

Garmin AQUAMAP 10x2 Series, AQUAMAP 12x2 Series, AQUAMAP 10x2 Owner's Manual
AQUAMAP™ 10x2/12x2 SERIES
Owner’s Manual

© 2017 Garmin Ltd. or its subsidiaries
All rights reserved. Under the copyright laws, this manual may not be copied, in whole or in part, without the written consent of
Garmin. Garmin reserves the right to change or improve its products and to make changes in the content of this manual without
obligation to notify any person or organization of such changes or improvements. Go to Garmin.com for current updates and
supplemental information concerning the use of this product.
Garmin®, the Garmin logo, AQUAMAP™, BlueChart®, FUSION®, g2 Vision®, MapSource®, Ultrascroll®, and VIRB® are trademarks
of Garmin Ltd. or its subsidiaries, registered in the USA and other countries. Fantom™, FUSION-Link™, Garmin ClearVü™, Garmin
Connect™, Garmin Helm™,Garmin LakeVü™, Garmin Quickdraw™, GCV™, GMR™, GRID™, GXM™, HomePort™, MotionScope™, Panoptix™, Shadow Drive™, and SmartMode™ and are trademarks of Garmin Ltd. or its subsidiaries. These trademarks
may not be used without the express permission of Garmin.
The Bluetooth® word mark and logos are owned by the Bluetooth SIG, Inc. and any use of such marks by Garmin is under license.
CZone™ is a trademark of Power Products, LLC. FLIR® is a registered trademark of FLIR Systems, Inc. iOS® is a registered
trademark of Cisco Systems, Inc. used under license by Apple Inc. microSD® and the microSDHC logo are trademarks of SD-3C,
LLC. NMEA®, NMEA 2000®, and the NMEA 2000 logo are registered trademarks of the National Marine Electronics Association.
SiriusXM® is a registered trademark of SiriusXM Radio Inc. Wi-Fi® is a registered mark of Wi-Fi Alliance Corporation. Windows® is a
registered trademark of Microsoft Corporation in the United Stations and other countries. All other trademarks and copyrights are the
property of their respective owners. Other trademarks and trade names are those of their respective owners.

Table of Contents
Introduction ........................................................................1
AQUAMAP Dimensions .......................................................................... 1
Device Overview ..................................................................................... 1
Keys ............................................................................................................... 1
Protective Cover ..................................................................................... 2
Downloading the Manuals ...................................................................... 2
Garmin® Support Center ......................................................................... 2
Inserting Memory Cards ......................................................................... 2
Software Update ..................................................................................... 3
Loading the New Software on a Memory Card .............................................3
Updating the Device Software .......................................................................3
GPS Satellite Signals .............................................................................. 4
Selecting the GPS Source ............................................................................4
Customizing AQUAMAP .................................................... 4
Home Screen .......................................................................................... 4
Customizing Pages ................................................................................. 5
Adding an Item to the Favorites Screen ........................................................5
Customizing the Favorites Screen ................................................................ 5
Adding a Custom Combination Screen .........................................................5
Editing a Combination Screen .......................................................................5
Customizing the Combos Screen .................................................................5
Customizing the Data Overlays.....................................................................5
Resetting the Station Layouts ....................................................................... 6
Presets .................................................................................................... 6
Saving a New Preset ..................................................................................... 6
Managing Presets .........................................................................................6
Data Fields .............................................................................................. 6
Setting the Vessel Type .......................................................................... 6
Adjusting the Backlight............................................................................ 7
Adjusting the Color Mode ....................................................................... 7
Setting the Beeper .................................................................................. 7
Charts and 3D Chart Views ............................................... 7
Nav. Chart and Offshore Fishing Chart .................................................. 8
Selecting an Item on the Map Using the Device Keys..................................8
Chart Symbols ............................................................................................... 8
Measuring a Distance on the Chart ..............................................................9
Creating a Waypoint on the Chart ................................................................. 9
Navigating to a Point on the Chart ................................................................ 9
Viewing Location and Object Information on a Chart ................................... 9
Viewing Details about Navaids ...................................................................... 9
Premium Charts ...................................................................................... 9
Viewing Tide Station Information .................................................................10
Selecting a Map ........................................................................................... 10
Automatic Identication System ........................................................... 11
AIS Targeting Symbols ................................................................................ 11
Heading and Projected Course of Activated AIS Targets ........................... 11
Showing AIS and MARPA Vessels .............................................................. 12
Activating a Target for an AIS Vessel .......................................................... 12
Viewing a List of AIS and MARPA Threats ..................................................12
AIS Distress Signals .................................................................................... 12
Turning Off AIS Reception ...........................................................................13
Chart and 3D Chart View Settings ........................................................13
Marks, Wpts & Tracks Settings on the Charts and Chart Views ................14
AQUAMAP™ 10x2/12x2 SERIES
i

Other Vessels Settings on the Charts and Chart Views .............................14
Navigation and Fishing Chart Setup ........................................................... 14
Chart Appearance Settings ......................................................................... 14
Laylines Settings .........................................................................................15
Fish Eye 3D Settings ................................................................................... 16
Garmin Quickdraw Contours Mapping ................................................. 16
Mapping a Body of Water Using the Garmin Quickdraw Contours ...........16
Adding a Label to a Garmin Quickdraw Contours Map .............................. 17
Garmin Quickdraw Community ................................................................... 17
Garmin Quickdraw Contours Settings.........................................................18
Navigation with AQUAMAP.............................................19
Basic Navigation Questions .................................................................. 20
Destinations .......................................................................................... 20
Searching for a Destination by Name ......................................................... 20
Selecting a Destination Using the Nav. chart ..............................................20
Searching for a Marine Services Destination ..............................................20
Stopping Navigation .................................................................................... 20
Marks and Waypoints ...........................................................................20
Marking Your Current Location as a Waypoint ...........................................20
Creating a Waypoint at a Different Location ...............................................20
Creating a Waypoint on the Sonar Screen .................................................21
Creating a Waypoint on the Chart ...............................................................21
Marking an SOS Location ........................................................................... 21
Viewing a List of all Waypoints ....................................................................21
Editing a Saved Waypoint ...........................................................................21
Moving a Saved Waypoint...........................................................................21
Browsing for and Navigating to a Saved Waypoint.....................................22
Deleting a Waypoint or an MOB ..................................................................22
Deleting All Waypoints ................................................................................. 22
Setting and Following a Direct Course Using Go To ..................................22
Tracks ....................................................................................................23
Recording Tracks.........................................................................................23
Managing the Track Log Memory During Recording ..................................23
Conguring the Recording Interval of the Track Log .................................. 23
Setting the Color of the Active Track ........................................................... 23
Saving the Active Track ...............................................................................23
Clearing the Active Track .............................................................................23
Retracing the Active Track...........................................................................23
Viewing a List of Saved Tracks ...................................................................24
Editing a Saved Track .................................................................................24
Saving a Track as a Route ..........................................................................24
Browsing for and Navigating a Recorded Track .........................................24
Deleting a Saved Track ...............................................................................24
Deleting All Saved Tracks............................................................................24
Routes ................................................................................................... 24
Creating and Navigating a Route from Your Present Location ...................24
Creating and Saving a Route ...................................................................... 25
Viewing a List of Routes and Auto Guidance Paths ...................................25
Editing a Saved Route .................................................................................25
Browsing for and Navigating a Saved Route .............................................. 25
Browsing for and Navigating Parallel to a Saved Route ............................. 26
Deleting a Saved Route .............................................................................. 26
Deleting All Saved Routes ...........................................................................26
Auto Guidance ...................................................................................... 26
Setting and Following an Auto Guidance Path ...........................................26
Creating and Saving an Auto Guidance Path .............................................27
Adjusting a Saved Auto Guidance Path ......................................................27
ii
AQUAMAP™ 10x2/12x2 SERIES

Canceling an Auto Guidance Calculation in Progress ................................27
Setting a Timed Arrival ................................................................................27
Auto Guidance Path Congurations............................................................27
Boundaries ............................................................................................ 29
Creating a Boundary ...................................................................................29
Converting a Route to a Boundary ..............................................................29
Converting a Track to a Boundary ..............................................................29
Editing a Boundary ...................................................................................... 29
Setting a Boundary Alarm ...........................................................................30
Deleting a Boundary .................................................................................... 30
Synchronizing User Data Across the Garmin Marine Network ............ 30
Deleting All Saved Waypoints, Routes, and Tracks ............................. 30
Sailing Features ...............................................................31
Setting the Vessel Type ........................................................................ 31
Sail Racing ............................................................................................ 31
Starting Line Guidance ................................................................................ 31
Starting the Race Timer...............................................................................32
Stopping the Race Timer .............................................................................32
Setting the Distance between the Bow and the GPS Antenna ...................32
Laylines Settings ................................................................................... 32
Setting the Keel Offset .......................................................................... 32
Sailboat Autopilot Operation ................................................................. 33
Wind Hold .................................................................................................... 33
Tack and Gybe .............................................................................................33
Heading Line and Angle Markers .........................................................34
Setting the Heading and Course Over Ground Lines ................................. 34
Turning on Angle Markers ........................................................................... 34
Sonar Fishnder ..............................................................35
Traditional Sonar View .......................................................................... 35
Split-Zoom Sonar View ................................................................................ 35
Split-Frequency Sonar View ........................................................................ 35
Traditional 50/77/200 kHz Sonar .................................................................36
CHIRP Sonar ............................................................................................... 36
Garmin ClearVü Sonar View.................................................................36
ClearVü Scanning Sonar ............................................................................. 37
SideVü Sonar View ............................................................................... 37
SideVü Scanning Technology ..................................................................... 38
Measuring Distance on the Sonar Screen .................................................. 38
Panoptix Sonar Views ...........................................................................38
LiveVü Down Sonar View ............................................................................ 38
LiveVü Forward Sonar View ........................................................................ 39
RealVü 3D Historical Sonar View ................................................................39
RealVü 3D Down Sonar View ..................................................................... 39
RealVü 3D Forward Sonar View ................................................................. 39
FrontVü Sonar View ....................................................................................40
Changing the Sonar View ..................................................................... 40
Selecting the Transducer Type ............................................................. 40
Calibrating the Compass ............................................................................. 41
Pausing the Sonar Display ................................................................... 41
Creating a Waypoint on the Sonar Screen ........................................... 41
Viewing Sonar History ...........................................................................41
Stopping the Transmission of Sonar Signals .......................................41
Sonar Sharing ....................................................................................... 41
Selecting a Sonar Source ...........................................................................42
Renaming a Sonar Source .......................................................................... 42
AQUAMAP™ 10x2/12x2 SERIES
iii

Adjusting the Level of Detail ................................................................. 42
Adjusting the Color Intensity ................................................................. 42
Sonar Frequencies ................................................................................ 42
Selecting Frequencies ................................................................................. 43
Creating a Frequency Preset ...................................................................... 43
Adjusting the Zoom on the Sonar Screen ............................................ 43
Auto .............................................................................................................44
Bottom Lock .................................................................................................44
Shift Zoom ................................................................................................... 44
Target Expansion .................................................................................. 44
Adjusting the Range of the Depth or Width Scale ............................... 44
Traditional, Garmin ClearVü, and SideVü Sonar Setup ....................... 45
Setting the Scroll Speed .............................................................................. 45
Sonar Noise Rejection Settings ..................................................................45
Sonar Appearance Settings ........................................................................ 47
Sonar Alarms ............................................................................................... 48
Advanced Sonar Settings ............................................................................ 48
Transducer Installation Settings ..................................................................49
Sonar Recordings ................................................................................. 49
Recording the Sonar Display ......................................................................49
Stopping the Sonar Recording .................................................................... 49
Deleting a Sonar Recording ........................................................................ 49
Playing Sonar Recordings ........................................................................... 50
Panoptix Sonar Setup ........................................................................... 50
Adjusting the RealVü Viewing Angle and Zoom Level................................50
RealVü Sonar Settings ................................................................................ 50
LiveVü and FrontVü Sonar Settings ............................................................51
RealVü Appearance Settings ..................................................................... 52
LiveVü and FrontVü Appearance Settings .................................................52
RealVü Appearance Settings ...................................................................... 52
Panoptix Transducer Installation Settings ...................................................52
Radar .................................................................................54
Transmitting Radar Signals...................................................................54
Stopping the Transmission of Radar Signals .............................................54
Setting Up the Timed Transmit Mode ......................................................... 54
Enabling and Adjusting a Radar No Transmit Zone ....................................54
Adjusting the Radar Range................................................................... 55
Tips for Selecting a Radar Range ............................................................... 55
Marking a Waypoint on the Radar Screen ...........................................55
MotionScope™ Doppler Radar Technology ......................................... 55
Enabling a Guard Zone ......................................................................... 56
Dening a Circular Guard Zone ..................................................................56
Dening a Partial Guard Zone .....................................................................56
Disabling a Guard Zone .............................................................................. 56
MARPA .................................................................................................. 56
MARPA Targeting Symbols ......................................................................... 57
Assigning a MARPA Tag to an Object ......................................................... 57
Removing a MARPA Tag from a Targeted Object ....................................... 57
Viewing Information about a MARPA-tagged Object .................................. 57
Viewing a List of AIS and MARPA Threats ..................................................57
Showing AIS Vessels on the Radar Screen ................................................ 57
VRM and EBL ..............................................................................................58
Professional Mode ................................................................................ 58
Radar Overlay ....................................................................................... 58
Radar Overlay and Chart Data Alignment ..................................................58
Echo Trails ............................................................................................59
iv
AQUAMAP™ 10x2/12x2 SERIES

Turning on Echo Trails .................................................................................59
Adjusting the Length of the Echo Trails ......................................................59
Clearing the Echo Trails ..............................................................................59
Optimizing the Radar Display ............................................................... 59
Adjusting Gain on the Radar Screen Automatically ..................................59
Adjusting Gain on the Radar Screen Manually ........................................... 60
Minimizing Nearby Large-Object Interference ............................................ 60
Minimizing Side-Lobe Interference on the Radar Screen ...........................60
Adjusting Sea Clutter on the Radar Screen Automatically .........................60
Adjusting Sea Clutter on the Radar Screen Manually ............................... 61
Adjusting Rain Clutter on the Radar Screen ............................................... 61
Reducing Cross Talk Clutter on the Radar Screen .................................... 61
Radar Options Menu ............................................................................. 62
Radar Setup Menu ................................................................................ 62
Radar Appearance Settings ........................................................................ 62
Radar Installation Settings ..........................................................................63
Selecting a Different Radar Source ...................................................... 63
Nav Info ............................................................................. 64
Tide, Current, and Celestial Information ............................................... 64
Tide Station Information ..............................................................................64
Current Station Information ......................................................................... 64
Celestial Information .................................................................................... 64
Viewing Tide Station, Current Station, or Celestial Information for a Different
Date ............................................................................................................. 64
Viewing Information for a Different Tide or Current Station ........................64
Viewing Almanac Information from the Nav. chart ...................................... 64
Sharing and Managing User Data ........................................................ 65
Copying Waypoints, Routes, and Tracks from HomePort to AQUAMAP ...65
Selecting a File Type for Third-Party Waypoints and Routes ..................... 65
Copying Data from a Memory Card ............................................................ 65
Copying Waypoints, Routes, and Tracks to a Memory Card ......................65
Copying Built-In Maps to a Memory Card ................................................... 65
Backing Up Data to a Computer ................................................................. 65
Restoring Backup Data to AQUAMAP ........................................................66
Saving System Information to a Memory Card ........................................... 66
Digital Selective Calling ........................................................................ 66
Networked AQUAMAP and VHF Radio Functionality .................................66
Turning On DSC ..........................................................................................66
DSC List .......................................................................................................66
Incoming Distress Calls ............................................................................... 67
Position Tracking .........................................................................................67
Individual Routine Calls ............................................................................... 68
Warning Manager .................................................................................69
Viewing Messages ......................................................................................69
Sorting and Filtering Messages ...................................................................69
Saving Messages to a Memory Card .......................................................... 69
Clearing all of the Messages ....................................................................... 69
Gauges and Graphs .........................................................69
Viewing the Gauges .............................................................................. 69
Changing the Data Shown in a Gauge ....................................................... 69
Customizing the Gauges ............................................................................. 69
Customizing Engine Gauge and Fuel Gauge Limits ..................................70
Viewing Engine and Fuel Gauges ........................................................ 70
Selecting the Number of Engines Shown in Gauges .................................70
Customizing the Engines Shown in Gauges .............................................70
Enabling Status Alarms for Engine Gauges ...............................................71
AQUAMAP™ 10x2/12x2 SERIES
v

Enabling Some Engine Gauge Status Alarms ............................................71
Setting the Fuel Alarm ...........................................................................71
Setting the Fuel Capacity of the Vessel ......................................................71
Synchronizing the Fuel Data with the Actual Vessel Fuel...........................71
Viewing the Wind Gauges ....................................................................71
Conguring the Sailing Wind Gauge ...........................................................72
Conguring the Speed Source ....................................................................72
Conguring the Heading Source of the Wind Gauge .................................72
Customizing the Close-Hauled Wind Gauge .............................................. 72
Viewing Trip Gauges ............................................................................. 72
Resetting Trip Gauges ................................................................................. 72
Viewing Graphs .....................................................................................73
Setting the Graph Range and Time Scales ...............................................73
Setting Weather Alarm ................................................................................ 73
Battery Management ............................................................................ 73
Setting Up the Battery Management Page ................................................. 73
Media Player ..................................................................... 74
Opening the Media Player .................................................................... 74
Buttons .........................................................................................................74
Selecting the Media Source .................................................................. 74
Playing Music ........................................................................................ 75
Browsing for Music ...................................................................................... 75
Setting a Song to Repeat ............................................................................ 75
Setting All Songs to Repeat ........................................................................75
Setting Songs to Shufe ..............................................................................75
Adjusting the Volume ............................................................................ 75
Enabling and Disabling Zones ....................................................................75
Muting the Media Volume ............................................................................75
VHF Radio ............................................................................................. 75
Scanning VHF Channels ............................................................................. 75
Adjusting the VHF Squelch ......................................................................... 75
Radio ..................................................................................................... 75
Setting the Tuner Region.............................................................................76
Changing the Radio Station ........................................................................ 76
Changing the Tuning Mode .........................................................................76
Presets .........................................................................................................76
DAB Playback ....................................................................................... 76
Setting the DAB Tuner Region ....................................................................76
Scanning for DAB Stations .......................................................................... 76
Changing DAB Stations ..............................................................................77
DAB Presets ................................................................................................ 77
Setting the Device Name ...................................................................... 77
Updating the Media Player Software .................................................... 77
Viewing Video ...................................................................78
Selecting a Video Source .....................................................................78
Alternating Among Multiple Video Sources .................................................78
Networked Video Devices .....................................................................78
Using Video Presets on Networked Video Cameras ..................................78
Camera Settings .......................................................................................... 79
Video Settings..............................................................................................79
Associating the Camera to a Video Source ............................................... 79
Video Camera Movement Control ............................................................... 79
Creating a Combination with Video Functions ..................................... 80
Conguring the Video Appearance ....................................................... 80
vi
AQUAMAP™ 10x2/12x2 SERIES

Autopilot ...........................................................................81
Opening the Autopilot Screen ............................................................... 81
Engaging the Autopilot .......................................................................... 81
Adjusting the Heading with the AQUAMAP in Step Steering Mode ...........81
Autopilot Bar .......................................................................................... 82
Adjusting the Step Steering Increment .......................................................82
Setting the Power Saver..............................................................................82
Enabling Shadow Drive™ ........................................................................... 82
Steering Patterns .................................................................................. 82
Following the U-Turn Pattern ......................................................................82
Setting Up and Following the Circles Pattern ............................................ 82
Setting Up and Following the Zigzag Pattern .............................................83
Following the Williamson Turn Pattern ........................................................83
Cancelling a Steering Pattern .....................................................................83
Controlling the VIRB® Action Camera with the AQUAMAP .................. 83
VIRB Action Camera Settings .....................................................................83
VIRB Action Camera Video Setup Settings ................................................83
Adding the VIRB Action Camera Controls to Other Screens......................84
Controlling the VIRB Action Camera Video Playback .................................84
Starting a VIRB Video Slideshow ................................................................ 84
Communication with Wireless Devices ........................85
Wi-Fi® Network ...................................................................................... 85
Setting Up the Wi-Fi Wireless Network ....................................................... 85
Connecting a Wireless Device to the AQUAMAP .......................................85
Changing the Wireless Channel .................................................................85
Changing the Wi-Fi Host ............................................................................. 85
Wireless Remote Control ...................................................................... 85
Pairing the Wireless Remote Control With the AQUAMAP ........................85
Turning On and Off the Remote Backlight .................................................86
Disconnecting the Remote from All AQUAMAPs ........................................ 86
Using the Garmin Helm Application with the AQUAMAP ..................... 86
Connecting a quatix® Watch to the AQUAMAP .................................... 86
Connecting a Garmin Nautix™ Device to the AQUAMAP ...................86
Device Conguration .......................................................87
Turning On the AQUAMAP Automatically ............................................ 87
System Settings .................................................................................... 87
Viewing System Software Information ........................................................ 87
Station Settings ...........................................................................................87
Preferences Settings ............................................................................. 87
Units Settings ..............................................................................................88
Navigation Settings......................................................................................88
Communications Settings ..................................................................... 89
NMEA 0183 Settings ...................................................................................89
NMEA 2000 Settings ...................................................................................90
Marine Network ...........................................................................................90
Setting Alarms ....................................................................................... 91
Navigation Alarms........................................................................................91
System Alarms .............................................................................................91
Collision Alarm ............................................................................................. 91
Sonar Alarms ............................................................................................... 91
Weather Alarms ........................................................................................... 92
Fuel Alarm....................................................................................................92
My Vessel Settings ................................................................................92
Setting the Keel Offset.................................................................................92
Setting the Water Temperature Offset .........................................................93
Calibrating a Water Speed Device ..............................................................93
AQUAMAP™ 10x2/12x2 SERIES
vii

Other Vessels Settings .........................................................................93
Restoring the Original AQUAMAP Factory Settings.............................94
Appendix ........................................................................... 94
Registering Your Device ....................................................................... 94
Digital Switching .................................................................................... 95
Pairing the GRID Remote Input Device with the AQUAMAP ............... 95
Pairing the GRID Device with the AQUAMAP from the AQUAMAP ........... 95
Pairing the GRID Device with the AQUAMAP from the GRID Device .......95
Rotating the GRID Joystick ......................................................................... 95
Cleaning the Screen ............................................................................. 95
Viewing Images on a Memory card ...................................................... 95
Screenshots .......................................................................................... 95
Capturing Screenshots ................................................................................ 96
Copying Screenshots to a Computer .......................................................... 96
Troubleshooting ....................................................................................96
My device will not acquire GPS signals ...................................................... 96
My device will not turn on or keeps turning off ............................................ 96
My device is not creating waypoints in the correct location ........................ 96
Specications ........................................................................................ 97
Specications ..............................................................................................97
NMEA 2000 PGN Information .....................................................................98
NMEA 0183 Information ..............................................................................99
Software License Agreement ................................................................ 99
物質宣言 .......................................................................................... 100
viii
AQUAMAP™ 10x2/12x2 SERIES
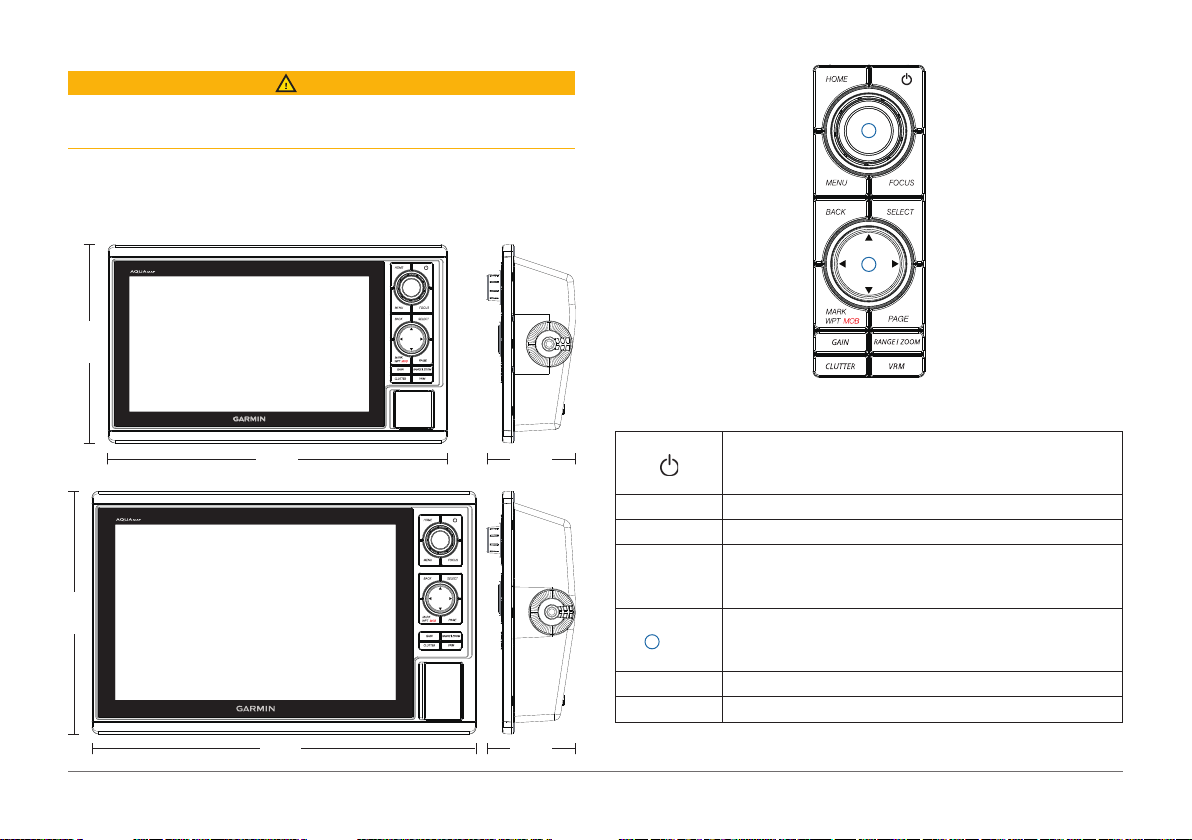
316.8 mm
185.2 mm
68.5 mm
358.8 mm
226.8 mm
68.5 mm
Introduction
WARNING
See the
Important Safety and Product Information
for product warnings and other important information.
Not all features are available on all models.
AQUAMAP Dimensions
AQUAMAP 10x2 Series
AQUAMAP 12x2 Series
guide in the product box
Device Overview
1
2
Keys
Hold to turn the device on or off.
Press to adjust the backlight, adjust the color mode, congure
colors, and enable and disable sonar transmission.
HOME Press to return to the home screen.
MENU Press to open or close the options menu for each page.
FOCUS
1
Knob
SELECT Press to select options and acknowledge messages.
BACK Press to return to the previous screen.
Press to move the highlight to a different section of a page.
Press to move the highlight to a different function or window on a
combination page.
Rotate to zoom in or out of a view.
Rotate to highlight options in menus.
Press to select a highlighted option.
AQUAMAP™ 10x2/12x2 SERIES
1
From a 2D chart or sonar page with the sonar paused, press to
mark your cursor position as a mark.
From a 2D chart with the cursor invisible and no menu shown,
press to mark your boat position as a mark.
MARK WPT
MOB
PAGE Press to switch through Favorites screens.
2
Arrows
RANGE /
ZOOM
GAIN On a sonar or radar screen, press to open the gain menu.
CLUTTER On a sonar or radar screen, press to open the clutter menu.
VRM
From any other page, press to mark your boat position as a mark.
From a 2D chart or sonar page with the sonar paused, hold to
mark your cursor position as a waypoint.
From a 2D chart with the cursor invisible and no menu shown, hold
to mark your boat position as a waypoint.
From any other page, hold to mark your boat position as a
waypoint.
Hold to open the man overboard (MOB) option.
Press to scroll, highlight options, and move the cursor.
On a sonar screen, press to open the range menu.
On a sonar screen, hold to open the zoom menu.
On a sonar screen, press to show or hide the depth line.
On a radar screen, press to open the VRM menu.
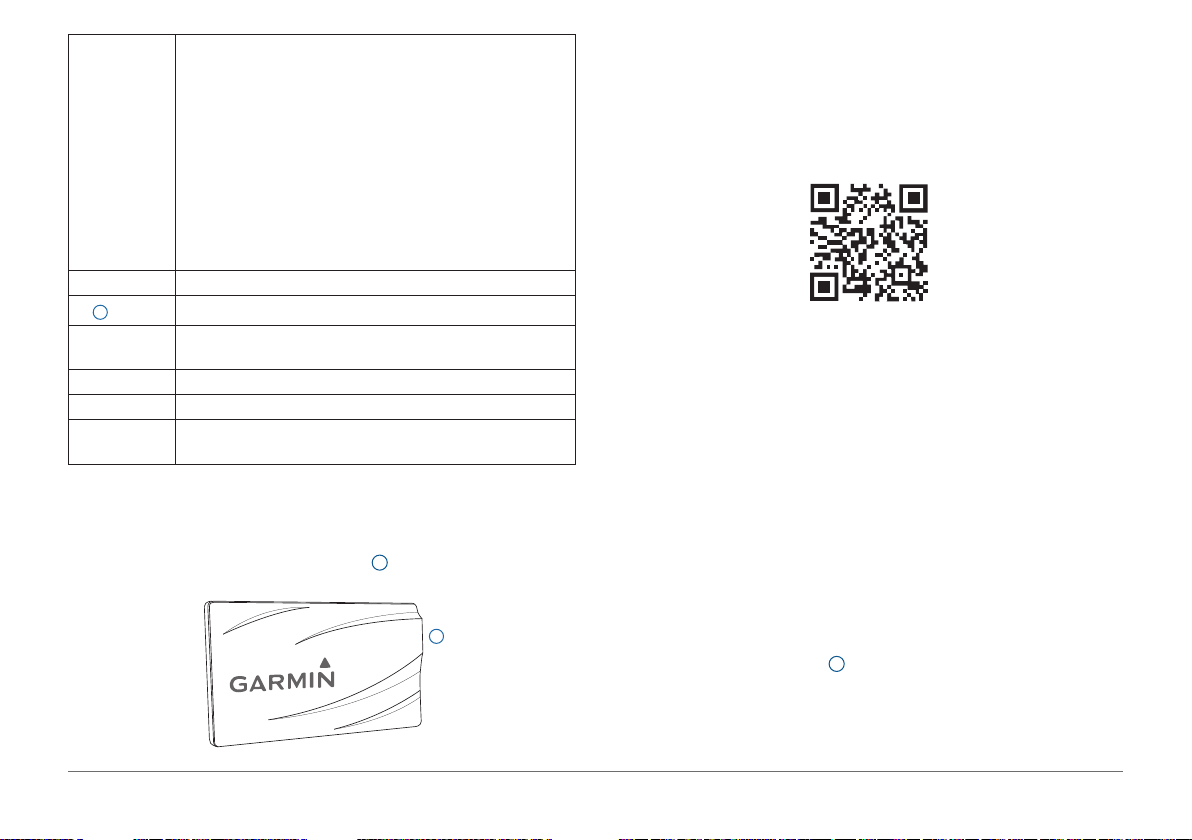
Protective Cover
The protective cover protects the screen when the device is not in use.
To remove the cover, hold the cover at the tab 1, and pull forward.
1
Downloading the Manuals
You can get the latest owner’s manual and translations of manuals from the
web.
1 Go to Garmin.com/manuals/URLHERE.
TIP: To quickly open this web page, scan this code:
2 Download the manual.
Garmin® Support Center
Go to support.garmin.com for help and information, such as product manuals,
frequently asked questions, videos, software updates, and customer support.
Inserting Memory Cards
You can use optional memory cards with AQUAMAP. Map cards allow you
to view high-resolution satellite imagery and aerial reference photos of ports,
harbors, marinas, and other points of interest. You can use blank memory
cards to record Garmin Quickdraw™ Contours mapping, record sonar (with
a compatible transducer), and transfer data such as waypoints and routes to
another compatible AQUAMAP or a computer.
This device supports FAT32 memory cards of up to 32 GB of storage.
1 Open the access ap or door 1 on the front of AQUAMAP.
2
AQUAMAP™ 10x2/12x2 SERIES
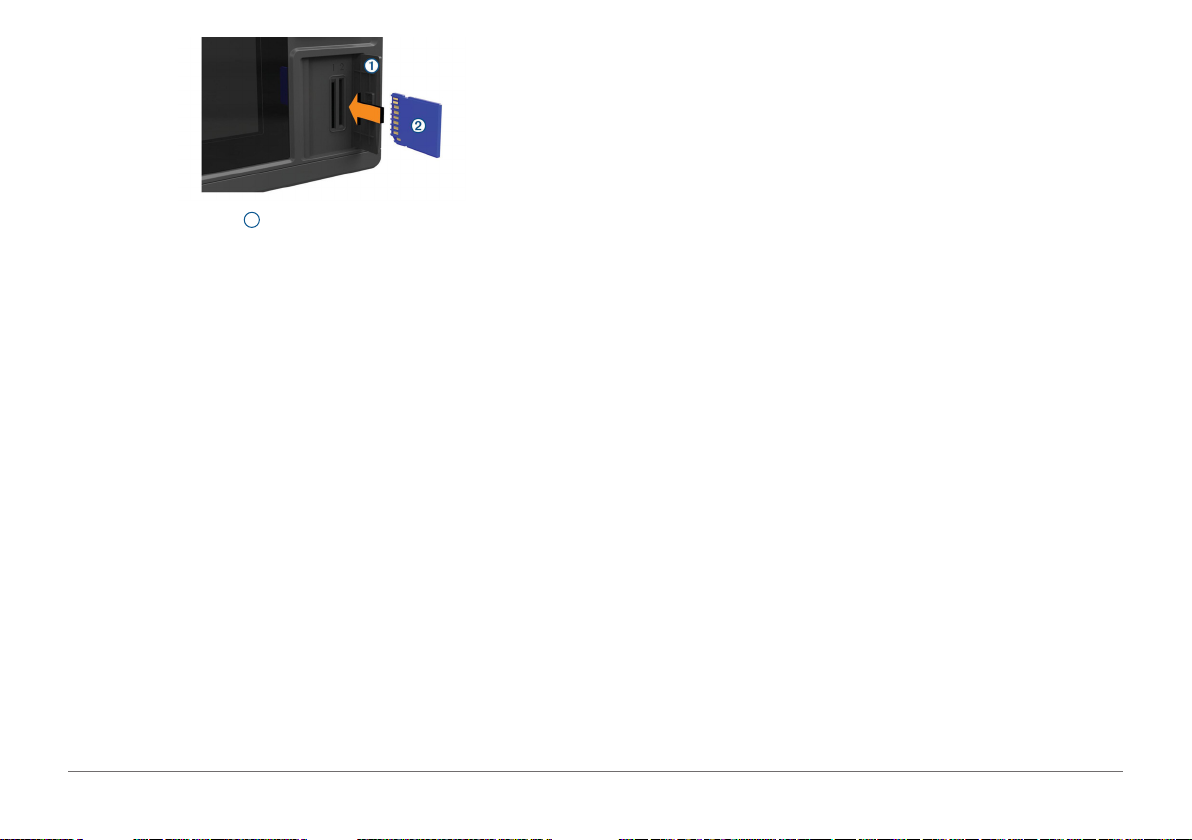
2 Insert the memory card 2.
3 Press the card in until it clicks.
4 Close the door.
Software Update
You may need to update the device software when you install the device or
add an accessory to the device.
Before you update the software, you can check the software version installed
on your device. Then, you can go to Garmin.com/support/software/marine.
html, select See All Devices in this Bundle, and compare the installed
software version to the software version listed for your product.
If the software on your device is older than the one listed on the website,
follow the steps to load the software on a memory card, and then update the
device software.
Loading the New Software on a Memory Card
You must copy the software update to a memory card using a computer that
is running Windows® software.
NOTE: You can contact Garmin customer support to order a preloaded
software update card if you do not have a computer with Windows software.
1 Insert a memory card into the card slot on the computer.
2 Go to Garmin.com/support/software/marine.html.
TIP: You can also download updated owner’s manuals to load on the
AQUAMAP from this web page.
3 Select GPSMAP Series with SD Card.
4 Select Download next to GPSMAP Series with SD Card.
5 Read and agree to the terms.
6 Select Download.
7 Choose a location, and select Save.
8 Double-click the downloaded le.
A Garmin folder containing the software update is created in the selected
location. A dialog box opens to assist in transferring the software update to
a memory card.
9 Select Next.
10 Select the drive associated with the memory card, and select Next >
Finish.
A Garmin folder containing the software update is created on the memory
card. The software update can take several minutes to load onto the memory
card.
Updating the Device Software
1 Turn on AQUAMAP.
2 After the home screen appears, insert the memory card into the card slot.
NOTE: In order for the software update instructions to appear, the device
must be fully booted before the card is inserted.
3 Follow the on-screen instructions.
4 Wait several minutes while the software update process completes.
5 When prompted, leave the memory card in place and restart AQUAMAP
manually.
6 Remove the memory card.
AQUAMAP™ 10x2/12x2 SERIES
3
NOTE: If the memory card is removed before the device restarts fully, the
software update is not complete.
GPS Satellite Signals
When you turn on AQUAMAP, the GPS receiver must collect satellite data
and establish the current location.
When AQUAMAP acquires satellite signals, appears at the top of the
Home screen. When AQUAMAP loses satellite signals, disappears and
a ashing question mark appears over on the chart.
For more information about GPS, go to Garmin.com/aboutGPS.
Selecting the GPS Source
You can select your preferred source for GPS data, if you have more than
one GPS source.
1 Select Settings > System > GPS > Source.
2 Select the source for GPS data.
Customizing AQUAMAP
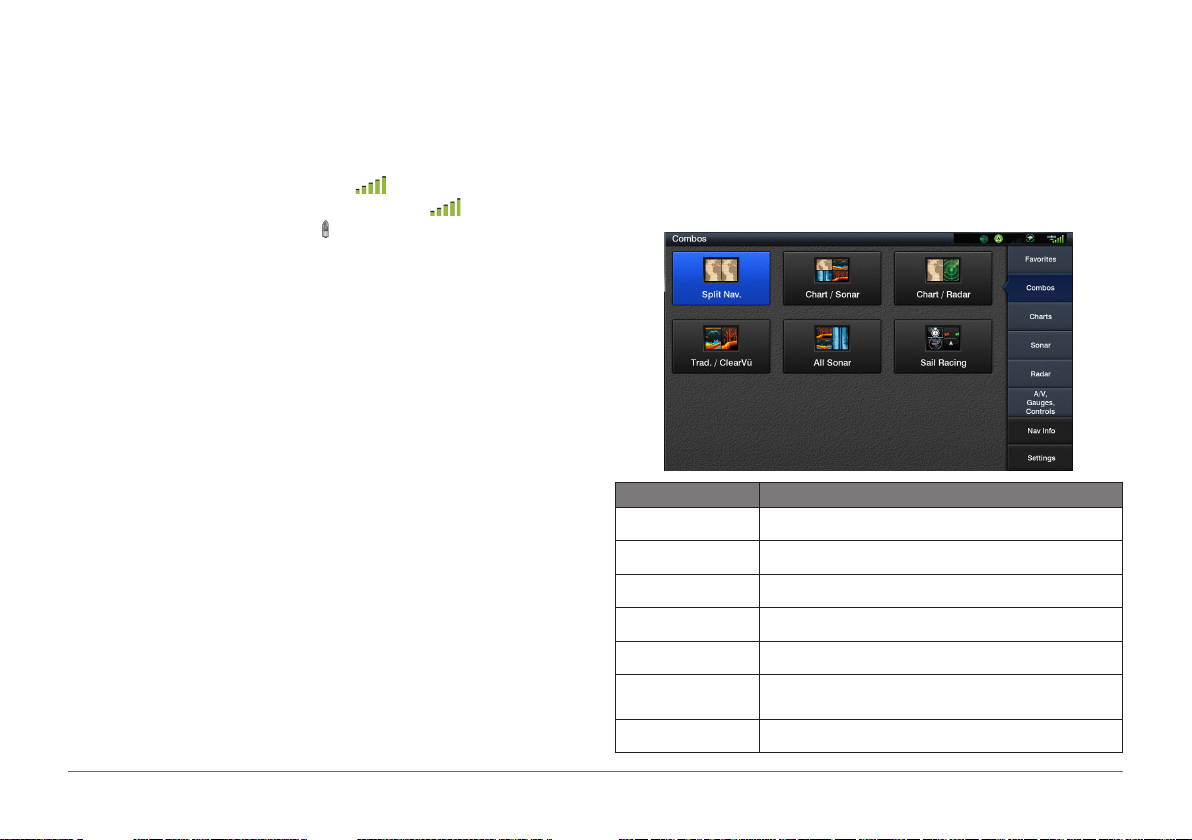
Home Screen
The home screen provides access to all of the features in the device. The
features are dependent on the accessories you have connected to the device.
When viewing another screen, you can return to the home screen by pressing
HOME. You can customize the layout of the screens and the items shown on
the home screen.
Item Description
Favorites Shortcuts such as chart, combination screen, or gauge.
Combos Combination screens for simultaneous views.
Charts Chart views such as navigation, shing, or forecast.
Sonar Sonar views such as ClearVü, SideVü, or LiveVü.
Radar Radar views such as Single Range or Dual Overlay.
A/V, Gauges, Controls
Settings System settings and preferences.
Functions such as wind monitor, media playback, or control
switches.
4
AQUAMAP™ 10x2/12x2 SERIES

Customizing Pages
Adding an Item to the Favorites Screen
From the Home screen, highlight an item, and hold SELECT to add it to your
Favorites screen.
Customizing the Favorites Screen
You can rearrange or remove items on the Favorites screen.
1 From the Favorites screen, press MENU.
2 Select an option:
• To rearrange an item, select Rearrange, select an item, and use the
arrow keys to select the new location.
• To remove an item, select Remove Favorite, and select the item to
remove.
TIP: You can also remove an item by highlighting an item on your
Favorites screen, and holding SELECT.
Adding a Custom Combination Screen
You can create a custom combination screen to suit your needs.
1 From the Combos screen, press MENU.
2 Select Add Combo, and follow the on-screen instructions.
Editing a Combination Screen
1 From the Combos screen, press MENU.
2 Select Edit Combo, and select one of the combination screen.
3 Select an option:
• To change the name, select Name, and enter a new name.
• To change the arrangement of the information on the screen, select
Layout, and select a new layout.
• To customize the data shown on the screen, select Overlays, and
select an option.
• To resize the information areas shown on the screen, use the arrow
keys, and press FOCUS to exit.
Customizing the Combos Screen
You can rearrange or remove items on the Combos screen.
1 From the Combos screen, press MENU.
2 Select an option:
• To rearrange an item, select Rearrange, select an item, and use the
arrow keys to select the new location.
• To remove an item, select Delete Combo, and select the item to
remove.
Customizing the Data Overlays
You can customize additional data shown on a screen.
1 Select an option based on the type of screen you are viewing:
• From a full screen view, press MENU, and select Edit Overlays.
• From the Combos screen, press MENU, select Edit Combo, select a
combination view, and select Overlays.
TIP: To quickly change the data shown in an overlay box, hold the overlay
box.
2 Select an item to customize the data and data bar:
• To change the data shown in an overlay box, select the overlay box,
select the new data to show, and select BACK.
• To select the location and layout of the data overlay bar, select Data,
and select an option.
• To customize the information shown when navigating, select
Navigation, and select an option.
AQUAMAP™ 10x2/12x2 SERIES
5
• To turn on other data bars, like the media controls, select Top Bar or
Bottom Bar, and select the necessary options.
3 Select Done.
Resetting the Station Layouts
You can restore the factory default layouts for all stations.
Select Settings > System > Station Information > Reset Stations.
2 Select a preset.
3 Select an option:
• To rename the preset, select Rename, enter a name, and select Done.
• To edit the preset, select Edit, and update the preset.
• To delete the preset, select Delete.
• To reset all presets to factory settings, select Reset All.
Presets
A preset is a collection of settings that optimize the screen or view. You can
use particular presets to optimize groups of settings for your activity. For
example, some settings might be optimal for when you are shing, and others
might be optimal for when you are cruising. Presets are available on some
screens, such as charts, sonar views, and radar views.
To select a preset for a compatible screen, select MENU > , and select the
preset.
When you are using a preset and you make changes to the settings or view,
you can save the changes to the preset or create a new preset based on the
new customizations.
Saving a New Preset
After you have customized the settings and view of a screen, you can save
the customization as a new preset.
1 From a compatible screen, change the settings and view.
2 Select MENU > > Save > New.
3 Enter a name, and select Done.
Managing Presets
You can customize the pre-loaded presets and edit presets you created.
1 From a compatible screen, select MENU > > Manage.
6
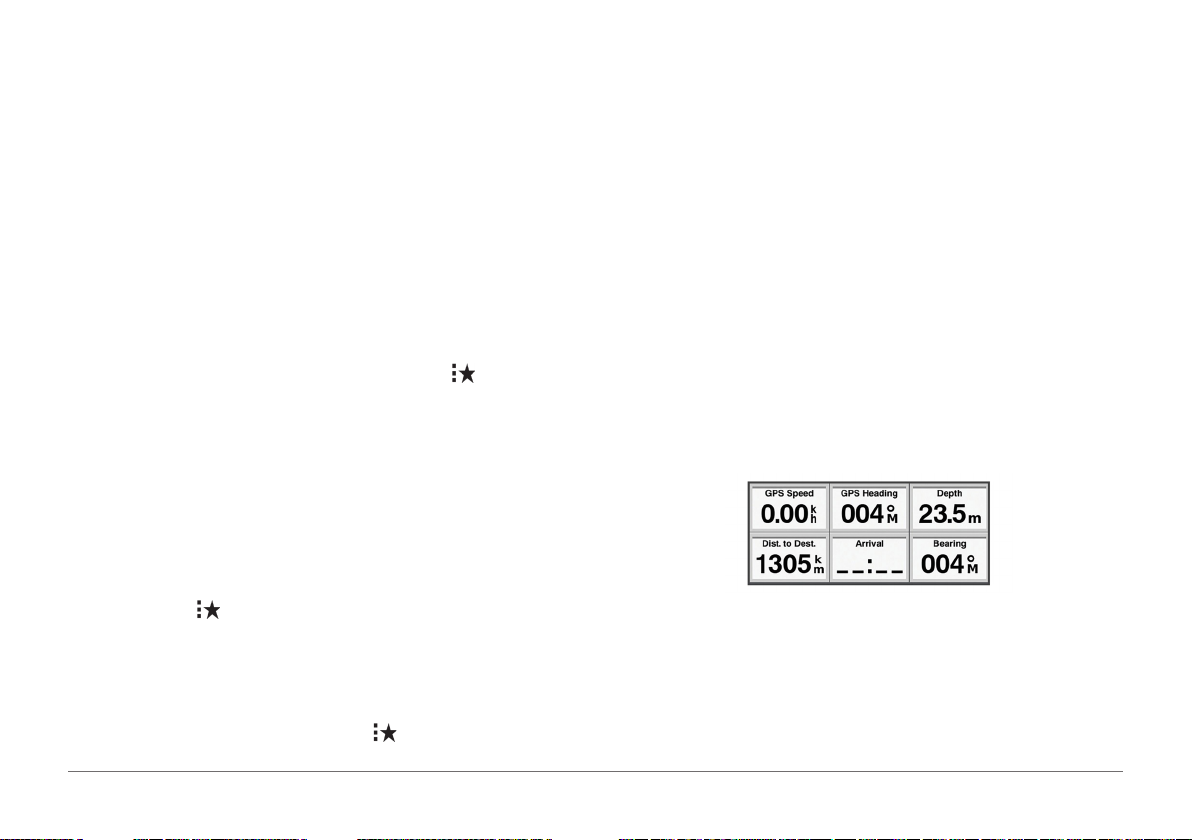
Data Fields
Data elds display multiple types of information in one area, such as depth,
heading, and bearing. Some data elds require you to be navigating or
require a connection to sensors to display data. For example, a temperature
sensor must be connected to the AQUAMAP to display the temperature data
eld.
The data elds on a page depend on the type of data associated with that
page. For example, a sonar page automatically displays sonar-related
information such as Depth.
You can congure the data elds that display on a page. Select MENU > Edit
Overlays.
Setting the Vessel Type
You can select your boat type to congure AQUAMAP settings and to use
features customized for your boat type.
1 Select Settings > My Vessel > Vessel Type.
2 Select an option.
AQUAMAP™ 10x2/12x2 SERIES
Adjusting the Backlight
1 Select Settings > System > Sounds and Display > Backlight.
TIP: Press from any screen to open the backlight settings.
2 Adjust the backlight.
Adjusting the Color Mode
1 Select Settings > System > Sounds and Display > Color Mode.
TIP: Select > Color Mode from any screen to access the color settings.
2 Select an option.
Setting the Beeper
You can set when the device makes sounds.
1 Select Settings > System > Beeper.
2 Select an option:
• To have the device beep when you select an item and when an alarm is
triggered, select Key and Alarm.
• To have the device beep only when alarms are triggered, select Alarms
Only.
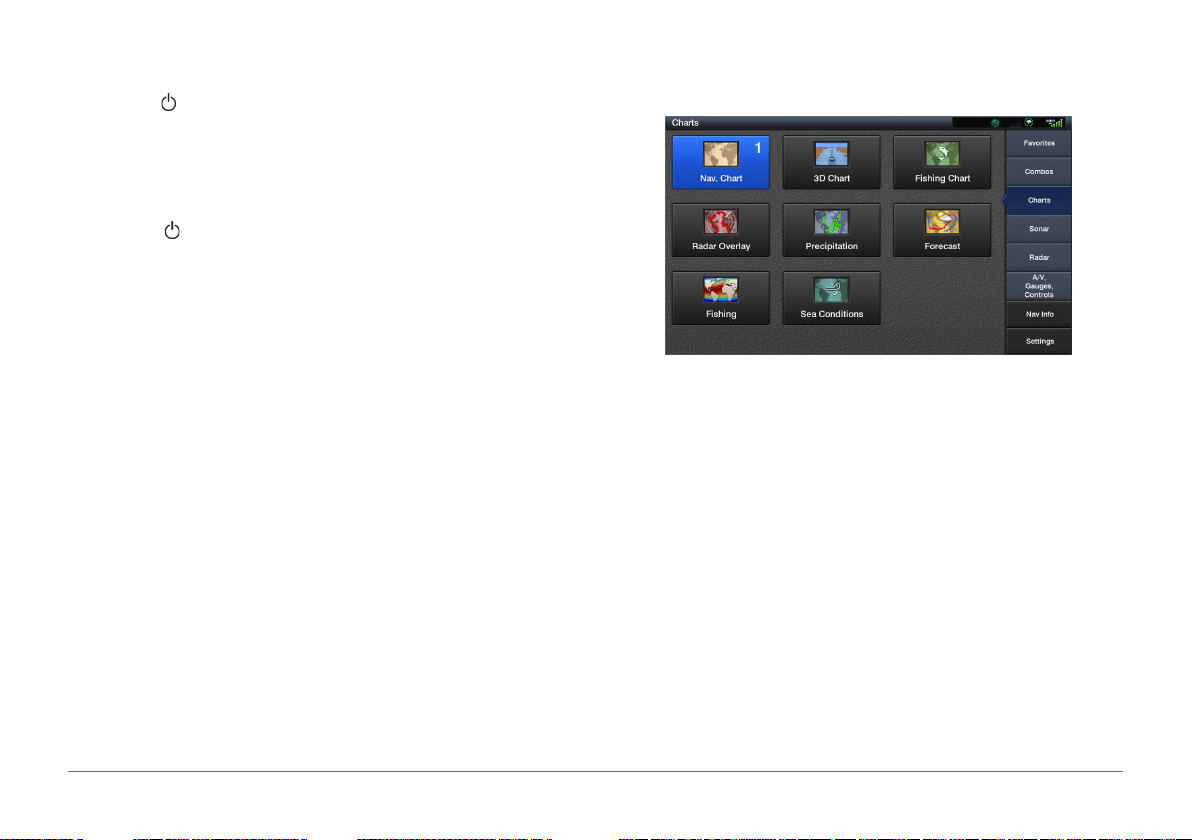
Charts and 3D Chart Views
The charts and 3D chart views that are available depend on the map data
and accessories used.
You can access the charts and 3D chart views by selecting Charts.
Nav. Chart: Shows navigation data available on your pre-loaded maps and
from supplemental maps, if available. The data includes buoys, lights,
cables, depth soundings, marinas, and tide stations in an overhead view.
3D Chart: Provides a view from above and behind the boat (according to
your course) and provides a visual navigation aid. This view is helpful
when navigating tricky shoals, reefs, bridges, or channels, and is
benecial when trying to identify entry and exit routes in unfamiliar harbors
or anchorages.
Fish Eye 3D: Provides an underwater view that visually represents the
sea oor according to the chart information. When a sonar transducer is
connected, suspended targets (such as sh) are indicated by red, green,
and yellow spheres. Red indicates the largest targets and green indicates
the smallest.
Fishing Chart: Provides a detailed view of the bottom contours and depth
soundings on the chart. This chart removes navigational data from the
chart, provides detailed bathymetric data, and enhances bottom contours
AQUAMAP™ 10x2/12x2 SERIES
7
for depth recognition. This chart is best for offshore deep-sea shing.
NOTE: The offshore Fishing chart is available with premium charts, in
some areas.
Radar Overlay: Superimposes radar information on the Nav. chart or the
Fishing chart, when AQUAMAP is connected to a radar. This feature is not
available with all models.
Precipitation: Precipitation ranging from very light rain and snow, up
to strong thunderstorms, is indicated in varying shades and colors.
Precipitation is shown either independently or with other weather
information.
Forecast: The Forecast chart shows city forecasts, marine forecasts,
warnings, hurricane warnings, METARS, county warnings, weather fronts
and pressure centers, surface pressure, and weather buoys.
Fishing: The weather Fishing chart shows present water temperature,
present surface pressure conditions, and shing forecasts.
Sea Conditions: The Sea Conditions feature shows information about
surface conditions, including winds, wave height, wave period, and wave
direction.
Nav. Chart and Offshore Fishing Chart
NOTE: The offshore Fishing chart is available with premium charts, in some
areas.
The Navigation and Fishing charts allow you to plan your course, view map
information, and follow a route. The Fishing chart is for offshore shing.
To open the Nav. chart, select Charts > Nav. Chart.
To open the Fishing chart, select Charts > Fishing.
Selecting an Item on the Map Using the Device Keys
1 From a chart or 3D chart view, use the arrow keys to move the cursor.
2 Press SELECT.
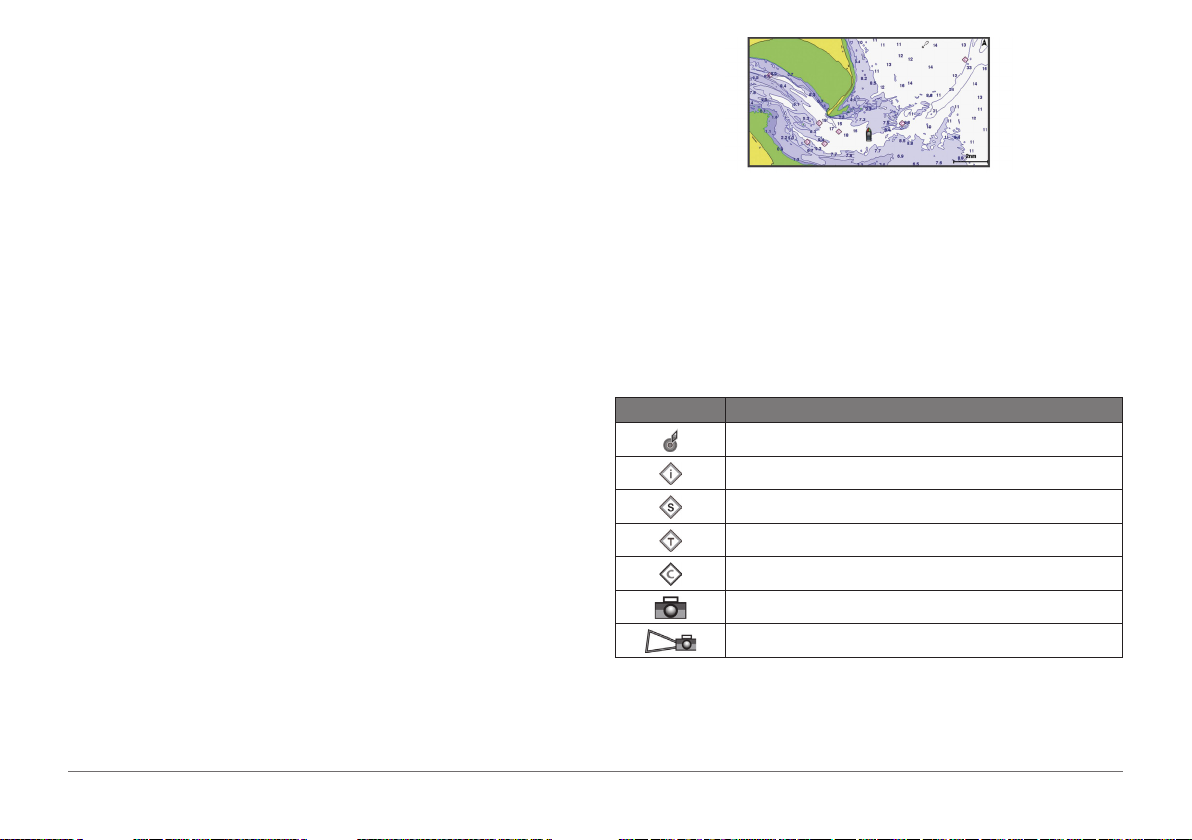
Chart Symbols
This table contains some of the common symbols you might see on the
detailed charts.
Icon Description
Buoy
Information
Marine services
Tide station
Current station
Overhead photo available
Perspective photo available
Other features common to most charts include depth contour lines, intertidal
zones, spot soundings (as depicted on the original paper chart), navigational
aids and symbols, obstructions, and cable areas.
8
AQUAMAP™ 10x2/12x2 SERIES

Measuring a Distance on the Chart
1 From a chart or the Radar overlay, select a location.
2 Press SELECT > Measure Distance.
A push pin appears on the screen at your present location. The distance
and angle from the pin is listed in the corner.
TIP: To reset the pin and measure from the current location of the cursor,
press SELECT.
Creating a Waypoint on the Chart
1 From a chart or a 3D chart view, select a location or object.
2 Press SELECT > Create Waypoint.
Navigating to a Point on the Chart
1 From the Nav. chart or Fishing chart, select a location.
2 Press SELECT > Navigate To.
The distance and bearing appear on the screen. Press SELECT to
measure from a location other than your current location.
• To view tide, current, celestial, chart notes, or local services information
near the cursor, select Information.
Viewing Details about Navaids
From the Nav. chart, 3D chart, Fish Eye 3D chart, or Fishing chart, you can
view details about various types of navigation aids, including beacons, lights,
and obstructions.
NOTE: The offshore Fishing chart is available with premium charts, in some
areas.
NOTE: Mariner’s Eye 3D and Fish Eye 3D chart views are available with
premium charts, in some areas.
1 From a chart or 3D chart view, select a navaid.
2 Select the name of the navaid.
Viewing Location and Object Information on a Chart
You can view information about a location or an object on the Nav. chart or
the Fishing chart.
NOTE: The offshore Fishing chart is available with premium charts, in some
areas.
1 From the Nav.chart or Fishing chart, select a location or object.
A list of options appears along the right side of the chart. The options that
appear vary based on the location or object you selected.
2 Select an option:
• To navigate to the selected location, select Navigate To.
• To mark a waypoint at the cursor location, select Create Waypoint.
• To view the distance and bearing of the object from your current
location, select Measure Distance.
AQUAMAP™ 10x2/12x2 SERIES
Premium Charts
CAUTION
The Auto Guidance feature is based on electronic chart information. That
data does not ensure obstacle and bottom clearance. Carefully compare
the course to all visual sightings, and avoid any land, shallow water, or other
obstacles that may be in your path.
NOTE: Not all models support all charts.
Optional premium charts, such as BlueChart® g2 Vision®, allow you to get the
most out of your AQUAMAP. In addition to detailed marine charting, premium
charts may contain these features, which are available in some areas.
Mariner’s Eye 3D: Provides a view from above and behind the boat for a
three-dimensional navigation aid.
Fish Eye 3D: Provides an underwater, three-dimensional view that visually
9
represents the sea oor according to the information on the chart.
Fishing Charts: Shows the chart with enhanced bottom contours and without
navigational data. This chart works well for offshore deep-sea shing.
High Resolution Satellite Imagery: Provides high- resolution satellite
images for a realistic view of the land and water on the Nav. chart.
Aerial Photos: Shows marinas and other navigationally signicant aerial
photos to help you visualize your surroundings .
Detailed Roads and POI data: Shows detailed road and point of interest
(POI) data, which includes highly detailed coastal roads and POIs such as
restaurants, lodging, and local attractions.
Auto Guidance: Uses specied information about your vessel and chart data
to determine the best path to your destination.
Viewing Tide Station Information
on a chart indicates a tide station. You can view a detailed graph for a tide
station to help predict the tide level at different times or on different days.
NOTE: This feature is available with premium charts, in some areas.
1 From the Nav. chart or Fishing chart, select a tide station.
Tide direction and tide level information appear near .
2 Select the station name.
Animated Tide and Current Indicators
NOTE: This feature is available with premium charts, in some areas.
You can view indicators for animated tide station and current direction on the
Nav. chart or the Fishing chart. You must also enable animated icons in the
chart settings.
An indicator for a tide station appears on the chart as a vertical bar graph with
an arrow. A red arrow pointing downward indicates a falling tide, and a blue
arrow pointing upward indicates a rising tide. When you move the cursor over
the tide station indicator, the height of the tide at the station appears above
the station indicator.
Current direction indicators appear as arrows on the chart. The direction of
each arrow indicates the direction of the current at a specic location on the
chart. The color of the current arrow indicates the range of speed for the
current at that location. When you move the cursor over the current direction
indicator, the specic current speed at the location appears above the
direction indicator.
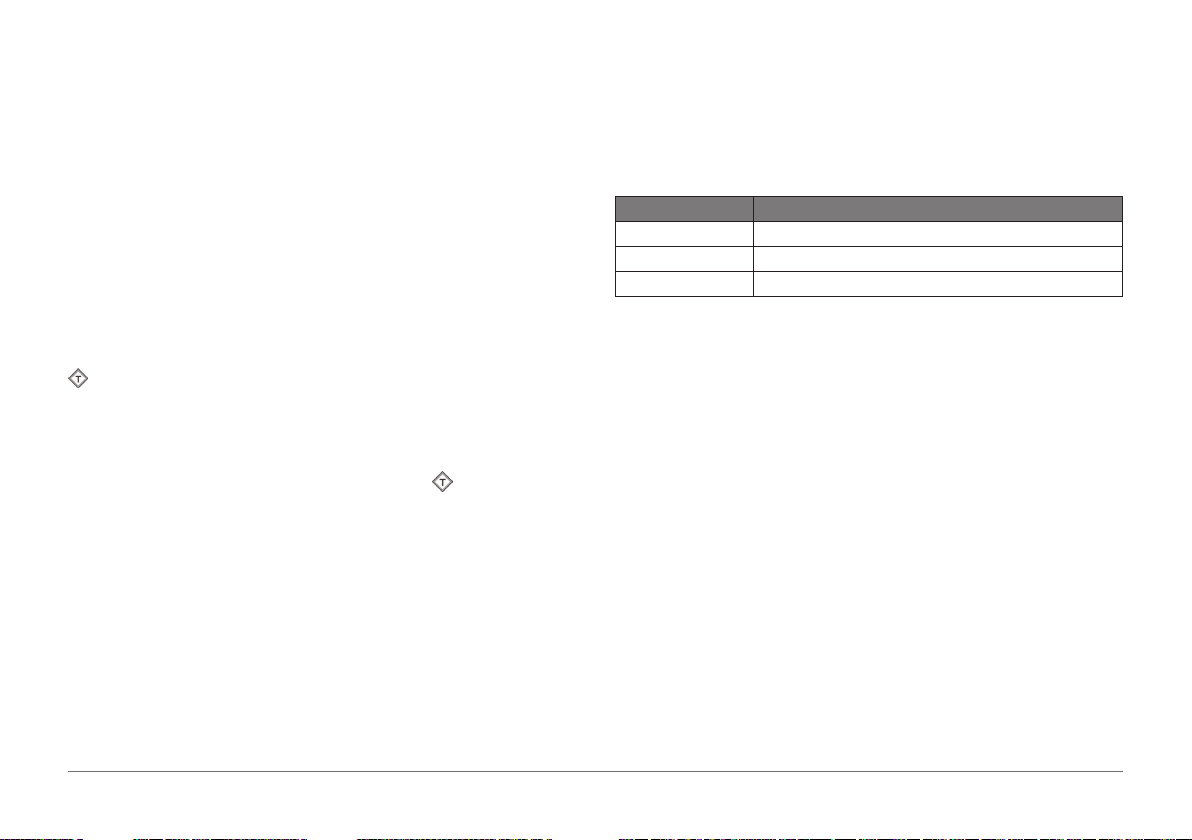
Color Current Speed Range
Yellow 0 to 1 knot
Orange 1 to 2 knots
Red 2 or more knots
Showing Tides and Current Indicators
NOTE: This feature is available with premium charts, in some areas.
You can show static or animated tide and current station indicators on the
Nav. chart or Fishing chart.
1 From the Nav. or Fishing chart, select MENU > Chart Setup > Tides &
Currents.
2 Select an option:
• To show current station indicators and tide station indicators on the
chart, select On.
• To show animated tide station indicators and animated current direction
indicators on the chart, select Animated.
Selecting a Map
If your product has both BlueChart g2 and Garmin LakeVü™ HD built-in
maps, you can select which map to use. Not all models have both types of
built-in maps.
1 From the Nav. chart, select MENU > Built-in Map.
10
AQUAMAP™ 10x2/12x2 SERIES
2 Select an option:
• When you are on an inland lake, select LakeVü™ HD.
• When you are offshore, select BlueChart® g2.
Automatic Identication System
The Automatic Identication System (AIS) enables you to identify and track
other vessels, and alerts you to area trafc. When connected to an external
AIS device, AQUAMAP can show some AIS information about other vessels
that are within range, that are equipped with a transponder, and that are
actively transmitting AIS information.
The information reported for each vessel includes the Maritime Mobile
Service Identity (MMSI), location, GPS speed, GPS heading, time that has
elapsed since the last position of the vessel was reported, nearest approach,
and time to the nearest approach.
Some AQUAMAP models also support Blue Force Tracking. Vessels being
tracked with Blue Force Tracking are indicated with a blue-green color.
AIS Targeting Symbols
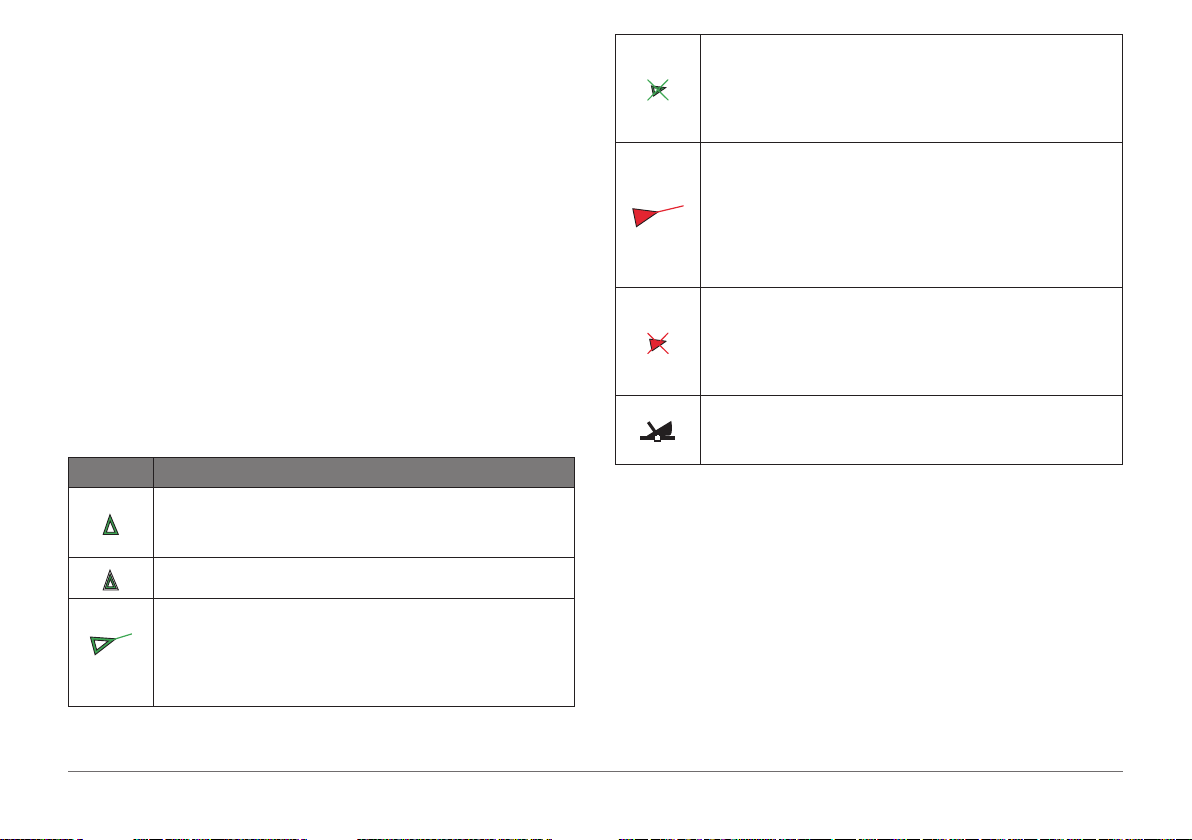
Symbol
AIS vessel. The vessel is reporting AIS information. The direction in
which the triangle is pointing indicates the direction in which the AIS
vessel is moving.
Target is selected.
Target is activated. The target appears larger on the chart. A green line
attached to the target indicates the heading of the target. The MMSI,
speed, and direction of the vessel appear beneath the target, if the
details setting has been set to Show. If the AIS transmission from the
vessel is lost, a message banner appears.
Description
Target is lost. A green X indicates that the AIS transmission from the
vessel is lost, and the AQUAMAP displays a message banner asking
whether the vessel should continue to be tracked. If you discontinue
vessel tracking, the lost target symbol disappears from the chart or the
3D chart view.
Dangerous target in range. The target ashes while an alarm
sounds and a message banner appears. After the alarm has been
acknowledged, a solid red triangle with a red line attached to it
indicates the location and the heading of the target. If the safe-zone
collision alarm has been set to Off, the target ashes, but the audible
alarm does not sound and the alarm banner does not appear. If the
AIS transmission from the vessel is lost, a message banner appears.
Dangerous target is lost. A red X indicates that the AIS transmission
from the vessel is lost, and the AQUAMAP displays a message
banner asking whether the vessel should continue to be tracked. If
you discontinue vessel tracking, the lost dangerous target symbol
disappears from the chart or the 3D chart view.
The location of this symbol indicates the closest point of approach to a
dangerous target, and the numbers near the symbol indicate the time
to the closest point of approach to that target.
NOTE: Vessels being tracked with the Blue Force Tracking feature are
indicated with a blue-green color regardless of their status.
Heading and Projected Course of Activated AIS Targets
When heading and course over ground information are provided by an
activated AIS target, the heading of the target appears on a chart as a solid
line attached to the AIS target symbol. A heading line does not appear on a
3D chart view.
The projected course of an activated AIS target appears as a dashed line on
a chart or a 3D chart view. The length of the projected course line is based
on the value of the projected heading setting. If an activated AIS target is
not transmitting speed information, or if the vessel is not moving, a projected
AQUAMAP™ 10x2/12x2 SERIES
11
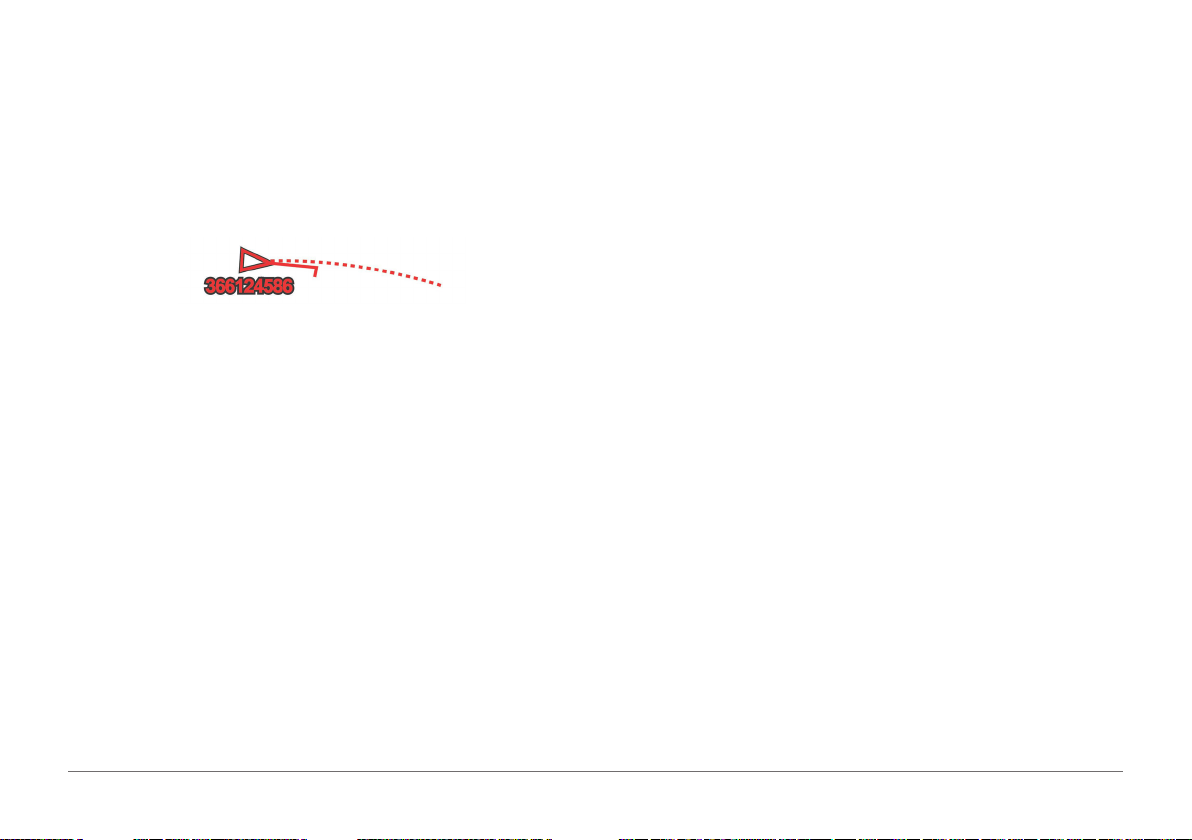
course line does not appear. Changes in the speed, course over ground, or
rate of turn information transmitted by the vessel can impact the calculation of
the projected course line.
When course over ground, heading, and rate of turn information are provided
by an activated AIS target, the projected course of the target is calculated
based on the course over ground and the rate of turn information. The
direction in which the target is turning, which is also based on the rate of turn
information, is indicated by the direction of the barb at the end of the heading
line. The length of the barb does not change.
• To show MARPA-tagged vessels, select MARPA > Show.
• To show details about AIS-activated and MARPA- tagged vessels,
select MARPA > Show.
• To set the projected heading time for AIS-activated and MARPA-tagged
vessels, select Proj. Heading, and enter the time.
• To show the tracks of AIS vessels, and the length of the track using a
trail, select Trails, and select the length.
Activating a Target for an AIS Vessel
1 From a chart or a 3D chart view, select an AIS vessel.
2 Select AIS Vessel > Activate Target.
When course over ground and heading information are provided by an
activated AIS target, but rate of turn information is not provided, the
projected course of the target is calculated based on the course over ground
information.
Showing AIS and MARPA Vessels
Before you can show AIS vessels on a chart, you must have an external AIS
device and active transponder signals from other vessels. Mini Automatic
Radar Plotting Aid (MARPA) functionality works with radar.
You can congure how other vessels appear on a chart or on a 3D chart view.
The display range and MARPA settings congured for one chart or one 3D
chart view are applied only to that chart or to that 3D chart view. The details,
projected heading, and trails settings congured for one chart or one 3D chart
view are applied to all charts and to all 3D chart views.
1 From a chart or a 3D chart view, select MENU > Other Vessels > Display
Setup.
2 Select an option:
• To indicate the distance from your location in which AIS vessels appear,
select Display Range, and select a distance.
12
Viewing Information about a Targeted AIS Vessel
You can view the AIS signal status, MMSI, GPS speed, GPS heading, and
other information that is reported about a targeted AIS vessel.
1 From a chart or a 3D chart view, select an AIS vessel.
2 Select AIS Vessel.
Deactivating a Target for an AIS Vessel
1 From a chart or a 3D chart view, select an AIS vessel.
2 Select AIS Vessel > Deactivate.
Viewing a List of AIS and MARPA Threats
1 From a chart or a 3D chart view, select MENU > Other Vessels > List >
Show.
2 Select the type of threats to include in the list.
AIS Distress Signals
Self-contained AIS distress signal devices transmit emergency position
reports when activated. The AQUAMAP can receive signals from Search and
AQUAMAP™ 10x2/12x2 SERIES
Rescue Transmitters (SART), Emergency Position Indicating Radio Beacons
(EPIRB), and other man overboard signals.
Distress signal transmissions are different than standard AIS transmissions,
so they appear differently on the AQUAMAP. Instead of tracking a distress
signal transmission for collision avoidance, you track a distress signal
transmission to locate and assist a vessel or person.
Navigating to a Distress Signal Transmission
When you receive a distress signal transmission, a distress signal alarm
appears.
Select Review > Go To to begin navigation to the transmission.
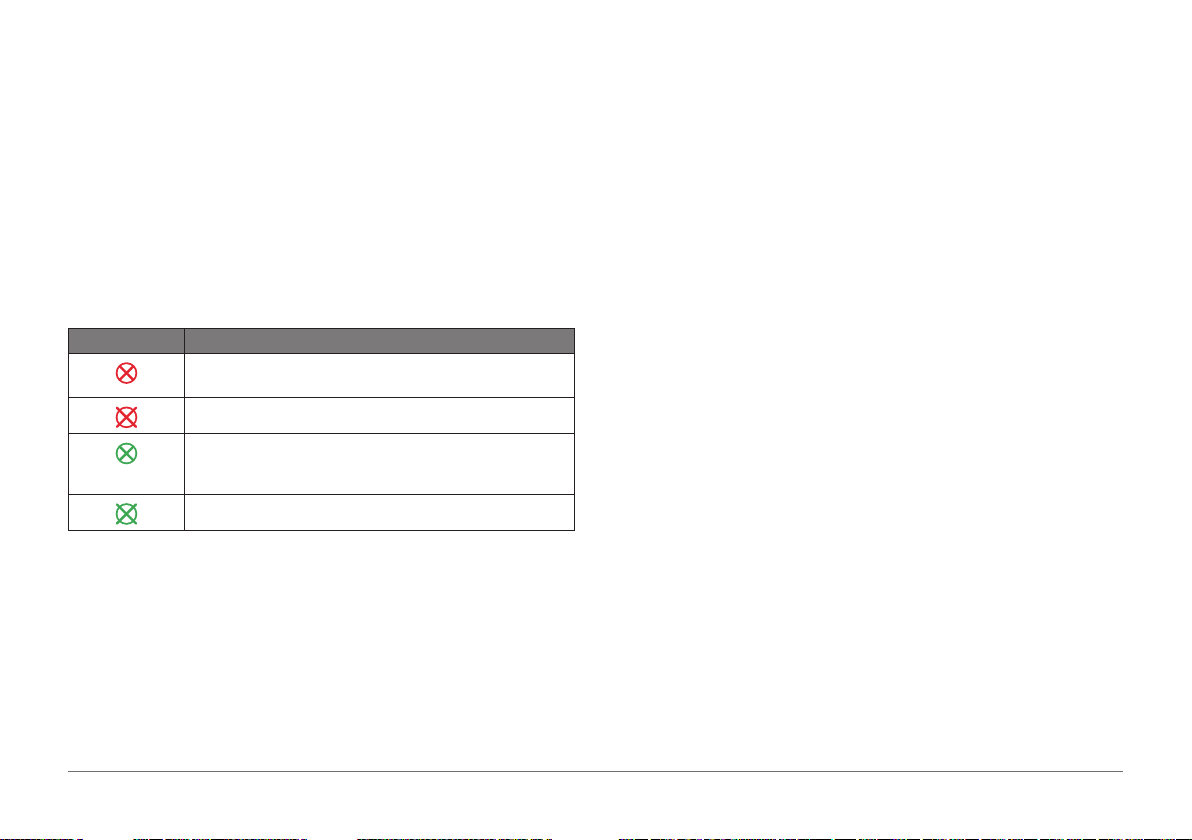
AIS Distress Signal Device Targeting Symbols
Symbol Description
AIS distress signal device transmission. Select to see more
information about the transmission and begin navigation.
Transmission lost.
Transmission test. Appears when a vessel initiates a test of their
distress signal device, and does not represent a true emergency.
Transmission test lost.
Enabling AIS Transmission Test Alerts
To avoid a large number of test alerts and symbols in crowded areas such as
marinas, you can select to receive or ignore AIS test messages. To test an
AIS emergency device, you must enable the AQUAMAP to receive test alerts.
1 Select Settings > Alarms > AIS.
2 Select an option:
• To receive or ignore Emergency Position Indicating Radio Beacon
(EPRIB) test signals, select AIS- EPIRB Test.
• To receive or ignore Man Overboard (MOB) test signals, select AIS-
MOB Test.
• To receive or ignore Search and Rescue Transponder (SART) test
signals, select AIS-SART Test.
Turning Off AIS Reception
AIS signal reception is turned on by default.
Select Settings > Other Vessels > AIS > Off.
All AIS functionality on all charts and 3D chart views is disabled. This
includes AIS vessel targeting and tracking, collision alarms that result from
AIS vessel targeting and tracking, and the display of information about AIS
vessels.
Chart and 3D Chart View Settings
NOTE: Not all settings apply to all charts and 3D chart views. Some options
require premium maps or connected accessories, such as radar.
These settings apply to the charts and 3D chart views, except the radar
overlay and Fish Eye 3D.
From a chart or a 3D chart view, press MENU, and select an option:
Marks, Wpts & Tracks: Opens waypoint and tracks lists.
Other Vessels: Adjusts how other vessels are shown.
Surface Radar: Shows surface radar details on the Perspective 3D or
Mariner’s Eye 3D chart views.
Weather Radar: Shows weather radar imaging on the Perspective 3D or
Mariner’s Eye 3D chart views.
Navaids: Shows navigational aids on the Fishing chart.
Quickdraw Contours: Turns on bottom contour drawing, and allows you to
create shing map labels.
Chart Setup: Adjusts the components to appear on the charts.
AQUAMAP™ 10x2/12x2 SERIES
13

Chart Appearance: Adjusts the appearance of the different charts and 3D
chart views. This may appear in the Chart Setup menu.
Edit Overlays: Adjusts the data shown on the screen. This may appear in the
Chart Setup menu.
Marks, Wpts & Tracks Settings on the Charts and Chart Views
From a chart or a 3D chart view, select MENU > Marks, Wpts & Tracks.
Tracks: Shows tracks on the chart or 3D chart view.
Marks & Waypoints: Shows the list of waypoints.
New Waypoint: Creates a new waypoint.
Waypoint Display: Sets how to display waypoints on the chart.
Active Tracks: Shows the active track options menu.
Saved Tracks: Shows the list of saved tracks.
Tracks Display: Sets which tracks to display on the chart based on track
color.
Routes & Auto Guidance: Shows routes and guidance on the chart.
Other Vessels Settings on the Charts and Chart Views
NOTE: These options require connected accessories, such as an AIS
receiver or VHF radio.
From a chart or a 3D chart view, select MENU > Other Vessels.
List: Shows a list of AIS and MARPA vessels.
AIS Group: Manages AIS groups.
DSC: Shows the DSC list and sets the DSC trails on the chart.
Collision Alarm: Sets the safe-zone collision alarm.
Display Setup: Sets how AIS and MARPA vessels are displayed.
Navigation and Fishing Chart Setup
NOTE: Not all settings apply to all charts and 3D chart views. Some settings
require external accessories or applicable premium charts.
From the Nav. chart or Fishing chart, select MENU > Chart Setup.
Photos: Shows high-resolution satellite images on the land or on both land
and sea portions of the Nav. chart, when certain premium maps are used .
Water Overlay: Enables relief shading, which shows the gradient of the
bottom with shading, or sonar imagery, which helps identify the density of
the bottom. This feature is available only with some premium maps.
Custom Maps: Shows custom maps on the chart of 3D chart view. You can
view KMZ les exported from Google Maps or Google Earth.
Tides & Currents: Shows current station indicators and tide station indicators
on the chart and enables the tides and current slider, which sets the time
for which tides and currents are reported on the map.
Roses: Shows a compass rose around your boat, indicating compass
direction oriented to the heading of the boat. A true wind direction or
apparent wind direction indicator appears if the AQUAMAP is connected to
a compatible marine wind sensor.
Lake Level: Sets the present water level of the lake. This feature is available
only with some premium maps.
Inset Map: Shows a small map centered on your present location.
Weather: Sets which weather items are shown on the chart, when the
AQUAMAP is connected to a compatible weather receiver with an active
subscription. Requires a compatible, connected antenna and an active
subscription.
Chart Appearance: Sets the appearance of the different charts views.
Chart Appearance Settings
You can adjust the appearance of the different charts and 3D chart views.
Each setting is specic to the chart or chart view being used.
NOTE: Not all settings apply to all charts and 3D chart views and AQUAMAP
models. Some options require premium maps or connected accessories.
14
AQUAMAP™ 10x2/12x2 SERIES
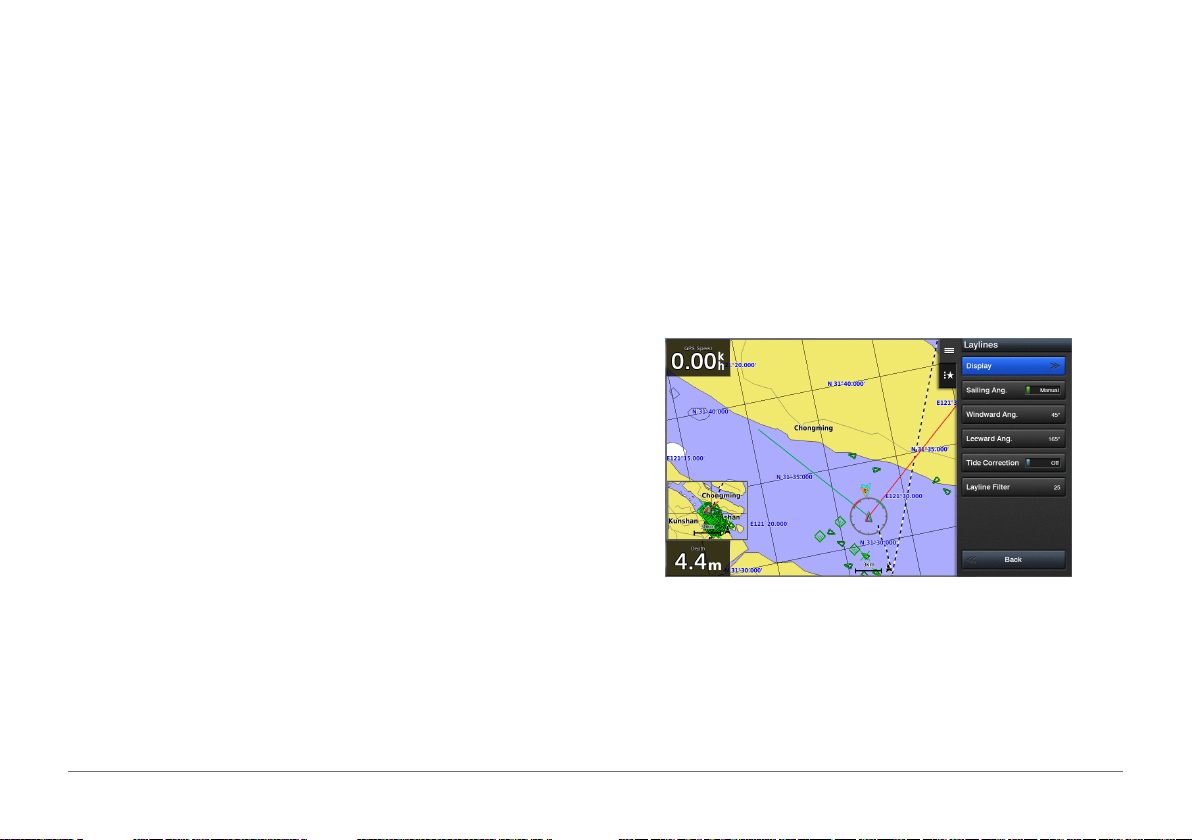
From a chart or 3D chart view, select MENU > Chart Appearance or MENU
> Chart Setup > Chart Appearance.
Orientation: Sets the perspective of the map.
Detail: Adjusts the amount of detail shown on the map, at different zoom
levels.
Heading Line: Shows and adjusts the heading line, which is a line drawn on
the map from the bow of the boat in the direction of travel, and sets the
data source for the heading line.
Panoptix Area: Shows and hides the area being scanned by the Panoptix™
transducer. The attitude and heading reference system (AHRS) must be
calibrated use this feature.
World Map: Uses either a basic world map or a shaded relief map on the
chart. These differences are visible only when zoomed out too far to see
the detailed charts.
Shallow Shading: Sets the shades from the shoreline to the specied depth.
Depth Shading: Species an upper and lower depth to shade between.
Spot Depths: Turns on spot soundings and sets a dangerous depth. Spot
depths that are equal to or more shallow than the dangerous depth are
indicated by red text.
Symbols: Shows and congures the appearance of various symbols on
the chart, such as the vessel icon, navaid symbols, land POIs, and light
sectors.
Inset Map: Shows a map zoomed in on the vessel’s location in the corner of
the main map.
Style: Sets how the chart appears over 3D terrain.
Hazard Colors: Shows shallow water and land with a color scale. Blue
indicates deep water, yellow is shallow water, and red is very shallow
water.
Preferred Depth: Sets the appearance of a safe depth for the Mariner’s Eye
3D chart view.
NOTE: This setting affects only the appearance of hazard colors for the
Mariner’s Eye 3D chart view. It does not affect the safe water depth Auto
Guidance setting or the sonar shallow water alarm setting.
Range Rings: Shows and congures the appearance of range rings, which
help you to visualize distances in some chart views.
Lane Width: Species the width of the navigation lane, which is the magenta
line in some chart views that indicates the course to your destination.
Laylines Settings
To use the laylines features, you must connect a wind sensor to the
AQUAMAP.
When in sailing mode, you can display laylines on the Nav. chart. Laylines
can be very helpful when racing.
From the Nav. chart, select MENU > Sailing > Laylines.
Display: Sets how the laylines and vessel appear on the chart, and sets the
length of the laylines.
Sailing Ang.: Allows you to select how the device calculates laylines. The
Actual option calculates the laylines using the measured wind angle from
the wind sensor. The Manual option calculates the laylines using manually
entered windward and leeward angles.
AQUAMAP™ 10x2/12x2 SERIES
15
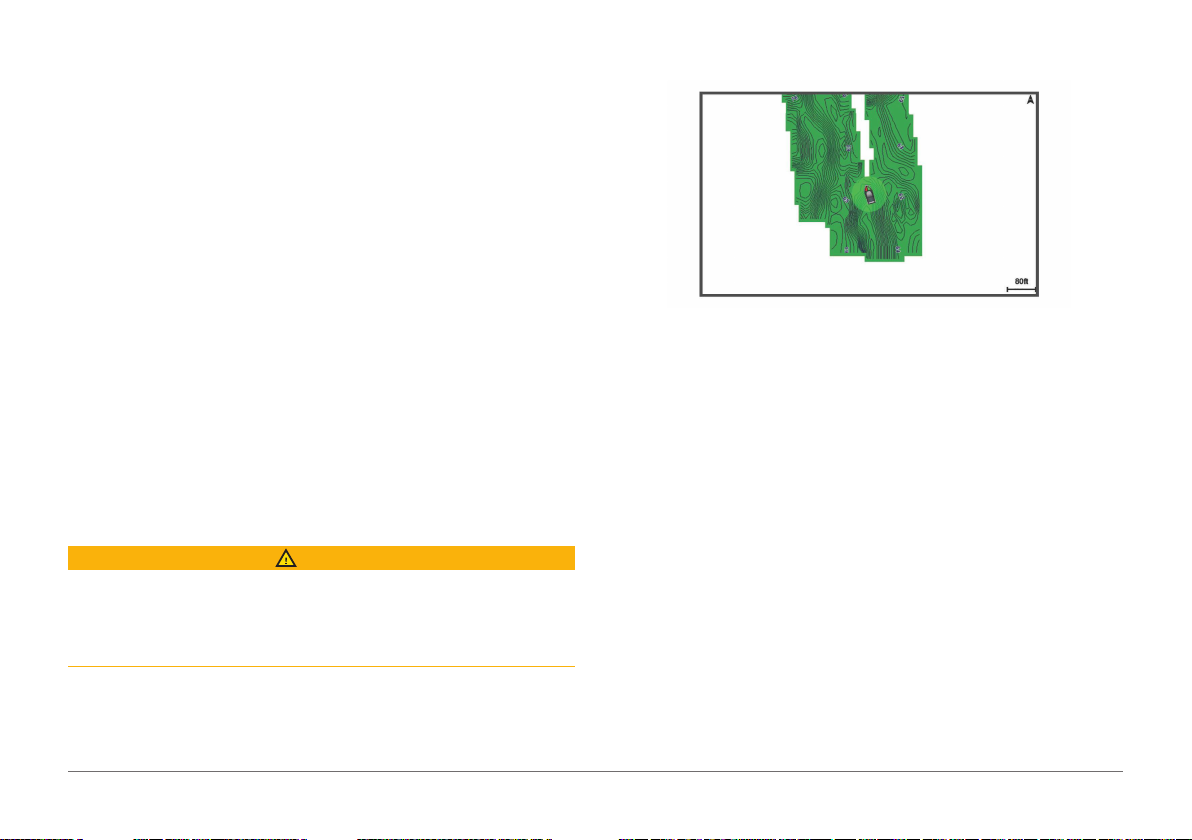
Windward Ang.: Allows you to set a layline based on the windward sailing
angle.
Leeward Ang.: Allows you to set a layline based on the leeward sailing
angle.
Tide Correction: Corrects the laylines based on the tide.
Layline Filter: Filters the layline data based on the time interval entered.
For a smoother layline that lters out some of the changes in the boat’s
heading or true wind angle, enter a higher number. For laylines that
display a higher sensitivity to changes in the boat’s heading or true wind
angle, enter a lower number.
Fish Eye 3D Settings
NOTE: This feature is available with premium charts, in some areas.
From the Fish Eye 3D chart view, select MENU.
View: Sets the perspective of the 3D chart view.
Tracks: Shows tracks.
Sonar Cone: Shows a cone that indicates the area covered by the
transducer.
Fish Symbols: Shows suspended targets.
Garmin Quickdraw Contours Mapping
WARNING
The Garmin Quickdraw Contours mapping feature allows users to generate
maps. Garmin makes no representations about the accuracy, reliability,
completeness or timeliness of the maps generated by third parties. Any use
or reliance on the maps generated by third parties is at your own risk.
The Garmin Quickdraw Contours mapping feature allows you to instantly
create maps with contours and depth labels for any body of water.
When Garmin Quickdraw Contours records data, a colored circle surrounds
the vessel icon. This circle represents the approximate area of the map that is
scanned by each pass.
A green circle indicates good depth and GPS position, and a speed under 16
km/h (10 mph). A yellow circle indicates good depth and GPS position, and a
speed between 16 and 32 km/h (10 and 20 mph). A red circle indicates poor
depth or GPS position, and a speed above 32 km/h (20 mph).
You can view Garmin Quickdraw Contours in a combination screen or as a
single view on the map.
The amount of saved data depends on the size of your memory card, your
sonar source, and the speed of your boat as you record data. You can record
longer when you use a single-beam sonar. It is estimated that you might be
able to record about 1,500 hours of data onto a 2 GB memory card.
When you record data on a memory card in your AQUAMAP, the new data is
added to your existing Garmin Quickdraw Contours map, and is saved on the
memory card. When you insert a new memory card, the existing data does
not transfer onto the new card.
Mapping a Body of Water Using the Garmin Quickdraw Contours
Before you can use the Garmin Quickdraw Contours feature, you must have
a supported AQUAMAP with upgraded software, sonar depth, your GPS
position, and a memory card with free space.
16
AQUAMAP™ 10x2/12x2 SERIES
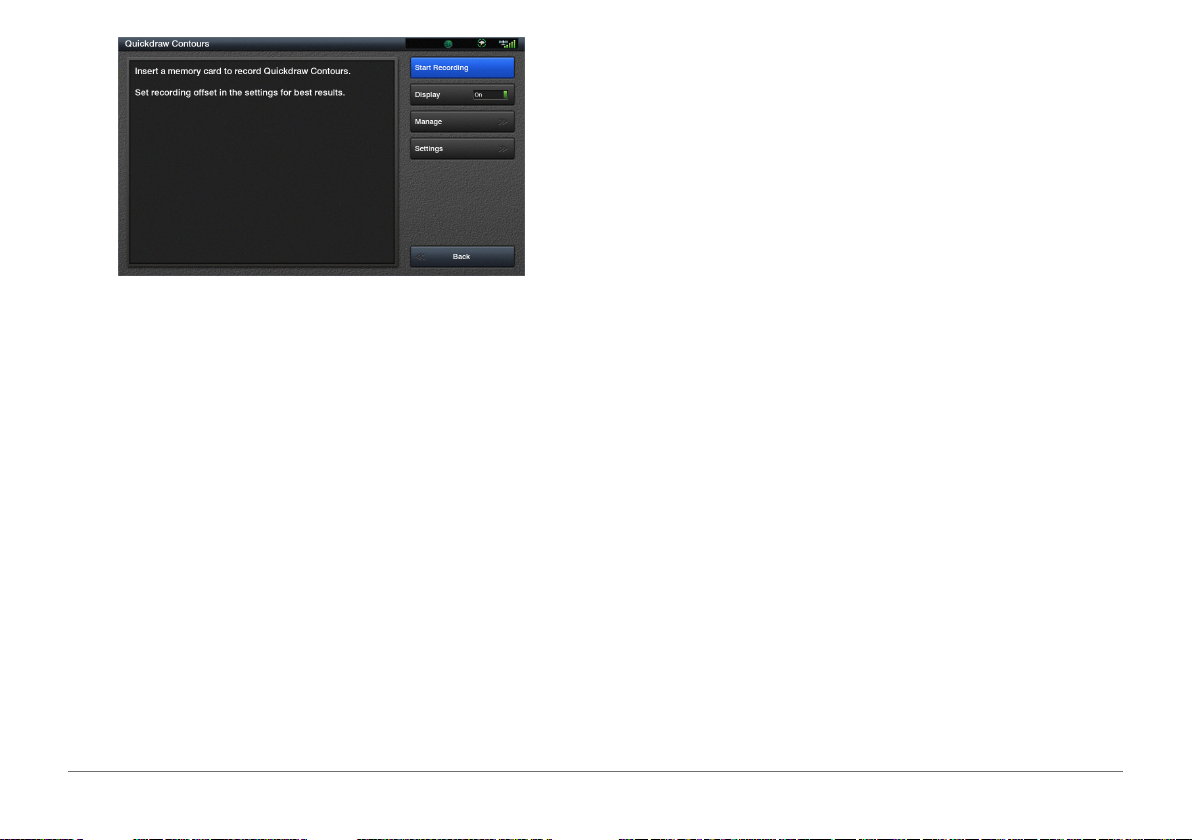
NOTE: This feature is not available on all models.
1 From a chart view, select MENU > Quickdraw Contours > Start
Recording.
2 When recording is complete, select Stop Recording.
3 Select Manage > Name, and enter a name for the map.
Adding a Label to a Garmin Quickdraw Contours Map
You can add labels to a Garmin Quickdraw Contours map to mark hazards or
points of interest.
1 From the Nav. chart, select a location.
2 Select Add Quickdraw Label.
3 Enter text for the label, and select Done.
Garmin Quickdraw Community
The Garmin Quickdraw Community is a free, public, online community that
enables you to share your Garmin Quickdraw Contours maps with others.
You can also download maps other users have created.
To access the Garmin Quickdraw Community, sign in to your Garmin
Connect™ account, and then you can upload and download maps using a
memory card.
Accessing the Garmin Quickdraw Community
You can access the Garmin Quickdraw Community using Garmin Connect
website.
1 Go to connect.garmin.com.
2 Select Get Started > Quickdraw Community > Get Started.
3 If you do not have a Garmin Connect account, create one.
4 Sign in to your Garmin Connect account.
5 Select Marine in the upper-right to open the Garmin Quickdraw widget.
TIP: Make sure you have a memory card in your computer to share Garmin
Quickdraw Contours maps.
Sharing Your Garmin Quickdraw Contours Maps with the Garmin
Quickdraw Community
You can share Garmin Quickdraw Contours maps that you have created with
others in the Garmin Quickdraw Community.
When you share a contour map, only the contour map is shared. Your
waypoints are not shared.
1 Remove the memory card from the AQUAMAP.
2 Insert the memory card into your computer.
3 Access the Garmin Quickdraw Community.
4 Select Share Your Contours.
5 Browse to your memory card, and select the /Garmin folder.
6 Open the Quickdraw folder, and select the le named ContoursLog.svy.
After the le is uploaded, delete the ContoursLog.svy le from your memory
card to avoid issues with future uploads. Your data will not be lost.
AQUAMAP™ 10x2/12x2 SERIES
17
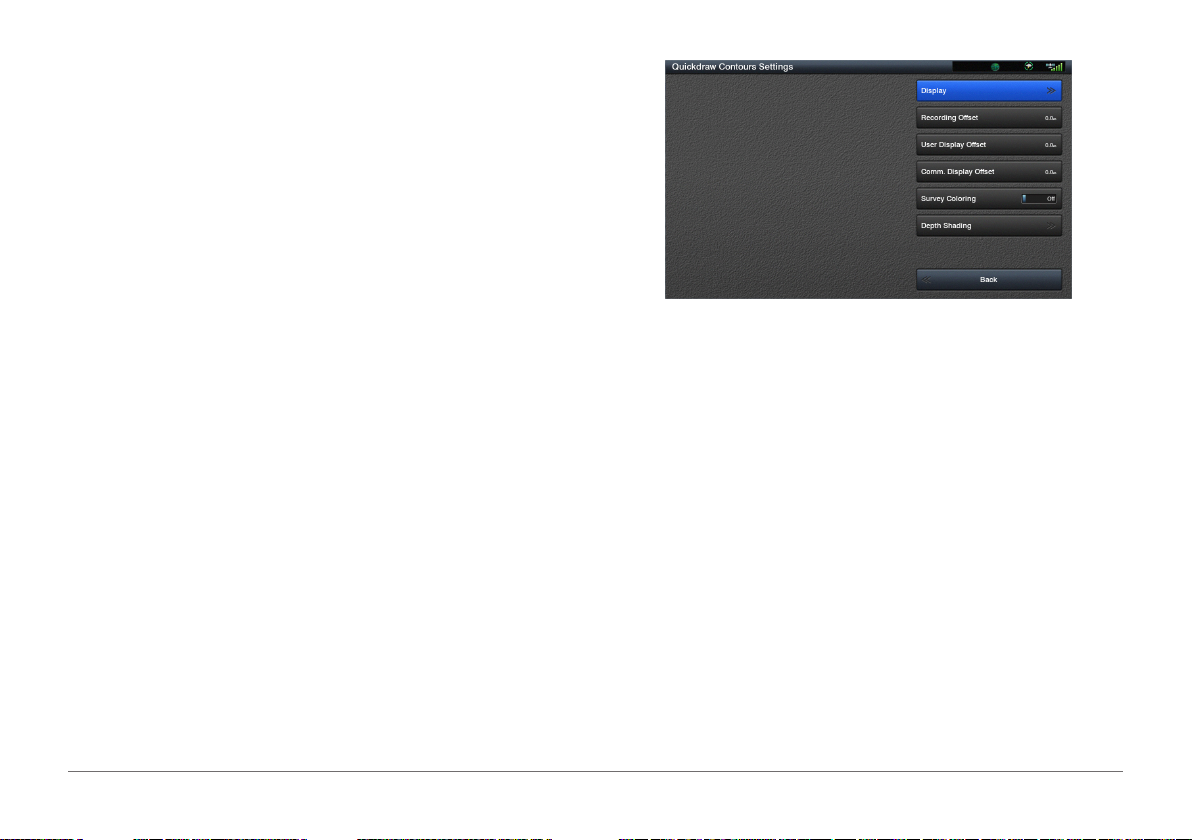
Downloading Garmin Quickdraw Community Maps
You can download Garmin Quickdraw Contours maps that other users have
created and shared with the Garmin Quickdraw Community.
1 Insert the memory card into your computer.
2 Access the Garmin Quickdraw Community.
3 Select Search for Contours.
4 Use the map and search features to locate an area to download.
The red dots represent Garmin Quickdraw Contours maps that have been
shared for that region.
5 Select Select an Area to Download.
6 Drag the edges of the box to select the area to download.
7 Select Start Download.
8 Save the le to your memory card.
TIP: If you cannot nd the le, look in the “Downloads” folder. The browser
may have saved the le there.
9 Remove the memory card from your computer.
10 Insert the memory card in the AQUAMAP.
The AQUAMAP automatically recognizes the contours maps. The
AQUAMAP may take a few minutes to load the maps.
Garmin Quickdraw Contours Settings
From a chart, select MENU > Quickdraw Contours > Settings.
Display: Displays Garmin Quickdraw Contours. The User Contours option
shows your own Garmin Quickdraw Contours maps. The Community
Contours option shows the maps you have downloaded from the Garmin
Quickdraw Community.
Recording Offset: Sets the distance between the sonar depth and the
contour recording depth. If the water level has changed since your last
recording, adjust this setting so the recording depth is the same for both
recordings.
For example, if the last time you recorded had a sonar depth of 3.1 m
(10.5 ft.), and today’s sonar depth is 3.6 m (12 ft.), enter -0.5 m (-1.5 ft.)
for the a Recording Offset value.
User Display Offset: Sets differences in contour depths and depth labels on
your own contours maps to compensate for changes in the water level of a
body of water, or for depth errors in recorded maps.
Comm. Display Offset: Sets differences in contour depths and depth labels
on the community contours maps to compensate for changes in the water
level of a body of water, or for depth errors in recorded maps.
18
AQUAMAP™ 10x2/12x2 SERIES
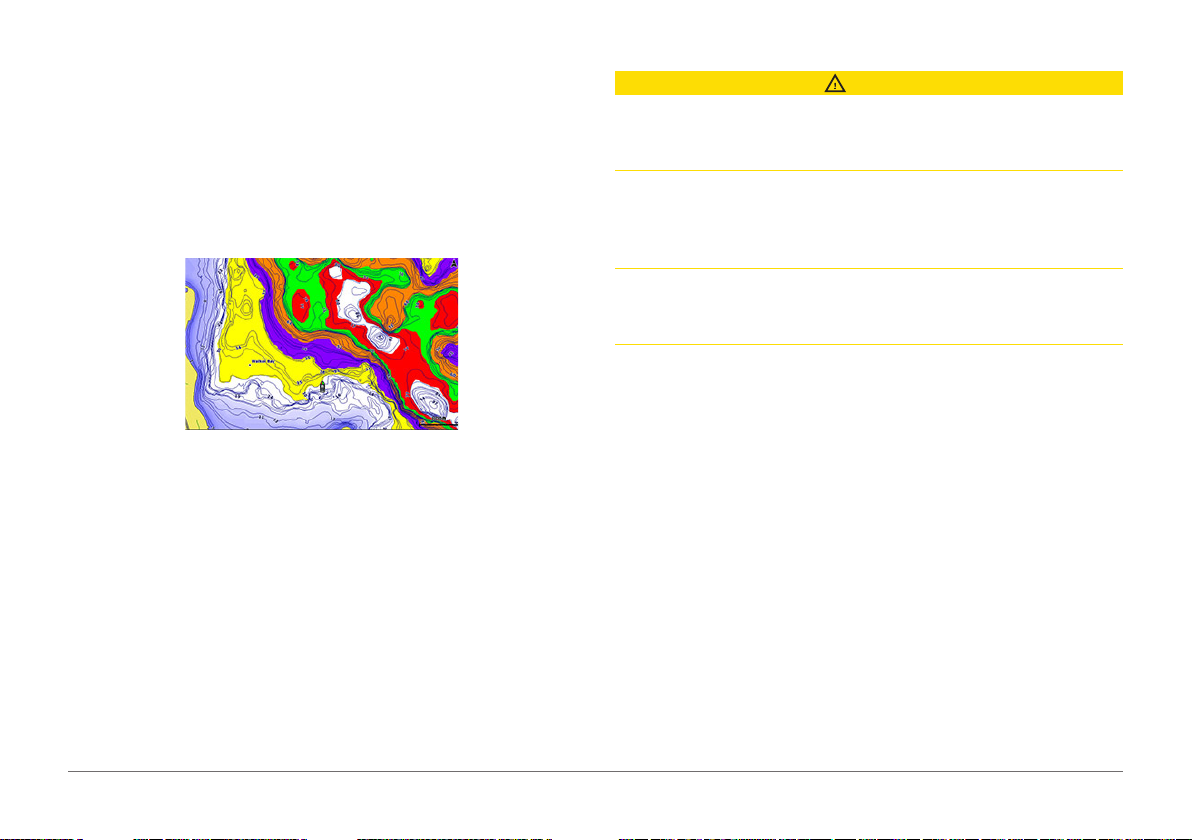
Survey Coloring: Sets the color of the Garmin Quickdraw Contours display.
When this setting is turned on, the colors indicate the quality of the
recording. When this setting is turned off, the contour areas use standard
map colors.
Green indicates good depth and GPS position, and a speed under 16
km/h (10 mph). Yellow indicates good depth and GPS position, and a
speed between 16 and 32 km/h (10 and 20 mph). Red indicates poor
depth or GPS position, and a speed above 32 km/h (20 mph).
Depth Shading: Species the upper and lower limits of a depth range and a
color for that depth range.
Navigation with AQUAMAP
CAUTION
If your vessel has an autopilot system, a dedicated autopilot control display
must be installed at each steering helm in order to disable the autopilot
system.
The Auto Guidance feature is based on electronic chart information. That
data does not ensure obstacle and bottom clearance. Carefully compare
the course to all visual sightings, and avoid any land, shallow water, or other
obstacles that may be in your path.
When using Go To, a direct course and a corrected course may pass over
land or shallow water. Use visual sightings, and steer to avoid land, shallow
water, and other dangerous objects.
NOTE: Some chart views are available with premium charts, in some areas.
To navigate, you must choose a destination, set a course or create a route,
and follow the course or route. You can follow the course or the route on the
Nav. chart, Fishing chart, or 3D chart view.
You can set and follow a course to a destination using one of three methods:
Go To: Takes you directly to the destination. This is the standard option for
navigating to a destination. The AQUAMAP creates a straight-line course
or navigation line to the destination. The path may run over land and other
obstacles.
Route To: Creates a route from your location to a destination, allowing you
to add turns along the way. This option provides a straight-line course to
the destination, but allows you to add turns into the route to avoid land and
other obstacles.
Auto Guidance: Uses the specied information about your vessel and chart
data to determine the best path to your destination. This option is available
only when using a compatible premium chart in a compatible AQUAMAP.
It provides a turn-by-turn navigation path to the destination, avoiding land
AQUAMAP™ 10x2/12x2 SERIES
19
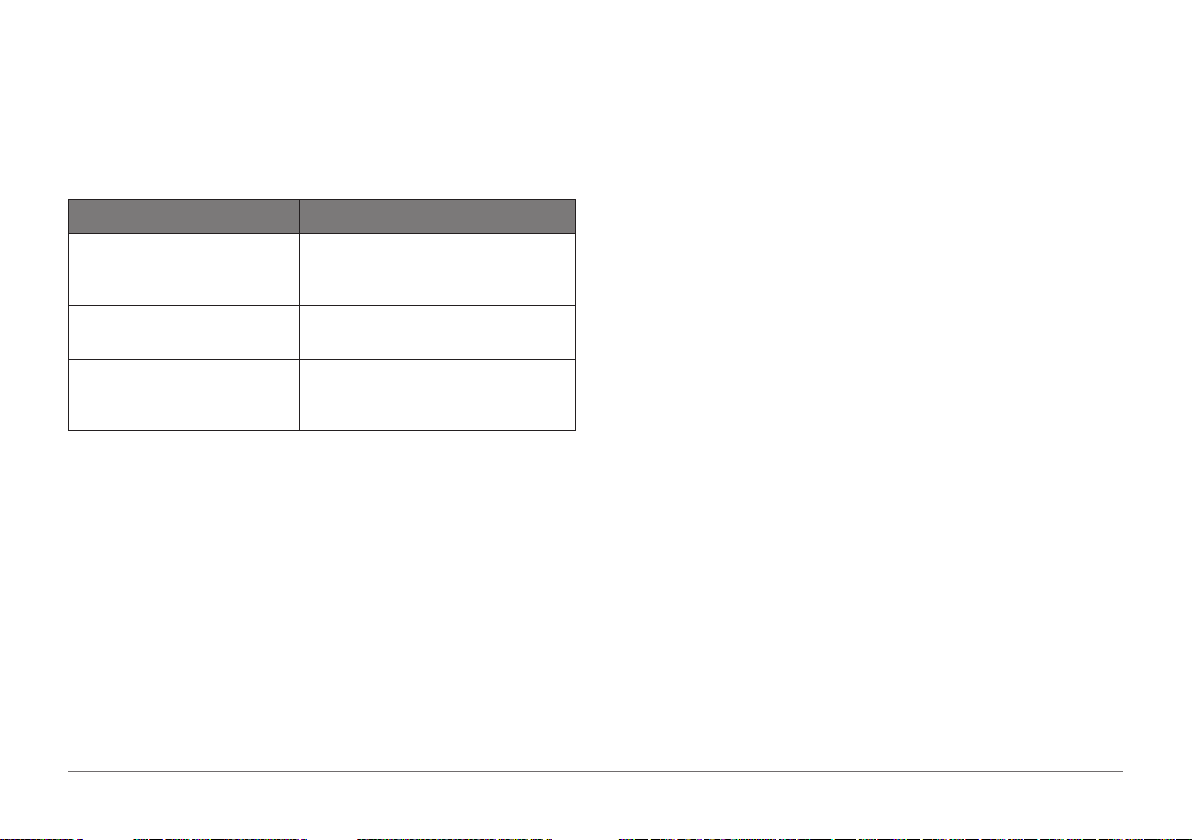
and other obstacles.
When you are using a compatible Garmin autopilot connected to the
AQUAMAP using NMEA 2000®, the autopilot follows the Auto Guidance
route.
NOTE: Auto Guidance is available with premium charts, in some areas.
Basic Navigation Questions
Question Answer
How do I make the device guide me
to a location while avoiding charted
obstacles?
How do I make the device steer my
automatic pilot?
Can the device create a path for me?
Build a multi-leg route and navigate it using
Route To.
Navigate using Route To.
If you have premium maps that support Auto
Guidance and are in an area covered by Auto
Guidance, navigate using Auto Guidance.
Destinations
You can select destinations using various charts and 3D chart views or using
the lists.
4 Select the destination.
Selecting a Destination Using the Nav. chart
From the Nav. chart, select a destination.
Searching for a Marine Services Destination
NOTE: This feature is available with premium charts, in some areas.
The AQUAMAP contains information for thousands of destinations offering
marine services.
1 Select NAV INFO > Services.
2 Select Offshore Services or Inland Services.
3 If necessary, select the marine service category. The AQUAMAP shows a
list of the nearest locations and the distance and bearing to each.
4 Select a destination. You can select Next Page or Previous Page to view
additional information or to show the location on a chart.
Stopping Navigation
While navigating, from the Nav. chart or Fishing chart, select an option:
• Select MENU > Stop Navigation.
• When navigating with Auto Guidance, select MENU > Navigation Options
> Stop Navigation.
Searching for a Destination by Name
You can search for saved waypoints, saved routes, saved tracks, and marine
services destinations by name.
1 Select NAV INFO > Services > Search by Name.
2 Enter at least a portion of the name of your destination.
3 If necessary, select Done.
The 50 nearest destinations that contain your search criteria appear.
20
Marks and Waypoints
Waypoints are locations you record and store in the device.
Marking Your Current Location as a Waypoint
From any screen, press MARK WPT MOB.
Creating a Waypoint at a Different Location
1 From a Nav. chart or 3D chart view, select MENU > Marks, Wpts &
AQUAMAP™ 10x2/12x2 SERIES
 Loading...