

OWNER’S MANUAL SUPPLEMENT
for Performance Computer with VFD display
New Features
c
New G-Meter Display Options 2-5
Other Improvements 6-7
Metric Operation
Metric/US config
Setup for Metric use 8-9
Metric Differences 10-11
New G-Meter Displays
We’ve added four new ways for the
Performance Computer to display
G-Forces.
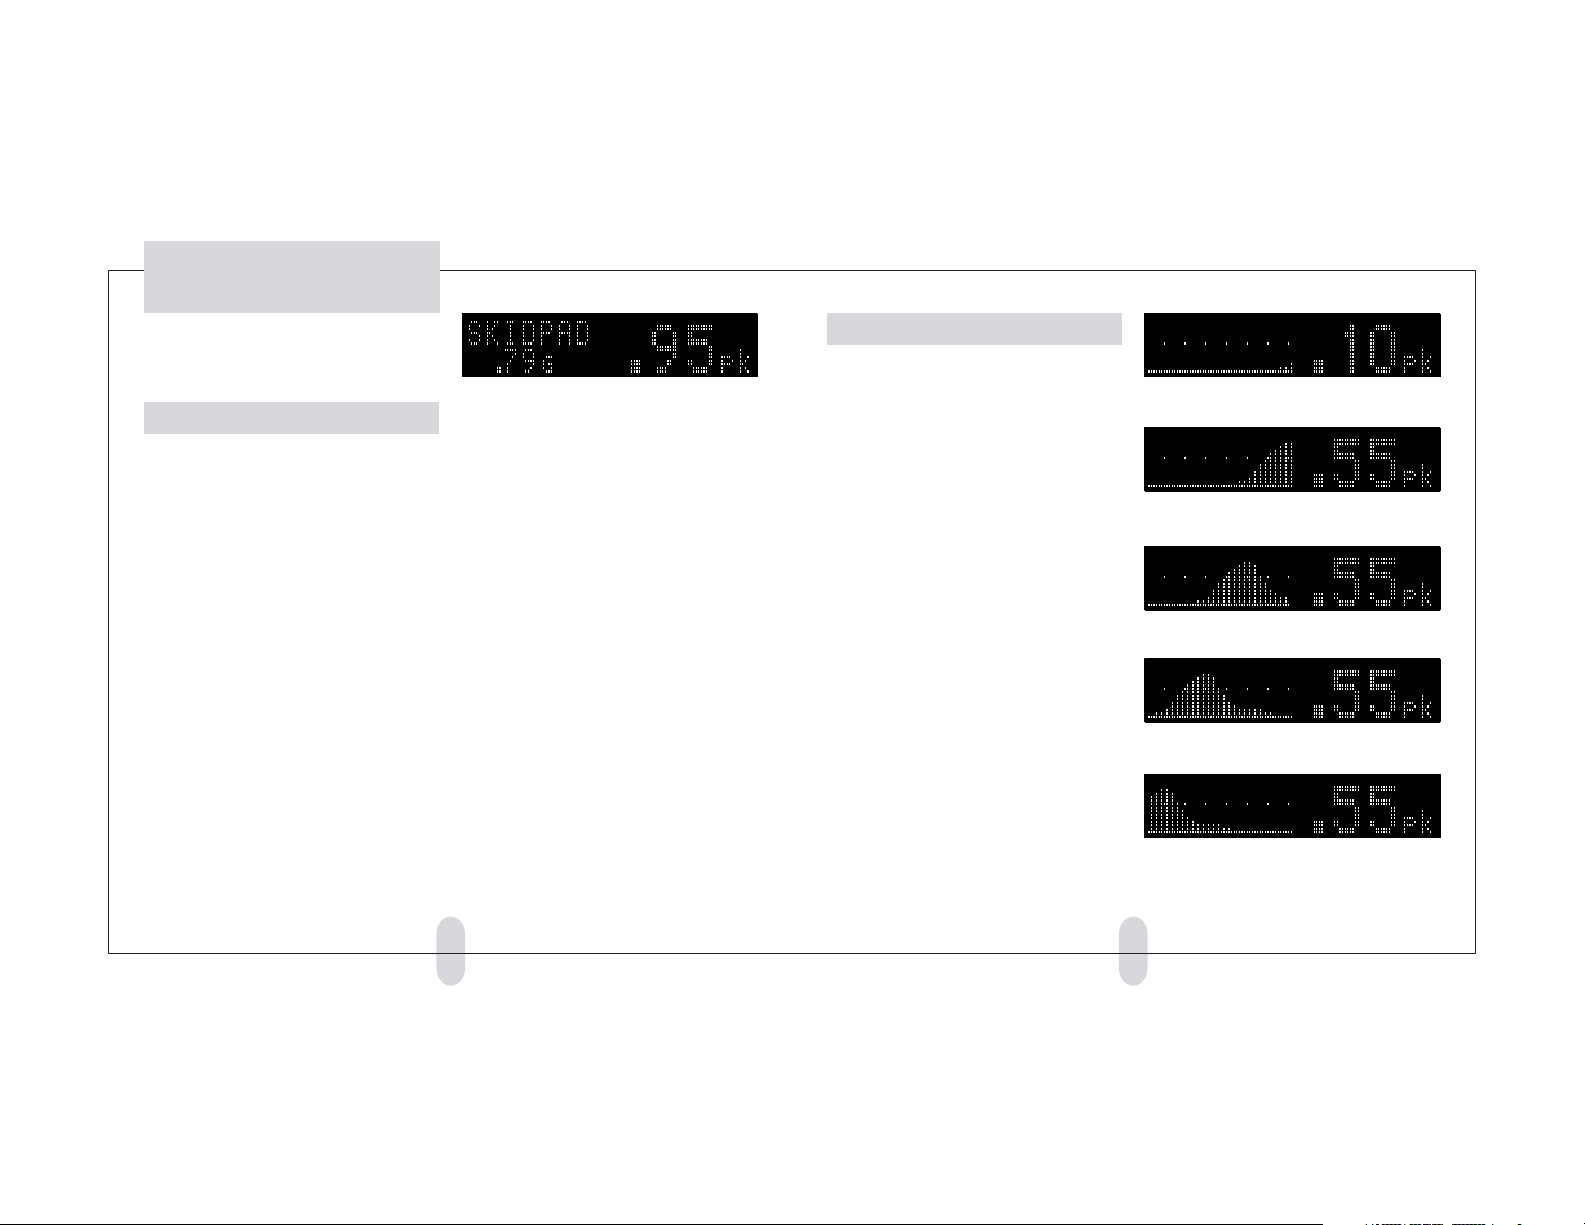
G-METER OPTION 9: SKIDPAD
Press and release the G-METER button as necessary to
select “G-METER OPTION 9.”
Car testers use a large circular track (“skidpad”) to
measure maximum cornering capabilities of vehicles.
This display shows only the cornering G-Force.
The small number on this display is a continuously computed two-second average reading for the cornering
G-Force. This averaging eliminates false readings
caused by momentary spikes.
(You can change the averaging time from 1 second to
16 seconds in the user setup mode. For reference, at
.8 G, it will take about 15 seconds to travel a full lap
of a 300 foot diameter skidpad.)
The large number on this display holds the peak reading (of the averaged number) for seven seconds. This
allows you to evaluate the vehicle at its maximum cornering capability, then slow down a bit and still have
time to view the highest reading achieved.
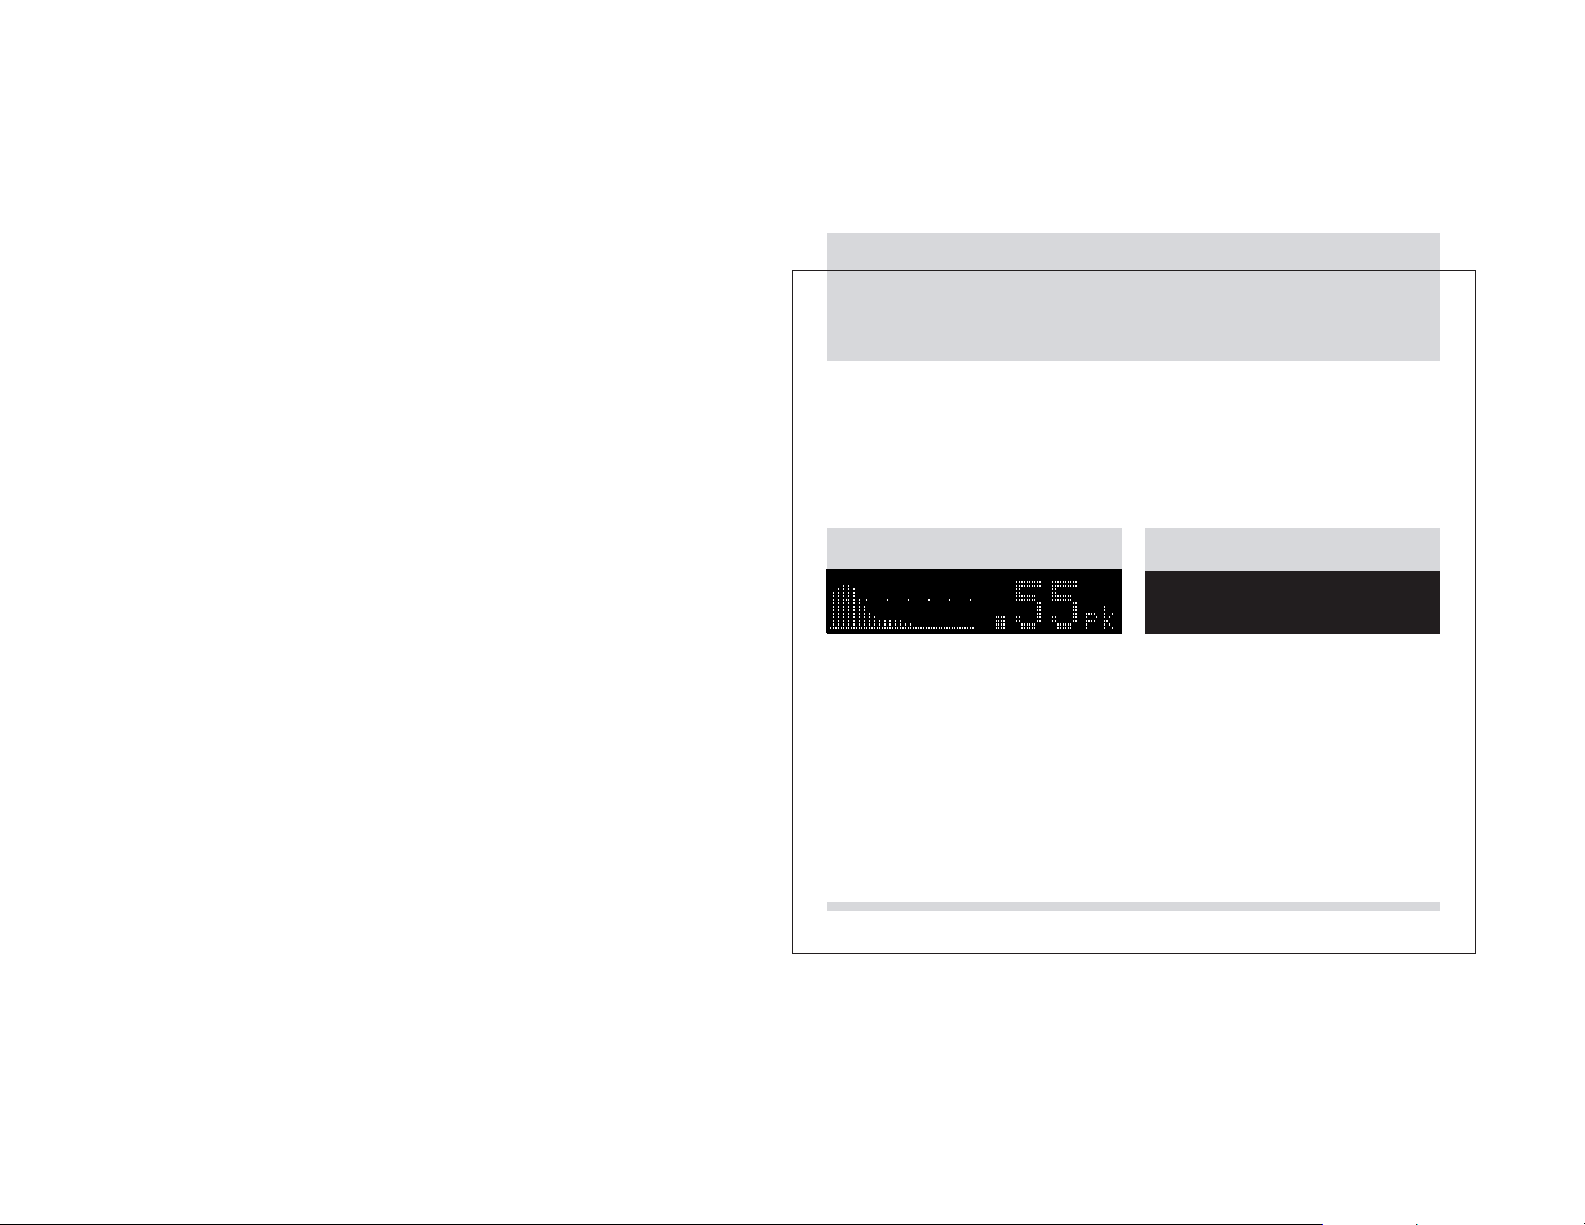
In this example, the small number shows that
the current cornering G-Force is .79 G, and
the large number shows that the peak skidpad
reading in the last seven seconds was .95 G.
ENGINE DAMAGE WARNING
Some street vehicles are not designed for long-term
continuous turning in one direction, and it may be possible to cause extensive engine damage when the oil
in the engine’s oil pan is held to one side by sustained
cornering forces. Make sure your vehicle’s oil is at the
proper level, and immediately stop the skidpad test if
your vehicle’s oil pressure drops.
Comparing your results to published tests
Professional testers typically use new vehicles (with fulltread tires) on large asphalt skidpads, usually 200 or
300 feet in diameter.
Smaller diameter circles (such as you might perform
in a parking lot) will produce higher G-Forces. Abrasive surfaces (such as concrete) will also produce higher
G-Forces. Finally, worn tires (with little tread remaining) will produce higher G-Forces (on dry surfaces).
G-METER OPTION 10: G-FORCE GRAPH
Press and release the G-METER button as necessary to
select “G-METER OPTION 10.”
Note: This “moving chart” display will be easier to
understand after you try it in your vehicle.
The graph shows a moving chart that shows how the
G-Force has changed over the past seven seconds.
The large number on this display shows the peak of
your combined vector G-Forces (see explanation in the
owner’s manual in G-METER option 2: Friction Circle)
over the past seven seconds.
This seven second peak hold allows you to complete a
maneuver (such as a turn), then after completing the
maneuver, still have time to glance at the display to
see what G-Force you attained.
This display is very useful for evaluating driver smoothness. For example, by having a passenger monitor the
G-Force as a driver brakes for a corner, turns into the
corner, and then accelerates out of the corner. Ideally
the G-Force graph will show a continuous high g-force
with smooth transitions as the car goes from braking
to cornering to acceleration.
The car has begun to brake,
and is decelerating at .10 G.
c
2 seconds later, the car is braking harder,
now decelerating at .55 G.
c
2 seconds later, braking has been reduced to .10 G.
(The peak G-Force over the past 7 seconds is .55 G.)
c
2 seconds later, the car is no longer braking.
(The peak G-Force over the past 7 seconds is .55 G.)
c
2 seconds later, the car is no longer braking.
(The peak G-Force over the past 7 seconds is .55 G.)
32
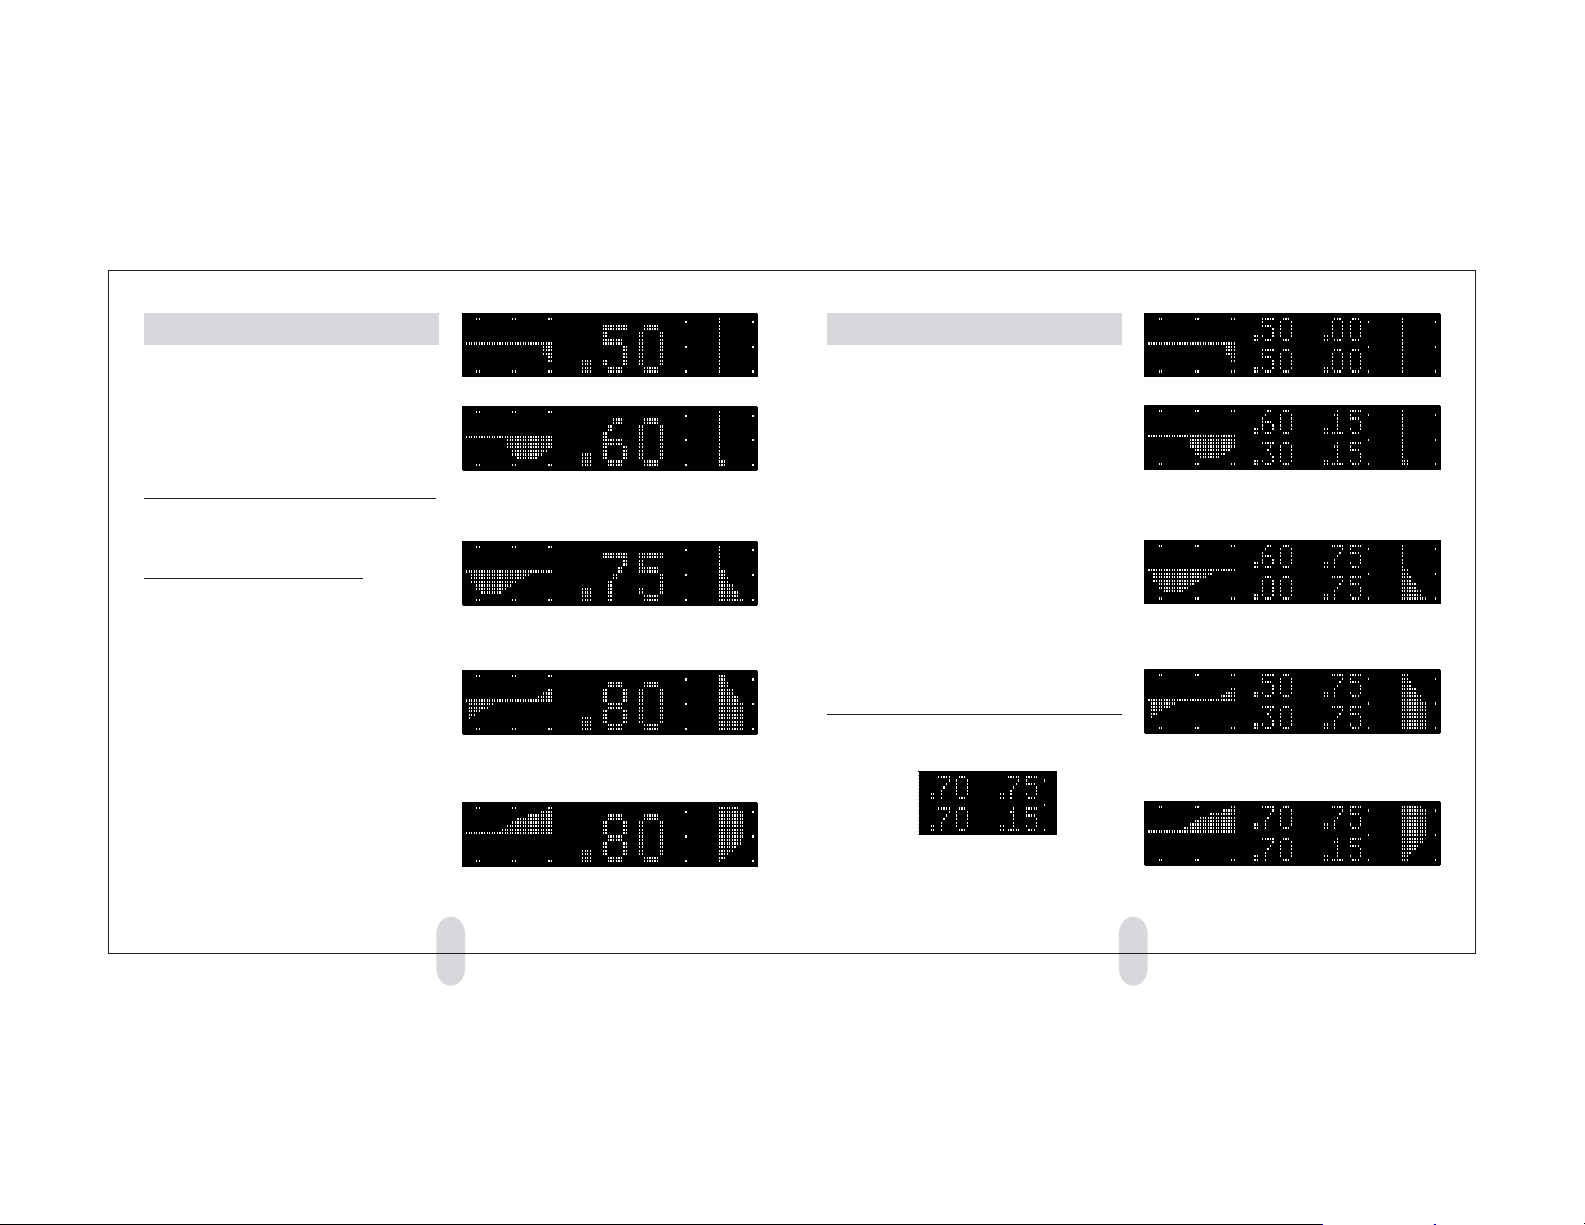
G-METER OPTION 11: 2-AXIS GRAPHS
G-METER OPTION 12: 2-AXIS W/ PEAKS
Press and release the G-METER button as necessary to
select “G-METER OPTION 11.”
Note: This “moving chart” display will be easier to
understand after you try it in your vehicle.
The left-hand graph shows acceleration and braking.
Acceleration is displayed as a line above the center.
Braking is displayed as a line below the center.
The right-hand graph shows cornering. Cornering to
the right is displayed as a line to the right. Cornering
to the left is displayed as a line to the left.
The number shows the peak of the combined G-Force
over the past four seconds.
2 seconds later, the car has braked harder, then
reduced braking. The car is beginning a right turn.
The peak G-Force over the past 4 seconds is .60 G.
2 seconds later, the car is no longer braking, but it is
cornering to the right at .75 G.
(The peak G-Force over the past 4 seconds is .75 G.)
2 seconds later, the car is still cornering to the right,
and is beginning to accelerate.
(The peak G-Force over the past 4 seconds is .80 G.)
2 seconds later, the car continues to accelerate.
(The peak G-Force over the past 4 seconds is .80 G.)
Press and release the G-METER button as necessary to
select “G-METER OPTION 12.”
Note: This “moving chart” display will be easier to
understand after you try it in your vehicle.
The graphs are identical to option 11.
The upper number on the left shows the peak acceleration or braking force over the past four seconds.
The lower number on the left shows the current acceleration or braking force over the past four seconds.
The upper number on the right shows the peak cornering force over the past four seconds.
The lower number on the right shows the current
cornering force over the past four seconds.
Peak acceleration or
braking force over "
past 4 seconds
Current acceleration !
or braking force
Peak cornering
" force over past
4 seconds
! Current
cornering force
The car is decelerating at .50 G.The car is decelerating at .50 G.
2 seconds later, the car is braking at .30 G. The peak
braking G-Force over the past 4 seconds is .60 G.
The car is beginning a right turn, cornering at .15 G.
.
2 seconds later, the car is not braking, but the peak
braking G-Force over the past 4 seconds is .60 G.
The car is cornering to the right at .75 G.
2 seconds later, the car is still cornering at .75 G, and
is accelerating at .30 G. The peak accelerating/
braking G-Force over the past 4 seconds is .50 G.
2 seconds later, the car continues to accelerate, and
is now cornering at .15 G.
54

Other New Features
We’ve made refinements and
improvements to several features
of the Performance Computer.
EASIER-TO-READ DISPLAYS
We’ve improved some of the timed run screens.
New Horsepower readout:
Max Speed 109.3
324HP60mph 296av
The display now shows the peak horsepower reading
and speed first, the average horsepower second.
New Brake Test readout:
60-0 Brake Test
168 feet 3.09 sec
.
IMPROVED DEFAULT SETTINGS
Vehicle Weight:
The default vehicle weight (used for horsepower calculation) is now 3500 lb. (In metric mode, it is 1600kg.)
Brake Test:
The brake test feature is now normally ON. To perform a brake test, start a timed run as normal, accelerate to at least 63mph/105kph (but no higher than
80mph/130kph), then begin your brake test.
CHANGE IN DEMO MODE
If you put the Performance Computer in the “demo
mode” (a special mode that continuously scrolls
through the product’s significant features), it will stay
in that mode, even if unplugged and plugged back in.
or stop the demo mode:
To start
1. Unplug the unit or disconnect power to it.
2. Press the UP button and the G-METER button.
3. Reconnect power while you hold the two buttons.
HORSEPOWER CALCULATION
We’ve improved the accuracy of the engine horsepower
calculations of the Performance Computer.
We’ve added an additional correction factor, called
“Mass Factor.” Roller-type (chassis) dynamometers typically measure horsepower with the car in 4th gear. We
believe most users of the Performance Computer will
measure their horsepower at lower speeds. In lower
gears, the effective mass of your car is increased, due
to an increased effect of the rotating inertia of the drivetrain. Suggested settings for “Mass Factor” in the setup
mode are 20% to measure horsepower in 1st gear, 7%
to measure horsepower in 2nd gear, 3% to measure
horsepower in 3rd gear, and 0% to measure horsepower
in 4th gear (or higher gears). The default Mass Factor
(adjustable in the Setup mode) is 7%, which assumes
you will measure horsepower in 2nd gear (which covers speeds to approximately 60 mph in most cars).
For accurate horsepower measurements
For the most accurate horsepower measurements during a timed run, shift early and shift smoothly, letting
your car accelerate at full throttle through the engine’s
entire RPM range. The unit measures horsepower from
30 mph through 60 mph (you can adjust this speed
range in the setup mode). The peak horsepower is displayed along with your other run results after the run.
But remember, horsepower readings are affected by
temperature, humidity, slope of the road, air density,
and other factors. As such, the horsepower readings
will not exactly match the results of an engine dynamometer, which is performed in a much more controlled
(and therefore repeatable) environment.
CHANGE IN DATALOGGER MODE
We’ve improved the datalogger mode (see details on
page 30 in the Owner’s Manual). Now the Datalogger
records acceleration, braking and cornering G-Forces
10 times per second, for a single run that can be as
long as 22 minutes.
SETUP MODE ITEMS
“Mass Factor” (new item)
See horsepower calculation information on this page.
“Factory Default” is eliminated.
To restore factory defaults, instead use the procedure
on page 33 of the Owner’s Manual.
“Skidpad” (new item)
This lets you choose the time period for averaging the
skidpad cornering force. It is adjustable from 1 to 16
seconds, the default is 2 seconds.
76

Setup for Metric use
You can now setup your Performance
Computer for US or Metric units, and
calculate engine power in HP, PS
(metric horsepower) or KW (kilowatts).
IMPORTANT
NOTE: Changing any of these settings
run results and any personal settings the user has programmed, such as vehicle weight, etc., so this configuration is best done before first using the Performance
Computer.
erases all saved
STEP 1: Enter the Metric Setup
1 Hold the G-METER button for
15 seconds.
The display will change a few times while you
hold the button. Do not release the button until
the display reads “Metric/US config.”
2 You will see these two alternating
instructions:
Metric/US config
STARTforNextItem
This screen explains that you should press the START
button if you want to go to the next item in the Metric
Setup Mode.
Metric/US config
GMETER ExitSetup
This screen explains that you should press the
G-METER button if you want to to exit the Metric Setup
Mode.
STEP 2: Select English or Metric
• Press the START button
to go to Item 1: “Mode”
• Then press the UP and DOWN buttons
to choose your preferred Mode.
There are three options:
Mode: ENGLISH
This choice has speed in MPH,
measurements in feet and inches,
and weight in pounds.
Mode: MET+400M
This choice has speed in KPH,
measurements in cm and meters,
and weight in Kg.
This choice also replaces the conventional
1/4 mile timed run with a 400 meter timed run.
Mode: MET+1/4m
This choice has speed in KPH,
measurements in cm and meters,
and weight in Kg, but uses a U.S.
“drag strip” 1/4 mile timed run
(but with the speed displayed in kph).
STEP 3: Select Power Units
• Press the START button
to go to Item 2: “Power Units”
• Then press the UP and DOWN buttons
to choose your preferred Units.
There are three options:
Power Units : HP
Displays power as English Horsepower.
Power Units : PS
Displays power as Metric Horsepower.
Power Units : kW
Displays power as kilowatts.
STEP 4: Exit the Metric Setup
After you have chosen your preferred settings, press
the G-METER button for normal operation.
98

Differences in Metric
There are many detail differences
between the US and Metric modes. We’ll
review the differences here.
Speed is measured in kph.
•
Vehicle weight is measured in kg, and the
•
default weight is 1600 kg. You can adjust this in
the setup mode. (See pages 24-30 in the Owner’s
Manual).
The braking test is from 100kph to 0. To perform
•
a braking test, start a timed run as usual, then
accelerate to at least 105 kph (but no more than
130 kph), then immediately perform a braking
test. The results will be included as additional
items added to the standard acceleration run data.
Rollout distances for the timed runs are measured
•
in cm, and adjustable from 0 to 65cm using the
setup mode. (See page 29 of the Owner’s Manual
for a definition and detailed discussion of rollout).
Aerodynamic drag CDA is measured in square
•
meters. You’ll need to enter this value in the setup
mode in order to calculate horsepower for your
vehicle.
See the following section for details.
To determine the metric CDA of your car:
There are three ways to determine your car’s CDA:
• Find specifications for your car’s CDA
• Estimate your car’s CDA
• Calculate your car’s CDA using a coastdown test
Details on each method follow.
1 Manufacturer’s specifications or other research
Very rarely do manufacturers list the aerodynamic
qualities of their cars, unless they are exceptional. Try
searching the internet for the terms “drag coefficient”
or “frontal area” and the make of your car.
Note: If you find specifications for US cars they
list frontal area in square feet. Divide those figures by
10.76 to convert to square meters.
Estimate your vehicle’s CDA
2
Use these examples to estimate your car’s CDA.
Honda Insight .25 CD x 1.90 M
Corvette C5 .29 CD x 1.98 M
Porsche 911 .32 CD x 1.80 M
Audi S4 .31 CD x 2.04 M2= .63 CDA
Honda Civic .34 CD x 1.95 M
Minivan or SUV .40 CD x 2.80 M
2
2
2
2
2
= .48 CDA
= .57 CDA
= .58 CDA
= .66 CDA
= 1.12 CDA
Pickup or van .45 CD x 3.25 M2= 1.46 CDA
Modern passenger car CDs are usually .30 to .35.
Van, SUV and truck CDs are usually .35 to .45.
Calculate your vehicle’s CDA
3
You can determine the correct CDA number by using a
“coastdown” test.
• On a flat road, on a day with no wind, accelerate
to slightly above 100 kph.
• Put your car in neutral (whether your car has an
automatic or manual transmission, it is important
to put the car in neutral).
• Measure the time it takes your car to decelerate
exactly 100 kph to exactly 80 kph.
from
• Perform this test at least three times in each
direction, to make sure your results are relatively
consistent.
• Average your times, then use the table to the right
to determine the CDA factor.
• Multiply your car’s weight times the CDA factor
from the table to determine your car’s CDA.
EXAMPLE: Find the CDA of a 1800 kg car that takes
20.5 seconds on average to coast from 100 to 80 mph.
Look at the table. For 20.5 seconds, the factor is .000382.
Multiply that times 1800 kg to get the car’s CDA.
1800 x .000382 = .69
.69 is the car’s approximate CDA.
The average time
it takes your car
to coast from
100 kph to 80 kph
(in seconds)
13.0 .000798
13.5 .000756
14.0 .000717
14.5 .000681
15.0 .000647
15.5 .000615
16.0 .000585
16.5 .000557
17.0 .000531
17.5 .000506
18.0 .000482
18.5 .000460
19.0 .000439
19.5 .000419
20.0 .000400
20.5 .000382
21.0 .000365
21.5 .000348
22.0 .000333
22.5 .000318
23.0 .000303
Multiply your
car’s weight by
this number to
calculate your
CDA.
1110

123VFD-01 Insert VFD Manual
Copyright 2004
 Loading...