

Page 1

Dellt Metered Rack Power Distribution Unit
(rPDU)
User's Guide
w w w . d e l l . c o m | s u p p o r t . d e l l . c o m
DELLM0001, DELLM001A, DELLM0002, DELLM0003, DELLM0004
DELLM004A, DELLM0005, DELLM0006, DELLM0007
Page 2

Notes and Warnings
NOTE: A NOTE indicates important information that helps you make better use of your product.
CAUTION: A CAUTION indicates a potentially hazardous situation which, if not avoided, may result in minor or
moderate injury or in property damage incidents.
WARNING: A WARNING indicates a potentially hazardous situation which, if not avoided, could result in death or
injury.
DANGER: A DANGER indicates an imminently hazardous situation which, if not avoided, will result in death or serious
injury.
DANGER: Observe the following instruction to help prevent an imminently hazardous situation which, if not avoided,
will result in death or serious injury:
S This rPDU contains LETHAL VOLTAGES. All repairs and service should be performed by
AUTHORIZED SERVICE PERSONNEL ONLY. There are NO USER SERVICEABLE PARTS inside
the rPDU.
Information in this document is subject to change without notice.
E 2010 Dell Inc. All rights reserved.
Reproduction in any manner whatsoever without the written permission of Dell Inc. is strictly forbidden.
Trademarks used in this text: Dell and the DELL logo are trademarks of Dell Inc.; National Electrical Code and NEC are registered trademarks of
National Fire Protection Association, Inc.; Internet Explorer and HyperTerminal are registered trademarks of Microsoft; Firefox is a registered
trademark of Mozilla.
Other trademarks and trade names may be used in this document to refer to either the entities claiming the marks and names or their products.
Dell Inc. disclaims any proprietary interest in trademarks and trade names other than its own.
December 2010 • 164201960 2
Page 3

Table of Contents
1 Introduction
Physical Description 9. . . . . . . . . . . . . . . . . . . . . . . . . . . . . . . . . . . . . . . . . . . . .
Installation Configurations 9. . . . . . . . . . . . . . . . . . . . . . . . . . . . . . . . . . . . . .
Strain Relief Brackets 10. . . . . . . . . . . . . . . . . . . . . . . . . . . . . . . . . . . . . . . . . .
Ground Bonding Point 10. . . . . . . . . . . . . . . . . . . . . . . . . . . . . . . . . . . . . . . . . .
Delta and Wye Configurations 10. . . . . . . . . . . . . . . . . . . . . . . . . . . . . . . . . . .
Attached Input Connections 11. . . . . . . . . . . . . . . . . . . . . . . . . . . . . . . . . . . . .
Circuit Breakers 11. . . . . . . . . . . . . . . . . . . . . . . . . . . . . . . . . . . . . . . . . . . . . .
LCD Panel and Pushbutton Controls 12. . . . . . . . . . . . . . . . . . . . . . . . . . . . . . .
Communication and Monitoring Ports 12. . . . . . . . . . . . . . . . . . . . . . . . . . . . .
Finding Information 13. . . . . . . . . . . . . . . . . . . . . . . . . . . . . . . . . . . . . . . . . . . . . . .
2 Safety Warnings
3 Installation
Unpacking the rPDU 15. . . . . . . . . . . . . . . . . . . . . . . . . . . . . . . . . . . . . . . . . . . . . .
Inspecting the Equipment 16. . . . . . . . . . . . . . . . . . . . . . . . . . . . . . . . . . . . . . . . . .
Checking the Accessory Bag 16. . . . . . . . . . . . . . . . . . . . . . . . . . . . . . . . . . . . . . .
Preparing for Installation 17. . . . . . . . . . . . . . . . . . . . . . . . . . . . . . . . . . . . . . . . . .
Installing Hardware for Options 17. . . . . . . . . . . . . . . . . . . . . . . . . . . . . . . . . . . . .
Installing Strain Relief Brackets 17. . . . . . . . . . . . . . . . . . . . . . . . . . . . . . . . . .
Installing Deep Mounting Pegs 18. . . . . . . . . . . . . . . . . . . . . . . . . . . . . . . . . . .
Installing the rPDU in the Rack Enclosure 19. . . . . . . . . . . . . . . . . . . . . . . . . . . . .
Attaching the Ground Wire 21. . . . . . . . . . . . . . . . . . . . . . . . . . . . . . . . . . . . . . . . .
Connecting the Protected Equipment 22. . . . . . . . . . . . . . . . . . . . . . . . . . . . . . . . .
Starting the rPDU 22. . . . . . . . . . . . . . . . . . . . . . . . . . . . . . . . . . . . . . . . . . . . . . . .
Shutting Down the rPDU 22. . . . . . . . . . . . . . . . . . . . . . . . . . . . . . . . . . . . . . . . . . .
Front Panels 23. . . . . . . . . . . . . . . . . . . . . . . . . . . . . . . . . . . . . . . . . . . . . . . . . . . .
4 External Signaling Ports
Communication Ports 27. . . . . . . . . . . . . . . . . . . . . . . . . . . . . . . . . . . . . . . . . . . . .
Serial Port 28. . . . . . . . . . . . . . . . . . . . . . . . . . . . . . . . . . . . . . . . . . . . . . . . . . .
Ethernet Port 29. . . . . . . . . . . . . . . . . . . . . . . . . . . . . . . . . . . . . . . . . . . . . . . . .
Table of Contents
|
3
Page 4

Monitoring Ports 29. . . . . . . . . . . . . . . . . . . . . . . . . . . . . . . . . . . . . . . . . . . . . . . . .
Temperature and Humidity Sensor (Optional) 29. . . . . . . . . . . . . . . . . . . . . . . .
Dry Contact Sensor (Optional) 30. . . . . . . . . . . . . . . . . . . . . . . . . . . . . . . . . . .
5 LCD Operation
LCD Panel and Control Buttons 31. . . . . . . . . . . . . . . . . . . . . . . . . . . . . . . . . . . . . .
Locking a Screen 33. . . . . . . . . . . . . . . . . . . . . . . . . . . . . . . . . . . . . . . . . . . . .
Automatic Alarm Notification 33. . . . . . . . . . . . . . . . . . . . . . . . . . . . . . . . . . . .
Input Status Screen 33. . . . . . . . . . . . . . . . . . . . . . . . . . . . . . . . . . . . . . . . . . . . . . .
Main Menu Selections 34. . . . . . . . . . . . . . . . . . . . . . . . . . . . . . . . . . . . . . . . . . . .
Selecting a Menu 35. . . . . . . . . . . . . . . . . . . . . . . . . . . . . . . . . . . . . . . . . . . . .
Performance Menu 35. . . . . . . . . . . . . . . . . . . . . . . . . . . . . . . . . . . . . . . . . . . . . . .
Retrieving Performance Information 36. . . . . . . . . . . . . . . . . . . . . . . . . . . . . . .
Measured and Calculated Meters 38. . . . . . . . . . . . . . . . . . . . . . . . . . . . . . . .
Alarms Menu 39. . . . . . . . . . . . . . . . . . . . . . . . . . . . . . . . . . . . . . . . . . . . . . . . . . .
Retrieving Active Alarms 39. . . . . . . . . . . . . . . . . . . . . . . . . . . . . . . . . . . . . . .
Event Log 42. . . . . . . . . . . . . . . . . . . . . . . . . . . . . . . . . . . . . . . . . . . . . . . . . . . . . . .
Retrieving the Event Log 42. . . . . . . . . . . . . . . . . . . . . . . . . . . . . . . . . . . . . . . .
System Info 43. . . . . . . . . . . . . . . . . . . . . . . . . . . . . . . . . . . . . . . . . . . . . . . . . . . . .
Retrieving System Identification Information 43. . . . . . . . . . . . . . . . . . . . . . . .
Settings 43. . . . . . . . . . . . . . . . . . . . . . . . . . . . . . . . . . . . . . . . . . . . . . . . . . . . . . . .
Retrieving or Changing Configuration Settings in the Settings Menu 43. . . . . .
6 Serial Interface Operation
Supported Commands 50. . . . . . . . . . . . . . . . . . . . . . . . . . . . . . . . . . . . . . . . . . . . .
Nomenclature 51. . . . . . . . . . . . . . . . . . . . . . . . . . . . . . . . . . . . . . . . . . . . . . . . . . .
Connecting to the Internal rPDU NMC 51. . . . . . . . . . . . . . . . . . . . . . . . . . . . . . . .
Configuring the Network with a DHCP Server 54. . . . . . . . . . . . . . . . . . . . . . . .
Configuring the Network without a DHCP Server 55. . . . . . . . . . . . . . . . . . . . .
alarm command 56. . . . . . . . . . . . . . . . . . . . . . . . . . . . . . . . . . . . . . . . . . . . . . . . .
current command 57. . . . . . . . . . . . . . . . . . . . . . . . . . . . . . . . . . . . . . . . . . . . . . . .
exit command 58. . . . . . . . . . . . . . . . . . . . . . . . . . . . . . . . . . . . . . . . . . . . . . . . . . .
factory_defaults command 59. . . . . . . . . . . . . . . . . . . . . . . . . . . . . . . . . . . . . . . . .
help command 59. . . . . . . . . . . . . . . . . . . . . . . . . . . . . . . . . . . . . . . . . . . . . . . . . .
network command 60. . . . . . . . . . . . . . . . . . . . . . . . . . . . . . . . . . . . . . . . . . . . . . .
power command 61. . . . . . . . . . . . . . . . . . . . . . . . . . . . . . . . . . . . . . . . . . . . . . . . .
|
4
Table of Contents
Page 5

reboot command 61. . . . . . . . . . . . . . . . . . . . . . . . . . . . . . . . . . . . . . . . . . . . . . . . .
sensors command 62. . . . . . . . . . . . . . . . . . . . . . . . . . . . . . . . . . . . . . . . . . . . . . . .
temperature command 63. . . . . . . . . . . . . . . . . . . . . . . . . . . . . . . . . . . . . . . . . . . .
ver command 63. . . . . . . . . . . . . . . . . . . . . . . . . . . . . . . . . . . . . . . . . . . . . . . . . . .
voltage command 64. . . . . . . . . . . . . . . . . . . . . . . . . . . . . . . . . . . . . . . . . . . . . . . .
7 Web Interface Operation
Navigating the Web Interface 66. . . . . . . . . . . . . . . . . . . . . . . . . . . . . . . . . . . . . . .
Accessing the Web Interface 68. . . . . . . . . . . . . . . . . . . . . . . . . . . . . . . . . . . . . . .
Configuring DPI Administration Settings 69. . . . . . . . . . . . . . . . . . . . . . . . . . . . . .
Configuring Administrator Access 69. . . . . . . . . . . . . . . . . . . . . . . . . . . . . . . .
Configuring User Access 69. . . . . . . . . . . . . . . . . . . . . . . . . . . . . . . . . . . . . . .
Setting the Date and Time 70. . . . . . . . . . . . . . . . . . . . . . . . . . . . . . . . . . . . . . .
Configuring Email Notification 70. . . . . . . . . . . . . . . . . . . . . . . . . . . . . . . . . . .
Identifying Email Notification Recipients 71. . . . . . . . . . . . . . . . . . . . . . . . . . .
Creating Links to External Web Sites 72. . . . . . . . . . . . . . . . . . . . . . . . . . . . . .
Configuring DPI Attributes 73. . . . . . . . . . . . . . . . . . . . . . . . . . . . . . . . . . . . . . . . .
Setting Basic DPI Attributes 73. . . . . . . . . . . . . . . . . . . . . . . . . . . . . . . . . . . . .
Returning Configuration Settings to Default Values 73. . . . . . . . . . . . . . . . . . .
Uploading a Configuration File 74. . . . . . . . . . . . . . . . . . . . . . . . . . . . . . . . . . .
Downloading a Configuration File 74. . . . . . . . . . . . . . . . . . . . . . . . . . . . . . . . .
Configuring Default CSV File Opening Settings 75. . . . . . . . . . . . . . . . . . . . . . .
Configuring Network Access and Control 75. . . . . . . . . . . . . . . . . . . . . . . . . . . . .
Setting General TCP/IPv4 Configuration Options 75. . . . . . . . . . . . . . . . . . . . .
Setting General TCP/IPv6 Configuration Options 76. . . . . . . . . . . . . . . . . . . . .
Enabling TCP/IP Network Controls 77. . . . . . . . . . . . . . . . . . . . . . . . . . . . . . . .
Adding and Rejecting IP Addresses for SNMP/HTTP Access Control 78. . . . .
Rejecting IP Addresses for SNMP/HTTP Access Control 78. . . . . . . . . . . . . . .
Configuring SNMP Protocol Settings 79. . . . . . . . . . . . . . . . . . . . . . . . . . . . . .
Configuring SNMP Trap Receivers 80. . . . . . . . . . . . . . . . . . . . . . . . . . . . . . . .
Monitoring and Managing the rPDU 81. . . . . . . . . . . . . . . . . . . . . . . . . . . . . . . . . .
Viewing Present rPDU Status 81. . . . . . . . . . . . . . . . . . . . . . . . . . . . . . . . . . . .
Viewing rPDU and Web/SNMP Card Identification 82. . . . . . . . . . . . . . . . . . . .
Viewing rPDU System Information 83. . . . . . . . . . . . . . . . . . . . . . . . . . . . . . . .
Monitoring Input Statistics 83. . . . . . . . . . . . . . . . . . . . . . . . . . . . . . . . . . . . . .
Managing Environment Sensors 86. . . . . . . . . . . . . . . . . . . . . . . . . . . . . . . . . .
Viewing Present Alarms and Events 88. . . . . . . . . . . . . . . . . . . . . . . . . . . . . . .
Viewing Event and Data logs 88. . . . . . . . . . . . . . . . . . . . . . . . . . . . . . . . . . . .
Table of Contents
|
5
Page 6

Clearing Logs 89. . . . . . . . . . . . . . . . . . . . . . . . . . . . . . . . . . . . . . . . . . . . . . . .
Saving Logs to an External File 89. . . . . . . . . . . . . . . . . . . . . . . . . . . . . . . . . . .
Restarting the Internal rPDU NMC 90. . . . . . . . . . . . . . . . . . . . . . . . . . . . . . . .
|
6
Table of Contents
Page 7
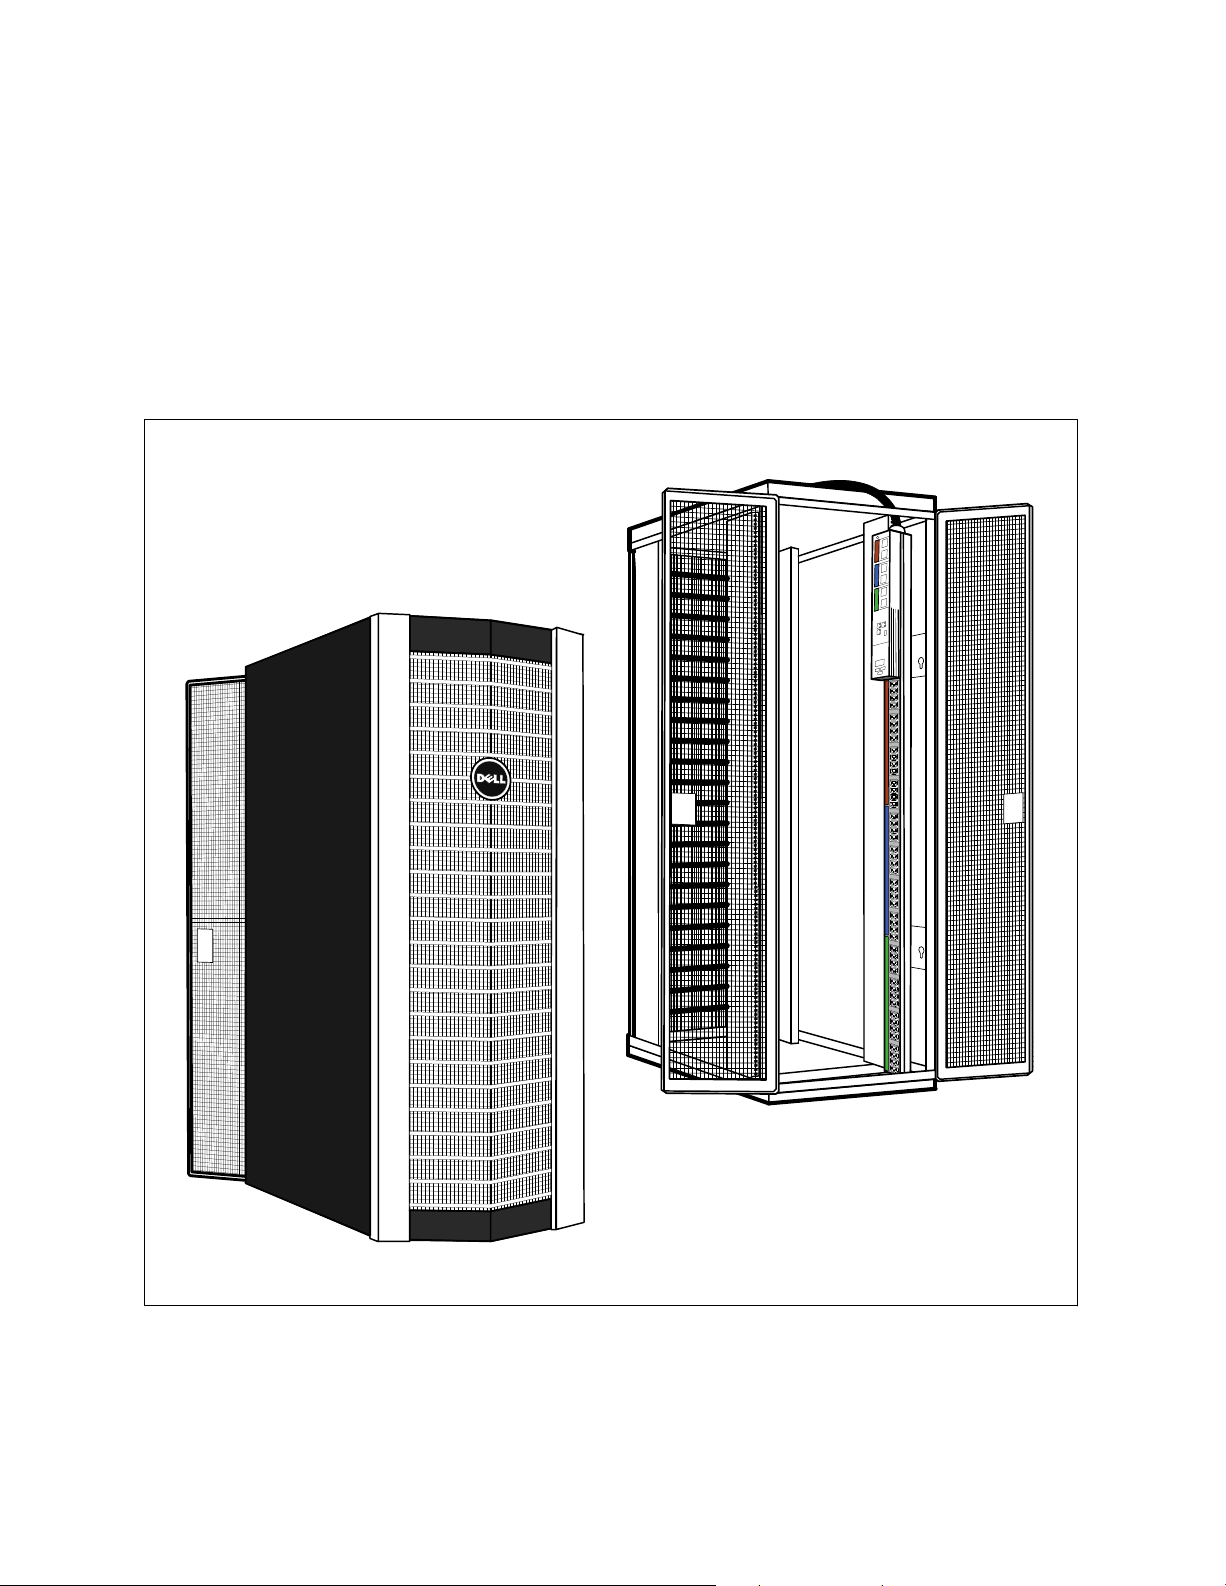
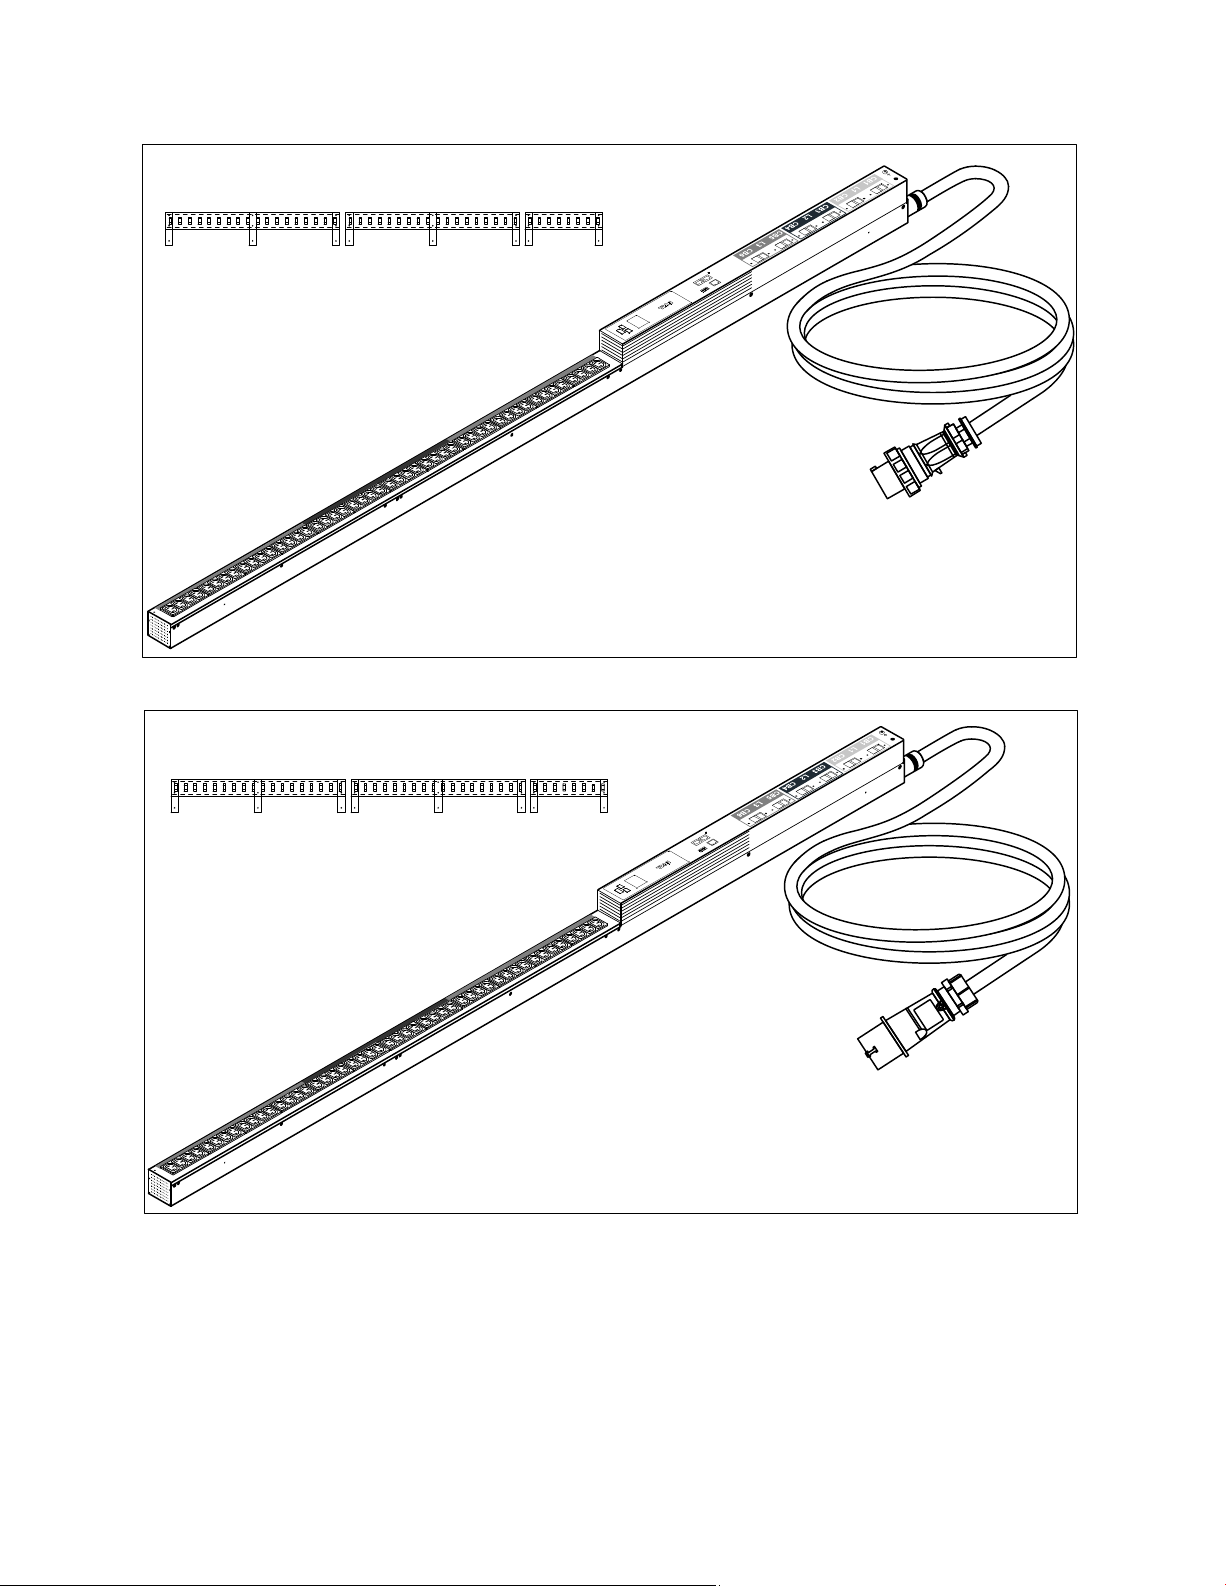
Introduction
The Dellt Metered Rack Power Distribution Unit (rPDU) models are installed at the rear in a rack enclosure.
The rack enclosure is designed to hold and protect server, network, and data storage equipment. The rPDUs
distribute power in the rack.
The rPDUs are mounted vertically in a recessed channel, providing more room for cabling within the rack
enclosure. The recessed location distances the rPDU from the other equipment and does not interfere with the
airflow in the rack enclosure.
1
Figure 1. Rack Enclosure with rPDU Installed
Introduction
|
7
Page 8

Providing outstanding performance and reliability, the rPDU benefits include the following:
S The rPDU can be installed as either 42U or 48U applications (depending on the model).
S The rPDU can be mounted using either factory-installed standard mounting pegs on the back of the rPDU,
or turned 90° by using user-installed deep mounting pegs on the side of the rPDU.
S Color-coded silk screening for outlet receptacles and circuit breakers clearly associate circuit breakers with
the receptacles they protect.
S The rPDU models provide several configurations of IEC 320 C-13 and IEC 320 C-19 outlet receptacles on
the front panel.
S The attached power cords for all models are 3m (10 ft) with IEC60309 input connector plugs.
S All receptacles, circuit breakers, ports, ground bonding point, and user interfaces are located on the front
panel of the rPDU for easy access.
S The rPDUs models are configured with either Delta or Wye topology.
S The rPDU provides an environmental monitoring sensor port, a dry contact sensor port, a 10/100 Base-T
Ethernet port, and a serial communication port.
S The LCD panel provides pushbutton controls for accessing performance monitoring data, event
notifications, and user-configured provisioning options.
S The rPDU provides an internal Dellt Network Management Card (NMC) for network communications.
The following options are available for the rPDU:
S Side- and front-mounted strain relief brackets for secure power cord retention (bracket type depends on
model)
S Dry contact sensor
S Temperature sensor
S Temperature and humidity sensor
The rPDU provides the following meters and measurements for reporting operational status:
S Input Voltage (V)
S Input Frequency in Hertz (Hz)
S Input Current in Amperes (A)
S Input Watts (W)
S Input Volt-amperes (VA)
S Instantaneous Headroom Watts
S Peak Headroom Watts (with time stamp)
S Peak Consumption Watts (with time stamp)
S Cumulative Kilowatt per Hour (with time stamp)
S Temperature (if an optional temperature sensor is installed)
S Humidity (if an optional humidity sensor is installed)
S Real-Time Clock
|
8
Introduction
Page 9
Physical Description
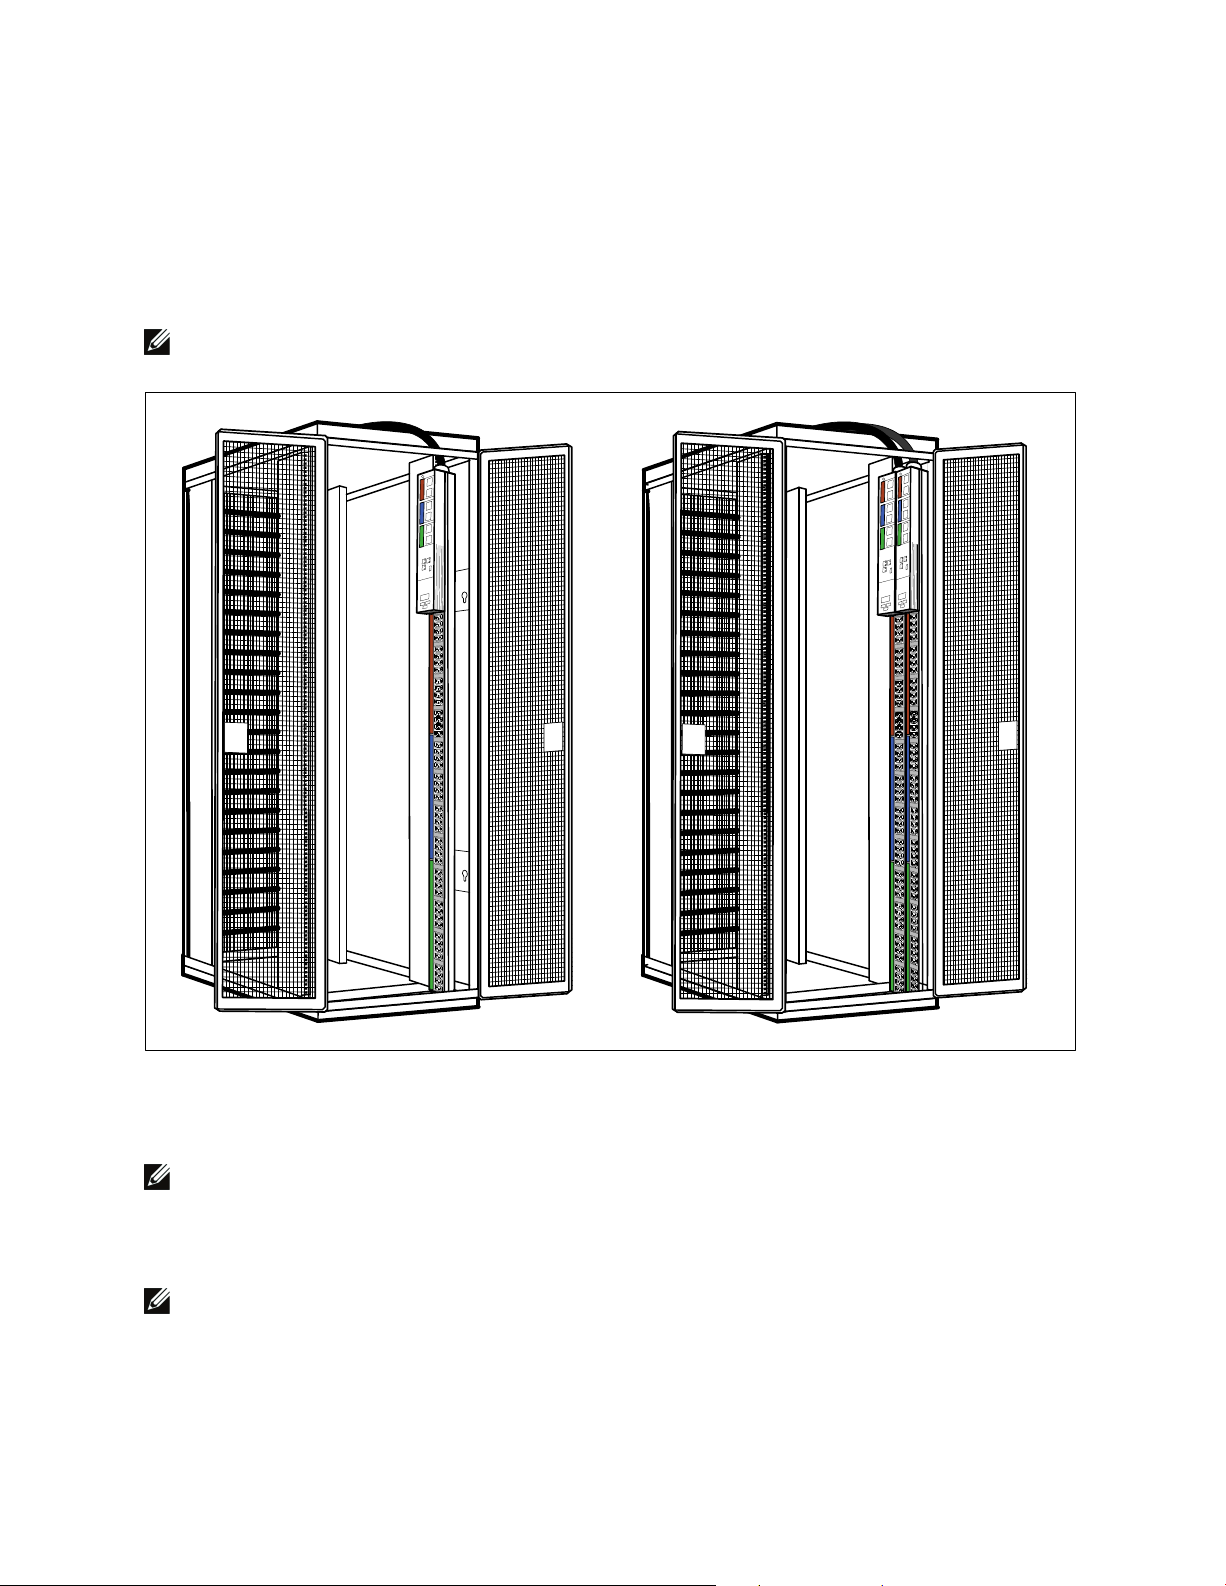
Installation Configurations
The rPDUs can be mounted vertically in several installation configurations and orientations to accommodate
different site needs. Either one or two rPDUs can be installed in each rPDU tray in the back of a rack enclosure,
providing a total of up to four rPDUs (see Figure 2).
NOTE:
When installing two rPDUs in a side-by-side configuration, you are not restricted to installing the same model.
See Figure 2.
Figure 2. One or Two rPDUs Installed in the rPDU Tray
The standard mounting orientation for the rPDU is 180°. This is a snap-in, tooless installation. Two
factory-installed mounting pegs are inserted in mounting keyholes on the wall of the rPDU tray.
NOTE:
The 180° orientation means that the mounting surface (the back of the rPDU) is 180° in relation to the front
receptacles.
The rPDU can also be mounted in a 90° orientation. For this configuration, two deep mounting pegs (provided)
are user-installed before mounting the rPDU in the rPDU tray (see Figure 3).
NOTE:
The 90° orientation means that the mounting surface (the side of the rPDU) is 90° in relation to the front
receptacles.
Introduction
|
9
Page 10
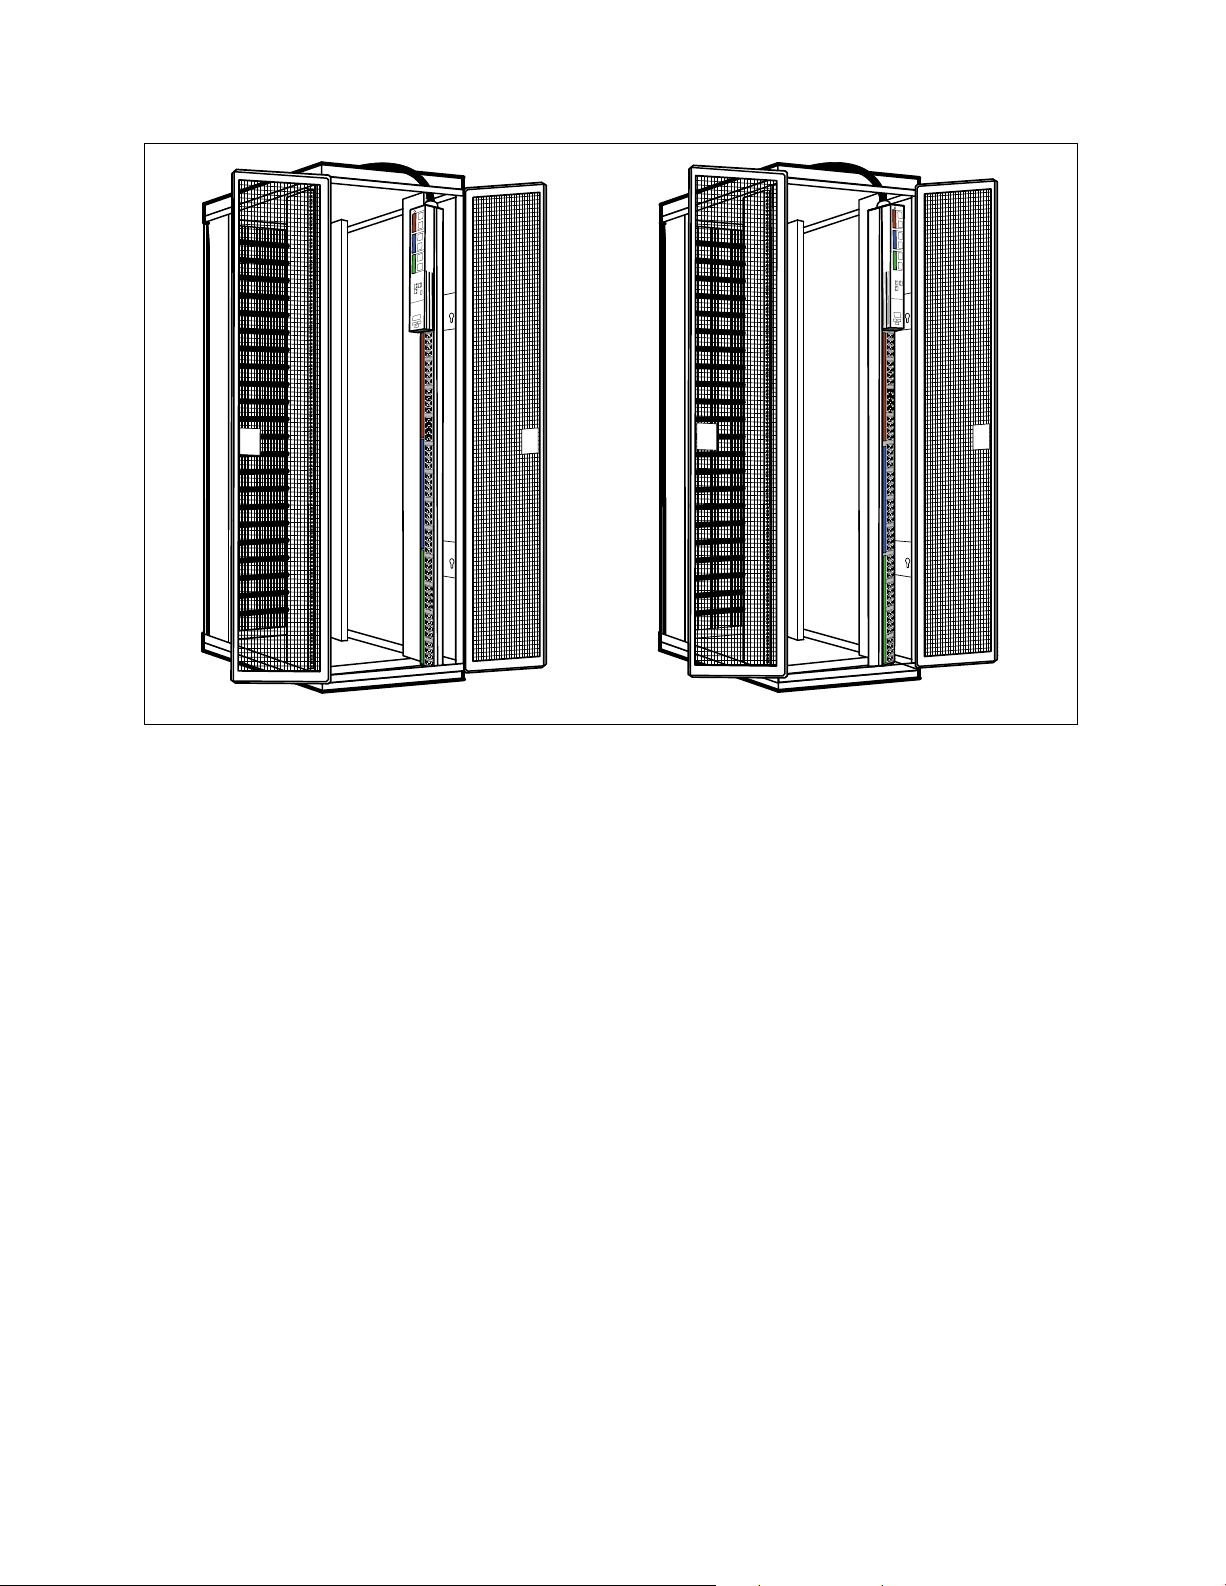
rPDU installed using deep mounting pegs on the side (90°)rPDU installed using standard mounting pegs on the back (180°)
Figure 3. Standard 180° and 90° rPDU Installation
Strain Relief Brackets
You can install optional strain relief brackets on any rPDU model. Models with dense receptacle configurations
on the front panel have mounting holes for side-mounted relief brackets only. Models with spacing between
outlet groupings have mounting holes for both side- and front-mounted relief brackets.
The strain relief bracket kits include three brackets and mounting hardware. The side-mounted brackets can be
installed on either side of the rPDU. The front-mounted strain relief brackets are adjustable.
Ground Bonding Point
The external ground bonding point located on the rPDU front panel may be used to bond other conductive
metal components in the rack enclosure to a ground reference point for signaling or other functional purposes.
This bonding point can also be used to bond the rPDU to a known earthed reference terminal in the building.
Per international regulatory requirements, the primary Safety Earth Bond connection is contained in the rPDU
as an integral part of the branch circuit cabling and plug.
Delta and Wye Configurations
The rPDUs are configured in either Delta or Wye topology.
S The Delta configuration uses a four-wire input connector plug with three phase wires, a protective earth
(ground) wire, and no neutral wire. This is commonly expressed as 3W + PE (Delta).
S The Wye configuration uses a five-wire input connector plug with three phase wires, a protective earth
(ground) wire, and a neutral wire. This is commonly expressed as 3W + N + PE (Wye).
Table 1 on page 11 lists the Delta or Wye configuration for each model.
|
10
Introduction
Page 11

Attached Input Connections
All models use an IEC60309 input connector plug on a 3m (10 ft) cable attached to the rPDU. The type of input
connector plug varies by model to accommodate different amperage ratings and Delta or Wye configurations.
The input connector plugs have Ingress Protection (IP) ratings that specify the degree of environmental
protection for electrical equipment. All models use IEC60309 input connector plugs that are either splash
resistant (S) or waterproof (W).
NOTE:
Splash resistant plugs are IP-rated at IP 44, which means the plug is protected against solid objects less than
1.0 mm in diameter.
NOTE: Waterproof plugs are IP-rated at IP 67, which means the plugs are watertight, splashproof, and dust tight.
Standard IEC60309 reference codes provide a useful summary of the input connector plug specifications. The
code includes the number of pins, the maximum amperage rating, the type of connection, the alignment tab
clock position, and the protective classification.
Table 1 lists the standard IEC60309 reference codes for each model.
Table 1. Metered rPDU IEC60309 Codes
Model
DELLM0001 460P9W 4 60 P 9 W
DELLM001A 460P9W 4 60 P 9 W
DELLM0002 532P6S 5 32 P 6 S
DELLM0003 516P6S 5 16 P 6 S
DELLM0004 460P9W 4 60 P 9 W
DELLM004A 460P9W 4 60 P 9 W
DELLM0005 532P6S 5 32 P 6 S
DELLM0006 460P9W 4 60 P 9 W
DELLM0007 532P6S 5 32 P 6 S
IEC
Reference
Code
Delta 4-Pin Plug (4)
or
Wye 5-Pin Plug (5)
Maximum
Amperage (A)
Rating
Plug (P)
Receptacle/Socket
(R)
or Connector (C)
Clock
Position PE
(6 or 9)
Waterproof (W)
or
Splash Resistant (S)
Circuit Breakers
NOTE: The DELLM0003 model does not have circuit breakers.
There are six 20A circuit breakers on the rPDU (two circuit breakers per phase protecting the group of outlet
receptacles for that phase). Circuit breakers on the rPDU trip automatically when a power overload is detected.
Standard rPDU circuit breakers have Type C trip characteristics.
The rPDU monitoring firmware provides warnings that there is potential for overload and alarms if an overload
occurs. These thresholds are user-configurable. To reset the breakers after an overload, flip the breaker switch to
the ON position.
Circuit breakers and outlet receptacles are numbered and color-coded on the front panel to show the association
between breakers and the receptacles they protect. The phases (L1, L2, and L3) and protecting circuit breakers
(CB1 through CB6) are labeled on both circuit breaker groups and outlet receptacle groups (see Figure 4).
Introduction
|
11
Page 12
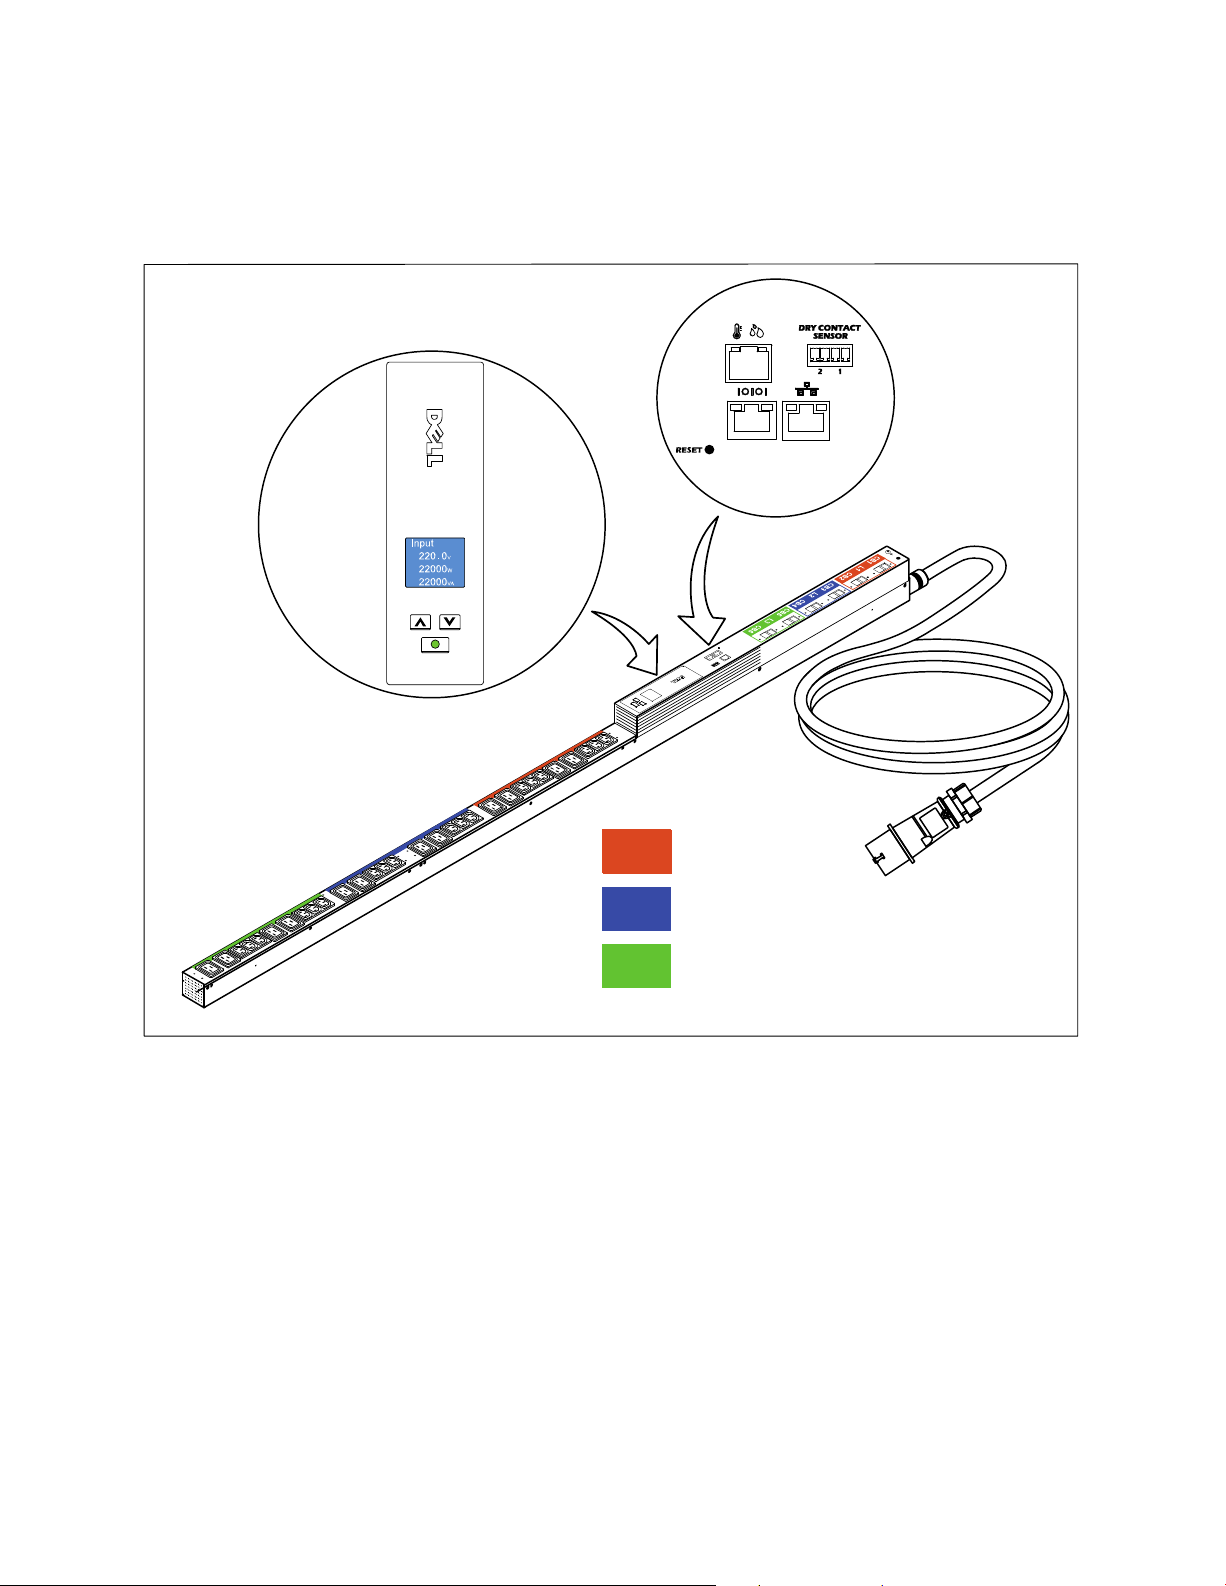
LCD Panel and Pushbutton Controls
The rPDU interface provides access to real-time performance monitoring and event notification data through
the LCD panel and pushbutton controls. This interface is also used to set user-configurable values, such as alarm
or warning thresholds. See Figure 4.
L1
L2
L3
Figure 4. LCD Front Panel
Phase 1: CB1 and CB2
Phase 2: CB3 and CB4
Phase 3: CB5 and CB6
Communication and Monitoring Ports
Two communication ports are provided. The rPDU has a serial port for an RJ-45 to DB-9 cable (provided) for
serial communication. The rPDU also has a 10/100 Base-T Ethernet port for network communication.
The network communication channel can be used to perform firmware upgrades (flash upgrades) over the
network. Upgrades can be performed for rPDUs installed in the rack enclosure while they are powered.
Two monitoring ports are provided. The following optional monitoring sensors can be installed:
S Dry contact sensor
S Temperature-only or combined temperature and humidity sensor
12
|
Introduction
Page 13

Finding Information
CAUTION: The Safety, Environmental, and Regulatory Information document provides important safety and regulatory
information.
What are You Looking For?
S Dell Metered Rack Power Distribution Unit (rPDU)
User's Guide
S Other rPDU documentation, such as Product Overview
documents
S Software updates Software updates can be found at:
Find It Here
Documentation can be found at:
support.dell.com/support/edocs/ACC/PDU/
support.dell.com
S How to install the rPDU
S rPDU specifications
S How to configure rPDU settings
S How to operate the rPDU
S Safety instructions
S Regulatory information
S Recycling information
S Warranty information
S Terms and Conditions (U.S. only)
S End User License Agreement
S Support information Dell Support Website — support.dell.com
Dell Metered rPDU User's Guide
The user's guide is available at:
support.dell.com/support/edocs/ACC/PDU/
Safety, Environmental, and Regulatory Information
Dell Warranty and Support Information
NOTE: Select your region or business segment to view the
appropriate support site.
Introduction
|
13
Page 14

Safety Warnings
IMPORTANT SAFETY INSTRUCTIONS
SAVE THESE INSTRUCTIONS
This manual contains important instructions that you should follow during installation and operation of the Dell Metered Rack
Power Distribution Unit (rPDU). Please read all instructions before operating the equipment and save this manual for future
reference.
DANGER:
This rPDU contains LETHAL VOLTAGES. All repairs and service should be performed by AUTHORIZED SERVICE PERSONNEL
ONLY.
CAUTION:
S To reduce the risk of fire or electric shock, install this rPDU in a temperature and humidity controlled, indoor
environment, free of conductive contaminants. Ambient temperature must not exceed 50°C (122°F). Do not operate
near water or excessive humidity (95% maximum).
S To comply with international standards and wiring regulations, the total equipment connected to the output of this
rPDU must not have an earth leakage current greater than 3.5 milliamperes.
S For PLUGGABLE EQUIPMENT, a readily accessible disconnect device shall be incorporated in the building installation
wiring.
S For PLUGGABLE EQUIPMENT, the power outlet shall be installed near the equipment and shall be readily accessible.
2
14
|
Safety Warnings
Page 15
Installation
This section explains:
S Unpacking the Dell Metered Rack Power Distribution Unit (rPDU) equipment
S Equipment inspection
S Setup and installation
S Starting up and shutting down the rPDU
S Front panel diagrams
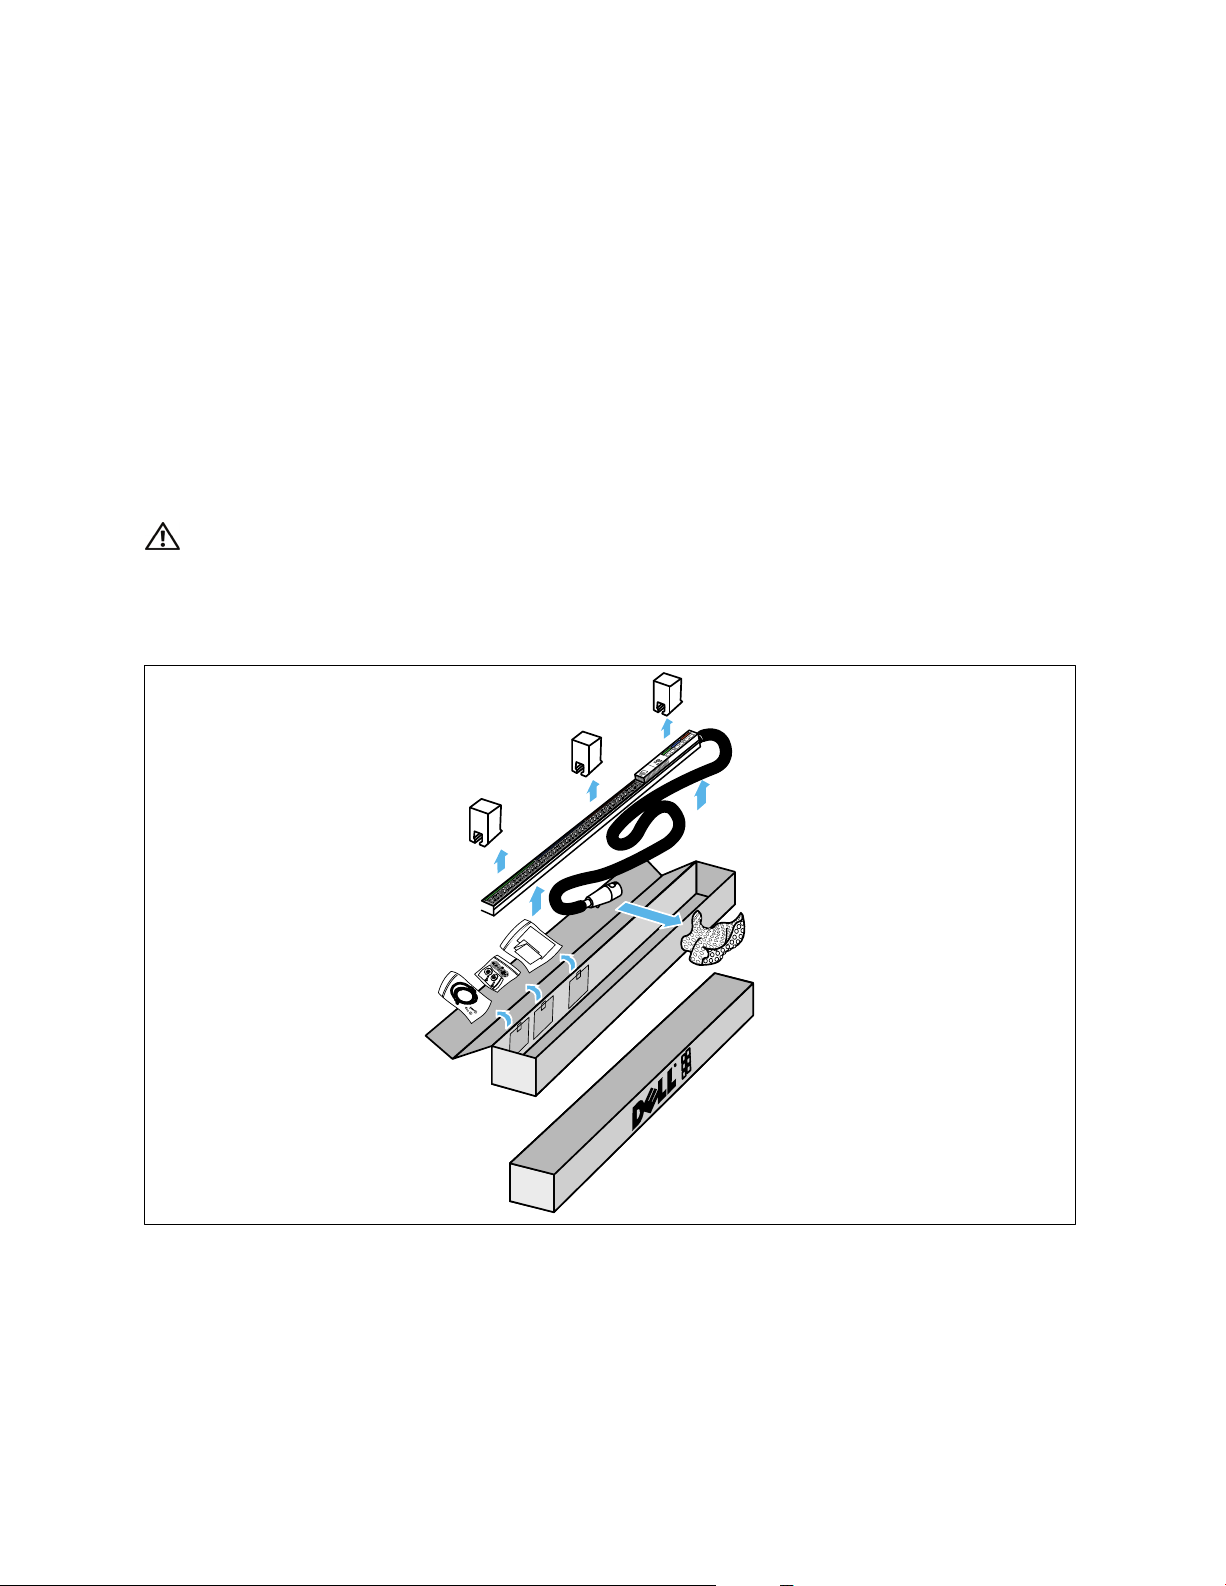
Unpacking the rPDU
CAUTION: Hazard of electric shock. Unpacking the cabinet in a low-temperature environment may cause condensation
to occur in and on the rPDU. Do not install the rPDU until the inside and outside are dry.
Use care when moving and opening the carton. Leave the components packaged until ready to install.
1 Remove the top from the carton(see Figure 5).
3
Figure 5. Unpacking the rPDU
2 Remove the rPDU, the accessory bag, and documentation from the carton:
Grasp the rPDU and the input connector plug and set them on a flat, stable surface.
Remove the Styrofoam shipping supports from the rPDU and the wrapper from the input connector plug.
Remove the documents and the accessory bag from the inside wall of the carton.
Installation
|
15
Page 16

3 Place the rPDU in a protected area that has adequate airflow and is free of humidity, flammable gas, and
corrosion.
4 Discard or recycle the packaging in a responsible manner, or store it for future use.
Inspecting the Equipment
If any equipment has been damaged during shipment, keep the shipping cartons and packing materials for the
carrier or place of purchase and file a claim for shipping damage. If you discover damage after acceptance, file a
claim for concealed damage.
To file a claim for shipping damage or concealed damage: 1) File with the carrier within 15 days of receipt of the
equipment; 2) Send a copy of the damage claim within 15 days to your service representative.
Checking the Accessory Bag
The rPDU accessory bag includes the following:
S (2) deep mounting pegs and (2) 8-32 5/8” mounting screws (for 90° installation)
S Grounding kit with:
- (1) silver 10-32
- (1) black, M5
- (1) ground wire
- (2) star washers
S Safety, Environmental, and Regulatory Information (SERI) document
S Quick Start Installation Sheet
S (1) RJ-45 Cable (RJ-45-to-DB9-female, 2.0m length, serial cable)
0.5” pan-head screw
12 pan-head screw
If you ordered the optional strain relief brackets (shipped separately), check that the following associated
hardware is included with the option.
For the side-mounted strain relief bracket:
S (3) strain relief brackets
S (8) M3 6 flat-head cross screws
For the front-mounted strain relief bracket:
S (3) strain relief brackets
S (4) 6-32 1/4” flat-head cross screws
|
16
Installation
Page 17

Preparing for Installation
Before installing the rPDUs in a rack enclosure, consider location and orientation. For most installations, the
selected location and orientation depends on the number of rPDUs that will be installed and the cable
management plan.
For example, suppose you plan to separate data and power cables on opposite sides of the rack enclosure. For this
configuration, install one or two rPDUs in the same tray. Route the data cables to the other rPDU tray (serving
as a cable channel) on the opposite side of the rack enclosure.
Another plan might be to balance the data and power cables on each side. For this configuration, install one
rPDU on each side of the rack enclosure. The remaining portion of each rPDU tray serves as a cable channel for
bundled and properly dressed data cables running beside the rPDU.
Other considerations include the orientation of the rPDU and the type of strain relief brackets mounted on the
rPDUs.
Installing Hardware for Options
Install the hardware that supports installation options before installing the rPDUs in the rack enclosure. This
includes the following:
S Strain relief brackets for cord management (optional kit)
S Deep mounting pegs for the 90° mounting option (supplied)
NOTE:
The factory-installed standard mounting pegs are secured to the chassis by two 8-32 3/7” mounting screws. The
user-installed deep mounting pegs are secured to the chassis by two 8-32 5/8” mounting screws.
Installing Strain Relief Brackets
To install the optional strain relief brackets:
1 Place the rPDU on a flat, stable surface.
2 Align the screw mounting holes on the rPDU with the screw mounting holes on the bracket (see Figure 6).
3 Secure the bracket with the supplied screws.
4 Are you installing deep mounting pegs for 90° installation?
If no, go to “Installing the rPDU in the Rack Enclosure” on page 19.
If yes, continue to the next section, “Installing Deep Mounting Pegs” on page 18.
Installation
|
17
Page 18
Side-Mounted Strain Relief Bracket
Front-Mounted Strain Relief Bracket
Figure 6. Strain Relief Bracket
Installing Deep Mounting Pegs
To install the deep mounting pegs (supplied) on the side of the rPDU for 90° mounting installations:
1 Remove the two deep mounting pegs and two mounting screws from the accessory bag.
2 Locate the top and bottom peg mounting holes on the side of the rPDU (see Figure 7).
3 Align the peg mounting holes on the rPDU with the mounting hole in the center of the deep mounting
pegs.
4 Secure the top and bottom deep mounting peg with the provided screws (see Figure 7).
NOTE:
Dell recommends removing the standard mounting pegs on the rear of the rPDU if you install the deep mounting
pegs (provided in the accessory kit shipped with the rPDU). Retain the standard mounting pegs so the rPDU can be
reoriented later if needed.
|
18
Installation
Page 19
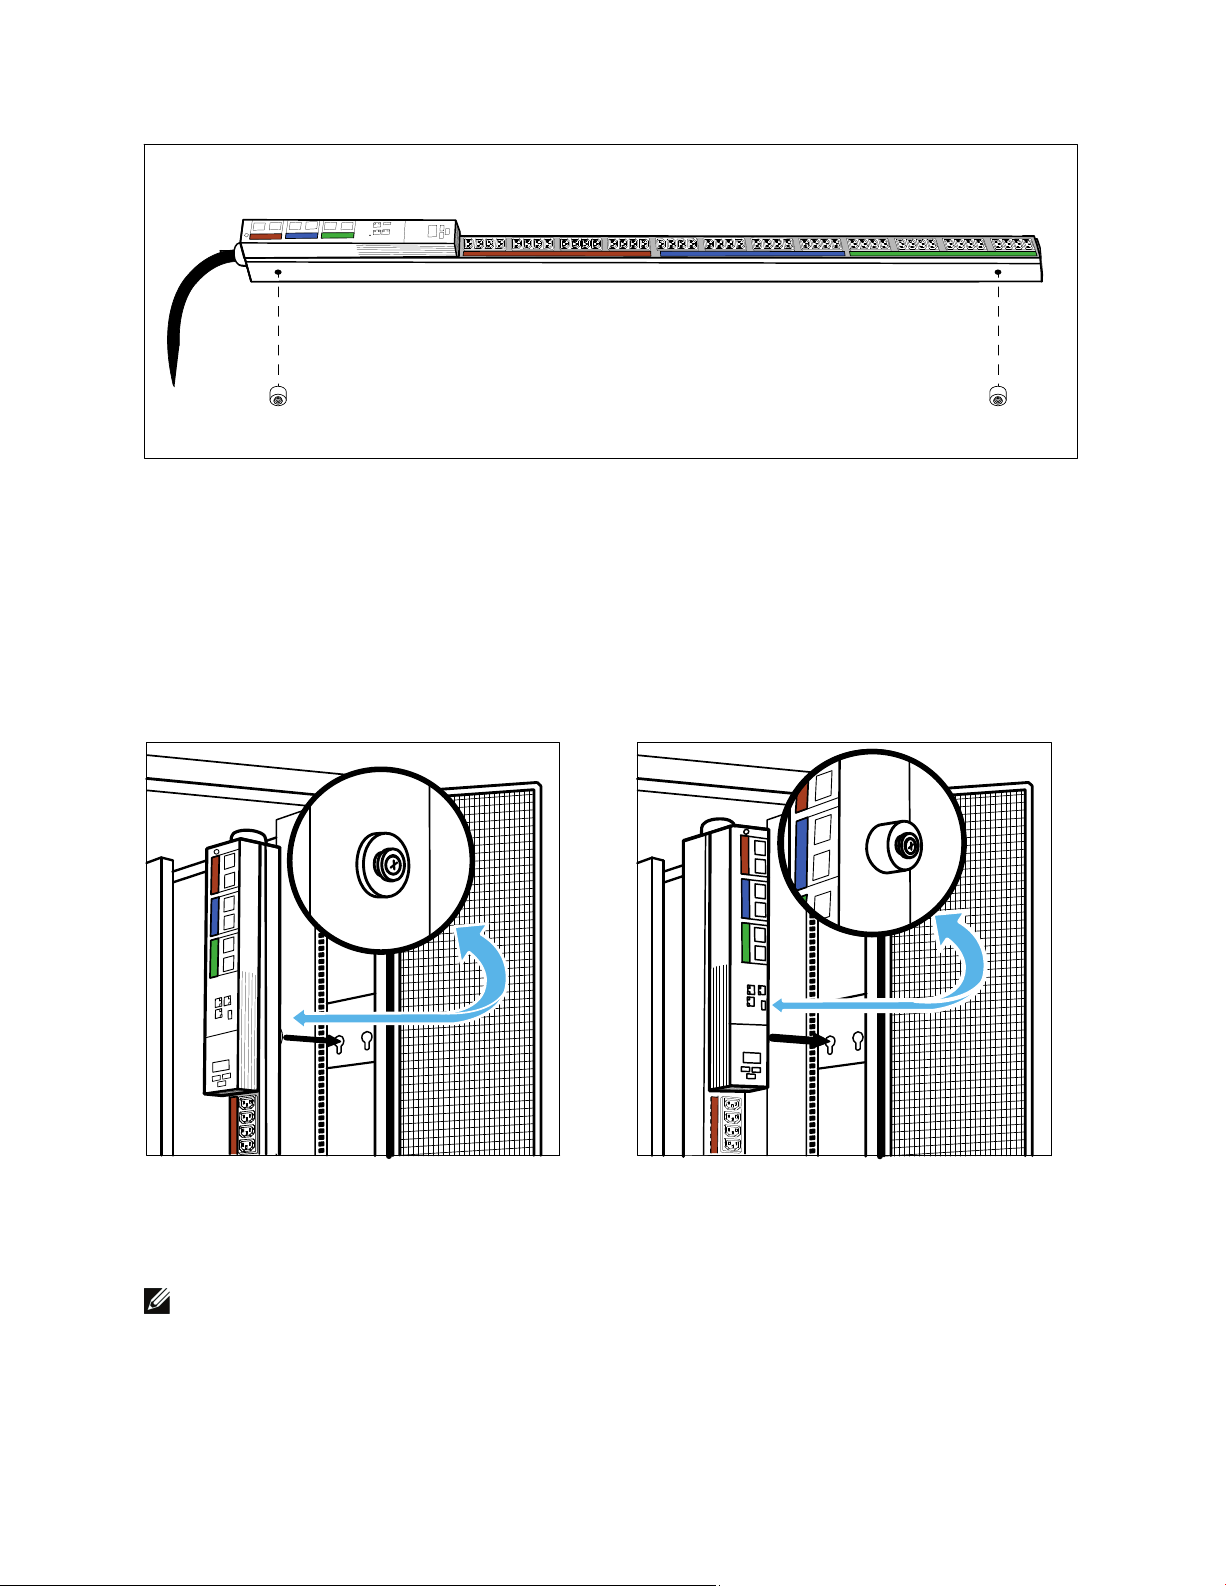
Figure 7. Installing the Deep Mounting Pegs
Installing the rPDU in the Rack Enclosure
To install the rPDU in a rack enclosure:
1 Move the rPDU into position at the rear of the rack enclosure.
2 Select the proper keyholes in the rPDU tray for mounting the rPDU.
3 Align the mounting pegs with the keyholes in wall of the rPDU tray (see Figure 8).
Figure 8. Aligning and Inserting the Standard or Deep Mounting Pegs (Top Mounting shown; Bottom Mounting not shown)
4 Fully insert both mounting pegs into the keyholes.
5 Push down to set the rPDU in place.
NOTE:
A second rPDU can be installed in the same tray. The procedure is the same. See Figure 9.
Installation
|
19
Page 20
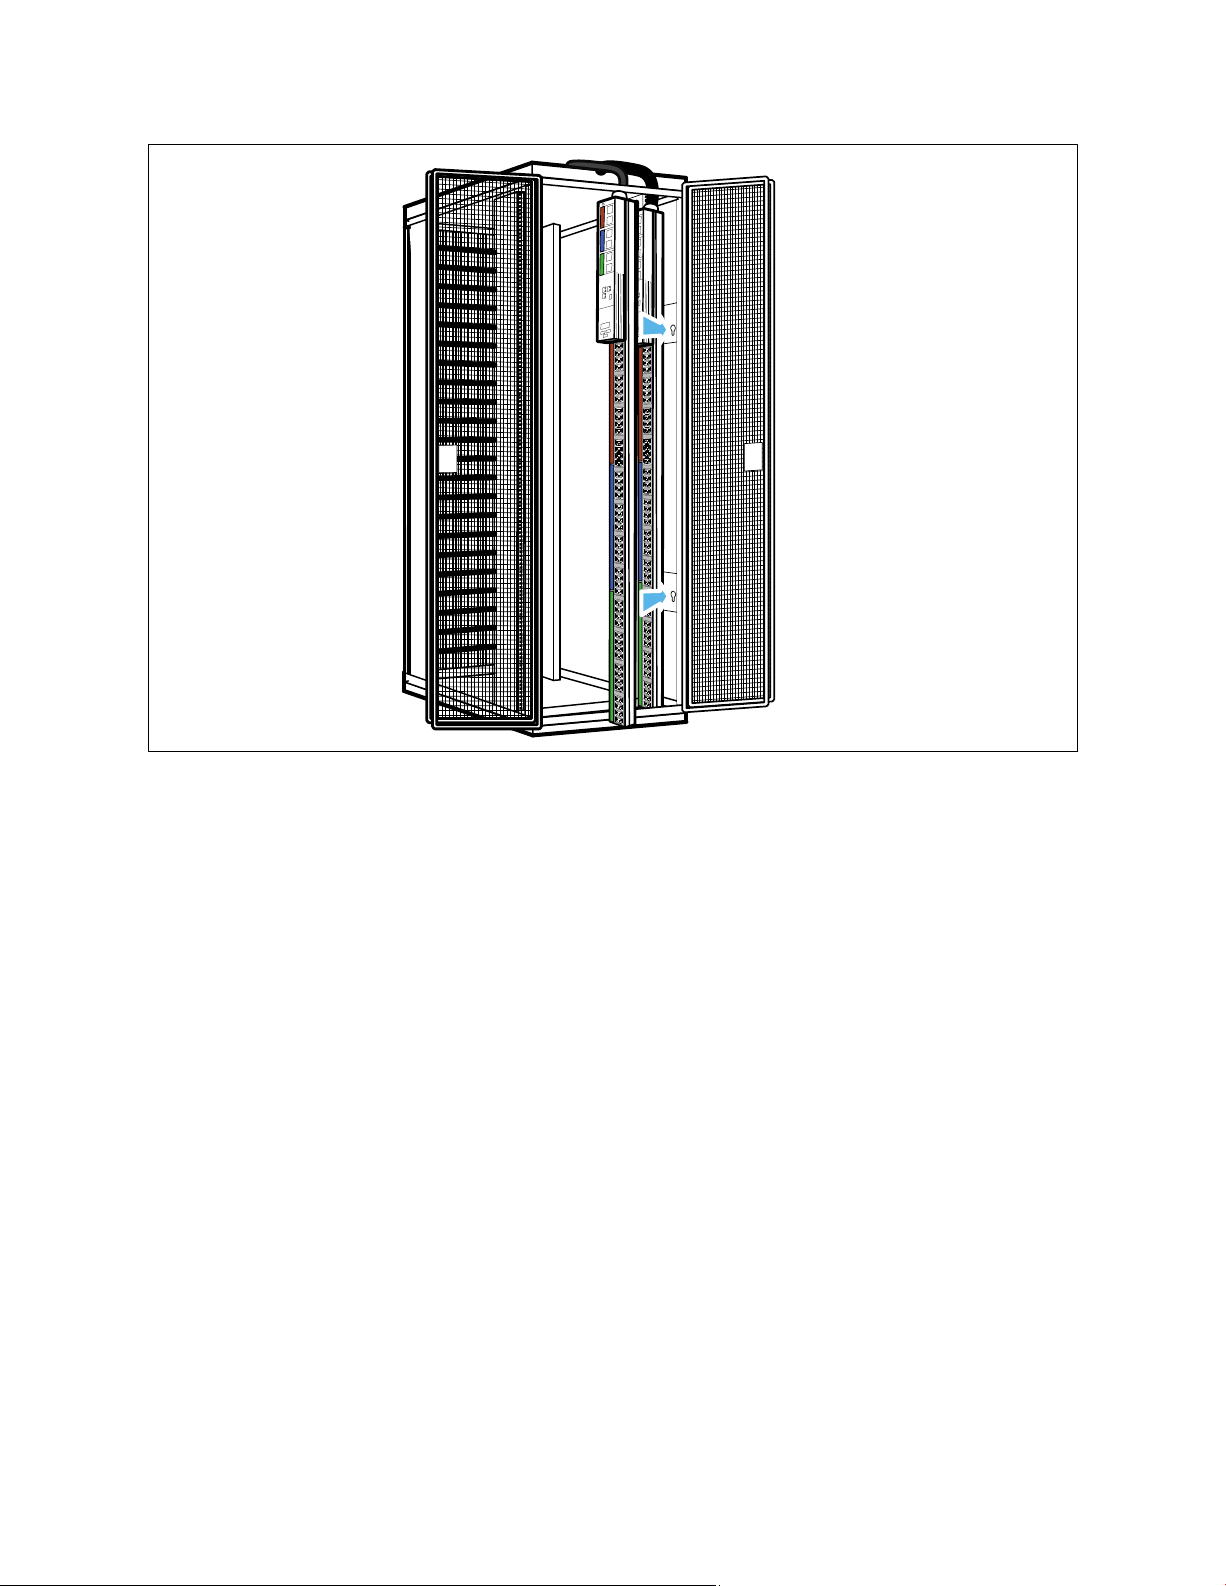
Figure 9. Mounting Two rPDUs in the PDU Tray
6 Continue to “Attaching the Ground Wire” section on page 21.
20
|
Installation
Page 21
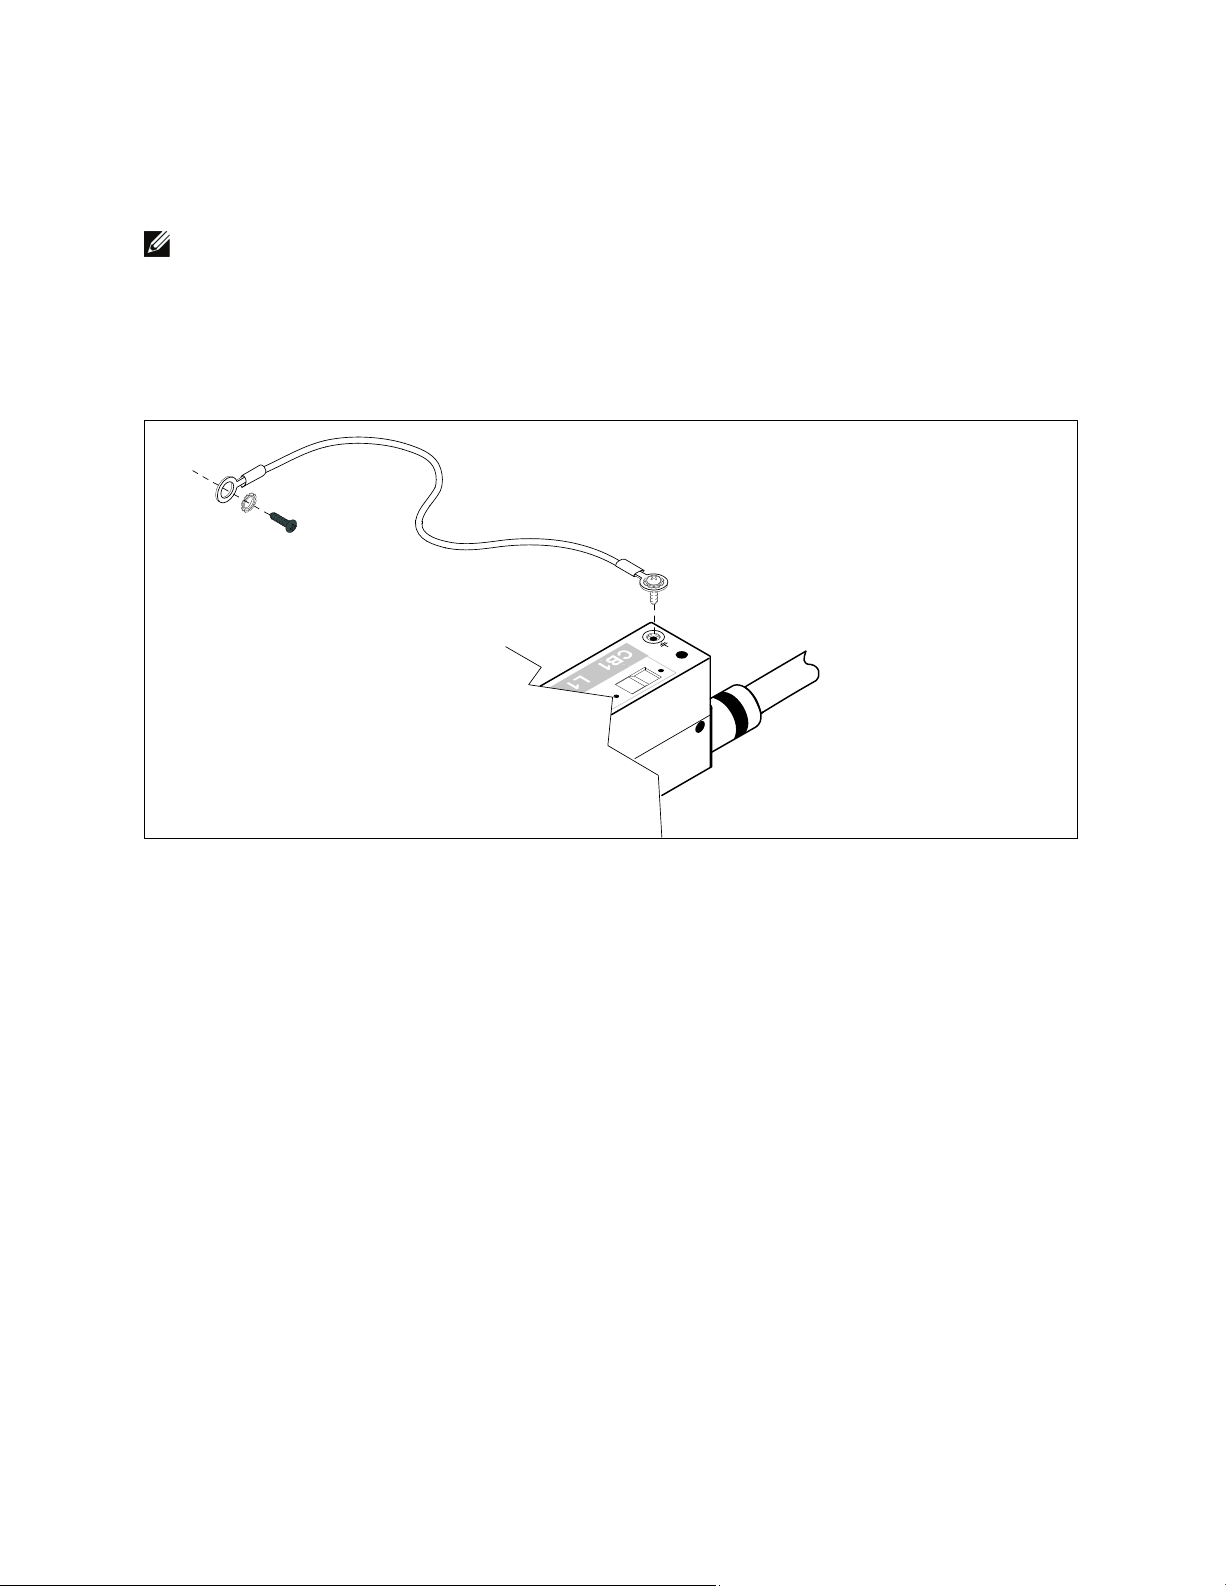
Attaching the Ground Wire
To attach the ground wire to the rack:
NOTE:
Dell recommends that you ground the rPDU to the rack frame with the ground wire provided in the Grounding Wire
Kit.
1 Connect one end of the ground wire to the ground bonding point location on the front panel of the rPDU
using the silver, 10-32
2 Connect the other end of the ground wire to a hole in the rack frame using the black, M5 12 pan-head
screw and star washer (supplied). See Figure 10.
0.5” pan-head screw and star washer (supplied).
Frame Connection
M5
12 Pan-head Screw (Black)
Star Washer
Figure 10. Ground Bonding Point and Frame Connections
3 Continue to “Connecting Protected Equipment” on page 22.
Ground Bonding Point Connection
10-32
0.5” Pan-head Screw (Silver)
Star Washer
Installation
|
21
Page 22

Connecting the Protected Equipment
CAUTION: For PLUGGABLE EQUIPMENT, the power outlet shall be installed near the equipment and shall be readily
accessible.
CAUTION: The rPDU output receptacles for each phase are protected by two 20A circuit breakers on the front panel.
Confirm that the equipment connected to the rPDU does not exceed the rPDU's capacity.
NOTE: The DELLM0003 model does not have circuit breakers.
To install the plug-receptacles:
1 Plug the equipment power cords into the rPDU outlet receptacles.
2 If an optional strain relief bracket is installed, attach the power cords to the bracket by looping the cords
and securing them with tie wraps.
NOTE:
Secure the power cords in the bracket so you can unplug them without removing the tie wrap.
3 Plug the rPDU power cord into a power outlet.
4 Ensure that each circuit breaker is in the ON position.
NOTE:
If power to the rPDU is interrupted, check each circuit breaker and reset if necessary.
Starting the rPDU
To start the rPDU:
1 Plug the rPDU power cord into the power outlet.
2 Turn each circuit breaker to the ON position.
3 If power to the rPDU is interrupted, check each circuit breaker and reset if necessary.
NOTE:
During startup, the Dell Startup screen displays for five seconds and then defaults to the Input Status screen.
Shutting Down the rPDU
NOTE: The protected equipment may be turned off at the equipment or, for models with circuit breakers, at the circuit
breakers on the rPDU.
To shut down the rPDU:
1 Shut down the protected equipment according to the manufacturer's recommended shutdown sequence.
2 Models with circuit breakers only. Turn each circuit breaker to the OFF position.
3 To remove power from the rPDU completely, disconnect the rPDU input connector at the source.
22
|
Installation
Page 23
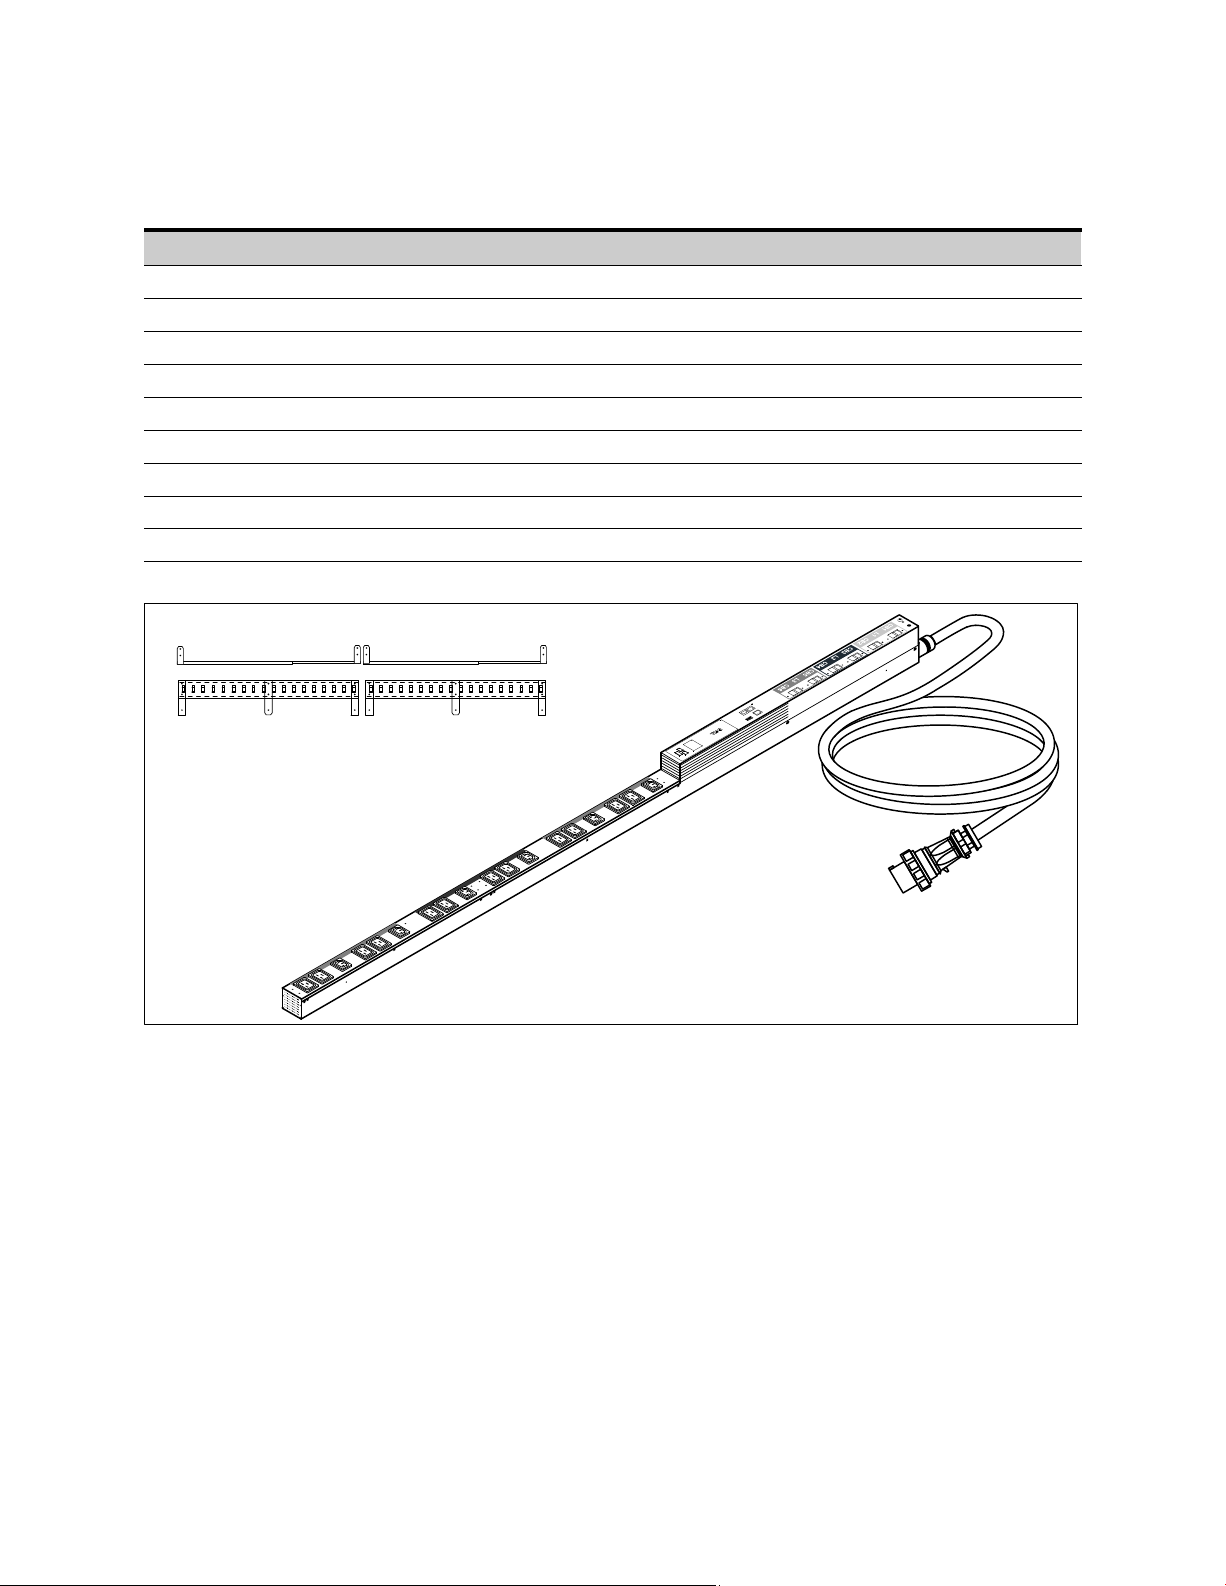
Front Panels
This section shows the front panels of the rPDU models.
rPDU Model Number See Figure On Page
DELLM0001 Figure 11 23
DELLM001A Figure 11 23
DELLM0002 Figure 12 24
DELLM0003 Figure 13 24
DELLM0004 Figure 14 25
DELLM004A Figure 14 25
DELLM0005 Figure 15 25
DELLM0006 Figure 16 26
DELLM0007 Figure 17 26
(6) 20A Circuit Breakers
Side-Mounted or Front-Mounted
Strain Relief Bracket (Optional)
Figure 11. DELLM0001 and DELLM001A
42U
Output Receptacles
(6) IEC 320-C13; 10A
(12) IEC320-C19; 16A
IEC60309-60A
(Waterproof - IP 67)
460P9W
Installation
|
23
Page 24
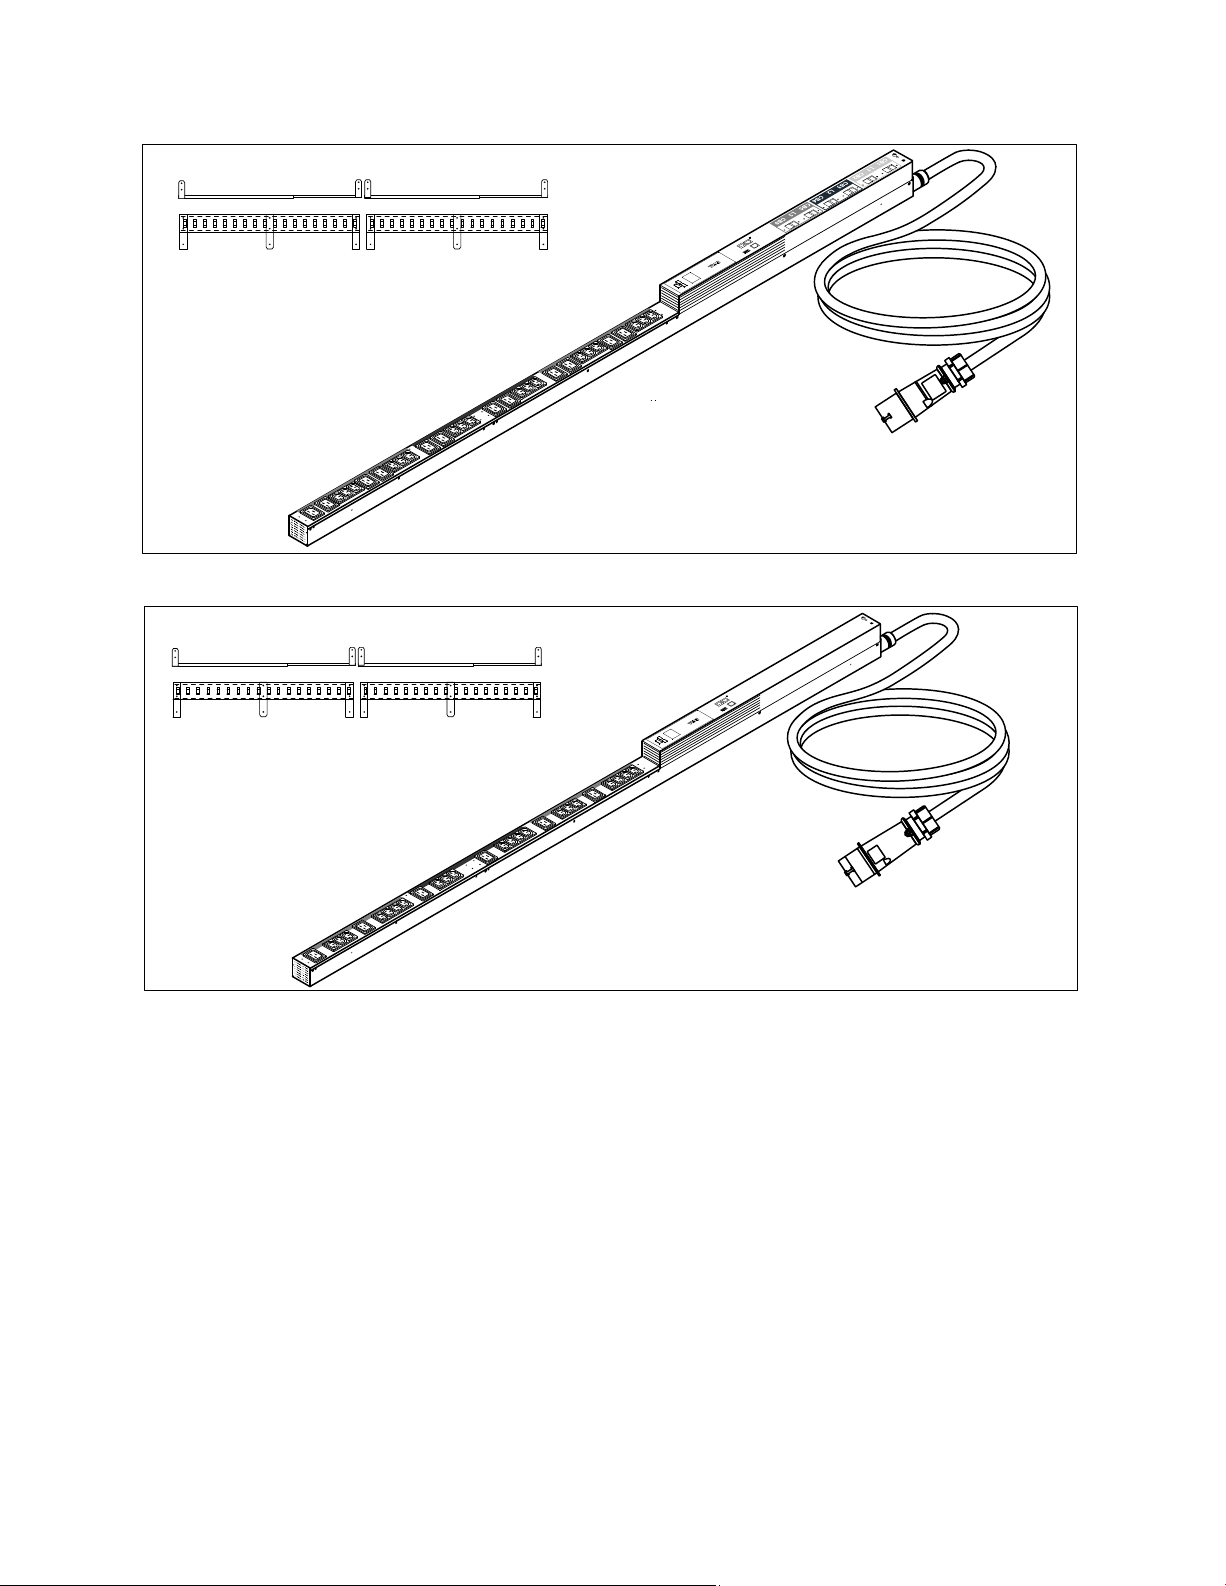
Side-Mounted or Front-Mounted
Strain Relief Bracket (Optional)
Figure 12. DELLM0002
Side-Mounted or Front-Mounted
Strain Relief Bracket (Optional)
42U
42U
(6) 20A Circuit Breakers
Output Receptacles
(18) IEC 320-C13; 10A
(12) IEC320-C19; 16A
IEC60309-32A
(Splash resistant - IP 44)
532P6S
Figure 13. DELLM0003
Output Receptacles
(21) IEC 320-C13; 10A
(6) IEC320-C19; 16A
IEC60309-16A
(Splash resistant - IP 44)
516P6S
24
|
Installation
Page 25
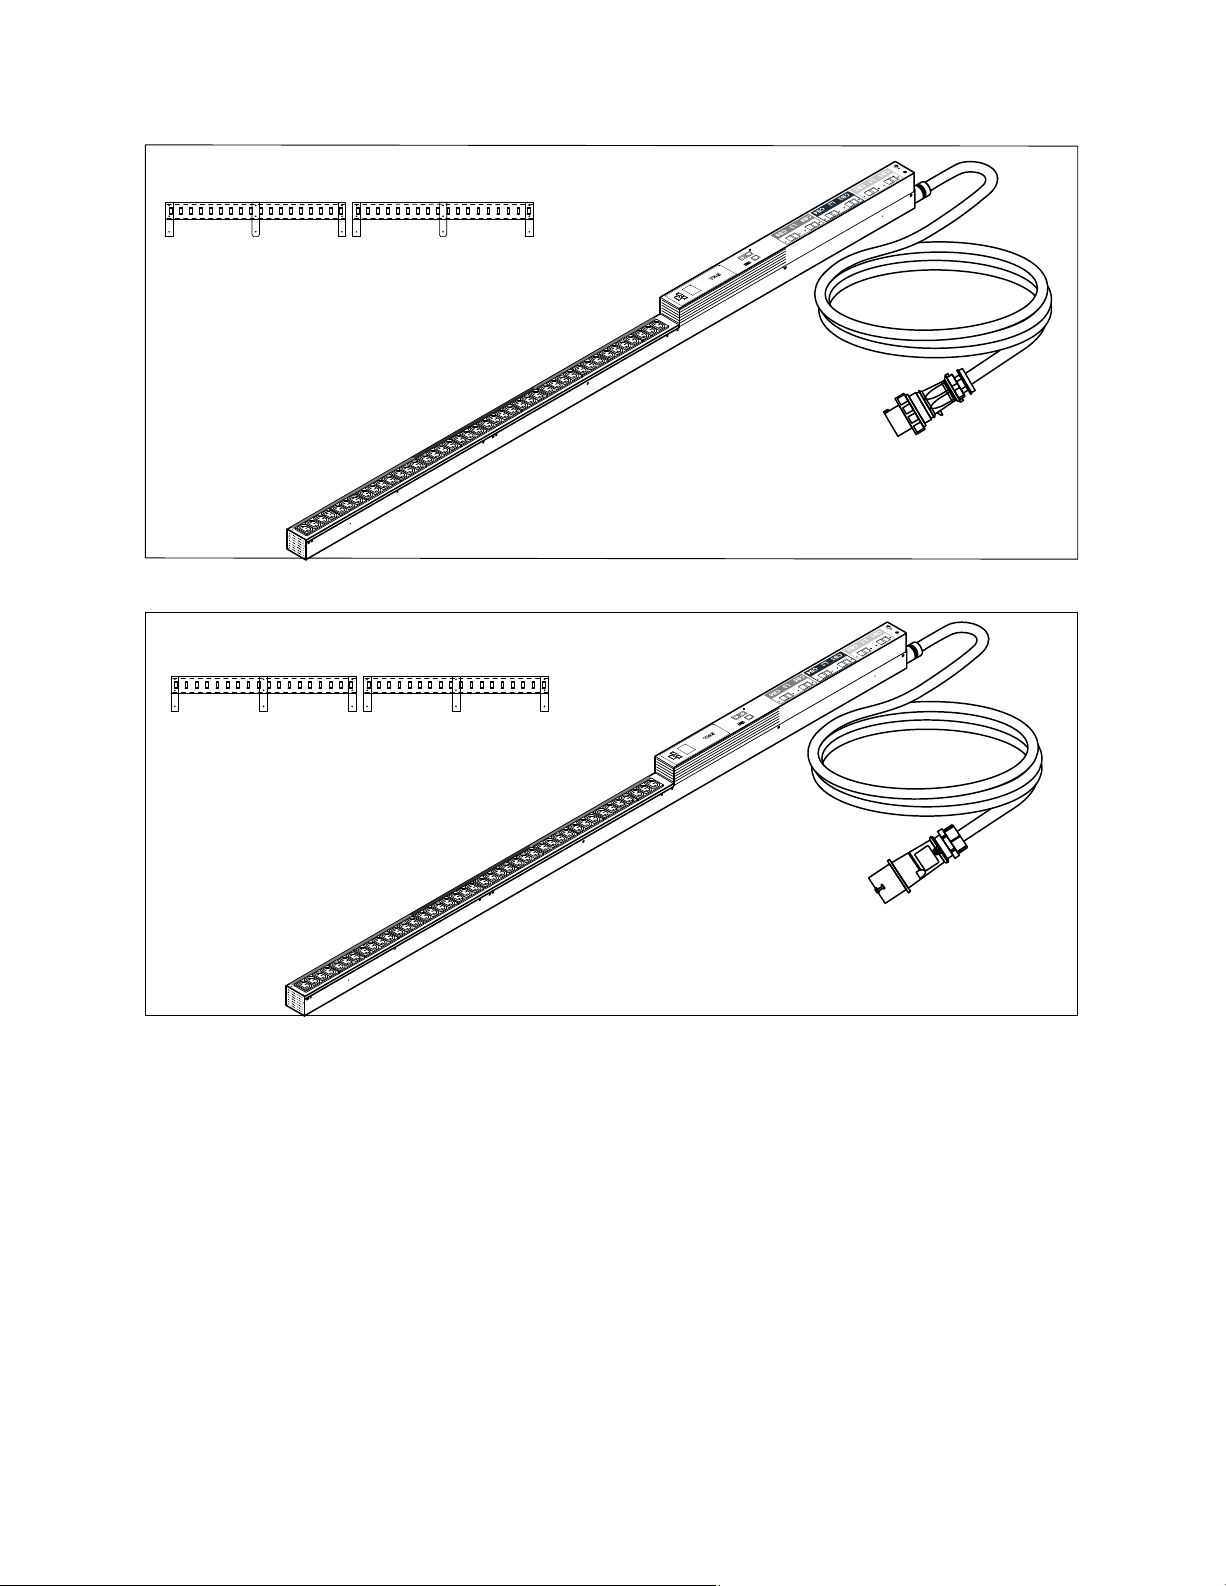
Side-Mounted Strain Relief Bracket (Optional)
Figure 14. DELLM0004 and DELLM004A
Side-Mounted Strain Relief Bracket (Optional)
(6) 20A Circuit Breakers
42U
Output Receptacles
(42) IEC 320-C13; 10A
IEC60309-60A
(Waterproof - IP 67)
460P9W
(6) 20A Circuit Breakers
Figure 15. DELLM0005
42U
Output Receptacles
(42) IEC 320-C13; 10A
IEC60309-32A
(Splash resistant - IP 44)
532P6S
Installation
|
25
Page 26
Side-Mounted Strain Relief Bracket (Optional)
Figure 16. DELLM0006
48U
Output Receptacles
(48) IEC 320-C13; 10A
(6) 20A Circuit Breakers
IEC60309-60A
(Waterproof - IP 67)
460P9W
(6) 20A Circuit Breakers
Side-Mounted Strain Relief Bracket (Optional)
Figure 17. DELLM0007
48U
Output Receptacles
(48) IEC 320-C13; 10A
IEC60309-32A
(Splash resistant - IP 44)
532P6S
26
|
Installation
Page 27
External Signaling Ports
Two types of external signaling ports are provided on the rPDU front panel (see Figure 18):
S Communication ports
S Monitoring ports
4
Temperature/Humidity
Sensor Port
Serial Port
NMC Reset Button
Figure 18. Communication and Environmental Ports
Dry Contact Sensor Port
Ethernet Port
Communication Ports
The rPDU provides both a serial and an Ethernet (10/100 Base-T) communication port for external controls.
These communication ports are used to access external controls for upgrading, monitoring, or managing the
rPDU.
Firmware upgrades (flash upgrades) update the rPDU firmware and the internal Dell Network Management
Card (NMC). Upgrades can be performed either using a command line interface (CLI) upgrade utility or a
Web-based graphical user interface.
NOTE:
The RESET button on the front panel resets the internal NMC.
Flash upgrades are transparent and do not affect rPDU operation. However, the front panel buttons and LCD
operation are disabled during the upgrade. Unique model identification information prevents an incorrect
firmware load from being installed on an rPDU during a flash upgrade.
During the flash upgrade, the LCD provides a “Flash Update In Process” message and provides a progress bar. If
the upgrade is interrupted, recovery processes allow the upgrade to restart. If the upgrade fails, the LCD displays
a “Flash Error” message and the backlight changes to amber text with a dark red background.
The rPDUs can be monitored and settings modified using a graphical Web interface. The settings correspond to
the Settings menu (see Settings menu on page 43). This requires a PC connected through the Ethernet port.
External Signaling Ports
|
27
Page 28

Serial Port
The serial port provides RS-232 serial communication between the rPDUs and a computer using an RJ-45 to
DB-9 serial cable (supplied). Use the serial port to connect to a PC and perform the following using a CLI:
S Configure the internal NMC at startup
S Upgrade the internal NMC and rPDU firmware using a flash update utility program
S Connect to a Dell KVM that supports rPDU communication
To create a serial connection between the rPDU and a PC:
1 Locate the RJ-45 to DB-9 serial cable provided in the accessory bag.
2 Connect the RJ-45 serial cable connector to the rPDU serial communication port (see Figure 18).
3 Connect the serial cable console connector to the RS-232 serial connection port (COM port) on the PC.
NOTE:
Use HyperTerminal® or an equivalent terminal emulation application for the CLI.
The cable pins for the RS-232 serial connection (DB-9 female connector) are identified in Figure 19.
3
16245
879
Figure 19. DB-9 Female Connector
Table 2 provides RS-232 serial connector port pin assignments.
Table 2. Serial Communication RS-232 Port Pin Assignment
Pin
1 Unused —
2 RXD Receive Data In
3 TXD Transmit Data Out
4 Unused —
5 GND Ground —
6 Unused —
7 Unused —
8 Unused —
9 Unused —
Signal Name Function Direction from the rPDU
NOTE: Unused pins must be left free on all models. The pins labeled “Unused” are not to be pulled high or tied to ground.
28
|
External Signaling Ports
Page 29

Table 3 provides RJ-45 serial connector port pin assignments.
Table 3. Serial Communication RJ-45 Port Pin Assignment
Pin
1 Unused —
2 Unused —
3 Unused —
4 RXD Receive Data In
5 TXD Transmit Data Out
6 GND Ground —
7 Unused —
8 Unused —
Signal Name Function Direction from the rPDU
Ethernet Port
The rPDU provides an Ethernet (10/100 Base-T) port connection in order to use the internal NMC to monitor
and manage rPDUs.
The rPDU defaults to using DHCP when delivered. If you are unable to connect to the rPDU through the
network connection with this default address, change the IP address using the serial interface before using any of
the network interfaces. See “Serial Interface Operation” on page 50 for more information.
Once connected, you can access the graphical Web interface over the network and verify that the rPDU's
internal NMC is operational and recognized by the Web interface so the rPDU can be monitored and managed.
NOTE:
The rPDU is defaulted to use DHCP, but additional NMC configuration can be done through the serial connection
using a CLI.
To create an Ethernet connection between the rPDU and the network:
1 Locate the Ethernet cable to use for this network connection (not provided).
2 Ensure the network cable is connected to the network server or router connection.
3 Connect the Ethernet cable to the Ethernet connection port on the rPDU (see Figure 18).
Monitoring Ports
Monitoring ports are used to collect readings from connected sensors. There are two types of environmental
monitoring device (EMD) ports on the rPDU. One port is provided for a either a temperature-only or a
combined temperature and humidity sensor. A dry contact sensor port is also provided.
Temperature and Humidity Sensor (Optional)
Temperature-only or combined temperature and humidity sensors provide readings of the ambient conditions where
the sensor is installed. If a temperature or humidity reading crosses the high or low threshold setting, an alarm
displays in the LCD. (See the Settings menu on page 43.) If the sensor is not installed, or not connected to the rPDU,
the LCD displays dashes.
NOTE:
An environment alarm does not affect rPDU system operation. The alarm only reports an environmental condition.
Install and set up the sensor as instructed in the installation documentation on www.dell.com. Connect the
appropriate end of the temperature-only or combined temperature and humidity sensor cable to the
temperature/humidity sensor port on the rPDU (see Figure 18).
External Signaling Ports
|
29
Page 30

NOTE: Temperature readings are measured in Kelvin (K), then converted and reported as °C on the LCD panel.
Dry Contact Sensor (Optional)
Two dry contacts on the front panel can be configured as either normally open or normally closed when dry
contacts are installed. When configured as normally open, the dry contact becomes active when the pins are
shorted. When configured as normally closed, the dry contact becomes active when the pins are open. (See the
Settings menu on page 43.)
NOTE:
When the dry contact is active, an alarm displays. The alarm is cleared by restoring the hardware connection to
the state before the dry contact became active.
Install and set up the dry contact sensor as instructed in the installation documentation on www.dell.com.
Connect the dry contact sensor to the appropriate port on the rPDU (see Figure 18).
30
|
External Signaling Ports
Page 31

LCD Operation
This chapter contains information on how to use the Dell Metered Rack Power Distribution Unit (rPDU),
including:
S LCD panel and control button functions
S Menu selections
The LCD panel language is not configurable. Only English is provided.
NOTE:
LCD Panel and Control Buttons
The rPDU has a three-button, graphical LCD panel (see Figure 20). Use the control buttons to change the
screen display and retrieve specific performance data or change configuration values.
The display view can also change automatically. For example, the display changes to show active alarms as they
occur, or particular displays update due to a change in operating state.
Inactivity can cause a screen change as well. For example, the display returns to the rPDU Input Status screen
automatically when no button has been pressed for 15 min.
5
Figure 20. LCD Panel
LCD Operation
|
31
Page 32

Table 4 describes the elements that comprise the LCD panel.
Table 4. LCD Panel Elements
LCD Panel Element Description
Scroll up to go back to previous options or menu levels
Selects a menu or option
Scroll down to see the next option or menu level
A standard backlight is continually lit so the white text and a blue background is
clearly visible.
When an rPDU alarm is active, the text changes to amber and the backlight
becomes dark.
Table 5 describes the LCD control button functions.
Table 5. LCD Control Button Functions
Control Button
Operator Action Response
Press for less than one second Scroll up, moving back to the previous menu.
Press for longer than one second Return/exit back one menu layer without initiating a command or
changing a setting.
Press for less than one second Select the menu or option to be changed.
Press for longer than one second Save the setting being edited.
Press for less than one second Scroll down, moving forward to the next menu option.
NOTE: The display automatically returns to the Input Status screen when no button has been pressed for 15 minutes and
no other screen has been locked by a user. To return to the Main Menu, press any control button.
32
|
LCD Operation
Page 33

Locking a Screen
To lock a screen, press the button. The screen view stays locked and does not automatically return to the
default screen after time-out. When the screen is locked, the image of a key appears at the top of locked screen.
Pressing any control button unlocks the screen, removes the lock symbol, and returns the normal control button
functions to the operator (see Figure 21).
Figure 21. Locked Screen
Automatic Alarm Notification
When an alarm occurs, the LCD display automatically changes to the active alarm display except under the
following circumstances:
S Screen lock is activated
S You are in the Settings menu
S You selected a control button in the last five seconds
NOTE:
An active alarm is presented as amber text on a dark background to distinguish it from the standard LCD display.
Input Status Screen
Five seconds after rPDU startup, the Input Status screen automatically replaces the Dell startup screen. The Input Status
screen provides a summary of rPDU input measurements (see Figure 22).
Figure 22. Dell Startup and Input Status Screens
LCD Operation
|
33
Page 34

Table 6 describes the values on the Input Status screen display.
Table 6. Input Status Screen
Status Description
Input Voltage (V) Present average of the total input voltage for all three rPDU phases, reported in Volts (V).
NOTE: If any phase fails to report voltage, the voltage for the remaining phases is averaged.
Input Wattage (W) Calculated value of the overall input wattage of the rPDU, reported in Watts (W). This is also
called active power.
Input Volt-amperes (VA) Calculated value of the overall input volt-amperes (VA) of the rPDU. This is also called
apparent power.
Main Menu Selections
The rPDU menu selection hierarchy provides useful performance information, alarms, events, identification, and
configuration settings.
Make a selection from the rPDU
Main Menu to retrieve performance monitoring data, review operation log
information, retrieve system identification information, or enter a configuration settings (see
Figure 23. Main Menu Selections
Figure 23).
34
|
LCD Operation
Page 35

Table 7 provides descriptions of Main Menu selections.
Table 7. Main Menu Selections
Main Menu Description
Performance Selections on the Performance Menu display data that represent the real-time operating status
of the system.
S The L1, L2, or L3 submenus provide voltage, frequency, or current data for each phase.
S The Power submenu provides present readings for power (VA) and wattage (W) data.
S The Environment menu displays present temperature and humidity readings (if sensors are
installed and connected).
Alarms Alarm screens are only visible when alarms are active. Selecting the Alarm menu displays the
message “No active alarm” if no alarms are active.
Event Log Scroll through the Event Log to review the most recent events (50 events maximum).
NOTE: Events do not automatically display when they occur the way alarms display. Events are
shown only in the event log.
System Info The System Info menu provides rPDU identification information, such as model serial
number and firmware version identification.
Settings The Settings menu provides configuration options for customizing performance monitoring
thresholds and configuring the user interface.
NOTE: For Delta models, L1 represents L1-L3 data, L2 represents L1-L2 data, and L3 represents L2-L3 data.
Selecting a Menu
To select a menu:
1 From the Main menu, use the or button to navigate to any menu.
2 Press and release the button to select the menu.
3 To exit any menu screen and return to the previous menu level, press the button for longer than one
second.
Performance Menu
Selections on the Performance menu display data that represents the real-time operating status of the system.
The Performance menu contains the following submenus:
S The L1, L2, or L3 menus provide voltage, current, and frequency data for each phase.
S The Power menu provides present readings for power (VA) and wattage (W) data.
S The Environment menu displays the present temperature (°C) and humidity (%) readings (if sensors are
installed and connected).
NOTE:
For Delta models, L1 represents L1-L3 data, L2 represents L1-L2 data, and L3 represents L2-L3 data.
LCD Operation
|
35
Page 36

Retrieving Performance Information
To select an option and retrieve rPDU performance information:
1 From the Main menu, use the or buttons to navigate to the Performance menu.
2 Press and release the button to select the Performance menu.
3 Use the or buttons to navigate to a submenu.
4 Press and release the button to select the submenu.
5 Use the or buttons to toggle the available options within a submenu.
NOTE:
When scrolling through the selections, the up-to-date data displays for each selection.
6 To exit any screen and return to the previous menu level, press the button for longer than one second.
Figure 24. Example Performance Displays
Table 8 provides descriptions of Performance menu selections.
|
36
LCD Operation
Page 37

Table 8. Performance Menu Selections
Performance
Option Description
Submenu
L1 Menu
L1 Voltage Present voltage reading for phase 1 (L1), displayed in
Volts (V)
L1 Frequency Present frequency reading for phase 1 (L1), displayed in
Hertz (Hz)
L1 Current Present current reading for phase 1 (L1), displayed in
Amps (A)
L2 Menu
L2 Voltage Present voltage reading for phase 2 (L2), displayed in
Volts (V)
L2 Frequency Present frequency reading for phase 2 (L2), displayed in
Hertz (Hz)
L2 Current Present current reading for phase 2 (L2), displayed in
Amps (A)
L3 Menu
L3 Voltage Present voltage reading for phase 3 (L3), displayed in
Volts (V)
L3 Frequency Present frequency reading for phase 3 (L3), displayed in
Hertz (Hz)
L3 Current Present current reading for phase 3 (L3), displayed in
Amps (A)
NOTE: For Delta models, L1 represents L1-L3 data, L2 represents L1-L2 data, and L3 represents L2-L3 data.
LCD Operation
|
37
Page 38

Table 8. Performance Menu Selections (Fortsetzung)
Option DescriptionPerformance
Submenu
Power
Environment
Active Power Provides the calculated value of the overall input,
displayed in watts (W)
Apparent Power Provides the calculated value of the overall input,
displayed in Volt-amperes (VA)
Instantaneous Headroom Watts Provides the watts capacity remaining
NOTE: When the rPDU is in an overload state, this value
is always 0.
Peak Headroom Watts Provides the remaining watts available to support the
load at peak demand
Peak Consumption Watts Provides the peak power demand on the rPDU with time
and date stamp of the most recent data update
Cumulative kWh Consumption Provides the total kWh usage with time and date stamp
of the most recent data update
NOTE: This value accumulates. If this value reaches the
maximum value for a 32-bit number, do not reset.
No sensors connected Displays dashes on both Temperature and Humidity
screens.
Only Temperature sensor connected Displays the temperature in °C on the Temperature
screen. Displays dashes on the Humidity screen.
Temperature and Humidity sensors
connected
Displays the temperature in °C on the Temperature
screen. Displays the humidity percentage on the
Humidity screen.
Measured and Calculated Meters
The rPDU operating status information provided by the Performance menu selections is derived from a series of
measured and calculated meters. See Table 9 for descriptions of measured and calculated meters.
Table 9. Measured and Calculated Meters
Meter Unit Description
Input Voltage
Input Frequency Hertz (Hz) Present frequency measured at the input of the rPDU
Input Current Amps (A) Present current measured at 3 f input of the rPDU
Input Watts Watts (W) Calculated value of the overall input W of the rPDU (active power)
Input Volt-amperes Volt-amperes (VA) Calculated value of the overall input VA of the rPDU (apparent power)
Instantaneous Headroom
Watts
Peak Headroom Watts
(with time stamp)
|
38
LCD Operation
Volts (V) Present voltage measured at the 3 f input of the rPDU
Watts (W) Present W capacity remaining for the rPDU
NOTE: This value is an absolute value calculated from the W rating of
rPDU deducted from the W being consumed.
Watts (W) Remaining W available to support the load at peak demand
NOTE: This value is based on the lowest value set for that Instantaneous
Headroom Watts. The value can be reset from the LCD or the internal
Dell Network Management Card (NMC).
Page 39

Table 9. Measured and Calculated Meters (Fortsetzung)
DescriptionMeter Unit
Peak Consumption
Watts (with time stamp)
Cumulative Kilowatt per
hour (with time stamp)
Temperature Kelvin (K) Two high temperature thresholds from an environmental thermal-only
Humidity Percent (%) Two low humidity thresholds reported from an environmental thermal
Real Time Clock MM/DD/YYYY Current time and date reading from the network interface card real-time
Watts (W) Peak power demand on the rPDU with time and date stamp of the most
recent data update
Kilowatt per hour
(kWh)
Total kWh usage
NOTE: This 32-bit meter value is derived by retrieving the current kWh
consumption meter once each hour and adding it to the previous value.
This value accumulates until it is reset from the LCD or network
interface card.
or thermal and humidity sensor, measured in K and reported as °C
and humidity sensor, reported as a percentage (%)
clock
Alarms Menu
Selecting the Alarms menu allows you to review all active alarms in the order of occurrence. If there are no active
notices or alarms, a “No Active Alarm” message appears (see Figure 25).
In addition to displaying in the Alarms menu alarms and notices are logged in the Event Log.
NOTE:
Events are not shown in rPDU alarm status screens. Events appear only in the Event Log.
Retrieving Active Alarms
To retrieve active alarms:
1 From the Main menu, use the or buttons to navigate to the Alarms menu.
2 Press and release the button to select the Alarms menu.
3 Use the or buttons to navigate forward or back to review the active alarms.
4 To exit any screen and return to the previous menu level, press the button for longer than one second.
Figure 25. Example Alarms Menu Display
Table 10 provides descriptions of status alarms, notices, and events.
NOTE:
For Delta models, L1 represents L1-L3 data, L2 represents L1-L2 data, and L3 represents L2-L3 data.
LCD Operation
|
39
Page 40

Table 10. Alarms , Notices, and Events
Name
L1 Over Current Warning The Phase 1 input current amperage (A) reading is
L2 Over Current Warning The Phase 2 input current amperage (A) reading is
L3 Over Current Warning The Phase 3 input current amperage (A) reading is
L1 Over Current Alarm The Phase 1 input current amperage (A) reading is
L2 Over Current Alarm The Phase 2 input current amperage (A) reading is
L3 Over Current Alarm The Phase 3 input current amperage (A) reading is
L1 Low Current Warning The Phase 1 input current amperage (A) reading is less
L2 Low Current Warning The Phase 2 input current amperage (A) reading is less
L3 Low Current Warning The Phase 3 input current amperage (A) reading is less
Description Type
greater than the value configured as the over current
warning threshold. This warning indicates that the
current A reading is approaching the value set for the
over current alarm.
Generates an alarm and is logged in the Event Log.
greater than the value configured as the over current
warning threshold. This warning indicates that the
current A reading is approaching the value set for the
over current alarm.
Generates an alarm and is logged in the Event Log.
greater than the value configured as the over current
warning threshold. This warning indicates that the
current A reading is approaching the value set for the
over current alarm.
Generates an alarm and is logged in the Event Log.
greater than the value configured as the over current
alarm threshold.
Generates an alarm and is logged in the Event Log.
greater than the value configured as the over current
alarm threshold.
Generates an alarm and is logged in the Event Log.
greater than the value configured as the over current
alarm threshold.
Generates an alarm and is logged in the Event Log.
than the value configured as the low current warning
threshold. This warning indicates that the current A
reading is approaching the value set for the low current
alarm.
Generates an alarm and is logged in the Event Log.
than the value configured as the low current warning
threshold. This warning indicates that the current A
reading is approaching the value set for the low current
alarm.
Generates an alarm and is logged in the Event Log.
than the value configured as the low current warning
threshold. This warning indicates that the current A
reading is approaching the value set for the low current
alarm.
Generates an alarm and is logged in the Event Log.
Notice
Notice
Notice
Alarm
Alarm
Alarm
Notice
Notice
Notice
40
|
LCD Operation
Page 41

Table 10. Alarms , Notices, and Events (Fortsetzung)
Name TypeDescription
Overload Warning The total watts (W) reading for all three phases is
greater than the value configured as the overload
warning threshold. This warning indicates that the
current W reading is approaching the value set for the
overload alarm.
Generates an alarm and is logged in the Event Log.
Overload Alarm The total watts (W) reading for all three phases is
greater than the value configured as the overload alarm
threshold.
Generates an alarm and is logged in the Event Log.
Low Load Warning The total watts (W) reading for all three phases is less
than the value configured as the low load warning
threshold. This warning indicates that the W reading is
approaching the value set for the low load alarm.
Generates an alarm and is logged in the Event Log.
Over Temperature Alarm The temperature level reading is greater than the
maximum temperature threshold value. This alarm
clears when the temperature drops 5°C below the
Temperature High Alarm Level value setting.
Generates an alarm and is logged in the Event Log.
Over Temperature Warning The temperature level reading is greater than the
warning temperature threshold value. This alarm clears
when the temperature drops 5°C below the Temperature
High Warning Level value setting.
Generates an alarm and is logged in the Event Log.
Low Humidity Warning The humidity level reading is less than the value
configured as the warning humidity threshold. This
alarm clears when the humidity rises 5% above the
Humidity Low Warning Level value setting.
Generates an alarm and is logged in the Event Log.
Low Humidity Alarm The humidity level reading is less than the minimum
humidity threshold. This alarm clears when the
humidity rises 5% above the Humidity Low Alarm Level
value setting.
Generates an alarm and is logged in the Event Log.
Contact 1 Active The signal for Dry Contact 1 is active.
Generates an alarm and is logged in the Event Log.
Contact 2 Active The signal for Dry Contact 2 is active.
Generates an alarm and is logged in the Event Log.
Meter IC Fault Communication is lost.
Generates an alarm and is logged in the Event Log.
Notice
Alarm
Notice
Alarm
Notice
Notice
Alarm
Alarm
Alarm
Alarm
LCD Operation
|
41
Page 42

Table 10. Alarms , Notices, and Events (Fortsetzung)
Name TypeDescription
Fatal EEPROM Fault This alarm occurs when the EEPROM experiences a
Range Check Failure alarm, an incorrect EEPROM
model map alarm, or an EEPROM Checksum Failure
alarm.
Generates an alarm and is logged in the Event Log.
PDU Control Power ON The rPDU processor is powered on.
Logged in the Event Log only.
Alarm
Event
Event Log
The Event Log holds up to 50 alarms, events, and most notices. They are logged when they occur. You can scroll
through the event screens, beginning with the most recent event.
The first row of each event screen contains the date (MM/DD/YYYY) and time (hh:mm:ss) at which the event
occurred. The second row contains the type of event and code. The event description begins on the third row
and may continue to the fourth row.
The bottom right corner of the event screen displays two numbers—an ordering number of the event in the log,
followed by the total number of events in the log.
If there are no events in the log, the screen displays “No events in log.”
Retrieving the Event Log
To retrieve the logged events:
1 From the Main menu, use the or buttons to navigate to the Events Log menu.
2 Press the button for longer than one second to see the logged events.
3 Use the or buttons to navigate forward or back to review the events, notices, and alarms in the order
they occurred.
4 To exit any screen and return to the previous menu level, press the button for longer than one second.
Figure 26. Example Event Log Displays
42
|
LCD Operation
Page 43

System Info
The System Info menu screens display the following rPDU identification information:
S Type and model
S rPDU part number
S Serial number
S NMC firmware version
S NMC IP address
S NMC MAC address
S rPDU firmware
Retrieving System Identification Information
To retrieve rPDU system identification information:
1 From the Main menu, use the or buttons to navigate to the System Info menu.
2 Press and release the button to select the System Info menu.
3 Use the or buttons to toggle the available options within the menu.
4 To exit any screen and return to the previous menu level, press the button for longer than one second.
Figure 27. Example Identification Displays
Settings
The Settings menu provides user configuration options (see Figure 28). Only the available options display.
User settings are not protected by default. You can enable the password through the Password setting.
NOTE:
Retrieving or Changing Configuration Settings in the Settings Menu
1 From the Main menu, use the or buttons to navigate to the Settings menu.
2 Press and release the button to select the Settings menu.
3 Use the or buttons to navigate to a submenu.
4 Press and release the button to select the submenu.
5 Use the or buttons to toggle the available configuration options within a submenu.
When scrolling through the selections, the present setting displays for each selection.
NOTE:
6 Press and release the button to select the configuration option you want to change.
LCD Operation
|
43
Page 44

7 Use the or buttons to toggle to the value you want to set.
8 Set a new value by pressing the button again for longer than one second.
9 To exit any screen and return to the previous menu level, press the button for longer than one second.
Figure 28. Example Settings Displays
Table 11 provides descriptions of Settings menu selections.
|
44
LCD Operation
Page 45

Table 11. Settings
Settings
Setting Option Available Settings Default Setting
Submenu
Cumulative
Reset Peak Watts [No] [Yes]
No
If No, no action.
If Yes, the Peak Consumption Watts value is
cleared and the date and time stamp for this
statistic is set to the present date and time.
Reset Peak Headroom Watts [No] [Yes]
No
If No, no action.
If Yes, the Peak Headroom Watts value is
cleared and the date and time stamp for this
statistic is set to the present date and time.
Reset Cumulative kWh [No] [Yes]
No
If No, no action.
If Yes, the Cumulative Consumption kWh
value is cleared and the date and time stamp for
this statistic is set to the present date and time.
L1 Settings
L1 Over Current Warning Level [0.0A]...[48.0A] *
[0.0A]...[32.0A] **
[0.0A]...[16.0A] ***
38.4A
25.6A
12.8A
An input current amperage (A) reading greater
than this value causes a warning to generate.
This warning indicates that the current A
reading has risen to an unacceptable level.
L1 Over Current Alarm Level [0.0A]...[48.0A] *
[0.0A]...[32.0A] **
[0.0A]...[16.0A] ***
48.0A
32.0A
16.0A
An input current amperage (A) reading greater
than this value causes an over current alarm to
generate.
L1 Low Current Warning Level [0.0A]...[48.0A] *
[0.0A]...[32.0A] **
[0.0A]...[16.0A] ***
0.0A
0.0A
0.0A
An input current amperage (A) reading less
than this value causes a warning to generate.
This warning indicates that the current A
reading is reduced to an unacceptable level.
* DELLM0001, DELLM001A, DELLM0004, DELLM004A, DELLM0006
** DELLM0002, DELLM0005, DELLM0007
*** DELLM0003
NOTE: For Delta models, L1 represents L1-L3 data, L2 represents L1-L2 data, and L3 represents L2-L3 data.
LCD Operation
|
45
Page 46

Table 11. Settings (Continued)
Settings
Setting Option Default SettingAvailable Settings
Submenu
L2 Settings
L2 Over Current Warning Level [0.0A]...[48.0A] *
[0.0A]...[32.0A] **
[0.0A]...[16.0A] ***
38.4A
25.6A
12.8A
An input current amperage (A) reading greater
than this value causes a warning to generate.
This warning indicates that the current A
reading has risen to an unacceptable level.
L2 Over Current Alarm Level [0.0A]...[48.0A] *
[0.0A]...[32.0A] **
[0.0A]...[16.0A] ***
48.0A
32.0A
16.0A
An input current amperage (A) reading greater
than this value causes a over current alarm to
generate.
L2 Low Current Warning Level [0.0A]...[48.0A] *
[0.0A]...[32.0A] **
[0.0A]...[16.0A] ***
0.0A
0.0A
0.0A
An input current amperage (A) reading less
than this value causes a warning to generate.
This warning indicates that the current A
reading is reduced to an unacceptable level.
L3 Settings
L3 Over Current Warning Level [0.0A]...[48.0A] *
[0.0A]...[32.0A] **
[0.0A]...[16.0A] ***
38.4A
25.6A
12.8A
An input current amperage (A) reading greater
than this value causes a warning to generate.
This warning indicates that the current A
reading has risen to an unacceptable level.
L3 Over Current Alarm Level
[0.0A]...[48.0A] *
[0.0A]...[32.0A] **
[0.0A]...[16.0A] ***
48.0A
32.0A
16.0A
An input current amperage (A) reading greater
than this value causes an over current alarm to
generate.
L3 Low Current Warning Level [0.0A]...[48.0A] *
[0.0A]...[32.0A] **
[0.0A]...[16.0A] ***
0.0A
0.0A
0.0A
An input current amperage (A) reading less
than this value causes a warning to generate.
This warning indicates that the current A
reading is reduced to an unacceptable level.
* DELLM0001, DELLM001A, DELLM0004, DELLM004A, DELLM0006
** DELLM0002, DELLM0005, DELLM0007
*** DELLM0003
NOTE: For Delta models, L1 represents L1-L3 data, L2 represents L1-L2 data, and L3 represents L2-L3 data.
46
|
LCD Operation
Page 47

Table 11. Settings (Continued)
Settings
Setting Option Default SettingAvailable Settings
Submenu
Power Limits
Near Overload Warning Level [0kW]...[17.3kW] *
[0kW]...[22.0kW] **
[0kW]...[11.0kW] ***
13.8kW
17.6kW
8.8kW
An input wattage (kW) reading in excess of this
value causes an overload warning to generate.
This warning indicates that the current kW
reading has risen nearly to the overload alarm
level value.
Overload Alarm Level [0kW]...[17.3kW] *
[0kW]...[22.0kW] **
[0kW]...[11.0kW] ***
17.3kW
22.0kW
11.0kW
An input wattage (kW) reading in excess of this
value causes an overload alarm to generate.
Low Load Warning Level [0.0kW]...[17.3kW] *
[0.0kW]...[22.0kW] **
[0.0kW]...[11.0kW] ***
0.0kW
0.0kW
0.0kW
An input wattage (kW) reading less than this
value causes a low load warning to generate as a
reminder to share the load for this phase.
Environments
Temperature High Warning
Level
[0 degree C]...[65 degree C]
A high temperature warning threshold is
59 degree C
exceeded when a value greater than this setting
is detected by the environmental temperature
sensor. A high temperature warning generates.
Temperature High Alarm Level [0 degree C]...[65 degree C]
60 degree C
A high temperature alarm threshold is exceeded
when a value greater than this setting is
detected by the environmental temperature
sensor. A high temperature alarm generates.
Humidity Low Warning Level [0%]...[95%]
10%
A low humidity warning threshold is exceeded
when a value less than this setting is detected
by the environmental humidity sensor. A low
humidity warning generates.
Humidity Low Alarm Level [0%]...[95%]
0%
A low humidity alarm threshold is exceeded
when a value less than this setting is detected
by the environmental humidity sensor. A low
humidity alarm generates.
* DELLM0001, DELLM001A, DELLM0004, DELLM004A, DELLM0006
** DELLM0002, DELLM0005, DELLM0007
*** DELLM0003
NOTE: For Delta models, L1 represents L1-L3 data, L2 represents L1-L2 data, and L3 represents L2-L3 data.
LCD Operation
|
47
Page 48

Table 11. Settings (Continued)
Settings
Setting Option Default SettingAvailable Settings
Submenu
Contact config.
Contact 1 [Normally open], [Normally closed]
Normally open
When set to normally open, the dry contact will
be active when the pins are shorted. When set
to normally closed, the dry contact will be
active when the pins are open.
Contact 2 [Normally open], [Normally closed]
Normally open
When set to normally open, the dry contact will
be active when the pins are shorted. When set
to normally closed, the dry contact will be
active when the pins are open.
Password Password [Enabled] [Disabled]
Disabled
If Enabled, the default password is USER. and
all settings are password-protected.
NOTE: If you enter an incorrect password, the
message “Incorrect Password” appears. Press
any button to return to the password screen and
retry the password.
Factory setting Restore Factory Defaults [No], [Yes]
No
If No, no action.
If Yes, all configurable settings are restored to
factory default values.
NOTE: When you select [Yes] and press the
select button, a “Factory setting restored”
message displays. You are prompted to “Press
any key to continue.”
Clear event log Clear Event Log [No], [Yes]
No
If No, no action.
If Yes, all events in the log are cleared and the
Total Events value returns to 0.
* DELLM0001, DELLM001A, DELLM0004, DELLM004A, DELLM0006
** DELLM0002, DELLM0005, DELLM0007
*** DELLM0003
NOTE: For Delta models, L1 represents L1-L3 data, L2 represents L1-L2 data, and L3 represents L2-L3 data.
48
|
LCD Operation
Page 49

Table 11. Settings (Continued)
Settings
Setting Option Default SettingAvailable Settings
Submenu
LCD display
LCD Contrast [-5], [-4], [-3], [-2], [-1], [+0], [+1], [+2],
[+0]
[+3], [+4], [+5]
The LCD contrast is adjustable from -5 to +5.
This range covers the maximum adjustment for
contrasting the background with the text in the
visual display of the control panel.
NOTE: The contrast on the LCD display screen
adjusts immediately as the Up and Down
buttons are pressed. Once you reach the
optimal contrast, press and hold the Select
button for one second to set the new contrast.
LCD Orientation [0 degree], [180 degree]
[0 degree]
The LCD orientation is adjustable to
accommodate both horizontal (0 degree
setting) and vertical (180 degree setting) views.
* DELLM0001, DELLM001A, DELLM0004, DELLM004A, DELLM0006
** DELLM0002, DELLM0005, DELLM0007
*** DELLM0003
NOTE: For Delta models, L1 represents L1-L3 data, L2 represents L1-L2 data, and L3 represents L2-L3 data.
LCD Operation
|
49
Page 50

Serial Interface Operation
This section describes remotely configuring and monitoring a Dell Metered Rack Power Distribution Unit
(rPDU) through the serial interface connection between the rPDU internal Dell Network Management Card
(NMC) and a laptop or workstation.
Access to a command line interface (CLI) using an Avocent protocol is provided through a terminal emulation
program, such as HyperTerminal or Telnet.
NOTE:
A terminal emulation program can communicate with another computer or network as if it were a specific type of
terminal directly connected to that computer or network.
Once connected, you can perform basic configuration and monitoring tasks for the rPDU to which you are
connected, including the following:
S Retrieve selected meters and measurements, including current, present power, temperature, and input
voltage
S Set or retrieve rPDU critical alarm high threshold values
S Set or retrieve high temperature warning or alarm threshold values, and low humidity warning or alarm
threshold values
S Set or retrieve settings for dry contact sensors connected to the rPDU
S Retrieve selected rPDU equipment, software version, and ratings information
S Reset the rPDU settings to factory defaults or reboot the rPDU
6
NOTE:
The rPDU defaults to using DHCP when delivered. If you are unable to connect to the rPDU through the network
connection with this default address, change the IP address using the serial interface before using any of the network
interfaces.
Supported Commands
The rPDU serial interface command set for managing and monitoring the rPDU includes the following
commands:
S alarm
S current
S exit
S factory_defaults
S help
S network
S power
S reboot
S sensors
S temperature
S ver
S voltage
50
NOTE:
Command variables are represented in command input syntax surrounded by angle braces (< >). Constants are
represented in command input syntax surrounded by straight brackets ([ ]).
|
Serial Interface Operation
Page 51

NOTE: You must be logged in to the rPDU before commands can be sent.
NOTE: See Page 56 though Page 64 for descriptions of the serial interface commands, including syntax, query options,
and example responses.
Nomenclature
The serial interface CLI uses a different nomenclature to represent current and voltage readings than the
nomenclature that displays on the LCD. Table 12 lists the CLI nomenclature that corresponds to voltages and
currents.
Table 12. Serial Interface Nomenclature
Voltage Nomenclature
XN L1 Line to Neutral on a Wye-configured rPDU
YN L2 Line to Neutral on a Wye-configured rPDU
ZN L3 Line to Neutral on a Wye-configured rPDU
XZ L1 Phase to Phase on a Delta-configured rPDU
XY L2 Phase to Phase on a Delta-configured rPDU
YZ L3 Phase to Phase on a Delta-configured rPDU
Current Nomenclature Description
X L1 (Phase 1)
Y L2 (Phase 2)
Z L3 (Phase 3)
1
Line-to-Neutral voltage will not be reported on a Delta-configured rPDU.
2
Line-to-Line voltage will not be reported on a Wye-configured rPDU.
1,2
Description
Connecting to the Internal rPDU NMC
NOTE: The following instructions describe the procedure to establish and save a serial interface connection to an rPDU
using HyperTerminal. The serial interface is supported on Microsoft Windows 2000, XP 2003, Vista Windows, and above.
To set up a connection between the rPDU internal NMC and a computer:
1 Verify that the serial cable is correctly connected between the rPDU and your computer.
2 Create or open a previously saved connection to the rPDU:
If you have already created a connection to the rPDU you want to access, go to Step 3.
If you are creating a new connection, go to Step 5.
3 Open a saved connection using one of the following options:
Select Start > All Programs > Accessories > Communications > HyperTerminal > saved connection
name.ht.
On the New Connection dialog, select File > Open. The Open dialog displays. In the File Name window,
select the saved connection file you intend to use. Click Open.
Serial Interface Operation
|
51
Page 52

4 Go to Step 9.
5 Open HyperTerminal from the computer Start menu:
Select Start > All Programs > Accessories > Communications > HyperTerminal.
The Connection Description dialog displays.
NOTE:
If the Connection Description dialog does not display when the New connection - Hyper Terminal window
opens, select File > New Connection from the File menu to open the dialog.
Figure 29. Create a Serial Connection
6 Enter a name for the connection in the Name: field. Select an icon representing the type of connection you
will use, then click OK (see Figure 29).
7 On the Connect To dialog, provide the communication details for connecting to the rPDU you intend to
remotely configure and monitor (see Figure 30).
52
|
Serial Interface Operation
Page 53

Figure 30. Define Serial Connection
8 On the Properties dialog for the port you selected, set the Port Settings values from the drop-down lists
(see Table 13).
Table 13. Serial Connection Port Settings
Port Setting Value
Baud Rate 9600
Data Bits 8
Parity None
Stop Bits 1
Flow Control None
9 The HyperTerminal session window opens for the connection you selected. The cursor is poised at the
command line to begin your session.
10 Continue to one of the following sections to configure the network settings:
“Configuring the Network with a DHCP Server” on page 54
“Configuring the Network without a DHCP Server” on page 55
Serial Interface Operation
|
53
Page 54

Configuring the Network with a DHCP Server
NOTE: The NMC automatically collects the network configuration settings (IP parameters) from the server by default.
When the NMC is not connected to the network, it continuously attempts to connect. When the connection is established,
rPDU network configuration settings become available using the CLI.
To configure a network with a DHCP server:
1 In the HyperTerminal session window, the default user name (admin) displays (see the following example).
Username: admin
Password: *****
rPDU>
2 Type admin at the password prompt. Press Enter.
3 Type network and press Enter. The Network Settings menu displays.
4 Type 2 to select Network Settings and press Enter. The Network Settings menu displays (see the following
example).
---------------------------------------------------------
---------------- Network Settings -----------------------
---------------------------------------------------------
1. Read NetworkSettings
2. Modify Network Settings
3. Set Ethernet Speed
0. Exit
Select an option ==> 1
5 At the Select an option prompt, type 1 and press Enter. The network configuration settings display (see
the following example).
------------------------------------------------------------Network configuration
------------------------------------------------------------MAC address : 00:22:19:FF:8E:13
Mode : DHCP
IP address : 166.99.224.48
Subnet mask : 255.255.255.0
Gateway : 166.99.224.1
Link Local IPv6 address : FE80::222:19FF:FEFF:8E13 /64
Global IPv6 address : 2001:720:410:100A:222:19FF:FEFF:8E13 /64
Global IPv6 address : 1789:720:410:100A:222:19FF:FFF:8E13 /64
-------------------------------------------------------------
6 Review the present configuration settings.
NOTE:
You should record the IP address that displays to use as a reference.
7 Type 0 and press Enter to exit.
8 Type 0 and press Enter again. The network connection to the rPDU internal NMC is configured and the
card is operational.
9 Network configuration is completed.
NOTE:
See Page 56 though Page 64 for an alphabetical command listing of detailed syntax, query options, and example
responses.
54
|
Serial Interface Operation
Page 55

Configuring the Network without a DHCP Server
To configure a network without a DHCP server:
1 In the HyperTerminal session window, enter admin at the User prompt, then enter admin at the password
prompt.
2 Type 2 to select Network Settings and press Enter . The Network Settings menu displays (see the following
example).
---------------------------------------------------------
---------------- Network Settings -----------------------
---------------------------------------------------------
1. Read NetworkSettings
2. Modify Network Settings
3. Set Ethernet Speed
0. Exit
Select an option ==> 2
3 At the Select an option prompt, type 2 to configure the network settings manually and press Enter. The
screen displays a series of questions (see the following example).
For each of the following questions, you can press <Return> to select
the value shown in braces, or you can enter a new value.
Should this target obtain IP settings from the network?[N] N
Static IP address [166.99.1.2]? 166.99.21.21
Static IP address is 166.99.21.21
Subnet Mask IP address [255.255.248.0]? 255.255.255.0
Subnet Mask IP address is 255.255.255.0
Gateway address IP address [166.99.17.1]? 166.99.17.1
Gateway address IP address is 166.99.17.1
Wait while your new configuration is saved.
Reset the card to enable the new configuration.
4 Follow the directions to respond to the questions displayed:
Required. Enter the static IP parameters (for IPV4 only).
For all other questions displayed, press Enter to accept the default value (shown in braces), or enter an new
value.
5 When Done displays, type 0 and press Enter to exit.
6 Type 1 and press Enter, then type 2 and press Enter to restart the NMC. The NMC restarts with the new
IP settings in approximately one minute.
7 Network configuration is completed.
NOTE:
See Page 56 though Page 64 for an alphabetical command listing of detailed syntax, query options, and example
responses.
Serial Interface Operation
|
55
Page 56

alarm command
Use this command to retrieve critical alarm thresholds for individual phases and a total of all phases. Also use
this command to set the critical alarm threshold value for individual phases (L1, L2, and L3) or for a total of all
phase lines on the rPDU.
Usage
<rPDU>alarm
<rPDU>alarm [<threshold>]]
<rPDU>alarm [<threshold> X|Y|Z]] (for three-phase models)
where:
<threshold> = 1 to the maximum current, entered as a whole number, reported as Amperage
100 to the maximum watt rating, entered as a whole number, reported as wattage
X = Phase L1
Y = Phase L2
Z = Phase L3
Retrieve the current critical alarm threshold settings for one or all rPDU phase lines
<rPDU>alarm
Example
rPDU>alarm
Alarm threshold on rPDU is 2000W
Alarm threshold on rPDU phase X is 24.0A
Alarm threshold on rPDU phase Y is 24.0A
Alarm threshold on rPDU phase Z is 24.0A
Set the threshold for the alarm level of a total of all phases on the rPDU
rPDU>alarm [<threshold>]
NOTE:
The threshold value you set should be between 1A and the maximum current on the rPDU, or between 100W and
maximum watt rating rPDU. Enter the value as a whole number.
Example
rPDU>alarm 3000
Setting alarm threshold on rPDU to 3000W
Set the threshold for the alarm level of specific phases on the rPDU
(Three-phase rPDUs only)
rPDU>alarm [<threshold> X|Y|Z]]
Example
rPDU>alarm 20 X
Setting alarm threshold on rPDU phase X to 20.0A
56
|
Serial Interface Operation
Page 57

current command
Use this command to retrieve the present current measurement for each rPDU phase line.
Usage
<rPDU>current
<rPDU>current [summary]
<rPDU>current [X|Y|Z] (for three-phase models)
<rPDU>current threshold [X|Y|Z] (for three-phase models)
where:
[summary] = Present current measurement
[X|Y|Z] rPDU phase lines:
X = Phase L1
Y = Phase L2
Z = Phase L3
Retrieve the present current measurement for each rPDU phase line (L1, L2, or L3)
rPDU>current
Example
rPDU>current
rPDU: RMS current for phase X: 0.1A.
rPDU: RMS current for phase Y: 0.2A.
rPDU: RMS current for phase Z: 0.1A.
Retrieve a summary of current measurements for each rPDU phase (L1, L2, or L3)
rPDU>current [summary]
Example
rPDU>current summary
X:0.1A,0.0A,0.0A,0.0A
Y:0.2A,0.0A,0.0A,0.0A
Z:0.3A,0.0A,0.0A,0.0A
The summary response shows the present current reading as the first value; the other three values (minimum,
NOTE:
maximum, and average) will always be reported as zero.
Retrieve a summary of current measurements for a specific rPDU phase (L1, L2, or L3)
rPDU>current [summary][X|Y|Z]
Example
rPDU>current summary X
X:0.1A,0.0A,0.0A,0.0A
Retrieve the present current measurement for a specific rPDU phase (L1, L2, or L3)
(Three-phase rPDUs only)
rPDU>current [X|Y|Z]
Example
rPDU>current X
rPDU: RMS current for phase X: 0.1A.
Serial Interface Operation
|
57
Page 58

Retrieve the present current threshold for all rPDU phases (L1, L2, or L3)
rPDU>current threshold
Example
rPDU>current threshold
rPDU: Threshold Phase X 24.0:18.0:0.0
rPDU: Threshold Phase Y 22.0:17.0:2.0
rPDU: Threshold Phase Z 22.0:17.0:2.0
Retrieve the present current threshold for a specific rPDU phase (L1, L2, or L3)
(Three-phase rPDUs only)
rPDU>current threshold [X|Y|Z]
Example
rPDU>current threshold X
rPDU: Threshold Phase X 24.0:18.0:0.0
exit command
Use this command to log out and exit the serial interface for the rPDU.
Usage
<rPDU>exit
Log out of the serial CLI
rPDU>exit
Example
rPDU>exit
Dell <rPDU model>
Copyright (c) 2010 Dell Corporation
DELL DPI 00.01.0028 August 5, 2010
Username:
where:
<rPDU model> = Dell model part number. See Table 14 for valid values.
Table 14. <rPDU model> Value Descriptions
<rPDU model> Value <rPDU model> Descriptions
1X98J PDU 208V 17.3KW 3PH 6C13 12C19 (DELLM0001)
7P35N PDU 200V 17.3KW 3PH 6C13 12C19 (DELLM001A)
09FG8 PDU 415V 22KW 3PH 18C13 12C19 (DELLM0002)
4J1C2 PDU 415V 11KW 3PH 21C13 6C19 (DELLM0003)
XX5T6 PDU 208V 17.3KW 3PH 42C13 (DELLM0004)
RXKCH PDU 200V 17.3KW 3PH 42C13 (DELLM004A)
K5YYY PDU 415V 22KW 3PH 42C13 (DELLM0005)
2CM2K PDU 208V 17.3KW 3PH 48C13 (DELLM0006)
C0G4D PDU 415V 22KW 3PH 48C13 (DELLM0007)
58
|
Serial Interface Operation
Page 59

factory_defaults command
Use this command to reset the rPDU configuration to the factory defaults.
Usage
<rPDU>factory_defaults
Reset the rPDU configuration to the factory defaults
rPDU>factory_defaults
Example
rPDU>factory_defaults
Setting configuration to defaults on rPDU.
Saving configuration to flash on rPDU... Done.
help command
Use this command to list all available rPDU CLI commands or receive detailed help on specified commands.
Usage
rPDU>help
rPDU><command> help
where:
<command> = alarm, current, exit, factory_defaults, network, power, reboot, sensors, temperature,
voltage, ver
List all available rPDU CLI commands
rPDU>help
Example
rPDU>help
Available commands:
alarm current exit factory_defaults
help network power reboot
sensors temperature voltage ver
List detailed help on a specific rPDU CLI command
rPDU><command> help
Example
rPDU>alarm help
Usage: alarm
alarm [<threshold>]]
alarm [<threshold> X|Y|Z]] (for three-phase models)
Sets the threshold for the alarm level to <threshold> on rPDU
<threshold> should be between 1A and the maximum current or 100W and maximum
watt rating.
Serial Interface Operation
|
59
Page 60

network command
Use this command to access the serial interface CLI and retrieve or modify network configuration.
Usage
rPDU>network
Access the serial interface CLI to retrieve network configuration
rPDU>network
Example
---------------------------------------------------------
---------------- Network Settings -----------------------
---------------------------------------------------------
1. Read NetworkSettings
2. Modify Network Settings
3. Set Ethernet Speed
0. Exit
Select an option ==> 1
------------------------------------------------------------Network configuration
------------------------------------------------------------MAC address : 00:22:19:FF:8E:13
Mode : DHCP
IP address : 166.99.224.48
Subnet mask : 255.255.255.0
Gateway : 166.99.224.1
Link Local IPv6 address : FE80::222:19FF:FEFF:8E13 /64
Global IPv6 address : 2001:720:410:100A:222:19FF:FEFF:8E13 /64
Global IPv6 address : 1789:720:410:100A:222:19FF:FFF:8E13 /64
-------------------------------------------------------------
Access the serial interface CLI to modify network configuration
---------------------------------------------------------
---------------- Network Settings -----------------------
---------------------------------------------------------
1. Read NetworkSettings
2. Modify Network Settings
3. Set Ethernet Speed
0. Exit
Select an option ==> 2
For each of the following questions, you can press <Return> to select
the value shown in braces, or you can enter a new value.
Should this target obtain IP settings from the network?[N] N
Static IP address [166.99.1.2]? 166.99.21.21
Static IP address is 166.99.21.21
Subnet Mask IP address [255.255.248.0]? 255.255.255.0
Subnet Mask IP address is 255.255.255.0
Gateway address IP address [166.99.17.1]? 166.99.17.1
Gateway address IP address is 166.99.17.1
Wait while your new configuration is saved.
Reset the card to enable the new configuration.
You must select 0 to exit and log in again as admin (password admin) to use other serial interface commands.
NOTE:
|
60
Serial Interface Operation
Page 61

power command
Use this command to retrieve or clear the power readings for current consumption and peak consumption watts.
Usage
rPDU>power [reset | summary]
where:
[reset] = Clears the peak consumption watts to zero
[summary] = Current consumption reading in watts (W), followed by the peak consumption power
reading in watts (W), separated by commas
Retrieve current consumption and peak consumption watts power readings
rPDU>power
Example
rPDU>power
rPDU: Power: 1.0W. Peak Consumption Watts: 2.0W.
Retrieve a summary of current consumption and peak consumption watts power readings
rPDU>power [summary]
Example
rPDU>power summary
rPDU: 1.0W,2.0W,0.0W,0.0W
NOTE:
The summary command response shows the present power as the first parameter and the peak consumption
watts as the second parameter. The minimum and average values will always be reported as zero.
Reset the peak consumption watts power readings to zero
rPDU>power [reset]
Example
rPDU>power summary
rPDU: 1.0W,2.0W,0.0W,0.0W
rPDU>power reset
rPDU:Clearing peak consumption watts to zero.
reboot command
Use this command to reboot the rPDU.
Usage
rPDU>reboot
Reboot the rPDU
rPDU>reboot
Examples
rPDU>reboot
Saving configuration to flash on rPDU ... Done ...
Username:
Serial Interface Operation
|
61
Page 62

sensors command
Use this command to retrieve values or set temperature and humidity thresholds for environment monitoring
sensors connected to an rPDU.
Usage
rPDU>sensors[name]
rPDU>sensors threshold [[name] [<thresholds>]
where:
[name] = Valid identifier for temperature sensor (T1) or humidity sensor (H1)
<thresholds> = High or low threshold values, entered in whole numbers, separated by a space
Retrieve present sensor readings for each environment monitoring sensor connected to an rPDU
rPDU>sensors
Example
rPDU>sensors
rPDU: temperature on sensor T1: 33.3C.
rPDU: humidity on sensor H1: 50%.
rPDU: dry-contact sensor D1 is opened.
rPDU: dry-contact sensor D2 is opened.
Retrieve present thresholds for all environment monitoring sensors connected to an rPDU
rPDU>sensors threshold
Example
rPDU>sensors threshold
rPDU: temperature thresholds on sensor T1: 60.0C:59.0C.
rPDU: humidity thresholds on sensor H1: 10.0%:0.0%.
The retrieved threshold value displays in a format of high value, then low value, separated by colons.
NOTE:
Retrieve present thresholds for a specific environment monitoring sensor connected to an rPDU
rPDU>sensors threshold [name]
Example
rPDU>sensors threshold T1
rPDU: temperature thresholds on sensor T1: 60.0C:59.0C.
NOTE:
The retrieved threshold value displays in a format of high value, then low value, separated by colons..
Set thresholds for a specific environment monitoring sensor connected to an rPDU
rPDU>sensors threshold[name] [<thresholds>]
The threshold values are entered in a format of high value, then low value, separated by a space.
NOTE:
Examples
rPDU>sensors threshold T1 55 50
rPDU: temperature thresholds on sensor T1: 55.0C:50.0C.
rPDU>sensors threshold H1 15 5
rPDU: humidity thresholds on sensor H1: 15.0%:5.0%.
|
62
Serial Interface Operation
Page 63

temperature command
Use this command to retrieve the present temperature reading from the environmental monitoring sensor.
Usage
rPDU>temperature
Retrieve the present temperature reading from the environmental monitoring sensor
rPDU>temperature
Example
rPDU>temperature
rPDU: Temperature: 37.0oC.
ver command
Use this command to retrieve selected equipment, software version, and ratings information for the rPDU.
Usage
rPDU>ver
Retrieve selected rPDU equipment, software version, and ratings information
rPDU>ver
Example
rPDU>ver
rPDU: Hw with <30>outlets <96> AMPs max <22000> watts max DELL DPI 00.01.0028
August 5, 2010 id model <09FG8> [(3 phases) <wye>].
where:
<outlets> = Total number of outlets, regardless of outlet type (see Table 15)
<maxcurrent> = Maximum current for the rPDU
<wattrating> = Maximum wattage rating for the rPDU
<sw> = Software version number
<model> = Dell Part Number (see Table 15)
[(3 phases) <delta|wye>] = For an rPDU with 3-phase output only, Delta or Wye configuration
Table 15. <model> and <outlets> Value Description
<model> Values <model> Descriptions <outlets> Values
1X98J PDU 208V 17.3KW 3PH 6C13 12C19 (DELLM0001) 18
7P35N PDU 200V 17.3KW 3PH 6C13 12C19 (DELLM001A) 18
09FG8 PDU 415V 22KW 3PH 18C13 12C19 (DELLM0002) 30
4J1C2 PDU 415V 11KW 3PH 21C13 6C19 (DELLM0003) 27
XX5T6 PDU 208V 17.3KW 3PH 42C13 (DELLM0004) 42
RXKCH PDU 200V 17.3KW 3PH 42C13 (DELLM004A) 42
K5YYY PDU 415V 22KW 3PH 42C13 (DELLM0005) 42
2CM2K PDU 208V 17.3KW 3PH 48C13 (DELLM0006) 48
C0G4D PDU 415V 22KW 3PH 48C13 (DELLM0007) 48
Serial Interface Operation
|
63
Page 64

voltage command
Use this command to retrieve the input voltage to the rPDU. The command response is specific to a single rPDU
and varies depending on whether the rPDU is a single-phase or three-phase model (see Table 16).
NOTE:
Voltage command query options cannot be used for single-phase rPDUs. However, query options can be used
with voltage command for three-phase rPDUs.
Table 16. Phase Line Nomenclature for Voltage Command
Voltage Nomenclature
1,2
Description
XN
RMS voltage between X and N
YN
RMS voltage between Y and N
ZN
RMS voltage between Z and N
XZ
RMS voltage between X and Z
XY
RMS voltage between X and Y
YZ
RMS voltage between Y and Z
1
Line-to-Neutral voltage will not be reported on a Delta-configured rPDU
2
Line-to-Line voltage will not be reported on a Wye-configured rPDU
L1 Line to Neutral on a Wye-configured rPDU
L2 Line to Neutral on a Wye-configured rPDU
L3 Line to Neutral on a Wye-configured rPDU
L1 Phase to Phase on a Delta-configured rPDU
L2 Phase to Phase on a Delta-configured rPDU
L3 Phase to Phase on a Delta-configured rPDU
Usage
rPDU>voltage [summary] [XN|YN|ZN|XZ|XY|YZ]]
where:
[summary] = Retrieves a summary of voltage per phase for all three phases
[XN|YN|ZN|XZ|XY|YZ] = Phase line (see Table 16)
Retrieve the present input voltage for rPDU phase lines
rPDU> voltage
Single-Phase Example
rPDU> voltage
rPDU: RMS voltage: 240V.
Three-Phase Wye Example
rPDU>voltage
rPDU: RMS voltage between X and N: 208V.
rPDU: RMS voltage between Y and N: 209V.
rPDU: RMS voltage between X and N: 207V.
Three-Phase Delta Example
rPDU>voltage
rPDU: RMS voltage between X and Z: 208V.
rPDU: RMS voltage between X and Y: 209V.
rPDU: RMS voltage between Y and Z: 207V.
|
64
Serial Interface Operation
Page 65

Retrieve the input voltage for a specific phase line (Three-phase rPDUs only)
rPDU>[XN|YN|ZN|XZ|XY|YZ]
Three-Phase Wye Example
rPDU>voltage XN
rPDU: RMS voltage between X and N: 230V.
Three-Phase Delta Example
rPDU>voltage XY
rPDU: RMS voltage between X and Y: 208V.
Retrieve a summary of the input voltage for rPDU phase lines (Three-phase rPDUs only)
rPDU>voltage [summary]
NOTE:
The summary option retrieves the voltage summary for each phase.
NOTE: The summary option response displays the present power as the first parameter and the peak consumption watts
as the second parameter. The minimum and average values will always be reported as zero.
Three-Phase Wye Example
rPDU>voltage summary
XN:229V,0V,0V,0V
YN:230V,0V,0V,0V
ZN:231V0V,0V,0V
Three-Phase Delta Example
rPDU>voltage summary
XY:208V, 0V,0V,0V.
YZ:209V, 0V,0V,0V.
XZ:207V, 0V,0V,0V.
Retrieve a summary of the input voltage for a specific phase line (Three-phase rPDUs only)
rPDU>voltage [summary] [XN|YN|ZN|XZ|XY|YZ]
Three-Phase Wye Example
rPDU>voltage summary XN
XN:229V,0V,0V,0V.
Three-Phase Delta Example
rPDU>voltage summary YZ
YZ:209V,0V,0V,0V.
Serial Interface Operation
|
65
Page 66

Web Interface Operation
This chapter describes configuring and monitoring a Dell Metered Rack Power Distribution Unit (rPDU)
remotely through the Dellt Device Power Interconnect (DPI) Web interface.
S Navigating the Web interface
S Accessing the Web interface
S Configuring DPI administration settings
S Configuring DPI attributes
S Configuring network access and control
S Monitoring and managing the rPDU
NOTE:
The Web interface language is not configurable. Only English is provided.
NOTE: The data that displays on the Web interface depends on the rPDU model you are using. The examples shown
represent typical data displays reported from a single model.
NOTE: The two most recent Microsoft Internet Explorer
Navigating the Web Interface
The Dell DPI is a graphical Web interface used to remotely monitor or configure the rPDU (see Figure 31). This
section describes the functions provided by this interface.
®
and Firefox® browser versions are currently supported.
7
Page Title
Header
Bar
Menu
Bar
Main Page
Figure 31. Navigating the Web Interface
Meter Bars
Operation Button
Dell DPI Software Version Number
Help
Button
66
|
Web Interface Operation
Page 67

Table 17 provides Web interface descriptions.
Table 17. Web Interface Descriptions
Area
Header Bar The header bar displays the Dell DPI application name and software version number.
Menu Bar The menu bar on the left panel contains links to pages for configuring the system or
Main Page As each menu link is selected, the corresponding information displays on the Main Page.
Operation Buttons and Icons Operation buttons and icons are provided to save data entries and updates. Enter data
Meter Bar Meter bars provide a visual cue of the readings for selected data. The position of the
Description
managing and monitoring the rPDU. The menu hierarchy is expandable and collapsible.
You can move the menu bar out of view using the horizontal scrolling tab at the bottom
of the page.
Click any selection in the menu bar to retrieve rPDU performance data, review
operation log information, retrieve system identification information, or enter a
configuration settings (see Figure 32). The data on the selected page is presented in
tables.
The top of the page displays the title and a Help link. Click Help on any page to see
online help for the currently displayed page.
NOTE: You can expand your view of the Main Page contents vertically using the
elevator tab on the side of the page. If you need more window viewing area, you can
resize the window to a wider or taller size.
by typing or selecting entries and clicking the associated button. Some pages have
buttons for specialized functions, such as clearing accumulated data logs. File operation
icons are also provided to save or download files.
white, vertical sliding bar indicates the present data reading. The color bar indicates
high and low operation thresholds for this parameter (example shown below).
Web Interface Operation
|
67
Page 68

Figure 32. Menu Selections
Accessing the Web Interface
The Web interface can be accessed using standard Web browsers. Up to eight users can be provided with access
to the interface, but only one administrator can be identified. Web access is enabled by default, but the
administrator can disable access for any other user.
NOTE:
The rPDU defaults to using DHCP when delivered. If you are unable to connect to the rPDU through the network
connection with this default address, change the IP address using the serial interface before using any of the network
interfaces. See “Serial Interface Operation” on page 50 for more information.
To access the Web interface:
1 Open the Web browser and navigate to the IP address of the rPDU.
2 Click the Dell logo start button to log in (see Figure 33).
Figure 33. Start Button
3 Enter a valid user name and password in the Authentication Required dialog box. Click OK to continue or
Cancel to exit.
The Home page displays with a menu bar on the left and the Summary table of present values in the Main
Page on the right.
4 Click any selection in the menu bar to open the corresponding page in the Main Page.
|
68
Web Interface Operation
Page 69

Figure 34. Login Authentication
NOTE: The default user name is admin and the default password is admin.
Configuring DPI Administration Settings
NOTE: Only the administrator can configure these options.
This section explains:
S Configuring administrator and user access and privileges
S Setting the date and time
S Setting up automatic Email notification
S Creating links to external Web sites
Configuring Administrator Access
NOTE: The default administrator user name and default password is admin.
To change the administrator user name and password:
1 From the System menu, click Configuration. The Configuration page displays.
2 Locate the Administrator User Name and Password table.
3 To change the administrator user name, enter the new password in the Administrator User Name field.
4 To change the administrator password, enter the new password in the Administrator Password field. The
characters appear as asterisks (*).
5 Enter the new password in the Confirm Administrator Password field. The characters appear as asterisks (*).
6 Click Save to apply the new user name and password.
7 This procedure is completed.
Configuring User Access
NOTE: Only the administrator can configure these settings.
NOTE: Up to eight users are allowed.
To configure access and privileges for multiple users:
1 From the System menu, click Multi-User. The Multi-User page displays.
2 Locate the Multi-User List table.
3 In the User Name field, enter the login ID to be used by this user.
4 Enter a password for the user in the Password field. The characters appear as asterisks (*).
Web Interface Operation
|
69
Page 70

5 From the Access Type list, select the user privilege. Selections are Device Access or Read Only.
6 Click Save to apply the new user name, password, and access privilege.
7 Repeat these steps to authorize additional users. When all intended user access is configured, this
procedure is completed.
Setting the Date and Time
NOTE: The default is to synchronize the date and time from the computer clock.
To set the date and time:
1 From the System menu, click Date & Time. The Date and Time page displays.
NOTE:
The Current Date and Time table displays the present system date and time.
2 In the Configure Date and Time table, choose one of the following methods:
To synchronize with computer time, go to Step 3.
To synchronize with a Network Time Protocol (NTP) server, go to Step 5.
To set the time and date manually, go to Step 9.
3 Select the Synchronize with computer time radio button. The current computer date and time displays.
4 Go to Step 10.
5 Select the Synchronize with NTP server radio button.
6 Type the NTP server address or DNS host address in the appropriate field, then select the time zone from
the list.
7 Optional. Enable Daylight Savings Time by selecting the check box.
8 Go to Step 10.
9 Select the Set manually radio button. Type the time and date in the appropriate field.
10 Optional. Select a new format in the Date Display Format list.
11 Click Save.
12 This procedure is completed.
Configuring Email Notification
NOTE: Only the administrator can configure these settings.
To configure automatic Email notification:
1 From the System menu, click Email Notification. The Email Notification page displays.
2 Locate the Email Configuration table.
3 Complete entries for attributes (see Table 18).
4 Click Save.
5 This procedure is completed.
|
70
Web Interface Operation
Page 71

Table 18 describes the attributes in the Email Configuration table.
Table 18. Email Configuration
Attribute
Mail Server OPTIONAL. You can enter the IP Address or Host name of a SMTP mail server that
DNS Address The IP address of your network. You must enter the DNS server address if you entered a
Optional SMTP Username OPTIONAL. The user name of the Simple Mail Transfer Protocol (SMTP) mail server
Optional SMTP Password OPTIONAL. The corresponding user password of the mail server.
Sender's Email Address Specifies the content of the “From” field of the Email. If you do not provide a sender's
SMTP Reply to Address The address to which the user will reply when the event mail is received.
SMTP Port Number The SMTP port number. You can enter a port number other than the standard port
Description
will be used to send Email messages from the Dell DPI.
NOTE: If entering a Host name, you are also required to enter the DNS Address.
Host name for the Mail Server.
that will be used by the Dell DPI to log into the mail server to forward Email
notifications.
Email address, the “From” field of the Email will be account@[ipv4_address] or
account@[ipv6_address].
setting for SMTP (port 25).
Identifying Email Notification Recipients
NOTE: Only the administrator can configure these settings.
To configure automatic Email notification:
1 From the System menu, click Email Notification. The Email Notification page displays.
2 Locate the Email Recipients Table.
3 Complete entries for attributes (see Table 19).
4 Click Save.
5 Optional. Click Send Test to send a test Email to the recipients according to the Mail Type setting (see
Figure 35 and Table 19).
NOTE:
If alarms and events have occurred, the event or alarm information is included in the test Email. However, if no
alarms or events have occurred, and the
information. The purpose of this test is to ensure the Email address is valid.
Send Test button is clicked only once, the Email notification will contain no
6 This procedure is completed.
Web Interface Operation
|
71
Page 72

Figure 35. Email Notification Test for Mail Type Daily Status
Table 19 describes the attributes in the Email Recipients Table.
Table 19. Email Recipients Table
Attribute
Index Index number of the entry in the table.
Mail Account Email address for the recipient of automatic notifications from the Dell DPI.
Description User-defined description for reference.
Mail Type Type of notification sent to this recipient. Selections include:
Event Level Sets the severity level of notification for Events or Events/Status mail types. (This filter
Mail Daily Report Level Sets the hour of the day the Email notification will be sent (Daily Status mail type
Description
S None – No Email notification sent.
S Events – Sends a text-only notification of any traps (no log files).
S Daily Status – Sends both the data and event logs for the past 24 hours, starting 24
hours after the recipient is set up in the system.
S Event/Status – Sends both text-only notification of any traps as well as data and
event logs for the past 24 hours.
is based on the SNMP-based traps). Selections include Critical, Major, Minor, or All.
only). Valid values are 00:00–23:00.
Creating Links to External Web Sites
NOTE: After external links are created, the link can be enabled to display at the bottom of the menu bar.
To create a link to external Web sites:
1 From the System menu, click External Links. The External Links page displays. Locate the Links Table.
2 In the Screen Text field, enter the external link name that will display at the bottom of the menu bar if the
link is enabled (limited to 31 characters).
3 In the Link Address field, enter the URL of the external link (limited to 31 characters).
NOTE:
It is not necessary to include http:// in the address. These characters are added automatically.
4 From the Status list, select either Enabled or Disabled to display the external link name at the bottom of the
menu bar.
5 This procedure is completed.
|
72
Web Interface Operation
Page 73

Configuring DPI Attributes
This section explains:
S Setting the Dell DPI system attributes
S Resetting the Dell DPI configuration to default values
S Uploading or downloading configuration files
S Configuring default file opening settings for Comma Separated Values (CSV) file formats
Setting Basic DPI Attributes
NOTE: Only the administrator can configure these settings.
To configure the Dell DPI:
1 From the System menu, click Configuration. The Configuration page displays.
2 Locate the System table.
3 Complete entries for attributes (see Table 20).
4 Click Save to apply the Dell DPI configuration settings in the System table.
5 This procedure is completed.
NOTE:
These settings are in effect until the administrator enters new data and saves the changes. The present settings
can be viewed in this table at any time.
Table 20 describes the attributes in the System table.
Table 20. System
Attribute
System Name Dell system name. Limited to 31 characters. The default value is Dell PDU.
System Contact System manager defined in MIB-II. Limited to 31 characters.
System Location System installation locality defined in MIB-II. Limited to 31 characters.
Data Log Interval (Sec) Polling time (in seconds) of the history log.
Web Refresh Rate (Sec) Web refresh rate (in seconds) of the Summary, Input, and Environment pages in the
Description
Power Management menu. Select from 4 to 10 seconds. The default value is 10
seconds.
Returning Configuration Settings to Default Values
NOTE: Only the administrator can configure these settings.
To return the configuration to default values:
1 From the System menu, click Configuration. The Configuration page displays.
2 Under Control, click the Reset to Default button.
The system is reset to the default configuration values.
3 This procedure is completed.
Web Interface Operation
|
73
Page 74

Uploading a Configuration File
To upload a configuration file:
1 From the System menu, click Configuration. The Configuration page displays.
2 Under Upload & Download, click the Browse button and browse to the configuration file you want to
upload.
3 Click the Upload Configuration button.
4 This procedure is completed.
Downloading a Configuration File
To download a configuration file:
1 From the System menu, click Configuration. The Configuration page displays.
2 Under Upload & Download, click the Download Configuration icon.
3 Does the file download dialog box display or does the file data display in the browser window?
If the dialog box displays, go to Step 4.
If the file data displays in the Browser window, go to “Configuring Default CSV File Opening Settings” on
page 75.
4 Choose to open or save the current Dell DPI configuration file and click OK (see Figure 36). Otherwise,
click
Cancel.
5 This procedure is completed.
Figure 36. File Download Dialog Box
74
|
Web Interface Operation
Page 75

Configuring Default CSV File Opening Settings
To configure default CSV file opening settings:
1 After the configuration file is downloaded a destination on your desktop, correct the default file opening
settings as follows:
S Click the My Computer icon and select Folder Options from the menu.
S Select the File Type tab and select CSV as the file type.
S Click the Advanced button, then select Open.
S Select the Confirm open after download check box.
NOTE:
Do not select the Browse in the same window option.
S Repeat the steps to correct the default file opening settings for the file type XLS.
NOTE:
After these settings are corrected, other configuration files will download properly.
2 This procedure is completed.
Configuring Network Access and Control
This section explains:
S Setting general IPv4 and IPv6 configuration options
S Enabling TCP/IP network controls
S Setting SNMP/HTTP access control
S Configuring SNMP protocol settings and trap receivers
Setting General TCP/IPv4 Configuration Options
To configure TCP/IPv4:
1 From the Network menu, click Configuration. The Network Configuration page displays.
2 Locate the General TCP/IPv4 Configuration table and enter configuration values for IPv4 (see Table 21).
3 Click Save.
4 This procedure is completed.
Web Interface Operation
|
75
Page 76

Table 21 describes the attributes in the General TCP/IPv4 Configuration table.
Table 21. General TCP/IPv4 Configuration
Attribute
IP Address IP address of the Dell DPI in dotted format. Limited to 15 characters. DHCP is the
Gateway Address IP address of the gateway in dotted format. Limited to 15 characters. Gateway
Subnet Mask Subnet mask of the Dell DPI in dotted format. Limited to 15 characters. Subnet mask
DNS Address IP address of your network DNS server. This is a required entry if you entered a Host
Description
default value.
address 192.168.1.254 is the default value.
255.255.0.0 is the default value.
name for the Mail Server in the Email Configuration table on the
Otherwise, 0.0.0.0 will be the value in the DNS Address field.
page.
Email Notification
Setting General TCP/IPv6 Configuration Options
To configure TCP/IPv6:
1 From the Network menu, click Configuration. The Network Configuration page displays.
2 Locate the General TCP/IPv6 Configuration table and enter configuration values for IPv6 (see Table 22).
3 Click Save.
4 This procedure is completed.
76
|
Web Interface Operation
Page 77

Table 22 describes the attributes in the General TCP/IPv6 Configuration table.
Table 22. General TCP/IPv6 Configuration
Attribute
Address Auto Configuration Enables or disables IPv6 address auto-configuration of the Dell DPI. If
Address Status READ ONLY. Displays the status of Dell DPI IPv6 global address as valid or invalid.
Link-Local Address READ ONLY. The IPv6 link-local address of the Dell DPI.
Global Address IPv6 global address of the Dell DPI, such as 2001:B181:2::2E0:D8FF:FEFF:8A59.
Global Prefix Length Prefix length of Dell DPI IPv6 global address.
Default Router Address IPv6 address of Dell DPI default router.
Description
auto-configuration is enabled, the DPI searches for a “Router Advertisement” message
to perform stateless auto-configuration. If no “Router Advertisement” message is found
on the same link or the same subnet, the DPI performs a stateful auto-configuration
using DHCPv6. Select Enabled or Disabled from the list.
NOTE: Always set this value to Disabled if you are configuring TCP/IPv4.
Valid status means the IPv6 global address is ensured uniquely and can be used for
network communication. If IPv6 auto-configuration is enabled and successfully
auto-configures the IPv6 global address, the status reported in this field is Valid.
If the IPv6 auto-configuration fails, or if auto-configuration is disabled and manual
configuration fails, the status reported in this field is Invalid.
NOTE: The IPv6 link-local address is always valid on the same link or subnet.
NOTE: If the prefix is 2001:B181:2::/64, the prefix length is 64. Normally, the prefix
length is limited to 0 to 64.
Enabling TCP/IP Network Controls
To configure TCP/IP network controls:
1 From the Network menu, click Control. The Network Control page displays.
2 Enter configuration values in the TCP/IP Control table (see Table 23).
3 Click Save.
4 This procedure is completed.
Web Interface Operation
|
77
Page 78

Table 23 describes the attributes in the TCP/IP Control table.
Table 23. TCP/IP Control
Attribute
BootP/DHCP Status Enable or disable the Boot Protocol (BootP)/Dynamic Host Configuration Protocol
PING Echo Enable or disable the Dell DPI to respond to Ping requests.
Network Upgrade Enable or disable the Trivial File Transfer Protocol (TFTP) upgrade control. You can
Telnet Connection Enable or disable the terminal to the server application (Telnet) control process, such as
HTTP Support Enable or disable the HTTP connection with the Dell DPI. You can configure the
Description
(DHCP) process. These protocols are used to obtain a dynamic IP address from a
BootP/DHCP server.
use the provided upgrade utility on Windows using TFTP to upgrade the Dell DPI
firmware.
telnet 192.168.1.1. You can configure the Telnet protocol to use a port number other
than the standard Telnet port (23).
HTTP protocol to use a port number other than standard HTTP port (80).
Adding and Rejecting IP Addresses for SNMP/HTTP Access Control
NOTE: The default IP address setting is 255.255.255.255.
To set and accept IP addresses:
1 From the Network menu, click Access Control. The SNMP/HTTP Access Control page displays.
2 Enter configuration values in the Access Control Table (see Table 24).
3 Select Accept from the Access Type list.
4 Click Set Value.
5 This procedure is completed.
Rejecting IP Addresses for SNMP/HTTP Access Control
To reject IP addresses:
1 From the Network menu, click Access Control. The SNMP/HTTP Access Control page displays.
2 Enter the IP address in the Access Control Table (see Table 24).
3 Select 32 for the Mask value.
NOTE:
The Valid Address Range value is generated in the field automatically when the Mask value is set.
4 Select Reject from the Access Type list.
5 Click Set Value.
6 This procedure is completed.
78
|
Web Interface Operation
Page 79

Table 24 describes the attributes in the Access Control Table.
Table 24. Access Control Table
Attribute
Index Index number of the entry in the table.
IP Address Management station's IP address. Empty value denotes entry not configured. The IP
IPv6 Only select this check box if you entered an IPv6 address.
Mask The mask bits to verify the IPv4 or IPv6 address. Select from 1–32.
Valid Address Range SYSTEM-GENERATED. The valid IP address range is set automatically when the mask
Description User-defined description string.
Access Type Accepts or rejects the entry. Selections are Accept or Reject.
Description
address is either an IPv4 or an IPv6 address.
is set.
Configuring SNMP Protocol Settings
To set SNMP protocol settings:
1 From the Network menu, click SNMP Configuration. The SNMP Configuration page displays.
2 Enter configuration values in the SNMP Protocol Settings table (see Table 25).
3 Click Save.
4 This procedure is completed.
Table 25 describes the attributes in the SNMP Protocol Settings table.
Table 25. SNMP Protocol Settings
Attribute
SNMP Status Enable or disable the SNMP connection with the Dell DPI.
SNMP UDP Port Simple Network Management Protocol (SNMP) User Datagram Protocol (UDP) port.
SNMP Version Simple Network Management Protocol (SNMP) version. Valid values are SNMPv1 and
SNMP Read Community Community name for clients allowed to access with read-only privileges. Limited to 31
SNMP Write Community Community name for clients allowed access with read-write privileges. Limited to 31
Description
You can configure the SNMP protocol to use a port number other than the standard
SNMP port (161).
SNMPv2.
characters. The characters appear as asterisks (*).
characters. The characters appear as asterisks (*).
Web Interface Operation
|
79
Page 80

Configuring SNMP Trap Receivers
To set SNMP trap receivers:
1 From the Network menu, click SNMP Configuration. The SNMP Configuration page displays.
2 Enter configuration values in the TRAP Receivers Table (see Table 26).
3 Click Save.
4 This procedure is completed.
Table 26 describes the attributes in the TRAP Receivers Table.
Table 26. TRAP Receivers Table
Attribute
Index Index number of the entry in the table.
NMS IP Address NMS station address to which the trap should be sent. The NMS address is entered in
Community Community string of the trap rPDU to be sent. Limited to 15 characters.
Trap Type Disables traps or receives traps based on Dell DPI MIB. Selections are Disabled or MIB
Severity Severity level of the trap to be received. Selections are:
Description User-defined description string for reference.
Description
dotted format. IP address can be IPv4, IPv6, or DNS host name.
Trap.
S All Traps – All traps are received.
S Minor – Minor severity traps are received.
S Major – Major severity traps are received.
S Critical – Significant traps, such as the outlet voltage over threshold, are received.
S None – No traps are received.
80
|
Web Interface Operation
Page 81

Monitoring and Managing the rPDU
This section explains:
S Viewing the present rPDU status
S Viewing rPDU and Web/SNMP card identification
S Monitoring input power statistics
S Resetting rPDU input threshold values for low, high, and critical warnings
S Managing environmental sensors
S Monitoring alarms and events
S Managing event and data logs
S Restarting the internal rPDU NMC
Viewing Present rPDU Status
NOTE: The Summary table always displays on the Main Page when the Web interface opens.
To view the present rPDU status:
1 From the Power Management menu, click Summary. The Summary page displays.
2 Review the present values for the rPDU (see Figure 37 and Table 27).
3 This procedure is completed.
Figure 37. Summary
Web Interface Operation
|
81
Page 82

Table 27 describes the attributes in the Present Values table.
Table 27. Present Values
Attribute Description
PDU Nominal Active Power (W) Calculated value of the overall input wattage of the rPDU, reported in Watts
(W). This is also called active power.
PDU Nominal Apparent Power (VA) Calculated value of the overall input volt-amperes (VA) of the rPDU. This is also
called apparent power.
PDU Total Rating Current (A) Present current measured at 3 f input of the rPDU, reported in amperes (A).
Viewing rPDU and Web/SNMP Card Identification
To view rPDU and Web/SNMP card identification:
1 From the System menu, click Identification. The Identification page displays.
2 Review the PDU Identification table and review the Web/SNMP Card Identification table (see Figure 38).
3 This procedure is completed.
Figure 38. Identification
|
82
Web Interface Operation
Page 83

Viewing rPDU System Information
To view rPDU system information:
1 From the Power Management menu, click Information. The Information page displays.
2 Review the Present Values table (see Figure 39).
3 This procedure is completed.
Figure 39. PDU Information
Monitoring Input Statistics
To view input readings or change rPDU warning thresholds:
1 From the Power Management menu, click Input. The Input page displays.
2 Review the present input values for the rPDU, input power statistics, and input thresholds (see Table 28
and Figure 40).
NOTE:
If you reset values for power statistics, you must click Reset before leaving this screen or the change will not be
preserved. If you change input threshold values, you must click Save to save your changes (see Table 28).
3 This procedure is completed.
Table 28 describes the attributes in the Input Statistics tables.
Table 28. Input Statistics
Table Attribute Description
Present Values
(Phase 1, Phase 2,
and Phase 3)
PDU Input Voltage (V) Present voltage reading for Phase 1, Phase 2, and Phase
3, displayed in Volts (V).
PDU Input Current (A) Present current reading for Phase 1, Phase 2, and Phase
3, displayed in Amps (A). A meter bar provides a visual
representation of the reading.
PDU Over Current State Present current reading compared to the value set as the
over current warning threshold. Either no threshold is
triggered, or the threshold has been surpassed.
Present Values
PDU Input Frequency (Hz) Present frequency measured at the input of the rPDU.
PDU Input Active Power (W) Calculated value of the overall input wattage of the
rPDU, reported in Watts (W). A meter bar provides a
visual representation of the reading.
PDU Input Apparent Power (VA) Calculated value of the overall input volt-amperes (VA)
of the rPDU.
Web Interface Operation
|
83
Page 84

Table 28. Input Statistics (Fortsetzung)
Attribute DescriptionTable
PDU Input Remaining Active Power (W) Provides the watts capacity remaining.
PDU Overload State Present total watts (W) reading for all three phases is
Input Power
Statistics
Input Thresholds Phase 1 Current Thresholds (A)
PDU Input Peak Headroom Watts
(Values provided for Watts and Time)
PDU Input Peak Consumption Watts
(Values provided for Watts and Time)
PDU Input Cumulative kWh
(Values provided for Watts and Time)
Phase 2 Current Thresholds (A)
Phase 3 Current Thresholds (A)
NOTE: When the rPDU is in an overload state, this value
is always 0.
compared to the value configured as the overload alarm
threshold. Either no threshold is triggered, or the
threshold has been surpassed.
Provides the remaining watts available to support the
load at peak demand. Provides a time and date stamp of
the most recent data update. Click Reset to clear this
value to the maximum value for this model and reset the
time to the present time.
Provides the peak power demand on the rPDU. Provides
a time and date stamp of the most recent data update.
Click Reset to clear this value to zero (0) and reset the
time to the present time.
Provides the total kWh usage. Provides a time and date
stamp of the most recent data update.
NOTE: This value accumulates. If this value reaches the
maximum value for a 32-bit number, do not reset.
Click Reset to clear this value to zero (0) and reset the
time to the present time.
Low Warning: Causes an alarm when the input current
amperage (A) reading falls below the low warning
threshold value displayed in the table.
High Warning: Causes an alarm when the input current
amperage (A) reading exceeds the high warning
threshold value displayed in the table.
High Critical: Causes an alarm when the input current
amperage (A) reading exceeds the high critical threshold
value displayed in the table.
Low Warning: Causes an alarm when the input current
amperage (A) reading falls below the low warning
threshold value displayed in the table.
High Warning: Causes an alarm when the input current
amperage (A) reading exceeds the high warning
threshold value displayed in the table.
84
|
Web Interface Operation
Page 85

Table 28. Input Statistics (Fortsetzung)
Attribute DescriptionTable
High Critical: Causes an alarm when the input current
amperage (A) reading exceeds the high critical threshold
value displayed in the table.
Input Thresholds Load Thresholds (W) For Phase 1, Phase 2, or Phase 3: Causes an alarm when
the total watts (W) reading for all three phases exceeds
the overload warning threshold value displayed in the
table.
NOTE: If you correct any threshold values in this table, click Save to save your changes.
Figure 40. Input
Web Interface Operation
|
85
Page 86

The meter bar colors on the Input page represent the following:
S Blue – The current reading for L1, L2, or L3 is below the low current warning threshold value that displays
in the Low warning field, or the overall rPDU input wattage reading is below the load threshold value in the
Low warning field.
S Green – The current reading is within the range of tolerance and no threshold has been triggered.
S Yellow – The current reading for L1, L2, or L3 is above the current warning threshold value that displays in
the High warning field, or the overall rPDU input wattage reading is above the load threshold value in the
High warning field.
S Red – The current reading for L1, L2, or L3 is above the current critical alarm threshold value that displays
in the High critical field, or the overall rPDU input wattage reading is above the load threshold value in the
High critical field.
Managing Environment Sensors
To view readings or change warning thresholds for environment sensors:
1 From the Power Management menu, click Environment. The Environment page displays.
2 Review the present values for all sensors connected to the rPDU (see Table 29 and Figure 41).
NOTE:
If a sensor is not connected to the rPDU, a “Non-active” value displays.
NOTE: If you change any sensor threshold values, you must click Save to save your changes (see Table 29).
3 This procedure is completed.
Table 29 describes the attributes in the Environment tables.
Table 29. Environment
Table Attribute Description
Present Values
Sensor Name
Temperature (°C) Displays the temperature in °C on the Temperature
screen. A meter bar provides a visual representation of
the reading.
Humidity (%) Displays the humidity percentage on the Humidity
screen. A meter bar provides a visual representation of
the reading.
Over Temperature State The current temperature compared to the value
configured as the temperature threshold. Either no
threshold is triggered, or the threshold has been
surpassed.
Under Humidity State The current humidity compared to the value configured
as the under-humidity threshold. Either no threshold is
triggered, or the threshold has been surpassed.
Dry Contact 1 State The present state of dry contact 1. Either the dry contact
is Normally Closed, Normally Open, or Non-active.
Dry Contact 2 State The present state of dry contact 2. Either the dry contact
is Normally Closed, Normally Open, or Non-active.
Temperature & Humidity Sensor The user-defined sensor name.
Dry Contact 1 The user-defined dry contact 1 sensor name.
Dry Contact 2 The user-defined dry contact 2 sensor name.
86
|
Web Interface Operation
Page 87

Table 29. Environment (Fortsetzung)
Attribute DescriptionTable
Sensor Thresholds
NOTE: If you correct any threshold values in this table, click Save to save your changes.
Temperature Thresholds (°C) High Warning, High Critical Alarm: Temperature (°C)
threshold setting in the range of 0.0–65.0 values. The
Hysteresis Value displays (read-only).
Humidity Thresholds (%) Low Warning, Low Critical Alarm: Humidity.
percentage
The Hysteresis Value displays (read-only)
Dry Contact The operation setting for Dry Contact 1 or Dry Contact 2.
Selections are Normally Closed or Normally Open.
threshold setting in the range of 0.0–95.0.
Figure 41. Environment
Web Interface Operation
|
87
Page 88

The meter bar colors on the Environment page represent the following:
S Green – The temperature or humidity reading is within the range of tolerance and no threshold has been
triggered.
S Yellow – The temperature reading is above the high temperature warning threshold value that displays in
the the High warning field, or the humidity reading is below the low humidity warning level threshold value
that displays in the Low warning field.
S Red – The temperature reading is above the high temperature alarm threshold value that displays in the
High critical field, or the humidity reading is below the low humidity alarm threshold value that displays in
the Low critical field.
Viewing Present Alarms and Events
NOTE: The Alarm/Event Table provides the number of active alarms, the ID of the active alarm or event number, the time
the alarm occurred, and an alarm description.
To view present alarms and events:
1 From the Power Management menu, click Alarm/Event Table. The Alarm/Event Table page displays.
2 Review the present alarms and events for the rPDU.
3 This procedure is completed.
Viewing Event and Data logs
NOTE: The logs list all entries that have occurred since the table was cleared. The accumulated entries are overwritten
when a maximum of 50 entries are collected. The logs can also be cleared manually with the
selection.
Save
Logs menu bar Clear and
To view event and data logs:
1 From the Logs menu, click the link for the type of log you want to review:
S NMC Event – Lists the NMC events that occurred in the specified date range, including a description
and the date and time the event occurred.
S PDU Event – Lists the events that occurred in the specified date range, including a description and
the date and time the event occurred.
S Data log – Provides a comprehensive snap-shot of all fundamental Dell DPI parameters by date and
time stamp.
NOTE:
The data collection interval for these measurements can be changed by selecting Configuration from the System
menu and modifying the Data Log Interval setting.
2 In the log event list that displays for your selection, click the link for the selected date range you want to
review.
3 This procedure is completed.
88
|
Web Interface Operation
Page 89

Clearing Logs
NOTE: Logs are overwritten automatically when a maximum of 50 entries are collected. Use this option if you choose to
clear a log or logs before this maximum is reached.
To clear logs:
1 From the Logs menu bar, click Clear & Save. The Clear and Save page displays.
2 Under Clear Log Data, click one of the following buttons to clear the accumulated entries in the log:
S Clear Data Log
S Clear NMC Event Log
S Clear PDU Event Log
3 A dialog box message prompts: Are you sure? Click OK or Cancel.
4 This procedure is completed.
Saving Logs to an External File
NOTE: The logs are saved to your computer as a spreadsheet in CSV format.
To save logs to an external file:
1 From the Logs menu bar, click Clear & Save. The Clear and Save page displays.
2 Under Save Log Data, click the icon for the type of log you want to save:
S Data Log
S NMC Event Log
S PDU Event Log
3 Does the file download dialog box display or does the file data display in the browser window?
If the dialog box displays, go to Step 4.
If the file data displays in the Browser window, go to “Configuring Default CSV File Opening Settings” on
page 75.
4 Choose to open or save the current log file and click OK or Cancel (see Figure 42).
5 This procedure is completed.
Figure 42. File Download Dialog Box
Web Interface Operation
|
89
Page 90

Restarting the Internal rPDU NMC
To restart the rPDU NMC:
1 From the System menu, click Configuration. The Configuration page displays.
2 Under Control, click the Restart NMC button. The NMC restarts.
3 This procedure is completed.
90
|
Web Interface Operation
 Loading...