

Page 1
Software
®
User’s Guide
INK
L
EATHER
W
For Windows
Version 4.0
Product #7862
™
0
0
Page 2

This equipment has been tested and found to comply with the limits for a Class B digital
device, pursuant to Part 15 of the FCC Rules. These limits are designed to provide reasonable
protection against harmful interference in a residential installation. This equipment generates, uses and can radiate radio frequency energy and, if not installed and used in accordance
with the instructions, may cause harmful interference to radio communications. However,
there is no guarantee that interference will not occur in a particular installation. If this equipment does cause harmful interference to radio or television reception, which can be determined by turning the equipment on and off, the user is encouraged to try to correct the
interference by one or more of the following measures:
• Reorient or relocate the receiving antenna.
• Increase the separation between the equipment and receiver.
• Connect the equipment into an outlet on a circuit different from that to which the
receiver is connected.
• Consult the dealer or an experienced radio/TV technician for help.
Changes or modifications not expressly approved in writing by Davis Instruments may void
the user's authority to operate this equipment.
Product Number: 7862
Davis Instruments Part Number: 7395-121
Weatherlink®, Version 4.0 for Windows
Rev. C Manual (July 16, 1999)
© Davis Instruments Corp. 1998. All rights reserved.
This product complies with the essential protection requirements of the
EC EMC Directive 89/336/EC
Weather Monitor II, Weather W izar d III, Weather Wizard II-s, Per ception
II, and Weatherlink are registered trademarks of Davis Instruments
Corp. Hayes is a registered trademark of Hayes Microcomputer
Products, Inc. Windows is a trademark of Microsoft Corporation.
Page 3

Software
®
User’s Guide
INK
L
EATHER
W
For Windows 0
Version 4.0
0
0
Page 4

T
ABLE OF CONTENTS
ABLE OF CONTENTS
T
I
NTRODUCTION
Contents of Package . . . . . . . . . . . . . . . . . . . . . . . . . . . . . . . . . . . . . . . . . . 1
Optional Accessories . . . . . . . . . . . . . . . . . . . . . . . . . . . . . . . . . . . . . . . . . . 1
ARDWARE INSTALLATION
H
Hardware Requirements . . . . . . . . . . . . . . . . . . . . . . . . . . . . . . . . . . . . . . . 3
Direct Connection Hardware Requirements . . . . . . . . . . . . . . . . . . . . . . . 3
Phone Modem Connection Hardware Requirements . . . . . . . . . . . . . . . . 3
Direct Connection. . . . . . . . . . . . . . . . . . . . . . . . . . . . . . . . . . . . . . . . . . . . . 4
Typical Direct Connection. . . . . . . . . . . . . . . . . . . . . . . . . . . . . . . . . . . . . 4
Direct Connection Installation. . . . . . . . . . . . . . . . . . . . . . . . . . . . . . . . . . 5
Phone Modem Connection . . . . . . . . . . . . . . . . . . . . . . . . . . . . . . . . . . . . . . 6
Typical Phone Modem Installation . . . . . . . . . . . . . . . . . . . . . . . . . . . . . . 6
Phone Modem Installation Instructions. . . . . . . . . . . . . . . . . . . . . . . . . . . 6
A Few Notes About Phone Modem Connections. . . . . . . . . . . . . . . . . . . . 8
OFTWARE INSTALLATION AND SETUP
S
Installing the Software . . . . . . . . . . . . . . . . . . . . . . . . . . . . . . . . . . . . . . . . 9
Running the Software . . . . . . . . . . . . . . . . . . . . . . . . . . . . . . . . . . . . . . . . . 9
Adding a Station . . . . . . . . . . . . . . . . . . . . . . . . . . . . . . . . . . . . . . . . . . . . . 9
Adding a Station . . . . . . . . . . . . . . . . . . . . . . . . . . . . . . . . . . . . . . . . . . . . 9
About the Walkthrough. . . . . . . . . . . . . . . . . . . . . . . . . . . . . . . . . . . . . . 10
Finding the Correct Serial Port. . . . . . . . . . . . . . . . . . . . . . . . . . . . . . . . . . 12
U
SING
Weather Station Models. . . . . . . . . . . . . . . . . . . . . . . . . . . . . . . . . . . . . . . 13
Multiple Stations . . . . . . . . . . . . . . . . . . . . . . . . . . . . . . . . . . . . . . . . . . . . 13
The Toolbar . . . . . . . . . . . . . . . . . . . . . . . . . . . . . . . . . . . . . . . . . . . . . . . . 14
File Menu . . . . . . . . . . . . . . . . . . . . . . . . . . . . . . . . . . . . . . . . . . . . . . . . . . 14
S
THE
OFTWARE
New Station . . . . . . . . . . . . . . . . . . . . . . . . . . . . . . . . . . . . . . . . . . . . . . 15
Open Station . . . . . . . . . . . . . . . . . . . . . . . . . . . . . . . . . . . . . . . . . . . . . . 15
Delete Station . . . . . . . . . . . . . . . . . . . . . . . . . . . . . . . . . . . . . . . . . . . . . 16
Download . . . . . . . . . . . . . . . . . . . . . . . . . . . . . . . . . . . . . . . . . . . . . . . . 16
View Log . . . . . . . . . . . . . . . . . . . . . . . . . . . . . . . . . . . . . . . . . . . . . . . . . 17
Print . . . . . . . . . . . . . . . . . . . . . . . . . . . . . . . . . . . . . . . . . . . . . . . . . . . . 18
Close. . . . . . . . . . . . . . . . . . . . . . . . . . . . . . . . . . . . . . . . . . . . . . . . . . . . 18
Hang Up . . . . . . . . . . . . . . . . . . . . . . . . . . . . . . . . . . . . . . . . . . . . . . . . . 18
Exit . . . . . . . . . . . . . . . . . . . . . . . . . . . . . . . . . . . . . . . . . . . . . . . . . . . . . 18
i
Page 5

T
C
ABLE
OF
ONTENTS
Setup Menu . . . . . . . . . . . . . . . . . . . . . . . . . . . . . . . . . . . . . . . . . . . . . . . . 18
Walkthrough . . . . . . . . . . . . . . . . . . . . . . . . . . . . . . . . . . . . . . . . . . . . . . 18
Station Config . . . . . . . . . . . . . . . . . . . . . . . . . . . . . . . . . . . . . . . . . . . . . 19
Serial Port . . . . . . . . . . . . . . . . . . . . . . . . . . . . . . . . . . . . . . . . . . . . . . . . 20
Select Units. . . . . . . . . . . . . . . . . . . . . . . . . . . . . . . . . . . . . . . . . . . . . . . 22
Set Time . . . . . . . . . . . . . . . . . . . . . . . . . . . . . . . . . . . . . . . . . . . . . . . . . 23
Set Archive Interval. . . . . . . . . . . . . . . . . . . . . . . . . . . . . . . . . . . . . . . . . 24
Set Barometer. . . . . . . . . . . . . . . . . . . . . . . . . . . . . . . . . . . . . . . . . . . . . 24
Set Rain Cal. . . . . . . . . . . . . . . . . . . . . . . . . . . . . . . . . . . . . . . . . . . . . . . 25
Set Temp Cal. . . . . . . . . . . . . . . . . . . . . . . . . . . . . . . . . . . . . . . . . . . . . . 25
Set Hum Cal. . . . . . . . . . . . . . . . . . . . . . . . . . . . . . . . . . . . . . . . . . . . . . . 26
Set Total Rain . . . . . . . . . . . . . . . . . . . . . . . . . . . . . . . . . . . . . . . . . . . . . 27
Set Alarms. . . . . . . . . . . . . . . . . . . . . . . . . . . . . . . . . . . . . . . . . . . . . . . . 28
Clear . . . . . . . . . . . . . . . . . . . . . . . . . . . . . . . . . . . . . . . . . . . . . . . . . . . . 28
Auto Clear . . . . . . . . . . . . . . . . . . . . . . . . . . . . . . . . . . . . . . . . . . . . . . . . 30
Auto Download . . . . . . . . . . . . . . . . . . . . . . . . . . . . . . . . . . . . . . . . . . . . 31
Auto Fax . . . . . . . . . . . . . . . . . . . . . . . . . . . . . . . . . . . . . . . . . . . . . . . . . 32
Reports Menu. . . . . . . . . . . . . . . . . . . . . . . . . . . . . . . . . . . . . . . . . . . . . . . 34
Printing Reports . . . . . . . . . . . . . . . . . . . . . . . . . . . . . . . . . . . . . . . . . . . 34
NOAA Setup. . . . . . . . . . . . . . . . . . . . . . . . . . . . . . . . . . . . . . . . . . . . . . . 34
NOAA This Month . . . . . . . . . . . . . . . . . . . . . . . . . . . . . . . . . . . . . . . . . . 35
NOAA Summarize Month. . . . . . . . . . . . . . . . . . . . . . . . . . . . . . . . . . . . . 36
NOAA This Year . . . . . . . . . . . . . . . . . . . . . . . . . . . . . . . . . . . . . . . . . . . . 39
NOAA Summarize Year . . . . . . . . . . . . . . . . . . . . . . . . . . . . . . . . . . . . . . 39
Yearly Rainfall. . . . . . . . . . . . . . . . . . . . . . . . . . . . . . . . . . . . . . . . . . . . . 44
Degree-Days . . . . . . . . . . . . . . . . . . . . . . . . . . . . . . . . . . . . . . . . . . . . . . 45
Temp/Hum Hours . . . . . . . . . . . . . . . . . . . . . . . . . . . . . . . . . . . . . . . . . . 46
Soil Temp. Hours. . . . . . . . . . . . . . . . . . . . . . . . . . . . . . . . . . . . . . . . . . . 48
Chilling Requirement. . . . . . . . . . . . . . . . . . . . . . . . . . . . . . . . . . . . . . . . 50
Sunrise & Sunset. . . . . . . . . . . . . . . . . . . . . . . . . . . . . . . . . . . . . . . . . . . 51
Windows Menu . . . . . . . . . . . . . . . . . . . . . . . . . . . . . . . . . . . . . . . . . . . . . 53
Bulletin . . . . . . . . . . . . . . . . . . . . . . . . . . . . . . . . . . . . . . . . . . . . . . . . . . 54
Browse . . . . . . . . . . . . . . . . . . . . . . . . . . . . . . . . . . . . . . . . . . . . . . . . . . 55
Plot . . . . . . . . . . . . . . . . . . . . . . . . . . . . . . . . . . . . . . . . . . . . . . . . . . . . . 56
Strip Charts. . . . . . . . . . . . . . . . . . . . . . . . . . . . . . . . . . . . . . . . . . . . . . . 56
Summary. . . . . . . . . . . . . . . . . . . . . . . . . . . . . . . . . . . . . . . . . . . . . . . . . 58
Using the Browse Window. . . . . . . . . . . . . . . . . . . . . . . . . . . . . . . . . . . . . 59
Choose Date . . . . . . . . . . . . . . . . . . . . . . . . . . . . . . . . . . . . . . . . . . . . . . 59
Make a Note . . . . . . . . . . . . . . . . . . . . . . . . . . . . . . . . . . . . . . . . . . . . . . 60
Edit a Record. . . . . . . . . . . . . . . . . . . . . . . . . . . . . . . . . . . . . . . . . . . . . . 61
Delete a Record. . . . . . . . . . . . . . . . . . . . . . . . . . . . . . . . . . . . . . . . . . . . 62
Copy Records . . . . . . . . . . . . . . . . . . . . . . . . . . . . . . . . . . . . . . . . . . . . . 62
Export Records . . . . . . . . . . . . . . . . . . . . . . . . . . . . . . . . . . . . . . . . . . . . 63
Delete Records . . . . . . . . . . . . . . . . . . . . . . . . . . . . . . . . . . . . . . . . . . . . 64
ii
Page 6

T
Using the Plot Window. . . . . . . . . . . . . . . . . . . . . . . . . . . . . . . . . . . . . . . . 65
Adding and Removing Variables. . . . . . . . . . . . . . . . . . . . . . . . . . . . . . . 66
Choose Specific Date . . . . . . . . . . . . . . . . . . . . . . . . . . . . . . . . . . . . . . . 66
Scroll Through Dates. . . . . . . . . . . . . . . . . . . . . . . . . . . . . . . . . . . . . . . . 67
Choose Plot Span . . . . . . . . . . . . . . . . . . . . . . . . . . . . . . . . . . . . . . . . . . 67
Enter Plot Title. . . . . . . . . . . . . . . . . . . . . . . . . . . . . . . . . . . . . . . . . . . . . 68
Choose Axis Information. . . . . . . . . . . . . . . . . . . . . . . . . . . . . . . . . . . . . 68
Choose Line/Bar . . . . . . . . . . . . . . . . . . . . . . . . . . . . . . . . . . . . . . . . . . . 68
Set Axis Min/Max . . . . . . . . . . . . . . . . . . . . . . . . . . . . . . . . . . . . . . . . . . 69
Lock Axis. . . . . . . . . . . . . . . . . . . . . . . . . . . . . . . . . . . . . . . . . . . . . . . . . 69
Pause Plot Calculation . . . . . . . . . . . . . . . . . . . . . . . . . . . . . . . . . . . . . . 69
View Database Information. . . . . . . . . . . . . . . . . . . . . . . . . . . . . . . . . . . 69
View Details . . . . . . . . . . . . . . . . . . . . . . . . . . . . . . . . . . . . . . . . . . . . . . 70
Zoom In/Out . . . . . . . . . . . . . . . . . . . . . . . . . . . . . . . . . . . . . . . . . . . . . . 70
Plotting Data From More than One Date (Overlay) . . . . . . . . . . . . . . . . . 71
Plotting Data from the Previous Year (Last Year) . . . . . . . . . . . . . . . . . . 72
Clear Entire Plot . . . . . . . . . . . . . . . . . . . . . . . . . . . . . . . . . . . . . . . . . . . 72
Saving and Opening Plots and Plot Templates . . . . . . . . . . . . . . . . . . . . 72
Plot Menu . . . . . . . . . . . . . . . . . . . . . . . . . . . . . . . . . . . . . . . . . . . . . . . . 73
Colors Menu . . . . . . . . . . . . . . . . . . . . . . . . . . . . . . . . . . . . . . . . . . . . . . 75
Using the Strip Charts . . . . . . . . . . . . . . . . . . . . . . . . . . . . . . . . . . . . . . . . 76
Open Strip Chart Window . . . . . . . . . . . . . . . . . . . . . . . . . . . . . . . . . . . . 77
Add Variable . . . . . . . . . . . . . . . . . . . . . . . . . . . . . . . . . . . . . . . . . . . . . . 77
Remove Variable. . . . . . . . . . . . . . . . . . . . . . . . . . . . . . . . . . . . . . . . . . . 77
Change Axis Information. . . . . . . . . . . . . . . . . . . . . . . . . . . . . . . . . . . . . 77
Change Plot Span . . . . . . . . . . . . . . . . . . . . . . . . . . . . . . . . . . . . . . . . . . 77
View Historical Data . . . . . . . . . . . . . . . . . . . . . . . . . . . . . . . . . . . . . . . . 78
Place the Strip Chart Into Auto Update Mode . . . . . . . . . . . . . . . . . . . . . 78
View Database Information. . . . . . . . . . . . . . . . . . . . . . . . . . . . . . . . . . . 78
View Details . . . . . . . . . . . . . . . . . . . . . . . . . . . . . . . . . . . . . . . . . . . . . . 78
Saving a Strip Chart Template. . . . . . . . . . . . . . . . . . . . . . . . . . . . . . . . 78
Opening a Previously Saved Strip Chart Template . . . . . . . . . . . . . . . . . 79
Strip Chart Menu. . . . . . . . . . . . . . . . . . . . . . . . . . . . . . . . . . . . . . . . . . . 79
Colors Menu . . . . . . . . . . . . . . . . . . . . . . . . . . . . . . . . . . . . . . . . . . . . . . 80
Using the Yearly Rainfall Database . . . . . . . . . . . . . . . . . . . . . . . . . . . . . . 80
Viewing the Yearly Rainfall Database . . . . . . . . . . . . . . . . . . . . . . . . . . . 81
Editing Yearly Rainfall Data. . . . . . . . . . . . . . . . . . . . . . . . . . . . . . . . . . . 82
Deleting Data . . . . . . . . . . . . . . . . . . . . . . . . . . . . . . . . . . . . . . . . . . . . . 83
Start a New Rainfall Database . . . . . . . . . . . . . . . . . . . . . . . . . . . . . . . . 84
Degree-Days. . . . . . . . . . . . . . . . . . . . . . . . . . . . . . . . . . . . . . . . . . . . . . . . 84
Adding a Degree-Day Total. . . . . . . . . . . . . . . . . . . . . . . . . . . . . . . . . . . 85
Opening a Degree-Days Total. . . . . . . . . . . . . . . . . . . . . . . . . . . . . . . . . 88
Deleting a Degree-Day Total. . . . . . . . . . . . . . . . . . . . . . . . . . . . . . . . . . 89
PC Degree-Day Report . . . . . . . . . . . . . . . . . . . . . . . . . . . . . . . . . . . . . . 89
ABLE
OF
C
ONTENTS
iii
Page 7

T
ABLE
OF
C
ONTENTS
T
ECHNICAL
R
EFERENCE
Archive Memory vs. Database . . . . . . . . . . . . . . . . . . . . . . . . . . . . . . . . . . 91
Archive Memory . . . . . . . . . . . . . . . . . . . . . . . . . . . . . . . . . . . . . . . . . . . 91
Database. . . . . . . . . . . . . . . . . . . . . . . . . . . . . . . . . . . . . . . . . . . . . . . . . 91
Automatic Download . . . . . . . . . . . . . . . . . . . . . . . . . . . . . . . . . . . . . . . . . 92
Automatic Clear. . . . . . . . . . . . . . . . . . . . . . . . . . . . . . . . . . . . . . . . . . . . . 92
Calibration Numbers . . . . . . . . . . . . . . . . . . . . . . . . . . . . . . . . . . . . . . . . . 93
Database Organization. . . . . . . . . . . . . . . . . . . . . . . . . . . . . . . . . . . . . . . . 93
Station Directory . . . . . . . . . . . . . . . . . . . . . . . . . . . . . . . . . . . . . . . . . . . 93
Station Configuration File . . . . . . . . . . . . . . . . . . . . . . . . . . . . . . . . . . . . 94
Database Files. . . . . . . . . . . . . . . . . . . . . . . . . . . . . . . . . . . . . . . . . . . . . 94
Weather Data Calculations. . . . . . . . . . . . . . . . . . . . . . . . . . . . . . . . . . . . . 95
Temperature . . . . . . . . . . . . . . . . . . . . . . . . . . . . . . . . . . . . . . . . . . . . . . 95
High and Low Temperature. . . . . . . . . . . . . . . . . . . . . . . . . . . . . . . . . . . 95
Barometric Pressure . . . . . . . . . . . . . . . . . . . . . . . . . . . . . . . . . . . . . . . . 95
Wind Speed. . . . . . . . . . . . . . . . . . . . . . . . . . . . . . . . . . . . . . . . . . . . . . . 95
High Wind Speed. . . . . . . . . . . . . . . . . . . . . . . . . . . . . . . . . . . . . . . . . . . 95
Wind Direction. . . . . . . . . . . . . . . . . . . . . . . . . . . . . . . . . . . . . . . . . . . . . 95
Temperature/Humidity Index. . . . . . . . . . . . . . . . . . . . . . . . . . . . . . . . . . 96
Wind Chill . . . . . . . . . . . . . . . . . . . . . . . . . . . . . . . . . . . . . . . . . . . . . . . . 96
Dew Point . . . . . . . . . . . . . . . . . . . . . . . . . . . . . . . . . . . . . . . . . . . . . . . . 96
Rainfall . . . . . . . . . . . . . . . . . . . . . . . . . . . . . . . . . . . . . . . . . . . . . . . . . . 97
Degree-Days . . . . . . . . . . . . . . . . . . . . . . . . . . . . . . . . . . . . . . . . . . . . . . 97
Chilling Requirement. . . . . . . . . . . . . . . . . . . . . . . . . . . . . . . . . . . . . . . . 97
Soil Temperature Hours . . . . . . . . . . . . . . . . . . . . . . . . . . . . . . . . . . . . . 98
Temperature/Humidity Hours . . . . . . . . . . . . . . . . . . . . . . . . . . . . . . . . . 98
Air Density. . . . . . . . . . . . . . . . . . . . . . . . . . . . . . . . . . . . . . . . . . . . . . . . 98
Equilibrium Moisture Content (EMC) . . . . . . . . . . . . . . . . . . . . . . . . . . . . 98
Bad Data . . . . . . . . . . . . . . . . . . . . . . . . . . . . . . . . . . . . . . . . . . . . . . . . . 98
Modem String . . . . . . . . . . . . . . . . . . . . . . . . . . . . . . . . . . . . . . . . . . . . . . 99
Station Modem Initialization String. . . . . . . . . . . . . . . . . . . . . . . . . . . . . 99
Auto Fax Modem Initialization String . . . . . . . . . . . . . . . . . . . . . . . . . . . 99
Command Line Options . . . . . . . . . . . . . . . . . . . . . . . . . . . . . . . . . . . . . . 100
Importing WeatherLink Data into Other Programs. . . . . . . . . . . . . . . . . . 101
Leap Year Correction . . . . . . . . . . . . . . . . . . . . . . . . . . . . . . . . . . . . . . . . 101
Computer Keeps Track of Leap Years. . . . . . . . . . . . . . . . . . . . . . . . . . 101
Computer Does Not Keep Track of Leap Years . . . . . . . . . . . . . . . . . . . 102
Backing Up and Restoring Data. . . . . . . . . . . . . . . . . . . . . . . . . . . . . . . . 102
Comprehensive Backup. . . . . . . . . . . . . . . . . . . . . . . . . . . . . . . . . . . . . 102
Individual Month Backup. . . . . . . . . . . . . . . . . . . . . . . . . . . . . . . . . . . . 102
Restoring Data. . . . . . . . . . . . . . . . . . . . . . . . . . . . . . . . . . . . . . . . . . . . 102
iv
Page 8

T
C
ABLE
OF
ONTENTS
T
ROUBLESHOOTING
G
UIDE
Communications Problems . . . . . . . . . . . . . . . . . . . . . . . . . . . . . . . . . . . 103
Program Problems . . . . . . . . . . . . . . . . . . . . . . . . . . . . . . . . . . . . . . . . . . 103
AutoFax Troubleshooting. . . . . . . . . . . . . . . . . . . . . . . . . . . . . . . . . . . . . 105
Changing Windows Communications Driver. . . . . . . . . . . . . . . . . . . . . 106
v
Page 9

T
ABLE
OF
C
ONTENTS
vi
Page 10

1
NTRODUCTION
I
Welcome to Davis Instruments’ WeatherLink Software! The WeatherLink Data
Logger (referred to as the WeatherLink in this manual) and software allows you to
connect your personal computer to Davis weather stations to store, view, plot,
analyze, export, and print weather data collected by your Davis station.
ONTENTS OF PACKAGE
C
Before proceeding, please check to make sure your WeatherLink package contains
the following:
▲
WeatherLink Data Logger
Includes 8’ (2.4 m) cable to connect the WeatherLink to your computer and a
3" (8 mm) cable to connect the WeatherLink to the weather station.
▲
PC COM Port Adapters (9-pin and 25-pin)
Use the 9-pin adapter to connect the WeatherLink to a 9-pin serial port. Use
the 25-pin adapter to connect the WeatherLink to a 25-pin serial port.
▲
Loopback connector
The loopback connector is a short piece of cable with a phone plug at one end
and a red plastic cap at the other . The loopback connector can be used to deter mine what serial ports are available for the WeatherLink and for troubleshooting communications problems.
▲
WeatherLink Software Diskette
O
PTIONAL ACCESSORIES
The following optional accessories, designed for use with the WeatherLink, are
available from your dealer or may be ordered directly from Davis.
▲
Telephone Modem Adapter
For transmission of data from the WeatherLink using a modem.
▲
Standard 4-Conductor Extension Cable
For more flexibility in the placement of your console. You may add one 40’
(12 m) extension cable to extend the cable run from WeatherLink to computer
up to 48’ (14.4 m).
▲
Link Isolator Kit
Provides upgraded protection against electrical disturbances. Installed
between the WeatherLink and your computer, optical coupling of signals prevent lockups of the weather station console and possible damage to the console, WeatherLink, and PC. Recommended when the station console and
computer are not grounded or are connected to two different grounds.
Includes 40’ (12 m) cable.
1
Page 11

I
NTRODUCTION
Optional Accessories
2
Page 12

2
H
Direct Connection Hardware Requirements
ARDWARE INSTALLATION
H
There are two basic types of installations: direct connection and phone modem
connection. Direct connection involves connecting the computer directly to the
WeatherLink. Phone modem connection refers specifically to any installation
where the WeatherLink is connected to a modem and you communicate with the
WeatherLink via a modem at your computer. Requirements and installation for
each type of connection differ, and are explained separately below.
ARDWARE REQUIREMENTS
The required hardware dif fers depending on whether you ar e attempting to make
a direct connection or a phone modem connection.
In addition to the provided hardware, the following are required for a direct connection.
▲
Computer running Windows™ 3.1, 95, or NT 4.0 with at least 5 MB of free disk
space
The amount of space necessary for the data files depends on the archive interval. Database files containing data stored at a 30 minute archive interval
require approximately 36K of disk space per month of data. The file size
changes in a linear fashion depending on the archive interval. For example,
data stored at a 1 minute interval requires approximately 1 MB/month while
the data stored at a 2 hour interval requires approximately 9K/month.
▲
4MB RAM
▲
Windows-Compatible Display
VGA (16 Colors) minimum. SVGA (256 Colors) recommended.
▲
One Free Serial Port
▲
Fax Modem
A fax modem is required to take advantage of the software’s AutoFax feature
(see ”Auto Fax” on page 32). If you do not plan to use the AutoFax feature, a
fax modem is not required for a direct connection.
Phone Modem Connection Hardware Requirements
In addition to the provided hardware, the following hardware is required for a
phone modem connection.
▲
Computer running Windows™ 3.1, 95, or NT 4.0 with at least 5 MB of free disk
space
See “Direct Connection Hardware Requirements” above for hard disk space
requirements.
▲
4MB RAM
3
Page 13
▲
▲
▲
▲
H
ARDWARE INSTALLATION
Direct Connection
Windows-Compatible Display
VGA (16 Colors) minimum. SVGA (256 Colors) recommended.
One Free Serial Port
One external modem to connect to the WeatherLink
The modem must be Hayes
®
compatible and run at either 1200 or 2400 baud.
One internal fax modem or external fax modem connected to your computer
The modem must be Hayes compatible and run at either 1200 or 2400 baud. A
fax modem is required to take advantage of the software’s AutoFax feature
(see ”Auto Fax” on page 32). If you do not plan to use the AutoFax feature, a
non-fax modem is acceptable.
▲
Telephone Modem Adapter
The Telephone Modem Adapter (#7870) provides the connection between the
WeatherLink and the modem.
IRECT
D
ONNECTION
C
The instructions below explain how to make a typical direct connection. Also
included is an illustration showing how to make a direct connection using the
Short-Range Modem Pair (consult the Short-Range Modem Pair manual for
installation instructions). If using the Link Isolator Kit, consult the Link Isolator
Kit manual for installation instructions.
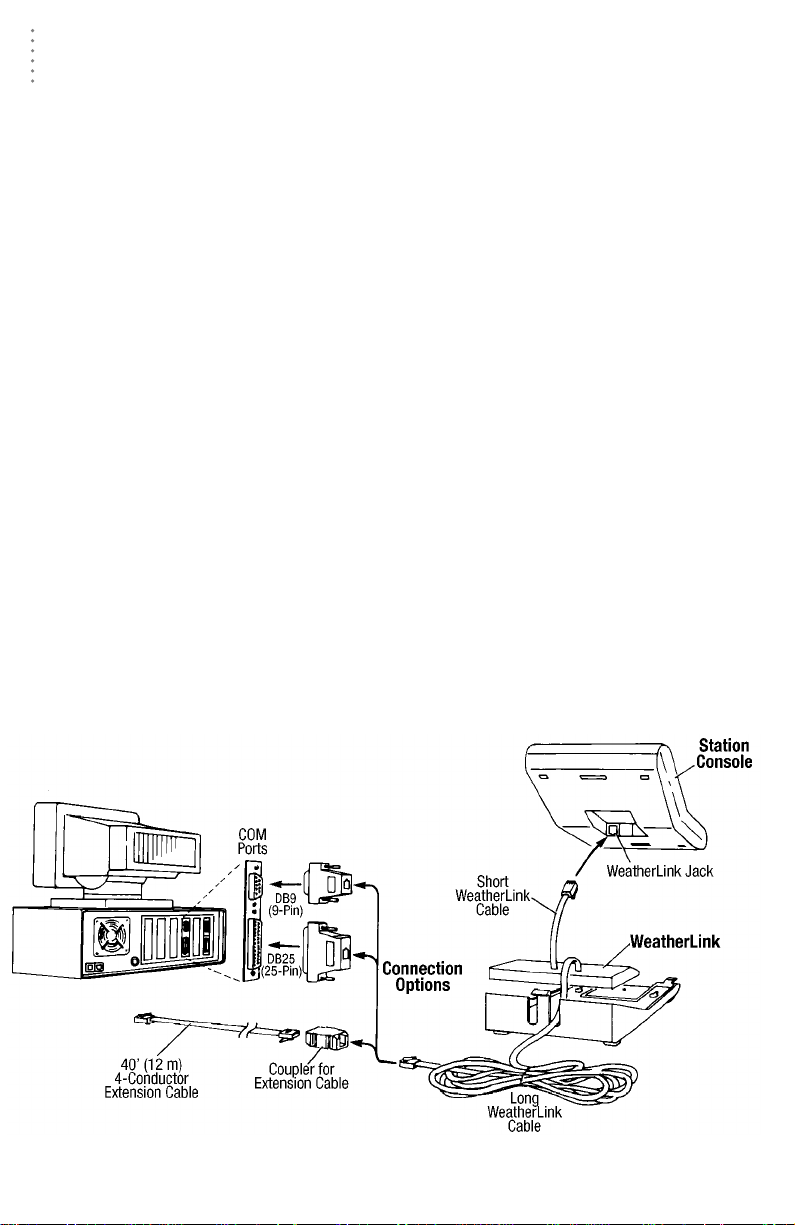
Typical Direct Connection
The instructions below explain how to make a typical direct connection. Note that
you may only use a single 40' (12 m) extension cable. If you extend the cable run
beyond 48' (14.4 m), the software may have difficulty communicating with the
station.
T
D
IRECT
C
ONNECTION
YPICAL
4
Page 14

H
ARDWARE
Direct Connection Installation
1. Make a note of your station’s current barometric pressure, total rainfall, and (if applicable) calibration numbers.
You must remove power from the station console to install the WeatherLink,
which will cause these values to be erased. Use the WeatherLink software to
reenter these values after restoring power to the station.
2. Remove the mounting base from the console and remove all power by removing the
AC-power adapter and battery backup.
Failure to remove power to the console before installing the WeatherLink may
cause damage to the WeatherLink or console.
3. Insert the cable plug at the end of the short cable coming from the WeatherLink into
the jack marked
CAUTION:
WEATHERLINK
on the bottom of the console.
Make sure that whenever you connect or disconnect the WeatherLink from the con-
sole that the console is NOT powered up. Plugging or unplugging the WeatherLink
while power is applied can damage or lock up the WeatherLink.
4. Restore power to the weather station by reattaching the power adapter and battery.
The weather station should beep three times. The third beep, which should
occur within 30 seconds, indicates that the WeatherLink is operating correctly.
5. Place the WeatherLink inside the mounting base and reattach the mounting base.
As you do so, guide the cables through the slots in the mounting base.
I
NSTALLATION
Direct Connection
P
W
L
I
B
LACE
EATHER
INK
NSIDE
ASE
.
6. Locate a free serial port on the back of your computer and connect the appropriate
adapter (DB9 or DB25) to that serial port.
7. Insert the cable plug at the end of the long cable coming from the WeatherLink into
either the DB9 or DB25 adapter.
The cable which connects the WeatherLink to the computer is 8 feet (2.4 m)
long. If you need to mount the station console more than 8 feet from the computer, use a 40’ (12 m) standard 4-conductor extension cable. Do not attempt
to use more than 40’ of extension cable, or the WeatherLink may have difficulty “communicating” with the computer. If you need to mount the station
console farther away, you will need to use the Short-Range Modem Pair.
5
Page 15
H
ARDWARE
Phone Modem Connection
P
HONE
I
NSTALLATION
M
ODEM
C
ONNECTION
The instructions below explain how to make a typical phone modem connection.
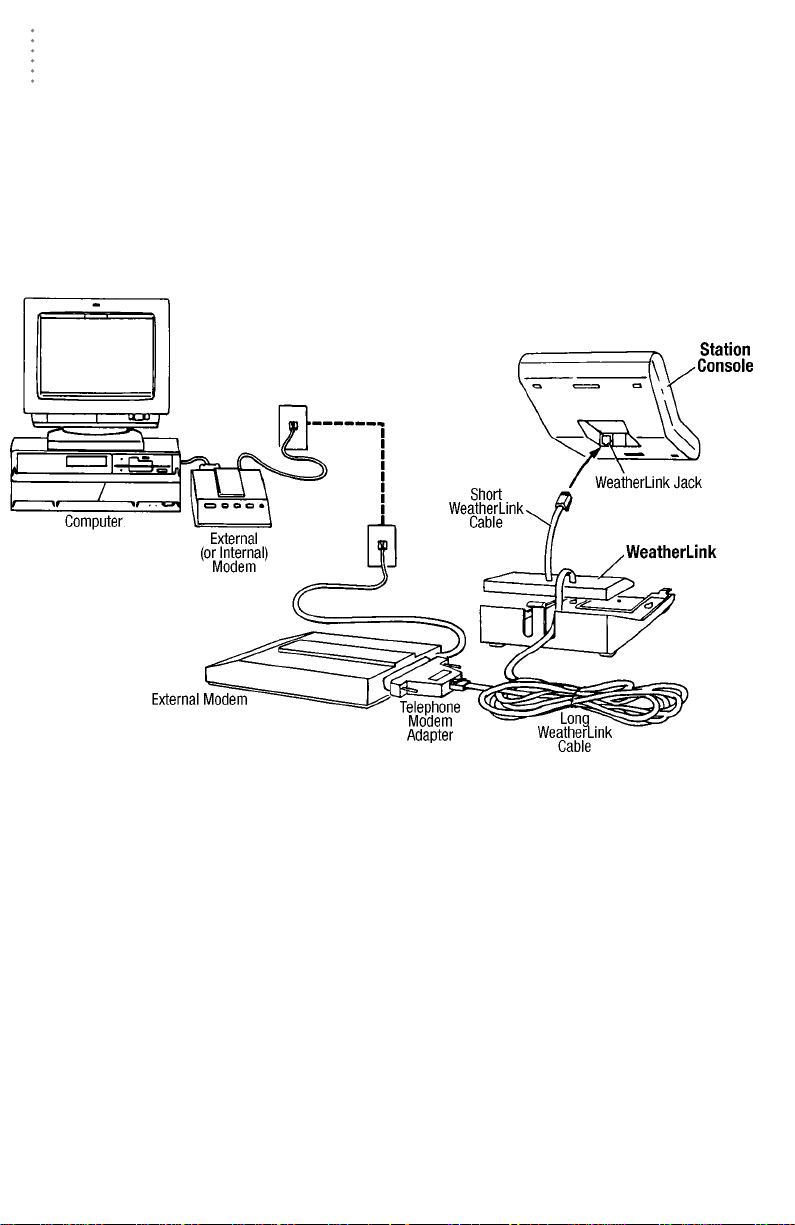
Typical Phone Modem Installation
The illustration below shows a typical phone modem connection. This involves
connecting the WeatherLink to the weather station and to a modem at the station
console site and connecting your computer’s modem to a phone line, which will
allow you to “dial” the weather station.
T
P
M
YPICAL
HONE
ODEM
I
NSTALLATION
Phone Modem Installation Instructions
1. Install and set up an internal or external modem (according to the instructions supplied
by the manufacturer) for use with your computer.
Make a note of the COM port and IRQ used by the modem. You will need this
information when entering serial port settings for the station (see “Serial Port”
on page 20).
2. At the station console site, position the external modem in a location where it can connect to both the WeatherLink and a phone jack and plug it into the phone jack. DO NO T
TURN THE MODEM ON AT THIS TIME.
The cable which connects the W eatherLink to the modem is 8 feet (2.4 m) long.
If you need to mount the station console more than 8 feet from the modem,
use a 40’ (12 m) standard 4-conductor extension cable. Do not attempt to use
more than 40’ of extension cable, or the WeatherLink may have difficulty
“communicating” with the modem. If you need to mount the station console
farther away, you will need to use the Short-Range Modem Pair.
3. Plug the external modem into the phone jack.
6
Page 16

H
ARDWARE
I
NSTALLATION
Phone Modem Connection
4. Make a note of your station’s current barometric pressure, total rainfall, and (if appli-
cable) calibration numbers.
You must remove power from the station console to install the WeatherLink,
which will cause these values to be erased. Use the WeatherLink software to
reenter these values after restoring power to the station.
5. Remove the mounting base from the console and remove all power by removing the
AC-power adapter and battery backup.
Failure to remove power to the console before installing the WeatherLink may
cause damage to the WeatherLink or console.
6. Insert the cable plug at the end of the short cable coming from the WeatherLink into
the jack marked
WEATHERLINK
on the bottom of the console.
7. Connect the Telephone Modem Adapter to the external modem.
Do not attempt to use the DB25 adapter and a gender changer to attach the
WeatherLink to a modem because it will not work.
8. Insert the cable plug at the end of the long cable coming from the WeatherLink into the
Telephone Modem Adapter.
9. Turn the modem on.
The modem must be on before you restore power to the station console.
10. Restore power to the weather station by reattaching the power adapter and battery.
The weather station should beep three times. The third beep, which should
occur within 30 seconds, indicates that the WeatherLink is operating correctly.
11. Place the WeatherLink inside the mounting base and reattach the mounting base.
As you do so, guide the cables through the slots in the mounting base.
P
LACE
W
EATHER
L
BASE
.
INK
INSIDE
7
Page 17

H
ARDWARE
Phone Modem Connection
I
NSTALLATION
A Few Notes About Phone Modem Connections
If you indicate a phone modem connection when setting up your station (see
“Serial Port” on page 20), the software automatically dials the station whenever
you attempt to initiate a program action which requires the software to “talk” to
the WeatherLink.
While connected to a phone modem station, an “On-Line” icon appears in the
toolbar. This icon indicates that you are on-line and may be used to hang up a
remote connection. To hang up, choose the On-Line icon from the toolbar or
choose Hang Up from the File menu.
T
O
-L
OOLBAR
WITH
I
N
INE
CON
Once connected, the software will remain on-line until you choose to hang up.
The software remains on line whether or not you are doing something which
requires it to be connected.
Note:
If you are on-line at the time of a schedule automatic download, the automatic download is
cancelled.
8
Page 18
3
I
R
A
OFTWARE INSTALLATION AND SETUP
S
This chapter covers software installation and setup.
NSTALLING THE SOFTWARE
1. Place the Install Disk in your disk drive.
2. Choose Run from the File menu, type A:SETUP (or B:SETUP), and choose OK to begin the
installation.
3. Follow the on-screen prompts to complete the installation.
UNNING THE SOFTWARE
To run the software, double-click on the WeatherLink 4 icon. If you have no stations in the program directory when you run the software, the software will
prompt you to add a station (see “Adding a Station” below for details). If you
have more than one station in the program directory when you run the software,
the software will prompt you to indicate which station you’d like to open.
DDING A STATION
In order to interact with your station, you must add a station, which entails naming
the station, configuring the software to work with that station and with your computer hardware, and setting station values such as time, barometric pressure, total
rainfall, and calibration numbers. For performance reasons, the software reads
these values from the station configuration file (see ”Station Configuration File” on
page 94 for more information) rather than from the station itself.
must set station values from the software.
tion’s console, the readings you see in the bulletin, database, strip charts, reports,
and plots may not agree with your station’s readings.
If you set station values from the sta-
Therefore, you
Adding a Station
1. Choose New Station from the File menu.
The software opens the Add New Station dialog box.
N
S
EW
TATION
9
Page 19
▲
S
OFTWARE
Adding a Station
I
NSTALLATION
AND
S
ETUP
2. Type the station name into the text box.
The station name may be up to 40 characters/spaces long. Note that the software uses the first eight characters of the station name (not counting spaces or
punctuation marks) as the name of the directory into which it saves this station’s database and configuration files. The first eight characters of each station name must, therefore, be unique. The software also uses the first three
characters as the file extension for that station’s database files (the first three
characters need not be unique).
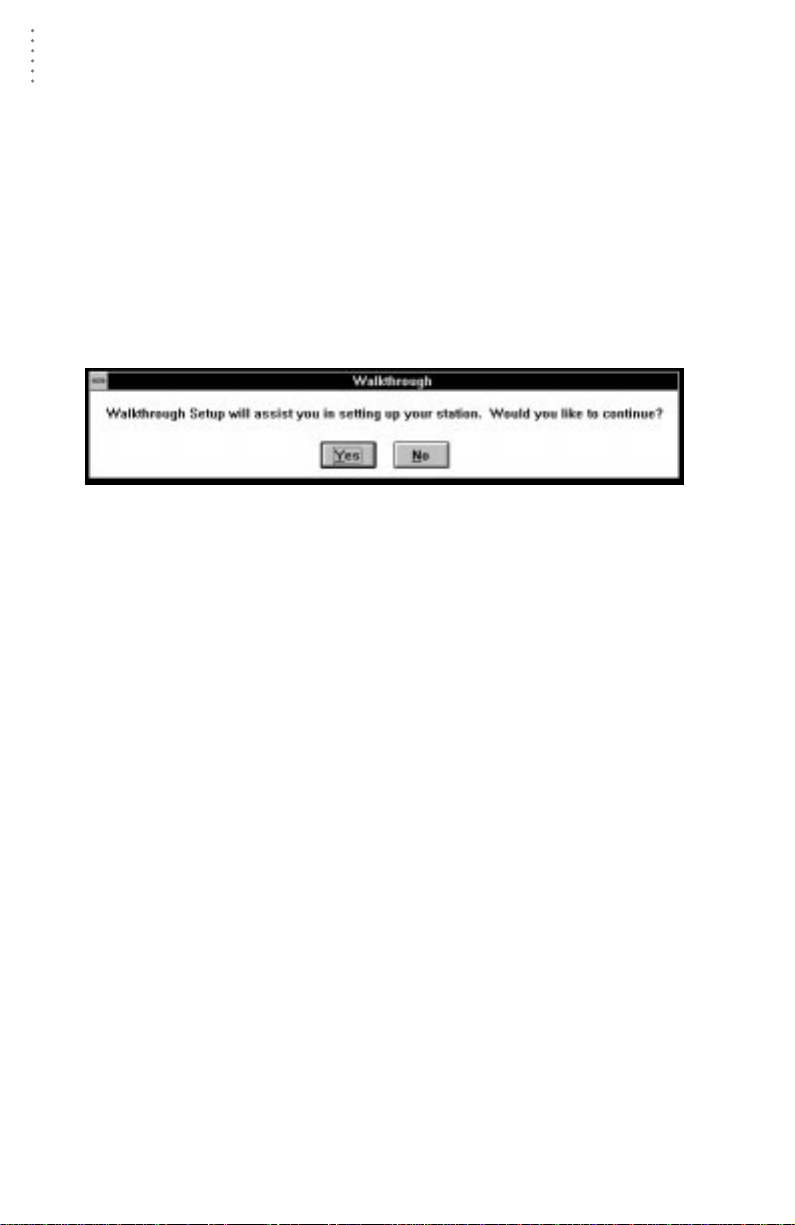
3. Choose OK.
The software saves the station, creates a directory and subdirectories for that
station, and prompts you to indicate whether you want to enter the walkthrough procedure.
S
TART
W
ALKTHROUGH
C
ONFIRMATION
About the Walkthrough
The software includes a station setup walkthrough which steps you through the
station configuration procedure. After adding a new station, the software automatically prompts you to indicate whether or not you want to be walked through
the configuration procedure. You may , of course, choose No and set up the station
by choosing all of the necessary commands from the menus. A Walkthrough command is included in the Setup menu which allows you to go through the walkthrough procedure at any time.
Note:
Where necessary, the software will automatically dial a phone modem station. See “A Few
Notes About Phone Modem Connections” on page 8 for instructions on dialing and hanging
up.
If you choose Yes to begin the walkthrough, the software takes you through the
following dialog boxes:
10
Station Configuration (see ”Station Config” on page 19)
Set station name, model, accessories, download options, and data file extension.
▲
Choose Units (see ”Select Units” on page 22)
Select units of measure in which station information is displayed.
▲
Serial Port Settings (see ”Serial Port” on page 20)
Set COM port to which W eatherLink is connected. Specify modem connection
settings such as baud rate, phone number, and modem initialization string.
▲
Set Barometer (see ”Set Barometer” on page 24)
Set barometric pressure on station and software. You must enter this information from the software if you want your station and software readings to
agree.
Page 20
▲
▲
▲
▲
S
OFTWARE
I
NSTALLATION
AND
Adding a Station
Set Rain Cal (see ”Set Rain Cal” on page 25)
Set station’s rainfall calibration number.
Enter Total Rainfall (see ”Set Total Rain” on page 27)
Set total rainfall amount on station and software. You must enter this information from the software if you want you station and software readings to agree.
Set Time and Date (see ”Set Time” on page 23)
Set the time and date on the station, software, and computer to make sure all
three are synchronized.
Note:
When you set the time and date, you will be prompted to clear your archive memory (see
”Archive Memory” on page 91 for information on the archive memory). If you do not clear
archive memory, you may end up with data stored at an incorrect time or duplicate
records. We r ecommend that you do wnload before setting the time (unless you are creating a brand new station) so you may safely clear the archive memory.
Set Archive Interval (see ”Set Archive Interval” on page 24)
Select the interval at which you want data stored to the WeatherLink’s archive
memory (see ”Archive Memory” on page 91).
▲
Set Station Alarms (see ”Set Alarms” on page 28)
Set alarm thresholds on the station.
▲
Set Auto Clear (see ”Auto Clear” on page 30)
Specify the high/low registers and rainfall registers you want cleared at the
same time each day and the time at which you want them cleared.
S
ETUP
▲
Set Auto Download Time(s) (see ”Auto Download” on page 31)
Specify the stations and the times at which you want data automatically
downloaded each day.
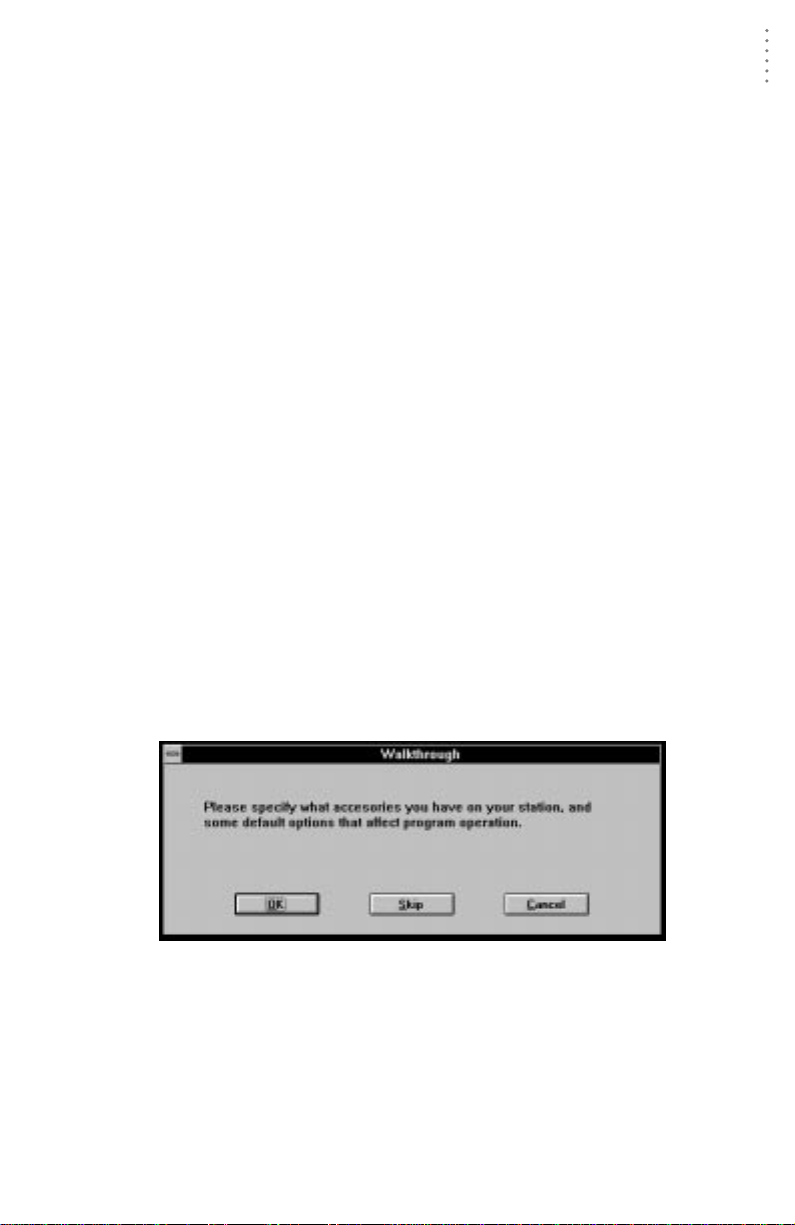
At each step in the walkthrough procedure, the software will provide confirmation boxes prompting you to indicate whether or not you wish to continue.
W
ALKTHROUGH
C
ONFIRMATION
To continue, choose OK. To skip this step and move to the next step, choose Skip.
To cancel the entire walkthrough procedure, choose Cancel.
11
Page 21
S
OFTWARE
Finding the Correct Serial Port
F
INDING
I
NSTALLATION
C
THE
S
AND
ETUP
ORRECT
S
ERIAL
P
ORT
The software contains a procedure for locating the serial port to which your station is connected or determining whether that serial port is working. Using the
Loopback command (as opposed to Test) will help you determine whether a communication problem is being caused by the serial port or by the WeatherLink.
Note:
This procedure will only work for direct connections. If you are making a phone modem connection, you may want to simply chec k the communications softw are you normally use for the
correct serial port setting. Otherwise , you must consult the documentation supplied with your
modem.
In order to use this procedure, you will need the loopback connector (the short
cable with a phone jack on one end and a red plastic tip on the other) supplied
with your Weatherlink software package.
1. If necessary, disconnect the 40-foot WeatherLink cable from the DB9 or DB25 adapter
which is connected to the COM port.
2. Insert the loopback connector into the DB9 or DB25 adapter.
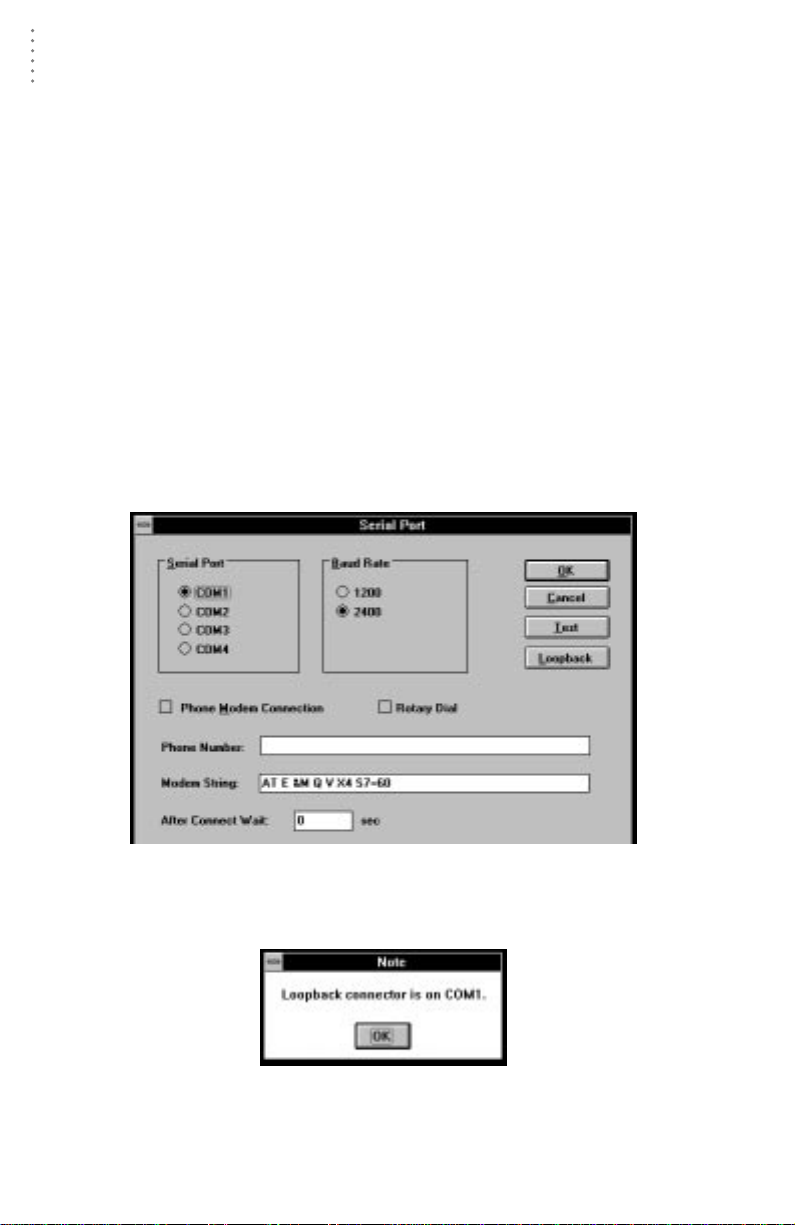
3. Choose Serial Port from the Setup menu.
The software opens the Serial Port dialog box.
4. Choose Loopback.
The software will search all standard serial ports and inform you of the COM
port at which the loopback connector is located.
The software automatically selects the correct COM port for you in the Serial Port
dialog box. If it cannot find the loopback connector at any COM port, your serial
port is not working. Consult your computer documentation for help.
12
L
OOPBACK
S
ERIAL
C
ONNECTOR
P
ORT
F
OUND
Page 22
4
W
M
SING THE SOFTWARE
U
Everything you need to know about running the software (once it is correctly
installed and set up) is explained in this chapter.
EATHER STATION MODELS
Depending on which station model (Weather Monitor II®, Weather Wizard III®,
etc.) you are using and which optional sensors (Rain Collector or External Temperature/Humidity Sensor) you have connected to your station, certain information and options explained in this manual may not be available. The software may
only display and plot data for which your weather station has a sensor. For example, if you have a Weather Wizard III, you may not plot, view, or print barometric
pressure information.
ULTIPLE STATIONS
The software can support the use of any number of weather stations with a single
version of the program. Each station must connect to its own WeatherLink, however. If you have set up more than one station, whenever you load the software
you will be prompted to open a station.
O
PEN STATION DIALOG BOX
All program actions affect the open station. To open a different station, choose
Open Station from the File menu (see “Open Station” on page 15).
13
Page 23
U
SING THE SOFTWARE
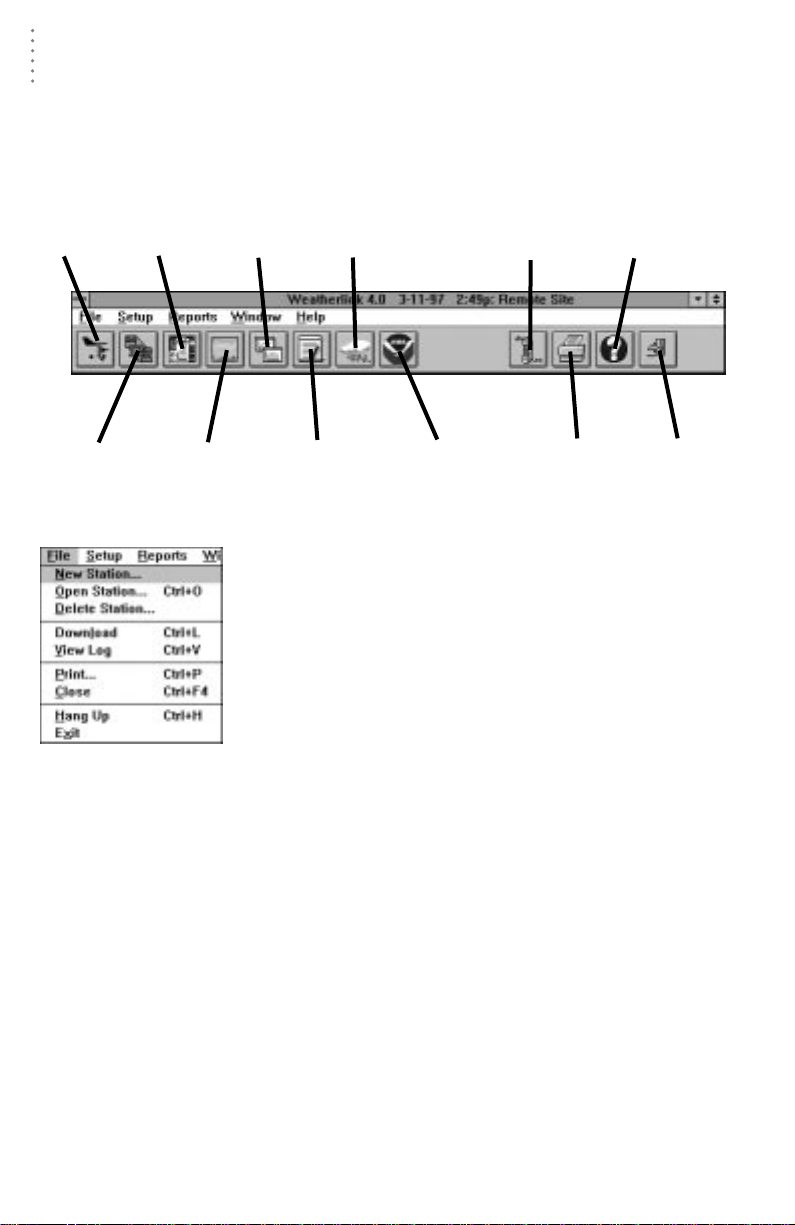
The Toolbar
T
HE
T
OOLBAR
The toolbar contains icons which activate program commands. The illustration
below shows what commands are activated by the individual toolbar icons. Note
that the Print icon only appears when you have a window which you may print
open. The On-Line icon only appears when you are connected to a remote station.
Open
Station
Download
Bulletin
Window
Strip Chart
Plot
Window
Window
ILE
F
The file menu contains commands relating to station files and
stations. Each command is explained separately below. Note
that the contents of the File menu may change, depending on
what window is currently active. For example, when the Plot
window is the active window, several commands which
enable you to save and open plots and plot templates are
added to the File menu. These added commands are
explained in the appropriate section below.
Rainfall
Database
Window
ENU
M
Yearly
T
OOLBAR
This Month’s
NOAA Summary
On-Line
(Hang Up)
Print
Window
View
Help
Exit
Program
14
Page 24
U
SING
THE
New Station
Each station connected to the computer must have its own “station” within the
software. This tells the software into which database new data should be saved,
provides the necessary communication settings (serial port, IRQ, etc.), and other
station-specific information.
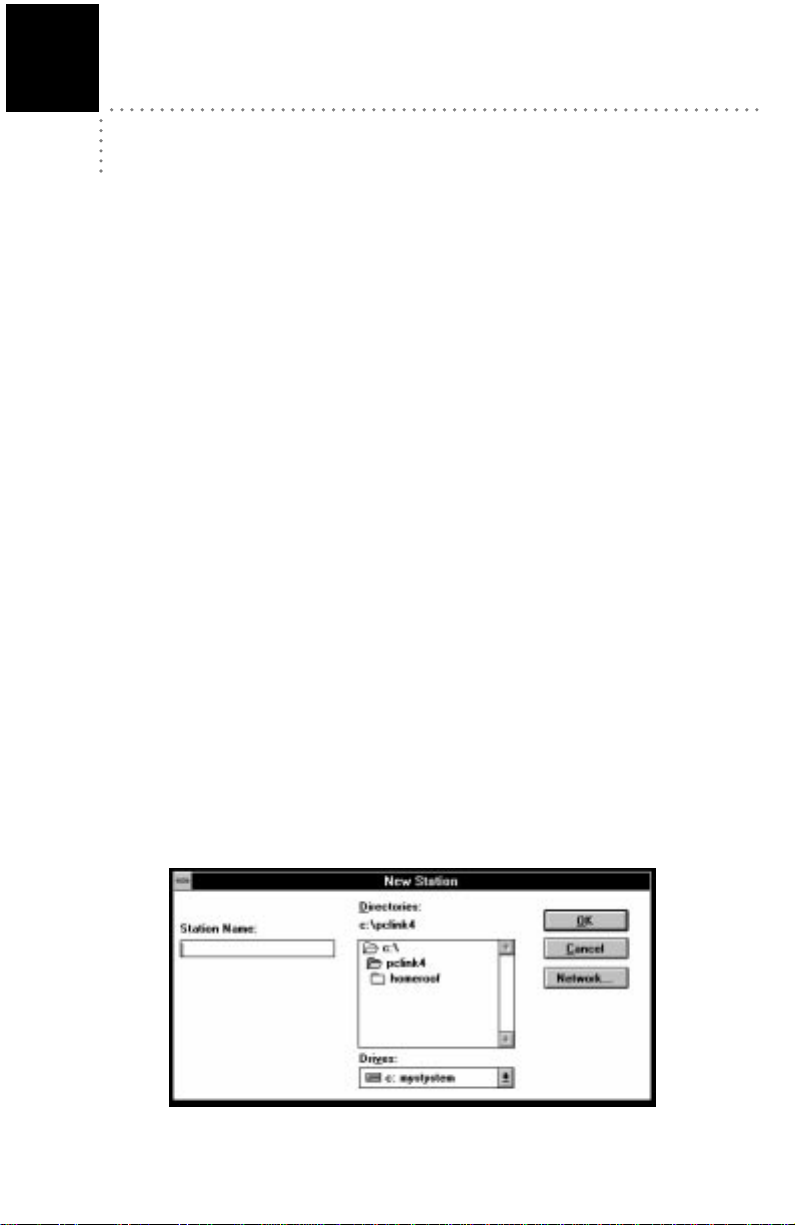
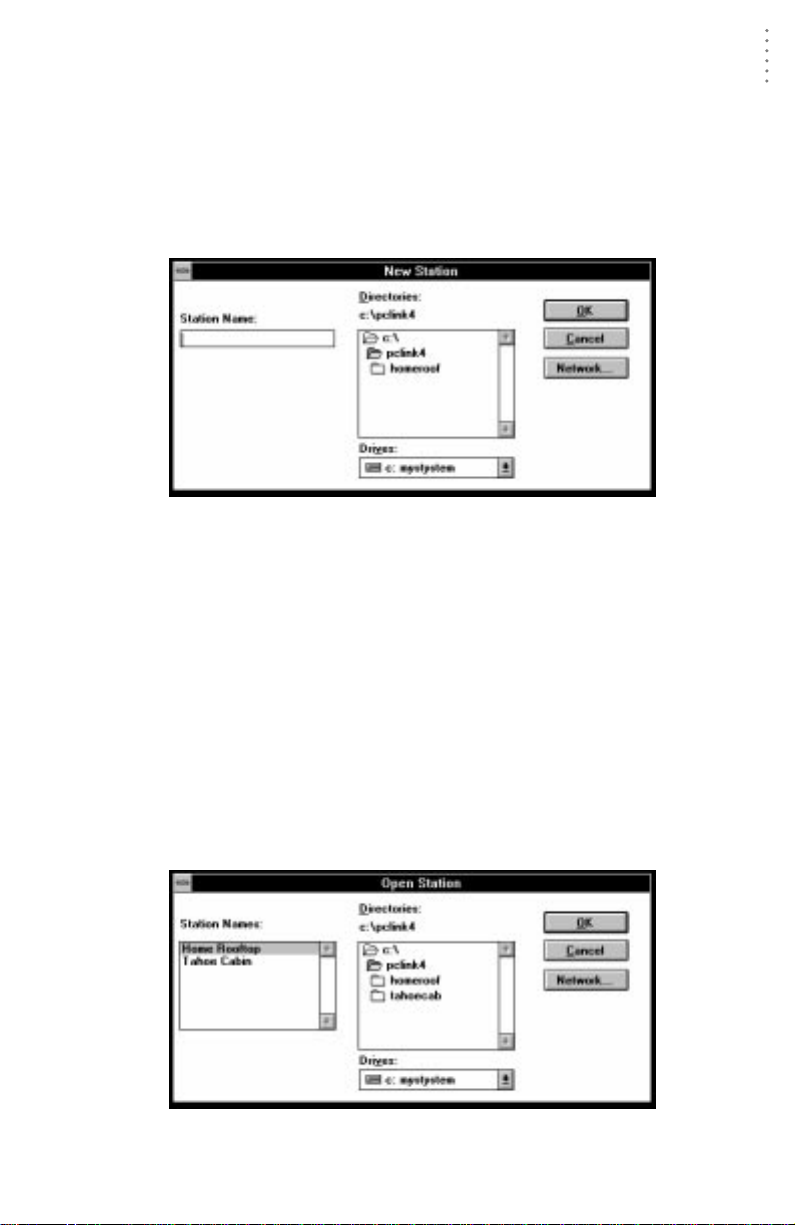
1. Choose New Station from the File menu.
The New Station dialog box appears.
N
EW
S
TATION
2. To add a station, type the desired station name (up to 40 characters/spaces) into the
Station Name text box and choose OK.
The software saves the station, creates a directory for that station using the
first eight characters in the station name (not including punctuation and
spaces), and prompts you to indicate whether you want to enter the walkthrough procedure (see “About the Walkthrough” on page 10).
S
OFTWARE
File Menu
Open Station
Only one station may be open at a time. That way the software knows into which
database downloaded data should be saved, which communications settings to
use, which database to use when plotting, etc.
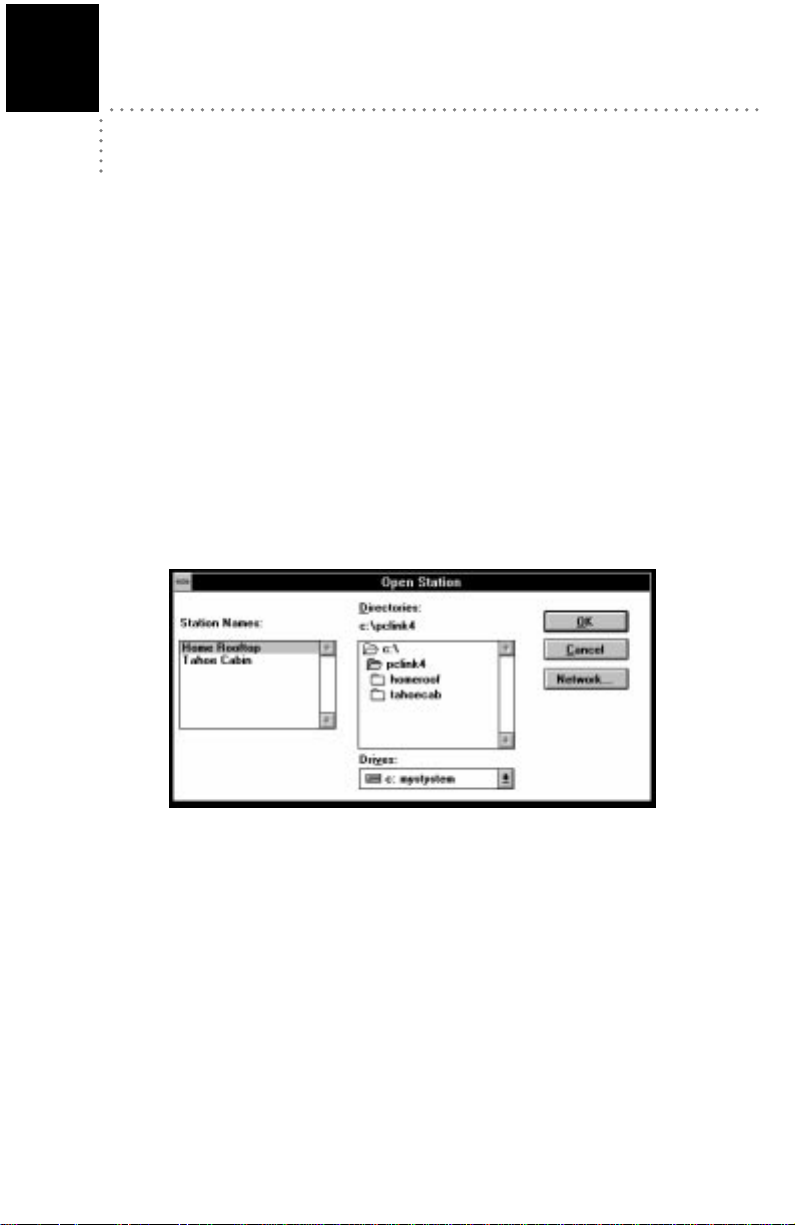
1. There are three ways to open a new station. Choose Open Station from the File menu,
choose the Open Station icon from the toolbar, or right click on the main window.
The Open Station dialog box appears.
PEN
TATION
O
S
2. Select a station from the list box on the left and choose OK to open that station.
15
Page 25
U
THE
S
OFTWARE
SING
File Menu
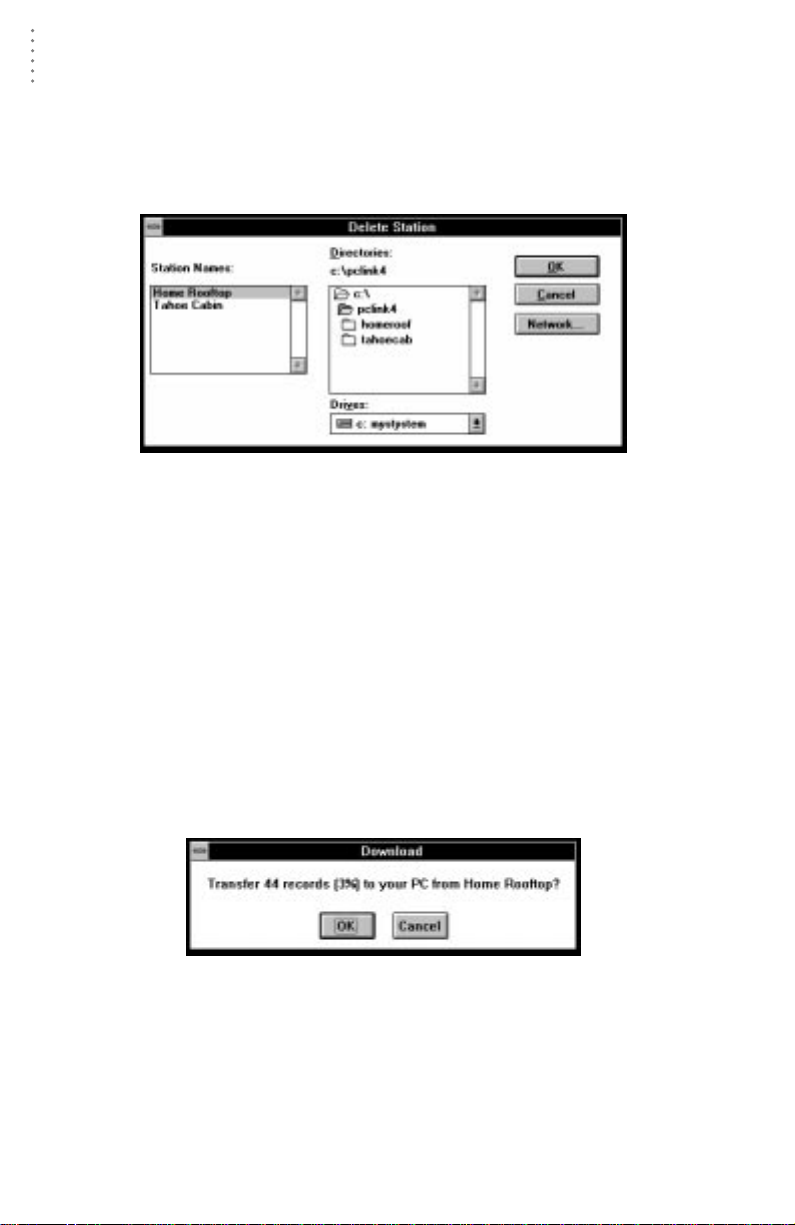
Delete Station
You may delete a station from the software quickly and easily. Deleting a station
removes the station directory and subdirectories from your hard disk.
1. Choose Delete Station from the File menu.
The Delete Station dialog box appears.
D
ELETE
S
TATION
2. Select a station from the list box on the left and choose OK.
You will be prompted to confirm that you want to delete the station.
3. Choose OK to confirm the deletion.
The software deletes the station and all related files.
Download
Downloading allows you to transfer weather data from the W eatherLink’s ar chive
memory to the database stored on your computer’s hard disk. For information on
the difference between the data in your archive memory and the data in your
database, see “Archive Memory vs. Database” on page 91.
1. Choose Download from the File menu or choose the Download icon from the toolbar.
The software will show you how much information is currently saved in the
archive memory (as a number of records and as a percentage of the archive
memory’s capacity), and prompt you to confirm that you wish to download.
D
OWNLOAD
C
ONFIRMATION
16
Page 26
U
THE
S
SING
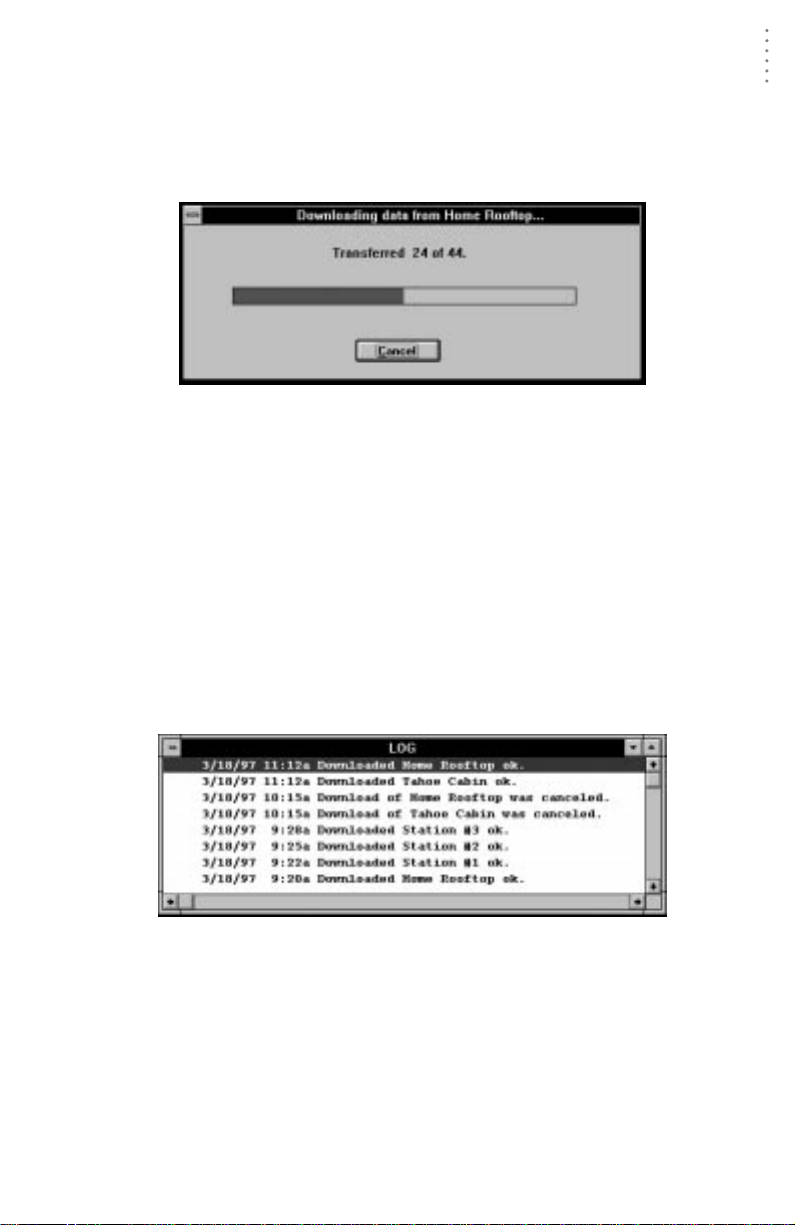
2. To begin the download, choose OK.
The software will begin to download data. The software shows you the
progress of the download in the form of a status bar and a text display of the
number of records transferred so far and the total number of records to be
transferred.
OFTWARE
File Menu
D
OWNLOAD
S
TATUS
After all records have been transferred, the software saves the information
into the open station’s database. If you have set up your station to clear the
archive memory after download (see “Clear archive memory after download”
on page 20), the software clears the archive memory.
View Log
Information about the automatic download and automatic clear of your station(s)
is automatically written to a file called “download.log.“ The log will show you
whether or not the download/clear was successful for each station and give you
the time and date at which it started and completed.
1. Choose View Log from the File menu.
The automatic download log appears.
A
UTOMATIC
D
OWNLOAD
L
OG
2. To close the log window, double-click on the control-box or choose Close from the File
menu.
17
Page 27
U
THE
S
OFTWARE
SING
Setup Menu
To print the active program window, choose Print from the File menu or click on
the Print icon in the toolbar. Specify printing options (for best results make sure
Landscape mode is selected) in Windows’ print dialog box and choose OK.
Close
To close the active program window, choose Close from the File menu or press
Ctrl-F4 (or Ctrl-Z).
Hang Up
To hang up a modem connection, choose Hang Up from the File menu or choose
the On-Line icon from the toolbar.
Note:
The On-Line icon only appears in the toolbar when you are connected to a remote station.
Exit
To exit the software, choose Exit from the File menu.
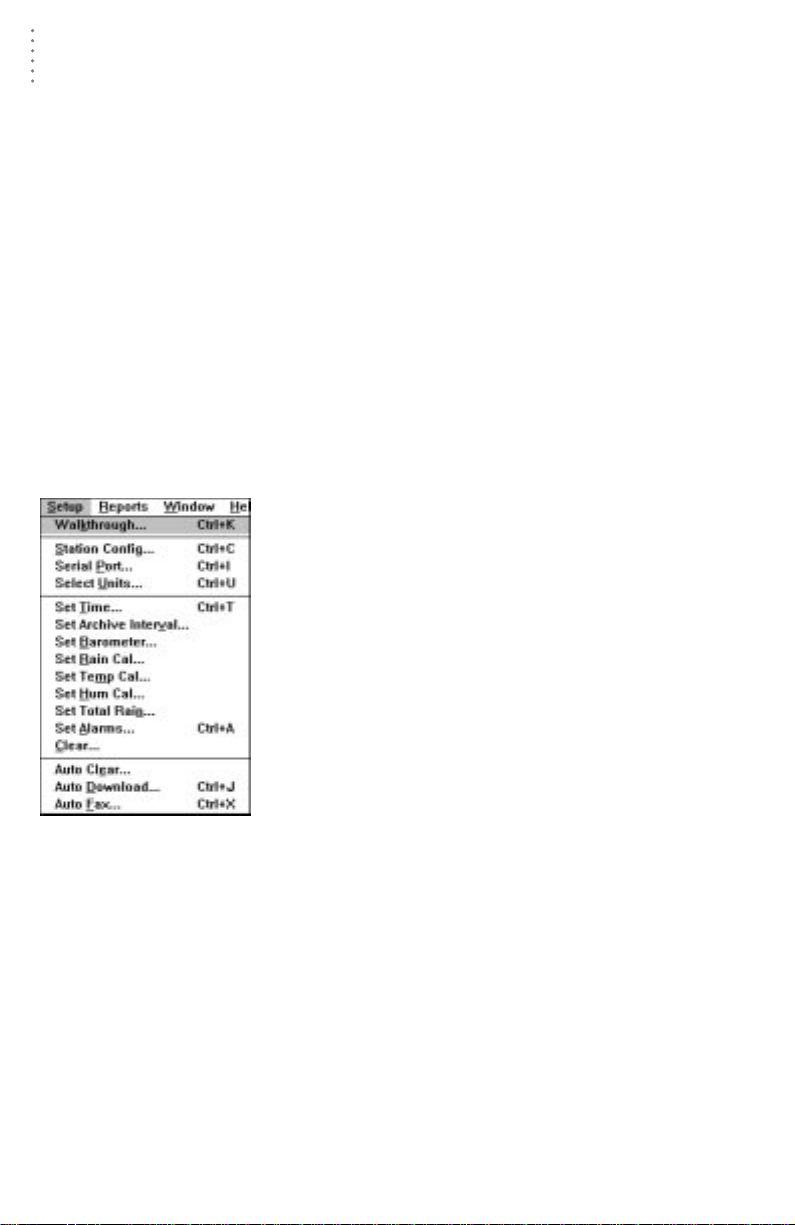
S
ETUP
M
ENU
The commands in the Setup menu relate to station and
software setup. Each of the commands is explained separately below.
Walkthrough
The station setup walkthrough automatically steps you
through the entire station configuration procedure. It is
explained in some detail in “About the Walkthrough”
starting on page 10.
18
Page 28
▲
U
SING
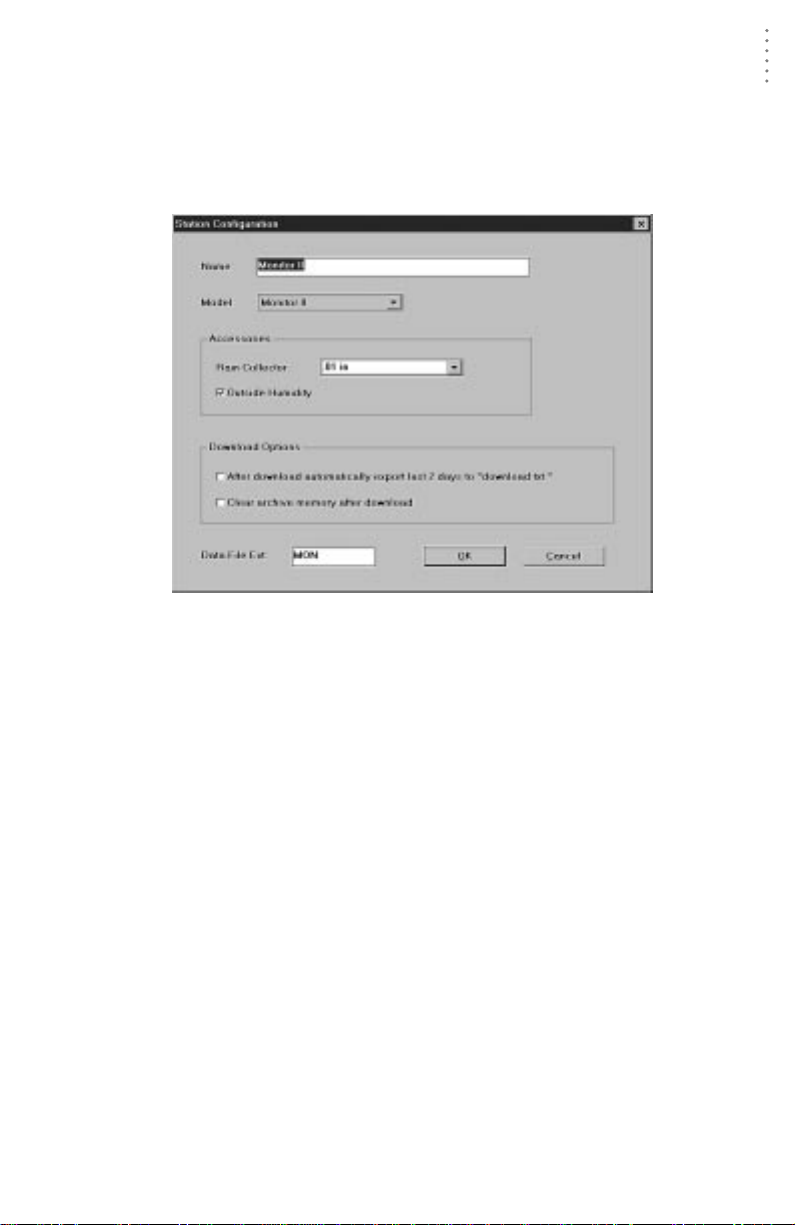
Station Config
You may enter information which will help to identify a particular station and
select a number of station-specific settings.
1. Choose Station Config from the Setup menu or press Ctrl-C.
The Station Configuration dialog box appears.
THE
S
OFTWARE
Setup Menu
S
C
TATION
ONFIGURATION
2. Enter the following information:
Name
Enter the desired station name in this text box. Note that when you first
create a station, the software uses the first eight characters of the station
name as the name of the directory into which it saves this station’s database and configuration files and the first three characters as the file extension for that station’s database files. If you change the station name, the
software will prompt you to change the name of the station directory and
database file extension.
▲
Model
Select the weather station model from the drop-down list box.
▲
Rain Collector
Select the increment in which the rain collector you use with the station
measures rainfall. If you do not have a rain collector, choose None.
▲
Outside Humidity
If you have the optional External Temperature/Humidity Sensor, select
this check box.
19
Page 29
U
THE
S
OFTWARE
SING
Setup Menu
After download automatically export last 2 days to “download.txt”
The software is capable of automatically creating a text file which contains
all downloaded records for the last 2 days (the day on which you downloaded and the previous day) after each download. To enable this feature,
select the check box. The file (named “download.txt”) is saved into the station’s directory.
▲
Clear archive memory after download
You may have the software automatically clear the archive memory whenever it downloads data. Clearing after each download will decrease the
time it takes to download because there will be less “accumulated” data in
the archive memory. Not clearing after each download allows you to
download data into multiple databases (if more than one person uses a
single weather station, for example). To clear data in the archive memory
after each download, select the check box.
▲
Data File Ext
The file extension used on database files for this station is displayed at the
bottom of the dialog box. To change the file extension, enter a valid DOS
file extension (3 characters) into the text box.
3. When finished, choose OK.
The software save the station configuration settings.
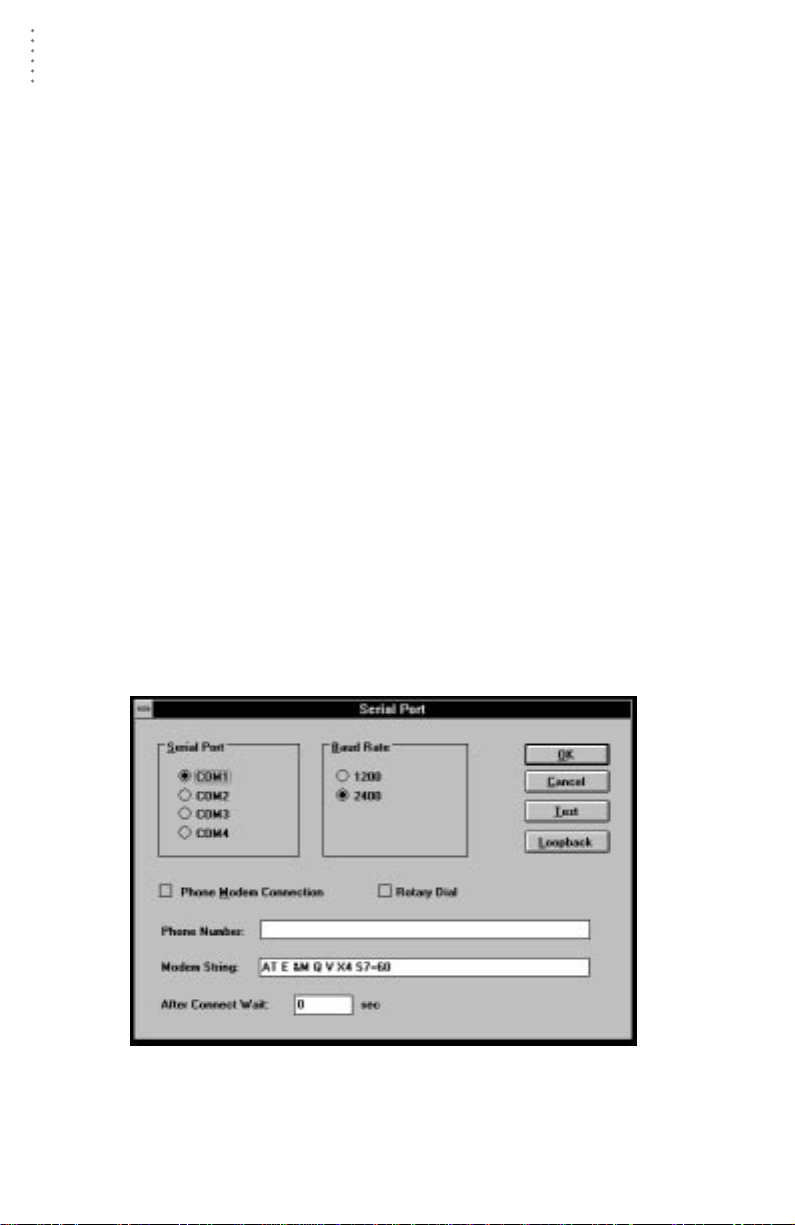
Serial Port
In order to communicate with the WeatherLink and station, you need to specify
communications settings for the station.
1. Choose Serial Port from the Setup menu or press Ctrl-I.
The Serial Port Settings dialog box appears.
▲
▲
2. Enter the following information:
Serial Port
Select the serial port to which the WeatherLink (or modem) is connected.
20
S
ERIAL
P
ORT
Page 30

U
THE
S
▲
SING
Baud Rate
Unless you are using a modem which only operates at 1200 baud, leave
the baud rate setting at 2400.
Note:
If you have a 1200 baud modem, you need to both flip this setting for the PC AND flip
the dip switch setting on the data logger. By default, both are set to 2400 baud. For
successful operation, both must remain in sync.
▲
Phone Modem Connection
Select this check box to connect to the station by modem (remote connection).
▲
Rotary Dial
Select this check box if you are using a phone modem connection and your
phone is rotary dial.
▲
Phone
Enter the phone number for the modem connected to the station in the text
box. Make sure to enter the area code and any necessary prefixes (for
example, 1, 011, etc.). You may enter the following special characters.
▲
Enter a comma (,) to force the modem to pause before dialing the next
digit. You may enter more than one comma to increase the length of
time for which the modem pauses.
▲
Enter a “w” to force the modem to wait for a dial tone before dialing
the next digit.
▲
Modem String
Enter the desired modem initialization string in the text box. The default
modem initialization string should work in almost all cases. Before changing the modem string, see “Modem String” on page 99 for an explanation
of what each part of the string means.
▲
After Connect Wait
Controls the number of seconds the software waits (after connecting to a
remote station) to send the first command. If you are having difficulty connecting to a remote station, try increasing the number of seconds until you
can connect successfully.
3. When finished selecting options, choose Test.
The software will check the connection to the station (or modem) using the
current settings and indicate whether or not it successfully connected to your
weather station model. If you cannot connect to the station, you may use
Loopback (see “Finding the Correct Serial Port” on page 12) to determine the
correct serial port or make sure the serial port itself is actually working.
4. Once the serial port settings are correct, choose OK.
The software saves the serial port settings.
OFTWARE
Setup Menu
21
Page 31
U
SING THE SOFTWARE
Setup Menu
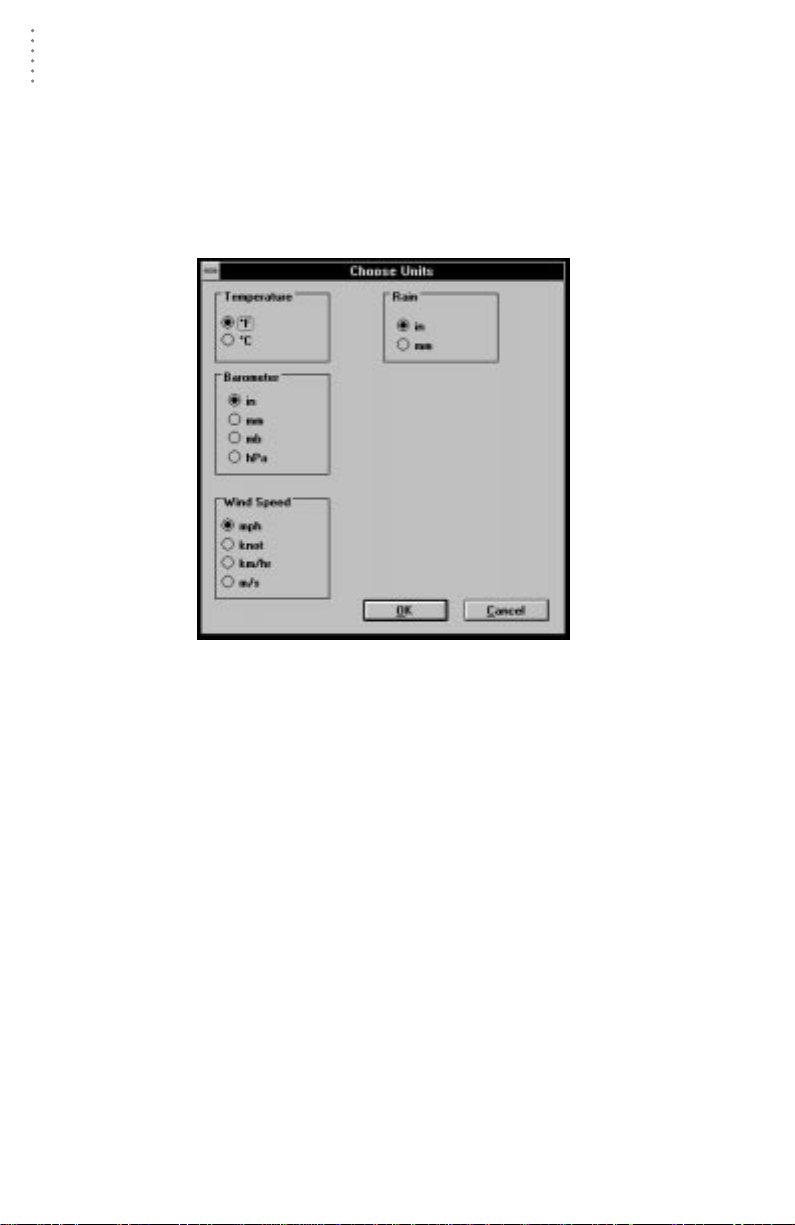
Select Units
You may select the units of measure in which data is displayed within the software. All program windows (bulletin, summary, plots, database, etc.) display data
in the selected units of measure. Choosing units of measure in the software does
not affect the units of measure in which data is displayed on the console.
1. Choose Select Units from the Setup menu or press Ctrl-U.
The Choose Units dialog box appears.
2. Select the desired units of measure:
▲
Temperature: Fahrenheit (°F) or Celsius (°C)
Wind chill, dew point, degree-days, and temperature-humidity index are
all displayed in the same unit of measure as temperature.
▲
Barometer: Inches of Hg (in), Millimeters of Hg (mm), Millibars (mb), or
Hectopascals (hPa)
▲ Wind Speed: Miles per Hour (mph), Knots (knot), Kilometers per Hour (km/hr), or
Meters per Second (m/s)
▲ Rain: Inches (in) or Millimeters (mm)
3. After selecting units of measure, choose OK.
The software saves your choices. All information will be displayed in the units
of measure you selected.
22
C
HOOSE UNITS
Page 32
USING THE SOFTWARE
Set Time
You may set the time and date on your station console and your computer from
the software. It is important to make sure that both the station and computer display the same time and date. Because changing time and date on the station can
affect data in the WeatherLink’s archive memory, we recommend that you download data before setting the time and date and then clear your archive memory
when finished.
Note:
See “Leap Year Correction” on page 101 before changing time and/or date during a leap year.
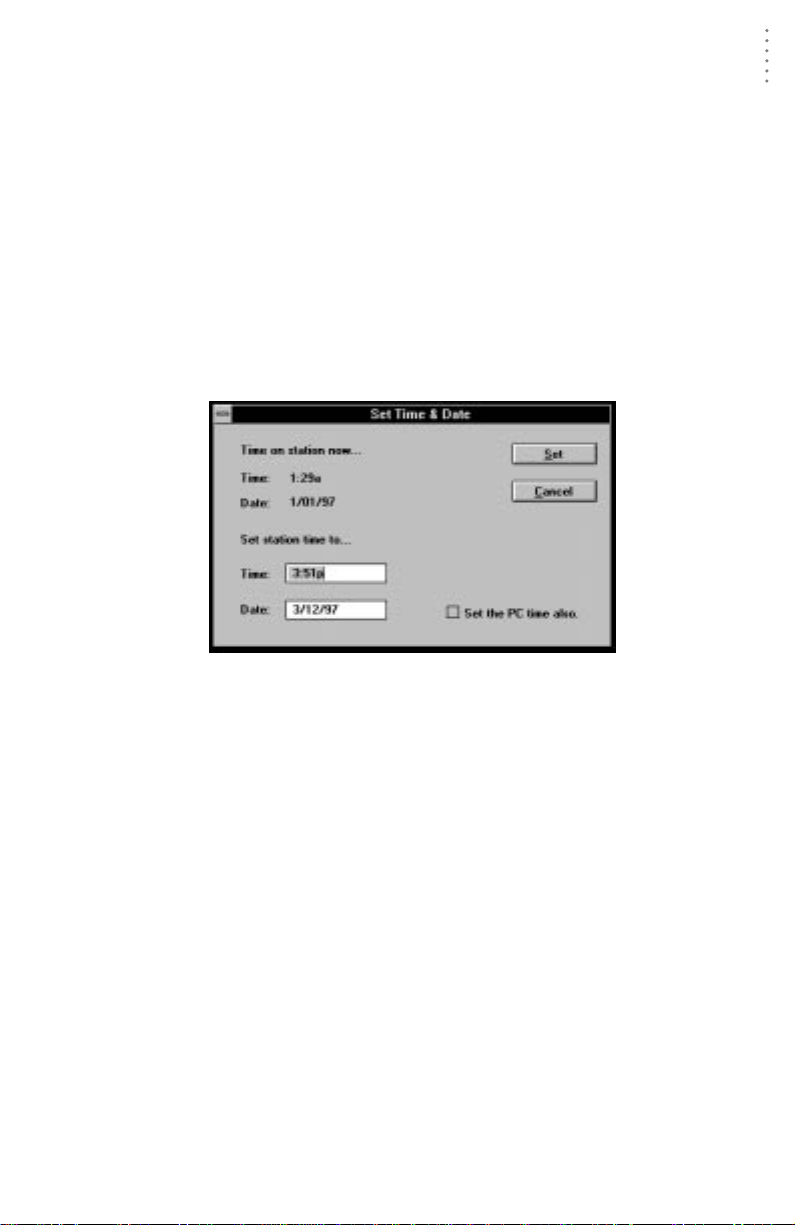
1. Choose Set Time from the Setup menu.
The Set Time & Date dialog box appears. The time and date currently displayed by the station console appear at the top of the dialog box. The software
automatically enters the time and date displayed by the computer into the text
boxes at the bottom of the dialog box.
Setup Menu
SET T
IME
& D
ATE
2. Enter the following information:
▲ Time/Date
Enter the current time and/or date.
▲ Set the PC time also
If you want the software to set the time and date on both the station console and the computer, select this check box.
3. After entering time and date, choose OK.
The software sets the time and date on the station console (and the PC) and
then prompts you to indicate whether you want to clear your archive memory
as well.
4. To indicate whether you want to clear your archive memory, choose Yes or No.
If you choose Yes, the software clears your archive memory.
23
Page 33
USING THE SOFTWARE
Setup Menu
Set Archive Interval
You may choose to store data to the WeatherLink’s archive memory at an interval
of 1, 5, 10, 15, 30, 60, or 120 minutes. This interval is known as the archive interval.
For information on archive memory and the effect that the archive interval has on
the amount of data which may be stored in the WeatherLink’s archive memory,
see “Archive Memory” on page 91.
Note:
Be aware that setting the archive interval clears your archive memory. You should download
data before changing archive interval (see “Download” on page 16).
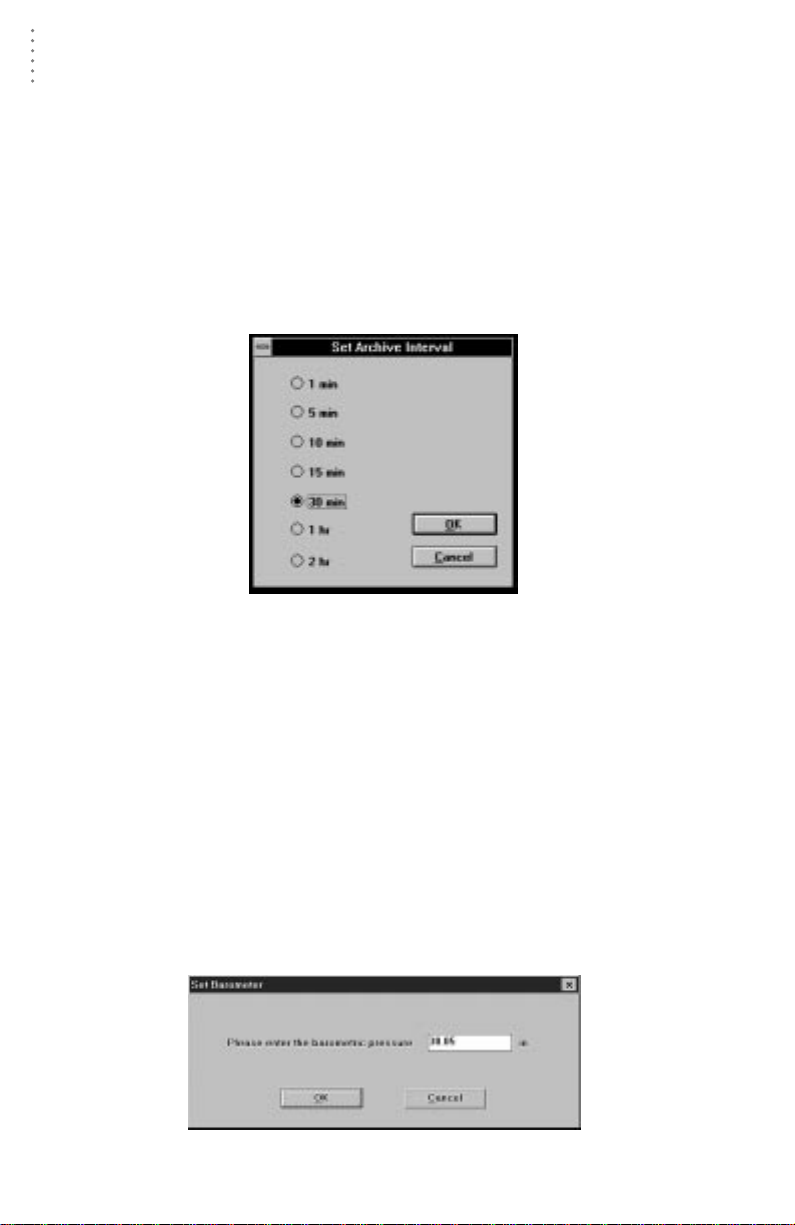
1. Choose Set Archive Interval from the Setup menu.
The Set Archive Interval dialog box appears.
SET A
RCHIVE INTERVAL
2. Select the desired archive interval and choose OK.
The software warns you that it is about to clear the archive memory.
3. To continue, choose OK.
The software sets the archive interval and clears the archive memory.
Set Barometer
You must set the barometer on your station console using the software (provided
your station has a barometer). For performance reasons, the software reads the
necessary calibration number for the barometer from the station’s configuration
file, rather than reading it from the console itself (see “Calibration Numbers” on
page 93). Therefore, in order for the software to display the correct barometric
pressure, you must set the barometer from the software.
1. Choose Set Barometer from the Setup menu.
The software opens the Set Barometer dialog box.
SET B
AROMETER
24
Page 34
USING THE SOFTWARE
2. Enter the correct barometric pressure and choose OK.
The software saves the change in barometric pressure to both the console and
the station’s configuration file.
Set Rain Cal
Y ou may set the rainfall calibration number on your station console using the software. Based on the type of rain collector you selected in station configuration (see
“Station Config” on page 19), the software automatically changes your station
console’s rainfall calibration number to the correct setting.
Note:
Consult your station manual for a more detailed description of the rainfall calibration number.
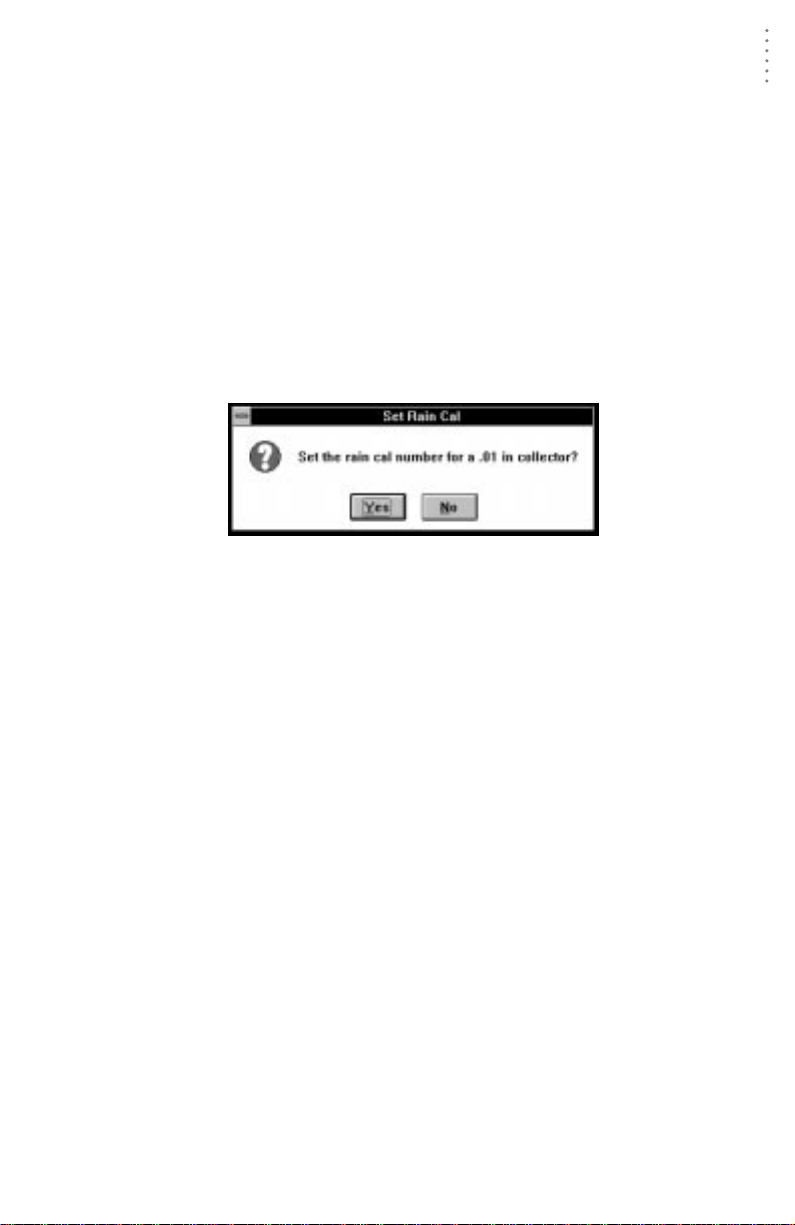
1. Choose Set Rain Cal from the Setup menu.
The software prompts you to confirm that you wish to change the rainfall calibration number.
SET R
AIN CAL
2. Choose Yes.
The software sets the rainfall calibration number on your station.
Setup Menu
Set Temp Cal
If you need to calibrate your temperature readings, you must set the temperature
calibration numbers on your station console using the software. For performance
reasons, the software reads the temperature calibration numbers from the station’s configuration file, rather than reading it from the console itself (see “Calibration Numbers” on page 93). Therefore, in order for the software to display the
correct temperature(s), you must set temperature calibration numbers from the soft-
ware.
Note:
Consult your station manual for a more detailed description of temperature calibration numbers.
25
Page 35
USING THE SOFTWARE
Setup Menu
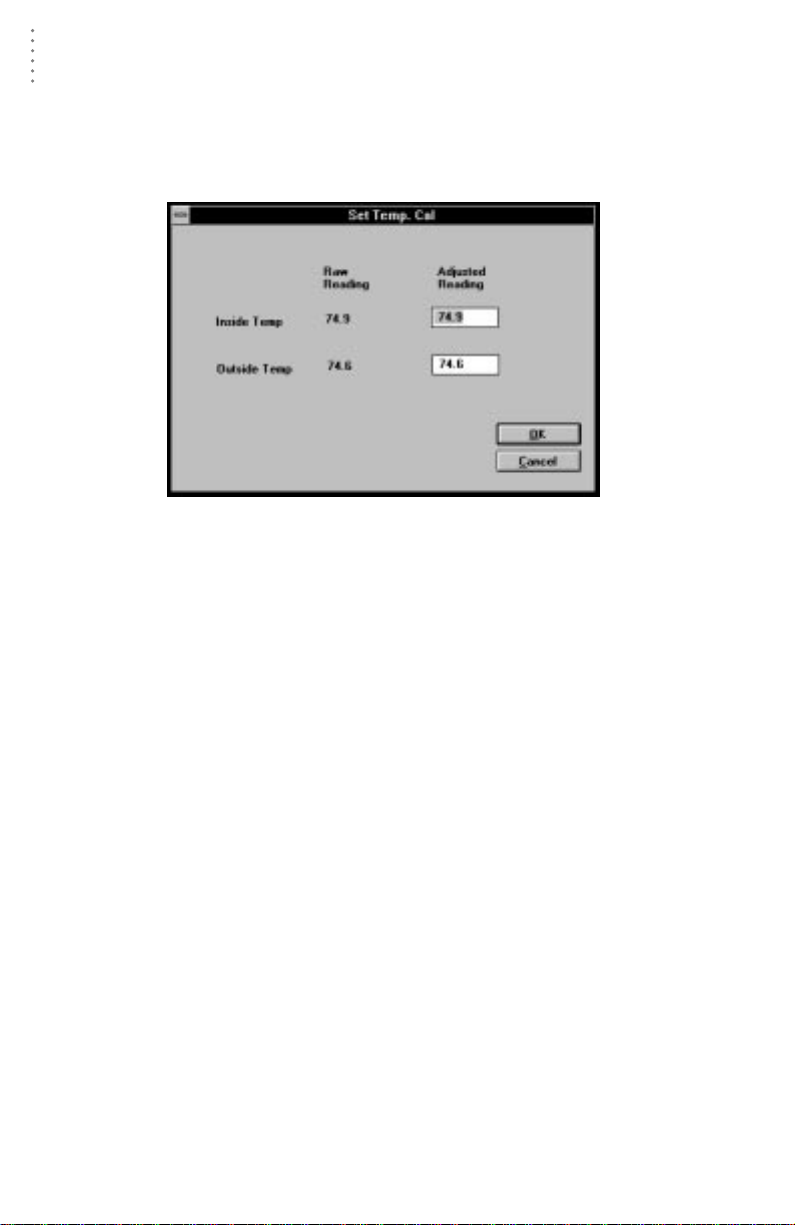
1. Choose Set Temp Cal from the Setup menu.
The Set Temp Cal dialog box appears. The raw reading shown in this dialog
box indicates the unadjusted reading coming from the sensor. The adjusted
reading indicates what the software displays, adjusted for any previously
entered calibration number.
SET T
EMP
2. Enter the desired adjusted reading and choose OK.
The software automatically calculates the necessary calibration number to
convert the raw reading into the adjusted reading and saves that calibration
number to the console and the station’s configuration file.
. C
AL
Set Hum Cal
If you need to calibrate your outside humidity reading, you must set the calibration number on your station console using the software. For performance reasons,
the software reads the calibration number from the station’s configuration file,
rather than reading it from the console itself (see “Calibration Numbers” on
page 93). Therefore, in order for the software to display the correct outside
humidity, you must set the outside humidity calibration number from the software.
Note:
Consult your station manual for a more detailed description of the outside humidity calibration number.
26
Page 36

USING THE SOFTWARE
1. Choose Set Hum Cal from the Setup menu.
The Set Hum Cal dialog box appears. The raw reading shown in this dialog
box indicates the unadjusted reading coming from the sensor. The adjusted
reading indicates what the software displays, adjusted for any previously
entered calibration number.
SET H
UMIDITY CAL
2. Enter the desired adjusted reading and choose OK.
The software automatically calculates the necessary calibration number to
convert the raw reading into the adjusted reading and saves that calibration
number to the console and the station’s configuration file.
Set Total Rain
You may want to enter a total rainfall amount to reflect any rainfall which
occurred before you obtained your station or before you started using the software. In order for the software’s rainfall totals to remain consistent with the station’s totals, you must enter total rainfall from the software. Once you set total rain,
the console and software will continue to accumulate rainfall normally.
1. Choose Set Total Rain from the Setup menu.
The Set Total Rain dialog box appears.
Setup Menu
SET T
OTAL RAIN
2. Enter the total rainfall amount and choose OK.
The software saves the total rainfall amount to the console and to the station’s
configuration file.
27
Page 37

USING THE SOFTWARE
Setup Menu
Set Alarms
You may quickly set the alarm thresholds on the station console using the software. Consult your station manual for information on the available alarms and
how they work.
1. Choose Set Alarms from the Setup menu or press Ctrl-A.
The Set Station Alarms dialog box appears.
SET S
TATION ALARMS
2. Enter the following information:
▲ High/Low Alarm
For all of the standard high/low alarms, enter the desired alarm threshold
into the text box. To clear an alarm, delete the contents of the text box.
▲ Dew Point
T urn on the dew point alarm by selecting the check box. Clear the alarm by
“de-selecting” the check box.
▲ Barometer
Select the desired change per hour which will trigger the barometer alarm.
To clear the alarm, select Off.
▲ Time
Enter the time at which the alarm should be triggered into the text box. To
clear the alarm, delete the contents of the text box.
3. When finished entering alarm information, choose Set.
The software sets the alarms on the station console to match the settings in this
dialog box.
Clear
You may quickly clear high/low registers and rainfall totals from the software.
Note:
This command will not clear the highs and lows on the bulletin if it is running.
28
Page 38

USING THE SOFTWARE
Setup Menu
1. Choose Clear from the Setup menu.
The Clear dialog box appears.
C
LEAR
2. Indicate which high/low registers and/or rainfall totals you wish to clear by selecting
the appropriate check box.
You may quickly select all high/low registers and rainfall totals by choosing
Check All. You may quickly de-select all high/low registers and rainfall totals
by choosing Check None.
3. To clear the selected high/low registers and/or rainfall totals, choose OK.
The software clears the selected high/low registers and/or rainfall totals on
the station console.
29
Page 39
USING THE SOFTWARE
Setup Menu
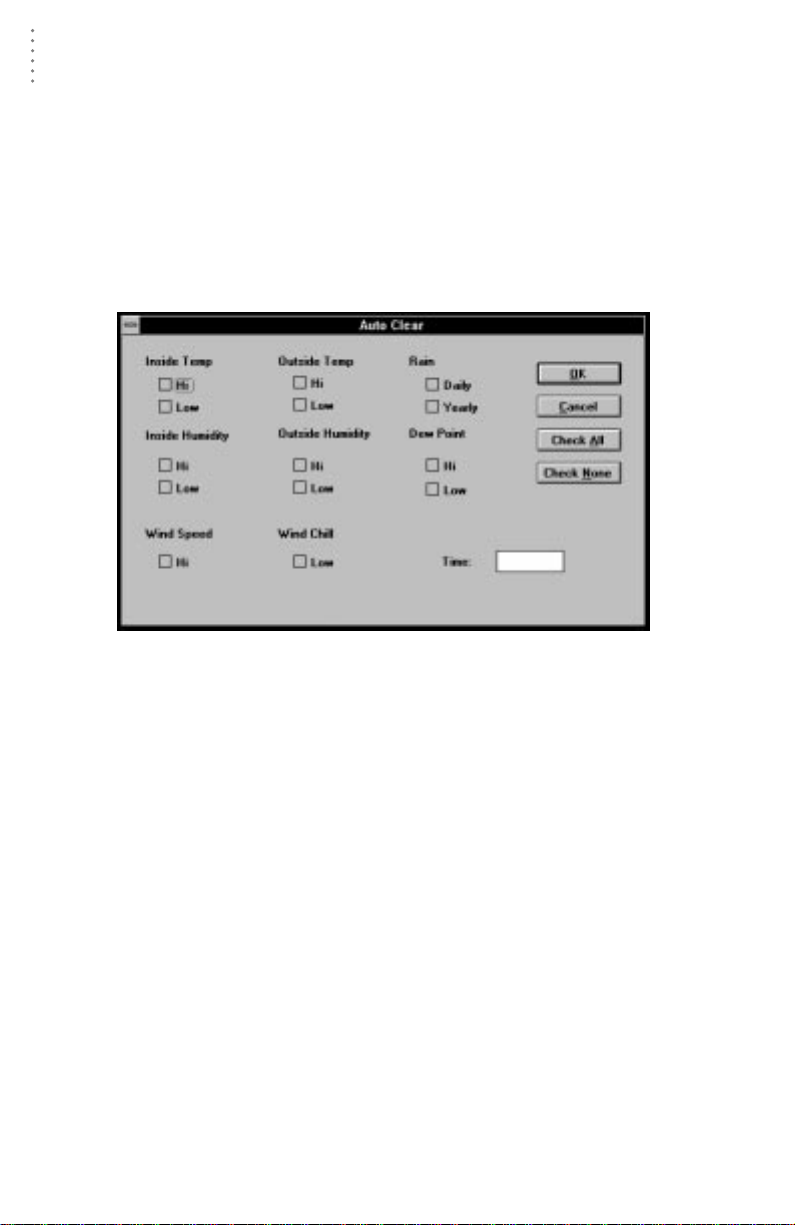
Auto Clear
You may set up the software to automatically clear selected high/low registers
and rainfall totals at a set time each day (the software must be running). For more
information on how the Auto Clear feature works, see “Automatic Clear” on
page 92.
Note:
This command
Clear occurs.
will
clear highs and lows on the bulletin if it is running at the time the Auto
1. Choose Set Auto Clear from the Setup menu.
The Auto Clear dialog box appears.
A
UTO CLEAR
2. Indicate which high/low registers and/or rainfall totals you wish cleared automatically
by selecting the appropriate check box.
You may quickly select all high/low registers and rainfall totals by choosing
Check All. You may quickly de-select all high/low registers and rainfall totals
by choosing Check None.
3. Enter the time at which you want the station to clear the selected highs and lows each
day into the Time text box.
4. When finished setting up Auto Clear, choose OK.
The software saves the Auto Clear settings. The selected high/low registers
and rainfall totals will be cleared at the specified time each day.
30
Page 40

USING THE SOFTWARE
Auto Download
You may set up the software to automatically download data at specified times
each day (the software must be running). For more information on how the automatic download feature works, see “Automatic Download” on page 92.
1. Choose Auto Download from the Setup menu or press Ctrl-J.
The Auto Download dialog box appears. The stations which appear in the
Auto Download List will be downloaded automatically.
Setup Menu
A
UTO DOWNLOAD
2. To add a station to the Auto Download List, double-click on the station name or select
the station from the Station Names list and choose Add.
The station name will be moved to the Auto Download List. You may select
more than one station before choosing Add to add several stations at once.
You may quickly add all stations in the Station Names list by choosing Add
All.
3. To remove a station from the Auto Download List, select the station and choose
Remove.
The station name will be removed from the Auto Download List. You may
select more than one station before choosing Remove to remove several stations at once. You may quickly remove all stations in the list by choosing
Clear.
31
Page 41
USING THE SOFTWARE
Setup Menu
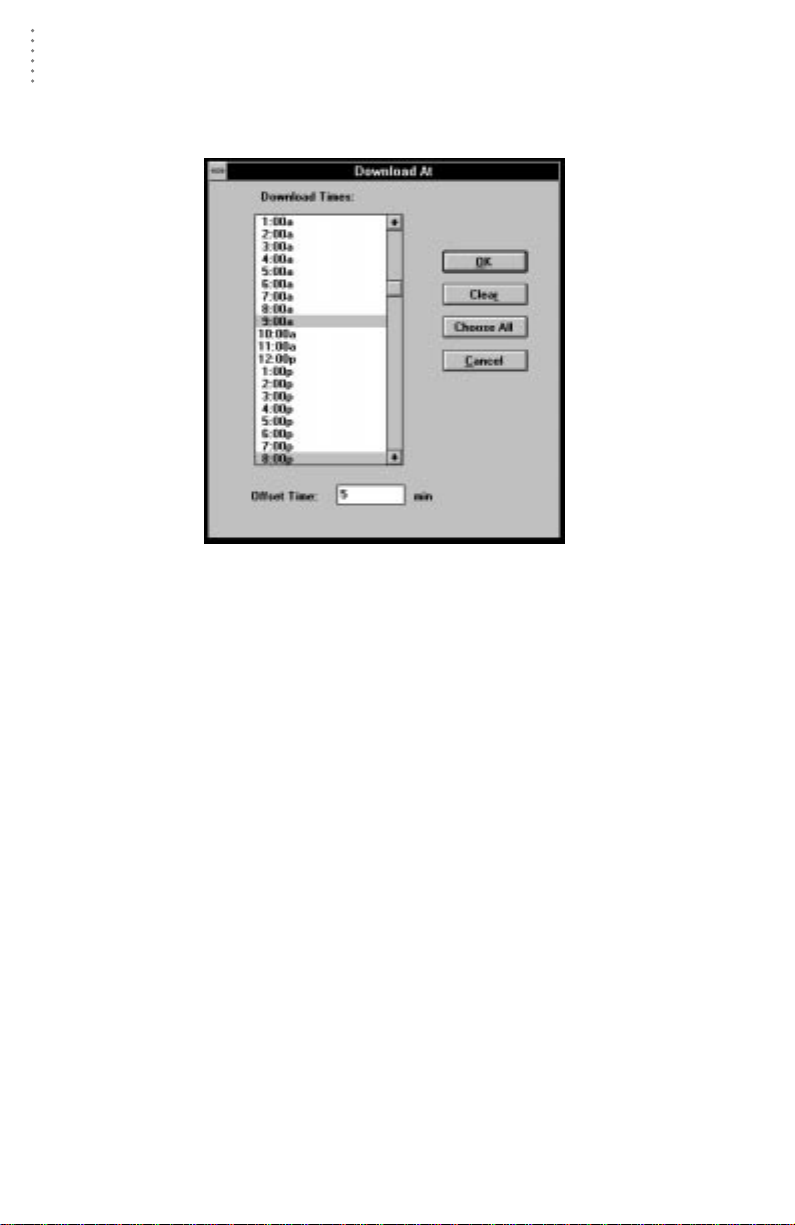
4. To set the time(s) at which the selected station should be downloaded, choose Download At.
The Download At dialog box appears.
D
OWNLOAD AT
5. Enter the following information:
▲ Download Times
Select the hour(s) at which the software should automatically download
information from this station by clicking on the desired hour in the list.
You may select as many download hours as you want; the software will
download data from your station during each of the specified hours. To
de-select a previously selected hour, click on it again. To quickly select all
hours, choose Choose All. To quickly clear all selected hours, choose Clear.
▲ Offset Time
To force the software to automatically download a specific number of minutes after the selected hour(s), enter the number of minutes here. For
example, In the illustration above, the software would automatically
download at 9:05 am and 8:05 pm.
6. After setting the download time(s), choose OK.
The software saves the automatic download time settings.
Auto Fax
You may set up the software to automatically fax weather data to you after each
automatic download (see “Auto Download” on page 31). If AutoFax is enabled,
the software creates a text file (“auto.fax“) which contains all weather data for the
current day and the previous day and then faxes that document to the number
you specify after the AutoDownload is complete. In order to use AutoFax, you
will need to have a working fax modem and know to which serial port the fax
modem is connected.
32
Page 42

USING THE SOFTWARE
1. Choose Auto Fax from the Setup menu or press Ctrl-X.
The Auto Fax Settings dialog box appears.
A
UTO FAX SETTINGS
2. Enter the following information:
▲ COM Port
Enter the number of the COM port to which your fax modem is connected.
▲ Fax Phone #
Enter the fax number to which you want the data sent.
▲ Modem Class
Select the modem class. Consult your fax modem’s documentation to
determine the correct class. If you are unsure, test the Auto Fax feature
using Modem Class 2.0, then 2, then 1 to determine which class will work
with your modem.
▲ Addressed To Information
Enter any desired addressing information. This information will appear at
the top of the fax.
▲ Modem Initialization String
Enter the desired modem initialization string in the text box. The default
modem initialization string should work in almost all cases. Before changing the modem string, see “Modem String” on page 99 for an explanation
of what each part of the string means.
▲ Fax After Auto Download
To enable Auto Fax, select this check box.
▲ Single Page/Multiple Page
The Auto Fax feature can be set to fax the entire contents of the auto.fax file
(on multiple pages) or it can be set to send you only the most recent data
(as much as will fit on a single page). Choose between these two modes by
selecting the desired option.
3. To test the Auto Fax, choose Test Fax.
The program will attempt to send a fax to the specified fax number. If successful, the program will inform you. If possible, you should also check the fax
itself to make sure it transmitted correctly.
Setup Menu
33
Page 43
USING THE SOFTWARE
Reports Menu
4. When finished, choose OK.
The software saves your Auto Fax settings.
REPORTS MENU
The Reports menu contains commands which allow you
to quickly generate reports using (in most cases) data in
your database. Each of the commands is explained separately below.
Printing Reports
To print any of the reports generated by the software,
choose Print from the File menu, click on the Print icon
in the Toolbar, or press Ctrl-P.
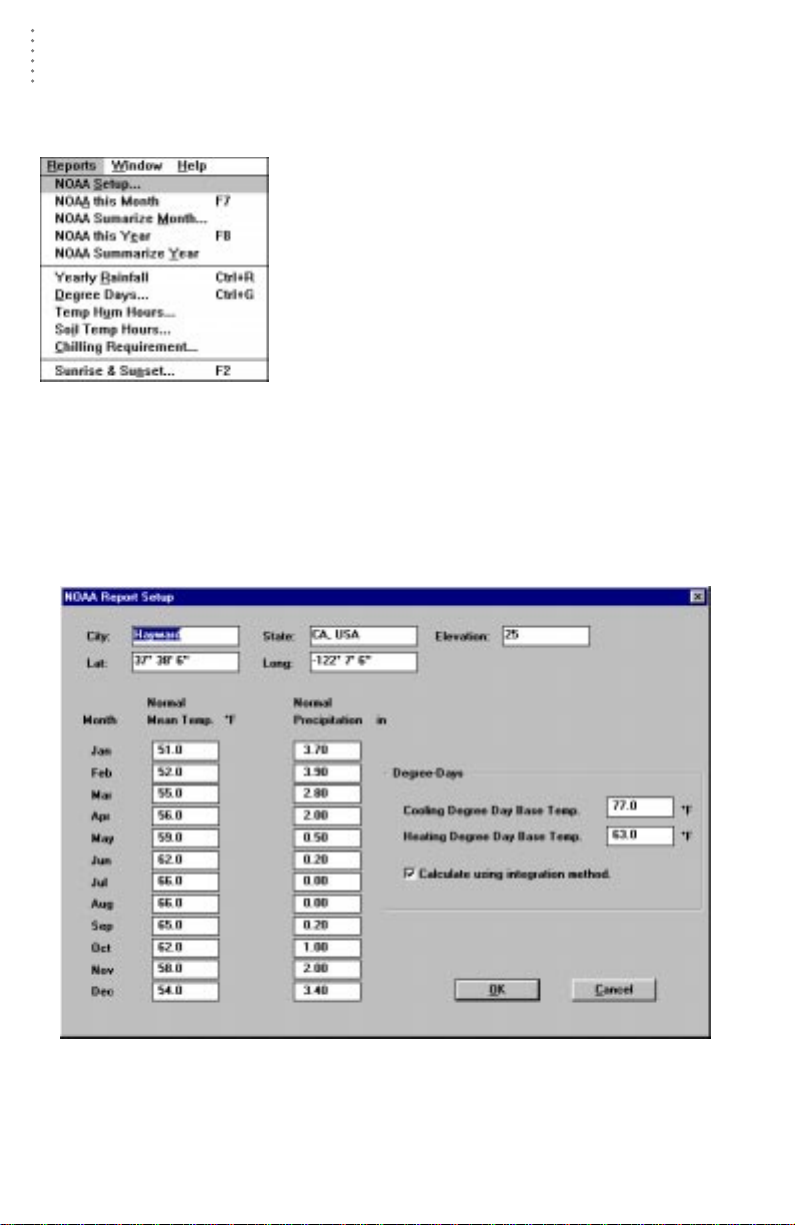
NOAA Setup
The software will automatically generate reports similar to Monthly and Yearly
NOAA (National Oceanic and Atmospheric Administration) ”weather watcher”
reports. Enter all necessary setup information using NOAA Setup, and the r eports
can be calculated in seconds.
1. Choose NOAA Setup from the Reports menu.
The NOAA Report Setup dialog box appears.
2. Enter the following information:
▲ City
Enter the city name into the text box.
34
NOAA R
EPORT SETUP
Page 44

USING THE SOFTWARE
▲ State
Enter the state name into the text box. If you wish, enter the country name
as well.
▲ Elevation
Enter the location’s elevation into the text box.
▲ Lat, Long
Enter the location’s longitude and latitude into the text box. When entering latitude, use negative numbers to represent southern latitudes. When
entering longitude, use negative numbers to represent western longitudes.
Note:
To enter the symbol for degrees (º) , you can either hold the Alt-key down while
pressing 0176 on the number pad of your keyboard, or you can copy the symbol from
the Character Map (in Start > Program > Accessories) and paste it into the dialog box
using Ctrl+V.
▲ Normal Mean Temp
Enter the normal mean temperature for each month of the year into the
appropriate text box.
▲ Normal Precipitation
Enter the normal mean precipitation for each month of the year into the
appropriate text box.
▲ Cooling Degree-Day Base Temp
Enter the desired cooling degree-day base temperature into the text box.
▲ Heating Degree-Day Base Temp
Enter the desired heating degree-day base temperature into the text box.
▲ Calculate using integration method
Calculate degree-days using integration method rather than averaging
high and low temperature reading for the day. See “Degree-Days” on
page 97 for a description of the two calculation methods.
3. After entering information, choose OK.
The software saves all NOAA report setup information.
Reports Menu
NOAA This Month
To quickly generate a NOAA monthly summary (see “NOAA Summarize
Month” below) using all existing data for the current month, choose NOAA This
Month, click on the NOAA icon in the toolbar, or press F7.
35
Page 45

USING THE SOFTWARE
Reports Menu
NOAA Summarize Month
The software can automatically generate a report similar to monthly NOAA
weather watcher reports using the information in your database and NOAA
Setup information (see “NOAA Setup” on page 34).
1. Choose NOAA Summarize Month from the Reports menu.
The Choose Month dialog box appears.
C
HOOSE MONTH
2. Select a month from the list.
3. Enter the desired file name into the Export File text box.
Whenever you create a monthly summary, the software automatically saves
an export file (ASCII text) which contains the report information. You may
enter the desired file name in this text box or you may use the default file
name.
36
Page 46

4. Choose OK.
The NOAA Monthly Summary appears.
USING THE SOFTWARE
Reports Menu
NOAA M
ONTHLY SUMMARY
General station information (Station Name, City, State, Units of Measure, etc.)
appears at the top of the report. For each day in the report, you may view the
following information (and a total for the month):
▲ Day
Each row in the report shows information for a single day. The date for
each row appears at the left of the row.
▲ Mean Temp
The mean temperature for the day. At the bottom of the column, the mean
temperature for the month is displayed.
▲ High & Time
The high temperature for the day and the time at which it occurred. At the
bottom of the column, the highest temperature recorded during the month
and the day on which it occurred is displayed.
37
Page 47

USING THE SOFTWARE
Reports Menu
▲ Low & Time
The low temperature for the day and the time at which it occurred. At the
bottom of the column, the lowest temperature recorded during the month
and the day on which it occurred is displayed.
▲ Heat Deg-Days
The number of heating degree-days accumulated on each day. At the bottom of the column, the total heating degree-days accumulated during the
month is displayed.
▲ Cool Deg-Days
The number of cooling degree-days accumulated on each day. At the bottom of the column, the total cooling degree-days accumulated during the
month is displayed.
▲ Rain
The rainfall accumulated on each day. At the bottom of the column, the
total rainfall accumulated during the month is displayed.
▲ Avg Wind Speed
The average wind speed for each day. At the bottom of the column, the
average wind speed of the month is displayed.
▲ High (Wind Speed) & Time
The high wind speed for the day and the time at which it occurred. At the
bottom of the column, the highest wind speed recorded during the month
and the day on which it occurred is displayed.
▲ Dom Direction
The dominant wind direction for the day. At the bottom of the column, the
dominant wind direction recorded during the month is displayed.
At the bottom of the report, the following monthly information is summarized.
▲ Max >= 90
The number of days on which high temperature was 90° F (32°C) or above.
▲ Max <= 32
The number of days on which high temperature was 32° F (0°C) or below.
▲ Min <= 32
The number of days on which low temperature was 32° F (0°C) or below.
▲ Min <= 0
The number of days on which low temperature was 0° F (-18°C) or below.
▲ Max Rain
The maximum rainfall on any single day during the month.
▲ Days of Rain
The number of days on which rainfall exceeded 0.01" (0.2 mm), 0.1"
(2 mm), or 1" (20 mm) is displayed.
5. To close the report, choose Close from the File menu, press Ctrl-F4, or double-click on
the Control-menu in the upper left corner of the window.
38
Page 48
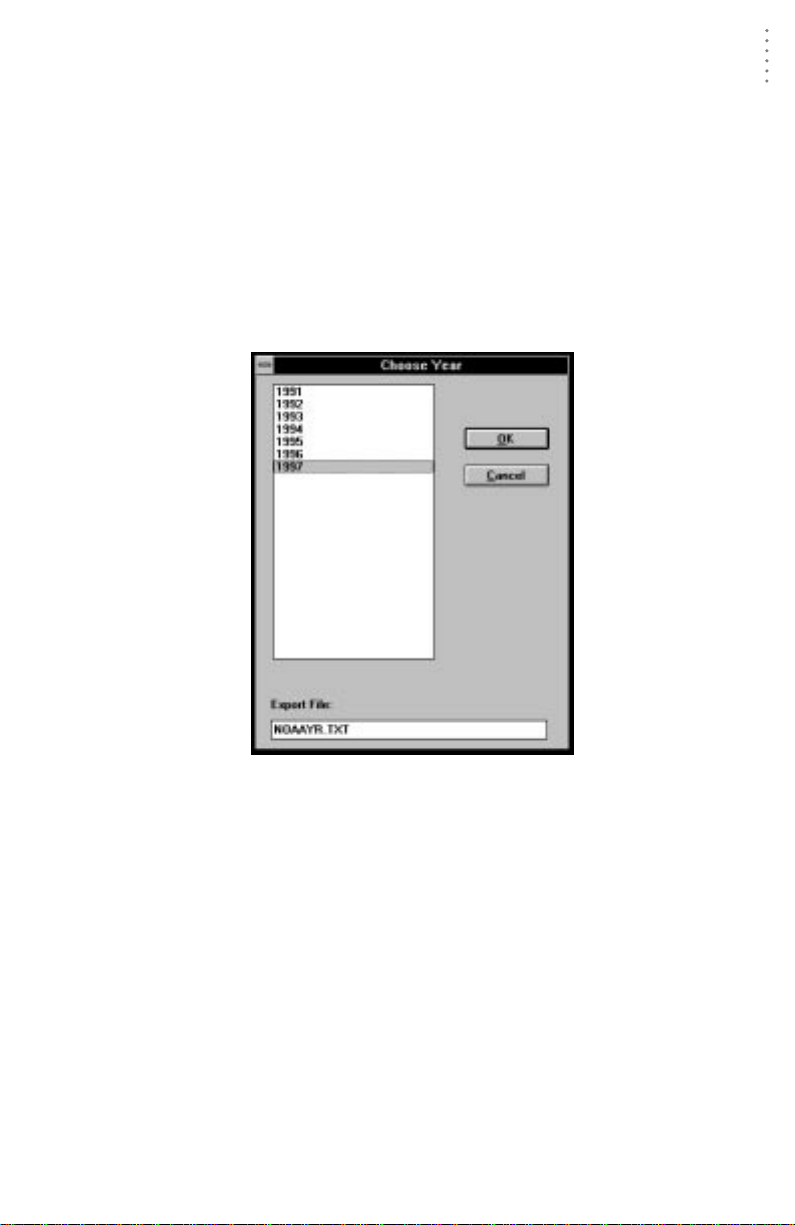
USING THE SOFTWARE
NOAA This Year
To quickly generate a NOAA yearly summary (see “NOAA Summarize Year”
below) using all existing data for the current year, choose NOAA This Year or
press F8.
NOAA Summarize Year
The software can automatically generate a report similar to yearly NOAA
weather watcher reports using the information in your database and NOAA
Setup information (see “NOAA Setup” on page 34).
1. Choose NOAA Summarize Year from the Reports menu.
The Choose Year dialog box appears.
Reports Menu
C
HOOSE YEAR
2. Select a year from the list.
3. Enter the desired file name into the Export File text box.
Whenever you create a yearly summary, the software automatically saves an
export file (ASCII text) which contains the report information. You may enter
the desired file name in this text box or you may use the default file name.
39
Page 49

USING THE SOFTWARE
Reports Menu
4. Choose OK.
The NOAA yearly summary appears. General station information (Station
Name, City, State, Units of Measure, etc.) appears at the top of the report.
Below that is the temperature summary section.
40
NOAA Y
EARLY SUMMARY
(T
EMPERATURE
)
For each month in the report, you may view the following temperature information (and a total/average for the year):
▲ YR & MO
Each row in the report shows information for a single month. The month
and year appear at the left of the row.
▲ Mean Max
The average of daily maximum temperatures for the month. At the bottom
of the column, the mean maximum temperature for the year is displayed.
▲ Mean Min
The average of daily minimum temperatures for the month. At the bottom
of the column, the mean minimum temperature for the year is displayed.
▲ Mean
The mean temperature for the month. At the bottom of the column, the
mean temperature for the year is displayed.
Page 50

USING THE SOFTWARE
Reports Menu
▲ Dep. From Norm
The amount by which the mean temperature departed from normal for the
month. At the bottom of the column, the amount by which the mean temperature departed from normal for the year is displayed.
Note:
For values (other than 0) to appear here, you need to first setup your NOAA report.
See “NOAA Setup” on page 34 for details.
▲ Heat Deg-Days
The number of heating degree-days accumulated during each month. At
the bottom of the column, the total heating degree-days accumulated during the year is displayed.
▲ Cool Deg Days
The number of cooling degree-days accumulated during each month. At
the bottom of the column, the total cooling degree-days accumulated during the year is displayed.
▲ Hi & Date
The highest temperature for the month and the date on which it occurred.
At the bottom of the column, the highest temperature recorded during the
year and the month in which it occurred is displayed.
▲ Low & Date
The lowest temperature for the month and the date on which it occurred.
At the bottom of the column, the lowest temperature recorded during the
year and the month in which it occurred is displayed.
▲ Max >= 90 (32)
The number of days on which high temperature was 90° F (32°C) or above
during the month. At the bottom of the column, the total number of days
on which the high temperature was 90° F (32°C) or above during the year
is displayed.
▲ Max <= 32 (0)
The number of days on which high temperature was 32° F (0°C) or below
during the month. At the bottom of the column, the total number of days
on which the high temperature was 32° F (0°C) or below during the year is
displayed.
▲ Min <= 32 (0)
The number of days on which low temperature was 32° F (0°C) or below
during the month. At the bottom of the column, the total number of days
on which the low temperature was 32° F (0°C) or below during the year is
displayed.
▲ Min <= 0 (-18)
The number of days on which low temperature was 0° F (-18°C) or below
during the month. At the bottom of the column, the total number of days
on which the low temperature was 0° F (-18°C) or below during the year is
displayed.
41
Page 51

USING THE SOFTWARE
Reports Menu
Below the temperature summary section, the rainfall summary section
appears.
For each month in the report, you may view the following rainfall information
(and a total/average for the year):
▲ YR & MO
Each row in the report shows information for a single month. The month
and year appear at the left of the row.
▲ Total
The total rainfall for the month. At the bottom of the column, the total rainfall for the year is displayed.
▲ Dep. From Norm
The amount by which the total rainfall departed from normal for the
month. At the bottom of the column, the amount by which the total rainfall departed from normal for the year is displayed.
Note:
▲ Max Obs. Day & Date
The highest rainfall total for an single day during the month and the date
on which it occurred. At the bottom of the column, the highest rainfall
total for any single day during the year and the month during which it
occurred are displayed.
▲ Days of Rain Over .01 (0.2)
The number of days on which rainfall exceeded 0.01" (0.2 mm) during the
month. At the bottom of the column, the number of days on which rainfall
exceeded 0.01" (0.2 mm) during the year is displayed.
▲ Days of Rain Over .1 (2)
The number of days on which rainfall exceeded 0.1" (2 mm) during the
month. At the bottom of the column, the number of days on which rainfall
exceeded 0.1" (2 mm) during the year is displayed.
42
NOAA Y
EARLY SUMMARY
For values (other than 0) to appear here, you need to first setup your NOAA report.
See “NOAA Setup” on page 34 for details.
(R
AINFALL
)
Page 52

USING THE SOFTWARE
Reports Menu
▲ Days of Rain Over 1 (20)
The number of days on which rainfall exceeded 1" (20 mm) during the
month. At the bottom of the column, the number of days on which rainfall
exceeded 1" (20 mm) during the year is displayed.
Below the rainfall summary section, the wind summary section appears.
NOAA Y
EARLY SUMMARY
(W
IND
)
For each month in the report, you may view the following wind information
(and an average for the year):
▲ YR & MO
Each row in the report shows information for a single month. The month
and year appear at the left of the row.
▲ Avg
The average wind speed for the month. At the bottom of the column, the
average wind speed for the year is displayed.
▲ Hi & Date
The high wind speed for the month and the date on which it occurred. At
the bottom of the column, the highest wind speed recorded during the
year and the month in which it occurred is displayed.
▲ Dom Dir
The dominant wind direction for the month. At the bottom of the column,
the dominant wind direction during the year is displayed.
5. To close the report window, double-click on the Control-menu in the upper left corner
of the window, or press Ctrl-F4.
43
Page 53

USING THE SOFTWARE
Reports Menu
Yearly Rainfall
You may generate rainfall reports which show rainfall totals for all years in the
database and any years for which you want to enter your own data. The rainfall
report database is kept separate from the station database, so you may alter rainfall information in the rainfall database without affecting the station database.
1. Choose Yearly Rainfall from the Reports menu, click on the Yearly Rain icon in the toolbar, or press Ctrl-R.
The software opens the Yearly Rainfall window.
Note:
The first time you open the rainfall report, you will be prompted to confirm that you want
to generate the rainfall database. Choose Yes to generate the rainfall database. Depending on the amount of data in your database, it may take a while to generate the rainfall
report.
Y
EARLY RAINFALL
2. See “Using the Yearly Rainfall Database” on page 80 for instructions on using the
yearly rainfall report.
44
Page 54

USING THE SOFTWARE
Degree-Days
The software can calculate degree-days for an almost infinite number of plants,
pests, etc. See “Degree-Days” on page 97 for a description of degree-days.
1. Choose PC Degree Days from the Reports menu or press Ctrl-G.
The PC Degree Days list box appears.
Reports Menu
PC D
EGREE DAYS
2. See “Degree-Days” starting on page 84 for instructions on using the degree-day calcu-
lation feature.
45
Page 55
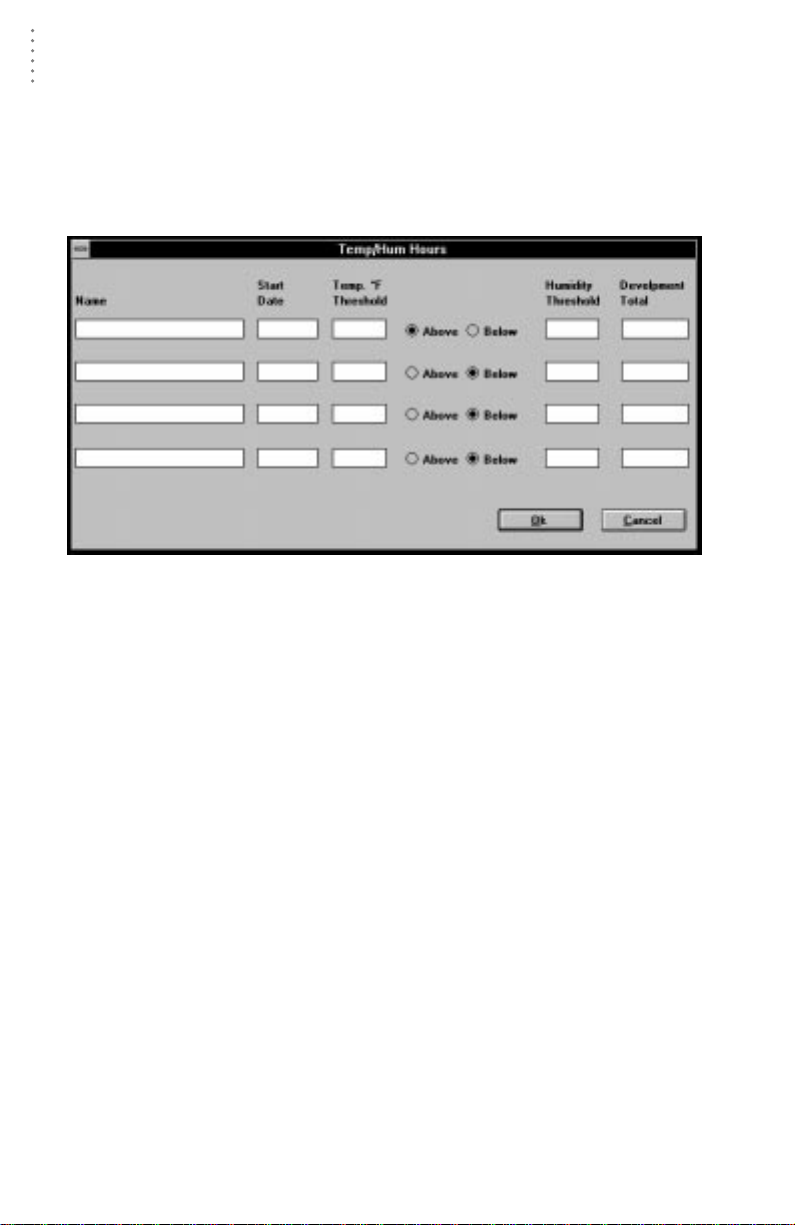
USING THE SOFTWARE
Reports Menu
Temp/Hum Hours
You may track the number of hours temperature is above or below a certain
threshold and humidity is above a certain threshold. See “Temperature/Humidity
Hours” on page 98 for a description of temperature/humidity hours.
1. Choose Temp/Hum Hours from the Reports menu.
The Temp/Hum Hours dialog box appears.
T
EMP/HUM HOURS
2. For each temp/hum hour total you wish to track, enter the following:
▲ Name
Enter the name of the crop/pest for which you want temp/hum hours calculated into the text box.
▲ Start Date
Enter the date from which you want temp/hum hours calculated into the
text box.
▲ Temp Threshold
Enter the temperature threshold for this crop/pest into the text box.
▲ Above/Below
Select whether the software should calculate temp/hum hours based on
the number of hours above or below the temperature threshold. (Above
means greater than or equal to, below means less than or equal to.)
▲ Humidity Threshold
Enter the humidity threshold for this crop/pest into the text box.
▲ Development Total
Enter the number of temp/hum hours required for this crop/pest to
develop.
46
Page 56

USING THE SOFTWARE
Reports Menu
3. After entering all necessary information, choose OK to view the temp/hum hours
report.
The software calculates and displays temp/hum hours information.
T
EMP/HUM HOURS REPORT
The temp/hum hours report contains the following information:
▲ Name, Start Date, Thresholds
The report shows the name, start date, and the thresholds you entered.
▲ Days Occurred
The report shows the number of days on which temp/hum hours
occurred.
▲ Total for prior 3 days
The report shows the number of temp/hum hours which occurred on each
of the past 3 days.
▲ Development Total
The reports shows the development total you entered.
▲ Hours to Go
The report shows the total temp/hum hours left before the development
total is reached.
▲ Days to Go
The report shows the expected number of days before the development
total is reached. This calculation is based on the average number of temp/
hum hours during the last three complete days.
47
Page 57

USING THE SOFTWARE
Reports Menu
Soil Temp. Hours
You may track the number of hours soil temperature is above a certain threshold.
See “Soil Temperature Hours” on page 98 for a description of soil temperature
hours.
1. Choose Soil Temp Hours from the Reports menu.
The Soil Temp Hours dialog box appears.
S
OIL TEMP HOURS
2. Enter the following information:
▲ Start Date
Enter the starting date for which you want soil temperature hours calculated into the text box.
▲ End Date
Enter the ending date for which you want soil temperature hours calculated into the text box.
▲ Temp Threshold
Enter the soil temperature threshold above which you want soil temperature hours calculated into the text box.
48
Page 58
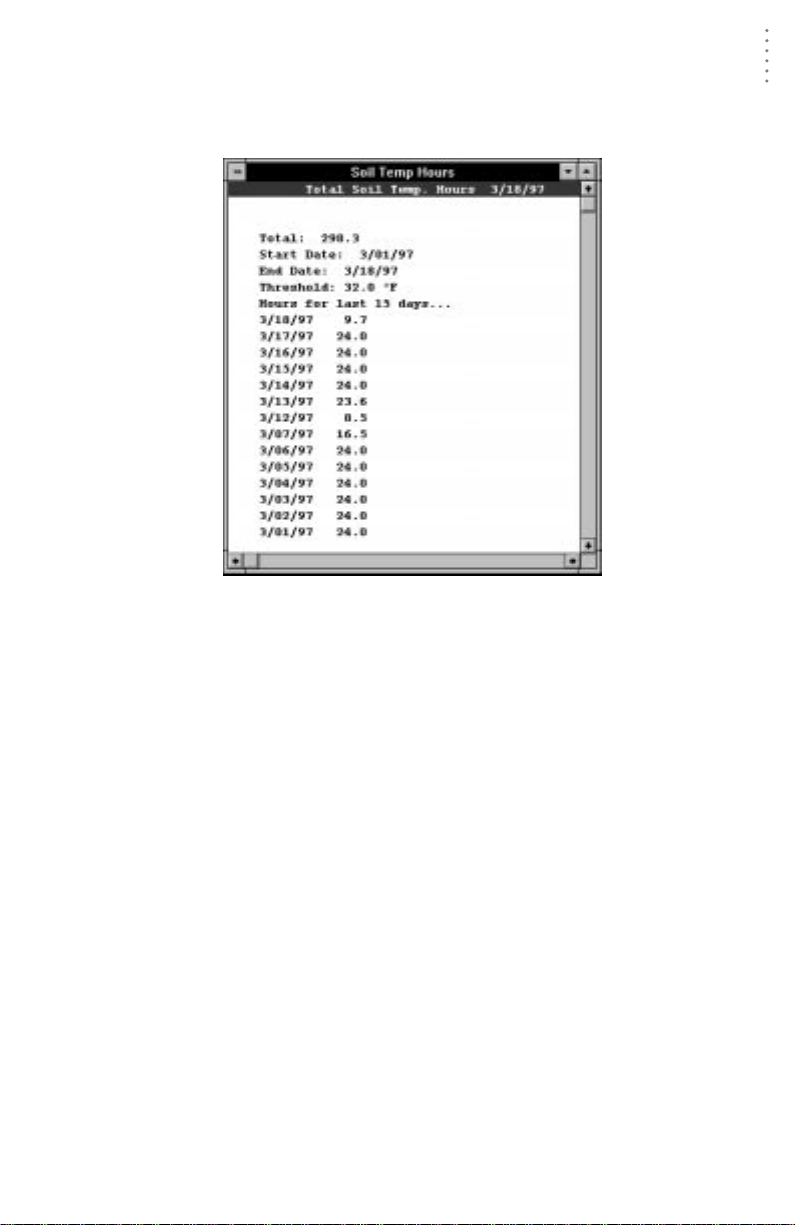
USING THE SOFTWARE
Reports Menu
3. After entering all necessary information, choose OK to view the soil temperature hours
report.
The software calculates and displays soil temperature hours information.
S
OIL TEMP HOURS REPORT
The soil temperature hours report contains the following information:
▲ Total
The total number of soil temperature hours which occurred during the
selected period of time.
▲ Start Date, End Date, Threshold
The report shows the start and end dates and the threshold you entered.
▲ Hours for the last 15 days
The report shows the number of soil temperature hours which occurred on
each of the past 15 days.
49
Page 59
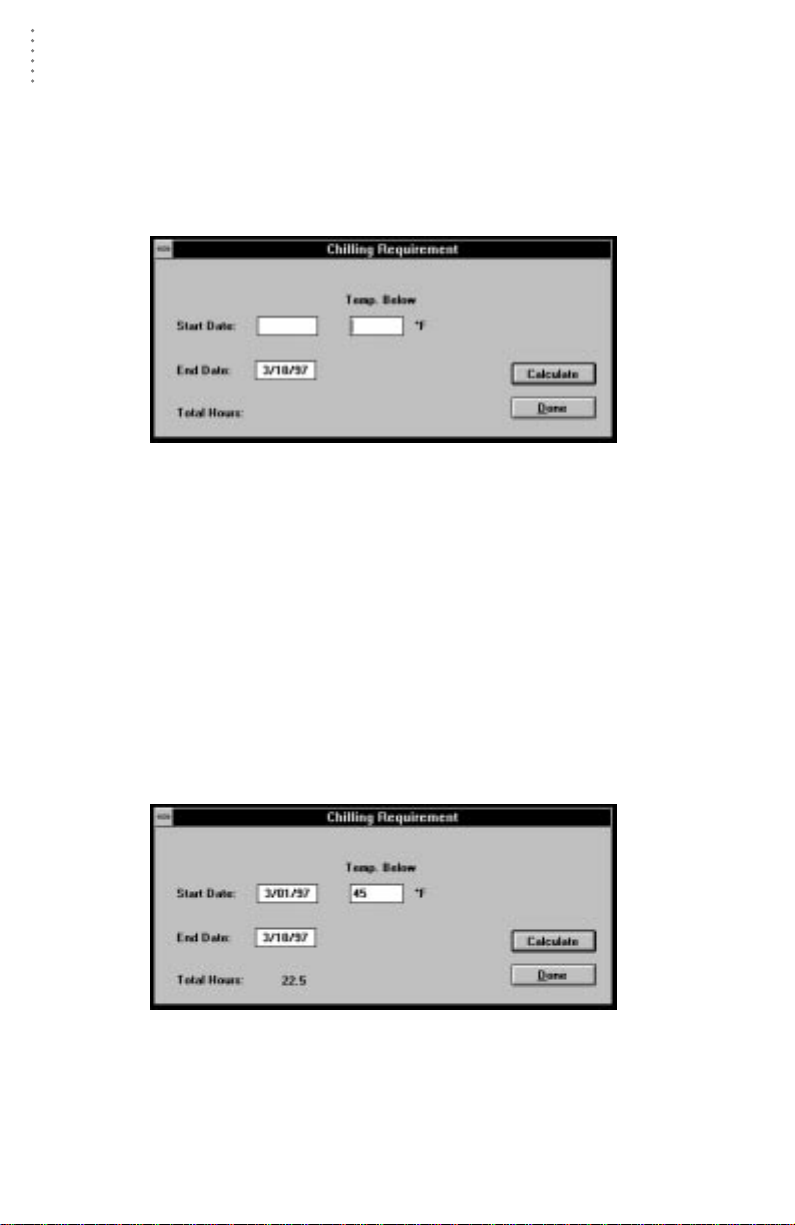
USING THE SOFTWARE
Reports Menu
Chilling Requirement
You may calculate chilling requirements by entering a start and end date and a
temperature threshold. See “Chilling Requirement” on page 97 for a description
of Chilling Requirements.
1. Choose Chilling Requirement from the Reports menu.
The Chilling Requirement dialog box appears.
C
HILLING REQUIREMENT
2. Enter the following information:
▲ Start Date
Enter the starting date for which you want chilling requirement calculated
into the text box.
▲ End Date
Enter the ending date for which you want chilling requirement calculated
into the text box.
▲ Temp. below
Enter the temperature below which you want chilling requirement calculated.
3. When finished, choose Calculate.
The software calculates chilling requirement for the selected period and displays that information at the bottom of the dialog box.
4. To exit, choose Done.
50
C
HILLING REQUIREMENT CALCULATED
(22.5 H
OURS
)
Page 60

Sunrise & Sunset
You may calculate sunrise and sunset times for any location and date.
1. Choose Sunrise & Sunset from the Reports menu or press F2.
The Sunrise & Sunset dialog box appears.
S
UNRISE
& S
UNSET
2. Enter the following information:
▲ Date
Enter the date for the report. If calculating for a day, the software calculates sunrise and sunset for the entered date. If calculating for a month or a
year, the softwar e calculates sunrise and sunset for the month/year during
which the date falls.
▲ Time Zone
Select the appropriate time zone from the drop-down list. Use the time
zone selection to adjust the calculated sunrise/sunset times to the desired
time zone. Note that the software uses the longitude and latitude to actually determine the times; the time zone simply allows it to adjust the time
correctly.
▲ Daylight Savings Time
Select this check box if you are currently on daylight savings time. The
software adjusts the times for daylight savings only if this check box is
selected.
▲ Latitude/Longitude
Enter the latitude and longitude of the location for which you want sunrise and sunset times calculated.
▲ Calculate
Select the length of time for which you want Sunrise and Sunset times calculated by selecting either Day, Month, or Year.
USING THE SOFTWARE
Reports Menu
51
Page 61

USING THE SOFTWARE
Reports Menu
3. After entering all necessary information, choose OK.
The software calculates sunrise and sunset times and displays the information.
S
UNRISE
& S
UNSET REPORT
The report contains the following information:
▲ Latitude/Longitude
The report shows the latitude and longitude setting you entered.
▲ Time Zone
The report shows the time zone you selected.
▲ Greenwich Offset
The number of hours the sunrise/sunset times are offset from Greenwich
Mean Time (due to time zone and daylight savings adjustments) is shown.
▲ Daylight Savings Time
The report shows whether the daylight savings time setting is on or off.
▲ Date
Each row in the report shows the sunrise and sunset times for a single day.
The date for each row appears at the left of the row.
▲ Twilight Times (Morning and Evening)
The report lists twilight times for both morning and evening for each day
in the report. The morning twilight times appear on the left and the
evening twilight times appear on the right. There are three separate twilight times listed for each:
▲ Astronomical Twilight (Astro) is defined as the time at which the
center of the sun is 18° below the horizon.
▲ Nautical Twilight (Naut) is defined as the time at which the center of
the sun is 12° below the horizon.
▲ Civil Twilight (Civil) is defined as the time at which the center of the
sun is 6° below the horizon.
52
Page 62
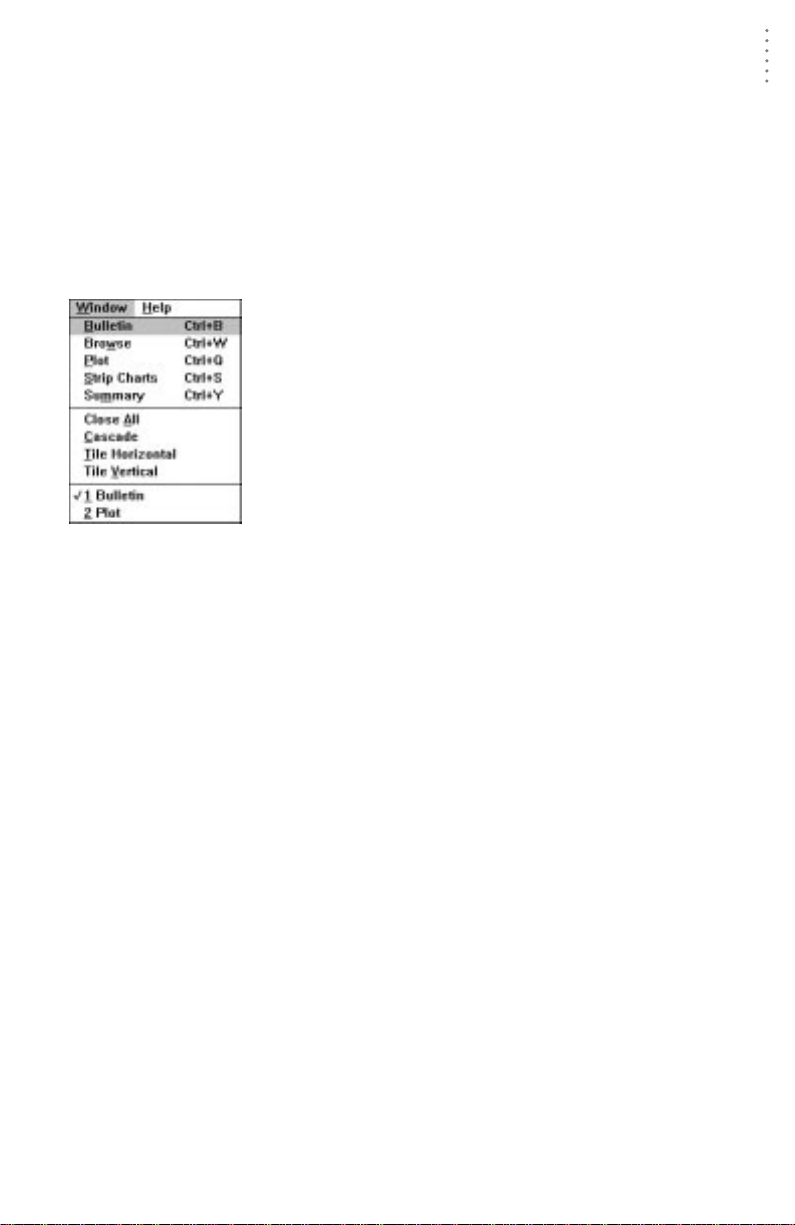
USING THE SOFTWARE
▲ Sunrise
The report lists the time at which sunrise (defined as the time at which the
upper limb of the sun appears) occurs for each day in the report.
▲ Sunset
The report lists the time at which sunset (defined as the time at which the
upper limb of the sun disappears) occurs for each day in the report.
▲ Daylight Hours
The report shows the total hours of daylight for each day in the report.
Windows Menu
WINDOWS MENU
The commands in the Windows menu allow you open and use
many of the software’s most important features: bulletin, database browser, plot window, strip charts, and the summary window.
The Windows menu also contains standard commands for closing, cascading, and tiling all open program windows. In addition, the names of open program windows are listed at the
bottom of the menu, allowing you to quickly bring the desired
window to the “front.”
53
Page 63
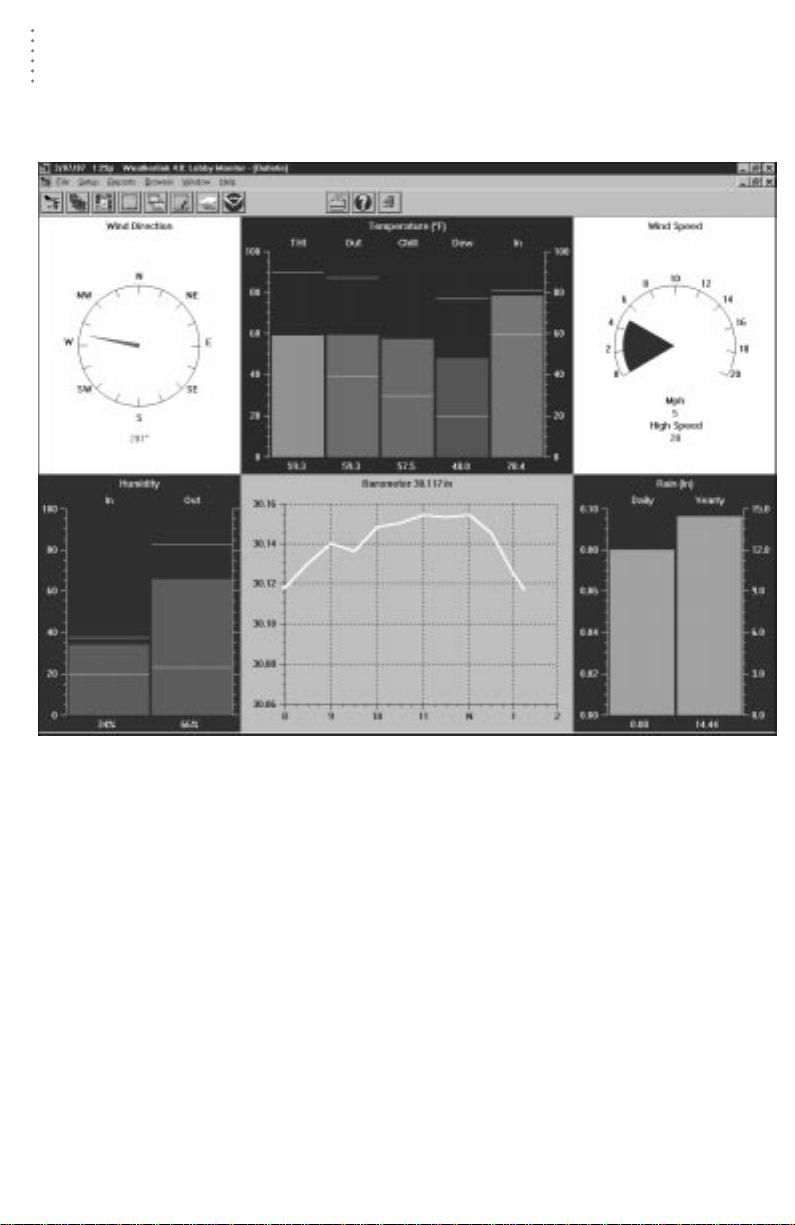
USING THE SOFTWARE
Windows Menu
Bulletin
The bulletin provides a graphic representation of current weather conditions
(with the numeric reading displayed as well) which updates in real-time.
B
ULLETIN
For all bar graphs (outside temperature, for example), highs and lows are represented by yellow lines which appear above the bar (high) or within the bar (low).
When you first open the bulletin window, the software prompts you to indicate
whether you want to download highs and lows from the station. Downloading
highs and lows causes the software to read highs and lows from the weather station and display them on the weather bulletin. If you download highs and lows it
takes a bit longer to open the bulletin window. If you do not download highs and
lows, the highs and lows shown in the bulletin window will only reflect the highs
and lows recorded while the bulletin is open. As long as the bulletin is open, the
software automatically updates highs and lows as they occur. (If a scheduled
Auto Clear occurs while the bulletin is open, any high or low that is cleared on the
console is also cleared on the bulletin.)
The bulletin displays a line graph of barometric pressure over the past six hours.
When you first open the bulletin window, the software graphs the current barometric pressure and any barometric pressure data which exists in your database
for the past six hours. While the bulletin is open, the software plots another point
on this graph every 15 minutes.
54
Page 64
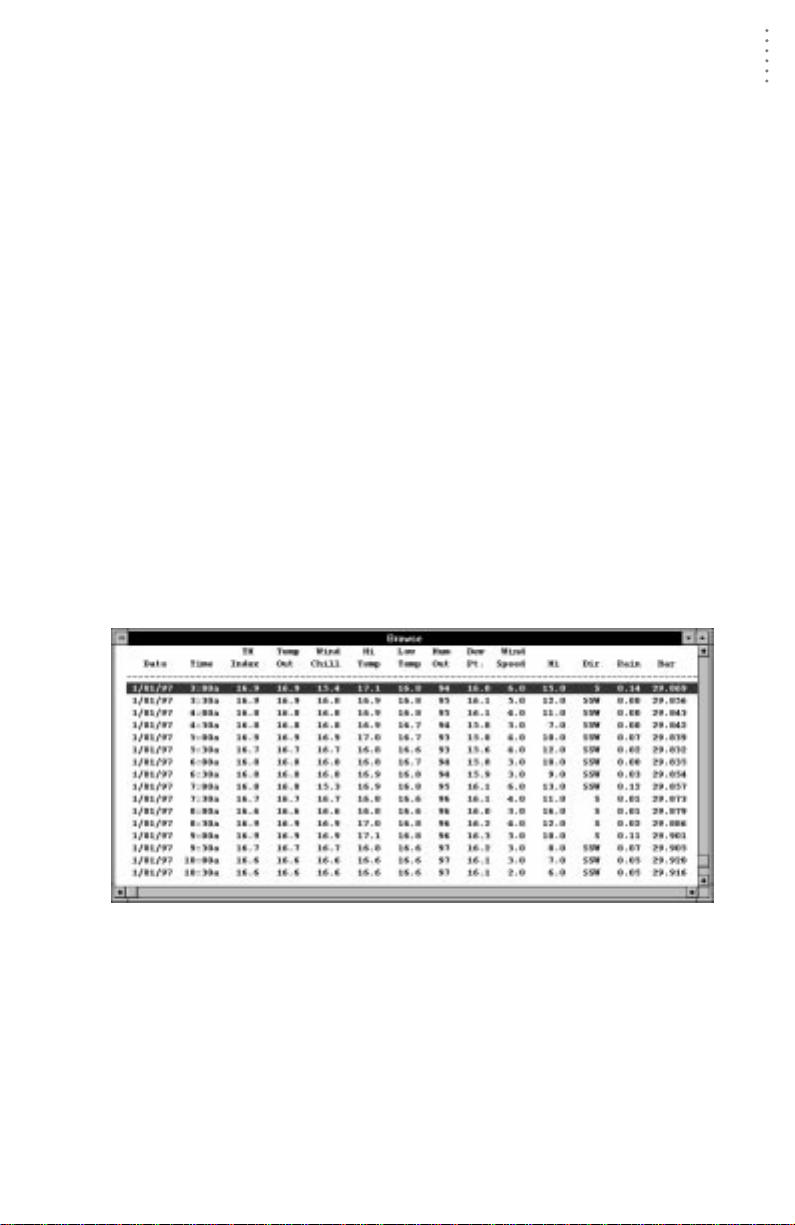
USING THE SOFTWARE
▲ To start the bulletin, choose Bulletin from the Windows menu, click on the Bulletin
icon in the toolbar, or press Ctrl-B.
The software prompts you to indicate whether you want to download highs
and lows. Choose Yes or No to continue.
▲ To view the Summary window which lists all current weather information (includ-
ing the time and date at which highs and lows occurred) press Page Down or right
mouse click in the bulletin window.
▲ To print the bulletin, choose Print from the File menu, click on the Print icon in the
toolbar, or press Ctrl-P.
Set your printer options in the Print dialog box (for best results, be sure to
choose landscape mode) and then choose OK.
▲ To close the bulletin, choose Close from the File menu, double-click on the Control-
menu box in the upper left corner of the window or press Ctrl-F4.
Browse
The Browse window allows you to view the raw data collected by your station. In
addition to viewing data, you may edit records, print data, export data for use in
database or spreadsheet programs, or add notes to individual records.
▲ To open the Browse window, choose Browse from the Windows menu, click on the
Database icon in the toolbar, or press Ctrl-W.
The Browse window appears. For complete instructions on using the Browse
window, see “Using the Browse Window” on page 59.
Windows Menu
B
ROWSE WINDOW
55
Page 65

USING THE SOFTWARE
Windows Menu
Plot
The WeatherLink software includes a powerful plotting engine which allows you
to plot as many conditions as you want on a single plot. You can also save plots
and plot templates for later viewing.
▲ To plot data, choose Plot from the Windows menu, click on the Plot icon in the tool-
bar, or press Ctrl-Q.
The Plot window appears. For complete instructions on using the Plot window, see “Using the Plot Window” on page 65.
P
LOT WINDOW
Strip Charts
The strip charts offer you 4 line graphs which update in real-time as long as they
are open. You may select the data you want to plot on the strip charts and the
span over which you want it plotted.
56
Page 66
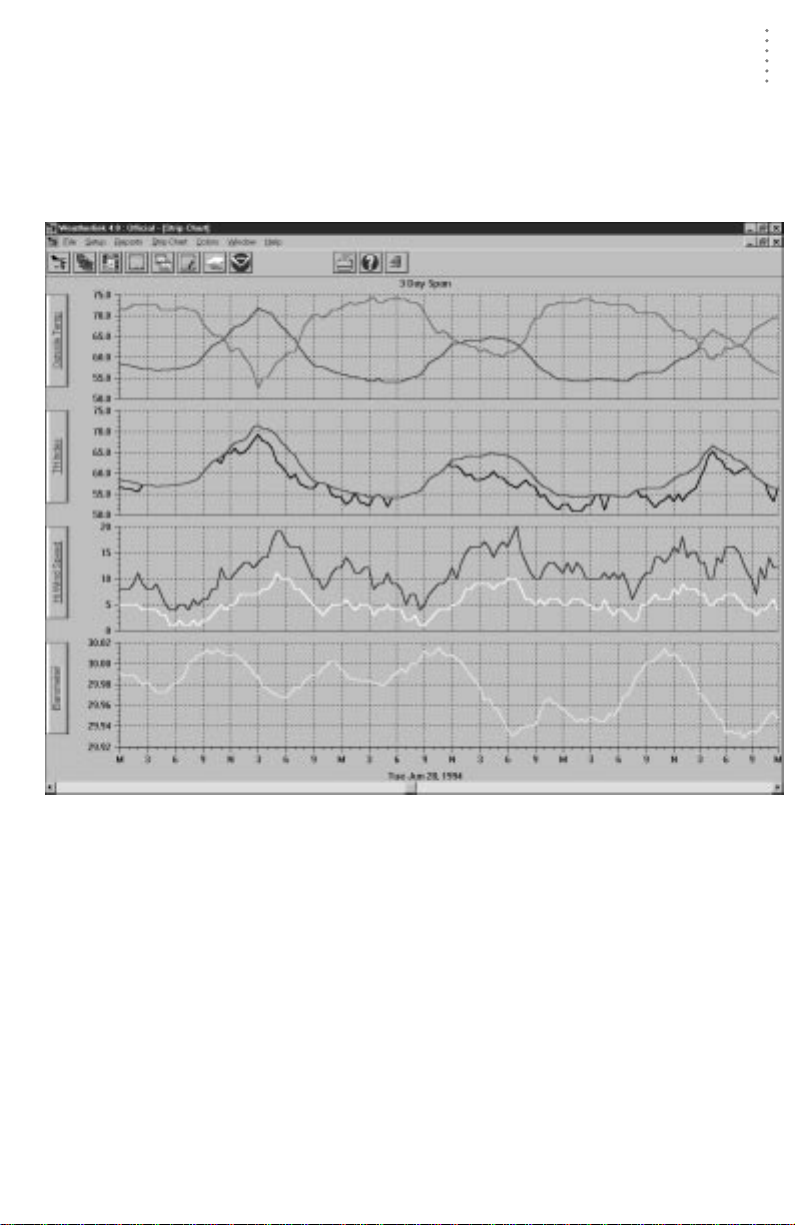
USING THE SOFTWARE
Windows Menu
▲ To use the strip charts, choose Strip Charts from the Windows menu, click on the
Strip Chart icon in the toolbar, or press Ctrl-S.
The software automatically downloads data from the open station in order to
fill out the entire strip chart. After downloading, the Strip Chart window
appears. For complete instructions on using the Strip Charts, see “Using the
Strip Charts” on page 76.
S
TRIP CHART
57
Page 67
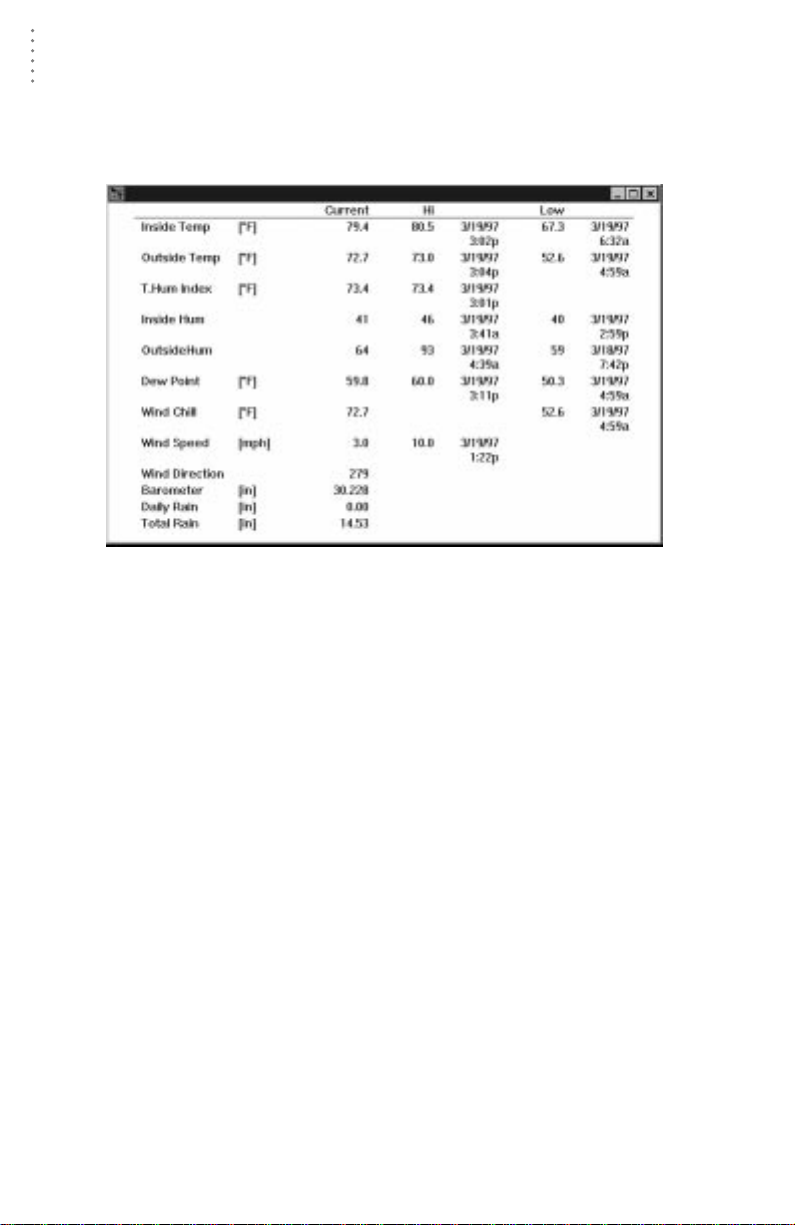
USING THE SOFTWARE
Windows Menu
Summary
The summary shows a text table of all current conditions as well as the highs and
lows along with the time and date at which they occurred. The information on the
high/low summary is updated in the same way as the bulletin.
S
UMMARY WINDOW
▲ To start the summary, choose Summary from the Windows menu or press Ctrl-Y.
The software prompts you to indicate whether you want to download highs
and lows. Choose Yes or No to continue.
▲ To print the summary, choose Print from the File menu, click on the Print icon in the
toolbar, or press Ctrl-P.
▲ To close the summary, choose Close from the File menu, double-click on the Con-
trol-menu box in the upper left corner of the window or press Ctrl-F4.
58
Page 68
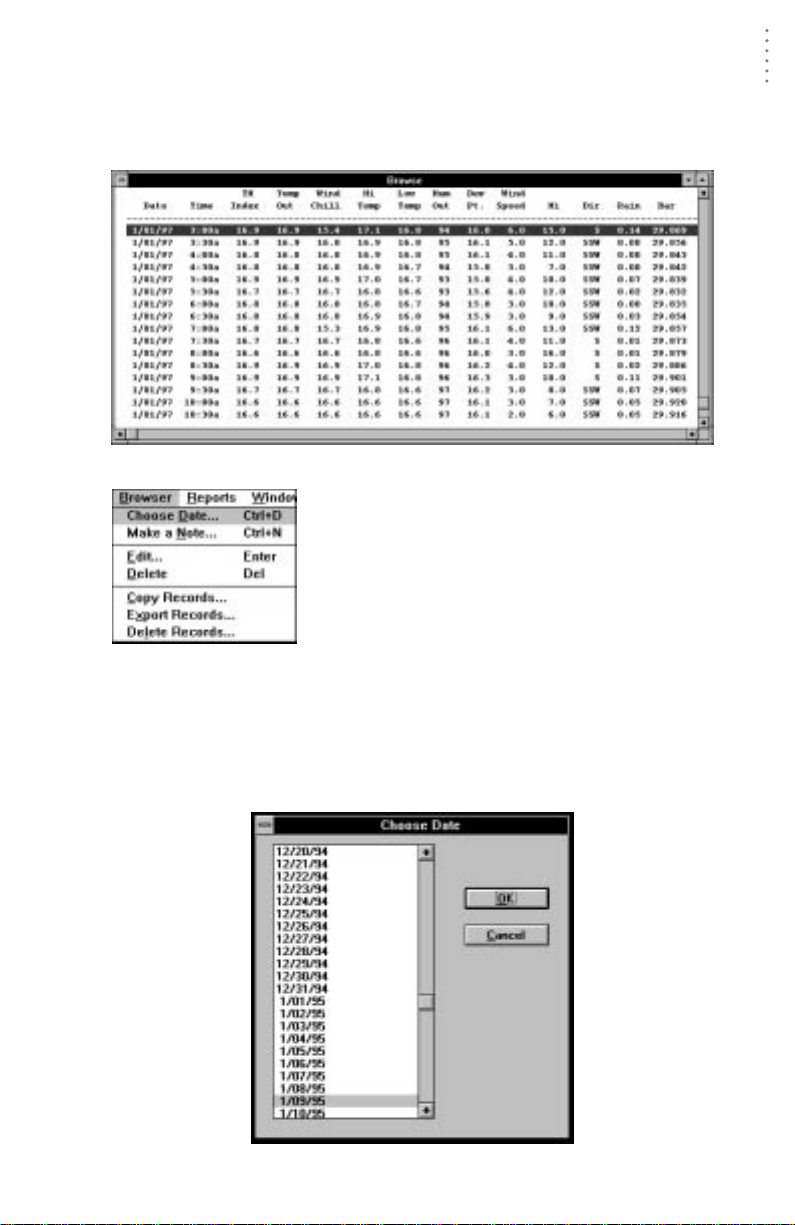
USING THE SOFTWARE
Using the Browse Window
USING THE BROWSE WINDOW
The browse window allows you to view, edit, print, annotate, and export the raw
data collected by the WeatherLink.
B
ROWSE WINDOW
When the Browse window is active, a Browse menu
appears in the menu bar. The Browse menu contains
commands which enable you to view , edit, print, export,
and copy database information.
Choose Date
You may quickly view the records for any date in the database.
1. To choose a date, click anywhere in the Browse window with the right mouse button,
choose Choose Date from the Browse menu, or press Ctrl-D.
The Choose Date dialog box appears.
C
HOOSE DATE
59
Page 69
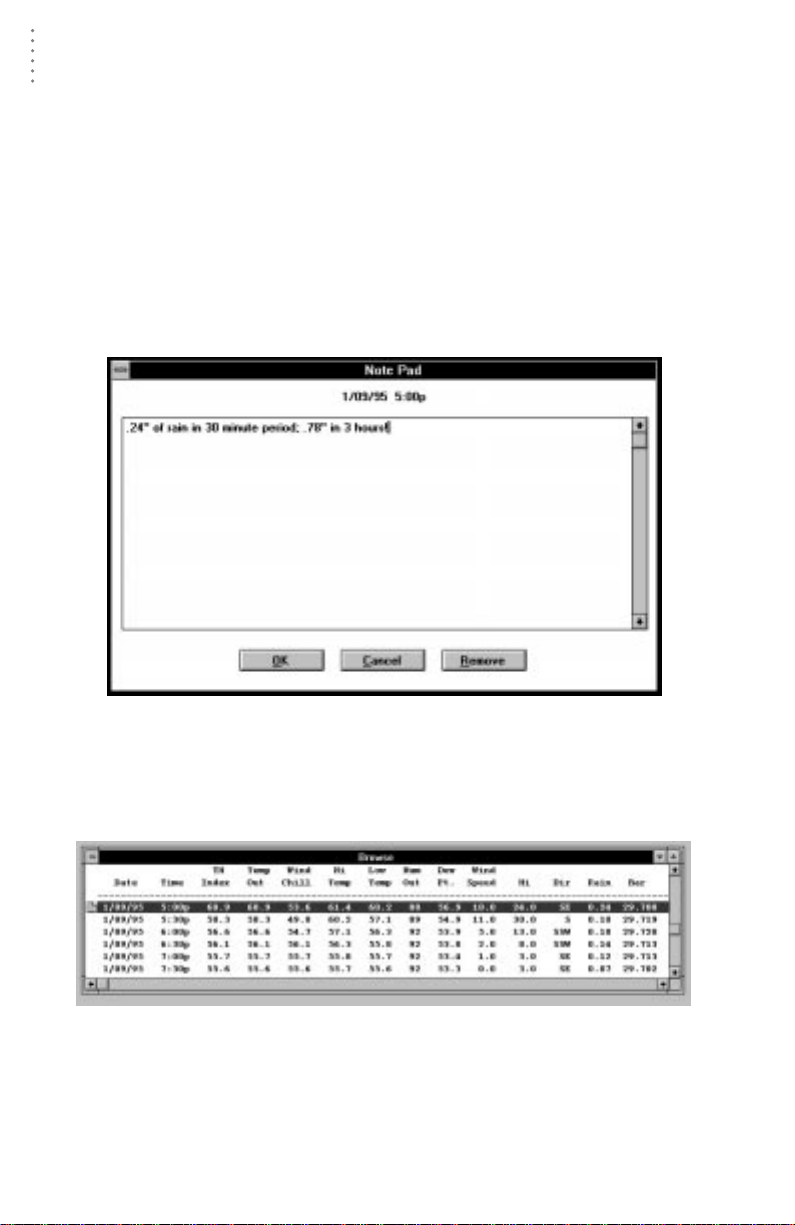
USING THE SOFTWARE
Using the Browse Window
2. Select the desired date from the list and choose OK.
The software locates and displays the first record from the selected date.
Make a Note
You may add notes to any record in the database.
Note:
The text of database notes are saved in the “DATANOTE” subdirectory for the open station.
The notes are assigned a coded file name which identifies them to the program. Do not
change these file names.
1. To add a note, double-click on the area just to the left of a record’s date (or select the
desired record and choose Make a Note from the Browse menu or press Ctrl-N).
The Note Pad appears.
N
OTE PAD
2. Enter the desired text into the note pad.
3. When finished, choose OK.
The software saves the note and returns you to the Browse window. After you
add a note to a record, the software adds a note icon to the left of the record.
N
OTE ICON
4. To edit, delete, or add to an existing note, double click on the note icon.
The Note Pad (with the text of previously entered notes) appears. Edit or add
to the note and choose OK to save. Choose Remove to delete the note completely.
60
Page 70
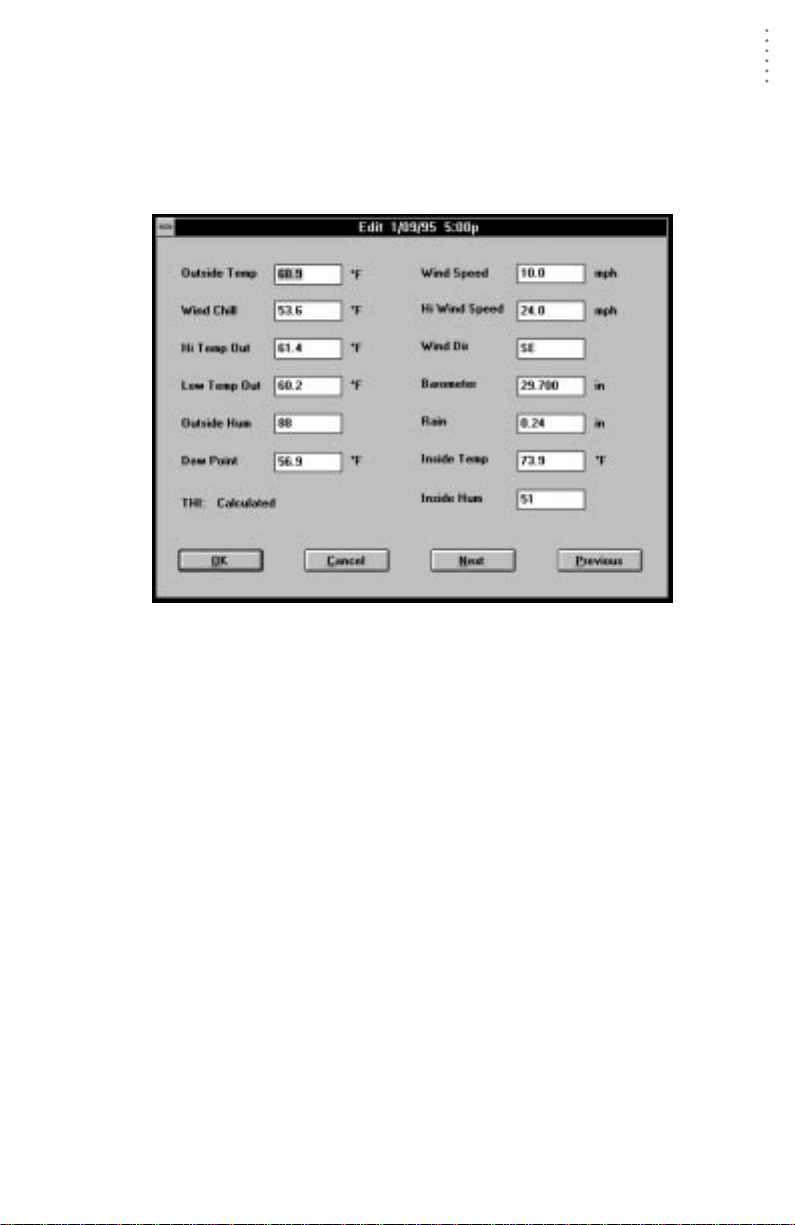
USING THE SOFTWARE
Using the Browse Window
Edit a Record
You may edit the data contained in any record in your database.
1. To edit a record, double-click on the desired record in the Browse window (or select
the desired record and choose Edit from the Browse menu or press Enter).
The Edit dialog box appears.
E
DIT
The date and time of the record appear in the title bar. You may enter or
change any of the record data by simply entering the desired data into the
appropriate text box. Note that you cannot edit temperature/humidity index
data directly because it is calculated ”on the fly” (see “T emperatur e/Humidity
Index” on page 96). To change temperatur e/humidity index data, edit the outside temperature or outside humidity data.
2. When finished editing data, choose OK.
The software saves your changes and closes the Edit dialog box. Choose Next
to save your changes and move to the next record in the database. Choose Previous to save your changes and move to the previous record in the database.
Choose Cancel to undo all changes and close the Edit dialog box.
61
Page 71
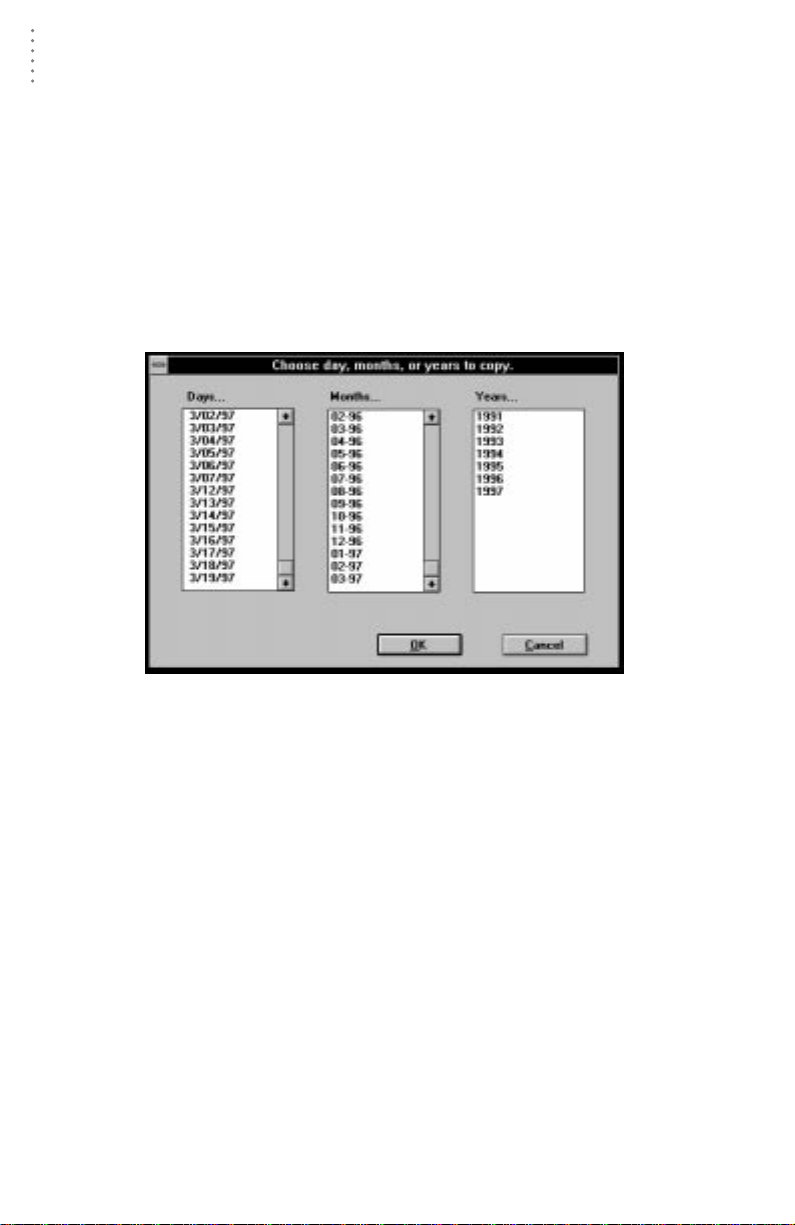
USING THE SOFTWARE
Using the Browse Window
Delete a Record
To delete a single record, select the desired record and press Delete or choose
Delete from the Browse menu. The software prompts you to confirm that you
wish to delete the record before it continues.
Copy Records
You may copy all record information for a specific group of records to Windows’
clipboard (from which you may paste the information into most Windows programs).
1. To copy records to the clipboard, choose Copy Records from the Browse menu.
The software prompts you to select the records you want copied.
C
HOOSE RECORDS TO COPY
2. Select the desired days, months, or years (you may choose more than one) and choose
OK.
The software copies the selected records to the clipboard.
62
Page 72
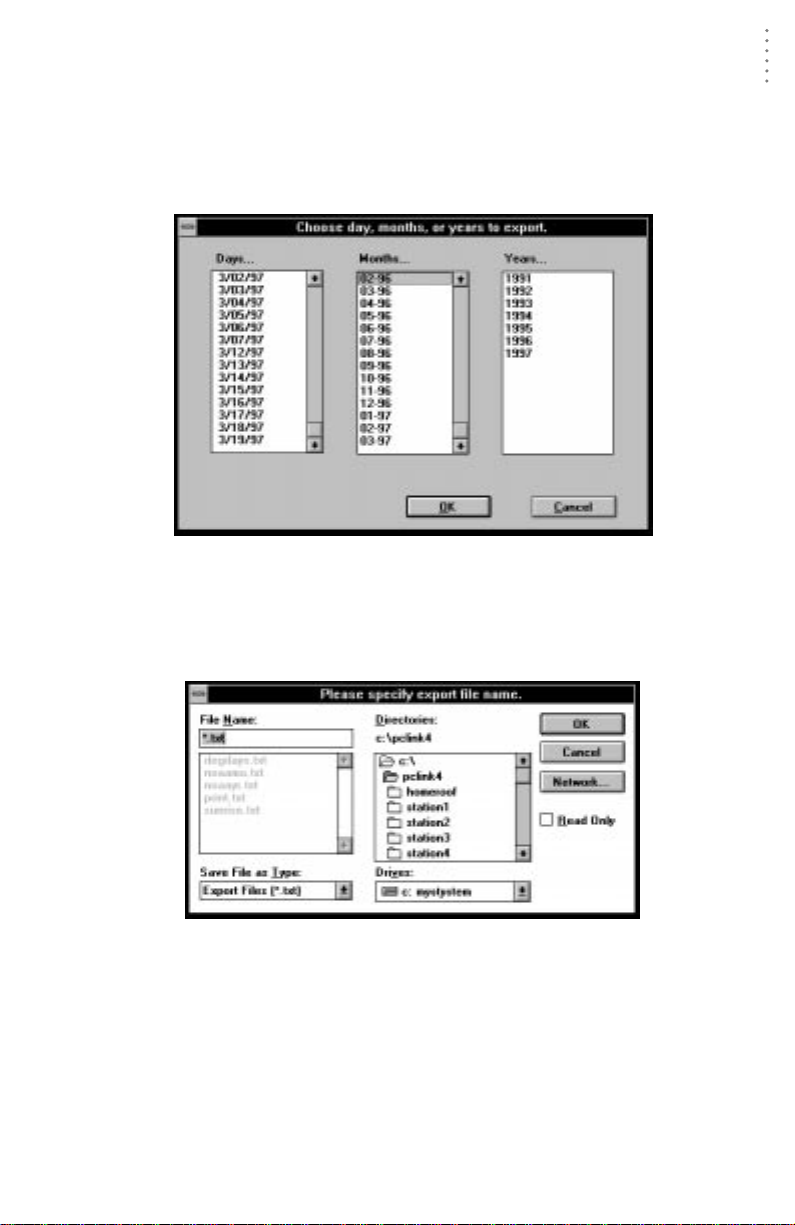
USING THE SOFTWARE
Using the Browse Window
Export Records
You may export record information to a tab delimited export file which can be
used in most database, spreadsheet, or word processing programs.
1. To export records, choose Export from the Browse menu.
The software prompts you to select the records you want exported.
C
HOOSE RECORDS TO EXPORT
2. Select the desired days, months, or years (you may choose more than one) and choose
OK.
The software prompts you to enter an export file name.
3. Enter the desired file name and choose OK.
E
NTER EXPORT FILE NAME
The software saves all record information for the selected days, months, or
years (in tab delimited format) into the export file. You may use this file to
import data into most popular database, spreadsheet, and/or word processing programs.
63
Page 73

USING THE SOFTWARE
Using the Browse Window
Delete Records
You may quickly delete a group of records.
1. To delete records, choose Delete Records from the Edit menu.
The software prompts you to select the records you want deleted.
C
HOOSE RECORDS TO DELETE
2. Select the desired days, months, or years (you may choose more than one) and choose
OK.
The software prompts you to confirm that you want to delete the records.
3. To delete the records, choose OK.
The software deletes the selected records.
64
Page 74
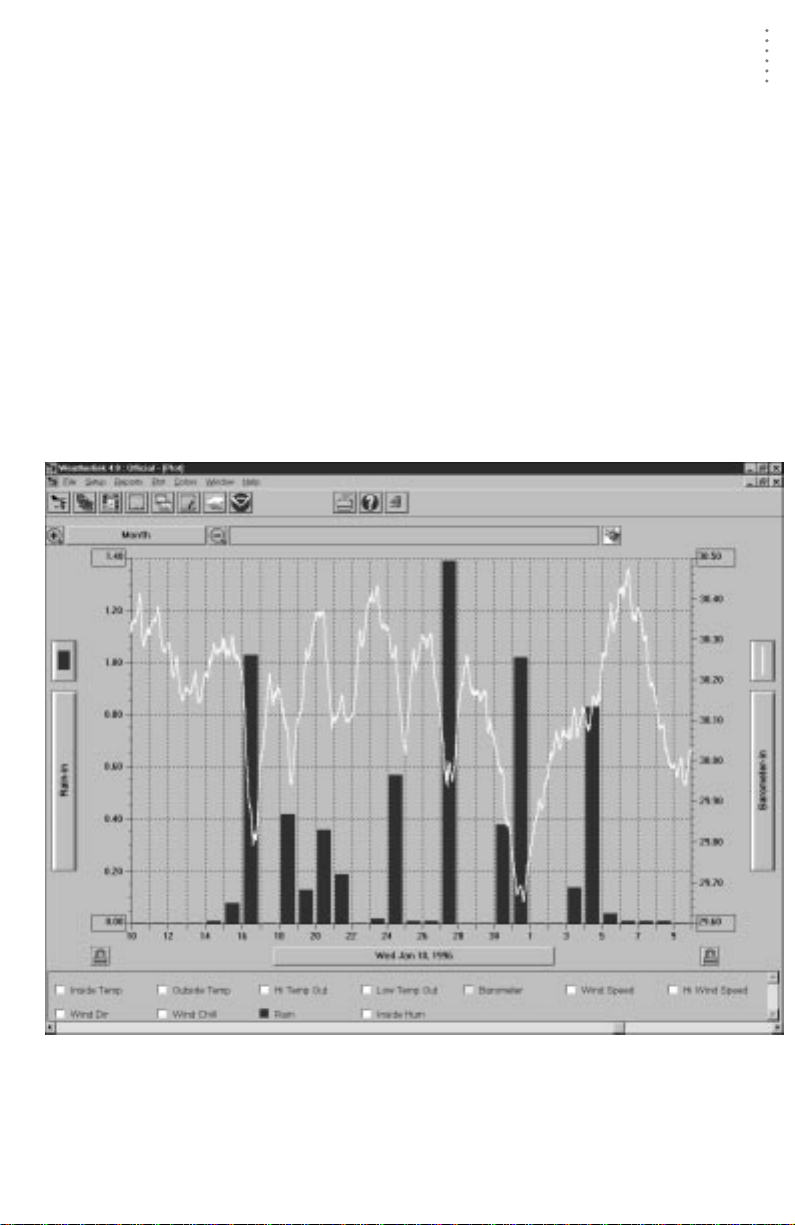
USING THE SOFTWARE
Using the Plot Window
USING THE PLOT WINDOW
The software includes powerful plotting capabilities which allow you to view and
compare data in graphical format. The plot interface has been designed so that
almost all plot features may be accessed directly from the plot window. You may
use menu commands if you find it easier, of course. Menu commands are
explained separately below. When the Plot window is active, a Plot menu and a
Color menu are added to the main menu bar and some new commands (Open
Plot, Save Plot, Open Plot T emplate, and Save Plot Template) are added to the File
menu. The use of the Plot menu, Colors menu, and the Open and Save commands
are explained below.
The three most basic elements of any plot are the variables (the weather conditions you are plotting), the date, and the plot span (the length of time over which
you are plotting those conditions). The software allows you to quickly and simply
select those three elements and also includes many other useful features which
make it easier to view and compare data. Almost all of the plot features may be
accessed directly from the plot window.
P
LOT WINDOW
65
Page 75
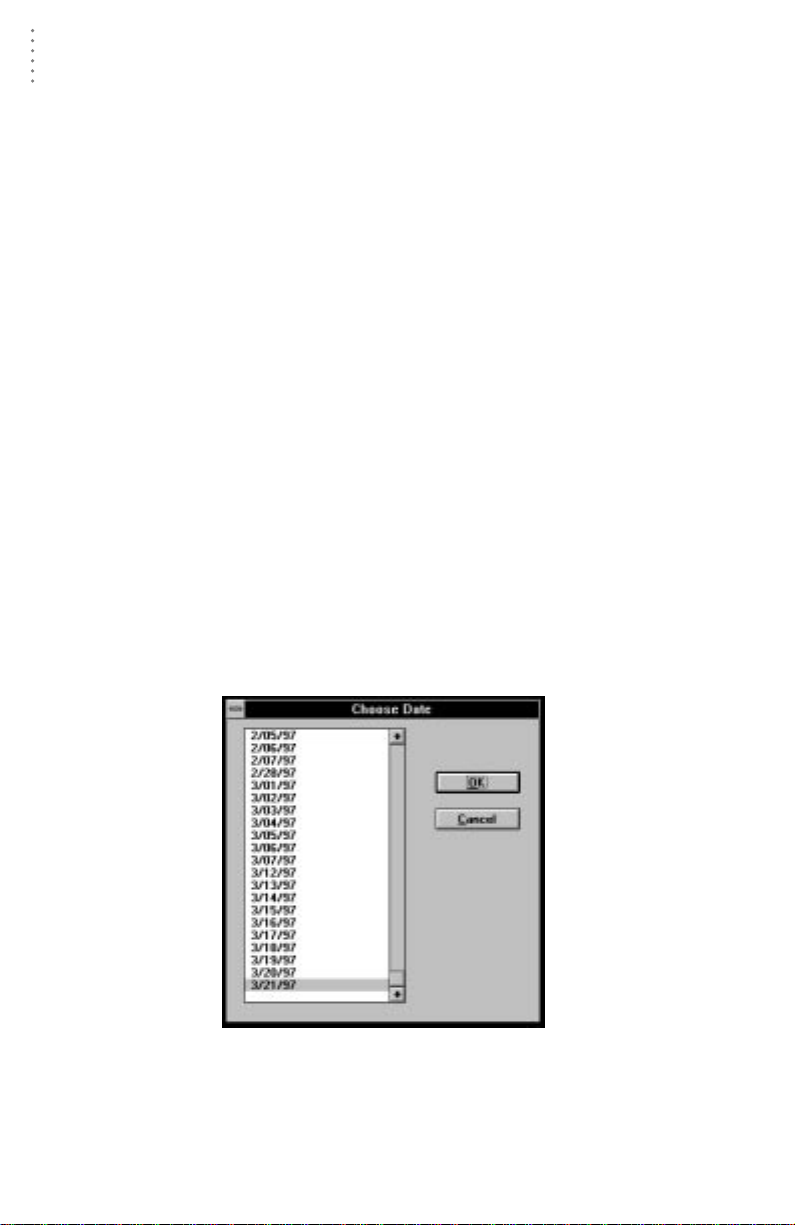
USING THE SOFTWARE
Using the Plot Window
Adding and Removing Variables
▲ Variables Box
The variables box at the bottom of the screen makes it possible to add and
remove variable with a click of the mouse. To add or remove a variable from a
plot, click on the box next to the variable’s name in the variables box. When
you add a variable to the plot, the color of that variable fills the box and the
variable is added to the plot. When you remove a variable, the box becomes
white again and the variable is removed from the plot.
To add or remove multiple variables at one time, hold down the Shift key
while clicking on the desired variables. The program will wait until you
release the Shift key before beginning to draw the plot.
▲ Plot Menu
You may also choose variables from the Add/Remove sub-menu in the Plot
menu to add or remove variables. A variable which is already plotted will
have a check mark before its name in the menu.
▲ Keyboard
If you have only one variable plotted, pressing the up and down arrows
quickly scrolls through the available variables. Watch the variables box or the
axis info button to see what variable is being plotted.
Choose Specific Date
You may choose a specific date for plotting.
1. Click on the Date button, press Ctrl-D, click anywhere in the Plot window with the
mouse button
, or choose Choose Date from the Plot menu.
A list of dates in your database appears.
right
C
HOOSE DATE
2. Select the desired date from the list and choose OK.
For plot spans which show more than one day, the date you pick will be plotted on the left side of the axis and the rest of the plot will fill in with subsequent data. The date which appears on the date button always indicates what
data is plotted on the left-most side of the axis.
66
Page 76

USING THE SOFTWARE
Using the Plot Window
Scroll Through Dates
You may use the scroll bar along the bottom of the strip chart window to scroll
through data.
▲ Click the scroll arrows (or press the right or left arrow keys) to move the plot for-
ward or backward one day at a time.
If the plot span is less than a day, clicking this action moves the plot one span
at a time. If the span is one year, this action moves the plot one month at a
time.
▲ Click the scroll bar to move the plot one plot span at a time.
▲ Drag the scroll box to quickly find a specific date.
As you drag the scroll box, watch the date button of the window until the
desired date appears, then release the scroll box.
Choose Plot Span
T o choose a plot span, click on the Span button or choose the Span sub-menu fr om
the Plot menu. A list containing all available plot spans appears. Choose the
desired plot span from the list.
P
LOT SPAN LIST
67
Page 77

USING THE SOFTWARE
Using the Plot Window
Enter Plot Title
You may enter a plot title into the Plot Title text box at the top of the window . You
may also choose Edit Title from the Options sub-menu in the Plot menu to move
the cursor to the Title text box.
Choose Axis Information
Although you may have as many variables as desired on any plot, each axis (left/
right) on a plot may only display information for one of those variables. T o choose
the axis information you want displayed, click on the desired Axis Info button or
choose the desired Variable command from the Options sub-menu in the Plot
menu. A pop-up list appears, containing the name (and color) of the variables on
this plot. Select the desired variable from the pop-up list.
A
XIS INFO POP-UP LIST
Choose Line/Bar
A line plot shows a line drawn from one data point to another until the whole plot
span is filled. A bar graph, on the other hand, shows cumulative totals during a
specific interval (each day on week and month plots, each month on year plots).
Y ou may only use bar graphs for rainfall and only on plot spans of a week, month,
or year.
To select either a bar or line graph, click on the Line/Bar button or choose the
Line/Bar option for the desired axis from the Options sub-menu in the Plot menu.
A pop-up list appears next to the Line/Bar button. Choose either Line or Bar from
the list.
L
INE/BAR POP-UP LIST
68
Page 78

USING THE SOFTWARE
Using the Plot Window
Set Axis Min/Max
You may set your own minimum or maximum for each axis by entering the
desired number into the Axis Min/Max text box (the first and last numbers in the
axis. You may also choose the desired Edit Min/Max option from the Options
sub-menu in the Plot menu to move the cursor into the Min/Max text box. Setting
the minimum or maximum automatically “locks” the axis (see below).
A
XIS MAXIMUM TEXT BOX
Note:
The Min and Max values you specify may not end up being the actual min and max values
used to create the plot. For simplicity, the grid lines on any axis are always multiples of one of
the following numbers: .01, .02, .05, .1, 2, 5, 10, 20, 50, 100, 200, 500, or 1000. The software
will determine the closest possible match to your specified max or min value.
Lock Axis
To lock (or unlock) the axis of a plot, click on the Lock Axis icon for the desired
axis or choose the desired locking option from the Options sub menu in the Plot
menu. Locking the axis will cause subsequent plot spans (when you scroll
through plot spans) to use the same scale as the plot span currently being viewed.
Note:
When you move to a date which contains data that falls outside of the plot scale, the software
automatically re-scales so the all of the new data fits on the plot and then locks the scale at
the new settings.
L
OCK AXIS ICON
Pause Plot Calculation
You may stop the program from “drawing” a plot at any time by pressing Esc.
The program will stop calculating and drawing the plot as soon as it is possible
and wait for further input before continuing. This feature can be especially useful
on slower machines or larger plot spans when you want to make a change without waiting for the plot to finish drawing.
View Database Information
Double-clicking on any location in a plot will open the Browse window (see
“Using the Browse Window” on page 59) to view the raw data for that time and
date.
69
Page 79

USING THE SOFTWARE
Using the Plot Window
View Details
Click and drag to select a portion of the plot you wish to see in detail. The software will zoom in on that section of the plot, using the closest possible plot span.
C
LICK AND DRAG TO SELECT
Zoom In/Out
To “zoom in” one plot span (for example, to go from a plot span of a Week to a
plot span of 3 Days), click on the Zoom In icon, press F3, or choose Zoom In from
the Plot menu. To “zoom out” one plot span (for example, to go from a plot span
of 3 Days to a plot span of a Week), click on the Zoom Out icon, press F4, or
choose Zoom Out from the Plot menu.
70
Z
OOM IN
& Z
OOM OUT ICONS
Page 80

USING THE SOFTWARE
Using the Plot Window
Plotting Data From More than One Date (Overlay)
The software features an “overlay” plotting mode which enables you to plot data
from more than one day on a single plot. Overlaying is only possible when you
have a single variable plotted.
1. Choose Overlay from the Plot menu or press F9.
The Overlay dialog box appears. The single date currently plotted appears in
the Plot Dates list. The dates of all data in your database appears in the dates
Available list.
O
VERLAY
2. To add a date to the plot, double-click on a date in the Dates Available list or select a
date and choose Add.
All dates which are going to be plotted in the Overlay plot appear in the Plot
Dates list (you may have a maximum of 10 dates plotted). To remove a single
date from the plot, double-click on the desired date in the Plot Dates list (or
select the date and choose Remove). To remove all but the original date from
the Plot Dates list, choose Clear.
3. If you want to select custom colors for overlaid dates, select the desired date in the
Plot Dates List and choose Color.
Windows’ Color dialog box appears. Choose or create the desired color in
which you want the date plotted. Consult your Windows’ documentation for
instructions on choosing or creating colors.
4. To view the Overlay plot, choose OK.
The software plots data for all selected dates. Note that the span button and
the zoom icons disappear (you may not zoom in/out, change plot spans, or
view details while viewing an overlay plot) and the axis info buttons now display date information instead of variable information. While viewing overlay
plots, you may scroll through dates using the scroll bar or left/right arrow
keys; all plotted dates will shift by the same amount as you scroll. You may
also change the variable you are plotting by choosing a new variable from the
variables box or Add/Remove sub-menu, or by pressing the up/down arrow
keys.
71
Page 81

USING THE SOFTWARE
Using the Plot Window
5. To return to normal plot operation, Choose Overlay from the Plot menu (or press F9) to
open the Overlay dialog box and choose Overlay Off.
The software returns you to the Plot window. The only date plotted will be the
top date from the Plot Dates list.
Plotting Data from the Previous Year (Last Year)
The software can quickly compare plotted data to data for the same period from
the previous year. For example, if you are viewing a 3-day plot span starting on
March 1, 1997, this feature will quickly show you, on the same plot, the data for
March 1, 1996.
Note:
Obviously , you cannot use this feature unless you have data from a previous year in your database.
▲ To view previous year’s data, choose Last Year from the Plot menu or press F10.
The software plots data for the previous year. Note that the span button and
the zoom icons disappear (you may not zoom in/out, change plot spans, or
view details while viewing last year’s data) and the axis info buttons now display date information instead of variable information. While viewing last
year’s data, you may scroll the date using the scroll bar or left/right arrow
keys. You may also change the variable you are plotting by choosing a new
variable from the variables box or Add/Remove sub-menu, or by pressing the
up/down arrow keys.
▲ To remove the previous years’ data, choose Last Year from the Plot menu or press
F10 again.
The software removes the second date and returns you to normal Plot operation.
Clear Entire Plot
T o clear all variables fr om the plot (giving you a blank plot to work with), click on
the Clear Plot icon (next to the Title Bar) or choose Clear Plot from the Options
sub-menu in the Plot menu.
Saving and Opening Plots and Plot Templates
The commands added to the File menu when the Plot window is active allow you
to save and open plots and plot templates. When you save a plot, all information
is stored, including the date of the data currently plotted. When you open that
plot, it automatically loads all variables and settings to restore the plot to the exact
way it looked when you saved it. When you save a plot template, all information
except for the date is stored. When you open a plot template, the software loads
all variables and settings, but plots the data from whatever date is currently being
viewed.
▲ Open Plot
To open a previously saved plot, choose Open Plot from the File menu. Select
the desired plot in the Open dialog box and choose OK.
▲ Save Plot
To save a plot, choose Save Plot from the File menu or press Ctrl-S. Enter the
desired file name and choose OK.
72
Page 82

USING THE SOFTWARE
Using the Plot Window
▲ Open Template
T o open a previously saved plot template, choose Open Template from the File
menu. Select the desired plot template in the Open dialog box and choose OK.
▲ Save Template
To save a plot template, choose Save Template from the File menu. Enter the
desired file name and choose OK.
Plot Menu
The commands in the Plot menu allow you to create plots and
set various plot-related options.
▲ Make Default
To make the current plot the default plot (the plot which appears initially
whenever you open the plot window), choose Make Default from the Plot
menu or press Ctrl-M.
▲ Choose Date
T o choose a specific date, choose Choose Date fr om the Plot menu, click on the
date button in the plot window , or right mouse click anywher e in the plot window . The Choose Date dialog box appears. Select the desir ed date from the list
and choose OK.
▲ Span Sub-Menu
To change the plot span of the plot, select the desired plot span from the Span
sub-menu.
▲ Options Sub-Menu
The commands in the Options sub-menu allow you to set a variety of plot
options.
▲ Left/Right/Time Gridlines
You may turn the gridlines on or off for the left axis, right axis, and time
axis separately. When the gridlines are on, a check mark appears beside
the menu command. To change the gridline setting from on to off (or vice
versa) choose the appropriate command from the Options sub-menu.
▲ Like Variable Same Scale
Turning this option on facilitates comparison of variables which use the
same unit of measure by forcing the software to use the same scale for any
variables which use the same unit of measure. When this option is on, a
check mark appears beside the menu command. To turn this option on or
off, choose Like Variable Same Scale from the Options sub-menu.
▲ Lock Left/Right Scale
T o lock (or unlock) the axis of a plot, choose Lock Scale for the desir ed axis.
73
Page 83

USING THE SOFTWARE
Using the Plot Window
▲ Choose Left/Right Variable
To choose the information you want displayed on either axis, choose
Choose Variable for the desired axis. A pop-up list appears next to the axis
information button. Select the desired variable from the pop-up list.
▲ Choose Left/Right Line/Bar
T o select either a bar or line graph, choose Choose Line/Bar for the desir ed
axis. A pop-up list appears next to the Line/Bar button. Choose either Line
or Bar from the list.
▲ Edit Title
To edit the plot title, choose Edit Title from the Options sub-menu. The
software moves the cursor to the Plot Title text box.
▲ Edit Left/Right Min/Max
To edit the Min/Max setting for either axis, choose the appropriate command from the Options sub-menu. The software moves the cursor to the
appropriate Min/Max text box.
▲ Hide Variable Box
You may hide the Variables Box in order to maximize the size of your plot.
When the Variables Box is hidden, a check mark appears beside the menu
command. To turn this option on or off, choose Hide Variable Box from the
Options sub-menu.
▲ Clear Plot
To clear all variables from the plot (giving you a blank plot to work with),
choose Clear Plot from the Options sub-menu.
▲ Add/Remove Sub-Menu
To add a variable to the plot, choose the variable you want to add from the
Add/Remove sub-menu. To remove a variable from the plot, choose the variable you want to remove from the Add menu.
Note:
Variables which are plotted have check marks next to their name.
▲ Overlay
To plot more than one date on the same plot, choose Overlay. (See “Plotting
Data From More than One Date (Overlay)” on page 71 for details.)
▲ Last Year
T o quickly compar e plotted data to data for the same period from the pr evious
year, choose Last Year. (See “Plotting Data from the Previous Y ear (Last Year)”
on page 72 for details.)
▲ Zoom In/Zoom Out
T o “zoom in” one plot span (for example, to go fr om a plot span of a Week to a
plot span of 3 Days) choose Zoom In from the Plot menu or press F3. To
“zoom out” one plot span (for example, to go from a plot span of 3 Days to a
plot span of a Week) choose Zoom Out from the Plot menu or press F4.
74
Page 84

USING THE SOFTWARE
Using the Plot Window
Colors Menu
You may change the color scheme used by the software in creating strip charts and plots. To change the color used for the plot
text, plot background, or any of the variables plotted by the software, choose the appropriate command from the Colors menu.
The software opens Windows’ Color dialog box from which you
may select or create a color. Consult your Windows’ documentation for instructions on choosing or creating colors.
C
OLOR
▲ Make Default
T o save the curr ent color scheme as the default, choose Make Default fr om the
Colors menu. If you make a change to a plot color and don’t choose Make
Default, the program will prompt you to save those color changes before you
close the Plot window.
Note:
The strip chart window and the plot window use the same color scheme. Changing the
default color scheme in the one window will change the color scheme used in the the
other.
▲ Load Default
If you have made changes to the color scheme and want to return to a previously saved default color scheme (see above), choose Load Default from the
Colors menu. You can use this to quickly “undo” any changes you don’t like.
▲ Load Program Default
To load the color scheme in which the program originally displayed plots and
strip charts, choose Load Program Default from the Colors menu. To make
this color scheme your default once again, choose Make Default.
75
Page 85

USING THE SOFTWARE
Using the Strip Charts
USING THE STRIP CHARTS
The strip charts are four line graphs, stacked one on top of another, onto which
you may plot any data contained in your database. Unlike the normal plots, however, strip charts can also be set to update at each ar chive interval allowing you to
view changes in weather conditions as they occur. Whenever you open the strip
chart window, the software automatically downloads data. Thereafter, as long as
the strip chart is in “auto update” mode, the software will download and update
the strip charts at each archive interval.
When you activate the Strip Chart window , a Strip Chart menu and a Color menu
are added to the main menu bar and two new commands (Open Chart and Save
Chart) are added to the File menu. The use of the Strip Chart menu, Open Chart,
and Save Chart are explained below. The use of the color menu is explained in
“Colors Menu” on page 80.
76
S
TRIP CHART WINDOW
Page 86

USING THE SOFTWARE
Using the Strip Charts
Open Strip Chart Window
T o open the strip chart window, choose Strip Chart from the Windows menu, click
on the Strip Chart icon in the toolbar, or press Ctrl-S. When you open the strip
chart window, the program automatically downloads any data in the station’s
archive memory.
Add Variable
To add a variable to a strip chart, select the desired chart (top, bottom, etc.) by
clicking anywhere within the chart. Choose Add/Remove from the Strip Chart
menu (to open the sub-menu). Then, choose the variable you want added to the
selected strip chart from the sub-menu. Note that any variables already plotted on
the selected strip chart have check marks next to their name.
Remove Variable
To remove a variable to a strip chart, select the desired chart (top, bottom, etc.) by
clicking anywhere within the chart. Choose Add/Remove from the Strip Chart
menu (to open the sub-menu). Then, choose the variable you want removed from
the selected strip chart from the sub-menu. Note that any variables already plotted on the selected strip chart have check marks next to their name.
Change Axis Information
Although you may have as many variables as desired on any strip chart, the axis
for each strip chart may only display information for one of those variables. To
choose the axis information you want displayed, click on the axis button for the
desired strip chart. A pop-up menu appears, containing the name (and color) of
the variables plotted on this strip chart. Select the desired variable from the popup menu.
A
XIS BUTTON POP-UP MENU
Change Plot Span
Choose the desired plot span from the Span sub-menu in the Strip Chart menu. To
“zoom in” one plot span (for example, to go from a plot span of a Week to a plot
span of 3 Days) choose Zoom In from the Strip Chart menu or press F3. To “zoom
out” one plot span (for example, to go from a plot span of 3 Days to a plot span of
a Week) choose Zoom Out from the Strip Chart menu or press F4.
77
Page 87

USING THE SOFTWARE
Using the Strip Charts
View Historical Data
Y ou may use the scr oll bar along the bottom of the strip chart window to view historical data on the strip charts. Clicking on the scroll arrows moves the strip chart
forward or backward one day at a time. Clicking the scroll bar moves the strip
chart one span at a time. Dragging the scroll box allows you to quickly find a specific date. As you drag the scroll box, watch the bottom of the window until the
desired date appears, then release the scroll box.
Note:
Viewing historical data takes the strip chart out of auto update mode.
Place the Strip Chart Into Auto Update Mode
When you first open the strip chart window, the strip chart is automatically
placed into auto update mode. It will remain in that mode (downloading and
updating the charts at each archive interval) until you click on the scroll bar (to
view historical data) at which point it is automatically taken out of auto update
mode. To return to auto update mode, choose Auto Update from the Strip Chart
menu. If necessary, the software will download any data in the archive memory
before entering auto update mode. The strip charts will automatically move to the
most current date in the database.
View Database Information
Double-clicking on any location in the strip chart will open the Browse window (see
“Using the Browse Window” on page 59) to view the raw data for that time and date.
View Details
Click and drag to select a portion of the strip chart that you wish to see in detail.
The software will zoom in on that section of the strip chart, using the closest possible plot span.
Saving a Strip Chart Template
Strip chart templates save all information concerning which variables are plotted
on the four strip charts, what information is displayed on the axis for each strip
chart, and the plot span. It does not save any date information and, when opened,
will always show the latest data in your database and be placed into auto update
mode. To save the current strip chart as a template, choose Save Chart from the
File menu. Enter the desired file name and choose OK to save the template.
S
AVE STRIP CHART TEMPLATE
78
Page 88

USING THE SOFTWARE
Using the Strip Charts
Opening a Previously Saved Strip Chart Template
To open a previously saved strip chart template, choose Open Chart from the File
menu and choose the desired strip chart template file.
O
PEN STRIP CHART TEMPLATE
Strip Chart Menu
The commands in the Strip Chart menu allow you to create
strip charts and set various strip chart-related options.
▲Make Default
T o make the current strip chart the default strip chart (which
appears initially whenever you open the strip chart window), choose Make Default from the Strip Chart menu or
press Ctrl-M.
▲ Auto Update
When in auto update mode, the software downloads data from the archive
memory and updates the strip charts at each archive interval. To change the
auto update status, choose Auto Update from the Options sub-menu. When
the strip charts are in auto update mode, a check mark appears beside the
command name. When you change the auto update status to place the strip
charts into auto update mode, the software automatically downloads all data
in the archive memory and moves to the most current date in the database.
Note:
Viewing historical data automatically takes the strip chart sout of auto update mode.
▲ Lock Axes
To lock (or unlock) the axes of all strip charts, choose Lock Axis from the
Options sub-menu. When the strip charts’ axes are locked, a check mark
appears beside the command name. Locking the axes will cause subsequent
plot spans (when viewing historical data) to use the same scale as the plot
span currently being viewed
Note:
When you move to a date which contains data that falls outside of the scale , the software
automatically re-scales so the all of the new data fits on the strip chart and then locks
the scale at the new settings.
79
Page 89

USING THE SOFTWARE
Using the Yearly Rainfall Database
▲ Add/Remove Sub-Menu
To add a variable to any of the strip charts, select the desired strip chart (to
make it active) and then select the variable you want to add from the Add/
Remove menu. To remove a variable from any of the strip charts, select the
desired strip chart (to make it active) and then select the variable you want to
remove from the Add/Remove menu.
Note:
Variables which are plotted have check marks next to their name.
▲ Span Sub-Menu
To change the plot span of the strip charts, select the desired span from the
Span sub-menu.
▲ Clear Plots
T o clear all variables from the strip charts, choose Clear Plots fr om the Options
sub-menu. The software prompts you to confirm that you want to clear all
data before it continues.
▲ Zoom In/Zoom Out
T o “zoom in” one plot span (for example, to go fr om a plot span of a Week to a
plot span of 3 Days) choose Zoom In from the Strip Chart menu or press F3. To
“zoom out” one plot span (for example, to go from a plot span of 3 Days to a
plot span of a Week) choose Zoom Out from the Strip Chart menu or press F4.
Colors Menu
You may change the color scheme used by the software in creating strip charts
and plots. For instructions, see “Colors Menu” on page 75.
USING THE YEARLY RAINFALL DATABASE
The WeatherLink software keeps a separate rainfall database which enables you
to view accumulated rainfall totals broken down by month and year. If you have
existing data in your main weather database, the software will create the rainfall
database using the data stored in your main weather database. Once created, the
software updates the rainfall database after each download. It is also possible to
alter any existing entry in the rainfall database and to enter rainfall totals for
months and years which are not contained in your main weather database.
When the Yearly Rainfall window is active, a Rain menu is
added to the menu bar. This menu allows you to start a new
rainfall database, edit data, add years of rainfall data, or
delete years of rainfall data.
80
Page 90
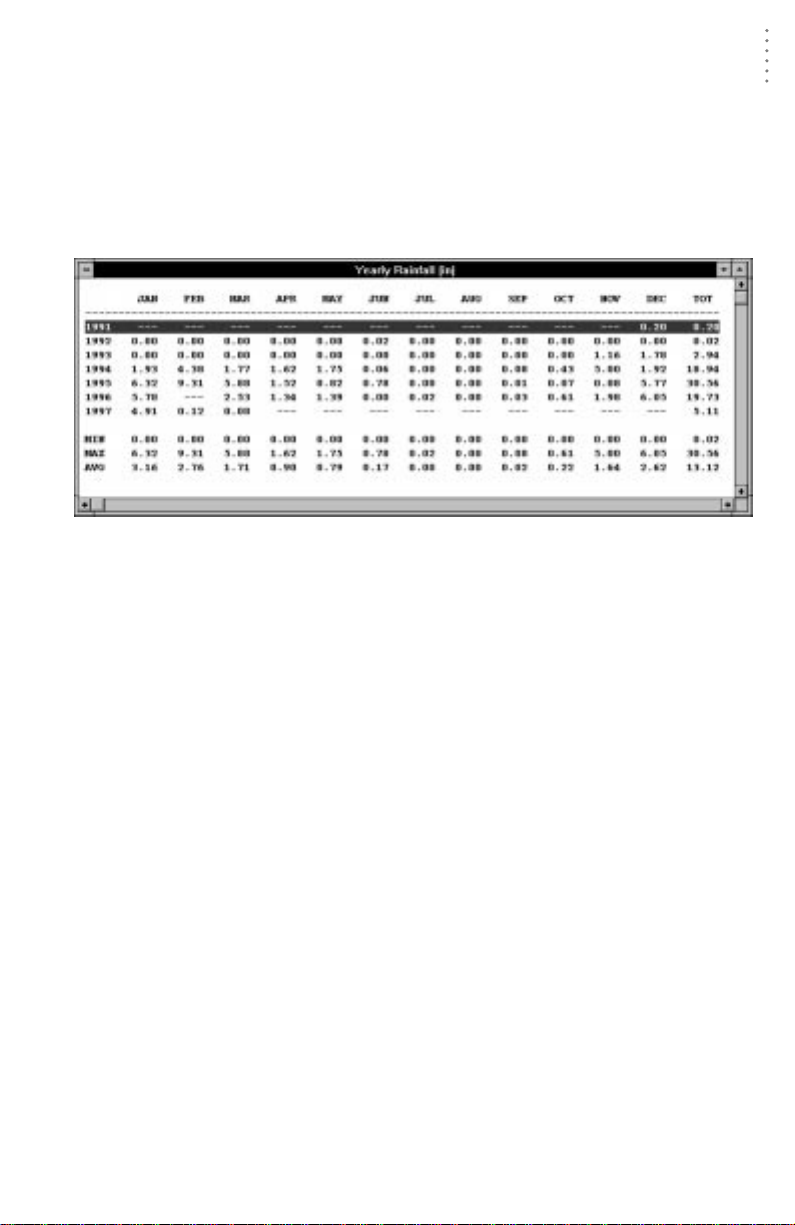
USING THE SOFTWARE
Using the Yearly Rainfall Database
Viewing the Yearly Rainfall Database
To open the Yearly Rainfall Window, choose Yearly Rainfall from the Reports
menu, click on the Yearly Rainfall icon in the toolbar, or press Ctrl-R.
Note:
The first time you attempt to open the rain database, the software will prompt you to indicate
whether you want to create the rainfall database. Choose Yes to create the database (note
that depending on the size of your main weather database and the speed of your computer,
this can take some time).
Y
EARLY RAINFALL
The top section of the Y early Rainfall window displays the amount of rainfall each
month for every year in your database and the total rainfall for each year. The bottom section shows the minimum, maximum, and average rainfall amounts for
each month and year in the database.
Note:
Dashes indicate that no data exists for a particular month.
81
Page 91
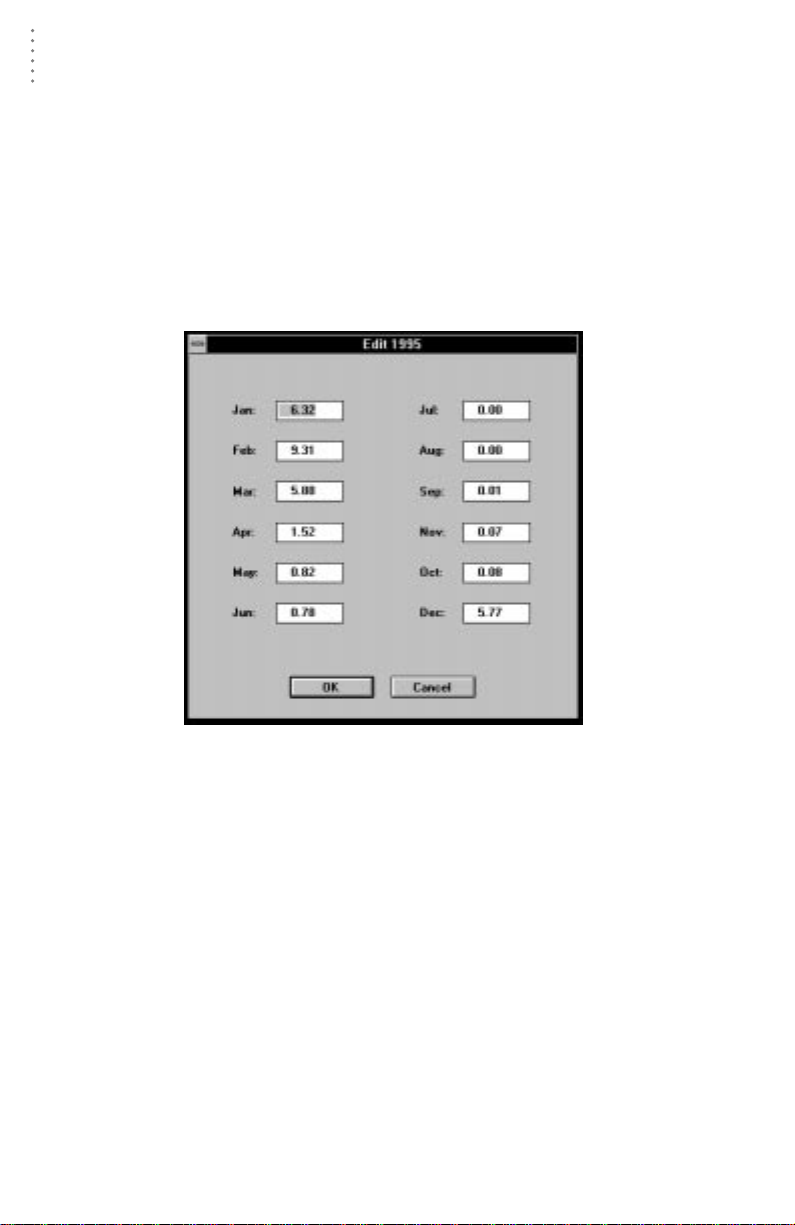
USING THE SOFTWARE
Using the Yearly Rainfall Database
Editing Yearly Rainfall Data
You may edit the data for any existing year or add entire years of rainfall data.
▲ Edit Data for an Existing Year
To edit data, double-click on any line in the rainfall database (or select the
desired line and press Enter or choose Edit from the Rain menu). The Edit dialog box appears. Change the data in any of the text boxes and choose OK to
save changes.
Note:
Changes made to the rainfall database are not reflected in the main weather database
(and vice-versa, unless you start a new database). You must treat rainfall totals in both
databases separately.
82
E
DIT
Page 92

USING THE SOFTWARE
Using the Yearly Rainfall Database
▲ Add Data for an Entire Year
To add a year to the rainfall database, choose Add from the Rain menu. The
Add dialog box appears. Enter the year at the top of the box and the rainfall
amounts for each month into the appropriate text box. When finished, choose
OK to save.
A
DD
Deleting Data
To delete an entire year‘s worth data from the rainfall database, select the desired
year and choose Delete from the Rain menu or press Delete. The software will
prompt you to confirm that you wish to delete data before continuing.
C
ONFIRM DELETION
83
Page 93

USING THE SOFTWARE
Degree-Days
Start a New Rainfall Database
If you want to start the rainfall database over, choose New from the Rain menu.
You will be prompted to confirm that you want to continue. Your existing rainfall
database will be deleted and a new database constructed using whatever data
exists in your main weather database.
DEGREE-DAYS
The instructions below explain how to use the WeatherLink Software’s degreeday reporting feature to track the development of crops and/or pests. For information on degree-days, see “Degree-Days” on page 97. In order to use degreedays, you must determine the developmental threshold(s) for the desired crop or
pest. The base developmental threshold is the temperature at and below which
development stops. Above the base threshold, development increases until the
temperature reaches the upper threshold, over which development rate remains
constant. Information on degree-day thresholds is available from your county
agricultural agent or university agricultural extension service.
84
PC D
EGREE DAYS
Page 94
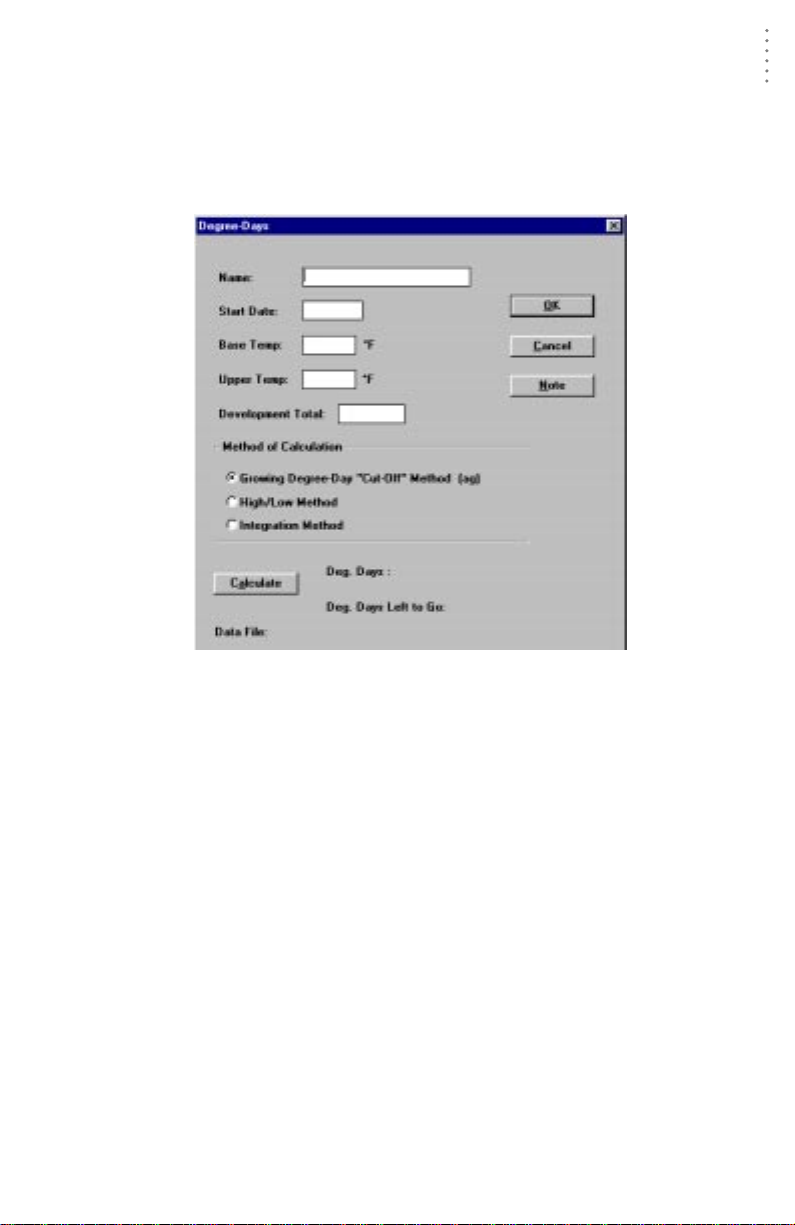
USING THE SOFTWARE
Adding a Degree-Day Total
You need to enter a separate degree-day total for every individual crop, pest, etc.
for which you want to track degree-days.
1. From the PC Degree-Days list box, choose Add.
The PC Degree-Day Definition dialog box appears.
Degree-Days
PC D
EGREE-DAY DEFINITION
2. Enter the following information for each degree-day total:
▲ Name
Enter the name of the crop, pest, etc. into the text box.
▲ Start Date
Enter the starting date for degree-day calculations into the text box.
▲ Base Temp
Enter the base developmental threshold (the temperature at and below
which development stops) into the text box.
▲ Upper Temp
Enter the upper developmental threshold (the temperature at and above
which development rate remains constant) into the text box.
▲ Development Total
Enter the number of degree-days required for this crop/pest to develop
into the text box.
85
Page 95

USING THE SOFTWARE
Degree-Days
▲ Degree-Day Calculation Method
Choose the method by which degree-days are calculated.
▲ Growing Degree-Day “Cut-Off” Method
The software uses the highest temperature and the lowest temperature
for a given day to calculate the average temperature for that day. Note,
however, that if the low temperature is below the base threshold, the
software uses the base threshold as the low temperature when determining average temperature for the day. In addition, if the high temperature is above the upper threshold, the software uses the upper
threshold as the high temperature when determining average temperature. For this method, both thresholds must be entered.
The difference between the average temperature and the base threshold is assumed to be the number of degree-days accumulated on that
day. (For example, if the average of the highest and lowerst temperatures was 24˚ above the base threshold, the software would assume 24
degree-days for the entire day.)
Note:
▲ High/Low Method
The software uses the highest temperature and the lowest temperature
for a given day to calculate the average temperature for that day. Note,
however, that if the high temperature is above the upper threshold the
software uses the upper threshold as the high temperature when determining average temperature for the day. (If no upper threshold is
entered, the high temperature will not be “cut off” in this way.) For
this method, the upper threshold need not be entered.
The difference between the average temperature and the base threshold is assumed to be the number of degree-days accumulated on that
day. (For example, if the average of the highest and lowest temperatures was 24˚ above the base threshold, the software would assume 24
degree-days for the entire day.)
Note:
▲ Integration Method
The software calculates degree-days using the average temperature for
an interval and the interval time. For example, if the average temperature during a 15 minute interval was 24˚ above the base threshold, the
software would calculate 0.25 degree-days dudring that interval (24˚ *
15 minutes in interval / 1440 minutes per day). The number of degreedays during each interval are added together to arrive at a degree-day
total. This method calculates degree-day totals more accurately than
the high/low method.
Unless 15 hours worth of records exist in the database for a day (through 3pm),
the software will not calculate degree-days for that day.
Unless 15 hours worth of records exist in the database for a day (through 3pm),
the software will not calculate degree-days for that day.
86
Page 96

USING THE SOFTWARE
Degree-Days
3. To add a note to this degree-day total, choose Notes.
The software opens the note file for this degree-day total. You may enter any
desired notes into this file.
N
OTE FILE
4. To view total degree-days since the start date, choose Calculate.
The software calculates the total degree-days since the start date and displays
the number of accumulated degree-days and the degree-days left until the
development total is reached.
D
EGREE-DAYS CALCULATED
5. After entering all necessary information, choose OK.
The software saves the degree-day information for this crop/pest. Instead of
closing, the PC degree-day definition dialog box remains open so you can
enter information on the next crop/pest. When finished entering information
for all crops/pests, choose Done.
87
Page 97

USING THE SOFTWARE
Degree-Days
Opening a Degree-Days Total
Y ou may open a pr eviously saved degr ee-day total to edit information, add notes,
view degree-day totals, etc.
1. To open a degree-day total, double click on the desired total or select it from the list
and choose Open.
The Degree-Day Definition dialog box for that total appears. At the bottom of
the dialog box, the name of the data file for this degree-day totals is displayed.
D
EGREE-DAY DEFINITION
2. You may enter or change any information, add notes, or calculate degree-day totals as
explained in “Adding a Degree-Day Total” on page 85.
88
Page 98
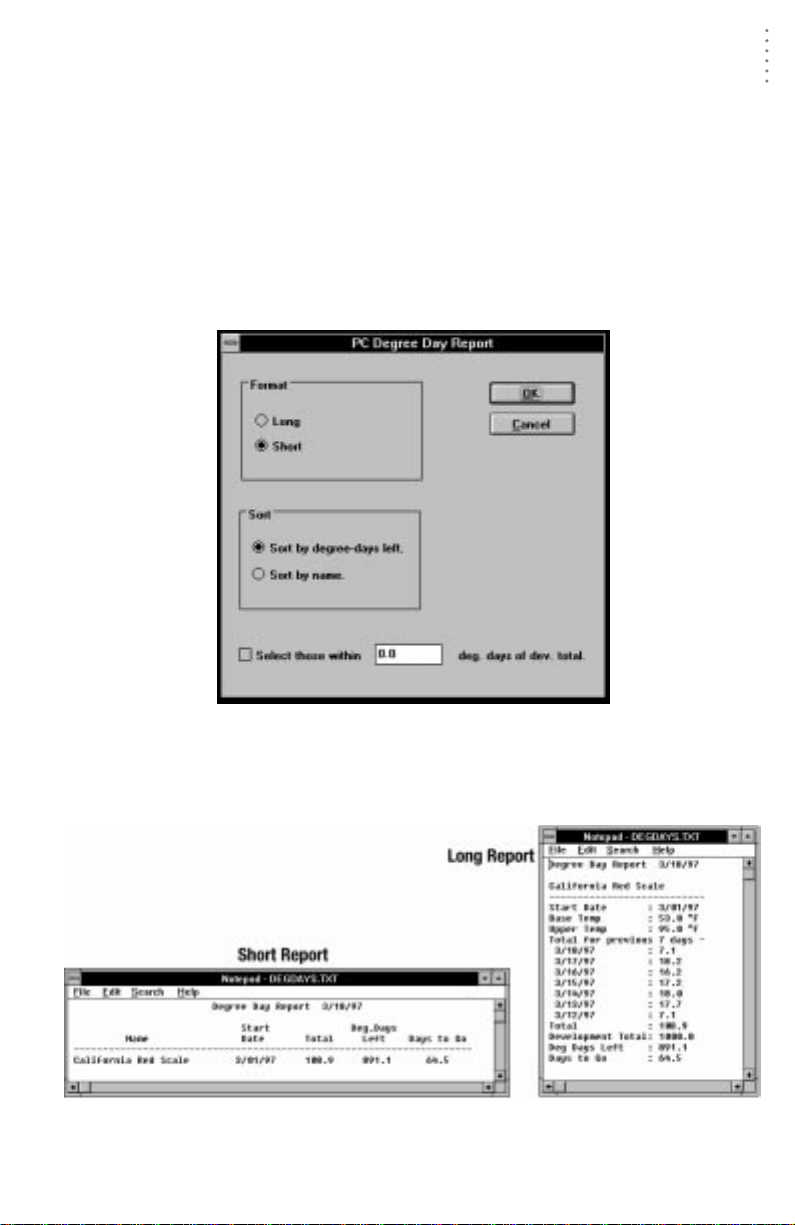
USING THE SOFTWARE
Deleting a Degree-Day Total
T o delete a degr ee-day total, select it fr om the list and choose Delete. The software
will prompt you to confirm that you want to delete the total before doing so.
PC Degree-Day Report
The software allows you to create reports on some or all of your degree-day totals.
The report is opened into Windows Notepad from which you may copy or print
the report information.
1. From the PC Degree-Days list, choose Report.
The PC Degree-Day Report dialog box appears.
Degree-Days
PC D
EGREE-DAY REPORT
2. Set the following report options:
▲ Format
Select either the long or the short report format.
R
EPORT FORMATS
89
Page 99

USING THE SOFTWARE
Degree-Days
▲ Sort
Select the sort order. You may sort by the number of degree days remaining until the development total (which will show the totals closest to the
development total at the top of the report) or you may sort by name which
will show totals in alphabetical order.
▲ Degree-Day Selection check box
By selecting this check box and entering a number of degree-days into the
text box, you may choose to include only those crops/pests whose degreeday totals are within the specified number of degree-days of their development total.
3. When finished setting options, choose OK.
The software calculates and displays degree-days information. Depending on
which format you chose (long, short), the report shows you some or all of the
following information for each degree-day total:
▲ Start Date, Base Temp, Upper Temp
The report shows the start date and the base and upper thresholds you
entered.
▲ Total for previous 7 days
The report shows the total degree-days for each of the last 7 days.
▲ Total
The report shows the total degree-days since the start date.
▲ Development Total
The report shows the development total you entered.
▲ Deg-Days Left
The report shows the total degree-days left before the development total is
reached.
▲ Days to Go
The report shows the expected number of days before the development
total is reached. This calculation is based on the average number of
degree-days during the last three complete days.
90
Page 100

5
ECHNICAL REFERENCE
T
This chapter covers several technical topics which may help you better understand and use the software.
RCHIVE MEMORY VS
A
There are two places where the WeatherLink stores weather data: the archive
memory and the database.
Archive Memory
The archive memory is the weather information storage area in the WeatherLink
itself. At each archive interval the WeatherLink stores one record to archive memory. The WeatherLink has room in the ar chive memory for approximately 1 day of
weather data for each minute in the archive interval. For example, if you use the 1
minute archive interval, the WeatherLink may store approximately 1 day of data.
If you use the 30 minute archive interval, the WeatherLink may store approximately 30 days of data. If you use the 2 hour archive interval (120 minutes), the
WeatherLink may store approximately 120 days of data.
Note:
To aid you in determining when you need to download, the software shows you what percent
of archive memory is full whenever you download data.
When the archive memory “fills” the WeatherLink overwrites old data each time
it stores a new record. Because of this, it is best to select the longest archive interval which suits your purpose. In addition, make sure to download data before
your archive memory fills or you will have gaps in your database.
Database
The database is the permanent record of data stored on disk. When you download, the software transfers all information in the archive memory to the computer and writes the information into the appropriate database files. If you do not
clear the archive memory when downloading data (see “Station Config” on
page 19), the software will incorporate any data that post-dates the existing database. The software will not overwrite existing data. This means that if, for example, your station loses power and, upon power up, begins logging data at the
default date January 1,
precede the most recent date.
As the software writes the data to database files, it calculates the average wind
chill and average dew point. The temperature/humidity index, Equilibrium
Moisture Content, and air density, on the other hand, are calculated by the software as needed.
The software stores data to disk in monthly blocks, each of which is a separate
data file in the weather station's directory. The name of the data file indicates the
year and the month of the data and has a three character file extension which indicates the station from which that data came.
ATABASE
. D
this data will not make it into an existing database
as it will
91
 Loading...