

Page 1
LED Lamp
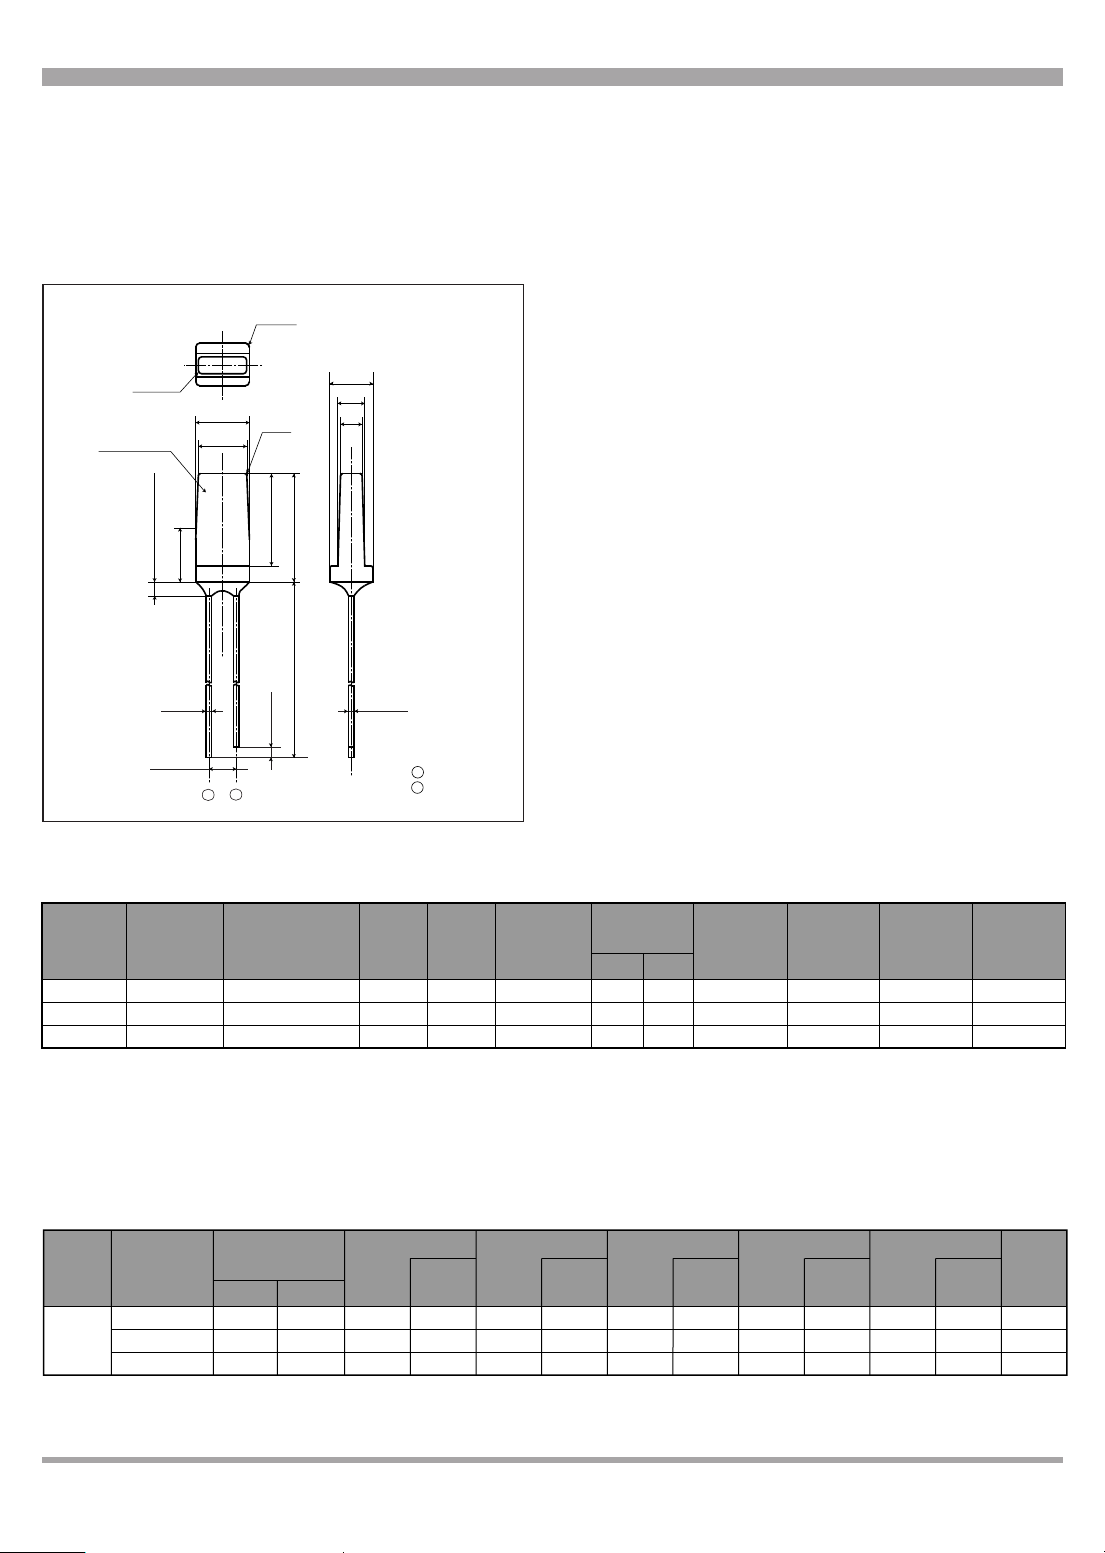
Protruded resin 1.5MAX
(1.0) 8.6
(5.0)
10.1
2.54NOM
24.0MIN
0.5
±0.1
0.5
±0.1
1
2
5.0
4.5
2.0
2.5
4.0
R0.2
4-R0.4
4-R0.2
Colored diffusion
Pin connections
1 Anode
2 Cathode
Unspecified tolerance:±0.2
GL8HD23
GL8HY23
GL8EG23
TYP MAX
2.0
2.0
2.1
2.8
2.8
2.8
635
585
565
20
20
20
20
20
20
20
20
20
10
10
10
4
4
4
20
35
35
1
1
1
→
→
→
35
30
30
6.0
8.0
6.0
Model No.
Lens type
Forward voltage
VF(V)
λp(nm)
TYP
I
V(mcd)
TYP
I
F
(mA)
IF
(mA)
IF
(mA)
(MH
Z)
V
R
(V)
I
R(µA)
MAX
C
t(pF)
TYP
∆λ(nm)
TYP
Peak emission wavelength
Luminous intensity
Spectrum radiation bandwidth
Reverse current
Page for
characteristics
diagrams
Terminal capacitance
(Ta=25˚C)
Colored
diffusion
GL8❏❏23 series
GL8❏❏23 series
2.0✕4.5mm, Rectangle Type,
Colored Diffusion LED Lamps for
Indicator
■ Outline Dimensions
(Unit : mm)
■ Absolute Maximum Ratings
Model No.
GL8HD23
GL8HY23
GL8EG23
Radiation color
Red
Yellow
Yellow-green
Radiation material
GaAsP on GaP
GaAsP on GaP
GaP
Power dissipation
P
(mW)
84
84
84
Forward current
IF
(mA)
30
30
30
Peak forward current
IFM
(mA)
50
50
50
*1 Duty ratio=1/10, Pulse width=0.1ms
*2 5s or less(At the position of 1.6mm or more from the bottom face of resin package)
*1
Derating factor
(mA/˚C)
DC Pulse
0.67
0.40
0.67
0.40
0.67
0.40
Reverse voltage
■ Electro-optical Characteristics
(Notice) ¡
(Internet) ¡Data for sharp's optoelectronic/power device is provided for internet.(Address http://www.sharp.co.jp/ecg/)
In the absence of confirmation by device specification sheets, SHARP takes no responsibility for any defects that may occur in equipment using any SHARP
devices shown in catalogs, data books, etc. Contact SHARP in order to obtain the latest device specification sheets before using any SHARP device.
VR
(V)
5
5
5
Operating temperature
Topr
(˚C)
-25 to +85
-25 to +85
Storage temperature
Tstg
(˚C)
-25 to +100
-25 to +100
-25 to +85 -25 to +100
(T
a=25˚C)
Soldering temperature
*2
Tsol
(˚C)
260
260
260
Page 2
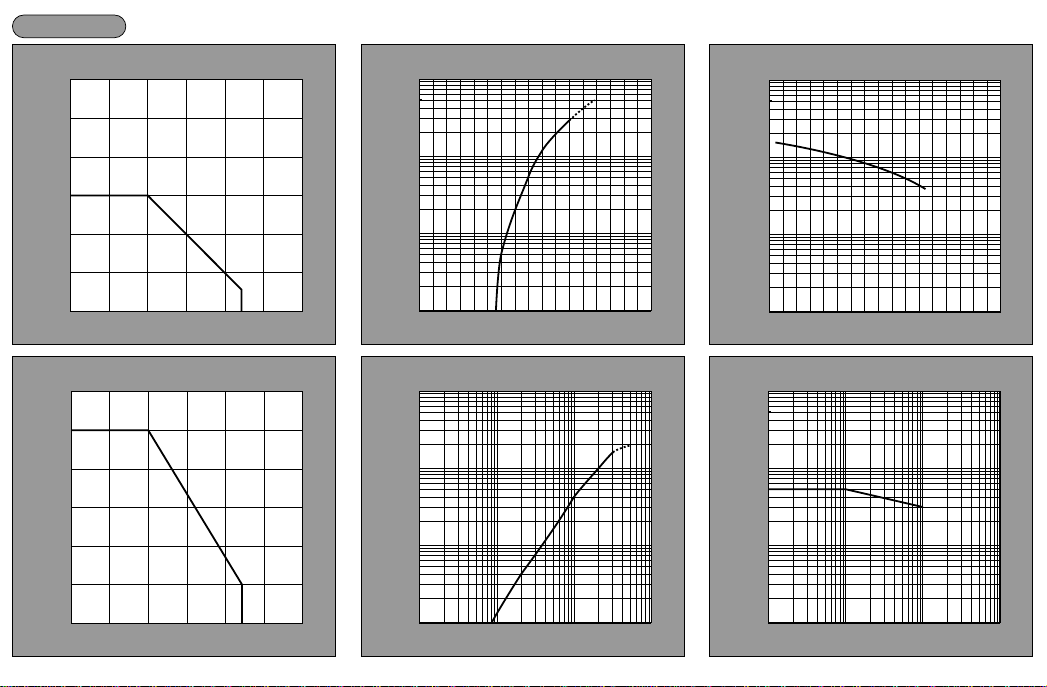
Note)Characteristics shown in diagrams are typical values. (not assurance value)
HD series
0
10
20
30
40
50
60
-25 0 25 50 75 85 125100
Peak Forward Current Derating Curve
Ambient temperature Ta(˚C)
Peak forward current IFM(mA)
0
10
20
30
40
50
60
-25 0 25 50 75 85 125100
Forward Current Derating Curve
Ambient temperature Ta(˚C)
Forward current IF(mA)
0.1
0.5
1.0
5.0
10
50
100
1.0 1.2 1.4 1.6 1.8 2.0 2.4 2.62.2
Forward Current vs. Forward Voltage(Note)
Forward voltage VF(V)
Forward current IF(mA)
(Ta=25˚C)
1.0
5.0
10
50
100
500
1000
-20 0 20 40 60 80 120100
Luminous Intensity vs. Ambient Temperature(Note)
Ambient temperature Ta(˚C)
Relative luminous intensity(%)
(Ta=25˚C)
1.0
5.0
2.0
10
20
50
100
200
500
1000
0.1 0.2 0.5 1 2 5 10 20 50
Luminous Intensity vs. Forward Current(Note)
Forward current IF(mA)
Relative luminous intensity(%)
(Ta=25˚C)
1.0
5.0
2.0
10
20
50
100
200
500
1/50 1/20 1/10 1/5 1/2 1
Duty Ratio vs. Peak Forward Current
Duty ratio DR
Peak forward current IFM(mA)
(Ta=25˚C)
Page 3

Note)Characteristics shown in diagrams are typical values. (not assurance value)
HY series
0
10
20
30
40
50
60
-25 0 25 50 75 85 125100
Peak Forward Current Derating Curve
Ambient temperature Ta(˚C)
Peak forward current IFM(mA)
0
10
20
30
40
50
60
-25 0 25 50 75 85 125100
Forward Current Derating Curve
Ambient temperature Ta(˚C)
Forward current IF(mA)
0.1
0.5
1.0
5.0
10
50
100
1.0 1.2 1.4 1.6 1.8 2.0 2.4 2.62.2
Forward Current vs. Forward Voltage(Note)
Forward voltage VF(V)
Forward current IF(mA)
(Ta=25˚C)
1.0
5.0
10
50
100
500
1000
-20 0 20 40 60 80 120100
Luminous Intensity vs. Ambient Temperature(Note)
Ambient temperature Ta(˚C)
Relative luminous intensity(%)
(Ta=25˚C)
1.0
5.0
2.0
10
20
50
100
200
500
1000
0.1 0.2 0.5 1 2 5 10 20 50
Luminous Intensity vs. Forward Current(Note)
Forward current IF(mA)
Relative luminous intensity(%)
(Ta=25˚C)
1.0
5.0
2.0
10
20
50
100
200
500
1/50 1/20 1/10 1/5 1/2 1
Duty Ratio vs. Peak Forward Current
Duty ratio DR
Peak forward current IFM(mA)
(Ta=25˚C)
Page 4

EG series
0
10
20
30
40
50
60
-25 0 25 50 75 85 125100
Peak Forward Current Derating Curve
Ambient temperature Ta(˚C)
Peak forward current IFM(mA)
0
10
20
30
40
50
60
-25 0 25 50 75 85 125100
Forward Current Derating Curve
Ambient temperature Ta(˚C)
Forward current IF(mA)
0.1
0.5
1.0
5.0
10
50
100
1.0 1.2 1.4 1.6 1.8 2.0 2.4 2.62.2
Forward Current vs. Forward Voltage(Note)
Forward voltage VF(V)
Forward current IF(mA)
(Ta=25˚C)
1.0
5.0
10
50
100
500
1000
-20 0 20 40 60 80 120100
Luminous Intensity vs. Ambient Temperature(Note)
Ambient temperature Ta(˚C)
Relative luminous intensity(%)
(Ta=25˚C)
1.0
5.0
2.0
10
20
50
100
200
500
1000
0.1 0.2 0.5 1 2 5 10 20 50
Luminous Intensity vs. Forward Current(Note)
Forward current IF(mA)
Relative luminous intensity(%)
(Ta=25˚C)
1.0
5.0
2.0
10
20
50
100
200
500
1/50 1/20 1/10 1/5 1/2 1
Duty Ratio vs. Peak Forward Current
Duty ratio DR
Peak forward current IFM(mA)
(Ta=25˚C)
Note)Characteristics shown in diagrams are typical values. (not assurance value)
 Loading...