

Page 1
SMT User Manual - Revision G
®
Danfoss Turbocor® Twin-Turbine
Centrifugal Series Compressors
TTS, TGS, TTH, T TG Series Compressors
http://turbocor.danfoss.com
Page 2

THIS PAGE INTENTIONALLY LEFT BLANK
2 of 88
M-SM-001-EN Rev. G
Page 3

Table of Contents
Chapter 1.0 Service Monitoring Tools Overview ..............................................................................9
1.1 Service Monitoring Tools Suite ...................................................................................................................................................... 9
1.2 Compatibility Requirements ........................................................................................................................................................ 10
1.3 General Usage ................................................................................................................................................................................... 12
Chapter 2.0 Recordings .....................................................................................................................15
2.1 Running a Recording ...................................................................................................................................................................... 15
Chapter 3.0 Compressor Connection Manager ...............................................................................23
3.1 Accessing the Compressor Connection Manager ................................................................................................................ 23
3.2 Compressor ........................................................................................................................................................................................24
3.3 Closing an Established Connection ........................................................................................................................................... 25
3.4 Detecting Compressor Settings ..................................................................................................................................................25
3.5 Changing Compressor Access Levels ........................................................................................................................................ 26
3.6 Synchronizing the Compressor Real-Time Clock with a PC Clock ..................................................................................26
3.7 Viewing a List of Recent Compressor Connection Settings .............................................................................................. 26
3.8 Selecting the Unit System ............................................................................................................................................................. 26
3.9 Connection Status Indications .................................................................................................................................................... 27
3.10 RAM Only and RAM & EEPROM Check boxes (TT/TG Only) ............................................................................................27
Chapter 4.0 ModComm Tool .............................................................................................................24
4.1 Accessing the ModComm Tool ....................................................................................................................................................24
4.2 Changing the Current Register Watch Range ........................................................................................................................24
4.3 Making a Single Write Request ................................................................................................................................................... 30
4.4 Making a Multiple Writes Request ............................................................................................................................................. 31
4.5 Changing the Current Data Interpretation View ..................................................................................................................32
Chapter 5.0 Active Alarm/Fault Viewer ............................................................................................35
5.1 Accessing the Active Alarm/Fault Viewer Tool ....................................................................................................................... 35
5.2 Viewing and Conguring Alarm/Fault Limits and Lockout Settings .............................................................................37
Chapter 6.0 Compressor Monitor .....................................................................................................39
6.1 Accessing the Compressor Monitor .......................................................................................................................................... 39
6.2 View Options ...................................................................................................................................................................................... 39
6.3 Changing the Demand .................................................................................................................................................................. 40
6.4 Changing the IGV Opening ( TT/TG Only) ................................................................................................................................40
6.5 Changing the Desired Motor Speed ......................................................................................................................................... 40
6.6 Levitating or De-levitating the Shaft ........................................................................................................................................40
Chapter 7.0 Logged Event and Fault Viewer ...................................................................................41
7.1 Accessing the Logged Event and Fault Viewer ...................................................................................................................... 41
Chapter 8.0 Compressor Data Recording and Playback Tool .........................................................47
8.1 Launching the Compressor Data Recording and Playback Tool .................................................................................... 47
8.2 Recording ............................................................................................................................................................................................47
8.3 Playback ...............................................................................................................................................................................................51
Chapter 9.0 Bearing Calibration Tool ...............................................................................................57
9.1 Accessing the Bearing Calibration Tool ....................................................................................................................................57
9.2 Performing a Calibration ............................................................................................................................................................... 58
9.3 Performing a Validation .................................................................................................................................................................59
9.4 Saving the Latest Bearing Calibration for Persistent Use ................................................................................................... 59
9.5 Viewing Bearing Calibration or Operation Settings ............................................................................................................59
9.6 Creating a Calibration Report ...................................................................................................................................................... 59
Chapter 10.0 Chiller and Analog Configuration Tool......................................................................61
10.1 Accessing the Chiller and Analog Conguration Tool ...................................................................................................... 61
10.2 Viewing or Modifying Chiller Controller Settings .............................................................................................................. 62
10.3 Viewing or Modifying Analog Output Controller Settings ............................................................................................. 62
Chapter 11.0 EXV Configuration Tool ..............................................................................................63
11.1 Accessing the EXV Conguration Tool ...................................................................................................................................63
11.2 Viewing and Modifying EXV Controller Settings ................................................................................................................ 65
Page 4

Chapter 12.0 Compressor Configuration Tool .................................................................................67
12.1 Accessing the Compressor Conguration Tool ................................................................................................................... 69
12.2 Viewing or Modifying Compressor Operation Settings ................................................................................................... 69
12.3 Viewing or Modifying Compressor Startup Settings ........................................................................................................ 69
12.4 Viewing of Modifying Shutdown Conguration Settings (TT/TG Only) .................................................................... 70
12.5 Viewing or Modifying IGV Conguration Settings (TT/TG Only) .................................................................................. 70
12.6 Viewing or Modifying Surge/Choke Conguration Settings (TT/TG Only) ............................................................... 70
12.7 Viewing or Modifying Capacity Control Conguration Settings (VTT Only) ............................................................70
12.8 Viewing or Modifying Communication Conguration ....................................................................................................71
12.9 Viewing Advanced Conguration ............................................................................................................................................71
Chapter 13.0 Compressor Commissioning Tool ..............................................................................73
13.1 Accessing the Compressor Commissioning Tool (TT/TG Only) ..................................................................................... 73
13.2 Importing a Commissioning Conguration from a File ...................................................................................................73
13.3 Adjusting Commissioning Parameters Requirement Step ............................................................................................. 74
13.4 Exporting a Commissioning Values Conguration to a File ...........................................................................................74
13.5 Exporting Commissioning Parameters to a Connected Compressor ......................................................................... 75
13.6 Creating a Commissioning Report .......................................................................................................................................... 75
Chapter 14.0 Compressor Data Trending Tool ................................................................................77
14.1 Accessing the Compressor Data Trending Tool (TT/TG Only) ........................................................................................ 77
14.2 Adding Parameters for Graphical Monitoring ..................................................................................................................... 77
14.3 Removing Parameters from Graphical Monitoring ........................................................................................................... 79
14.4 Selecting the Plot Color a Specic Parameter .....................................................................................................................79
14.5 Starting Graphical Monitoring ..................................................................................................................................................80
14.6 Stopping Graphical Monitoring ............................................................................................................................................... 80
14.7 Resetting Plot Data ....................................................................................................................................................................... 81
14.8 Saving Plot Data to a CSV File ................................................................................................................................................... 82
14.9 Loading a Saved or Pre-congured Watch Group .............................................................................................................82
14.10 Deleting a Saved or Pre-congured Watch Group ..........................................................................................................82
14.11 Saving the Active Watch Conguration for Later Recall................................................................................................83
14.12 Trending Tool ................................................................................................................................................................................83
14.13 Valve Control Setup (VTT Only) ..............................................................................................................................................84
14.14 Valve Control Tool........................................................................................................................................................................ 85
4 of 88
List of Tables
Table 1-1 SMT Software Requirements ........................................................................................................................................... 10
Table 1-2 SMT Software Icons ............................................................................................................................................................. 11
M-SM-001-EN Rev. G
Page 5

List of Figures
Figure 1-1 TT/TG SMT Suite Launcher Strip - Not Connected ................................................................................................... 9
Figure 1-2 VTT SMT Suite Launcher Strip - Not Connected ....................................................................................................... 9
Figure 1-3 TT/TG SMT Suite Launcher Strip - Connected............................................................................................................ 9
Figure 1-4 VTT SMT Suite Launcher Strip - Connected ................................................................................................................ 9
Figure 1-5 Select Language ................................................................................................................................................................... 9
Figure 1-6 Restart Application ............................................................................................................................................................ 10
Figure 1-7 Collapsible Group Boxes Example (TT/TG SMT Shown) ....................................................................................... 13
Figure 2-1 SMT Suite Launcher Strip - Not Connected (TT SMT Shown) ............................................................................15
Figure 2-2 Compressor Data Recording & Playback Tool Icon ................................................................................................ 15
Figure 2-3 Compressor Data Recording and Playback Tool ..................................................................................................... 16
Figure 2-4 Open Recording Icon ........................................................................................................................................................ 16
Figure 2-5 Choose a Recording File to Open Window ...............................................................................................................17
Figure 2-6 Compressor Data Recording & Playback Tool .......................................................................................................... 18
Figure 2-7 Compressor Data Recording and Playback Tool showing Launch Playback Server .................................. 19
Figure 2-8 Launch Playback Server Icon ......................................................................................................................................... 19
Figure 2-9 Compressor Connection Manager Icon ..................................................................................................................... 20
Figure 2-10 Compressor Connection Manager ............................................................................................................................ 20
Figure 2-11 TT/TG SMT Suite Launcher Strip - Connected .......................................................................................................21
Figure 2-12 VTT SMT Suite Launcher Strip - Connected ........................................................................................................... 21
Figure 3-1 Compressor Connection Manager Icon ..................................................................................................................... 23
Figure 3-2 TT/TG Compressor Connection Manager .................................................................................................................. 23
Figure 3-3 V TT Compressor Connection Manager .....................................................................................................................24
Figure 3-4 Parameter Saving Frame .................................................................................................................................................27
Figure 4-1 ModComm Tool Icon ........................................................................................................................................................29
Figure 4-2 VTT ModComm Window (VTT Displayed) ................................................................................................................29
Figure 4-3 ModComm Window Displaying Menu .......................................................................................................................30
Figure 4-4 ModComm Tool Window Showing Menu ................................................................................................................. 30
Figure 4-5 Write Single Register .........................................................................................................................................................30
Figure 4-6 Write Single Register Result Window ..........................................................................................................................31
Figure 4-7 ModComm Tool Window Showing Menu ................................................................................................................. 31
Figure 4-8 Write Multiple Registers Result Window ....................................................................................................................32
Figure 4-9 TT/TG ModComm Tool Window Showing Menu .................................................................................................... 32
Figure 4-10 VTT ModComm Tool Window Showing Menu ......................................................................................................33
Figure 4-11 VTT ModComm Tool Window Showing Display Format Options ..................................................................33
Figure 4-12 ModComm Tool Window Showing Chosen New Display Format (VTT Displayed) .................................33
Figure 5-1 Active Alarm/Fault Viewer Tool Icon............................................................................................................................35
Figure 5-2 TT/TG Active Alarm/Fault Viewer Window ................................................................................................................35
Figure 5-3 VTT Active Alarm/Fault Viewer Window ....................................................................................................................36
Figure 5-4 Clearing Faults (TT/TG)..................................................................................................................................................... 36
Figure 5-5 TT/TG Compressor Status Tab ........................................................................................................................................ 37
Figure 5-6 VTT Compressor Status Tab ............................................................................................................................................37
Figure 5-7 Alarm and Fault Conguration (1) (TT/TG Shown) ................................................................................................ 38
Figure 5-8 Alarm and Fault Conguration (2) Page 2 (TT/TG Only) ...................................................................................... 38
Figure 6-1 Compressor Monitor Tool Icon ......................................................................................................................................39
Figure 6-2 Compressor Monitor Tool Window (TT/TG Shown) ...............................................................................................39
Figure 6-3 Shaft Levitation Status Graphic .................................................................................................................................... 40
Figure 7-1 Logged Event and Fault Viewer Icon ...........................................................................................................................41
Figure 7-2 Logged Event and Fault Viewer Window (TT/TG) ...................................................................................................41
Figure 7-3 Logged Events Fault Viewer ...........................................................................................................................................43
Figure 7-4 Logged Event and Fault Viewer Window (VTT).......................................................................................................44
Figure 7-5 VTT System Snapshot Log Window .............................................................................................................................45
Figure 8-1 Compressor Data Recording and Playback Tool Icon ........................................................................................... 47
Figure 8-2 Compressor Data Recording and Playback ..............................................................................................................48
Figure 8-3 Choose Destination Filename (TT/TG Shown) ........................................................................................................48
Figure 8-4 Site Information .................................................................................................................................................................. 49
Figure 8-5 Start Recording Icon ......................................................................................................................................................... 49
Figure 8-6 Stop Recording Icon..........................................................................................................................................................50
Figure 8-7 Cancel Recording Icon ..................................................................................................................................................... 50
Figure 8-8 Pause Recording Icon .......................................................................................................................................................50
Figure 8-9 Start Recording Icon ......................................................................................................................................................... 51
Figure 8-10 Open Recording Icon ..................................................................................................................................................... 51
Figure 8-11 Choose a Recording to Open Window .....................................................................................................................51
Figure 8-12 Play Icon .............................................................................................................................................................................. 52
Figure 8-13 Compressor Connection ............................................................................................................................................... 52
Figure 8-14 Compressor Data Recording and Playback Window ..........................................................................................53
Figure 8-15 Close Recording Icon ..................................................................................................................................................... 53
5 of 88M-SM-001-EN Rev. G
Page 6

Figure 8-16 Stop Playback Server ...................................................................................................................................................... 54
Figure 8-17 Play Button .........................................................................................................................................................................54
Figure 8-18 Pause Button ..................................................................................................................................................................... 54
Figure 8-19 Rewind Button .................................................................................................................................................................. 54
Figure 8-20 Slow Forward Button .....................................................................................................................................................54
Figure 8-21 Slow Reverse Button.......................................................................................................................................................54
Figure 8-22 Save as CSV File Button .............................................................................................................................................55
Figure 8-23 Save to CSV ..................................................................................................................................................................... 55
Figure 8-24 Tools Button .......................................................................................................................................................................56
Figure 8-25 Manage Parameters Window ...................................................................................................................................56
Figure 8-26 Speed Registers Selected ............................................................................................................................................. 56
Figure 9-1 Bearing Calibration Tool Icon ......................................................................................................................................... 57
Figure 9-2 Bearing Calibration Window ..........................................................................................................................................57
Figure 9-3 Bearing Calibration Tool Showing Graphs ................................................................................................................58
Figure 10-1 Chiller and Analog Conguration Tool Icon ...........................................................................................................61
Figure 10-2 Chiller and Analog Conguration Window ............................................................................................................61
Figure 11-1 EXV Conguration Tool Icon ........................................................................................................................................ 63
Figure 11-2 EXV Conguration Tool (Applies to rmware prior to 4.X) ...............................................................................63
Figure 11-3 EXV Conguration Tool (Applies to 4.x rmware) ................................................................................................64
Figure 12-1 Compressor Conguration Tool Icon ........................................................................................................................ 67
Figure 12-2 Compressor Conguration Window .........................................................................................................................67
Figure 12-3 Compressor Conguration Window (Basic Conguration) ..............................................................................68
Figure 12-4 Compressor Conguration Window (Advanced Conguration) ....................................................................68
Figure 13-1 Compressor Commissioning Tool Icon .................................................................................................................... 73
Figure 13-2 Compressor Commissioning Window......................................................................................................................73
Figure 13-3 Compressor Commissioning Finish Window .........................................................................................................74
Figure 13-4 Choose Commissioning File Location ......................................................................................................................74
Figure 13-5 Commissioning Complete............................................................................................................................................75
Figure 13-6 Report Prompt .................................................................................................................................................................. 75
Figure 13-7 Report Save As Window ................................................................................................................................................76
Figure 14-1 Compressor Data Trending Tool Icon .......................................................................................................................77
Figure 14-2 Compressor Data Trending Window ......................................................................................................................... 77
Figure 14-3 Compressor Trending Window - Parameter Pane ................................................................................................78
Figure 14-4 Parameter Color Selection............................................................................................................................................79
Figure 14-5 Watched Parameters After Color Change ............................................................................................................... 80
Figure 14-6 Watched Parameters Being Plotted .......................................................................................................................... 80
Figure 14-7 Save Data Prompt ............................................................................................................................................................81
Figure 14-8 Save Data to a CSV File ..................................................................................................................................................81
Figure 14-9 Managed Watch Congurations Button .................................................................................................................82
Figure 14-10 Watch Management Window ...................................................................................................................................82
Figure 14-11 Compressor Data Trending ........................................................................................................................................83
Figure 14-12 Compressor Data Trending ........................................................................................................................................84
Figure 14-13 Motor Cooling Valve Tool Icon ..................................................................................................................................84
Figure 14-14 Valve Control Setup - Motor Cooling .....................................................................................................................85
Figure 14-15 Valve Control Setup - VFD Cooling .........................................................................................................................85
Figure 14-16 Valve Control Setup - IFV ............................................................................................................................................85
Figure 14-17 Valve Control Setup - Staging ...................................................................................................................................86
6 of 88
M-SM-001-EN Rev. G
Page 7

Proprietary Notice
Copyright, Limitations of Liability and Revision Rights.
This publication contains proprietary information to Danfoss Turbocor Compressors, Inc. (DTC). This
publication is protected under the Copyright laws of the United States of America (USA) and most
other countries. This work is owned by DTC, and was published as of the most recent revision of
this publication, as indicated on the Title page of this document. This document is for the use DTC
customers and prospective customers only. Any use beyond that is prohibited.
Tests have demonstrated that equipment produced according to the guidelines provided in this
manual will function properly, however DTC cannot guarantee the equipment to work in every
physical, hardware or software environment.
The guidelines provided in this manual are provided “AS-IS” without any warranty of any kind, either
express or implied, including, without limitation, any implied warranties of condition, uninterrupted
use, merchantability, fitness for a particular purpose.
In no event shall DTC be liable for direct, indirect, special, incidental or consequential damages
arising out of the manufacture, use, or the inability to manufacture or use information contained in
this manual, even if advised of the possibility of such damages. In particular, DTC is not responsible
for any costs, including but not limited to those incurred as a result of lost profits or revenue, loss of
damage or equipment, loss of computer programs, loss of data, the costs to substitute these, or any
claims by third parties. In any event, DTC’s total aggregate liability for all damages of any kind and type
(regardless of whether based in contract or tort) shall not exceed the purchase price of this product.
DTC reserves the right to revise the publication at any time and to make changes to its contents
without prior notice or any obligation to notify former or present users of such revisions or changes.
Danfoss Turbocor Compressors Inc.
1769 East Paul Dirac Drive Tallahassee,
Florida 32310
USA
Phone 1-850-504-4800
Fax 1-850-575-2126
http://turbocor.danfoss.com
Encounter an error or see opportunity for improvements while reading
this manual? Email us at turbocor.contact@danfoss.com with a brief
description.
* Subject to change without notice.
* Danfoss Turbocor’s commitment to excellence ensures continuous product improvements.
7 of 88M-SM-001-EN Rev. G
Page 8

THIS PAGE INTENTIONALLY LEFT BLANK
8 of 88
M-SM-001-EN Rev. G
Page 9
Chapter 1.0 Service Monitoring Tools Overview
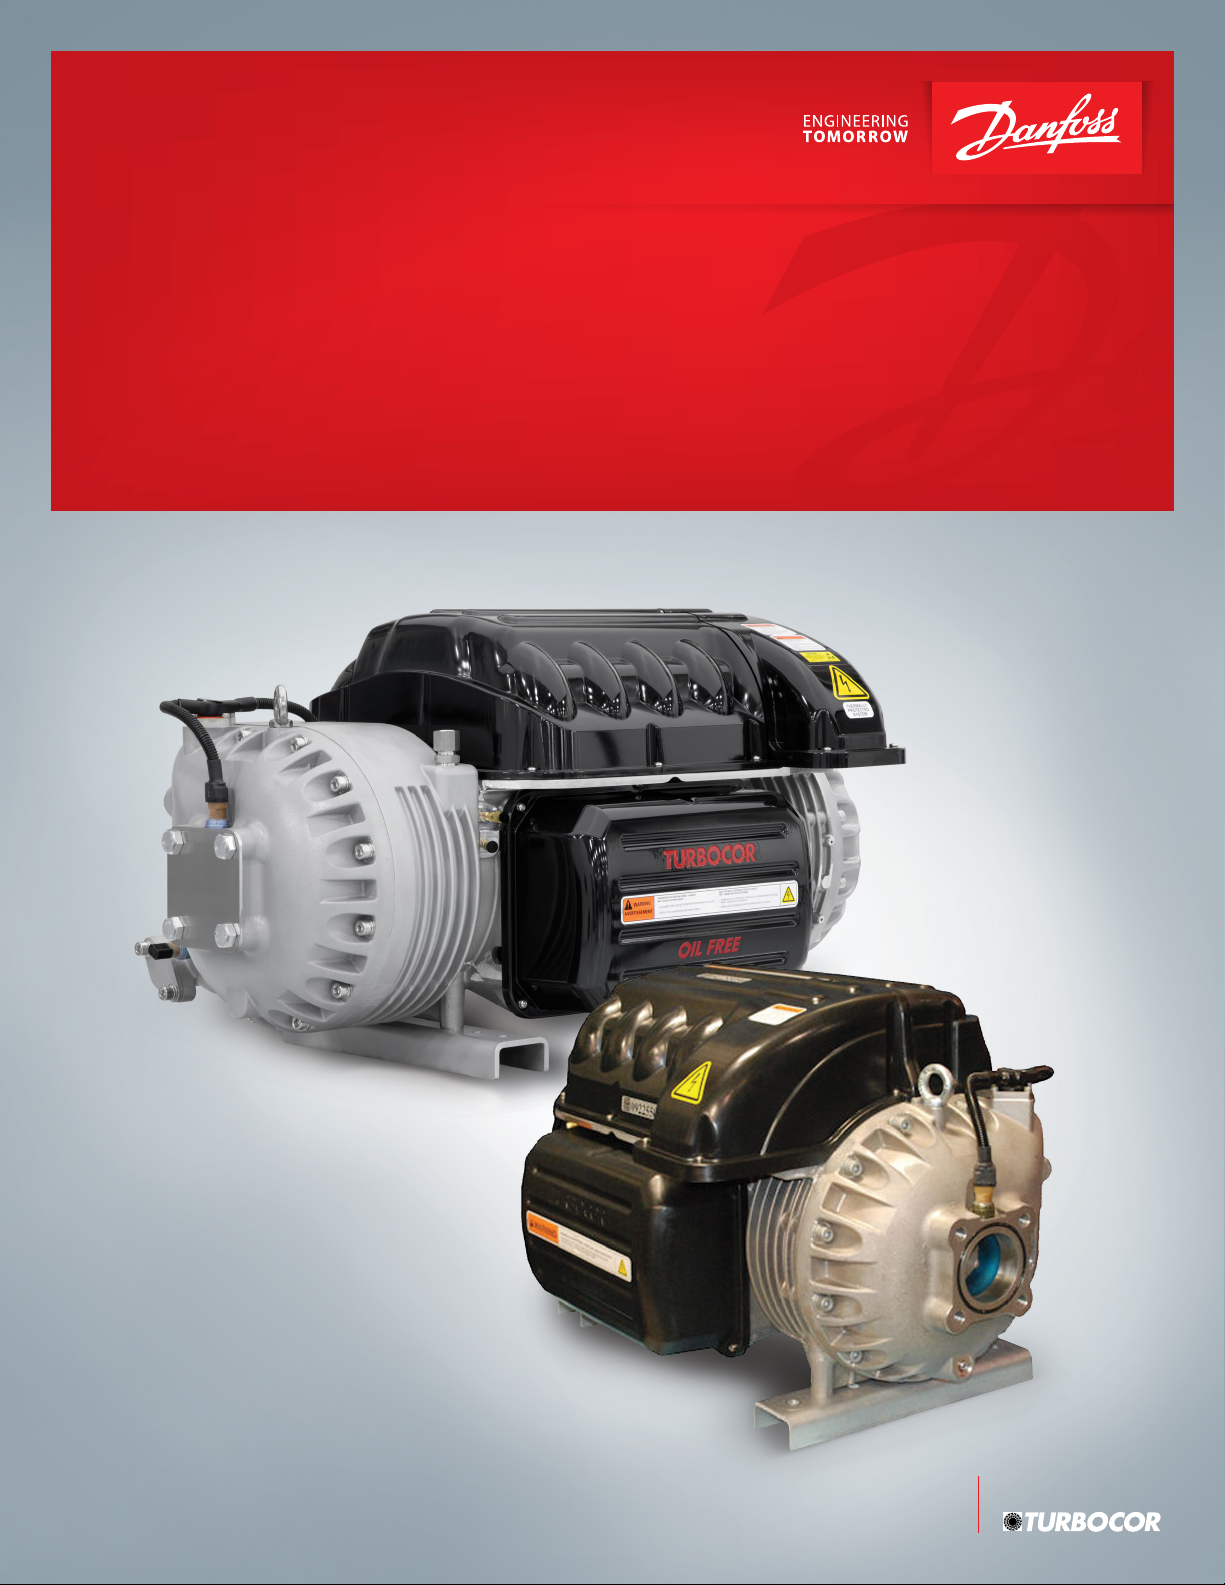
1.1 Service Monitoring Tools Suite
Figure 1-1 TT/TG SMT Suite Launcher Strip - Not Connected
Figure 1-2 VTT SMT Suite Launcher Strip - Not Connected
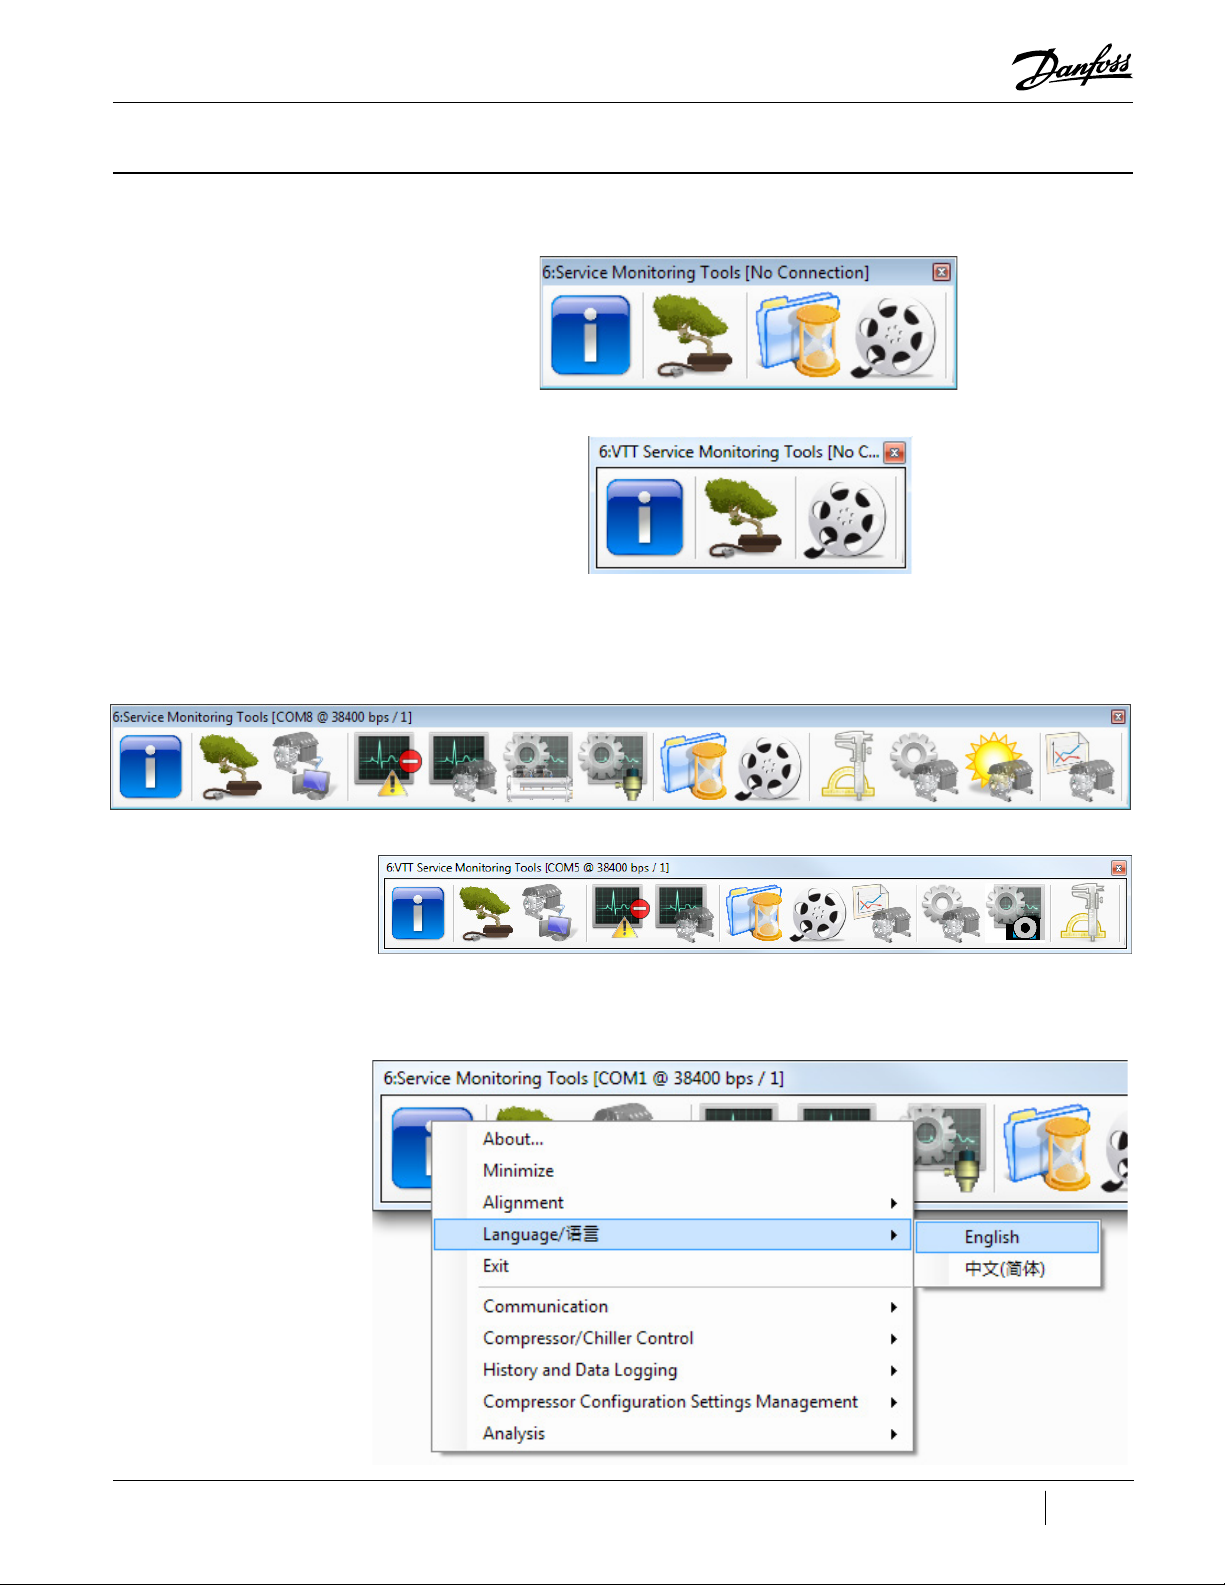
Once connected, more tool icons may appear in the SMT Suite Launcher Strip depending on the
compressor’s established access level.
Figure 1-3 TT/TG SMT Suite Launcher Strip - Connected
Figure 1-4 VTT SMT Suite Launcher Strip - Connected
To change the language in the SMT, Right-Click the main toolbar and select Language then English
or Chinese.
Figure 1-5 Select Language
9 of 88M-SM-001-EN Rev. G
Page 10
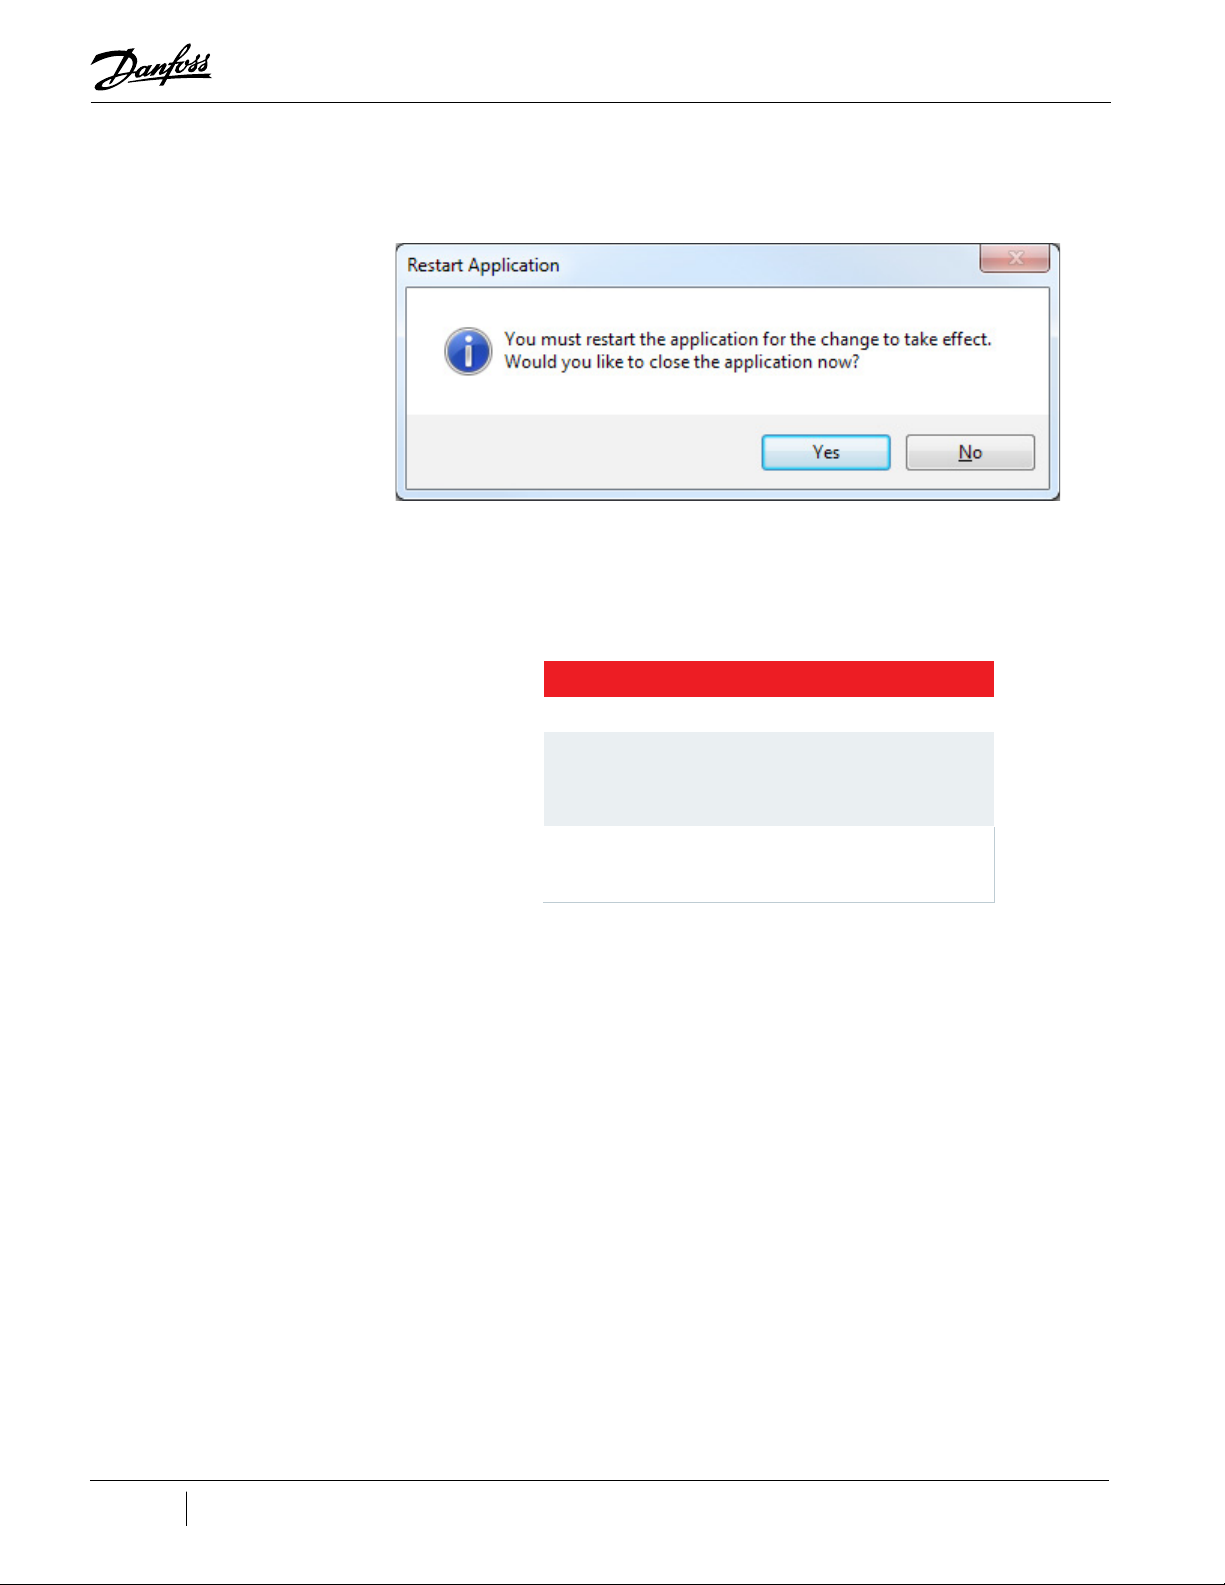
To save language preference, restart the application. The chosen language will be stored in settings.
The default language found in local machine settings will be used during installation.
Figure 1-6 Restart Application
1.2 Compatibility Requirements
"Table 1-1 SMT Software Requirements" provides the system requirements for the SMT.
Table 1-1 SMT Software Requirements
TT/TG/VTT
Framework: .NET Framework Version 4.0 or later.
Operating System: Microsoft Windows XP
(32-bit or 64-bit) SP2 or later, Microsoft Windows Vista (32-bit or
64-bit) Basic or better, Microsoft Windows 7 (32-bit or 64-bit)
Home Basic, or Windows 10 (32-bit or 64-bit).
Hardware: 1.0 GHz or higher CPU, minimum OS-required RAM,
1024x768 high-color display (or better), and 20 MB or more
available hard-disk space.
Depending on compressor access level, the following tools may be available from the SMT Suite
Launcher Strip:
10 of 88
M-SM-001-EN Rev. G
Page 11
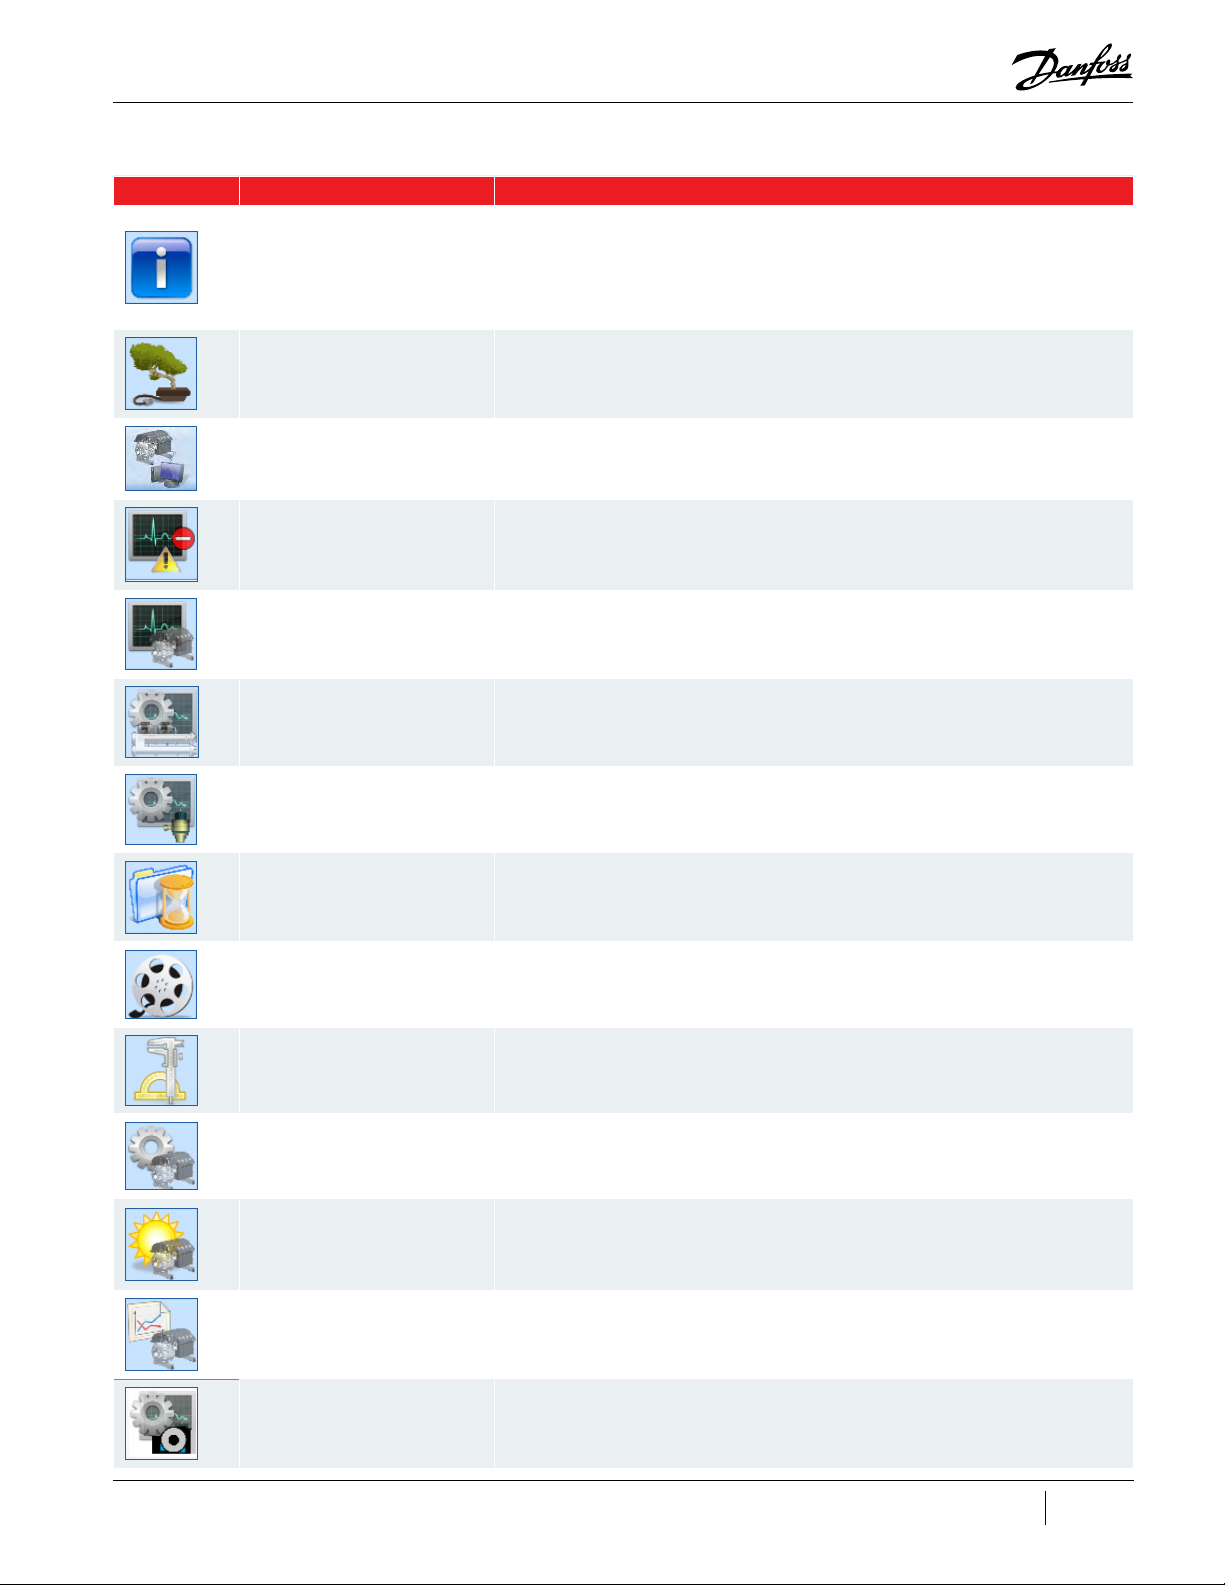
Table 1-2 SMT Software Icons
Icon Tool Description
The About tool displays a form showing OS and framework version information, SMT software
system release product version info, and a listing of software assemblies loaded for the SMT
About
Compressor Connection Manager Discover and establish a means of communication with the compressor. ( TT/TG and VTT)
software product.
• To view a detailed description of any given assembly, select an item in the loaded assemblies
listing and a text description and graphic icon (if exists) displays in the area below
• To copy all of the version information to the clipboard, click the Copy Info button. (TT/TG
and VTT )
ModComm Tool
Active Alarm/Fault Viewer
Compressor Monitor
Chiller and Analog Conguration
EXV Conguration Tool
Logged Event and Fault Viewer
Compressor Data
Recording and Playback
Assists in troubleshooting a Bearing, Motor and Compressor Controller (BMCC) or monitoring
registers by providing access to ModBus registers on a raw level. (TT/TG and VTT )
Instantaneously monitor the alarm and fault status of a connected compressor device and
congure the alarm and fault limits. (TT/TG and VTT )
Monitor the most commonly desired parameters of the BMCC related to motor, bearing, and
compressor operation. (TT/TG and VTT )
Allows you to view or modify the chiller control and analog output control conguration
parameters and settings. (TT/TG 3.1.X or older Firmware Only)
This allows you to view and congure the electronic expansion valve conguration
parameters and settings. (TT/TG Only)
Retrieve logged fault and event data regarding the operation of a connected compressor for
the purpose of troubleshooting and diagnostics. (TT/TG 3.1.X or older Firmware Only)
Start and stop recording of any variables on the BMCC, as well as launch a server partially
simulating an actual compressor using previously recorded data. The intended usage of
this tool is not only for training, but for testing, evaluation and compressor troubleshooting
purposes. (TT/TG and VTT)
Bearing Calibration Execute a bearing calibration procedure and analyze the outcome. (TT/TG and VTT)
Compressor Conguration
Compressor
Commissioning
Compressor Data Trending
Valve Control
View and congure the compressor operation, IGV startup, surge/choke, and other
operational conguration parameters. (TT/TG and VTT)
View, modify and commit site-specic compressor parameter values of a connected
compressor, as well as import and export congurations between portable les. Minor
guidance is provided to the user by presenting any number of conguration pages which
are necessary for consideration during the deployment of a compressor system and the
displaying of basic coverage/ow indication. (TT/TG Only)
Graphically monitor selected compressor parameter values and load or save usercongurable watch congurations. (TT/TG and VTT)
View and congure the valve operation: Motor Cooling, VFD Cooling, IFV, and Staging valves.
(VT T only)
11 of 88M-SM-001-EN Rev. G
Page 12

1.2.1 Right-Click Context Menu
From the SMT Launcher Strip, you can right-click with your mouse to view a context menu providing
easy access to tasks, including:
1.3 General Usage
There are several helpful features common across all tools in the SMT software system geared toward
simplifying day-to-day as well as extensive usage. These features include: internal logging system,
informative tooltips, highlight-on-click, collapsible group boxes, interactive graphs, persistent user
settings, normalized tool framework, and product update checking.
1.3.1 Internal Logging System
To enhance maintenance and troubleshooting the SMT software system, all tools utilize a common
logging system functionality for outputting to file internal trace information, as well as any error
occurrences which may occur.
The log file is located at: [My Documents]\Danfoss Turbocor\SMT\smt.log
• Launching a tool - select the desired tool by name.
• Display the About form - click About.
• Minimize the tool suite - click Minimize and the tool will be minimized to your task bar under
one window button.
• Change the SMT Launcher Strip orientation - click Alignment -> Horizontal to display the SMT
Launcher Strip in a landscape format or Alignment -> Vertical for a portrait layout.
1.3.2 Informative Tooltips
To aid in general use and interpretation of compressor data, all compressor parameter edit/display
fields will display a tooltip which pops up if the mouse cursor hovers over the field and will describe
the modbus register associated with that parameter.
1.3.3 Highlight-on-click
To assist you in viewing data ‘at a glance’, certain readout fields can be highlighted to make them stand
out from the rest. The highlighting of fields with this functionality enabled can be toggled by leftclicking on the desired field.
1.3.4 Expand/Collapse-on-click
Any group boxes which display a box bearing a +/- box in the upper left-hand corner may be collapsed
in order to reduce the size of a form when some information is not desired to be viewed. To collapse or
expand these regions, left-click on the +/- graphic.
12 of 88
M-SM-001-EN Rev. G
Page 13
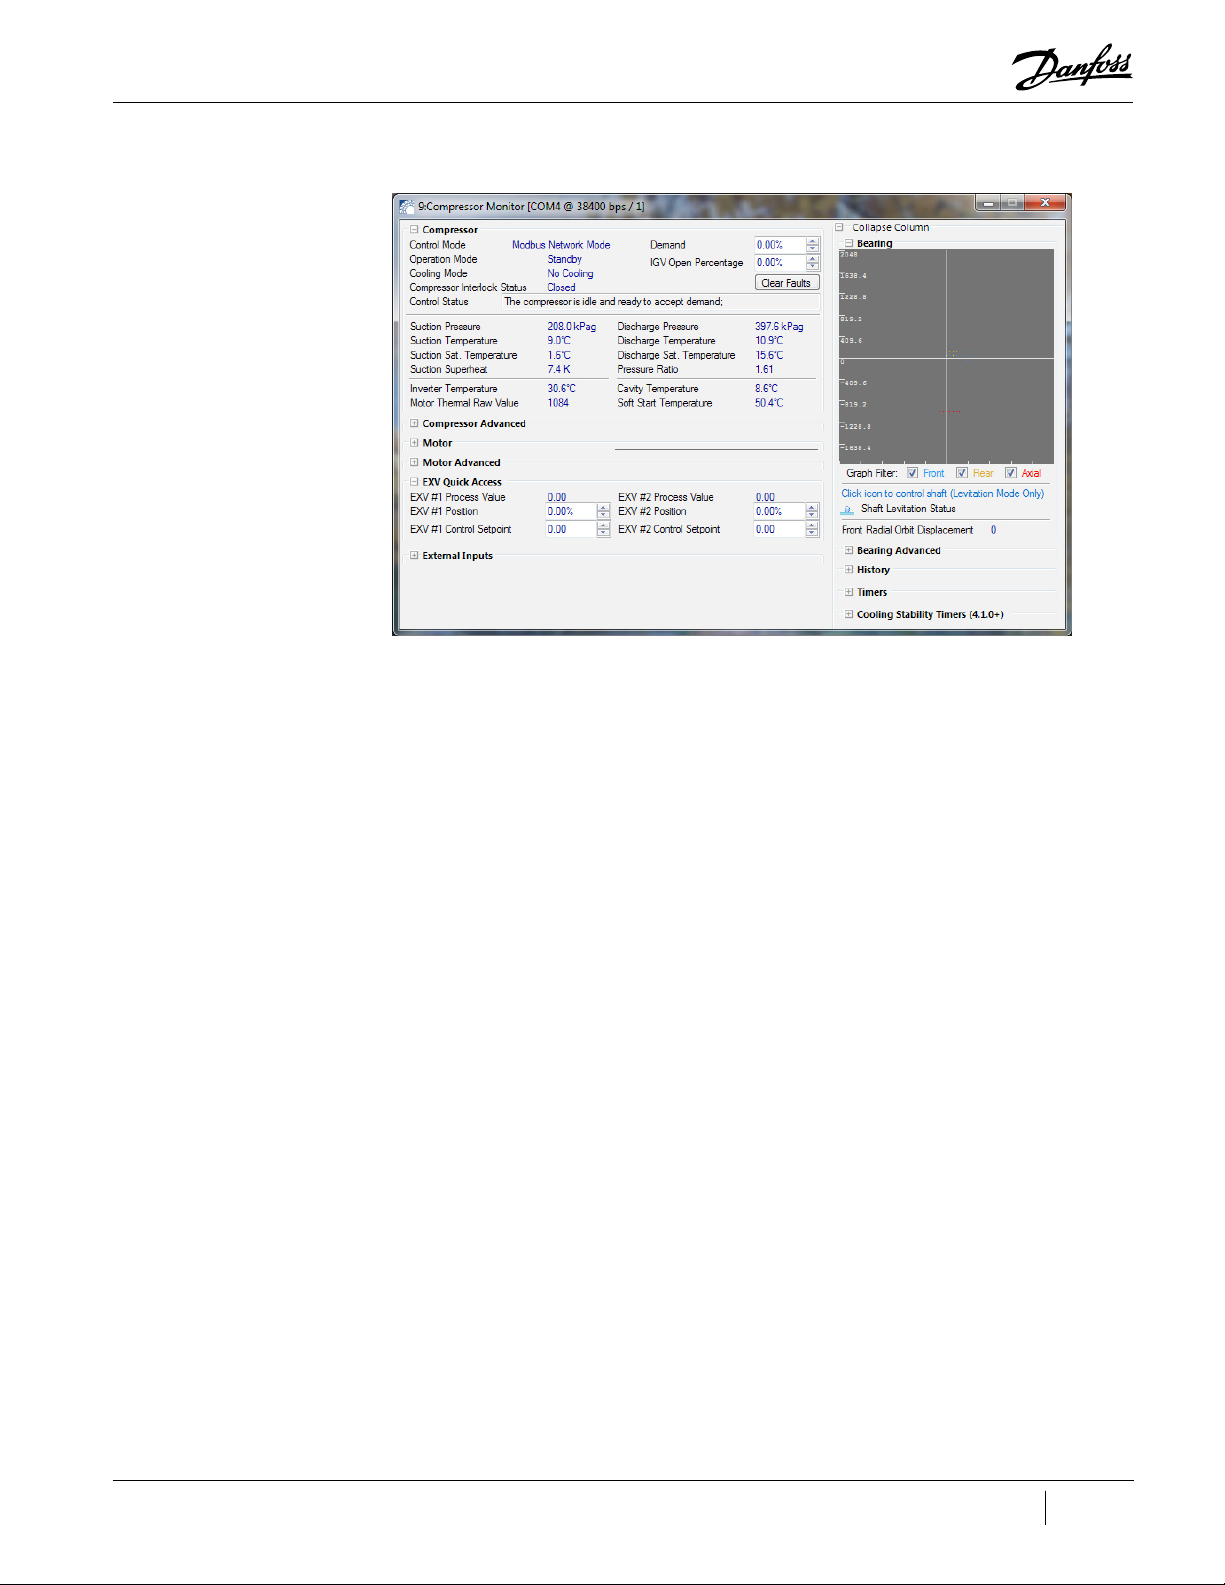
Figure 1-7 Collapsible Group Boxes Example (TT/TG SMT Shown)
1.3.5 Interactive Graphs
Graphs display data and provide a different perspective. The graphing feature provides the ability to
pan, zoom, etc.
• To pan: if panning is enabled, click and drag in either the X or Y direction.
• To fast pan: hold the control key while clicking and dragging within a graph to pan across larger
areas.
• To zoom: if zooming is enabled, use the scroll wheel on the mouse to zoom in and out - holding
shift while scrolling will only stretch the Y axis; holding ctrl while scrolling will only stretch the X axis.
• To reset to initial view: double-click anywhere on the graph.
1.3.6 Persistent User Settings
Many of the interface settings are saved in a local settings file in order to persist common settings on a
user-by-user basis.
Typical persistent settings include: tool form screen location, tool form normal/maximized state,
collapsible form collapse/expand states, user-entered application fields (e.g., hostnames, DTC ports,
technician name fields, etc.).
The settings file is located at:
[My Documents]\Danfoss Turbocor\SMT\Settings.xml
1.3.7 Normalized Tool Framework
All components considered to be tools contain a commonly-structured data identifying a tool and its
interface components.
Data included in the tool metadata (assembly information) include: Tool Id #, Tool Name Id, Tool
Description Id, Tool Classification, Minimum (execution) Access Level, Enumeration Count, Persistence,
Connection Requirement, Dedication Requirement, and an Application Graphic.
In addition to the framework metadata, there are several components geared toward the utilization of
these tool components, including standalone execution support, common interfacing components, etc.
13 of 88M-SM-001-EN Rev. G
Page 14

1.3.8 Tool Identification
Each tool’s title frame contains information identifying it. This information includes:
• Tool/Form ID - The first number, indicating the ID number of the current tool.
• Tool Title - The localized text title of the current tool.
• Device Connection Info - This includes the serial port and baud rate or IP address and port
number and the slave address of the device with which the current tool is connected.
NOTE
To dierentiate between instances of the SMT, look at the device communication information displayed in the tool’s frame.
14 of 88
M-SM-001-EN Rev. G
Page 15
Chapter 2.0 Recordings
2.1 Running a Recording
While the SMT Suite Tools are intended to be used with live Danfoss Turbocor (DTC) compressors, it is
possible to partially simulate communication with a compressor using recorded data. The playback
simulation can be used for displaying values, but cannot accept write requests (parameter updates)
and certain features may not be available (such as fault or event log retrieval).
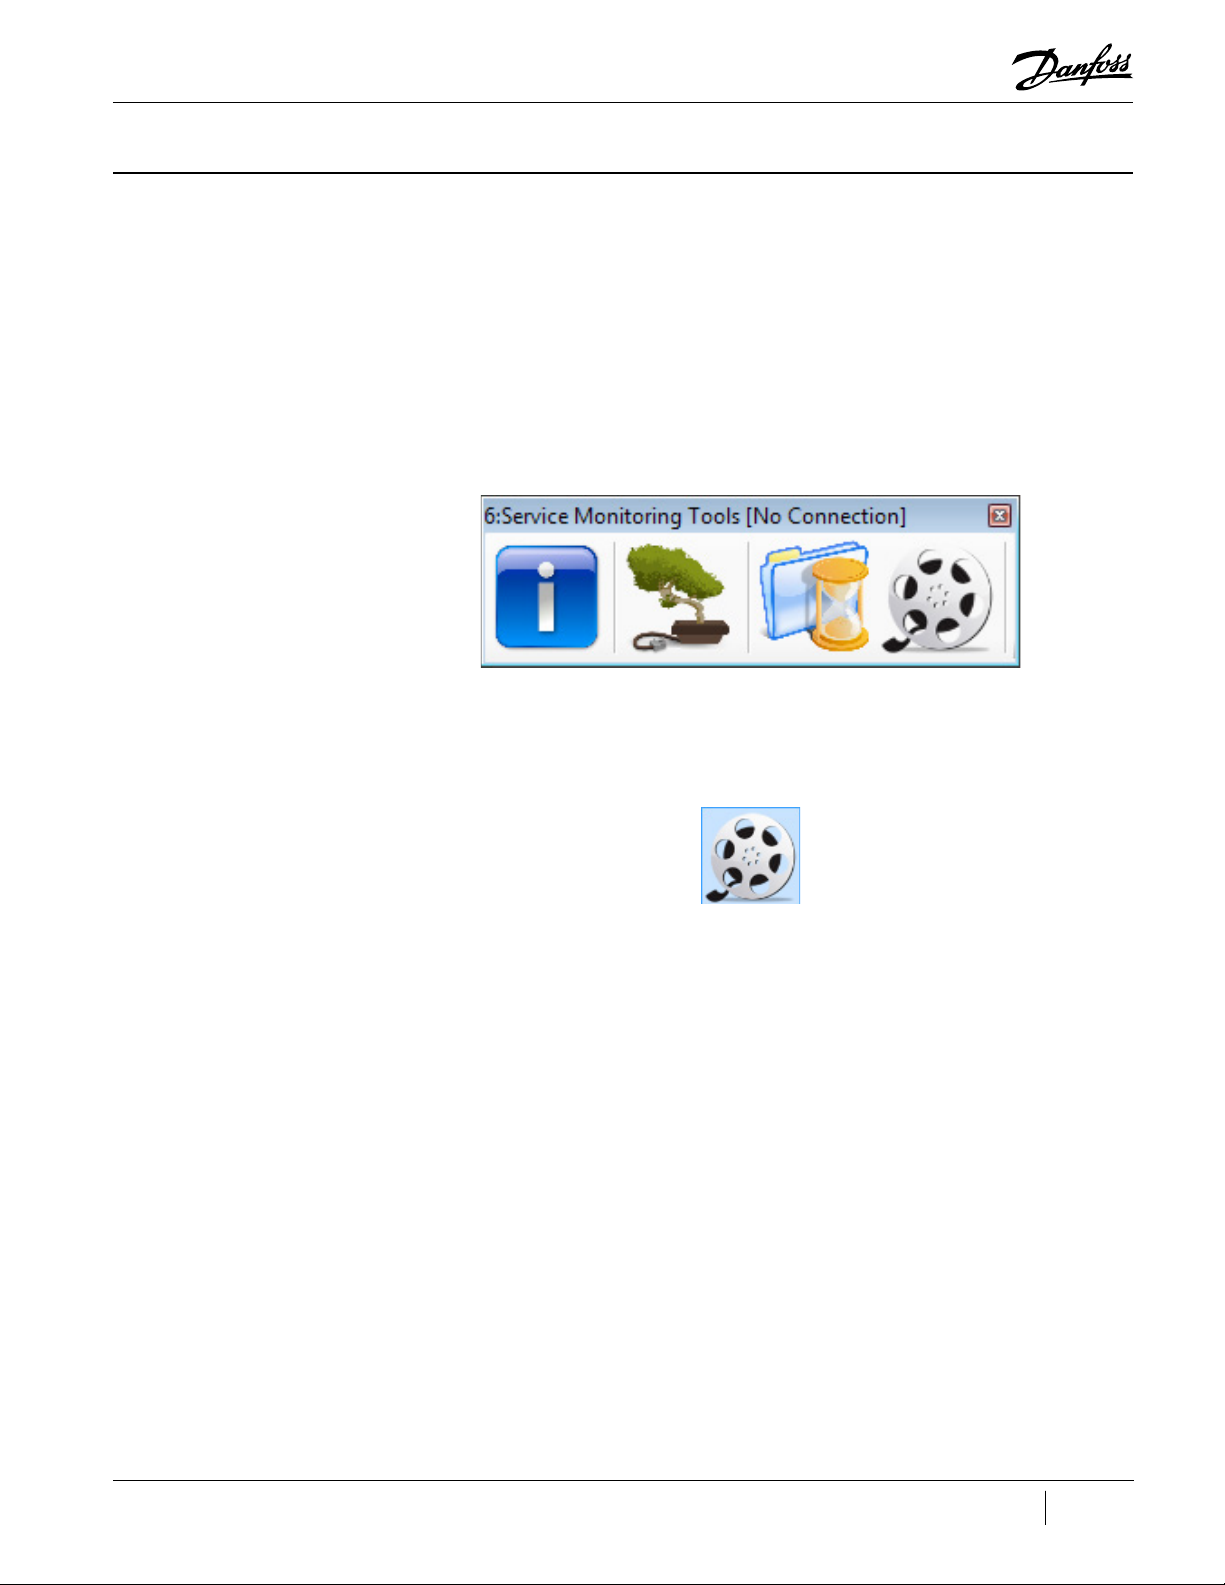
When you first open the Service Monitoring Tools software, a limited version of the Service Monitoring
Tools (SMT) Suite Launcher Strip is displayed.
Figure 2-1 SMT Suite Launcher Strip - Not Connected (TT SMT Shown)
1. Click the Compressor Data Recording & Playback Tool icon.
Figure 2-2 Compressor Data Recording & Playback Tool Icon
2. The Compressor Data Recording & Playback Tool window displays.
15 of 88M-SM-001-EN Rev. G
Page 16
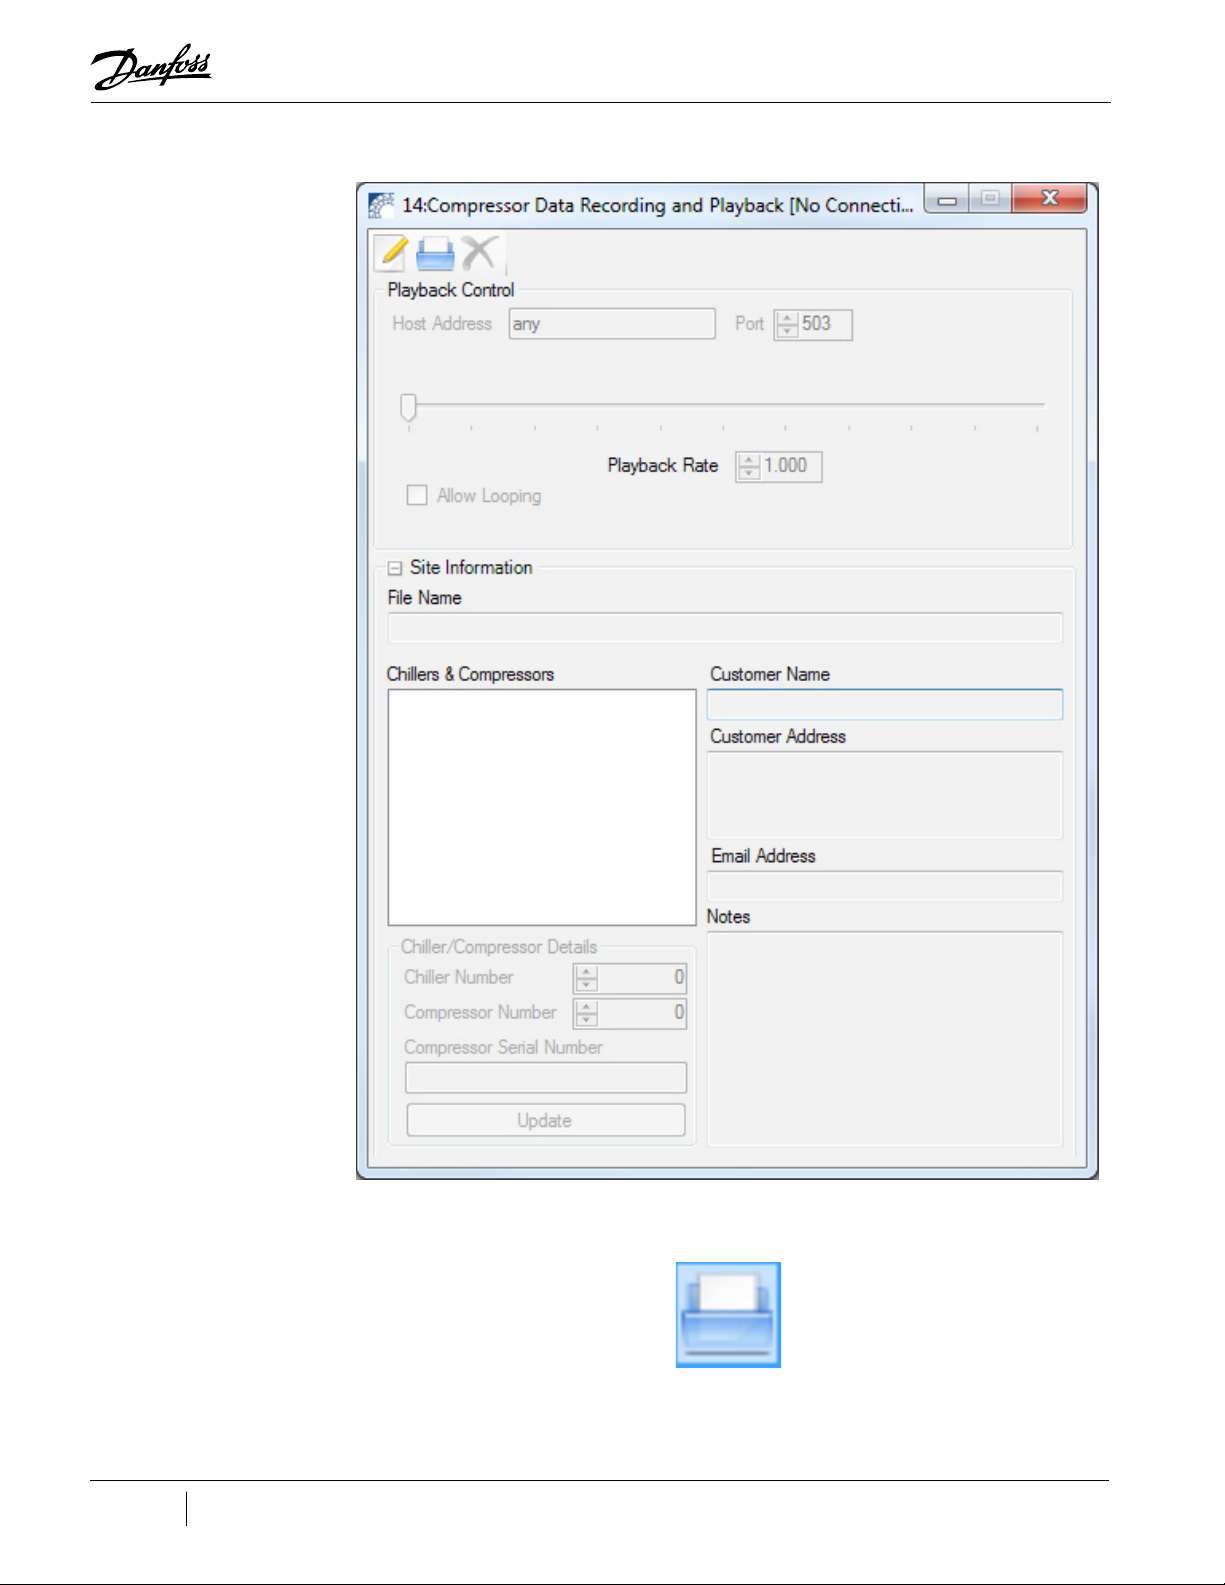
Figure 2-3 Compressor Data Recording and Playback Tool
Figure 2-4 Open Recording Icon
16 of 88
M-SM-001-EN Rev. G
3. Click the Open Recording icon.
The Choose a recording file to open window displays:
Page 17
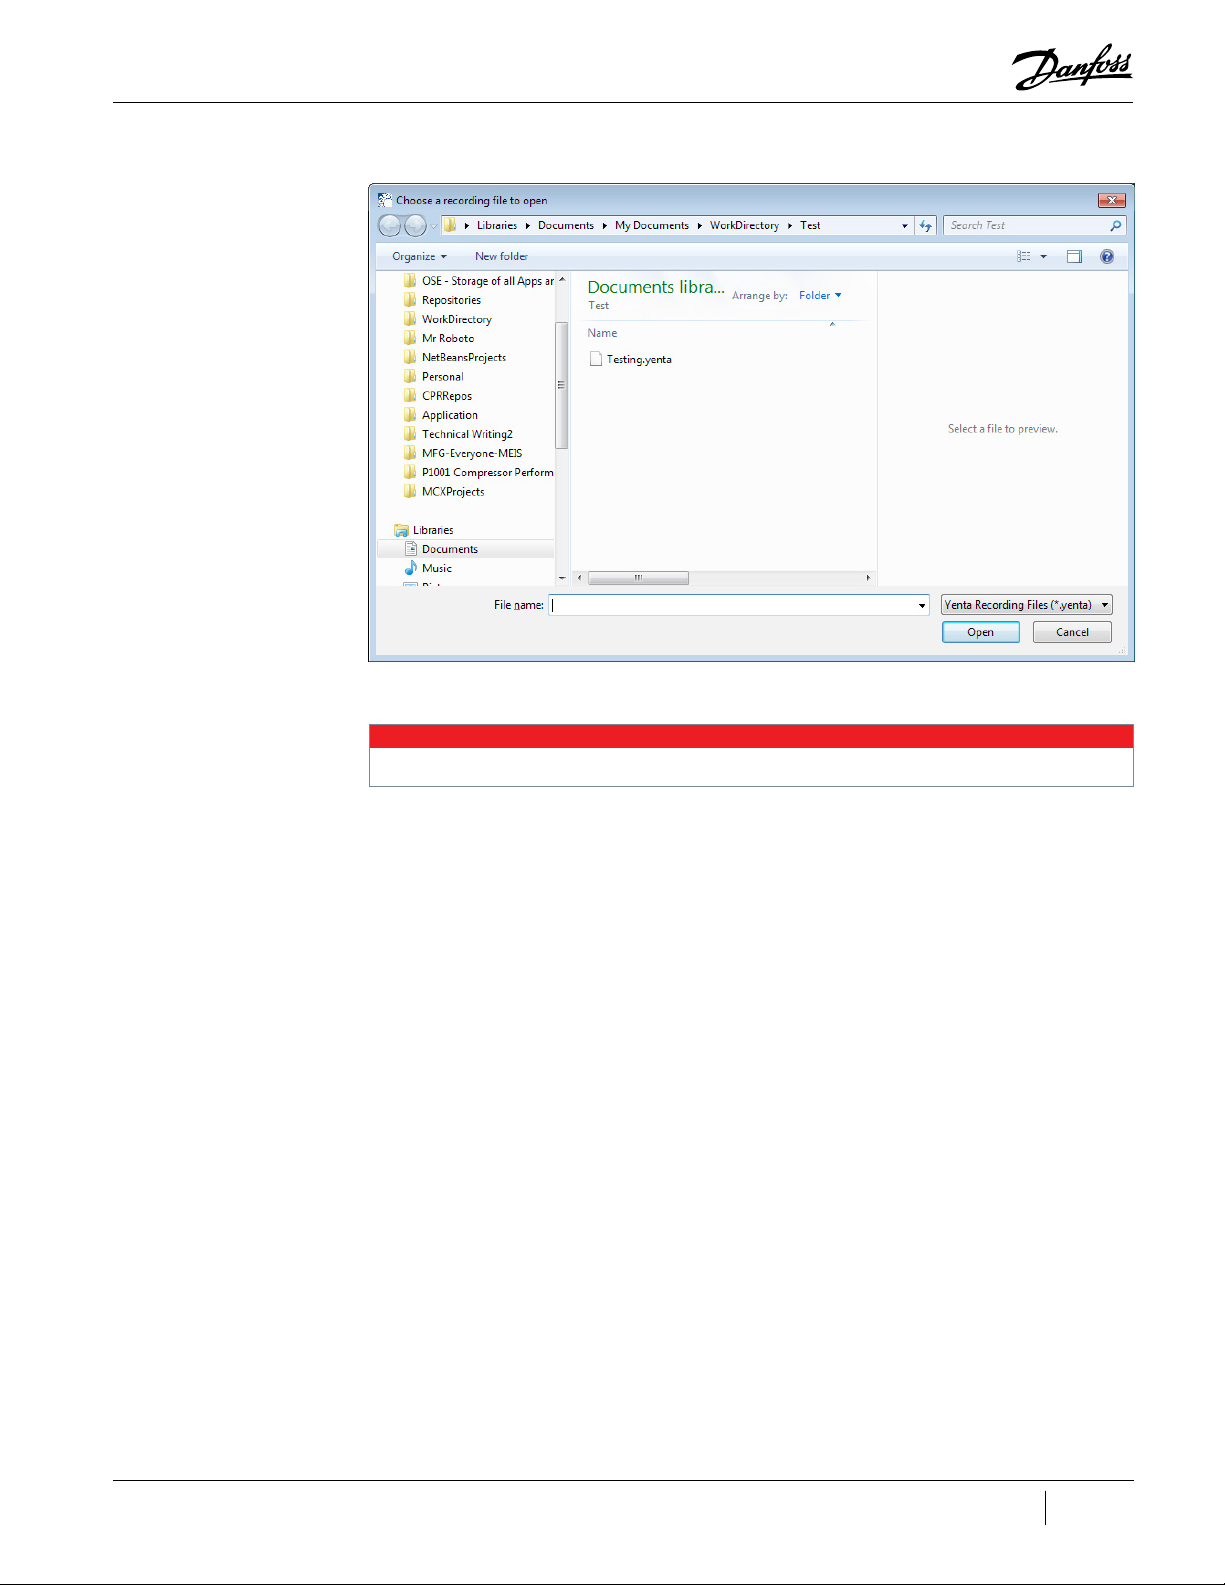
Figure 2-5 Choose a Recording File to Open Window
4. Select a recording file, and then click Open.
The playback host will automatically start when you connect to it.
NOTE
17 of 88M-SM-001-EN Rev. G
Page 18
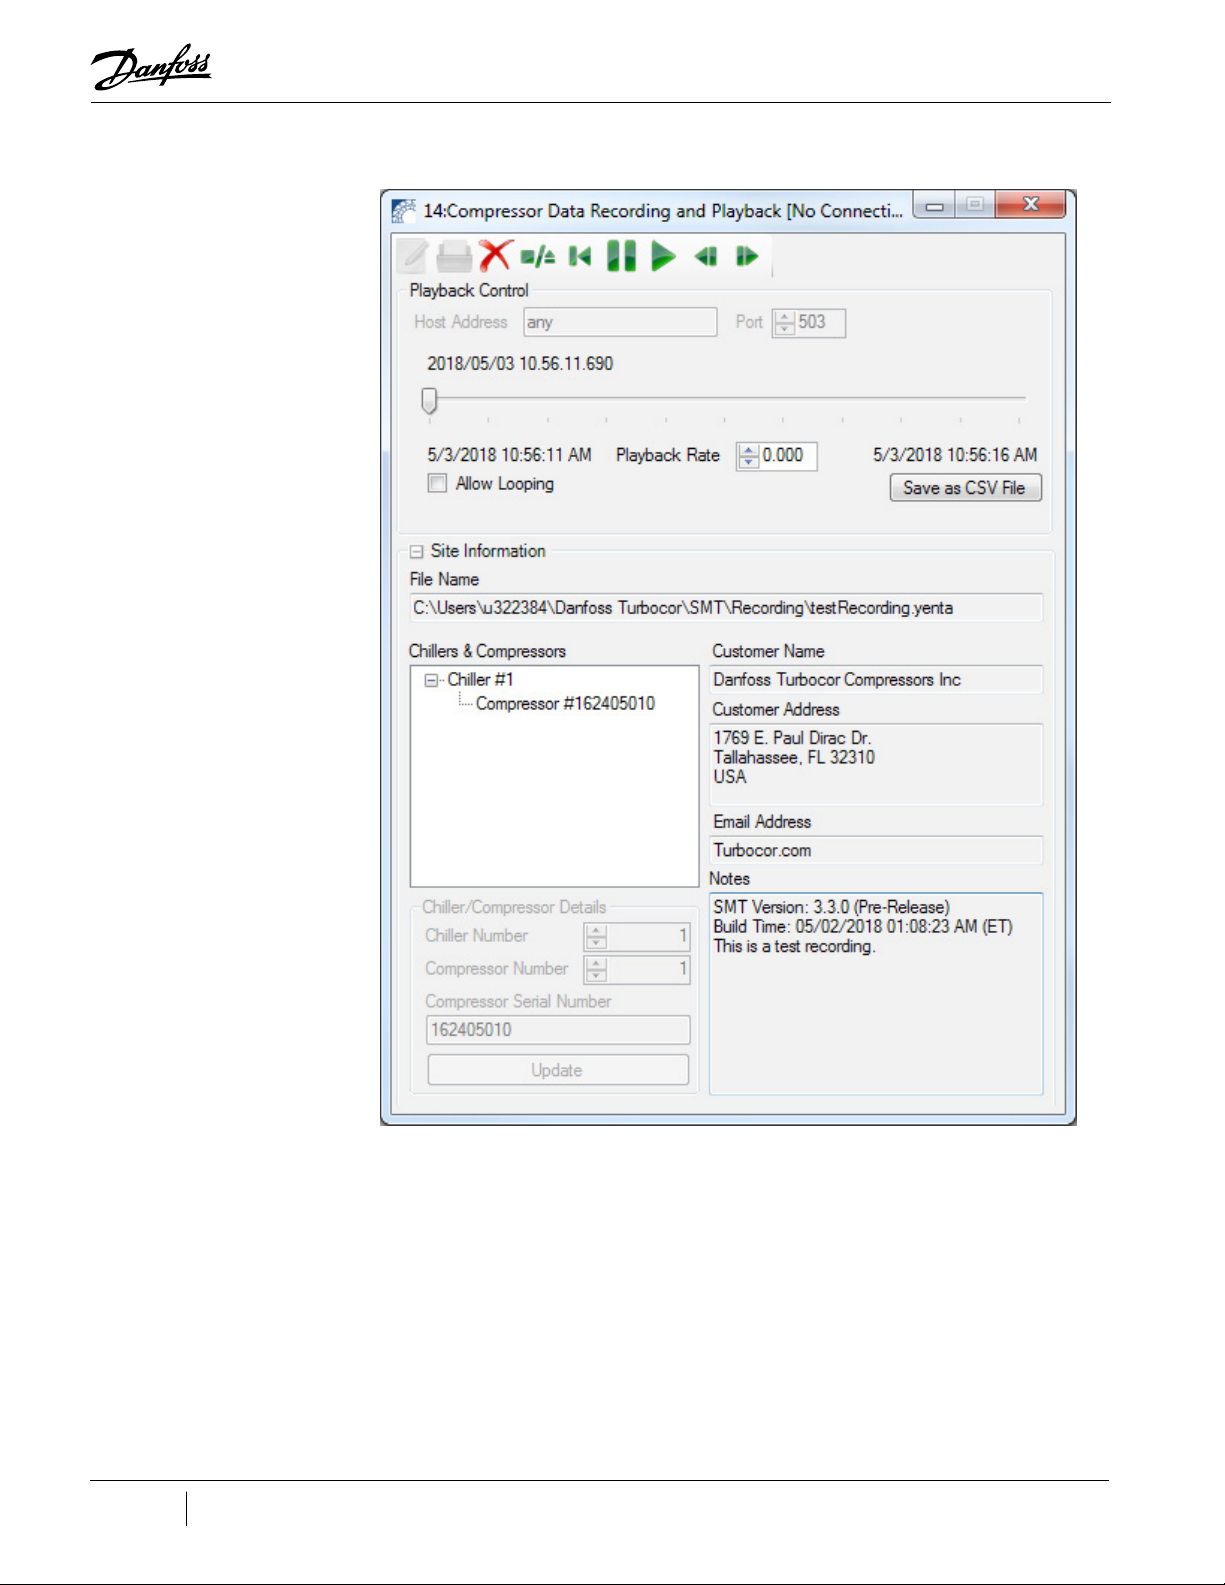
Figure 2-6 Compressor Data Recording & Playback Tool
18 of 88
5. If the playback control icons do not appear at the top of the Compressor Data Recording &
Playback Tool, a window similar to "Figure 2-7 Compressor Data Recording and Playback Tool
showing Launch Playback Server" on page 19 will display. Complete steps a and b; otherwise
jump to step 6.
M-SM-001-EN Rev. G
Page 19
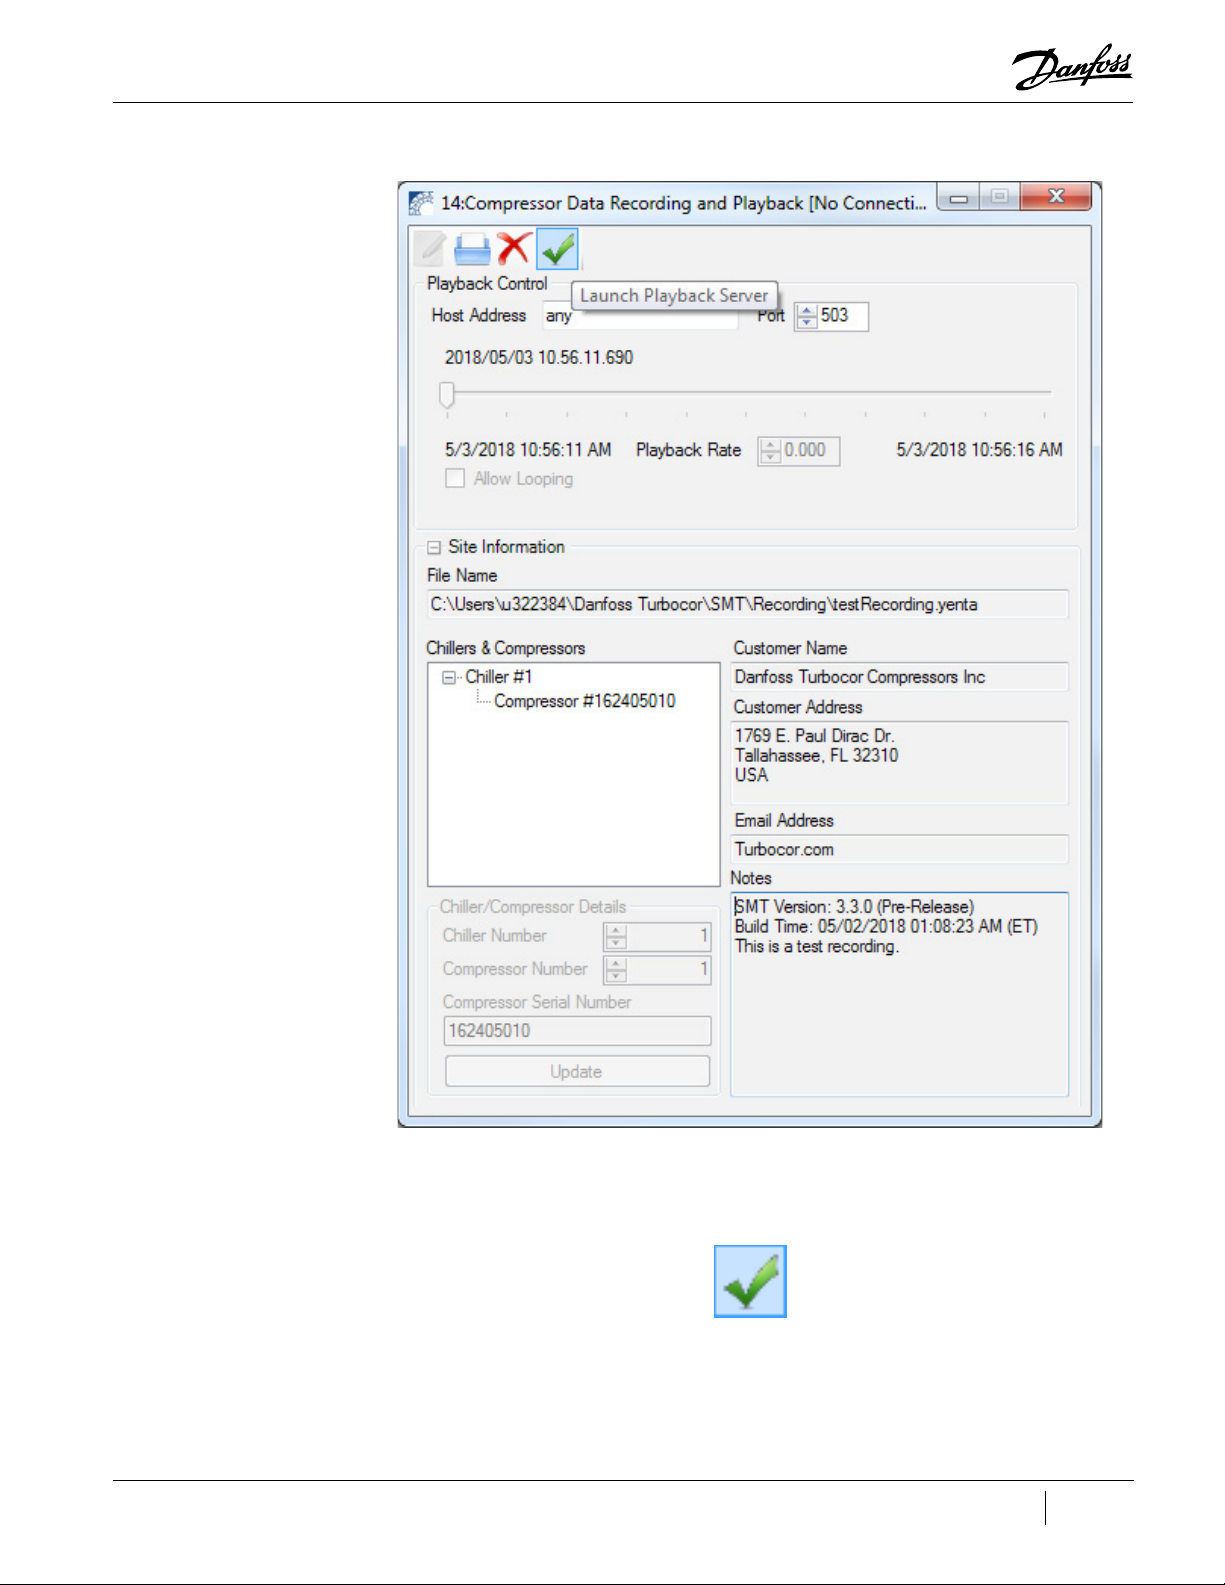
Figure 2-7 Compressor Data Recording and Playback Tool showing Launch Playback Server
Figure 2-8 Launch Playback Server Icon
6. Click the Compressor Connection Manager icon.
a. Check the settings of the Host Address and Port fields (default values are ‘any’ and ‘503’).
b. Click the Launch Playback Server icon. For more information, refer to Section "8.1
Launching the Compressor Data Recording and Playback Tool" on page 47
19 of 88M-SM-001-EN Rev. G
Page 20
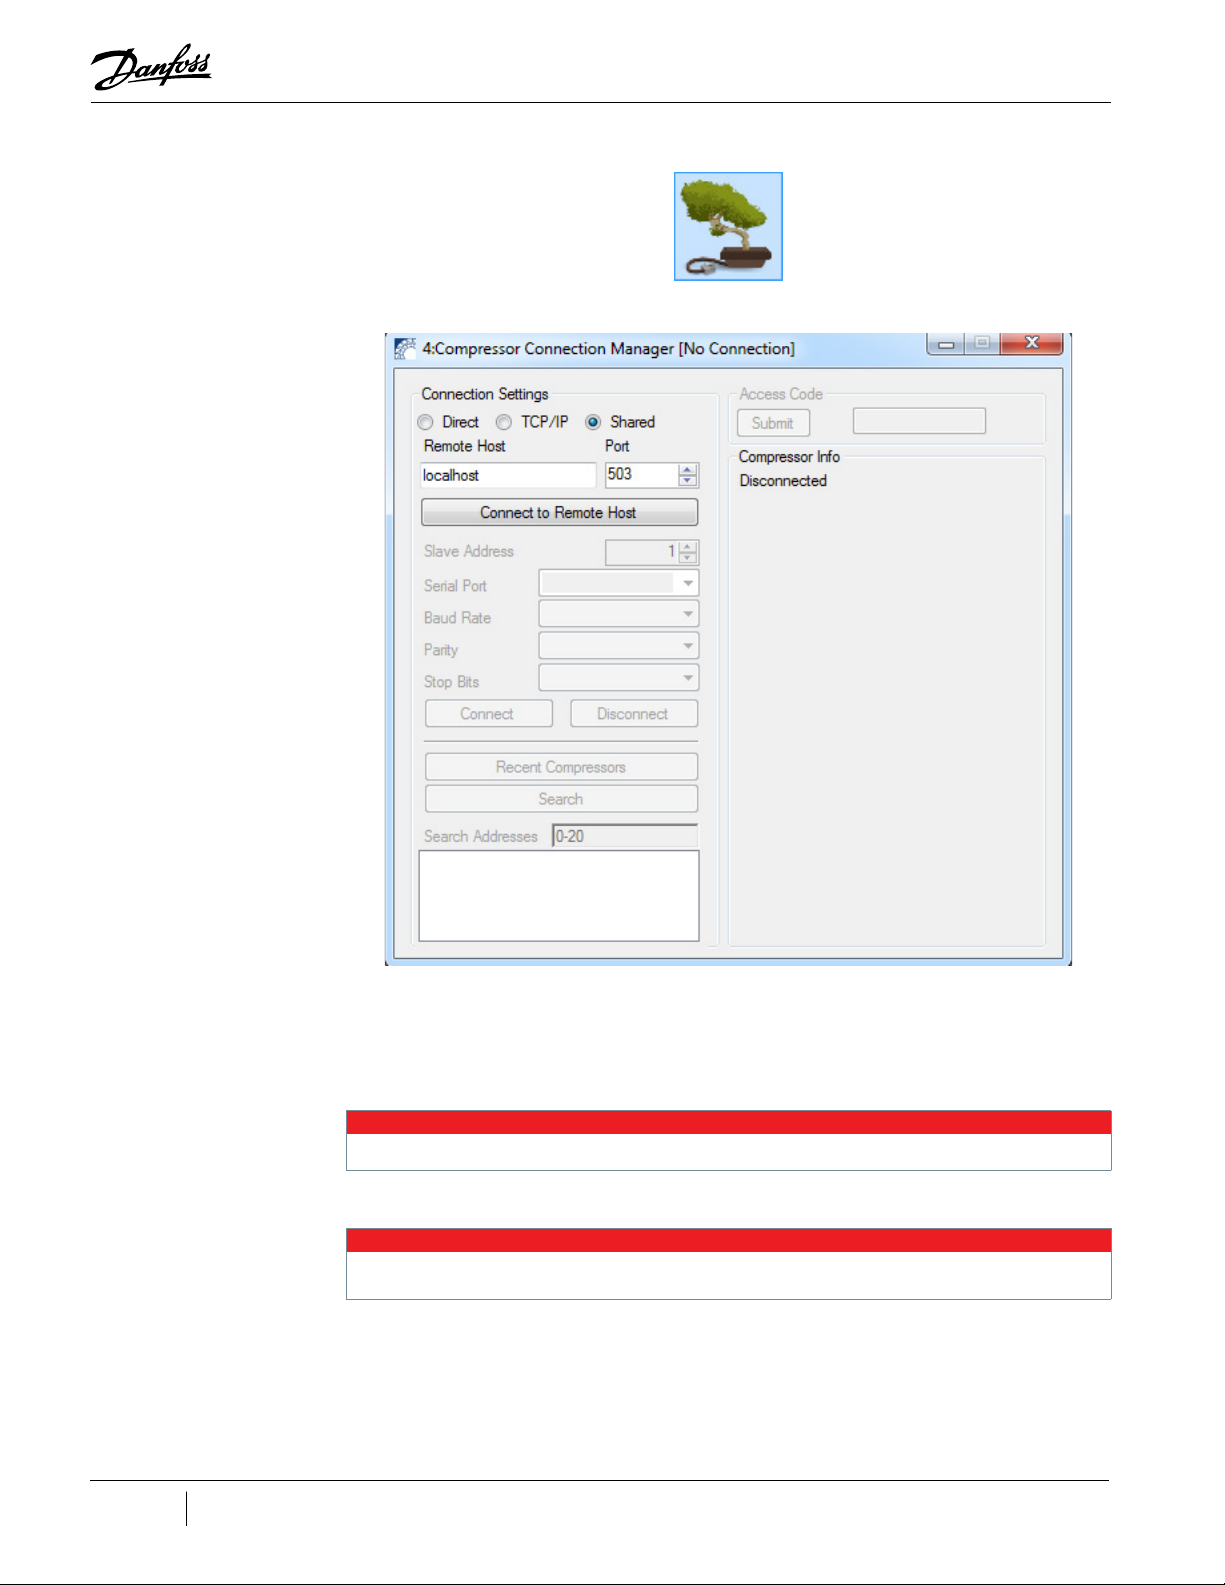
Figure 2-9 Compressor Connection Manager Icon
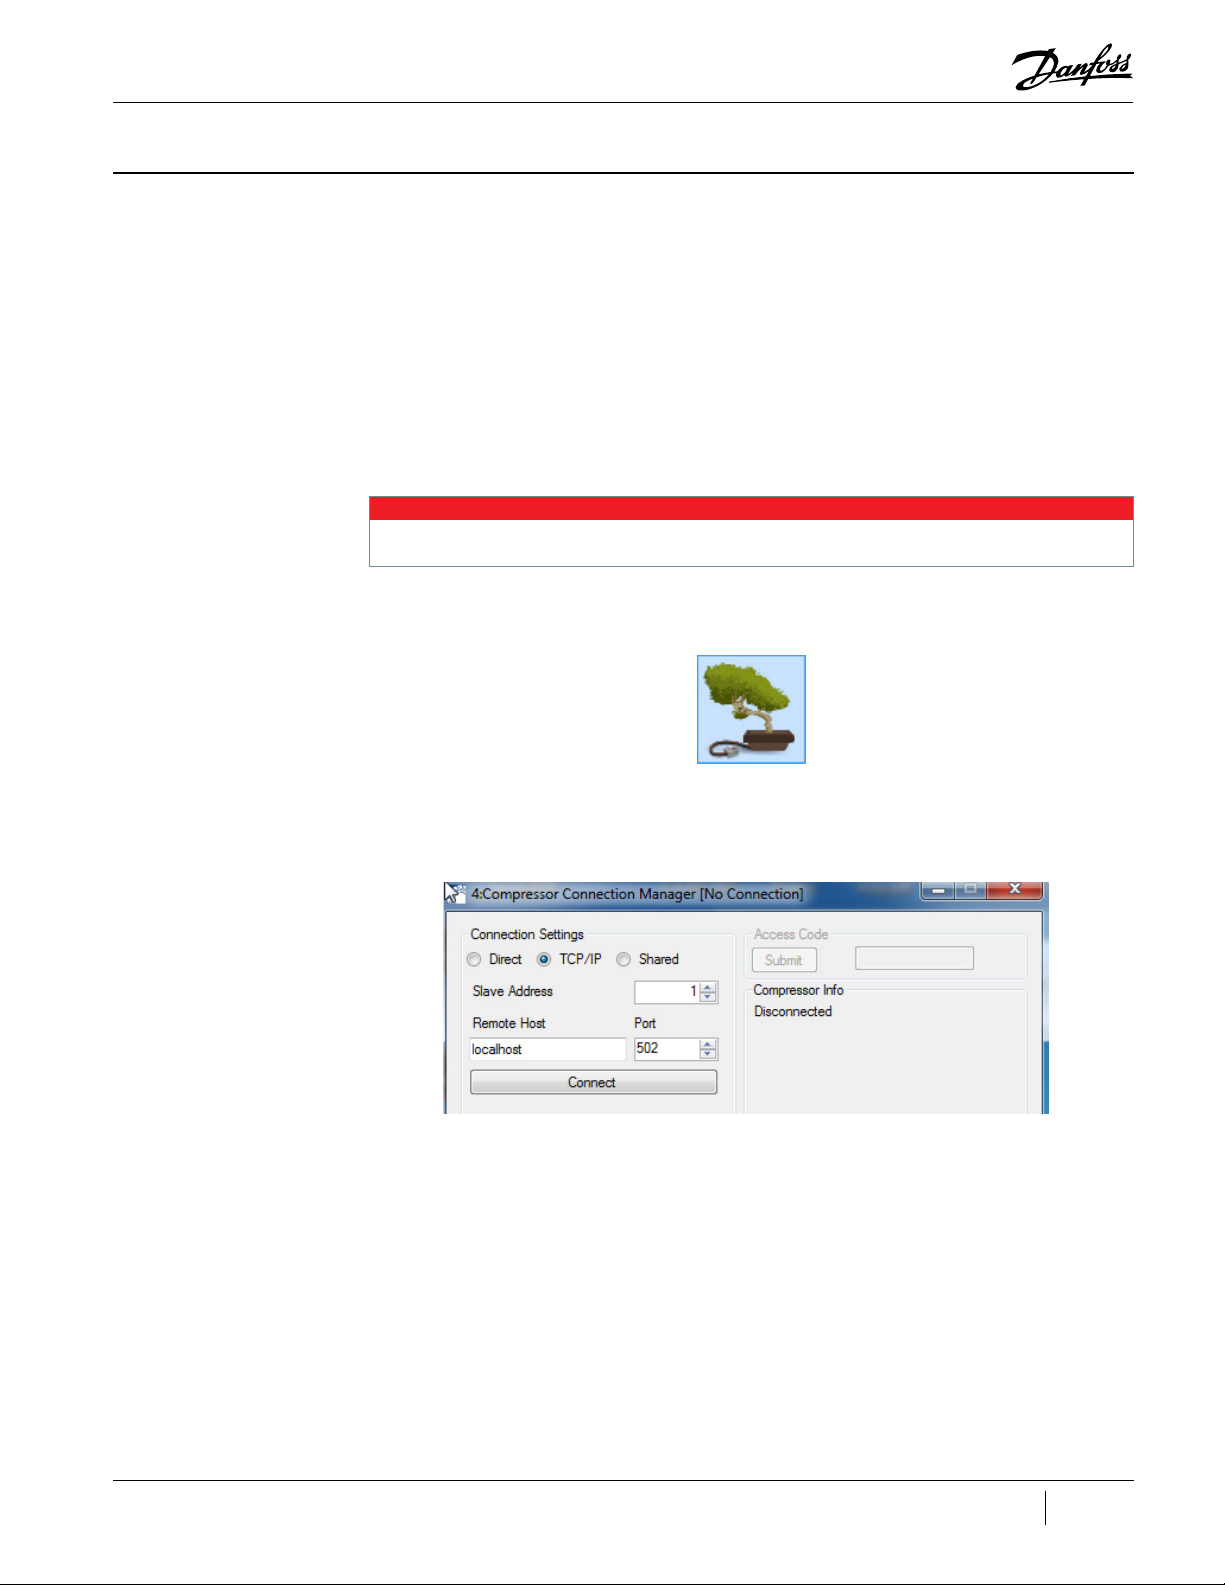
Figure 2-10 Compressor Connection Manager
7. In the Compressor Connection Manager, ensure that Shared is selected under the Connection
Settings.
8. Ensure that the field labeled Port matches the Port filed displayed on the Compressor Data
Recording & Playback Tool and that the field labeled ‘Remote Host’ says ‘localhost’.
9. In the Compressor Connection Manager, click Connect to Remote Host.
NOTE
No other information (e.g., Serial Port, Baud Rate) will need to be selected/entered prior to clicking the Connect button.
10. Click Connect. You are now connected.
NOTE
Access level is determined by the recording and cannot be changed. For example, if the recording was made at an OEM level, the
recording playback will display OEM level access.
20 of 88
M-SM-001-EN Rev. G
Page 21
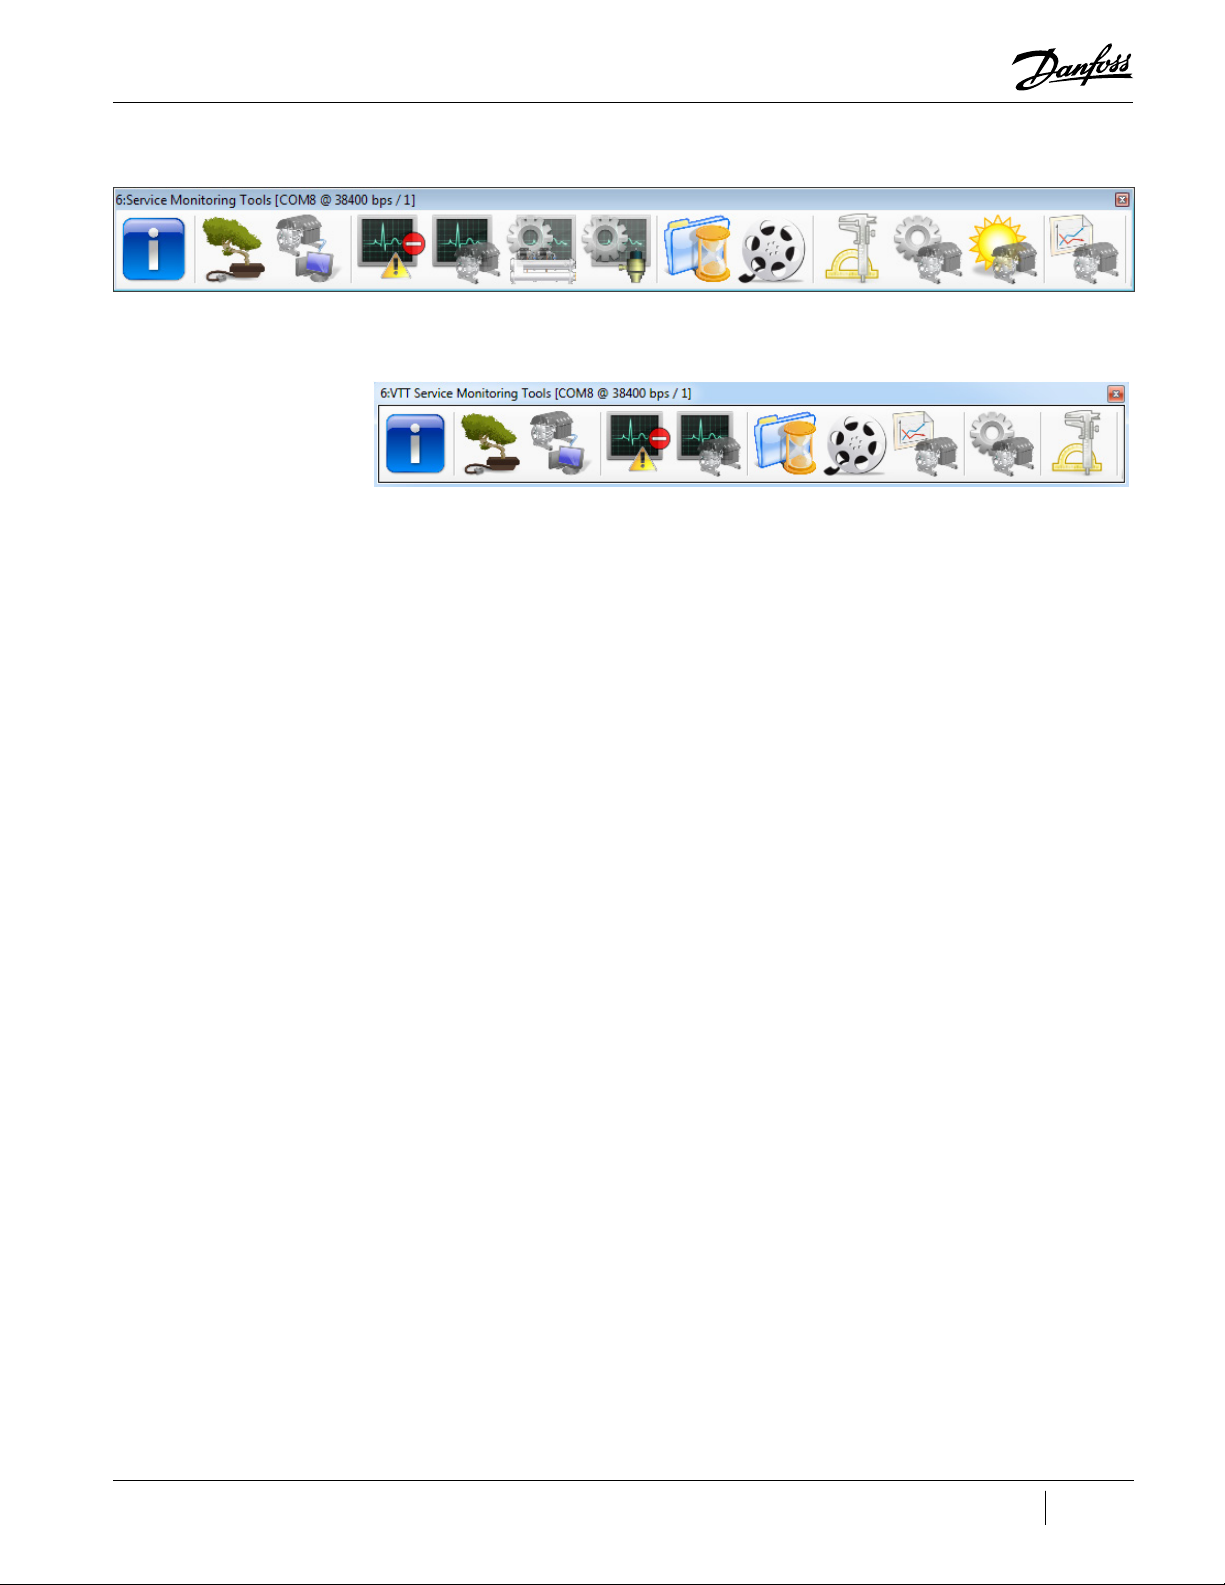
Figure 2-11 TT/TG SMT Suite Launcher Strip - Connected
Figure 2-12 VTT SMT Suite Launcher Strip - Connected
21 of 88M-SM-001-EN Rev. G
Page 22

THIS PAGE INTENTIONALLY LEFT BLANK
22 of 88
M-SM-001-EN Rev. G
Page 23
Chapter 3.0 Compressor Connection Manager
The Compressor Connection Manager is used to discover and establish a means of communication
with a compressor. This tool can be used to establish a connection with a compressor, close an
established connection, detect compressor settings, change compressor access level, synchronize
the compressor real-time clock (RTC) with a personal computer (PC) clock, and view a list of recent
compressor connection settings.
When a connection with a compressor is established, information detailing the compressor’s current
access level, Bearing and Motor Control (BMC) version, Compressor Controller (CC) version, part
number, configuration number, refrigerant type, unit system, and current real-time clock readout are
displayed as well as the current connection status.
3.1 Accessing the Compressor Connection Manager
Please see Section 1.5 “Running a Simulation” if you wish to evaluate the software without connecting to a compressor.
1. Click the Compressor Connection Manager icon.
Figure 3-1 Compressor Connection Manager Icon
NOTE
The Compressor Connection Manager window displays:
Figure 3-2 TT/TG Compressor Connection Manager
23 of 88M-SM-001-EN Rev. G
Page 24
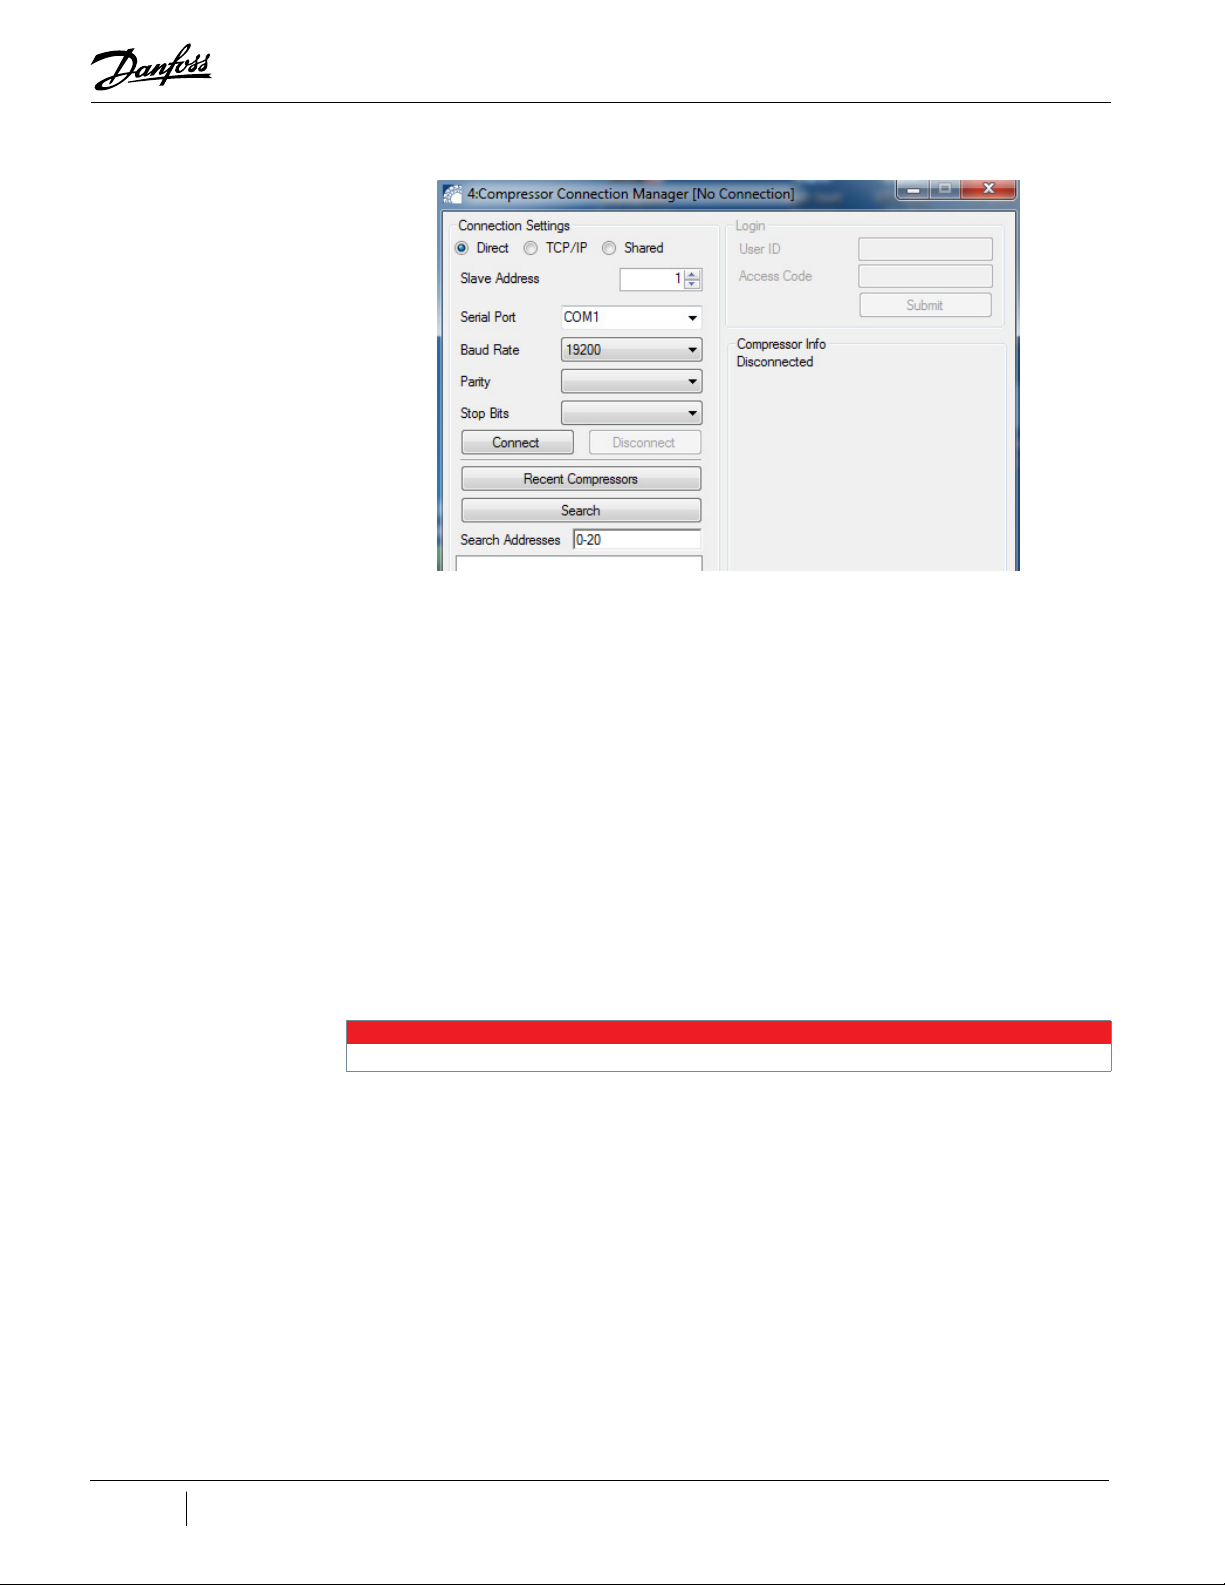
Figure 3-3 V TT Compressor Connection Manager
3.2 Compressor
To establish a connection with a compressor:
1. From the Connection Settings group, select a connection type:
• Direct for direct use of the serial port. This is the default recommended setting.
• Shared for indirect use of a serial port, allowing multiple applications access to the same
compressor via the same serial port.
• Transmission Control Protocol/Internet Protocol (TCP/IP) for communication with a Modbus TCP
compressor interface.
2. If using Shared or TCP/IP, enter your shared host name and TCP port number - usually the
default values (localhost and 502) will work.
a. For a Direct Connection, refer to Section "3.2.1 Direct Connection" on page 24.
b. For a Shared Connection, refer to Section "3.2.2 Shared Connection" on page 25.
c. For TCP/IP, refer to Section "3.2.3 TCP/IP Connection" on page 25.
3.2.1 Direct Connection
24 of 88
M-SM-001-EN Rev. G
1. From the Connection Settings group, select Direct as your connection type.
2. Select the serial port to which the compressor is connected from the Serial Port drop-down list.
NOTE
The Serial Port listing only shows serial port names which currently exist on the local/host machine.
3. Do one of the following:
a. If the slave address and baud rate are known: enter the known slave address in the Slave
Address field and select the known baud rate from the Baud Rate drop-down and click
Connect - a connection should now be established.
b. If the slave address or baud rate are unknown, enter a slave address search range or list
of values to test for detection in the Search Addresses field and click Search (default is
0-20).
After a short period of time (the fewer addresses to check, the quicker the search will be), the search
results containing a list of communication setting combinations display in the Search Addresses field.
Double-click any of the communication setting combinations to automatically connect using those
settings. A connection should now be established.
If no compressors are detected, No compressors found! will display in the listing.
4. Type in your Access Code and click Submit.
Page 25

3.2.2 Shared Connection
3.2.3 TCP/IP Connection
To enter a Shared connection:
1. From the to Connection Settings group, select Shared as your connection type.
2. Enter your shared host name and TCP port number - usually the default values will work.
3. Click the Connect to Remote Host button.
4. Select the serial port to which the compressor is connected from the Serial Port drop-down
box.’
5. Do one of the following:
a. If the slave address and baud rate are known: enter the known slave address in the Slave
Address field and select the known baud rate from the Baud Rate drop-down and click
Connect - a connection should now be established.
b. If the slave address or baud rate are unknown, enter a slave address search range or list
of values to test for detection in the Search Addresses field and click Search (default is
0-20).
After a short period of time (the less addresses to check, the quicker the search will be), the search
results containing a list of communication setting combinations display in the Search Results listing.
Double-click any of the communication setting combinations to automatically connect using those
settings. A connection should now be established If no compressors are detected, No compressors
found! will display in the listing.
6. Type in your Access Code and click Submit.
1. From the Connection Settings group, select TCP/IP as your connection type:
2. Enter the slave address in the Slave Address field.
3. Click Connect.
A connection should now be established.
4. Type in your Access Code and click Submit.
3.3 Closing an Established Connection
To close an established connection:
1. Click the Disconnect button.
2. To also disconnect from a remote host (such as the Compressor Data Recording & Playback
tool’s playback host), click the Disconnect from Remote Host button. The tool will close any
connections established and data polling will stop.
3.4 Detecting Compressor Settings
To detect compressor settings:
• Enter a slave address search range or list of values to test for detection in the Search Results
listing and click the Search.
After a short period of time (the less addresses to check, the quicker the search will be), the search
results display in the Search Addresses field. If no compressors are detected, No compressors found! will
display in the listing; otherwise, communication setting combinations will display.
25 of 88M-SM-001-EN Rev. G
Page 26

3.5 Changing Compressor Access Levels
On connection, the SMT requires a valid access code in order to allow access to the various tools available at the given
access level.
A user must not change the access level of the BMCC to a value lower than 2 if the compressor is being controlled by Modbus.
If the access level is lower than access level 2, the compressor can not accept a demand write.
For rmware versions of 3.X.X or lower, for example, if the lowest level that a compressor can accept a demand write is at
Access Level 2 (Low Level), then on submission of a “0” in the Access Code eld, the SMT will revert to a read-only state and the
compressor will not accept writes to demand from the Modbus controller. In this case, the compressor access level should be left
at Access Level 2 (Low Level) or higher.
To change the compressor access level:
TT/TG SMT
1. Enter the desired Access Code, then click Submit.
VTT/TG SMT
1. Enter the desired User ID and Access Code, then click Submit.
The tool will send the access code to the compressor and indicate the access level on the connected
compressor.
If the access code is incorrect: the compressor will revert the access to the lowest level. After five failed
access code change attempts, the compressor will no longer accept access codes and will require a
power cycle before allowing an access level change.
NOTE
Since the access level on the compressor will remain after disconnecting from the compressor, be sure to either downgrade the
access level or power cycle the compressor after completing service.
3.6 Synchronizing the Compressor Real-Time Clock with a PC Clock
To synchronize a compressor real-time clock (RTC) with a PC clock:
• Click the Sync Compressor/Computer Time button.
The tool will attempt to update the compressor’s RTC to match the local computer’s date and time to
within ±500 ms.
3.7 Viewing a List of Recent Compressor Connection Settings
To view a list of recent compressor connection settings:
• Click the Recent Compressors button.
A list of recent compressor communication settings will display. If there is no connection history,
No compressors found! displays in the listing; otherwise, communication setting combinations are
displayed. Double-clicking any of the settings combination entries will automatically attempt to
connect using the those settings.
3.8 Selecting the Unit System
To select the appropriate unit system for the compressor:
• Click the Units Drop-Down Box and select the desired unit system.
NOTE
26 of 88
M-SM-001-EN Rev. G
Page 27
3.9 Connection Status Indications
The Connection Status is indicated in the Compressor Info section of the Compressor Connection
Manager Window.
• Disconnected: no connection exists with a compressor or remote compressor host.
• Ready to Connect: a connection with a remote host (if applicable) has been established, but no
compressor connection has yet been established.
• Compressor is starting up: The currently connected compressor is in startup mode.
• Connected: There has been established a connection with a remote host (if applicable) and a
connection with a compressor has been established and verified.
• No compressor found: Any serial ports or connections have been established, but a valid
compressor was not able to be detected.
• Error opening port: There was an error opening the specified serial port (either the port is
already in use, the port name doesn’t exist, or there was some other error attempting to open
the serial port).
• Server not found: Could not connect to remote host.
• There was a time out during communication’ (Error Time out): There was a timeout during
communication.
• Invalid response: The response received was invalid.
• Received an error response: The host responded with an error.
• Error: CRC mismatch: The received message has a CRC mismatch.
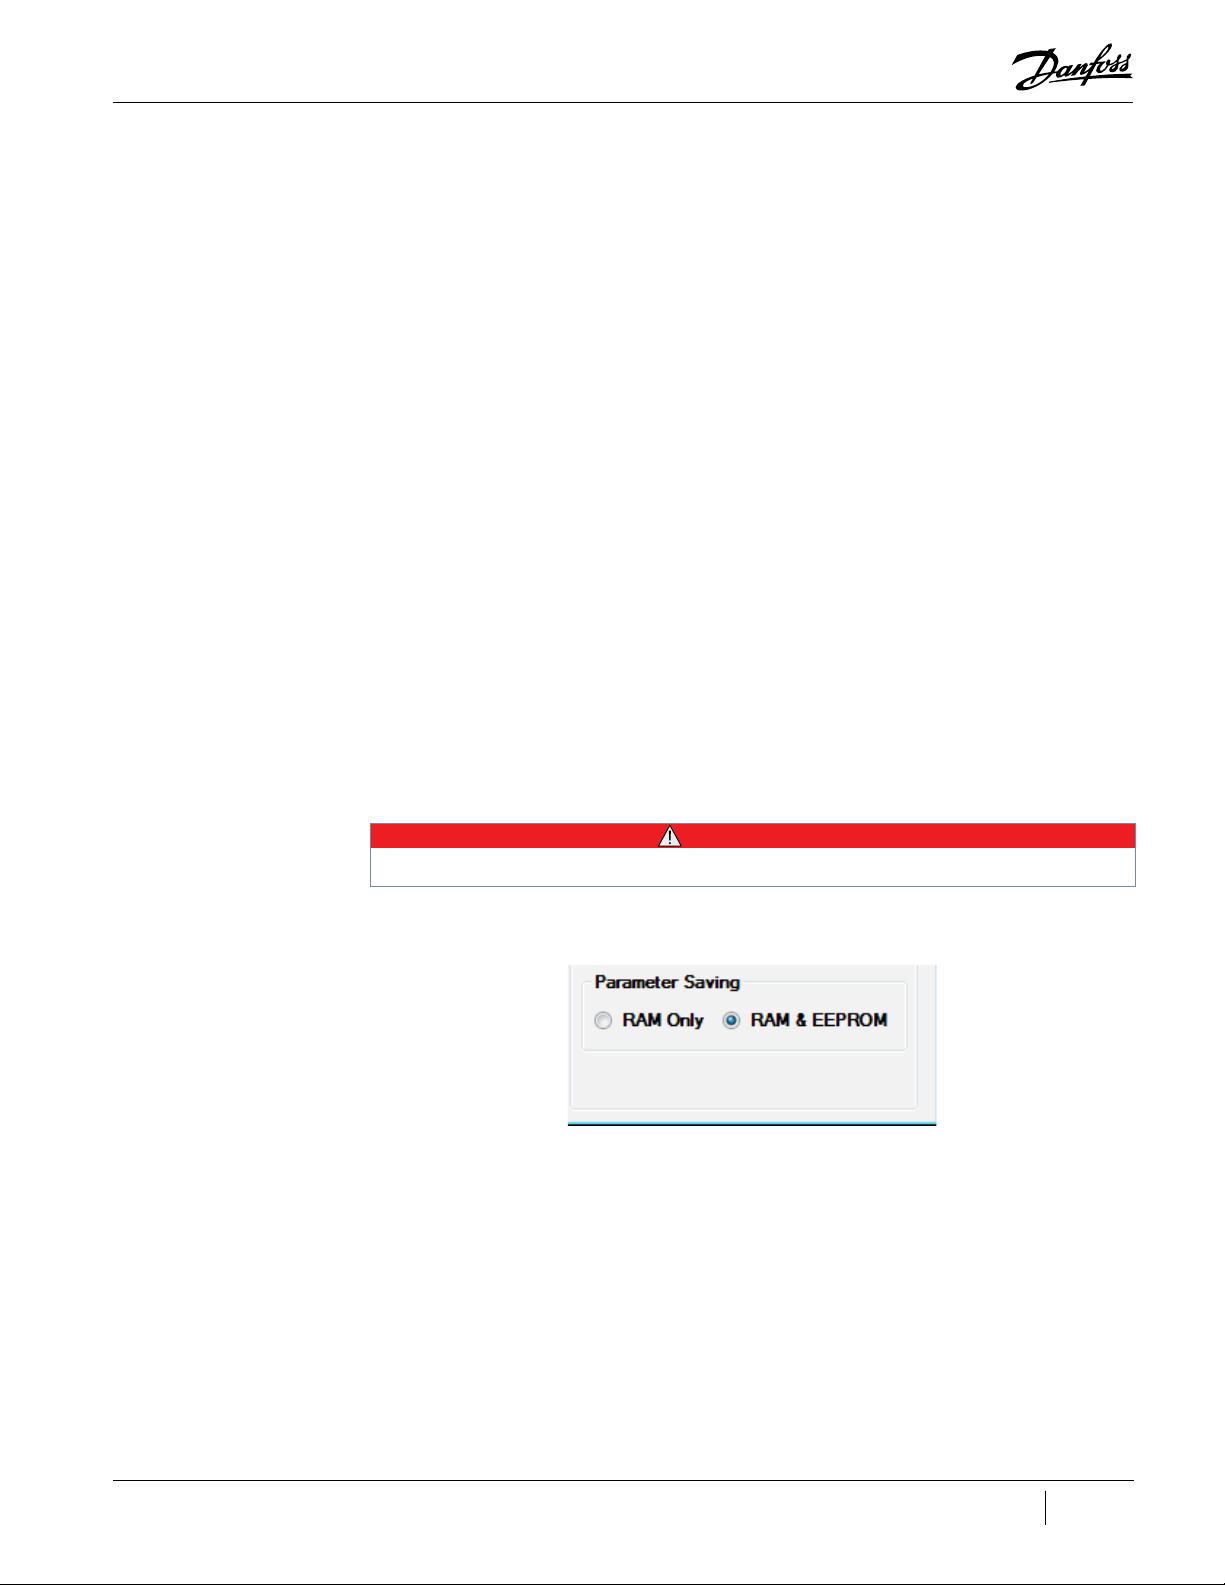
3.10 RAM Only and RAM & EEPROM Check boxes (TT/TG Only)
By default, changes made in the SMT are set to RAM & EEPROM.
If the RAM & EEPROM check box is clicked, all parameter changes are saved to persistent memory, if
said register is capable of doing so.
Saving to RAM & EEPROM will commit all the current values to permanent memory and all previous values will be lost.
Figure 3-4 Parameter Saving Frame
The Parameter Saving frame is located in the lower right corner of the Compressor Connection Tool.
See "Figure 3-4 Parameter Saving Frame".
• • • CAUTION • • •
27 of 88M-SM-001-EN Rev. G
Page 28

THIS PAGE INTENTIONALLY LEFT BLANK
28 of 88
M-SM-001-EN Rev. G
Page 29

Chapter 4.0 ModComm Tool
The ModComm Tool assists users in troubleshooting a Bearing, Motor and Compressor Controller
(BMCC) or monitoring extra registers by providing access to Modbus registers on a raw level. This tool
can be used to change the current register watch range, toggle between watching the specified watch
range and all currently polled register watches, make a single write request, and change the current
data interpretation view.
4.1 Accessing the ModComm Tool
• Once connected, select the ModComm tool icon from the SMT Suite Launcher Strip.
Figure 4-1 ModComm Tool Icon
The ModComm window displays.
Figure 4-2 VTT ModComm Window (VTT Displayed)
4.2 Changing the Current Register Watch Range
To change the current register watch range:
1. Double-click the Display register number in the header and change the register number to
update the range.
2. If desired, the Count can be changed to display a desired number of registers.
29 of 88M-SM-001-EN Rev. G
Page 30

Figure 4-3 ModComm Window Displaying Menu
4.3 Making a Single Write Request
To make a single write request:
1. Click on Modbus Function and select Single Register Write from the context menu.
Figure 4-4 ModComm Tool Window Showing Menu
Figure 4-5 Write Single Register
30 of 88
M-SM-001-EN Rev. G
2. Enter a valid register address (if necessary) and the appropriate value.
3. Click Send to perform the write. A window displays indicating the result of the operation.
Page 31

Figure 4-6 Write Single Register Result Window
4. Look for the Write ok! message.
4.4 Making a Multiple Writes Request
1. Click on Modbus Function and select Multi-Register Write from the context menu.
Figure 4-7 ModComm Tool Window Showing Menu
2. Enter the base register number and select the Number of Registers to be updated.
3. Update the desired registers then click Write Values.
4. Look for the Write ok! message.
31 of 88M-SM-001-EN Rev. G
Page 32

Figure 4-8 Write Multiple Registers Result Window
4.5 Changing the Current Data Interpretation View
To change the current data interpretation view:
1. Right-click anywhere on the main form and the context menu will display.
Figure 4-9 TT/TG ModComm Tool Window Showing Menu
32 of 88
M-SM-001-EN Rev. G
Page 33

Figure 4-10 VTT ModComm Tool Window Showing Menu
2. Highlight Display Format.
Figure 4-11 VTT ModComm Tool Window Showing Display Format Options
3. Select the desired value display format. The values displayed in the main form will be
formatted as specified.
Figure 4-12 ModComm Tool Window Showing Chosen New Display Format (VTT Displayed)
33 of 88M-SM-001-EN Rev. G
Page 34

THIS PAGE INTENTIONALLY LEFT BLANK
34 of 88
M-SM-001-EN Rev. G
Page 35

Chapter 5.0 Active Alarm/Fault Viewer
The Active Alarm/Fault Viewer allows you to instantaneously monitor the alarm and fault status of a
connected compressor device and configure the alarm and fault limits. This tool can be used to view
compressor alarms and faults, view motor alarms and faults, view bearing alarms and faults, and view/
configure alarm and fault limits and lockout settings.
This tool may not function properly if the connected compressor’s access level is below Low.
For alarm/fault indicators, alarm and fault status are indicated by the colored LED graphic to the left of the alarm/fault name
(alarms are yellow, faults are red, and alarm + fault are orange)
5.1 Accessing the Active Alarm/Fault Viewer Tool
• Once connected, select the Active Alarm/Fault Viewer tool icon from the SMT Suite
Launcher Strip.
Figure 5-1 Active Alarm/Fault Viewer Tool Icon
The Active Alarm/Fault Viewer window displays.
Figure 5-2 TT/TG Active Alarm/Fault Viewer Window
NOTE
NOTE
35 of 88M-SM-001-EN Rev. G
Page 36

Figure 5-3 VTT Active Alarm/Fault Viewer Window
5.1.1 Clearing Faults
To attempt to clear or reset the fault status, click the Clear Faults button in the Compressor Monitor
Window refer to Section "Chapter 4.0 ModComm Tool" on page 29.
Figure 5-4 Clearing Faults (TT/TG)
NOTE
If the cause of the fault has not be resolved, then clicking the Clear Faults button will not clear or reset the faults, since the cause
of the fault still remains.
36 of 88
M-SM-001-EN Rev. G
Page 37

5.2 Viewing and Configuring Alarm/Fault Limits and Lockout Settings
To view/configure alarm and fault limits and lockout settings:
• Click the Configure Alarms/Faults menu option.
If the cause of the fault has not be resolved, then clicking the Clear Faults button will not clear or reset the faults, since the cause
of the fault still remains. The method to access the Congure Alarms/Faults window diers between the two dierent SMTs. Refer
to "Figure 5-5 TT/TG Compressor Status Tab" and "Figure 5-6 VTT Compressor Status Tab" illustrate the dierences.
Figure 5-5 TT/TG Compressor Status Tab
NOTE
Figure 5-6 VTT Compressor Status Tab
37 of 88M-SM-001-EN Rev. G
Page 38

Figure 5-7 Alarm and Fault Configuration (1) (TT/TG Shown)
Figure 5-8 Alarm and Fault Configuration (2) Page 2 (TT/TG Only)
38 of 88
M-SM-001-EN Rev. G
Page 39

Chapter 6.0 Compressor Monitor
The Compressor Monitor tool allows you to monitor the most commonly desired parameters of the
BMCC related to motor, bearing, and compressor operation. This tool can be used to view compressor,
bearing, and motor operational readouts, change the demand, change the IGV opening, change the
desired motor speed, and levitate/de-levitate the shaft.
6.1 Accessing the Compressor Monitor
• Once connected, select the Compressor Monitor Tool icon from the SMT Suite Launcher Strip.
Figure 6-1 Compressor Monitor Tool Icon
The Compressor Monitor window displays.
Figure 6-2 Compressor Monitor Tool Window (TT/TG Shown)
6.2 View Options
The following view options are available on the Compressor Monitor Tool window:
• To view bearing-related readouts, expand the Bearing section.
• For compressor-related readouts, expand the Compressor section.
NOTE
The Pressure Ratio value displayed CAN NOT be guaranteed to accurately reect the pressure ratio as calculated by the BMCC for
BMCC software versions earlier than 1210 - in such a case, it is at best an approximation of what the compressor is assumed to
be calculating.
• For motor-related readouts, expand the Motor section.
39 of 88M-SM-001-EN Rev. G
Page 40

6.3 Changing the Demand
To change the demand:
1. Expand the Compressor section.
2. In the Demand field, either use the up/down arrows or manually enter a value and press
Enter to submit a new value.
6.4 Changing the IGV Opening (TT/TG Only)
To change the IGV opening:
1. Make sure you are in Manual mode. (To change the Compressor Control Mode, refer to Section
"12.2.1 Modifying Control Mode" on page 69.
2. Expand the Compressor section.
3. In the IGV Open Percentage field, either use the up/down arrows or manually enter a value
and press Enter to submit a new value.
Only values between 25%-110% are valid.
6.5 Changing the Desired Motor Speed
To change the desired motor speed:
1. Make sure you are in Manual mode. (To change the Compressor Control Mode, refer to Section
"12.2.1 Modifying Control Mode" on page 69.
2. Expand the Motor section.
3. In the Desired Speed field, either use the up/down arrows (TT/TG Only) or manually enter a
value and press Enter to submit a new value.
6.6 Levitating or De-levitating the Shaft
NOTE
To levitate or de-levitate the shaft:
1. Make sure you are in Levitate Only mode. (To change the Compressor Control Mode, refer to
Section "12.2.1 Modifying Control Mode" on page 69.
2. Click the Shaft Levitation Status graphic located just above the Bearing graph.
Figure 6-3 Shaft Levitation Status Graphic
The graphic will appear as a floating yellow ball when the shaft is levitating and a blue ball on the
ground if the shaft is de-levitated.
40 of 88
M-SM-001-EN Rev. G
Page 41

Chapter 7.0 Logged Event and Fault Viewer
The Logged Event and Fault Viewer allows you to retrieve logged fault and event data regarding the
operation of a connected compressor for the purpose of troubleshooting and diagnostics.
This tool can be used to retrieve logged event/fault data, watch for new logged event/fault data, view
details pertaining to logged events/faults, export logged event/fault data to file, import logged event/
fault data from file, and view application help information.
This tool may not function properly if the connected compressor’s access level is below Low.
7.1 Accessing the Logged Event and Fault Viewer
Launch this tool after connecting to a compressor.
Any instance of this tool launched before connecting to a compressor will remain “oine”.
Launch another instance of this tool after connecting if you later want to view logs of a connected device.
7.1.1 TT/TG Logged Event and Fault Viewer
1. Click the Logged Event and Fault Viewer icon.
Figure 7-1 Logged Event and Fault Viewer Icon
NOTE
NOTE
The Logged Event and Fault Viewer window displays:
Figure 7-2 Logged Event and Fault Viewer Window (TT/TG)
41 of 88M-SM-001-EN Rev. G
Page 42

7.1.1.1 Applying Filters for Data Retrieval and Watching
To apply filters for data retrieval and watching:
• To retrieve logged event data from the connected compressor, check the Retrieve check box to
the side of the Events count indicator.
• To retrieve logged fault data from the connected compressor, check the Retrieve check box to
the side of the Faults count indicator.
• To apply a cut-off date/time for items retrieved, select the Don’t retrieve older than check box,
and then choose a date from the calendar drop-down. Items older than the selected date will
not be retrieved.
7.1.1.2 Retrieving Logged Event and Fault Data
Closing the Logged Event & Fault Viewer will terminate the retrieve functions.
To retrieve logged event and fault data:
1. Click the Data->Start Retrieving menu item.
The tool will automatically start retrieving events and faults as specified until either there are no more
entries to retrieve or there are no more entries within the specified date/time range filter. Entries will
appear in the event/fault listing panel.
2. To stop retrieving logged event and fault data before retrieval is completed, click Data->Stop
Retrieving Data.
NOTE
7.1.1.3 Watching for New Logged Event and Fault Data
Closing the Logged Event & Fault Viewer will terminate the retrieve functions.
To watch for new logged event/fault data:
1. Click Data->Watch for New… menu item.
The tool will continuously check for changes in the event and fault logs as specified. Entries will display
in the Event/Fault Listing pane.
2. To stop watching for new logged event and fault data, click the Data->Stop Watching menu
item.
7.1.1.4 Viewing Logged Events and Faults Details
To view details pertaining to logged events and faults:
• Click on any entry in the Event/Fault Listing panel.
The tool will display details and analysis information describing the selected event
or fault.
NOTE
42 of 88
M-SM-001-EN Rev. G
Page 43

Figure 7-3 Logged Events Fault Viewer
7.1.1.5 Exporting Logged Event and Fault Data to a File
To export logged event/fault data to file:
1. Do one of the following:
a. To export only selected entries, select the desired entries in the event/fault listing panel,
and then select File->Export Selected...
b. To export all entries, select File->Export all.
2. In the Save as window, select an output file name. The logged faults and events will be saved
as .CSV and .TLF files.
7.1.1.6 Importing Logged Event and Fault Data
You do not have to be connected to a compressor to import a saved TLF le for viewing.
To import logged event/fault data from a file:
• Click File>Import Data.
• In the Open file window, select a previously exported TLF logged event/fault data file.
If the file is valid, event and fault entries will display in the Event/Fault Listing panel.
7.1.1.7 Viewing Application Help Information
To view application help information:
• Click the Help menu option, and then select any help area item from the list which appears.
The tool will display relevant help information in the details view.
NOTE
43 of 88M-SM-001-EN Rev. G
Page 44

7.1.2 VTT Logged Event and Fault Viewer
Figure 7-4 Logged Event and Fault Viewer Window (VTT)
7.1.2.1 Event Log Tab
Event Log Tab
1. Click Refresh Status.
2. Choose a Date Range in the Event Retrieval Filter section.
3. Change Retrieval Count to “0” to get all events in the date range.
4. Click the Retrieve Event Logs button.
5. Once the event log is done with the retrieval process, click Save Results to File.
System Snapshot Log Tab
This first step will create the Collection Log.
1. Click Refresh Status.
2. Choose a Date Range in the Snapshot Retrieval Filter section.
3. Change Retrieval Count to “0” to get all events in the date range.
4. Click Retrieve Collection List.
5. Once the Collection List is done with the retrieval process, click Save Results to File.
This second step will create the Snapshot.
1. Click Refresh Status.
2. Choose a Date Range in the Snapshot Retrieval Filter section.
3. Change Retrieval Count to “0” to get all events in the date range.
4. Click Retrieve Collection List.
5. Click on a specific fault you want to view in the list displayed.
6. Click download snapshot from selection.
7. Once the Snapshot is downloaded from the compressor, click Save Results to File.
44 of 88
M-SM-001-EN Rev. G
Page 45

7.1.2.2 System Snapshot Log Tab
Figure 7-5 VTT System Snapshot Log Window
45 of 88M-SM-001-EN Rev. G
Page 46

THIS PAGE INTENTIONALLY LEFT BLANK
46 of 88
M-SM-001-EN Rev. G
Page 47

Chapter 8.0 Compressor Data Recording and Playback Tool
The Compressor Data Recording & Playback tool is used to start and stop recordings of variables in
the BMCC, as well as to launch a server partially simulating an actual compressor using previously
recorded data. The intended usage of this tool is for training, evaluation, and compressor
troubleshooting purposes. This tool can be used to either record data communicated between
the desktop SMT system and a compressor or to host (‘playback’) recorded data for use with the
SMT system.
When recording, the tool can be used to create a new recording, start recording, end recording, cancel
recording, and pause/resume recording. A recording can be created and started either before or after
establishing a connection with a compressor.
When playing back, the tool can be used to open a recording, close a recording, manually launch a
playback server, stop a playback server, manipulate the playback rate, seek playback time, and specify
the minimum access level.
8.1 Launching the Compressor Data Recording and Playback Tool
To launch the Compressor Data Recording and Playback Tool:
• Click the Compressor Data Recording and Playback Tool icon.
Figure 8-1 Compressor Data Recording and Playback Tool Icon
8.2 Recording
8.2.1 Creating a Recording
To create a new recording:
1. Click the New Recording icon.
47 of 88M-SM-001-EN Rev. G
Page 48

Figure 8-2 Compressor Data Recording and Playback
New Recording
icon
2. A Save as window displays. Select an output filename and click OK.
Figure 8-3 Choose Destination Filename (TT/TG Shown)
3. In the Site Information section, optionally enter the Customer Name, Customer Address,
Email Address, and any Notes regarding the recording. Any of this information can be
edited at any time until the recording is stopped and saved. Once the recording is saved, this
information can not be edited.
48 of 88
M-SM-001-EN Rev. G
Page 49

Figure 8-4 Site Information
Site
Information
Figure 8-5 Start Recording Icon
4. To change the chiller and compressor identification, in the Chillers & Compressors’ tree,
select the compressor node and change the chiller number, compressor number, and
compressor serial number, and then click Update.
5. To start recording, click the Start Recording (record circle) menu item.
The tool will automatically make an initial read of all standard compressor parameters and begin
polling all ‘volatile’ compressor parameters until recording is finished.
NOTE
Recording can be started before or after establishing a connection with a compressor.
The tool will automatically save and close the recording when an active compressor connection is
closed.
NOTE
The current time indicator may appear to only advance in short bursts - this is normal and is not indicative of performance
degradation.
49 of 88M-SM-001-EN Rev. G
Page 50

8.2.2 Stoping a Recording
Figure 8-6 Stop Recording Icon
To end a recording:
1. Click the Stop Recording menu item.
The tool will prompt you to verify ending of recording.
2. Click Yes to stop recording.
The tool will stop recording, finish writing any buffered data reads, compress, and close the recording.
Long recordings may take a moment to save. File saving progress is displayed at the bottom of the
Playback Control section.
NOTE
If no data has been recorded, a le will not be created.
NOTE
If compressor connection is lost during recording, the recording le will automatically save and close.
8.2.3 Cancelling a Recording
To cancel a recording:
Figure 8-7 Cancel Recording Icon
You are prompted to verify canceling of the recording.
The tool will cancel recording, wait for any pending writes to complete, close the file, and delete the
temporary recording data.
8.2.4 Pausing a Recording
To pause a recording:
Figure 8-8 Pause Recording Icon
1. Click the Cancel Recording (red X) menu item.
2. Click Yes to cancel.
• If recording is active, click the Pause Recording (red pause marks) menu item. The tool will
suspend recording data until recording is stopped or resumed.
50 of 88
M-SM-001-EN Rev. G
Page 51

8.2.5 Resuming a Recording
To resume a recording:
• If recording is paused, click the Start Recording menu item. The tool will resume recording data.
Figure 8-9 Start Recording Icon
8.3 Playback
8.3.1 Playing Back a Recording
1. To open a recording, click the Open Recording (folder) menu item.
Figure 8-10 Open Recording Icon
An Open file window displays.
Figure 8-11 Choose a Recording to Open Window
2. Select a recording file.
• If the file is properly loaded, the recording’s site information displays in the ‘Site Information’
section.
• This data may not be altered.
3. The playback server will automatically attempt to launch. If there are any problems starting the
playback host, a popup dialog displays.
4. Click the Play button to begin playing the recording.
51 of 88M-SM-001-EN Rev. G
Page 52

Figure 8-12 Play Icon
A connection with the playback server may be made in the same manner as with a remote compressor. Match the client host
name and TCP port settings with those displayed in this application.
8.3.2 Connecting to the Playback of a Recording
To connect to the playback:
1. In the Compressor Connection Manager Window, select Shared for the Connection Settings.
Figure 8-13 Compressor Connection
NOTE
52 of 88
2. Verify Port setting matches recording information.
NOTE
Typically, the default settings - host address = any and port = 503 - are acceptable; however, ensure that this port is unused. For
example, another application may be using port 503. The ‘launch’ button will not display if the host name text box is empty.
3. Click Connect to Remote Host.
4. Click Connect.
5. To view all of the available tools, enter a valid access code.
M-SM-001-EN Rev. G
Page 53
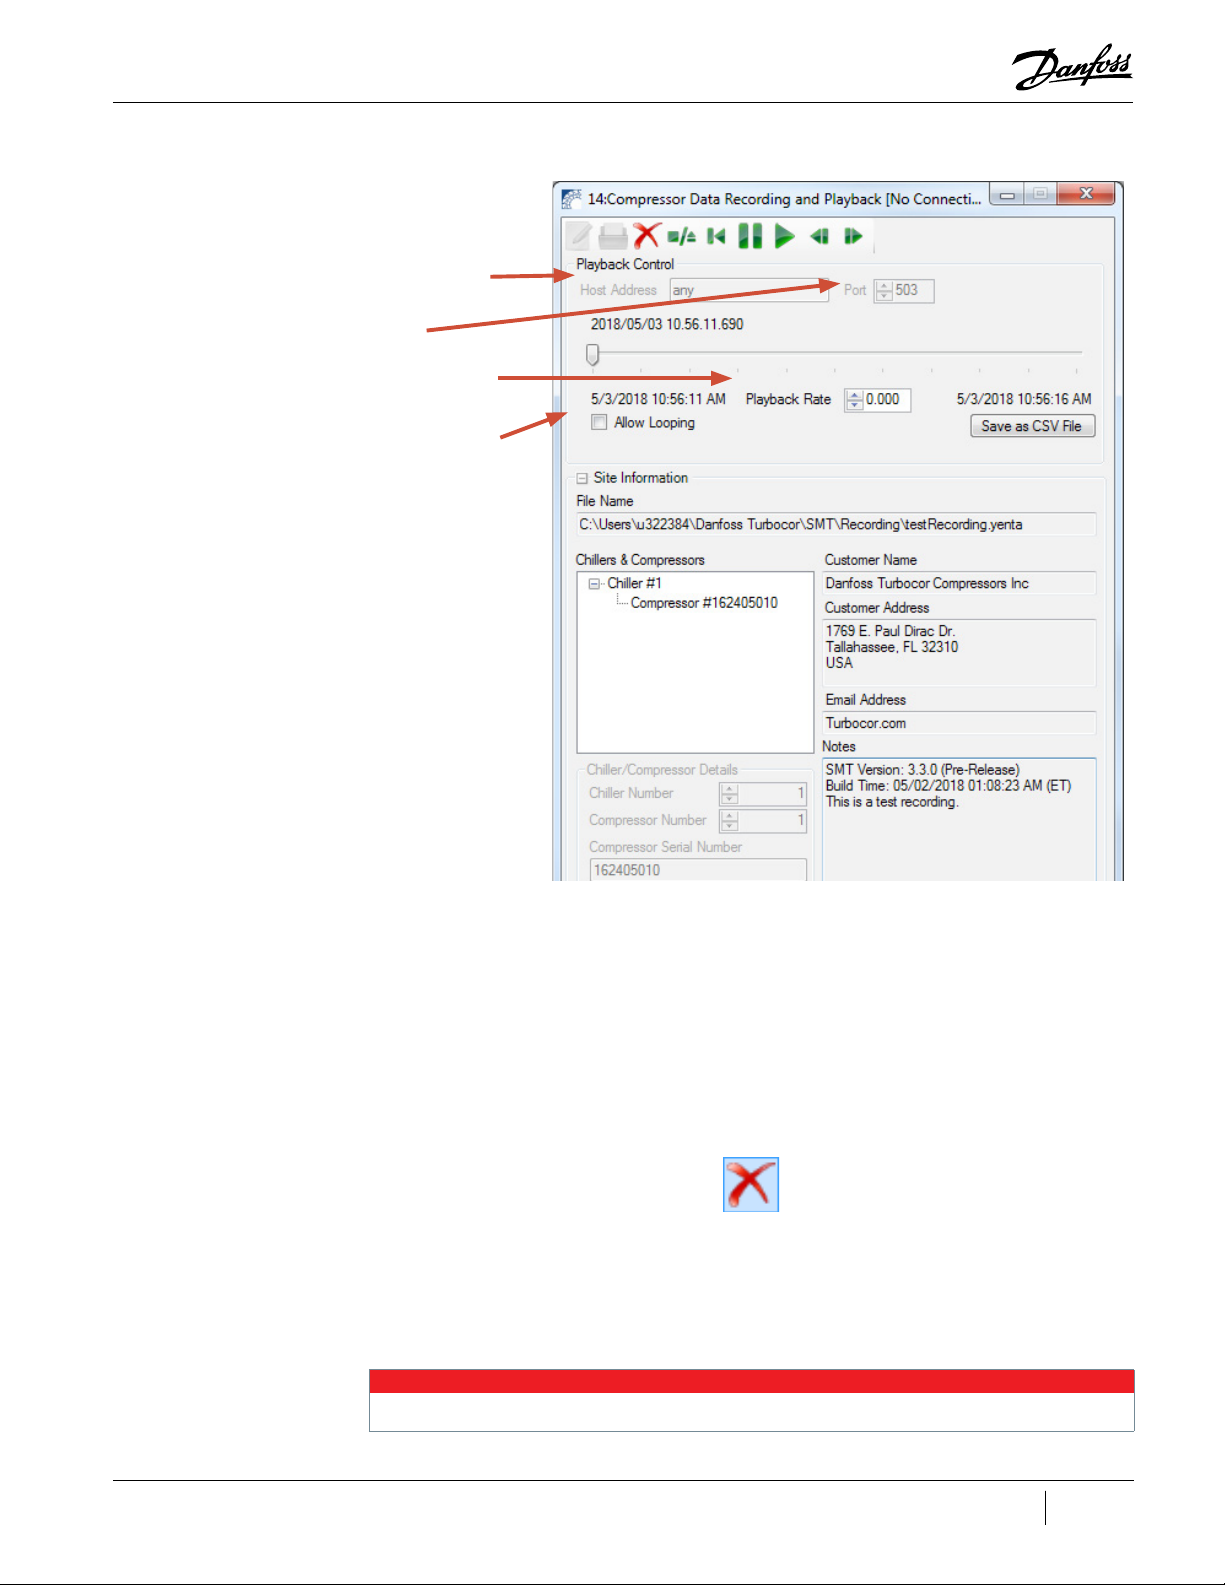
Figure 8-14 Compressor Data Recording and Playback Window
Host Address
Port
Playback Rate
Allow Looping
8.3.3 Enabling or Disabling Automatic Playback Looping
The tool contains an Allow Looping feature which will enable the playback server to loop the playback
timer when a boundary time is reached; otherwise the playback will pause.
• To enable looping, click the Allow Looping checkbox.
• To disable looping un-check the checkbox.
8.3.4 Closing an Open Recording
Figure 8-15 Close Recording Icon
To close an open recording:
1. Be sure to disconnect from the recording prior to closing the recording.
2. Click the Close Recording button.
• The tool will prompt to confirm the closure of the recording file.
3. Select Ye s to close the file and terminate any active playback sessions.
The playback server will launch in the paused mode - click the play button (play triangle) to begin playback at a normal rate.
NOTE
53 of 88M-SM-001-EN Rev. G
Page 54

8.3.5 Stopping the Playback Server
To stop the playback server:
1. Click the Stop Playback Server button.
Figure 8-16 Stop Playback Server
You are prompted for confirmation of termination of the playback server:
2. Select Ye s to terminate the playback server.
8.3.6 Changing the Playback Rate
To change the playback rate:
In the Playback Control section, the playback rate may be manually specified by either using the up/
down arrows or by entering a number in the Playback Rate field.
• To play at the normal rate (1.0), click the Play button.
Figure 8-17 Play Button
• To pause the playback, click the Pause button.
Figure 8-18 Pause Button
Figure 8-19 Rewind Button
Figure 8-20 Slow Forward Button
Figure 8-21 Slow Reverse Button
• If the absolute value of the playback rate < 1.0, click the Slow Forward button to increase
playback rate up to 1x in 1/8 increments.
• If the absolute value of the playback rate < 1.0, click the Slow Reverse button to decrease
playback rate down to -1x, in 1/8 increments.
54 of 88
M-SM-001-EN Rev. G
Page 55

8.3.7 Specifying the Minimum Access level
In case the recorded access level is too low to use certain tools for viewing, you can specify the
minimum access level:
To specify the minimum access level:
• From the Minimum Access Level drop-down, select the desired minimum access level. This forces
the playback server to disallow the access level to drop below the level specified.
You have to enter your Access level on the Compressor Connection Manager window to see the appropriate level. See “Changing
Compressor Access Levels”.
8.3.8 Save as CSV File
NOTE
Figure 8-22
Figure 8-23 Save to CSV
Save as CSV File Button
Clicking the Save as CSV file button will launch a new window which will provide the ability to save all
of the data stored in the Yenta into a CSV file, viewable in Excel.
The Save to CSV File window provides the ability to set the start time and end time to reduce the
actual data saved to the file, as well as, the ability to specify after how many rows to split the file.
Use the right and left arrow buttons are add or remove selected registers. The Parameters to show
checkboxes filters which registers are displayed in the Available Registers (left) list.
55 of 88M-SM-001-EN Rev. G
Page 56

Figure 8-24 Tools Button
The Tools button displays the Manage Parameters window, which provides the ability to select specific
parameters and to group specific parameters for future quick selection.
Figure 8-25 Manage Parameters Window
Figure 8-26 Speed Registers Selected
56 of 88
After the registers to record are selected and the start and end times are selected, click the “Save File”
button to save the file as a CSV. Creating the CSV file may take a few minutes; the Percent Done in the
Output Configuration section will display the status of the file save procedure.
M-SM-001-EN Rev. G
Page 57

Chapter 9.0 Bearing Calibration Tool
The Bearing Calibration Tool allows you to execute a bearing calibration procedure and analyze the
outcome. The tool can be used to calibrate the bearings, validate a calibration, view the current
persistent and latest calibration values and create a calibration report.
This tool may not function properly if the connected compressor’s access level is below Technician. This tool requires exclusive
application focus - all other tools will be closed or hidden when starting this tool.
9.1 Accessing the Bearing Calibration Tool
Once connected, select the Bearing Calibration tool icon from the SMT Suite Launcher Strip.
Figure 9-1 Bearing Calibration Tool Icon
The Bearing Calibration window displays:
Figure 9-2 Bearing Calibration Window
NOTE
57 of 88M-SM-001-EN Rev. G
Page 58

If the Save to EEPROM setting is set to RAM Only on the Compressor Connection window, the Save to EEPROM button will be unavailable for use on the Bearing Calibration window.
9.2 Performing a Calibration
To perform a calibration:
1. Ensure that the compressor’s interlock is open and the Modbus connection to the compressor
is disconnected.
2. Click the Start Calibration button.
The tool will invoke the calibration sequence on the compressor and display the bearing offset data in
the three graphs visible at the top of the main form.
The left-most graph displays data pertinent to the front radial bearing; the middle graph displays
data pertinent to the rear radial bearing; and the right-most graph displays data pertinent to the axial
bearing. The radial graphs display the offsets of the shafts edges. The axial graph displays the axial
displacement by time.
After the compressor successfully completes a bearing calibration sequence, the option to Save to
EEPROM becomes available.
Figure 9-3 Bearing Calibration Tool Showing Graphs
NOTE
58 of 88
M-SM-001-EN Rev. G
Page 59

9.3 Performing a Validation
To perform a validation:
• Click the Validate button.
The tool will validate the calibration by levitating the shaft, sampling orbit offset data, and validating
the data using the calibration values currently stored in EEPROM.
If the tool indicates that it is unable to perform a validation, check for any faults present and take appropriate actions before
attempting validation again.
9.4 Saving the Latest Bearing Calibration for Persistent Use
To save the latest bearing calibration for persistent use, click the Save to EEPROM button. The tool will
notify the compressor to use the latest calibration for persistent operation.
This calibration will overwrite previous calibration data.
If the last calibration values dier from the stored values outside of the tolerances set in the SMT, a warning message will appear
when saving to the EEPROM. This measures changes from the stored calibration and may be an indicator of shaft alignment
changes over time. Refer to the Service Manual for further information.
9.5 Viewing Bearing Calibration or Operation Settings
NOTE
NOTE
To view bearing calibration or operation settings:
1. Click the Bearing Configuration button.
The tool will display a form consisting of three sections: Calibration Limits, Operational Limits, and Bias
Settings.
2. Close the form when done.
9.6 Creating a Calibration Report
To create a calibration report:
1. Click the Create Report button.
A Save As window displays.
2. Select a path to use for saving the generated report.
The tool will generate a report at the user-specified path.
A bearing calibration need not be saved to EEPROM to create a report.
NOTE
59 of 88M-SM-001-EN Rev. G
Page 60

THIS PAGE INTENTIONALLY LEFT BLANK
60 of 88
M-SM-001-EN Rev. G
Page 61

Chapter 10.0 Chiller and Analog Configuration Tool
• This section is only applicable to when using BMCC rmware 3.1.4 and earlier.
• The Chiller and Analog Conguration Tool is only available if the rmware supports these features (i.e. TT/TG compressors with
CC 3.1.4 and earlier).
Configuration tool allows you to view and configure the configuration and operational parameters
of the BMCC’s chiller controller and analog output controller. This can be used to view or modify the
chiller control and analog output control configuration settings.
The tool can only modify parameters which the BMCC will allow for each given access level. If the
current access level is below any individual write access level, the corresponding field will appear
disabled.
10.1 Accessing the Chiller and Analog Configuration Tool
Once connected, select the Chiller and Analog Configuration Tool icon from the SMT Suite
Launcher Strip.
Figure 10-1 Chiller and Analog Configuration Tool Icon
The Chiller and Analog Configuration window displays:
Figure 10-2 Chiller and Analog Configuration Window
NOTE
61 of 88M-SM-001-EN Rev. G
Page 62

10.2 Viewing or Modifying Chiller Controller Settings
To view or modify the chiller controller settings:
1. Expand the Chiller Controller section
This section includes:
• Chiller Control Mode - The functional control mode of the compressor and how it is expected to
interact with external chiller system components.
• Chiller Set Point - Represents the operational target for the chiller control loop.
• Chiller Control Enabled - Checkbox enables Chiller Control. Even if the Control Mode is set to
Chiller Control Mode, the Chiller Control Enabled box must be checked.
• Chiller Proportional Gain - Represents the proportional gain for the chiller control loop. The
higher the proportional gain, the more severe the reaction to a given instantaneous deviation
from the setpoint will be.
• Chiller Integral Gain - Represents the integral gain for the chiller control loop. The higher the
integral gain, the more severe the reaction to an accumulated deviation from the setpoint over
time will be.
2. Modify as necessary.
10.3 Viewing or Modifying Analog Output Controller Settings
To view or modify the analog output settings:
1. Expand the Analog Output Controller section.
This section includes:
• Analog Control Mode - Represents the methodology used to control the Analog Output.
• Analog Control Action - Indicates the control action of the analog output.
• Analog Setpoint - The target value by which the analog output controller operates.
• Analog Start Output - This value represents the percentage of maximum voltage sent to the
‘ANALOG’ (JP1) terminal on the compressor interface module. This position will be maintained
until the Start Delay Timer has expired.
• Analog Start Delay Time - Represents the time in seconds that the analog Start Output is held.
The Start Delay Timer starts to count down when drive is enabled.
• Analog Output Offset - Represents the minimum amount of the maximum output voltage to
output at all times.
• Analog Output Process Value - The process value used by the BMCC for analog output control.
This readout is only available for BMCC software versions 1210 or later.
• Analog Output - The value indicated by the analog output via the analog output controller.
• Analog Proportional Gain - Represents the analog output proportional gain.
• Analog Integral Gain - Represents the analog output integral gain.
• Analog Derivative Gain - Represents the analog output derivative gain.
2. Modify as necessary.
62 of 88
M-SM-001-EN Rev. G
Page 63

Chapter 11.0 EXV Configuration Tool
The EXV Conguration Tool is only available when the rmware on the connected compressor has the Automatic EXV Control feature.
The Electronic Expansion Valve (EXV) Configuration Tool allows you to view and configure the electronic
expansion valve configuration parameters and settings.
The tool can only modify parameters which the BMCC will allow for each given access level. If the
current access level is below any individual write access level, the corresponding field will appear
disabled.
11.1 Accessing the EXV Configuration Tool
Once connected, select the EXV Configuration Tool icon from the SMT Suite Launcher Strip.
Figure 11-1 EXV Configuration Tool Icon
The EXV Configuration Tool displays.
Figure 11-2 EXV Configuration Tool (Applies to firmware prior to 4.X)
NOTE
63 of 88M-SM-001-EN Rev. G
Page 64

Figure 11-3 EXV Configuration Tool (Applies to 4.x firmware)
64 of 88
M-SM-001-EN Rev. G
Page 65

11.2 Viewing and Modifying EXV Controller Settings
To view or modify external expansion valve settings:
• Expand either the ‘EXV #1 Controller’ or ‘EXV #2 Controller’ sections.
These sections include:
• EXV #1 Control Mode - The methodology used to control the EXV #1 output.
• EXV #1 Control Action - Indicates the control action of the EXV output.
• EXV #1 Control Setpoint - Suction Superheat or Liquid Level percentage in accordance with the
selected control mode. Not applicable to Load Balance control mode because the compressor
will calculate the best position.
• EXV # 1 Stepper Start Delay Time - Represents the time in seconds that the valve’s Start Position
is held. The Stepper Start Delay Timer starts to count down when drive is enabled.
• EXV #1 Control Loop Speed - Represents the reaction time of the control loop to a process error
and replaces the PID (proportional, integral, and derivative) controller gains.
• EXV #1 Derivative Gain - The gain of the EXV controller’s derivative component.
• EXV #1 Process Value - The EXV’s process value by which the EXV position is controlled.
• EXV #1 Position - The current valve position.
• EXV #1 Min Steps - The minimum number of steps EXV #1 can open.
• EXV #1 Start Offset - The number of steps required to close EXV #1 to ensure initialization to
the closed position.
• EXV #1 Max Steps - The number of steps between the minimum and maximum positions for
EXV #1.
• EXV #1 Start Position - The percentage that the valve is open in start position and
• EXV #2 Control Mode - The methodology used to control the EXV #2 output.
• EXV #2 Control Action - Indicates the control action of the EXV output.
• EXV #2 Control Setpoint - Suction Superheat or Liquid Level percentage in accordance with the
selected control mode. Not applicable to Load Balance control mode because the compressor
will calculate the best position.
• EXV # 2 Stepper Start Delay Time - Represents the time in seconds that the valve’s Start Position
is in held. The Stepper Start Delay Timer starts to count down when drive is enabled.
• EXV #2 Control Loop Speed - Represents the reaction time of the control loop to a process error
and replaces the PID (proportional, integral, and derivative) controller gains.
• EXV #2 Derivative Gain - The gain of the EXV controller’s derivative component.
• EXV #2 Process Value - The EXV’s process value by which the EXV position is controlled.
• EXV #2 Position - The current valve position.
• EXV #2 Min Steps - The minimum number of steps EXV #2 can open.
• EXV #2 Start Offset - The number of steps required to close EXV #2 to ensure initialization to the
closed position.
• EXV #2 Max Steps. - The number of steps between the minimum and maximum positions for
EXV #2.
• EXV #2 Start Position - The percentage that the valve is open in start position.
65 of 88M-SM-001-EN Rev. G
Page 66

THIS PAGE INTENTIONALLY LEFT BLANK
66 of 88
M-SM-001-EN Rev. G
Page 67

Chapter 12.0 Compressor Configuration Tool
The Compressor Configuration Tool allows you to view and configure the compressor operation, IGV,
startup, surge/choke, and other operational configuration parameters and settings.
The Compressor Configuration Tool can only modify parameters which the BMCC will allow for each given access level and the
for rmware in the connected compressor. If the current access level is below any individual write access level or if the particular
setting is not available on the rmware on the connected compressor, the corresponding eld may not be available or may be
disabled.
12.1 Accessing the Compressor Configuration Tool
Once connected, select the Compressor Configuration Tool icon from the SMT Suite Launcher Strip.
Figure 12-1 Compressor Configuration Tool Icon
The Compressor Configuration window displays:
Figure 12-2 Compressor Configuration Window
NOTE
67 of 88M-SM-001-EN Rev. G
Page 68

Figure 12-3 Compressor Configuration Window (VTT Basic Configuration)
Figure 12-4 Compressor Configuration Window (VTT Advanced Configuration)
68 of 88
M-SM-001-EN Rev. G
Page 69

12.2 Viewing or Modifying Compressor Operation Settings
To view or modify the compressor operation settings:
TT/TG
1. Expand the Compressor Configuration section.
This section includes: Control Mode, Hot Gas Bypass Gain, and Power Control Loop Gain.
2. Modify as necessary.
VTT
1. Expand the Compressor Configuration section.
This section includes: Control Mode, Input Frequency, Refrigerant, Voltage Option, Current Hold Limit,
and Maximum System Speed.
2. Modify as necessary.
12.2.1 Modifying Control Mode
To modify the Control Mode, click the Drop-Down Box and change to the desired control mode.
12.3 Viewing or Modifying Compressor Startup Settings
To view or modify the compressor startup settings:
TT/TG
1. Expand the Startup Configuration section.
This section includes: Motor Pre-Cool Mode, Start Speed, Start Speed Offset, Part Vane Speed
Compensation, Motor Ramp-Up Increment, Run Status Indication Speed, Motor Pre-Cool Time, IGV
Start Position, Motor Start IGV Percentage, Minimum Motor Current, and Minimum Start Speed
Percentage.
2. Modify as necessary.
VTT
1. Expand the Startup Configuration section.
This section includes: Pressure Ration Override, Start Speed, Motor Ramp-Up Increment, Startup Time
Limit, Motor KW Startup Threshold, Minimum Start Speed Percent, IFV% Open at Startup, Suction
Pressure Startup Delay, Min Requested Power Percent, and IFV Start Position on idle.
2. Modify as necessary.
69 of 88M-SM-001-EN Rev. G
Page 70

12.4 Viewing of Modifying Shutdown Configuration Settings (TT/TG Only)
To view or modify the Shutdown Configuration settings:
1. Expand the Shutdown Configuration section.
This section includes: Shutdown Speed, Shutdown Timer Setting, Controlled Assist Shutdown on
Interlock Open, and Shutdown Timer Max Limit.
2. Modify as necessary.
12.5 Viewing or Modifying IGV Configuration Settings (TT/TG Only)
To view or modify the IGV configuration settings:
1. Expand the IGV Configuration section.
This section includes: Fast Restart IGV on Interrupt, Open IGV to Start Position after Initialization, IGV
Gain, Skip IGV Initialization on Fault, Initialize IGV to Fully Closed and Minimum IGV Steps.
2. Modify as necessary.
NOTE
Refer to M-PR-001-EN OEM Programming Guide for detailed information on the Fast Restart feature.
12.6 Viewing or Modifying Surge/Choke Configuration Settings (TT/TG Only)
To view or modify the surge/choke configuration settings:
1. Expand the Surge & Choke Configuration section.
This section includes: Surge Recovery/Prevention Orbit Limit, Surge Warning Orbit Limit, Part-Vane
Speed Gain, and Surge Offset.
2. Modify as necessary.
12.7 Viewing or Modifying Capacity Control Configuration Settings (VTT Only)
To view or modify the capacity control configuration settings:
1. Expand the Capacity Control Configuration section.
This section includes: IFV Open Power Offset A, IFV Open Power Offset B, Surge Escape Speed Increase,
IFV Close Power Offset A, and IFV Close Power Offset B.
2. Modify as necessary.
70 of 88
M-SM-001-EN Rev. G
Page 71

12.8 Viewing or Modifying Communication Configuration
To view or modify the Communication Configuration settings:
TT/TG
1. Expand the Communication Configuration section.
This section includes: RS-232 & RS-485 Baud Rate, Parity and Stopbits, as well as the Modbus
Slave Address.
2. Modify as necessary.
VTT
1. Expand the Communication Configuration section.
This section includes: Modbus Slave Address, RS-485 Baud Rate, RS-485 Parity, RS-485 Stopbits,
Modbus Slave Address RS485-2, RS-485 Baud Rate Com2, RS-485 Parity Com2, and RS-485
Stopbits Com2.
2. Modify as necessary.
12.9 Viewing Advanced Configuration
TT/TG
To view the Advanced Configuration settings:
1. Expand the Advanced Configuration section.
This section includes: Positive Calculation Mode, Inverter & Cavity Cooling Max Temp., SCR Mains
Input Frequency, Min. Operating Speed, Cooling Split Mode, Envelope Coefficient A & B, Low Speed
Acceleration Threshold, Max System Speed, IGV Coefficient A & B, Max IGV Steps, IGV Initialization
Steps, Surge and Choke Coefficients A thru D.
VTT
To view the Advanced Configuration settings:
1. Click the Advanced Configuration tab.
This section includes: Orb Limit 2, Orbit Counter Threshold, Motor Power Counter Threshold, Power
Counter Threshold, RPM Change Per Control Cycle, IFV Override Enable, IFV Transistion Delay Loading,
IFV Transition Power Deadband 1% IFV Override Zone, IFV Transition Delay Unloading, Speed Ctrl PID
Max, Speed Ctrl P Deadband, Speed Ctrl I Deadband, Speed Ctrl D Deadband, Speed Ctrl I Deadband
Factor, IFV Ctrl P Gain, IFV Ctrl I Gain, IFV Ctrl D Gain, IFV Ctrl PID Transition Zone, IFV Ctrl P Deadband,
IFV Ctrl I Deadband, IFV Ctrl D Deadband, IFV Ctrl I Deadband Factor, and IFV Ctrl PID Transition PR.
71 of 88M-SM-001-EN Rev. G
Page 72

THIS PAGE INTENTIONALLY LEFT BLANK
72 of 88
M-SM-001-EN Rev. G
Page 73

Chapter 13.0 Compressor Commissioning Tool
The Compressor Commissioning Tool is used to view, modify, and commit site-specific compressor
parameter values of a connected compressor, as well as to import and export such configurations
between portable files. Minor guidance is provided by presenting any number of configuration
‘pages’, which are necessary for consideration during the deployment of a compressor system, and by
displaying basic coverage/flow indications.
This tool can be used to import commissioning configuration from a file, adjust commissioning
parameters requirement steps, export a commissioning value configuration to a file, sign an existing
configuration file, export commissioning parameter values to a connected compressor, and create a
commissioning report.
• The Compressor Commissioning Tool requires exclusive application focus - all other tools may be closed or hidden when starting
this tool
• The Compressor Commissioning Tool is only available if the rmware supports these features (i.e. TT/TG compressors with
CC 3.1.4 and earlier)
13.1 Accessing the Compressor Commissioning Tool (TT/TG Only)
Once connected, select the Compressor Commissioning icon from the SMT Suite Launcher Strip.
Figure 13-1 Compressor Commissioning Tool Icon
NOTE
The Compressor Commissioning window displays:
Figure 13-2 Compressor Commissioning Window
Available tools are dependent upon the rmware version of the connected compressor.
13.2 Importing a Commissioning Configuration from a File
To import a commissioning configuration from a file:
1. From the Commissioning Configuration window, click the Import from File button.
2. Select a commissioning file The commissioning parameters will be loaded and a notice is
displayed indicating whether or not the file contains the signature of a DTC Trusted Official.
NOTE
73 of 88M-SM-001-EN Rev. G
Page 74

13.3 Adjusting Commissioning Parameters Requirement Step
To adjust the Commissioning parameters requirement step:
• Click any of the graphical commissioning section flow item representation buttons (colored
circle with text name) in the flow items toolbar or click the Next or Prev buttons along the top
toolbar.
An orange button means the item has been visited, a blue is button is an unvisited item, and yellow is the current item.
The selected section will appear below in the Commissioning Section display.
13.4 Exporting a Commissioning Values Configuration to a File
To export commissioning values configuration to a file:
1. From the Commissioning Configuration Finish window, click the Export to File button.
Figure 13-3 Compressor Commissioning Finish Window
2. Select a file destination.
Figure 13-4 Choose Commissioning File Location
NOTE
74 of 88
3. Click Save. The commissioning parameters and values are saved.
M-SM-001-EN Rev. G
Page 75

13.5 Exporting Commissioning Parameters to a Connected Compressor
Click the Export to Compressor button.
All parameters will be updated on the connected compressor. The progress of the export can be
gauged by the progress bar directly below the button. A notification of completion will be displayed
when finished.
Figure 13-5 Commissioning Complete
NOTE
The Parameter Saving selection in the Connection Manager must be set to RAM & EEPROM to enable the option to Export to
Compressor.
13.6 Creating a Commissioning Report
NOTE
A commissioning report can be saved at anytime, not just after commissioning has been performed.
To create a commissioning report:
Figure 13-6 Report Prompt
By clicking the Create Commissioning Report button or after commissioning is completed, a prompt
will display asking if you would like to create a report.
1. Click Yes. A Save As window displays.
75 of 88M-SM-001-EN Rev. G
Page 76

Figure 13-7 Report Save As Window
A report is generated and saved to the user-specified path.
2. Enter a filename and path to which the report will be saved.
3. Click Save.
76 of 88
M-SM-001-EN Rev. G
Page 77

Chapter 14.0 Compressor Data Trending Tool
The Compressor Data Trending Tool is used to graphically monitor selected compressor parameter
values and load or save user-configurable watch configurations. This tool can be used to add or
remove parameters for graphical monitoring, select the plot color of a specific parameter, start or stop
graphical monitoring, reset plot data, save plot data to CSV file, load saved or pre-configured watch
groups, delete saved or pre-configured watch groups, or save the active watch configuration for
later recall.
14.1 Accessing the Compressor Data Trending Tool (TT/TG Only)
Once connected, select the Compressor Data Trending icon from the SMT Suite Launcher Strip.
Figure 14-1 Compressor Data Trending Tool Icon
The Compressor Data Trending window displays:
Figure 14-2 Compressor Data Trending Window
14.2 Adding Parameters for Graphical Monitoring
To add or remove parameters for graphical monitoring:
1. From the Compressor Data Trending window, in the Available Parameters listing, scroll to the
desired parameter.
77 of 88M-SM-001-EN Rev. G
Page 78

Figure 14-3 Compressor Trending Window - Parameter Pane
78 of 88
NOTE
You can enter a partial query in the Available Parameters text box above the listing to lter the visible parameters.
NOTE
Clicking inside the listing and typing the rst few letters of the name can help speed up nding the parameter to select.
2. Double-click on the desired entry or click the Add to Trend Configuration button.
Refer to "Figure 14-3 Compressor Trending Window - Parameter Pane".
The parameter is removed from the Available Parameters listing and added to the Watched Parameters.
listing.
NOTE
To choose more parameters, rst stop the plotting by clicking the Stop button in the Trending Control section.
M-SM-001-EN Rev. G
Page 79

14.3 Removing Parameters from Graphical Monitoring
To remove parameters from graphical monitoring:
1. From the Compressor Data Trending window, in the Watched Parameters listing, select the
desired parameter.
2. Double-click on the desired entry or click the Remove from Trend Configuration button.
Refer to "Figure 14-3 Compressor Trending Window - Parameter Pane".
The parameter is removed from the Watched Parameters listing and is added to the top of the Available
Parameters listing.
To remove parameters, rst stop the plotting by clicking the Stop button in the Trending Control section.
14.4 Selecting the Plot Color a Specific Parameter
To select the plot color of a specific parameter:
1. From the Compressor Data Trending window, in the Watched Parameters listing, click on the
colored square immediately to the left of the name of the parameter whose plot color is to
be changed. A color selection dialog displays.
Figure 14-4 Parameter Color Selection
NOTE
2. Select a new color and click OK. The color square in the listing will update as will the color of
the appropriate plot line (if plotting is active).
79 of 88M-SM-001-EN Rev. G
Page 80

Figure 14-5 Watched Parameters After Color Change
14.5 Starting Graphical Monitoring
To start graphical monitoring, from the Compressor Data Trending window, click the Start Plotting
button (orange button with down arrow). Plotting begins.
The Start Plotting button will change to the Stop Plotting button.
Figure 14-6 Watched Parameters Being Plotted
14.6 Stopping Graphical Monitoring
To stop graphical monitoring:
1. From the Compressor Data Trending window, click the Stop Plotting button. See Figure 101
(Watched Parameters Being Plotted).
2. You are prompted as to whether you would like to save the data to a file.
Plot Line
Stop Plotting
80 of 88
M-SM-001-EN Rev. G
Page 81

Figure 14-7 Save Data Prompt
Figure 14-8 Save Data to a CSV File
3. Select Ye s to save a CSV (Excel) file.
14.7 Resetting Plot Data
4. Enter the destination file name and all trend data will be recorded to the specified file in CSV
format.
NOTE
You will also receive the Save As prompt if a compressor connection is lost or you are disconnected.
To reset plot data, click the Reset Plots button (orange curl-arrow).
• All plots will be reset and the graph may momentarily clear.
NOTE
When resetting the plots, data recorded before resetting will not be saved to le if this option was selected when plotting
was stopped.
81 of 88M-SM-001-EN Rev. G
Page 82

14.8 Saving Plot Data to a CSV File
To save plot data to CSV file:
1. After stopping, a prompt asking whether the user would like to save the trend data to file
• A Save As window displays. Refer to "Figure 14-8 Save Data to a CSV File" on page 81.
2. Enter the destination file name and all trend data will be recorded to the specified file in
displays. Select Yes to save data to a CSV file.
CSV format.
You will also receive the Save As prompt if a compressor connection is lost or you are disconnected.
14.9 Loading a Saved or Pre-configured Watch Group
To load a saved or pre-configured watch group:
1. From the Compressor Data Trending window, click the Manage Watch Configurations button.
Figure 14-9 Managed Watch Configurations Button
The Watch Management window displays.
Figure 14-10 Watch Management Window
NOTE
2. Select the desired watch configuration (if any exist) from the listing.
3. To load the selected watch configuration, either double-click the item in the listing or click
the Load button.
• The watch configuration will display in the Watched Parameters listing on the main form and
each item’s plot color will be adjusted as saved.
Once deleted, the conguration can not be retrieved. It would have to be recreated manually.
14.10 Deleting a Saved or Pre-configured Watch Group
To delete a saved or pre-configured watch group:
1. Click the Manage Watch Configurations button (wrench & screwdriver).
• The watch configuration management form displays.
2. Select the desired watch configuration (if any exist) from the listing.
3. Click Delete.
• A prompt verifying whether you really want to delete the selected watch configuration displays.
4. Select Ye s to remove the watch configuration.
82 of 88
M-SM-001-EN Rev. G
NOTE
Page 83

14.11 Saving the Active Watch Configuration for Later Recall
To save the active watch configuration for later recall:
1. Add at least one parameter to the Watched Parameters listing.
2. Click the Manage Watch Configurations button (wrench & screwdriver).
• The watch configuration management form displays.
3. Click the Save Current button. A form requesting a name for the watch configuration will
appear.
4. Enter a name and click OK to save the current watch configuration.
14.12 Trending Tool
Figure 14-11 Compressor Data Trending
83 of 88M-SM-001-EN Rev. G
Page 84

Figure 14-12 Compressor Data Trending
14.13 Valve Control Setup (VTT Only)
Once connected, select the Motor Cooling Valve tool icon from the SMT Suite Launcher Strip.
Figure 14-13 Motor Cooling Valve Tool Icon
To view or modify the Valve settings:
VTT
1. Click the Motor Cooling Valve tool icon.
This section includes: Motor Cooling, VFD Cooling, IFV calibration, and Staging.
2. Select the IFV tab to calibrate the IFV.
3. Select the appropriate other tabs and modify as necessary.
84 of 88
M-SM-001-EN Rev. G
Page 85

Figure 14-14 Valve Control Setup - Motor Cooling
Figure 14-15 Valve Control Setup
- VFD Cooling
14.14 Valve Control Tool
Figure 14-16 Valve Control Setup - IFV
85 of 88M-SM-001-EN Rev. G
Page 86

Figure 14-17 Valve Control Setup - Staging
86 of 88
M-SM-001-EN Rev. G
Page 87

®
Troubleshoot
Quick access to Danfoss Turbocor®
compressor troubleshooting.
The new version of the Danfoss TurboTool® 2.0 app for all your full service
Danfoss Turbocor® compressor needs.
24/7
Access to Danfoss
The TurboTool® app makes
it easy for technicians to
troubleshoot issues on Danfoss
Turbocor® compressors.
You no longer need to keep
hundreds of pages of parts
catalogs and training manuals.
With the app, all of this
information is at your fingertips
on your smart device.
The user can select from a list
of symptoms in the app that
match the problems exhibited
by the compressor being
serviced. The app will then
list potential causes, solutions
to the problem, and service
literature to reference for further
information.
With the app, you can access
videos made by Danfoss
Turbocor® that demonstrate
how to remove, install, and
rebuild key components on
Danfoss Turbocor® compressors.
Tur boc or®
compressor
troubleshooting on
site
The app provides the correct
operating parameters for key
components: no need to keep
reference documents on hand.
Spare Parts
TurboTool® helps you to
quickly identify the required
Download the
2.0 app today!
Scan to
download app
spare parts. A quick scan of
the compressor serial # using
your smartphone camera or by
entering the part # or model
#, and the app will display
potential spare parts kits.
www.turbocor.danfoss.com
87 of 88M-SM-001-EN Rev. G
Page 88

Danfoss Commercial Compressors
Danfoss Inverter Scrolls
is a worldwide manufacturer of compressors and condensing units for refrigeration and HVAC applications. With a wide range of
high quality and innovative products we help your company to find the best possible energy efficient solution that respects the
environment and reduces total life cycle costs.
We have 40 years of experience within the development of hermetic compressors which has brought us amongst the global
leaders in our business, and positioned us as distinct variable speed technology specialists. Today we operate from engineering
and manufacturing facilities spanning across three continents.
Danfoss Turbocor Compressors
Danfoss Light Commercial Refrigeration
Our products can be found in a variety of applications such as rooftops, chillers, residential air conditioners,
heatpumps, coldrooms, supermarkets, milk tank cooling and industrial cooling processes.
http://turbocor.danfoss.com
Danfoss Turbocor 1769 E. Paul Dirac Drive 1769, Tallahassee FL 32310 USA | +1 850 504 4800
M-SM-001-EN Rev. G
Danfoss Scrolls
Danfoss Optyma Condensing Units
Danfoss Maneurop Reciprocating Compressors
Compressors
© Danfoss | DCS (CC) | 2019.05
 Loading...