

CEL-296/3 Octave & Third Octave
Autoscan Filter Set
Operator's Handbook
060046
Issue: 3A
March 1995
CEL Instruments Ltd CEL-296/3 Operator Handbook Page 1

Page 2 CEL-296/3 Operator Handbook CEL Instruments Ltd

Contents: Page
1. INTRODUCTION 5
2. SCHEDULE OF PARTS 9
3. DESCRIPTION 11
3.1 Technical Description 11
3.1.1 Signal Processing & Filters 12
3.1.2 Control System 13
3.2 Digital Display 13
3.3 Autoscan & Spectrum Storage Facilities 17
3.3.1 Manual Storage 18
3.3.2 Autoscan Storage 18
3.4 Control Identities 20
3.5 Input Facilities 25
3.6 Output Facilities 26
3.7 Batteries & Auxiliary Power Supplies 27
4. PREPARATION FOR USE 29
5. OPERATION 31
5.1 Analysis Using Instruments Equipped
With the Low Power Serial Interface 31
5.1.1 Preparation for Use with Measuring Instruments
Equipped With the Low Power Serial Interface 31
5.1.2 Operation of Manual Storage Facilities 35
5.1.3 Operation of Autoscan Storage Facilities 37
5.1.4 Recall of Stored Autoscan Data 42
5.2 Analysis Using Instruments Not Equipped
with the Low Power Serial Interface 44
5.2.1 Preparation for Use With Measuring Instruments
Not Equipped With the Low Power Serial Interface 44
5.2.2 Operation as a Manually or Remotely Scanned
Filter Set 47
CEL Instruments Ltd CEL-296/3 Operator Handbook Page 3

Contents: (Continued) Page
6. DIGITAL INTERFACE 51
7. SPECIFICATION 57
8. ERROR MESSAGES 63
9. MANUFACTURERS SERVICING & WARRANTY
ARRANGEMENTS 65
Page 4 CEL-296/3 Operator Handbook CEL Instruments Ltd

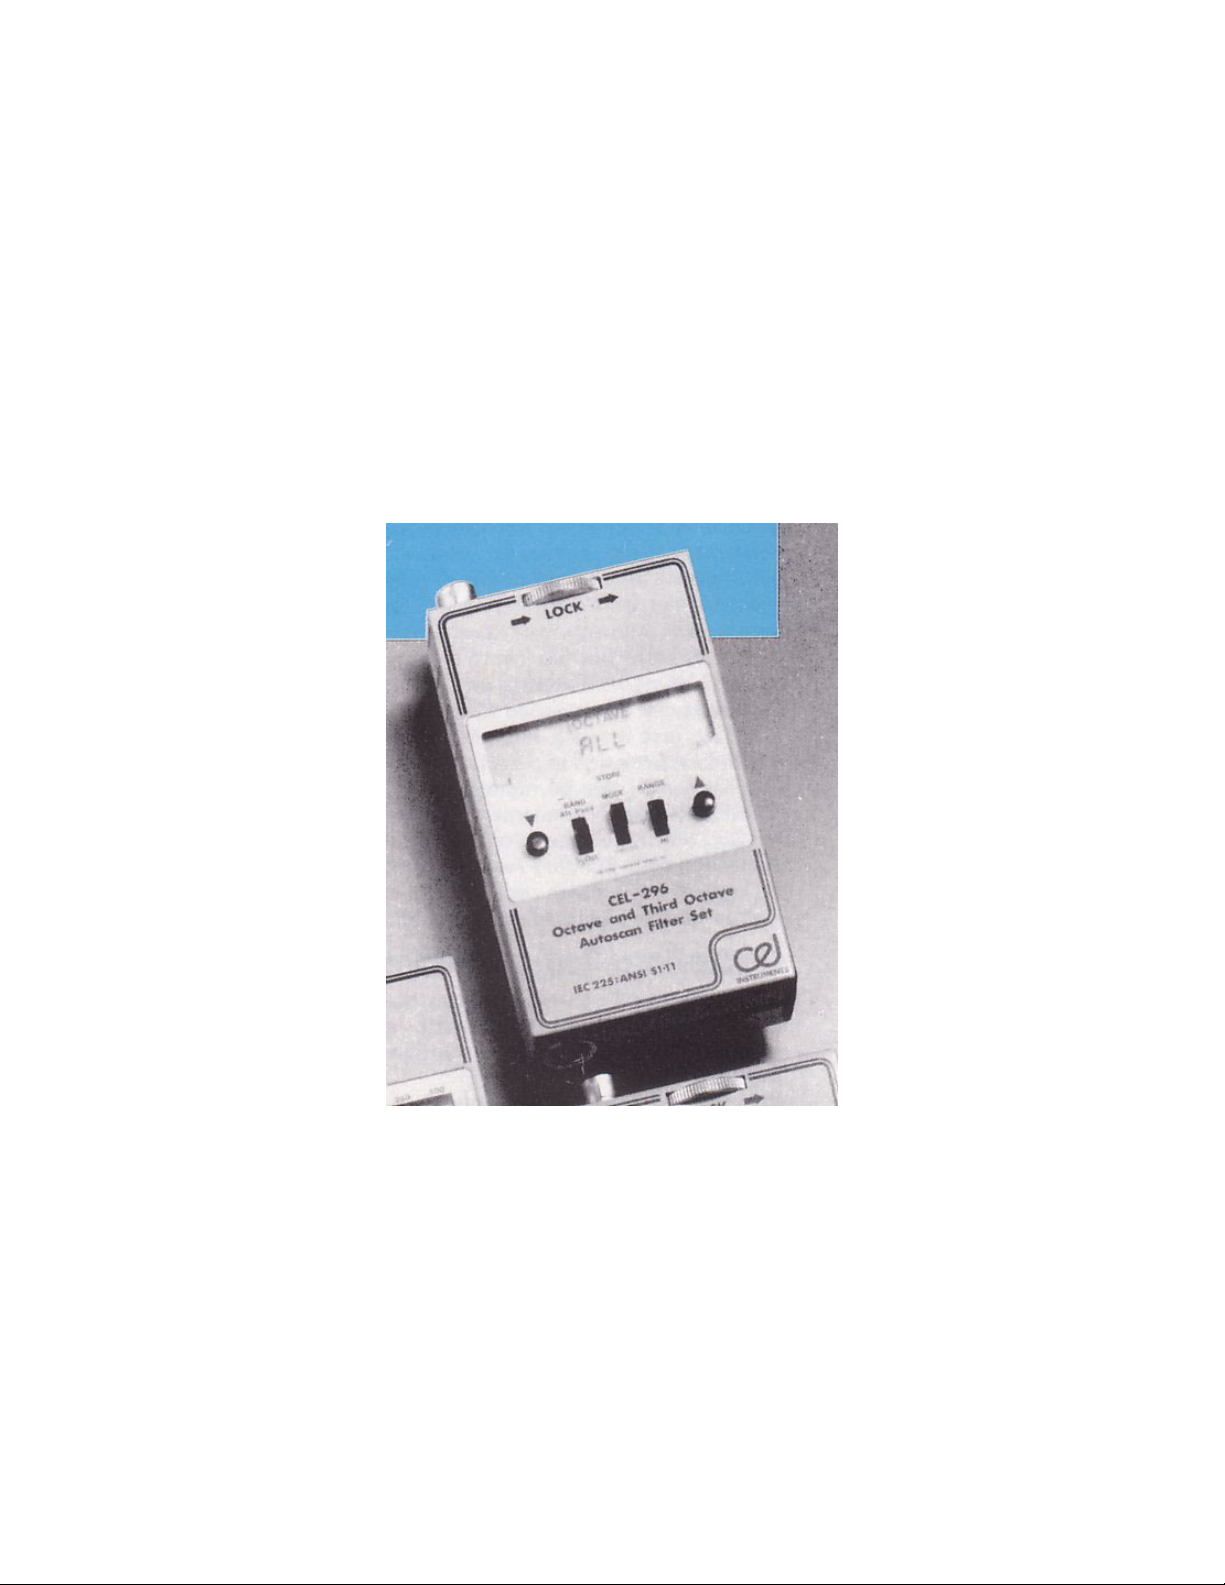
1. INTRODUCTION
The CEL-296/3 Filter Set was designed to meet the requirement for
a portable octave and third octave filter set that allows frequency
analysis to be performed with CEL sound level meters. This
requirement has been realised by utilizing a pair of switched
capacitor filters, one for octaves and one for third octaves, that can
be switched step by step to give the full range of centre frequencies.
The resulting lightweight instrument has 12 octave bands with
centre frequencies from 8 Hz to 16 kHz, and 36 third octave bands
with centre frequencies from 6.3 Hz to 20 kHz. The accuracy of
each individual filter band achieved in this way fulfils the relevant
IEC and ANSI Standard requirements for octave and third octave
filters.
The filter set contains a built in microprocessor plus the CEL low
power serial interface, and in consequence is primarily intended to
operate in conjunction with one of the following sound level
meters.
CEL-493/2N, /3 Precision Integrating Impulse Sound
Level Meter (Type 1I),
CEL-275/28, /2D, /3B, /3D Precision Integrating
Impulse Sound Level Meter (Type 1I),
CEL-363/2B, /2D, /3B, /3D Integrating Impulse Sound
Level Meter (Type 2I).
When fitted to the base of one of these instruments, all of which
contain the interface. a powerful system is formed that can perform
autoscan frequency analysis of noise and vibration under the control
of the microprocessor in the filter set.
Results of the analysis are stored, and this memory is retained even
when the unit is switched off. The memory function enables six
octave and six third octave analyses to be stored, where five of each
CEL Instruments Ltd CEL-296/3 Operator Handbook Page 5

type are generated by the autoscan routine, and one of each type is
produced by a manual analysis.
The CEL low power serial interface also allows connection to the
CEL-438 Noise Level Analyzer, CEL-338 Graphics Printer and
Logger, and 238A Secondary Processor, or to some other digital
device for data logging or processing, and for control purposes.
The CEL-296/3 may also be used with other current types of CEL
instrumentation that has not got the interface, including the
following.
CEL-275/2A, /2C, /3A, /3C Precision Integrating Impulse
Sound Level Meter (Type 1I),
CEL-383/2A, /2C, /3A, /3C Integrating Impulse Sound Level
Meter (Type 2I),
CEL-262 Environmental Noise Analyzer (Type 1),
CEL-160 Graphic Level Recorder.
A factory conversion is available to adapt the following older
versions of these sound level meters so that they can be close
coupled to the CEL-296/3.
CEL-493/2* Precision Integrating Impulse Sound Level
Meter (Type 1I),
CEL-275A, & B Precision Integrating Impulse Sound Level
Meter (Type 1I),
CEL-383A, & B Integrating Impulse Sound Level Meter
(Type 2I),
Note*:Some early models of the CEL-493 cannot fully utilize the
autoscan facilities. however ALL 493/2s are fully operable.
Please consult CEL quoting the relevant serial number.
Page 6 CEL-296/3 Operator Handbook CEL Instruments Ltd

The following other earlier types of CEL sound level meter may also
be used, although special procedures and cables may be required.
Please consult your local CEL representative for details.
CEL-193 Precision Integrating Impulse Sound Level Meter
(Type 1I),
CEL-175 Precision Integrating Impulse Sound Level Meter
(Type 1I),
CEL-187 Precision Integrating Sound Level Meter (Type 1).
The CEL-160 Graphic Level Recorder is able to control the
frequency switching so that level can be plotted against frequency.
However, as none of these instruments contain the CEL low power
serial interface, the autoscan and memory functions cannot be used.
Refer to Chapter 5 for detailed instructions for operating the filter set,
and to Chapter 3 for a technical description of its functions. Please
turn to Chapter 4 to prepare the instrument for use.
CEL Instruments Ltd CEL-296/3 Operator Handbook Page 7

Page 8 CEL-296/3 Operator Handbook CEL Instruments Ltd

2. SCHEDULE OF PARTS
A complete "CEL-296/3 Octave and Third Octave Autoscan Filter
Set" contains the following items. When the instrument is delivered,
check that all items on the schedule have been supplied.
CEL-296/3 Octave and Third Octave Autoscan Filter Set.
LR6 Alkaline battery (4 off),
045018 Pad of filter tables,
060046 Handbook.
Special transit packing is provided for the instrument and this should
be retained for use when the instrument is transported or must be
consigned by general carriers. (Current or pending legislation on
recycling states that this packaging must be retained for re-use or be
recycled in the locally approved manner).
Any instrument returned inadequately packed to the manufacturer
for calibration, service, or repair will be re-packed and charged
accordingly.
The following additional items may be ordered separately to
increase the range of tasks that can be performed by the CEL296/2. They will be itemized separately on the schedule.
CEL-4697 Set of 4 NiCad rechargeable cells,
CEL-4691 Charger Unit required for CEL-4697,
C4531/0.5 Cable Set for automatic frequency analysis with
CEL-160 Graphic Recorder,
C4534/2 Cable for AC conditioned output and automatic
frequency analysis with CEL-160 when Filter Set
mounted on CEL-493/2. CEL-275, or CEL-383
(old or new) series of sound level meters.
CEL Instruments Ltd CEL-296/3 Operator Handbook Page 9

Page 10 CEL-296/3 Operator Handbook CEL Instruments Ltd
3. DESCRIPTION
3.1 Technical Description
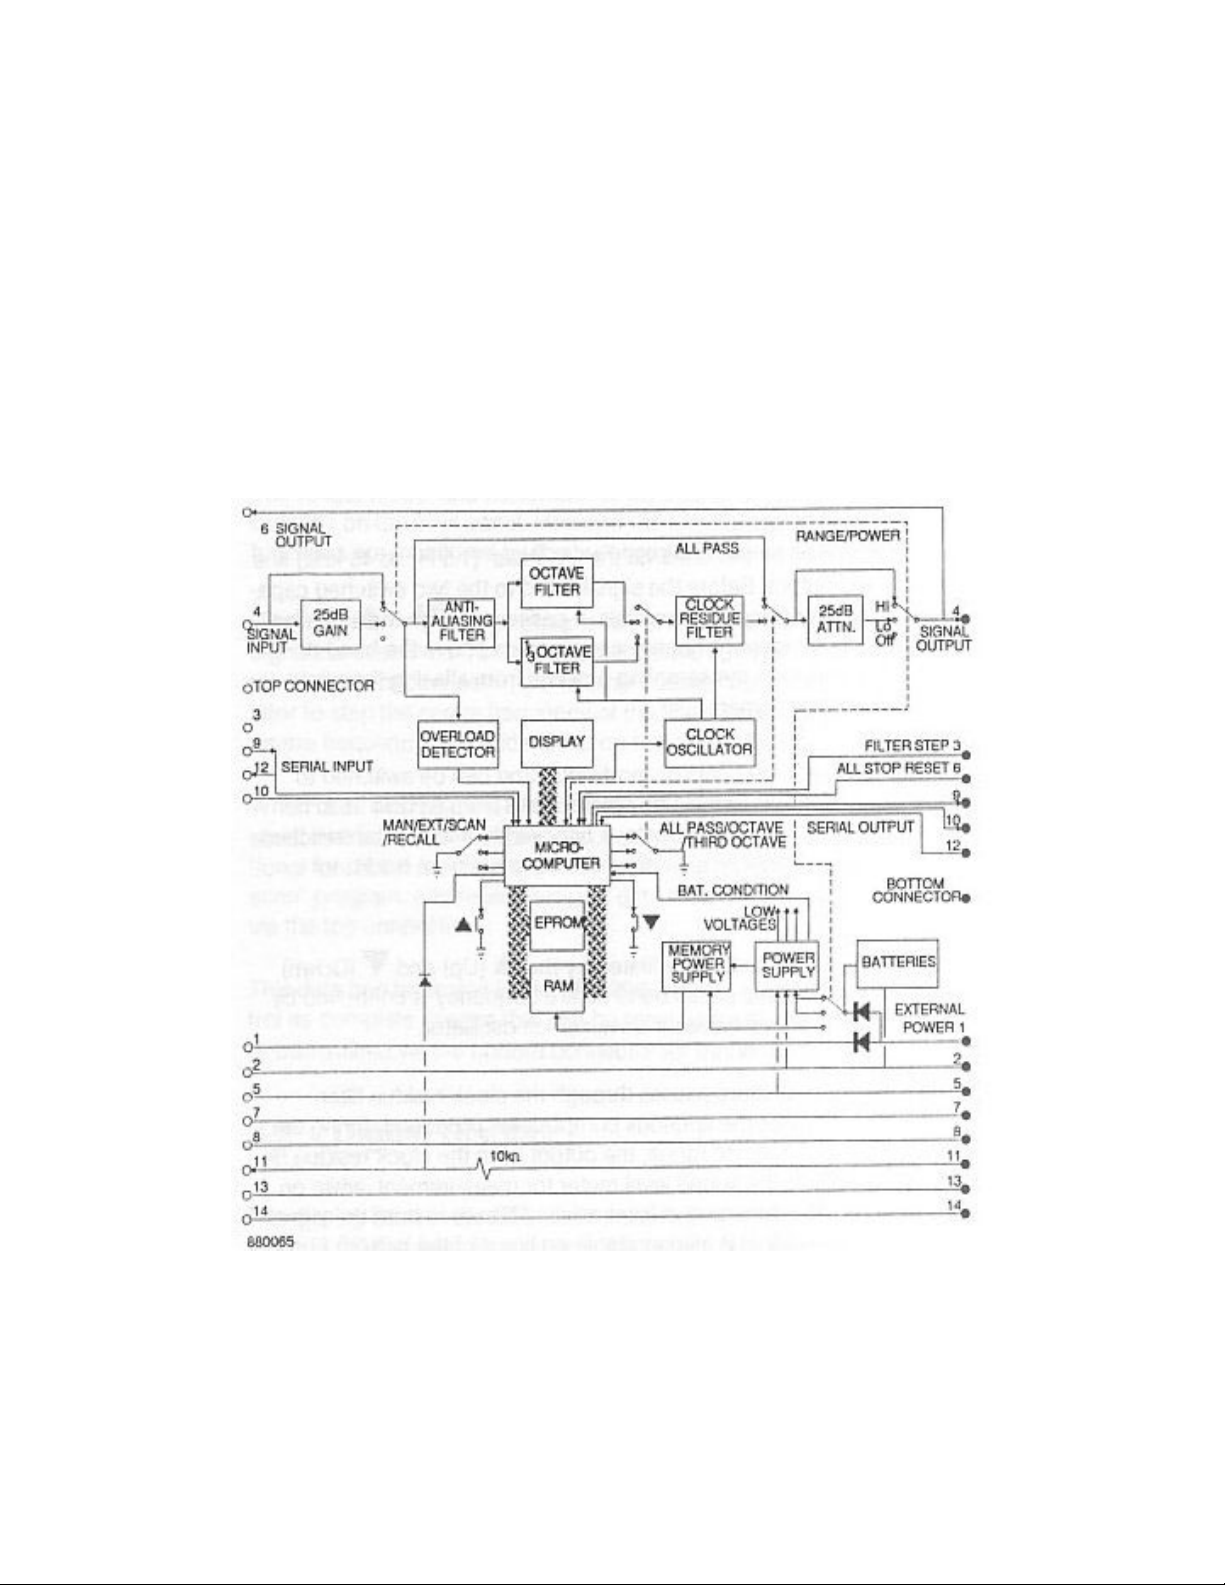
The interior components of the CEL-296/3 are organized into two
main functional areas, as shown in the block diagram (Figure 1).
Frequency filtering is performed by the signal processing area, while
the control system manages the filter scanning, feeds data to the
display, and organizes data storage and recall.
Figure 1: Block diagram of the CEL-296/3
CEL Instruments Ltd CEL-296/3 Operator Handbook Page 11

3.1.1 Signal Processing & Filters
The CEL-296/3 is designed to be mounted close coupled to the
bottom of a CEL sound level meter. it receives signals to be filtered
via line 4 of the connector in the top of the instrument case, and
returns them to the meter for measurement via line 6 of the same
connector.
On "Hi" range the input signal passes directly to the anti-aliasing
filter and thence to the selected octave or third octave filter unit. On
"Lo" range, 25 dB of gain is added to raise the signal level well
above the noise floor.
The input can also be switched via the "All Pass" (1.5 Hz to 45 kHz)
line directly to the output. Before the signal is fed to the two switched
capacitor filter units for frequency analysis, it passes through the
anti-aliasing filter which removes frequency components above the
band of interest. This prevents the sampling process from aliasing
them into the band for measurement.
One filter unit has a one octave bandwidth, and can be switched to
give 12 centre frequencies in one octave steps from 8 Hz to 16 kHz
The other filter unit has a third octave bandwidth, and can be
switched to give 36 centre frequencies in third octave steps from 6.3
Hz to 20 kHz.
Centre frequency selection is initiated by the
(Up) and
(Down) push buttons, while the actual band centre frequency is
controlled by pulses from the microprocessor driven clock
oscillator.
The output from the filters passes through the clock residue filter
which further reduces the spurious components produced during the
sampling process. On "Hi" range, the output from the clock residue
filter is fed directly to the sound level meter for measurement, while
on "Lo" range 25 dB of attenuation is introduced first to restore the
signal level. This output signal is also available on line 4 of the
bottom connector for transmission to some other measuring or
Page 12 CEL-296/3 Operator Handbook CEL Instruments Ltd

recording device.
The overall frequency response of the CEL-296/3 satisfies the
requirements of IEC 225 for octave and third octave filters, and ANSI
S1.11-1966 (R 1975) Class II for octave filters and Class III for third
octave filters (best classes). Figures 2 and 3 represent typical
response curves for octaves and third octaves respectively. These
curves were produced by using a CEL-493/2 Sound Level Meter to
measure the response for all bands, and then averaging the results.
3.1.2 Control System
The range, mode, and bandwidth of the instrument are set manually
by controls on the front panel. However, all internal and external
control functions are monitored by the built in microprocessor.
When the
or nudge buttons are pressed, or band step control
signals are received from an external device such as a level recorder
via the bottom connector, the microprocessor controls the clock
oscillator to step the centre frequency of the filter band. The selected
band centre frequency will be identified on the digital display.
When used with a sound level meter equipped with the CEL low
power serial interface, the microprocessor can also perform several
additional functions. It controls the filter scanning by means of an
"autoscan" program, and receives digital data from the sound level
meter via the top connector.
This data can be stored in the CEL-296/3 under microprocessor
control as complete spectra that can be recalled for display at a later
time, or transmitted via the bottom connector for further processing.
3.2 Digital Display
The display fitted to the CEL-296/3 Autoscan Filter Set is a custom
designed LCD that has clear, easy to read digits (see Figure 4). As
in normal operation the instrument will be used close coupled to a
CEL Instruments Ltd CEL-296/3 Operator Handbook Page 13
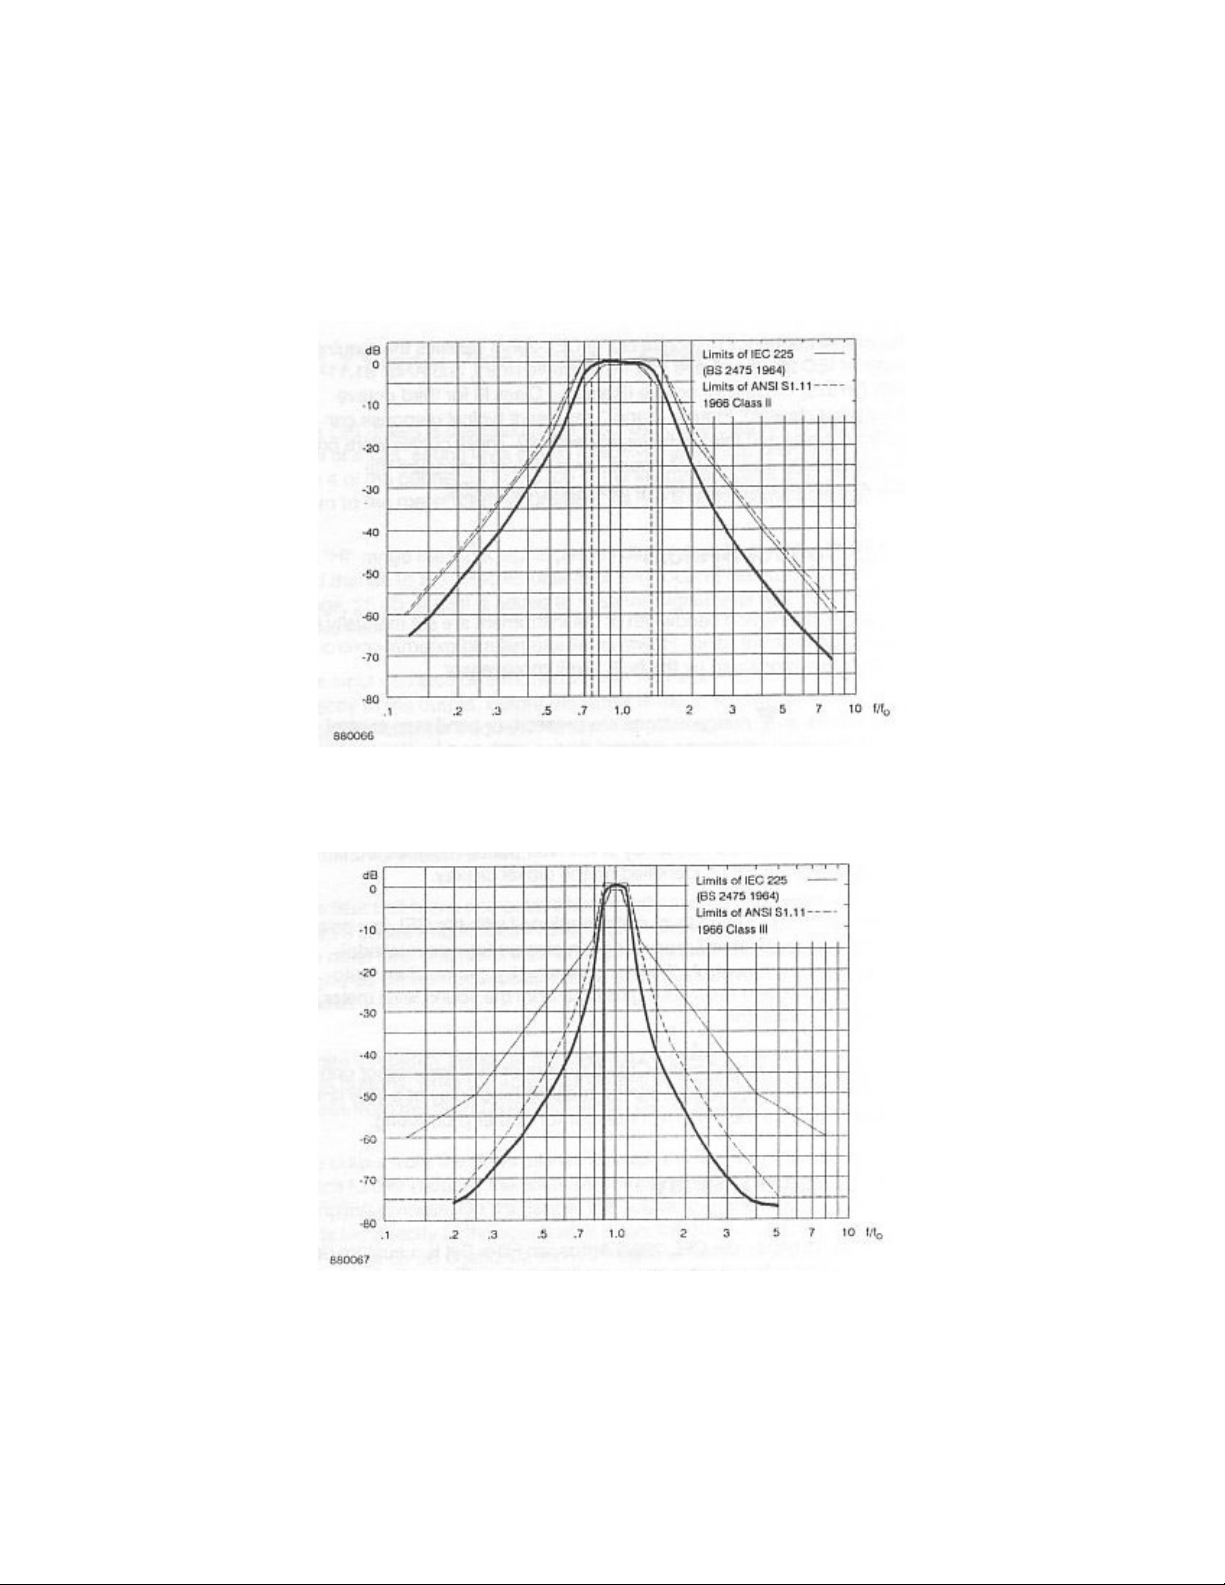
Figure 2: Typical octave filter response curve
Figure 3: Typical third octave filter response curve
Page 14 CEL-296/3 Operator Handbook CEL Instruments Ltd
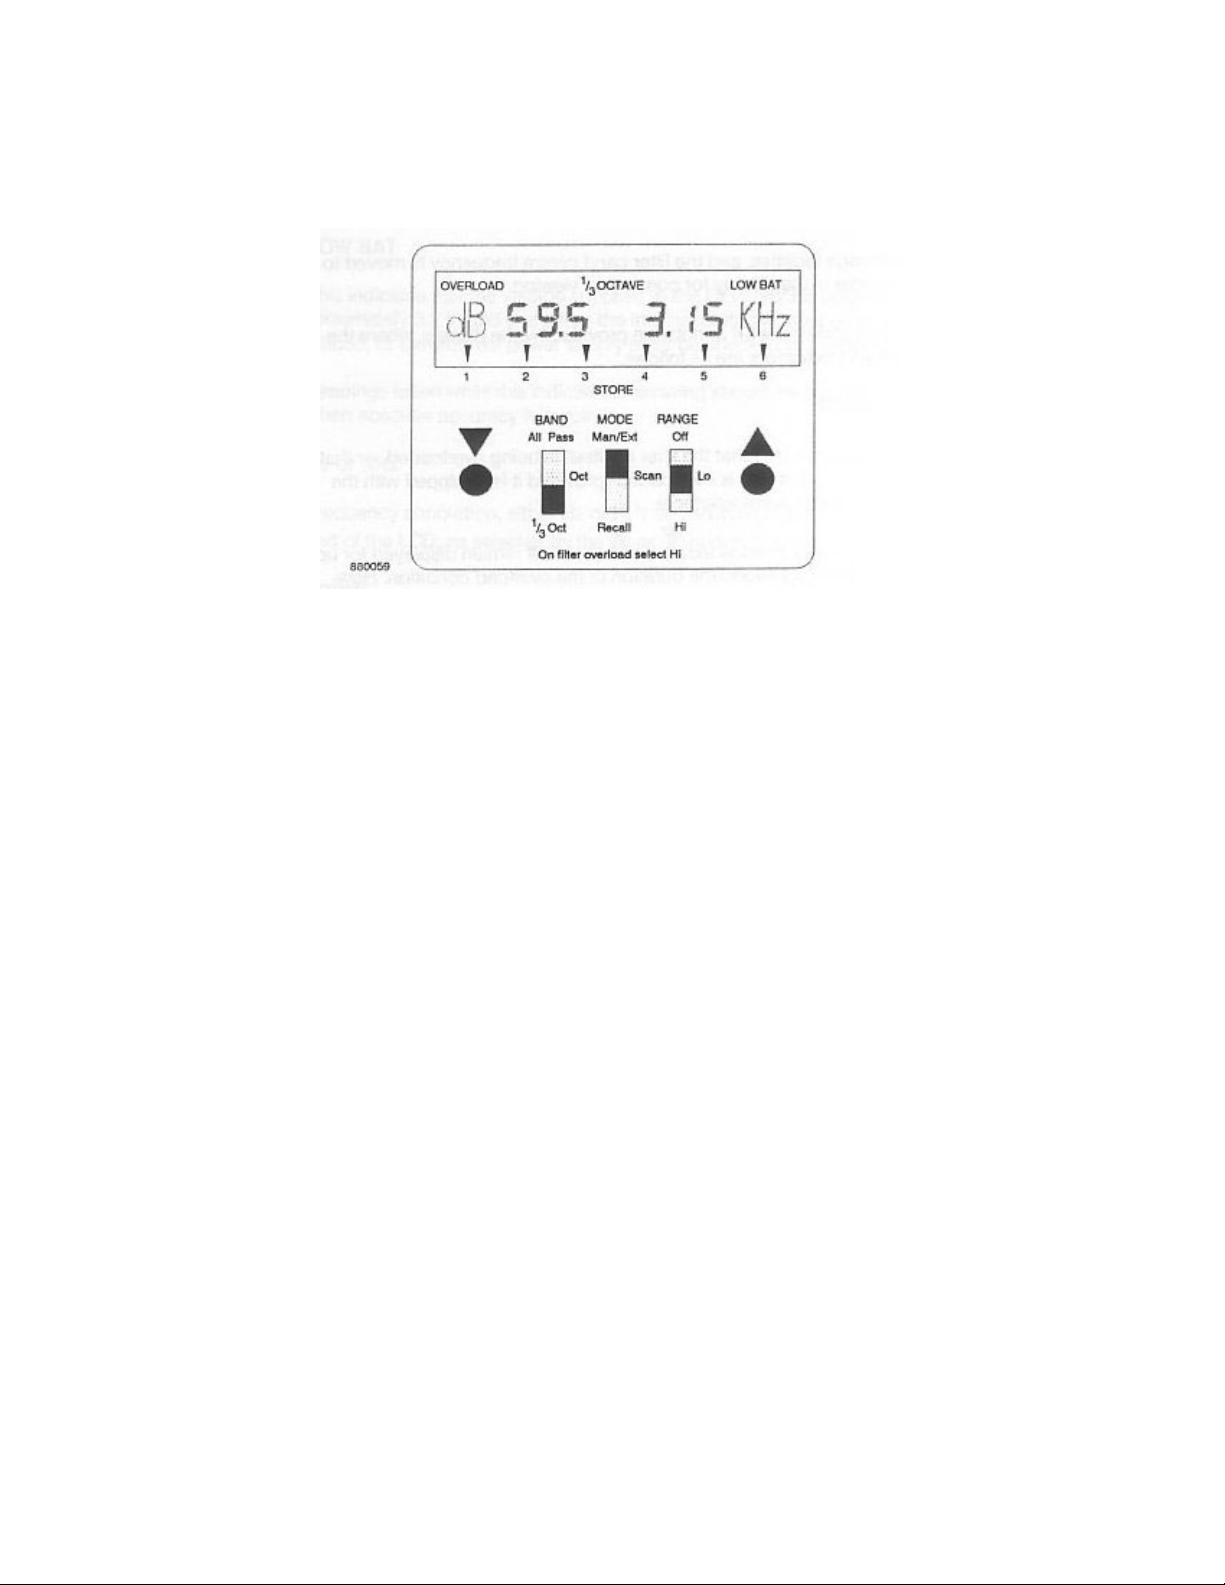
Figure 4: Control panel and display showing all indicators
(All indicators will be displayed at the same time only at start up)
CEL sound level meter, the viewing angle has been selected to
optimize the clarity and legibility of the reading when hold slightly
away from the Operator's body as required by the relevant
measurement standards. or when fitted to the CEL-4627 Tripod.
When operating with a sound level meter equipped with the CEL low
power serial interface, the filter band centre frequency is presented
on the right hand side of the display, and sound level (repeated from
the sound level meter) on the left. This avoids dividing the Operator's
attention between two displays during analysis, and eliminates the
need for a sound level meter to be connected when recalling stored
results.
Sound level meter displays can also show other parameters such as
battery level, elapsed time, or event threshold values, that are not
noise levels. At such times, the reading may be repeated to the filter
set, but the dB indication will be suppressed as an indication that
they should be ignored.
When used with a sound level meter (or other instruments) NOT
equipped with the interface, there are neither repeated sound levels
CEL Instruments Ltd CEL-296/3 Operator Handbook Page 15

nor storage facilities, and the filter band centre frequency is moved
to the middle of the display for convenient viewing.
Figure 4 shows the full annotation provided by the display, where
the remaining indicators are as follows.
OVERLOAD
This indicates either that the filter set itself is being overloaded, or
that the sound level meter is overloaded (provided it is equipped
with the CEL low power serial interface).
If the filter set is overloaded, the indication will remain displayed for
up to two seconds beyond the duration of the overload condition.
However, when triggered by the overload indicator in the sound
level meter, the indication will be cleared only when the sound level
meter condition is cleared.
When OVERLOAD is indicated during an autoscan, the scan is
interrupted, and restarted from the first band to ensure that only
valid data is stored in the memory. If OVERLOAD is indicated
during a manual or remotely stepped measurement, the instrument
settings must be corrected to remove it from the display. Either
select a higher range on the sound level meter, or move the filter set
range switch from "Lo" to "Hi".
1 /3 OCTAVE
This shows that the selected bandwidth for measurement is set to
1/3 octaves stepping at 1/3 octave intervals, or that the recall of
stored spectra is from the 1/3 octave memory bank (see Spectrum
Storage Facilities below).
OCTAVE
This shows that the selected bandwidth for measurement is set to
octaves stepping at octave intervals, or that the recall of stored
spectra is from the octave memory bank (see below).
Page 16 CEL-296/3 Operator Handbook CEL Instruments Ltd

LOW BAT
This indicates that the voltage supplied to the CEL-296/3 is below
approximately 3.2 V. and that either the internal batteries must be
replaced, or the external power supply must be checked or
changed.
Readings taken while this indicator is showing should be
discounted when absolute accuracy is required.
Hz or KHz
Frequency annotation, either Hz or KHz is displayed at the right
hand end of the LCD, as selected by the
or nudge buttons.
Arrows
Six arrow markers along the bottom of the display that indicate
which current memory has been selected.
During the start up sequence, the arrows show which memory
locations have a set of data already stored,
dB
Level annotation, this is displayed at the left hand end of the LCD
only when the filter set is used with a sound level meter fitted with
the CEL low power serial interface, (unless non-noise parameters
are being displayed, at which time the readings are invalid).
3.3 Autoscan & Spectrum Storage Facilities
These facilities are available ONLY when the instrument is
operated with a CEL sound level meter equipped with the low
power serial interface.
The CEL-296/3 can be operated under the control of its
microprocessor to perform autoscan analysis and store the
CEL Instruments Ltd CEL-296/3 Operator Handbook Page 17

measurements in digital form, or the filters may be stopped
manually by means of the
or nudge buttons. Both autoscan
and manual analysis can be performed with both octave or third
octave filter bandwidths, as selected by the BAND switch.
The filter set contains six digital storage locations, each of which
can be used to store one complete measured octave spectrum
PLUS one complete third octave spectrum, resulting in a possible
total of twelve stored spectra. Five of these locations are for use in
autoscan mode, which records only Leq data, while the remaining
location can store one each of manually switched octave and third
octave spectra, which may be SPL, Leq, Lmax, LTm. LOSHA. or
LDOD data.
Stored spectra are retained in memory even when the instrument is
switched OFF, provided the internal batteries are not removed (or
any external power source disconnected). This feature enables the
power to be switched off to conserve internal battery life.
3.3.1 Manual Storage
When used in manual mode, the level in each frequency band is
stored in location 1 as soon as the
(or ) button is pressed to
move on to the next band. This allows the Operator to watch the
display and determine the correct moment to store the result.
3.3.2 Autoscan Storage
In autoscan mode, all control adjustments to the filter set must be
made with the sound level meter "Paused". The first scan begins as
soon as the "Pause" is released, and subsequent scans may be
initiated in the same way.
A new scan can also be started by pressing the
button, and this
will be stored in the next higher numbered location overwriting any
previously stored data. If the
Page 18 CEL-296/3 Operator Handbook CEL Instruments Ltd
button is pressed while location 6

is indicated the instrument returns to location 2 for data storage.
Similarly, pressing the
button starts a scan that will be stored in
and overwrite the next lower location, and if this button is pressed
while location 2 is indicated, the instrument wraps to location 6.
If required, the desired memory locations (2 to 6) can be specified
by setting the BAND switch to "All Pass", using the
or buttons
to position the pointer on the display against the store identity, then
returning the BAND switch to the required bandwidth.
When the autoscan commences, the first band selected is always
the "All Stop" band (indicated on the display by "ALL"). This is an
internally connected setting used only to check whether the sound
level meter is correctly switched for use with an external filter. In this
band, the input signal is grounded so that the microprocessor can
determine a base level. Note that the level measured in this band will
not be stored permanently.
The scan then moves on to the "All Pass" band (while still indicating
"ALL") where the signal level is measured again, and compared with
the level in the "All Stop" band. The autoscan is allowed to proceed
through to completion ONLY when there is a difference in signal
level between the two bands GREATER than 10 dB. Should the
difference be less than 10 dB, the "Err' message will be displayed. If
the message is displayed continuously, the sound level meter is not
set to measure Leq. however when the message blinks, the meter is
not set for use with an external filter (FA or FL).
To ensure that data recorded during the autoscan analysis is always
based on stable readings, the filter set copies the sound level meter
display twice each second and stores an Leq result for the band
only when two consecutive levels differ by no more than 0.1 dB.
Therefore the minimum time that can be spent in each band is one
second two samples), and in practice this will depend on the
variability of the Leq of the input signal. Tests using a pink noise
source (equal energy per octave or third octave band) give typical
autoscan times of 30 seconds for octave analysis, and 90 seconds
for third octave analysis.
CEL Instruments Ltd CEL-296/3 Operator Handbook Page 19
It is recommended that the autoscan mode NOT be used for the
analysis of IMPULSIVE noise. This is best performed under the
manual control of the Operator, using storage location 1.
Once stored, the results from the twelve memory locations may be
brought to the display for examination at any time, and transmitted to
another instrument for print out or data logging. These facilities
become available when the MODE switch is set to "Recall", even
when there is no sound level meter connected.
With the BAND switch on "All Pass", the
and nudge buttons
can be used to select any of the octave or third octave stores for
display. Then moving the BAND switch to "Oct" or 1/3 Oct", stored
results from the complete scan can be displayed by using the
and
buttons.
After the last (highest frequency) band level has been recalled,
pressing the
button again moves the display to the first stored
band from the spectrum in the next highest numbered memory
location. Similarly, if the
button is pressed while in the first band
of a store location, the highest frequency band measurement from
the previous location will be brought to the display.
For print out or data logging, the software in the associated
instrument controls the data transfer. (This data is also shown on the
display, but the transfer rate may be too rapid for visual reading.)
3.4 Control Identities
The functions of the control switches and push buttons on the CEL296/3 are identified by the legends marked alongside them on the
instrument front panel as follows, (see Figure 4).
RANGE: Off-Lo-Hi
This three position slide switch is the main on/off and range control
for the instrument.
Page 20 CEL-296/3 Operator Handbook CEL Instruments Ltd

No functions are performed in the "Off' position, except that any
oLo o
spectra stored in the autoscan memory locations are retained,
provided the batteries are not removed (or an auxiliary power supply
disconnected).
When this switch is moved from the "Off' position to apply power to
the instrument, the microprocessor performs a self checking
procedure.
The start up message "CEL" will appear on the display while some
of the arrow markers may also be shown to indicate which of the
store locations contain octave data. Shortly afterwards the message
changes to "CEL 296" while arrows may appear on the display to
show which store locations contain third octave data. When this test
has been satisfactorily completed, all analysis and band switching
functions become available. Should the instrument fail the self test,
the "Err ALL" error message will be displayed.
Normally when the filter set is used with CEL sound level meters,
(except for the CEL-493/3,/2N, or /2 which have a 100 dB dynamic
range), the CEL-296/3 RANGE switch is set to "Hi" so that the upper
75 dB of its dynamic range is brought into operation.
When used with the CEL-493/3/, 2N, or /2 Sound Level Meters, set
the filter set RANGE switch to the following settings for frequency
analysis:
Level within CEL-493 CEL-296
Freq. Band Range Setting Range Setting
Less than 40 dB Lo Lo
Between 40 and 80 L
r Hi
More than 120 dB Hi Hi
If both instruments are set to Lo range, an overload will be indicated
whenever the linear path (all pass) signal exceeds 80 dB, (refer to
Figure 5). Should such an overload occur, move the filter set
RANGE switch to "Hi' and use the top 75 dB of its range.
CEL Instruments Ltd CEL-296/3 Operator Handbook Page 21
 Loading...