

Page 1
AMPLIFICATION
Precision Melt Analysis™ Software
Quick Guide
Precision Melt Analysis software imports
and analyzes data files generated from a
™,
CFX96
Deep Well
CFX384 Touch
system to genotype samples based on the
thermal denaturation properties of
double-stranded DNA.
Installing Precision Melt
Analysis Software
A computer with either a Windows XP or
Windows 7 operating system is required
to run the software. The software must be
installed on the computer by a user with
administrative privileges.
To install the Precision Melt Analysis software:
1. Place the Precision Melt Analysis software
CFX96 To u ch™, CFX96 Touch
™
, CFX Connect™, CFX384™, or
™
real-time PCR detection
CD in the computer’s CD drive. The software
launch page should appear automatically.
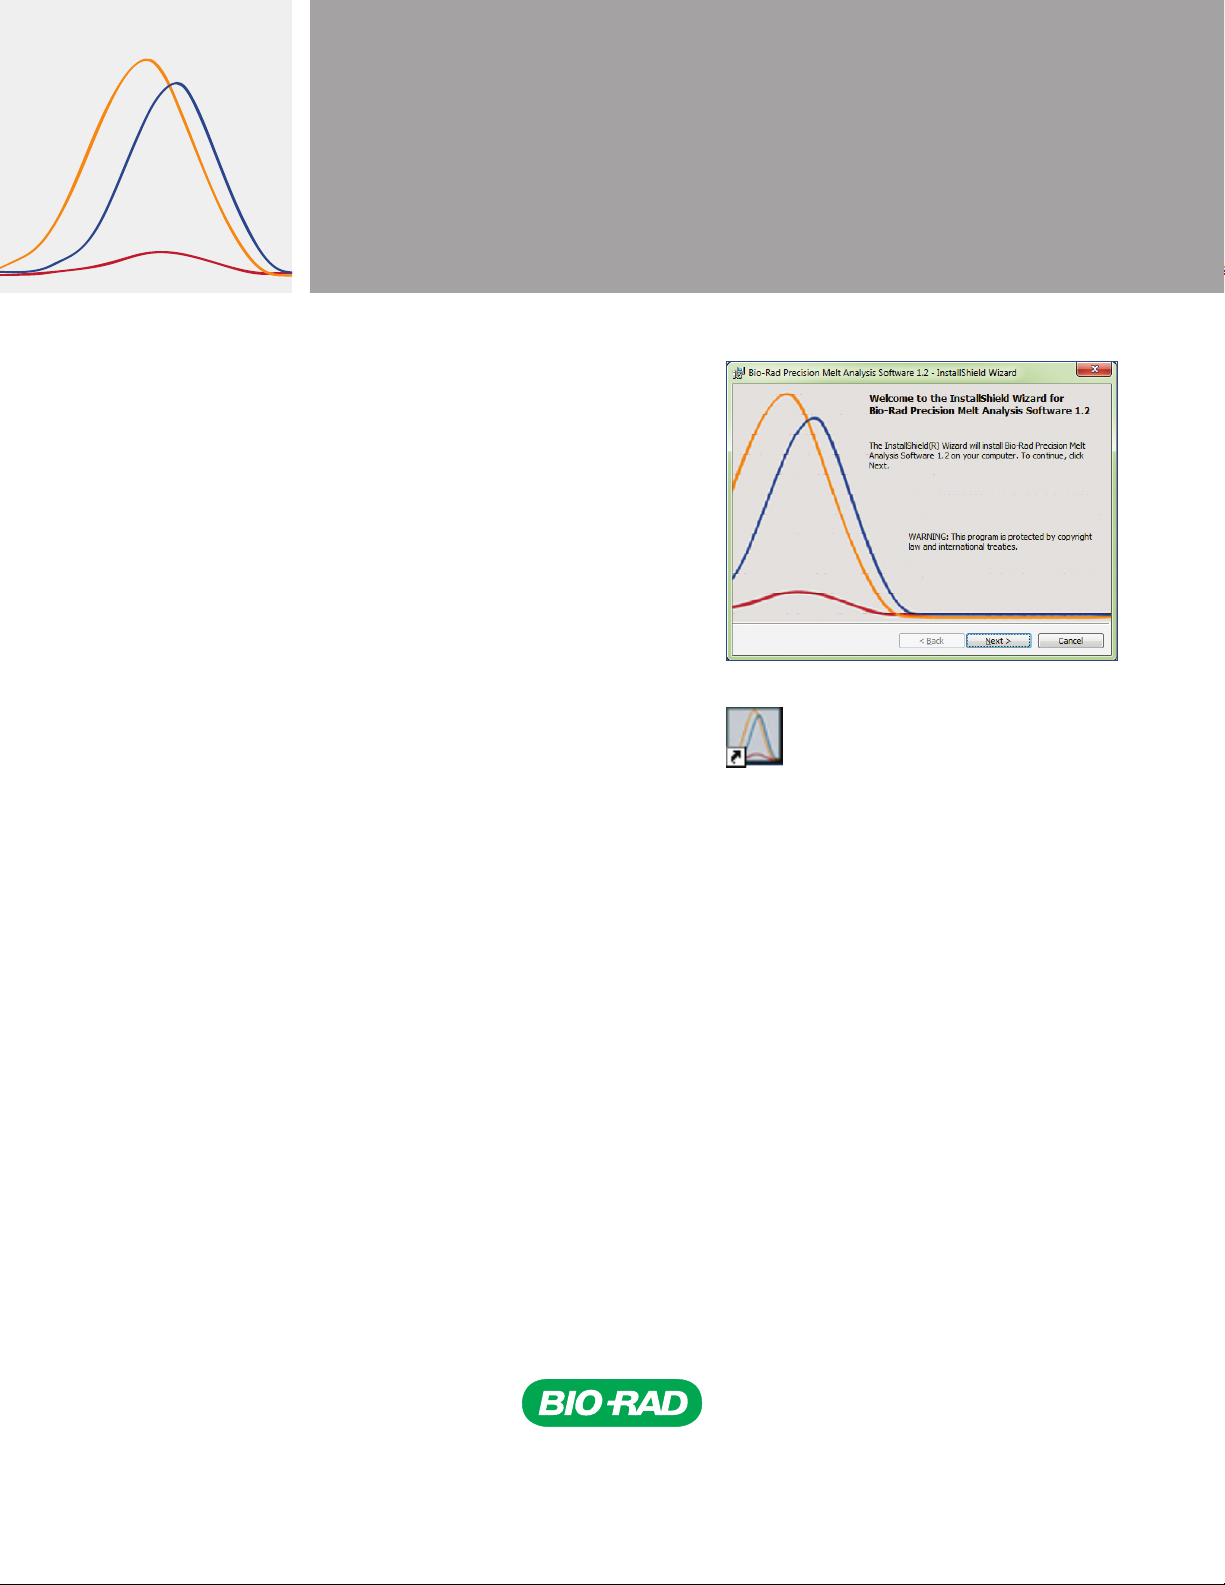
Fig. 1. Welcome screen.
Fig. 2. Desktop software icon.
2. Click Next on the software launch page
(Figure 1).
3. Follow the instructions onscreen to
complete the installation.
4. If the launch page does not appear
automatically, click CD drive, then
open and follow the instructions in the
Readme.txt file.
5. After installation, launch the software
by double clicking the desktop icon
(Figure 2), or select Start > Programs >
Bio-Rad > Precision Melt Analysis.
Page 2
Melt Calibration
Before Precision Melt Analysis software can analyze data generated on
a CFX96, CFX96 Touch, CFX96 Touch Deep Well, CFX Connect, CFX384,
or CFX384 Touch real-time PCR detection system, a melt calibration must
be performed. The procedure requires running an experiment and then
importing the data into Precision Melt Analysis software to generate a melt
calibration file. The software is shipped with a calibration kit that includes
the following materials:
n
Melt calibration DNA standard
n
Melt calibration primers
n
Precision melt supermix (catalog #172-5110)
Additional Materials Required
In addition to the components provided in the melt calibration kit,
the following materials are required:
n
PCR-grade tubes
n
Nuclease-free water
n
Microseal® 'B' adhesive seals, optically clear (catalog #MSB-1001)
n
Hard-Shell® thin-wall 384-well skirted PCR plates with clear shell
and white wells (catalog #HSP-3805) for use with a CFX384 or
CFX384 Touch system
n
Hard-Shell thin-wall 96-well skirted PCR plates with white shell and
clear wells (catalog #HSP-9601) or white wells (catalog #HSP-9655)
for use with a CFX96, CFX96 Touch, CFX96 Touch Deep Well, or
CFX Connect system
Preparing a Melt Ca libration Plate
1. Add the required volume of each component to an appropriately
sized tube (Table 1).
2. Cap the tube and gently mix the reaction components by vortexing.
3. Briefly centrifuge the tube to remove air bubbles and collect
contents at the bottom of the tube.
4. Add the appropriate volume of the mixture into each well of a
reaction plate:
n
For a CFX96, CFX96 Touch, CFX96 Touch Deep Well, or
CFX Connect system, add 20 µl of the reaction mixture to each
well of a 96-well plate
n
For a CFX384 or CFX384 Touch system, add 10 µl of the reaction
mixture to each well of a 384-well plate
5. Seal the reaction plate with a Microseal 'B' adhesive seal. Centrifuge
the plate at 1000 x g for 2 min to move all the reaction components
to the bottom of the wells.
Performing a Melt Calibration Experiment
A melt calibration experiment is run on a CFX96, CFX96 Touch,
CFX96 Touch Deep Well, CFX Connect, CFX384, or CFX384 Touch realtime PCR detection system and analyzed using CFX Manager
™
software.
To run a melt calibration to generate a melt calibration data file:
Table 1. Reac tion setup for a melt calibration plate.
Volume for Volume for
Component CFX96 System CFX384 System
Precision melt 1,200 µl 2,250 µl
supermix
Melt calibration 120 µl 450 µl
DNA standard
Melt calibration 14.4 µl 27 µl
primers
Nuclease-free water 1,065.6 µl 1,773 µl
Total 2,400 µl 4,500 µl
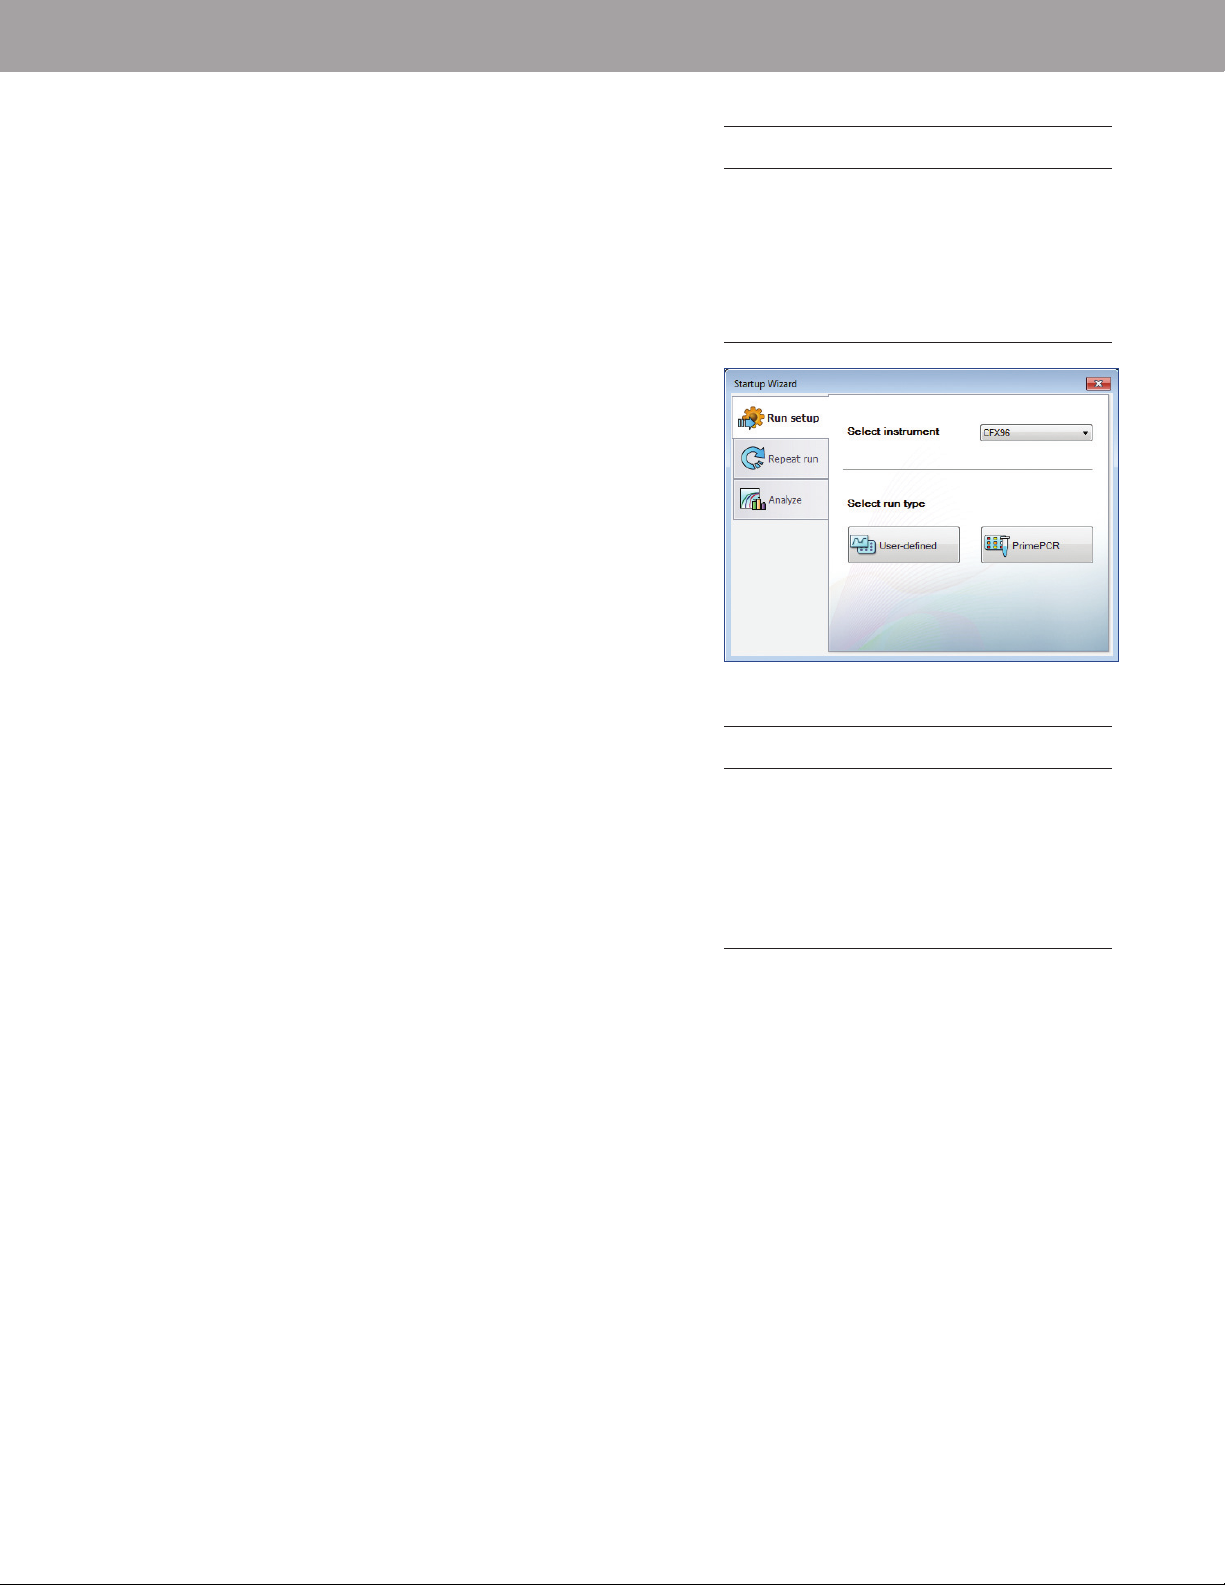
Fig. 3. Startup Wizard in CF X Manager software.
Table 2. Melt calibration PCR protocol.
Number
Cycling Step Temperature T ime of Cycles
Enzyme activation 98°C 2 min 1
Denaturation 98°C 5 sec
Annealing/extension 55°C 10 sec
95°C 1 min 1
70°C 1 min 1
Melt curve 70– 95°C 10 sec/step 1
(in 0.2°C
increments)
35
1. Turn on the CFX system.
2. Double click the CFX Manager software desktop icon to launch
the software.
3. Select User-defined from the Run setup tab of the Startup Wizard
(Figure 3) to launch the Run Setup window.
Page 3

4. In the Protocol tab, select Create New to open the Protocol Editor.
5. Create the protocol in Table 2.
6. Click OK to save the protocol and return to the Run Setup window.
7. Click the Plate tab.
8. Click the Select Existing > Sample files > MeltCalibration fo lde r,
select the appropriate plate name based on your instrument and plate
type, then click Open.
n
For a 96-well system, select Melt Calibration Plate_96 wells_
Clear or Melt Calibration Plate_96 wells_White
n
For a 384-well system, select Melt Calibration Plate_
384 wells_White
9. Click the Start Run tab.
10. Select the instrument in the Start Run on Selected Blocks list
by clicking the checkbox to the left of the instrument name.
11. Load the melt calibration plate into the instrument.
12. Click Start Run to begin running the experiment on the
selected block.
13. At the prompt, save the name of the melt calibration data file as
Melt Calibration_run date, for example, Melt Calibration_081412.
14. When the melt calibration run is complete, CFX Manager
software automatically opens and processes the data file.
Check the data file to ensure all wells display a tight
amplification and a single melt peak (Figure 4).
Importing a Melt Calibration File
Precision Melt Analysis software is used to open data files that
have been generated from an experiment performed on a CFX96,
CFX96 Touch, CFX96 Touch Deep Well, CFX Connect, CFX384, or
CFX384 Touch real-time PCR detection system and analyzed using
CFX Manager software. To open and generate a melt calibration
file using Precision Melt Analysis software:
A
B
Fig. 4. Melt calibration data. A, amplification plot; B, melt
curve plot with a single peak.
Fig. 5. Import Melt Calibration file.
1. Launch Precision Melt Analysis software by double clicking
the Precision Melt Analysis software icon on the Desktop.
2. Click Tools > Import Melt Calibration from the Menu bar (Figure 5).
3. Choose the name of the melt calibration experiment data file (.pcrd
extension) and click Open.
4. A window will appear indicating the calibration was successful.
5. Click OK to proceed and use Precision Melt Analysis software.
Page 4

Software Navigation
Double click the desktop icon (Figure 2), or select Start >
Programs > Bio-Rad > Precision Melt Analysis. To navigate
within the software, use the Startup Wizard (Figure 6), which
provides quick access to common software commands found
in the menu bar and the toolbar.
Conver ting a Data File to a Melt File
To convert a data file to a melt file, select Create a new melt file
in the Startup Wizard (Figure 6), or select File > New > Melt File
from the File menu. Choose the data file, then click Open.
To open an existing melt file, select Open a melt file in the
Startup Wizard (Figure 6), or select File > Open > Melt File
from the File menu.
Analyzing and Viewing Data
Precision Melt Tab
When you open a melt file in the Precision Melt Analysis software,
the software uses the default analysis settings to assign a cluster
to each sample. To analyze the data in the different panes:
1. In the Melt Cur ve pane, select the Normalized view checkbox
to compare all the curves with the same starting and ending
fluorescent signal level applied. Two cursors per region are
provided, defaulted to the ends of the curve, as shown in
Figure 7.
2. Optional: In the Melt Curve pane, select Temperature-
shifted view to apply a temperature shift to each normalized
fluorescence curve along the temperature axis (x-axis) (Figure 7).
3. For easy visual identification of clusters, Precision Melt Analysis
software generates a difference curve for each well (Figure 8).
The Difference Curve chart shows the difference in fluorescence
between a well and the fluorescence of a reference curve.
4. Right click the fluorescence trace of a well in the Melt Curve
or Difference Curve chart to change the selected sample or
selected cluster parameters (Figure 9).
Tip: Right click the spreadsheet for options. Export the data
in the spreadsheet by right clicking and selecting the Export to
Excel option.
Fig. 6. Startup Wizard in Precision Melt Analysis software.
Fig. 7. Melt Curve pane.
Fig. 8. Difference Curve pane.
Fig. 9. Changing cluster parameters.
Page 5

Viewing Well Group Data
Use the Well Group dropdown menu on the toolbar to view data for
a specific well group (Figure 10). The software treats well groups as
independent experiments, and each well group can be analyzed
with its own settings.
Viewing Results
Click the Precision Melt Data tab in the Data Analysis window
(Figure 11) to view the numerical data calculations and statistics.
Click any column header to sort rows based on that column.
Right click the spreadsheet and select Sort to sort rows based on
multiple columns. Display data in the following ways:
n
Right click the spreadsheet, and select a format to export
data as a Microsoft Excel, image, XML, or HTML file
n
Select Plate View from the dropdown menu under the
Precision Melt Data tab to display well data in a plate grid format
n
Select Charts from the dropdown menu under the
Precision Melt Data tab to display all charts
Creating a Report
To create a report follow these steps:
1. Click Report on the toolbar of the Data Analysis window
to open the Report window.
2. Click the applicable checkboxes in the report options list
to include specific information in the report, which is displayed
in the preview section (Figure 12).
Fig. 10. Well Group selection.
Fig. 11. Precision Melt Data tab.
3. Click File on the toolbar and select Save to save the report
as a PDF, or select Print to print the report.
4. Save the report template for use with other data files, if desired.
Fig. 12. Report window. Report options list includes
checkboxes for choosing information to include in a report.
Excel, M icrosoft, and Windows a re tradema rks of Micros oft Corpo ration.
Bio-R ad’s real-time thermal cyclers are lice nsed real-time therma l cyclers un der Apple ra’s U.S. Patent Numbe r 6,814,934 B1 for us e in researc h, human in vitro diagnos tics, and all other field s
except veterinar y diagnostics.
Bio-R ad’s real-time thermal cyclers are cover ed by one or more of the followin g U.S. patents or th eir foreign c ounterpa rts owned by E ppendor f AG: U.S. Patent Numb ers 6,767,512 and 7,074,367.
Purchase of precision melt supermix includes an immunity from suit under patents specified in the product insert to use only the amount purchased for the purchaser’s own internal research. No
other patent rights are conveyed expressly, by implication, or by estoppel. Further information on purchasing licenses may be obtained by contacting the Director of Licensing, Applied Biosystems,
850 Linc oln Centre D rive, Foster C ity, Californ ia 94404, USA .
Hard-S hell plates a re covered by one or more of the fo llowing U.S. patents or their foreign cou nterpart s owned by Eppe ndorf AG: U.S. Patent Number s 7,347,977; 6,340,589; and 6,528,302.
Page 6

Bio-Rad
Laboratories, Inc.
Life Science
Group
10014810 Rev C US/EG
Web site ww w.bio-rad.com USA 800 424 6723 Australia 61 2 9914 2800 Austria 01 877 89 01 Belgium 09 385 55 11 Braz il 55 11 5044 5699
Canada 905 364 3435 China 86 21 6169 8500 Czech Repu blic 420 241 430 532 Den mark 44 52 10 00 Finland 09 804 22 00
France 01 47 95 69 65 Germany 089 31 884 0 Greece 30 210 9532 220 Ho ng Kong 852 2789 330 0 Hungary 36 1 459 6100 India 91 124 4029300
Israel 03 963 6050 Italy 39 02 2160 91 Japan 03 6361 7000 Kore a 82 2 3473 4460 Mexic o 52 555 488 7670 The Netherlands 0318 540666
New Zealand 64 9 415 2280 Nor way 23 38 41 30 Poland 48 22 331 99 99 Portugal 351 21 472 7700 Russia 7 495 721 14 04
Singapore 65 6415 3188 South Africa 27 861 246 723 Spain 34 91 590 52 00 Sweden 08 555 1270 0 Switzerland 061 717 95 55
Taiwan 886 2 2578 7189 Thailand 800 88 22 88 United Kingdom 020 8328 2000
12-1307 0812 Sig 1211
 Loading...