

Page 1
RUN PROGRAM
RELAY 1 RELAY 2
RNL Vortex Insertion
Liquid Flow Meter
Installation & Operation Manual09-VRX-UM-00408 (July 2012)
Page 2

2
09-VRX-UM-00408 07/12
Page 3

TABLE OF CONTENTS
INTRODUCTION ................................................................................................................4
INSTALLATION ...................................................................................................................5
Mechanical Installation ...........................................................................................................................5
Installation Location ............................................................................................................................................................... 5
Back Pressure Calculations .....................................................................................................................7
Electrical Installation ...............................................................................................................................9
Wiring ........................................................................................................................................................................................10
Pulse Output ........................................................................................................................................................................... 11
Cable Installation ................................................................................................................................................................... 11
+ 4-20 mA Terminals ............................................................................................................................................................. 11
OPERATING THE MONITOR ............................................................................................13
Basic Programming Mode .....................................................................................................................13
Additional Scaling Parameters .............................................................................................................15
Totalizer Functions ................................................................................................................................17
TROUBLESHOOTING .......................................................................................................18
APPENDIX ........................................................................................................................20
Additional Installation Requirements ...................................................................................................20
Introduction ............................................................................................................................................................................20
Turbulence ...............................................................................................................................................................................20
Swirl ............................................................................................................................................................................................20
Sonic Noise ..............................................................................................................................................................................21
Velocity Pro le for RNL Insertion Meters ....................................................................................................................... 21
Straight-Run Piping Considerations ................................................................................................................................21
Temperature and Pressure Tap Locations .....................................................................................................................22
RNL Insertion Style Meter Installation ............................................................................................................................22
Hot Tap Insertion Flow Meter Installation ............................................................................................22
Maximum Fluid Velocity ......................................................................................................................................................23
Flow Pro ling .........................................................................................................................................25
Reducing the Pipe Diameter ..................................................................................................................26
SPECIFICATIONS .............................................................................................................27
PIPE TABLES .....................................................................................................................28
WARRANTY ......................................................................................................................33
09-VRX-UM-00408 07/12
3
Page 4

FIGURES
FIGURE 1 VON KARMAN VORTEX STREET ............................................................................................4
FIGURE 2 BACK PRESSURE CALCULATIONS .........................................................................................7
FIGURE 3 OUTLINE DIMENSIONS FOR RNL SERIES .............................................................................8
FIGURE 4 FLOW METER TERMINAL FUNCTIONS .................................................................................9
FIGURE 5 LOAD RESISTANCE VS. SUPPLY VOLTAGE ..........................................................................10
FIGURE 6 DEDICATED POWER SUPPLY HOOKUP ..............................................................................11
FIGURE 7 LOOP POWER HOOKUP .......................................................................................................12
FIGURE 8 RNL SEPARATE POWER AND RECEIVER HOOKUP ............................................................12
FIGURE 9 420 mA TEST SETUP ............................................................................................................15
FIGURE 10 PROGRAMMING MENU MAP .............................................................................................19
FIGURE A1 TURBULENCE ......................................................................................................................20
FIGURE A2 SWIRL ..................................................................................................................................20
FIGURE A3 SONIC NOISE ......................................................................................................................21
FIGURE A4 HOT TAP CUTAWAY ............................................................................................................22
FIGURE A5 HOT TAP DIMENSIONS ......................................................................................................23
FIGURE A6 INSERTION DEPTH .............................................................................................................24
FIGURE A7 MAKING REDUCTIONS OR ENLARGEMENTS ..................................................................26
TABLES
TABLE 1 MINIMUM PIPING REQUIREMENTS ........................................................................................6
TABLE 2 FLOW RANGES ..........................................................................................................................6
TABLE 3 LINE RESISTANCE FOR CURRENT LINES ...............................................................................10
TABLE 4 EXPONENT MULTIPLIERS ......................................................................................................14
TABLE A1 INSERTION DEPTH ...............................................................................................................24
TABLE A2 FLOW PROFILE RAW DATA ...............................................................................................25
TABLE A3 FLOW PROFILE NORMALIZED DATA ................................................................................25
TABLE A4 STEEL, STAINLESS STEEL, P.V.C. PIPE STANDARD CLASSES .........................................28
TABLE A5 CAST IRON PIPE STANDARD CLASSES ............................................................................30
TABLE A6 DUCTILE IRON PIPE STANDARD CLASSES ......................................................................31
TABLE A7 TUBING SCHEDULES ...........................................................................................................32
4
09-VRX-UM-00408 07/12
Page 5

INTRODUCTION
The RNL vortex shedding ow meters are designed to provide accurate and repeatable liquid ow measurements in a variety
of common ow measurement applications. The ow meters employ a patented ultrasonic technique to measure a form of
turbulence created in the ow stream. This turbulence, know as a Von Karman Vortex Street, is related to the volumetric ow
through a full pipe.
An everyday example of a vortex shedding phenomenon is a ag waving in the breeze: the ag waves due to the vortices
shed by air moving across the
agpole.
Within the ow meter, as a uid
moves across a strut or “blu body”,
vortices are also shed but on a
smaller scale. The vortices form
alternately, from one side to the
other, causing pressure uctuations.
The alternating pressure changes are
detected by the piezoelectric crystals
in the sensor tube, and are converted
to an analog signal or pulse output.
The frequency of the vortices is
directly proportional to the ow. This
results in extremely accurate and
repeatable measurements with no troublesome moving parts (see Figure 1).
Bluff
Body
Ultrasonic
Beam
Transmitter
T
R
Receiver
FIGURE 1 VON KARMAN VORTEX STREET
Counter
The ow meters primary output is a 4-20 milliampere (mA) current. The value of the current output is proportional to the ow
rate. The secondary output is a pulse train whose frequency is directly proportional to the ow.
Each RNL ow meter is calibrated against ow standards traceable to NIST (National Institute of Standards and
Technology).
The RNL ow meter is an insertion style retractable ow meter, for pipe sizes 4 inches (102 mm) and larger. The meter is
usually installed through a 2 inch full port isolation valve (See Figure A4), which permits the meter to be retracted or inserted
without shutting down the system.
The RNL series ow meters are calibrated in actual volumetric ow rates, such as gallons per minute (GPM) and comes with a
standard rate and total display.
09-VRX-UM-00408 07/12
5
Page 6

INSTALLATION
MECHANICAL INSTALLATION
The ow meter is shipped completely assembled, tested and ready to install and operate in its permanent location. See Figure
3 for the applicable outline dimensions for the ow meter. See the Appendix for additional installation information.
Installation Location
The RNL series ow meters use a combination of ultrasonic and vortex shedding technologies to measure volumetric ow. An
ultrasonic noise source can interfere with this technique, therefore the meter should not be installed near high intensity ultrasonic
noise sources. Common ultrasonic noise sources include the following:
» Slightly open valves operating with large pressure drops.
» Small pipe leaks in high pressure systems.
» Venturis operating at near-sonic ow rates.
» Sonic nozzles.
If these ultrasonic noise sources cannot be eliminated, the meter should be mounted with at least one elbow between the ow
meter and the noise source remembering to keep in mind the straight pipe run requirements as described next.
The sensor should be installed with at least 20 pipe diameters of straight pipe upstream and 10 pipe diameters downstream.
This condition provides a fully developed, symmetrical ow pro le that is necessary to obtain accurate and repeatable results.
Shorter upstream/downstream piping may be used, although a shift in calibration may occur. If severe turbulence or distorted
ow pro les are present, ow straighteners should be used. Consult factory for shorter upstream/downstream con gurations.
When installing the ow meter in a newly constructed process line, a strainer should be installed upstream of the meter to
prevent foreign material from damaging the meter strut or obstructing the ow. Damage to the strut could a ect the accuracy
of the meter.
In order to prevent cavitation, it is important that the required back pressure be maintained. The minimum required back pressure
varies with temperature. See the back pressure calculations in Figure 2. The sensor should be installed using the minimum piping
requirements indicated in Table 1.
Maximum volumetric ows are determined by the inside diameter of the pipe and the velocity of the uid being measured.
Calculations of minimum and maximum ow ranges are based on the pipe being full at all times. See Table 2 for ow ranges in
common pipe sizes.
BACK PRESSURE CALCULATIONS
At high ow rates, cavitation may occur, causing a ow meter to be inaccurate. Cavitation can be prevented by increasing the
back pressure. The following equation determines the minimum back pressure required to prevent cavitation:
P1 = PVP + 0.03 V
where: P1 = line pressure at the meter PSIA
P
V = line velocity FPS
EXAMPLE: In water at 65° F owing with a speed of 25 fps, the vapor pressure is 0.3 PSIA.
P1 = 0.3 + 0.03 (25)2 = 19.05 PSIA If atmospheric pressure is 14.69 PSIA,:
Then P1 = 19.05 PSIA - 14.69 PSIA = 4.36 PSIG
= vapor pressure of the liquid PSIA
VP
²
Maintaining a back pressure of 5 PSIG or greater will prevent cavitation.
FIGURE 2 BACK PRESSURE CALCULATIONS
6
09-VRX-UM-00408 07/12
Page 7
Upstream Obstruction
90° Elbow 10
Two 90° Elbows, Same Plane 15
Two 90° Elbows, Di erent Planes 20
Flow Straightener
(recommended when ever an axial swirl exists in the ow stream)
Fully Open Shut-o Valve 5
Minimum Required Straight-run Pipe
Diameters Upstream from Meter
10
Downstream Obstruction
Control Valve 5
Minimum Required Straight-run Pipe
Diameters Downstream from Meter
TABLE 1 MINIMUM PIPING REQUIREMENTS
NOMINAL SIZE
INCH (mm)
4.0 (100) 79 635 300 2,403
6.0 (152) 180 1441 682 5,454
8.0 (203) 312 2,495 1,181 9,444
10.0 (254) 492 3,933 1,861 14,886
12.0 (305) 698 5,582 2,641 21,130
14.0 (356) 843 6,746 3,192 25,537
16.0 (406) 1,102 8,813 4,170 33,360
18.0 (457) 1,394 11,155 5,278 42,226
20.0 (508) 1,733 13,864 6,560 52,481
Based on water at 1 centistoke at 73° F, schedule 40 pipe 1 to 20 fps (0.3 to 6 mps). For reference only, consult sizing
program for temperature and pressure conditions other than those listed here.
GALLONS PER MINUTE (gpm) LITERS PER MINUTE (lpm)
Minimum Flow Maximum Flow Minimum Flow Maximum Flow
TABLE 2 FLOW RANGES
09-VRX-UM-00408 07/12
7
Page 8
RUN
R
ELAY
1
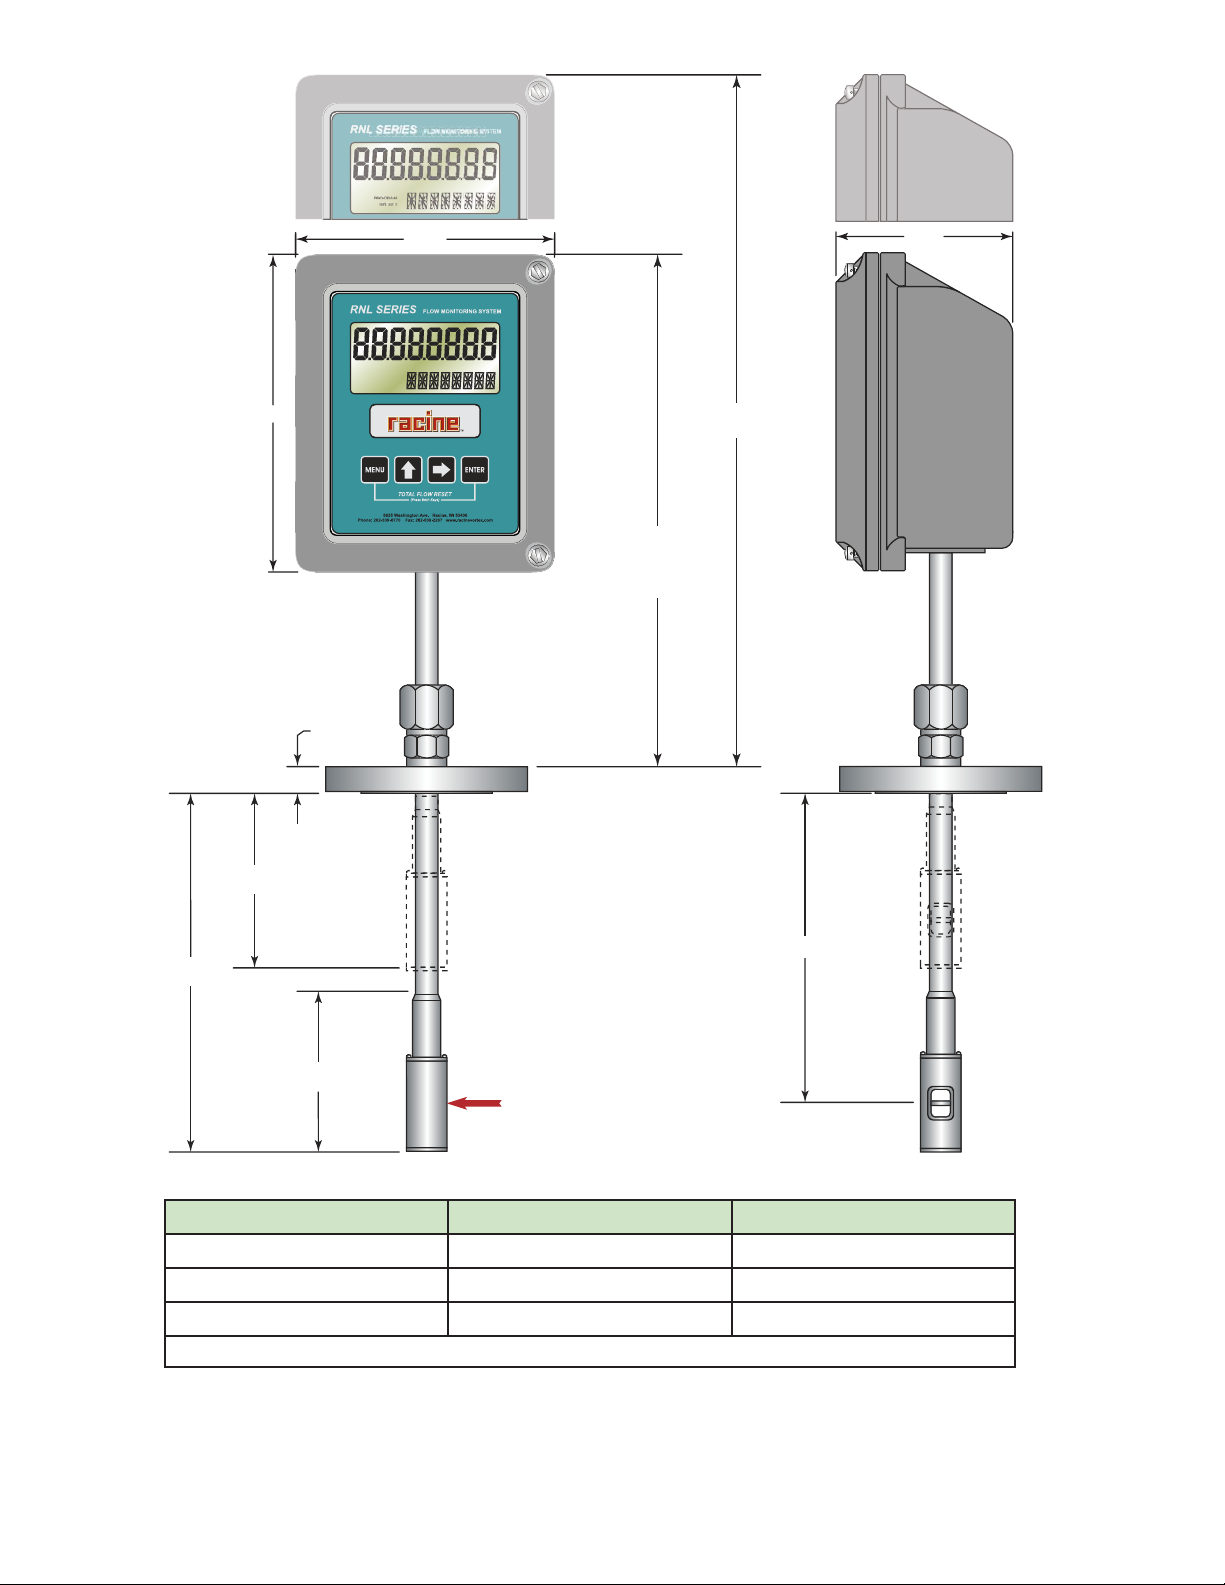
7.00"
.75"
RUN PROGRAM
RELAY 1 RELAY 2
5.75"
9.75" Maximum
at Maximum
Insertion
C Maximum
Retracted
3.93"
4.00" Maximum
Retracted
B Maximum
Insertion
4.50"
Maximum
ABC
12.00 (305) 13.125 (333) 18.83 (478)
24.00 (610) 25.125 (638) 30.83 (783)
36.00 (914) 37.125 (943) 42.83 (1088)
All dimensions are in inches (mm)
FIGURE 3 OUTLINE DIMENSIONS FOR RNL SERIES
A
Flow
8
09-VRX-UM-00408 07/12
Page 9

The RNL Series ow meters are designed to mount on a standard ANSI 150 lb., 2” pipe ange. It is recommended that the customer
conduct a ow pro le survey and place the probe at the optimum point. The labeling of the ow direction on the sensor should
be aligned with the ow in the pipe. Maximum insertion depth is a product of pipe size and uid velocity, see Appendix Table
A1 for Insertion Depth Chart.
CAUTION: Avoid bending the vortex strut or damaging the transducers during installation. The torque value for
the Conax tting is 90-100 ft. lbs.
NOTE: See Appendix for further information on installation.
ELECTRICAL INSTALLATION
TP1
TP2
TP3
TRANSDUCER
CONNECTIONS
White
Green
Black
Green
White
Black
Label Denoting
Receiving
XMIT
RECV
4-20 Pulse
Transducer Cable
PULSE
OUTPUT
LOOP POWER
R
CONNECTIONS
FIGURE 4 FLOW METER TERMINAL FUNCTIONS
Electrical connections for the ow meter are made using screw-type terminals located inside the electronics enclosure. To
expose these terminals, open the cover. The functions of these terminals are illustrated in Figure 4.
09-VRX-UM-00408 07/12
9
Page 10

Wiring
A two conductor cable of 16 to 24 AWG solid or stranded wire is required to make connections to the ow meter. It is recommended
that a shielded interconnecting cable be used. The maximum cable length for the power depends on the supply voltage lines
required to drive the ow meter and the current meter being used to monitor the current output of the ow meter. The maximum
length of the cable is determined by using Figure 5 to calculate the maximum load (resistance in Ohms) that can be driven using
the known power supply voltage. In determining this value the voltage drop across the meter being used to monitor the current
output of the ow meter must be considered. After this value has been found, Table 3 can be used to calculate the resistance in
the cable being used and adjust the input voltage as required.
Ohms/Ft Related to Wire Size (AWG)
16 AWG = 0.00420 Ohm/Ft
18 AWG = 0.00651 Ohm/Ft
20 AWG = 0.01035 Ohm/Ft
22 AWG = 0.01310 Ohm/Ft
24 AWG = 0.02620 Ohm/Ft
TABLE 3 LINE RESISTANCE FOR CURRENT LINES
Loop Voltage - 7 VDC
0.02
= Maximum Loop Resistance
1200
1100
1000
900
800
700
600
500
Loop Load (Ohms)
400
300
Operate in the
Shaded Regions
200
100
10 12 14 16 18 20 22 24 26 28 30
Loop Voltage (VDC)
10
FIGURE 5 LOAD RESISTANCE VS. SUPPLY VOLTAGE
09-VRX-UM-00408 07/12
Page 11

Pulse Output
The pulse output is a secondary output and is not intended for long transmission. The load on the line must be 50 kilohm
minimum and 1,000 picofarads (pf) maximum.
The maximum length of shielded cable that can be attached to this output is 100 feet.
Cable Installation
To install the cable in the ow meter, route the cable through the cable gland located on the electronics enclosure.
The wiring of the other end of the cable will vary depending on the speci c installation requirements. Figures 6, 7, and 8 show
the wiring diagram for variations of ow meter installation.
The ow meter’s 4 position terminal strip provides all the connections needed to operate the ow meter.
+ 4-20 mA Terminals
The + 4-20 mA terminals are used for the ow meter’s power supply. This power supply should be 10 to 30 Volt DC and be capable
of supplying 25 Milliamp to the ow meter. Because this meter has a built-in display no additional wiring is necessary for basic
operation (See Figure 6).
Pulse
-
4-20
+
2 CONDUCTOR
SHIELDED CABLE
RECV
XMIT
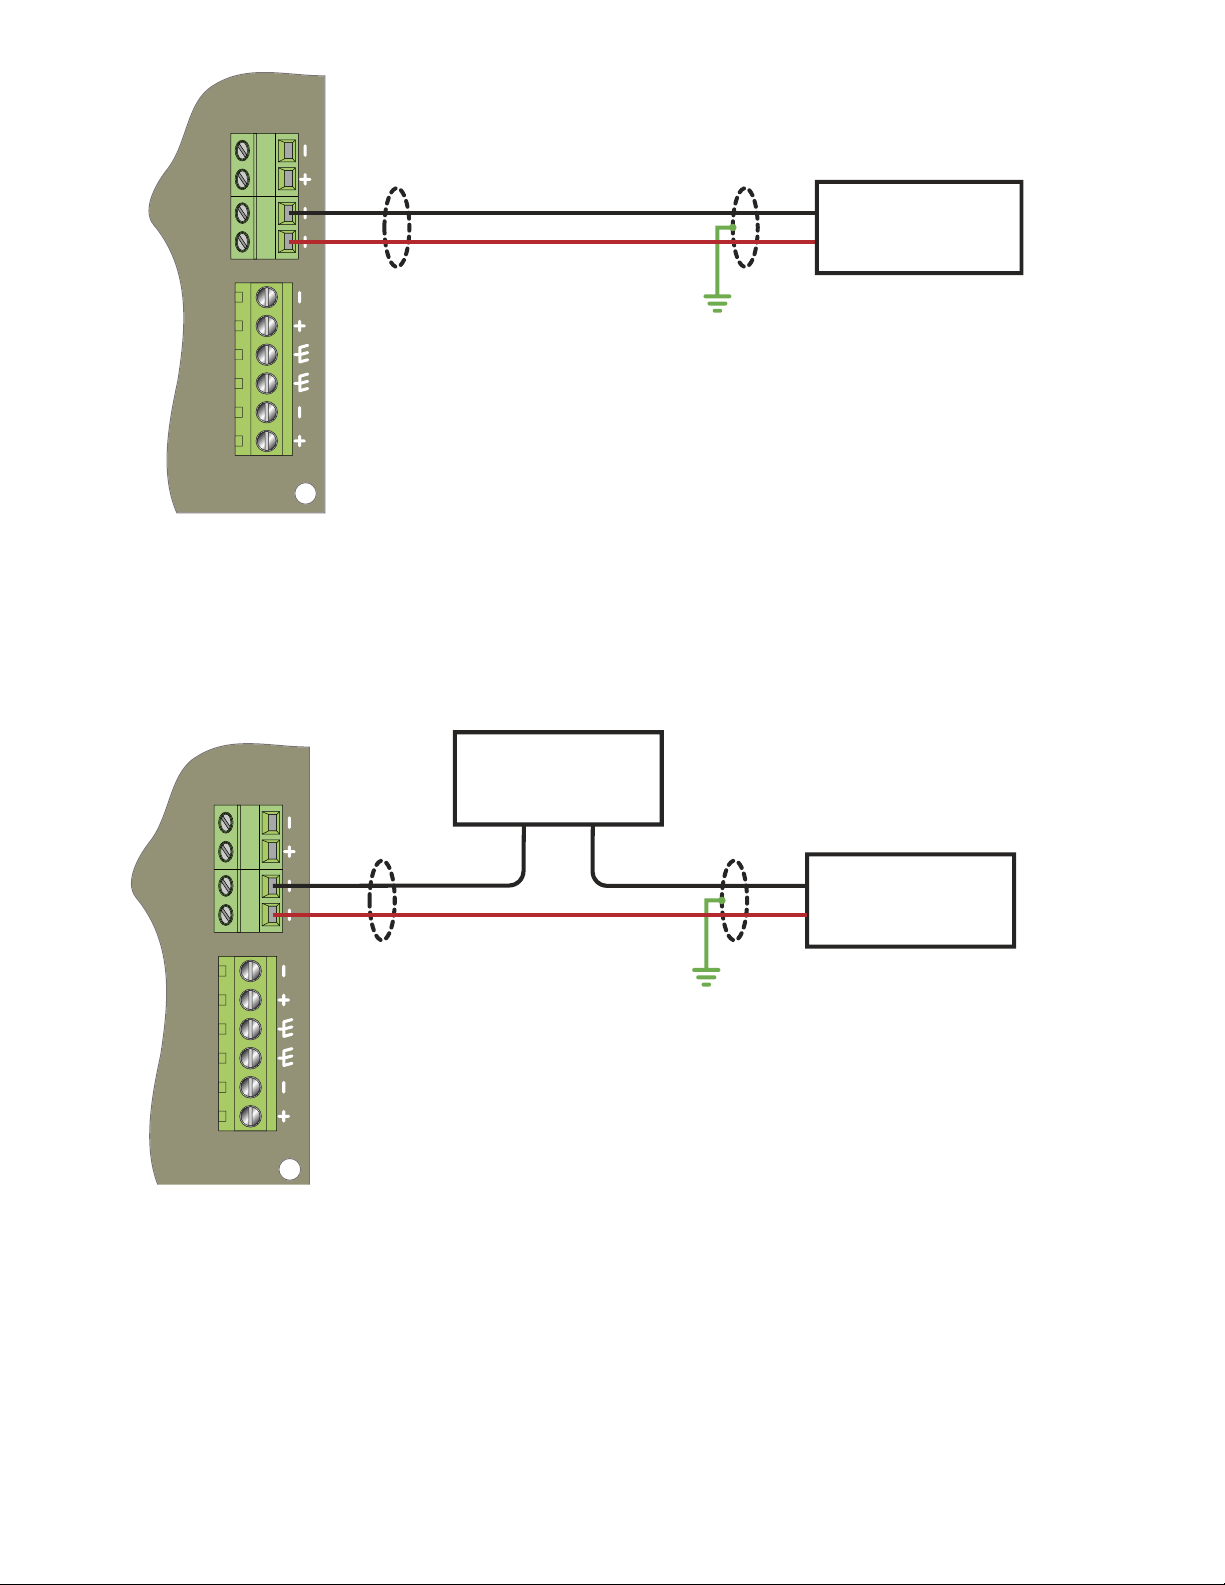
FIGURE 6 DEDICATED POWER SUPPLY HOOKUP
CURRENT OUTPUT 2 WIRE HOOKUP
STAND ALONE POWER SUPPLY
-
10-30 VDC
POWER SUPPLY
+
09-VRX-UM-00408 07/12
11
Page 12
Pulse
-
RECEIVER
+
4-20 mA
4-20
RECV
XMIT
-
+
2 CONDUCTOR
SHIELDED CABLE
CURRENT OUTPUT 2 WIRE HOOKUP
RECEIVER AND POWER SUPPLY COMBINED
FIGURE 7 LOOP POWER HOOKUP
If the current loop is used to transmit data the receiving device may also be the current source for the instrument (See Figure 7).
Finally the device used to measure the current can be installed in series with the return line as illustrated in Figure 8. This output
is a standard 4 to 20 Milliamp output, where 4 Milliamp corresponds to no ow and 20 Milliamp indicates 100% (full scale) ow.
4-20 mA
RECEIVER
Pulse
+
-
-
-
10-30 VDC
4-20
RECV
XMIT
+
2 CONDUCTOR
SHIELDED CABLE
POWER SUPPLY
+
CURRENT OUTPUT 2 WIRE HOOKUP
SEPARATE RECEIVER AND POWER SUPPLY
FIGURE 8 RNL SEPARATE POWER AND RECEIVER HOOKUP
If the pulse output function is to be used the receiving device must conform to the output parameters as described in the
speci cations section. Attach a cable as describe in to the Pulse output terminal and terminate the other end of the cable at the
desired location.
12
09-VRX-UM-00408 07/12
Page 13
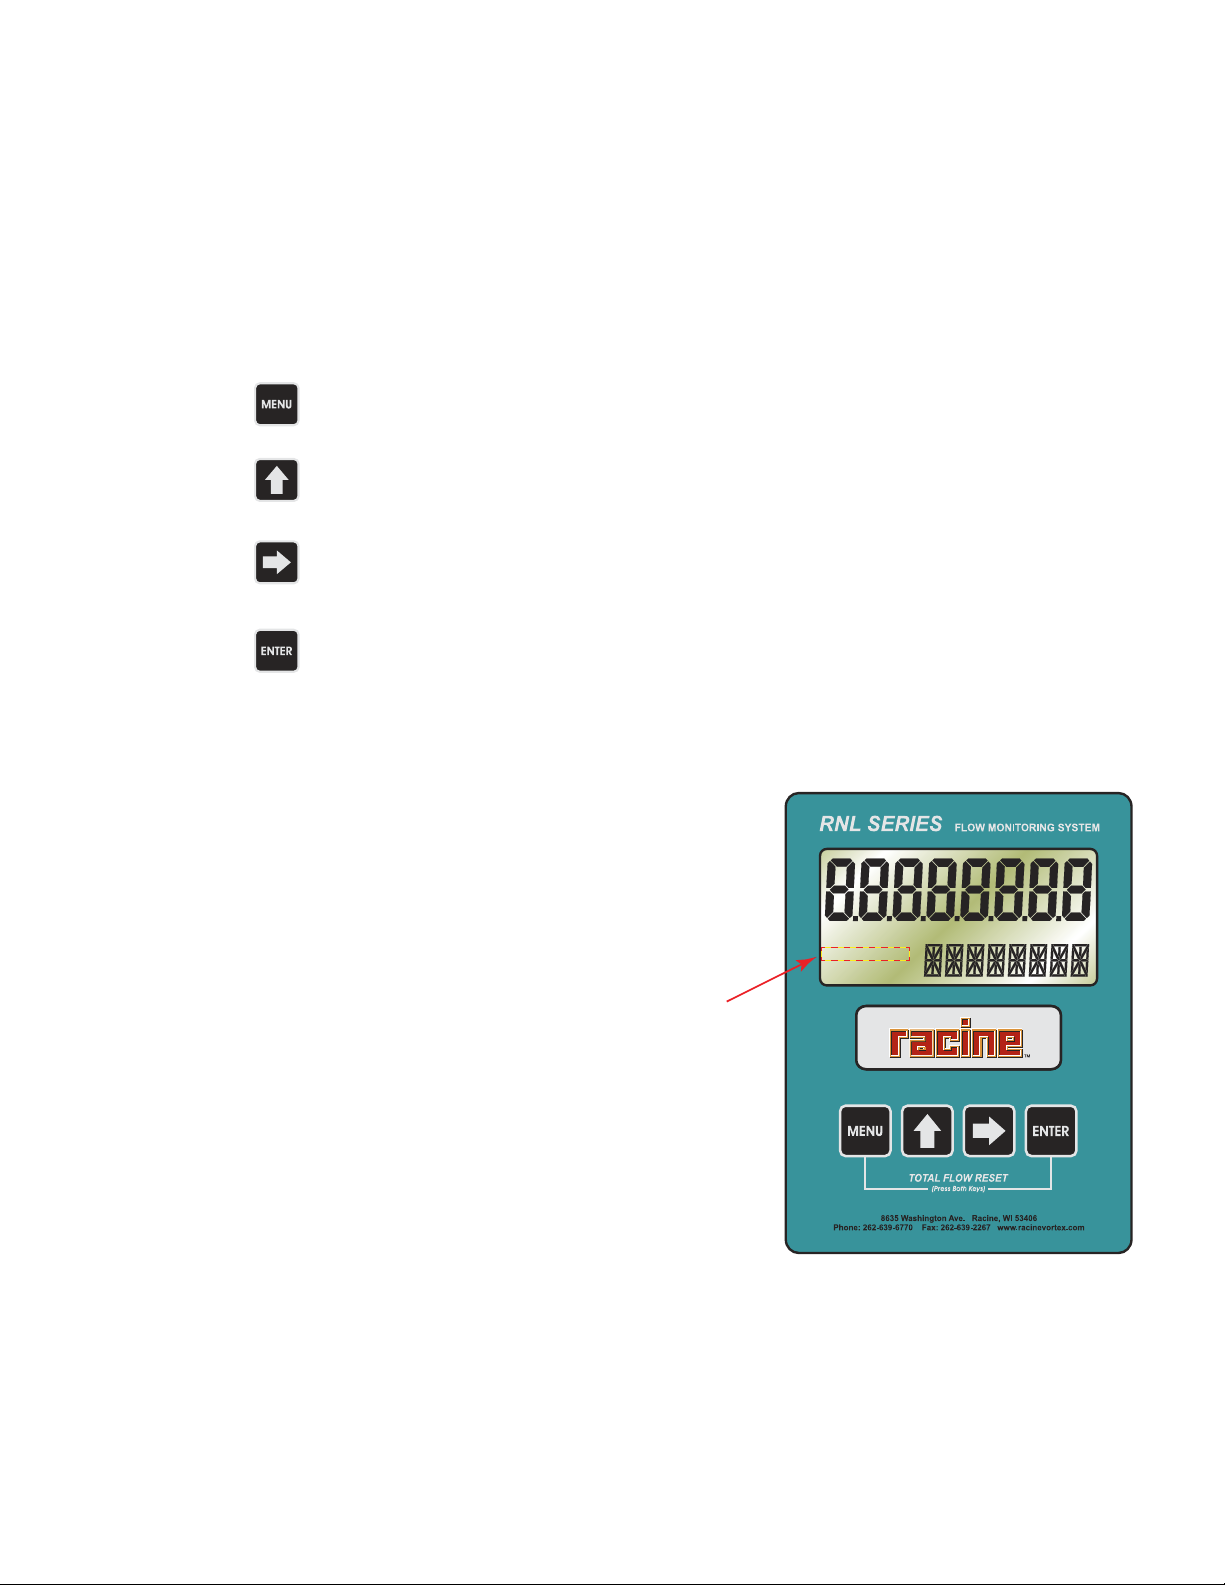
OPERATING THE MONITOR
The monitor has two modes of operation, referred to as the RUN mode and the PROGRAM mode. Both the run mode and the
program mode display screen enunciators con rming the state of the monitor. A quick glance at the lower left hand corner of
the LCD screen will con rm operating status. Normal operation will be in the run mode. To access the programming mode, press
the MENU key once. The programming indicator will appear signaling that the display is ready to accept programming inputs.
After programming the display with the necessary information, a lock out feature can be turned on to prevent unauthorized
access or changing the meter's setup parameters.
BASIC PROGRAMMING MODE
Keys:
MENU - Switches to PROGRAMMING mode.
Up Arrow - Scrolls forward through the parameters choices and increments
numeric variables.
Right Arrow - Scrolls backward through the parameters choices and moves the
active digit to the right.
ENTER - Used to save programming information, advance to the next programming
parameter, and in the reset process.
Modes:
RUN – Normal operating mode.
PROGRAM – Used to program variables into
the display
Entering Programming Mode – Change to programming
mode by pressing the MENU key once. The mode indicator
will change from RUN to PROGRAM.
RUN
and
Select The ID Unit – At the ID UNIT prompt press the
ENTER key once. The current ID (inside diameter) unit
will begin to ash. Using the arrow keys choose INCH for
US measurements or MM for metric measurements. Press
ENTER once to save the meters ID Unit choice and advance
to the pipe ID selection.
Select The Pipe ID – At the ID prompt press the ENTER key once. The current
meter ID (inside diameter) will begin to ash. Using the arrow keys enter the
pipe inside diameter. Press ENTER once to save the pipe ID.
PROGRAM
Indicators
RUN PROGRAM
RELAY 1 RELAY 2
NOTE: Speci cation charts for common types of pipes can be found in the appendix of this manual.
09-VRX-UM-00408 07/12
13
Page 14

Select The Display Function – The monitor can display RATE or TOTAL or alternate between BOTH rate and total. At the DISPLAY
prompt press the ENTER key once. The monitor now shows the display mode currently in e ect. If the current selection is correct,
press the ENTER key to advance to the next parameter. To change to an alternate display mode, use the arrow keys to scroll to
the desired display mode and press ENTER to save the choice.
A TEST function is also available in the Display Function sub-menu. With the test function selected the display acts like a frequency
counter and displays the raw input frequency being supplied to the frequency input terminals. The second line of the test screen
shows transducer signal strength.
Velocity*
Select The Rate Unit – The monitor can display rate in any of
the units listed at the right.
Feet VEL FEET
Meters VEL MTRS
Volumetric
If the current selection is correct, press the ENTER key to
advance to the next parameter. To change to an alternate rate
unit, use the arrow keys to scroll to the desired display units
and press ENTER to save the choice.
Gallons GALLONS
Liters LITERS
Millions of Gallons MGAL
Cubic Feet CUBIC FT
Select The Rate Interval – The monitor can display rate
Million Cubic Feet M CU FT
Cubic Meters CUBIC ME
Interval Displayed as
Seconds SEC
Minutes MIN
Hours HOUR
Days DAY
interval in any of the units listed below.
Million Liters MEGLTRS
Acre Feet ACRE FT
Oil Barrels (42 GAL) OIL BARR
Liquid Barrels (31.5 GAL) LIQ BARR
Mass**
Kilograms KGS
Pounds LBS
* - Velocity measurements not available as totalizer units.
If the current selection is correct, press the ENTER key to
** - Mass units require entry of speci c gravity.
advance to the next parameter. To change to rate interval,
use the arrow keys to scroll to the desired interval and press
ENTER to save the choice.
Select the Totalizer Units - The ow totalizer unit is used
to set the ow totalizer exponent. This feature is useful for
accommodating a very large accumulated ow. The exponent
is a x10n multiplier, where “n” can be from -1 (x0.1) to +6
(x1,000,000). Table 4 should be referenced for valid entries
and their in uence on the display.
If the current selection is correct, press the ENTER key to
advance to the next parameter. To change to rate interval, use
the arrow keys to scroll to the desired interval and press ENTER
to save the choice.
This completes the basic setup for the meter.
14
Exponent Display Multiplier
E-1 x 0.1
E0 x 1 (no multiplier)
E1 x 10
E2 x 100
E3 x 1,000
E4 x 10,000
E5 x 100,000
E6 x 1,000,000
TABLE 4 EXPONENT MULTIPLIERS
09-VRX-UM-00408 07/12
Page 15

ADDITIONAL SCALING PARAMETERS
4-20 Pulse
XMIT
RECV
+
-
10-30 VDC
POWER SUPPLY
10A MAX
FUSED
400mA
FUSED
CAT III
1000V
HOLD MIN MAX REL
Hz % ms RANGE
AutoHOLD FAST MI N M X LOGGING YES
CANCEL SAVE NO
SETUP
μA
mA
A
W
V
TEMPERATURE
COM
OFF
nS
W
VIEW MEM
CLEAR MEM
V
dB
mV
dB
ac+dc
V
ac+dc
A
mA
mV
ac+dc
mA
A
μA
ac+dc
μA
°C
°F
AC+DC
00
Speci c Gravity (SP GRAV)- The speci c gravity for the uid being measured must be entered if mass readings are desired. The
SP GRAV (speci c gravity) prompt will only be displayed when one of the mass Rate Units is chosen.
Low Flow Cuto (FL C OFF) - The low ow cuto is entered as an actual ow value between maximum ow and minimum ow
and in uences how the ow meter will act at ows very near zero. Generally, an entry of 2% of the maximum ow provides for
a stable zero indication. When the ow rate drops below the entered value, the meters’ display will read zero.
Damping (DAMPING) - The damping value is increased to increase stability of the ow rate readings. Damping values are
decreased to allow the ow meter to react faster to changing ow rates.
Flow 4 mA Setting (FLOW 4MA) - If the 4-20 mA analog output is to be used the ow rate that corresponds to 4 mA must be
set. If the current selection is correct, press the ENTER key once to advance to the next parameter. If adjustment is required, use
the arrow keys to input the correct 4 mA setting. The arrow key moves the active digit one place to the right for each press of
the key. The arrow key increments the active digit one integer for each press of the key. When the correct 4 mA ow rate has
been entered press ENTER once to store this value and move to the next parameter.
Flow 20 mA Setting (FLOW20MA) - If the 4-20 mA analog output is to be used the ow rate that corresponds to 20 mA must
be set. If the current selection is correct, press the ENTER key once to advance to the next parameter. If adjustment is required,
use the arrow keys to input the correct 20 mA setting. The arrow key moves the active digit one place to the right for each
press of the key. The arrow key increments the active digit one integer for each press of the key. When the correct 20 mA ow
rate has been entered press ENTER once to store this value and move to the next parameter.
4-20 mA Calibration (4-20CAL?) - The 4-20 mA calibration menu allows the ne adjustment
of the 4-20 mA output. The 4 mA setting is typically between 35 and 50. To set the 4 mA value,
connect an ammeter in series with the loop power supply. At the 4-20CAL? prompt press ENTER
once. The display will now show a steady NO indication. Press the arrow key to change to a
YES display. Press ENTER once to access the 4 mA ne adjustment.
4 mA Adjustment (4MA OUT) - While monitoring the ammeter, adjust the
4 mA value to obtain a 4 mA reading. The arrow key increments the value
and the arrow key decrements the value. When a steady 4 mA reading is
obtained on the ammeter press the Enter key to lock in this value and move
to the 20 mA adjustment.
20 mA Adjustment (20MA OUT) - The 20 mA adjustment is preformed using
the same procedure as the 4 mA adjustment.
While monitoring the ammeter, adjust the 20 mA value to obtain a 20 mA
reading. The arrow key increments the value and the arrow key decrements
the value. When a steady 20 mA reading is obtained on the ammeter press the
Enter key to lock in this value and move to the next parameter.
4-20 mA Test (4-20TEST)- The monitor contains a diagnostic routine that allows
the simulation of mA values between 4 and 20 to check output tracking. At the
4-20TEST prompt the arrow keys change the simulated mA output in increments
of 1 mA. The ammeter should track the simulated mA output. If a 4-20 mA test is
not necessary press MENU once to move to the next parameter.
FIGURE 9 420 mA TEST SETUP
Password (PASSWORD) - Password protection prevents unauthorized users from changing programming information. Initially
the password is set to all zeros. To change the password press ENTER once at the password prompt. The rst digit of the password
value will begin to ash. Using the arrow keys as previously described enter the password value. Pressing ENTER will store the
password and exit to run mode.
09-VRX-UM-00408 07/12
15
Page 16

Advanced Setup (ADV STUP) - The advances setup menu allows access to entries for applying scaling factors, enabling or
disabling the pulse output, and adding linearization points.
At the ADV STUP prompt press ENTER once. The display will now show a steady NO indication. Press the arrow key to change
to a YES display. Press ENTER once to access the rst parameter.
Scale Factor (SCALE F) - At the SCALE F prompt press the ENTER key once. The current scale factor will begin to ash. If the
current selection is correct, press the ENTER key to advance to the next parameter.
The scale factor is used to force a global change to all variables. For example, under operating conditions the display is reading a
consistent 3% below the expected values at all ow rates. Rather than changing all parameters individually the scale factor can
be used to compensate for the 3% o set. The scale factor would be set to 1.03 to correct the readings.
The range of scale factors is from 0.5 to 1.5. The default scale factor is 1.00. A scale factor is used to correct (correlation adjustment)
or change the ow value displayed on the LCD.
A correlation adjustment allows the user to “force” the display to read a ow value di erent from the factory calibrated value.
This procedure is only valid for an “o set” di erence. In other words the readings must be o by a constant value or percentage
for the entire measurement range.
Totalizer Pulse Output (PULS OUT) - The pulse output parameter can be either enabled or disabled. When enabled this output
generates a 20 mS duration pulse for every time the least signi cant digit of the totalizer increments. The amplitude of the pulse
is dependent on the voltage level of the supply connected to the pulse output and is limited to a maximum 30 VDC.
Linearization (LINEAR) - Enhanced accuracy can be obtained by linearization of the display. The linearization routine will accept
a maximum of ten points. Linearization requires additional calibration data from the sensor to be used with the monitor. Typically
calibration information is obtained for three, ve, or ten points.
Number of Points - At the LINEAR prompt press ENTER once. The rst display number will begin to ash. Again the arrow
key increments the value and the arrow moves the cursor between digits. Enter the number of linear points to be used.
When the number of points has been input press the ENTER key once to move to the rst linear segment.
Press the ENTER key once and the rst linear point's frequency input will begin to ash FREQ 1. Enter the frequency for the
rst linear point using the arrow keys. When the frequency value input is completed, press ENTER once again to change to
the coe cient value for the rst linear point.
At the COEFF 1 prompt enter the coe cient that corresponds to the frequency value previously entered. Press ENTER once
to move to the next scaling point.
Continue entering pairs of frequency and coe cient points until all data has been entered.
TOTALIZER FUNCTIONS
Reset Total - To reset the monitor total display, in run mode press MENU and ENTER simultaneously until TOTAL RST starts to
ash. The TOTAL RST will stop ashing and the display will return to run mode at the conclusion of the reset procedure.
Store Total - The current total can be manually stored in the monitors ash memory. Press and hold the ENTER key for 2 seconds.
The display will respond with a ashing TOTALSVD and then start a display test. At the end of the test the instrument will return
to run mode.
Automatic Store Total - The monitor is equipped with a store total feature that works automatically saving the current total to
ash memory once every ten minutes.
16
09-VRX-UM-00408 07/12
Page 17

TROUBLESHOOTING
The RNL series ow meters are designed to ensure long term accuracy and reliability. The material used for construction and
self-cleaning strut are speci cally designed to withstand the rigors of industrial environments.
As a result, periodic adjustments or re-calibration is not required. The following section is intended as a guide to eliminating
common problems found with the installation of the ow meters. Technical assistance is also available directly from Badger
Meter, who also provides complete re-calibration and repair service for the RNL series ow meter at nominal cost.
1) Is the ow meter cable installed correctly?
2) Is the proper power supplied to the correct terminals?
3) Is the ow meter installed with the ow direction arrow aligned with ow in the pipe?
4) For insertion style ow meters has the sensor head been inserted to the optimum depth?
09-VRX-UM-00408 07/12
17
Page 18

Totalizer Units
Not Available as
OR
Note: Only available when either
KGS or LBS are Selected
See Note
18
For INCHES For mm
FIGURE 10 PROGRAMMING MENU MAP
09-VRX-UM-00408 07/12
Page 19

APPENDIX
RUN PROGRAM
RELAY 1 RELAY 2
ADDITIONAL INSTALLATION REQUIREMENTS
Introduction
Installing a ow meter is something which requires careful consideration. It cannot just be placed in a line somewhere and be
expected to ful ll its purpose adequately. The geometry and condition of the pipe runs in the area of the installation must be
considered to ensure the best and most accurate operation of the ow-meter. This appendix provides suggestions for optimum
installations.
Most flow meter manufacturers define installation conditions in terms of upstream and
downstream straight pipe lengths from the point of installation. Unfortunately this is not the
only requirement, and one needs to consider other peripheral conditions, such as proximity and
style of bends, and other equipment installed in the line. By doing this, problems of turbulence,
swirl, and sonic noise may be avoided.
Turbulence
Turbulence is a disturbance of the ow caused by bends and
obstructions in the ow stream (it is this phenomenon which
makes the vortex ow meter work). Fortunately turbulence dies
out fairly quickly, so by positioning the ow meter well away from
bends and obstructions this potential problem of measuring ow
in turbulent conditions is overcome (See Figure A1).
FIGURE A1 TURBULENCE
Swirl
Unlike turbulence, swirl will not die away. Once created it will
continue until dissipated on the next pipe bend in
the system. Swirl occurs after two bends, in close
proximity, which are at an angle to each other.
When designing an installation, keep the ow
meter out of any line which has two adjacent
bends upstream. (See Figure A2).
Sonic Noise
Sonic noise is created by valves (either ow control or pressure control valves)
which are slightly open. Like swirl, sonic noise will only dissipate on a
bend so it is important to install ow meters out of line of sight of
valves. Sonic noise is caused by liquid obtaining sonic velocities
through a slightly open valve which has a pressure di erence
across it. This noise travels both up and down stream from
the valve therefore the ow meter must be installed well
away from the valve, preferably around a bend (See Figure
A3).
FIGURE A2 SWIRL
FIGURE A3 SONIC NOISE
09-VRX-UM-00408 07/12
19
Page 20

Velocity Pro le for RNL Insertion Meters
When using an RNL series insertion ow meter, it is necessary to consider the e ects of the velocity pro le across the pipe or
duct to optimize accuracy.
In large pipes, the ow moves slowly at the pipe walls but is at maximum velocity in the center of the pipe creating a continuously
variable velocity across the pipe. This velocity variation is called the velocity pro le of the pipe, and can be measured and plotted
by using the insertion ow meter to measure velocities at various noted positions across the pipe. As the maximum velocity is
in the center of the pipe, it follows that if the ow meter is positioned in the center, it will not measure average ow. The “rule
of thumb” position is 25% of the pipe ID into the pipe, but the optimum position can only be obtained by measuring the pro le
and working out the correct position from that.
Straight-Run Piping Considerations
The sensor should be installed with 20 diameters, or more, of straight, unobstructed, full area pipe upstream of the ow meter
installation and 10 diameters, or more, downstream. This condition provides a fully developed, symmetrical ow pro le that is
necessary to obtain accurate and repeatable results. The rst obstruction up and downstream should be a full area elbow. If the
minimum straight run is not possible, the general rule is to have 80% of the straight run upstream and 20% downstream from
the ow meter installation.
High intensity ultrasonic noises should not be located upstream or downstream from the sensor. Common ultrasonic noise
sources include the following:
● Slightly cracked valves operating with large pressure drops.
● Small pipe leaks in high pressure systems.
● Venturies operating at near-sonic fl ow rates.
● Sonic nozzles.
If these ultrasonic noise sources cannot be eliminated, the meter should be mounted with at least one elbow between the ow
meter and the noise source.
Temperature and Pressure Tap Locations
User supplied pressure and temperature sensors should be mounted downstream from the ow meter. The pressure sensor
should be approximately 3-5 pipe diameters and the temperature sensor approximately 4-8 pipe diameters downstream.
RNL Insertion Style Meter Installation
The RNL series ow meter is shipped completely assembled, tested and ready to install and operate in its permanent location.
If the main line can be depressurized easily without undue user inconvenience, then a simple installation, consisting of a 2 inch
(51 mm) nozzle and a standard ANSI 150 pound, 2 inch pipe ange may be used. This permits the shortest shaft length to be used,
which keeps clearance space requirements for insertion and removal to a minimum. Gaskets (not provided) are necessary between
the sensor and ANSI ange. It is recommended that the customer conduct a ow pro le survey prior to installing ow meter.
DANGER - Caution should be used when inserting or retracting at pressures exceeding 60 PSIG (4.14 BARg).
20
09-VRX-UM-00408 07/12
Page 21

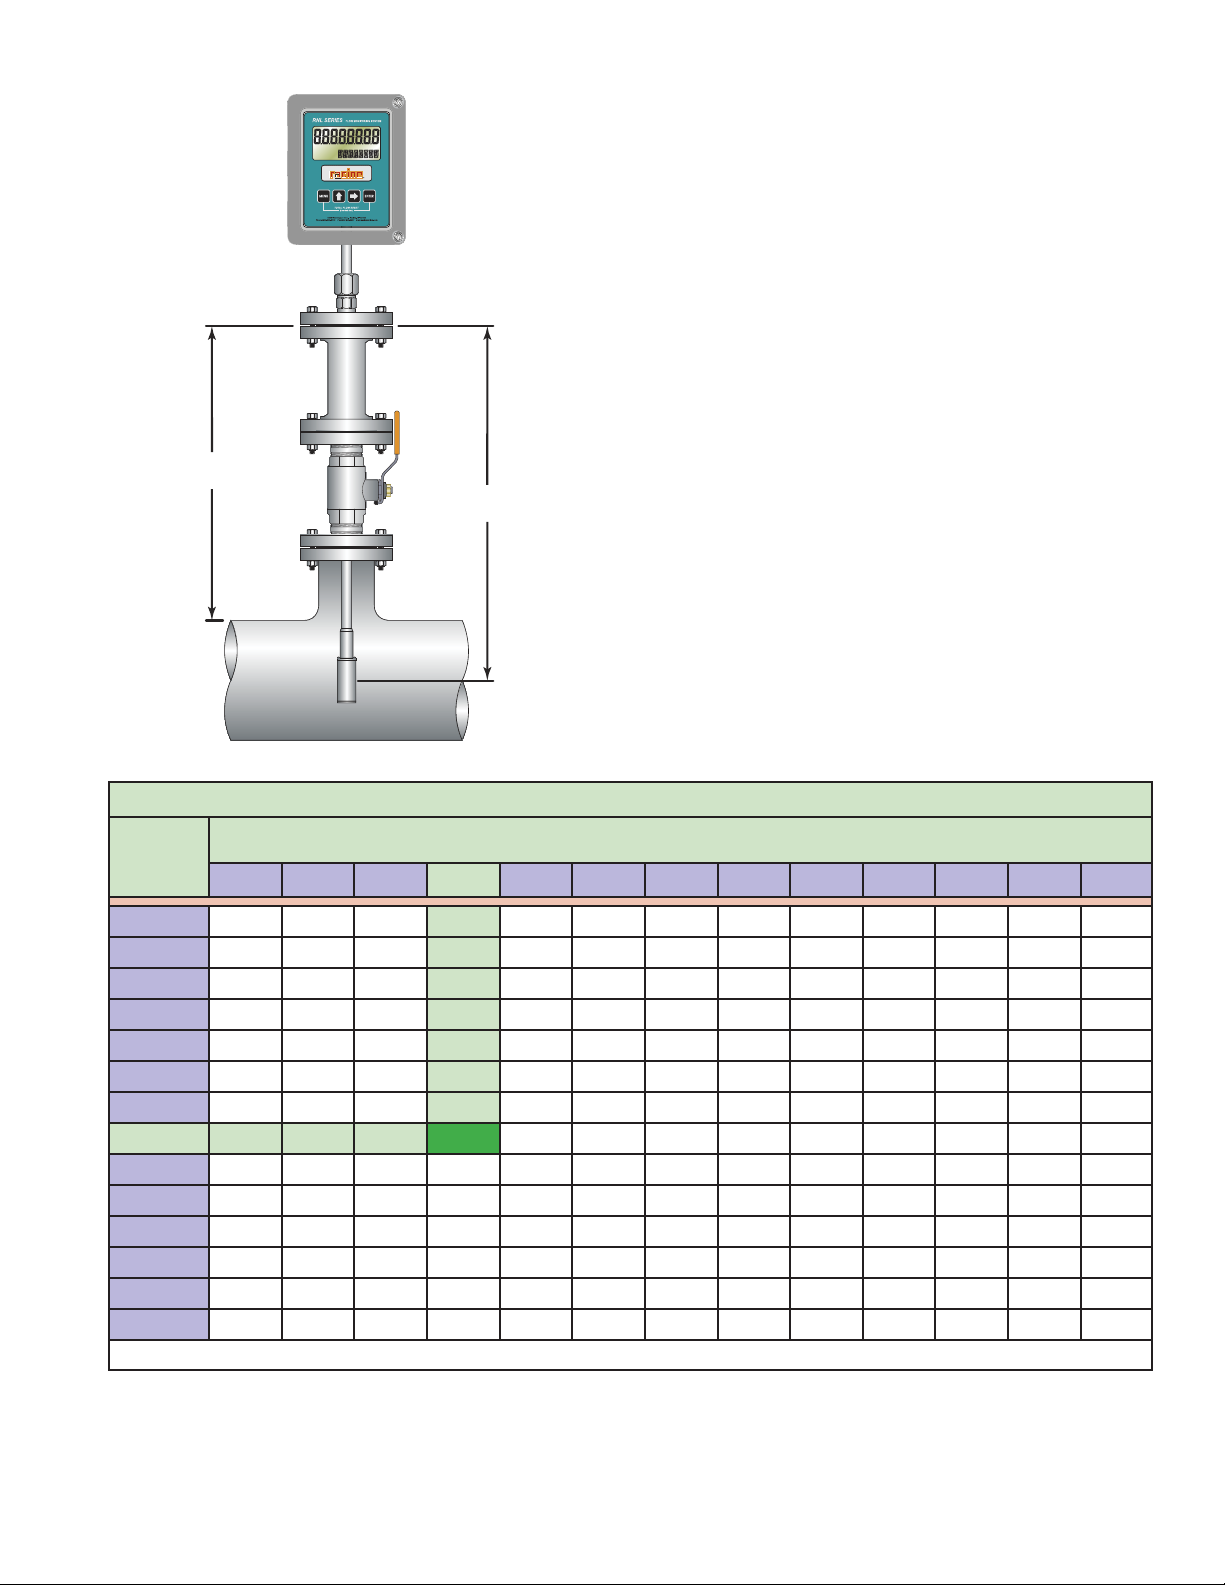
HOT TAP INSERTION FLOW METER INSTALLATION
Where de-pressurizing the line for ow meter maintenance is impossible or undesirable, the “hot tap” method of installation is
used. This method involves inserting the ow meter through a 2 inch (50.76 mm) spool piece and a 2 inch (50.76 mm) full port
valve and will require a longer shaft length as well as greater clearance space for removal and installation.
DANGER - Caution should be used when inserting or retracting at pressures exceeding 60 PSIG (4.14 BARg).
Figure A4 shows the cutaway of a typical hot tap installation.
Coupler
6” x 2” Nipple with
2” Full Port
Ball Valve
3” x 2” Nipple
FIGURE A4 HOT TAP CUTAWAY
Pressure Port
09-VRX-UM-00408 07/12
21
Page 22

Figure A5 shows a sample hot tap installation. With the exception of the spool piece, which must be a minimum of 6 inches
10.75" Maximum
at Maximum
Insertion
4.50" Maximum
Retracted
Standard ANSI
2 Inch 150 Lb. Flange
Determined
By Stem
Length
Determined
By Stem
Length
2" Full Port
Valve
Flow
4.50"
Maximum
Spool Piece
4.00" Minimum
RUN PROGRAM
RELAY 1 RELAY 2
5.75"
7.00"
RUNP
R
1
R
(152 mm) in length, all of the dimensions are suggestions only. Actual dimensions may vary depending on customer’s own hot
tap con guration.
To calculate the required insertion ow meter stem
length for the installation:
For pipe diameters less than 24 inches (609 mm):
ROGRAM
ELAY
Calculate the distance from the center line of
ELAY 2
the pipe to the top of the ow meter mounting
ange.
For pipe diameters greater than 24 inches (609 mm):
Calculate the distance from the top of the ow
meter ange to a point ¼ of the pipe diameter.
Where a flow profile is desirable, calculate the
distance from the bottom of the pipe to the top
of the ow meter mounting ange and subtract 2
inches (50.76 mm). Round this distance up to the
next largest 12 inches (305 mm) increment. This is
the stem length that should be ordered.
DANGER - Caution should be used
when inserting or retracting at
pressures exceeding 60 PSIG (4.14
BARg).
22
FIGURE A5 HOT TAP DIMENSIONS
09-VRX-UM-00408 07/12
Page 23
Maximum Fluid Velocity
L2
RUN PROGRAM
RELAY 1 RELAY 2
L1
Insertion meters are subject to damage from bending if the uid velocity
exceeds a speci c value. The threshold velocity where damage may occur is
found in a lookup table (See Table A1) and the depth the meter stem
extends into the pipe (See Figure A6).
L1 = Distance from bottom of ow meter ange to center of vortex strut.
L2 = Distance from bottom of ow meter ange to top inside wall of pipe
1) Find the appropriate L1 distance for your application in the rst
column.
2) Once the L1 distance is identi ed, move across the row until the
appropriate L2 distance is located for the application. The resulting
number is the maximum uid velocity.
EXAMPLE: L1 length = 24, and L2 length = 12.
Using Table A1 follow the 24” (L1) row until it intersects the 12” (L2)
column. L1 and L2 intersect at 13 ft/sec. Exceeding the maximum
uid velocity of 13 ft/sec risks bending the meter stem.
FIGURE A6 INSERTION DEPTH
L1
Inches
10 26 28
12 22 24 25
14 20 21 22 24
16 18 18 19 20 22
18 16 16 17 18 19 21
20 15 15 15 16 17 18 20
22 13 14 14 15 15 16 17 19
24 13 13 13 13 14 15 15 16 18
26 12 12 12 12 13 13 14 15 16 17
28 11 11 11 12 12 12 13 13 14 15 17
30 10 10 11 11 11 11 12 12 13 14 15 16
32 10 10 10 10 10 11 11 11 12 12 13 14 15
34 9 9 10 10 10 10 10 11 11 11 12 13 14
36 9 9 9 9 9 9 10 10 10 11 11 12 12
NOTE: Operating at velocities higher than the values listed in the table may result in bending the stem of the insertion meter.
6 8 10 12 14 16 18 20 22 24 26 28 30
L2 (INCHES)
09-VRX-UM-00408 07/12
TABLE A1 INSERTION DEPTH
23
Page 24

FLOW PROFILING
If the purchased ow meter is long enough to be inserted to the far side of the pipe, the ow through the pipe may be pro led
at various ow rates. The goal is to nd a point in the pipe that remains a consistent percentage of the average ow rate over a
wide range of ow. A sample ow pro le is shown in Table A2. In this example, the ow rate of a 48 inch pipe is measured every
six inches across the diameter of the pipe beginning and ending 3 inches from the near and far sides of the pipe. The distance
in inches from the nearside of the pipe is shown. Measurements are taken at a low, medium and high average ow. In Table
A3 the ow rate at each measurement point has been converted to a percentage of the average ow. It can be seen that point
number three (15 inches from the near side of the pipe) reads a consistent 102 percent of the average ow. The meter should
be placed in this position and the output should be divided by 1.02 to obtain the correct reading. Flow pro ling should be done
for all insertion meter installations.
FLOW
FLOW RATE AT MEASUREMENT POINT (F/S)
12345678 AVERAGE (ft/s)
LOW FLOW 1.90 2.00 2.04 2.06 2.06 2.04 2.00 1.90 2.0
MEDIUM FLOW 5.58 5.91 6.12 6.21 6.24 6.18 6.06 5.70 6.0
HIGH FLOW 10.92 11.70 12.24 12.48 12.60 12.48 12.18 11.40 12.0
DISTANCE
3 9 15 21 27 33 39 45 INCHES
TABLE A2 FLOW PROFILE RAW DATA
FLOW
LOW FLOW 95.0 100.0 102.0 103.0 103.0 102.0 100.0 95.0
MEDIUM FLOW 93.0 98.5 102.0 103.5 104.0 103.0 101.0 95.0
HIGH FLOW 91.0 97.5 102.0 104.0 105.0 104.0 101.5 95.0
FLOW RATE AT MEASUREMENT POINT (%)
12345678
TABLE A3 FLOW PROFILE NORMALIZED DATA
REDUCING THE PIPE DIAMETER
To decrease the variation of ow pro le, the piping can be narrowed at the ow meter as shown in Figure A7. This will smooth
the ow and increase the e ectiveness of ow pro ling. Nearly any angle can be used on the down-stream side of the meter to
restore the original pipe diameter. However, if the angle of piping is seven degrees or less, nearly all the pressure drop caused
by the narrow pipe section will be recovered.
RUN PROGRAM
RELAY 1 RELAY 2
FIGURE A7 MAKING REDUCTIONS OR ENLARGEMENTS
Flow
7°3d 1d
09-VRX-UM-00408 07/12
24
D
30°
d
Page 25

SPECIFICATIONS
MEASURED Liquids
MINIMUM PIPE SIZE 4 inches (102 mm)
FLOW RATE MEASURED 2...18 fps (0.6...5.5 mps)
PROCESS TEMPERATURE -20° F...300° F (-28° C...148° C)
PROCESS PRESSURE -5...250 PSIG (-0.3...17 BARg)
MINIMUM BACK PRESSURE See Figure 2 - BACK PRESSURE CALCULATIONS
MAXIMUM VISCOSITY 10 centistokes - Consult factory for higher viscosities
ACCURACY ±2.0% of reading
REPEATABILITY ±0.5% of reading
RESPONSE TIME 1 second
INPUT POWER 4-20 mA 2 Wire Current Loop Powered; +10 to +30 VDC, 25 mA max
4-20 mA Current Loop
ANALOG OUTPUT
PULSE OUTPUT
PROCESS CONNECTION
ENVIRONMENTAL
DISPLAY
ENCLOSURE NEMA 4X (IP66) Polycarbonate
Resolution 1:4000
Transient Over-voltage: Category 3, in accordance with IEC 664
Outputs one pulse for each increment of totalizers least signi cant digit
Pulse Type: Opto-Isolated open collector transistor
Maximum Voltage: 30 VDC
Pulse Width ON State: 20 ms / Max pulse rate 25 Hz
Current ON State: 0.9 V drop @ 5.0 mA
or 0.7 V drop @ 0.1 mA
Stainless steel w/PPS transducer assembly
Standard: 2” ANSI 150 lb ange
Optional: 300 lb ange or ¾ NPT x 2 NPT Bushings
Ambient Temperature: -20 °F to 110 °F (-30 °C to 43 °C)
Humidity: 0-90% Non-condensing
Flow Rate and Total
8 digit, .75” high numeric display; 8 character, .38” high alphanumeric
4-20 mA Loop Powered; +10 to +30 VDC, 25 mA max
09-VRX-UM-00408 07/12
25
Page 26
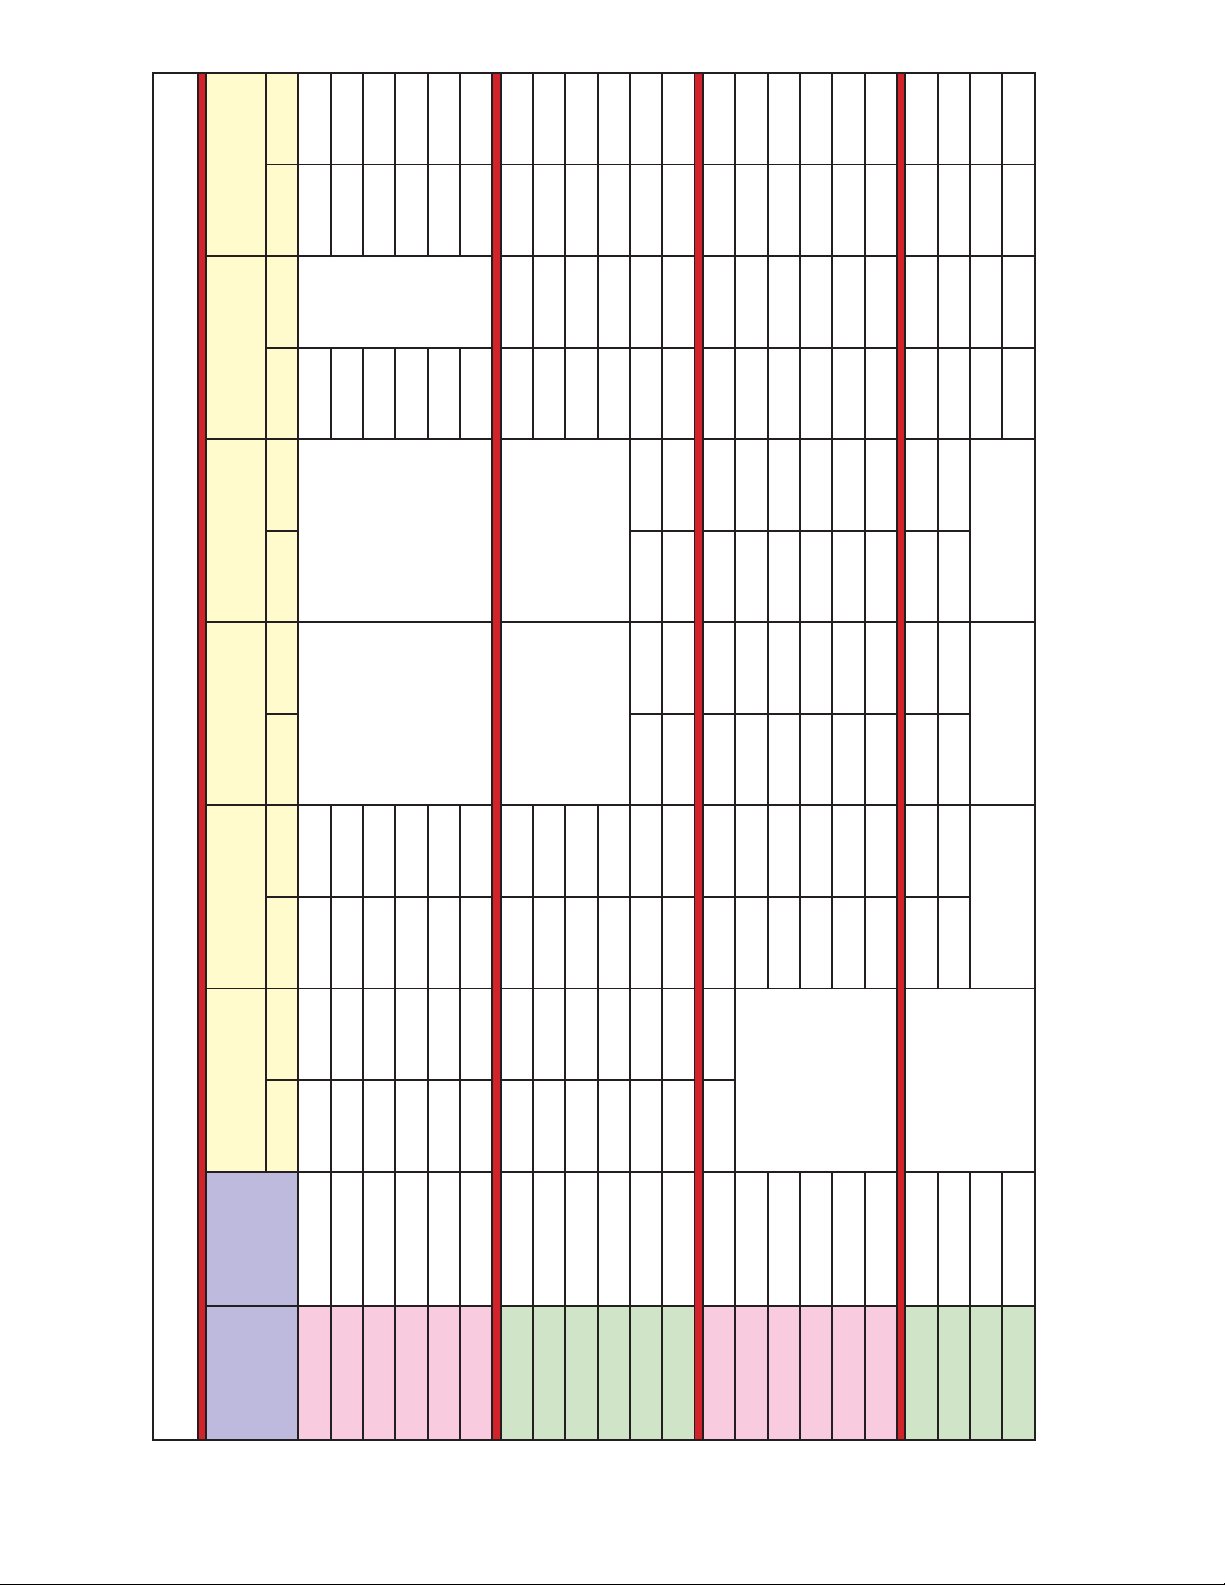
SCH 20 SCH 30 STD SCH 40
SCH 10
(Lt Wall)
26
TABLE A4 STEEL, STAINLESS STEEL, P.V.C. PIPE STANDARD CLASSES
SCH 5
ID Wall ID Wall ID Wall ID Wall ID Wall ID Wall
Outside
Diameter
Inches
Nominal
Pipe Size
1 1.315 1.185 0.065 1.097 0.109 1.049 1.049 0.133
1.25 1.660 1.53 0.065 1.442 0.109 1.380 1.380 0.140
2 2.375 2.245 0.065 2.157 0.109 2.067 2.067 0.154
1.5 1.900 1.77 0.065 1.682 0.109 1.610 1.610 0.145
3 3.500 3.334 0.083 3.260 0.120 3.068 3.068 0.216
2.5 2.875 2.709 0.083 2.635 0.120 2.469 2.469 0.203
4 4.500 4.334 0.083 4.260 0.120 4.026 0.237 4.026 0.237
3.5 4.000 3.834 0.083 3.760 0.120 3.548 3.548 0.226
5 5.563 5.345 0.109 5.295 0.134 5.047 0.258 5.047 0.258
6 6.625 6.407 0.109 6.357 0.134 6.065 0.280 6.065 0.280
8 8.625 8.407 0.109 8.329 0.148 8.125 0.250 8.071 0.277 7.981 0.322 7.981 0.322
10 10.75 10.482 0.134 10.42 0.165 10.25 0.250 10.13 0.310 10.02 0.365 10.02 0.365
12 12.75 12.42 0.165 12.39 0.180 12.25 0.250 12.09 0.330 12.00 0.375 11.938 0.406
14 14.00 13.50 0.250 13.37 0.315 13.25 0.375 13.25 0.375 13.124 0.438
16 16.00 15.50 0.250 15.37 0.315 15.25 0.375 15.25 0.375 15.000 0.500
18 18.00 17.50 0.250 17.37 0.315 17.12 0.440 17.25 0.375 16.876 0.562
20 20.00 19.50 0.250 19.25 0.375 19.25 0.375 19.25 0.375 18.814 0.593
24 24.00 23.50 0.250 23.25 0.375 23.25 0.375 23.25 0.375 22.626 0.687
30 30.00 29.37 0.315 29.00 0.500 29.00 0.500 29.25 0.375 29.25 0.375
36 36.00 35.37 0.315 35.00 0.500 35.00 0.500 35.25 0.375 35.25 0.375
42 42.00 41.25 0.375 41.25 0.375
48 48.00 47.25 0.375 47.25 0.375
09-VRX-UM-00408 07/12
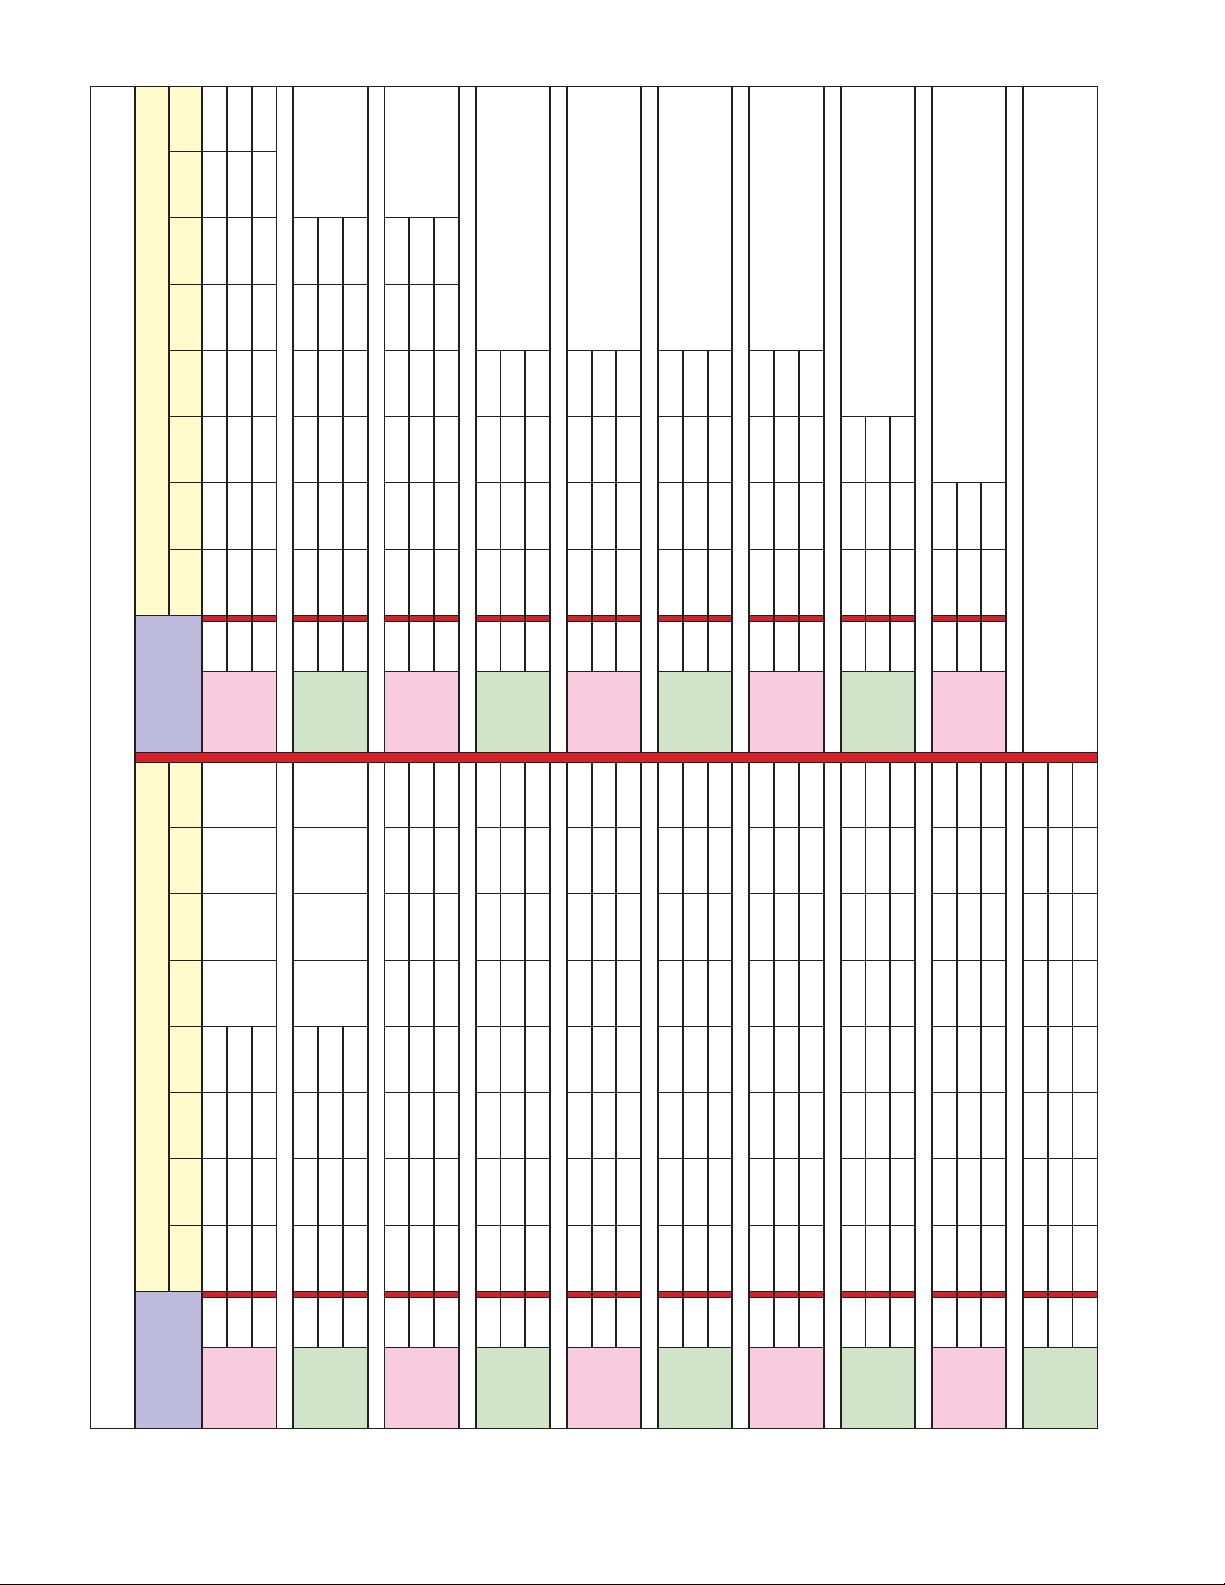
Page 27

STEEL, STAINLESS STEEL, P.V.C. PIPE (STANDARD CLASSES)
SCH 60 X STG. SCH 80 SCH 100 SCH 120/140 SCH 180
ID Wall ID Wall ID Wall ID Wall ID Wall ID Wall
Outside
Diameter
Nominal
09-VRX-UM-00408 07/12
Pipe Size
Inches
1 1.315 0.957 0.179 0.957 0.179 0.815 0.250
1.25 1.660 1.278 0.191 1.278 0.191 1.160 0.250
2 2.375 1.939 0.218 1.939 0.218 1.687 0.344
1.5 1.900 1.500 0.200 1.500 0.200 1.338 0.281
3 3.500 2.900 0.300 2.900 0.300 2.624 0.438
2.5 2.875 2.323 0.276 2.323 0.276 2.125 0.375
4 4.500 3.826 0.337 3.826 0.337 3.624 0.438 3.438 0.531
3.5 4.000 3.364 0.318 3.364 0.318
5 5.563 4.813 0.375 4.813 0.375 4.563 0.500 4.313 0.625
6 6.625 5.761 0.432 5.761 0.432 5.501 0.562 5.187 0.719
8 8.625 7.813 0.406 7.625 0.500 7.625 0.500 7.437 0.594 7.178 0.719 6.183 1.221
10 10.75 9.750 0.500 9.75 0.500 9.562 0.594 9.312 0.719 9.062 0.844 8.500 1.125
12 12.75 11.626 0.562 11.75 0.500 11.37 0.690 11.06 0.845 10.75 1.000 10.12 1.315
14 14.00 12.814 0.593 13.00 0.500 12.50 0.750 12.31 0.845 11.81 1.095 11.18 1.410
16 16.00 14.688 0.656 15.00 0.500 14.31 0.845 13.93 1.035 13.56 1.220 12.81 1.595
18 18.00 16.564 0.718 17.00 0.500 16.12 0.940 15.68 1.160 15.25 1.375 14.43 1.785
20 20.00 18.376 0.812 19.00 0.500 17.93 1.035 17.43 1.285 17.00 1.500 16.06 1.970
24 24.00 22.126 0.937 23.00 0.500 21.56 1.220 20.93 1.535 20.93 1.535 19.31 2.345
30 30.00 29.00 0.500
36 36.00 35.00 0.500
42 42.00 41.00 0.500
48 48.00 47.00 0.500
27
Page 28
Class
TABLE A5 CAST IRON PIPE STANDARD CLASSES
Size
(Inches)
Class
25.80 25.80 26.32 26.32 26.90 26.90 27.76 27.76
O.D.
0.76 0.98 1.05 1.16 1.31 1.45 1.75 1.88
24”
24.28 24.02 24.22 24.00 24.28 24.00 24.26 24.00
31.74 32.00 32.40 32.74 33.10 33.46
O. D.
0.88 1.03 1.20 1.37 1.55 1.73
Wall
30”
29.98 29.94 30.00 30.00 30.00 30.00
I.D.
37.96 38.30 38.70 39.16 39.60 40.04
O.D.
0.99 1.15 1.36 1.58 1.80 2.02
Wall
36”
35.98 36.00 35.98 36.00 36.00 36.00
I.D.
44.20 44.50 45.10 45.58
O.D.
1.10 1.28 1.54 1.78
Wall
42”
42.00 41.94 42.02 42.02
I.D.
50.55 50.80 51.40 51.98
O.D.
1.26 1.42 1.71 1.99
Wall
48”
47.98 47.96 47.98 48.00
I.D.
56.66 57.10 57.80 58.40
O.D.
1.35 1.55 1.90 2.23
Wall
54”
53.96 54.00 54.00 53.94
I.D.
62.80 63.40 64.20 64.28
O.D.
1.39 1.67 2.00 2.38
Wall
60”
60.02 60.06 60.20 60.06
I.D.
75.34 76.00 76.88
O.D.
1.62 1.95 2.39
Wall
72”
72.10 72.10 72.10
I.D.
87.54 88.54
O.D.
1.72 2.22
Wall
84”
84.10 84.10
I.D.
28
ABCDEFGH ABCDEFGH
Size
(Inches)
O.D. 3.80 3.96 3.96 3.96
Wall 0.39 0.42 0.45 0.48 Wall
3”
I.D. 3.02 3.12 3.06 3.00 I.D.
O.D. 4.80 5.00 5.00 5.00
Wall 0.42 0.45 0.48 0.52
4”
I.D. 3.96 4.10 4.04 3.96
O.D. 6.90 7.10 7.10 7.10 7.22 7.22 7.38 7.38
Wall 0.44 0.48 0.51 0.55 0.58 0.61 0.65 0.69
6”
I.D. 6.02 6.14 6.08 6.00 6.06 6.00 6.08 6.00
O.D. 9.05 9.05 9.30 9.30 9.42 9.42 9.60 9.60
Wall 0.46 0.51 0.56 0.60 0.66 0.66 0.75 0.80
8”
I.D. 8.13 8.03 8.18 8.10 8.10 8.10 8.10 8.00
O.D. 11.10 11.10 11.40 11.40 11.60 11.60 11.84 11.84
Wail 0.50 0.57 0.62 0.68 0.74 0.80 0.86 0.92
10”
I.D. 10.10 9.96 10.16 10.04 10.12 10.00 10.12 10.00
O.D. 13.20 13.20 13.50 13.50 13.78 13.78 14.08 14.08
Wall 0.54 0.62 0.68 0.75 0.82 0.89 0.97 1.04
12”
I.D. 12.12 11.96 12.14 12.00 12.14 12.00 12.14 12.00
O.D. 15.30 15.30 15.65 15.65 15.98 15.98 16.32 16.32
Wall 0.57 0.66 0.74 0.82 0.90 0.99 1.07 1.16
14”
I.D. 14.16 13.98 14.17 14.01 14.18 14.00 14.18 14.00
O.D. 17.40 17.40 17.80 17.80 18.16 18.16 18.54 18.54
Wall 0.60 0.70 0.80 0.89 0.98 1.08 1.18 1.27
16”
I.D. 16.20 16.00 16.20 16.02 16.20 16.00 16.18 16.00
O.D. 19.50 19.50 19.92 19.92 20.34 20.34 20.78 20.78
Wall 0.64 0.75 0.87 0.96 1.07 1.17 1.28 1.39
I.D. 18.22 18.00 18.18 18.00 18.20 18.00 18.22 18.00
18”
09-VRX-UM-00408 07/12
O.D. 21.60 21.60 22.06 22.06 22.54 22.54 23.02 23.02
Wall 0.67 0.80 0.92 1.03 1.15 1.27 1.39 1.51
20”
I.D. 20.26 20.00 20.22 20.00 20.24 20.00 20.24 20.00
Page 29

Lining
Mortar
Class
Dbl. 0.375
Std . 0.1875
Dbl. 0.375
Std . 0.1875
Dbl. 0.375
Std . 0.1875
Dbl. 0.500
Std. 0.250
Dbl. 0.500
Std. 0.250
Dbl. 0.500
Std. 0.250
Dbl. 0.500
Std. 0.250
Dbl. 0.500
Std. 0.250
TABLE A6 DUCTILE IRON PIPE STANDARD CLASSES
Size
(Inches)
Lining
Mortar
Class
Wall 0.35 0.38 0.41 0.44 0.47 0.50 0.53
O.D. 19.50 19.50 19.50 19.50 19.50 19.50 19.50
18”
Dbl. 0.250
Std. 0.123
I.D. 18.80 18.74 18.68 18.62 18.56 18.50 18.44
O.D. 21.60 21.60 21.60 21.60 21.60 21.60 21.60
20”
Dbl. 0.250
Std. 0.123
0.38 0.41 0.44 0.47 0.50 0.53 0.56
25.80 25.80 25.80 25.80 25.80 25.80 25.80
Wall
O.D.
24”
Dbl. 0.250
Std. 0.123
25.04 24.98 24.92 24.86 24.80 24.74 24.68
I.D.
0.39 0.43 0.47 0.51 0.55 0.59 0.63
32.00 32.00 32.00 32.00 32.00 32.00 32.00
Wall
O. D.
30”
Std. 0.123
31.22 31.14 31.06 30.98 30.90 30.82 30.74
I.D.
Dbl. 0.250
0.43 0.48 0.62 0.58 0.45 0.68 0.73
38.30 38.30 38.30 38.30 38.30 38.30 38.30
Wall
O.D.
36”
Dbl. 0.250
Std. 0.123
37.44 37.34 37.06 37.14 37.40 36.94 36.48
I.D.
0.47 0.53 0.59 0.65 0.71 0.77 0.83
44.50 44.50 44.50 44.50 44.50 44.50 44.50
Wall
O.D.
42”
Dbl. 0.250
Std. 0.123
43.56 43.44 43.32 43.20 43.08 42.96 42.84
I.D.
0.51 0.58 0.65 0.72 0.79 0.86 0.93
50.80 50.80 50.80 50.80 50.80 50.80 50.80
Wall
O.D.
48”
Dbl. 0.375
Std . 0.1875
49.78 49.64 49.50 49.36 49.22 49.08 48.94
I.D.
0.57 0.65 0.73 0.81 0.89 0.97 1.05
57.10 57.10 57.10 57.10 57.10 57.10 57.10
Wall
O.D.
54”
Dbl. 0.375
Std . 0.1875
55.96 55.80 55.64 55.48 55.32 55.16 55.00
I.D.
09-VRX-UM-00408 07/12
50 51 52 53 54 55 56 50 51 52 53 54 55 56
Size
(Inches)
O.D. 3.96 3.96 3.96 3.96 3.96 3.96
Wall 0.25 0.28 0.31 0.34 0.37 0.41
3”
I.D. 3.46 3.40 3.34 3.28 3.22 3.14
O.D. 4.80 4.80 4.80 4.80 4.80 4.80
Wall 0.26 0.29 0.32 0.35 0.38 0.42 Wall 0.36 0.39 0.42 0.45 0.48 0.51 0.54
4”
I.D. 4.28 4.22 4.16 4.10 4.04 3.93 I.D. 20.88 20.82 20.76 20.70 20.64 20.58 20.52
O.D. 6.90 6.90 6.90 6.90 6.90 6.90 6.90
Wall 0.25 0.28 0.31 0.34 0.37 0.40 0.43
6”
I.D. 6.40 6.34 6.28 6.22 6.16 6.10 6.04
O.D. 9.05 9.05 9.05 9.05 9.05 9.05 9.05
Wall 0.27 0.30 0.33 0.36 0.39 0.42 0.45
8”
I.D. 8.51 8.45 8.39 8.33 8.27 8.21 8.15
O.D. 11.10 11.10 11.10 11.10 11.10 11.10 11.10
Wail 0.39 0.32 0.35 0.38 0.41 0.44 0.47
10”
I.D. 10.32 10.46 10.40 10.34 10.28 10.22 10.16
O.D. 13.20 13.20 13.20 13.20 13.20 13.20 13.20
Wall 0.31 0.34 0.37 0.40 0.43 0.46 0.49
12”
I.D. 12.58 12.52 12.46 12.40 12.34 12.28 12.22
O.D. 15.30 15.30 15.30 15.30 15.30 15.30 15.30
Wall 0.33 0.36 0.39 0.42 0.45 0.48 0.51
14”
I.D. 14.64 14.58 14.52 14.46 14.40 14.34 14.28
O.D. 17.40 17.40 17.40 17.40 17.40 17.40 17.40
Wall 0.34 0.37 0.40 0.43 0.46 0.49 0.52
16”
I.D. 16.72 16.66 16.60 16.54 16.48 16.42 16.36
29
Page 30
ALUMINUM
Copper &
Brass Pipe
COPPER TUBING
O D 8.125 8.125 8.125 8.625 8 000
8”
0. D. 10 000
10”
Nominal
Diameter
ALUMINUM
O. D. 3.625 3.625 3.625 4.000
3½”
O. D. 4.125 4.125 4.125 4.500 4.000
4”
O D. 5.000
4-½”
0. D. 5.125 5.125 5.125 5.563 5.000
5”
0. D. 6.125 6.125 6.125 6.625 6.000
6”
O. D 7.625 7.000
7”
TABLE A7 TUBING SCHEDULES
Copper &
Brass Pipe
Type Type
30
COPPER TUBING
KLM KLM
I.D. 0.527 0.545 0.569 0.625 I.D. 3.385 3.425 3.459 3.500
Wall 0.049 0.040 0.028 0.108 Wall 0.120 0.100 0.083 0.250
O. D. 0.625 0.625 0.625 0.840
Nominal
Diameter
1/2”
O. D. 0.750 0.750 0.750
Wall 0.049 0.042 0.030 Wall 0.063 0.134 0.110 0.095 0.250
5/8”
I.D. 0.652 0.666 0.690 I. D. 3 874 3.857 3.905 3.935 4.000
O. D. 0.875 0.875 0.875 1.050
Wall 0.065 0.045 0.032 0.114 Wall 0.250
3/4”
I.D. 0.745 0.785 0.811 0.822 I. D. 4.500
O. D. 1.125 1.125 1.125 1.315
Wall 0.065 0.050 0.035 0.127 Wall 0.160 0.125 0.109 0.250 0.063
1”
I.D. 0.995 1.025 1.055 1.062 I. D. 4.805 4.875 4.907 5.063 4.874
O. D. 1.375 1.375 1.375 1.660
Wail 0.065 0.055 0.042 0.146 Wall 0.192 0.140 0.122 0.250 0.063
1-¼”
I.D. 1.245 1.265 1.291 1.368 ID. 5.741 5.845 5.881 6.125 5.874
O. D. 1.625 1.625 1.625 1.900
Wall 0.072 0.060 0.027 0.150 Wall 0.282 0.078
1-½”
I.D. 1.481 1.505 1.571 1.600 I. D. 7.062 6.844
O. D. 2.125 2.125 2.125 2.375
Wall 0.083 0.070 0.058 0.157 Wall 0,271 0.200 0.170 0.313 0.094
2”
I.D. 1.959 1.985 2.009 2.062 I. D. 7.583 7.725 7.785 8.000 7.812
I.D. 2.435 2.465 2.495 2.500 2.400 I. D. 9.812
Wall 0.095 0.080 0.065 0.188 0.050 Wall 0.094
O. D. 2.625 2.625 2.625 2.875 2.500
2 ½”
09-VRX-UM-00408 07/12
O. D. 3.125 3.125 3.125 3.500 3.000
Wall 0.109 0.090 0.072 0.219 0.050
3”
I.D. 2.907 2.945 2.981 3.062 2.900
Page 31

Badger Meter Warranty
Series RNL Insertion Liquid
PRODUCTS COVERED
The Badger Meter warranty shall apply to the Racine
Vortex RNL Series Insertion Liquid Flow Meter
(“Product”).
MATERIALS AND WORKMANSHIP
Badger Meter warrants the Product to be free from
defects in materials and workmanship for a period
of 12 months from the original purchase date.
PRODUCT RETURNS
Product failures must be proven and verified to
the satisfaction of Badger Meter. The Badger Meter
obligation hereunder shall be limited to such
repair and replacement and shall be conditioned
upon Badger Meter receiving written notice of
any asserted defect within 10 (ten) days after its
discovery. If the defect arises and a valid claim is
received within the Warranty Period, at its option,
Badger Meter will either (1) exchange the Product
with a new, used or refurbished Product that is
at least functionally equivalent to the original
Product, or (2) refund the purchase price of the
Product. DO NOT RETURN ANY PRODUCT UNTIL
YOU HAVE CALLED THE BADGER METER CUSTOMER
SERVICE DEPARTMENT AND OBTAINED A RETURN
AUTHORIZATION.
Product returns must be shipped by the Customer
prepaid F.O.B. to the nearest Badger Meter factory
or distribution center. The Customer shall be
responsible for all direct and indirect costs associated
with removing the original Product and reinstalling
the repaired or replacement Product. A replacement
Product assumes the remaining warranty of the
original Product or ninety (90) days from the date of
replacement, whichever provides longer coverage.
LIMITS OF LIABILITY
This warranty shall not apply to any Product
repaired or altered by any Product other than
Badger Meter. The foregoing warranty applies
only to the extent that the Product is installed,
serviced and operated strictly in accordance with
Badger Meter instructions. The warranty shall not
apply and shall be void with respect to a Product
exposed to conditions other than those detailed
in applicable technical literature and Installation
and Operation Manuals (IOMs) or which have been
subject to vandalism, negligence, accident, acts
of God, improper installation, operation or repair,
alteration, or other circumstances which are beyond
the reasonable control of Badger Meter.
With respect to products not manufactured by
Badger Meter, the warranty obligations of Badger
Meter shall in all respects conform and be limited
to the warranty extended to Badger Meter by the
supplier.
THE FOREGOING WARRANTIES ARE EXCLUSIVE
AND IN LIEU OF ALL OTHER EXPRESS AND
IMPLIED WARRANTIES WHATSOEVER, INCLUDING
BUT NOT LIMITED TO IMPLIED WARRANTIES OF
MERCHANTABILITY AND FITNESS FOR A PARTICULAR
PURPOSE (except warranties of title).
Any description of a Product, whether in writing
or made orally by Badger Meter or its agents,
specifications, samples, models, bulletins, drawings,
diagrams, engineering sheets or similar materials
used in connection with any Customer’s order are
for the sole purpose of identifying the Product
and shall not be construed as an express warranty.
Any suggestions by Badger Meter or its agents
regarding use, application or suitability of the
Product shall not be construed as an express
warranty unless confirmed to be such, in writing, by
Badger Meter.
EXCLUSION OF CONSEQUENTIAL DAMAGES AND
DISCLAIMER OF OTHER LIABILITY
Badger Meter liability with respect to breaches of
the foregoing warranty shall be limited as stated
herein. Badger Meter liability shall in no event
exceed the contract price. BADGER METER SHALL
NOT BE SUBJECT TO AND DISCLAIMS: (1) ANY
OTHER OBLIGATIONS OR LIABILITIES ARISING OUT
OF BREACH OF CONTRACT OR OF WARRANTY, (2)
ANY OBLIGATIONS WHATSOEVER ARISING FROM
TORT CLAIMS (INCLUDING NEGLIGENCE AND
STRICT LIABILITY) OR ARISING UNDER OTHER
THEORIES OF LAW WITH RESPECT TO PRODUCTS
SOLD OR SERVICES RENDERED BY BADGER METER,
OR ANY UNDERTAKINGS, ACTS OR OMISSIONS
RELATING THERETO, AND (3) ALL CONSEQUENTIAL,
INCIDENTAL AND CONTINGENT DAMAGES
WHATSOEVER.
09-VRX-UM-00408 07/12
Badger Meter Warranty
31
Page 32

Trademarks appearing in this document are the property of their respective entities.
Due to continuous research, product improvements and enhancements, Badger Meter reserves the right to change produc t or system speci cations without notice, except to the extent an outstanding
contractual obligation exists. © 2012 Badger Meter, Inc. All rights reserved.
info@racinevortex.com | www.racinevortex.com | www.badgermeter.com
Phone: 262-639-6770 | Fax: 262-417-1155
The Americas | Badger Meter | 4545 West Brown Deer Rd | PO Box 245036 | Milwaukee, WI 53224-9536 | 800-876-3837 | 414-355-0400
México | Badger Meter de las Americas, S.A. de C.V. | Pedro Luis Ogazón N°32 | Esq. Angelina N°24 | Colonia Guadalupe Inn | CP 01050 | México, DF | México | +52-55-5662-0882
Europe, Middle East and Africa | Badger Meter Europa GmbH | Nurtinger Str 76 | 72639 Neuffen | Germany | +49-7025-9208-0
Czech Republic | Badger Meter Czech Republic s.r.o. | Maříkova 2082/26 | 621 00 Brno, Czech Republic | +420-5-41420411
Slovakia | Badger Meter Slovakia s.r.o. | Racianska 109/B | 831 02 Bratislava, Slovakia | +421-2-44 63 83 01
Asia Pacific | Badger Meter | 80 Marine Parade Rd | 21-04 Parkway Parade | Singapore 449269 | +65-63464836
China | Badger Meter | Rm 501, N° 11 Longyue Apartment | N° 180 Longjin Rd, Jiuting Songjiang District | Shanghai, China | 201615 | +86-21-5763 5412
 Loading...