

Page 1
ReadCenter® Analytics & Analytics Mobile
Reading Data Management Software
RDC-UM-00936-EN-04 (June 2014)
User Manual
Page 2

ReadCenter® Analytics & Analytics Mobile
Page ii June 2014
Page 3

User Manual
CONTENTS
INTRODUCTION . . . . . . . . . . . . . . . . . . . . . . . . . . . . . . . . . . . . . . . . . . . . . . . . . . . . . . . . .5
OVERVIEW OF READCENTER ANALYTICS AND ANALYTICS MOBILE. . . . . . . . . . . . . . . . . . . . . . . .7
PROGRAM STARTUP . . . . . . . . . . . . . . . . . . . . . . . . . . . . . . . . . . . . . . . . . . . . . . . . . . . . . .9
MAIN SCREEN . . . . . . . . . . . . . . . . . . . . . . . . . . . . . . . . . . . . . . . . . . . . . . . . . . . . . . . . . 10
SYSTEM OUTLINE . . . . . . . . . . . . . . . . . . . . . . . . . . . . . . . . . . . . . . . . . . . . . . . . . . . . . . . 12
PART II: READING CYCLE
FIXED AND MOBILE READING CYCLES. . . . . . . . . . . . . . . . . . . . . . . . . . . . . . . . . . . . . . . . . .14
SAVE/CLEAR READS . . . . . . . . . . . . . . . . . . . . . . . . . . . . . . . . . . . . . . . . . . . . . . . . . . . . . 15
READ INPUT FILE . . . . . . . . . . . . . . . . . . . . . . . . . . . . . . . . . . . . . . . . . . . . . . . . . . . . . . . 16
APPLY GATEWAY READINGS TO THE CUSTOMER ACCOUNT RECORDS . . . . . . . . . . . . . . . . . . . . . 18
LOAD COLLECTORS. . . . . . . . . . . . . . . . . . . . . . . . . . . . . . . . . . . . . . . . . . . . . . . . . . . . . .19
Work Items . . . . . . . . . . . . . . . . . . . . . . . . . . . . . . . . . . . . . . . . . . . . . . . . . . . . . . . . .19
UNLOAD COLLECTORS . . . . . . . . . . . . . . . . . . . . . . . . . . . . . . . . . . . . . . . . . . . . . . . . . . . 23
ROUTE READING REPORTS / RUN REPORTS . . . . . . . . . . . . . . . . . . . . . . . . . . . . . . . . . . . . . . 25
WRITE OUTPUT FILE . . . . . . . . . . . . . . . . . . . . . . . . . . . . . . . . . . . . . . . . . . . . . . . . . . . . . 26
PART III: REPORTS AND ANALYTICS
GATEWAY READING REPORTS . . . . . . . . . . . . . . . . . . . . . . . . . . . . . . . . . . . . . . . . . . . . . . . 28
CUSTOM REPORTS . . . . . . . . . . . . . . . . . . . . . . . . . . . . . . . . . . . . . . . . . . . . . . . . . . . . . . 34
ANALYTICS . . . . . . . . . . . . . . . . . . . . . . . . . . . . . . . . . . . . . . . . . . . . . . . . . . . . . . . . . . . 39
Network Analysis . . . . . . . . . . . . . . . . . . . . . . . . . . . . . . . . . . . . . . . . . . . . . . . . . . . . .39
Account Analytics. . . . . . . . . . . . . . . . . . . . . . . . . . . . . . . . . . . . . . . . . . . . . . . . . . . . .42
Gateway Reading Summary . . . . . . . . . . . . . . . . . . . . . . . . . . . . . . . . . . . . . . . . . . . . . . 46
PART IV: ACCOUNTS AND SYSTEM SETTINGS
ACCOUNTS AND SYSTEM SETTINGS . . . . . . . . . . . . . . . . . . . . . . . . . . . . . . . . . . . . . . . . . . .50
Account Records . . . . . . . . . . . . . . . . . . . . . . . . . . . . . . . . . . . . . . . . . . . . . . . . . . . . . 51
Account Groups . . . . . . . . . . . . . . . . . . . . . . . . . . . . . . . . . . . . . . . . . . . . . . . . . . . . . .62
Collected Readings . . . . . . . . . . . . . . . . . . . . . . . . . . . . . . . . . . . . . . . . . . . . . . . . . . . .66
Handheld and Laptop Settings . . . . . . . . . . . . . . . . . . . . . . . . . . . . . . . . . . . . . . . . . . . . 68
Page iii June 2014
Page 4

ReadCenter® Analytics & Analytics Mobile
Endpoint Settings . . . . . . . . . . . . . . . . . . . . . . . . . . . . . . . . . . . . . . . . . . . . . . . . . . . . 71
Adding and Managing a Gateway . . . . . . . . . . . . . . . . . . . . . . . . . . . . . . . . . . . . . . . . . .75
Account Table Setup . . . . . . . . . . . . . . . . . . . . . . . . . . . . . . . . . . . . . . . . . . . . . . . . . . . 84
Batch Processing . . . . . . . . . . . . . . . . . . . . . . . . . . . . . . . . . . . . . . . . . . . . . . . . . . . . . 85
APPENDIX
SYSTEM REQUIREMENTS . . . . . . . . . . . . . . . . . . . . . . . . . . . . . . . . . . . . . . . . . . . . . . . . . . 90
SOFTWARE FUNCTION DETAILED DESCRIPTION . . . . . . . . . . . . . . . . . . . . . . . . . . . . . . . . . . . 92
CODES . . . . . . . . . . . . . . . . . . . . . . . . . . . . . . . . . . . . . . . . . . . . . . . . . . . . . . . . . . . . . . 93
Read Type/Read Method Codes . . . . . . . . . . . . . . . . . . . . . . . . . . . . . . . . . . . . . . . . . . . .93
Billing Interface Codes . . . . . . . . . . . . . . . . . . . . . . . . . . . . . . . . . . . . . . . . . . . . . . . . . .94
Valid Serial Numbers . . . . . . . . . . . . . . . . . . . . . . . . . . . . . . . . . . . . . . . . . . . . . . . . . . .94
Read Resolution Codes (also known as Test Circle Codes). . . . . . . . . . . . . . . . . . . . . . . . . . . .95
Gas Drive Circle Codes . . . . . . . . . . . . . . . . . . . . . . . . . . . . . . . . . . . . . . . . . . . . . . . . . .95
USING THE TOOL BARS . . . . . . . . . . . . . . . . . . . . . . . . . . . . . . . . . . . . . . . . . . . . . . . . . . . 96
RADIX HANDHELD FILE TRANSFER. . . . . . . . . . . . . . . . . . . . . . . . . . . . . . . . . . . . . . . . . . . .99
READALL HANDHELD FILE TRANSFER. . . . . . . . . . . . . . . . . . . . . . . . . . . . . . . . . . . . . . . . .102
MINI MOBILE INTERROGATOR MMI FILE TRANSFER . . . . . . . . . . . . . . . . . . . . . . . . . . . . . . . 105
BACKUP OPERATION . . . . . . . . . . . . . . . . . . . . . . . . . . . . . . . . . . . . . . . . . . . . . . . . . . . . 107
TROUBLESHOOTING . . . . . . . . . . . . . . . . . . . . . . . . . . . . . . . . . . . . . . . . . . . . . . . . . . . . 108
TECHNICAL SUPPORT . . . . . . . . . . . . . . . . . . . . . . . . . . . . . . . . . . . . . . . . . . . . . . . . . . . 110
Page iv June 2014
Page 5

User Manual
INTRODUCTION
Audience and Purpose
The ReadCenter® Analytics and Analytics Mobile Reading Data Management User Manual is intended for water and gas utility
reading data management software operators to set up, configure and use ReadCenter Analytics or Analytics Mobile reading
data management software with ORION® and GALAXY® fixed network and/or mobile meter reading systems. The ReadCenter
software is used for sending data to, and collecting and analyzing data from, Badger Meter ORION, GALAXY AMI, touch and
manual read systems.
About this Manual
The manual is arranged as follows:
• Part I: Overall Operation
Part I features basic information about the overall operation of ReadCenter Analytics and Analytics Mobile including an
overview of the software functions and program startup information.
• Part II: Reading Cycle
Part II is the user guide that provides the process details for using the software to manage the daily meter reading
cycle operations.
• Part III: Reports and Analytics
Part III explains how to review and analyze collected data and create customized reports and charts.
• Part IV: Accounts and System Settings
Part IV describes set up and maintenance procedures that are performed one time or as needed for customer accounts,
meter reading devices, endpoints and gateways.
• Appendix
The Appendix includes system requirements, the file transfer process using alternate types of hardware, troubleshooting
and additional product information.
Typographic Conventions
Items on the software screens that you will be asked to select or choose by clicking a button, highlighting, checking a box or
another similar means are in bold text and capitalized in the manual.
Example: Click once on the View Report button.
Names of options, boxes, columns, fields, and sections are italicized. In most cases, first letters will be capitalized.
Example: The information is noted in the Meter Reading Cycle field.
Messages and special markings are italicized and in quotation marks, with first letters capitalized.
Examples: “Service Stopped” and "Unread"
OTE:N Names, addresses and other customer-related information displayed in examples of screens were created for
demonstration purposes in this manual. No actual customer information is used.
Fixed and Mobile System Networks
• Sections of the manual dedicated to gateway setup and management are marked Fixed Network Only.
• Sections of the manual dedicated to mobile system setup and management are marked Mobile Only.
• Sections of the manual that are not marked Fixed Network Only or Mobile Only are for all users.
OTE:N Customers who have both fixed and mobile reading systems should use the entire manual.
Page 5 June 2014
Page 6

ReadCenter® Analytics & Analytics Mobile
Part I: Overall Operations
Page 6 June 2014
Page 7

User Manual
OVERVIEW OF READCENTER ANALYTICS AND ANALYTICS MOBILE
ReadCenter Analytics and Analytics Mobile are reading data management software applications that provide a central
location for performing a variety of meter reading tasks and allow sharing across the meter reading solutions offered by
Badger Meter.
ReadCenter Analytics reading data management software manages and provides analysis of data collected from the following
Badger Meter reading systems:
• ORION Fixed Network (SE) network gateway transceiver (ReadCenter Analytics only)
• ORION Migratable (ME) and Classic (CE) mobile and handheld systems
• ORION CE gateway receiver (ReadCenter Analytics only)
• GALAXY® fixed network systems (ReadCenter Analytics only)
• BadgerTouch® and competitive touch modules
• Manual reads from Read-o-Matic® and local read registers
ReadCenter Analytics Mobile reading data management software manages and provides analysis of data collected from the
following Badger Meter reading systems:
• ORION Migratable (ME) and Classic (CE) mobile and handheld systems
• BadgerTouch and competitive touch modules
• Manual reads from Read-o-Matic and local read registers
ReadCenter Analytics ReadCenter Analytics Mobile
Designed for managing both fixed and mobile meter
reading networks.
The software application has three parts that can run on
one computer or on separate computers:
• A server (Monitor) handles communication with
gateways
• Integrated custom report builder
• Database server stores information
Designed for managing a mobile meter reading network.
The software application has two main parts.
• Integrated custom report builder
• Database server stores information
Meter Data Management System (MDMS)
ReadCenter Analytics and Analytics Mobile works with the system already in place at your organization for maintaining
customer data, such as names, addresses and serial numbers. This system may be known as a Meter Data Management
System (MDMS), Utility Billing System, Customer Information System or other type of system.
Page 7 June 2014
Page 8
ReadCenter® Analytics & Analytics Mobile
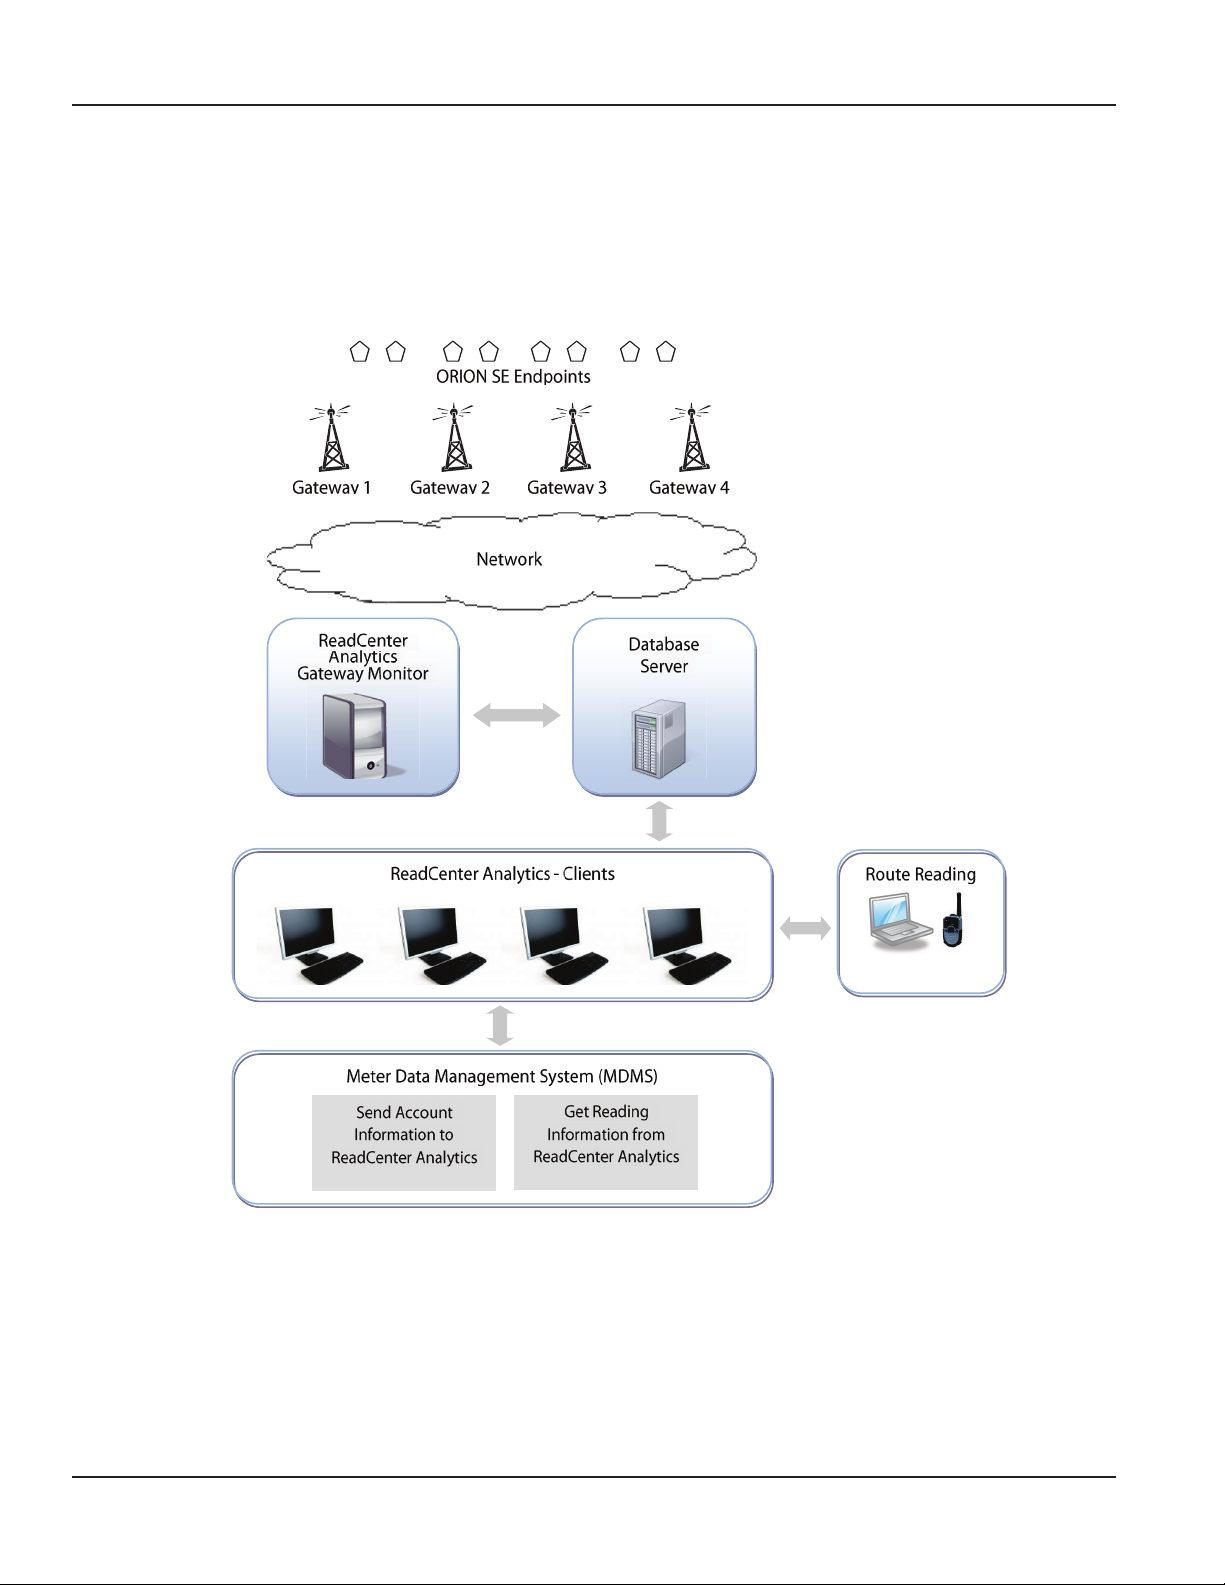
System Diagram
The diagram below visually displays how the various parts of the system interact.
Page 8 June 2014
Page 9
PROGRAM STARTUP
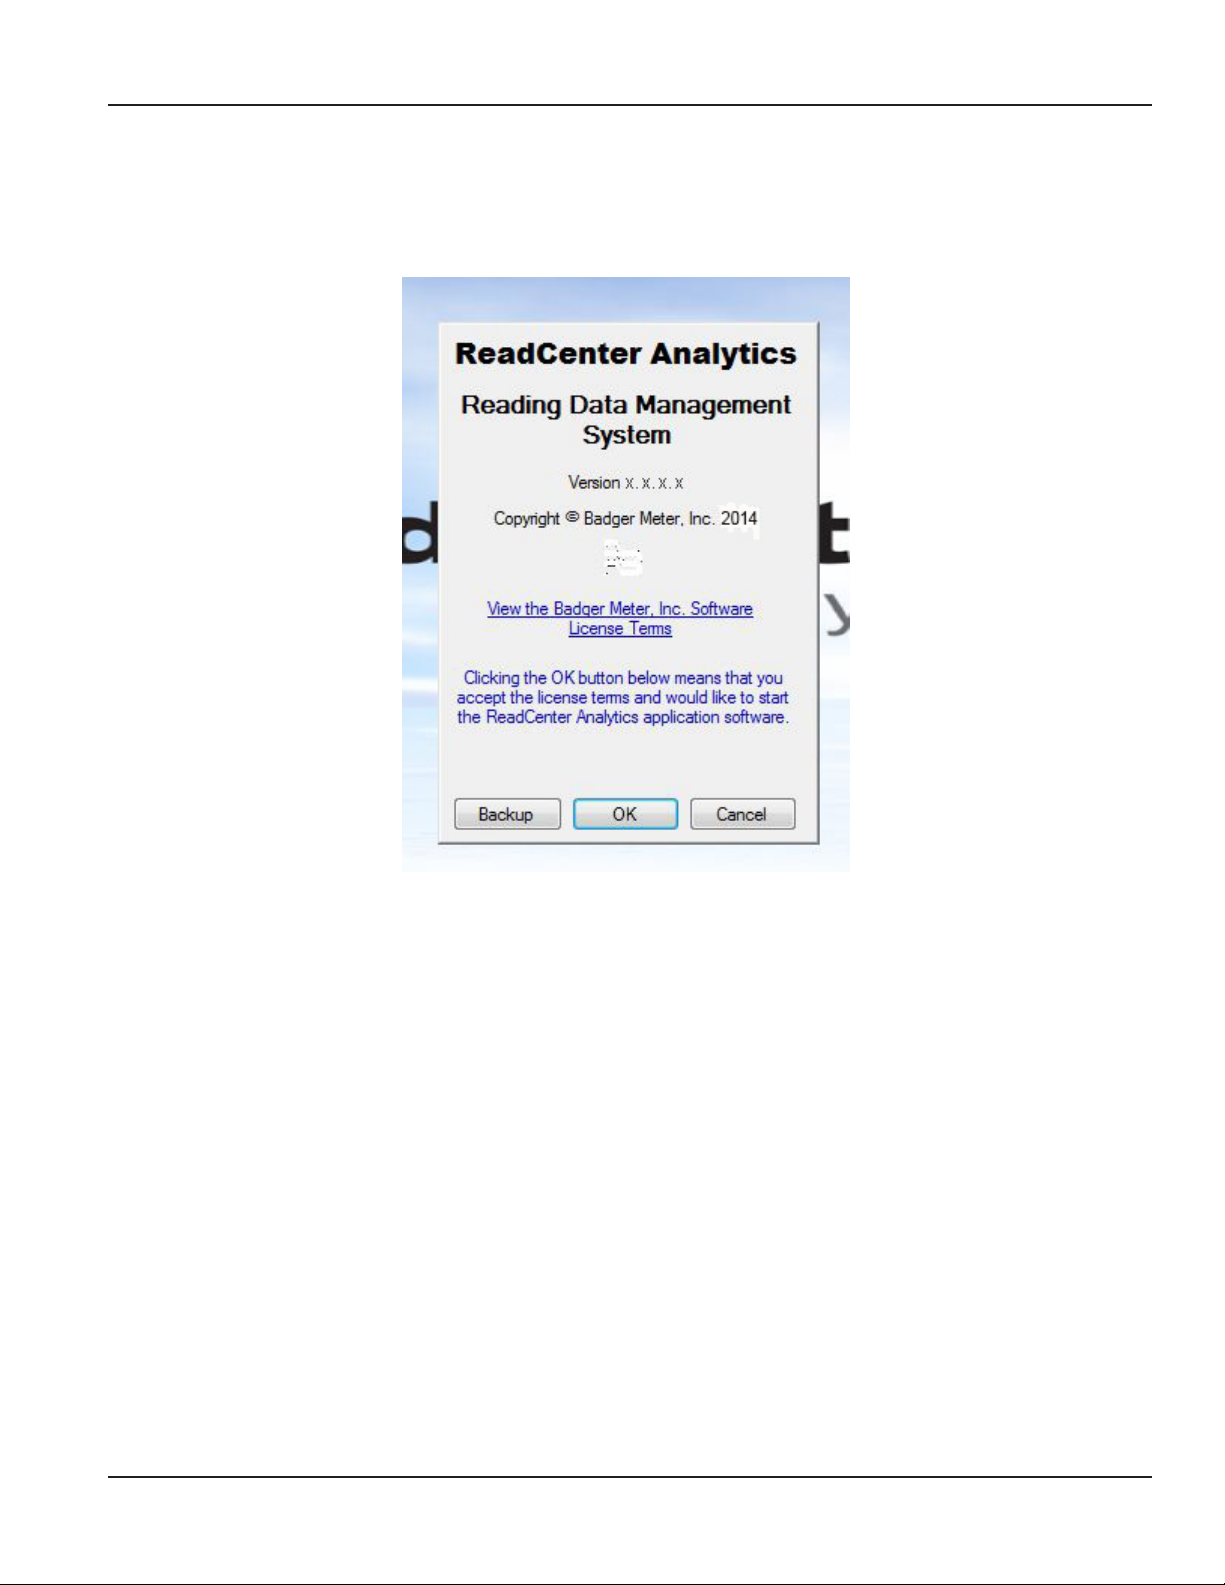
1. Double-click the ReadCenter Analytics or Analytics Mobile icon on the desktop to start the program.
Result: ReadCenter Analytics opens with the startup window displayed. The current software version number is listed below
the title.
User Manual
Clicking Backup makes a copy of the current database files. Refer to "Backup Operation" onpage107 for details.
OTE:N Depending on your setup, this option may not be available.
Clicking Cancel ends the program.
2. Click OK to accept the software license terms and start ReadCenter Analytics software application.
Result: The startup window closes and the ReadCenter Analytics main screen displays.
Page 9 June 2014
Page 10
ReadCenter® Analytics & Analytics Mobile
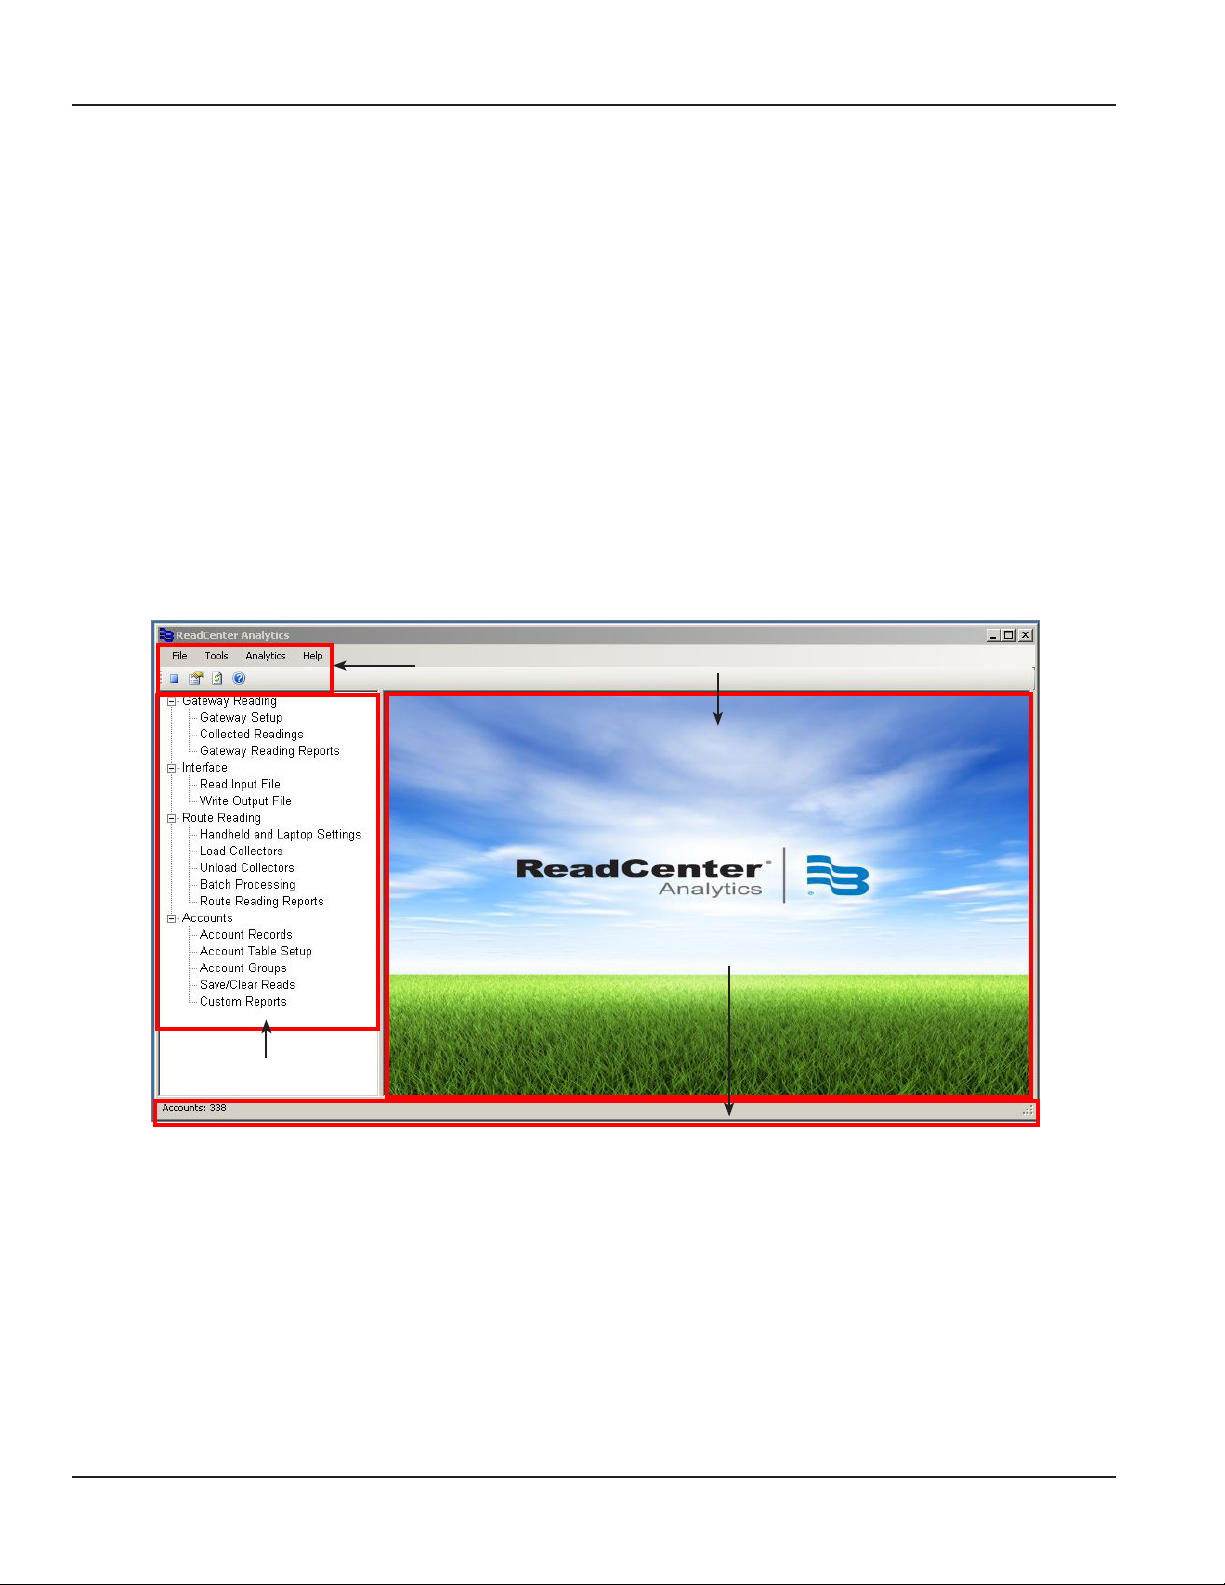
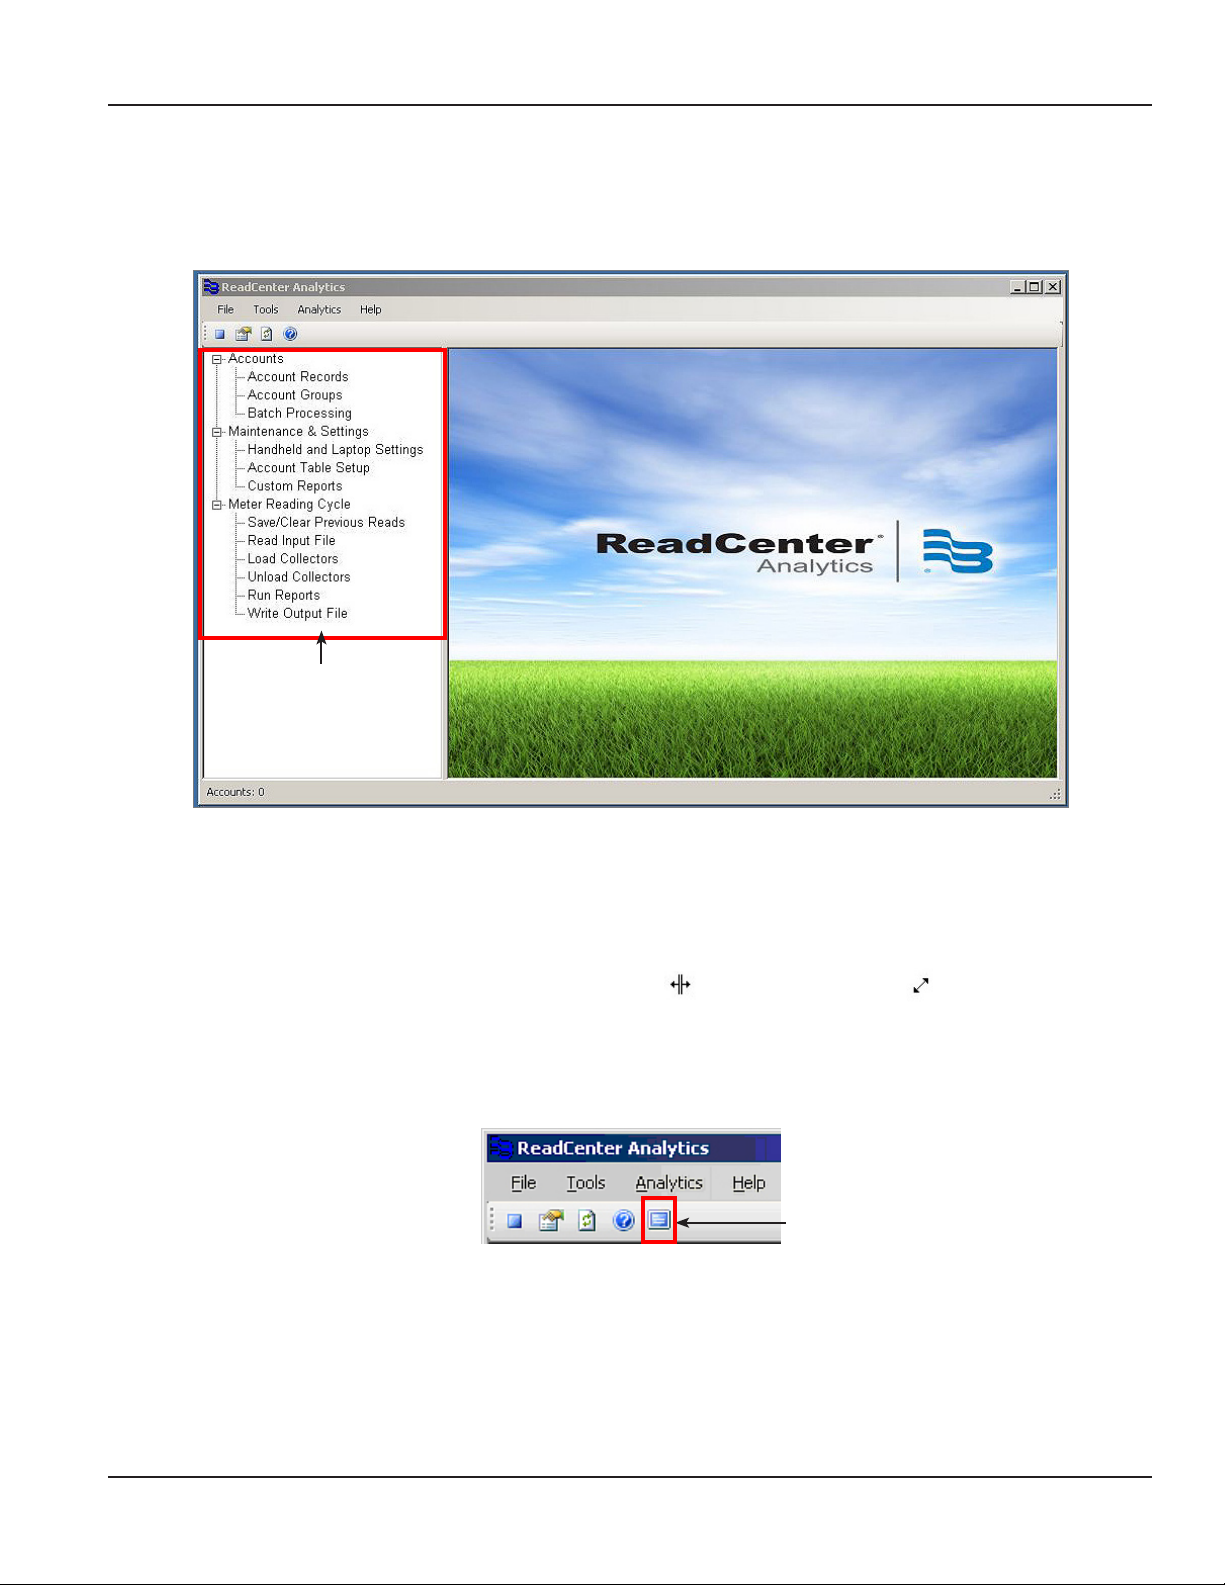
MAIN SCREEN
The main screen in ReadCenter Analytics and Analytics Mobile is a multiple document interface (MDI) form that holds various
function screens and has the following features:
• Left pane displays the main ReadCenter Analytics or Analytics Mobile main menu with links to top-level functions.
• Main viewing pane (right) contains the software name and displays the selected function screen.
• The main menu bar and tool bar at the top provide access to system configuration settings and analytics features.
• The status bar at the bottom displays messages related to active processes.
OTE:N Based on licensing, information may vary or the status bar may be blank.
For more information about the tool bars, refer to "Using the Tool Bars" onpage96.
ReadCenter Analytics Main Screen
The ReadCenter Analytics main screen is shown below. Each screen section is outlined and identified.
OTE:N An image of the ReadCenter Analytics Mobile main screen is shown on the next page.
Main Menu
Main Menu Bar
and Tool Bar
ReadCenter Analytics Main Screen
Main Viewing Pane
Status Bar
Page 10 June 2014
Page 11
User Manual
ReadCenter Analytics Mobile Main Screen
The ReadCenter Analytics Mobile main screen has the same layout and functionality as the ReadCenter Analytics main screen
shown on the previous page. However, the main menu in the left pane is different since it includes those functions designed
for use exclusively with a mobile meter reading network.
Main Menu
ReadCenter Analytics Mobile Main Screen
Sizing Screens and Windows
The ReadCenter Analytics screen is a collection of individual windows. Each screen that displays in the main viewing pane is a
separate window.
Some windows are static, but many windows can be resized to display more or less information. Move the cursor over the
edge of a window (screen) until the cursor changes to a cross hair ( ) or double-sided arrow ( ). Then click the left mouse
button and drag to resize the window.
In addition, some windows can be maximized to fill the entire viewing pane. If a window can be maximized, the "fill" icon
displays in the icon tool bar at the top of the screen as shown below. For additional details about the "fill" icon and other tool
bar features, refer to "Main Menu and Tool Bar" onpage96.
Fill the viewing pane
Page 11 June 2014
Page 12

ReadCenter® Analytics & Analytics Mobile
SYSTEM OUTLINE
The software is laid out in sections and grouped according to task. The table below outlines the tasks and sections as they are
organized in the software application.
ReadCenter Analytics ReadCenter Analytics Mobile
Main Menu
Gateway Reading
Configure and manage the gateway reading process.
• Gateway Setup
• Collected Readings
• Gateway Reading Reports
Interface
Associate customer information to meter readings and provide
information for billing.
• Read Input File
• Write Output File
Route Reading
Perform the mobile route reading process if this is to be done in
addition to (fixed) gateway reading.
• Handheld and Laptop Settings
• Load Collectors
• Unload Collectors
• Batch Processing
• Route Reading Reports
Accounts
Define, view, search and group accounts.
• Account Records
• Account Table Setup
• Account Groups
• Save/Clear Reads
• Custom Reports
Main Menu
Accounts
Define, view, search and group accounts.
• Account Records
• Account Groups
• Batch Processing
Maintenance & Settings
Associate customer information to meter readings and provide
information for billing.
• Handheld and Laptop Settings
• Account Table Setup
• Custom Reports
Meter Reading Cycle
Perform the mobile route reading process.
• Save/Clear Previous Reads
• Read Input File
• Load Collectors
• Unload Collectors
• Run Reports
• Write Output File
Main Menu Bar
Analytics
Track, chart and monitor consumption patterns and design alerts
for comprehensive mobile system management. Analytics is a
selection in the main menu bar.
• Account Analytics
Main Menu Bar
Analytics
Track, chart and monitor consumption patterns and design
alerts for comprehensive fixed and mobile system management.
Analytics is a selection in the main menu bar.
• Network Analysis
• Account Analytics
• Gateway Reading Summary
Tools
Define system settings including collection methods and endpoint
types. Tools is a selection in the main menu bar.
• System Configuration
• Interface File Formats
• Endpoint Settings
Page 12 June 2014
Tools
Define system settings including collection methods and endpoint
types. Tools is a selection in the main menu bar.
• System Configuration
• Interface File Formats
Page 13

User Manual
Part II: Reading Cycle
Page 13 June 2014
Page 14
Prepare a file for
(Export or Download)
Data Collection
Write Output File
Save/Clear Reads
ReadCenter® Analytics & Analytics Mobile
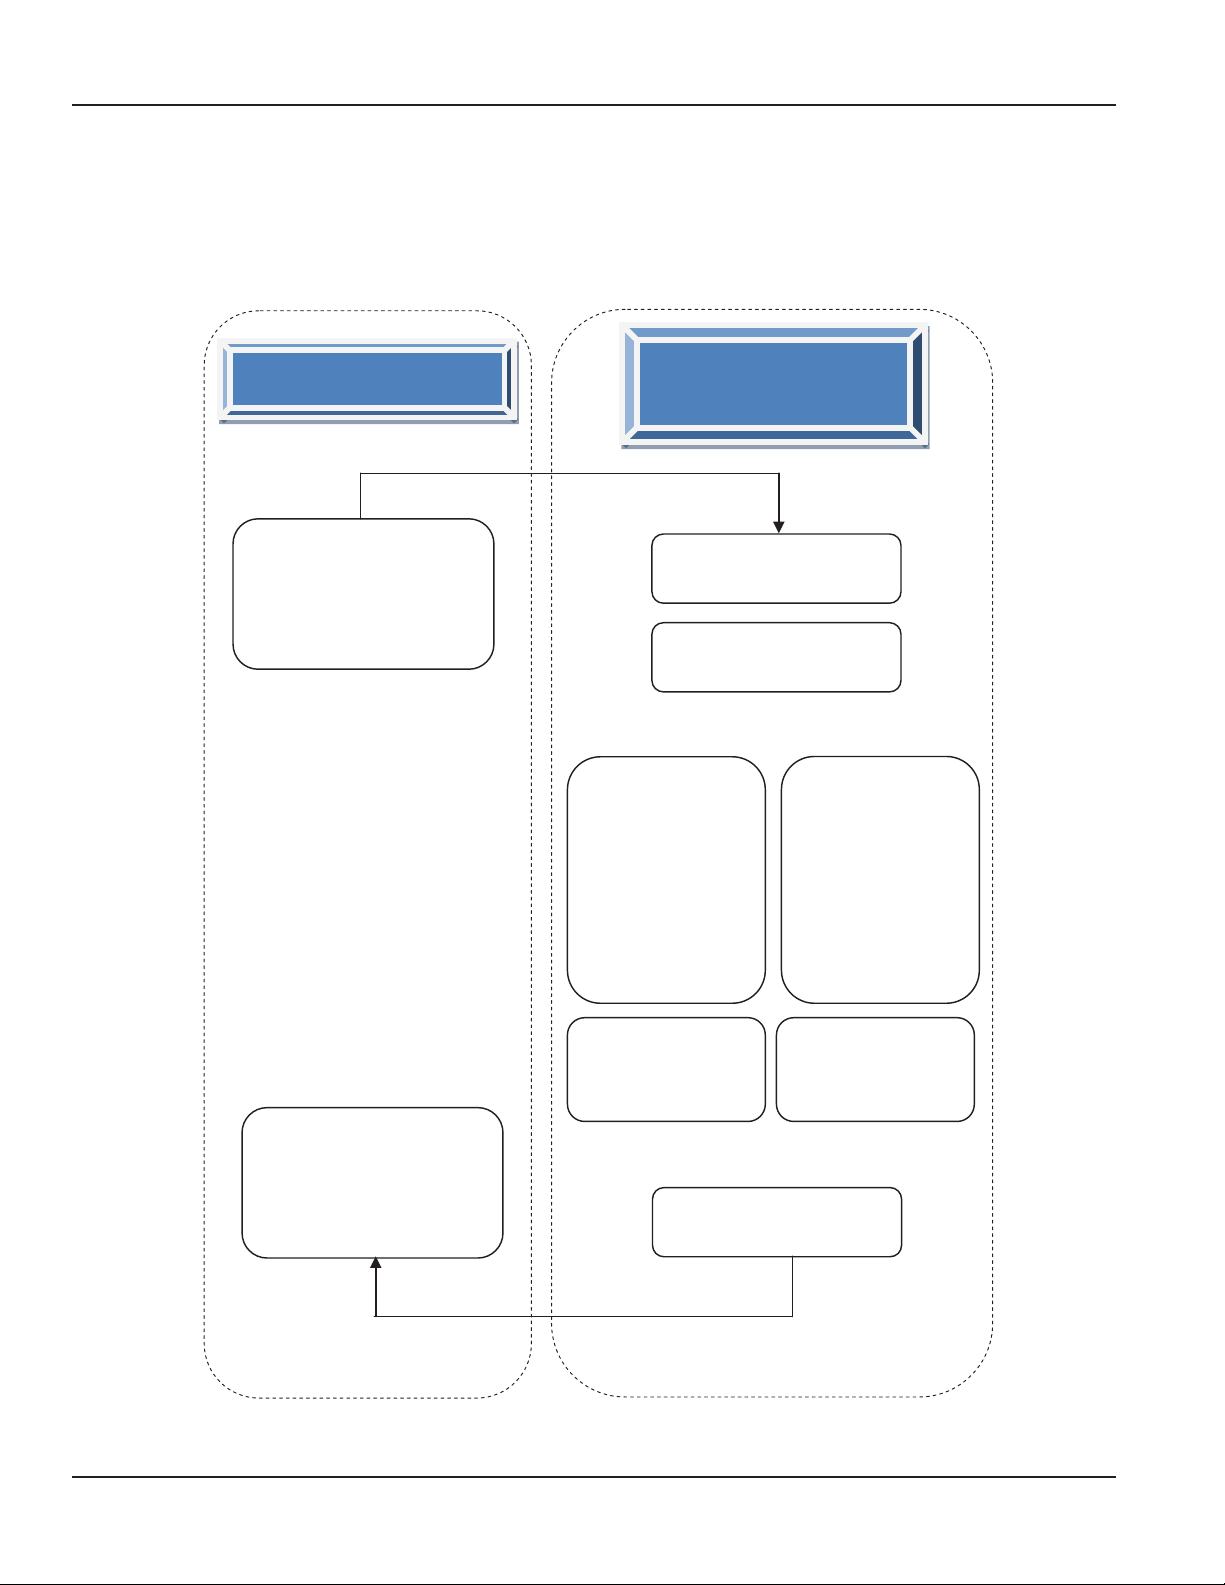
FIXED AND MOBILE READING CYCLES
When preparing a file for ReadCenter Analytics, it is important that each reading cycle is processed in the order described
here. Start by creating a download file from the billing system.
OTE:N Remember to define and modify new endpoint settings or convert ORION ME migratable endpoints to report as
ORION SE fixed endpoints, if applicable. Refer to "Endpoint Settings" onpage71 for additional information.
Billing System
ReadCenter Analytics or
Analytics Mobile
ReadCenter Analytics
& Analytics Mobile
Read Input File
FIXED
Open Gateway
Reading Reports
Select "Last Read"
Choose End Date &
Period
Click "Run Report"
Click "Apply"
MOBILE
Load Collectors
Unload Collectors
FIXED
Route Reading
MOBILE
Run Reports
Reports
Process the file from
ReadCenter Analytics
Write a File for Billing
(Import or Upload)
Page 14 June 2014
Page 15
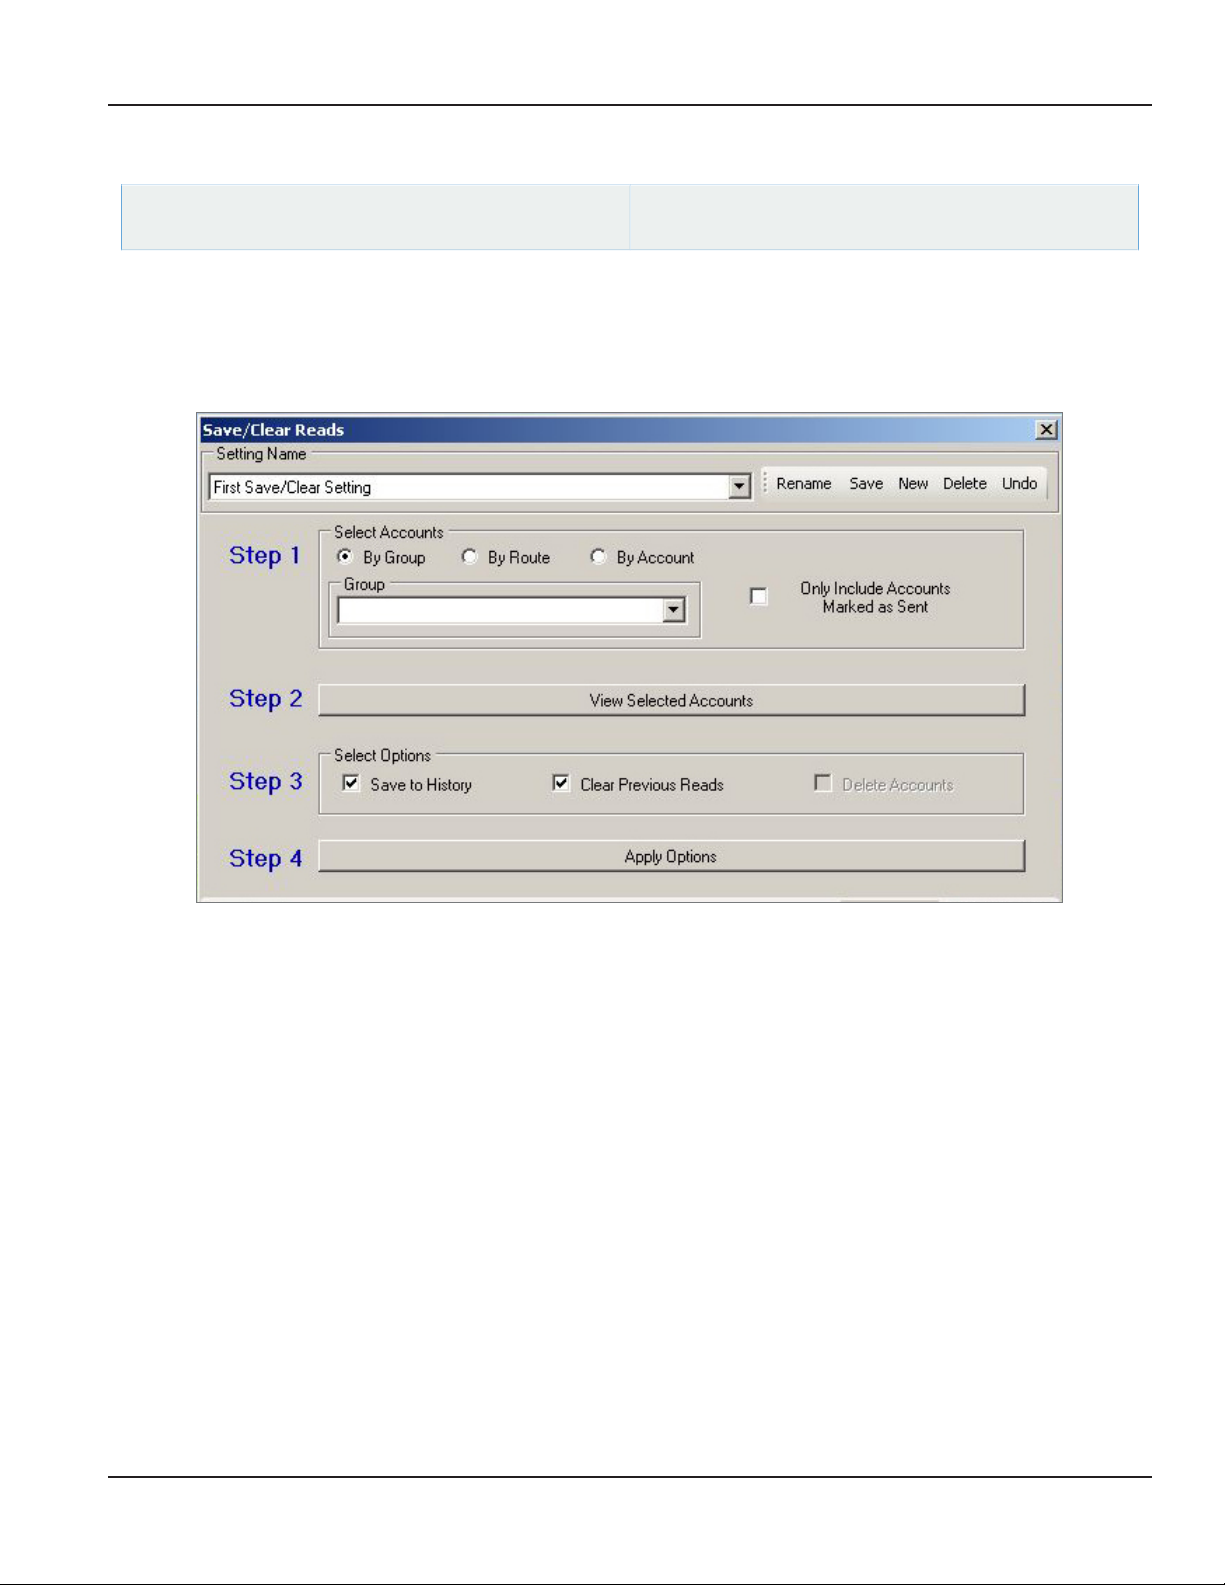
SAVE/CLEAR READS
User Manual
ReadCenter Analytics
Accounts> Save/Clear Reads
Save/Clear Reads prepares ReadCenter Analytics or Analytics Mobile to accept updated information from the billing system.
Use this function to save the previous meter readings to the history and/or clear the current readings before beginning a new
reading cycle.
OTE:N This process may be skipped if there are no accounts in the database.
Meter Reading Cycle> Save/Clear Previous Reads
ReadCenter Analytics Mobile
Step 1 Select the accounts to apply options to by choosing a Group, or select a range of Route or Account numbers. For
more information on setting up account groups, refer to "Account Groups" onpage62.
Step 2 Click View Selected Accounts to verify the chosen accounts. A field at the bottom of the screen shows the
number of accounts selected.
Step 3 Select the option that applies to what you want to do.
• To save current readings to Route Reading history, select the Save to History option. Refer to "Route Reading"
onpage98 for more information.
• Prior to starting a new reading cycle, always clear the previous meter reading information by selecting the
option labeled Clear Previous Reads. This prepares ReadCenter Analytics or Analytics Mobile to accept new
information from the billing system.
Step 4 Click Apply Options. A message displays asking you to confirm your selections. When the process completes,
another message displays with the results.
Page 15 June 2014
Page 16
ReadCenter® Analytics & Analytics Mobile
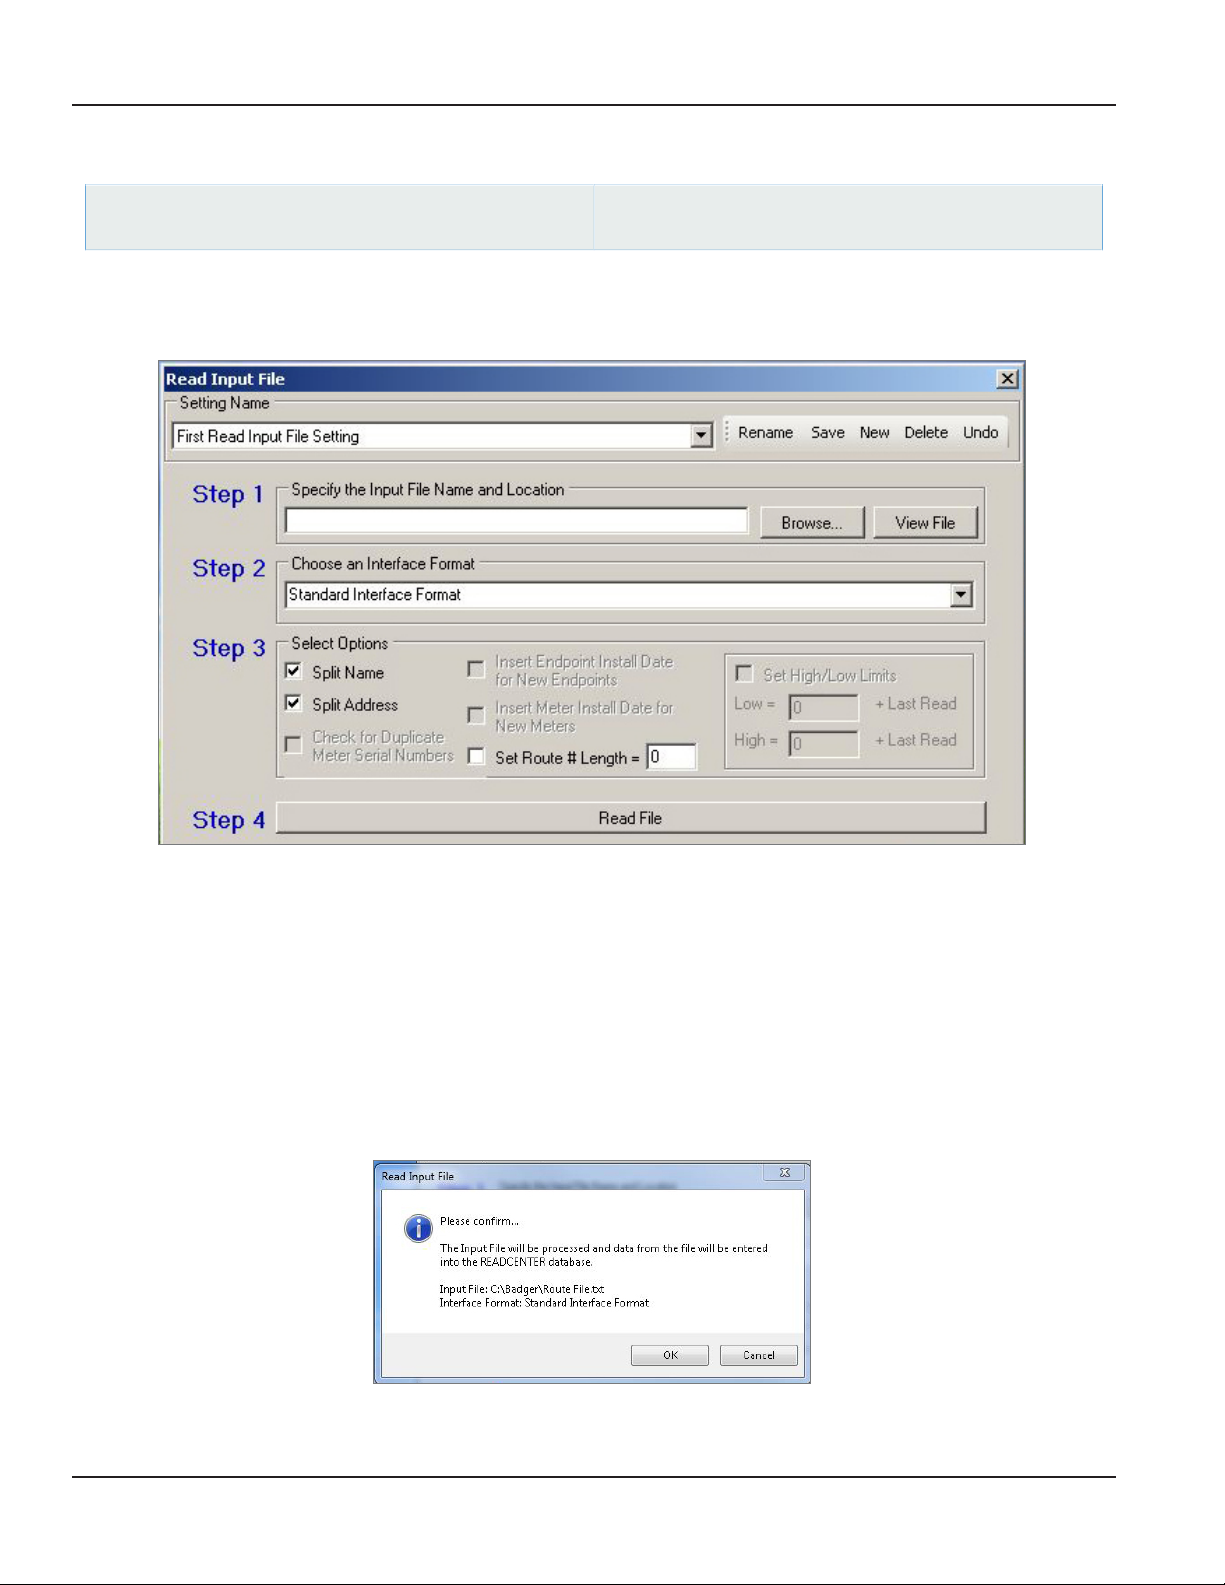
READ INPUT FILE
ReadCenter Analytics
Interface> Read Input File
Use this function to read account information (input file) into ReadCenter Analytics or Analytics Mobile from an outside
source, typically the billing system software. This information may include new accounts or changes to existing accounts. It
may also include the previous meter reading and/or high and low limit ranges.
ReadCenter Analytics Mobile
Meter Reading Cycle> Read Input File
Step 1 Click Browse to select the Input File Name and Location that holds your account information. Click View File to
verify this is the file of accounts you want.
Step 2 Select an Interface Format from the drop-down menu.
Step 3 Select Options that apply to what you want to do. These options should be discussed and set up during initial
training.
Step 4 Click Read File to process the Input File and update ReadCenter Analytics or Analytics Mobile. A message displays
asking you to confirm your selections. When the process completes, another message displays with the results.
Here is an example of the message asking you to confirm the options selected.
OTE:N Remember to define and modify new endpoint settings or convert ORION ME migratable endpoints to report as
ORION SE fixed endpoints, if applicable. Refer to "Endpoint Settings" onpage71 for additional information.
Page 16 June 2014
Page 17
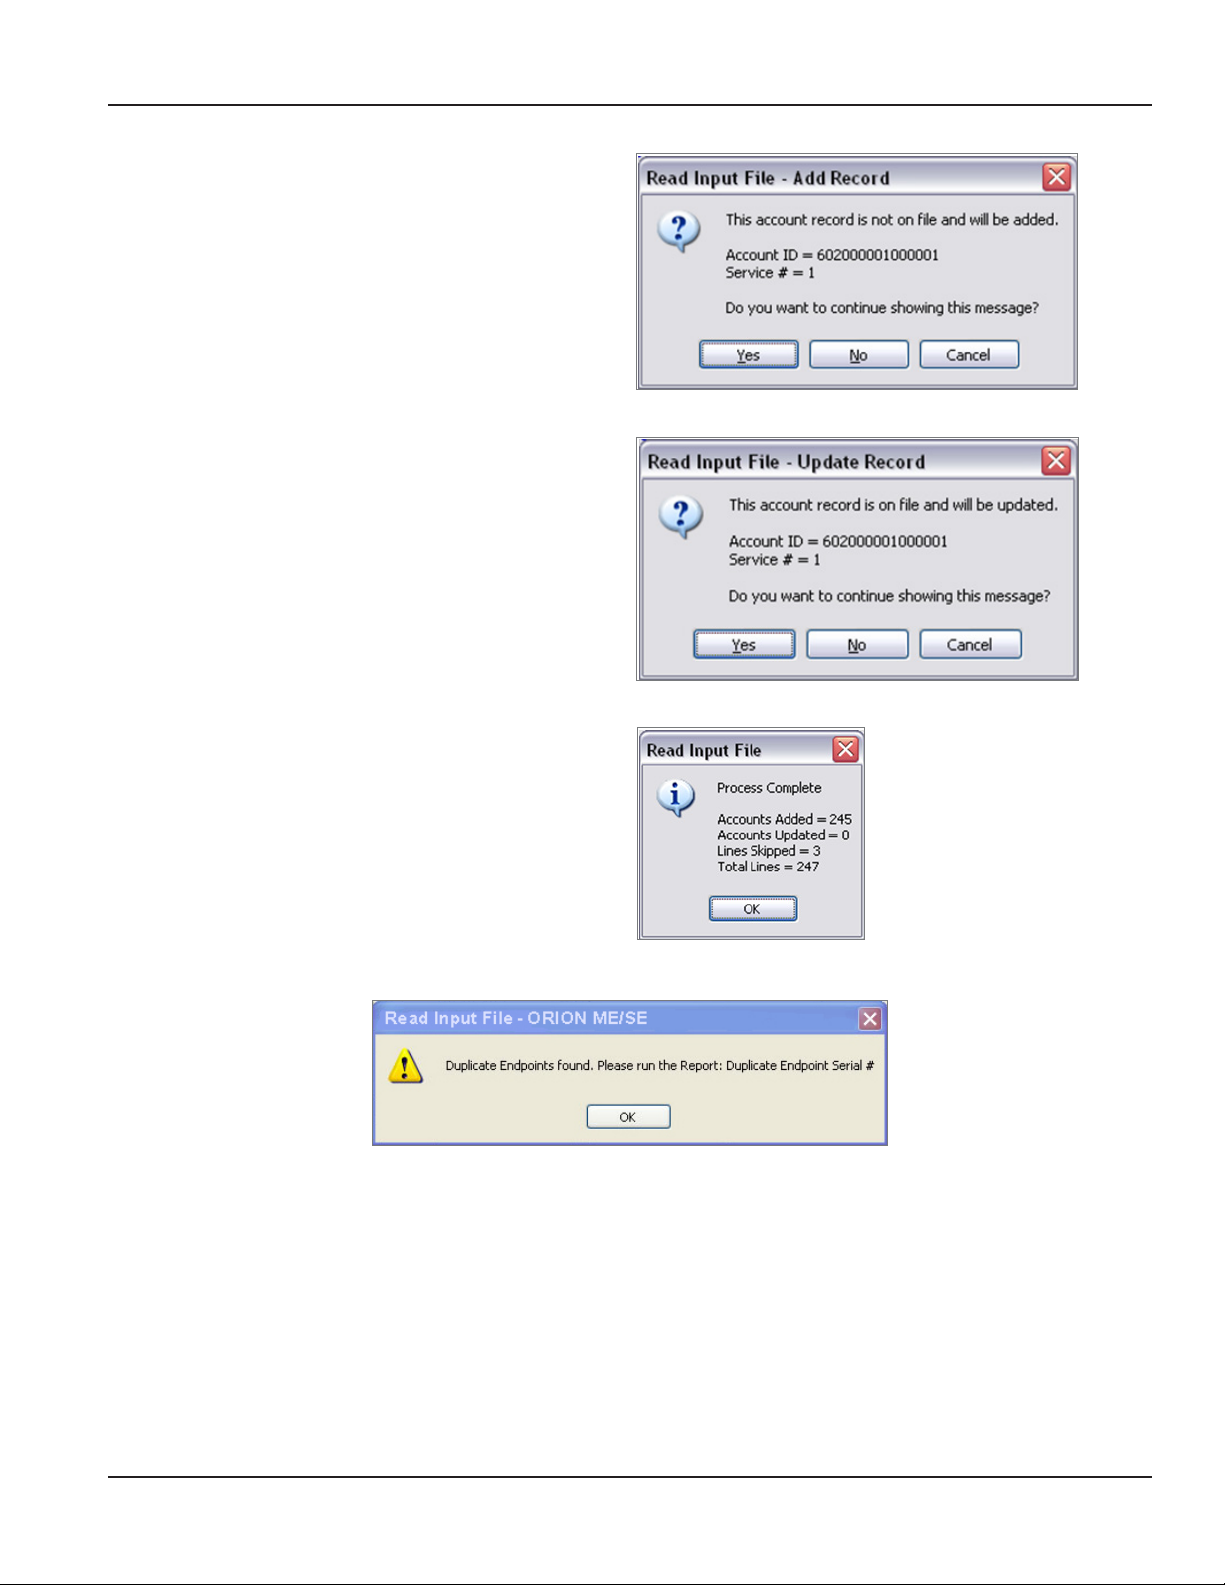
Each time a file is read in, a message similar to this one
displays the first time an account is seen that is new to
ReadCenter Analytics or Analytics Mobile.
Each time a file is read in, a message similar to this one
displays the first time an account is seen that is not new to
ReadCenter Analytics or Analytics Mobile.
User Manual
When the process completes, a message similar to this one
displays the results.
OTE:N If you receive a Duplicate Endpoint Serial # message, refer to "Troubleshooting" onpage108.
Page 17 June 2014
Page 18
ReadCenter® Analytics & Analytics Mobile
APPLY GATEWAY READINGS TO THE CUSTOMER ACCOUNT RECORDS
ReadCenter Analytics
Gateway Reading> Gateway Reading Reports
ReadCenter Analytics Mobile
n/a
Fixed Network Only: This section is intended for customers with a fixed network system. Customers using ReadCenter
Analytics exclusively for a mobile network may skip this section.
Use this function to obtain billable readings for a desired date and post them on the customer account records.
OTE:N If you receive a "Duplicate Endpoint Serial #" message, refer to "Troubleshooting" onpage108.
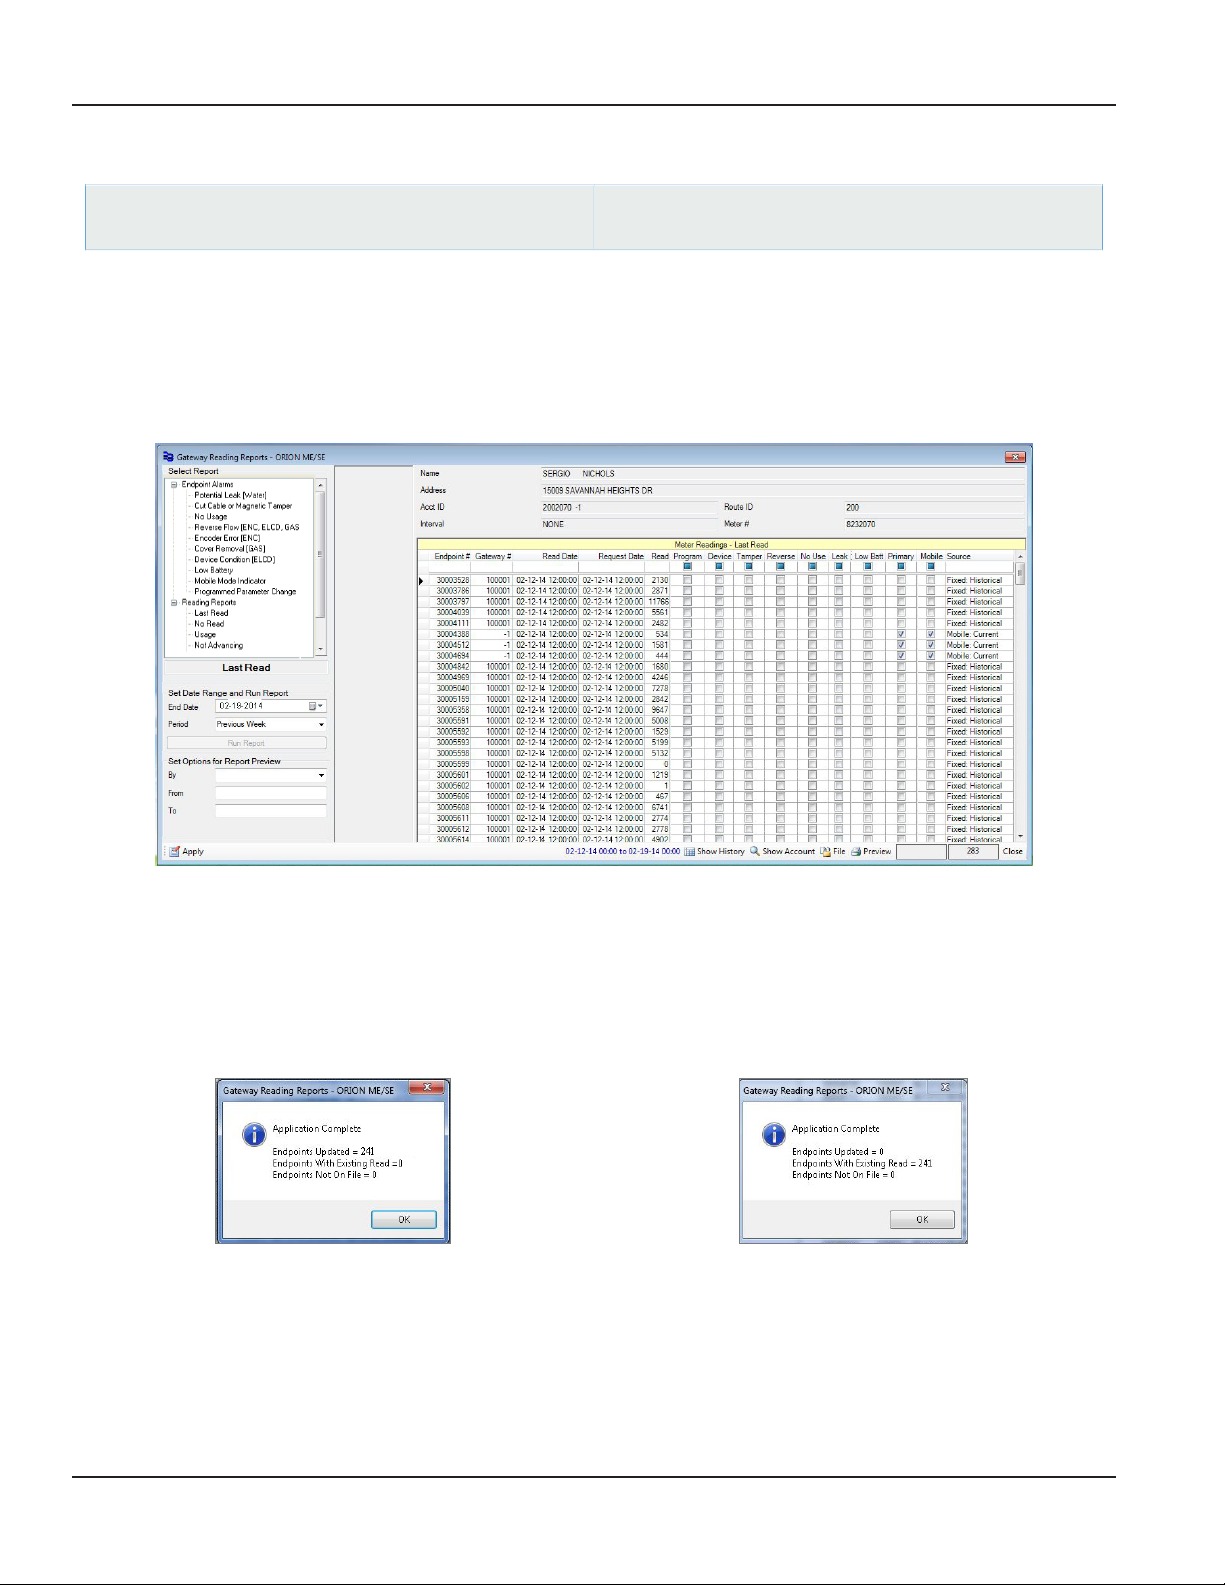
1. Select Last Read from the Select Report column on the left.
Result: Last Read displays in the eld below the list of Reports and the End Date defaults to the current date.
2. Use the End Date drop-down menu to post reads for a specic date. For example, customer reads are always posted
on the 25th regardless of holiday or weekend.
3. Select the Period of time desired. (Example, Previous Week)
4. Click Run Report and then click the Apply button to apply the readings. A message similar to Sample 1 appears
when the task is complete. Read the message to ensure you received what you expected.
Sample 1
Sample 2
In Sample 2, a Save/Clear Reads function was not done or the reading cycle was processed out of order. Therefore
readings were not applied.
OTE:N "Endpoints Not On File" refers to endpoints received by a gateway that do not have an account record in the
database with a matching endpoint serial number.
Page 18 June 2014
Page 19
LOAD COLLECTORS
User Manual
ReadCenter Analytics
Route Reading> Load Collectors
Mobile Only: This section is intended for customers with a mobile network. Customers using ReadCenter Analytics exclusively
for a fixed network may skip this section.
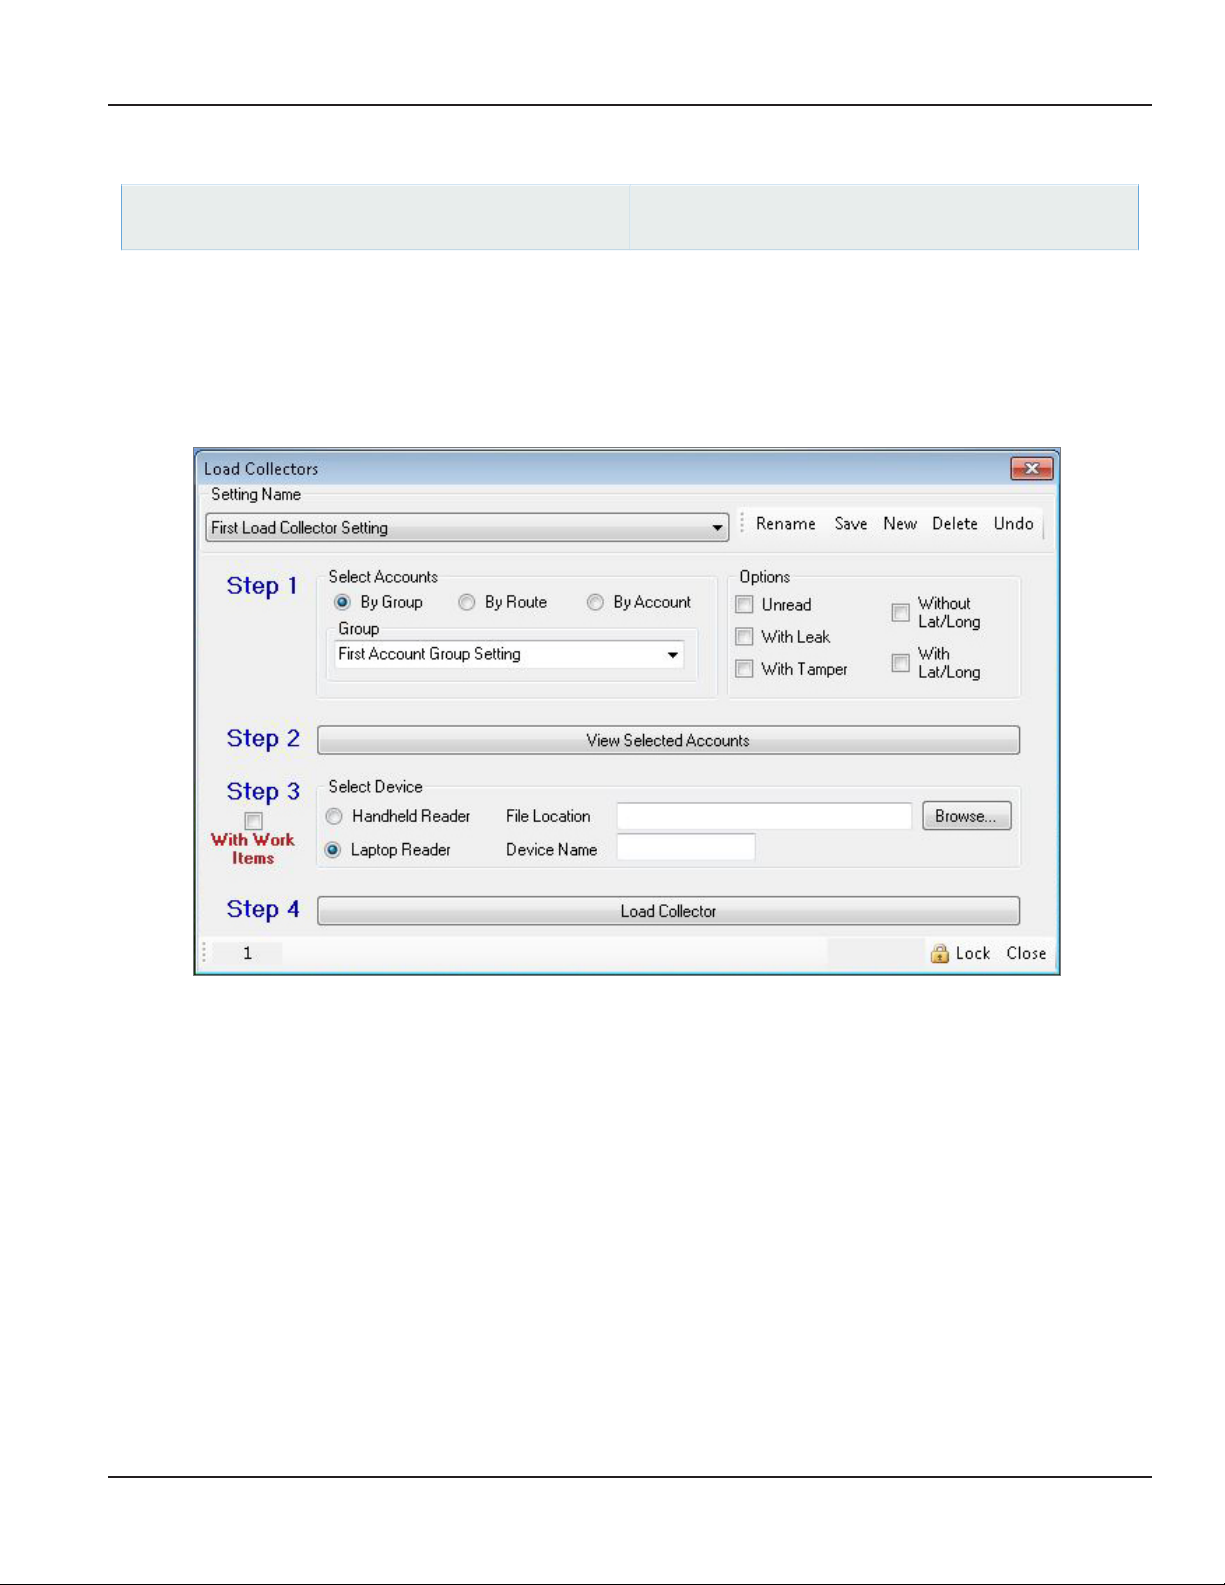
Use this function to create a route load file which sends account information from ReadCenter Analytics or Analytics Mobile
to the collection device for the purpose of gathering mobile meter readings. Settings defined on this screen apply to every
meter on the route.
ReadCenter Analytics Mobile
Meter Reading Cycle> Load Collectors
Work Items
ORION ME work Items are optional tasks that are set up for collecting additional data for a group of selected ORION ME
endpoints. Once the With Work Items box is checked, work items can be initiated automatically for all ORION ME endpoints
that are part of the route or requested manually by the meter reader in the field for individual endpoints.
Setting Name
(Recommended) Create a unique Setting Name for each meter reading device, labeled with the type of device (handheld or
laptop) being used. Be sure to select the appropriate Setting Name when creating the route load file.
Prior to creating the route load file (beginning with Step 1 on the next page), choose the correct Setting Name of the device
being loaded. Use the New button next to the Setting Name field to create a new setting name. You also have the option to
Rename a setting or Delete a setting name.
Page 19 June 2014
Page 20
ReadCenter® Analytics & Analytics Mobile
Requesting Work Items
Step 1 Select the accounts to be loaded by choosing a Group, or select a range of Route or Account numbers. For more
information on setting up account groups, refer to "Account Groups" onpage62.
In the Options area to the right, filter the account list by selecting one or more options.
Step 2 Click View Selected Accounts to verify the chosen accounts. A box at the bottom of the Selected Accounts form
shows the number of accounts to be loaded.
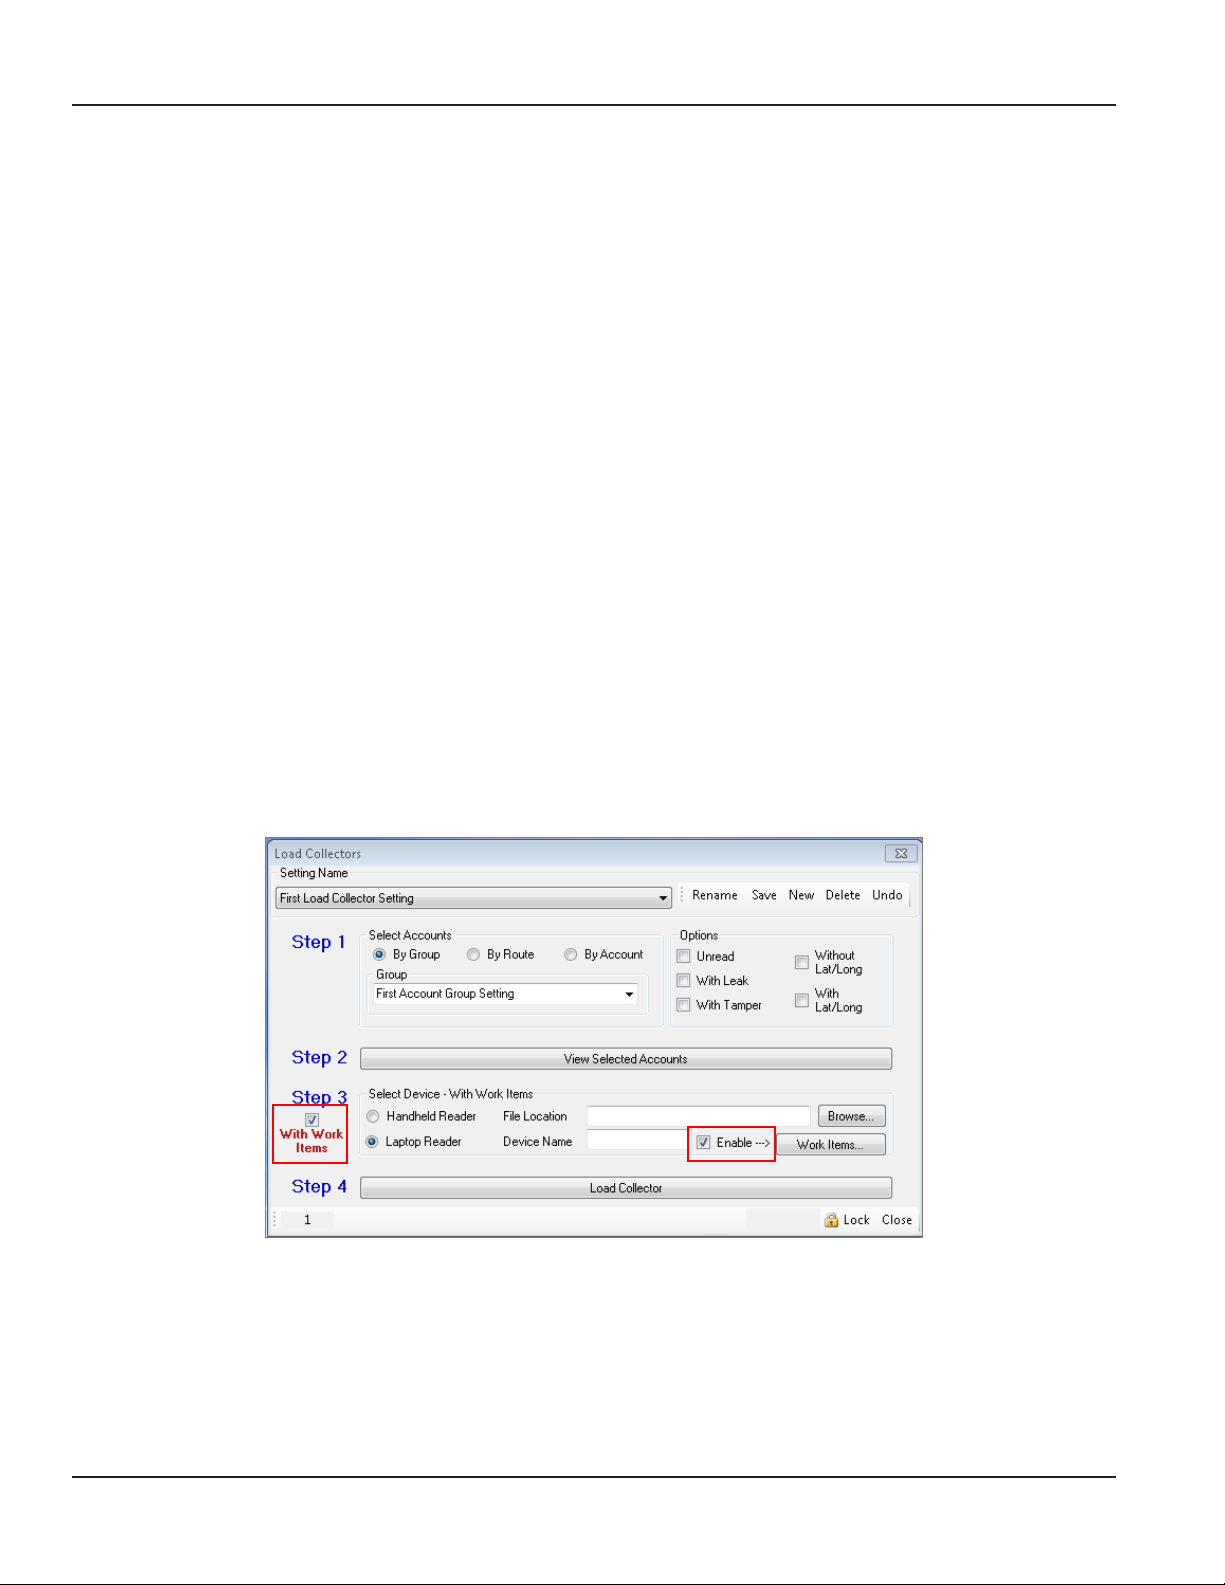
Step 3 • Insert a data storage device into the computer USB port.
• If there are ORION ME endpoints in the route, check the box labeled With Work Items.
Result: The Enable check box becomes available to allow choosing work items in advance for all accounts
selected, if desired. The ability to manually request work items for individual accounts from the handheld or
laptop reader, when in the field, also becomes available.
OTE:N Work items for accounts requested in advance can be viewed by the meter reader in the field but
cannot be changed. Work items that are not requested in advance can be initiated by the meter
reader in the field. In either case, the data collected is returned with the route information and
downloaded to ReadCenter during Unload Collectors.
• Select the mobile collection device (Handheld Reader or Laptop Reader) and click Browse to find the File
Location where the route load file will be sent. Create a folder for the load file on the storage device if one
does not exist. Depending on your selection, one of the load file types automatically displays.
- RecLoad.xml - With Work Items is selected (Handheld or Laptop)
- udc.dat - With Work Items is not selected (Handheld)
- ors.rte - With Work Items is not selected (Laptop)
• (Optional) Enter the "friendly" name of the Trimble Ranger handheld in the Device Name field if needed.
This is an optional field, which may be used for wireless setup.
OTE:N If you do not need to assign work items in advance, skip to Step 4.
• Check the Enable box to activate the Work Items button.
Any work items requested will be automatically performed on all ORION ME endpoints that are part of the
route load file.
OTE:N If "With Work Items" is not checked, the Enable check box is not available.
Page 20 June 2014
Page 21
User Manual
Step 3
continued
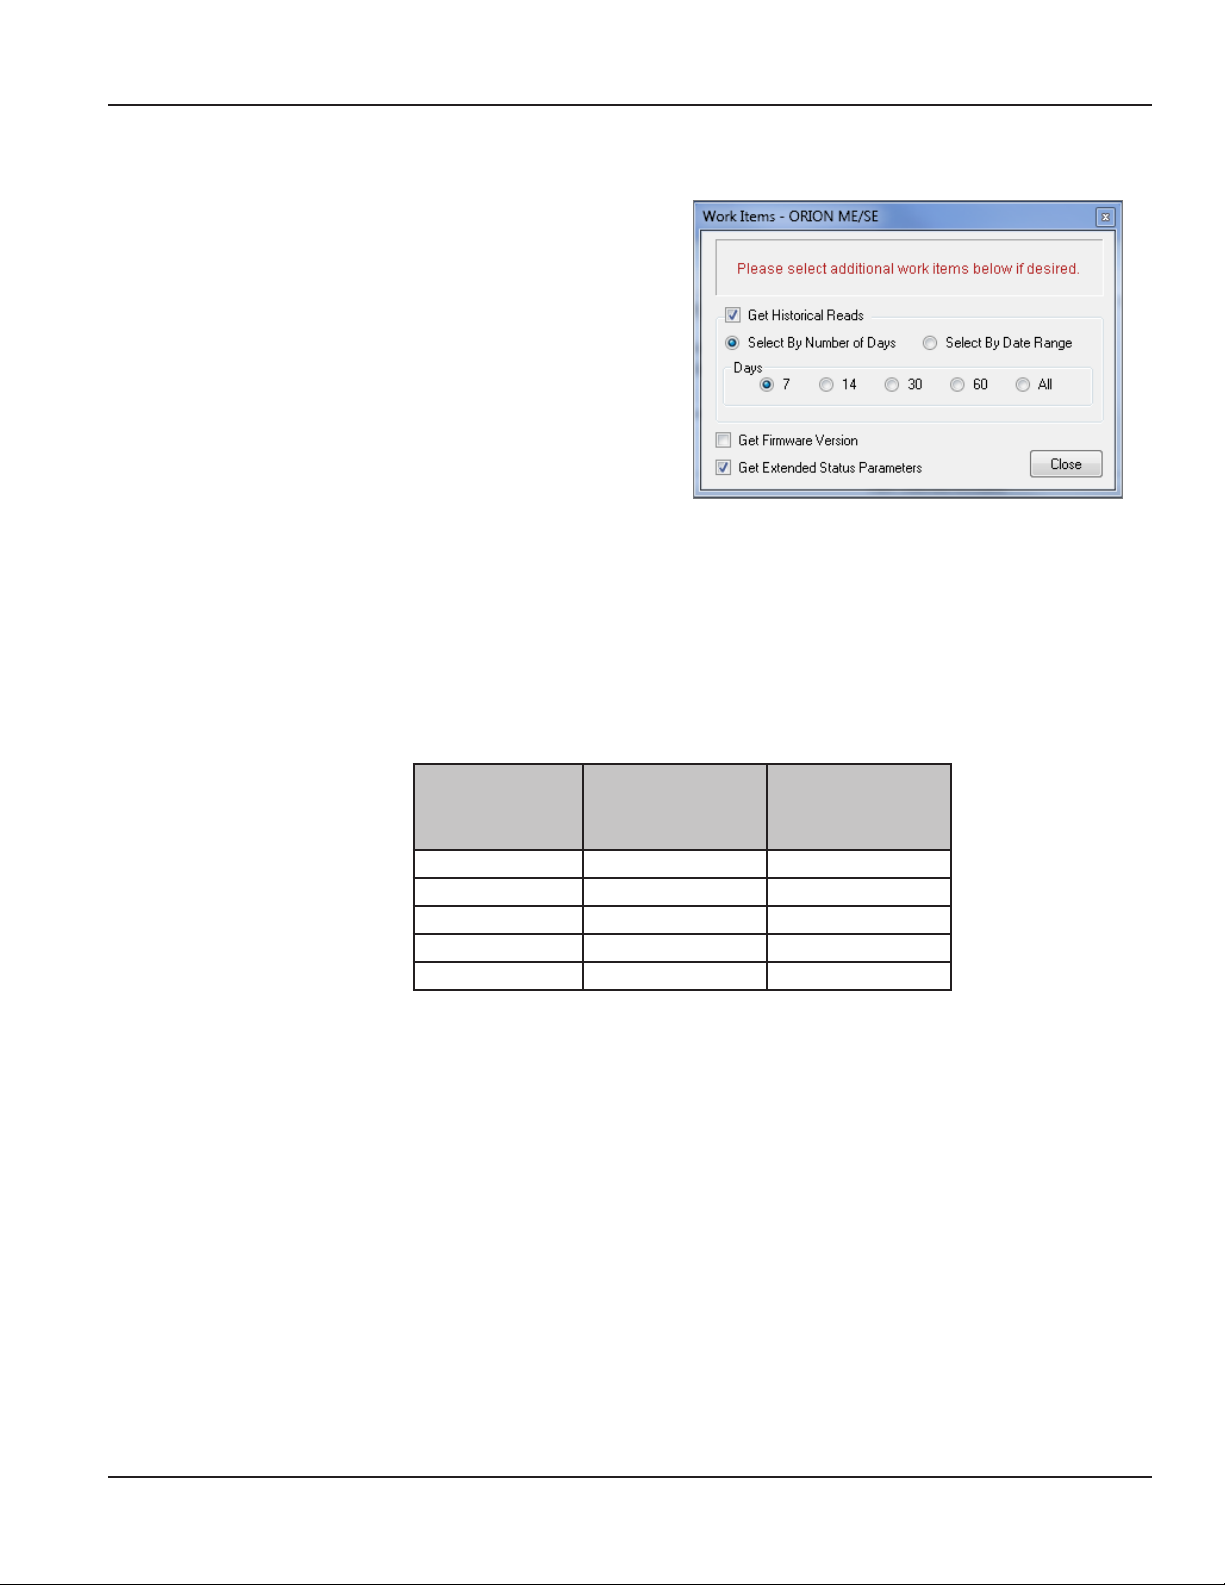
• Click the Work Items button.
Result: The Work Items selection window opens.
• Select up to two work items from the three
options. In the example shown, Historical Reads
and Extended Status Parameters are selected.
- Get Historical Reads
This work item is used to collect
endpoint interval reading data during
the route reading process. Historical
Reads provide a water usage profile for
each endpoint for the specified time
period.
The information collected is useful in discovering potential leaks, addressing customer questions
and/or resolving billing disputes. The work item automatically initiates the historical read data
collection process in the handheld or mobile reading device and does not require manual
intervention by the meter reader.
An ORION ME endpoint is capable of holding up to 90 days of readings, or 2160 hourly reads. If the
account is set to read every 15 minutes—four (4) readings per hour—the data extracted reflects 4
readings per hour and reaches the maximum 2160 reads in 22.5 days (90 days / 4 = 22.5 days).
This chart shows the number of readings collected for meters set for hourly or 15 minute reads:
Available Prole Data
Extraction Intervals
Hourly Reads:
1 Read per Hour
24 Reads per Day
15 Minute Reads:
4 Reads per Hour
96 Reads per Day
7 days 168 reads (24 x 7) 672 (96 x 7)
14 days 336 reads (24 x 14) 1344 (96 x 14)
30 days 720 reads (24 x 30) 2160 (96 x 22.5)
60 days 1440 reads (24 x 60) 2160 (96 x 22.5)
All/ 90 days 2160 reads (24 x 90) 2160 reads (96 x 22.5)
Check the Get Historical Reads box to activate the work item.
Use the radio buttons to Select By Number of Days or Select By Date Range. If you choose Select By
Date Range, use the drop-down menus that display to select a specific date range.
- Get Firmware Version
This work item collects the firmware version of an ORION ME or SE (mobile mode) endpoint.
Check the Get Firmware Version box to activate the work item.
- Get Extended Status Parameters
This work item is used to gather the full status of the endpoint with additional data such as the
meter type and resolution code. For additional information, refer to "Account Records" onpage51.
Select the Get Extended Status Parameters box to activate the work item.
• Click Close when you are finished selecting work items.
Result: The Work Items selection window closes.
Page 21 June 2014
Page 22
ReadCenter® Analytics & Analytics Mobile
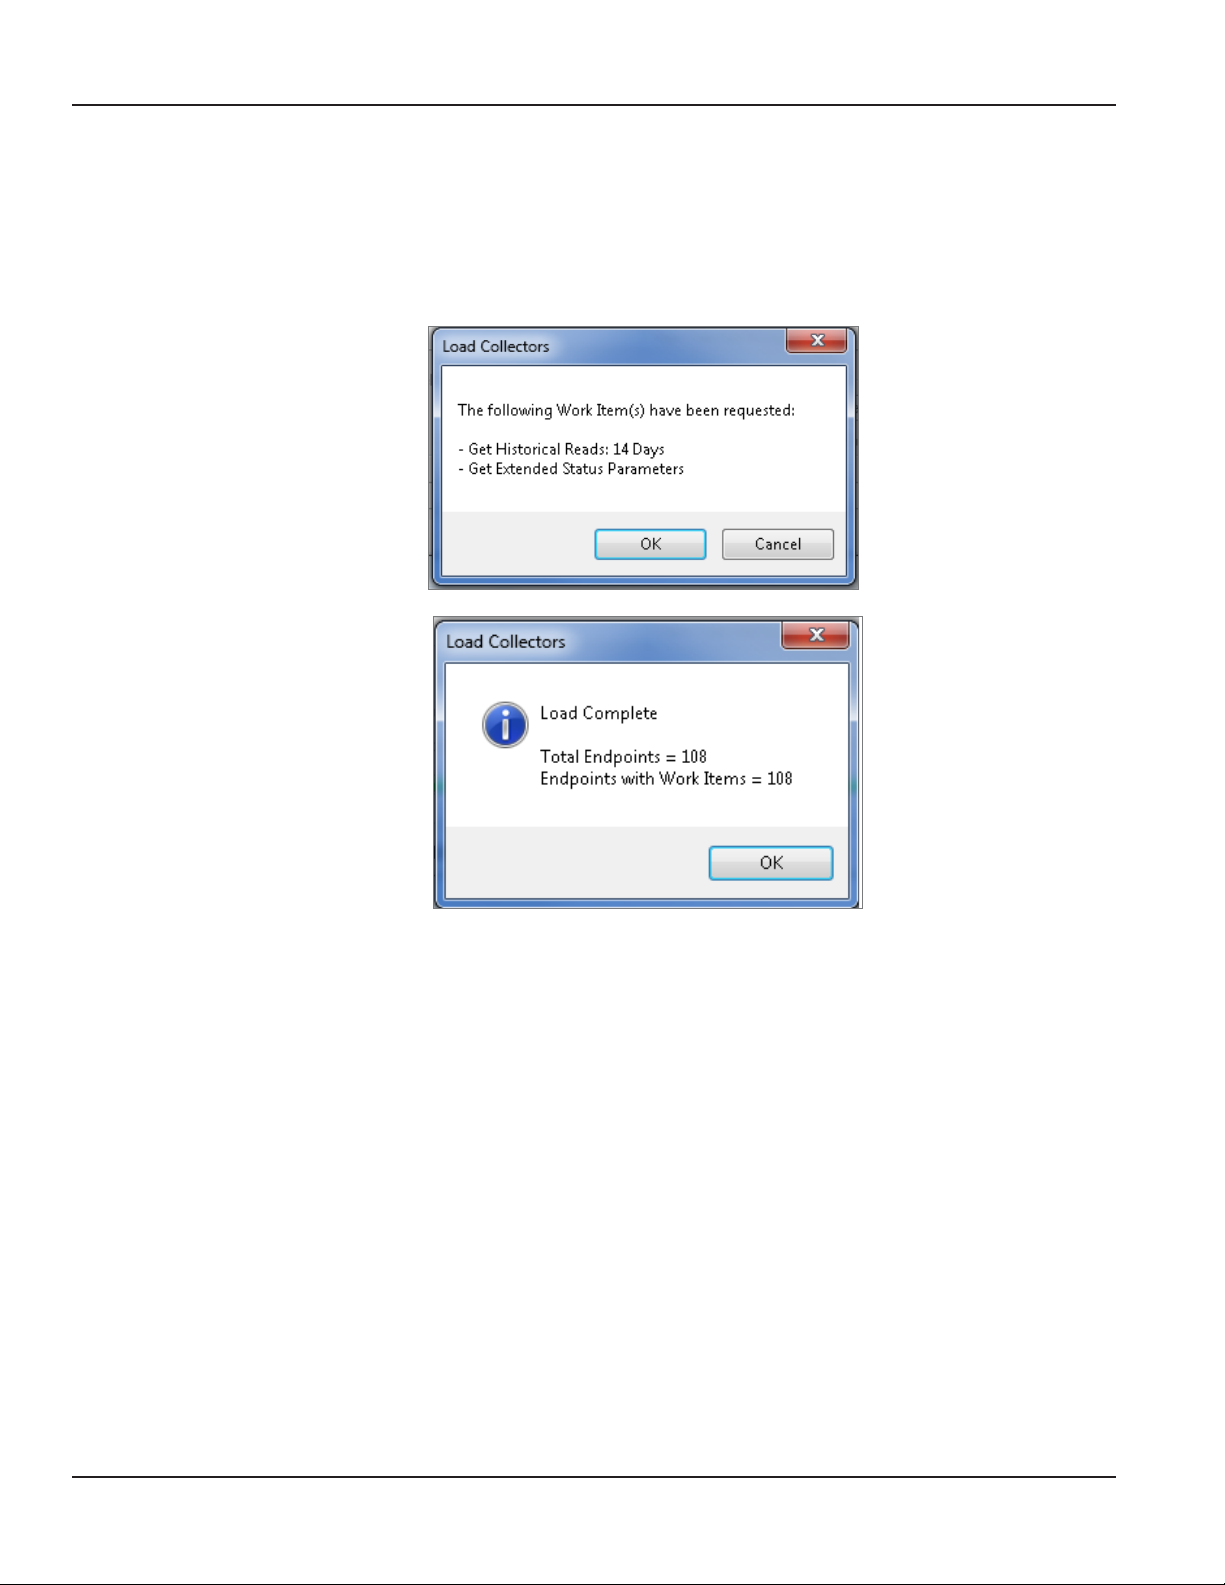
Step 4 Click the Load Collector button to begin loading the files to the designated folder on the data storage device.
• If work items are requested, a confirmation message displays. Click OK and the "Load Complete"
message displays.
• If work items are not requested, the "Load Complete" message displays.
Click OK.
The route file is now ready to be loaded to the mobile collection device (handheld or laptop). Refer to the
handheld (ORI-IOM-52-EN, ORI-IOM-64-EN) and laptop (ORI-IOM-35-EN) Installation & Operation manuals for
instructions on transferring the load file to the collection device.
OTE:N Work items that are initiated automatically in ReadCenter Analytics or Analytics Mobile can be viewed by the meter
reader in the field but cannot be changed.
OTE:N Work items that are not requested in ReadCenter Analytics or Analytics Mobile can be initiated by the meter reader
in the field. The data collected is returned with the route information and downloaded to ReadCenter during Unload
Collectors.
Page 22 June 2014
Page 23
UNLOAD COLLECTORS
User Manual
ReadCenter Analytics
Route Reading> Unload Collectors
Mobile Only: This section is intended for customers with a mobile network. Customers using ReadCenter Analytics exclusively
for a fixed network may skip this section.
Use this function when a completed route file is received to retrieve mobile meter reading data from the collection device and
store the data in ReadCenter Analytics or Analytics Mobile.
Meter Reading Cycle> Unload Collectors
ReadCenter Analytics Mobile
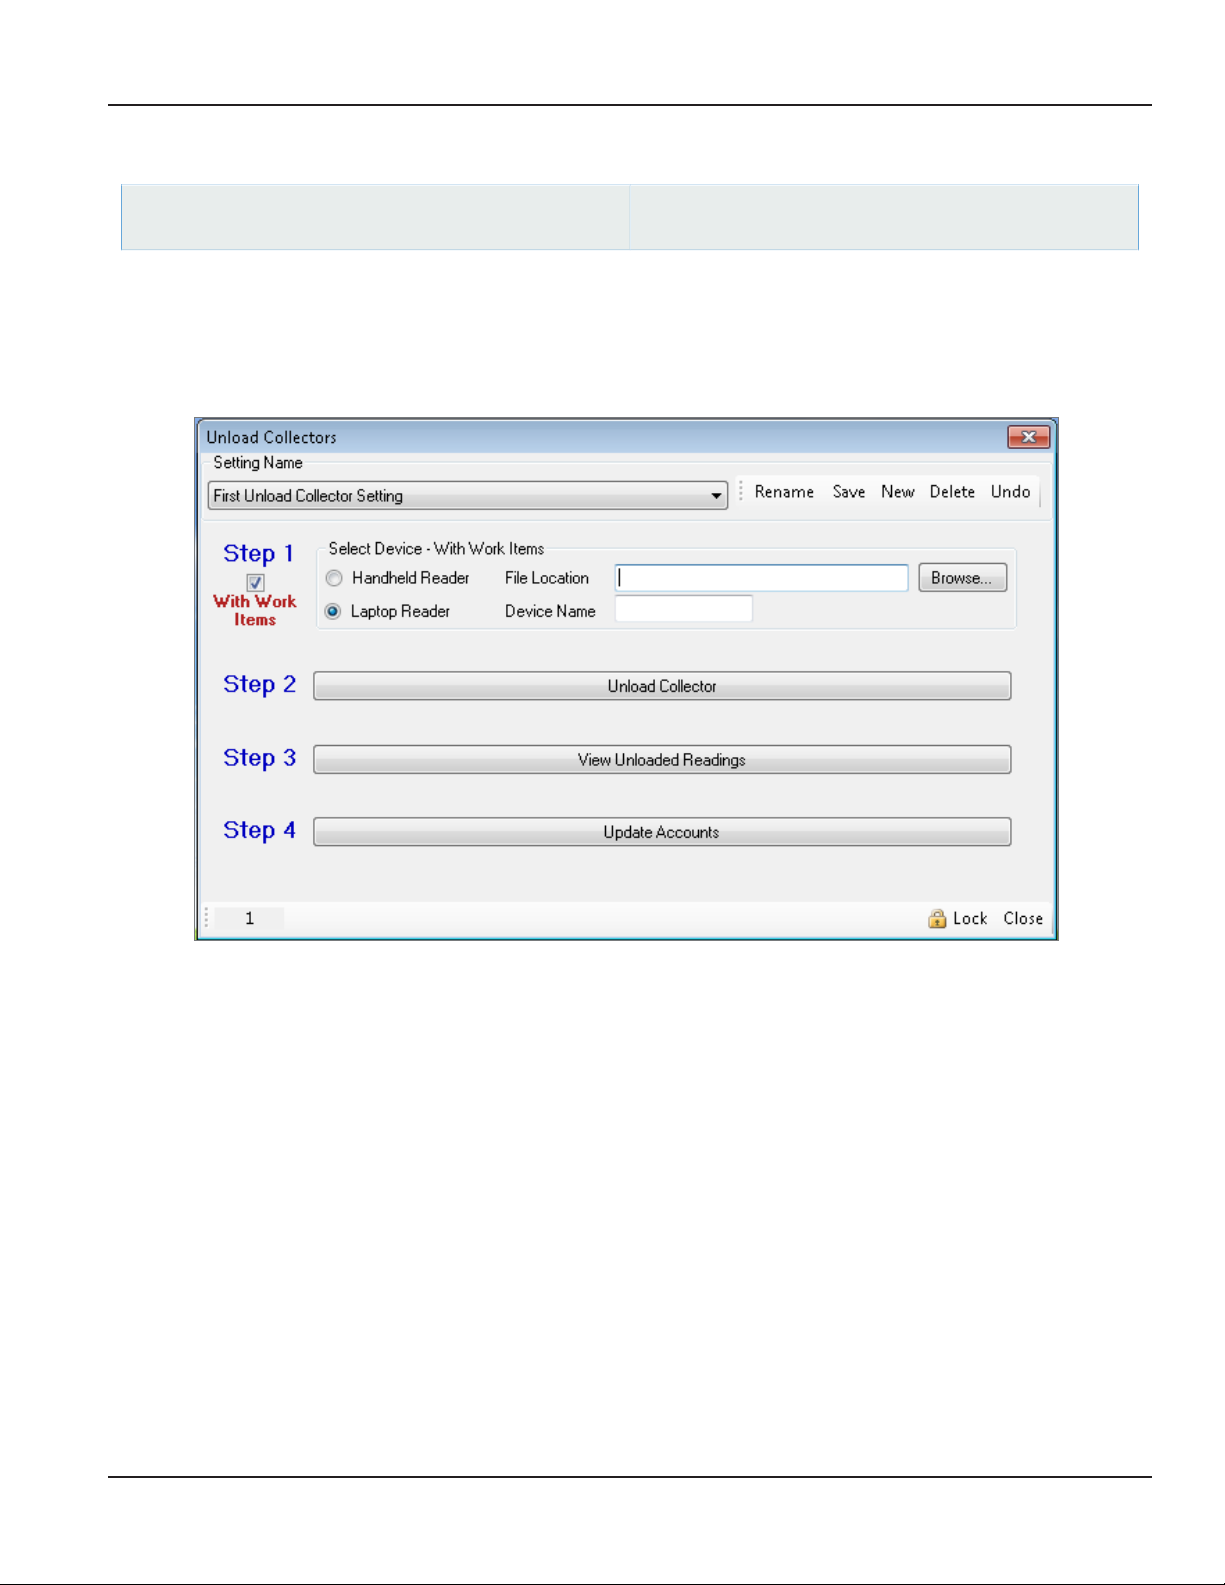
Setting Name
Prior to unloading the route file (beginning with Step 1 on the next page), choose the correct Setting Name of the device
being unloaded. Use the New button next to the Setting Name field to create a new setting name. You also have the option to
Rename a setting or Delete a setting name.
(Recommended) Create a unique Setting Name for each meter reading device, labeled with the type of device (handheld or
laptop) being used.
Page 23 June 2014
Page 24
ReadCenter® Analytics & Analytics Mobile
Step 1 • Select the mobile collection device (Handheld Reader or Laptop Reader) being unloaded.
• If the route file contains ORION ME or SE (mobile mode) endpoints, check With Work Items to ensure the
file processes in the appropriate format. Work Items may have been assigned during Load Collectors for
the route load file or manually collected in the field.
OTE:N Make sure you check With Work Items for Unload Collectors if it was checked for Load Collectors.
ReadCenter will not recognize the correct file if the Work Items box is not checked.
• Insert the data storage device with the route unload information into the computer USB port.
• Click Browse to locate the unload file folder on the storage device. One of the unload file types
automatically displays.
- RecUnload.xml - With Work Items is selected (Handheld or Laptop)
- udc.dat - With Work Items is not selected (Handheld)
- ors.rte - With Work Items is not selected (Laptop)
OTE:N Device Name refers to the "friendly" name of the Trimble Ranger handheld which must be used for
wireless set up.
Step 2 Click Unload Collector. When the unload file is ready, the message "Unload data is ready for update" is displayed
in red below the field.
Step 3 (Optional) Click View Unloaded Readings to verify that the account information was retrieved from the reading
device. At this point, the information from the collector is in a raw data format. Once updated in Step 4, the
billing resolution and test circle code will be applied.
OTE:N The route unload file information displays in a different data format when Work Items are selected.
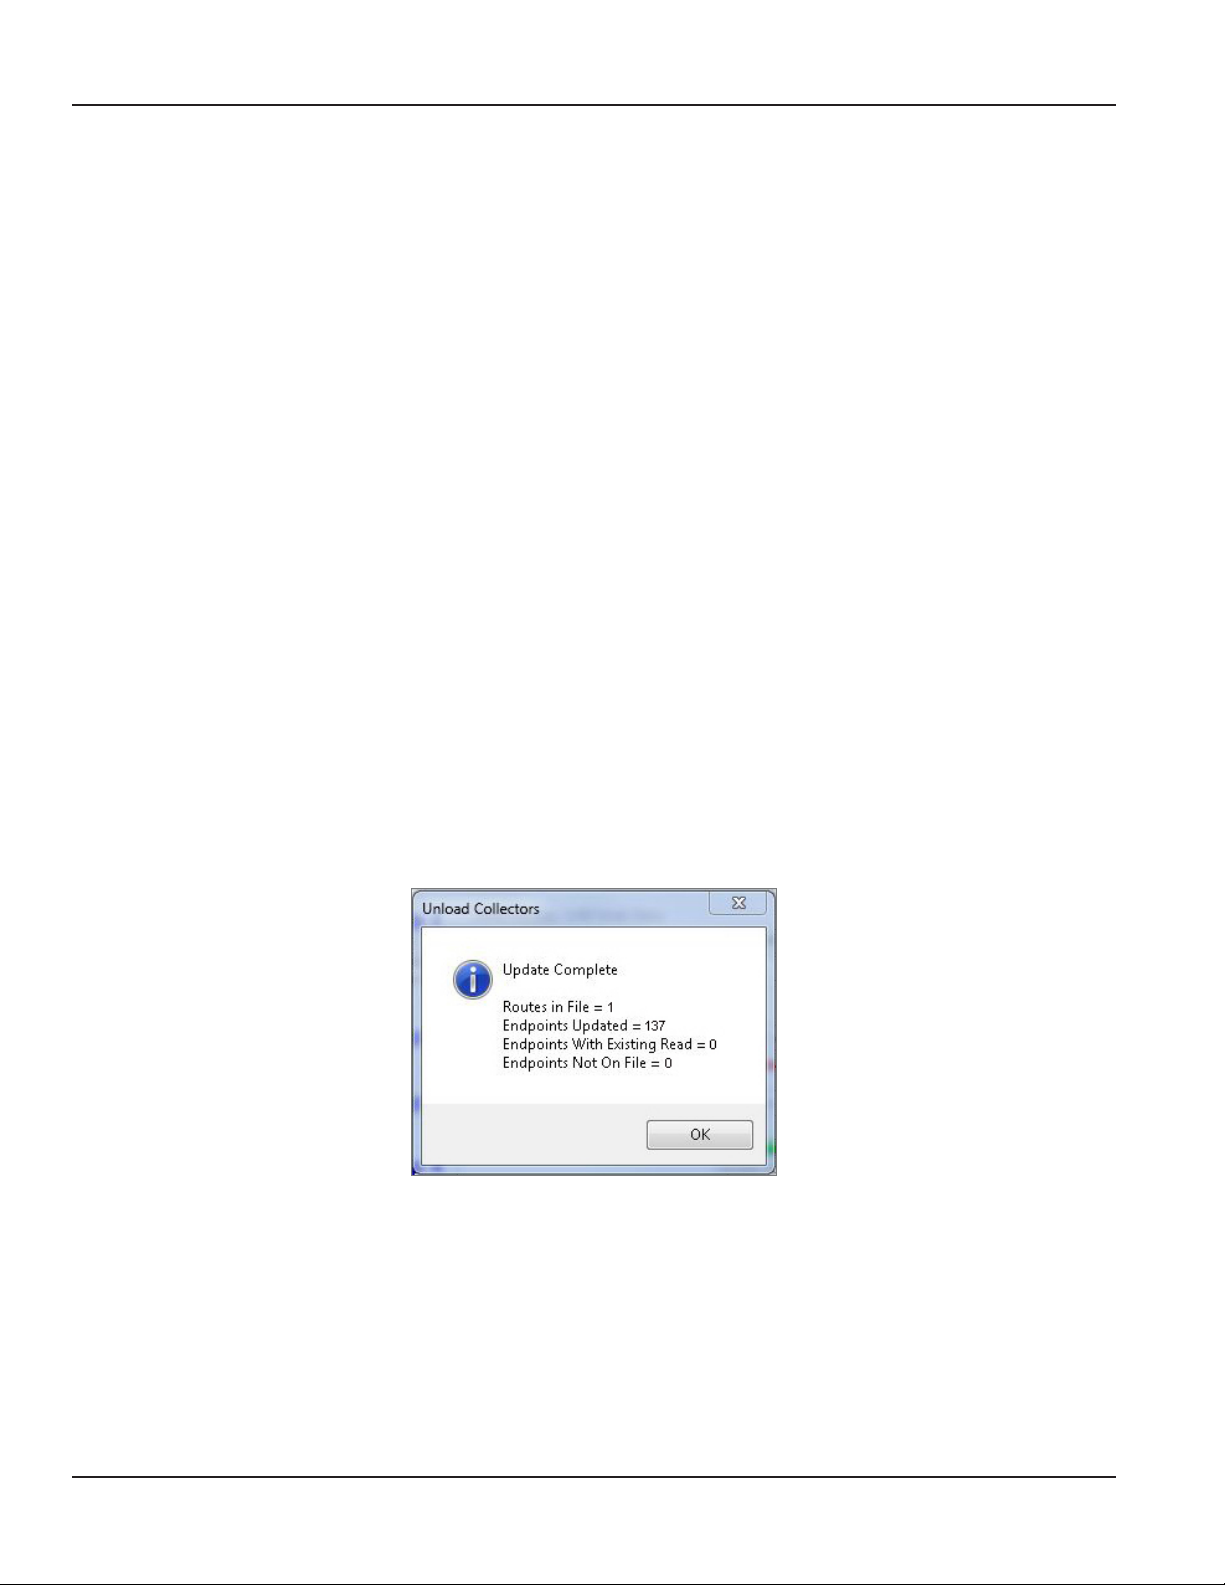
Step 4 Click Update Accounts to store the current reading data in ReadCenter Analytics or Analytics Mobile.
Result: A message box displays the results when the update is complete.
Page 24 June 2014
Page 25
ROUTE READING REPORTS / RUN REPORTS
User Manual
ReadCenter Analytics
Route Reading> Route Reading Reports
Use this function to display a list of predefined standard reports to view or print. These reports display information from the
account records and are not associated with the Gateway Reading Reports.
ReadCenter Analytics Mobile
Meter Reading Cycle> Run Reports
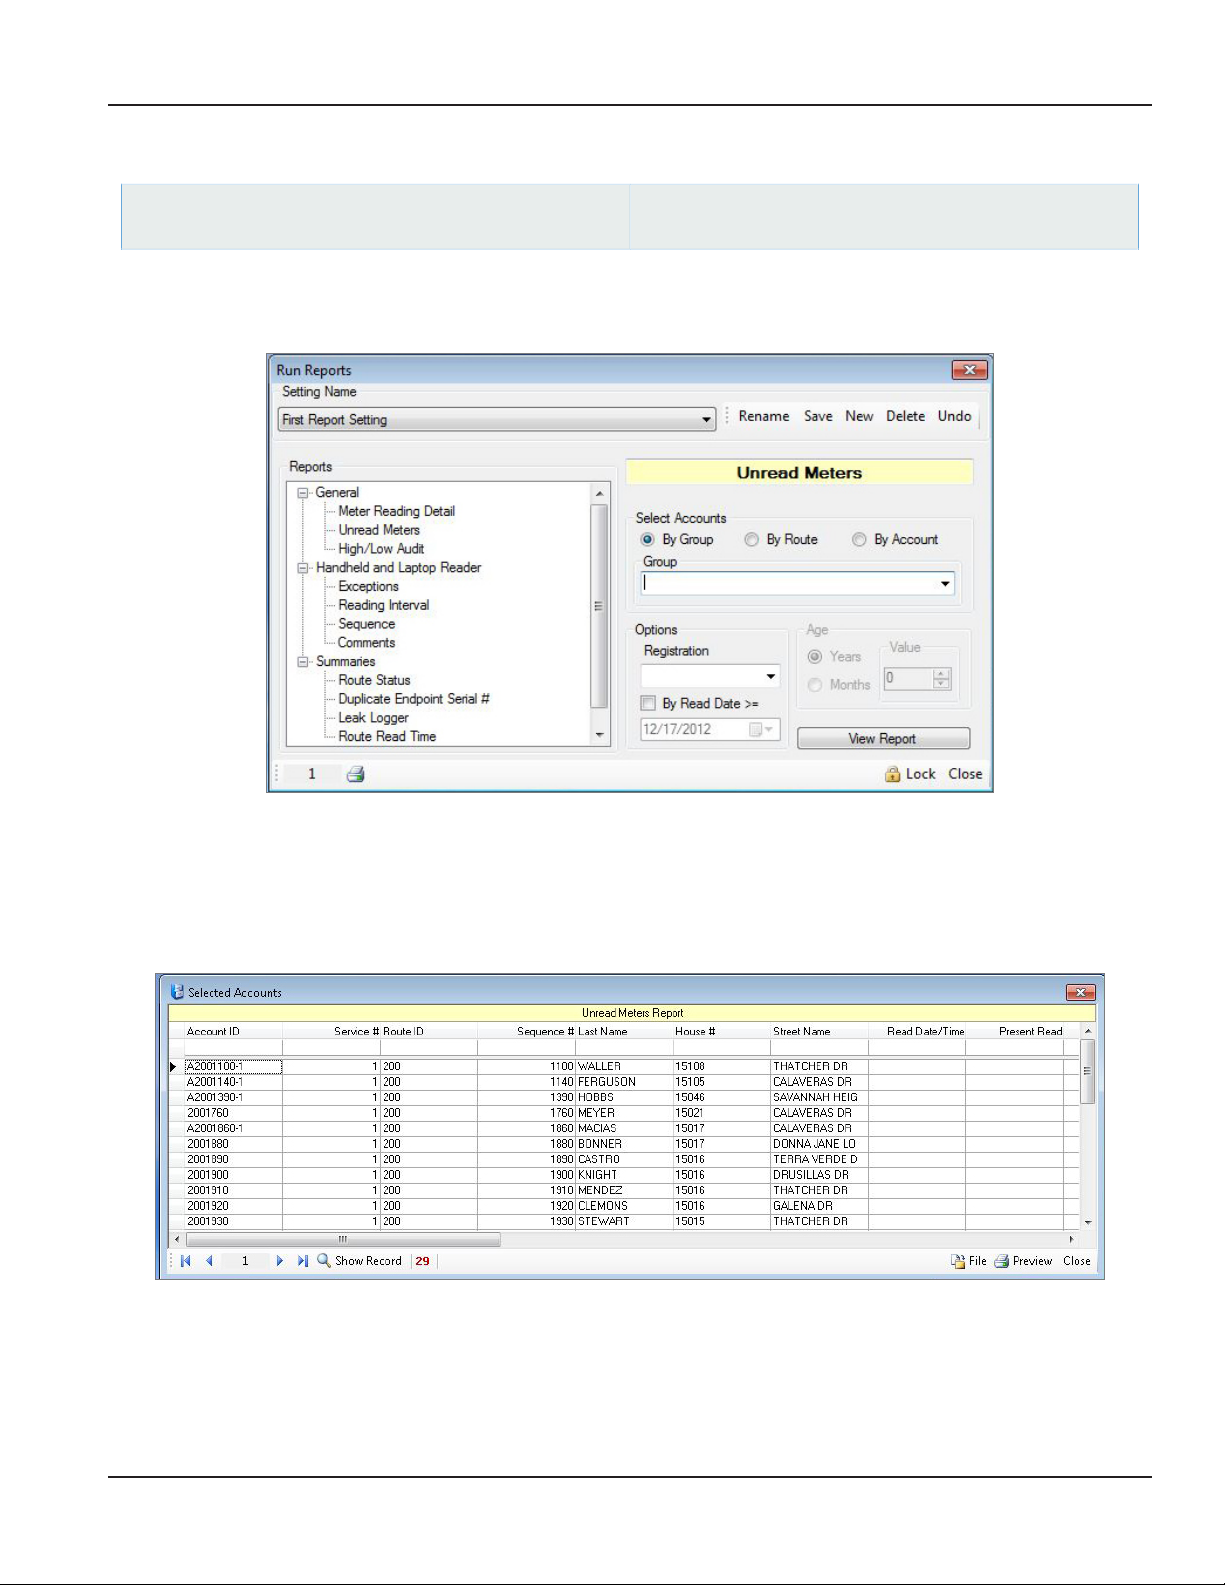
1. Select a report from the list.
In the example, Unread Meters is selected from the General reports heading on the Route Reading Reports (or Run
Reports) screen menu. When selected, Unread Meters displays in the eld to the right of the menu.
2. Select accounts by specifying a Group or a range of Route or Account numbers.
3. Select View Report.
If a report is generated, you can double-click the customer record and advance to the Account Record screen to
review the reading history or select Preview and print the report.
Page 25 June 2014
Page 26
ReadCenter® Analytics & Analytics Mobile
WRITE OUTPUT FILE
ReadCenter Analytics
Interface> Write Output File
Use this function to send meter readings collected from ReadCenter Analytics or Analytics Mobile to the billing system.
Meter Reading Cycle> Write Output File
ReadCenter Analytics Mobile
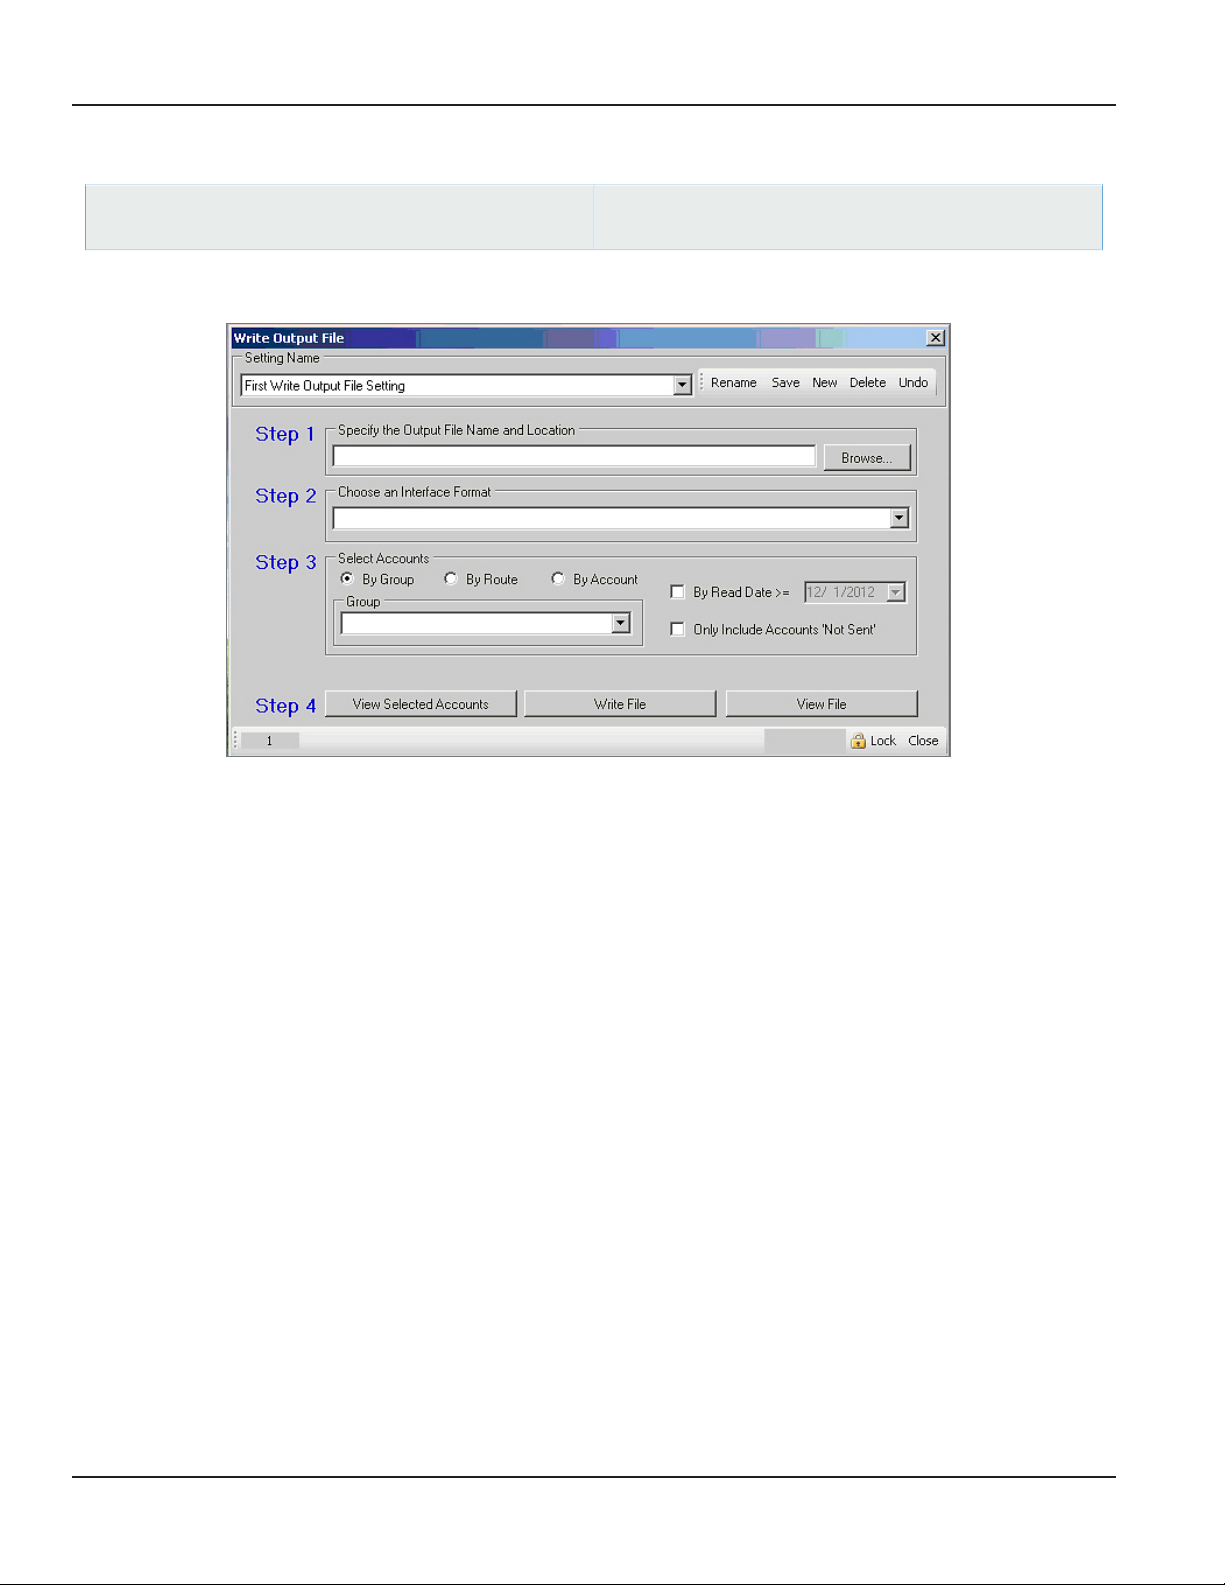
Step 1 Click Browse to select the Output File Name and Location where the billing software will look to retrieve
account information from ReadCenter Analytics or ReadCenter Analytics Mobile. If the file name and location do not
change, verify that the field is filled correctly.
Step 2 Choose an Interface Format from the drop down.
Step 3 Select accounts by specifying a Group, or select a range of Route or Account numbers. For more information on
setting up account groups, refer to "Account Groups" onpage62.
Optional filters may be added.
By Read Date: Check the box to activate the option and receive accounts on or after a specific read date.
Only Include Accounts 'Not Sent': Check the box to ensure accounts sent previously are not included in the file.
Step 4 Do the following to complete the Write Output File process.
• Click View Selected Accounts to verify the chosen accounts. A field at the bottom of the screen shows the
number of accounts selected to be written.
• Click Write File to begin writing the file. When the message displays saying the last file written will be
overwritten or create a new file will be created, click OK.
• After file writing is complete, you may optionally verify the format of the output file by clicking View File.
Typically this will only be used by Badger Meter personnel.
Page 26 June 2014
Page 27

User Manual
Part III: Reports and Analytics
Page 27 June 2014
Page 28
ReadCenter® Analytics & Analytics Mobile
GATEWAY READING REPORTS
ReadCenter Analytics
Gateway Reading> Gateway Reading Reports
ReadCenter Analytics Mobile
n/a
Fixed Network Only: This section is intended for customers with a fixed network system. Customers using ReadCenter
Analytics exclusively for a mobile network may skip this section and refer to "Account Analytics" onpage42 for
Endpoint Alarm reports.
Account information Status Reports
Set Options for
Report Preview
Report you
selected
Endpoints table for
History report
Source of the
reading
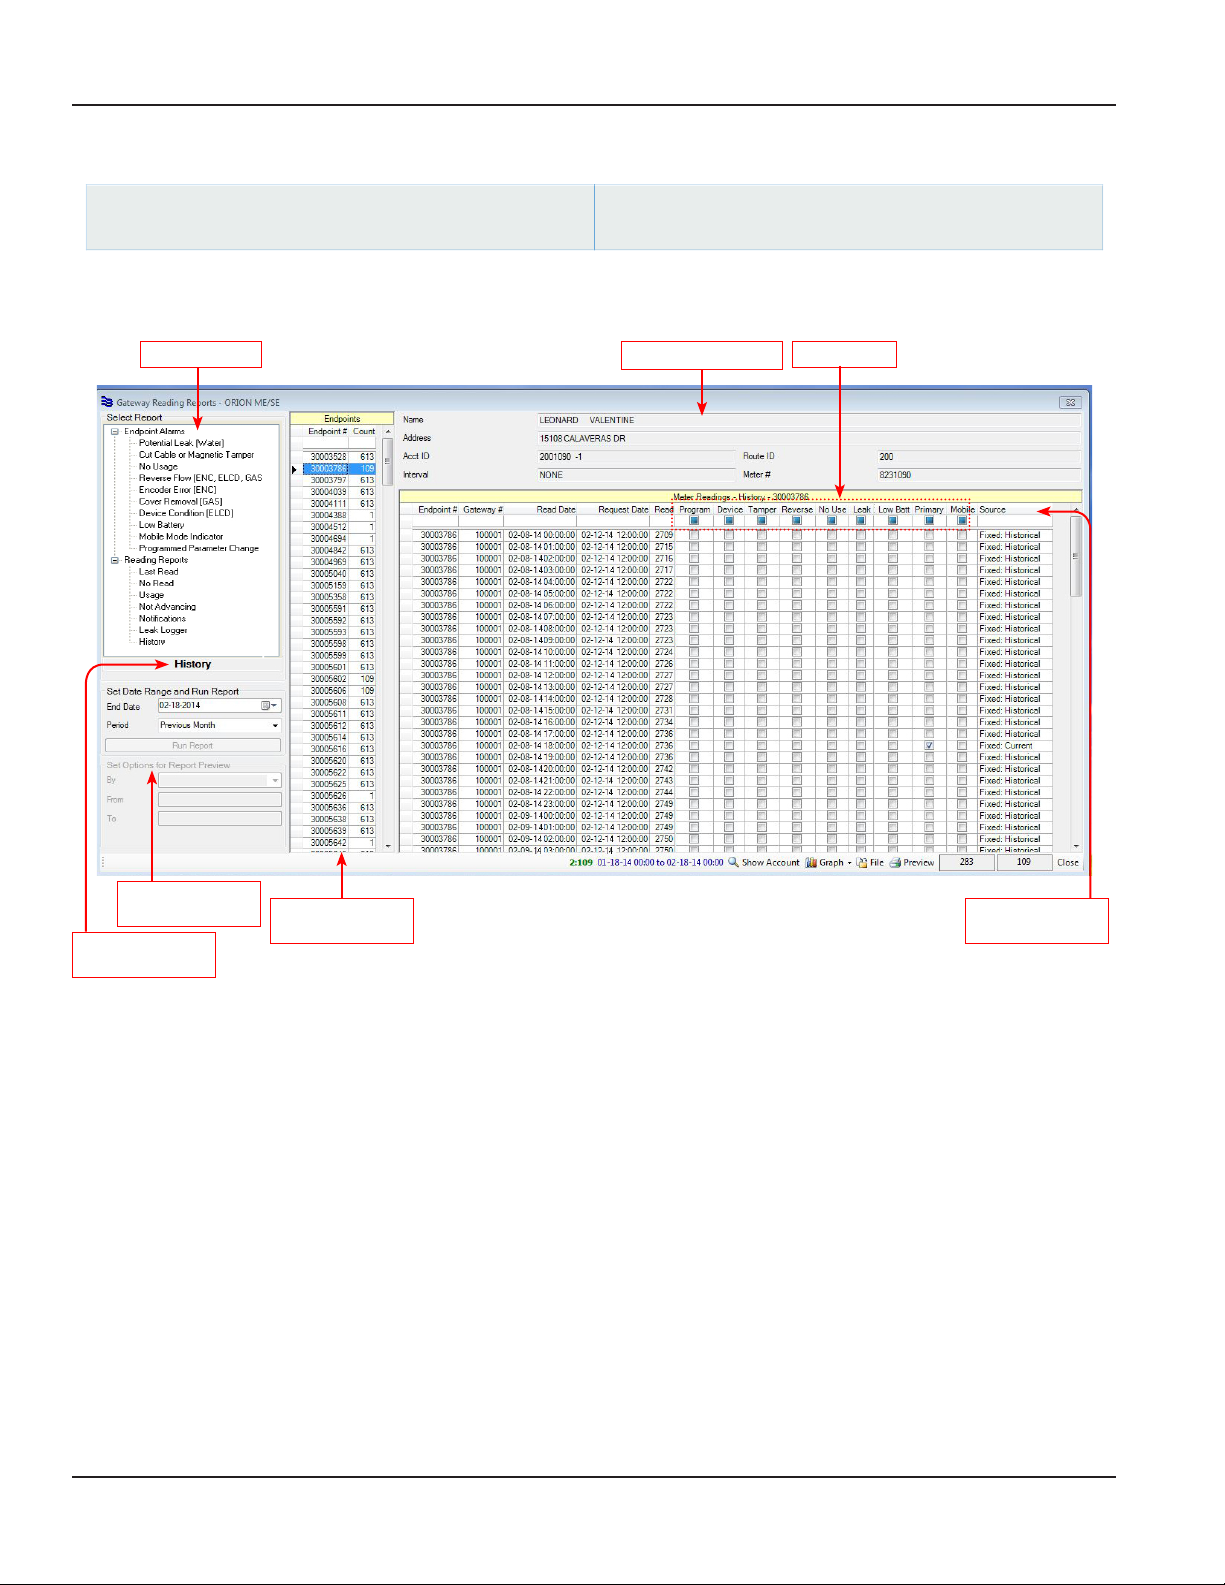
Use the Gateway Reading Reports function to view meter readings by endpoint serial number and to run reports based on
history or endpoint status indicators. A graph of the history can be displayed and/or printed.
History Report Screen Layout
• In the middle section of the Gateway Reading Reports screen is the Endpoints table, which displays endpoints with
meter readings collected during the time specified for the report.
• The right side of the screen displays the report, which includes the individual account information and the Meter
Readings table. As you point to a selection in the Endpoints table, the respective account information is displayed and
readings reported by the selected endpoint during that time are shown in the table. Status indicators are displayed
at the top of the table. A check in the box indicates the status reported by the endpoint at the time of the read.
• The number of the selected endpoint and the history line item are displayed in the bottom tool bar—2:109 in the
screen shown above. Two text boxes are displayed in the bottom tool bar next to the Close button. The total number
of endpoints is on the left (283) and the number of meter readings reported by the selected endpoint (109) is on the
right. For a description of the Show Account, File and Preview buttons, which are available in the tool bar, refer to
"Buttons" onpage31. For a description of the Graph button, refer to "History Report Graph" onpage32.
Page 28 June 2014
Page 29

User Manual
Screen Layout for Other Reports
For all reports except History, the following descriptions apply.
• The middle section of the Gateway Reading Reports screen is blank.
• The right side of the Gateway Reading Reports screen displays the report, which includes the individual account
information and the Meter Readings table.
• The Show History button in the tool bar can be used to run a History report for an account.
• Two text boxes are displayed in the bottom tool bar next to the Close button. The left is blank. The right contains the
number of records returned for the report selected.
Status
When a report is run, status indicators display across the top of the report. The box will be checked if the status was reported
by the endpoint at the time of the read. In Preview mode, status is displayed as a single letter as shown in the Preview Status
column in the table below.
Gateway Reading
Reports Status
Program O Endpoint received a program parameter change. For example, it was reprogrammed via IR.
Device D Device condition. Endpoint reports an encoder error for ENC. For ELCD, conditions are
Tamper T Endpoint reports a tamper condition.
Reverse R Endpoint reports the encoder measured flow in the reverse direction.
No Use U Endpoint reports no usage.
Leak L Endpoint reports a potential leak condition.
Low Batt A Endpoint reports that its estimated battery life is low.
Primary Y The Primary indicator is only checked for the endpoint current reads. Current reads are
Mobile M Endpoint read collected via mobile device.
Preview
Status
Description
indicated in the extended status as shown below.
E-Series HR-E LCD
Empty Pipe Reverse Flow Encoder Removal Reverse Flow
Temp Limit Leak Temp Limit Leak
Encoder Life Encoder Programmed Encoder Life Encoder Programmed
No Usage Sensor Error No Usage Magnetic Tamper
collected when the Current Reads schedule runs.
Usage Report Status
In addition to the status indicators listed above, the Usage report also has three additional columns—Max, Min, Usage—to
show the maximum, minimum and current usage as reported by the endpoint.
Source
Except for the Usage report, the Source of the read is shown in the last column of the reports. The following options
can display.
• Fixed: Current or Fixed: Historical which indicates the reading is from a gateway.
Fixed: Current displays when the Current Reads schedule is run. Fixed: Historical displays when the Historical Reads
schedule is run.
• Mobile: Current or Mobile: Historical which indicates the reading is from a mobile collection device.
Mobile Source indicators only display for customers with both fixed and mobile reading systems.
OTE:N If the read Source is Mobile (Current or Historical), the number in the Gateway # column on the report is shown as “-1.“
Page 29 June 2014
Page 30

ReadCenter® Analytics & Analytics Mobile
Reports
Endpoint Alarms
Report Report
Status
Potential Leak (Water) Leak RTR: Endpoints with an RTR look for 1 hour of non-usage in 24 hours.
Description
ENC: Endpoints with an ADE or HRE look for 2 hours of non-usage in 24 hours.
ELCD: Endpoints with an HR E-LCD encoder report 24 hours without one 15-minute
interval of no flow.
Cut Cable or Magnetic
Tamper
No Usage No Use Endpoint(s) reporting no usage. No usage conditions occur when there is no flow over
Reverse Flow
(ENC, GAS, ELCD)
Encoder Error (ENC) Encoder Device condition. Endpoint(s) reporting an encoder error. Error conditions occur when
Cover Removal (GAS) Cover Device condition. Endpoint(s) reporting error due to meter cover or partial cover
Device Condition
(ELCD)
Low Battery Low Batt Endpoint(s) reporting estimated remaining battery life is low.
Mobile Mode Indicator Mobile Endpoint(s) reporting in mobile mode.
Programmed
Parameter Change
Priority of Alarms: Low Battery, Tamper, Reverse Flow, Leak, No Usage, Encoder Error (ENC)/Device Condition (ELCD).
Endpoint alarms are based on the most current reading within the time period selected.
OTE:N Encoder error descriptions differ depending on the encoder type. Refer to the HR-E LCD Encoder Installation and
Programming Manual and E-Series Ultrasonic Meters User Manual, available at www.badgermeter.com, for more
information about HR E LCD and E-Series status indicators and clearing alarms.
Reading Reports
Last Read The most current meter reading within the time period selected.
No Read The most current meter reading for endpoints that have not reported within the time period selected.
Tamper Endpoint(s) reporting a tamper condition when the wire between the register and the
endpoint is cut or shorted. With gas meters, a tamper occurs when the presence of an
external magnetic field interferes with the ability of the gas endpoint to accurately
record consumption.
a 30-day time frame.
Reverse Endpoint(s) reporting that the encoder has reverse direction measured flow, causing
the current reading to be lower than the previous recorded reading.
the encoder exhibits a temporary or permanent failure to extract the current reading.
removal.
Device The specific conditions indicated in the extended status. See “Device“ under "Status"
onpage29.
Program Endpoint received a program parameter change. Example, it was reprogrammed via IR.
Usage The most current meter reading, the lowest meter reading, and the difference between them within the
time period selected. Use the section titled "Set Options for Report Preview" at the bottom left to select
records to show when previewing the report.
Not Advancing The most current meter reading for endpoints where the meter reading did not change within the time
period selected.
Notifications Endpoints with notifications set on Endpoint Settings or Account Records screens. If Alarm Notifications
are not set on either screen, the report is blank.
Leak Logger Refers to a report from the Permalog® acoustic leak detection device.
History All endpoints that have reported meter readings within the time period selected, along with the
individual meter readings collected within that time.
Page 30 June 2014
Page 31

User Manual
Buttons
• Show Account Opens the Account Records screen with all of the information for the selected account.
• Graph
(History report only)
• File Enables saving report results to a comma-delimited file. Refer to "File" onpage33 for details.
• Preview Opens a screen with a preview of the report results that can be printed. .
• Apply
(Last Read report only)
Opens a screen showing usage calculations and a usage graph for meter readings shown.
Refer to "History Report Graph" onpage32 for details.
Writes meter readings shown in the report to the Account Record for billing purposes. Refer to
"Apply Gateway Readings to the Customer Account Records" onpage18 for more information.
Running Reports
1. Select a report from the list.
2. Click the drop-down in the End Date and
Period elds to specify a date range for the
report.
OTE:N In the software, End Date is at
midnight of the date selected. To
get information for the current
date as well, select an End Date
that is one day after the report
time period. For example, if
you want to see a report with
information through February 2,
select February 3 as the End Date.
OTE:N As the date selections change, the
resulting range is shown in blue in the
tool bar at the bottom of the screen.
3. Click Run Report. The History report is
selected in the example shown.
OTE:N When Run Report is selected, the
section below the Run Report
button, labeled "Set Options for
Report Preview," may become
active, depending on the report.
Result: Report information displays on the
right side of the screen.
Page 31 June 2014
Page 32
ReadCenter® Analytics & Analytics Mobile
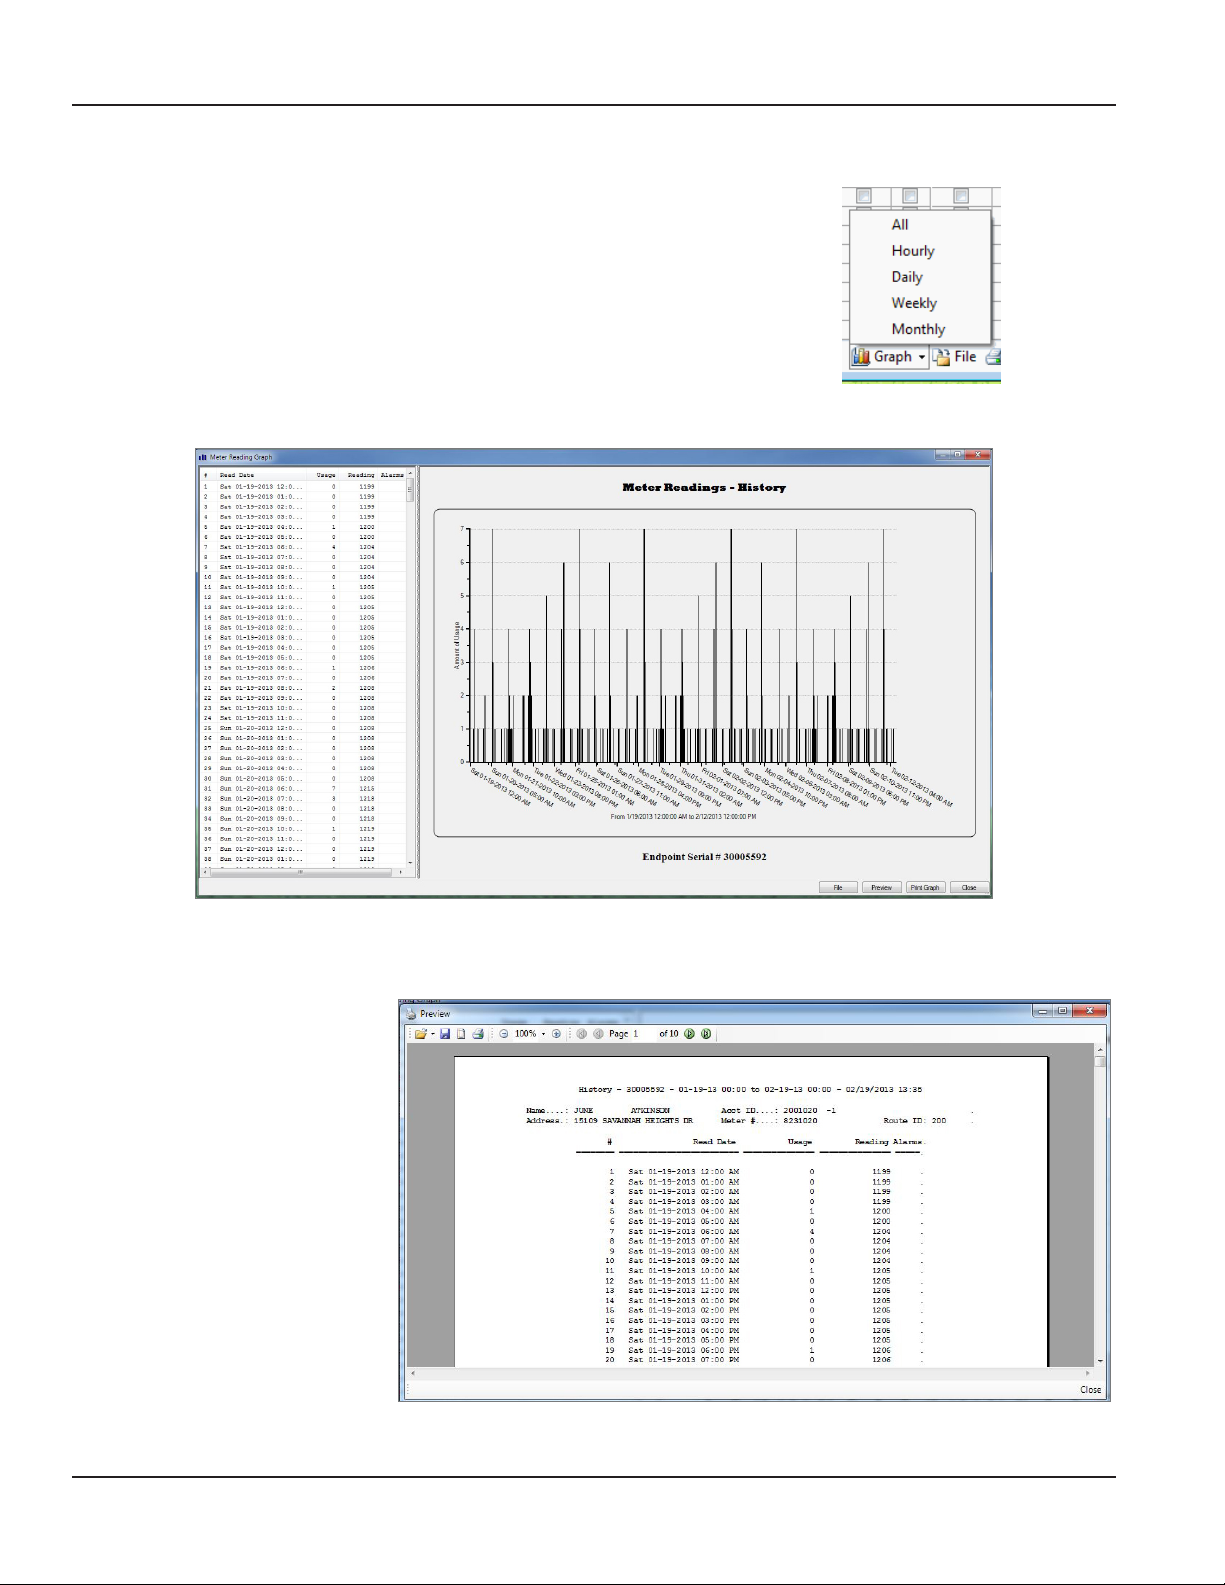
History Report Graph
From a History report, click the Graph button to see usage graph for an
endpoint for the time period selected. Use the drop-down menu to select All,
Hourly, Daily, Weekly, or Monthly readings.
OTE:N The Graph option is available whenever you run a History report.
An example of meter readings history in Graph view is shown below. The endpoint serial number is shown under the graph.
Buttons in Graph Tool Bar
• Preview: Shows a report of the customer and usage information. (Includes print option.)
An example of the Preview
screen is shown here.
Click the Close button at
the bottom right to return
to the Graph view.
• Print Graph: Opens the
print dialog box to select a
printer.
Page 32 June 2014
Page 33
File
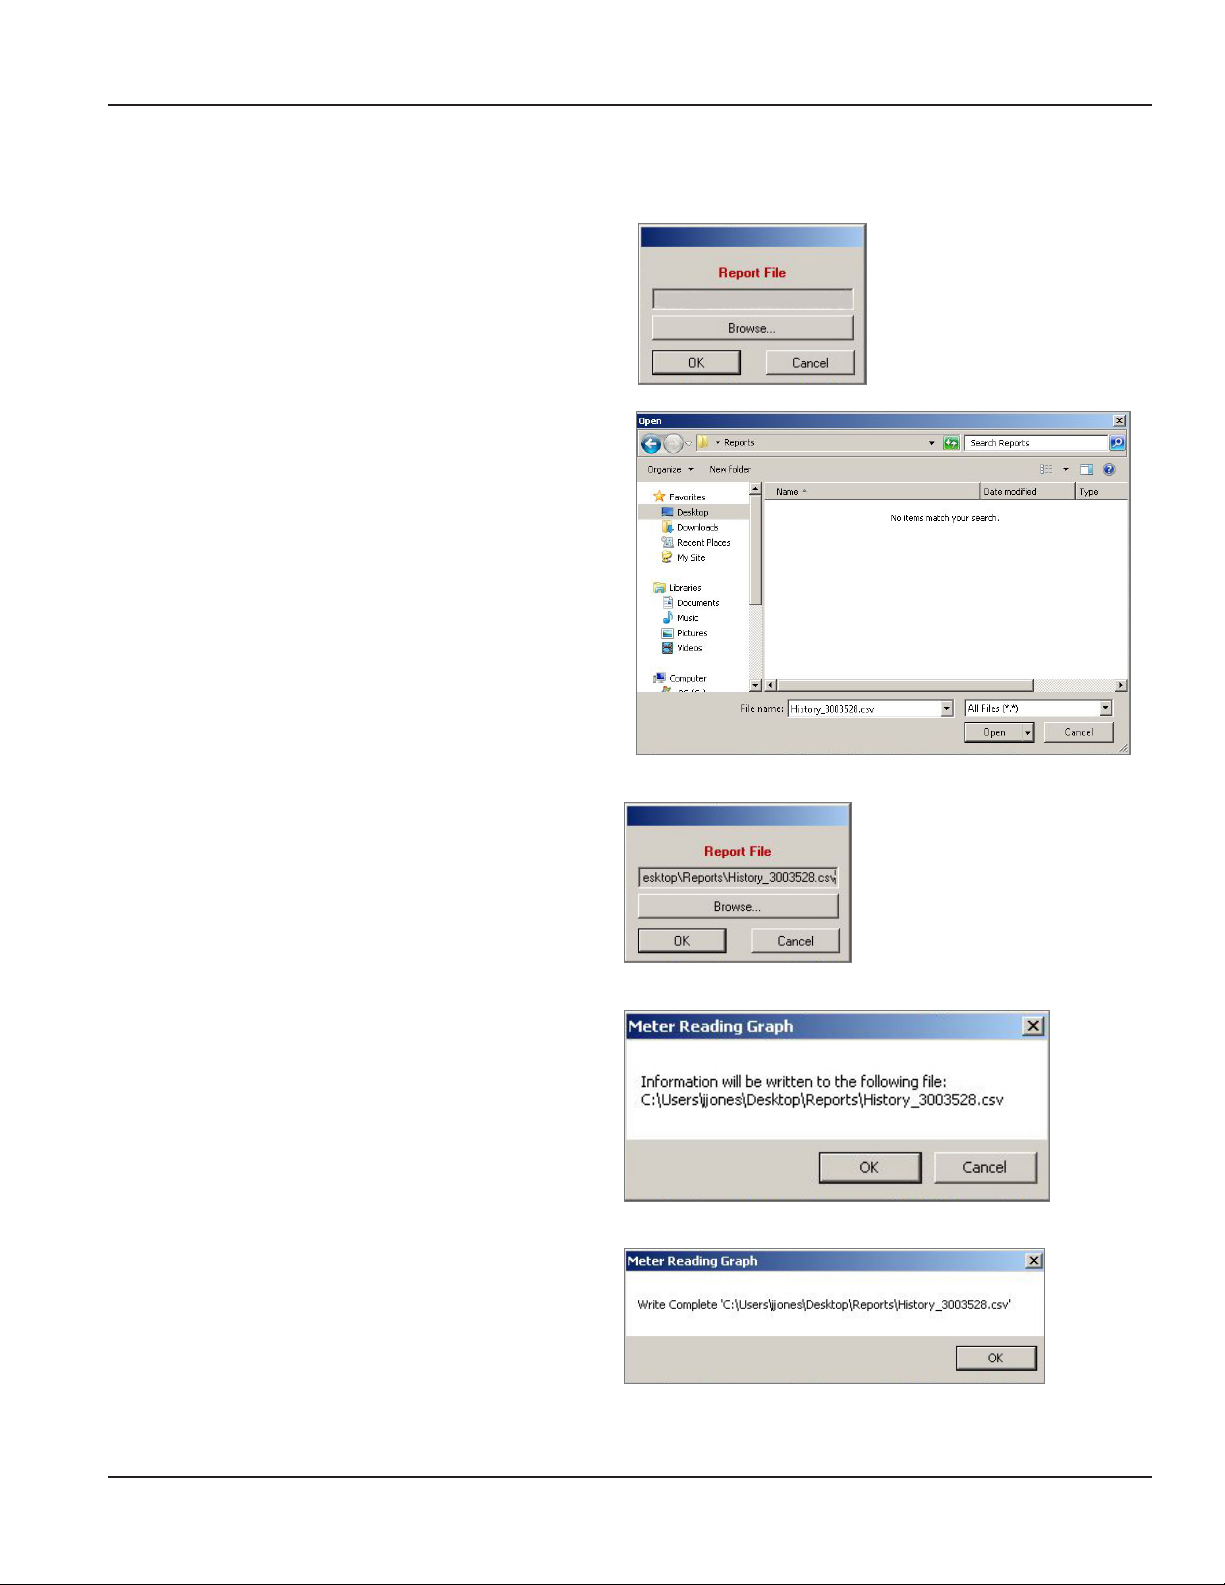
Click the File button on the Gateway Reading Reports screen to save the report results to a comma-delimited file.
1. Click Browse for the location to save the le.
2. Type the name of the le. If no extension is entered,
the system will default to a .csv le which can be
opened in Excel. (The le may also be opened in a
text editor. Use a .txt extension in this case.)
Click Open.
User Manual
3. The path and name of the le display in the le
name eld. Click OK to conrm and continue.
4. A message displays stating the specied le will
be written. Click OK to conrm and continue.
5. When you see the message that the process is
complete, click OK.
Page 33 June 2014
Page 34
ReadCenter® Analytics & Analytics Mobile
CUSTOM REPORTS
ReadCenter Analytics
Accounts> Custom Reports
Use this function to create reports with field names you select.
OTE:N An account record must be associated with the endpoint to create a Custom Report.
Maintenance & Settings> Custom Reports
ReadCenter Analytics Mobile
Creating a Report
3
5
1
2
4
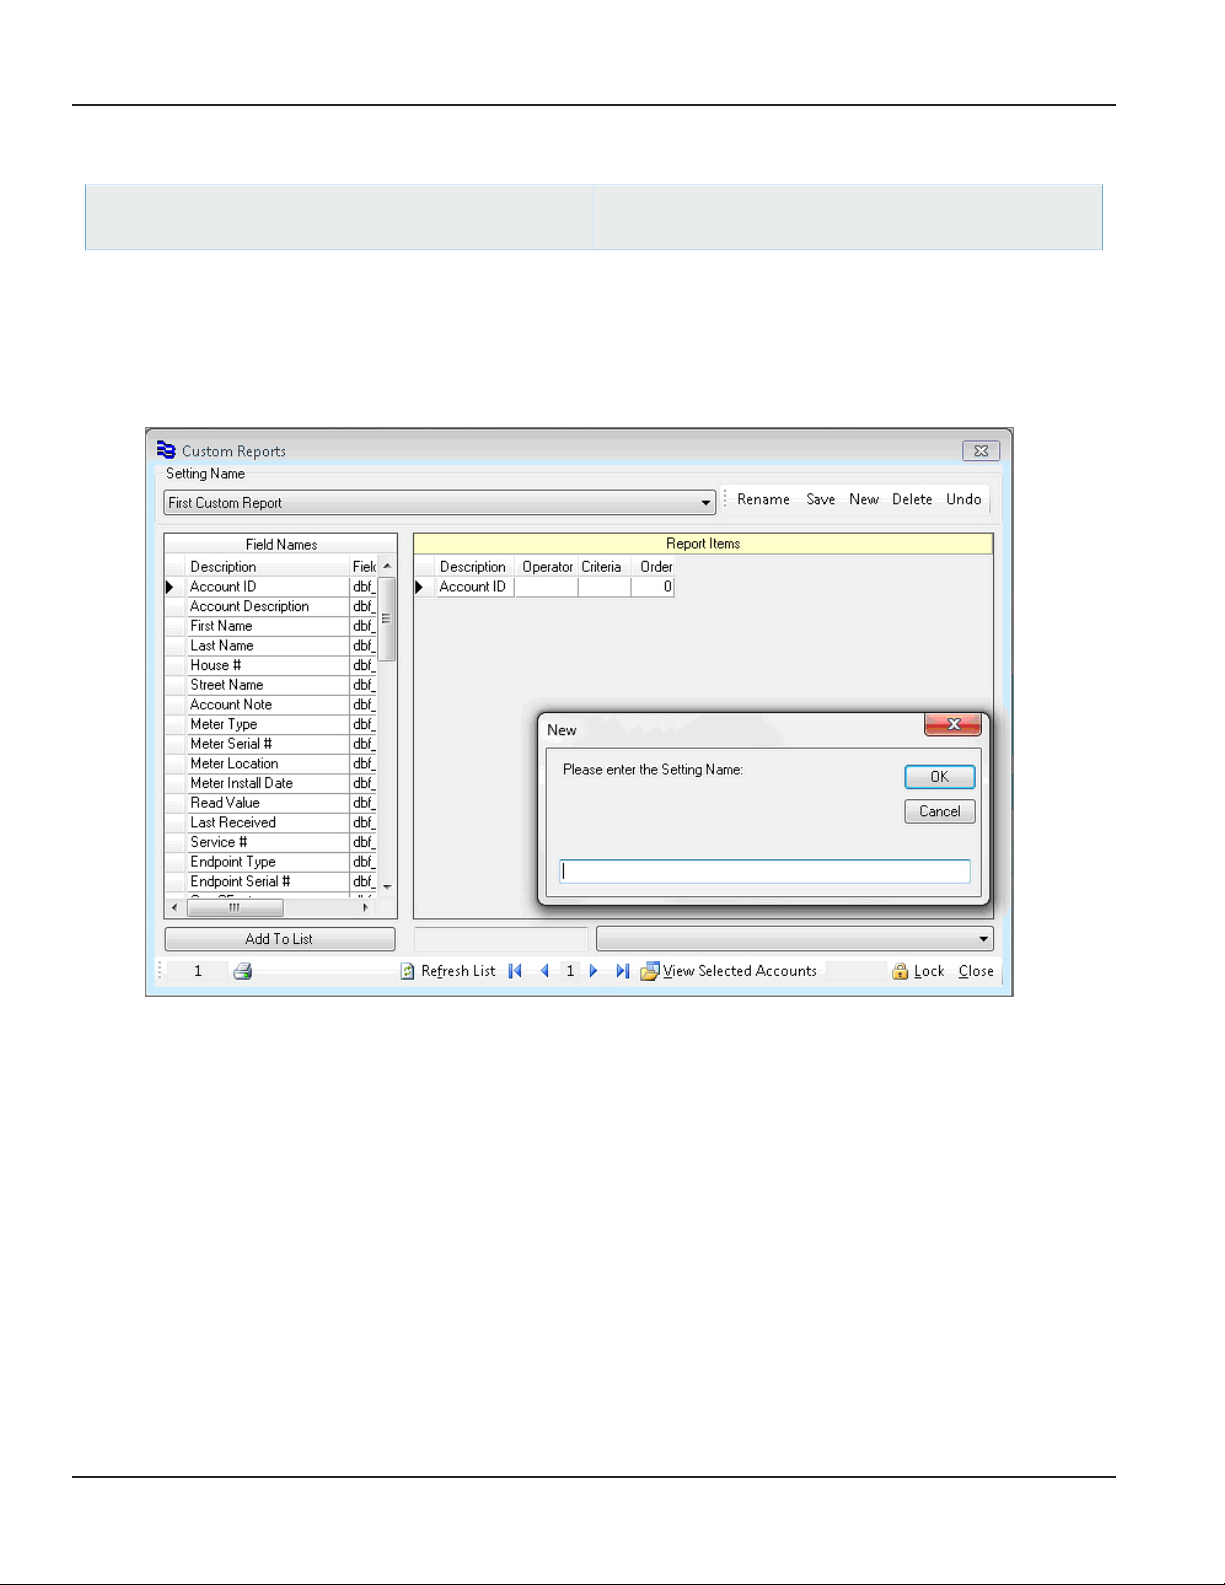
1. Click New on the upper right side of the screen.
2. Enter the name of the new report in the window that opens and click OK.
3. Select a Field Name from the column on the left.
4. Click Add To List to add an item to the report. (Double clicking on the eld name description will also add the item.)
Result: The selected eld name appears as a new line in the Report Items window.
5. Repeat steps 3 and 4 until all the desired eld names have been added.
OTE:N To remove an item from the report, highlight the item by clicking to the left of the description. Then press
the Delete key on the keyboard.
6. To change the order of the elds, enter the desired order numbers into the Order eld (see #5 above).
7. Click Refresh List to place the elds in the desired order and save the changes.
Page 34 June 2014
Page 35
User Manual
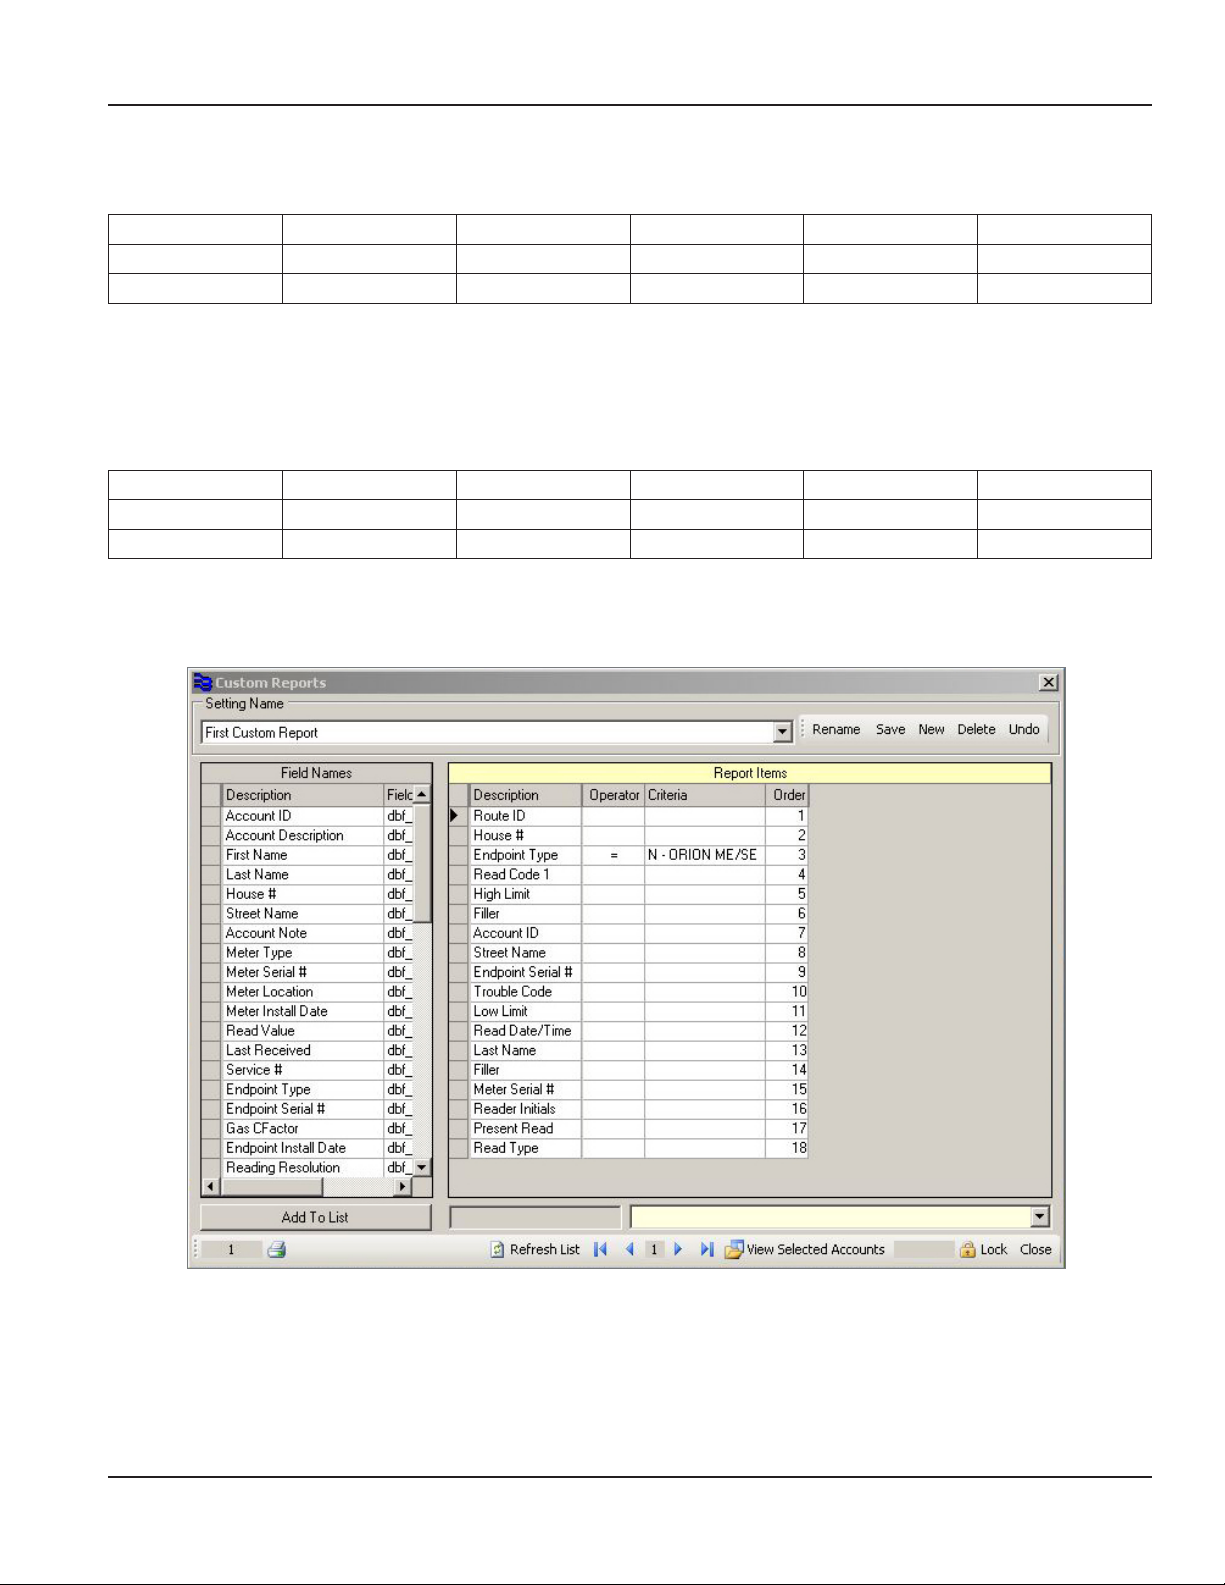
Setting the Operators and Criteria
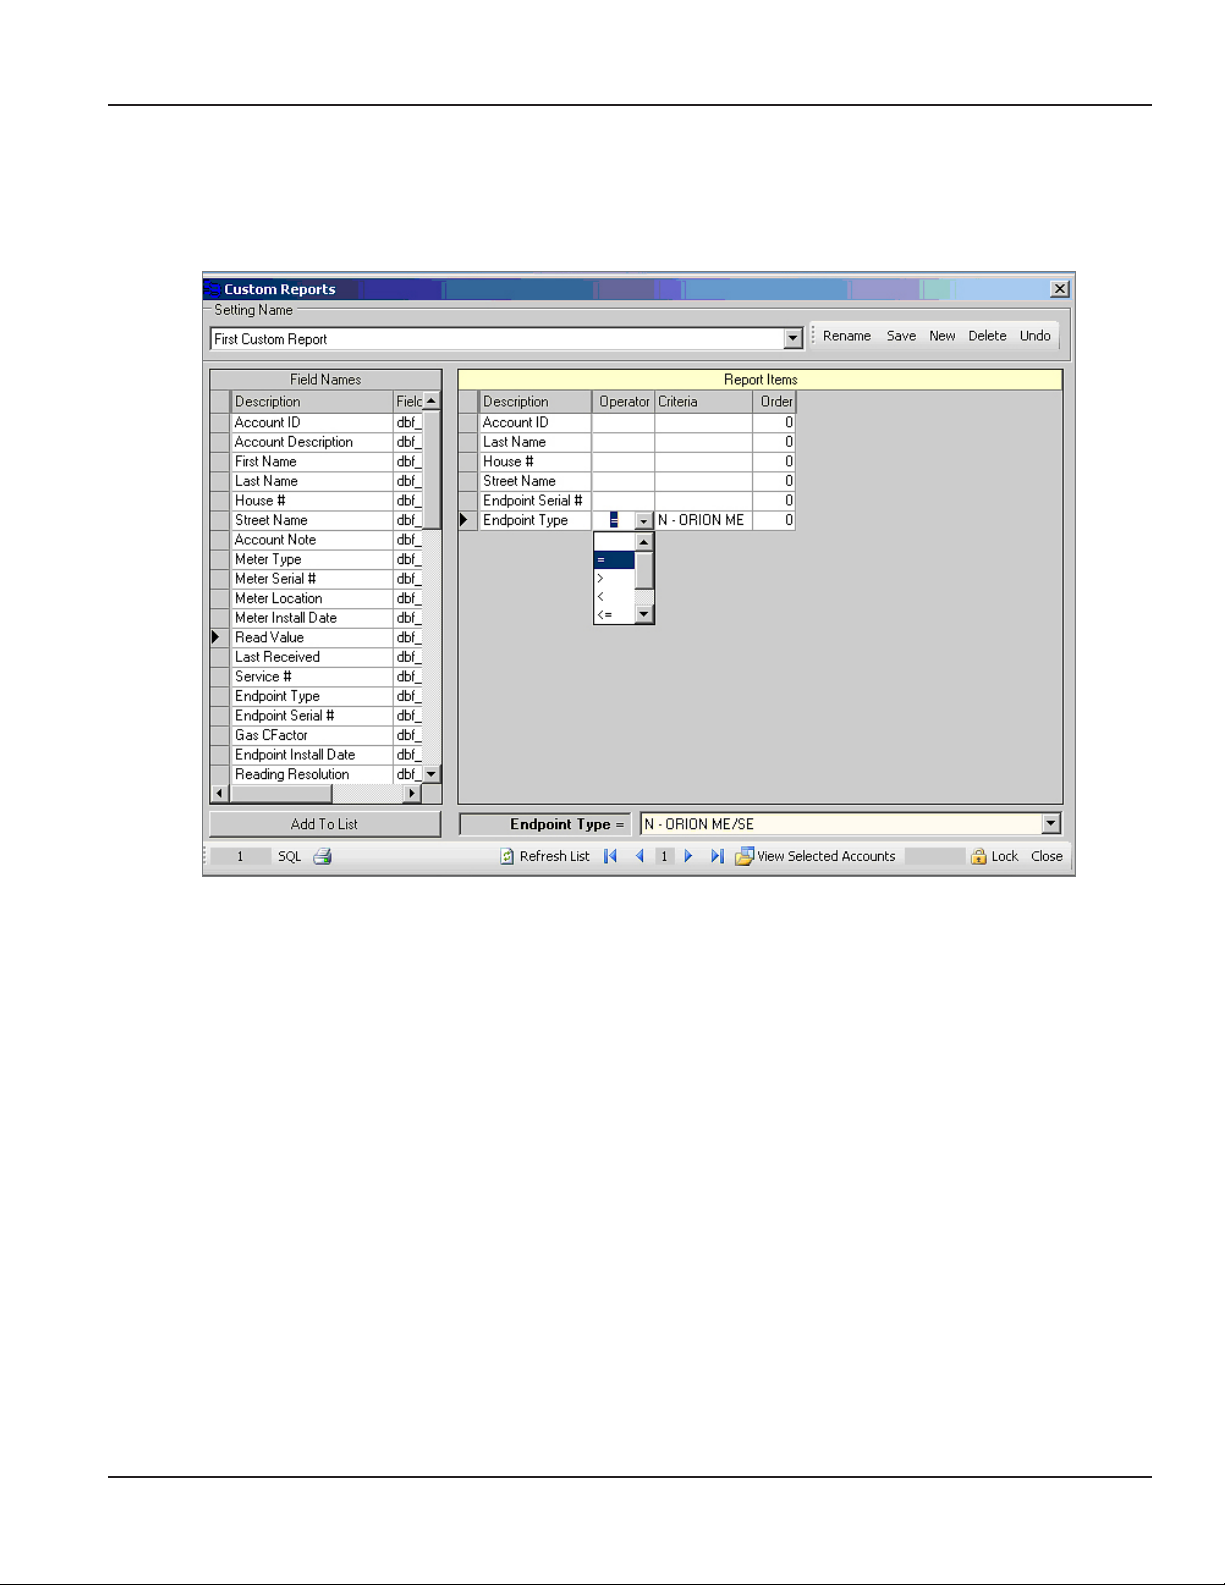
Account information can be sorted further by using the Operator and Criteria fields. If a report showing only ORION ME/SE
endpoints is desired, the non-ORION accounts can be filtered out by selecting an Operator of ‘=’ and the Criteria of
‘N-ORION ME/SE’ in the Endpoint Type field.
1. Click in the Operator eld to activate the drop-down menu and select the desired operator.
2. Select or type the Criteria.
OTE:N Some field descriptions have a drop-down menu with a predefined list of criteria that appears at the bottom
of the window. Others require you to type the desired criteria into the Criteria field.
Page 35 June 2014
Page 36
ReadCenter® Analytics & Analytics Mobile
Viewing, Printing and Exporting
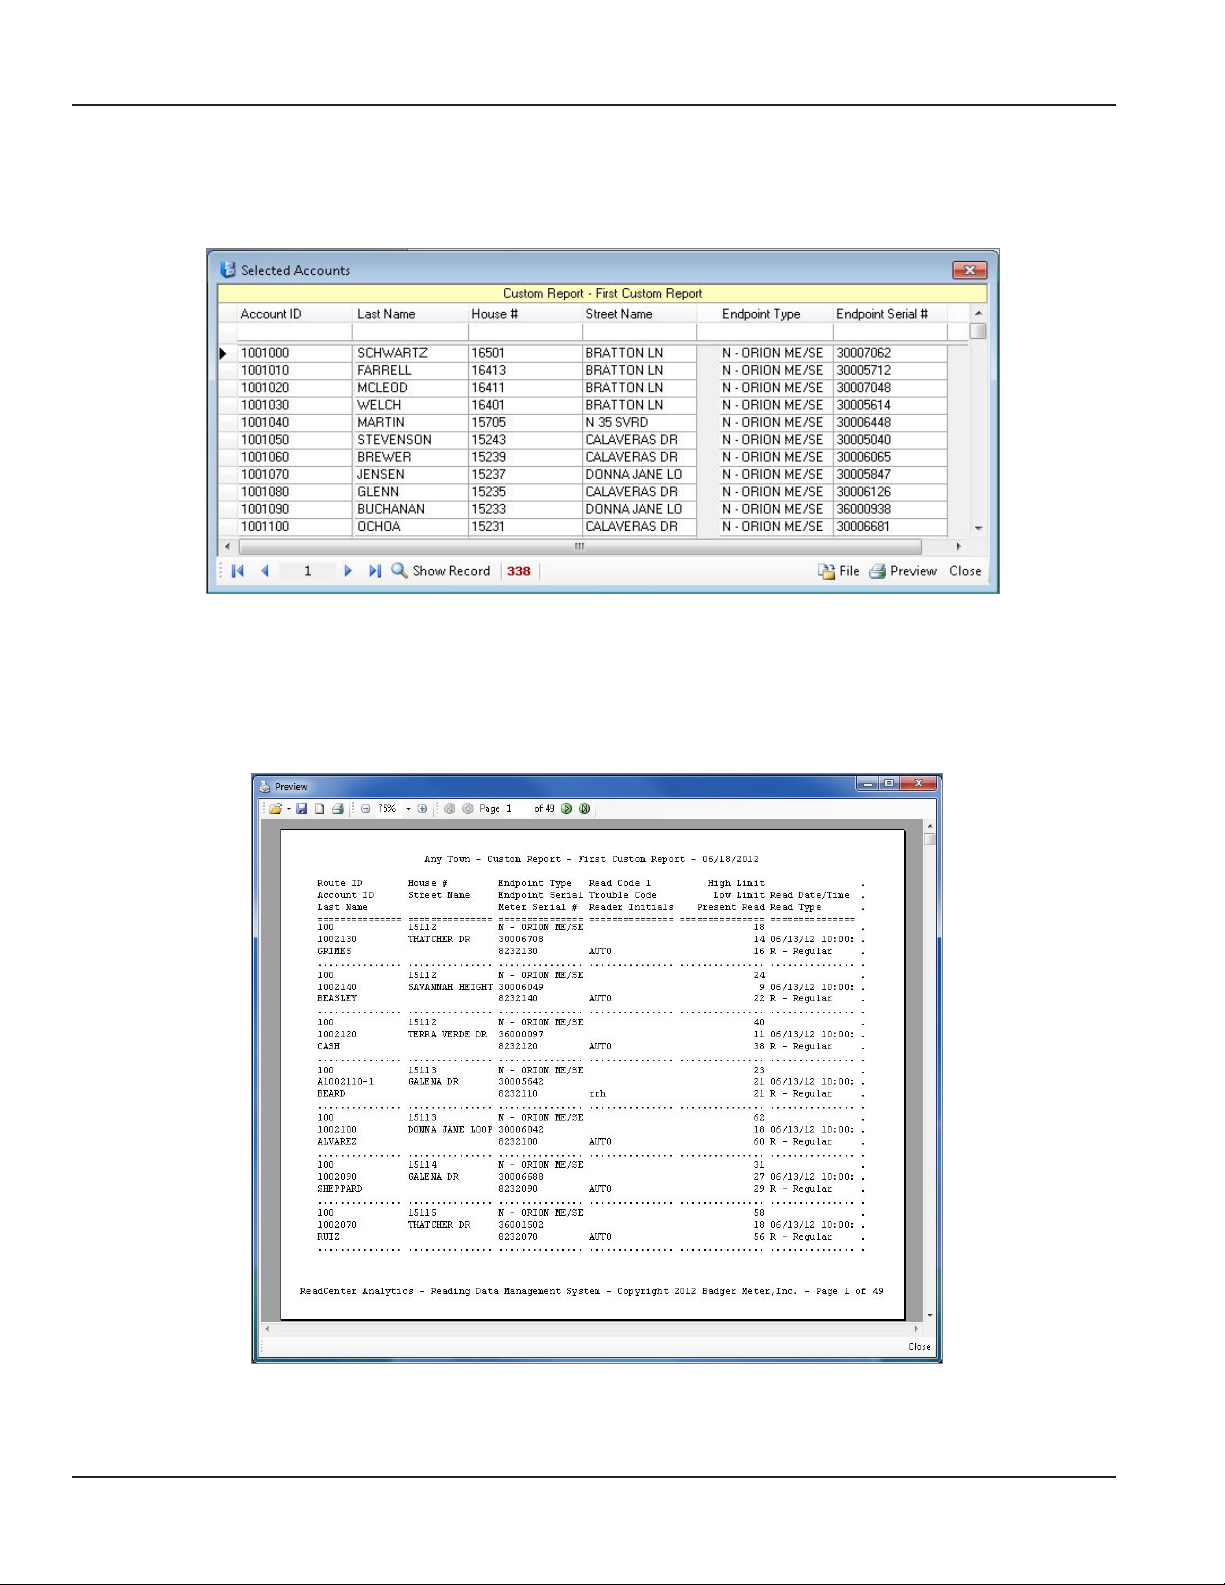
1. To view the selected accounts click View Selected Accounts at the bottom of the Custom Reports window.
Result: The accounts that match the report are displayed.
The fields may not be in the selected order in this window. When the report is printed, the fields appear in the
defined order.
OTE:N If you click File, the report will be saved as a .csv file. For additional information, refer to "File" onpage33.
2. To print or export the report click Preview.
Result: A preview of the report opens.
3. Click the printer icon in the task bar at the top of the screen to print the report.
4. To export the report, click the save icon and save the report in the desired format that can be attached to an
email or distributed as needed.
Page 36 June 2014
Page 37
User Manual
Large Reports
A maximum of 18 fields can be displayed on a report. They display in the following format.
Field 1 Field 2 Field 3 Field 4 Field 5 Field 6
Field 7 Field 8 Field 9 Field 10 Field 11 Field 12
Field 13 Field 14 Field 15 Field 16 Field 17 Field 18
When grouping fields vertically, use the Filler description to create a blank field. In the example below, Filler was used in
Field 6 and Field 14.
Desired format:
Route ID House # Endpoint Type Read Code 1 High Limit Filler
Account ID Street Name Endpoint Serial # Trouble Code Low Limit Read Date/Time
Last Name Filler Meter Serial # Reader Initials Present Read Read Type
Shown below is an example of the Custom Reports screen with the maximum number of fields (18) defined, including two
blank fields.
Click View Selected Accounts at the bottom of the Custom Reports window. Then click Preview to see a report preview, print
the report or export the report file.
Page 37 June 2014
Page 38
ReadCenter® Analytics & Analytics Mobile
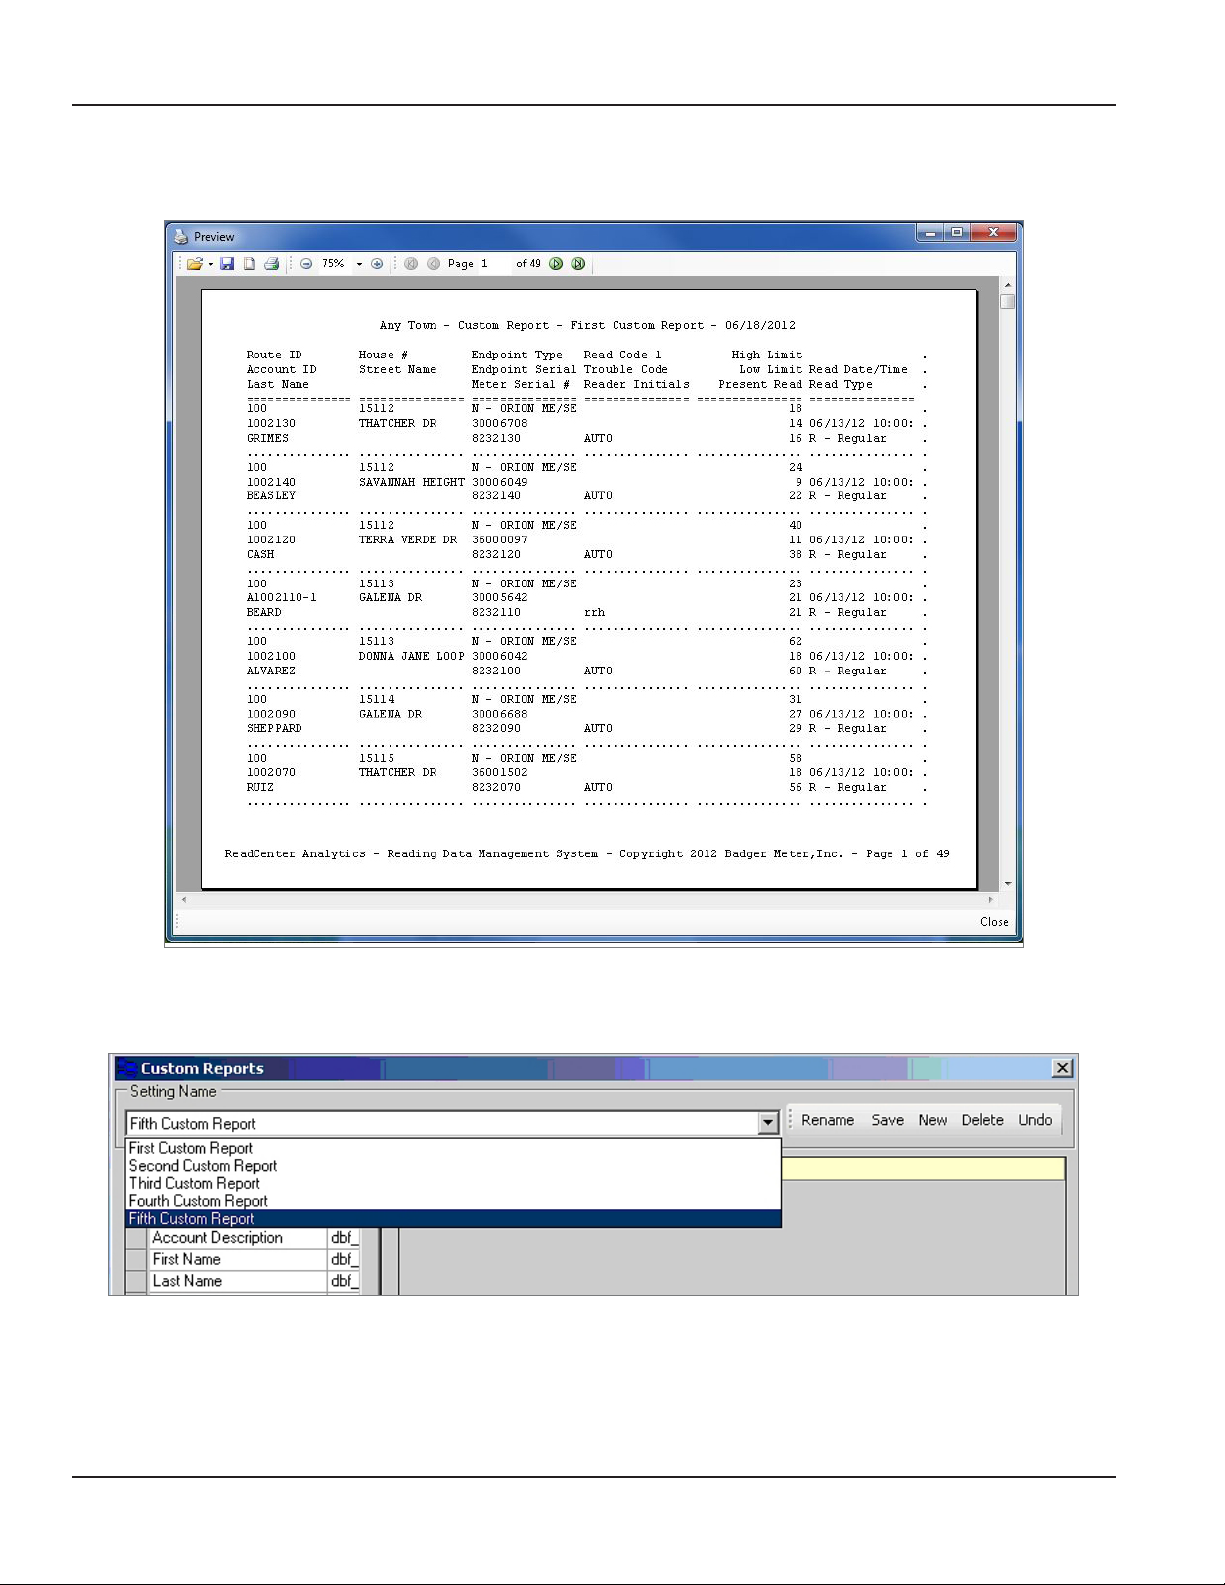
Preview of the Report
Shown below is an example of a custom report with the maximum 18 fields.
Deleting a Custom Report
1. Select the report from the drop-down menu at the top of the screen.
2. Click Delete.
3. Click OK in the conrmation popup window to delete the report.
Page 38 June 2014
Page 39

ANALYTICS
The Analytics section is accessed from the main menu bar.
• Network Analysis
• Account Analytics
• Gateway Reading Summary
OTE:N Network Analytics and Gateway Reading Summary
apply to fixed network only and are not part of
Analytics Mobile.
Network Analysis
User Manual
ReadCenter Analytics
Analytics> Network Analysis
Fixed Network Only: This section is intended for customers with a fixed network system. Customers using ReadCenter
Analytics exclusively for a mobile network may skip this section.
The Network Analysis option provides a means to record daily summaries of gateway and endpoint reception totals to allow
viewing over time. Use the summaries to monitor system activity and the overall health of the system.
OTE:N This option is not available with SQL Server Express.
A process is executed automatically each day to record the number of total active gateways and endpoints that should have
reported that day along with the number of gateways and endpoints that actually reported. The initial view shows activity for
the past week. The date range can be modified to show other time periods.
Each day’s totals and percentages within the time period are shown in a table view at the top of the screen and in a chart view
in the lower portion of the screen. Table data may be saved as a .csv file.
Chart Options
The Network Analysis chart views can be
customized. A variety of chart options are
available and a default chart view is provided.
ReadCenter Analytics Mobile
n/a
Select Chart Options at the bottom of the
Network Analysis screen and use the wizard to
select a chart type, make color selections and
position the data to create a chart suitable for
the selected information.
Page 39 June 2014
Page 40
ReadCenter® Analytics & Analytics Mobile
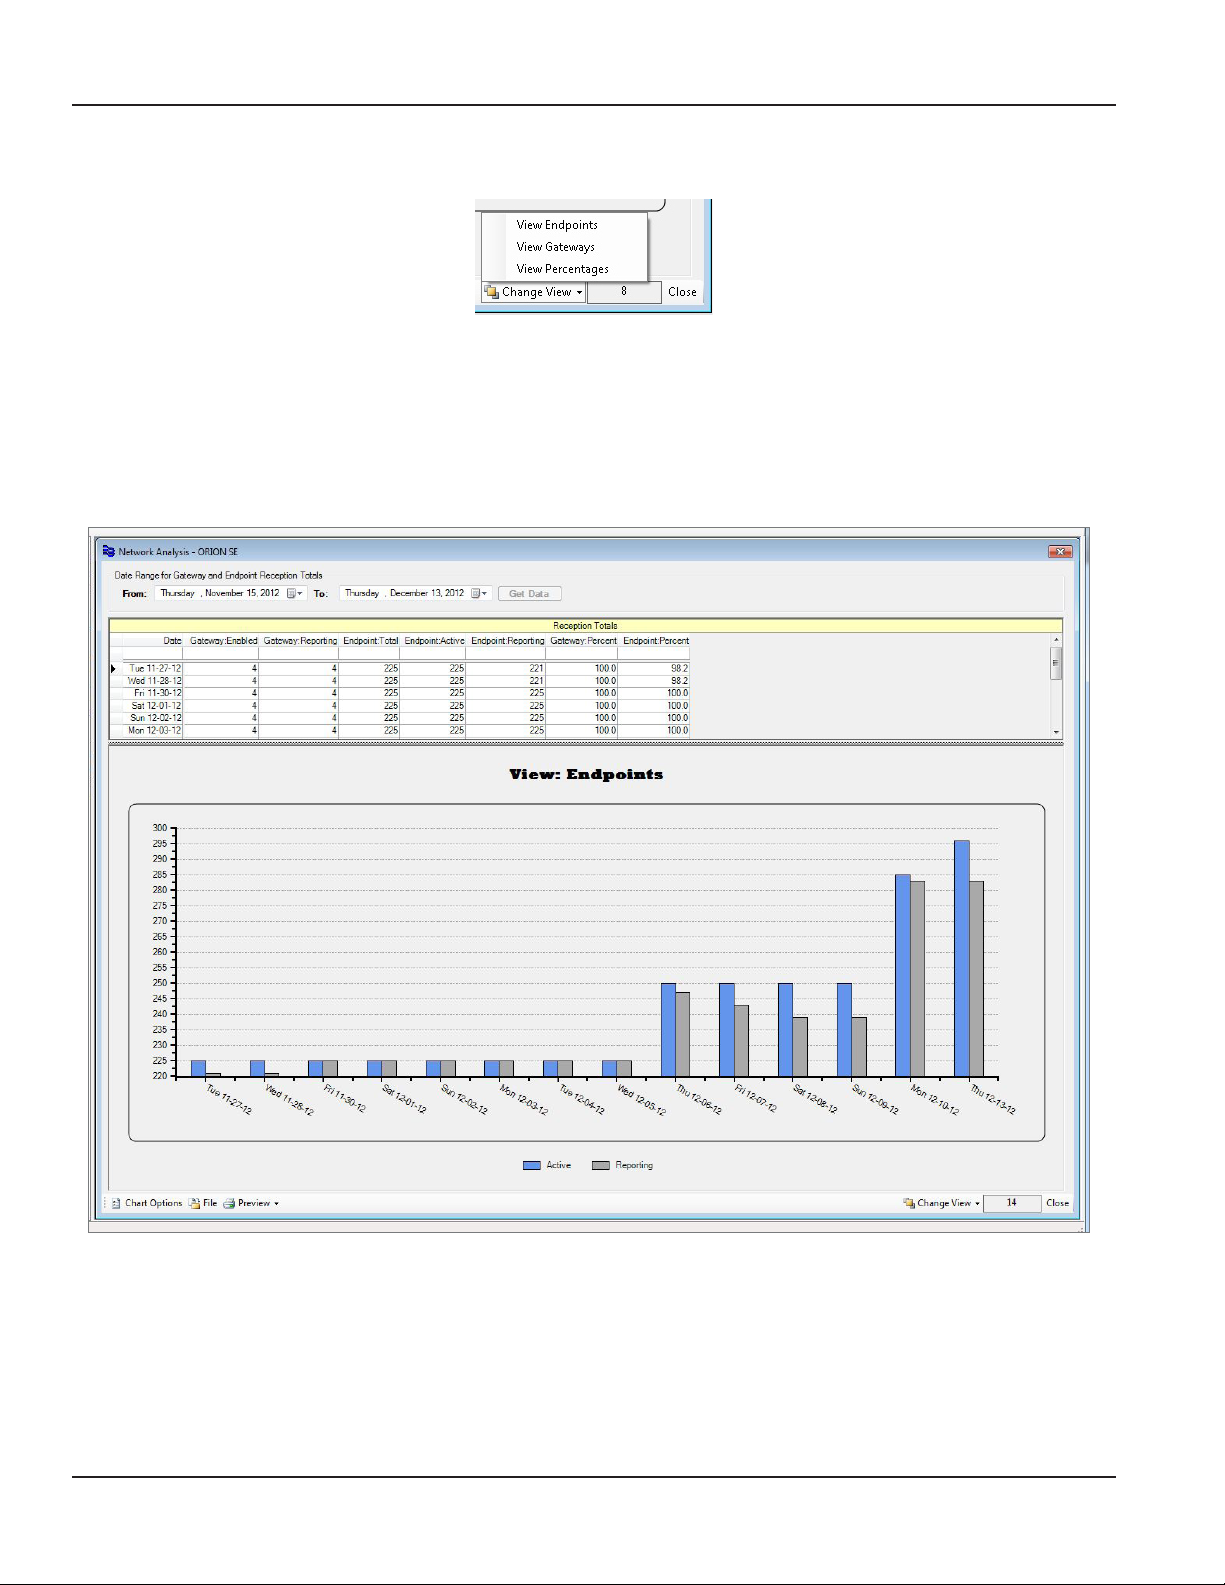
Summaries are available in three views: Endpoints, Gateways and Percentages. To select a view, click Change View in the
bottom tool bar.
View Endpoints
Click Change View in the bottom tool bar and select View Endpoints. The endpoint view provides a comparison of the
number of reporting endpoints with the total number of endpoints per day for a selected time period.
For the endpoint view, the Endpoint: Total number represents the endpoints that have been installed and imported into
ReadCenter Analytics from the utility account files. The Endpoint: Reporting number represents endpoints that have been
associated with account information and that are successfully communicating.
Page 40 June 2014
Page 41

View Gateways
Click Change View in the bottom tool bar
and select View Gateways.
The Gateways view provides a comparison
of the number of reporting gateways with
the total number of gateways per day for a
selected time period.
In the Gateways view, the
Gateway: Enabled number represents
gateways that are installed and ready to
accept endpoint readings and assignments.
The Gateway: Reporting number
represents gateways that have successfully
communicated each day.
User Manual
View Percentages
Click Change View in the bottom tool bar
and select View Percentages.
The Percentages view shows a comparison
between endpoint and gateway receptions
by percent rather than actual count.
This sample view shows that each gateway
is "Enabled" and communicated each day.
It also shows that endpoint activity varies
from day to day.
Page 41 June 2014
Page 42

ReadCenter® Analytics & Analytics Mobile
Account Analytics
ReadCenter Analytics
Analytics> Account Analytics
Use the Account Analytics option to define the conditions for which you need to be informed:
• Endpoint alarms that occur a specified number of times over a configurable time period.
• Usage alarms for consumption limits either not met or exceeded over a configurable period of time.
ReadCenter Analytics Mobile
Analytics> Account Analytics
Features
• Multiple Setting Names can be defined and saved for later recall.
• Conditions can be defined for specific customer accounts or account groups.
• Optional Notifications can be sent to your email. (NOTE: Not available with SQL Server Express.)
• Customer Account records that meet the conditions can be viewed in a table format.
• Tabular data can be saved as a .csv file.
Defining Criteria for Account Analysis
1. Choose a Setting Name from the drop-down menu.
This is a customer-dened eld. Click New next to the Setting Name eld to add a new setting name. You may also
Rename a setting or Delete a setting name.
2. Use the radio buttons and the related elds to select accounts to be analyzed by specifying a group or a range of
route or account numbers.
3. Click the View Selected Accounts button to verify you have the correct accounts.
Page 42 June 2014
Page 43

User Manual
4. Click on an Endpoint Alarm or Usage Alarm in the Conditions eld on the left side of the screen.
The list of Endpoint Alarms and Usage Alarms in the Conditions eld is based on the selections made for the endpoint
types on the System Conguration screen (Tools> System Conguration).
When a Condition is selected from the list on the left, it displays in the Condition eld on the right side of the screen
where it can be further dened.
5. Dene a period of time for the account analysis.
Use the drop-down menu to choose an End Date. Then select the time period using the drop-down menu in the
Period eld
or
Check Use Date Range and then select Date From and Date To using the drop down menus.
OTE:N In the software, End Date is at midnight of the date selected. To get information for the current date as well,
select an End Date that is one day after the report time period. For example, if you want to see a report with
information through February 2, select February 3 as the End Date.
OTE:N As the date selections change, the resulting range is shown in blue in the tool bar.
6. Select a qualier ("Greater Than," "Less Than") from the drop-down menu. This eld is labeled "IS" for Usage Alarms and
changes to "Occurs" for Endpoint Alarms.
7. Use the up and down arrows to dene the number of units or number of times the Condition must have occurred
within the dates selected. This eld is labeled "Units" for Usage Alarms and changes to "Times" for Endpoint Alarms.
8. Click View Report to see a report with the criteria specied. A sample report is shown here.
Show Records - Select an account and click Show Records to see the Account Records screen for the account.
Show Reads - Select an account and click Show Reads to see the readings for the selected time period. In this view,
a graph of the reads is also available.
Page 43 June 2014
Page 44

ReadCenter® Analytics & Analytics Mobile
Email Notification for Alerts
Endpoint and usage alarms can be sent via email by setting up email notifications on the Account Analytics screen.
OTE:N Email notifications are not available with SQL Server Express.
After defining the criteria for account analysis, you can create an email notification that will trigger a daily email to be sent to
an address you define.
• Any number of email notifications can be created. The number of notifications displays at the bottom of the Create
screen and the View screen.
• Email Notification delivery starts the day after the Notification is created.
• The Notification reports the prior day's activity. In the case of a usage alarm, the Notification reports activity for 7
days (weekly usage) or 30 days (monthly usage) prior to the Email Notification date.
• One email for each Notification is sent daily—seven days a week— whether or not an alarm condition occurs.
Creating an Email Notification
1. On the Account Analytics screen, click to select a Condition from the list on the left side of the screen for which you
want to create an Email Notication.
2. Select a qualier ("Greater Than," "Less Than") and dene the number of units or number of times for the Condition
from the menu on the right side of the screen.
3. Click Email Notication> Create New Notication in the lower tool bar of the screen.
Result: A conrmation window pops up with the condition information you selected.
Page 44 June 2014
Page 45

4. Click OK.
Result: The Email Notication Create screen
opens as shown in the example here.
5. Enter a description of the Notication (up to 50
characters) in the Description eld.
6. The user name automatically lls in the Created
By eld. This eld can be changed to a dierent
name or initials.
7. Enter one or more email addresses for the
Notications in the Recipient Email Address(s)
eld. If you enter more than one email address,
separate the addresses with a semi-colon ( ; ).
8. Click Save Notication.
Result: The Email Notication conrmation
window opens as shown here.
9. Click OK.
Result: The Email Notication is saved and
active. The rst email will be sent the next day.
User Manual
Viewing and Deleting Email Notifications
1. Click Email Notication> View Existing Notications in the lower tool bar of the Account Analytics screen.
Result: The Email Notication View window opens with any email notications that have been created.
2. Click the Notication in the list on the left side
of the screen to view the details.
3. To delete the notication, make sure the
notication you want to delete is selected in
the list.
Then click the Delete button.
Result: A conrmation window pops up.
4. Click Yes to delete the notication.
Result: A window pops up to conrm the deletion.
5. Click OK.
Result: The Email Notication is deleted.
6. Click Close to close the Email Notication View
window.
Page 45 June 2014
Page 46

ReadCenter® Analytics & Analytics Mobile
Gateway Reading Summary
ReadCenter Analytics
Analytics> Gateway Reading Summary
Fixed Network Only: This section is intended for customers with a fixed network. Customers using ReadCenter Analytics
exclusively for a mobile network may skip this section.
Use the Gateway Reading Summary function to view information retrieved from the receive log held within each ORION SE
gateway. The log is typically retrieved on a weekly basis. Information can be viewed to see the reception coverage of each
gateway. It can also tell whether endpoint activity is being received by multiple gateways.
ReadCenter Analytics Mobile
n/a
1. Select a Start date using the drop-down menu on the left side of the screen, below the Gateways table.
2. Select a time period using the Period drop-down menu. In the screen example above, "Previous Month" is selected.
3. Click the Get Data button.
Result: The Gateways, Endpoints and Meter Readings tables on the left side of the screen ll with information for the time
period selected and the time period displays at the bottom of the screen.
4. Click the Update Summary button to view the data in the Reception Summary table on the right.
Result: All unique gateway/endpoint combinations for the time period selected are shown in the Reception Summary table.
The data shows which gateways are picking up the most endpoint activity and shows any endpoints that are reporting to
more than one gateway.
As you point to each gateway in the table, endpoints reported through the gateway during the time period specified are
shown in the Endpoints column. As you point to each endpoint in the table, meter readings reported by the endpoint are
shown in the Meter Readings column.
Page 46 June 2014
Page 47

User Manual
The boxes at the bottom of the screen provide additional information about the data displayed in the tables for the time
period selected.
• The first three boxes on the left show the total number of gateways, endpoints and meter readings. In the screen
below, the boxes show 3,646 and 6 from left to right, respectively.
• The first of the two boxes on the right shows the number of items in the Reception Summary table. The screen
below shows 1303. The second box shows the number of endpoints in the system that are currently assigned to
gateways. The screen below shows 2373.
Reception Summary
Select the Reception Summary tab to see a list of unique endpoint and gateway combinations. The screen below shows
several examples of an endpoint (36005243) which was received by two gateways (9020103, 9020155).
Endpoint # The unique numeric serial number of the endpoint.
Gateway # The unique numeric serial number of the gateway.
First Read The rst reading received from the endpoint through the gateway for the time period selected.
Last Read The last reading received from the endpoint through the gateway for the time period selected.
Span The number of days between the rst and last read for the time period selected.
Reads The total number of readings received from the endpoint through the gateway for the time period selected.
Interval The time between each reading for the endpoint.
Page 47 June 2014
Page 48

ReadCenter® Analytics & Analytics Mobile
Current Assignments
Select the Current Assignments tab to see the current gateway endpoint assignments.
Endpoint # The unique numeric serial number of the endpoint.
Gateway # The unique numeric serial number of the gateway.
Assigned Date and time that an assignment was determined.
Sent Date and time that the actual assignment was communicated to the gateway.
Page 48 June 2014
Page 49

User Manual
Part IV: Accounts and System Settings
Page 49 June 2014
Page 50

ReadCenter® Analytics & Analytics Mobile
ACCOUNTS AND SYSTEM SETTINGS
The Accounts and System Settings section includes procedures for ReadCenter Analytics and Analytics Mobile system set up
and maintenance. These procedures are for fixed and mobile networks and are intended to be used one time prior to using
ReadCenter Analytics or Analytics Mobile and as needed thereafter when settings need to be redefined. Settings can be
customized to support the needs of the utility.
This section includes the following topics.
• "Account Records" onpage51
• "Account Groups" onpage62
• "Collected Readings" onpage66
• "Handheld and Laptop Settings" onpage68
• "Endpoint Settings" onpage71.
• "Adding and Managing a Gateway" onpage75
• "Account Table Setup" onpage84
• "Batch Processing" onpage85
Page 50 June 2014
Page 51
Account Records
User Manual
ReadCenter Analytics
Accounts> Account Records
Accounts are created in the system by adding them manually or by reading an input file. The input file can be created by the
billing system, customer information system or another system that manages customer data.
ReadCenter Analytics Mobile
Accounts> Account Records
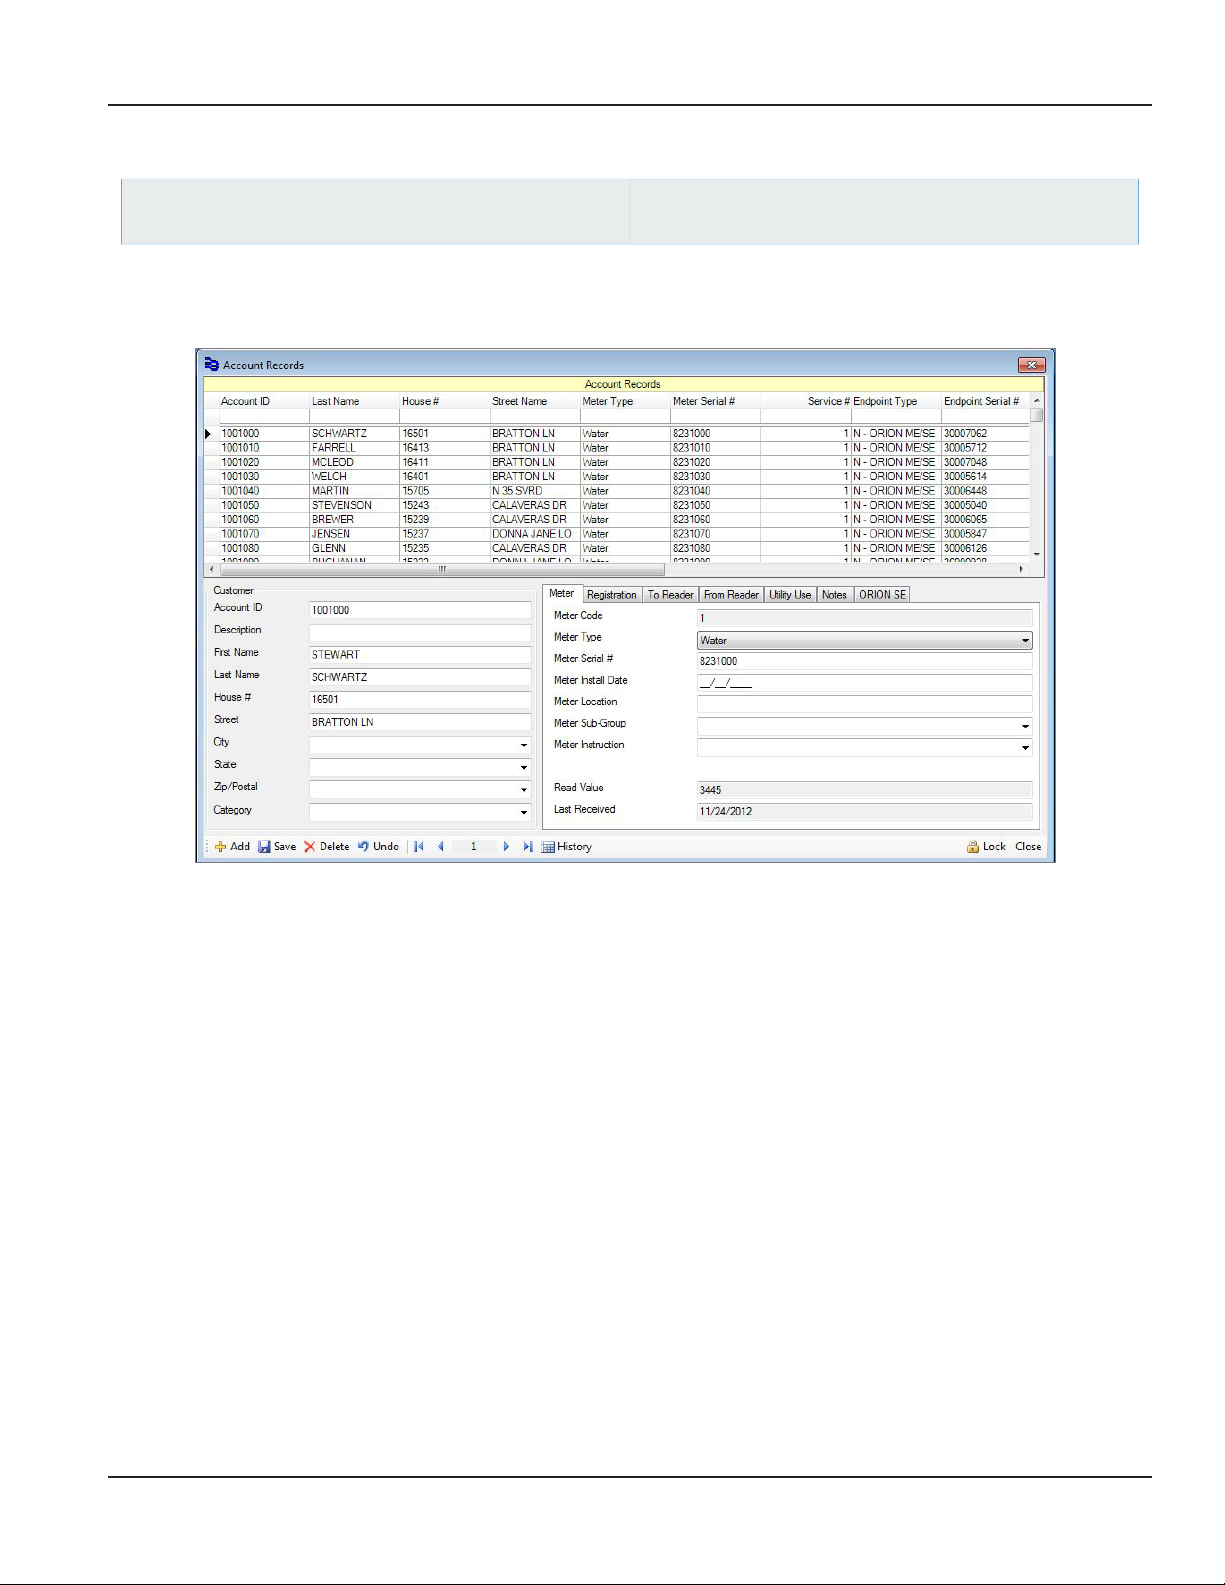
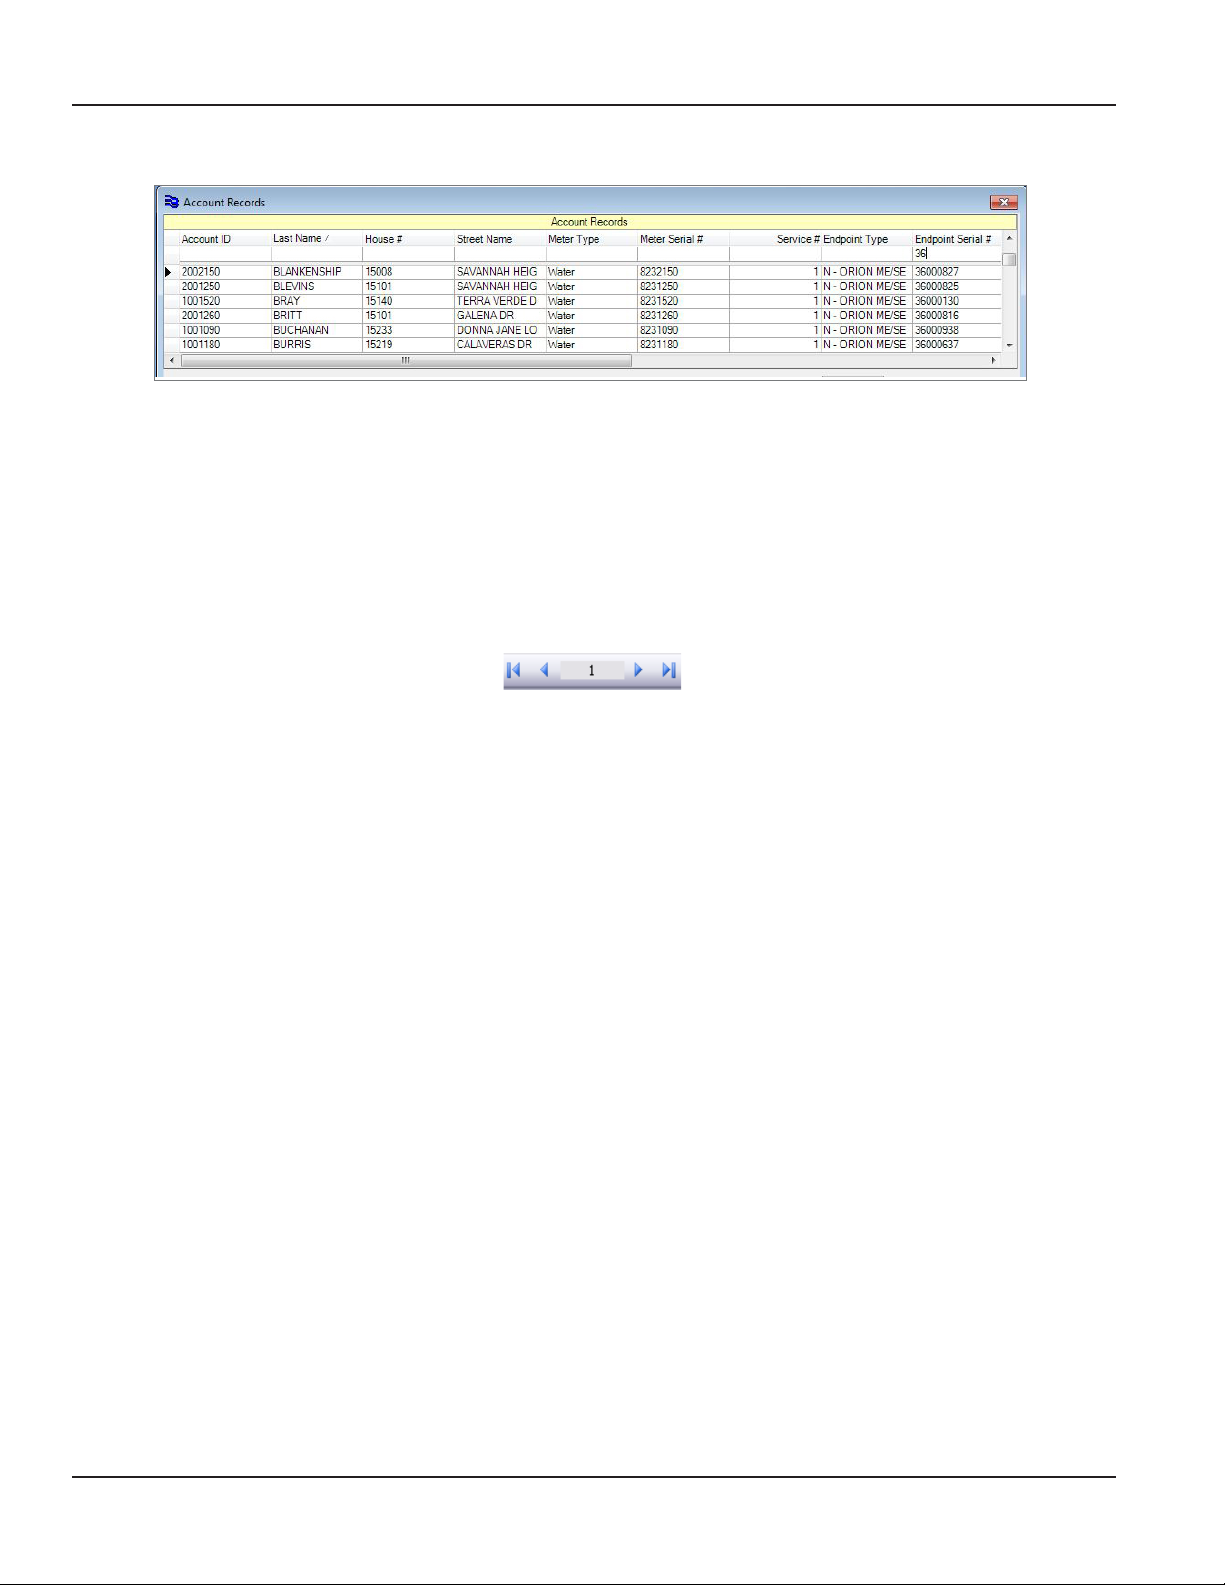
Screen Layout and Navigation
The Account Records screen has two sections. The top section is a grid with a list of account records, each with basic
information such as customer name and address. Scroll to view all the information in the grid. When you place the cursor on
an account in the top section and click to highlight it, the lower section displays details related to the account. The size of the
screen and location of the splitter bar between the sections can be adjusted.
The columns in the grid can be resized to accommodate the information. Move the cursor over the edge of the column
header until the cursor changes to a double-sided arrow ( ↔ ) . Then click the left mouse button and drag to resize the
column. Click the up/down arrow in the column heading to change from descending to ascending order. Click the arrow
again to change back.
Page 51 June 2014
Page 52
ReadCenter® Analytics & Analytics Mobile
Filtering Records
The row of fields below the column headings on the Account Records grid is called a filter bar. Use the
filter bar to search for details in the records such as account ID, endpoint serial number, last name or
address based on a character or term you enter. For example, if you type a “36” in the blank cell under
the Endpoint Serial # heading, endpoints that begin with “36” display in the rows below. The more
information you type in, the more you will narrow your search.
Record Navigation
There are two ways of navigating through the account records:
1. Point and click a row in the grid.
2. Use the navigation buttons in the tool bar .
Account Information Tabs
Customer Resident name and physical address where the meter is located
Meter Information about the meter
Registration Type of method used to read the meter
To Reader Information helpful to the person or collection device that reads the meter
From Reader Information from the person or collection device that reads the meter
Utility Use Extra space for miscellaneous information from the billing system
Notes Notes related to the account record
ORION ME or
ORION SE
The ORION ME endpoint tab displays when an ORION ME endpoint is selected in the grid at the top
of the screen. Configuration information including meter type, resolution code and programming
information is included.
The ORION SE endpoint tab displays when an ORION SE endpoint is selected in the grid at the top of
the screen. It includes parameters defined for the selected ORION SE endpoint using Tools> Endpoint
Settings in the main menu bar. On the Account Records screen, ORION SE information is divided into
two tabs, Configuration and Fixed Network Settings. Refer to "Endpoint Settings" onpage71 for
additional information.
Tool Bar Icons
The tool bars at the bottom of the Account Records screen and several other ReadCenter Analytics and Analytics Mobile
screens include icons that provide shortcut access to many time-saving features. Refer to "Using the Tool Bars" onpage96 for
more information.
Page 52 June 2014
Page 53
Account Fields
• For fields passed to the handheld or laptop, sizes listed here may vary from what can be displayed.
• Field sizes listed may vary from those defined in the structure of the input file from the billing system.
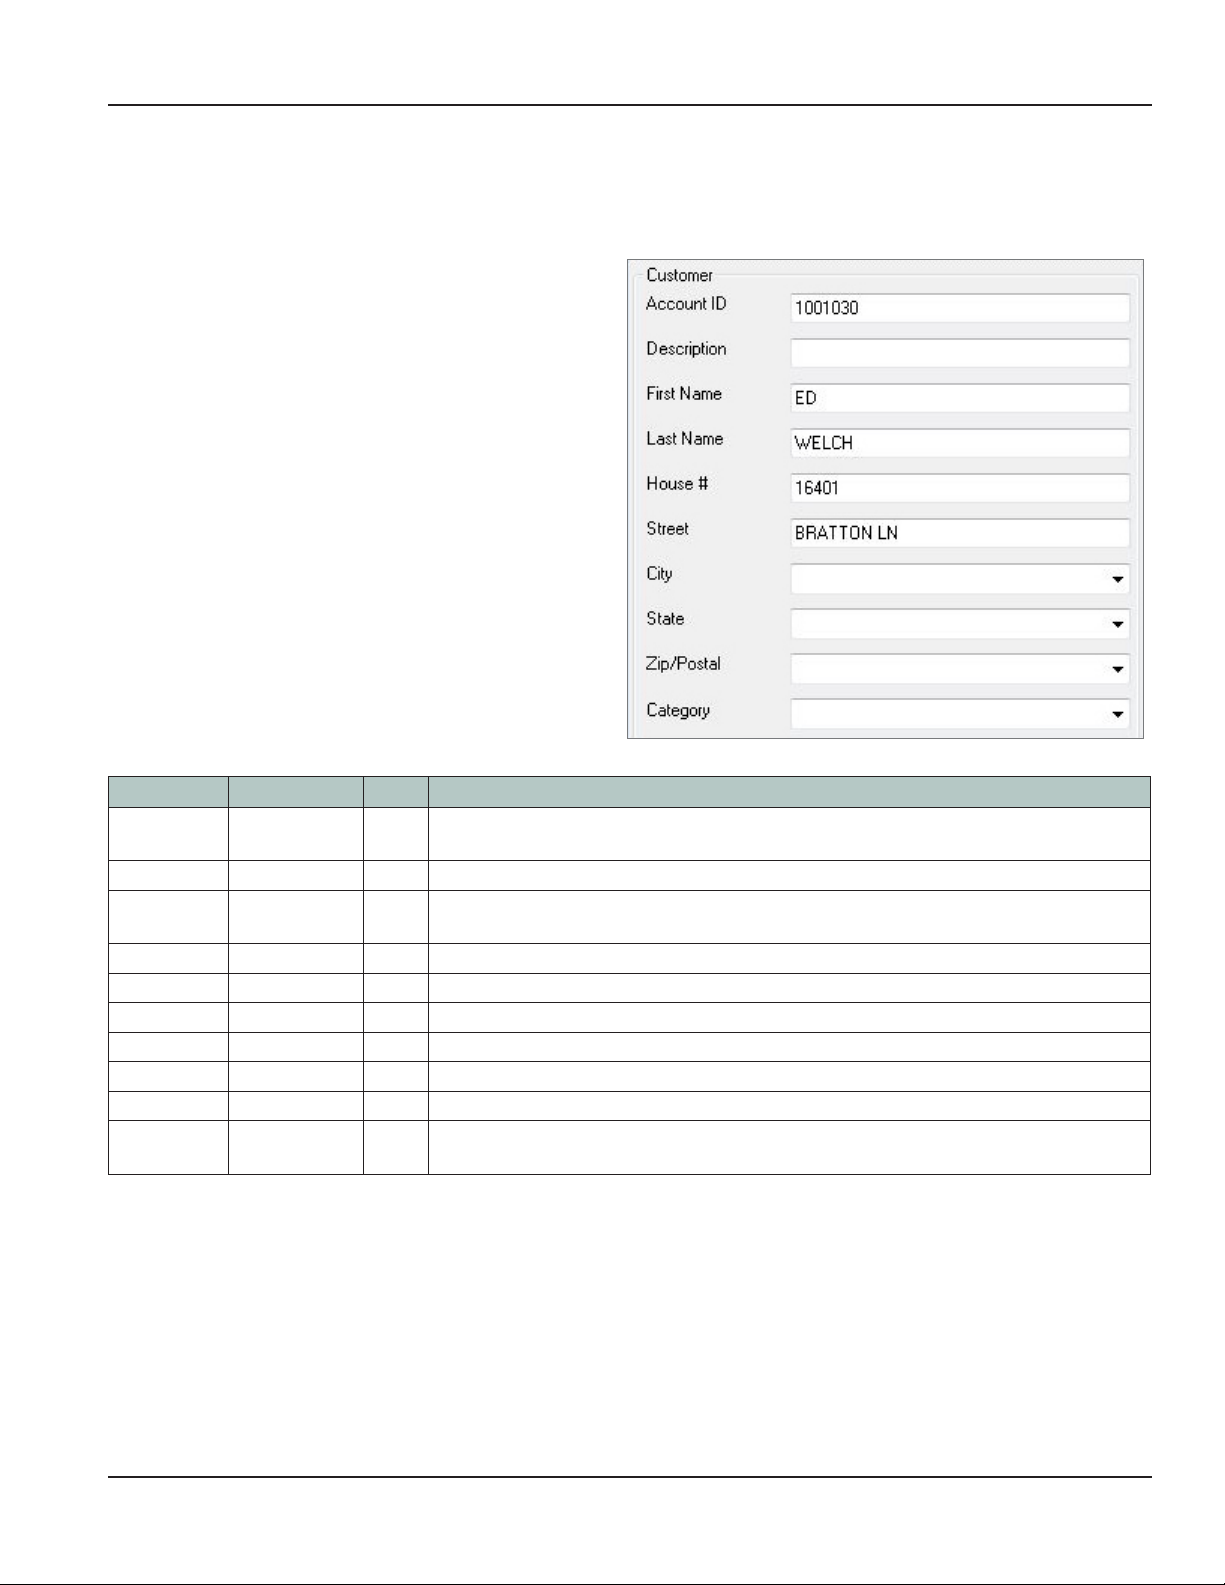
Customer
The Customer section displays the Account ID,
First Name, Last Name, House # and other
customer information including the physical
address where the meter is located.
User Manual
Field Name Type Size Description
Account ID Alphanumeric 50 Used to link the billing system record to the ReadCenter Analytics or Analytics Mobile record
(see Note below).
Description Alphanumeric 50 Optional customer information.
First Name Alphanumeric 50 First name of the customer who lives at the address—if a residence—where the meter is
located.
Last Name Alphanumeric 50 Last name or business name of the customer at the address where the meter is located.
House # Alphanumeric 50 Number of the address—residence or business— where the meter is located.
Street Name Alphanumeric 50 Street name of the address where the meter is located.
City Account Table 50 Optional—city where the meter is located.
State Account Table 50 Optional—state where the meter is located.
ZIP/Postal Account Table 50 Optional—the ZIP or postal code where the meter is located.
Category Account Table 50 Optional—for future development to identify a customer category such as residential or
commercial.
ACCOUNT ID Note:
• The Account ID is associated with the physical location of the meter and does not change when the meter,
endpoint or tenant changes. If the billing account number does not fit this criterion, a location identifier—if one
exists—may be used.
• The combination of the Account ID and Service # (under the Registration tab) forms a unique identifier for each
meter reading. If the last digits of the Account ID hold a tenant number, ReadCenter Analytics will be configured to
store it separately in one of the fields (such as the Description field). If ReadCenter Analytics does not find a record
with the combined Account ID and Service # specified in the input file from the billing system, it creates a new
record.
Page 53 June 2014
Page 54
ReadCenter® Analytics & Analytics Mobile
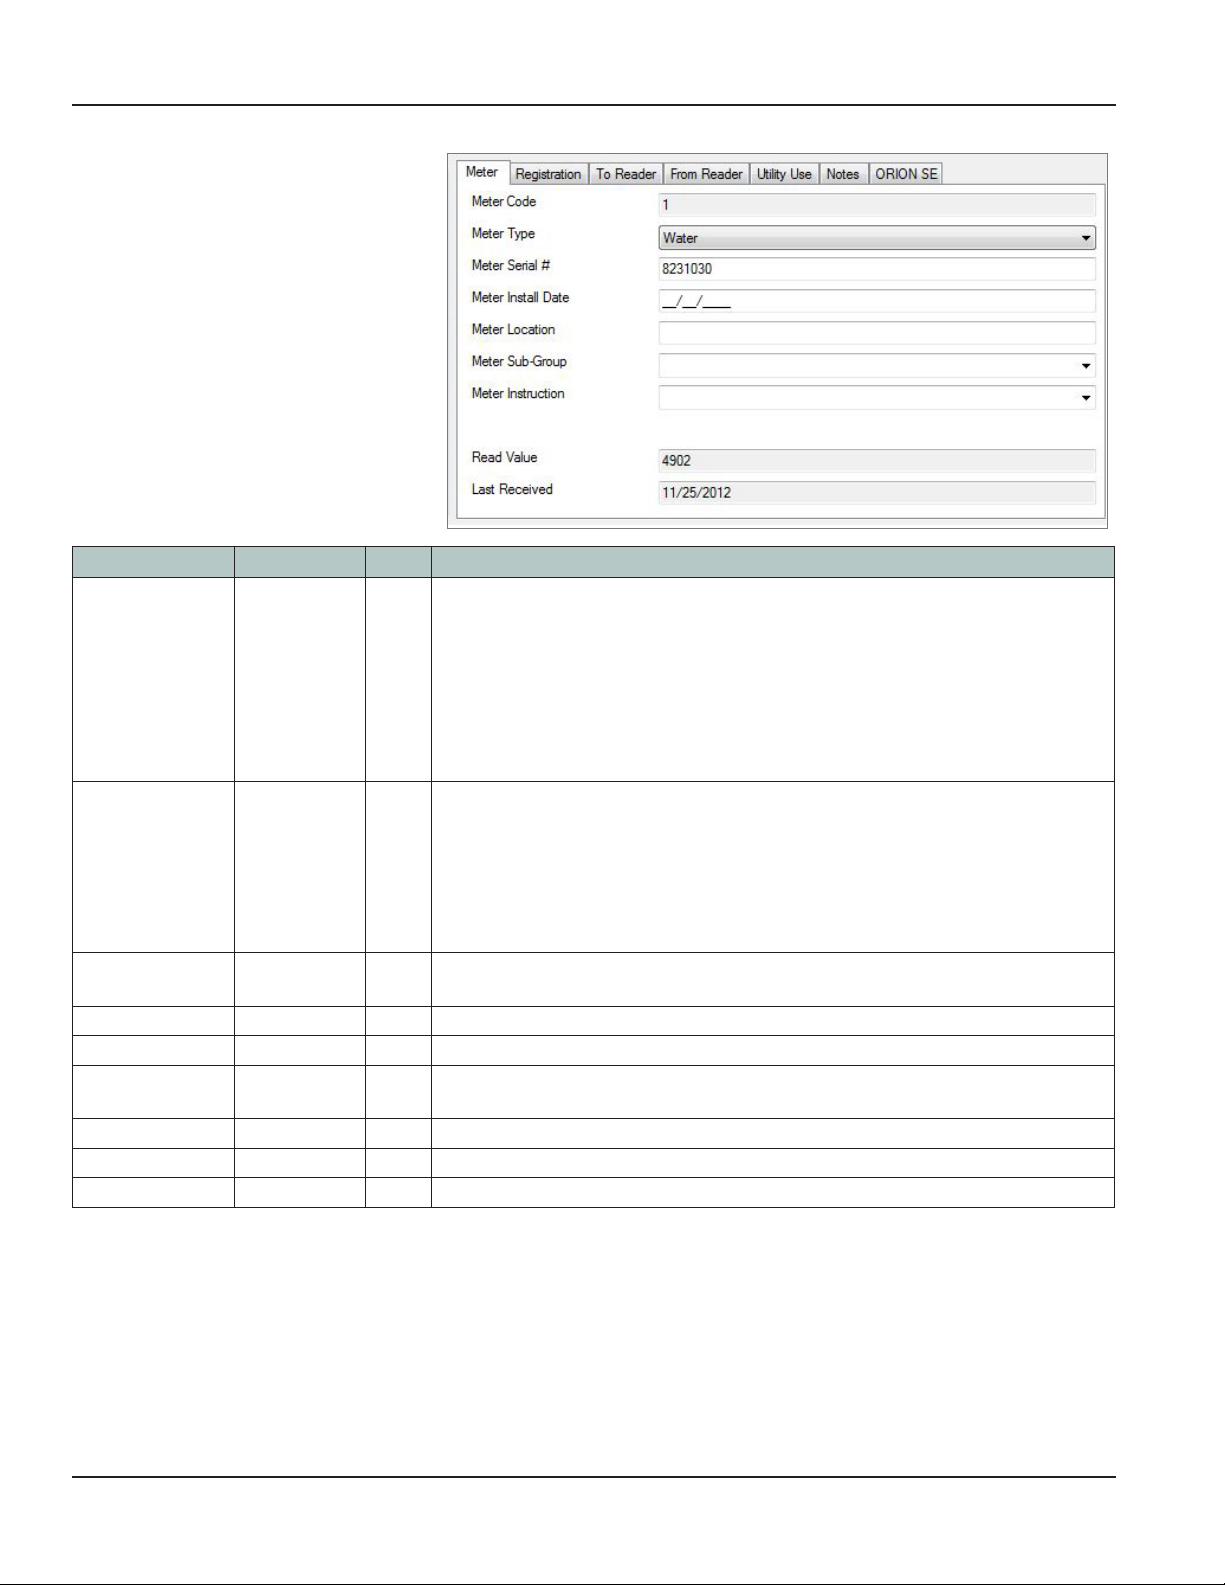
Meter
The Meter tab displays details about
the meter, such as the Meter Serial # and
Meter Location.
Field Name Type Size Description
Meter Code Numeric —
1 RTR or Unspecified 6 Gas Remote
2 ENC 7 Mag
3 Gas Integral 8 C700D
4
ELCD
5
Permalog
HRE
9
OTE:N Currently field is for Badger Meter internal use only.
Meter Type Water
Gas RT
Gas ORION
Electric
Other
Meter Serial # Alphanumeric 50 Identification number of the meter. This number is used by readers for verification when
Meter Install Date Date — Optional—date the meter was installed.
Meter Location Alphanumeric 50 Optional—details to help locate the meter.
Meter Sub-Group Account Table 50 Optional—for future development to identify a group of meters that are supplied by a
Meter Instruction Account Table 50 Optional—table entry assigned used to associate information about the meter.
Read Value Numeric — The actual (raw) reading unloaded from the collection device (see Note below).
Last Received Date — The date the account record was read from a billing input file.
— Type of service being read. If not specified, the default is water.
manually entering readings into a collection device.
main meter.
Read Value Note:
• The meter reading formatted for billing is shown on the From Reader tab in the Present Read field.
• Radio and touch reads may be adjusted based on a multiplier that relates to the Read Resolution shown on the
Registration tab. The multiplier varies according to the size of the meter. Radio and touch reads may also be
adjusted by the reading resolution defined in configuration settings discussed during initial training. Refer to "Billing
Interface Codes" onpage94 for more information.
Page 54 June 2014
Page 55

User Manual
Registration
The Registration tab has information
about how the meter is read, whether
electronically or manually.
OTE:N Compound meters may have two
registration records associated
with one meter. Each record has
its own Service # and is related to
a separate register.
Field Name Type Size Description
Service # Numeric — This is a required entry that identifies individual meter readings that share the same
Account ID. If not specified, the number 1 is assumed. Here are the cases this applies to:
• Several meters are read at one address and the same Account ID is used.
• One Account ID is used to bill several meters in a multiple-dwelling unit.
• A compound meter is present, and two readings are associated with one endpoint.
Endpoint Type See Appendix — The type of reading device associated with the meter.
Endpoint Serial # Numeric 50 Identification number of the reading endpoint attached to the meter—required for radio
and touch reading. A valid serial number must be entered. Refer to "Valid Serial Numbers"
onpage94.
Gas C Factor Numeric 10 Pressure compensation factor for Gas ORION radio meter readings. (ORION only)
Endpoint Install Date Date — Optional—date the reading endpoint was installed on the meter.
Read Resolution See Appendix — Setting required for radio and touch reading used to determine the multiplier needed to
convert electronic readings.
NOTE: The multiplier varies according to the size of the meter.
Endpoint Instruction Account Table 50 Optional—table entry assigned used to associate information about the endpoint.
Latitude Alphanumeric 50 Latitude position for reading the endpoint—used by the laptop collection device for
map display.
Longitude Alphanumeric 50 Longitude position for reading the endpoint—used by the laptop collection device for
map display.
Received
Loaded
Sent
Status Flag Numeric — Internal status indicator collected from the reading endpoint. (Bottom left of screen)
Multiplier Numeric — Internal multiplier applied to radio and touch reads based on the read resolution and
Yes/No — Indicates whether the account record was:
• Received from the interface input file
• Loaded to a collection device for reading
• Written to the interface output file
reading endpoint. (Bottom left of screen, next to Status Flag)
Page 55 June 2014
Page 56
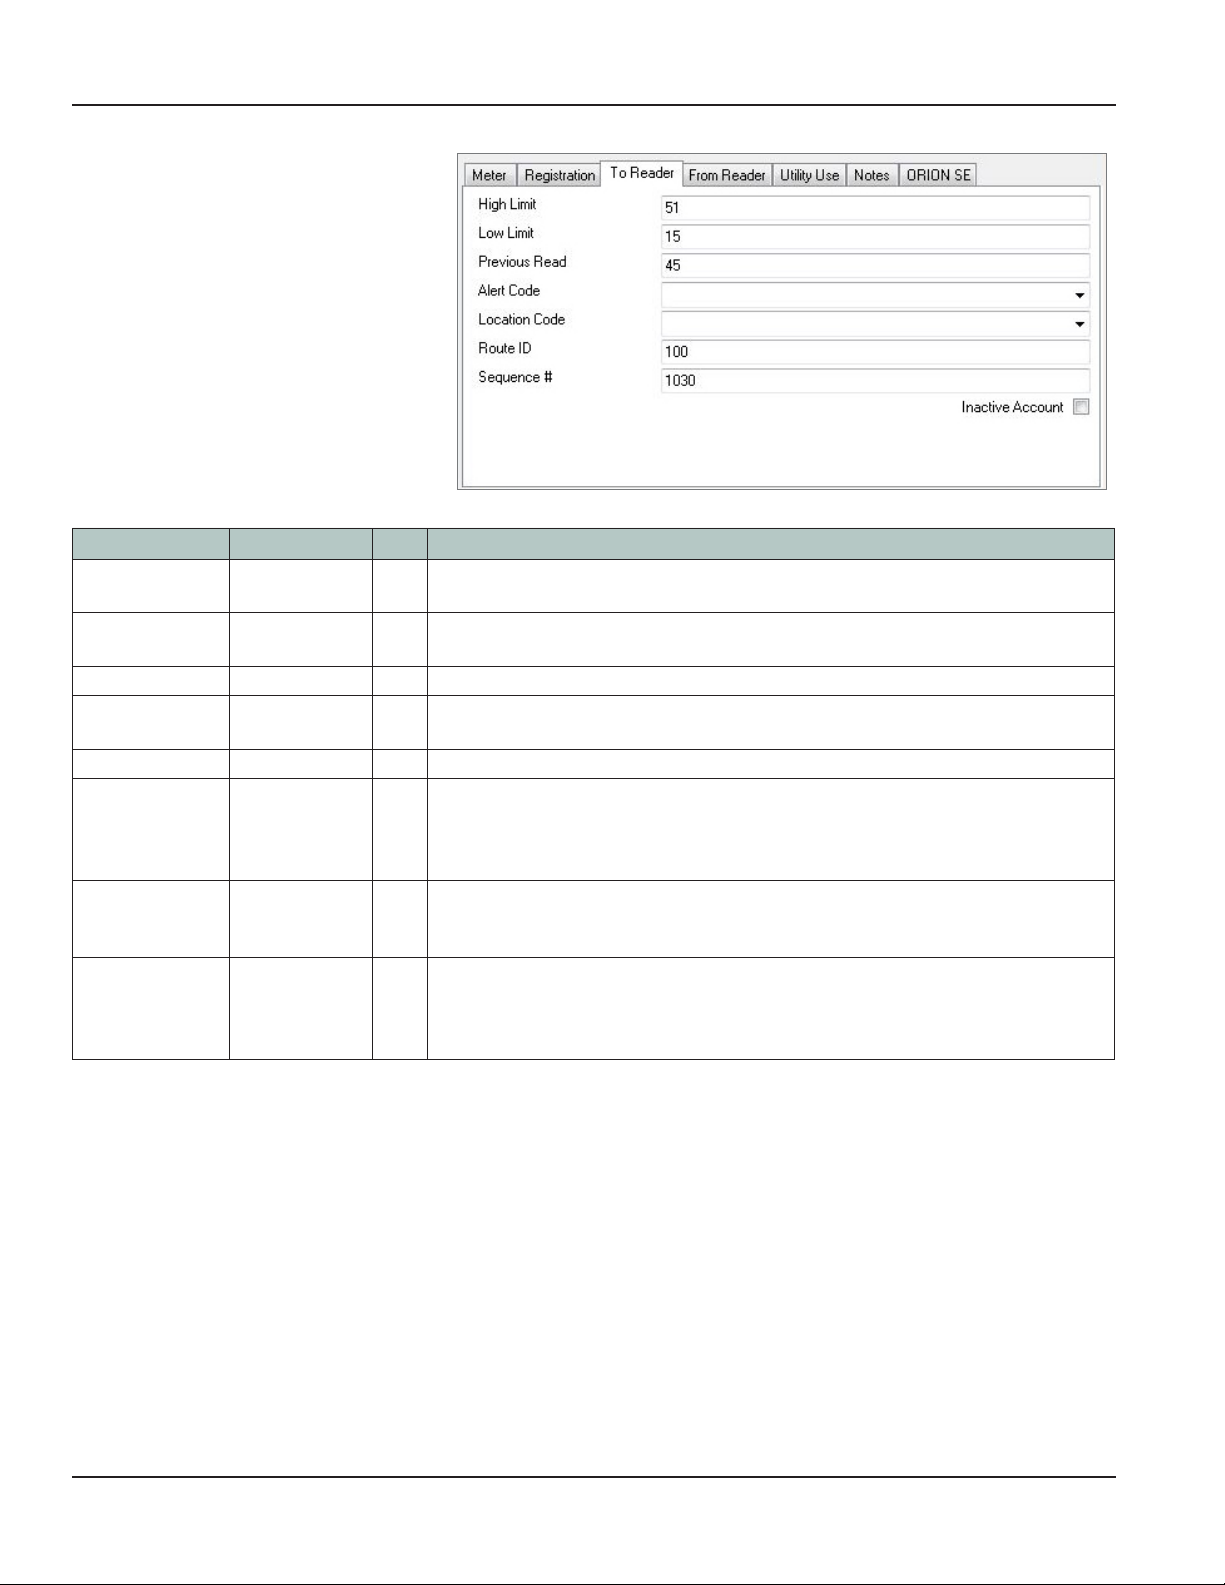
ReadCenter® Analytics & Analytics Mobile
To Reader
The To Reader tab has information that is
helpful to the person or collection device
that reads the meter.
The ReadCenter Analytics operator
determines which information passes to
the reader.
Field Name Type Size Description
High Limit Numeric — Reading passed from the billing system and sent to the collection device to warn of a
high reading.
Low Limit Numeric — Reading passed from the billing system and sent to the collection device to warn of a low
reading.
Previous Read Numeric — Reading passed from the billing system.
Alert Code Code Table 50 Code passed from the billing system and sent to the collection device to alert the meter
reader to special conditions that apply to the meter being read.
Location Code Code Table 50 Code passed from the billing system that is used to identify the meter’s location.
Route ID Alphanumeric 20 Identifier passed from the billing system that specifies the route or book the meter
belongs to. It is used by ReadCenter Analytics or Analytics Mobile to group accounts
for loading into collection devices, running reports and to perform other reading cycle
functions.
Sequence # Numeric — Number passed from the billing system that specifies the order of account records loaded
in collection devices. For manual meter reading, this is the walking order the meter reader
will follow.
Inactive Account Yes/No — Check the box to mark the account inactive in ReadCenter Analytics or Analytics Mobile.
It is typically used with the Account Analytics report called ‘Inactive Account Usage’ when
an account, which should be inactive, is being monitored for unexpected usage. Checking
the box does not stop any account functions from occurring.
Page 56 June 2014
Page 57
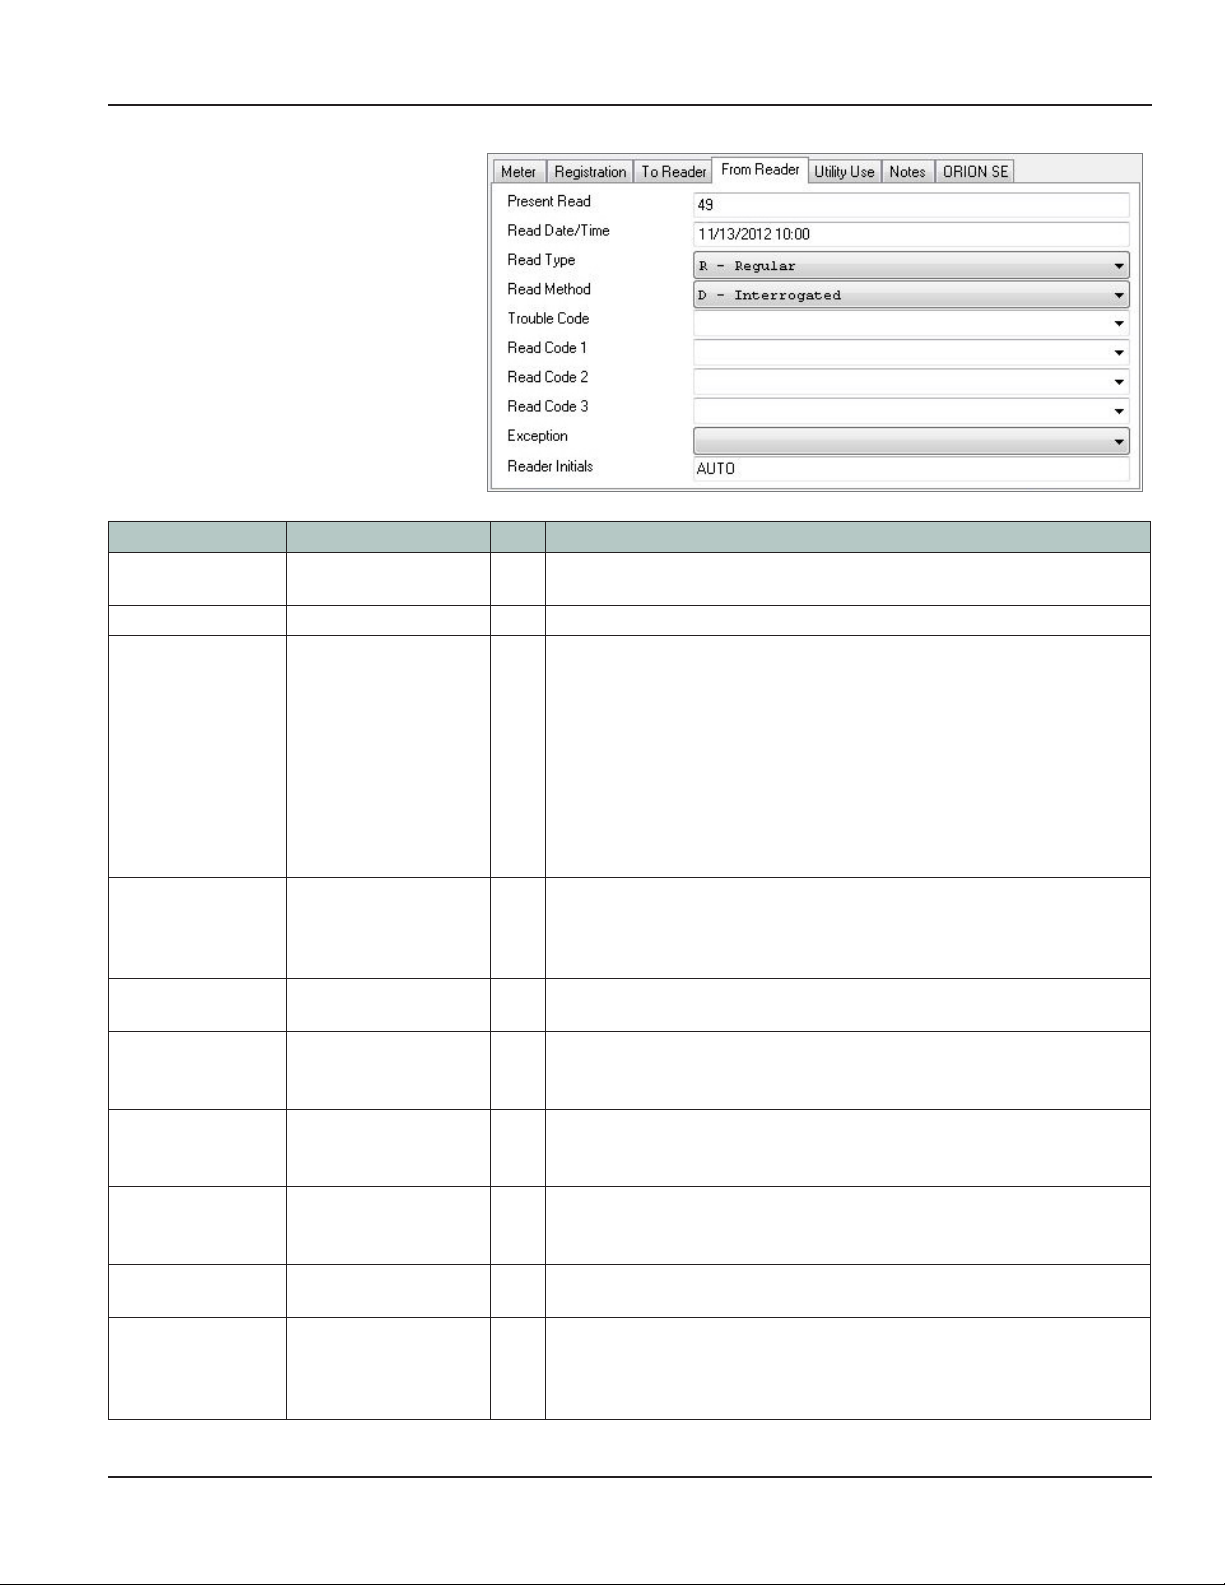
User Manual
From Reader
The From Reader tab has information
from the person or collection device that
reads the meter. Fields are filled in after
collection devices are unloaded.
Field Name Type Size Description
Present Read Numeric — Meter reading for billing purposes. (See the Read Value Note on page 54 for
adjustments that may have been made to radio and touch reads.)
Read Date/Time Date/Time — Date and time the meter reading was received.
Read Type N – Unread
R – Regular
H – High
— Code received from the collection device that indicates the type of
reading that was acquired. Refer to ."Read Type/Read Method Codes"
onpage93.
L – Low
r – Regular with Inquiry
h – High with Inquiry
l – Low with Inquiry
Read Method N – Unread
d – Manual
D – Interrogated
Trouble Code Code Table 50 Code entered by the meter reader into the collection device that alerts the
Read Code 1 Code Table 50 Code entered by the meter reader into the collection device to supply
Read Code 2 Code Table 50 Code entered by the meter reader into the collection device to supply
Read Code 3 Code Table 50 Code entered by the meter reader into the collection device to supply
Exception See Appendix — Code received from the collection device that indicates there is an alert
Reader Initials Alphanumeric 10 Initials entered into the collection device by the meter reader when
— Code received from the collection device that indicates whether the
reading was acquired and how it was acquired. Refer to "Read Type/Read
Method Codes" onpage93.
ReadCenter Analytics operator to problems with the meter being read.
information related to the meter being read to the ReadCenter Analytics or
Analytics Mobile operator.
information related to the meter being read to the ReadCenter Analytics or
Analytics Mobile operator.
information related to the meter being read to the ReadCenter Analytics or
Analytics Mobile operator.
condition in the reading endpoint.
beginning the reading process. The meter reader’s initials are automatically
associated with each meter reading. If the reading is received via a gateway,
Reader Initials field will display AUTO.
Page 57 June 2014
Page 58

ReadCenter® Analytics & Analytics Mobile
Utility Use
The Utility Use tab stores miscellaneous
information from the billing system.
Field Name Type Size Description
Utility Use 1-10 Alphanumeric 50 Holds miscellaneous information.
Notes
The Notes tab holds information related to
the account record.
Field Name Type Size Description
Note To Reader Alphanumeric Memo Message about the meter being read. It may be received in the file from the
billing system or manually entered by the ReadCenter Analytics or Analytics Mobile
operator. It is cleared when performing the Save/Clear Reads function.
Note From Reader Alphanumeric Memo Message about the meter being read. It is entered in the collection device by the
meter reader and cleared when performing the Save/Clear Reads function.
Account Note Alphanumeric Memo Entered by the ReadCenter Analytics or Analytics Mobile operator to keep
information with the account record from one reading cycle to the next.
OTE:N Account notes are NOT cleared when performing the Save/Clear Reads
function.
Page 58 June 2014
Page 59

User Manual
ORION ME
The ORION ME tab displays when an
ORION ME endpoint is selected from the
list on the Account Records screen.
The ORION ME tab displays any extended
status information collected from the
endpoints with work items.
Work items are set when creating the route
file. Refer to "Load Collectors" onpage19
for more information.
Extended status can be collected via
RF as part of regular route reading.
The Configuration tab Value fields
automatically populate when extended
status information is requested from
the endpoint.
Configuration
Field Name Value (All fields are read only)
Meter Type Options are: RTR or Unspecified; ENC; Gas Integral; Gas Remote; ELCD; Permalog; MAG; C700D; HRE
Meter Model Code Meter model fills when extended status is received.
Pressure Factor Code (GAS) Informational data programmed through the IR port.
Unit of Measure Code Cubic Meters; Cubic Feet; Gallons; Imperial Gallons; Liters
Dials (ENC, GAS, ELCD) Number of dials: 4; 5; 6; 7; 8
Meter Direction (GAS, ELCD) Flow direction: 0 = counterclockwise; 1= clockwise
Encoder Type (ENC, ELCD) Options are: Not Set; Ind. Standard; Neptune ProRead; Elster/AMCO Scancoder; Neptune ARB V;
Elster/AMCO Invision; Sensus Fixed Format; Other
Meter Reading Changed Date Index changed date
First Programmed Date Date fills when first programmed through the IR port.
Last Programmed Date Date fills when last programmed through the IR port.
Fields ll when Extended Status is received
Extended Status Endpoint data fills when requested.
Firmware Version Endpoint firmware version number fills when requested.
Latitude This value does not fill for ORION ME.
Longitude This value does not fill for ORION ME.
Device Conditions Displays all conditions indicated by the latest Extended Status. See "Status" onpage29 for a list of
device conditions.
Page 59 June 2014
Page 60

ReadCenter® Analytics & Analytics Mobile
ORION SE – Fixed Network Only
This section is intended for customers
with an ORION SE fixed network system.
Customers using ReadCenter Analytics
Mobile exclusively for a mobile network
may skip this section.
The ORION SE tab displays when an ORION
SE endpoint is selected from the list on the
Account Records screen. Refer to "Defining
Endpoint Settings" onpage73 for more
information on converting an ORION ME
endpoint to SE.
The ORION SE tab is automatically
populated as the endpoint extended status
information is received from the gateway.
The ORION SE tab has two subsections: Configuration and Fixed Network Settings.
In a fixed network, Extended Status is received automatically when the endpoint is assigned to a gateway.
Configuration
Field Name Value (All fields are read only)
Meter Type Options are: RTR or Unspecified; ENC; Gas Integral; Gas Remote; ELCD; Permalog; MAG; C700D; HRE
Meter Model Code Meter model fills when extended status is received.
Pressure Factor Code (GAS) Informational data programmed through the IR port.
Unit of Measure Code Cubic Meters; Cubic Feet; Gallons; Imperial Gallons; Liters
Dials (ENC, GAS, ELCD) Number of dials: 4; 5; 6; 7; 8
Meter Direction (GAS, ELCD) Flow direction: 0 = counterclockwise; 1= clockwise
Encoder Type (ENC, ELCD) Options are: Not Set; Ind. Standard; Neptune ProRead; Elster/AMCO Scancoder; Neptune ARB V; Elster/
AMCO Invision; Sensus Fixed Format; Other
Meter Reading Changed Date Index changed date
First Programmed Date Date fills when first programmed through the IR port.
Last Programmed Date Date fills when last programmed through the IR port.
Fields ll when Extended Status is received
Extended Status Endpoint data fills when received from the gateway.
Firmware Version Endpoint firmware version number fills when received from the gateway.
Latitude Position of the endpoint programmed at installation and received from the gateway.
Longitude Position of the endpoint programmed at installation and received from the gateway.
Device Conditions Displays all conditions indicated by the latest Extended Status. See "Status" onpage29 for a list of
device conditions.
Page 60 June 2014
Page 61

ORION SE, continued
The Fixed Network Settings tab
shows settings that have been
defined using Tools> Endpoint
Settings. Refer to "Endpoint
Settings" onpage71 for
additional information.
Settings for individual accounts
can also be modified on this tab.
Any changes to the settings are
communicated to the gateway to
which the endpoint is assigned
when the Update Assignments
schedule runs.
Refer to"Defining Gateway Schedules"
onpage78 for more information.
Fixed Network Settings
User Manual
Field Name Type Size Description
Region Alpha — Area grouping that is assigned to the account
Reading Interval Alphanumeric — How often the endpoint collects readings for fixed network only. Two intervals are
available: 15 minutes and 60 minutes.
Alarm Notification Check box — Determines the alarms that are periodically sent to the gateway. If the endpoint
reading is received with the selected alarm(s), the data is forwarded automatically to
ReadCenter Analytics.
Alarm notifications appear as an extra read on the Gateway Reading Reports and
Account Analytics screens, and when viewing the ORION ME/SE Historical Reading
History from the Account Records screen.
Current Reads Only* Radio button — When the button is selected and the Current Reads schedule runs, the current read for
the endpoint is retrieved.
Historical Reads* Radio button — When the button is selected and the Historical Reads schedule runs, historical reads
for the endpoint are retrieved.
Push Reads Radio button — A selected button indicates a Push Read. When selected, reading data for an endpoint
set for Push Reads will be automatically forwarded to ReadCenter Analytics when
received by the gateway, regardless of Current Reads or Historical Reads schedules.
*Neither Current Reads Only or Historical Reads affects what is saved by the gateway. The gateway always saves historical reads.
The settings only impact what is returned for each endpoint when the Current Reads or Historical Reads schedule runs. Refer
to "Defining Gateway Schedules" onpage78 for more information on gateway schedules.
Page 61 June 2014
Page 62

ReadCenter® Analytics & Analytics Mobile
Account Groups
ReadCenter Analytics
Accounts> Account Groups
The Account Groups function provides a way to define more detailed groups of accounts for use in loading and unloading
mobile collection devices, running reports and performing other tasks related to meter reading.
ReadCenter Analytics Mobile
Accounts> Account Groups
Defining Account Group Settings
Account groups are commonly used to define multiple routes. The routes may or may not be in sequential order. The account
group name is user defined. You may want to define account groups to represent the various cycles, routes, books, meter
readers or reading technologies involved.
The Setting Name drop-down menu at the top of the screen includes every setting record defined for the function. When
ReadCenter Analytics is initially installed, each function that allows multiple setting records has one defined by default, with
a name that starts with the word ‘First.' This may be changed by the ReadCenter Analytics or Analytics Mobile operator. When
you select a setting name from the drop-down menu, the entries saved for the setting are shown. In the left corner of the
Status Bar, the number associated with the account group setting name displays.
Use these buttons to maintain various screen settings:
Rename Change the Setting Name without affecting the setting entry. The Setting Name displays in the Group
drop-down menu on the Load Collectors screen. All other functions that reference this setting will reflect the
new name automatically.
Save Save entries shown for the current setting record.
New Create a new setting record and clears all entries.
Delete Delete the current setting record.
Undo Restore account information to the last saved entries.
Undo removes all information that has changed since you accessed the setting record not just the latest change. Also, once
you move away from a setting, changes are saved automatically and cannot be undone by choosing Undo.
Remove All Removes all the rows in the Group Items table.
Add Item Enters a blank field at the top of the Group Items table.
Remove Item Removes the last row (highlighted item) added in the Group Items table.
Refresh List Moves the information from the bottom section of the screen to the selected row in the Group Items table.
OTE:N For additional information on the tool bar, refer to "Using the Tool Bars" onpage96.
Page 62 June 2014
Page 63

Listing Accounts
Accounts may be listed and filtered as described below.
The grid on the left side of the Account Groups screen is used
to display accounts that are in the database.
Click the Accounts tab and then click the Fill List button at
the top of the grid to show current account data.
User Manual
To find a specific Route ID, Sequence # or Account ID, enter
search criterion in the filter bar, which is the row below the
column headings.
Only accounts that match the criteria entered will display.
Page 63 June 2014
Page 64

ReadCenter® Analytics & Analytics Mobile
Selecting Accounts
For the Select By entry, select Route ID/Sequence #
from the drop-down menu.
In the list of accounts, point to the rst line and
click the From --> button.
The Route ID and Sequence # on the From line are
populated automatically.
In the list of accounts, point to the record in the
middle of the route (approximately) and click the
To --> button.
Page 64 June 2014
Page 65
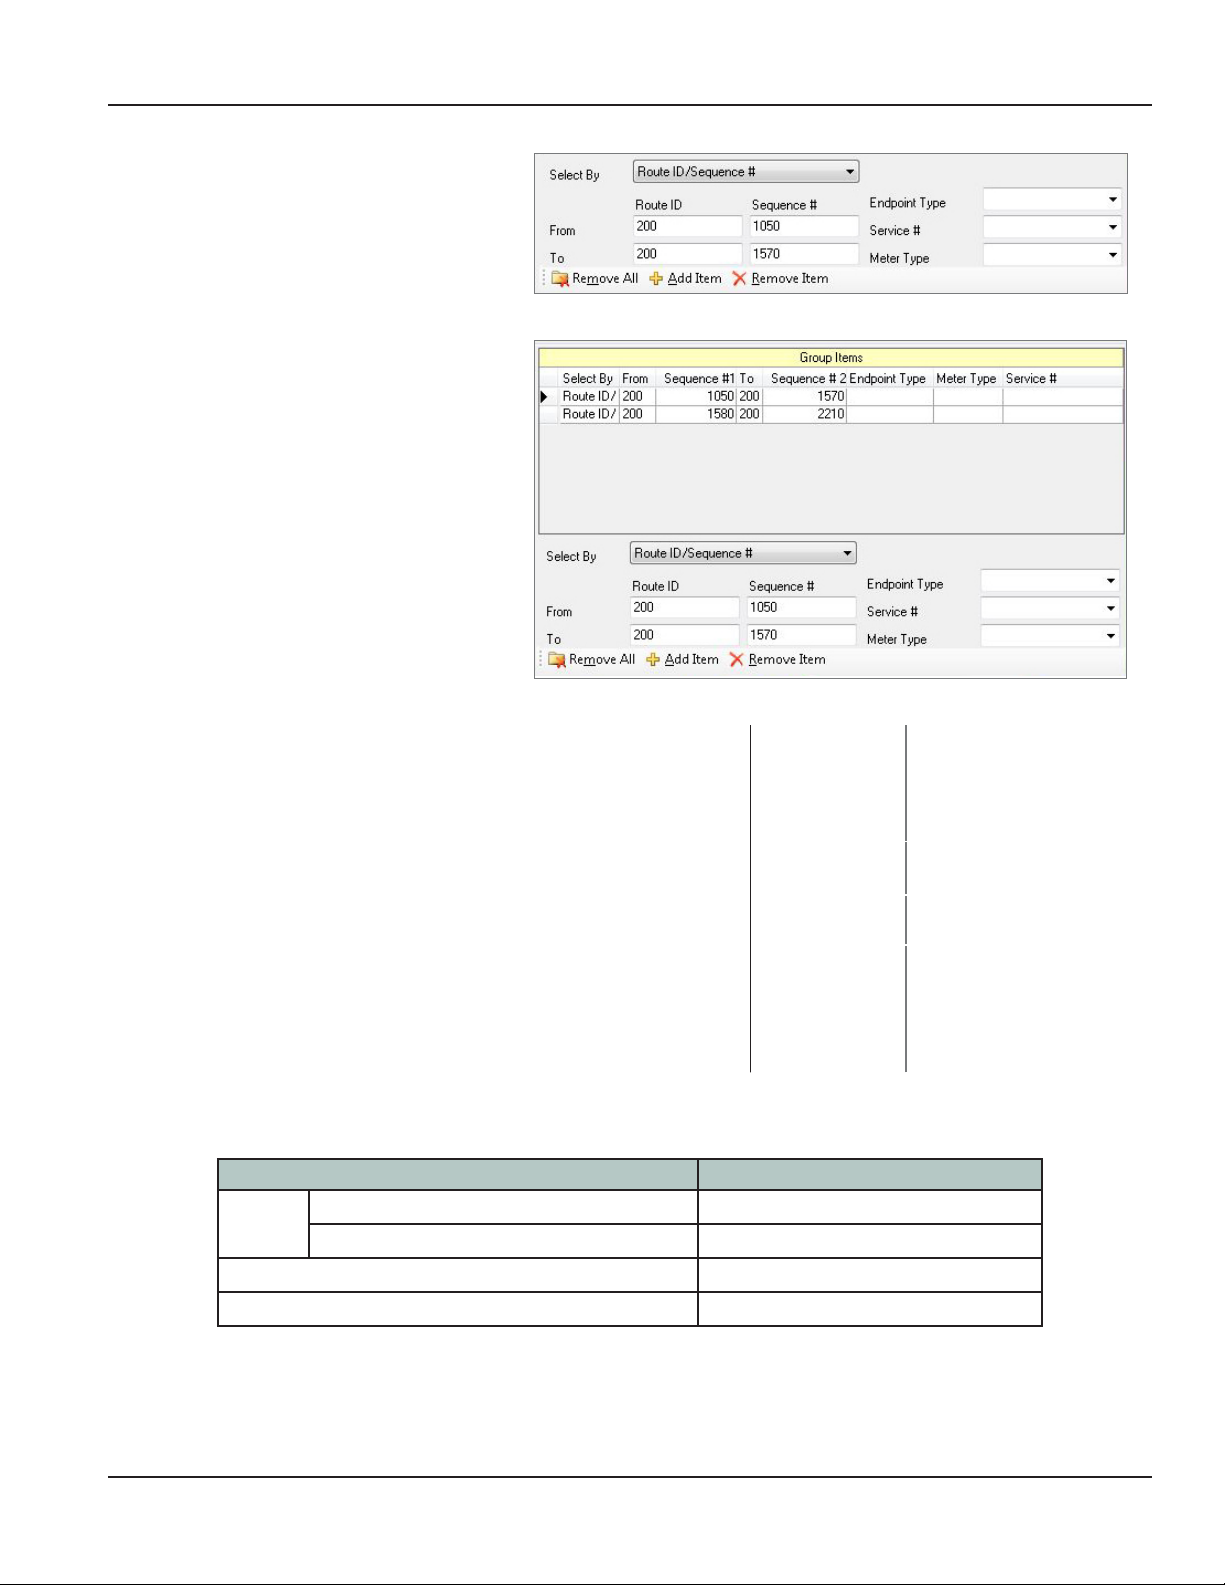
The Route ID and Sequence # on the To line are
populated automatically.
To add other Group Items to the list, click Add
Item on the tool bar and repeat the process of
selecting accounts.
From and To entries may also be typed in
manually. As items are added, they appear in the
Group Items grid.
User Manual
Available grouping options appear on the lower right
Select By Route ID
portion of the screen.
Endpoint Type Refer to "Billing Interface
Service # Account Table Entry
Meter Type Water
The order of accounts when loading the mobile collection device is shown in the following table.
Select by Order
Group Group contains all Account ID ranges route, account, service
Group contains Routes or Sequence # ranges route, sequence, account, service
Route route, sequence, account, service
Account route, account, service
Account ID
Sequence #
Route ID/Sequence #
Codes" onpage94.
Gas
Gas ORION
Electric
Other
Page 65 June 2014
Page 66

ReadCenter® Analytics & Analytics Mobile
Collected Readings
ReadCenter Analytics
Gateway Reading> Collected Readings
ReadCenter Analytics Mobile
n/a
Fixed Network Only: This section is intended for customers with a fixed network system. Customers using ReadCenter
Analytics Mobile exclusively for a mobile network may skip this section.
Use the Collected Readings function to view endpoint information collected by each gateway, along with the meter readings
it reported during the time period specified.
1. Specify a date range using the End Date and Period settings. A calendar is available from the drop-down menu in
the End Date eld. As the date selections change, the resulting date range is shown in blue in the tool bar.
2. Click Get Data to obtain meter reading information for the time period chosen.
Number of
readings
Collections
Number of
gateways
The table that displays under Collections is based on the schedules that are run for each gateway and the readings that are
collected based on each schedule. Refer to "Defining Gateway Schedules" onpage78 for additional information.
Primary Readings
The Readings table displays the readings collected by the gateways for the time period specified. As you point to a gateway
in the Collections table on the left, meter readings reported through the gateway for the time specified are shown under
"Readings" on the right. The example shown above displays the collected readings when the Current Reads schedule is
run. Each row displays a different endpoint and its Primary reading for the date listed. The Primary boxes are checked for all
endpoints. Usage and exception conditions for which an endpoint triggers an alert will be shown on this report. A potential
Leak was reported for Endpoint Serial #35050681 on 1-13-13 at 20:00.
Collected Readings Tool Bar
At the bottom of the screen, the dates for the collected readings are displayed, followed by the order number of the
selected gateway and the reading line item—1:1—in the example shown above. In addition, two boxes are displayed in
the tool bar next to the Close button. The number of gateways is on the left and the number of meter readings reported
through the gateways is on the right. The box on the right is the same as the number displayed in the Count field under the
Collections heading.
Page 66 June 2014
Page 67
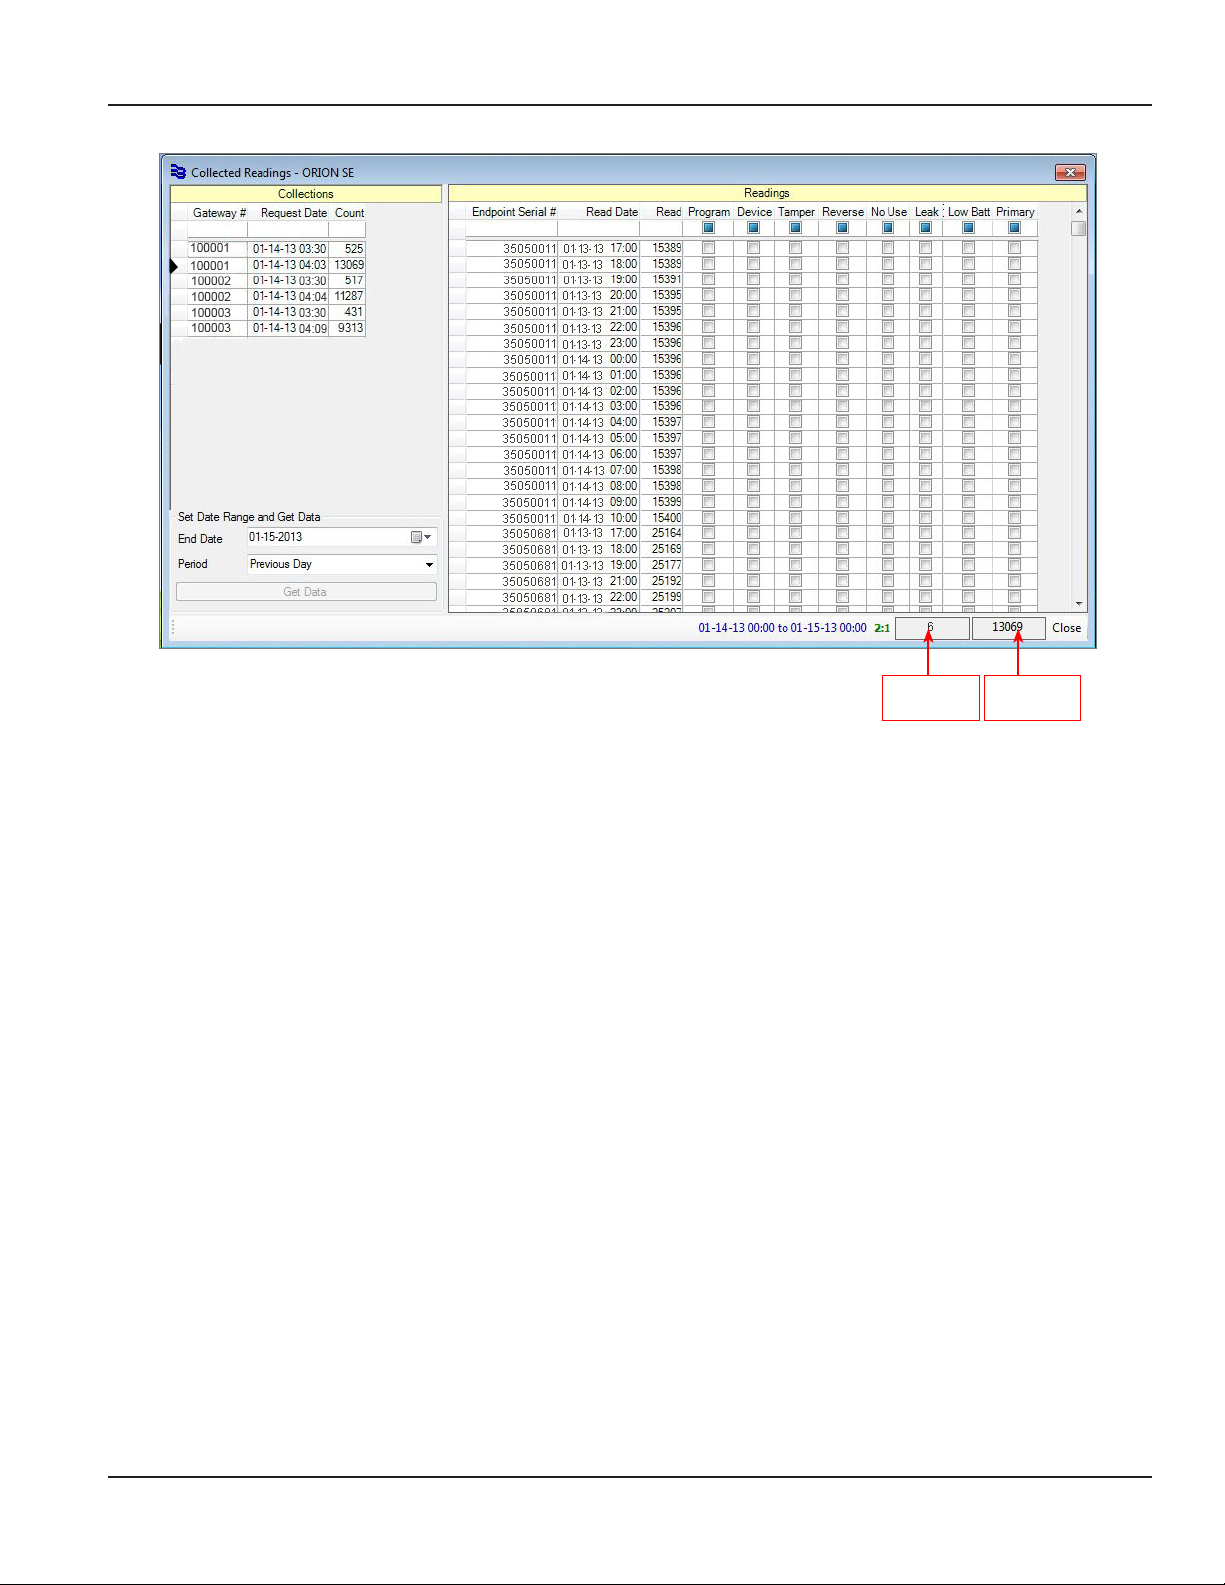
User Manual
Historical Readings
Number of
gateways
Number of
readings
The example shown above displays the collected readings when the Historical Reads schedule is run. Multiple readings for a
single endpoint are displayed for the date listed. The Primary boxes are not checked and no usage and exception conditions
are shown on this screen.
Column Headings
The following headings display in the first three columns in the Readings section of the Collected Readings screen.
Endpoint Serial # Unique serial number of the endpoint.
Read Date Date and time of the meter reading.
Read The actual (raw) meter reading collected at the date and time specified.
Usage and exception conditions reported by the endpoint are listed across the top of the screen in the Readings section. A
check mark in the box indicates a condition that existed at the time of the meter reading.
OTE:N Refer to "Reports" onpage30 for additional information.
Program Endpoint received a program parameter change. For example, it was reprogrammed via IR.
Device Conditions indicated in extended status. See “Device“ under "Status" onpage29.
Tamper Endpoint reporting a tamper condition.
Reverse Endpoint reporting that the encoder measured flow in the reverse direction.
No Use Endpoint reporting no usage.
Leak Endpoint reporting a potential leak condition.
Low Batt Endpoint reporting that its estimated battery life is low.
Primary The Primary indicator is only checked for the endpoint current reads. Current reads are collected when
the Current Reads schedule runs.
Page 67 June 2014
Page 68
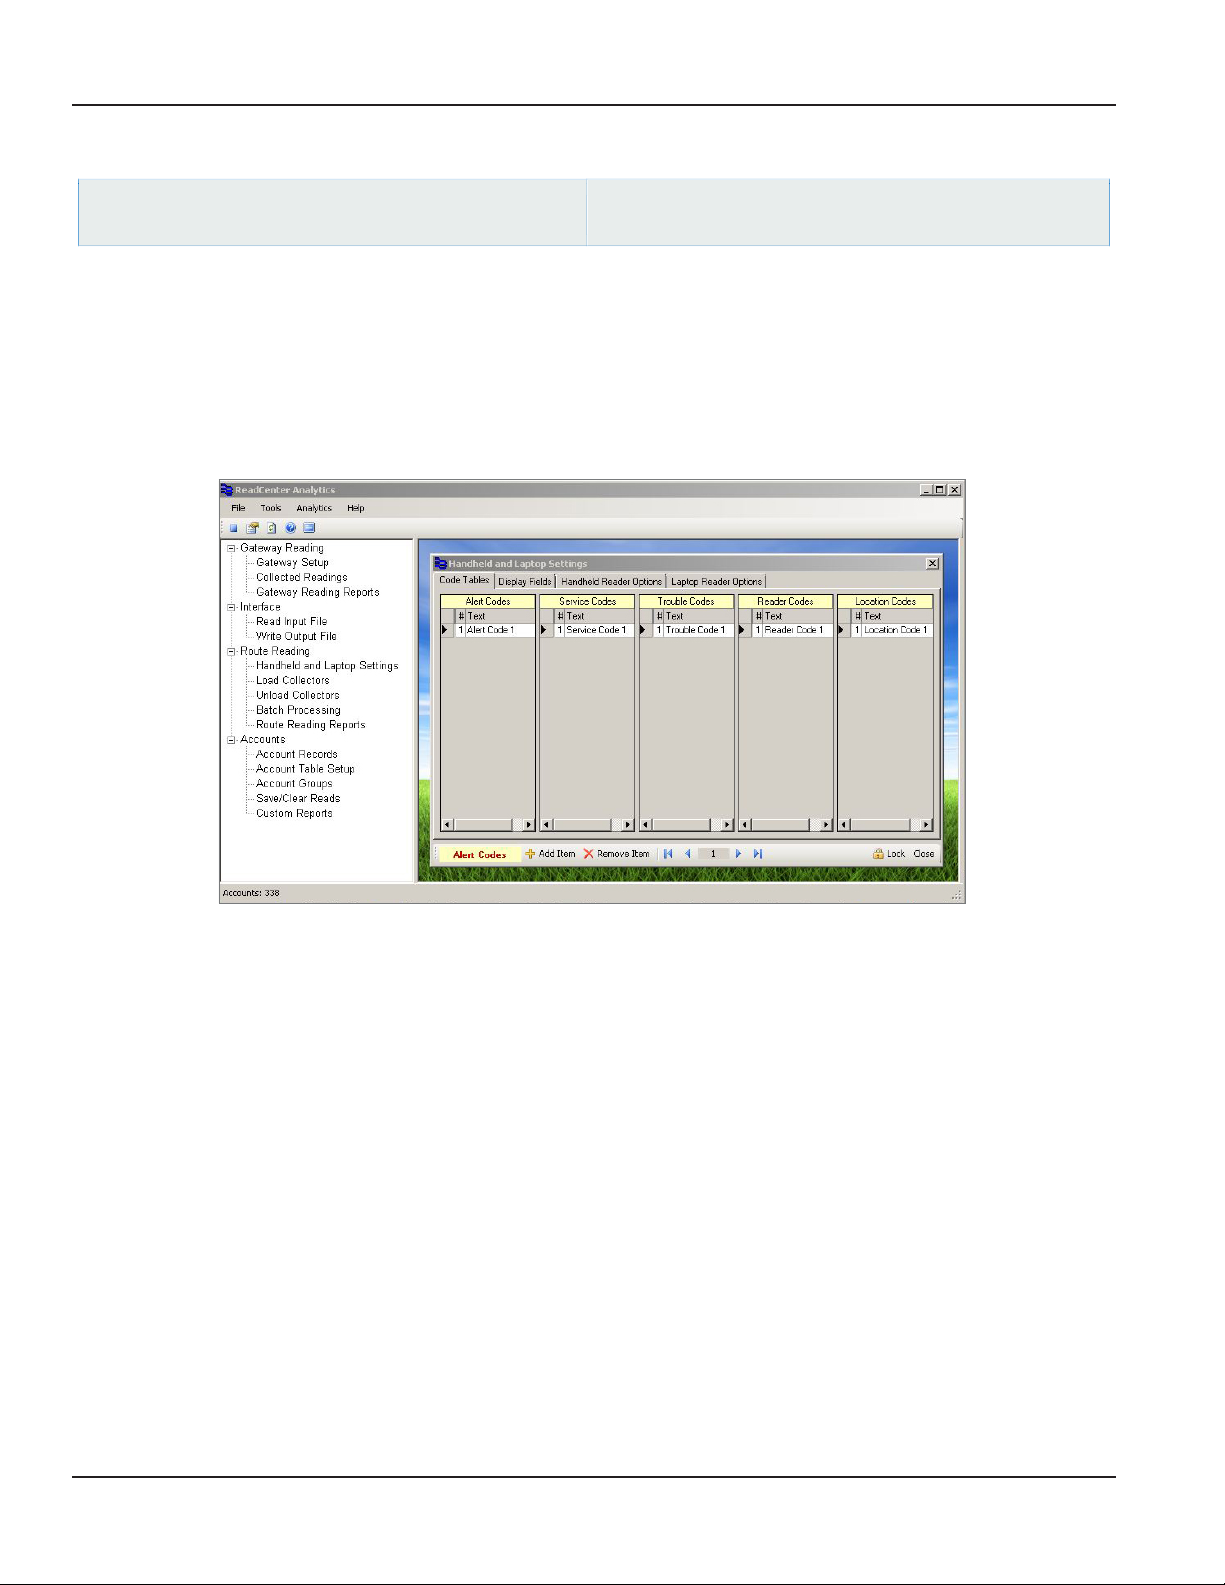
ReadCenter® Analytics & Analytics Mobile
Handheld and Laptop Settings
ReadCenter Analytics
Route Reading> Handheld and Laptop Settings
Mobile Only: This section is intended for customers with a mobile network. Customers using ReadCenter Analytics
exclusively for a fixed network may skip this section.
Use this function to define system settings and configurations for the collection devices used to perform the mobile route
reading process.
Maintenance & Settings> Handheld and Laptop Settings
ReadCenter Analytics Mobile
Code Tables
Use the tables to define a code and the text message associated with the number. Code numbers range from 1 to 99. Text can
have up to 50 characters, however, the display limit of the mobile collection device (handheld or laptop) may vary.
Alert Codes Sent to the collection device in a table to communicate information to the meter reader.
Service Codes Describe the service types for meters being read.
Trouble Codes Sent to the collection device in a table for the meter reader to enter.
Reader Codes Sent to the collection device in a table for the meter reader to enter.
Location Codes Describe location information. The text is passed to the collection device from account records.
1. Click on the table to select it. The active table name displays in yellow in the bottom tool bar. In the screen example
above, Alert Codes is the active table and displays in the bottom tool bar.
2. To add a table entry, click Add Item in the bottom tool bar. A new blank line will appear. Type the number and text
for the entry on this line.
3. To delete a table entry, move the cursor to the line you wish to delete, click on it, and then click Remove Item in the
bottom tool bar.
4. To edit an entry, insert the cursor and type directly on the line. The navigation arrow buttons in the bottom tool bar
provide another way to move from one table entry to another.
Page 68 June 2014
Page 69
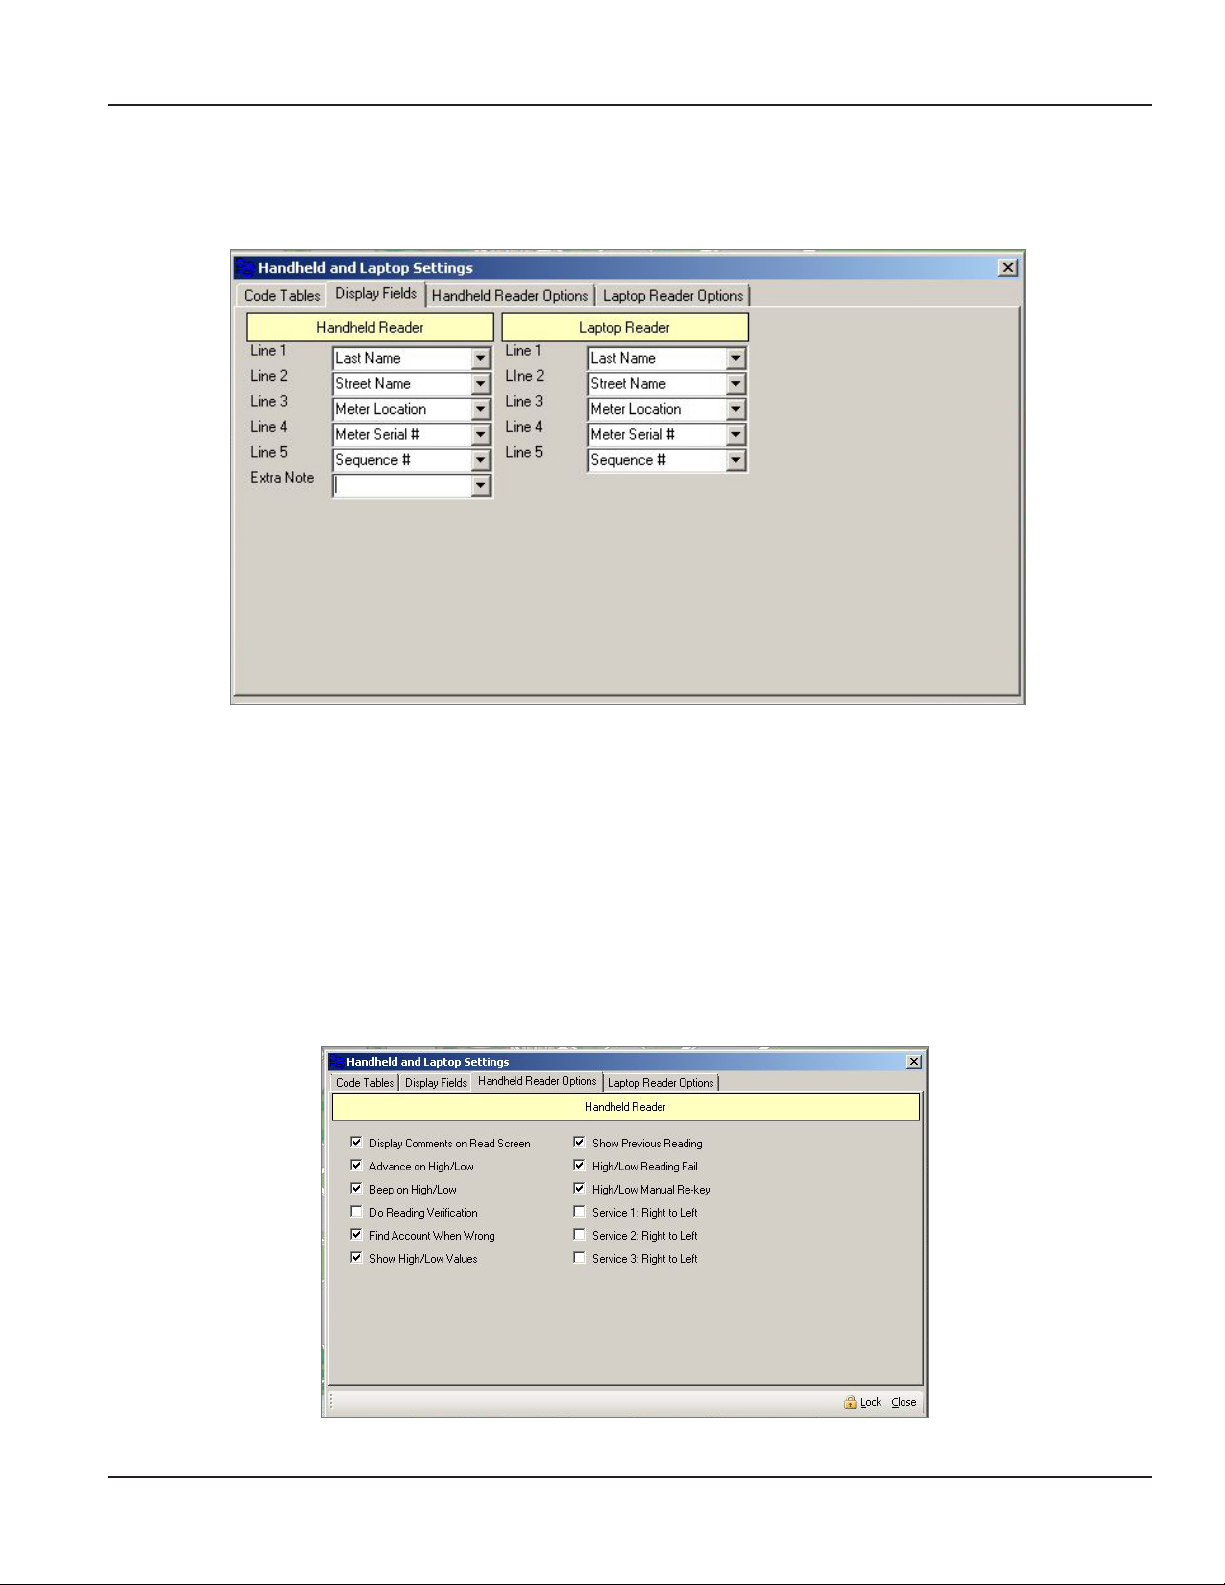
Display Fields
Collection devices have five display lines. The contents for the lines are defined here on the Display Fields tab.
User Manual
Each drop-down list shows all the fields available. Select the field you want to display for each line of the collection device.
A different set of fields may be defined for the Handheld Reader and Laptop Reader.
The Extra Note field is used to define a field of special instructions with more information than can fit on a single line of the
handheld reader screen. The handheld reader has an option that will pop up a window to display the full text.
Handheld Reader Options
Define the settings for the handheld by selecting from the list of options on this tab. The selections will be discussed in detail
during initial training. Refer to the ORION Automated Meter Reading System for the Trimble Ranger manual,
ORI-IOM-52-EN (Ranger X) and ORI-IOM-64-EN (Ranger 3), for instructions and options for the handheld.
Page 69 June 2014
Page 70
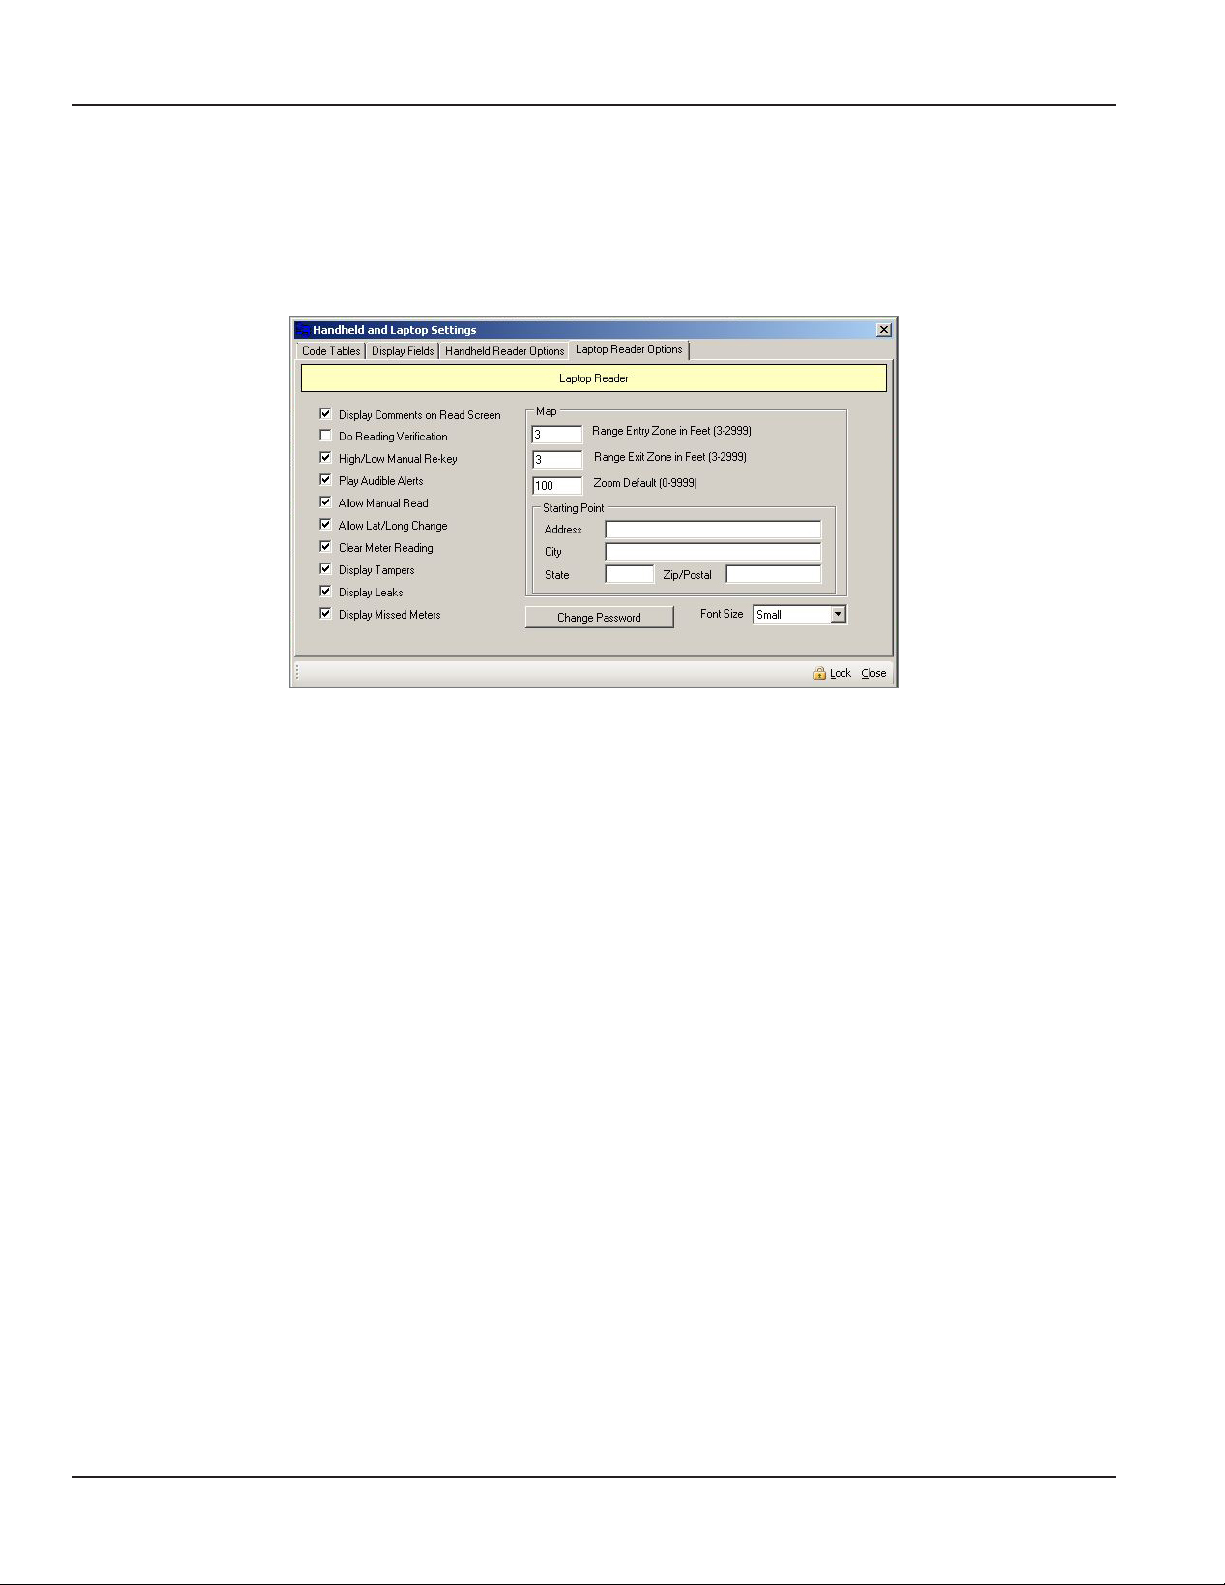
ReadCenter® Analytics & Analytics Mobile
Laptop Reader Options
Define the settings for the laptop by selecting from the list of options on this tab. You may also define the settings for the
route map and starting point using this tab. The selections will be discussed in detail during initial training. Refer to
the ORION Mobile Reading Software installation and operation manual, ORI-IOM-35-EN, for instructions and options for the
laptop.
Page 70 June 2014
Page 71
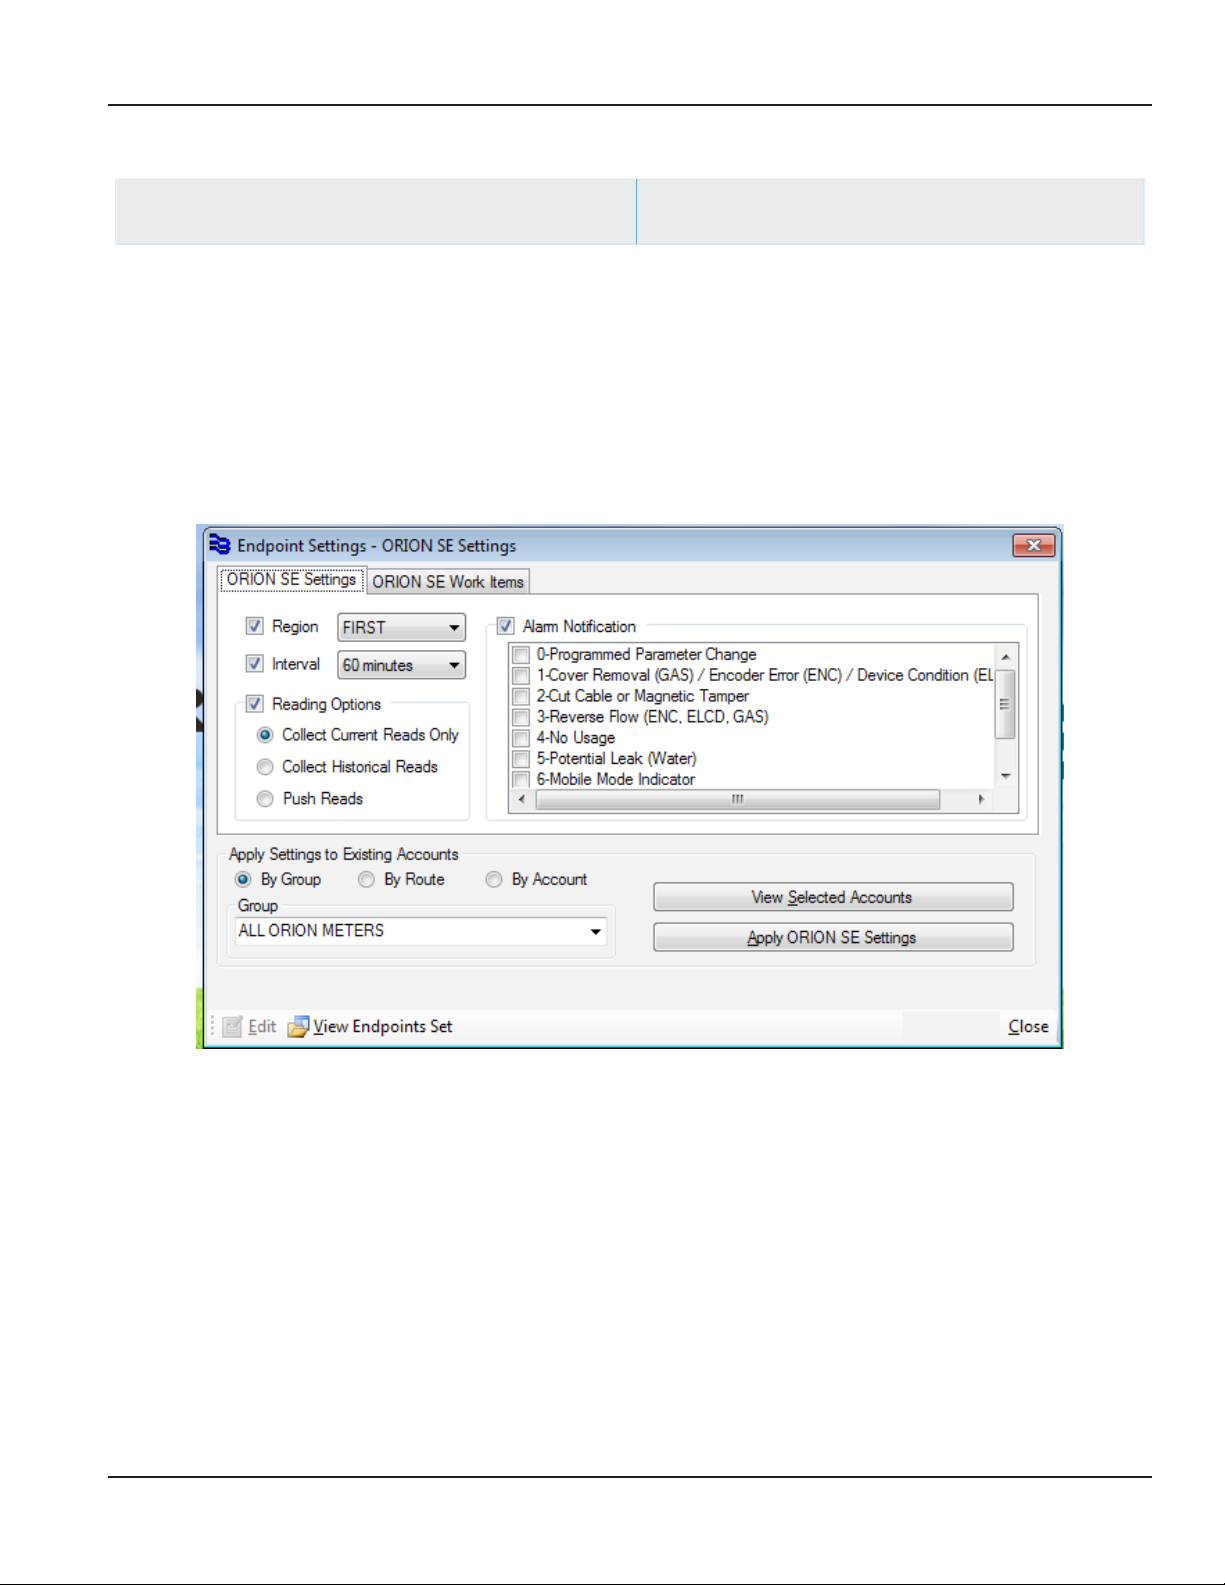
Endpoint Settings
User Manual
ReadCenter Analytics
Tools> Endpoint Settings
Fixed Network Only: This section is intended for customers with a fixed network system. Customers using ReadCenter
Analytics exclusively for a mobile network may skip this section.
Select the ORION SE Settings tab to define and modify existing endpoint settings or to convert ORION ME migratable
endpoints to report as ORION SE fixed endpoints. Select the ORION SE Work Items tab to choose work items for a group
of endpoints.
OTE:N To define or modify the settings of an individual endpoint, refer to "ORION SE – Fixed Network Only" onpage60.
ReadCenter Analytics Mobile
n/a
ORION SE Settings Tab
Password Protected Fields
The fields on the ORION SE Settings tab are password protected. Click Edit and enter the password to activate the fields and
make changes to the ORION SE endpoint settings. The fields are locked again when the screen is closed.
Page 71 June 2014
Page 72

ReadCenter® Analytics & Analytics Mobile
ORION SE Settings Tab Fields
Region This field is not applicable for Endpoint Settings.
Interval Determines how often the endpoint collects readings—every 15 minutes or every hour.
Reading Options Determines endpoint collection.
• Collect Current Reads Only*: When the button is selected and the Current Reads schedule
runs, the current read for the endpoint is retrieved.
• Collect Historical Reads*: When the button is selected and the Historical Reads schedule
runs, historical reads for the endpoint are retrieved.
• Push Reads: A selected button indicates a push read. When a gateway receives data set as a
push read from an endpoint, it does not hold it for the scheduled time. The gateway forwards
the data to ReadCenter Analytics automatically when it is received.
Alarm Notication Alarms selected are sent immediately to ReadCenter Analytics when the condition is detected by
the endpoint. Check the box next to "Alarm Notication" to activate the check boxes.
OTE:N Alarms set on the Endpoint Settings screen are reflected on the Account Records screen.
OTE:N Alarm Notifications are set up during Training, if needed. Notifications set on this screen
can result in high backhaul usage charges if there are a large number of accounts
selected. To set alarm notifications for single endpoints, refer to "ORION SE – Fixed Network
Only" onpage60.
*Neither Current Reads Only or Historical Reads affects what is saved by the gateway. The gateway always saves historical
reads. The settings only impact what is returned for each endpoint when the Current Reads or Historical Reads schedule
runs. Refer to "Defining Gateway Schedules" onpage78 for more information on gateway schedules.
Buttons
View Selected
Accounts
Apply ORION SE
Settings
Edit Activates the fields to make changes. Selecting Edit brings up a Password window. The Password
View Endpoints Set View a report of all the endpoints settings currently defined. The information can be written to a
View and verify the accounts for which you are changing the settings. Accounts are displayed in a
grid format. Double-click an individual row or click Show Account if you want to see the account
record details.
Applies the settings to all selected accounts. Settings are saved within ReadCenter for the account,
route or group selected. A conrmation message displays.
must be entered to make changes to the endpoint settings.
comma-delimited file. Double-click an individual row or click Show Account if you need to see
the account record details. This feature is primarily used by Badger Meter Technical Support for
troubleshooting.
Page 72 June 2014
Page 73
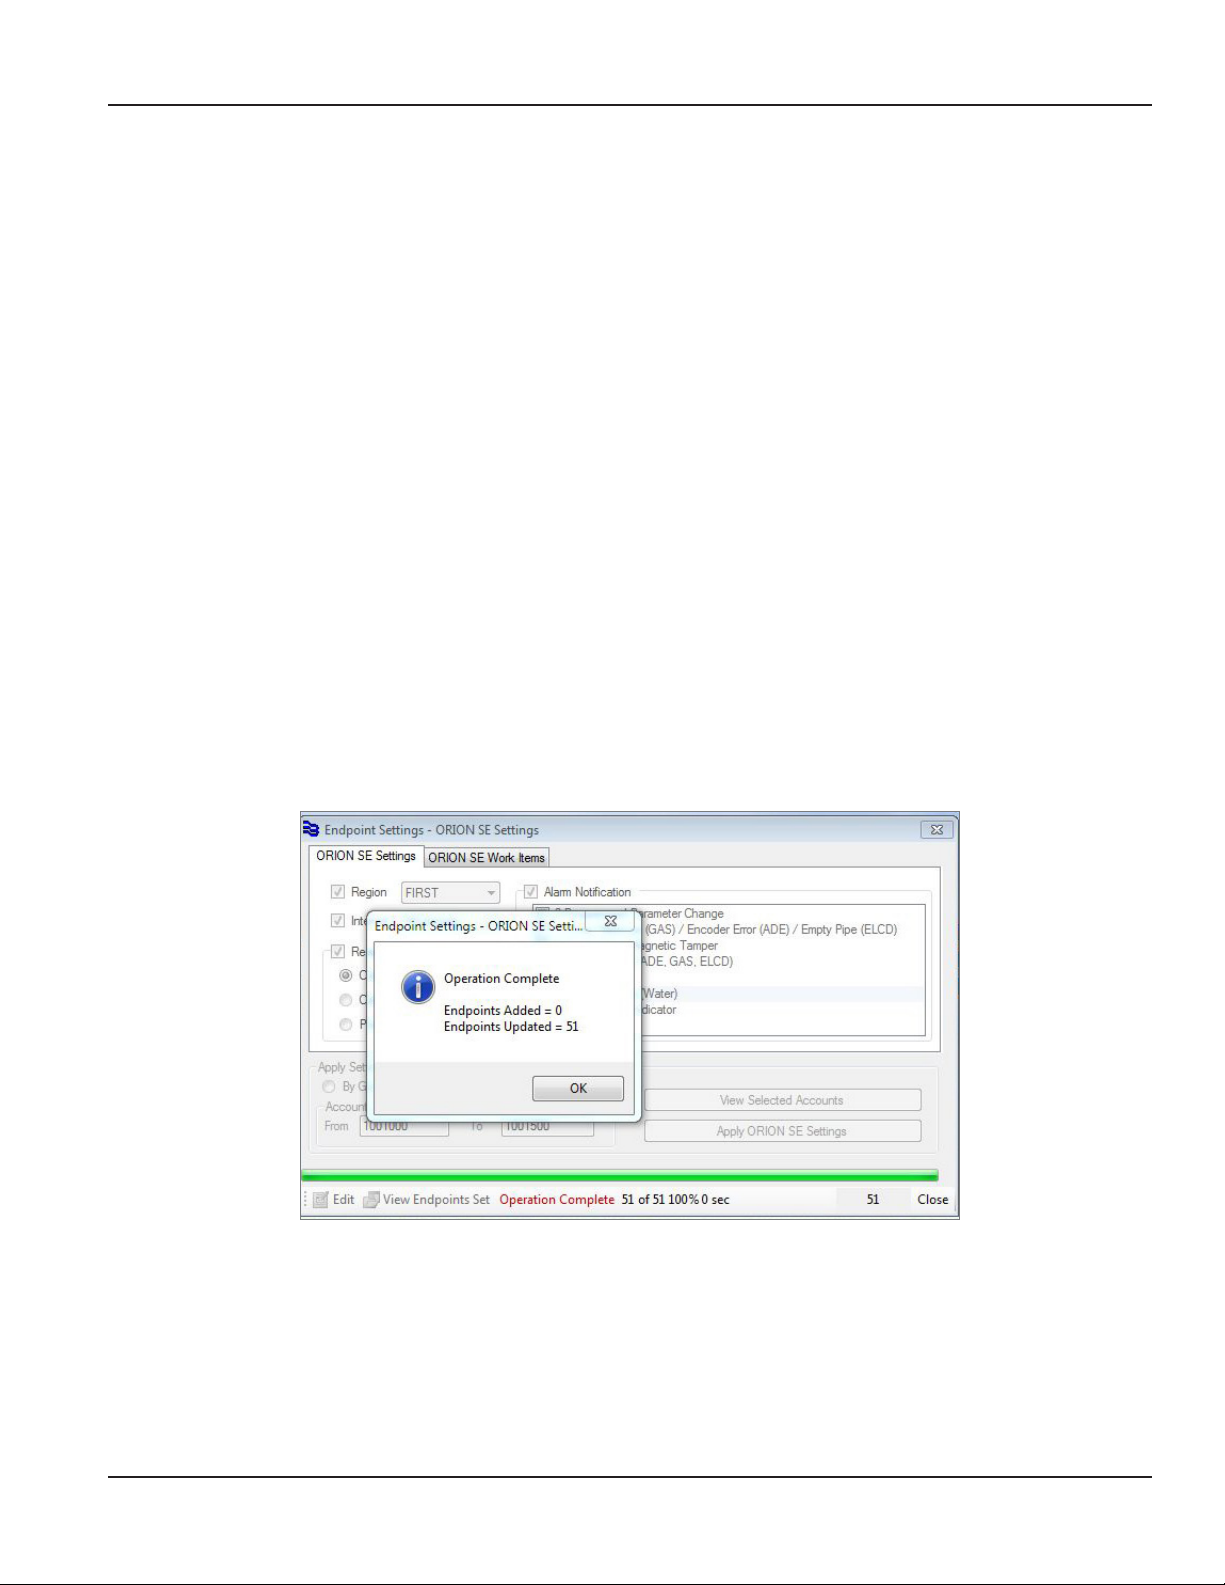
User Manual
Defining Endpoint Settings
OTE:N Changes are sent to the gateway when the Update Assignment schedule runs. Refer to "Defining Gateway Schedules"
onpage78 for more information. Once the schedule runs, it may take up to 48 hours for the endpoint settings to
take affect.
MPORTANTI
CONVERTING AN ORION ME ENDPOINT TO AN ORION SE ENDPOINT IS A ONE-WAY OPERATION. THE ACTION CANNOT
BE REVERSED.
1. From the ReadCenter Analytics main menu bar, select Tools > Endpoint Settings.
2. Click the ORION SE Settings tab.
3. Click Edit and enter the password to activate the elds.
For Region and Reading Interval, check the setting box to activate the eld, then make a selection from the
drop-down menu.
For Reading Options, check the setting box to activate the eld, then select one or more option using the radio
buttons.
For Alarm Notication, check the setting box to activate the eld, then check one or more of the boxes to
select alarms.
4. When all settings are selected, choose how to apply the settings: By Group, By Route or By Account.
5. Click View Selected Accounts to make sure you have the correct accounts selected.
6. Click Apply ORION SE Settings.
7. In the window that displays, click Yes to conrm you want to apply the settings to all the accounts selected.
This action is NOT reversible.
Result: A conrmation window displays and "Operation Complete" displays in the bottom tool bar as shown below.
8. Click Close to exit the Endpoint Settings screen.
Once an endpoint settings are changed, the list of settings is shown on the Account Records screen on a tab labeled
ORION SE where settings for individual account records can be modified. Refer to "ORION SE – Fixed Network Only"
onpage60 for additional information.
The Monitor application software running on the collection server detects any modified ORION SE endpoint settings and
forwards them to a gateway in range of the endpoint.
Page 73 June 2014
Page 74

ReadCenter® Analytics & Analytics Mobile
ORION SE Work Items Tab
The ORION SE Work Items tab is used to set optional tasks for collecting additional data for a group of selected ORION SE
endpoints. When a work item is requested on the ORION SE Work Items tab, the work item is performed once and then the
flag is cleared. A work item selected on this screen must be requested each time it needs to be performed.
Extended Status Collects the full status of the endpoint with additional data such as the meter type, size and unit of
measure.
Firmware Version Collects the firmware version of the selected ORION SE endpoints.
Coordinates Collects the latitude and longitude that was programmed into the endpoint.
OTE:N Work items for ORION ME endpoints can be requested on the Load Collectors screen. Refer to"Load Collectors"
onpage19 for more information.
Requesting ORION SE Work Items
1. Check the box to choose any or all Work Item(s) you want.
2. Select By Group, By Route or By Account.
3. Click View Selected Accounts to make sure you have the correct accounts selected.
4. Click Apply ORION SE Work Items.
5. Conrm the Work Item(s) by selecting Ye s in the window that displays.
Result: A conrmation window displays and "Operation Complete" displays in the bottom tool bar to show how many
endpoint work items are set.
6. Click Close to exit the Endpoint Settings screen.
Page 74 June 2014
Page 75

User Manual
Adding and Managing a Gateway
Fixed Network Only: This section is intended for customers with a fixed network system. Customers using ReadCenter
Analytics exclusively for a mobile network may skip this section.
Use this section to add and manage ORION SE network gateway transceivers in ReadCenter Analytics and to set
gateway security.
Setting Gateway Security
Before a gateway can establish communication with ReadCenter Analytics, it has to authenticate using a
utility-specific security code or pass key. The key is added when the ReadCenter Analytics software is installed, before the
gateways are added.
OTE:N The gateway pass key is set locally, either during manufacturing or via the gateway software configuration tool. The
pass key in ReadCenter Analytics and the gateway pass key must match for communications to take place. If they
do not match, the gateway will not connect. Refer to the ORION SE Network Gateway Transceiver Configuration
Software manual, ORI-A-01-EN, for additional information.
Page 75 June 2014
Page 76

ReadCenter® Analytics & Analytics Mobile
Enabling a Gateway Type
ReadCenter Analytics
Tools> System Configuration
ReadCenter Analytics Mobile
n/a
OTE:N The fields on the left side of the System Configuration Master tab are password protected. Click Edit and enter the
password to activate the fields and make changes to the Collection Methods. The fields are locked again when the
screen is closed.
The gateway setting must be enabled to allow ORION SE data to be managed in ReadCenter Analytics. Follow these steps to
enable the gateway.
1. From the ReadCenter Analytics main menu bar, select Tools > System Conguration.
2. Click the Master tab in the System Conguration window.
3. Click Edit and enter the password to activate the elds.
4. Select the Gateway Reader(s) option.
5. Select ORION SE under Gateway Readers.
6. Select ORION ME/SE under Endpoint Types if not already selected.
7. Click Save.
8. Click Close to close the System Conguration window.
OTE:N The Tools section at the bottom right of the screen is not currently in use.
Page 76 June 2014
Page 77

Defining Gateway Regions
User Manual
ReadCenter Analytics
Gateway Reading> Gateway Setup
ReadCenter Analytics Mobile
n/a
A gateway region defines the gateway time offset and helps separate endpoint communications between gateways that are
located in close proximity to each other. The time offset helps reduce "collisions" when endpoints communicate with the
gateway, allowing for more reliable communication. Regions should be defined as part of the site layout.
1. Select Dene Regions from the lower
tool bar on the Gateway Setup screen.
Result: The Dene Regions window
opens.
2. Click Add to add a new region.
3. Enter the following information:
• Name: Unique name of region.
• Description: Explanation that further defines or describes the region. (Optional but recommended)
• Offset: Offset for each gateway in seconds. Valid values are 0, 1, 2. The offset number is provided by
Badger Meter and is based on the site layout to ensure optimum communication between the gateway and
endpoints.
4. Click Save.
Result: The gateway region is dened.
5. Repeat steps 2…4 to dene each
additional region.
When complete, the window
should look similar to the example
shown here.
6. Click Close to close the Dene
Regions window.
Page 77 June 2014
Page 78

ReadCenter® Analytics & Analytics Mobile
Defining Gateway Schedules
ReadCenter Analytics
Gateway Reading> Gateway Setup
ReadCenter Analytics Mobile
n/a
To retrieve reading data from the newly added gateway, create the recommended gateway schedules.
Adding a Schedule
Follow the steps below to add each of the four schedules.
1. Select Dene Schedules from
the lower tool bar on the Gateway
Setup screen.
2. Click Add.
Result: A new row displays in the
Schedules section at the top of
the screen.
3. Dene the new schedule by
entering the following details in the
blank elds in the lower section of
the screen.
• Name: Type the name to associate with the schedule in the field.
• Description: Type an explanation in the field that describes the schedule purpose.
• Operation: Select one of the operations for each schedule using the drop-down menu. Refer to "Schedule
Operations – Four Options" onpage79 to see a description of the four available schedule operations.
• Repeat: Determines how often to repeat the schedule after the initial start time. Select daily, weekly, monthly or
quarterly using the drop-down menu. Making a selection is necessary for the schedule to run.
• Start Time: Type the first date and time to execute the schedule. Use leading zeroes and a 24-hour time format.
Example: 4 p.m. on January 8, 2013 would by entered as 01/08/2013 16:00.
• Retry Span: Use the up and down arrows to select the number of minutes to wait before considering the current
run of the schedule as failed. (1380 = 23 hours; 8640 = 6 days; max = 30240 or 21 days)
• Retry Count: Use the up and down arrows to select the number of times within the Retry Span that the schedule
will retry if it fails. (max = 99)
• Retry Delay: Use the up and down arrows to select the number of seconds between each retry attempt.
(13200 = 3:40; 21600 = 6:00; max = 28800 or 8 days)
• Last Edit: Automatically filled to show the date of the last change made to the schedule setting.
4. Click Save to save the schedule.
Result: The information dened in step 3 lls in the Schedules row at the top of the screen.
Page 78 June 2014
Page 79

User Manual
5. Repeat steps 2…4 until all four schedules are added.
When complete, the window should look similar to the example shown here. The example shows the recommended
settings for the gateway schedules.
6. Click Close when the four schedules are added and saved.
Schedule Operations – Four Options
When adding a schedule, select one of the following four operations using the Operation drop-down menu.
Update Assignments
This operation sends updates like assignments, modifications to assignments and requests for more data along with other
requests.
Get Current Reads
This operation obtains the latest read that was heard by the gateway from each endpoint at the time the schedule runs.
Get Historical Reads
This operation obtains the last complete block of interval reads from each endpoint set to obtain interval reads. If the interval
reads are missing, the operation instructs the gateway to obtain reads from the endpoint and fills in missing data.
Get Receive Log
This operation obtains a list of all endpoints heard by the gateway and analyzes it to see how well the endpoints are
performing. This operation should repeat, at most, at a weekly interval.
Page 79 June 2014
Page 80
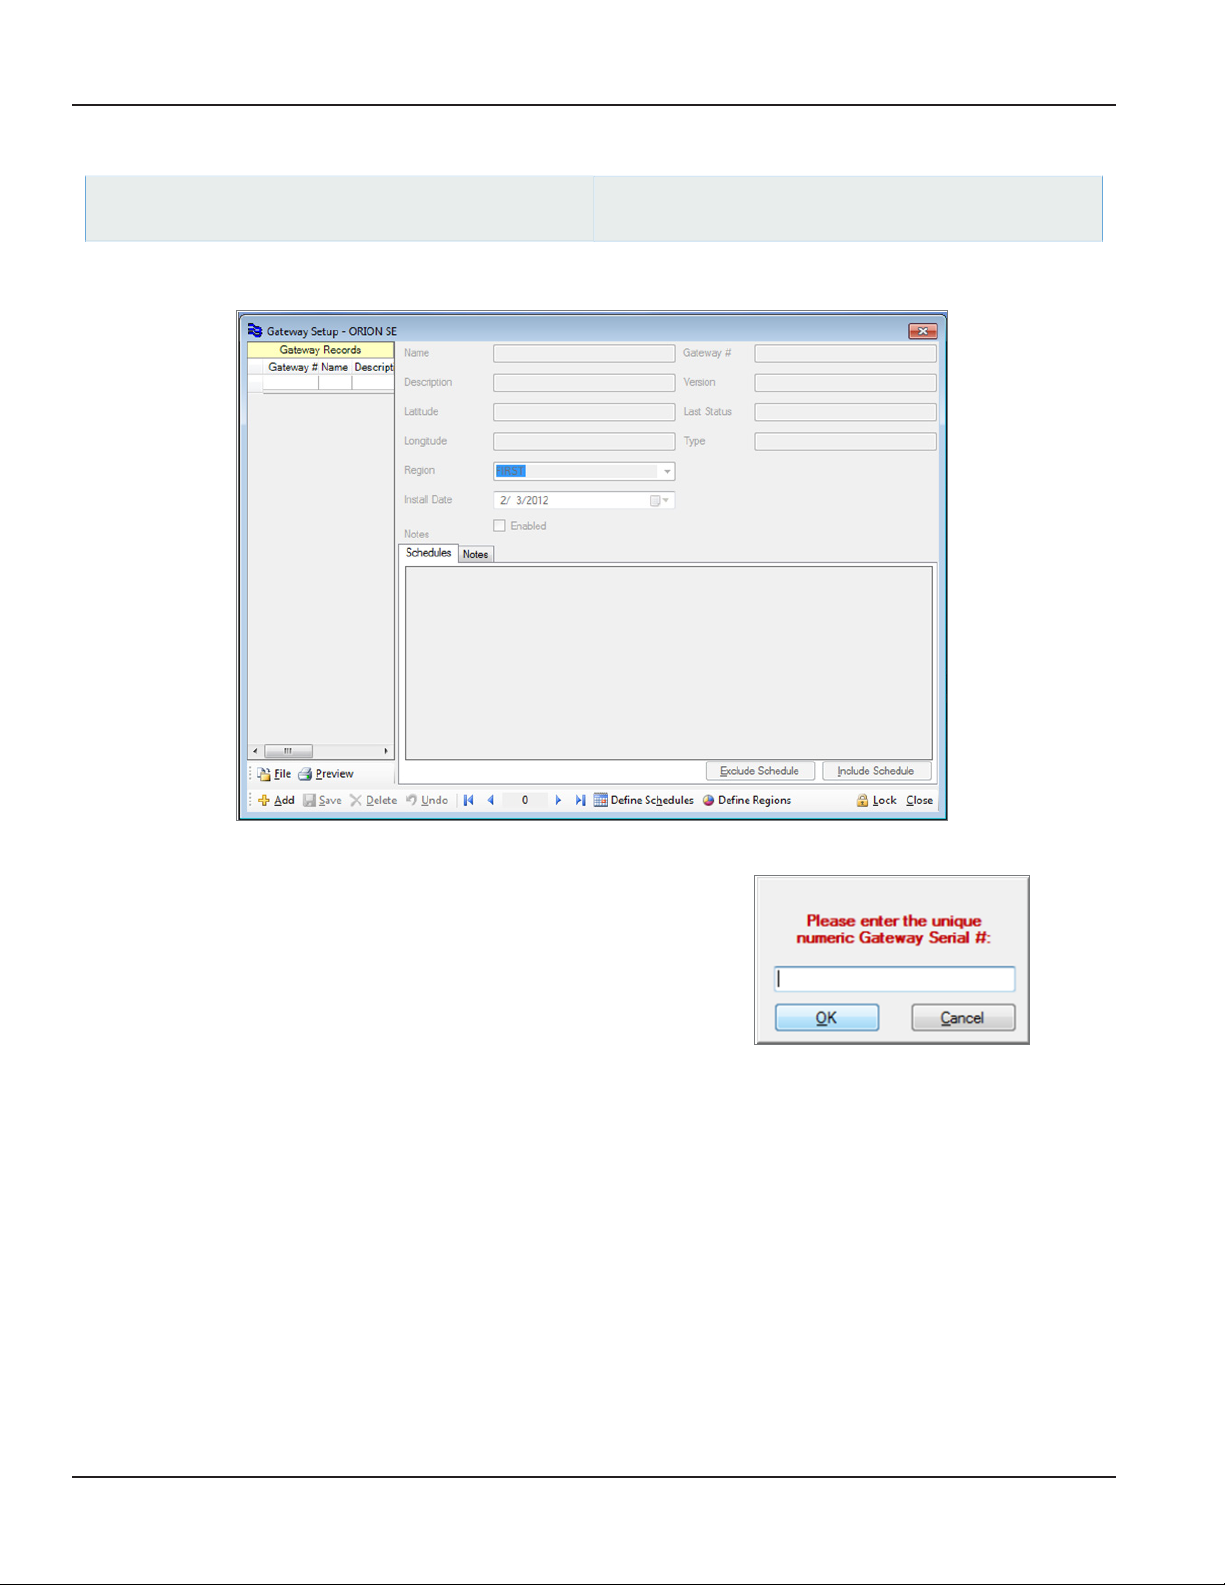
ReadCenter® Analytics & Analytics Mobile
Adding a Gateway
ReadCenter Analytics
Gateway Reading> Gateway Setup
ReadCenter Analytics Mobile
n/a
Use this section to configure and set up a gateway for the gateway reading process in ReadCenter Analytics.
1. Click Add in the lower tool bar of the Gateway Setup screen.
Result: A window opens asking for the "unique numeric Gateway
Serial #".
OTE:N The serial number is shown on the label that displays
on the side of the gateway transceiver enclosure.
"MB S/N" precedes the number.
2. Enter the gateway serial number in the eld and click OK.
Result: The gateway is added to the Gateway Records list and the serial number automatically fills in the Gateway # field on
the right side of the screen.
3. Enter the following information for the gateway in the blank elds on the top right section of the screen.
• Name: (Optional) A name to associate with the gateway.
• Description: (Optional) Explanation that further describes the gateway.
• Latitude/Longitude: (Required) Geo-code location of the gateway used to automatically determine the gateway
ping delay.
• Region: (Required) The gateway region defines the gateway time offset and helps separate endpoint
communications between gateways that are located in close proximity to each other. Refer to "Defining
Gateway Regions" onpage77 for details. Gateways in close proximity should be defined with different regions.
• Install Date: The date the gateway was installed and put in use.
• Enabled: A check in the box enables gateway communication and indicates the selected gateway is active with
available data.
Page 80 June 2014
Page 81
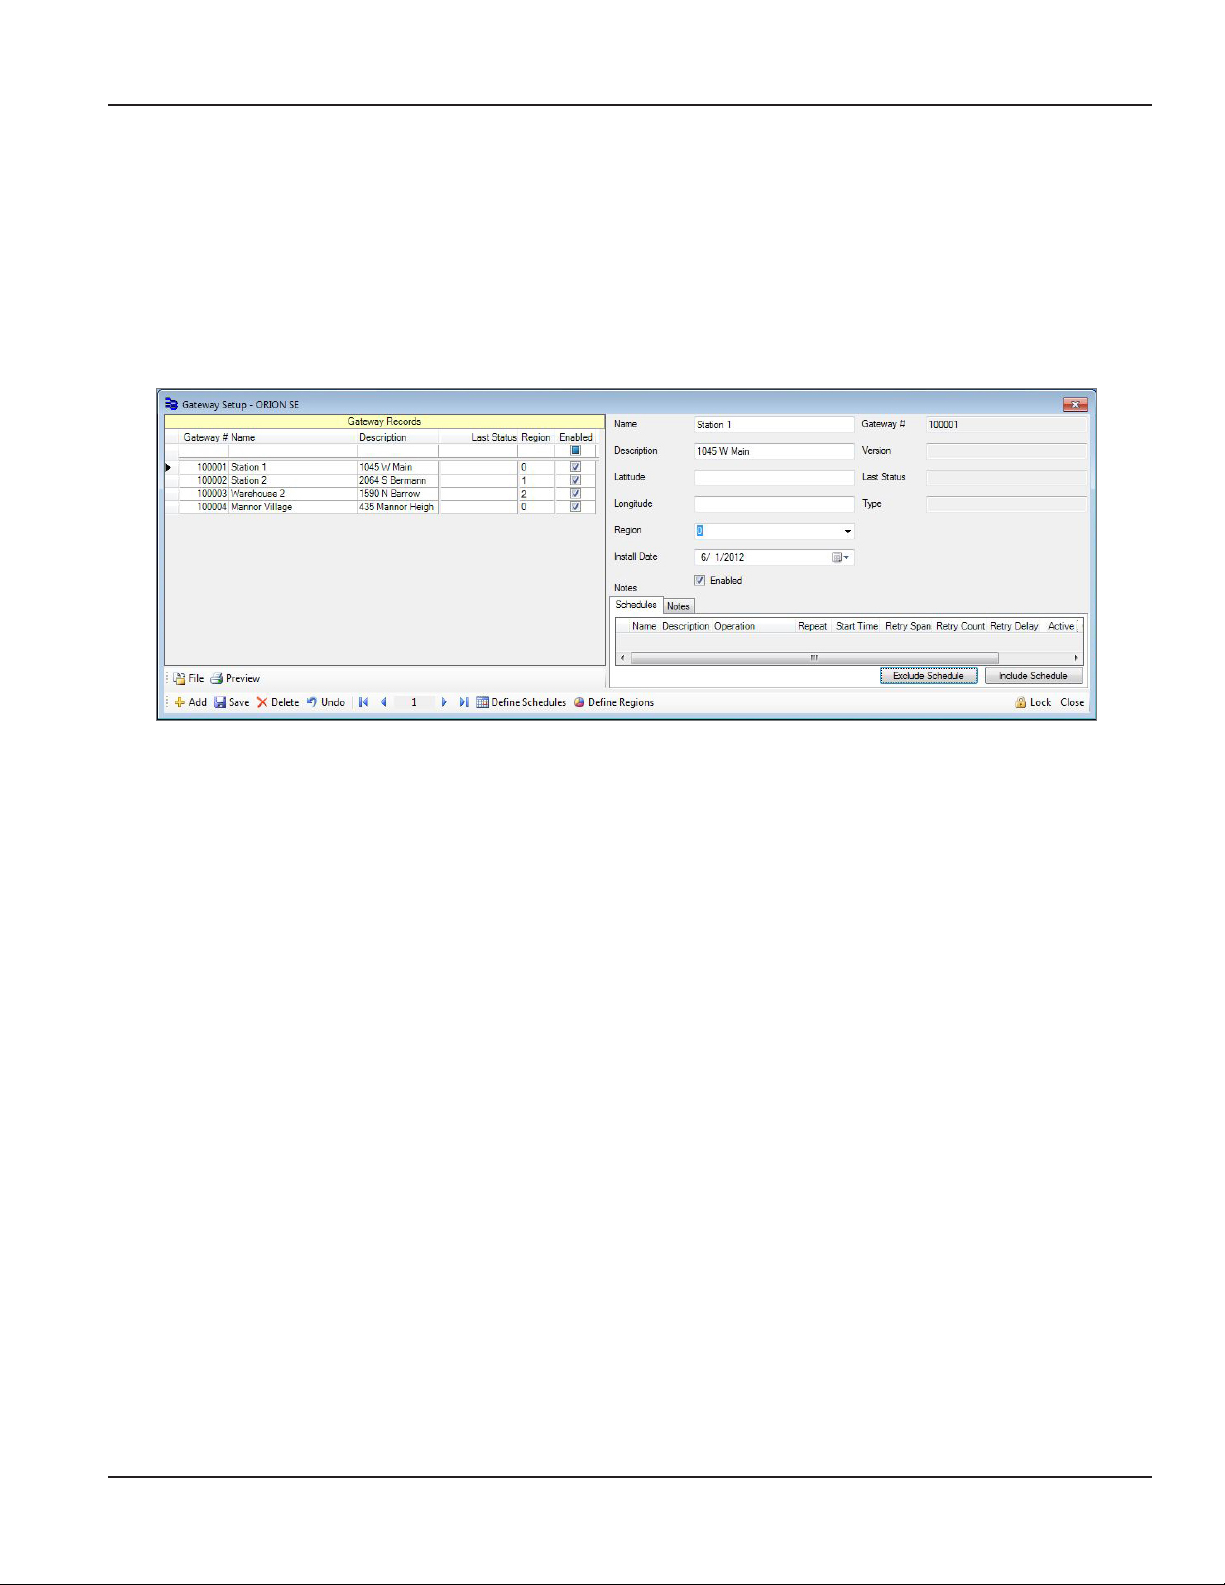
User Manual
• Version: The firmware version of the gateway. NOTE: This field is automatically filled.
• Last Status: Each time the gateway sends a message, the date is automatically modified here.
• Type: The type of backhaul communication in use. (LAN/GPRS/Wi-Fi) NOTE: This field is automatically filled.
4. Click Save.
Result: The information is saved and lls in the Gateway Records elds on the left side of the screen for the gateway that
was added.
5. Repeat steps 1…4 for each gateway you wish to add. When complete, the screen should look similar to the example
shown here.
Saving or Printing a Gateway Record
To save a .csv file of the gateway records displayed on the screen, click File and browse for the location to store the record. To
preview a report, click Preview. You also have the option to print the report preview.
Page 81 June 2014
Page 82
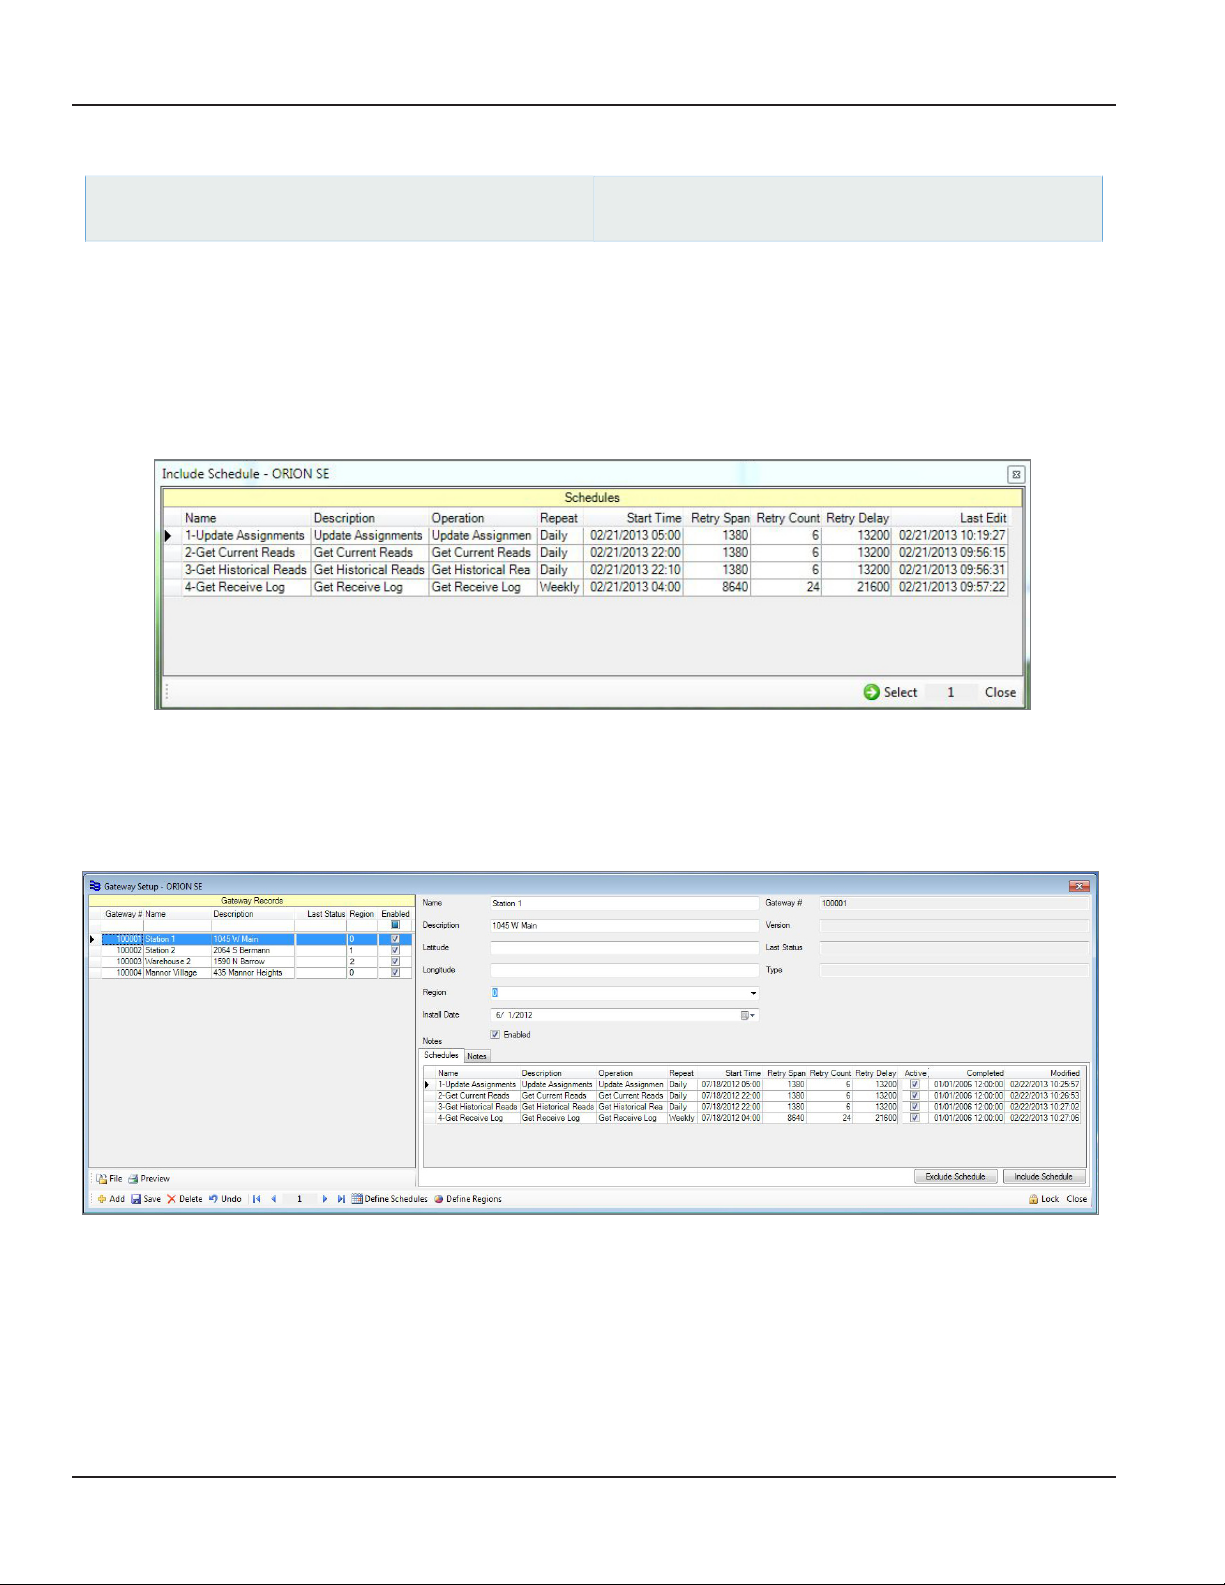
ReadCenter® Analytics & Analytics Mobile
Including a Schedule
ReadCenter Analytics
Gateway Reading> Gateway Setup
ReadCenter Analytics Mobile
n/a
Once schedules have been defined, they can be associated with gateways. One schedule can be associated with
multiple gateways.
1. On the Gateway Setup screen, select the gateway. Click the row to select it.
2. Click the Include Schedule button at the bottom right of the screen.
Result: The Include Schedule window opens, showing the schedules that were dened. Refer to "Dening Gateway
Schedules" onpage78 for additional information.
3. From the list of schedules, click the row to select the schedule that should be assigned to the gateway.
4. Click the Select button.
Result: The schedule is included under the Schedules tab for the gateway.
5. Repeat steps 1…4 to assign the desired schedules to a gateway. When complete, the screen should look similar to
the example shown here.
6. Click Close to exit the Gateway Setup screen.
Page 82 June 2014
Page 83
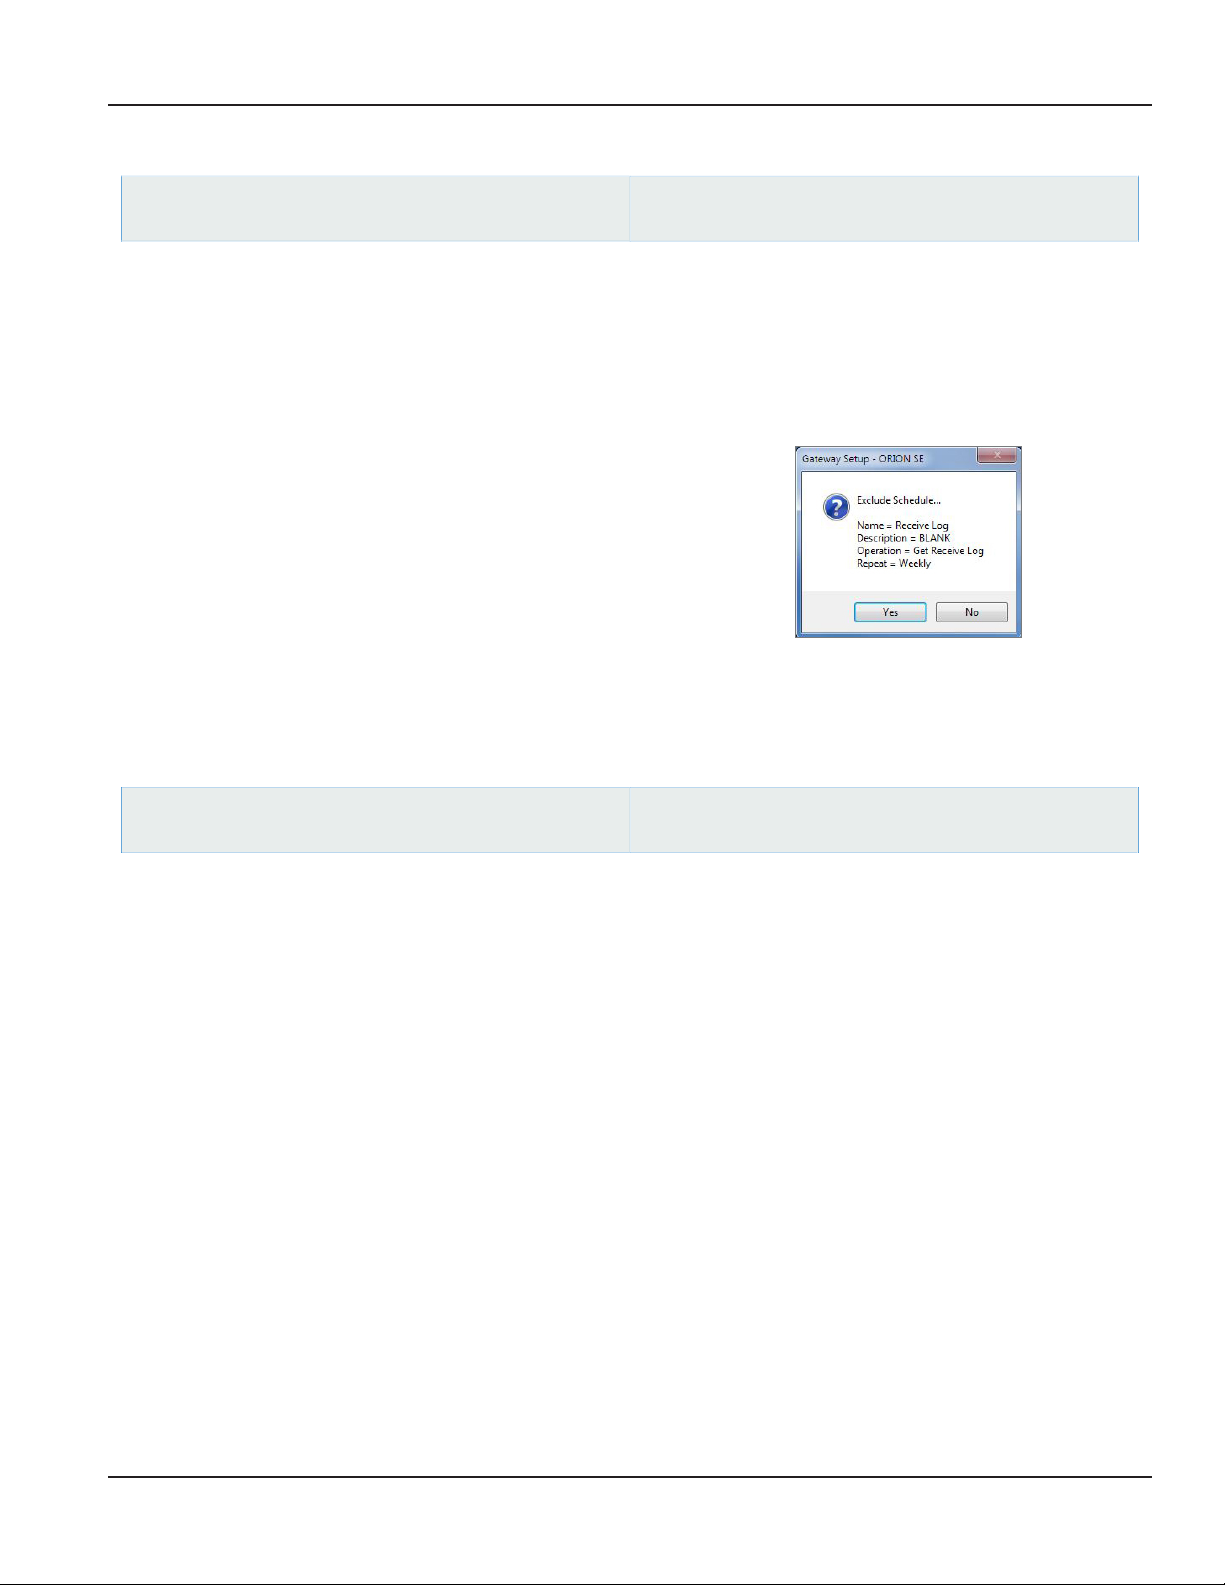
Excluding a Schedule
User Manual
ReadCenter Analytics
Gateway Reading> Gateway Setup
ReadCenter Analytics Mobile
n/a
If a schedule is no longer associated with a gateway, it can be excluded by following the steps below.
1. On the Gateway Setup screen under Gateway Records, select the gateway from which you would like to exclude a
schedule. Click the row to select it.
2. Under the Schedules tab, click on the schedule you would like to exclude.
3. Once the correct schedule is selected, click the Exclude Schedule button at the bottom right of the Gateway Setup
screen.
Result: A confirmation window is displayed.
4. Click Yes to conrm the schedule exclusion.
Result: The selected schedule is removed from the Schedules tab list.
Modifying a Schedule
ReadCenter Analytics
Gateway Reading> Gateway Setup
ReadCenter Analytics Mobile
n/a
Schedule changes are automatically detected and used for the gateway reading process.
Schedules can be modified using the Define Schedule window. Any changes made are automatically applied to all the
gateways that the schedule is associated with. Refer to "Defining Gateway Schedules" onpage78 for more information.
Page 83 June 2014
Page 84
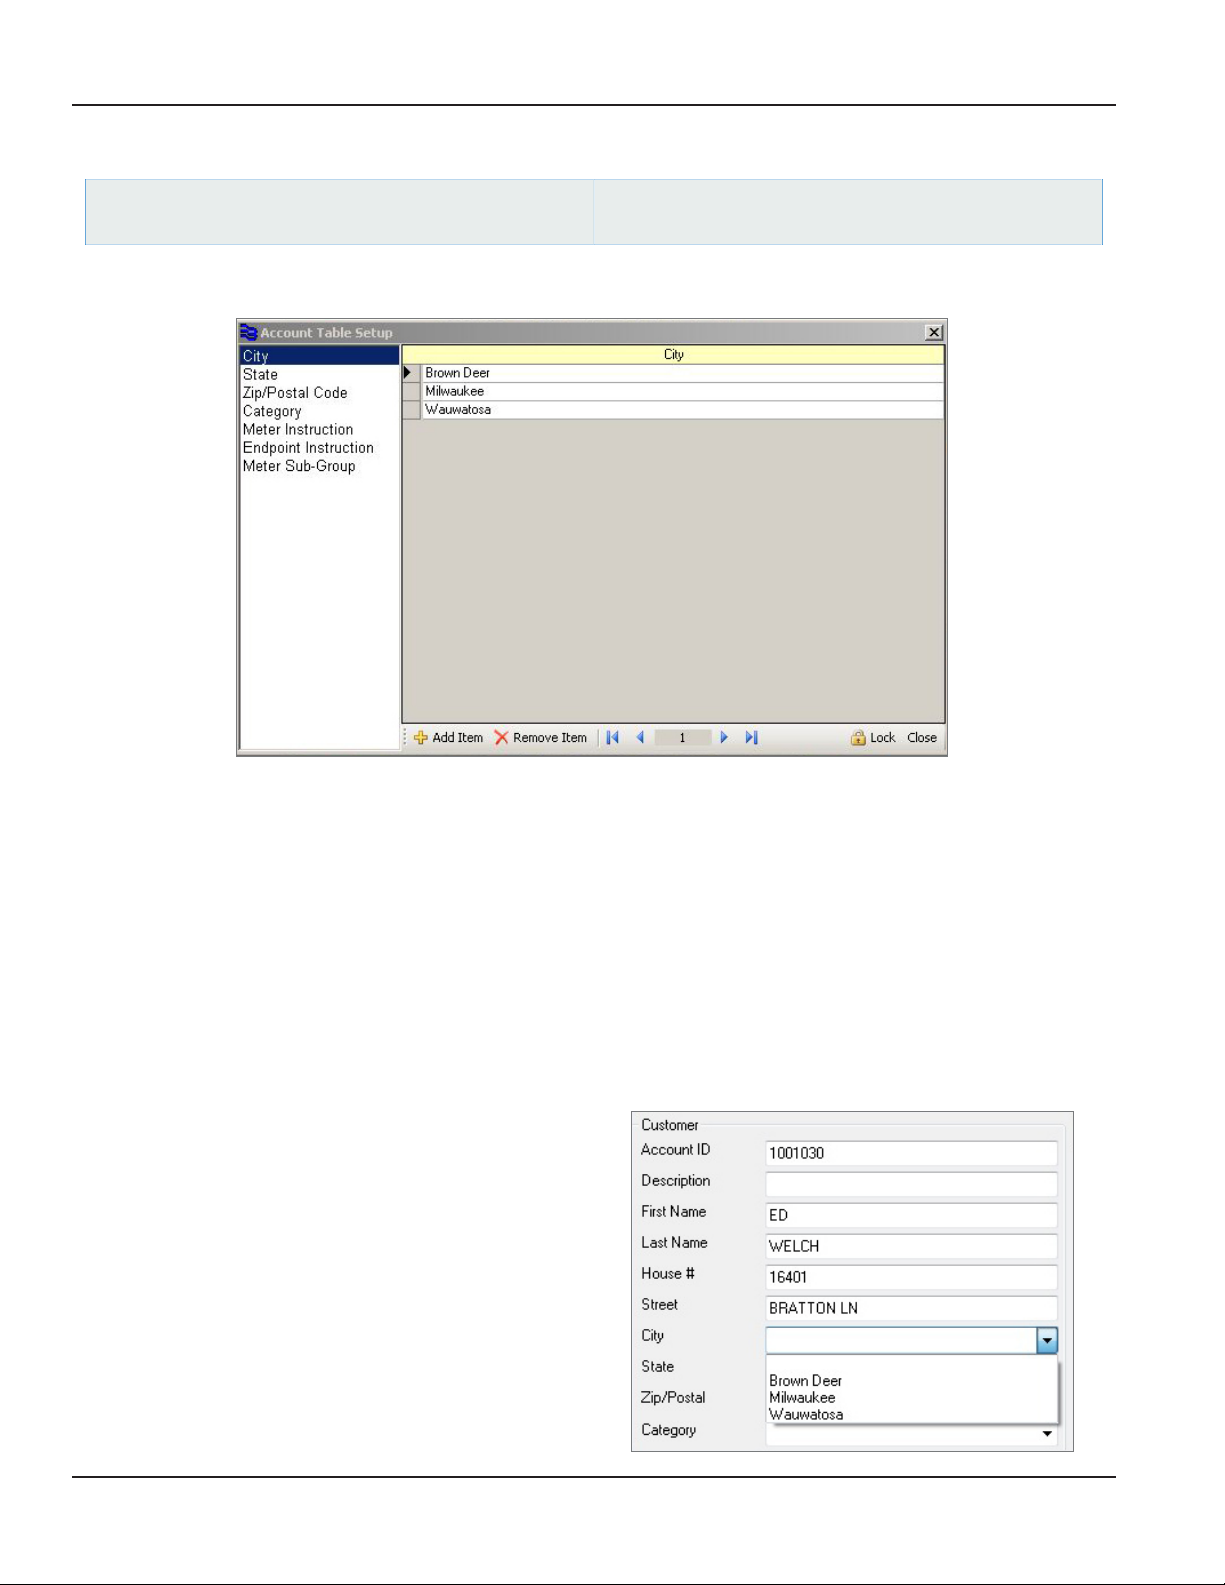
ReadCenter® Analytics & Analytics Mobile
Account Table Setup
ReadCenter Analytics
Accounts> Account Table Setup
Use the Account Table Setup function to define lists of information to associate with individual account records.
Maintenance & Settings> Account Table Setup
ReadCenter Analytics Mobile
The left side of the form holds table names. The right side of the form displays entries for a selected table. When you select
a table name from the list on the left, the right side of the form shows the name in the heading line with associated table
entries below it. Form size is adjustable.
Adding and Removing Table Entries
• To add a table entry, click the table name from the list on the left. Then click Add Item in the bottom tool bar. A new
blank line will appear. Type the text for the entry on the blank line. Repeat this step to add additional entries.
• To delete a table entry, move the cursor to the line you wish to delete, click on it, then click Remove Item in the
bottom tool bar.
• To edit an entry, click on the line to insert the cursor and type directly on the line.
• The navigation arrow buttons in the bottom tool bar provide another way to move from one table entry to another.
When entries are added on the Account Table Setup screen as
described above, they become part of the account information
visible in the Customer section of the Account Records screen.
Each table has an associated drop-down eld.
An example of the Account Records screen using the City table
is shown at the right.
Page 84 June 2014
Page 85
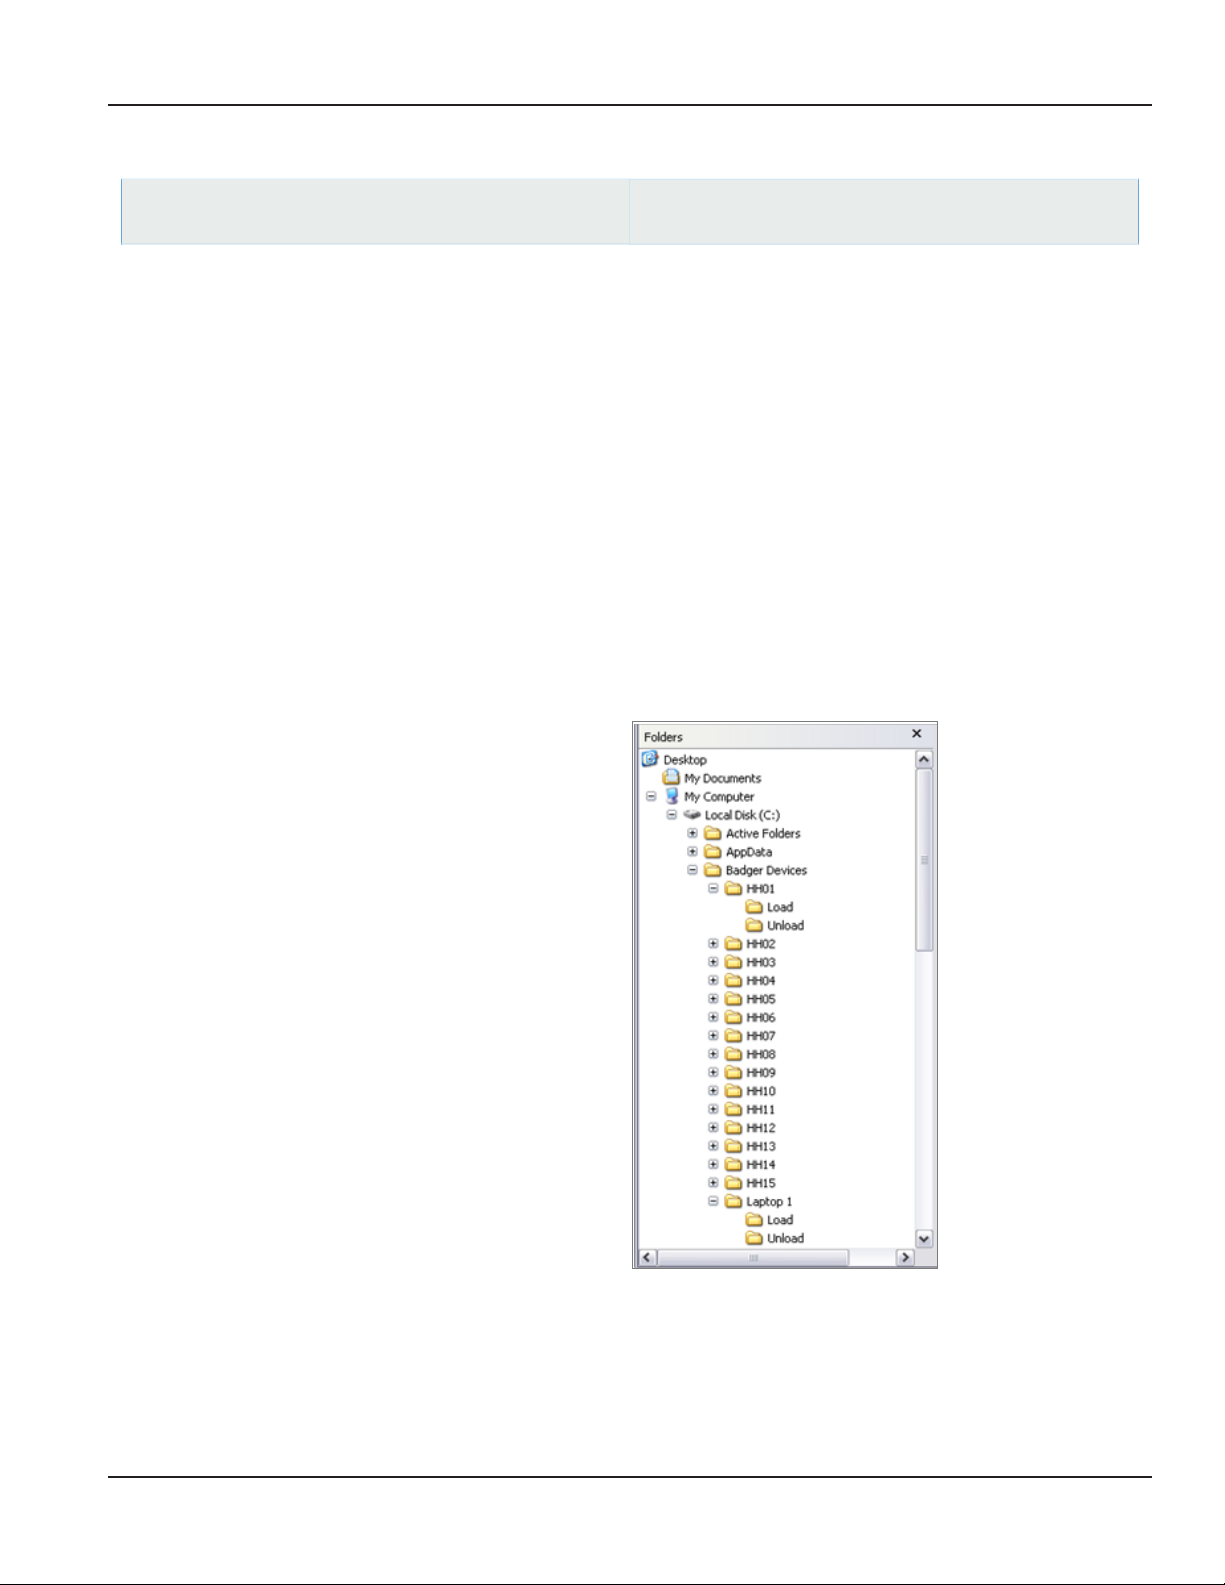
Batch Processing
User Manual
ReadCenter Analytics
Route Reading> Batch Processing
Mobile Only: This section is intended for customers with a mobile network. Customers using ReadCenter Analytics
exclusively for a fixed network may skip this section.
With Batch Processing you can load and unload collection devices automatically, one after the other rather than individually.
Before running this function, here are the steps that must be done in preparation.
1. Set up folders for each collection device to hold load and unload files.
2. USB memory device communication: assign permanent drive letters for the USB memory devices.
3. Wireless handheld reader communication: setup the wireless network.
4. Create Load Collector settings.
5. Create Unload Collector settings.
6. Define batch functions to run.
ReadCenter Analytics Mobile
Accounts> Batch Processing
1. Set up folders for each collection device to hold load and unload files.
• Using Windows® Explorer, create a folder for each
collection device.
• Under each device folder, create two more folders,
one called “Load” and one called “Unload.”
This example shows 15 handhelds and one laptop.
2. USB memory device communication.
• To assign permanent drive letters for the USB memory devices, refer to the document READCENTER –Trimble
Ranger USB Setup Installation Data for details.
Page 85 June 2014
Page 86
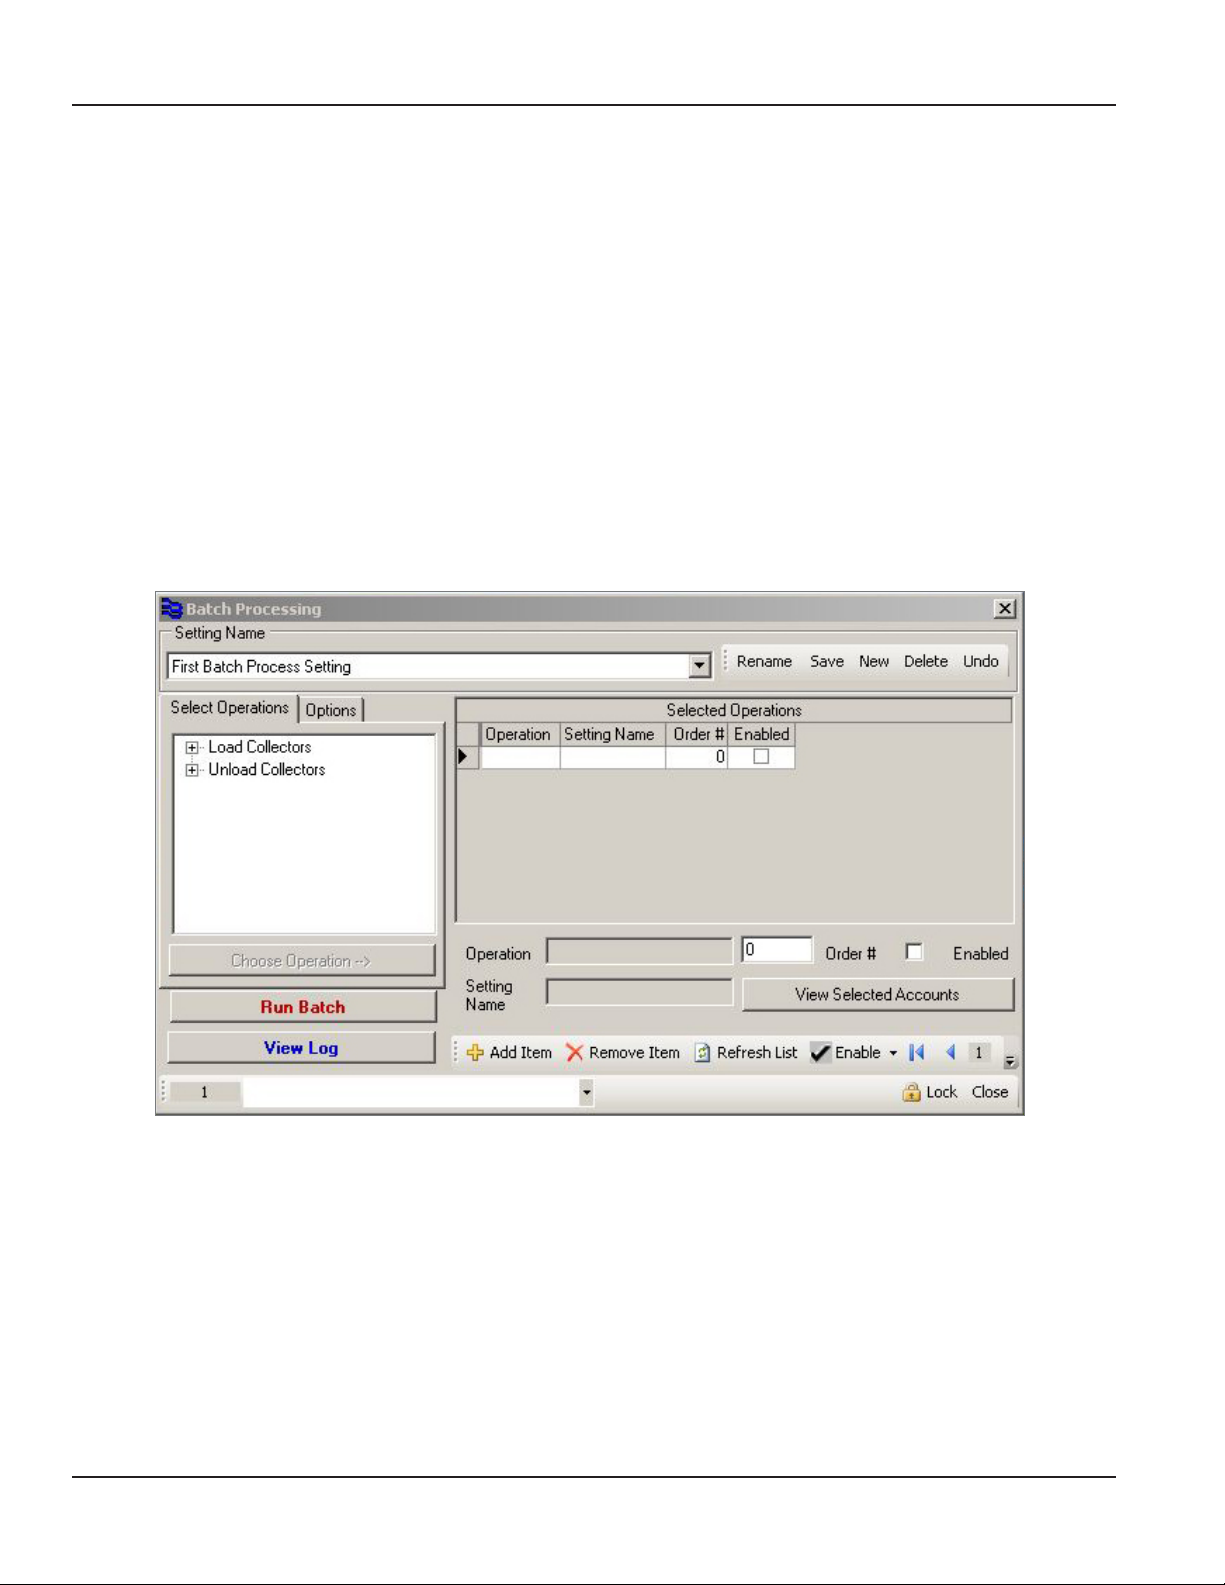
ReadCenter® Analytics & Analytics Mobile
3. Wireless handheld reader communication: setup the wireless network.
• To setup the wireless network, refer to document RDC-I-01 titled READCENTER – Wireless Network Setup
Installation Data for details.
4. Create Unload Collectors settings.
• For each collection device that will be unloaded, create an Unload Collectors setting. In the setting name, indicate
the folder name that was set up previously. For example, if the folder name is HH01, the setting name can be “Unload
Trimble 01.”
5. Create Load Collectors settings.
• For each collection device that will be loaded, create a Load Collectors setting. In the setting name, indicate the
folder name that was set up previously. For example, if the folder name is HH01, the setting name can be “Load
Trimble 01.”
6. Define Batch Functions to run.
• Select Batch Processing from the main menu.
Page 86 June 2014
Page 87
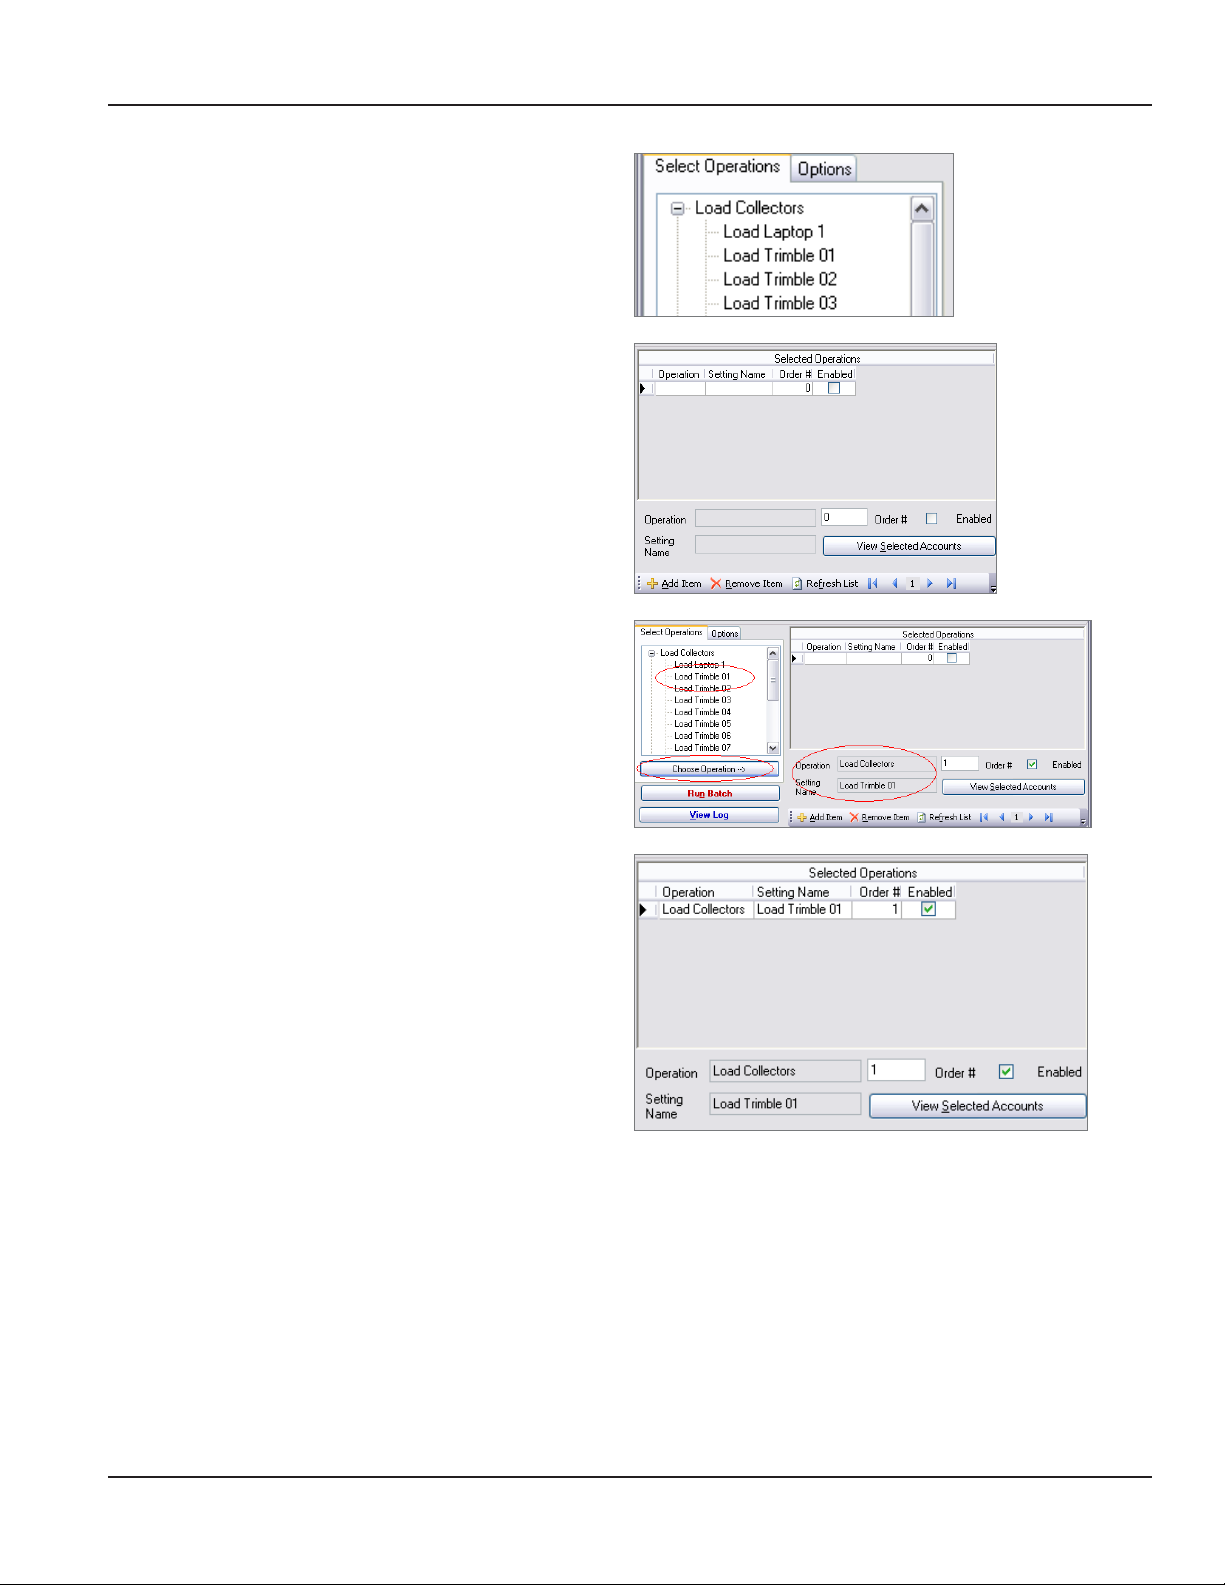
The tree view on the left side of the Batch Processing form
displays all of the settings dened for Load Collectors and
Unload Collectors.
Click the boxes with the + signs to expand the tree and view
all of the setting names for each.
To add a batch item, click Add Item in the bottom tool bar.
As items are added, they appear in the Selected Operations
grid.
With the record selector of the Selected Operations grid
on the new item, click the setting name in the Select
Operations tree. Click Select Operation -->. Note that
the Operation and Setting Name boxes have been lled in
automatically.
User Manual
Enter the order to perform the operation.
OTE:N To unload a collection device and then load it with
new information in the same batch process, define
the Unload operation with an order number that
comes before the Load operation.
Click Refresh List to update the Selected Operations grid and view the operations in the order dened.
Page 87 June 2014
Page 88
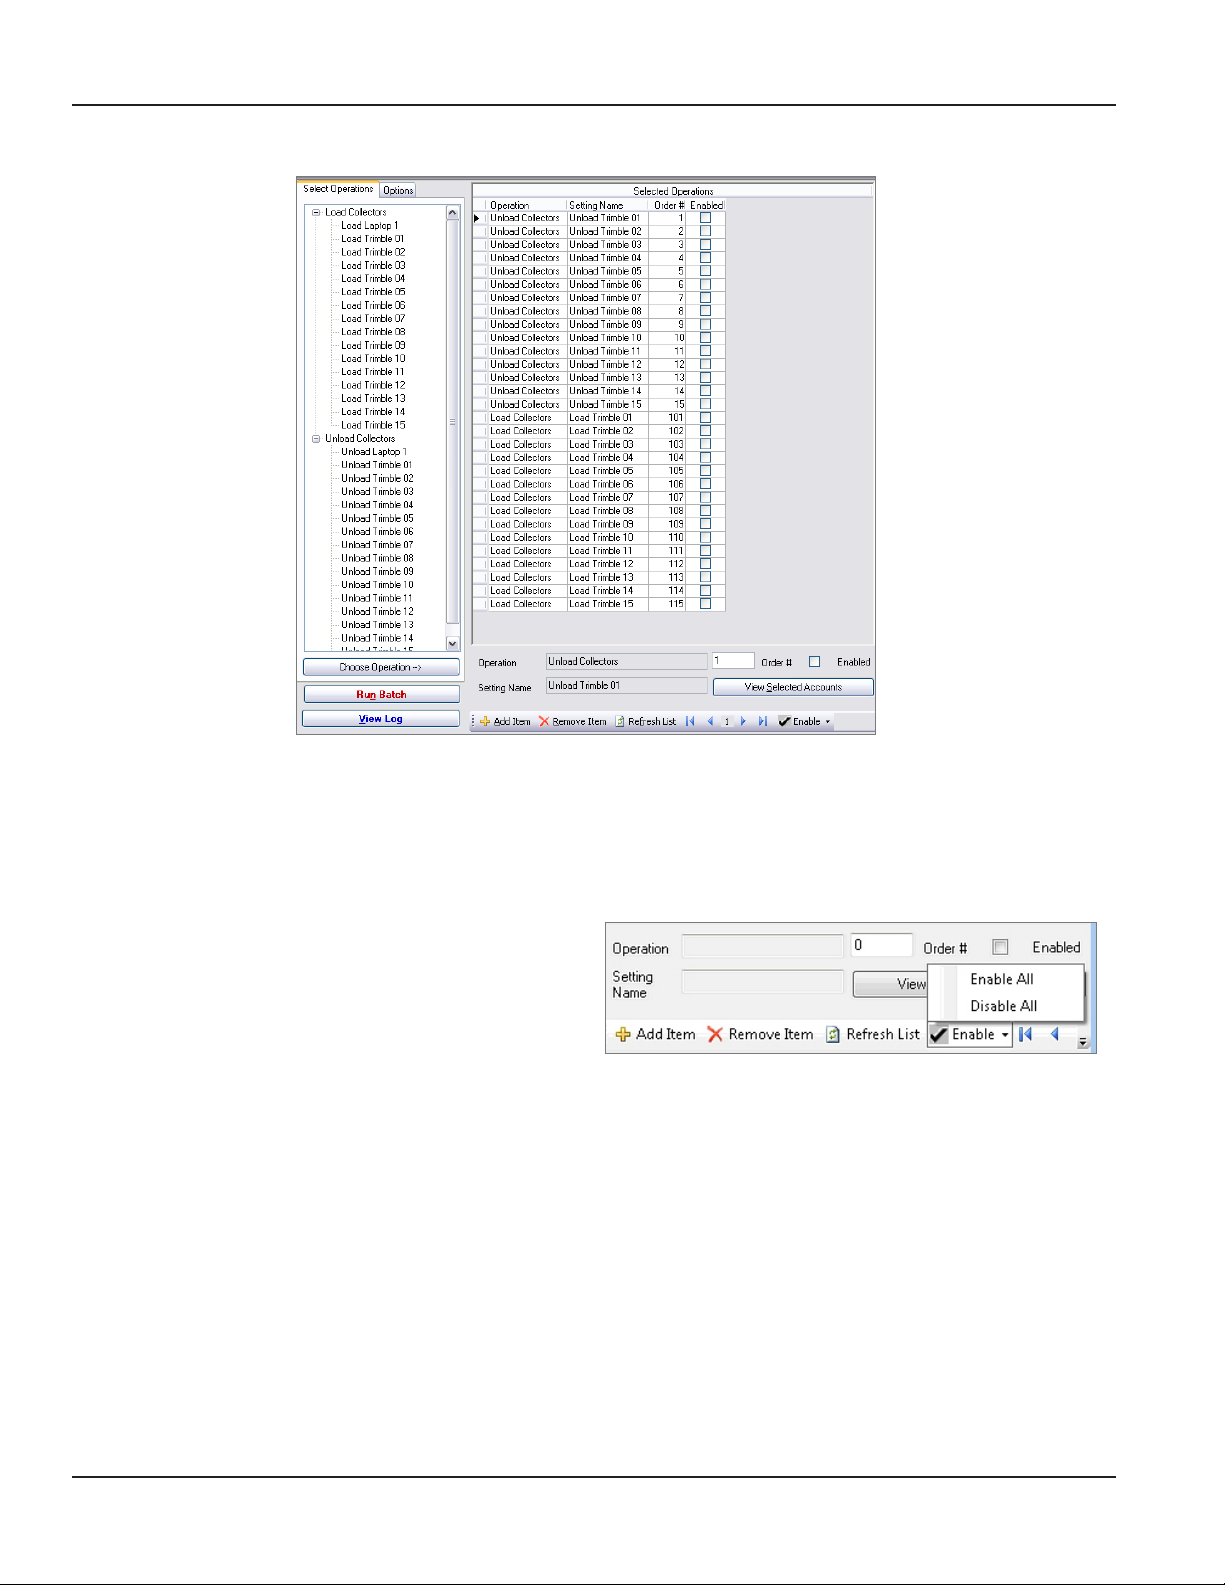
ReadCenter® Analytics & Analytics Mobile
Here is a portion of the screen showing the full setup.
Selected Operations
Place a check mark in the box for each load/unload function you would like to perform.
OTE:N To uncheck the Enabled box for each item, click the
Enable drop-down menu in the bottom tool bar
and select Disable All.
Click Run Batch to begin the process. Each setting in the Selected Operations grid will be verified first to make sure all of the
information is correct. If any of the settings need to be corrected, a message will display showing which ones, and processing
will not continue. Correct the settings and return to Batch Processing to proceed.
Click View Log to see and optionally print the results. The log file will start fresh each time the Run Batch button is clicked.
Page 88 June 2014
Page 89

User Manual
Appendix
Page 89 June 2014
Page 90

ReadCenter® Analytics & Analytics Mobile
SYSTEM REQUIREMENTS
OTE:N The specifications shown are to be used as a guideline. Some items relate more to requirements of the Operating
System rather than the ReadCenter Analytics application and they are subject to change. Follow any Operating
System vendor recommendations that exceed what is listed here.
Fixed Network and Mobile Reading Requirements
Server Component: For fixed network meter reading a gateway Monitor application runs on a server and requests or listens
for meter readings from gateways.
Server Specifications
Operating System • Windows Server 2008 R2 x64
Other
Fixed Network Reading
Requirements
Database Component: The database holds mobile and fixed network information collected. The database application can run on the same
server as the Gateway Monitor or on a separate server with the same specifications.
Data Sources
Database Storage
Requirements
1
Processor: 2.4 GHz Quad Core minimum
RAM: 16 GB minimum
Hard Disk: 100 GB available for application data. See Database Storage Requirements below.
Monitor: 17 - 19 inch screen, 1280 x 768 resolution minimum
Drives: 16x DVD-ROM for software installation
• A backup power supply is required to ensure uninterrupted power.
• An Internet connection is required for Technical Support through WebEx.
• A dedicated computer is required that must be running at all times.
• Requires LAN, WAN, Wi-Fi or Cell Network ability.
• GALAXY Gateway: A Public Static IP Address is required that allows connection with gateway
receivers via port 5003.
• ORION 4.0 Gateway: A Public Static IP Address is required that allows two way TCP/UDP
communications with gateway receivers via port 17134.
• ORION 1.0/2.0 Gateway: HTTP communication via port 80 is required to communicate with gateway
receivers.
• ORION SE Gateway: A Public Static IP Address is required that allows two way TCP/UDP
communications with gateway receivers via port 5004.
• SQL Server 2008 R2 x64 – Standard or Enterprise
• Fixed Network2: 25K Accounts = 100 GB 100K Accounts = 400 GB 500K Accounts=2 TB
• Mobile: 25K Accounts = 2 GB 100K Accounts = 10 GB 500K Accounts=50 GB
Client Computer: A client application runs reports to view and print meter reading information collected. It interfaces with the database
and mobile reading devices, and it allows for transfer of information to/from billing or customer information systems.
Processor • 1.3 GHz Quad Core minimum
RAM • 4 GB minimum
Operating Systems • Windows XP – Professional – SP2 or SP3 (x86 Only)
• Windows 7 – Professional, Ultimate, or Enterprise – (x86 and x64)
Hard Disk • 20 GB available
Monitor • 17 - 19 inch screen, 1280 x 768 resolution minimum
Printer • Inkjet or laser, networked or local
Drives • 16x DVD-ROM for software installation
Ports • USB ports available if needed for Trimble Ranger handheld communication
Wireless • Wireless ability if needed for Trimble Ranger handheld communication
Internet • An Internet connection is required for Technical Support through WebEx
1
Five year estimation
2
Based on hourly readings being held for 12 months for ORION SE or GALAXY TR3.
Page 90 June 2014
Page 91

Mobile Only Network Reading Requirements
Database Server: The database holds the collected mobile reading data.
Configuration 1
Data Source • SQL Server 2008 R2 Express – included on DVD, 10GB Maximum Size
Processor • 1.3 GHz Quad Core minimum
RAM • 8 GB minimum
Operating Systems • Windows XP – Professional – SP2 or SP3 (x86 Only)
• Windows 7 – Professional, Ultimate, or Enterprise – (x86 and x64)
Configuration 2
Data Source • SQL Server 2008 R2 – Standard or Enterprise – end user purchased and maintained
Processor • 2.4 GHz Quad Core minimum
RAM • 16 GB minimum
Operating Systems • Windows Server 2008 R2 x64
Common Requirements
Hard Disk • 100 GB available
Monitor • 17 - 19 inch screen, 1280 x 768 resolution minimum
Printer • Inkjet or laser, networked or local
Drives • 16x DVD-ROM for software installation
Internet • An Internet connection is required for Technical Support through WebEx
User Manual
Database Storage Requirements
1
Mobile Network 25K Accounts = 2 GB 100K Accounts = 10 GB 500K Accounts=50 TB
Client Computer: A client application runs reports to view and print meter reading information collected. It interfaces with the database
and mobile reading devices, and it allows for transfer of information to/from billing or customer information systems.
Processor • 1.3 GHz Quad Core minimum
RAM • 4 GB minimum
Operating Systems • Windows XP – Professional – SP2 or SP3 (x86 Only)
• Windows 7 – Professional, Ultimate, or Enterprise – (x86 and x64)
Hard Disk • 20 GB available
Monitor • 17 - 19 inch screen, 1280 x 768 resolution minimum
Printer • Inkjet or laser, networked or local
Drives • 16x DVD-ROM for software installation
Ports • USB ports available if needed for Trimble Ranger handheld communication
Wireless • Wireless ability if needed for Trimble Ranger handheld communication
Internet • An Internet connection is required for Technical Support through WebEx
1
Five year estimation
Page 91 June 2014
Page 92

ReadCenter® Analytics & Analytics Mobile
SOFTWARE FUNCTION DETAILED DESCRIPTION
The table below lists the main sections of the ReadCenter Analytics and ReadCenter Analytics Mobile software and briefly
describes each of the primary software functions within each main section.
ReadCenter
Analytics
Gateway
Reading
Interface
Route Reading
Accounts
n/a Run Reports View or print predefined standard reports. Meter Reading Cycle
Analytics
(main menu
bar)
Software Function ReadCenter
Analytics Mobile
Gateway Setup Describes gateways that communicate with ReadCenter Analytics.
Collected
Readings
Gateway Reading
Reports
Read Input File Places account information into ReadCenter Analytics from a file
Write Output File Send meter readings collected from ReadCenter Analytics to an
Load Collectors Send account information from ReadCenter Analytics to the mobile
Unload Collectors Retrieve meter reading data from the mobile collection devices and
Handheld and
Laptop Settings
Batch Processing Load and unload collection devices automatically, one after the other,
Route Reading
Reports
Account Records View all of the information available for each account. Scroll through
Account Groups Define more detailed groups of accounts for use in loading collection
Account Table
Setup
Save/Clear Reads
or
Save/Clear
Previous Reads
Custom Reports Create reports using available data fields of your choosing from the
Network Analysis View daily summaries of gateway and endpoint reception totals to
Account Analytics Define conditions for which you want to be informed.
Gateway Reading
Summary
Displays a range of meter readings and exception conditions per
gateway.
View a list of available gateway reading reports.
created by the MDMS. The information may include new accounts or
changes to existing accounts. It may also include the previous meter
reading and/or high and low limit ranges.
electronic storage file for use by the MDMS.
collection devices for the purpose of gathering meter readings.
store the information in ReadCenter Analytics.
Define code tables, display fields and other settings for passing to
mobile collection devices.
rather than individually.
View or print predefined standard reports.
account records and search for specific records based on the account
number, name, address, meter serial # or other parameters. You can
also view and print the meter reading history and add and save notes
for individual accounts.
devices, running reports and performing other tasks related to meter
reading.
Define lists of information to associate with individual account
records such as City, State and ZIP code.
Save the current readings to history and clear current readings as
shown on the Account Records screen.
Account Records screen. The report definitions can be saved and used
at any time.
monitor the overall health of the system.
View all gateways and the endpoints to which they report. This
screen shows endpoints that report to more than one gateway.
For additional information, refer to "Gateway Reading Summary"
onpage46.
Meter Reading Cycle
Maintenance & Settings
Accounts
Accounts
Meter Reading Cycle
Maintenance & Settings
Analytics
(main menu bar)
n/a
n/a
n/a
n/a
n/a
Page 92 June 2014
Page 93

User Manual
CODES
Read Type/Read Method Codes
Read Type Read Method Description Reading Device
R d
r d
H d
h d
L d
l d
N N
R D
r D
H D
h D
L D
I D
T —
L —
t L
A normal read (reading between the high/lows), and was manually
entered into the reading device
A normal read (reading between the high/lows), but the high/low
values were viewed rst. The reading was manually entered into the
reading device.
The meter reading was High. The meter was read manually. ORION Laptop
The meter reading was High. The high/low values were viewed rst.
The meter was read manually.
The meter reading was Low. The meter was read manually. ORION Laptop
The meter reading was High. The high/low values were viewed rst.
The meter was read manually.
The meter was not read (Unread) ORION Laptop
A normal read (reading between the (high/lows),The meter was read
successfully by radio (Interrogated).
A normal read (reading between the high/lows), The high/low values
were viewed rst. The meter was read by radio (Interrogated).
The meter reading was High. The meter was read by radio
(Interrogated).
The meter reading was High. The high/low values were viewed rst.
The meter was read by radio (Interrogated).
The meter reading was Low. The meter was read by radio
(Interrogated).
The meter reading was Low. The high/low values were viewed rst
The meter was read by radio (Interrogated).
A wire from the ORION endpoint going to the register (water) or Index
(Gas) has been cut or shorted.
Potential Leak. The ORION endpoint has noticed continuous water
usage in a 24 hour period and has agged the meter with a Potential
Leak.
A wire from the ORION endpoint going to the register (water) or Index
(Gas) has been cut or shorted. The ORION endpoint (Water) has also
noticed continuous water usage in a 24 hour period and has also
agged the meter with a Potential Leak.
ORION Laptop
Trimble Radix
ReadAll
ORION Laptop
Trimble Radix
ReadAll
Trimble Radix
ReadAll
ORION Laptop
Trimble Radix
ReadAll
Trimble Radix
ReadAll
ORION Laptop
Trimble Radix
ReadAll
Trimble Radix
ReadAll
ORION Laptop
Trimble Radix
ReadAll
ORION Laptop
Trimble Radix
ReadAll
ORION Laptop
Trimble Radix
ReadAll
ORION Laptop
Trimble Radix
ReadAll
ORION Laptop
Trimble Radix
ReadAll
ORION Laptop
Trimble Radix
ReadAll
ORION Laptop
Trimble Radix
ReadAll
ORION Laptop
Trimble Radix
ReadAll
ORION Laptop
Trimble Radix
ReadAll
Page 93 June 2014
Page 94

ReadCenter® Analytics & Analytics Mobile
Billing Interface Codes
Endpoint Types or Registration Types
• C – Manual
• Z – ORION CE
• N – ORION ME or SE
• G – GALAXY
• R – RAMAR®
• X – Datamatic®
• M – TRACE
• D – Touch
• L– Permalog ORION CE
• Y– Permalog GALAXY
• A– Permalog ORION ME/SE
Read Types
• N – Unread
• R – Regular
• H – High
• L – Low
• r – Regular with Inquiry
• h – High with Inquiry
• l – Low with Inquiry
Exceptions
• T – Tamper
• L – Leak
• R – Reverse Flow
• U – No Usage
• t – Tamper/Leak
• B – No Reply
• G – Rollover
• E – Encoder Error
• F – Forced Read
• P – Empty Pipe
• A – Low Battery
• C – Cover Removal
• D – Device Condition
Read Methods
• N – Unread
• d – Manual
• D – Interrogated
Valid Serial Numbers
ORION ME/SE 30000000 to 59999999
ORION CE 70000000 to 199999999
Permalog ORION CE 60000000 to 69999999
TRACE PI/ TRACE MMI 1000000 to 9999999
GALAXY TR3
GALAXY TR2
Page 94 June 2014
10000000 to 19999999
10000 to 999999
Page 95

Read Resolution Codes (also known as Test Circle Codes)
• Refer to LCD-AS-00462-EN for a list of HR-E LCD Test Circle codes.
• Refer to RDC-A-02-EN for a list of ADE Test Circle codes.
• Refer to RDC-A-01-EN for a list of RTR Test Circle codes.
Gas Drive Dial Codes
• Refer to ORI-A-03-EN for a list of ORION Gas Drive Dial codes.
OTE:N All the documents listed above are available on the Badger Meter website, www.badgermeter.com.
User Manual
Page 95 June 2014
Page 96
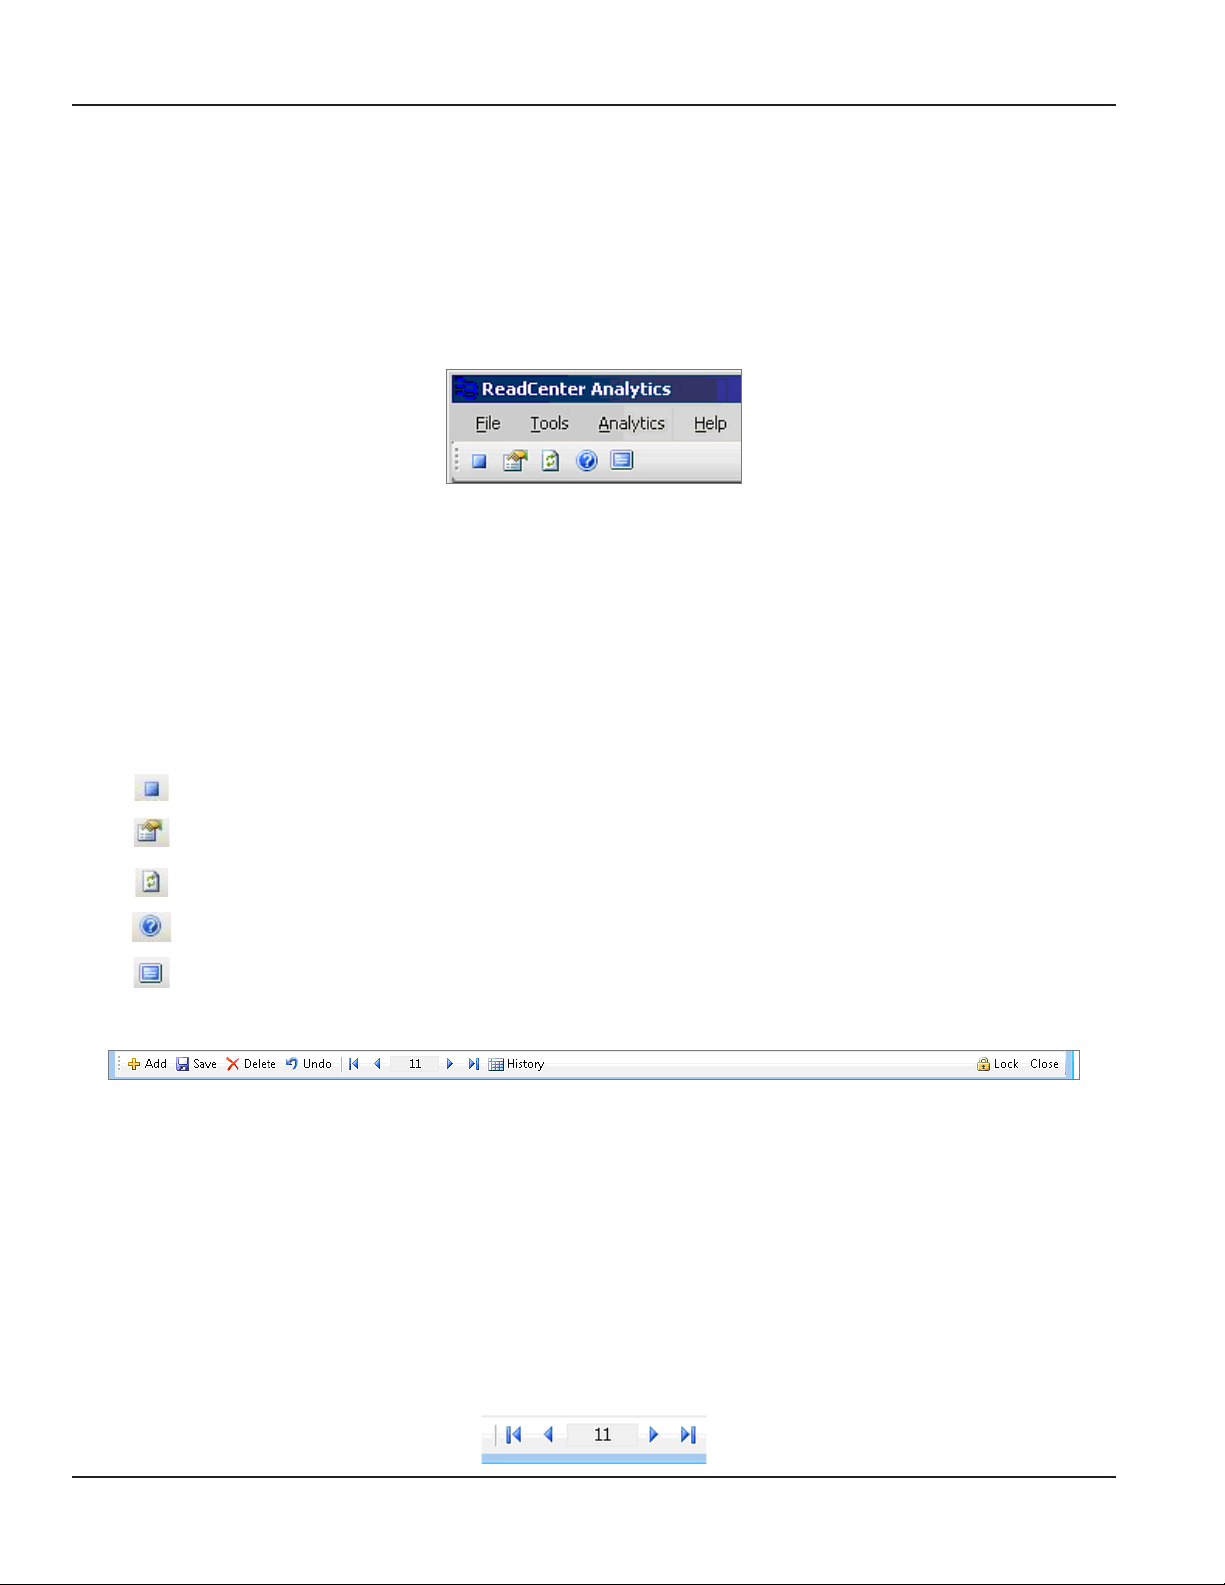
ReadCenter® Analytics & Analytics Mobile
USING THE TOOL BARS
The tool bars on the ReadCenter Analytics and Analytics Mobile screens provide shortcut access to many time-saving features.
The following section describes the tool bars and explains their functions in the order they appear.
Main Menu and Tool Bar
The main menu bar sits at the top left corner of the main screen. The main menu bar includes access to the screens for
defining system settings and analytics. The icons in the tool bar below the main menu bar provide additional functions and
alternative access to several functions in the main menu bar.
• File The Exit function is located here. Click Exit to close the software application.
• Tools Provides access to the System Configuration, Interface File Formats and Endpoint Settings screens.
• Analytics Provides access to Network Analysis, Account Analytics and Gateway Reading Summary screens.
OTE:N Network Analysis, Account Analytics and Gateway Reading Summary options are included with
ReadCenter Analytics. Network Analysis and Gateway Reading Summary are for fixed network
only. Account Analytics is included with ReadCenter Analytics Mobile.
• Help Provides access to the About and Support options. Click About to see the software version number.
Click Support to find links to the Badger Meter main website and the Webex connection which may be
needed for Technical Support.
Click to exit the ReadCenter Analytics software application.
Click to access the System Configuration screen.
Click to refresh the screen.
Click to see the software version number.
Click to maximize the selected screen. This icon displays for screens that can be resized. .
System Tool Bar
• Add Adds a new record to the database. Typically, records are added automatically when a file is read in from
the billing system so this function is rarely needed.
• Save Saves account information to the database for the record currently selected.
• Delete Removes the currently selected record from the database.
• Undo OTE:N Restores account information to the last saved entries.
Undo removes all information that has changed since you accessed the account record, not just
the latest change. Once you move away from a record, changes are saved automatically and
cannot be undone by choosing Undo.
• Record
Navigation
Move through records using the right and left navigation arrows. From left to right as shown below, the
arrows move the cursor to the first row, previous row, next row and last row. The number in the center
indicates the row of the currently selected record.
Page 96 June 2014
Page 97
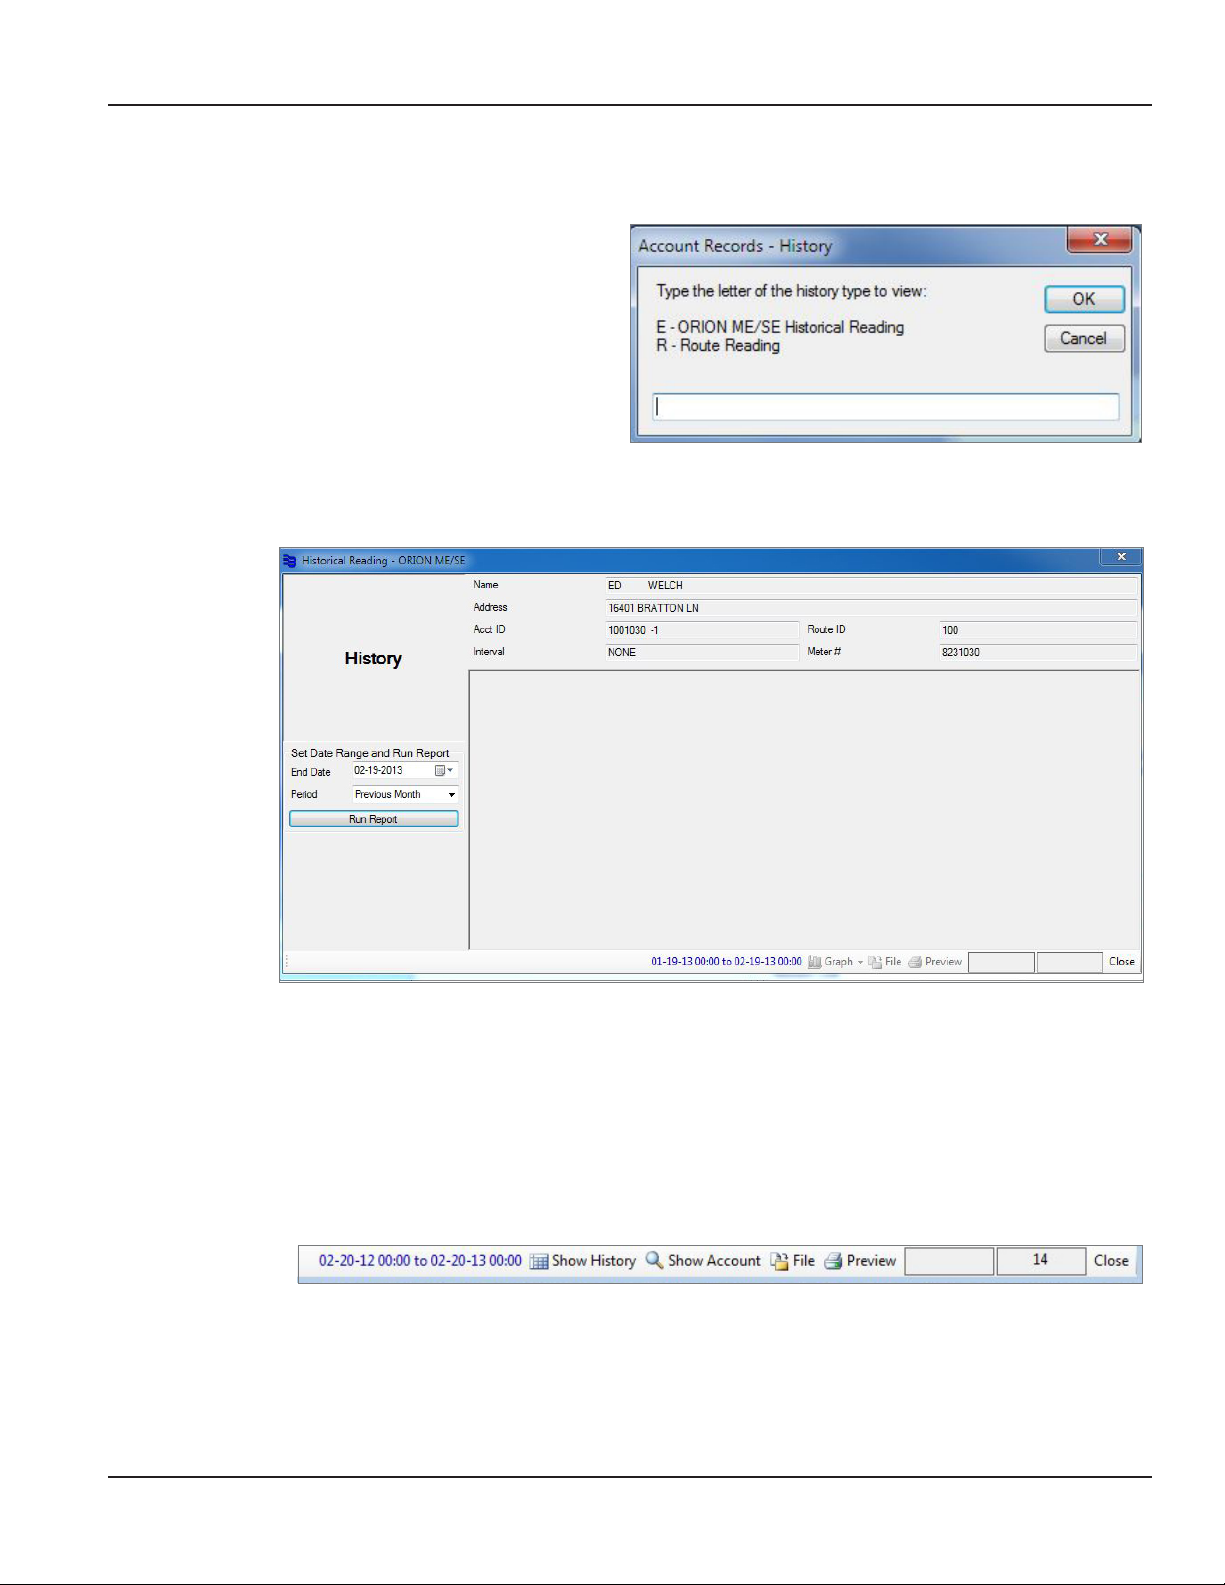
User Manual
• History History displays on the tool bar for the Account Records screen. Click History to open the window
providing access to collected readings—up to a year—for the endpoint of the selected account.
Depending on how the system
is configured, you may need to
select the type first.
• Type E to open the History
window.
• Type R to see the reading
collected from the route
for the account selected.
OTE:N The field is not case sensitive.
Historical Reading
In the History window, select the date range and click Run Report. Historical data displays for the time
period selected.
You have the option to print, file or create a graph of the historical data displayed. For more information,
refer to "History Report Graph" onpage32.
OTE:N You can also access the History screen from the Gateway Reading Reports. When you run a report, Show
History displays in the tool bar at the bottom of the report. Click Show HIstory to access the History
screen as described above.
Page 97 June 2014
Page 98
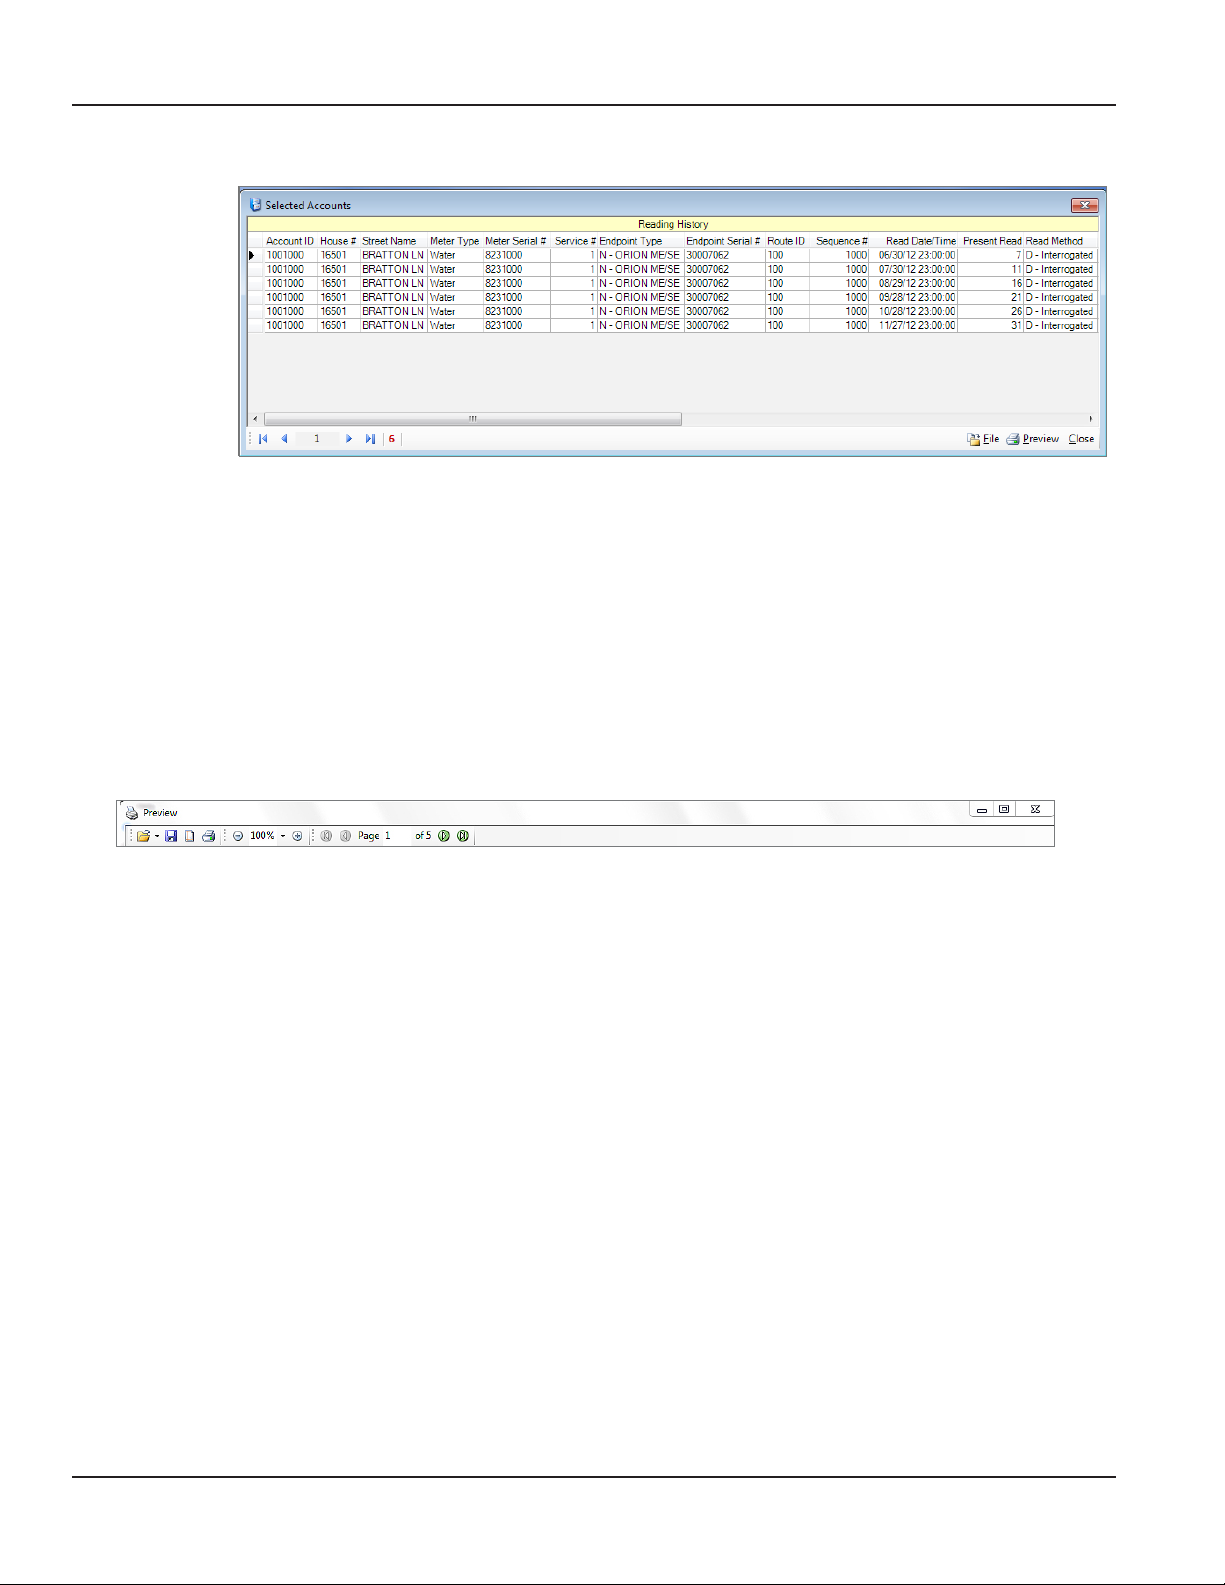
ReadCenter® Analytics & Analytics Mobile
Route Reading
The Reading History table shows readings saved for the selected account using the Save/Clear Reads
function. Refer to "Save/Clear Reads" onpage15 for more information. You have the option to preview,
print and write the history to a file.
• Lock Used to determine user permissions at set up, and by Badger Meter Technical Support for
troubleshooting.
• Close Closes the screen.
Preview Screen Tool Bar
The tool bar at the top of the Print Preview screen includes icons that provide shortcut access to features to help view, print
and save the report. The following information explains the icon functions in the order they appear on the tool bar.
• Open File Browse to find the location of the stored report files.
• Close (Bottom right) Closes the screen.
• X (Upper right) Closes the screen.
• Save File Save the report to the stored file location.
• Page Setup Set up the report page(s) to print. You have the option to select paper size and orientation, and to
change the page margins.
• Print Bring up the print dialog box to select the printer.
• Zoom Use the + or - sign to increase or decrease the size of the graph preview document. You can also
select a size percentage from the drop-down menu.
• Page
Navigation
View the pages of a multiple page document. Click the right and left arrows to move from page to
page, or select First Page or Last Page using the outside arrows.
Page 98 June 2014
Page 99
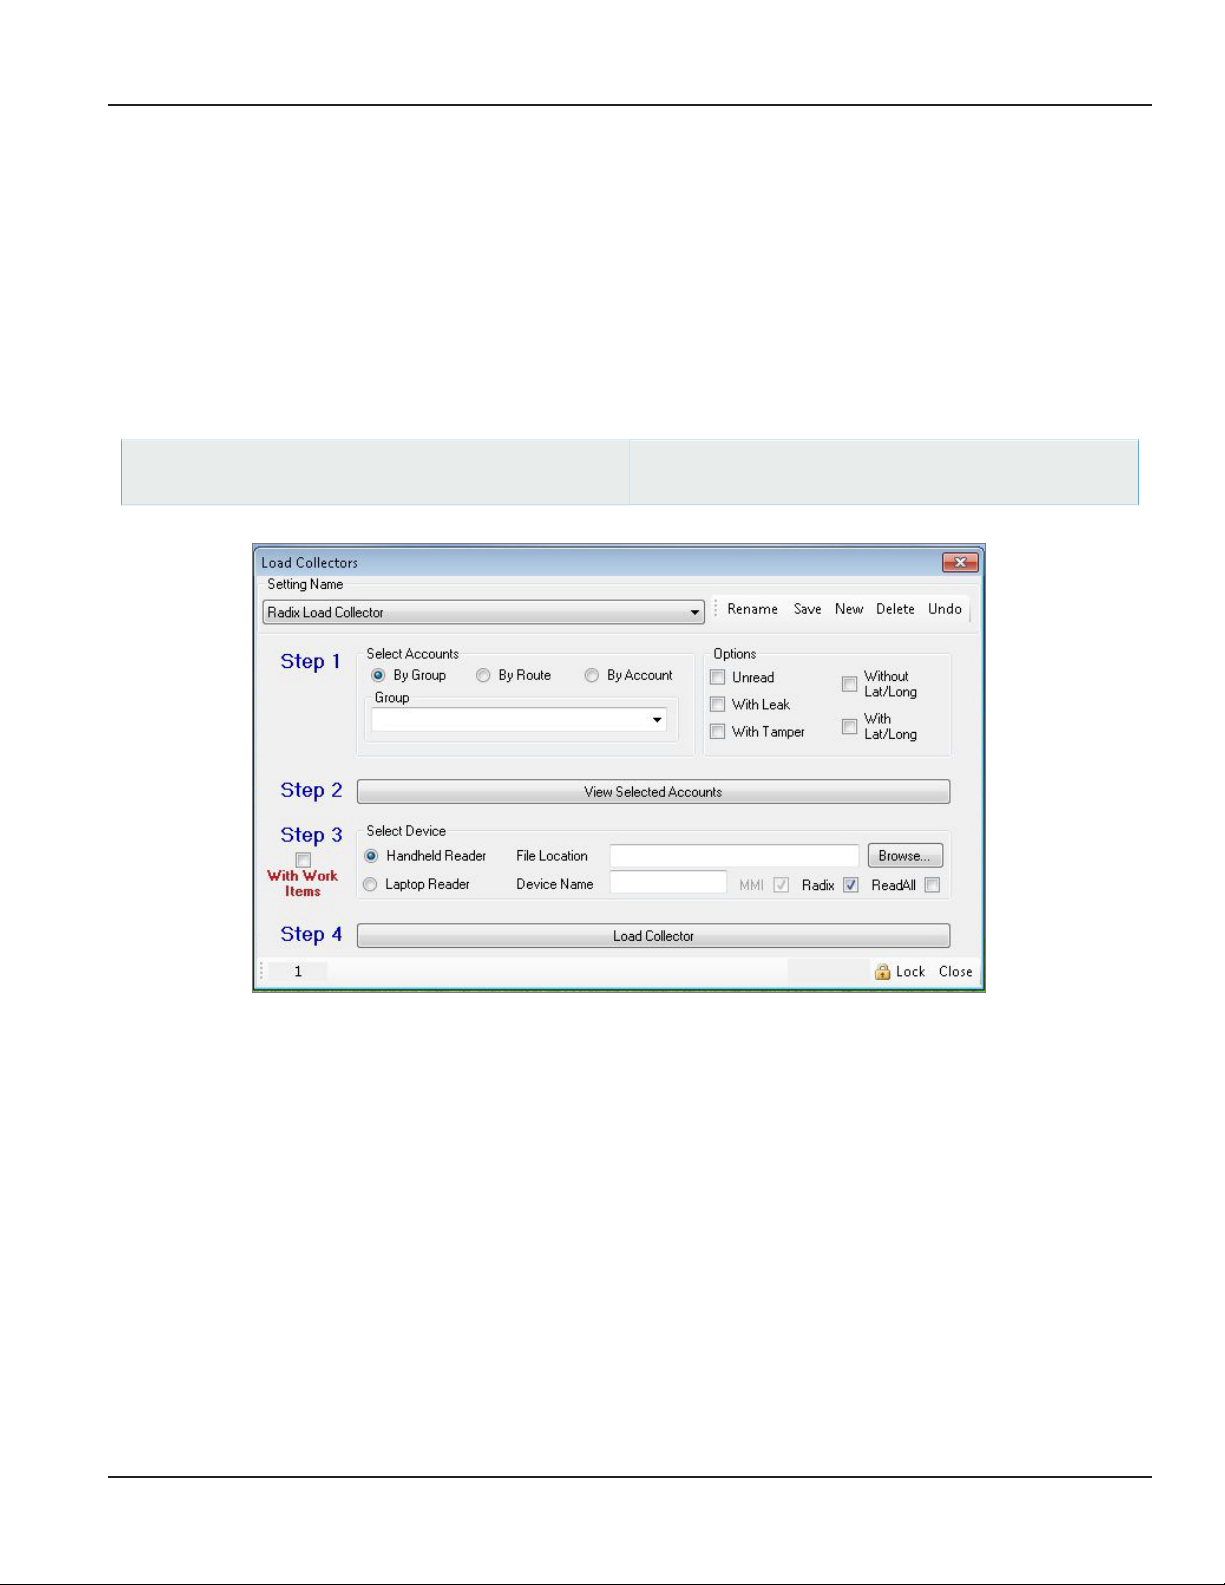
User Manual
RADIX HANDHELD FILE TRANSFER
Mobile Only: This section is intended for customers with a mobile network. Customers using ReadCenter Analytics exclusively
for a fixed network may skip this section.
When the Radix check box is selected, ReadCenter Analytics or Analytics Mobile activates the Radix File Transfer process to
communicate to and from the Radix handheld. A direct connection must be set up in advance to support the communication.
See the documents RAD-IOM-02 Radix Data Collector Main Line and Secondary Loader-Charger Installation & Operation
Manual, or RAD-IOM-03 Radix Data Collector Cascade Loader-Charger Installation & Operation Manual for details. The
configuration option to support Radix file transfer and the direct connection are set up during initial training.
Load Collectors - Radix
ReadCenter Analytics
Route Reading> Load Collectors
If the configuration option to support Radix file transfer is set, the Radix check box will be shown on the screen for Load
Collectors and Unload Collectors when the Handheld Reader device is chosen.
ReadCenter Analytics Mobile
Meter Reading Cycle> Load Collectors
Before starting with Step 1, go to System Configuration> General in the main tool bar and make sure the Radix/MMI/
ReadAll File Transfer configuration option is selected.
Step 1 Select accounts to be loaded.
Step 2 Click View Selected Accounts to verify the chosen accounts.
Step 3 Select the Handheld Reader device, check the Radix box, and enter the File Location where the information will
be sent. You may also click Browse to look for the File Location.
OTE:N Do not check "With Work Items."
Step 4 Click Load Collector to send the file to the designated location and activate the Radix File Transfer process.
Page 99 June 2014
Page 100

ReadCenter® Analytics & Analytics Mobile
Unload Collectors – Radix
ReadCenter Analytics
Route Reading> Unload Collectors
ReadCenter Analytics Mobile
Meter Reading Cycle> Unload Collectors
Step 1 Select Handheld Reader, check the Radix box, and enter the File Location where information from the
Radix will be sent. You may also click Browse to look for the File Location.
OTE:N Do not check "With Work Items."
Step 2 Click Unload Collector to activate the Radix File Transfer process. When the process completes and the unload
file is ready for the next step, a message is displayed in red as shown here.
Step 3 Click View Unloaded Readings to verify that the account information was retrieved from the reading device.
Information at this point is in a raw data format from the collector. Once updated in Step 4, the billing resolution
and test circle code will be applied.
Step 4 Click Update Accounts to store the current reading data in ReadCenter Analytics or Analytics Mobile and apply the
billing resolution and test circle code.
Page 100 June 2014
 Loading...