

Page 1

Portable Combustion Analyzer
Instruction 24-9448
Operation & Maintenance
Rev. 1 - October 2006
Product Leadership • Training • Service • Reliability
Page 2

WARRANTY
Bacharach, Inc. warrants to Buyer that at the time of delivery this Product will be free from defects in material
and manufacture and will conform substantially to Bacharach Inc.’s applicable specifications. Bacharach’s
liability and Buyer’s remedy under this warranty are limited to the repair or replacement, at Bacharach’s option,
of this Product or parts thereof returned to Seller at the factory of manufacture and shown to Bacharach Inc.’s
reasonable satisfaction to have been defective; provided that written notice of the defect shall have been given
by Buyer to Bacharach Inc. within two (2) years after the date of delivery of this Product by Bacharach, Inc.
The Oxygen (O2) sensor has a limited warranty of one (1) year. Routine service and calibration are excluded
from this warranty.
Bacharach, Inc. warrants to Buyer that it will convey good title to this Product. Bacharach’s liability and Buyer’s
remedy under this warranty of title are limited to the removal of any title defects or, at the election of Bacharach,
to the replacement of this Product or parts thereof that are defective in title.
THE FOREGOING WARRANTIES ARE EXCLUSIVE AND ARE GIVEN AND ACCEPTED IN LIEU OF (I) ANY
AND ALL OTHER WARRANTIES, EXPRESS OR IMPLIED, INCLUDING WITHOUT LIMITATION THE IMPLIED WARRANTIES OF MERCHANTABILITY AND FITNESS FOR A PARTICULAR PURPOSE: AND (II) ANY
OBLIGATION, LIABILITY, RIGHT, CLAIM OR REMEDY IN CONTRACT OR TORT, WHETHER OR NOT ARIS
ING FROM BACHARACH’S NEGLIGENCE, ACTUAL OR IMPLIED. The remedies of the Buyer shall be limited
to those provided herein to the exclusion of any and all other remedies including, without limitation incidental or
consequential damages. No agreement varying or extending the foregoing warranties, remedies or this limita
tion will be binding upon Bacharach, Inc. unless in writing, signed by a duly authorized officer of Bacharach.
-
Register Your Warranty by Visiting
www.bacharach-inc.com
-
Notice:
Product improvements and enhancements are continuous, therefore the specifications and information
contained in this document may change without notice.
Bacharach, Inc. shall not be liable for errors contained herein or for incidental or consequential damages in
connection with the furnishing, performance, or use of this material.
No part of this document may be photocopied, reproduced, or translated to another language without the prior
written consent of Bacharach, Inc.
Copyright © 2006, Bacharach, Inc., all rights reserved.
BACHARACH is a registered trademark of Bacharach, Inc. All other trademarks,
trade names, service marks and logos referenced herein belong to their respective companies.
A
Instruction 24-9448
Page 3

Contents
Contents
1 Introduction . . . . . . . . . . . . . . . . . . . . . . . . . . . . . . . . . . 1-1
1.1 PCA 2 General Description . . . . . . . . . . . . . . . . . . . . . . . . . . . . . . .1-1
1.2 Sales Combo & Model Configurations . . . . . . . . . . . . . . . . . . . . . . 1-2
1.3 Features & Benefits . . . . . . . . . . . . . . . . . . . . . . . . . . . . . . . . . . . .1-4
1.4 Operational Overview . . . . . . . . . . . . . . . . . . . . . . . . . . . . . . . . . . .1-5
1.5 Connector Descriptions . . . . . . . . . . . . . . . . . . . . . . . . . . . . . . . . . .1-6
1.5.1 Probe Connections (Gas, Pressure, T-Stack) . . . . . . . . . . . .1-6
1.5.2 T-AIR (Primary Air Thermocouple) . . . . . . . . . . . . . . . . . . .1-6
1.5.3 POWER (AC Adapter) . . . . . . . . . . . . . . . . . . . . . . . . . . . . .1-8
1.5.4 ∆P (Differential Pressure) . . . . . . . . . . . . . . . . . . . . . . . . . .1-8
1.5.5 USB (Computer Interface) . . . . . . . . . . . . . . . . . . . . . . . . . .1-8
1.5.6 IrDA (Printer Interface) . . . . . . . . . . . . . . . . . . . . . . . . . . . .1-8
1.5.7 OPT (Option) . . . . . . . . . . . . . . . . . . . . . . . . . . . . . . . . . . . . .1-8
1.6 Front Panel Buttons . . . . . . . . . . . . . . . . . . . . . . . . . . . . . . . . . . . .1-9
2 Specications . . . . . . . . . . . . . . . . . . . . . . . . . . . . . . . . . 2-1
3 Initial Setup . . . . . . . . . . . . . . . . . . . . . . . . . . . . . . . . . . 3-1
3.1 Scope . . . . . . . . . . . . . . . . . . . . . . . . . . . . . . . . . . . . . . . . . . . . . . . .3-1
3.2 Power . . . . . . . . . . . . . . . . . . . . . . . . . . . . . . . . . . . . . . . . . . . . . . . .3-1
3.2.1 Installing or Replacing Batteries . . . . . . . . . . . . . . . . . . . . .3-1
3.2.2 Using the AC Power Adapter . . . . . . . . . . . . . . . . . . . . . . . .3-2
3.3 Connecting the Probe and Hose Assembly . . . . . . . . . . . . . . . . . . . . . 3-2
3.4 Operating Parameters . . . . . . . . . . . . . . . . . . . . . . . . . . . . . . . . . . 3-4
3.5 Fuel Selection . . . . . . . . . . . . . . . . . . . . . . . . . . . . . . . . . . . . . . . . 3-4
3.6 Temperature Units Selection . . . . . . . . . . . . . . . . . . . . . . . . . . . . 3-5
3.7 Pressure Units Selection . . . . . . . . . . . . . . . . . . . . . . . . . . . . . . . . 3-6
3.8 Pollution Units Selection . . . . . . . . . . . . . . . . . . . . . . . . . . . . . . . . .3-7
3.9 Date Setup . . . . . . . . . . . . . . . . . . . . . . . . . . . . . . . . . . . . . . . . . . . 3-8
3.10 Time Setup . . . . . . . . . . . . . . . . . . . . . . . . . . . . . . . . . . . . . . . . . . 3-9
3.11 O2 Reference Setup . . . . . . . . . . . . . . . . . . . . . . . . . . . . . . . . . . .3-10
3.12 Print Pressure Selection . . . . . . . . . . . . . . . . . . . . . . . . . . . . . . .3-11
3.13 Zoom-Display Selection . . . . . . . . . . . . . . . . . . . . . . . . . . . . . . . .3-12
3.14 Battery Charger Selection . . . . . . . . . . . . . . . . . . . . . . . . . . . . . .3-13
3.15 Logging Selection . . . . . . . . . . . . . . . . . . . . . . . . . . . . . . . . . . . .3-14
3.16 Button Sound . . . . . . . . . . . . . . . . . . . . . . . . . . . . . . . . . . . . . . . .3-14
Instruction 24-9448
i
Page 4

Contents
4 Operation . . . . . . . . . . . . . . . . . . . . . . . . . . . . . . . . . . . . 4-1
4.1 Operating Tips . . . . . . . . . . . . . . . . . . . . . . . . . . . . . . . . . . . . . . . . .4-1
4.2 Turning ON the Analyzer and Warm Up . . . . . . . . . . . . . . . . . . .4-2
4.3 Selecting a Fuel . . . . . . . . . . . . . . . . . . . . . . . . . . . . . . . . . . . . . . . 4-3
4.4 Sampling Point . . . . . . . . . . . . . . . . . . . . . . . . . . . . . . . . . . . . . . . 4-4
4.5 Performing a Combustion Test . . . . . . . . . . . . . . . . . . . . . . . . . . . 4-5
4.6 Making a Draft / Pressure Measurement . . . . . . . . . . . . . . . . . . .4-7
4.7 Saving Test Data . . . . . . . . . . . . . . . . . . . . . . . . . . . . . . . . . . . . . . 4-8
4.8 Ending a Combustion Test . . . . . . . . . . . . . . . . . . . . . . . . . . . . . . 4-9
4.9 Emptying the Water Trap . . . . . . . . . . . . . . . . . . . . . . . . . . . . . . . 4-9
4.10 Turning OFF the Analyzer & Purging. . . . . . . . . . . . . . . . . . . .4-10
4.11 Low Battery Alarm . . . . . . . . . . . . . . . . . . . . . . . . . . . . . . . . . . .4-10
4.12 Data Logging . . . . . . . . . . . . . . . . . . . . . . . . . . . . . . . . . . . . . . . . 4-11
4.12.1 Turning ON Data Logging . . . . . . . . . . . . . . . . . . . . . . . .4-12
4.12.2 Setting the Logging Interval and Duration . . . . . . . . . .4-13
4.12.3 Starting the Data Logging Process . . . . . . . . . . . . . . . . .4-14
4.12.4 Ending the Data Logging Process . . . . . . . . . . . . . . . . . .4-15
4.13 Memory . . . . . . . . . . . . . . . . . . . . . . . . . . . . . . . . . . . . . . . . . . . .4-15
4.13.1 Recalling Combustion Test Data . . . . . . . . . . . . . . . . . . .4-16
4.13.2 Recalling Logged Test Data . . . . . . . . . . . . . . . . . . . . . . .4-17
4.13.3 Clearing Memory . . . . . . . . . . . . . . . . . . . . . . . . . . . . . . .4-18
4.14 Downloading Stored Data to a Computer . . . . . . . . . . . . . . . . . .4-19
4.14.1 PCA 2 Data Recovery Program Installation . . . . . . . . . 4-20
4.14.2 Computer to PCA 2 Connection & USB Device Driver In-
stallation . . . . . . . . . . . . . . . . . . . . . . . . . . . . . . . . . . . . . . . . . . . 4-22
4.14.3 Recovering Data . . . . . . . . . . . . . . . . . . . . . . . . . . . . . . . 4-24
4.14.4 Unplugging the USB Cable . . . . . . . . . . . . . . . . . . . . . . . .4-27
4.15 Importing Saved Data Into a Spreadsheet . . . . . . . . . . . . . . . . . .4-28
4.16 Printing Test Data . . . . . . . . . . . . . . . . . . . . . . . . . . . . . . . . . . . 4-30
5 Calibration . . . . . . . . . . . . . . . . . . . . . . . . . . . . . . . . . . . 5-1
5.1 Smart Sensors . . . . . . . . . . . . . . . . . . . . . . . . . . . . . . . . . . . . . . . . .5-1
5.2 Starting a Calibration . . . . . . . . . . . . . . . . . . . . . . . . . . . . . . . . . . .5-1
5.3 Pressure Sensor Calibration . . . . . . . . . . . . . . . . . . . . . . . . . . . . . 5-2
5.4 T-Stack Calibration . . . . . . . . . . . . . . . . . . . . . . . . . . . . . . . . . . . . 5-4
5.5 T-Air Calibration . . . . . . . . . . . . . . . . . . . . . . . . . . . . . . . . . . . . . . 5-6
5.6 CO-LO Sensor Calibration . . . . . . . . . . . . . . . . . . . . . . . . . . . . . . 5-8
5.7 SO2 Sensor Calibration . . . . . . . . . . . . . . . . . . . . . . . . . . . . . . . . .5-10
5.8 NO Sensor Calibration . . . . . . . . . . . . . . . . . . . . . . . . . . . . . . . . .5-11
5.9 NO2 Sensor Calibration . . . . . . . . . . . . . . . . . . . . . . . . . . . . . . . . .5-12
5.10 CO-HI Sensor Calibration . . . . . . . . . . . . . . . . . . . . . . . . . . . . . .5-13
ii
Instruction 24-9448
Page 5

Contents
6 Maintenance . . . . . . . . . . . . . . . . . . . . . . . . . . . . . . . . . . 6-1
6.1 PCA 2 Disassembly . . . . . . . . . . . . . . . . . . . . . . . . . . . . . . . . . . . . 6-2
6.2 Water Trap / Filter Maintenance . . . . . . . . . . . . . . . . . . . . . . . . . 6-6
6.2.1 Emptying the Water Trap Chamber . . . . . . . . . . . . . . . . . 6-6
6.2.2 Replacing the Filter Element . . . . . . . . . . . . . . . . . . . . . . . 6-6
6.3 Smart Sensor Replacement . . . . . . . . . . . . . . . . . . . . . . . . . . . . . . .6-7
6.4 Sensor Only Replacement . . . . . . . . . . . . . . . . . . . . . . . . . . . . . . . 6-8
6.5 Nitric Oxide Sensor Battery Replacement . . . . . . . . . . . . . . . . . .6-10
6.6 Thermocouple Replacement . . . . . . . . . . . . . . . . . . . . . . . . . . . . .6-11
6.7 Pump Replacement . . . . . . . . . . . . . . . . . . . . . . . . . . . . . . . . . . . .6-13
6.8 Cleaning the Probe . . . . . . . . . . . . . . . . . . . . . . . . . . . . . . . . . . . . 6-14
7 Troubleshooting . . . . . . . . . . . . . . . . . . . . . . . . . . . . . . 7-1
7.1 Analyzer Repair . . . . . . . . . . . . . . . . . . . . . . . . . . . . . . . . . . . . . . . . 7-1
7.2 Error Symbols . . . . . . . . . . . . . . . . . . . . . . . . . . . . . . . . . . . . . . . . .7-1
7.3 Error Messages Displayed After Warm-Up . . . . . . . . . . . . . . . . . .7-2
7.4 Diagnostics and Status Screens . . . . . . . . . . . . . . . . . . . . . . . . . . .7-3
8 Parts & Service . . . . . . . . . . . . . . . . . . . . . . . . . . . . . . . 8-1
8.1 Replacement Parts . . . . . . . . . . . . . . . . . . . . . . . . . . . . . . . . . . . . . .8-1
8.2 Accessories . . . . . . . . . . . . . . . . . . . . . . . . . . . . . . . . . . . . . . . . . . . 8-5
8.3 Service Centers . . . . . . . . . . . . . . . . . . . . . . . . . . . . . . . . . . . . . . . .8-7
Instruction 24-9448
iii
Page 6

Contents
Notes:
iv
Instruction 24-9448
Page 7

Introduction
1 Introduction
1.1 PCA 2 General Description
The PCA 2 is a commercial-grade hand-held combustion and emissions
analyzer designed for on-demand sampling of light industrial, institutional, commercial and residential furnaces, appliances, and boilers. The
basic instrument is supplied with a probe and hose assembly, instruction
manual, factory calibrated smart sensors, 4 'A A' alkaline batteries, Data
Download Software with USB cable and carrying case.
Because of the PCA 2’s ability to measure up to four gases simultaneously,
it is the perfect tool for service technicians, inspectors and boiler contractors who need to determine combustion efficiency, excess air, stack gas O2
and CO levels, stack temperature, draft, and differential pressure. The
analyzer can also directly measure and display NO, NO2 and SO2 with the
installation of the appropriate sensors. Combustion efficiency calculations
can be conducted for the following fuels: natural gas, oil #2, oil #4, oil #6,
propane, coal, wood, kerosene, bagasse, and digester gas. A large backlit
graphical display shows up to eight combustion test values simultaneously,
and includes a zoom capability that provides an extra large display of just
the O2, CO, and combustion efficiency values.
Smart sensor technology allows a new sensor to be installed in the field
without having to calibrate the analyzer before use. New and innovative
probe and analyzer designs allow the PCA 2 to be easily serviced, thus
lowering the cost of ownership.
Advanced data storage and communication features allow the operator
to store up to 500 individual combustion test records, which can later be
recalled for viewing, printing, or downloading to a personal computer. In
its data logging mode, the analyzer can store an additional 500 data logged
records.
An optional AC power adapter allows the analyzer to run continuously for
data logging purposes.
The optional sample conditioning probe is recommended when measuring
NO2 and SO2 to ensure the highest degree of measurement accuracy.
Instruction 24-9448 1-1
Page 8

Introduction
1.2 Sales Combo & Model Configurations
Sales Combo 24-8350 24-8351 24-8352
Sales Combo (Kit) 24-8370 24-8371 24-8372
Model Type 225 235 245
PCA2 Only Part Number 24-7301 24-7302 24-7303
Measurements
Oxygen (O2)
Stack Temperature
Primary / Ambient Air Temperature
Carbon Monoxide Low (CO
Low
)
Pressure / Draft
Carbon Monoxide High (CO
High
)
Nitric Oxide (NO)
Nitrogen Dioxide (NO
)
2
Sulfur Dioxide (SO2)
Calculations
Combustion Efciency
Excess Air
Carbon Dioxide (CO
)
2
NOx (NOx = NO + NO2)
NOx referenced to %O
CO referenced to %O
NO referenced to %O
NO2 referenced to %O
SO2 referenced to %O
2
2
2
2
2
3 3 3
3 3 3
3 3 3
3 3 3
3 3 3
3
3
3 3 3
3 3 3
3 3 3
3 3 3
3
Refer to Section 8.2 for a listing of standard and optional accessories.
Instruction 24-94481-2
Page 9

Introduction
Sales Combo 24-8353 24-8354 24-8355
Sales Combo (Kit) 24-8373 24-8374 24-8375
Model Type 255 265 275
PCA2 Only Part Number 24-7304 24-7305 24-7306
Measurements
Oxygen (O2)
Stack Temperature
Primary / Ambient Air Temperature
Carbon Monoxide Low (CO
Low
)
Pressure / Draft
Carbon Monoxide High (CO
High
)
Nitric Oxide (NO)
Nitrogen Dioxide (NO
Sulfur Dioxide (SO
)
2
)
2
3 3 3
3 3 3
3 3 3
3 3 3
3 3 3
3 3
3
3 3
Calculations
Combustion Efciency
Excess Air
Carbon Dioxide (CO
)
2
NOx (NOx = NO + NO2)
NOx referenced to %O
CO referenced to %O
NO referenced to %O
NO2 referenced to %O
SO2 referenced to %O
2
2
2
2
2
3 3 3
3 3 3
3 3 3
3
3
3 3 3
3 3
3
3 3
Instruction 24-9448 1-3
Page 10

Introduction
1.3 Features & Benefits
• Powered by 4 ‘AA’ alkaline batteries, or NiMH rechargeable batteries.
An optional AC power adapter provides continuous operation.
• Internal charging circuit allows rechargeable batteries to be charged
inside the analyzer with the use of the optional AC power adapter.
• O2 and CO
two additional gases: CO
measurement standard. Optional measurement of up to
Low
, NO, NO2, or SO2.
High
• With the appropriate sensors installed, the analyzer optionally displays pollution conversions for CO, NO, NO2, and SO2. Pollution conversions include ppm, #/MBTU, mg/m3, and g/GJ.
• Smart sensor technology allows pre-calibrated sensors to be installed
in the field.
• Automatic zero of all sensing channels on ambient air when the analyzer is first turned ON.
• Automatic flushing of the CO
exceeds 4,000 ppm, thus protecting the CO
sensor with fresh air if the CO level
Low
sensor from high CO
Low
levels. To measure CO levels above 4,000 ppm, the analyzer automatically switches to its CO
sensor, if installed.
High
• Automatic purging of the gas-sample system if the detected gas levels
are abnormally high when the analyzer is turned OFF.
• Displays temperatures in either °F or °C.
• Displays pressure in either inwc, mb, Pa, or hPa.
• Backlit LCD and push buttons.
• Low battery alarm.
• Stores 500 individual combustion records, which can later be recalled
for viewing, printing, or downloading to a personal computer. Stores an
additional 500 data logged records.
• Wireless IrDA link used for printing current and stored combustion
records, pressure records, sensor calibration data, and diagnostic data.
• USB connectivity for downloading stored data to a personal computer.
• Field replaceable sensors and thermocouple.
• Two year warranty on analyzer and all gas sensors except the O2 sensor which has a one (1) year warranty.
Instruction 24-94481-4
Page 11

Introduction
1.4 Operational Overview
The PCA 2 is powered by either its 4 internal batteries, or by an optional
AC power adapter that operates from any convenient source of 100–
240 VAC, 50/60 Hz power. The type of batteries used can be either disposable alkaline or rechargeable NiMH. Note that rechargeable batteries can
be charged inside the analyzer using the optional AC power adapter.
The PCA 2 is controlled by 11 front panel push buttons, while a graphical
LCD is used to display all combustion and emission test data and analyzer
parameters.
A probe and hose assembly, with an integral thermocouple and filter/water-trap connect to the bottom of the analyzer, thus providing the means of
drawing in gas samples, and for measuring stack temperature and draft.
The PCA 2 is turned ON by pressing its red I/O button. A warm-up period
of 60 seconds then begins, during which time the analyzer performs self
diagnostics. At the end of the warm-up period, if no errors were detected
the message “NO ERRORS DETECTED” is briefly displayed followed by
the display of the Combustion Test HOLD screen. If errors were detected,
the message “ERRORS DETECTED” is displayed along with a list of the
errors. These errors must be corrected before proceeding with the combustion test.
Before starting a test be sure to select the fuel being burned. The default
fuel selected is Natural Gas. Note that the name of the fuel being burned
is indicated at the top of the display. To change the fuel: first, press the
MENU (F2) button; next, select FUEL from the menu; then use the but-
tons to highlight the fuel being burned; and finally, press the green ENT
button to select the highlighted fuel.
To assure correct combustion-efficiency calculations, the analyzer must
know the burner’s primary-air temperature. The analyzer normally uses
its internal temperature sensor for the primary-air temperature value, but
this method is only acceptable if the burner is using ambient room air. If
the burner is drawing in cold outside air, we recommend that the optional TAIR thermocouple be used. This thermocouple plugs into the bottom of the
analyzer and is placed in the burner’s primary-air stream.
Begin the combustion test by first inserting the analyzer’s probe tube into
the stack-gas stream of the appliance under test, and then pressing the
RUN/HOLD button to display the Combustion Test RUN screen. The analyzer will begin to continuously monitor the stack temperature, %O2 and
Instruction 24-9448 1-5
Page 12

Introduction
emission levels in the stack gas and then display measured and calculated
values on its LCD. Values are listed in Section 2 Specifications.
During a test, the CO
automatically flushed with fresh air when the detected CO level exceeds
4,000 ppm. The analyzer will automatically start using its optional CO-
sensor, if installed, at CO levels starting at 4,001 ppm, thus providing
High
continuous CO readings up to 20,000 ppm.
A backlight enables a user to read the display in dimly-lit areas. Turn the
backlight ON and OFF by briefly pressing the I/O button.
The analyzer is turned OFF by pressing and holding down the I/O button
for at least 2 seconds. Note that there is a 5-second delay before the analyzer actually turns OFF, during which time the analyzer can be turned back
ON by pressing the RUN/HOLD button. In addition, there is a gas-purge
feature that keeps the analyzer’s pump running if the gas level inside the
sensor chambers is abnormally high at shutdown. With the probe removed
from the stack and sampling fresh air, the analyzer purges itself until the
detected gas concentrations drop below predetermined levels.
sensor is protected from high CO levels by being
Low
1.5 Connector Descriptions
1.5.1 Probe Connections (Gas, Pressure, T-Stack)
Attach the probe and hose assembly to the analyzer by connecting its . . .
• stack-gas thermocouple to the analyzer's T-STACK connector,
• stack-gas hose to the analyzer's GAS connector,
• draft hose to the analyzer's +∆P connector.
Observe that the probe connectors are of different sizes and shapes, which
prevent incorrect connection to their associated connectors on the analyzer.
1.5.2 T-AIR (Primary Air Thermocouple)
If thermocouple P/N 104-1797 (10 feet long) or Utility Wand P/N 104-1799
(12 inch ridged probe with handle and 5 foot coiled cable) is to be used
to measure the burner’s primary air temperature, then connect either of
these thermocouples to the analyzer’s T-AIR connector.
Instruction 24-94481-6
Page 13
Introduction
T-STACK T-AIR
IrDA – Wireless printer
communications port
ENT:
• Selects a highlighted
menu item, or conrms the
entry of data
• Switches among the
Combustion & Emission
Test Screens when in the
RUN or HOLD mode
RUN / HOLD:
• Starts and stops a combustion
efciency test
• Pressing this button during
the 5 second turn-off period will
keep the analyzer turned ON
ESC – Displays previous menu
or previously viewed screen
I/O – Press from between
1 and 2 seconds to turn
analyzer ON and OFF
– With analyzer turned
ON, press briey to turn
backlight ON and OFF
LCD – 160 x 160
graphic display
F1 / F2 / F3 –
Soft Menu Buttons,
whose functions are
dened by labels
appearing above them
on LCD
USB – Computer
communications
connector
Arrow Buttons:
– Moves cursor
up the display,
or increments an
alphanumerical value
– Moves cursor
down the display,
or decrements an
alphanumerical value
– Moves cursor left,
or moves to top of
menu list
– Moves cursor right,
or moves to bottom of
menu list
T-STACK – Probe’s stack-gas
thermocouple connector
OPT – Option external
measurement connector
T-AIR – Primary /
POWER – AC power adapter
connector
ambient air thermocouple connector
GAS – Probe’s gas
hose connector
“+∆P” Probe’s draft
hose tting
“–∆P” Reference
pressure hose tting
Figure 1-1. PCA 2 Components
Instruction 24-9448 1-7
Page 14

Introduction
1.5.3 POWER (AC Adapter)
The AC power adapter P/N 24-1404 can be used as an external power supply, which will run the analyzer on a continuous basis.
When using rechargeable NiMH batteries, the AC power adapter can also
be used to charge the batteries while inside the analyzer. The analyzer’s
rapid-charger circuit, however, must first be turned ON per Section 3.14.
The rapid charger will charge a set of depleted batteries in approximately
2 - 3 hours.
When disposable alkaline batteries are used, the analyzer’s battery charger circuit must be OFF to prevent the batteries from overheating. As a
precaution, the charger circuit is automatically toggled back to its OFF
state when the analyzer is turned OFF.
1.5.4 ∆P (Differential Pressure)
Draft is measured by connecting the probe’s draft hose to the +∆P fitting,
while leaving the –∆P fitting open to the atmosphere.
In addition to measuring draft, the “+” and “–” ∆P fittings can also be used
to measure the differential pressure between two areas by first connecting
a hose P/N 24-1103 to the –∆P fitting, and then inserting the open end of
this hose into the area being used as the reference pressure. The analyzer’s
probe is then inserted into the area who’s differential pressure is to be
measured. Refer to Section 4.6.
1.5.5 USB (Computer Interface)
Data that has been stored in the analyzer’s memory can be downloaded to
a personal computer by connecting USB data cable P/N 104-4032 between
the USB ports of the computer and analyzer. Refer to Section 4.14.2.
1.5.6 IrDA (Printer Interface)
Data that has been stored in the analyzer’s memory can be printed on a
compatible IrDA wireless printer by aligning their IrDA communication
ports. Refer to Section 4.16.
1.5.7 OPT (Option)
The option connector is used for optional external measurement features.
Instruction 24-94481-8
Page 15
Introduction
1.6 Front Panel Buttons
Descriptions of the front panel buttons are given below. Note that a control
may perform multiple functions as determined by what screen is being
displayed at the time.
The functions of these buttons are defined by labels appearing above them on the LCD. The labels that appear
depend on the functions that can be performed in the
particular screen being displayed.
PRINT (F1): Transmits the data displayed on the screen
to a printer through the IrDA communications port.
MENU (F2): Displays the Main Menu.
SAVE (F3): Saves the data currently displayed on the
LCD in memory. Up to 500 individual Combustion Test
and Pressure records can be saved. After which, the oldest data will be overwritten.
ZERO (F2): When viewing the Pressure screen, this
button zeros the pressure sensor to current atmospheric
conditions.
PAGE– (F1): When viewing the Memory or Logging
Directory, each press of this button pages down through
the directory. Holding this button down speeds up the
paging process.
PAGE+ (F3): When viewing the Memory or Logging
Directory, each press of this button pages up through
the directory. Holding this button down speeds up the
paging process.
The arrow buttons move the cursor on the LCD in the direction of the arrow. In screens that require the entry of
alphanumerical data, use the buttons to move cursor
across the screen and then use the buttons to increment and decrement the data. When viewing a menu, use
the buttons to quickly move to the top and bottom of
the menu.
Instruction 24-9448 1-9
Page 16

Introduction
Selects a highlighted menu. In addition, if changes were
made to one of the analyzer’s operating parameters (e.g.,
date, time, O2 reference, etc.), pressing this button confirms those changes and saves them in memory.
Starts and stops a combustion test when the Combustion Test screen is displayed. Pressing this button in any
other screen returns the analyzer to the Combustion Test
HOLD screen. Pressing this button during the 5 second
turn-off-delay period will abort the turn-off process and
also return the analyzer to the Combustion Test HOLD
screen.
Displays a previously viewed screen. In addition, if
changes were made to one of the analyzer’s operating
parameters (e.g., date, time, O2 reference, etc.), pressing
this button aborts those changes, restores the old values,
and then displays the previously viewed screen.
Turns the analyzer ON and OFF, and is also used to
turn the backlight and button LEDs ON and OFF.
Note that when the analyzer is turned OFF, there is a
5 second delay, during which time an operator can keep
the analyzer turned ON by pressing the RUN / HOLD
button. Also note that if the measured emission levels
are above predetermined limits at the time the instrument is turned OFF, the pump is automatically started
and purges the sensor compartment with fresh air until
the gas levels inside the analyzer are reduced. If desired,
the purging process can be aborted by again pressing the
I/O button.
Instruction 24-94481-10
Page 17

Specications
2 Specifications
The PCA 2 Directly Measures and Displays:
The gases displayed depend on the analyzer’s model number.
Refer to Section 1.2.
Oxygen . . . . . . . . . . . . . . . . . . . . . . . . . . . . . . . . . . . . . . . . . . . . . . 0 to 20.9%
Stack Temperature . . . . . . . . . . . . . . . . . . . . –4 to 2,192 ºF (–20 to 1,200 ºC)
Primary / Ambient Air Temperature . . . . . . . . –4 to 999 ºF (–20 to 537 ºC)
Carbon Monoxide (CO) (H2 compensated) . . . . . . . . . . . . . . . .0 to 4,000 ppm
Pressure / Draft . . . . . . . . . . . . . . . . . . . . . . . . . . . . . . . . ±72 "H2O (±180 mb)
CO High Range . . . . . . . . . . . . . . . . . . . . . . . . . . . . . . . 4,001 to 20,000 ppm
Nitric Oxide (NO) . . . . . . . . . . . . . . . . . . . . . . . . . . . . . . . . . . .0 to 3,000 ppm
Nitrogen Dioxide (NO2) . . . . . . . . . . . . . . . . . . . . . . . . . . . . . . . 0 to 500 ppm
Sulfur Dioxide (SO2) . . . . . . . . . . . . . . . . . . . . . . . . . . . . . . . .0 to 5,000 ppm
The PCA 2 Calculates and Displays:
Calculations are performed only when the measured oxygen level is below
16.0%, and the stack temperature is below 2,000 °F (1,093 ºC).
Combustion Efficiency . . . . . . . . . . . . . . . . . . . . . . . . . . . . . . . . . .0.1 to 100%
Excess Air . . . . . . . . . . . . . . . . . . . . . . . . . . . . . . . . . . . . . . . . . . . . . 1 to 250%
Carbon Dioxide (dry basis) . . . . . . . . . . 0.1 to fuel dependent maximum in %
NOx (NOx = NO + NO2) . . . . . . . . . . . . . . . . . . . . . . . . . . . . . . 0 to 3,500 ppm
NOx referenced to %O2 . . . . . . . . . . . . . . . . . . . . . . . . . . . . . . 0 to 9,999 ppm
CO referenced to %O2 . . . . . . . . . . . . . . . . . . . . . . . . . . . . . . . . 0 to 9,999 ppm
NO reference to %O2 . . . . . . . . . . . . . . . . . . . . . . . . . . . . . . . . 0 to 9,999 ppm
NO2 reference to %O2 . . . . . . . . . . . . . . . . . . . . . . . . . . . . . . . . 0 to 9,999 ppm
SO2 reference to %O2 . . . . . . . . . . . . . . . . . . . . . . . . . . . . . . . . 0 to 9,999 ppm
Fuels Available for Combustion Calculations:
• Natural Gas • Coal
• Oil #2 • Wood
• Oil #4 • Kerosene
• Oil #6 • Bagasse
• Propane • Digester Gas
Instruction 24-9448 2-1
Page 18

Specications
Normal Operating Conditions:
Temperature:
Analyzer . . . . . . . . . . . . . . . . . . . . . . . . . . . . . . . 32 to 104 ºF (0 to 40 ºC)
Probe Tip . . . . . . . . . . . . . . . . . . . . . . . . . . . . . . . . .1,472 ºF (800 ºC) Max.
Humidity:
Analyzer . . . . . . . . . . . . . .15 to 90% Relative Humidity, non-condensing
Air Pressure:
Analyzer . . . . . . . . . . . . . . . . . . . . . . . . . . . . . . . . . . . . . . . . .Atmospheric
Probe . . . . . . . . . . . . . . . . . . . . . 10" H2O (25 mb) draft max. at probe tip
Performance:
Accuracy:
O2 . . . . . . . . . . . . . . . . . . . . . . . . . . . . .±0.3% O2 on practical concentrations
of stack gas (mix of O2, CO2 and N2)
CO . . . . . . . . . . . . . . . . . . . . . . . . . . ±5% of reading or ±10 ppm,
whichever is greater between
0–2,000 ppm, and ±10% of reading
between 2,001–20,000 ppm.
NO . . . . . . . . . . . . . . . . . . . . . . . . . . ±5% of reading or ±5 ppm,
whichever is greater between
0–2,000 ppm
NO2 . . . . . . . . . . . . . . . . . . . . . . . . . ±5% of reading or ±5 ppm,
whichever is greater between
0–500 ppm
SO2 . . . . . . . . . . . . . . . . . . . . . . . . . ±5% of reading or ±10 ppm,
whichever is greater between
0–2,000 ppm
Stack Gas Temp. . . . . . . . . . . . . . . . ±4 ºF between 32 and 255 ºF
(±2 ºC between 0 and 124 ºC)
±6 ºF between 256 and 480 ºF
(±3 ºC between 125 and 249 ºC)
±8 ºF between 481 and 752 ºF
(±4 °C between 250 and 400 °C)
Primary / Ambient Air Temp. . . . . . ±2 ºF between 32 and 212 ºF
(±1 °C between 0 and 100 °C)
Pressure / Draft . . . . . . . . . . . . . . . . ±2% of reading or ±0.02 "H2O
(±0.05 mb), whichever is greater
System Flow Rate with Probe . . . . . . . 200 cc/min minimum
Instruction 24-94482-2
Page 19

Specications
Power Requirements:
Four disposable ‘AA’ alkaline batteries provide at least 15 hours of continuous operation. NiMH rechargeable batteries can also be used, with the
operating time dependent on battery type and condition.
An optional AC power adapter, which runs from any convenient source of
100–240 VAC, 50/60 Hz power, can be used to power the analyzer on a continuous basis. If using rechargeable batteries, the AC power adapter can also
be used to charge the batteries while inside the analyzer.
Warm-Up Time:
60 seconds. Sensors are checked and auto zeroed during warm-up.
Memory:
• 500 complete combustion test records
• 500 complete logged combustion test records
Interfaces:
• Printer – Infrared (IrDA) communications
• Computer – USB
Dimensions:
9H x 3W x 2.5D inches (22.9 x 7.6 x 6.3 cm)
Weight:
• Analyzer – 1.4 lb (0.6 kg) w/ batteries
• Probe & Hose Assembly – 1 lb (0.5 kg)
Instruction 24-9448 2-3
Page 20

Specications
Notes:
Instruction 24-94482-4
Page 21
Initial Setup
Release and then
remove battery cover
by pushing latch up
3 Initial Setup
3.1 Scope
Before using the PCA 2, you MUST:
• Install batteries, or plug in the optional AC power adapter (Section 3.2)
• Connect the probe and hose assembly (Section 3.3)
• Check, and if necessary, make changes to the analyzer’s configuration
(Section 3.4)
3.2 Power
3.2.1 Installing or Replacing Batteries
Either alkaline or NiMH rechargeable batteries can used to power the analyzer. Note that if rechargeable batteries are used, they can be recharged
while installed inside the analyzer using the optional AC power adapter
(refer to Section 3.2.2).
Install or replace the batteries as described below:
1. Remove battery cover from back of unit (Figure 3-1.)
2. Remove (and properly dispose of) any old batteries.
3. Install a set of four ‘AA’ alkaline or NiMH batteries, per the “+” and
“–” markings inside the battery compartment.
4. Replace battery cover.
Figure 3-1. Installing Batteries
Instruction 24-9448 3-1
Page 22

Initial Setup
3.2.2 Using the AC Power Adapter
The AC power adapter is capable of powering the analyzer on a continuous
basis. The adapter plugs into an appropriate 100–240 VAC, 50/60 Hz wall
outlet, and produces an output of +9 VDC. The adapter’s output connector
plugs into the analyzer’s POWER jack located on the bottom of the unit
(Figure 3-2).
If NiMH rechargeable batteries are used, the adapter can also rapid
charge these batteries in approximately 2 - 3 hours while still inside the
analyzer. For the batteries to be charged, however, the analyzer’s battery
charger circuit must be turned ON per Section 3.14.
3.3 Connecting the Probe and Hose Assembly
Do the following to attach the probe and hose assembly to the analyzer
(Figure 3-2):
1. Push the gas-sample hose connector, the larger of the two connectors (giving a slight twist), onto the analyzer’s GAS fitting.
2. Push the draft-hose connector, the smaller connector (giving a slight
twist), onto the analyzer’s +∆P fitting.
3. Push the stack-gas thermocouple connector into the T-STACK jack (connector fits in only one way).
NOTE: The analyzer has a built-in temperature sensor for
measuring ambient temperature. Perform Step 4 only if the
optional primary / ambient air thermocouple is used.
4. Push the optional primary / ambient air thermocouple into the T-AIR
jack (connector fits in only one way).
IMPORTANT: To assure the accurate calculation of combustion
efficiency, the optional primary / ambient air thermocouple
must be used when the burner’s primary-air temperature is not
the same as the room temperature.
5. Inspect all hoses for cracks. If any hose is found to be defective, replace the entire probe and hose assembly. Check that the water trap is
empty, and that the filter is not dirty or saturated with water.
Instruction 24-94483-2
Page 23
Initial Setup
POWER
P
T-STACK T-AIR
GAS
Differential
Pressure Hose
(— ∆P) (Optional)
Probe
Handle
Water Trap /
Filter Assembly
Stack Gas
Thermocouple
Connector
(T-STACK)
AC Power
Adapter Jack
(POWER)
Option
Connector
(Optional External
Measurement)
Draft
Hose
(+ ∆P)
Gas Sample
Hose
(GAS)
Probe Tube
Probe Stop
Primary /
Ambient Air
Thermocouple
(T-AIR) (Optional)
Figure 3-2. Connecting the Probe and Hose Assembly to the PCA 2
Instruction 24-9448 3-3
Page 24
Initial Setup
MAIN MENU
FUEL
PRESSURE
MEMORY
SETUP
CALIBRATION
DIAGNOSTICS
STATUS
F1 F2 F3
MENU
FUEL MENU
NATURAL GAS
OIL #2
OIL #4
OIL #6
PROPANE
COAL
WOOD
(more)
MENU
F1 F2 F3
3.4 Operating Parameters
The PCA 2 is set up at the factory for the following operating parameters:
Fuel . . . . . . . . . . . . . . . . . . . . .Natural Gas
Temperature Units . . . . . . . . . °F
Pressure Units . . . . . . . . . . . .Inches of Water Column (inwc)
Pollution Units . . . . . . . . . . . .ppm
Date . . . . . . . . . . . . . . . . . . . . . Current MM/DD/YY
Time . . . . . . . . . . . . . . . . . . . . Current EST HH:MM AM/PM
O2 Reference . . . . . . . . . . . . . .0%
Print Pressure . . . . . . . . . . . .No
Zoom . . . . . . . . . . . . . . . . . . . .No
Battery Charger . . . . . . . . . . .OFF
Logging . . . . . . . . . . . . . . . . . . No
Button Sound . . . . . . . . . . . . .ON
To change any of these parameters, perform the associated procedure provided in Sections 3.5 thru 3.16.
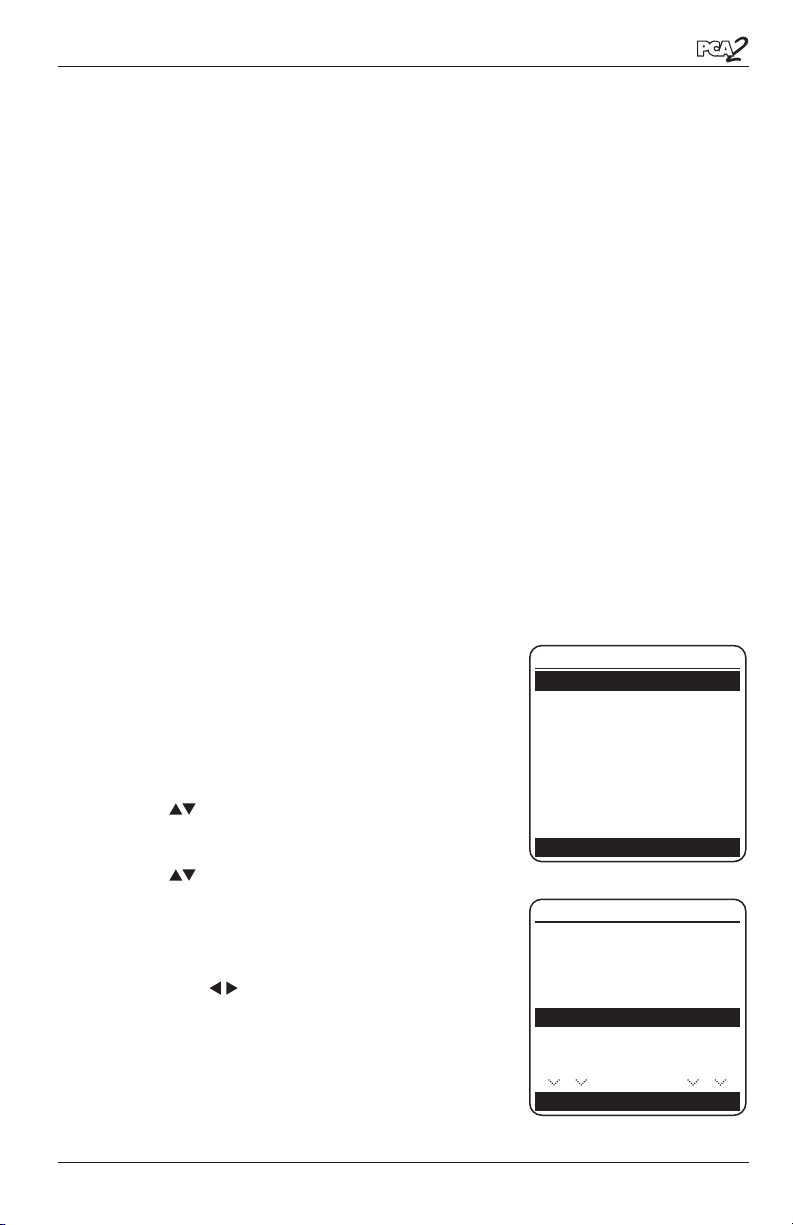
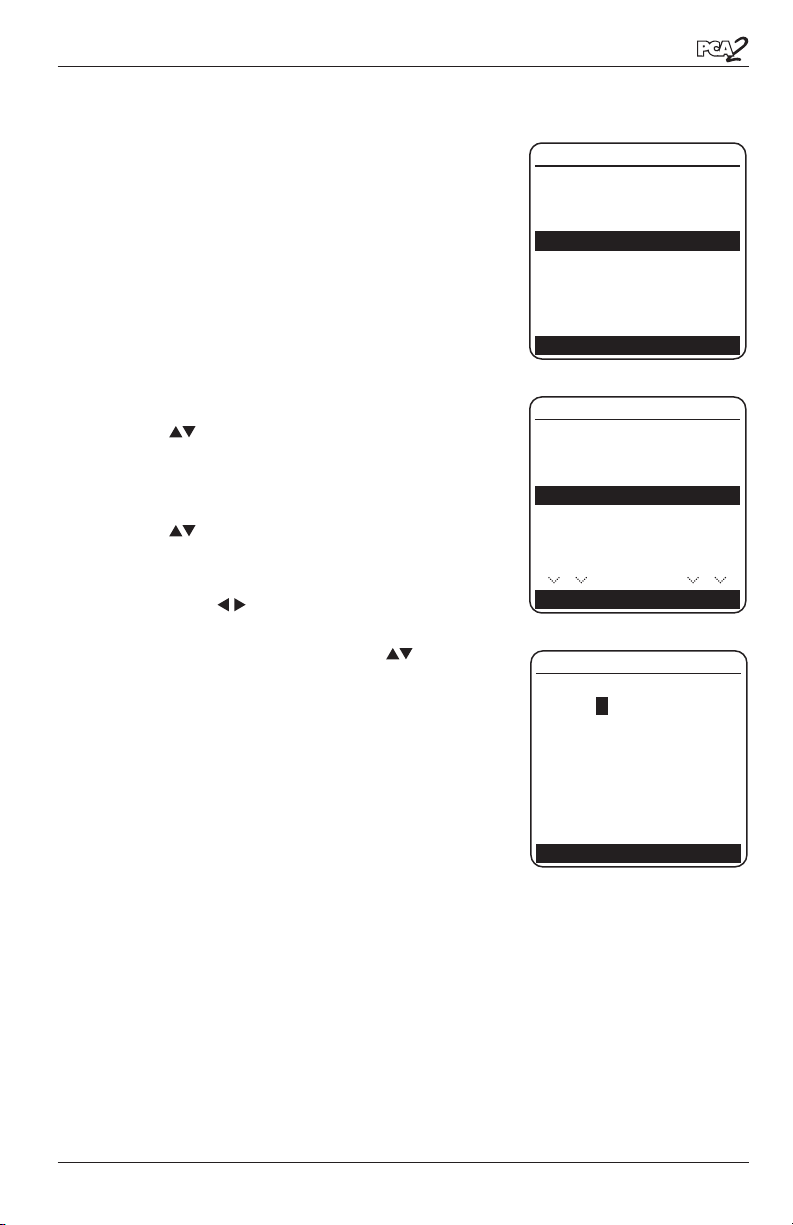
3.5 Fuel Selection
To assure the accurate calculation of combustion
efficiency, select the fuel being burned as follows:
1. Display the MAIN MENU by pressing the
MENU (F2) button. If necessary, press ESC
until MENU appears above F2.
2. Use the buttons to highlight FUEL, and
then press ENT to display the FUEL MENU.
3. Use the buttons to scroll through the
list of available fuels until the desired
fuel is highlighted. In the example shown,
PROPANE has been selected.
TIP: Use the buttons to quickly scroll to the
bottom and top of the list.
4. Press ENT to save the selection and display
the Combustion Test HOLD screen. Observe
that the name of the selected fuel should now
appear at the top of the screen.
Instruction 24-94483-4
Page 25
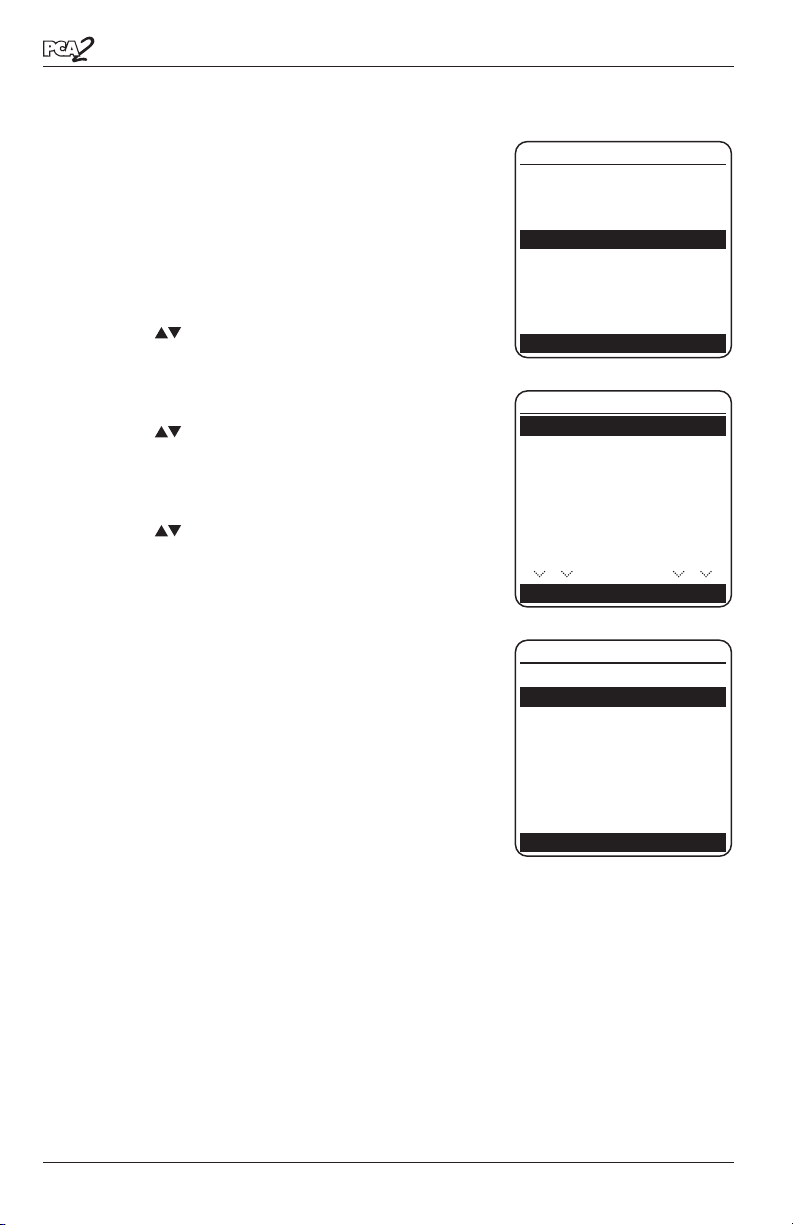
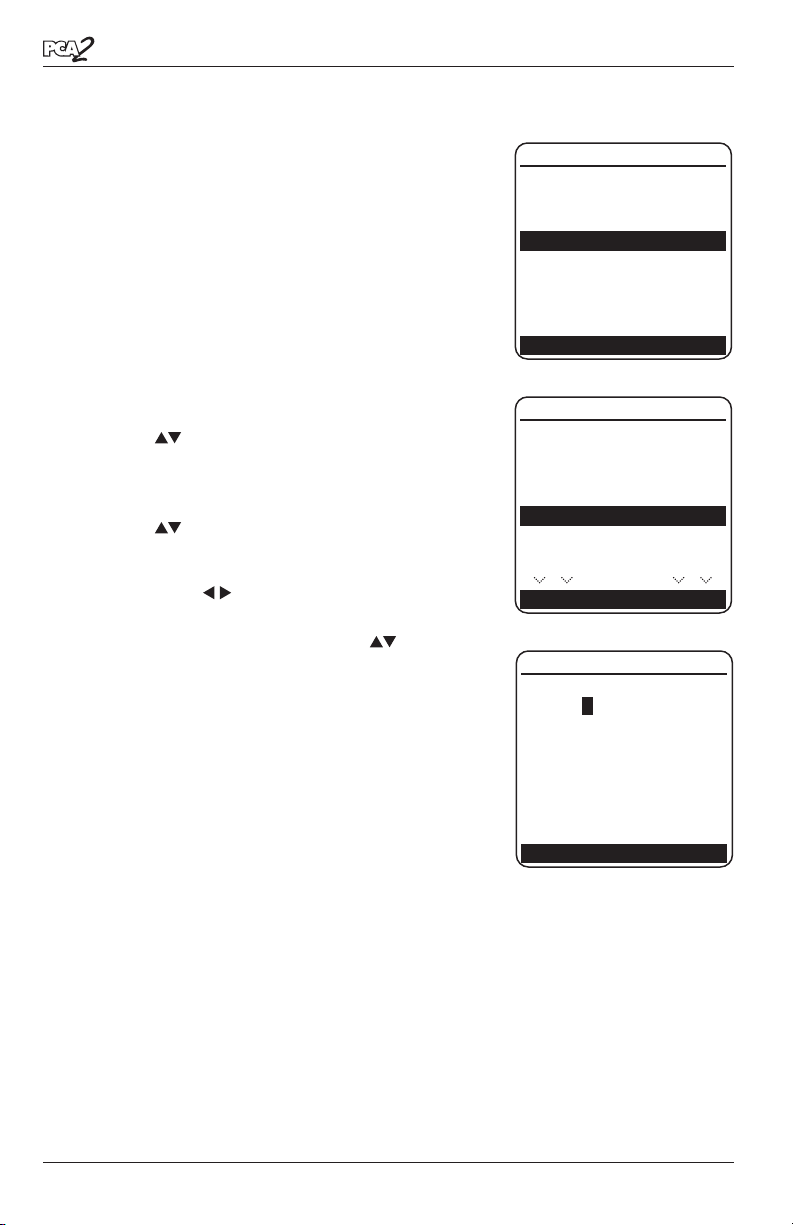
3.6 Temperature Units Selection
MAIN MENU
FUEL
PRESSURE
MEMORY
SETUP
CALIBRATION
DIAGNOSTICS
STATUS
F1 F2 F3
MENU
SETUP MENU
TEMP UNITS
PRESSURE UNITS
POLLUTION UNITS
DATE
TIME
O2 REF
PRINT PRESSURE
(more)
MENU
F1 F2 F3
TEMP UNITS MENU
Celsius
Fahrenheit
MENU
F1 F2 F3
05/26/06 09:25:30 AM
Select to display temperature in either °F or °C
as follows:
1. Display the MAIN MENU by pressing the
MENU (F2) button. If necessary, press ESC
until MENU appears above F2.
2. Use the buttons to highlight SETUP,
and then press ENT to display the SETUP
MENU.
3. Use the buttons to highlight TEMP
UNITS, and then press ENT to display the
TEMP UNITS MENU.
4. Use the buttons to highlight the desired
temperature units. In the example shown,
Fahrenheit has been selected.
5. Press ENT to save the selection and re-display
the SETUP MENU.
Initial Setup
Instruction 24-9448 3-5
Page 26
Initial Setup
MAIN MENU
FUEL
PRESSURE
MEMORY
SETUP
CALIBRATION
DIAGNOSTICS
STATUS
F1 F2 F3
MENU
PRESSURE UNITS MENU
InchesWater
milliBar
Pascals
hectoPascals
MENU
F1 F2 F3
05/26/06 09:25:30 AM
SETUP MENU
TEMP UNITS
PRESSURE UNITS
POLLUTION UNITS
DATE
TIME
O2 REF
PRINT PRESSURE
(more)
MENU
F1 F2 F3
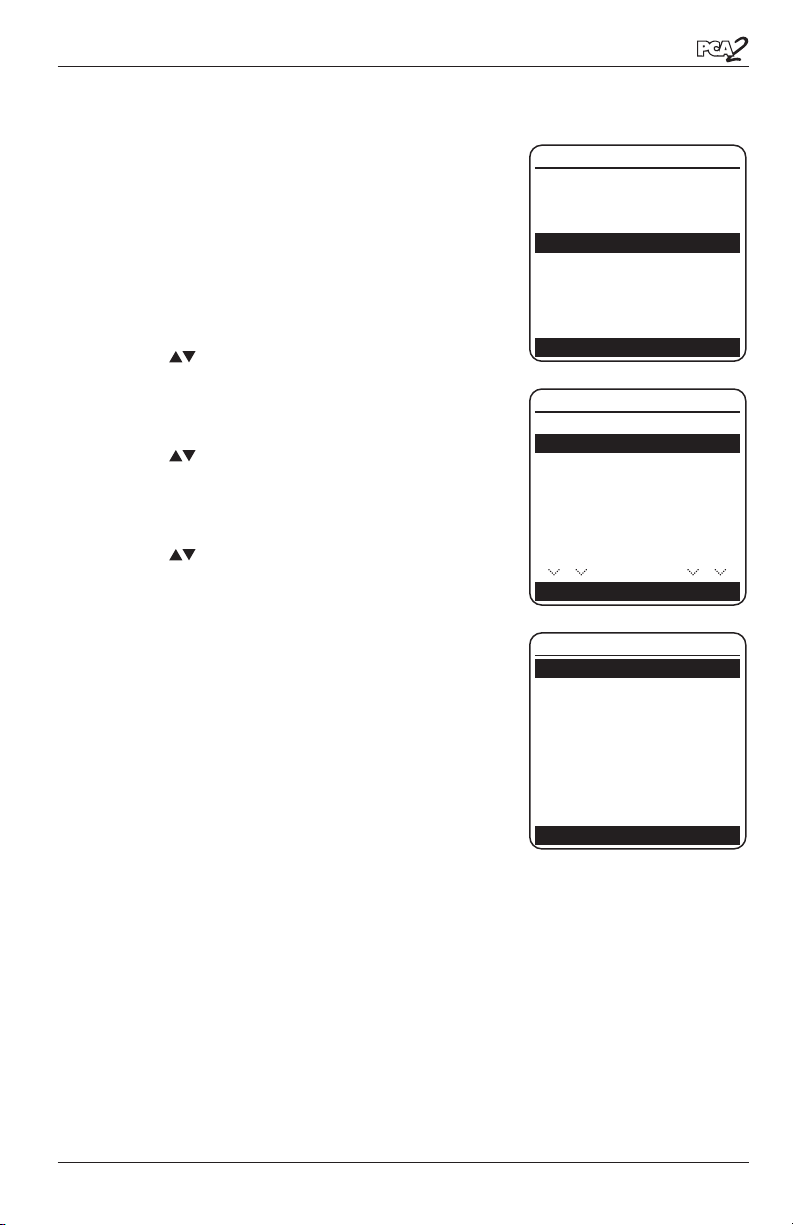
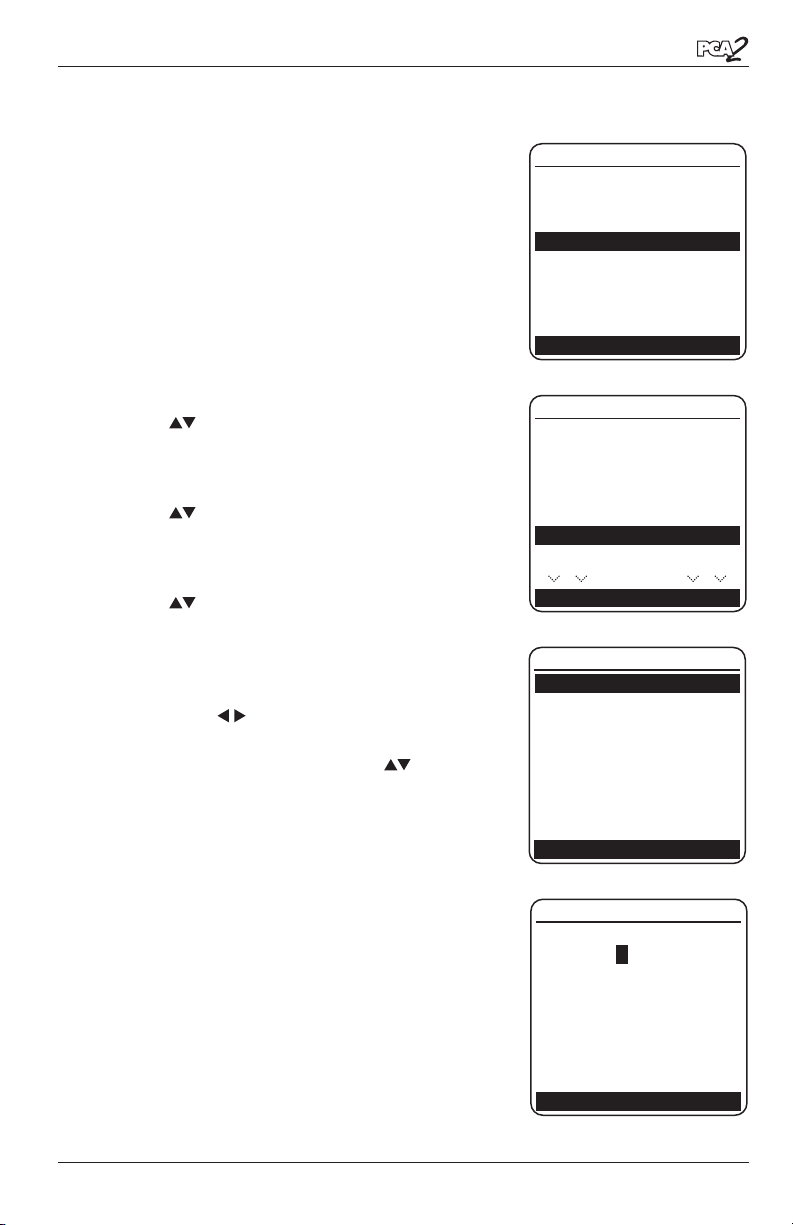
3.7 Pressure Units Selection
Select to display pressure in Inches of Water
Column (inwc), millibar (mb), Pascals (Pa), or
hectoPascals (hPa) as follows:
1. Display the MAIN MENU by pressing the
MENU (F2) button. If necessary, press ESC
until MENU appears above F2.
2. Use the buttons to highlight SETUP,
and then press ENT to display the SETUP
MENU.
3. Use the buttons to highlight PRESSURE
UNITS, and then press ENT to display the
PRESSURE UNITS MENU.
4. Use the buttons to highlight the desired pressure units. In the example shown,
InchesWater has been selected.
5. Press ENT to save the selection and
re-display the SETUP MENU.
Instruction 24-94483-6
Page 27
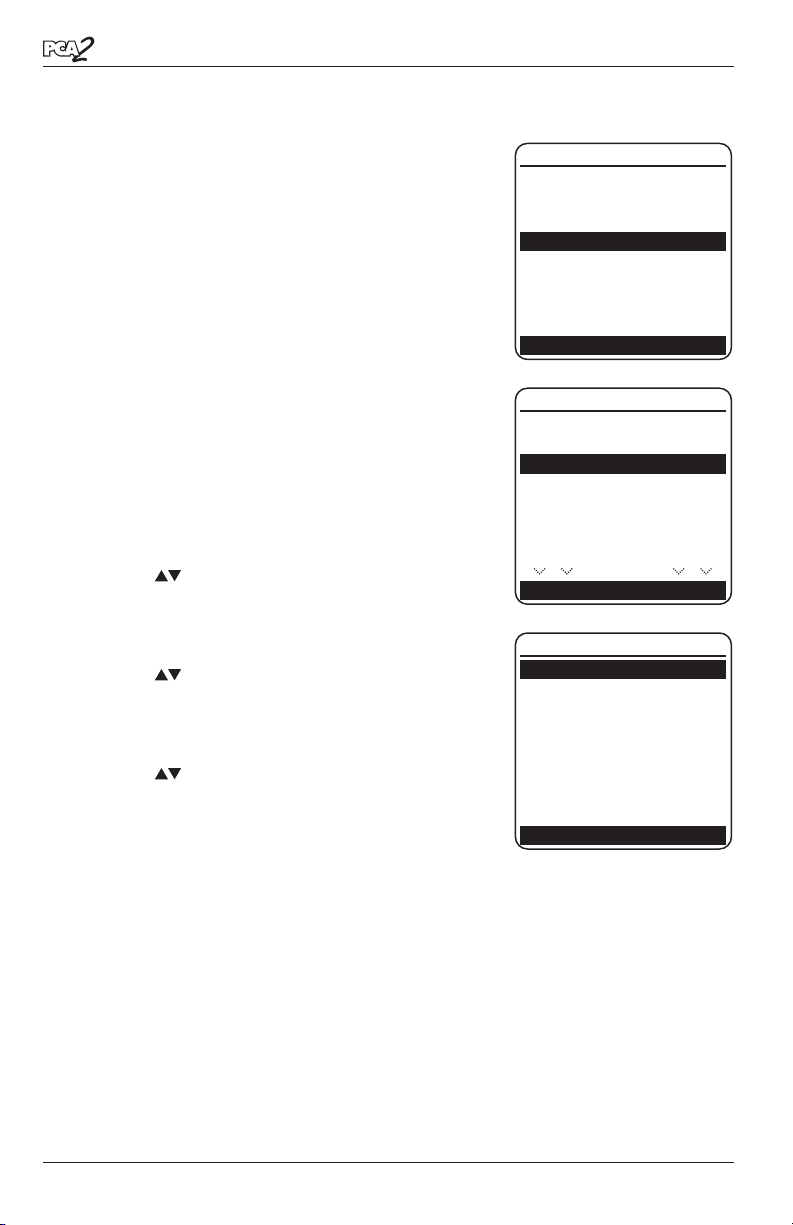
3.8 Pollution Units Selection
MAIN MENU
FUEL
PRESSURE
MEMORY
SETUP
CALIBRATION
DIAGNOSTICS
STATUS
F1 F2 F3
MENU
SETUP MENU
TEMP UNITS
PRESSURE UNITS
POLLUTION UNITS
DATE
TIME
O2 REF
PRINT PRESSURE
(more)
MENU
F1 F2 F3
POLLUTION UNITS MENU
ppm
#/Mbtu
mg/m3
g/GJ
MENU
F1 F2 F3
05/26/06 09:25:30 AM
The PCA 2 is capable of converting the measured
ppm levels of CO, NO, NO2, and SO2 to various
pollution units using CFR40 Part 60 emission
factors. Note that the pollution-unit conversions
for NO, NO2 and NOx are based on the molecular
weight of NO2.
Select to display pollution units in parts per million (ppm), pounds of pollutant per million BTU
(#/Mbtu), milligrams of pollutant per cubic meter
of gas (mg/m3), or grams of pollutant per gigajoule
(g/GJ) as follows:
1. Display the MAIN MENU by pressing the
MENU (F2) button. If necessary, press ESC
until MENU appears above F2.
2. Use the buttons to highlight SETUP,
and then press ENT to display the SETUP
MENU.
Initial Setup
3. Use the buttons to highlight POLLUTION
UNITS, and then press ENT to display the
POLLUTION UNITS MENU.
4. Use the buttons to highlight the desired
pollution units. In the example shown, ppm
has been selected.
5. Press ENT to save the selection and re-display
the SETUP MENU.
Instruction 24-9448 3-7
Page 28
Initial Setup
MAIN MENU
FUEL
PRESSURE
MEMORY
SETUP
CALIBRATION
DIAGNOSTICS
STATUS
F1 F2 F3
MENU
SETUP MENU
TEMP UNITS
PRESSURE UNITS
POLLUTION UNITS
DATE
TIME
O2 REF
PRINT PRESSURE
(more)
MENU
F1 F2 F3
DATE MENU
DATE 05/26/06
05/26/06 09:25:30 AM
MENU
F1 F2 F3
3.9 Date Setup
The date is stored in the format: MM/DD/Y Y. Its
value is part of the date and time stamp that is
saved along with each combustion test record.
Set the analyzer’s internal clock to the current
date as follows:
1. Display the MAIN MENU by pressing the
MENU (F2) button. If necessary, press ESC
until MENU appears above F2.
2. Use the buttons to highlight SETUP,
and then press ENT to display the SETUP
MENU.
3. Use the buttons to highlight DATE, and
then press ENT to display the DATE MENU.
4. First use the buttons to move the cursor
across the screen until it is over the digit to
be changed, and then press the buttons
until the desired value is displayed.
5. Repeat Step 4 until the values for month, day,
and year have been set.
6. Press ENT to save the displayed date values
and re-display the SETUP MENU, or press
ESC to abort this procedure and retain the
old date values.
Note: The Date and Time real time clock is powered by the main batteries and is maintained by a supercap on the Main PCB for approximately 1-2 days in the absence of batteries. The supercap is intended
to maintain the real time clock when the batteries are changed when
exhausted. If the batteries are removed for extended periods of time
such as when the PCA2 is not in use (off-season storage), simply reset
the time and date after fresh batteries are installed when it is placed
back in service.
Instruction 24-94483-8
Page 29
3.10 Time Setup
MAIN MENU
FUEL
PRESSURE
MEMORY
SETUP
CALIBRATION
DIAGNOSTICS
STATUS
F1 F2 F3
MENU
SETUP MENU
TEMP UNITS
PRESSURE UNITS
POLLUTION UNITS
DATE
TIME
O2 REF
PRINT PRESSURE
(more)
MENU
F1 F2 F3
TIME MENU
TIME 09:25 AM
05/26/06 09:25:30 AM
MENU
F1 F2 F3
The time is stored in the format: hh:mm:ss
AM/PM. Its value is part of the date and time
stamp that is saved along with each combustion
test record.
Set the analyzer’s internal clock to the current
time as follows:
1. Display the MAIN MENU by pressing the
MENU (F2) button. If necessary, press ESC
until MENU appears above F2.
2. Use the buttons to highlight SETUP,
and then press ENT to display the SETUP
MENU.
3. Use the buttons to highlight TIME, and
then press ENT to display the TIME MENU.
4. First use the buttons to move the cursor
across the screen until it is over the digit to
be changed, and then press the buttons
until the desired value is displayed.
Initial Setup
5. Repeat Step 4 until the values for hour, minute, and meridiem have been set.
NOTE: The value for seconds cannot be en-
tered, but are displayed and stored as part of
the combustion test record.
6. Press ENT to save the displayed time values
and re-display the SETUP MENU, or press
ESC to abort this procedure and retain the old time values.
Instruction 24-9448 3-9
Page 30
Initial Setup
MAIN MENU
FUEL
PRESSURE
MEMORY
SETUP
CALIBRATION
DIAGNOSTICS
STATUS
F1 F2 F3
MENU
SETUP MENU
TEMP UNITS
PRESSURE UNITS
POLLUTION UNITS
DATE
TIME
O2 REF
PRINT PRESSURE
(more)
MENU
F1 F2 F3
O2 REFERENCE
CO Ref to O2
NOx Ref to O2
SO2 Ref to O2
05/26/06 09:25:30 AM
MENU
F1 F2 F3
CO REF TO O2
00%
05/26/06 09:25:30 AM
MENU
F1 F2 F3
3.11 O2 Reference Setup
The measured values of CO, NOx, and SO2 can be
individually referenced to a specific O2 percentage
of between 0 and 15%.
Individually set up the O2 reference value for each
of the above gases as follows:
1. Display the MAIN MENU by pressing the
MENU (F2) button. If necessary, press ESC
until MENU appears above F2.
2. Use the buttons to highlight SETUP,
and then press ENT to display the SETUP
MENU.
3. Use the buttons to highlight O2 REF, and
then press ENT to display the O2 REFERENCE screen.
4. Use the buttons to highlight the desired
measurement, and then press ENT to display
the REF TO O2 screen for that measurement.
In the example shown, CO has been selected.
5. First use the buttons to move the cursor
across the screen until it is over the digit to
be changed, and then press the buttons
until the desired value is displayed.
6. Press ENT to save the displayed value and redisplay the O2 REFERENCE screen, or press
ESC to abort this procedure and retain the
old O2 reference value.
7. If the O2 reference value for more than one
gas is being set, then repeat Steps 4, 5, and 6
for each measurement.
Instruction 24-94483-10
Page 31

3.12 Print Pressure Selection
MAIN MENU
FUEL
PRESSURE
MEMORY
SETUP
CALIBRATION
DIAGNOSTICS
STATUS
F1 F2 F3
MENU
SETUP MENU
(more)
TIME
O2 REF
PRINT PRESSURE
DIAGNOSTICS
BATTERY CHARGER
LOGGING
BUTTON SOUND
MENU
F1 F2 F3
PRINT PRESSURE
No
Yes
05/26/06 09:25:30 AM
MENU
F1 F2 F3
Select whether to print or not print the pressure
measurement on the combustion test printout as
follows (see Figure 4-3 on Page 4-31):
1. Display the MAIN MENU by pressing the
MENU (F2) button. If necessary, press ESC
until MENU appears above F2.
2. Use the buttons to highlight SETUP,
and then press ENT to display the SETUP
MENU.
3. Use the buttons to highlight PRINT
PRESSURE, and then press ENT to display
the PRINT PRESSURE screen.
4. Use the buttons to highlight either No (do
not print pressure) or Yes (print pressure). In
the example shown, Yes has been selected.
5. Press ENT to save the selection and re-display
the SETUP MENU.
Initial Setup
Instruction 24-9448 3-11
Page 32

Initial Setup
MAIN MENU
FUEL
PRESSURE
MEMORY
SETUP
CALIBRATION
DIAGNOSTICS
STATUS
F1 F2 F3
MENU
SETUP MENU
(more)
TIME
O2 REF
PRINT PRESSURE
ZOOM
BATTERY CHARGER
LOGGING
BUTTON SOUND
MENU
F1 F2 F3
ZOOM
No
Yes
05/26/06 09:25:30 AM
MENU
F1 F2 F3
O2 4.0 %
CO 12 ppm
EFF 82.6%
PRINT MENU SAVE
F1 F2 F3
3.13 Zoom-Display Selection
Zoom-display provides an additional combustion
test screen that shows the test values of O2, CO,
and efficiency in extra large characters, thus allowing the operator to view the display of these
values from a longer distance.
Pressing the ENT button while performing a combustion efficiency test will now show the zoomdisplay. Refer to Section 4.5.
Turn zoom-display ON and OFF as follows:
1. Display the MAIN MENU by pressing the
MENU (F2) button. If necessary, press ESC
until MENU appears above F2.
2. Use the buttons to highlight SETUP,
and then press ENT to display the SETUP
MENU.
3. Use the buttons to highlight ZOOM, and
then press ENT to display the ZOOM screen.
4. Use the buttons to highlight either No
(turn zoom OFF) or Yes (turn zoom ON). In
the example shown, Yes has been selected.
5. Press ENT to save the selection and re-display
the SETUP MENU.
Instruction 24-94483-12
Page 33

3.14 Battery Charger Selection
MAIN MENU
FUEL
PRESSURE
MEMORY
SETUP
CALIBRATION
DIAGNOSTICS
STATUS
F1 F2 F3
MENU
SETUP MENU
(more)
TIME
O2 REF
PRINT PRESSURE
ZOOM
BATTERY CHARGER
LOGGING
BUTTON SOUND
MENU
F1 F2 F3
BATTERY CHARGER
OFF
ON
05/26/06 09:25:30 AM
MENU
F1 F2 F3
When using rechargeable NiMH batteries, the
AC power adapter can be used to charge the batteries while inside the analyzer. The analyzer’s
rapid-charger circuit, however, must be first
turned ON.
IMPORTANT: When using disposable
alkaline batteries, the analyzer’s battery
charger circuit should be OFF to prevent
the batteries from overheating.
As a precaution, the charger circuit is automatically toggled to its OFF state when the analyzer
is turned OFF, thus requiring the operator to
turn the charger back ON when needed.
Note: The PCA2 must be left turned ON to
charge the batteries.
Turn the battery charger circuit ON and OFF as
follows:
Initial Setup
1. Display the MAIN MENU by pressing the
MENU (F2) button. If necessary, press ESC
until MENU appears above F2.
2. Use the buttons to highlight SETUP,
and then press ENT to display the SETUP
MENU.
3. Use the buttons to highlight BATTERY
CHARGER, and then press ENT to display
the BATTERY CHARGER screen.
4. Use the buttons to highlight either OFF
(turn charger OFF) or ON (turn charger ON). In the example shown,
ON has been selected.
5. Press ENT to save the selection and re-display the SETUP MENU.
Instruction 24-9448 3-13
Page 34

Initial Setup
SETUP MENU
(more)
TIME
O2 REF
PRINT PRESSURE
ZOOM
BATTERY CHARGER
LOGGING
BUTTON SOUND
MENU
F1 F2 F3
MAIN MENU
FUEL
PRESSURE
MEMORY
SETUP
CALIBRATION
DIAGNOSTICS
STATUS
F1 F2 F3
MENU
SETUP MENU
(more)
TIME
O2 REF
PRINT PRESSURE
ZOOM
BATTERY CHARGER
LOGGING
BUTTON SOUND
MENU
F1 F2 F3
BUTTON SOUND
OFF
ON
05/26/06 09:25:30 AM
MENU
F1 F2 F3
3.15 Logging Selection
–
When the logging function is activated, up to 500
combustion test records will be automatically
stored in memory at a preset interval over a predetermined length of time.
Refer to Section 4.12 for detailed information on
how to select the logging function; how to set the
interval and duration time periods; and how to
view or download the stored data.
3.16 Button Sound
The audible sound used to signal when a button is
pressed can be turned OFF and ON as follows:
1. Display the MAIN MENU by pressing the
MENU (F2) button. If necessary, press ESC
until MENU appears above F2.
2. Use the buttons to highlight SETUP,
and then press ENT to display the SETUP
MENU.
3. Use the buttons to highlight BUTTON
SOUND, and then press ENT to display the
BUTTON SOUND screen.
4. Use the buttons to highlight either OFF
(turn sound OFF) or ON (turn sound ON). In
the example shown, OFF has been selected.
5. Press ENT to save the selection and
re-display the SETUP MENU.
Instruction 24-94483-14
Page 35

Operation
4 Operation
4.1 Operating Tips
• When an analyzer is brought in from a cold vehicle, let it warm up slowly
to minimize condensation. Temperatures below freezing will not damage the analyzer; however, bringing a cold analyzer into a warm, humid
environment may cause condensate to form inside the case.
CAUTION: Although the analyzer itself is not damaged by an extremely
cold environment, the electrochemical sensors may be damaged. The O2
sensor's electrolyte will freeze at approximately -20 ºF and the other sensors at approximately -94 ºF. If the analyzer is exposed to an extremely
cold condition, it is strongly suggested that the sensor housings be examined for hairline cracks. Be aware that a leaking sensor can cause chemical burns to the skin and possibly damage the PCB assemblies.
• Ensure that the analyzer is sampling fresh air when turned ON. Pulling
a stack-gas sample through the analyzer during its warm-up period will
not damage the analyzer, but it will result in incorrect sensor readings,
and may result in sensor error messages appearing after the warm-up
cycle completes.
• Note that flue-gas condensate is acidic and very corrosive. It is important
not to allow the analyzer’s internal components to come in contact with
condensate for long periods of time.
• Before each use, inspect the filter element of the water-trap / filter assembly. Replace the filter if it looks dirty. Refer to Section 6.2.
• When sampling flue-gas, keep the analyzer above the water-trap, and
keep the trap in a vertical position. This will maximize the effectiveness
of the trap and keep liquid condensate from being drawn directly into the
analyzer.
• When liquid condensate is seen inside the water trap, empty the trap
before it becomes full. Refer to Section 4.9.
• It is recommended that the analyzer be purged after performing a combustion test. Once the probe is removed from the stack, let the pump run
for 10 minutes or so to completely remove any remaining stack gases and
dry any condensate from inside the sensor chamber and probe assembly.
If the analyzer is turned OFF with high levels of flue gas remaining
in the analyzer, then the pump will continue to run and the message
“PURGING SENSORS” will appear on the display until all flue gas
levels fall below predetermined levels.
• When storing the analyzer, it’s a good idea to empty the water trap and
leave it open to further dry it out.
• Calibrate the analyzer every
Instruction 24-9448 4-1
6 months to assure its accuracy.
Page 36

Operation
MENU
Warm Up 60
MENU
Warm Up Complete
NO ERRORS DETECTED
MENU
O2 Value: Good
ERRORS DETECTED
Low Battery
MENU
MENUMENU
PCA 2
FIRMWARE VERSION
x.xx
MODEL xxx
SERIAL # x xxxxxx
4.2 Turning ON the Analyzer and Warm Up
1. Connect the probe and hose assembly, and make sure that the analyzer
is properly set up per Section 3 Initial Setup.
IMPORTANT: DO NOT insert probe into stack
before turning ON the analyzer!
2. Place the probe in an area that contains fresh
air. This ensures that the sensors will be
properly zeroed during the warm-up cycle.
3. Turn ON the analyzer by pressing the I/O
button for at least 1 second, or until a single
beep is heard. Observe that the analyzer’s
firmware version, model and serial numbers
are briefly displayed followed by the Warm Up
screen.
4. Wait for the analyzer to count down its
60 second warm-up period; after which, the
message “NO ERRORS DETECTED” along
with the oxygen sensor’s output voltage is
briefly displayed followed by the display of the
Combustion Test HOLD screen.
TIP: The O2 value at the end of warm-up is
reported as "Good, Low or BAD". Consider
replacing the oxygen sensor when its value is
reported as "Low".
If problems were detected during warm up,
the message “ERRORS DETECTED” is
displayed along with a list of those errors.
As an example, the screen to the right shows
that the battery is low. Refer to Section 7.3 for
a listing and possible remedy for the errors
displayed.
TIP: If the sensors in error are not critical to
the combustion test, then press the RUN/HOLD
button to display the Combustion Test HOLD
screen and proceed with the test.
Instruction 24-94484-2
Page 37

4.3 Selecting a Fuel
HOLD NATURAL GAS
O2 20.9 %
CO 0 ppm
EFF --- %
CO2 --- %
T-STK 71.5 °F
T-AIR 71.5 °F
EA --- %
CO(0) --- ppm
PRINT MENU SAVE
F1 F2 F3
MAIN MENU
FUEL
PRESSURE
MEMORY
SETUP
CALIBRATION
DIAGNOSTICS
STATUS
F1 F2 F3
MENU
FUEL MENU
NATURAL GAS
OIL #2
OIL #4
OIL #6
PROPANE
COAL
WOOD
(more)
MENU
F1 F2 F3
HOLD PROPANE
O2 20.9 %
CO 0 ppm
EFF --- %
CO2 --- %
T-STK 71.5 °F
T-AIR 71.5 °F
EA --- %
CO(0) --- ppm
PRINT MENU SAVE
F1 F2 F3
The top line of the Combustion Test HOLD screen
shows the fuel currently selected. In the example
shown, the current fuel is NATURAL GAS. If
necessary, change the fuel as follows:
1. Display the MAIN MENU by pressing the
MENU (F2) button.
2. Use the buttons to highlight FUEL, and
then press ENT to display the FUEL MENU.
3. Use the buttons to scroll through the
list of available fuels until the desired
fuel is highlighted. In the example shown,
PROPANE has been selected.
TIP: Use the buttons to quickly scroll to the
bottom and top of the list.
4. Press ENT to save the selection and return
to the Combustion Test HOLD screen. The
newly selected fuel should now appear in the
top line of the display.
Operation
Instruction 24-9448 4-3
Page 38

Operation
O2,
CO,
Stack Temp.
Undiluted Flue
Gas Sample Taken
Under Draft
Diverter in Top
of Fire Tube
O2, CO,
Stack Temp.
O2, CO,
Stack Temp.
Combustion Air
Sampling Point
O2, CO,
Stack Temp.
4.4 Sampling Point
FORCED AIR FURNACE – For atmospheric burner
or gravity vented, forced air heating equipment
with a clamshell or sectional heat exchanger design, test each of the exhaust ports at the top of the
heat exchanger. The probe should be inserted back
into each of the exhaust ports to obtain a flue-gas
sample, before any dilution air is mixed in.
HOT WATER TANK – Domestic hot water tanks
with the ‘bell’ shaped draft diverter can be accurately tested by inserting the probe tip directly
into the top of the fire tube below the diverter.
80% EFFICIENCY FAN ASSIST OR POWER VENTED
– Combustion testing of fan assist or power vented,
furnaces/boilers should be done through a hole drilled
in the vent immediately above the inducer fan.
90% EFFICIENCY CONDENSING – Condensing furnaces/boilers can be tested through a hole
drilled in the plastic vent pipe (when allowed by
the manufacturer or local authority of jurisdiction)
or taken from the exhaust termination.
Forced Air Furnace
ATMOSPHERIC OR GRAVITY VENTED BOILER
– Boilers, which have a ‘bell’ shaped draft diverter
on top, should be tested directly below the diverter
through a hole drilled in the vent connector.
80% Eff. Fan Assist or
90% Eff. Condensing
Power Vented
Hot Water Tank
Atmospheric or Gravity
Vented Boiler
Instruction 24-94484-4
Page 39

Operation
RUN NATURAL GAS
O2 4.0 %
CO 12 ppm
EFF 82.6 %
CO2 9.5 %
T-STK 374 °F
T-AIR 68.0 °F
EA 21.3 %
CO(3) 13 ppm
PRINT MENU SAVE
F1 F2 F3
RUN NATURAL GAS
NO 18 ppm
NO2 6 ppm
NOx 24 ppm
NO(3) 19 ppm
NO2(3) 1 ppm
NOx(3) 25 ppm
PRINT MENU SAVE
F1 F2 F3
O2 4.0 %
CO 12 ppm
EFF 82.6%
PRINT MENU SAVE
F1 F2 F3
4.5 Performing a Combustion Test
Ensure that the following has been completed, and then proceed with the
combustion test as described below:
• Turn ON analyzer and allow it to warm up (Section 4.2).
• Select fuel being burned (Section 4.3).
• Inset probe into stack (Section 4.4).
• If necessary, insert optional primary air thermocouple into combustionair stream of burners that use an outside source of combustion air.
1. Press the RUN/HOLD button to start the test.
You should hear the pump start running and
see the word RUN appear at the top of the
Combustion Test screen.
2. Press the ENT button to view the various
combustion test screens that contain the data
listed in Table 4-1 on Page 4-6.
The screens to the right show typical combus-
tion test data for an analyzer equipped with
O2, CO
TIP: Use the zoom-display to show only the
values of O2, CO, and efficiency in large characters. Refer to Section 3.13.
, NO and NO2 sensors.
LOW
Sensor Indicators: The following indicators
appear in the sensor's data field depending on
certain conditions:
(∗ ∗ ∗) Sensor that is not calibrated or defective.
(XXX) Sensor overrange
(
- - -
) The calculated data cannot be displayed
because the measured data necessary to make
the calculation is out of range (i.e., oxygen level
above 16%).
3. Press ENT until T-STK is displayed. Loosen
thumbscrew on probe stop and move probe in
and out of the stack until the stack’s core temperature (hot spot) is located as indicated
by the highest T-STK reading; then tighten
thumbscrew to prevent further probe movement. Locating the highest stack temperature
is very important for accurate efficiency calculations.
Instruction 24-9448 4-5
Page 40

Operation
4. You can now begin burner-service procedures. The analyzer readings
will change quickly to show changes in burner performance.
CAUTION: Position the Water Trap with its gas-flow arrow
pointing upward. Do not let water condensate go above the tip
of the riser tube. The sensors could be damaged if water would
enter the analyzer. Empty the Water Trap after every combustion test (refer to Section 4.9)
5. Pressing the RUN/HOLD button freezes all readings, stops the pump and
displays the Combustion-Test HOLD screen. Press the ENT button to view
all test values at the moment the RUN/HOLD button was pressed. Press-
ing RUN/HOLD again restarts the pump and resumes testing.
TABLE 4-1. LIST OF COMBUSTION TEST DATA
Display
Name
O
2
CO Carbon Monoxide
Description of Measurement or Calculation
% Oxygen
(1)
EFF % Combustion Efficiency
CO
2
% Carbon Dioxide
T-STK Stack Temperature
T-AIR Primary / Ambient Air Temperature as measured either in-
ternally or by an optional external thermocouple plugged into
the analyzer’s T-AIR connector
EA % Excess Air
CO(n) Carbon Monoxide ppm level referenced to a % of oxygen
NO Nitric Oxide
NO
2
Nitrogen Dioxide
NOx Oxides of Nitrogen (combination of NO and NO2)
SO
2
Sulfur Dioxide
(1)
(1)
(1)
(1)
NO(n) Nitric Oxide ppm level referenced to a % of oxygen
NO2(n) Nitrogen Dioxide ppm level referenced to a % of oxygen
NOx(n) Oxides of Nitrogen ppm level referenced to a % of oxygen
SO2(n) Sulfur Dioxide ppm level referenced to a % of oxygen
(2)
(2)
(2)
(2)
(2)
NO Temp Nitric Oxide Sensor Temperature (3)
(1) Pollution unit of measure selected per Section 3.8
(2) The letter “n” represents the oxygen reference level of between 0 and 15% as
selected per section 3.11
(3) Shown only on printout, not on LCD display.
Instruction 24-94484-6
Page 41

Operation
PRESSURE
Measured:
0.00 inwc
PRINT ZERO SAVE
F1 F2 F3
MAIN MENU
FUEL
PRESSURE
MEMORY
SETUP
CALIBRATION
DIAGNOSTICS
STATUS
F1 F2 F3
MENU
POWER
P
T-STACK T-AIR
GAS
— ∆P (Pressure
Reference Port)
+∆P (Pressure
Measurement Port)
4.6 Making a Draft / Pressure Measurement
The difference in pressure (∆P) between two areas can be measured by
using the analyzer’s two pressure ports and the PRESSURE screen. By
using the –∆P port as the reference, the pressure applied to the +∆P port
will be displayed on the PRESSURE screen as the differential pressure
between the two ports.
Perform a draft / pressure measurement as follows:
1. Turn ON the analyzer and allow it to complete
its warm-up cycle (Section 4.2).
TIP: The pressure units of measure is selected
per Section 3.7.
2. Display the MAIN MENU by pressing the
MENU (F2) button. If necessary, press ESC
until MENU appears above F2.
3. Use the buttons to highlight PRESSURE,
and then press ENT to display the PRESSURE screen.
4. Before taking a measurement, the pressure
sensor may need to be re-zeroed if it is not
already displaying zero with both pressure
ports open to the atmosphere. If necessary,
zero the pressure sensor as follows:
a. Press the ZERO (F2) button.
Sampling Hoses with quick
connect ttings are available
as an optional accessory.
Refer to Section 8.2.
Instruction 24-9448 4-7
Figure 4-1. Draft / Pressure Measurement Hose Connections
Page 42

Operation
PRESSURE ZERO
Disconnect hose then
press ENTER
PRINT ZERO SAVE
F1 F2 F3
PRESSURE ZERO
Reconnect hose
PRINT ZERO SAVE
F1 F2 F3
RUN NATURAL GAS
O2 4.0 %
CO 12 ppm
EFF 82.6 %
CO2 9.5 %
T-STK 374 °F
T-AIR 68.0 °F
EA 21.3 %
CO(3) 13 ppm
PRINT MENU SAVE
F1 F2 F3
b. Disconnect any hoses connected to the
+∆P and –∆P ports, and then press ENT
to zero the pressure sensor.
c. Reconnect any hoses. When measuring
draft, simply leave the –∆P port open to
the atmosphere and connect the probe’s
draft hose to the +∆P port (see Figure 3-2
on Page 3-3).
5. Do one of the following to measure draft or
differential pressure:
• To measure draft, simply insert the probe
into the stack and observe the draft reading on the PRESSURE screen.
• To measure differential pressure, connect
two sampling hoses to the +∆P and –∆P
ports, and place the open end of each hose
into the areas being measured. The differential pressure between the two areas is
now displayed on the PRESSURE screen.
If the pressure at the +∆P port is higher than the –∆P port, then the
pressure reading will be positive. If it is lower, then the reading will be
negative.
4.7 Saving Test Data
Up to 500 individual sets (“snap shots”) of combustion-test or pressure
data can be saved in memory, which can later be recalled for viewing from
the Memory Directory (Section 4.13.1).
1. First display the screen that contains the
data to be saved. In the example to the right,
all data associated with the Combustion Test
RUN screen will be saved.
2. Press the SAVE (F3) button to save the test
data in the next available memory location.
NOTE: When memory is full, the next reading
saved will overwrite the oldest reading.
Instruction 24-94484-8
Page 43

Operation
To Gas Port
on Analyzer
Gas
Flow
Do not allow water
level to go above
tip of riser tube
Stack Gas
From Probe
To empty water,
pull apart using
a slight twisting
motion
4.8 Ending a Combustion Test
WARNING! Burn Hazard. Do not touch the probe after
removing it from the stack. Allow the probe to cool before
handling (about 5 minutes).
1. Remove probe from stack.
2. Allow the pump to run until all combustion gases have been flushed
from the analyzer as indicated by the O2 reading returning to 20.9%.
4.9 Emptying the Water Trap
The Water Trap / Filter Assembly removes
stack-gas condensate, and also prevents soot
from contaminating the internal components
of the analyzer.
IMPORTANT: Use the Water Trap /
Filter Assembly in a vertical position
with the gas-flow arrow pointing up as
shown in the illustration to the right.
Empty the water trap chamber after each
combustion test, or stop the test and empty
the chamber if the liquid condensate level approaches the tip of the riser tube.
To empty the trap, first pull apart the two
halves of the Water Trap using a slight twisting motion; empty the water trap chamber;
and then reassemble the trap.
After each combustion test, also check the
Water Trap’s filter element. If it looks dirty,
replace the filter per Section 6.2.
Instruction 24-9448 4-9
Page 44

Operation
RUN NATURAL GAS
O2 4.0 %
CO 12 ppm
EFF 82.6 %
CO2 9.5 %
T-STK 374 °F
T-AIR 68.0 °F
EA 21.3 %
CO(3) 13 ppm
PRINT MENU SAVE
F1 F2 F3
Low Batter y Alarm
Empty Battery Icon
MENU
SHUTDOWN IN 5 sec
MENU
PURGING SENSORS
4.10 Turning OFF the Analyzer & Purging
Turn OFF the analyzer by pressing the I/O button for at least 2 seconds, or until two beeps are
heard. The unit will count down 5 seconds before
shutting down, giving the operator an opportunity to keep the analyzer turned ON by pressing
the RUN/HOLD button.
If the PCA 2 was not purged with fresh air as
described in Section 4.8, then the analyzer may
remain ON with its pump running and display
the message “PURGING SENSORS” as the result of combustion gases still being present inside
the analyzer. At this time the operator should
ensure that the probe is removed from the stack,
allowing the analyzer to purge itself with fresh
air. The 5-second-shutdown sequence will not
begin until the gas levels inside the analyzer drop
below predetermined levels:
TIP: Although not recommended, the purging process can be bypassed by pressing the I/O button a
second time.
4.11 Low Battery Alarm
When the batteries are nearly depleted, an empty battery icon appears in
the upper-right corner of the display, and a short beep is sounded every
10 seconds.
After a low battery alarm occurs, the analyzer
will continue to operate for only a few minutes.
The amount of operating time that remains depends on many factors (e.g., pump and backlight
being ON or OFF, and the type and condition of
the batteries).
Instruction 24-94484-10
Page 45

Operation
4.12 Data Logging
When the logging function is activated, up to 500 combustion test records
will be automatically stored in memory at a preset interval (1, 5, 10, 15,
30 seconds, 1, 2, 5, 10 minutes) over a predetermined duration (5, 10, 15,
30 minutes, 1, 2, 5, 10, 24, 48 hours).
The maximum duration that data can be collected is determined by the interval. For example, if the interval is set to 10 seconds, then the maximum
selectable length of time in which data can be collected to fill 500 memory
locations would be 1 hour (500 x 10 seconds = 5000 seconds or 83 minutes).
If the operator chooses a duration that is longer than possible for the interval chosen, then the analyzer automatically selects the highest duration
possible for the selected interval.
The stored logged data can either be viewed on the display using the analyzer’s memory function (refer to Section 4.13), or downloaded to a personal
computer using the supplied PCA 2 data recovery software and USB cable
(refer to Section 4.14). Downloaded data is stored on the computer’s hard
drive as a comma-separated-value ASCII text file with a CSV extension,
which can be opened by most spreadsheet programs for analysis.
TIP: The latest PCA 2 data recovery software can be downloaded from http://www.bacharach-inc.com/downloads.
Instruction 24-9448 4-11
Page 46

Operation
MAIN MENU
FUEL
PRESSURE
MEMORY
SETUP
CALIBRATION
DIAGNOSTICS
STATUS
F1 F2 F3
MENU
SETUP MENU
(more)
TIME
O2 REF
PRINT PRESSURE
ZOOM
BATTERY CHARGER
LOGGING
BUTTON SOUND
MENU
F1 F2 F3
LOGGING
NO
YES
nnn MEMORY
LOCATIONS OPEN
MENU
F1 F2 F3
Where: “nnn” is the number of
memory locations available to
store data.
4.12.1 Turning ON Data Logging
IMPORTANT: Before turning ON data logging and starting the
data logging process, the analyzer should already be set up to
perform a combustion test per Section 4.5.
Turn ON data logging as follows:
1. Display the MAIN MENU by pressing the
MENU (F2) button. If necessary, press ESC
until MENU appears above F2.
2. Use the buttons to highlight SETUP,
and then press ENT to display the SETUP
MENU.
3. Use the buttons to highlight LOGGING,
and then press ENT to display the LOGGING
screen.
TIP: The amount of memory available for
storing new data is displayed in the LOGGING screen (maximum of 500 locations). If
previous logging sessions are stored, and additional memory is needed, clear the logging
memory per Section 4.13.3.
NOTE: At no time will new logging data over
write old data.
4. Use the buttons to highlight YES (turn
logging ON).
5. Press ENT to make the selection and display
the LOGGING INTERVAL screen.
Instruction 24-94484-12
Page 47

Operation
LOGGING INTERVAL
1 sec
5 sec
10 sec
15 sec
30 sec
1 min
2 min
(more)
MENU
F1 F2 F3
LOGGING DURATION
5 min
10 min
15 min
30 min
1 hr
2 hr
5 hr
(more)
MENU
F1 F2 F3
4.12.2 Setting the Logging Interval and Duration
The logging interval is the length of time between measurements, while
the logging duration is the time allocated to the logging process. Set the
logging interval and duration as follows:
TIP: If the duration is set for more than 10 hours, we recommend using the optional AC power adapter to power the
analyzer.
1. As soon as logging is turned ON as described
in Section 4.12.1, the LOGGING INTERVAL
screen appears.
2. Use the buttons to highlight the desired
interval, and then press ENT to make the
selection and display the LOGGING DURATION screen. In this example, 1 minute has
been selected
3. Use the buttons to highlight the desired
duration, and then press ENT to make the
selection and display the LOGGING SUMMARY screen. In this example, 2 hours has
been selected.
NOTE: If the selected duration requires more
memory than is currently available, then the
analyzer will automatically select the longest
duration possible for the selected interval.
Instruction 24-9448 4-13
Page 48

Operation
LOGGING SUMMARY
Interval 1 min
Duration 2 hr
Press ENTER
to Start
MENU
F1 F2 F3
LOG NATURAL GAS
O2 4.0 %
CO 12 ppm
EFF 82.6 %
CO2 9.5 %
T-STK 374 °F
T-AIR 68.0 °F
EA 21.3 %
CO(3) 13 ppm
Log Entry xx
F1 F2 F3
Where: “xx” is the memory
location where the current
log entry is being saved.
4.12.3 Starting the Data Logging Process
After turning ON data logging and setting the
interval and duration, the analyzer will pause
at the LOGGING SUMMARY screen, where the
currently selected interval and duration time
periods are displayed.
Press ENT to start the combustion test and logging process. At this time the Combustion Test
LOG screen will appear, indicating that the analyzer is now performing a combustion test and the
data is being stored in memory.
Note the following:
• At the bottom of the screen, the memory
location where the current log entry is being
saved is displayed. This number also represents the total number of test records that
are stored in memory.
• If there were previously stored log entries,
each new logging session will start to store
data in the next available memory location.
• At no time will new data overwrite old data.
• The ENT button can be pressed while logging to view the other Combustion Test screens.
Instruction 24-94484-14
Page 49

Operation
LOG NATURAL GAS
O2 4.0 %
CO 12 ppm
EFF 82.6 %
CO2 9.5 %
T-STK 374 °F
T-AIR 68.0 °F
EA 21.3 %
CO(3) 13 ppm
yy Entries Stored
F1 F2 F3
Where: “yy” is the number of
log entries stored during the
last logging session.
4.12.4 Ending the Data Logging Process
Data logging will stop and the pump will turn OFF after the prescribed
duration, or after all 500 memory locations are filled.
To exit the Combustion Test LOG screen, press
the RUN/HOLD button twice to display the Combustion Test HOLD screen.
Note the following:
• To end the logging process at any time, press
the ESC button.
• At the end of the logging period, or if the
ESC button was pressed, the total number
of log entries that were stored during that
period appear at the bottom of the screen.
• If the logging process was stopped by pressing ESC, it cannot be resumed without first turning logging back ON per Section 4.12.1.
4.13 Memory
There are two memory banks, each containing 500 memory locations. The
first bank is used to store combustion test data as described in Section 4.7.,
while the second bank is used to store logged combustion test data as
described in Section 4.12. Each bank is independent of each other, and cannot share data or be combined.
Individual memory locations in each memory bank can be recalled for
viewing on the display or printed (refer to Sections 4.13.1 & 4.13.2), or the
entire contents of each memory bank can be individually downloaded to a
computer and viewed in a spreadsheet program for analysis (refer to Section 4.14).
Instruction 24-9448 4-15
TIP: When displaying the contents of either memory bank,
the operator can quickly page through the screens by pressing the PAGE– (F1) and PAGE+ (F3) buttons. Or move to
the first or last memory location by pressing the buttons,
respectively.
Page 50

Operation
MAIN MENU
FUEL
PRESSURE
MEMORY
SETUP
CALIBRATION
DIAGNOSTICS
STATUS
F1 F2 F3
MENU
MEMORY MENU
MEMORY DIRECTORY
LOGGING DIRECTORY
CLEAR MEMORY DATA
CLEAR LOGGING DATA
CLEAR ALL MEMORY
F1 F2 F3
MENU
MEMORY DIRECTORY
1 05/23/06 10:00:00
2 05/23/06 10:30:14
3 05/23/06 11:45:38
4 05/23/06 01:50:10
5 05/23/06 03:35:25
6 EMPTY
7 EMPTY
(more)
F1 F2 F3
PAGE- MENU PAGE+
Mem: 1 NATURAL GAS
O2 4.0 %
CO 12 ppm
EFF 82.6 %
CO2 9.5 %
T-STK 374 °F
T-AIR 68.0 °F
EA 21.3 %
CO(3) 13 ppm
PRINT MENU
F1 F2 F3
4.13.1 Recalling Combustion Test Data
Recall individual combustion test data records as follows:
1. Display the MAIN MENU by pressing the
MENU (F2) button. If necessary, press ESC
until MENU appears above F2.
2. Use the buttons to highlight MEMORY,
and then press ENT to display the MEMORY
MENU.
3. Use the buttons to highlight MEMORY
DIRECTORY, and then press ENT to display
the MEMORY DIRECTORY screen.
4. Use the buttons to highlight the desired
memory location to be recalled. Each memory
location is identified by the date and time
at which data was saved. The word EMPTY
signifies that the memory location does not
contain data.
5. Press ENT to display the data contained in
the selected memory location.
Note the following:
• The top line of the recalled combustion test
data screen shows the memory location being
viewed. In this example, “MEM: 1” is being
displayed
• The ENT button can be pressed to view other
memory test data screens.
• The recalled combustion test data can be
printed by pressing the PRINT (F1) button
(refer to Section 4.16).
Instruction 24-94484-16
Page 51

4.13.2 Recalling Logged Test Data
MAIN MENU
FUEL
PRESSURE
MEMORY
SETUP
CALIBRATION
DIAGNOSTICS
STATUS
F1 F2 F3
MENU
MEMORY MENU
MEMORY DIRECTORY
LOGGING DIRECTORY
CLEAR MEMORY DATA
CLEAR LOGGING DATA
CLEAR ALL MEMORY
F1 F2 F3
MENU
LOGGING DIRECTORY
1 05/23/06 10:00:00
2 05/23/06 10:30:00
3 05/23/06 11:00:00
4 05/23/06 11:30:00
5 05/23/06 12:00:00
6 05/23/06 12:30:00
7 05/23/06 01:00:00
(more)
F1 F2 F3
PAGE- MENU PAGE+
Log: 6 NATURAL GAS
O2 4.0 %
CO 12 ppm
EFF 82.6 %
CO2 9.5 %
T-STK 374 °F
T-AIR 68.0 °F
EA 21.3 %
CO(3) 13 ppm
PRINT MENU
F1 F2 F3
Recall individual logged combustion test data records as follows:
1. Display the MAIN MENU by pressing the
MENU (F2) button. If necessary, press ESC
until MENU appears above F2.
2. Use the buttons to highlight MEMORY,
and then press ENT to display the MEMORY
MENU.
3. Use the buttons to highlight LOGGING
DIRECTORY, and then press ENT to display
the LOGGING DIRECTORY screen.
4. Use the buttons to highlight the desired
data logging location to be recalled. Each
logging location is identified by the date and
time at which the data was saved. The word
EMPTY signifies that the logging location
does not contain data.
5. Press ENT to display the logging data contained in the selected memory location.
Operation
Note the following:
• The top line of the log test data screen shows
the log location being viewed. In this example, “Log: 6” is being displayed.
• The ENT button can be pressed to view other
log test data screens.
• The recalled logged test data can be printed
by pressing the PRINT (F1) button (refer to
Section 4.16).
Instruction 24-9448 4-17
Page 52

Operation
MAIN MENU
FUEL
PRESSURE
MEMORY
SETUP
CALIBRATION
DIAGNOSTICS
STATUS
F1 F2 F3
MENU
MEMORY MENU
MEMORY DIRECTORY
LOGGING DIRECTORY
CLEAR MEMORY DATA
CLEAR LOGGING DATA
CLEAR ALL MEMORY
F1 F2 F3
MENU
CLEAR MEMORY DATA
NO
YES
F1 F2 F3
MENU
CLEAR MEMORY DATA
WAIT
Erasing memory
F1 F2 F3
MENU
4.13.3 Clearing Memory
When all memory (“snap shot”) locations used
to store individual combustion test records have
been filled, the next combustion test record saved
will overwrite the oldest.
When all logging memory locations in the logging
directory are full, they must be manually cleared
in order to store new data. At no time will the logging process overwrite older data.
Each memory bank can be individually cleared,
or all memory locations in both banks can be
cleared simultaneously.
Do the following to clear memory:
1. Display the MAIN MENU by pressing the
MENU (F2) button. If necessary, press ESC
until MENU appears above F2.
2. Use the buttons to highlight MEMORY,
and then press ENT to display the MEMORY
MENU.
3. Use the buttons to highlight one of the
following:
• CLEAR MEMORY DATA clears only the
individual saved combustion test records.
• CLEAR LOGGING DATA clears only the
combustion test records that were saved
during the logging process.
• CLEAR ALL MEMORY clears all memory
locations in both memory banks.
4. Press ENT to display the CLEAR MEMORY, LOGGING, or ALL DATA conformation screen. Highlight YES to confirm that
memory is to be cleared, and then press ENT
to actually clear memory as evidenced by
the display of the “WAIT Erasing memory”
screen.
Instruction 24-94484-18
Page 53

Operation
4.14 Downloading Stored Data to a Computer
The combustion test data that was stored in either the analyzer’s Memory
Directory (Section 4.7), or Logging Directory (Section 4.12), can be downloaded to a computer using the PCA 2 Data Recovery Program and USB
cable that are supplied with the analyzer.
The following procedures assume that the operator is familiar with creating folders and navigating the file structure of the Windows operating system. If necessary, consult the Windows help files for instructions on how to
perform these procedures.
The downloaded data is stored on the computer’s hard drive – or removable
media of the operator’s choosing – as a comma-separated-value ASCII text
file with a CSV extension. This type of file can be opened by most spreadsheet programs for analysis.
Computer requirements:
• Windows 98SE or higher
• CD ROM drive
• USB 1.1 or USB 2.0 port
• 12 MB of hard drive space for the PCA 2 data recovery program, plus
up to an additional 350 KB for each download
Instruction 24-9448 4-19
Page 54

Operation
4.14.1 PCA 2 Data Recovery Program Installation
The PCA 2 Data Recovery Program is supplied with the analyzer on a CD
(P/N 24-1425). Install this program as follows:
1. Insert the PCA 2 CD into the computer’s CD-ROM drive.
2. Locate the CD-ROM drive in Windows Explorer and open the PCA2
folder. Double-click the Setup.exe program to start the installation
process.
3. Click Next on the “Welcome to the InstallShield Wizard for PCA2”
window.
4. Click
Next to accept the default destination folder, or click Change to
install to a different folder.
Default
Installation Folder
Click to change
installation folder
Instruction 24-94484-20
Page 55

Operation
5. Click Install to confirm the destination folder and user information.
6. Click
Finish after all files have been copied into the destination folder.
7. At this time the PCA2 Data Recovery Program icon should appear
under "Start All Programs menu.
8. This completes the installation of the software. Remove CD from drive.
Instruction 24-9448 4-21
Page 56

Operation
4.14.2 Computer to PCA 2 Connection &
USB Device Driver Installation
Connect the USB cable (P/N 104-4032) that was supplied with the PCA 2,
and, if necessary, install the analyzer’s USB device driver as follows:
1. With both the PCA 2 and computer turned ON, insert the appropriate ends of the USB cable into the USB connectors on the PCA 2 and
computer as shown in Figure 4-2.
2. If this is the first time the PCA 2 is being connected to the computer,
then the “Found New Hardware Wizard” should shortly appear. Select
“No, not this time” and click Next>.
NOTE: The USB
device driver
only needs to be
installed once. It
does not require
to be re-installed
each time the
PCA 2 is connected to the
computer.
Do not search for
software.
Figure 4-2. Computer to PCA 2 Connection
Instruction 24-94484-22
Page 57

Operation
3. Select “Install from a list or specific location (Advanced)” and click Next>.
Name of new USB
hardware
Select (Advanced).
4. Select to search for the best driver and then browse to folder
C:\Program Files\PCA2Data. Click
Select to search
for driver in folder
C:\Program Files\
PCA2Data
Next>.
5. At the Hardware Installation window, click
Continue Anyway.
Our driver has been thoroughly tested in Windows for stability. This
message appears because Microsoft has not tested this product through
WHQL certification.
Instruction 24-9448 4-23
Page 58

Operation
6. After the Found New Hardware Wizard has finished installing the
software, click Finish to close the Wizard.
4.14.3 Recovering Data
Before data can be recovered from the analyzer, install the PCA 2 Data
Recovery Program, USB cable, and USB device driver as described in Sections 4.14.1 and 4.14.2.
Recover either the logging or combustion data as follows:
1. Start the program by either double-clicking the PCA2 icon
on the Windows desktop, or clicking the PCA2 shortcut in
start menu. The “Bacharach PCA 2 Data Recovery Program”
window should appear.
Observe that the window is divided into two sections. The left-hand
section is used to recover logging data, while combustion data is recovered from the right-hand section.
In the following steps, the logging data will be recovered. The same
procedure can be used to recover combustion data using the right-hand
section of the window.
2. Select where the downloaded file containing the recovered data will be
located and give it a filename by clicking the Open Log File button. The
following example screens show that the downloaded file will be placed
into a pre-existing PCA2 Logging Data folder and given the filename
Customer XYZ.
Instruction 24-94484-24
Page 59

Operation
Use this section
of window
to Recover
Logging Data
Status line
showing PCA 2
is successfully
connected to
the computer
Select a
pre-existing
folder or create
a new folder
to store the
downloaded le
Enter lename
File type preset
to *.cvs
Use this section
of window
to Recover
Combustion
Data
Start the
download
process by
clicking the
desired Open
Log / Data File
button
Click here to
create a new
folder
Click Open after
selecting a folder
and entering a
lename
Location of
downloaded le
Click Start
to begin the
download
process
Total number
of records
received out of
512 total
Status line
showing les
are currently
being received
Instruction 24-9448 4-25
Page 60

Operation
NOTE: The filename is automatically given a CSV (Comma
Separated Value) extension, allowing the file to be directly
opened by most spreadsheet programs for analysis.
3. After selecting a folder and entering the filename, click Open and then
click Start to begin the download process.
While recovering the stored data, observe that the “Records received”
line displays the total number of records currently downloaded. And
after all records have been received, the Status line will read “Log files
finished.”
NOTE: The “Records received” line will shown that 512 files
have been received, regardless of how many memory locations
actually contained data. This occurs because the program
checks for data in all 500 memory locations, including 12
additional locations that contain sensor calibration data.
Note that the 12 files that contain sensor calibration data are
saved in a separate “CalibrationData.csv” file. This file is
automatically created and placed in the same folder that was
selected in Step 2.
4. This completes the process of recovering logging data. Either click Exit
to close the program, or proceed to recover the combustion data by
starting over at Step 2, but this time using the right-hand section of
the “Bacharach PCA 2 Data Recovery Program” window.
NOTE: Once either the logging data or combustion data has
been recovered, that portion of the recovery program’s window
will turn gray.
Status line
showing
recovery
process has
nished
Click Exit
to end the
program
Instruction 24-94484-26
Page 61

4.14.4 Unplugging the USB Cable
Safely Remove
Hardware Icon
CAUTION: To avoid possible electronic damage to the analyzer, it is not advisable to unplug the USB cable without
first turning OFF the PCA 2 USB connection using the
“Safely Remove Hardware” icon in the Windows XP system
tray.
Do the following before unplugging the
USB cable:
1. Double-click the “Safely Remove
Hardware” icon in the Windows XP
system tray.
2. If more than one USB device is
plugged into the computer, select
the device labeled “Bacharach PCA2
USB driver” and then click Stop.
3. Click OK to confirm that the device
is to be stopped.
Operation
4. Wait until “Bacharach PCA2 USB
driver” is removed from the screen,
and then click Close.
5. The USB cable can now be safely
unplugged.
Instruction 24-9448 4-27
Page 62

Operation
4.15 Importing Saved Data Into a Spreadsheet
Data that was recovered and saved as an ASCII text file with a “CSV”
extension, as described in Section 4.14, can easily be opened for viewing
in most spreadsheet programs by simply double-clicking the filename. For
example: double-clicking the filename Customer XYZ.csv should automatically open the spreadsheet program and display the contents of the file.
If the spreadsheet program does not recognize the “CSV” file extension,
then refer to the spreadsheet’s documentation for information on how to
manually import comma-delimited text files.
Table 4-2 contains a listing and description of the 27 data fields that are
downloaded with each data record. Note that for sensors that are not
installed, all related data fields for those sensors will be marked as “N/A”
(Not Applicable). For example: if the analyzer does not contain an SO2 sensor, then “N/A” will appear in data fields 19 and 20.
Instruction 24-94484-28
Page 63

TABLE 4-2. DOWNLOADED DATA FIELDS
Field Column Name Data Name or Value
1 Time Time of Test in 12 hour format (AM / PM)
2 Date Date of Test in mm/dd/yy
3 Fuel Fuel Name
4 %O2 Oxygen Level
5 CO Carbon Monoxide Level (see field 26)
6 ppm CO(O2) Carbon Monoxide Level referenced to a
% of O2 (see field 21)
7 %Efficiency Combustion Efficiency
8 %CO2 Carbon Dioxide Level
9 TStk Stack Temperature
10 TAir Primary / Ambient Air Temperature
11 TempUnit Temperature Units
12 %EA Excess Air
13 NO Nitric Oxide Level (see field 26)
14 ppm NO(O2) Nitric Oxide Level referenced to a % of O
(see field 22)
15 NO2 Nitrogen Dioxide Level (see field 26)
16 ppm NO2(O2) Nitrogen Dioxide Level referenced to a
% of O
(see field 22)
2
17 NOx Nitrogen Oxides (NO + NO2) (see field 26)
18 ppm NOx(O2) Nitrogen Oxides Level referenced to a
% of O
(see field 22)
2
19 SO2 Sulfur Dioxide (see field 26)
20 ppm SO2(O2) Sulfur Dioxide Level referenced to a
% of O
21 CO_O2Ref %O2 Reference for CO
22 NOx_O2Ref %O2 Reference for NOx
23 SO2_O2Ref %O2 Reference for SO
(see field 23)
2
(1)
(1)
(1)
2
24 Pressure Pressure (Draft) Value
25 Pressure Units Pressure Units of Measure
26 Pollution Units Pollution Units of Measure
(2)
(3)
27 PS Voltage Power Supply Voltage
28 NO Temp Nitric Oxide Sensor Temperature (4)
Operation
2
(1) %O2 reference as selected per Section 3.11
(2) Pressure units as selected per Section 3.7
(3) Pollution units as selected per Section 3.8
(4) Shown only on printout, not on LCD display.
Instruction 24-9448 4-29
Page 64

Operation
4.16 Printing Test Data
Combustion or pressure data that is currently being displayed can be sent
to a printer using IrDA protocol as described below.
Data that is stored in memory can also be printed by first displaying the
stored test data as described in Sections 4.13.1 & 4.13.2.
In addition to printing combustion and pressure data, the contents of any
screen that shows the label “PRINT” above the F1 button can be printed.
For example, the information shown in the DIAGNOSTIC screen can be
printed.
1. Turn ON printer. Refer to the printer’s instruction manual for detailed
operating information. If not already done, set up the printer for:
• 8 bit
• No parity
• 9600 baud
• IrDA is set to IrDA-SIR
• DTR handshaking
2. Align the printer with the top of the analyzer as shown in Figure 4-6.
3. Press the PRINT (F1) button to begin printing.
The printout shown in Figure 4-6 shows typical combustion-test results of an analyzer containing O2, CO
that since the CO
and SO2 sensors are not installed, three stars
HIGH
, NO, and NO2 sensors. Note
LOW
(∗∗∗) appear in their data fields.
Instruction 24-94484-30
Page 65

BACHARACH, INC.
PCA 2
SN: xxxxxx
=====================
TIME 01:00:00 PM
DATE 10/06/06
FUEL
NATURAL GAS
O2 4.0 %
CO 12 ppm
EFF 82.6 %
CO2 9.5 %
T-STACK 374 °F
T-AIR 68.0 °F
EA 21 %
NO 18 ppm
NO Temp 70.5 °F
NO2 6 ppm
NOX 24 ppm
SO2 ∗∗∗ ppm
CO(3) 13 ppm
NO(3) 19 ppm
NO2(3) 6 ppm
NOX(3) 25 ppm
SO2(3) ∗∗∗ ppm
PRESSURE – 0.25 inwc
COMMENTS:
PRINT MENU SAVE
3 to 18 in.
(7.62 to 45.72 cm)
Operation
Optional
pressure printout
as selected per
Section 3.12.
NOTES:
Three stars (∗∗∗) appear in the data
eld of sensors that are not calibrated
or defective, and in the data elds of
that sensor’s related calculated values.
Three hyphens or dashes (- - -) indicate
that the calculated data cannot be
displayed because the measured data
necessary to make the calculation is
out of range (i.e., oxygen level above
16%).
Three (XXX) indicate sensor overrange.
Figure 4-3. Printer Alignment & Sample Printout
Instruction 24-9448 4-31
Page 66

Operation
Notes:
Instruction 24-94484-32
Page 67

Calibration
5 Calibration
IMPORTANT: Before performing any calibration procedure,
ensure that fresh batteries are installed or use the optional AC
power adapter. Also ensure that the analyzer is at room temperature and will be sampling fresh air when turned ON.
5.1 Smart Sensors
The PCA 2 uses Bacharach’s new “Smart Sensor” technology, meaning
that the calibration data for each sensor is stored in nonvolatile memory
on the sensor’s printed circuit board.
Benefits of Smart Sensors:
New sensors can be installed without needing to be calibrated.
•
Sensors can be pre-calibrated and installed when needed.
•
Sensors can be moved from one analyzer to another.
•
The analyzer’s diagnostics screen shows what sensors are installed,
•
and their current end-of-life condition (Good, Low, Bad).
Each sensor stores its calibration history and operating parameters,
•
which can be downloaded to a computer and analyzed. This information is useful in determining when the sensor was last calibrated, and
predicting its end-of-life.
The smart sensors should be calibrated by an authorized Bacharach
Service Center (Section
continues to meet its published accuracy specifications. The smart sensors,
however, can be calibrated in the field if your facility has the necessary
equipment and qualified personnel to perform the procedures described in
the following sections of this instruction manual.
8.3) every 6 months to assure that the analyzer
5.2 Starting a Calibration
Start any calibration procedure by doing the following:
1. Place the probe in an area of fresh air, turn ON the analyzer, allowing
it to cycle through its 60 second warm-up period. During warm-up,
the analyzer’s operation is checked and the sensors are set to the following ambient conditions:
Oxygen sensor spanned to 20.9%
•
All gas sensors are zeroed
•
The pressure sensor is zeroed
•
Instruction 24-9448 5-1
Page 68

Calibration
MAIN MENU
FUEL
PRESSURE
MEMORY
SETUP
CALIBRATION
DIAGNOSTICS
STATUS
F1 F2 F3
MENU
ERRORS DETECTED
Low Battery
MENU
F1 F2 F3
Any errors detected during warm-up will
be listed on the display immediately following warm-up. For example, the screen
to the right shows that the battery is low.
Correct any errors before proceeding. Refer
to Section 7.3 for a listing of error messages
and their meaning.
2. Display the MAIN MENU by pressing the
MENU (F2) button. If necessary, press ESC
until MENU appears above F2.
3. Use the buttons to highlight
CALIBRATION, and then press ENT to display the CALIBRATION LIST screen.
4. Use the buttons to highlight the sensor to
be calibrated, and then perform the calibration procedure for that sensor as described in
the following sections.
5.3 Pressure Sensor Calibration
This procedure calibrates the pressure sensor to a known pressure value.
Material Required:
Bellows
•
Manometer
•
Range: ±8 in. of water column (±20 mb)
Accuracy: ±0.01 in. of water column (±0.025 mb)
-
Procedure:
NOTE: The unit-of-measure for pressure is selected per
Section 3.7. In the following procedure inwc is selected, but note
that any unit-of-measure can be used for calibration purposes.
1. Assemble the pressure sensor calibration equipment as shown in
Figure 5-1, but DO NOT connect the analyzer to the calibration equip-
ment at this time.
2. If not already done, turn ON the analyzer and display the
CALIBRATION LIST screen per Section 5.2.
3. Use the buttons to highlight Pressure, and then press ENT to dis-
Instruction 24-94485-2
Page 69

play the CALIBRATE PRESSURE screen.
POWER
P
T-STACK T-AIR
GAS
4
3
2
1
0
-1
-2
-3
-4
Parts:
1. 3/16" I.D. Tubing
2. Tee
3. Barbed Hose Connector
4. Bellows
5. Manometer
1
2
3
4
5
CALIBRATE PRESSURE
Measured 0.00 inwc
Applied -4.00 inwc
06/27/06 11:55:30 PM
PRINT
F1 F2 F3
CALIBRATION LIST
Pressure
T-Stack
T-Air
CO-LO
SO2
NO
NO2
(more)
MENU
F1 F2 F3
“Measured” is the pressure value currently
being detected by the pressure sensor, while
“Applied” is a known value of pressure that
will be applied for calibration purposes.
4. With both the –∆P and +∆P ports open to
the atmosphere, observe that the current
Measured pressure reading should be 0
±0.01 inwc. If necessary, zero the pressure
sensor per Section 4.6, and repeating Steps 2
thru 4.
5. Connect the hose from the manometer to
the +∆P port and apply a negative pressure
to this port by adjusting the bellows for a
manometer reading of –4.00 ±2.00 inwc.
6. Use the and buttons to enter an
Applied value that exactly equals the
manometer reading.
The calibration range is from –6 to –2 inwc
(–15 to –5 mb). An attempt to calibrate outside this range will cause
the message “Bad Calibration Wrong CAL Entry” to appear in the following step.
Calibration
7. Wait until the Measured reading stabilizes, and then press ENT to calibrate the pressure sensor’s Measured value to that of the Applied value;
after which the message “Good Calibration” should briefly appear followed by the CALIBRATION LIST screen being re-displayed.
8. Remove calibration equipment.
Instruction 24-9448 5-3
Figure 5-1. Pressure Sensor Calibration Equipment
Page 70

Calibration
CALIBRATION LIST
Pressure
T-Stack
T-Air
CO-LO
SO2
NO
NO2
(more)
MENU
F1 F2 F3
5.4 T-Stack Calibration
This procedure first zeros and then spans the stack-temperature channel
to known temperature values.
The use of an electronic thermocouple simulator is the preferred method of
producing the desired calibration temperatures. Alternatively, containers
of ice water and boiling water can be used.
Material Required:
Thermocouple Simulator (K-type)
•
Range: 0 to 600 °F
Accuracy: ±0.5 °F
-
(Alternatively) Ice-Water, Boiling Water, Thermometer
•
TS-Zero Procedure:
1. Set thermocouple simulator to room temperature and plug its output
into the T-STACK connector located at the bottom of the analyzer.
Alternatively: Plug the probe’s thermocouple into the T-STACK con-
nector located at the bottom of the analyzer. DO NOT attach the
probe’s gas hose to the analyzer’s GAS port; otherwise water
will be drawn into the analyzer!
2. If not already done, turn ON the analyzer and display the
CALIBRATION LIST screen per Section 5.2.
3. Use the buttons to highlight T-Stack, and
then press ENT to display the CALIBRATE
TS-ZERO screen.
“Measured” is the current temperature read-
ing, while “Applied” is a known temperature
that will be applied for calibration purposes.
4. Set thermocouple simulator to 32 °F (0 °C),
and then use the and buttons to enter
an Applied value that exactly equals the setting of the simulator.
Alternatively: Submerge probe tip into an ice-water bath with a ther-
mometer, wait several minutes, and then use the and buttons to
enter an Applied value that exactly equals the thermometer reading.
The calibration range is from 32 to 41 °F (0 to 5 °C). An attempt to
calibrate outside this range will cause the message “Bad Calibration
Wrong CAL Entry” to appear in the following step.
Instruction 24-94485-4
Page 71

5. Wait until the Measured reading stabilizes,
CALIBRATE TS-ZERO
Measured 34 °F
Applied 032 °F
06/27/06 11:55:30 PM
PRINT
F1 F2 F3
CALIBRATE TS-SPAN
Measured 574 °F
Applied 572 °F
06/27/06 11:55:30 PM
PRINT
F1 F2 F3
and then press ENT to calibrate the TS-Zero
Measured value to that of the Applied value;
after which the message “Good Calibration”
should briefly appear followed by the
CALIBRATE TS-SPAN screen.
TS-Span Procedure:
6. Set thermocouple simulator to 572 °F
(300 °C), and then use the and buttons to enter an Applied value that exactly
equals the setting of the simulator.
Alternatively: Submerge probe tip into a con-
tainer of boiling water with a thermometer,
wait several minutes, and then use the
and buttons to enter an Applied value
that exactly equals the thermometer reading.
The calibration range is from 175 to 625 °F
(80 to 330 °C). An attempt to calibrate outside this range will cause
the message “Bad Calibration Wrong CAL Entry” to appear in the following step.
Calibration
7. Wait until the Measured reading stabilizes, and then press ENT to calibrate the TS-Span Measured value to that of the Applied value; after
which the message “Good Calibration” should briefly appear followed by
the CALIBRATION LIST screen being re-displayed.
Instruction 24-9448 5-5
Page 72

Calibration
CALIBRATION LIST
Pressure
T-Stack
T-Air
CO-LO
SO2
NO
NO2
(more)
MENU
F1 F2 F3
CALIBRATE TA-ZERO
Measured 33 °F
Applied 032 °F
06/27/06 11:55:30 PM
PRINT
F1 F2 F3
5.5 T-Air Calibration
This procedure first zeros and then spans the ambient-temperature channel to known temperature values.
The use of an electronic thermocouple simulator is the preferred method of
producing the desired calibration temperatures. Alternatively, containers
of ice water and boiling water can be used.
Material Required:
Thermocouple Simulator (K-type)
•
Range: 0 to 600 °F
Accuracy: ±0.5 °F
-
(Alternatively) Ice-Water, Boiling Water, Thermometer
•
TA-Zero Procedure:
1. Set thermocouple simulator to room temperature and plug its output
into the T-AIR connector located at the bottom of the analyzer.
Alternatively: Plug the probe’s thermocouple into the T-AIR connector
located at the bottom of the analyzer. DO NOT attach the probe’s
gas hose to the analyzer’s GAS port; otherwise water will be
drawn into the analyzer!
2. If not already done, turn ON the analyzer
and display the CALIBRATION LIST screen
per Section 5.2.
3. Use the buttons to highlight T-Air, and
then press ENT to display the CALIBRATE
TA-ZERO screen.
“Measured” is the current temperature read-
ing, while “Applied” is a known temperature
that will be applied for calibration purposes.
4. Set thermocouple simulator to 32 °F (0 °C),
and then use the and buttons to enter
an Applied value that exactly equals the setting of the simulator.
Alternatively: Submerge probe tip into an ice-
water bath with a thermometer, wait several
minutes, and then use the and buttons to enter an Applied value that exactly
equals the thermometer reading.
Instruction 24-94485-6
Page 73

Calibration
CALIBRATE TA-SPAN
Measured 210 °F
Applied 212 °F
06/27/06 11:55:30 PM
PRINT
F1 F2 F3
The calibration range is from 32 to 41 °F (0 to 5 °C). An attempt to
calibrate outside this range will cause the message “Bad Calibration
Wrong CAL Entry” to appear in the following step.
5. Wait until the Measured reading stabilizes, and then press
ENT to
calibrate the TA-Zero Measured value to that of the Applied value;
after which the message “Good Calibration” should briefly appear followed by the CALIBRATE TA-SPAN screen.
TA-Span Procedure:
6. Set thermocouple simulator to 212 °F
(100 °C), and then use the and buttons to enter an Applied value that exactly
equals the setting of the simulator.
Alternatively: Submerge probe tip into a con-
tainer of boiling water with a thermometer,
wait several minutes, and then use the
and buttons to enter an Applied value
that exactly equals the thermometer reading.
The calibration range is from 194 to 230 °F (90 to 110 °C). An attempt
to calibrate outside this range will cause the message “Bad Calibration
Wrong CAL Entry” to appear in the following step.
7. Wait until the Measured reading stabilizes, and then press
ENT to
calibrate the TA-Span Measured value to that of the Applied value;
after which the message “Good Calibration” should briefly appear followed by the CALIBRATION LIST screen being re-displayed.
Instruction 24-9448 5-7
Page 74

Calibration
CALIBRATION LIST
Pressure
T-Stack
T-Air
CO-LO
SO2
NO
NO2
(more)
MENU
F1 F2 F3
CALIBRATE CO
Measured 480 PPM
Applied 500 PPM
06/27/06 11:55:30 PM
PRINT
F1 F2 F3
5.6 CO-LO Sensor Calibration
Note that the CO-LO sensor also measures H2 for the purpose of compensating the CO reading for the presence of H2 in the gas sample. This
procedure first spans the CO-LO sensor and, optionally, spans the H2 part
of the sensor to known gas levels.
Material Required:
Calibration Kit, P/N 24-7059
•
Gas Cylinder: 500 ppm CO in air, P/N 24-0492
•
Gas Cylinder: 1,000 ppm CO & 1,000 ppm H2 in Nitrogen, P/N 24-0794
•
Procedure:
1. If not already done, turn ON the analyzer and display the
CALIBRATION LIST screen per Section 5.2.
2. Use the buttons to highlight CO-LO, and
then press ENT to display the CALIBRATE
CO screen.
“Measured” is the current CO reading, while
“Applied” is a known CO level that will be
applied for calibration purposes.
3. Attach a 500 ppm CO cylinder to the regulator of the calibration fixture shown in
Figure 5-2 on Page 5-14.
4. Use the and buttons to enter an
Applied value that exactly equals the concentration stamped on the CO cylinder.
The calibration range is from 250 to
1,000 ppm. An attempt to calibrate outside
this range will cause the message “Bad
Calibration Wrong CAL Entry” to appear in
the following step.
5. Adjust the regulator for a flowmeter indication of approximately 2 SCFH. Wait until
the Measured reading stabilizes (approximately 3 minutes), and then
press ENT to calibrate the CO Measured value to that of the Applied
value. The message “Good Calibration” should briefly appear followed
by the TEST GAS CO/H2 screen.
If the sensor’s output is low, but still usable, then the message “Good
Calibration WARNING Low Sensor” will appear. The sensor will now
be marked as being Low in the DIAGNOSTICS screen.
Instruction 24-94485-8
Page 75

Calibration
TEST GAS CO/H2
Enter CO VALUE
1000 PPM
06/27/06 11:55:30 PM
PRINT
F1 F2 F3
CALIBRATE H2
Measured 1000 PPM
Applied 1000 PPM
06/27/06 11:55:30 PM
PRINT
F1 F2 F3
If the sensor’s output is too low to be usable, then the message “Bad
Calibration Sensor End of Life, Entry Not Saved” will appear. The sensor will now be marked as being BAD in the DIAGNOSTICS screen.
NOTE: H2 calibration can be bypassed by pressing the ESC
button, after which the CALIBRATION LIST screen is re-displayed. Skip to Step 10 if the ESC button was pressed.
6. Turn OFF the regulator of calibration fixture and remove the CO
cylinder.
7. Attach a combination 1,000 ppm CO and
1,000 ppm H2 cylinder to the regulator of the
calibration fixture, and then use the and
buttons to enter an Applied value that
exactly equals the CO concentration stamped
on the cylinder.
8. Adjust the regulator for a flowmeter indication of approximately 2 SCFH, and then press
ENT to display the CALIBRATE H
screen.
2
The calibration range is from 400 to 1,500 ppm. An attempt to cali-
brate outside this range will cause the message “Bad Calibration
Wrong CAL Entry” to appear in the following step.
9. Wait until the Measured reading stabilizes
(approximately 3 minutes), and then press
ENT to calibrate the H
Measured value to
2
that of the Applied value; after which the
message “Good Calibration” should briefly
appear followed by the CALIBRATION LIST
screen being re-displayed.
If the sensor’s output is low, but still
usable, then the message “Good Calibration
WARNING Low Sensor” will appear. The
sensor will now be marked as being Low in
the DIAGNOSTICS screen.
If the sensor’s output is too low to be usable, then the message
“Bad Calibration Sensor End of Life” will appear followed by the
CALIBRATION LIST screen being re-displayed. The sensor will now
be marked as being BAD in the DIAGNOSTICS screen.
10. Turn OFF the regulator and remove the gas cylinder.
Instruction 24-9448 5-9
Page 76

Calibration
CALIBRATION LIST
Pressure
T-Stack
T-Air
CO-LO
SO2
NO
NO2
(more)
MENU
F1 F2 F3
CALIBRATE SO2
Measured 98 PPM
Applied 100 PPM
06/28/06 11:55:30 PM
PRINT
F1 F2 F3
5.7 SO2 Sensor Calibration
This procedure spans the optional sulfur dioxide sensor to a known
gas level.
Material Required:
Calibration Kit, P/N 24-7059
•
Gas Cylinder: 100 ppm SO2 in Nitrogen, P/N 24-1158
•
Procedure:
1. If not already done, turn ON the analyzer and display the
CALIBRATION LIST screen per Section 5.2.
2. Use the buttons to highlight SO2, and
then press ENT to display the CALIBRATE
SO2 screen.
“Measured” is the current SO2 reading, while
“Applied” is a known SO2 level that will be
applied for calibration purposes.
3. Attach a 100 ppm SO
cylinder to the regu-
2
lator of the calibration fixture shown in
Figure 5-2 on Page 5-14.
4. Use the and buttons to enter an
Applied value that exactly equals the concentration stamped on the SO2 cylinder.
The calibration range is from 9 to 150 ppm.
An attempt to calibrate outside this range will
cause the message “Bad Calibration Wrong
CAL Entry” to appear in the following step.
5. Adjust regulator for a flowmeter indication
of approximately 2 SCFH. Wait until the
Measured reading stabilizes (approximately
3 minutes), and then press ENT to calibrate the SO2 Measured value
to that of the Applied value. The message “Good Calibration” should
briefly appear followed by the CALIBRATION LIST screen being
re-displayed.
If the sensor’s output is low, but still usable, then the message “Good
Calibration WARNING Low Sensor” will appear. The sensor will now
be marked as being Low in the DIAGNOSTICS screen.
Instruction 24-94485-10
Page 77

Calibration
CALIBRATION LIST
Pressure
T-Stack
T-Air
CO-LO
SO2
NO
NO2
(more)
MENU
F1 F2 F3
CALIBRATE NO
Measured 245 PPM
Applied 250 PPM
06/28/06 11:45:30 PM
PRINT
F1 F2 F3
If the sensor’s output is too low to be usable, then the message “Bad
Calibration Sensor End of Life, Entry Not Saved” will appear followed
by the CALIBRATION LIST screen being re-displayed. The sensor will
now be marked as being BAD in the DIAGNOSTICS screen.
6. Turn OFF regulator and remove gas cylinder.
5.8 NO Sensor Calibration
This procedure spans the optional nitric oxide sensor to a known gas level.
Material Required:
Calibration Kit, P/N 24-7059
•
Gas Cylinder: 250 ppm NO in Nitrogen, P/N 24-1156
•
Procedure:
1. If not already done, turn ON the analyzer and display the
CALIBRATION LIST screen per Section 5.2.
2. Use the buttons to highlight NO, and
then press ENT to display the CALIBRATE
NO screen.
“Measured” is the current NO reading, while
“Applied” is a known NO level that will be
applied for calibration purposes.
3. Attach a 250 ppm NO cylinder to the regulator of the calibration fixture shown in
Figure 5-2 on Page 5-14.
4. Use the and buttons to enter an
Applied value that exactly equals the concentration stamped on the NO cylinder.
The calibration range is from 9 to 550 ppm.
An attempt to calibrate outside this range will
cause the message “Bad Calibration Wrong
CAL Entry” to appear in the following step.
5. Adjust regulator for a flowmeter indication
of approximately 2 SCFH. Wait until the
Measured reading stabilizes (approximately
3 minutes), and then press ENT to calibrate the NO Measured value
to that of the Applied value. The message “Good Calibration” should
Instruction 24-9448 5-11
Page 78

Calibration
CALIBRATION LIST
(more)
T-Air
CO-LO
SO2
NO
NO2
CO-HI
T-Ref
MENU
F1 F2 F3
CALIBRATE NO2
Measured 96 PPM
Applied 100 PPM
06/28/06 11:45:30 AM
PRINT
F1 F2 F3
briefly appear followed by the CALIBRATION LIST screen being
re-displayed.
If the sensor’s output is low, but still usable, then the message “Good
Calibration WARNING Low Sensor” will appear. The sensor will now
be marked as being Low in the DIAGNOSTICS screen.
If the sensor’s output is too low to be usable, then the message “Bad
Calibration Sensor End of Life, Entry Not Saved” will appear followed
by the CALIBRATION LIST screen being re-displayed. The sensor will
now be marked as being BAD in the DIAGNOSTICS screen.
6. Turn OFF regulator and remove gas cylinder.
5.9 NO2 Sensor Calibration
This procedure spans the optional nitrogen dioxide sensor to a known
gas level.
Material Required:
Calibration Kit, P/N 24-7059
•
Gas Cylinder: 100 ppm NO2 in Nitrogen, P/N 24-1157
•
Procedure:
1. If not already done, turn ON the analyzer
and display the CALIBRATION LIST screen
per Section 5.2.
2. Use the buttons to highlight NO2, and
then press ENT to display the CALIBRATE
NO2 screen.
“Measured” is the current NO2 reading, while
“Applied” is a known NO2 level that will be
applied for calibration purposes.
3. Attach a 100 ppm
NO2 cylinder to the
regulator of the calibration fixture shown in
Figure 5-2 on Page 5-14.
4. Use the and buttons to enter an
Applied value that exactly equals the concentration stamped on the NO2 cylinder.
The calibration range is from 9 to 150 ppm.
An attempt to calibrate outside this range will
Instruction 24-94485-12
Page 79

Calibration
CALIBRATION LIST
(more)
T-Air
CO-LO
SO2
NO
NO2
CO-HI
T-Ref
MENU
F1 F2 F3
cause the message “Bad Calibration Wrong CAL Entry” to appear in the
following step.
5. Adjust regulator for a flowmeter indication of approximately 2 SCFH.
Wait until the Measured reading stabilizes (approximately 3 minutes),
and then press ENT to calibrate the NO2 Measured value to that of the
Applied value. The message “Good Calibration” should briefly appear
followed by the CALIBRATION LIST screen being re-displayed.
If the sensor’s output is low, but still usable, then the message “Good
Calibration WARNING Low Sensor” will appear. The sensor will now
be marked as being Low in the DIAGNOSTICS screen.
If the sensor’s output is too low to be usable, then the message “Bad
Calibration Sensor End of Life, Entry Not Saved” will appear followed
by the CALIBRATION LIST screen being re-displayed. The sensor will
now be marked as being BAD in the DIAGNOSTICS screen.
6. Turn OFF regulator and remove gas cylinder.
5.10 CO-HI Sensor Calibration
This procedure spans the optional carbon monoxide high sensor (4,001 to
20,000 ppm) to a known gas level.
Material Required:
Calibration Kit, P/N 24-7059
•
Gas Cylinder: 4,000 ppm CO in Air, P/N 24-1155
•
Procedure:
1. If not already done, turn ON the analyzer and display the
CALIBRATION LIST screen per Section 5.2.
2. Use the buttons to highlight CO-HI, and
then press ENT to display the CALIBRATE
CO-HI screen.
“Measured” is the current CO reading, while
“Applied” is a known CO level that will be
applied for calibration purposes.
3. Attach a 4,000 ppm CO cylinder to the
regulator of the calibration fixture shown in
Figure 5-2 on Page 5-14.
Instruction 24-9448 5-13
Page 80

Calibration
CALIBRATE CO-HI
Measured 3895 PPM
Applied 4000 PPM
06/28/06 09:45:30 AM
PRINT
F1 F2 F3
Parts:
1. Gas Cylinder
2. Regulator *
3. 3/16" I.D. Tubing *
4. Tee *
5. Flowmeter *
6. Barbed Hose Connector *
* Part of Calibration Kit 24-7059
POWER
P
T-STACK T-AIR
GAS
Leave Top
Port Open
GAS Port
4. Use the and buttons to enter an
Applied value that exactly equals the concentration stamped on the CO cylinder.
The calibration range is from 250 to
11,000 ppm. An attempt to calibrate outside this range will cause the message “Bad
Calibration Wrong CAL Entry” to appear in
the following step.
5. Adjust regulator for a flowmeter indication of approximately 2 SCFH. Wait until
the Measured reading stabilizes (approximately 3 minutes), and then
press ENT to calibrate the CO Measured value to that of the Applied
value. The message “Good Calibration” should briefly appear followed
by the CALIBRATION LIST screen being re-displayed.
If the sensor’s output is low, but still usable, then the message “Good
Calibration WARNING Low Sensor” will appear. The sensor will now
be marked as being Low in the DIAGNOSTICS screen.
If the sensor’s output is too low to be usable, then the message “Bad
Calibration Sensor End of Life, Entry Not Saved” will appear followed
by the CALIBRATION LIST screen being re-displayed. The sensor will
now be marked as being BAD in the DIAGNOSTICS screen.
6. Turn OFF regulator and remove gas cylinder.
Figure 5-2. Gas Sensor Calibration Equipment
Instruction 24-94485-14
Page 81

Maintenance
6 Maintenance
Customer maintenance of the PCA 2 is limited to the following:
Battery replacement or charging using AC power adapter (Section 3.2)
•
Sensor re-calibration (Section 5)
•
Water trap / filter assembly maintenance (Section 6.2)
•
Sensor replacement (Section 6.3)
•
Probe thermocouple replacement (Section 6.6)
•
Pump (gas or purge) replacement (Section 6.7)
•
Cleaning the probe (Section 6.8)
•
All other maintenance should be performed by an authorized Bacharach
Service Center. Refer to Section 8.3.
Instruction 24-9448 6-1
Page 82

Maintenance
Rear Case Screws
(typical 4 places)
Release and then
remove battery
cover by pushing
latch up
6.1 PCA 2 Disassembly
The following procedure describes how to disassemble the analyzer, while
Figures 6-1 thru 6-4 illustrate how the analyzer is put together.
Tools Required:
Medium Phillips Screwdriver
•
Procedure:
1. Unplug all thermocouples from
bottom of analyzer.
2. Remove battery cover and then
remove batteries.
TIP: In Step 3, if the sensors are
not being replaced, leave the tubing
connected to each sensor’s gas cap,
being careful not to put unnecessary strain on the tubing during the
disassembly process.
3. Pull off sensor retainer; and
Figure 6-1. Removing Rear Case
then unplug all sensors.
4. Lay analyzer face down on a padded work surface; and then using a
medium Phillips screwdriver, remove the unit’s four rear-case screws.
5. Lift rear case from analyzer and set aside.
6. Unplug electrical connectors J8, J9, and J14 from printed circuit
board.
CAUTION: In Step 7, note that there is tubing connected
between the bottom hose-connector plate and the pressure sensor
on the printed circuit board. Do not put unnecessary strain on
this tubing during the disassembly process.
7. Carefully lift battery-and-pump chassis, along with the bottom hose-
8. Lift printed circuit board from analyzer.
connector plate, from analyzer.
Instruction 24-94486-2
Page 83

Sensor Positions
Sensor Retainer
Purge Pump
Gas Pump
GAS
Purge Air In
Pressure
+∆P
–∆P
Battery & Pump
Chassis
Hose Connector
Plate
Purge Pump
Motor Connector
Gas Pump
Motor Connector
Sensors
Type and position
determined by
model number
Battery Connector
on printed circuit board
Pressure Sensor
on printed circuit board
+∆P (Top)
–∆P (Bottom)
Model
P/N
Position
#1 O
#2 COLOCOLOCOLOCOLOCOLOCO
#3 SO2NO2SO
#4 NO CO
225
24-7301
2
235
24-7302
O
2
245
24-7303
O
255
24-7304
2
HI
O
2
265
24-7305
NO NO
Maintenance
275
24-7306
O
O
2
2
LO
2
Figure 6-2. Inside View with Rear Case Removed
Instruction 24-9448 6-3
Page 84

Maintenance
Models 235 & 245
P/Ns 24-7302 & 24-7303
Model 255
P/N 24-7304
Models 265 & 275
P/Ns 24-7305 & 24-7306
Model 225
P/N 24-7301
PRESSURE SENSOR
on printed circuit board
–∆P
+∆P
–∆P (Bottom)
+∆P (Top)
PRESSURE
PURGE AIR
GAS
Gas IN
GAS PUMP
PURGE PUMP
Gas OUT
OUTIN
To Sensors
Figure 6-3. Tubing Connections
Instruction 24-94486-4
Page 85

Maintenance
Solder
(2 Places)
Red dot on pump
indicates positive
(red wire) connection
Battery
to J14
Battery
to J14
Gas
Pump
to J8
Purge
Pump
to J9
Sensor Connector
(typical 4 places)
Factory Test
Connector
LCD Connector
(opposite side of board)
Ribbon Cable Conection
between LCD Assembly and
Printed Circuit Board
Lock Tabs
(both ends)
J8
J9
J14
Wire Routing
Solder Connections
Connectors
Instruction 24-9448 6-5
Figure 6-4. Wiring
Page 86

Maintenance
FILTER
ELEMENT
“A” “B”
Pry apart
filter chamber
using a small
flat-blade
screwdriver
inserted into
notch
When reassembling filter chamber,
make sure surfaces
“A” and “B” contact
each other
WATER
TRAP
CHAMBER
FILTER
CHAMBER
Pull apart
using a
twisting
motion.
DO NOT
rock back
and forth!
6.2 Water Trap / Filter Maintenance
6.2.1 Emptying the Water Trap Chamber
The water trap chamber should be emptied after every test, or when the
water condensate approaches the tip of the riser tube (refer to Section 4.9).
1. Remove water trap chamber per Figure 6-5.
2. Pour out liquid condensate, and then reassemble trap.
6.2.2 Replacing the Filter Element
Replace the filter element when it becomes visibly dirty or becomes saturated with water.
Material Required: • Filter Element, P/N 07-1644
• Small Flat Blade Screwdriver
1. Remove water trap chamber per Figure 6-5.
2. Pry apart filter chamber using a small flat-blade screwdriver. Remove
and discard old filter.
3. Install new filter and reassemble filter chamber, making sure that
surfaces “A” and “B” contact each other.
4. Reassemble trap.
Figure 6-5. Disassembling the Water Trap / Filter Assembly
Instruction 24-94486-6
Page 87

Maintenance
Gas Cup
Sensor Retainer
Sensor
and Printed
Circuit Board
Twist gas cap
bayonet fitting
counterclockwise
to release
Sensor electrical
connector mates with
pins on analyzer’s main
board
6.3 Smart Sensor Replacement
Bacharach’s Smart sensor technology allows new sensors to be installed
without needing to be calibrated inside the analyzer.
NOTE: Sensors may be purchased with and without the Smart sensor technology
PCB. See Section 6.4 on how to change just the sensor itself. Calibration must be
performed if the sensor is purchased without the Smart technology PCB. Refer to
Section 8.1 Replacement Parts for list of sensors and part numbers of both types.
Replace the oxygen sensor when its automatic calibration fails and the analyzer displays an O2 sensor error at the end of warm up. Refer to Section 4.2.
NOTE: The O2 sensor and PCB is not Smart sensor technology. Only the sensor itself, not the PCB, needs to be purchased when the sensor needs replaced.
Replace a gas sensor when it can no longer be calibrated, as evidenced by
“Bad Calibration Sensor End of Life” being displayed during its calibration
procedure. Refer to Sections 5.6 thru 5.10.
Refer to Section 8.1 for a listing of sensor part numbers. Also, see
Figure 6-2 on page 6-3 for sensor positions.
Do the following to replace a Smart sensor:
1. Turn OFF the analyzer.
2. Remove the battery cover.
3. Remove the sensor retainer.
4. Remove the tubing from the gas
cup of sensor being replaced.
5. Unplug the sensor along with
its printed circuit board from
the analyzer’s main board.
6. Remove the sensor’s gas cup
by twisting its bayonet fitting
counterclockwise, and then
pulling the cup straight up.
7. Attach the gas cup to new sensor, making sure that when the
sensor is plugged into analyzer’s main board, the tubing connections on top of gas cup are aligned
as shown in Figure 6-3 on page 6-4.
8. Plug the sensor into analyzer; and then reattach tubing to gas cup.
9. Install the sensor retainer and battery cover.
10. Turn ON the analyzer and confirm that no sensor errors occur during
warm up.
Instruction 24-9448 6-7
Page 88

Maintenance
Gas Cup
Sensor Retainer
Sensor
Twist gas cap
bayonet fitting
counterclockwise
to release
Sensor electrical
connector mates with
pins on analyzer’s main
board
Printed
Circuit Board
Adhesive
foam
disk
Be sure to remove any
shorting spring from the
new sensor pins before
installing! There is no
shorting spring on the
O2 or NO sensors.
6.4 Sensor Only Replacement
All sensors are replaced in a similar manner. Do the following to
1.
replace either the O2, CO-LO, CO-HI, NO, NO2, or SO2 sensor. Refer
to Section 8.1 Replacement Parts for list of sensors and part numbers.
Turn OFF the analyzer.
2.
Remove the battery cover.
3.
Remove the sensor retainer.
4.
Remove the tubing from the gas cup of sensor being replaced.
5.
Unplug the sensor along with its printed circuit board from the analyz-
6.
er’s main board.
Remove the sensor’s gas cup by twisting its bayonet fitting counter-
7.
clockwise, and then pulling the cup straight up.
Carefully remove the old sensor from the Smart sensor PCB, keeping
8.
in mind that there is an adhesive foam disk in between the PCB and
sensor. Gently remove any adhesive from from the PCB.
Important! When replacing the O2 sensor, be sure that the “+” sensor
pin plugs into the PCB socket that is also marked “O2+”.
When replacing an NO sensor, also replace the bias battery.
9. Remove the replacement sensor from its plastic canister. Note that
the CO-LO, CO-HI, SO2,
and NO2 sensors have a
shorting-spring installed
between two of their pins.
Remove and discard this
spring before installing the
sensor.
10. Place the adhesive disk on
the bottom of the new sensor and plug the new sensor into the sensor PCB.
11. Attach the gas cup to new
sensor, making sure that
when the sensor assembly
is plugged into the analyzer’s main board, the tubing
connections on top of gas
cup are aligned as shown
in Figure 6-3 on page 6-4.
Instruction 24-94486-8
Page 89

Maintenance
12. Plug the sensor into analyzer; and then reattach tubing to gas cup.
13. Install the sensor retainer and battery cover.
12. Allow the sensor that was just installed time to stabilize in the circuit
before continuing with this procedure. Stabilization time for all sensors (except for the NO sensor) is about 1 hour. The NO sensor baseline
technically requires several days to stabilize but should be sufficiently
stabilized for use in approximately 4 hours.
13. Turn ON the analyzer and confirm that no sensor errors occur during
warm up.
Note: Discard an old sensor in accordance with local and federal hazardous waste disposal laws.
14. Calibrate the new sensor(s) per Section 5 (except the O2 sensor which
does not require calibration).
Instruction 24-9448 6-9
Page 90

Maintenance
6.5 Nitric Oxide Sensor Battery Replacement
A single lithium battery, located on the NO Smart Sensor assembly, applies
a bias voltage to the NO sensor to prevent the sensor from destabilizing
when the analyzer is turned off. The NO bias battery is expected to last at
least the life of the NO sensor.
Note: It is recommended that the bias battery be replaced whenever the NO
sensor is replaced.
Material Required:
• Bias battery (refer to Section 8.1 Replacement Parts)
Procedure:
1. Follow the instructions in Section 6.3 Smart Sensor Replacement to
remove the Smart Sensor assembly from position 4.
2. Remove the old battery from its holder on the Nitric Oxide printed
circuit board.
3. Insert the new battery with the positive side facing away from the
sensor (the battery contact is stamped with a + symbol) .
4. Re-install the Smart Sensor assembly.
5. Before powering up and using the analyzer, allow the Nitric Oxide
sensor to stabilize as described below. Note that recalibration of the
Nitric Oxide sensor is not required after replacing its bias battery.
Depending on how long the Nitric Oxide sensor was without bias
voltage, the time required for the sensor to completely stabilize varies
from less than a minute to several days. Typical stabilization times
are shown below. Generally, however, the sensor is sufficiently stable
after 4 hours for measurement purposes.
Bias battery removed for . . . Stabilization time
Less than 15 minutes Less than 1 minute
Less than 1 hour Less than 5 minutes
Less than 2 days Less than 4 hours
Greater than 2 days Up to 2 days
Instruction 24-94486-10
Page 91

Maintenance
Probe Handle
Screws
6.6 Thermocouple Replacement
Using the appropriate thermocouple replacement kit listed below, replace
the probe’s thermocouple as follows:
Thermocouple Replacement Kits:
Part Number Replaces Thermocouple in a
Probe with a Tube Length of . . .
24-8413 6 inches
24-8414 12 inches
24-8415 24 inches
24-8416 36 inches
Each kit contains a thermocouple assembly, two O-rings, and two wiresplice connectors.
Tools Required:
• Small Flat Blade Screwdriver
• Wire Cutter
• Wire Stripper
• Slip Joint Pliers
Procedure:
1. Gain access to the thermocouple connections by first removing three
screws from probe handle, and then separating the two handle pieces.
2. Cut wires attached to old crimp connectors, leaving behind as much of
the probe’s thermocouple-connector wire as possible.
Figure 6-6. Probe Handle Disassembly
Instruction 24-9448 6-11
Page 92

Maintenance
O-Rings
Thermocouple Assembly
Ensure end of Thermocouple is
in front of plastic rib in handle
Wire-Splice Connectors
Red and Yellow
Thermocouple Wires
Cut away view of Thermocouple
inserted into Probe Body
When reassembling probe
handle, ensure that the thermocouple wires do not become
pinched around screw hole or
edge of handle
3. Pull old thermocouple from probe body and discard.
4. The new thermocouple has been coiled for shipping purposes.
Straighten the thermocouple using your thumb and index finger.
5. If not already done, install supplied O-Rings onto thermocouple.
6. Insert thermocouple into probe body until it “bottoms out.”
7. Strip 1/4 inch of insulation from each of the probe’s thermocouple
connector wires.
IMPORTANT: In Step 8, the thermocouple wires must first be
twisted together and then crimped.
8. Twist both red thermocouple wires together; insert them into the supplied wire-splice connector; and then crimp the connector using a pair
of pliers. Repeat this step for the yellow thermocouple wires.
9. Reassemble the probe handle, being careful not to pinch the thermocouple wires between the handle pieces. In addition, ensure that the
end of the thermocouple is in front of the rib molded into the bottom
handle piece; otherwise, the handle pieces will not fit tightly together.
Figure 6-7. Thermocouple Installation and Wiring
Instruction 24-94486-12
Page 93

Maintenance
–∆P
+∆P
–∆P (Bottom)
+∆P (Top)
PRESSURE
PURGE AIR
GAS
Gas IN
GAS PUMP LATCH
GAS PUMP
PURGE PUMP
Gas OUT
OUTIN
6.7 Pump Replacement
Parts & Tools Required:
Replacement Pump:
•
Gas Pump P/N 24-1393
Purge Pump P/N 3015-1716
-
Soldering Iron and Solder
•
Medium Phillips Screwdriver
•
Small Flat Blade Screwdriver
•
Procedure:
1. Gain access to both the gas and purge pumps by removing the rear
case. Refer to Section 6.1.
2. Unsolder the red and black wires from pump being replaced. Note that
during installation of the new pump, the red dot on the pump motor
indicates the positive (red wire) connection.
3. Do one of the following:
• Gas Pump Removal: Push pump latch toward bottom of analyzer
and lift gas pump out from its mounting location.
• Purge Pump Removal: Insert a small f lat blade screwdriver
between the purge pump motor and the pump chassis, and then pry
the pump out from its mounting location.
4. Remove tubing from pump.
3. Install new pump by reversing this procedure.
To Sensors
See Figure 6-3
Figure 6-8. Pump Tubing Connections
Instruction 24-9448 6-13
Page 94

Maintenance
6.8 Cleaning the Probe
The probe tube and gas-sample hose will become dirty under normal use.
Note that the water trap’s filter element should prevent soot from reaching
the analyzer’s internal components. If the probe is not kept clean, it could
become clogged and restrict the flow of gas into the analyzer, resulting in
incorrect combustion test readings and calculations.
NOTE: An analyzer that is used to test natural gas furnaces
normally requires less frequent cleaning than an analyzer used
for testing coal or oil fired furnaces.
Equipment Required:
Alcohol
•
Aerosol Can of Automotive Carburetor Cleaner
•
Clean Rag
•
Source of Compressed Air (optional)
•
Procedure:
1. Remove gas-sample hose from top of water trap.
CAUTION: Carburetor cleaner attacks plastic components!
Take precautions not to spray cleaner onto the probe handle or
analyzer.
2. Insert the plastic-spray tube of the carburetor cleaner into the gassample hose, and then liberally spray carburetor cleaner through the
hose and out the probe tube.
3. After spraying, remove all the residual cleaner by repeatedly flushing
the gas hose and probe tube with alcohol.
4. Wipe off the surfaces of the probe and tubing with a clean rag.
5. Allow the parts to dry completely. If available, blow compressed air
through the probe to expedite the drying process.
6. Reconnect gas-sample hose to top of water trap.
Instruction 24-94486-14
Page 95

Notes:
Maintenance
Instruction 24-9448 6-15
Page 96

Troubleshooting
7 Troubleshooting
7.1 Analyzer Repair
It is recommended that field repair of the PCA 2 be limited to:
Checks of printed circuit board connectors
•
Replacing the probe assembly
•
Replacing the filter element in the water trap / filter assembly
•
Replacing sensors
•
Replacing either the gas or purge pump
•
Information on how to perform these repairs is provided in Section 6.
All other repairs should be performed by an authorized Bacharach Service
Center (refer to Section 8.3). Any repairs performed by an unauthor-
ized service organization will void the analyzer’s warranty and release
Bacharach, Inc. of any implied or written product liability.
7.2 Error Symbols
Error symbols are shown in the data fields of the Combustion Test screens
and on the printout to indicate the following:
“- - -” Three hyphens or dashes indicates that the calculated data can-
not be displayed because the measured data necessary to make
the calculation is out of range. For calculations to occur, the oxygen level must be below 16% and the stack temperature must be
below 2,000 °F (1,093 °C).
“∗ ∗ ∗” Three stars appear in the data field of sensors that are not
installed, defective, or found to be in overrange during warmup, and also in the data fields of that sensor’s related calculated
values. For example, if the data field of either the NO or NO2
sensor contains three stars, then the NOx data field will also
contain three stars.
"X X X" Indicates sensor overrange.
Instruction 24-9448 7-1
Page 97

Troubleshooting
7.3 Error Messages Displayed After Warm-Up
If there were problems detected during warm-up, error messages that
describe the nature of the problems are displayed immediately following the
analyzer’s 60 second warm-up period.
If problems were detected, the analyzer will not automatically switch to the
Combustion Test HOLD screen after warm-up. The analyzer, however, can
still be used to perform any test that does not depend on the sensor that is
in error. Press the RUN button to manually display the Combustion Test
HOLD screen, and then continue using the analyzer.
The following is a list of the error messages that may appear following
warm-up and their suggested remedies:
Low Battery – Battery voltage is low. Only several minutes of operating
time remain. Replace or charge batteries per Section 3.2.
O2 No Sensor – Oxygen sensor not installed, or has become unplugged from
its electrical connector. Install oxygen sensor per Figure 6-2 on Page 6-3.
O2 BAD Sensor – The oxygen sensor’s output is below 24 mV, signifying
that the sensor is depleted and needs replaced. Refer to Section 6.3.
No Smart Sensors – No gas sensors are installed. Install sensors per
Section 6.3.
Pressure Overrange – Pressure sensor measured a pressure that was
outside the range of ±3 inwc during warm-up. Ensure that probe tip is open
to the atmosphere during warm-up.
Ts Error – The probe’s thermocouple is not connected to the analyzer’s TSTACK connector.
Ts Overrange – The temperature measured during warm-up was outside
the range of –4 to 2,192 °F (–20 to 1,200 °C). Ensure that the probe is
correctly connected to the analyzer per Figure 3-2 on Page 3-3, and that
the probe is at room temperature during warm-up.
Ta Overrange – The temperature measured during warm-up by the
optional primary / ambient air thermocouple plugged into the analyzer's
T-AIR connector was outside the range of –4 to 212 °F (–20 to 100 °C).
Ensure that this thermocouple is at room temperature during warm-up.
UNCALIBRATED SENSORS – List of sensors that do not have a
calibration history stored on their printed circuit board. Calibrate each of
the sensors listed per Section 5.
Instruction 24-94487-2
Page 98

Troubleshooting
DIAGNOSTICS
O2 Value: 41mv Good
Smart Sensors
COLO cal Good Sensor
F1 F2 F3
PRINT MENU
STATUS
Firmware Ver 1.00
Model 225
Serial # LN1000
1 Smart Sensors
Battery Volt: 4.38 v
Ref Temp: 79.5 °F
No Errors
09/11/06 04:55:18 PM
PRINT MENU
7.4 Diagnostics and Status Screens
The DIAGNOSTICS screen lists the current status of all the SMART gas
sensors installed and the O2 sensor status and mV output.
The STATUS screen provides a quick reference of key items when
troubleshooting.
Instruction 24-9448 7-3
Page 99

Troubleshooting
Notes:
Instruction 24-94487-4
Page 100

Parts & Service
8 Parts & Service
8.1 Replacement Parts
Item
(Fig. 8-1) Description Part No.
1 Main PCB Assembly
2 LCD Module . . . . . . . . . . . . . . . . . . . . . . . . . . . . . . . . . . .24-1374
3 Rear Case . . . . . . . . . . . . . . . . . . . . . . . . . . . . . . . . . . . . .24-1381
4 Top Case . . . . . . . . . . . . . . . . . . . . . . . . . . . . . . . . . . . . . .24-1382
5 Battery Cover . . . . . . . . . . . . . . . . . . . . . . . . . . . . . . . . . .24-1383
6 Window . . . . . . . . . . . . . . . . . . . . . . . . . . . . . . . . . . . . . . .24-1385
7 LCD Frame . . . . . . . . . . . . . . . . . . . . . . . . . . . . . . . . . . . .24-1386
8 Keypad . . . . . . . . . . . . . . . . . . . . . . . . . . . . . . . . . . . . . . .24-1387
9 Chassis, Battery & Pump . . . . . . . . . . . . . . . . . . . . . . . .24-1388
10 Lens, Infrared . . . . . . . . . . . . . . . . . . . . . . . . . . . . . . . . . .24-1391
11 Pump, Sample Gas . . . . . . . . . . . . . . . . . . . . . . . . . . . . . .24-1393
12 Pump, Purge
13 Sensor Retainer
14 Hose Connector Plate (complete assembly) . . . . . . . . . .24-1419
14A Gas Fitting . . . . . . . . . . . . . . . . . . . . . . . . . . . . . . . . . . .24-1416
14B Pressure Fitting . . . . . . . . . . . . . . . . . . . . . . . . . . . . . .24-1415
14C Retaining ring . . . . . . . . . . . . . . . . . . . . . . . . . . . . . . . .02-2886
15 O-Ring, Gas Fitting . . . . . . . . . . . . . . . . . . . . . . . . . . . .105-5102
16 O-Ring, Pressure Fitting . . . . . . . . . . . . . . . . . . . . . . . .105-5103
17 Gas Covers:
17A O2 / SO2 / NO2 . . . . . . . . . . . . . . . . . . . . . . . . . . . . . . . .24-1421
17B CO-H2 . . . . . . . . . . . . . . . . . . . . . . . . . . . . . . . . . . . . . . .24-1422
17C NO / COHI . . . . . . . . . . . . . . . . . . . . . . . . . . . . . . . . . . . .24-1420
18 Smart Sensors (pre-calibrated):
18B CO-H2 . . . . . . . . . . . . . . . . . . . . . . . . . . . . . . . . . . . . . . .24-1395
18C COHI . . . . . . . . . . . . . . . . . . . . . . . . . . . . . . . . . . . . . . . .24-1397
18D NO . . . . . . . . . . . . . . . . . . . . . . . . . . . . . . . . . . . . . . . . .24-1401
18E NO2 . . . . . . . . . . . . . . . . . . . . . . . . . . . . . . . . . . . . . . . . .24-1399
18F SO2 . . . . . . . . . . . . . . . . . . . . . . . . . . . . . . . . . . . . . . . . .24-1398
. . . . . . . . . . . . . . . . . . . . . . . . . . . . . . . . 3015-1716
. . . . . . . . . . . . . . . . . . . . . . . . . . . .24-1371
. . . . . . . . . . . . . . . . . . . . . . . . . . . . . . . .24-1418
Instruction 24-9448 8-1
 Loading...