

Page 1
Test Receiver R&S®ESPI
Data sheet
Version
05.03
May
2009
Excellent test receiver features
◆ Choice of 7 detectors
◆ EMI measurement bandwidths
200 Hz, 9 kHz, 120 kHz, 1 MHz
◆ Pulse weighting with quasi-peak,
average and RMS average detector
in accordance with the latest
CISPR 16-1-1 edition
◆ For all commercial EMI standards
The precompliance standard up to 7 GHz
Extremely high measurement speed
◆ Measurement times
from 100 µs to 100 s
◆ Option: preselector and
20 dB preamplifier
Spectrum analyzer
◆ IF resolution bandwidths
from 10 Hz to 10 MHz
◆ Test routines for TOI, ACP, OBW,
CCDF
Outstanding performance features
◆ Total measurement uncertainty
– Spectrum analyzer mode: 0.5 dB
(without preselection)
– Receiver mode: <1.5 dB
◆ Displayed average noise level (DANL):
–155 dBm (1 Hz), f < 1 GHz
◆ NF = 21.5 dB (12 dB with preamplifier)
◆ Programmable scan tables
◆ Limit lines
◆ Transducer tables and sets
◆ Brilliant 21 cm TFT color display
Page 2
Precompliance Test Receiver/Spectrum Analyzer
R&S®ESPI...
◆ Optimized operating concept owing to
decades of experience in EMI test
receiver development
◆ Very high measurement speed
◆ High measurement accuracy
With the two ¸ESPI test receiver
models, the well-known advantages of
the ¸ESIB high-end compliance test
receivers/analyzers have been systematically implemented for the upper middleend.
Due to a common platform system, the
user has the additional benefits of the
¸FSP spectrum analyzer family which
is already in place. These benefits by far
exceed the capabilities and functions of
conventional precompliance test equipment.
The ¸ESPI defines the vital criteria,
such as functionality, measurement speed
and accuracy for middle-end equipment.
The use of innovative techniques, such as
the VLSI frontend and largely digital
signal processing, together with ASICs
developed by Rohde & Schwarz, has
resulted in a product with top-class
specifications and high reliability.
Outstanding features
TEST RECEIVER
◆ Peak, Quasi-Peak, Average, CISPR
Average, RMS and RMS Average
(max. 3 detectors simultaneously)
◆ EMI measurement bandwidths
200 Hz, 9 kHz, 120 kHz, 1 MHz
◆ Correct pulse weighting in line with
CISPR 16-1-1 from 10 Hz pulse repeti-
tion frequency
◆ For all commercial EMI standards
such as CISPR, EN, ETS, FCC, ANSI
C63.4, VCCI and VDE
◆ Option ¸ESPI-B2:
Preselector and 20 dB preamplifier
SPECTRUM ANALYZER
◆ Resolution bandwidths from 10 Hz
to 10 MHz (in 1/3/10 sequence)
◆ RMS detector for measurements on
digitally modulated signals
◆ Test routines for TOI, ACPR, OBW,
amplitude statistics
Unprecedented
measurement speed
◆ Fast detection of critical frequencies
through overview measurements:
– Measurement time 100 µs to 100 s
in receiver mode
– up to 16 000 s in analyzer mode
2 Test Receiver ¸ESPI
Page 3
...the standard in the EMI precompliance class
EMC-relevant
performance features
◆ Total measurement uncertainty
– Spectrum analyzer mode: 0.5 dB
(without preselection)
– Receiver mode: <1.5 dB
◆ Displayed average noise level (DANL):
–155 dBm (1 Hz), f < 1 GHz
◆ Noise figure 21.5 dB
(12 dB with preamplifier option)
◆ Overview measurements in spectrum
analyzer mode
◆ User-programmable scan tables
◆ Display of results and comparison
with standard-conforming limit lines
◆ Correction values for cable loss,
coupling networks and antennas
included as transducer factor
◆ Data reduction and modification of a
frequency list for weighted final measurement
◆ Bargraph display for different types of
detectors
◆ Overload indication
◆ Built-in AF demodulator
◆ EMI bandwidths in line with CISPR
◆ Brilliant 21 cm TFT color display
Precompliance has a name: R&S®ESPI3 and R&S®ESPI7
Features
The ¸ESPI 3 and ¸ESPI 7,
which are suitable for all commercial EMI
standards in line with CISPR, EN, ETS,
FCC, ANSI C63.4, VCCI and VDE, have
been specially designed for precompliance measurements in development. The
aim is to perform EMC diagnostic measurements on the devices under test as
quickly as possible and as accurately as
necessary and to document the results.
9 kHz 3 GHz
The final compliance test will then be
purely a formality. The advantages of test
receiver accuracy and selectivity combined with the measurement speed of a
spectrum analyzer define the crucial performance features for a new class of test
receivers.
¸ESPI 3: 9 kHz to 3 GHz
¸ESPI 7: 9 kHz to 7 GHz
These two models make it possible to
take products through the critical stages
of development and the EMC test plan
and still be on schedule for approval and
market launch.
¸ESPI 3
¸ESPI 7
7 GHz
The precompliance measuring instruments from Rohde & Schwarz provide the
functions that are required for in-house
test sequences:
◆ Manual measurement of EMI spectra
owing to the receiver-oriented
operating concept
◆ Semi-automatic measurements with
predefined scan and sweep tables
allowing interactive interruption
◆ Individual evaluation of critical fre-
quencies using markers and additional detectors assigned to the markers
which are simultaneously displayed
◆ Fully automatic interference measure-
ments in conjunction with external
EMI software packages from
Rohde & Schwarz, including, for instance, determination of the worst
case by automatic switchover of the
phase and protective ground settings
via the USER port for remote-controlled line impedance stabilization
networks
Test Receiver ¸ESPI 3
Page 4
Accuracy and reproducibility are also key
parameters for all applications of the
¸ESPI test receiver family.
The combination of test receiver and
spectrum analyzer provides an optimum
concept for precompliance measurements in development environments.
Standard-conforming EMI
measurements
Fitted with the optional preselector/preamplifier (¸ESPI-B2), all ¸ESPI
models feature an excellent dynamic
range compared with other precompliance solutions and are, therefore, able to
perform precise interference measurements with pulse repetition frequencies
(PRF) from 10 Hz in line with
CISPR 16-1-1.
¸ESPI-B2: preamplifier and preselection filters up to 3 GHz
The input stages of precompliance test equipment, which often feature
a rather poor overload capability, would be hopelessly overdriven
without a preselection unit. This is different with the ¸ESPI where,
in combination with preselection filter units, a low-noise preamplifier
comes after the filter module but before the mixer stage. It must be
possible to switch the preamplifier on/off as required, since in the case
of high signal levels, the dynamic range would be reduced by an amount
numerically equal to the gain. Where low signal levels are to be
expected, it is best to switch in the preamplifier. Since the Test
Receivers ¸ESPI operate both in the spectrum analyzer mode and in
the test receiver mode, both modes offer the choice of switching the
preamplifier on or off. In the receiver mode, the preselection filter
setting is fixed, whereas in the analyzer mode it can be selected.
Measurements to commercial EMI standards such as CISPR, EN 550xx, ETS, FCC,
ANSI C63.4, VCCI or VDE can be carried
out directly by comparing the EMI spectrum with the associated limit lines and
switching on the appropriate detectors
(PK, QP, CAV, AV, RMS-AV, RMS).
The detectors
Depending on the operating mode of the
¸ESPI 3 and ¸ESPI 7, i.e. spectrum analyzer or test receiver, the following detectors are available:
◆ Analyzer mode: MaxPeak, MinPeak,
AutoPeak, Sample, Quasi-Peak,
Average, CISPR Average, RMS,
RMS Average
◆ Receiver mode: MaxPeak, MinPeak,
Quasi-Peak, Average, CISPR Average,
RMS, RMS Average
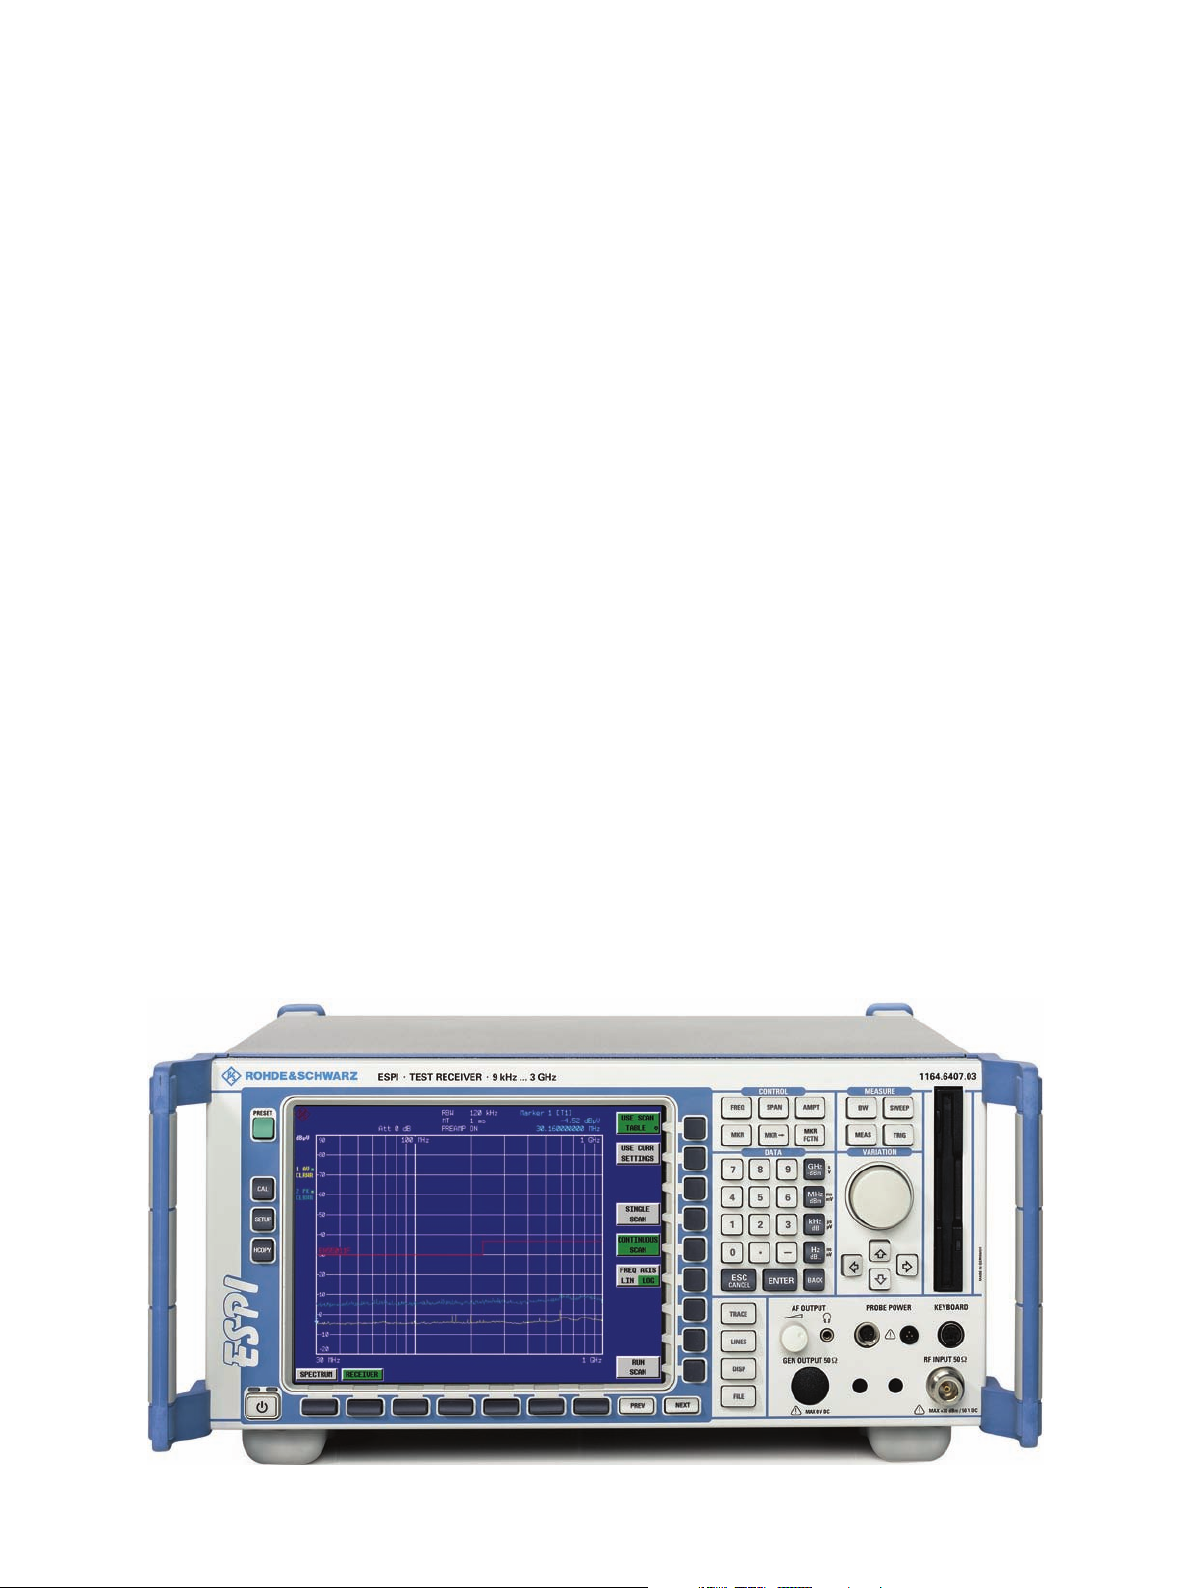
Spectrum analyzer mode with selectable preselection filters and preamplifier switched on
Up to 3 detectors can be activated simultaneously and the results displayed.
The bargraph display, with current detector value and MaxHold display, clearly
shows the results of manual circuit
adjustment when the DUT cabling is
arranged for maximum emissions and
when the antenna is aligned relative to
the DUT for a maximum reading.
In the receiver mode, the QP detector is
coupled with the time constants, prescribed by the standard, as a function of
the frequency range. This ensures that
the correct time constants and IF bandwidth are used for signal weighting in the
CISPR bands. This means much greater
ease of operation for the user.
4 Test Receiver ¸ESPI
Page 5
The measurement bandwidths
The measurement bandwidths of the
¸ESPI are designed for a large variety
of applications:
The analyzer mode provides all –3 dB
bandwidths from 10 Hz to 10 MHz
(in 1/3/10 sequence). In the receiver
mode, the –6 dB bandwidths can also be
selected by softkey: 200 Hz, 9 kHz,
120 kHz plus 1 MHz bandwidth.
Moreover, approx. 40 digital channel
filters are available.
Like the detectors, the standard-conforming CISPR bandwidths can be coupled as
a function of the frequency range. If
necessary, the coupling can be disabled.
The preselector/preamplifier option
(¸ESPI-B2) is available as a protection against overloading by pulsed, highpower signals and for ensuring the validity of signal evaluation in the linear operating range of the measuring instrument.
The advantage of this option is that, in
the analyzer mode, the preselection filters or the preamplifier can be switched
on or off as required.
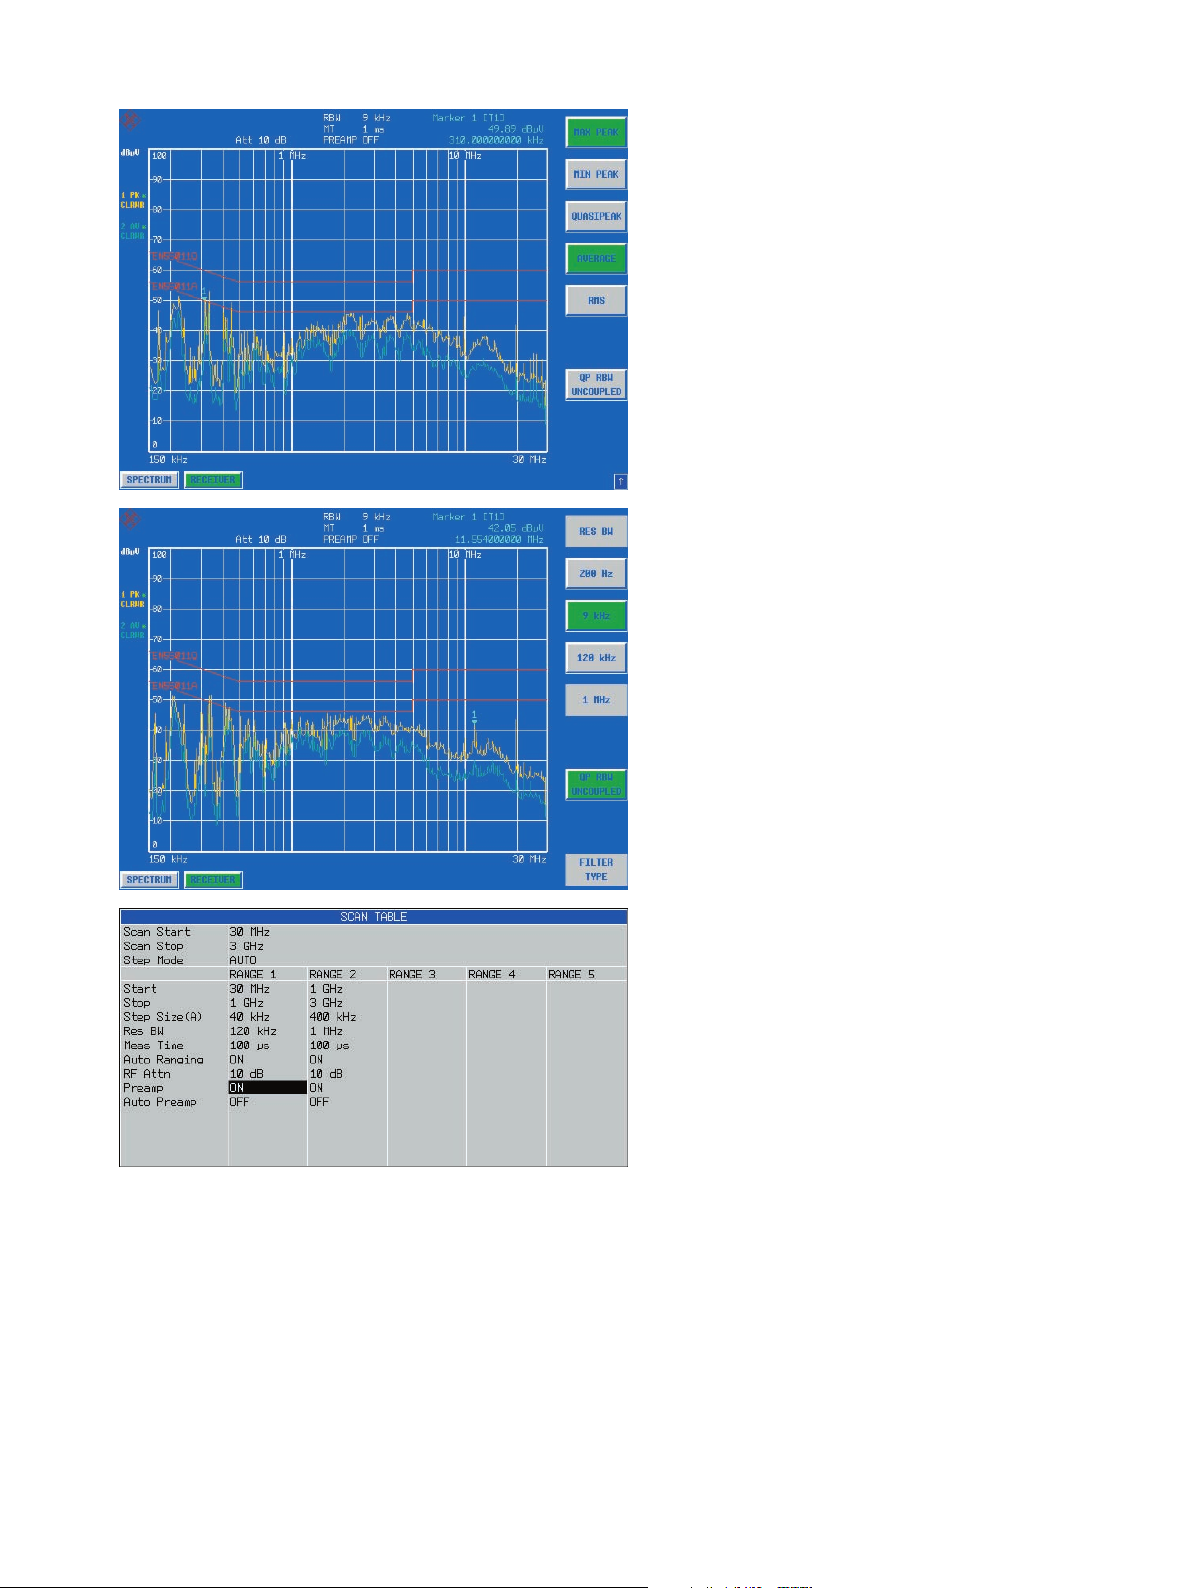
SCAN table
User-selectable parameters in
up to 10 subranges
The basis for all reproducible measurements is a scan table with up to ten subranges and user-programmable frequency parameters such as START, STOP,
STEP SIZE, resolution bandwidth, measurement time per frequency as well as
RF attenuation setting at a constant value
or coupled to AUTO RANGE overload
monitoring. For sensitive measurements
(if low signal levels are expected), the
preamplifier can be switched on or off as
a function of the subrange.
Test Receiver ¸ESPI 5
Page 6

Diagram and graphics display can most
easily be defined via ADJUST AXIS.
Marker functions and
split-screen display
In addition to normal FULL SCREEN
display, a second window is opened in
the SPLIT SCREEN mode for bargraph
display with current detector values and
MaxHold display. By activating "Tune to
Marker" the receive frequency and the
amplitude of the detectors coupled to the
marker are displayed as a bargraph and
numerically. This makes things considerably easier for the user.
The split-screen display in the analyzer
mode makes it possible to resolve fine
spectrum detail. By coupling the marker
frequency (in screen B) to the center frequency of screen A, parameters such as
bandwidth, span, RF attenuation can be
selected separately to detect spurious
which are close to the signal and cannot
be seen in the overview spectrum.
6 Test Receiver ¸ESPI
Page 7

R&S®ESPI – the optimal balance of price and performance
◆ Large 21 cm display with brilliant
colors which makes it easy to read parameters and displays results clearly
◆ Seven different detectors including
average detector with meter time
constant (CISPR Average) and RMS
average detector, up to three of them
can be selected simultaneously
◆ EMI bandwidths 200 Hz, 9 kHz,
120 kHz and 1 MHz
◆ Resolution bandwidths from 10 Hz
to 10 MHz
◆ Editable limit lines
◆ Correction tables for transducers,
coupling networks, accessories,
antennas
◆ Convenient documentation of results
as a hardcopy or file in PC-compatible
formats
◆ Interfaces: GPIB, Centronics,
RS-232-C, LAN (option)
◆ Automatic test routines for measure-
ment of TOI, OBW, phase noise,
ACP(R)
Overview of limit lines
◆ Split-screen display with independent
settings and up to 3 traces per screen
◆ Fast measurements in the time
domain: minimum sweep time 1 µs
◆ Gated sweep for measurements on
TDMA signals
◆ Minimum sweep time of 2.5 ms,
supports daily efforts in the lab to cut
development times
Additional applications –
extra performance
Modern communications systems are
required to achieve optimum spectral
efficiency at high data rates. For the 3rd
generation CDMA mobile radio systems
currently under development, this is
achieved by a number of measures, for
example high-precision power control.
The ¸ESPI is the ideal measurement
tool for diagnostic measurements,
development, precertification and postcertification owing to its excellent RF
characteristics:
◆ Total measurement uncertainty
– Spectrum analyzer mode: 0.5 dB
(without preselection)
– Receiver mode: <1.5 dB
◆ Displayed average noise level of
typ. –155 dBm (1 Hz) without
preamplifier
◆ Phase noise of typ. –145 dBc (1 Hz) at
an offset of 10 MHz providing optimum conditions for ACPR measurements on WCDMA systems
The resolution bandwidths of up to
100 kHz are fully digital and provide –
in addition to high selectivity – an ideal
basis for accurate (adjacent-)channel
power measurements owing to a
maximum bandwidth deviation of 3 %.
Test Receiver ¸ESPI 7
Page 8

The
R&S®ESPI comes as standard with a large variety of
functions
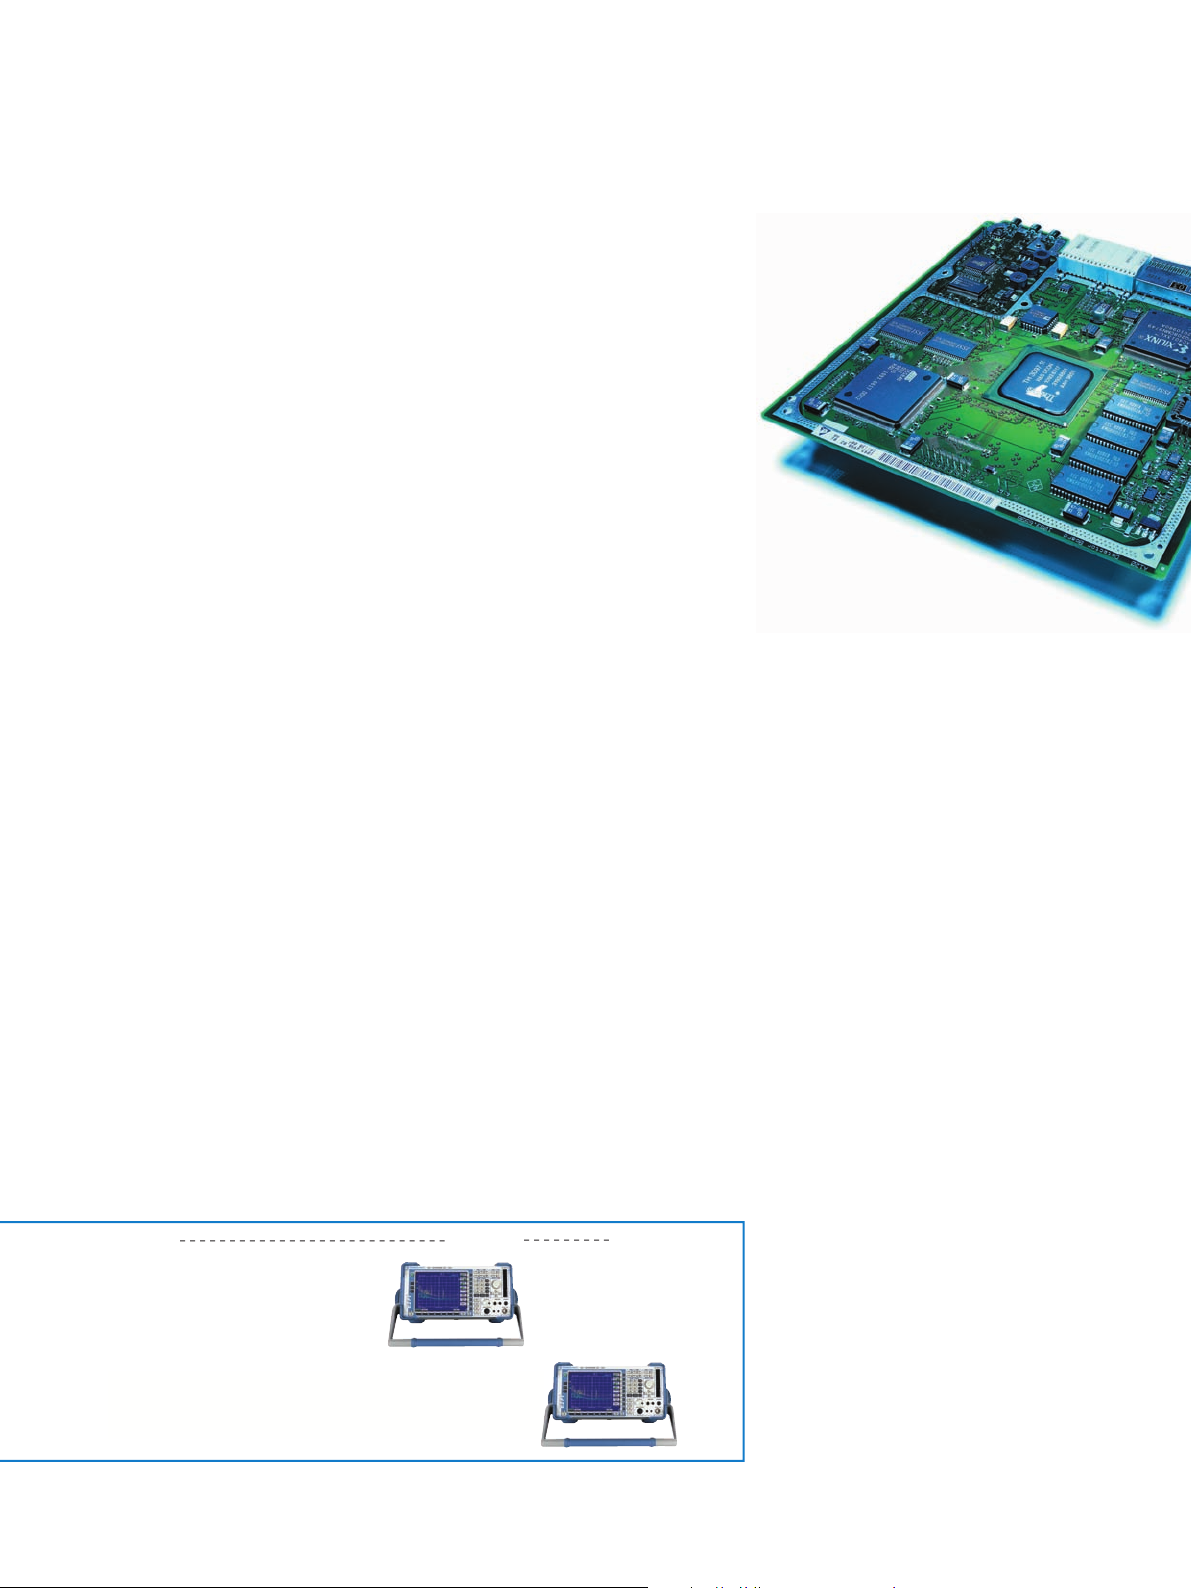
Fit for the future
Owing to its modular design, the
¸ESPI is optimally equipped to
handle today’s measurements and the
measurements of the future. The design
already takes into account both hardware
and firmware extensions so that the
¸ESPI will meet all requirements in
the years to come as well. A safe investment for the future.
Ergonomics&design
The ¸ESPI sets the new standard in
the precompliance class. The 21 cm (8.4")
color display makes it easy for the user to
read results and provides an overview of
the parameters which have been
selected.
Vertical and horizontal rows of softkeys
make it easy to perform even complex
measurements. Parameters such as frequency and amplitude are entered by
means of dedicated hardkeys and unit
keys.
Wide dynamic range
Featuring the lowest displayed average
noise level in its class (DANL typ.
–145 dBm at 10 Hz RBW), the ¸ESPI
measures even small signals precisely,
when using the optional Preselector/Preamplifier ¸ESPI-B2 from 9 kHz to
3 GHz even down to –153 dBm (10 Hz
RBW). Together with the high intercept
point, this yields an intermodulation-free
Displayed
average noise
level in receiver
mode with
preselector/
preamplifier
switched on
range of typ. 100 dB – an excellent value
even for higher middle-end instruments.
Phase noise
The ¸ESPI’s minimal phase noise
makes it suitable for demanding measurements both close to the carrier
(typ. –113 dBc (1 Hz) at 10 kHz) and far
from the carrier (typ. –125 dBc (1 Hz) at
1 MHz). The ¸ESPI is therefore optimally equipped for performing spectral
analysis and ACPR measurements on narrowband systems such as IS-136 or PDC
as well as on wideband systems such as
IS-95 or WCDMA.
8 Test Receiver ¸ESPI
Interior view: modular design of test receiver
Page 9

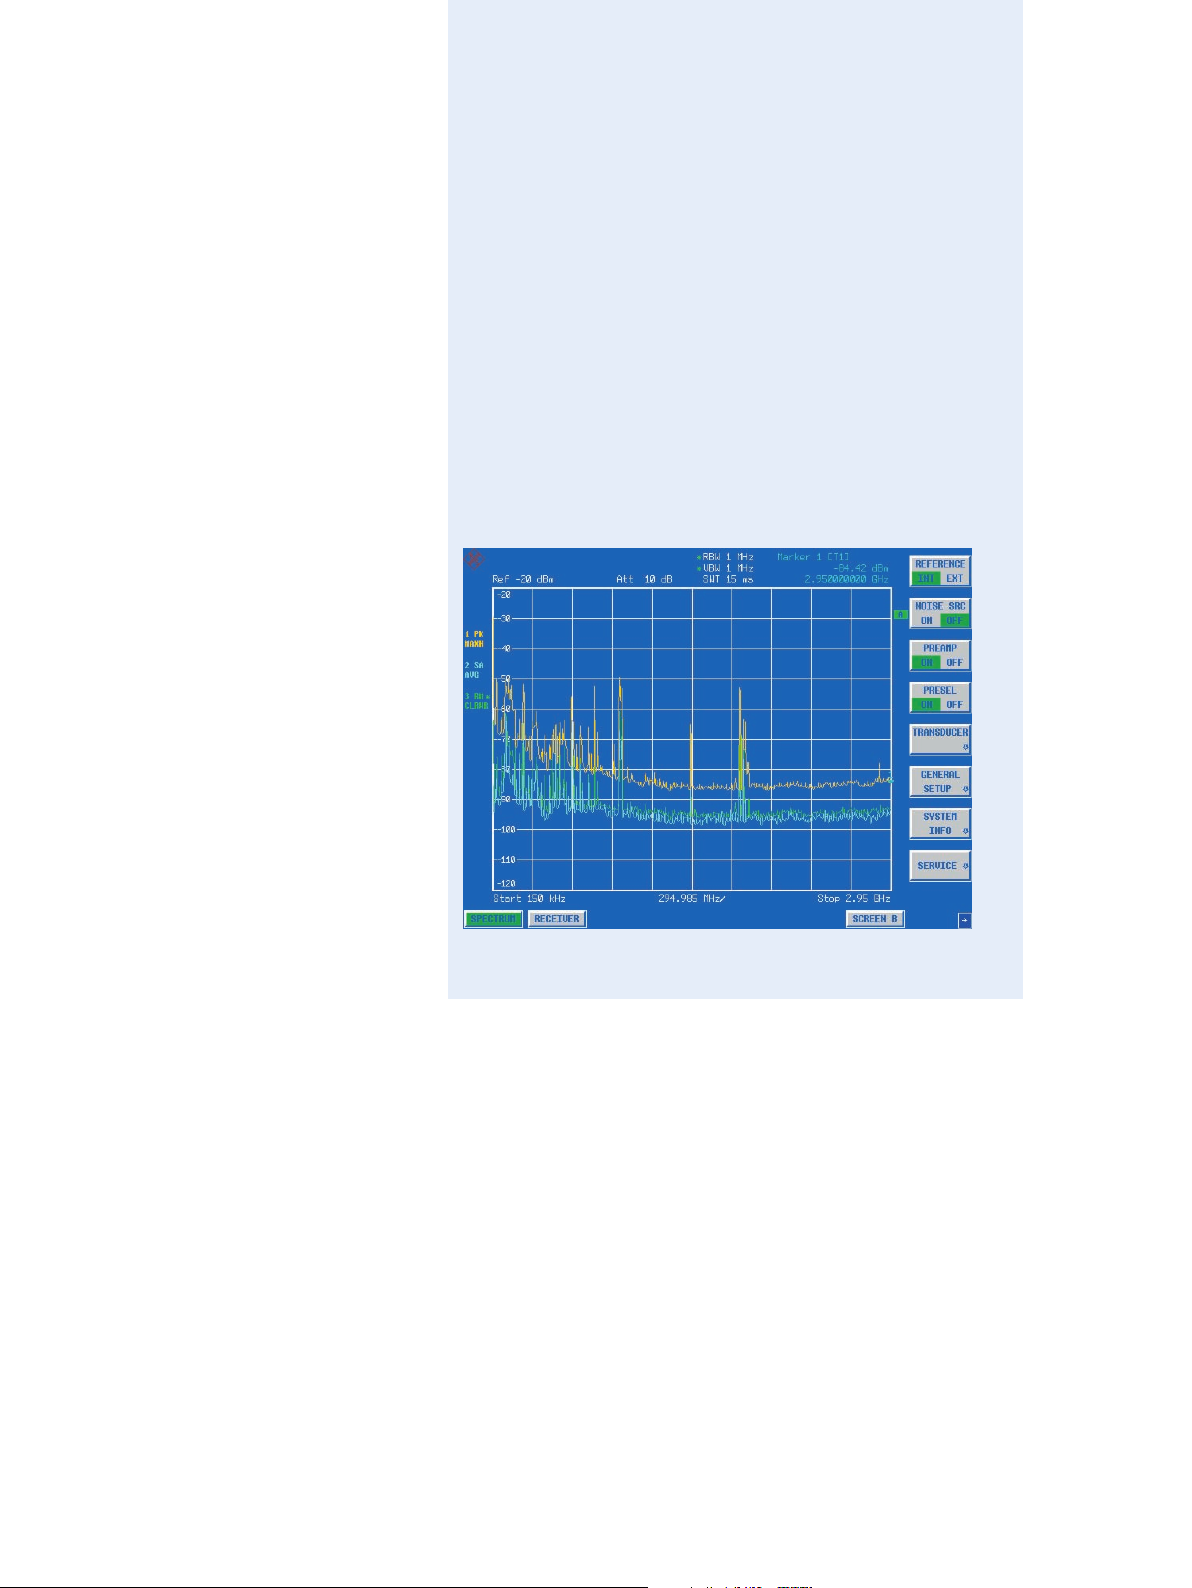
Spectrum analyzer application,
ACPR measurements
Measurement of the adjacent-channel
power ratio (ACPR), which many mobile
radio standards stipulate for components
and units, is performed in the ¸ESPI
analyzer mode by automatic test routines.
All settings, measurements and filters
required for a selected standard are
activated at a keystroke.
In addition to a large number of preprogrammed standards, the channel width
and channel spacing can be selected as
required.
Due to its excellent dynamic range, the
lowest phase noise in its class and its
RMS detector, the ¸ESPI sets the
new standard for the upper middle-end –
even for ACPR measurements.
TOI measurement
Test routines for TOI, OBW, etc
are standard
The ¸ESPI offers fast test routines for
a multitude of typical laboratory measurements. The routines make postprocessing superfluous and supply results
directly:
◆ Determination of TOI
◆ Occupied bandwidth (OBW)
◆ Burst power with peak, average and
RMS indication as well as standard
deviation
◆ Modulation depth of AM signals
◆ Phase noise
◆ Bandwidth marker
Of course, these functions can also be
used via the fast GPIB interface.
Test Receiver ¸ESPI 9
Page 10

Optional tracking generator
9 kHz to 3 GHz
The optional Internal Tracking Generator
¸FSP-B9 up to 3 GHz and External
Generator Control ¸FSP-B10
enhance the two ¸ESPI test receiver
models to yield scalar network analyzer
functionality. Gain, frequency response,
insertion and return loss are measured
using a selective method with a wide
dynamic range without being affected by
harmonics or spurious from the generator. The Internal Tracking Generator
¸FSP-B9 can be used in both
¸ESPI models and covers the frequency range from 9 kHz to 3 GHz. A frequency offset of ±150 MHz can be set for
measurements on frequency-converting
modules. The tracking generator can be
broadband-modulated by an external I/Q
baseband signal.
Optional LAN interface
With the aid of the optional LAN Interface
¸ FSP-B16, the ¸ESPI models can
be connected to common networks such
as 100Base T so that functions such as
file logging on network drives or documentation of measurement results via
network printer are available. The
¸ESPI can also be remote-controlled
via the LAN interface. Control is via a softpanel that behaves exactly as if it were
part of a real instrument. The LAN interface has a clear speed advantage over
the IEC/IEEE bus – in particular when
large blocks of data are transmitted.
Easy generation of reports
owing to PC compatibility
◆ PC-compatible screenshots, no
conversion software being required
◆ Windows printer support
◆ LabWindows driver
◆ LabView driver
◆ SCPI-compatible
◆ ¸FSE/ESIB-compatible GPIB
command set
◆ Customized training
Rear view with interfaces for tracking generator with I/O, LAN and user port
10 Test Receiver ¸ESPI
Page 11

R&S®ESPI-K50 – external trigger for measuring field-strength profiles
To measure the coverage field strength of
a communications or broadcast network,
continuous level measurements have to
be performed at a high measurement rate
and the results must be forwarded to an
evaluation unit.
When a displacement sensor/GPS system
is used, the external trigger input of the
¸ESPI can be used to start the single
measurements. The level values can thus
be accurately assigned to the measurement site.
Lab model or robust portable
unit
Whether as a desktop model for the lab,
in a 19" rack, or as a robust unit with edge
protectors and carrying handle for
portable use – the ¸ESPI always
looks good.
The coverage measurement function is
only available in the receive mode and in
the case of remote control. The ¸ESPI
performs the coverage measurement in
two different ways:
◆ All measurements are performed on a
discrete frequency
(sample rate >100 ksample/s)
◆ A channel list with up to 1000 chan-
nels is cyclically processed, i.e. a new
frequency is set for each measurement
Additional channel filters
In addition to the channel filters included
as standard in the ¸ESPI, the option
provides filters with bandwidths of
5.6 MHz to 8 MHz for DVB-T signals as
listed below:
◆ 5.6 MHz: ISDB-T (Japan)
◆ 6.0 MHz: ATSC (USA, Korea)
◆ 6.4 MHz
◆ 7.0 MHz: DVB-T (Europe, Australia)
◆ 8.0 MHz: DVB-T (Europe)
Environmental compatibility
◆ Fast and easy disassembly
◆ Small number of materials
◆ Mutual compatibility of materials
◆ Easy identification of substances
through appropriate marking
(plastics)
Test Receiver ¸ESPI 11
Page 12

Specifications
Specifications apply under the following conditions: 15 minutes warm-up time at ambient
temperature, specified environmental conditions met, calibration cycle adhered to and total
calibration performed. Data designated "nominal" applies to design parameters and is not
tested. Data designated " = xx dB" indicates the standard deviation.
¸ESPI 3 ¸ESPI 7
Frequency
Frequency range 9 kHz to 3 GHz 9 kHz to 7 GHz
Frequency resolution 0.01 Hz
Internal reference frequency (nominal)
Aging per year
1)
Temperature drift (+5 °C to +45 °C) 1 × 10
With option ¸FSP-B4 (OCXO)
Aging per year
1)
Temperature drift (+5 °C to +45 °C) 1 × 10
External reference frequency 10 MHz
Frequency display (receiver mode)
Display numeric display
Resolution 0.1 Hz
Frequency display (analyzer mode)
Display with marker or frequency counter
Resolution span/500
Accuracy (sweep time 3 × auto sweep time) ±(frequency × reference error
Frequency counter
Resolution 0.1 Hz to 10 kHz (selectable)
Count accuracy (S/N 25 dB) ±(frequency × reference error
Display range for frequency axis 0 Hz,
Resolution/accuracy of display range 0.1 %
Spectral purity (dBc (1 Hz))
SSB phase noise, f = 500 MHz, for frequencies 500 MHz see diagram
Carrier offset
100 Hz
1 kHz
10 kHz
2)
100 kHz
2)
1 MHz
10 MHz
Residual FM, f = 500 MHz, RBW 1 kHz,
sweep time 100 ms typ. 3 Hz
Frequency scan (receiver mode)
Scan scan with max. 10 subranges with
Measurement time per frequency 100 µs to 100 s, selectable
Sweep (analyzer mode)
Span 0 Hz (zero span)
Resolution
Span 10 Hz
Max. deviation
IF bandwidths (receiver mode)
Bandwidths (–3 dB) 10 Hz to 10 MHz; in 1, 3, 10 sequence
Bandwidth error
100 kHz
300 kHz to 3 MHz
10 MHz
Shape factor BW
100 kHz
300 kHz to 3 MHz
60 dB
: BW
3 dB
10 MHz
1)
After 30 days of operation.
2)
Valid for span 100 kHz.
12 Test Receiver ¸ESPI
6
1 × 10
6
7
1 × 10
8
+ 0.5 % × span + 10 % × resolution
bandwidth + ½ (last digit))
+ ½ (last digit))
10 Hz to 3 GHz
84, typ. 90
typ. 100, 108
typ. 106, 113
typ. 110, 113
typ. 120, 125
typ. 145 typ.
0 Hz,
10 Hz to 7 GHz
different settings
1 µs to 16 000 s
125 ns
2.5 ms to 16 000 s
1 %
3 %
10 %
+10 %, –30 %
5:1 (Gaussian filter)
15:1 (4-circuit synchronously
tuned filters)
7:1
–60
f
in GHz
–70
–80
in
0.5
3
7
–90
–100
–110
–120
–130
SSB phase noise in dBc (1 Hz)
100 Hz 1 k 10 k 100 1 M
Offset frequency
–
50
–
60
–
70
–
80
–
90
–
100
–
110
–
120
SSB phase noise in dBc (1 Hz)
–
130
Offset
frequency
057
100 Hz
1 k
10 k
100 k
1 M
Frequency in GHz
Typical values for SSB phase noise (referenced to 1 Hz bandwidth)
Carrier offset fin = 3 GHz fin = 7 GHz
100 Hz 74 dBc 67 dBc
1 kHz 100 dBc 94 dBc
10 kHz 108 dBc 104 dBc
100 kHz 108 dBc 106 dBc
1 MHz 118 dBc 118 dBc
Preselector (option ¸ESPI-B2), can be switched off in analyzer mode
Filter Frequency range Bandwidth (–6 dB)
1 <150 kHz 230 kHz fixed
2 150 kHz to 2 MHz 2.6 MHz fixed
3 2 MHz to 8 MHz 2 MHz tracking
4 8 MHz to 30 MHz 6 MHz tracking
5 30 MHz to 70 MHz 15 MHz tracking
6 70 MHz to 150 MHz 30 MHz tracking
7 150 MHz to 300 MHz 60 MHz tracking
8 300 MHz to 600 MHz 80 MHz tracking
9 600 MHz to 1000 MHz 100 MHz tracking
10 1 GHz to 2 GHz highpass filter tracking
11 2 GHz to 3 GHz highpass filter fixed
Preamplifier (9 kHz to 3 GHz) can be switched between preselector and
1st mixer, gain 20 dB
Page 13

¸ESPI 3 ¸ESPI 7
EMI bandwidths 200 Hz, 9 kHz, 120 kHz (–6 dB)
Bandwidth error
120 kHz
1 MHz
Shape factor BW
120 kHz
1 MHz
60 dB
: BW
6 dB
1 MHz (pulse bandwidth)
3 %
10 %, nominal
5:1 (Gaussian filter)
15:1 (4-circuit synchronously
tuned filters)
Resolution bandwidths (analyzer mode)
Bandwidths (–3 dB) 10 Hz to 10 MHz; in 1, 3, 10 sequence
Bandwidth error
100 kHz
300 kHz to 3 MHz
10 MHz
Shape factor BW
100 kHz
300 kHz to 3 MHz
60 dB
: BW
3 dB
10 MHz
EMI bandwidths 200 Hz, 9 kHz, 120 kHz (–6 dB)
Bandwidth error
120 kHz
1 MHz
Shape factor BW
120 kHz
1 MHz
60 dB
: BW
6 dB
3 %
10 %
+10 %, –30 %
5:1 (Gaussian filter)
15:1 (4-circuit synchronously
tuned filters)
7
1 MHz (pulse bandwidth)
3 %
10 %, nominal
5:1 (Gaussian filter)
15:1 (4-circuit synchronously
tuned filters)
Video bandwidths 1 Hz to 10 MHz; in 1, 3, 10 sequence
FFT filter
Bandwidths (–3 dB) 1 Hz to 30 kHz (3 dB);
in 1, 3, 10 sequence
Bandwidth error, nominal 5 %
Shape factor BW
60 dB
: BW
, nominal 2.5
3 dB
Level
Display range displayed average noise level to
Maximum input level
DC voltage 50 V
RF attenuation 0 dB
CW RF power 127 dBµV (= 0.3 W)
Pulse spectral density 97 dB(µV/MHz)
RF attenuation 10 dB
CW RF power 137 dBµV (= 1 W)
Max. pulse voltage 150 V
Max. pulse energy (10 µs) 1 mWs
1 dB compression of input mixer
0 dB RF attenuation, f200 MHz, without
preselector
Intermodulation
3rd-order intermodulation (TOI)
Intermodulation-free dynamic range,
level 2 ×30 dBm, f 5 × RBW or 10 kHz, whichever is larger
20 MHz to 200 MHz 70 dBc, TOI 5 dBm
200 MHz to 3 GHz 74 dBc, TOI 7 dBm (typ. 10 dBm)
3 GHz to 7 GHz 80 dBc,
With option ¸ESPI-B2, preselector switched on, preamplifier switched off
20 MHz to 200 MHz 65 dBc, TOI 0 dBm
200 MHz to 3 GHz 69 dBc, TOI 2 dBm (typ. 5 dBm)
137 dBµV
0 dBm nominal
TOI 10 dBm
(typ. 15 dBm)
¸ESPI 3 ¸ESPI 7
With option ¸ESPI-B2, preselector switched on, preamplifier switched on
20 MHz to 200 MHz 45 dBc, TOI –20 dBm
200 MHz to 3 GHz 49 dBc, TOI –18 dBm (typ. –15 dBm)
Second harmonic intercept point (SHI)
100 MHz typ. 25 dBm
100 MHz to 3 GHz typ. 35 dBm
3 GHz to 7 GHz typ. 45 dBm
With option ¸ESPI-B2, preselector switched on, preamplifier switched off
4 MHz to 100 MHz 40 dBm
100 MHz to 3 GHz 50 dBm
With option ¸ESPI-B2, preselector switched on, preamplifier switched on
4 MHz to 100 MHz 25 dBm
100 MHz to 3 GHz 35 dBm
Displayed average noise level
0 dB RF attenuation, RBW = 10 Hz, VBW = 1 Hz,
20 averages, trace average, zero span, 50 termination
9 kHz 95 dBm
100 kHz 100 dBm
1 MHz 120 dBm, typ. 125 dBm
10 MHz to 1 GHz 142 dBm,
1 GHz to 3 GHz 140 dBm,
typ. 145 dBm
typ. 145 dBm
3 GHz to 7 GHz 138 dBm,
140 dBm,
typ. 145 dBm
138 dBm,
typ. 143 dBm
typ. 143 dBm
With option ¸ESPI-B2, preselector switched on, preamplifier switched off
9 kHz 95 dBm
100 kHz 100 dBm
1 MHz 120 dBm, typ. 125 dBm.
10 MHz to 1 GHz 142 dBm,
1 GHz to 3 GHz 140 dBm,
typ. 145 dBm
typ. 145 dBm
140 dBm,
typ. 145 dBm
138 dBm,
typ. 143 dBm
With option ¸ESPI-B2, preselector switched on, preamplifier switched on
9 kHz 105 dBm
100 kHz 110 dBm
1 MHz 130 dBm, typ. 137 dBm
10 MHz to 1 GHz 152 dBm,
1 GHz to 3 GHz 150 dBm,
typ. 155 dBm
typ. 153 dBm
150 dBm,
typ. 153 dBm
148 dBm,
typ. 151 dBm
Immunity to interference
Image rejection 70 dB
Intermediate frequency (f < 3 GHz) 70 dB
Spurious responses
(f 1 MHz, without input signal, 0 dB attenuation)
Other spurious (with input signal,
mixer level –10 dBm, f 100 kHz) f7 GHz: 70 dBc
103 dBm
Level display (receiver mode)
Digital numeric; 0.01 dB resolution
Analog bargraph display,
Spectrum level axis 10 dB to 200 dB
separately for each detector
in 10 dB steps, frequency axis userselectable, linear or logarithmic
Units of level display dBµV, dBm, dBµA, dBpW, dBpT
Test Receiver ¸ESPI 13
Page 14

¸ESPI 3 ¸ESPI 7
Detectors MaxPeak, MinPeak, Average,
Measurement time 100 µs to 100 s, selectable
Level display (analyzer mode)
Result display 501 × 400 pixels (one diagram), max.
Log level scale 10 dB to 200 dB in 10 dB steps
Linear level scale 10 % of reference level per level division
Traces max. 3 per diagram
Trace detectors MaxPeak, MinPeak, AutoPeak, Sample,
Trace functions Clear/Write, MaxHold, MinHold,
Setting range of reference level
Logarithmic level display –130 dBm to +30 dBm, in 0.1 dB steps
Linear level display 70.71 nV to 7.07 V; in steps of 1 %
Units of level scale dBm, dBmV, dBµV, dBµA, dBpW
Level measurement accuracy
Level accuracy at 128 MHz
(level = –30 dBm, RF attenuation 10 dB,
ref. level –20 dBm, RBW 10 kHz) 0.2 dB ( = 0.07 dB)
Additional error with preselector/preamplifier
(with option ¸ESPI-B2) 0.1 dB
Quasi-peak display in line with CISPR 16-1,
Frequency response
50 kHz +0.5/1.0 dB
50 kHz to 3 GHz 0.5 dB ( = 0.17 dB)
3 GHz to 7 GHz 2 dB ( = 0.7 dB)
With option ¸ESPI-B2, preselector switched on
50 kHz +0.8/1.3 dB
50 kHz to 3 GHz 0.8 dB ( = 0.27 dB)
Attenuator 0.2 dB ( = 0.07 dB)
Reference level switching 0.2 dB ( = 0.07 dB)
Display nonlinearity log/lin (S/N 16 dB)
RBW 120 kHz
0 dB to –70 dB
–70 dB to –90 dB
RBW 300 kHz
0 dB to –50 dB
–50 dB to –70 dB
Bandwidth switching uncertainty
(referenced to RBW = 10 kHz)
10 Hz to 100 kHz
300 kHz to 10 MHz
FFT 1 Hz to 3 kHz
Total measurement uncertainty 0 Hz to 3 GHz
Analyzer without preselection
Receiver/analyzer with preselection
Quasi-Peak (QP), Average with meter
time constant (CAV), RMS and
RMS Average (CRMS)
3 detectors can be switched on
simultaneously
2 diagrams with independent settings
(10 divisions)
RMS, Average, Quasi-Peak
Average
(log level display);
mV, µV, mA, µA, pW, nW
(linear level display)
10 Hz pulse repetition frequency
(with option ¸ESPI-B2)
0.2 dB ( = 0.07 dB)
0.5 dB ( = 0.17 dB)
0.2 dB ( = 0.07 dB)
0.5 dB ( = 0.17 dB)
0.1 dB ( = 0.03 dB)
0.2 dB ( = 0.07 dB)
0.2 dB ( = 0.03 dB)
0.5 dB
<1.5 dB
Audio demodulation
Modulation modes AM and FM
Audio output loudspeaker and headphones output
14 Test Receiver ¸ESPI
¸ESPI 3 ¸ESPI 7
Trigger functions
Trigger
Span 10 Hz
Trigger source free run, video, external, IF level
Trigger offset 125 ns to 100 s, resolution min. 125 ns
Span = 0 Hz
Trigger source free run, video, external, IF level
Trigger offset ±125 ns to 100 s, resolution min.
Max. deviation of trigger offset ±(125 ns + (0.1 % × delay time))
Gated sweep
Trigger source external, IF level, video
Gate delay 1 µs to 100 s
Gate length 125 ns to 100 s, resolution min. 125 ns
Max. deviation of gate length ±(125 ns + (0.05 % × gate length))
or 1 % of offset
125 ns, depending on sweep time
or 1 % of gate length
Inputs and outputs (front panel)
RF input N female, 50
VSWR (RF attenuation >0 dB)
f 3 GHz 1.5:1
f 7 GHz 2.0:1
Input attenuator 0 dB to 70 dB in 10 dB steps
Probe power supply 3-pin female: +15 V DC, –12.6 V DC and
Keyboard connector PS/2 female for MF keyboard
AF output mini jack
Output impedance 10
Open-circuit voltage up to 1.5 V; adjustable
ground, max. 150 mA
5-pin mini DIN female: ±10 V DC
and ground, max. 200 mA
Inputs and outputs (rear panel)
IF 20.4 MHz Z
Level
RBW 30 kHz, FFT
RBW 100 kHz
Reference frequency
Output
Output frequency
Level
Input
Input frequency
Required level
Power supply connector for noise source BNC female, 0 V and 28 V switchable,
External trigger/gate input BNC female, 10 k
Voltage 1.4 V
IEC/IEEE-bus remote control interface in line with
Command set SCPI 1997.0
Connector 24-pin Amphenol female
Interface functions SH1, AH1, T6, L4, SR1, RL1,
Serial interface RS-232-C interface (COM),
Printer interface parallel interface
Mouse connector PS/2 female
User interface 25-pin D-SUB female
Connector for external monitor (VGA) 15-pin D-SUB female
= 50 , BNC female
out
–10 dBm at reference level,
mixer level 60 dBm
0 dBm at reference level,
mixer level –60 dBm
BNC female
10 MHz
0 dBm nominal
BNC female
10 MHz
0 dBm into 50
max. 100 mA
IEC 60625 (IEEE 488.2)
PP1, DC1, DT1, C0
9-pin D-SUB connector
(Centronics-compatible)
Page 15

General data
Display 21 cm TFT color display (8.4”)
Resolution 640 × 480 pixels (VGA resolution)
Pixel failure rate 2 × 10
Mass memory 1.44 Mbyte 3½” disk drive, hard disk
Data storage 500 instrument settings
Environmental conditions
Operating temperature range +5 °C to +40 °C
Permissible temperature range +5 °C to +45 °C
Storage temperature range –40 °C to +70 °C
Damp heat +40 °C at 95 % rel. humidity (IEC 60068)
Mechanical resistance
Vibration test, sinusoidal 5 Hz to 150 Hz, max. 2 g at 55 Hz,
Vibration test, random 10 Hz to 100 Hz, acceleration 1 g (RMS)
Shock test 40 g shock spectrum,
Recommended calibration interval 2 years for operation with
Power supply
AC supply 100 V to 240 V AC,
Power consumption 70 VA
Safety meets EN 61010-1, UL 3111-1,
RFI suppression meets EMC Directive of EU
Test mark VDE, GS, CSA, CSA-NRTL/C
Dimensions (W × H × D) 412 mm × 197 mm × 417 mm
Weight 10.5 kg
–5
0.5 g from 55 Hz to 150 Hz,
meets IEC 60068, IEC 61010,
MIL-T-28800D, class 5
meets MIL-STD-810C and
MIL-T-28800D, classes 3 and 5
external reference,
1 year with internal reference
50 Hz to 400 Hz,
protection class I to VDE 411
(¸ESPI 3)
CSA C22.2 No. 1010-1, IEC 61010
(89/336/EEC) and German EMC law
(¸ESPI 3)
120 VA
(¸ESPI 7)
11.3 kg
(¸ESPI 7)
Certified Quality System
ISO 9001
Certified Environmental System
ISO
14001
Test Receiver ¸ESPI 15
Page 16

Ordering information
Designation Type Order No.
Test Receiver 9 kHz to 3 GHz ¸ESPI 3 1164.6407.03
Test Receiver 9 kHz to 7 GHz ¸ESPI 7 1164.6407.07
Accessories supplied
Power cable, operating manual, service manual
Options
Preselector/Preamplifier for ¸ESPI
(factory-fitted) ¸ESPI-B2 1129.7498.03
Extended Environmental Specifications
(random vibration 1.9 g RMS, temperature
0 C to 55 C) ¸ESPI-B20 1155.1606.03
Trigger for Coverage Measurements ¸ESPI-K50 1106.4386.02
Rugged Case, Carrying Handle
(factory-fitted) ¸FSP-B1 1129.7998.02
OCXO Reference Frequency ¸FSP-B4 1129.6740.02
TV Trigger and Adjustable RF Power Trigger
(40 dB) for ¸FSP and ¸ESPI ¸FSP-B6 1129.8594.02
Internal Tracking Generator 9 kHz to 3 GHz,
I/Q modulator, for all ¸ESPI models ¸FSP-B9 1129.6991.02
External Generator Control for all
¸ESPI models ¸FSP-B10 1129.7246.02
LAN Interface 100BaseT for all ¸ESPI models ¸FSP-B16 1129.8042.03XP
DC Power Supply for Spectrum Analyzers
¸FSP/ESPI ¸FSP-B30 1155.1158.02
Battery Pack for Spectrum Analyzers
¸FSP/ESPI
Spare Battery Pack for Spectrum Analyzers
¸FSP/ESPI
Noise Measurement Software ¸FS-K3 1057.3028.02
AM/FM Measurement Demodulator ¸FS-K7 1141.1796.02
1)
2)
¸FSP-B31 1155.1258.02
¸FSP-B32 1155.1506.02
Designation Type Order No.
Recommended extras
Pulse Limiter 0 Hz to 30 MHz ¸ESH3-Z2 0357.8810.54
Control Cable for V-Network ¸ESH2-Z5 (2 m) ¸EZ-13 1026.5293.02
Control Cable for V-Network ¸ESH3-Z5 (2 m) ¸EZ-14 1026.5341.02
Headphones – 0708.9010.00
US Keyboard with trackball ¸PSP-Z2 1091.4100.02
PS/2 Mouse ¸FSE-Z2 1084.7043.02
IEC/IEEE-Bus Cable, 1 m ¸PCK 0292.2013.10
IEC/IEEE-Bus Cable, 2 m ¸PCK 0292.2013.20
19" Rack Adapter (not for ¸FSP-B1) ¸ZZA 478 1096.3248.00
Trolley ¸ZZK-1 1014.0510.00
Soft Carrying Case, grey ¸ZZT 473 1109.5048.00
Matching Pads, 75
L Section
Series Resistor, 25
SWR Bridge, 5 MHz to 3000 MHz
High-Power Attenuators, 100 W
3/6/10/20/30 dB ¸RBU 100 1073.8820.XX
High-Power Attenuators, 50 W
3/6/10/20/30 dB ¸RBU 50 1073.8695.XX
1)
¸FSP-B1 and ¸FSP-B30 required.
2)
¸FSP-B31 required.
3)
Taken into account in device function RF INPUT 75 .
See also data sheets
3)
◆ Accessories for Test Receivers and Spectrum Analyzers: PD 0756.4320
◆ EMC Test Antennas: PD 0757.5743
¸RAM
¸RAZ
¸ZRB 2
0358.5414.02
0358.5714.02
0373.9017.52
(XX = 03/06/10/20/30)
(XX = 03/06/10/20/30)
For information on EMC training courses or on-the-job training
please contact:
Rohde & Schwarz
Training Center
Mühldorfstr. 20
81671 München, Germany
Tel.: +49 89 4129 13051
Fax: +49 89 4129 13335
More information at
www.rohde-schwarz.com
(search term: ESPI)
¸is a registered trademark of Rohde&Schwarz GmbH & Co. KG · Trade names are trademarks of the owners · Printed in Germany (bb))
PD 0758.0745.32 · Test Receiver ¸ESPI · Version 05.03 · May 2009 · Data without tolerance limits is not binding · Subject to change
www.rohde-schwarz.com
Europe, Africa, Middle East: +49 1805 12 4242, customersupport@rohde-schwarz.com · North America: 1 888 837 87 72, customer.support@rsa.rohde-schwarz.com
Latin America: +1 410 910 79 88, customersupport.la@rohde-schwarz.com · Asia/Pacific: +65 65 13 04 88, customersupport.asia@rohde-schwarz.com
 Loading...