

Page 1
EMI Test Receivers ¸ESIB
Data sheet
Version
03.00
January
2006
Outstanding performance
High sensitivity
◆
Low inherent noise
◆
Wide dynamic range
◆
High measurement speed
◆
Preselection and preamplifi cation
◆
Automatic overload detection
◆
Autoranging
◆
2nd RF input with pulse protection
◆
EMI measurements up to 40 GHz conforming to standards
Current standards
Correct weighting of pulses in
◆
accordance with CISPR 16-1-1 and
VDE 0876
All commercial and military standards
◆
such as CISPR, EN, ETS, FCC, VDE,
ANSI, VCCI, MIL-STD, VG,
DEF-STAN, etc
Straightforward operation
Bright 24 cm LC color display
◆
Analog level display for each detector
◆
(parallel operation)
Split-screen display for detailed
◆
analysis
Receiver-oriented operating concept
◆
allowing manual operation
Internal test routines for automated
◆
and interactive EMI measurements
Page 2
The ¸ESIB family of EMI test receivers combines the high sensitivity, large
dynamic range and selectivity of a highend test receiver with the fl exibility and
speed of a top-class spectrum analyzer
in one instrument.
The ¸ESIB family comprises three
models with different upper frequency
limits:
¸ESIB 7 (20 Hz to 7 GHz)
◆
¸ESIB 26 (20 Hz to 26.5 GHz)
◆
¸ESIB 40 (20 Hz to 40 GHz)
◆
The upper frequency limit of the
¸ESIB 26 and ¸ESIB 40 can be
extended up to 110 GHz by means of
external mixers (option ¸FSE-B21
required).
All three models have the following
characteristics:
High sensitivity
◆
Excellent large-signal immunity
◆
Low measurement uncertainty
◆
High measurement speed
◆
Standard-conforming
measurements
The ¸ESIB carries out measurements
in conformance with all commercial and
military EMI standards such as CISPR,
EN, VDE, ANSI, FCC, BS, ETS, VCCI,
MIL-STD, VG, DEF-STAN, DO 160 and
GAM EG 13. It goes without saying that
the ¸ESIB family complies with
the basic standard, i.e. CISPR 16-1-1 or
VDE 0876, which places stringent
requirements on receiver dynamic range.
Test routines oriented to
practical requirements
During the various development phases
of a product, different measurements are
performed as required for each stage.
The ¸ESIB family offers appropriate
features and routines for the different
development stages.
Early in development, functional measurements play the predominant role.
While EMI measurements are important right from the beginning to avoid
re designs, the ¸ESIB at this stage
primarily functions as a high-grade
spectrum analyzer.
The ¸ESIB is outstanding for its low
inherent noise, high intermodulation
suppression and low SSB phase noise.
Moreover, the ¸ESIB provides all
test routines offered by modern spectrum analyzers, such as noise measurement, phase noise measurement,
channel and adjacent-channel power
measurement as well as time-domain
measurement.
As development progresses, EMI measurements become more and more
important, for example on modules and
their interfaces. Measurements are
frequently carried out using sensors,
probes or current transformers. Interference analysis and referencing of results
to limit values are important. Here, too,
the ¸ESIB family meets all relevant
requirements in terms of performance,
functionality and economy of operation:
Fast overview measurements with
◆
linear or logarithmic frequency scale
in spectrum analyzer mode (sweep
mode) or in test receiver mode (scan
mode) with tuning in user-defi ned
frequency steps with selectable
measuring times per step
Bandwidths conforming to
◆
CISPR 16-1-1 (200 Hz, 9 kHz, 120 kHz
and 1 MHz) and MIL-STD (10 Hz to
1 MHz), plus 10 MHz bandwidth, and
analyzer bandwidths between 1 Hz
and 10 MHz, selectable in steps of 1,
2, 3 and 5
2 EMI Test Receivers ¸ESIB
Page 3
Pulse weighting using quasi-peak,
◆
peak, average and CISPR-average
detectors; the detectors operate in
parallel and can be switched in as
required
User-selectable transducer factors
◆
for the output of results in the correct
unit; transducer factors for practically
any number of transducers can be
stored on the internal hard disk;
active transducers are powered and
coded via a socket on the ¸ESIB
front panel
User-defi nable limit lines with lin-
◆
ear or logarithmic frequency scale;
Overview measurement
limit lines are stored on the internal
hard disk
Time-domain measurements at up
◆ The excellent characteristics and func-
to 50 ns resolution for interference
source analysis
tions of the ¸ESIB family come into
their own when compliance with relevant EMI standards is to be verifi ed on
the fi nished product. This may involve
limit values for RFI voltage measurements using artifi cial mains networks,
Specifi cations in brief
Frequency range
◆
Input 1: 20 Hz to 7/26.5/40 GHz
–
Input 2: 20 Hz to 1 GHz
–
Preselection in receiver mode (fi xed) and analyzer mode (selectable)
◆
Three fi xed-tuned and six or seven tracking fi lters (models .26 and .40)
◆
Preamplifi er with 20 dB gain switch-selectable in conjunction with preselector
◆
Resolution bandwidths
◆
200 Hz, 9 kHz, 120 kHz in accordance with CISPR 16-1-1,
–
10 Hz to 10 MHz, in decadic steps (6 dB bandwidths,
–
receiver and analyzer mode)
1 Hz to 10 MHz, adjustable in steps of 1/2/3/5 (3 dB bandwidths,
–
analyzer mode)
Parallel detectors (max. 4) in receiver mode
◆
Peak, average, CISPR-average, quasi-peak and RMS
Automatic scan
◆
Four storable traces with up to 80 000 measured values each
(250 000 values with one trace)
Internal controller (Windows NT)
◆
for RFI fi eld-strength measurements by
means of test antennas, or for RFI power
measurements with absorbing clamps.
Especially measurements using artifi cial
mains networks and absorbing clamps
put the pulse-handling capability of the
RF input to a severe test. The ¸ESIB
solves this problem by means of a
second, pulse-protected input for the
frequency range from 20 Hz to 1 GHz. In
the case of the ¸ESIB 7, for example, this input can handle pulses with
voltages up to 1500 V and powers up
to 30 mWs without any damage being
caused. Pulses generated by artifi cial
mains networks during phase switching
or during RFI power measurements on
ignition cables using absorbing clamps
pose no problem.
The input bandwidth of the frontend is
limited by preselection fi lters to reduce
the total voltage level at the input mixer
to an extent compatible with the wide
dynamic range required for quasi-peak
detection in the CISPR frequency range.
EMI Test Receivers ¸ESIB 3
Page 4
1 3
2
Fig. 1:
Sensitivity in 30 MHz to 1000 MHz range at 120 kHz IF bandwidth,
with peak detector and transducer factors for antenna + cable, displayed with limit lines for quasi-peak
Fig. 2:
Scan table for CISPR bands A to C/D
Fig. 3:
Inherent noise from 30 Hz to 100 kHz with limit values in line with
MIL-STD-461D RE 101, using the Shielded and Calibrated Magnetic
Field Pickup Coil ¸HZ-10
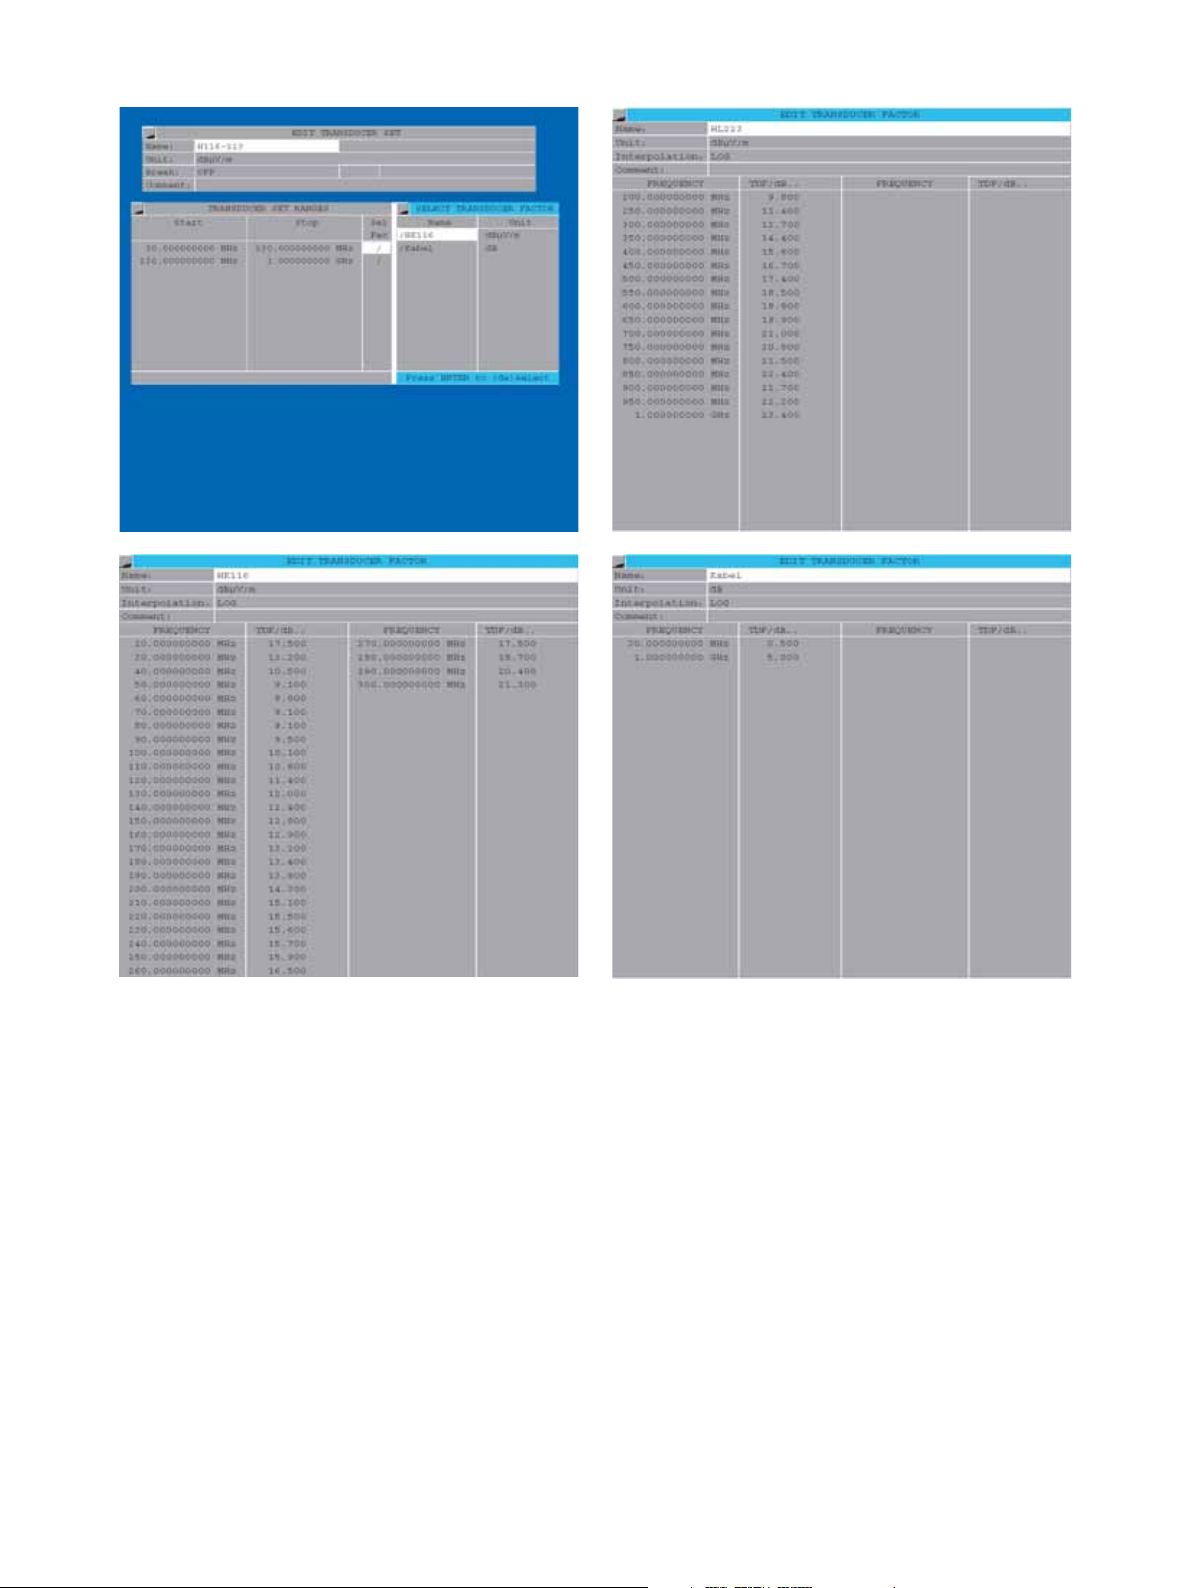
Figs. 4 to 7:
Example of transducer set: combination of antenna + cable
Up to 2 MHz, the ¸ESIB family
uses fi xed-tuned fi lters; from 2 MHz to
1000 MHz, the preselection fi lters operate as tracking fi lters.
An autorange function is available for
the automatic setting of attenuation and
gain in the RF and IF signal paths. This
function ensures the correct combination of attenuation and gain depending
on the test level or any overload of a signal stage caused by pulses or sinusoidal signals. So the operator is not burdened with the internal workings of the
test receiver.
4 EMI Test Receivers ¸ESIB
To measure extremely small voltage
levels occurring, for example, in EMI
measurements on vehicle antennas in
line with CISPR 25, the ¸ESIB family
offers a 20 dB preamplifi er from 9 kHz to
7 GHz (above 7 GHz as option
¸ESIB-B2). The preamplifi er is located between the RF preselection and the
input mixer to be protected against overload. With this preamplifi er, the inherent noise of the ¸ESIB is lowered to
such an extent that the RFI fi eld strength
obtained in an overview measurement
using the peak detector, a log- periodic
antenna (e.g. ¸HL 223) and a 10 m
connecting cable clearly remains below
the EN 55022 quasi-peak limit (Fig. 1).
Fig. 2 shows the SCAN table stipulated
for commercial EMI measurements as a
function of the prescribed CISPR bandwidths.
To achieve high sensitivity in measurements in line with MIL-STD-461D RE 101
in the frequency range from 30 Hz, the
unavoidable feedthrough of the 1st LO
at the input mixer is suppressed by self-
Page 5
4
6
5
alignment of the mixer. The ¸ESIB
consequently features suffi cient inherent
noise suppression with respect to relevant limit values even at the lower frequency limit (Fig. 3).
Defi nition of
standard test sequences
To meet the requirements of relevant
standards, measurements over various
frequency ranges and bandwidths have
to be performed, using different step
sizes and measurement times or differ-
ent receiver settings regarding RF attenuation and preamplifi cation. It must also
be possible to confi gure a scan matched
to DUT characteristics. For this purpose,
the ¸ESIB offers a user-confi gurable
scan table with up to ten subranges.
Calibration values for transducer factors
of absorbing clamps or antennas, for
example, are stored in tables and can be
switched on as required. The transducer
factors can also be combined into transducer sets, for example to display the
i nterference spectrum in the correct unit
dBμV/m in measurements with an
antenna and a connecting cable
(Figs. 4 to 7).
7
EMI emissions are usually measured in
two steps. An overview measurement
performed with the peak detector identifi es critical emissions above or close
to limit values (Fig. 8). In a second measurement with the prescribed CISPR
detectors and an appropriate measurement time, the critical frequencies are
checked for compliance with limit values. The ¸ESIB family supports this
procedure by two independent measurement windows on the screen and offers
automatic or interactive evaluation functions for preview measurements, generation of a peak list (data reduction) and
fi nal measurement.
EMI Test Receivers ¸ESIB 5
Page 6

8 10
9 11
Split-screen display
Critical emissions can be measured with
numeric display of frequency and level
as with classic receivers. Bargraphs
provide an analog display of measured
values for the various detectors simultaneously and in different colors (Fig. 9).
By coupling the marker in the overview
spectrum to the receiver frequency,
emissions can be measured fast and reliably in line with standards.
In the second window, the operator can
zoom in on the displayed trace (Fig. 10).
6 EMI Test Receivers ¸ESIB
Zooming is effected either based on
stored measured data or by means of a
new measurement with the selected detectors. If stored data is used, all stored
values can be displayed. For this, the
¸ESIB can store up to 250 000 measured values with one trace active in
background operation. This considerably
reduces measurement time, since no
new measurement is needed to make a
detailed analysis.
Listen, view, measure
To analyze the spectrum and to exclude
ambient noise, such as originating from
sound or TV broadcast transmitters or
the like, it is expedient to select single
frequencies by means of the markers,
tune the receiver frequency to the marker frequency, and activate the audio
path with the built-in AM/FM demodulator by switching on the loudspeaker or headphones. Acoustic identifi cation is very frequently and successfully
used in EMI signal analysis, all the more
so since manual pre-/postmeasurements
and interactive operation support this
approach.
Page 7

Fig. 8:
Complete representation of spectrum: level display with PK and
AV detectors and QP and AV limit lines
Fig. 9:
Split screen with parallel detectors and bargraph
Fig. 10:
Split screen with trace and zoomed display of trace section
Fig. 11:
Frequency response of the ¸ESIB from 30 MHz up to 7 GHz
Documentation of results
Typical SSB phase noise
Practically any type of printer can be
used for the documentation of results.
The ¸ESIB runs under Windows NT,
so all printers for which Windows drivers
are available can be employed.
mented in the ¸ESIB fully digitally
by means of gate arrays and signal pro-
cessors. This makes for the best possible
Results can not only be output to a
printer but also stored on a fl oppy disk
or the internal hard disk in common
Windows formats such as EMF, WMF
or BMP. The data can be integrated into
reproducibility of results and does away
with the discharge times between mea-
surement periods occurring with analog
detectors. As a result, measurement
times are reduced considerably.
word processing programs for the generation of test reports.
Selftest
High accuracy
In the frequency range up to 1 GHz, the
¸ESIB performs level measurements
with an accuracy of ±1 dB. This is clearly better than the value of ±2 dB specifi ed by CISPR 16-1-1, and is achieved by
individual correction factors stored on all
modules affecting measurement uncertainty. The operator can run calibration
routines for the frequency response,
display linearity and signal path gain
correction for the various instrument settings, thus ensuring low measurement
uncertainty under all specifi ed environmental conditions.
The built-in selftest supports fault local-
ization down to module level. With in-
dividual correction tables being stored
on each module, defective modules can
be replaced largely without any adjust-
ment or additional instruments. Down-
times and repair costs are reduced to a
minimum.
–60
–70
–80
–90
–100
–110
–120
SSB phase noise in dBc (1 Hz)
–130
–140
–150
–155
100 Hz 1 kHz 10 kHz 100 kHz 10 MHz
¸ESIB7/26/40 at 500 MHz
¸
ESIB7/26/40
¸ESIB26/40 at 26.5 GHz
¸ESIB40 at 40 GHz
Carrier offset
1 MHz
System integration
The fast data processing of the
¸ESIB makes it an ideal choice for
use in automatic measurement systems.
The IEC/IEEE bus command set
(IEC 625-2) conforms to SCPI (1994.0).
Fit for the future
The ¸ESIB family can be upgraded
by a wide variety of options to extend
its range of applications and add extra
functionality without requiring additional
instruments. The Tracking Generator
¸FSE-B10 from 9 kHz to 7 GHz
makes it easy to measure shielding
effectiveness or fi lter transfer functions.
at 3.5 GHz
The required calibration sources are connected internally so that autocorrection
is possible even in system applications
without any external equipment such as
cables being required. Pulse weighting
with the prescibed detectors is imple-
EMI Test Receivers ¸ESIB 7
Page 8

Specifi cations
Specifi cations apply under the following conditions: 30 minutes warm-up time at ambient temperature, specifi ed environmental conditions met, calibration cycle
adhered to, and total calibration performed. Data without tolerances: typical values only. Data designated “nominal” applies to design parameters and is not tested.
¸ESIB 7 ¸ESIB 26 ¸ESIB 40
Frequency
Frequency range
Input 1
Input 2
Frequency resolution 0.01 Hz
Internal reference frequency (nominal)
Aging per day
Aging per year
1)
1)
Temperature drift (0 °C to 50 °C) 5 × 10
Total error (per year) 2.5 × 10
External reference frequency 10 MHz or n × 1 MHz, n = 1 to 16
Frequency display (receiver mode)
Display numeric display
Resolution 0.1 Hz
Frequency display (analyzer mode)
Display with marker
Resolution
Accuracy (sweep time >3 × auto sweep time)
Frequency counter measures the marker frequency
Resolution 0.1 Hz to 10 kHz, selectable
Count accuracy (S/N >25 dB) ± (frequency × reference error + ½ (last digit))
Display range for frequency axis 0 Hz, 10 Hz to 7 GHz 0 Hz, 10 Hz to 27 GHz 0 Hz, 10 Hz to 40 GHz
Resolution/accuracy of display range 0.1 Hz/±1 %
Spectral purity for frequencies >500 MHz: see diagram on page 7
SSB phase noise, f ≤ 500 MHz
Carrier offset
100 Hz
1 kHz
10 kHz
2)
100 kHz
2)
1 MHz
Frequency scan (receiver mode)
Scan scan with max. 10 subranges with different settings
Measurement time per frequency 100 μs to 100 s, selectable
Sweep (analyzer mode)
Span 0 Hz (zero span) 1 μs to 2500 s, selectable in steps of 5 %
Span ≥10 Hz 5 ms to 1000 s, selectable in steps of ≤10 %
Accuracy ±1 %
Picture refresh rate
(span ≤7 GHz)
Sampling rate 50 ns (20 MHz A/D converter)
Number of pixels 500
Time measurement with marker and cursor lines
Resolution 50 ns
20 Hz to 7 GHz
20 Hz to 1 GHz
–9
1 × 10
–7
2 × 10
–8
–7
20 Hz to 26.5 GHz
20 Hz to 1 GHz
20 Hz to 40 GHz
20 Hz to 1 GHz
0.1 Hz to 10 kHz (depending on span)
± (marker frequency × reference error + 0.5 % × span + 10 % × resolution bandwidth +
½ (last digit))
<–81 dBc (1 Hz)
<–100 dBc (1 Hz)
<–114 dBc (1 Hz)
<–111 dBc (1 Hz)
<–129 dBc (1 Hz)
>20 updates/s with 1 trace
>15 updates/s with 2 traces at shortest sweep time
8 EMI Test Receivers ¸ESIB
Page 9

¸ESIB 7 ¸ESIB 26 ¸ESIB 40
Preselector (receiver mode)
Filters Frequency range Bandwidth (–6 dB)
1 <150 kHz 230 kHz fi xed
2 150 kHz to 2 MHz 2.6 MHz fi xed
3 2 MHz to 8 MHz 1.9 MHz tracking
4 8 MHz to 25 MHz 5.6 MHz tracking
5 25 MHz to 80 MHz 15 MHz tracking
6 80 MHz to 200 MHz 40 MHz tracking
7 200 MHz to 500 MHz 85 MHz tracking
8 500 MHz to 1000 MHz 104 MHz tracking
9 1 GHz to 7 GHz highpass fi lter fi xed
10 – 7 GHz to 26.5 GHz YIG fi lter 7 GHz to 40 GHz YIG fi lter
– bandwidth (–3 dB): 35 MHz + f/1000
Preamplifi er (1 kHz to 7 GHz) selectable, between preselector and 1st mixer, gain 20 dB
IF bandwidths (receiver and analyzer mode)
3)
6 dB bandwidths 10 Hz, 100 Hz, 200 Hz, 1 kHz, 9 kHz, 10 kHz, 100 kHz, 120 kHz, 1 MHz
, 10 MHz
Bandwidth error
RBW ≤1 MHz
Shape factor B
RBW ≤1 kHz
RBW >1 kHz
60 dB
: B
6 dB
<10 %
<5
<10
Resolution bandwidths (analyzer mode)
3 dB bandwidths 1 Hz to 10 MHz, in steps of 1/2/3/5
Bandwidth error
RBW ≤3 MHz
RBW = 5 MHz
RBW = 10 MHz
Shape factor B
RBW <1 kHz
60 dB
: B
RBW = 1 kHz to 2 MHz
RBW >2 MHz
6 dB
<10 %
<15 %
+25 %, –10 %
<6
<12
<7
Video bandwidths 1 Hz to 10 MHz, in steps of 1/2/3/5
FFT fi lter
3 dB bandwidths
Bandwidth error, nominal
Shape factor B
Display range for frequency axis
60 dB
: B
, nominal
3 dB
Additional level error (reference: RBW = 5 kHz)
Max. display range
Inherent spurious response
1 Hz to 1 kHz, in steps of 1/2/3/5
2 %
2.5
min. 25 × RBW, max. 100000 × RBW or 2 MHz
<1 dB
100 dB
<–100 dBm
Level
Display range displayed noise fl oor to 137 dBμV
Max. input level
Input 1 20 Hz to 7 GHz 20 Hz to 26.5 GHz 20 Hz to 40 GHz
RF attenuation 0 dB
DC voltage 0 V
Sinewave AC voltage 127 dBμV (= 0.3 W)
Pulse spectral density 97 dB(μV/MHz)
RF attenuation ≥10 dB
DC voltage 0 V
Sinewave AC voltage 137 dBμV (= 1 W)
Max. pulse voltage (10 μs) 150 V 50 V 50 V
Max. pulse energy (10 μs) 1 mWs 0.5 mWs 0.5 mWs
EMI Test Receivers ¸ESIB 9
Page 10

¸ESIB 7 ¸ESIB 26 ¸ESIB 40
Input 2 (receiver mode) 20 Hz to 1 GHz
DC voltage
DC coupling 0 V
AC coupling 50 V
RF attenuation 0 dB
Sinewave AC voltage 127 dBμV (= 0.3 W)
Pulse spectral density 97 dB(μV/MHz)
RF attenuation ≥10 dB
Sinewave AC voltage 137 dBμV (= 1 W)
Max. pulse voltage (10 μs) 1500 V 250 V 250 V
Max. pulse energy (10 μs) 30 mWs 15 mWs 15 mWs
1 dB compression of input mixer (RF attenuation 0 dB)
Analyzer mode +10 dBm nominal
Intermodulation
3rd-order intercept point (TOI)
Analyzer mode, Δf > 5 × IF bandwidth or resolution bandwidth,
or >10 kHz
Receiver mode, preamplifi er off
Receiver mode, preamplifi er on
Intercept point k2, analyzer mode >25 dBm, typ. for f < 150 MHz
Level display (receiver mode)
Digital numeric, 0.1 dB resolution
Analog bargraph display, separate for each detector, max. 4 simultaneously
Spectrum level axis 10 dB to 200 dB in steps of 10 dB, frequency axis user-selectable, linear or
Units of level display dBμV, dBm, dBμA, dBpW, dBpT, dB(μV/m), dB(μA/m), dB
Detectors average (AV), RMS, peak (PK), quasi-peak (QP) and CISPR-average (CISPR AV); 4 detectors can
Measurement time 100 μs to 100 s, selectable
Level display (analyzer mode)
Result display 500 × 400 pixels (with one diagram displayed), max. 2 diagrams with independent settings
Logarithmic level range 10 dB to 200 dB in steps of 10 dB
Linear level range 10 % of reference level per division (10 divisions) or logarithmic scaling
Traces max. 4 traces with one diagram (2 traces per diagram with 2 diagrams); quasi-analog display
Trace detectors max. peak, min. peak, auto peak (normal), sample, RMS, average
Trace functions clear/write, max. hold, min. hold, average
Setting range of reference level
Logarithmic level display –130 dBm to 30 dBm in steps of 0.1 dB
Linear level display 7.0 nV to 7.07 V in steps of 1 %
Unit of level axis dBm, dBμV, dBμA, dBpW, dB
≥12 dBm, typ. 15 dBm for f > 150 MHz ≥12 dBm, typ. 15 dBm for
f > 150 MHz; ≥10 dBm for
f > 7 GHz
≥2 dBm, typ. 5 dBm for f > 150 MHz
≥–18 dBm, typ. –15 dBm for f > 150 MHz
>40 dBm, typ. for f > 150 MHz
logarithmic
x4)/MHz
be switched on simultaneously
of all traces
x4)/MHz (logarithmic level display);
mV, μA, pW, nW (linear level display)
10 EMI Test Receivers ¸ESIB
Page 11

¸ESIB 7 ¸ESIB 26 ¸ESIB 40
Displayed noise fl oor (receiver mode)
Linear average (AV) display (preamplifi er off/on)
20 Hz to 1 kHz, RBW = 10 Hz 20 dBμV to –10 dBμV/–
1 kHz to 9 kHz, RBW = 10 Hz –10 dBμV to –16 dBμV/–25 dBμV to –30 dBμV
9 kHz to 150 kHz, RBW = 200 Hz 0 dBμV to –12 dBμV/–10 dBμV to –24 dBμV
150 kHz to 2 MHz, RBW = 9 kHz 5 dBμV to –5 dBμV/–7 dBμV to –17 dBμV
2 MHz to 30 MHz, RBW = 9 kHz <–5 dBμV/<–17 dBμV
30 MHz to 200 MHz, RBW = 120 kHz <10 dBμV/<–6 dBμV <13 dBμV/<–3 dBμV <13 dBμV/<–3 dBμV
200 MHz to 1000 MHz, RBW = 120 kHz <7 dBμV/<–6 dBμV <10 dBμV/<–3 dBμV <10 dBμV/<–3 dBμV
1 GHz to 5 GHz, RBW = 1 MHz <15 dBμV/<6 dBμV <18 dBμV/<9 dBμV <18 dBμV/<9 dBμV
5 GHz to 7 GHz, RBW = 1 MHz <22 dBμV/<9 dBμV <25 dBμV/<12 dBμV <25 dBμV/<12 dBμV
7 GHz to 18 GHz, RBW = 1 MHz – <19 dBμV <23 dBμV
18 GHz to 26.5 GHz, RBW = 1 MHz – <22 dBμV <26 dBμV
26.5 GHz to 30 GHz, RBW = 1 MHz – – <37 dBμV
30 GHz to 40 GHz, RBW = 1 MHz – – <41 dBμV
RMS, typ. increase rel. to AV display +1 dB
PK, typ. increase rel. to AV display +11 dB
Quasi-peak (preamplifi er off/on)
Band A 3 dBμV to –9 dBμV/–7 dBμV to –21 dBμV
Band B 9 dBμV to 0 dBμV/–2 dBμV to –12 dBμV
Band C 17 dBμV/1 dBμV 20 dBμV/4 dBμV 20 dBμV/4 dBμV
Band D 14 dBμV/1 dBμV 17 dBμV/4 dBμV 17 dBμV/4 dBμV
Displayed noise fl oor (analyzer mode) (displayed average noise fl oor, 0 dB RF attenuation, RBW = 10 Hz, VBW = 1 Hz, 20 averages, trace average, zero span,
termination 50 Ω)
Frequency
20 Hz <–74 dBm
1 kHz <–104 dBm
10 kHz <–119 dBm
100 kHz <–129 dBm
1 MHz <–142 dBm, typ. –145 dBm
10 MHz to 5 GHz <–142 dBm, typ. –147 dBm <–138 dBm, typ. –140 dBm <–138 dBm, typ. –140 dBm
5 GHz to 7 GHz <–139 dBm, typ. –141 dBm <–135 dBm, typ. –138 dBm <–135 dBm, typ. –138 dBm
7 GHz to 18 GHz – <–138 dBm, typ. –140 dBm <–134 dBm, typ. –139 dBm
18 GHz to 26.5 GHz – <–135 dBm, typ. –138 dBm <–131 dBm, typ. –136 dBm
26.5 GHz to 30 GHz – – <–120 dBm, typ. –125 dBm
30 GHz to 40 GHz – – <–116 dBm, typ. –122 dBm
Max. dynamic range (1 Hz bandwidth)
1 dB compression point/displayed noise fl oor 162 dB 160 dB 160 dB
Max. harmonics suppression, f > 50 MHz >90 dB
Max. intermodulation-free range
150 MHz to 7 GHz/26.5 GHz (nominal) 115 dB 112 dB 112 dB
Intermodulation free range at –40 dBm mixer input level 105 dB
Immunity to interference
Image frequency >80 dB, typ. >90 dB >80 dB, typ. >90 dB >80 dB
Intermediate frequency >75 dB >75 dB >80 dB
EMI Test Receivers ¸ESIB 11
Page 12

¸ESIB 7 ¸ESIB 26 ¸ESIB 40
Spurious response
(f > 1 MHz, without input signal, 0 dB RF attenuation)
Receiver mode or span <30 MHz
Span ≥30 MHz
f
= 25.175 MHz, 60 MHz, 5.7172 GHz
in
<–3 dBμV
<7 dBμV
<7 dBμV
Other spurious <–75 dBc
RF leakage
<0 dBμV
Voltage display at fi eld strength of 10 V/m and 0 dB RF attenuation
(f ≠ fin, f ≠ fIF, fs ≤ 1 GHz)
Additional error in quasi-peak display range (10 V/m)
(f ≠ f
, f ≠ fIF, fs ≤ 1 GHz)
in
<1 dB
Level measurement accuracy
Level error at 120 MHz (level = –40 dBm, RF attenuation 20 dB,
±0.3 dB
ref. level –15 dBm, RBW 5 kHz)
Attenuator ±0.3 dB
IF gain ±0.2 dB, typ. ±0.1 dB
Linearity
Logarithmic level display (RBW ≥1 kHz, analog, S/N >15 dB)
0 dB to –50 dB
–50 dB to –70 dB
–70 dB to –95 dB
Linear level display
±0.3 dB
±0.5 dB
±1 dB
5 % of reference level
Bandwidth switching
1 Hz to 30 kHz/100 kHz to 300 kHz
1 MHz to 10 MHz
±0.2 dB
±0.3 dB
Frequency response (analyzer mode, 10 dB RF attenuation)
≤1 GHz
±0.5 dB
1 GHz to 7 GHz ±1 dB
7 GHz to 18 GHz – ±2 dB ±2 dB
18 GHz to 26.5 GHz – ±2.5 dB
5)
±2.5 dB
26.5 GHz to 40 GHz – – ±3 dB
Total error
Receiver mode (AV display, display range = 0 dB to –50 dB, S/N >15 dB, preamplifi er off)
≤9 kHz
≤150 kHz
≤1 GHz
±1.5 dB
±1.2 dB
±1 dB
1 GHz to 4.5 GHz ±2 dB
4.5 GHz to 7 GHz ±2.5 dB
7 GHz to 18 GHz – ±2.5 dB
18 GHz to 26.5 GHz – ±3 dB
5)
5)
±2.5 dB
±3 dB
26.5 GHz to 40 GHz – – ±3.5 dB
Additional error with preamplifi er <0.5 dB
Analyzer mode (display range = 0 dB to –50 dB, S/N >15 dB, span/RBW <100)
<1 GHz ±1 dB
1 GHz to 4.5 GHz ±1.5 dB
4.5 GHz to 7 GHz ±2 dB
7 GHz to 18 GHz – ±2.5 dB
18 GHz to 26.5 GHz – ±3 dB
5)
5)
±2.5 dB
±3 dB
26.5 GHz to 40 GHz – – ±3.5 dB
Audio demodulation
Demodulation modes AM and FM
Audio output loudspeaker and phone jack
5)
5)
5)
5)
5)
5)
5)
5)
12 EMI Test Receivers ¸ESIB
Page 13

¸ESIB 7 ¸ESIB 26 ¸ESIB 40
Trigger functions
Trigger free-run, line, video, RF, external
Delayed sweep
Trigger source free-run, line, video, external
Delay time 100 ns to 10 s, resolution min. 1 μs or 1 % of delay time
Error of delay time ±(1 μs + (0.05 % × delay time))
Delayed sweep time 2 μs to 1000 s
Gated sweep
Trigger source external, RF
Gate delay 1 μs to 100 s
Gate length 1 μs to 100 s, resolution min. 1 μs or 1 % of gate length
Error of gate length ±(1 μs + (0.05 % × gate length))
Gap sweep (span = 0 Hz)
Trigger source free-run, line, video, RF, external
Pretrigger 1 μs to 100 s, resolution 50 ns, depending on sweep time
Trigger to gap time 1 μs to 100 s, resolution 50 ns, depending on sweep time
Gap length 1 μs to 100 s, resolution 50 ns
Inputs and outputs (front panel)
RF inputs
Input 1 20 Hz to 7 GHz
N female, 50 Ω
20 Hz to 26.5 GHz
adapter system, 50 Ω, N male
and female, 3.5 mm male and
female
VSWR (receiver mode, f ≤ 1 GHz)
RF attenuation 0 dB <2
RF attenuation ≥10 dB
<1.2
f < 3.5 GHz <1.5
f < 7 GHz <2.0
f < 26.5 GHz – <3.0 <2.5
f < 37 GHz – – <2.5
f < 40 GHz – – typ. 2.5
VSWR (analyzer mode)
RF attenuation ≥10 dB
f < 3.5 GHz <1.5
f < 7 GHz <2.0
f < 26.5 GHz – <3.0 <2.5
f < 37 GHz – – <2.5
f < 40 GHz – – typ. 2.5
Attenuator 0 dB to 70 dB, selectable in steps of 10 dB
Input 2 20 Hz to 1 GHz
N female, 50 Ω
VSWR (receiver mode)
RF attenuation <10 dB <2
RF attenuation ≥10 dB
VSWR (analyzer mode)
<1.2
<1.5
RF attenuation ≥10 dB
Attenuator 0 dB to 70 dB, selectable in steps of 5 dB, selectable AC/DC coupling
20 Hz to 40 GHz
adapter system, 50 Ω,
N male and female, K male
and female
EMI Test Receivers ¸ESIB 13
Page 14

¸ESIB 7 ¸ESIB 26 ¸ESIB 40
Probe power supply +15 V DC, –12.6 V DC and ground, max. 150 mA
Power supply and coding connector for antennas etc
12-contact Tuchel
(antenna code)
Supply voltages ±10 V, max. 100 mA, ground
AF output
Z
= 10 Ω, jack plug
out
Open-circuit voltage up to 1.5 V, adjustable
Inputs and outputs (rear panel)
IF 21.4 MHz
Level
Video output
Voltage (resolution bandwidth ≥1 kHz)
Z
= 50 Ω, BNC female, bandwidth >1 kHz or IF or resolution bandwidth
out
0 dBm at reference level, mixer level >–60 dBm
Z
= 50 Ω, BNC female
out
0 V to 1 V, full scale (open-circuit voltage), logarithmic scaling
Reference frequency
Output, usable as input
Output frequency
Level
Input
Required level
BNC female
10 MHz
10 dBm nominal
1 MHz to 16 MHz, in steps of 1 MHz
>0 dBm into 50 Ω
Sweep output BNC female, 0 V to +10 V in sweep range
Power supply connector for noise source BNC female, 0 V and 28 V, switch-selected
External trigger/gate input
Voltage
IEC/IEEE bus remote control
Command set
Connector
Interface functions
BNC female, >10 kΩ
–5 V to +5 V, adjustable
interface in line with IEC 625-2 (IEEE 488.2)
SCPI 1994.0
24-contact Amphenol female
SH1, AH1, T6, L4, SR1, RL1, PP1, DC1, DT1, C11
Serial interface RS-232-C (COM1 and COM2), 9-contact female connectors
Mouse interface PS/2-compatible
Printer interface parallel (Centronics-compatible) or serial (RS-232-C)
Keyboard connector 5-contact DIN female for MF2 keyboard
User interface 25-contact Cannon female
Connector for external monitor (VGA) 15-contact female
General data
Display
Resolution
Pixel error rate
24 cm LC color display (9.5“)
640 × 480 pixels (VGA resolution)
–5
<2 × 10
Mass memory 1.44 Mbyte 3½“ disk drive, hard disk
Temperature ranges
Operating temperature range
Permissible temperature range
Storage temperature range
+5 °C to +40 °C
0 °C to +50 °C
–40 °C to +70 °C
Environmental conditions +40 °C at 95 % relative humidity (IEC 68-2-3)
Mechanical stress
Sinewave vibration
5 Hz to 150 Hz, max. 2 g at 55 Hz, 0.5 g from 55 Hz to 150 Hz; in line with IEC 68-2-6,
IEC 68-2-3, IEC 1010-1, MIL-T-28800D, class 5
Random vibration
Shock
10 Hz to 300 Hz, acceleration 1.2 g RMS
40 g shock spectrum, in line with MIL-STD-810C and MIL-T-28800D, classes 3 and 5
Recommended calibration interval 1 year (2 years for operation with external reference)
EMC in line with CISPR 11/EN 55011 group 1 class B; in line with IEC/EN 61326, emission: class B
(residential environment), immunity: industrial environment (including operating frequency);
in line with CISPR 16-1-1
Power supply
AC supply 200 V to 240 V: 50 Hz to 60 Hz, 100 V to 120 V: 50 Hz to 400 Hz,
safety class in line with VDE 411
Power consumption 195 VA 230 VA
Safety in line with EN 61010-1, UL 3111-1, CSA C22.2 No. 1010-1, IEC 1010-1
Test mark VDE, GS, UL, cUL
14 EMI Test Receivers ¸ESIB
Page 15

¸ESIB 7 ¸ESIB 26 ¸ESIB 40
Dimensions (W × H × D) 435 mm × 236 mm × 570 mm
Weight 25.1 kg 26.4 kg 27.0 kg
1)
Aft er 30 days of op eration.
2)
Valid fo r span >100 kHz.
3)
In line with CISPR 16 (tolera nce for impuls e bandwidt hs) and MIL-ST D (–6 dB).
4)
x = μV, μV/m, μA or μ A/m.
5)
For RF f requencie s >7 GHz : error aft er calling pe aking func tion. For sweep time <10 ms/GH z: addition al error ±1.5 dB.
Ordering information
Designation Type Order No.
EMI Test Receiver (20 Hz to 7 GHz) ¸ESIB 7 1088.7490.07
EMI Test Receiver (20 Hz to 26.5 GHz) ¸ESIB 26 1088.7490.26
EMI Test Receiver (20 Hz to 40 GHz) ¸ESIB 40 1088.7490.40
Options
Linear Video Output ¸ESIB-B1 1089.0547.02
Preamplifi er 20 dB, 7 GHz to 26.5 GHz ¸ESIB-B2 1137.4494.26
Preamplifi er 20 dB, 7 GHz to 40 GHz ¸ESIB-B2 1137.4494.40
Tracking Generator 7 GHz ¸FSE-B10 1066.4769.02
Switchable Attenuator for Tracking Generator ¸FSE-B12 1066.5065.02
Ethernet Card, RJ-45 connector ¸FSE-B16 1037.5973.04
Second IEC/IEEE Bus Card ¸FSE-B17 1066.4017.02
External Mixer Output for ¸ESIB 26/40 ¸FSE-B21 1084.7243.02
Software
EMC Measurement Software (32 bit) ¸EMC 32-E+ 1501.9590.02
Driver for EMI Test Software ¸ES-K1 ¸ES-K16 1108.0288.02
Recommended extras
Service Kit ¸FSE-Z1 1066.3862.02
DC Block, 10 kHz to 18 GHz (type N) ¸FSE-Z4 1084.7443.02
Microwave Measurement Cable and Adapter Set ¸FS-Z15 1046.2002.02
Headphones – 0708.9010.00
IEC/IEEE Bus Cable, 1 m ¸PCK 0292.2013.10
IEC/IEEE Bus Cable, 2 m ¸PCK 0292.2013.20
Control Cable 3 m, between ¸ESIB and ¸ENV 216 ¸EZ-Z1 1107.2087.03
Control Cable 10 m, between ¸ESIB and ¸ENV 216 ¸EZ-Z1 1107.2087.10
Control Cable 10 m, between ¸ESIB and ¸ESH 3-Z5 ¸EZ-6 0816.0683.03
Control Cable 3 m, between ¸ESIB and ¸ENV 4200 ¸EZ-21 1107.2087.03
19“ Rack Adapter, 5 HU ¸ZZA-95 0396.4911.00
Recommended EMI accessories
see EMC Test & Measurement Products Catalog, Order No. 5213.5400.42
Accessories supplied
Power cable, operating manual, spare fuses, test port adapter N and 3.5 mm connector (female) (for ¸ESIB 26 and ¸ESIB 40), application software for
¸ESIB-K1
EMI Test Receivers ¸ESIB 15
Page 16

Certified Quality System
ISO 9001
DQS REG. NO 1954 QM
More information at
www.rohde-schwarz.com
(search term: ESIB)
Certified Environmental System
ISO
14001
DQS REG. NO 1954 UM
Europe: +49 1805 12 4242, customersuppor t@rohde -schwarz.com
www.rohde-schwarz.com
USA and Canada: 1-88 8-837- 8772, customer.suppor t@rsa.rohde-schwarz.com
Asia: +65 65130488, customersupport.asia@rohde-schwarz.com
¸is a register ed trademark of Rohde & Schwar z GmbH & Co. KG · Trade names are trademarks of t he owners · Printe d in Germany (U sk)
PD 5213.64 35.32 · ¸ES IB · Version 03.00 · Januar y 2006 · Dat a without t olerance limits is not binding · Subje ct to change
 Loading...