

Page 1

Revision P
March 2015
by AMETEK Programmable Power.
All rights reserved.
Copyright 2015
P/N M162084-01
CSW Series
AC Power Source
User Manual
Page 2

User Manual California Instruments
User's Manual
California Instruments AC Power Source
By AMETEK Programmable Power.
Models :
•
CSW5550
•
CSW5550-400
•
CSW11100
•
CSW11100-400
•
CSW16650
•
CSW16650-400
•
CSW22200
•
CSW22200-400
•
CSW27750
•
CSW27750-400
•
CSW33300
•
CSW33300-400
•
CSW38850
•
CSW38850-400
•
CSW44400
•
CSW44400-400
Copyright 2015 AMETEK Programmable Power. Rev P, March 2015.
2 CSW Series
Page 3

User Manual California Instruments
About AMETEK
AMETEK Programmable Power, Inc., a Division of AMETEK, Inc., is a global leader in the design
and manufacture of precision, programmable power supplies for R&D, test and measurement,
process control, power bus simulation and power conditioning applications across diverse industrial
segments. From bench top supplies to rack-mounted industrial power subsystems, AMETEK
Programmable Power is the proud manufacturer of Elgar, Sorensen, California Instruments and
Power Ten brand power supplies.
AMETEK, Inc. is a leading global manufacturer of electronic instruments and electromechanical
devices with annualized sales of $2.5 billion. The Company has over 11,000 colleagues working at
more than 80 manufacturing facilities and more than 80 sales and service centers in the United
States and around the world.
Trademarks
AMETEK is a registered trademark of AMETEK, Inc. California Instruments is a trademark owned by
AMETEK, Inc. Other trademarks, registered trademarks, and product names are the property of their
respective owners and are used herein for identification purposes only.
Notice of Copyright
CSW Series User Manual
© 2015 AMETEK Programmable Power, Inc. All rights reserved.
Exclusion for Documentation
UNLESS SPECIFICALLY AGREED TO IN WRITING, AMETEK PROGRAMMABLE POWER, INC. (“AMETEK”):
(a) MAKES NO WARRANTY AS TO THE ACCURACY, SUFFICIENCY OR SUITABILITY OF ANY
TECHNICAL OR OTHER INFORMATION PROVIDED IN ITS MANUALS OR OTHER
DOCUMENTATION.
(b) ASSUMES NO RESPONSIBILITY OR LIABILITY FOR LOSSES, DAMAGES, COSTS OR EXPENSES,
WHETHER SPECIAL, DIRECT, INDIRECT, CONSEQUENTIAL OR INCIDENTAL, WHICH MIGHT
ARISE OUT OF THE USE OF SUCH INFORMATION. THE USE OF ANY SUCH INFORMATION WILL
BE ENTIRELY AT THE USER’S RISK, AND
(c) REMINDS YOU THAT IF THIS MANUAL IS IN ANY LANGUAGE OTHER THAN ENGLISH,
ALTHOUGH STEPS HAVE BEEN TAKEN TO MAINTAIN THE ACCURACY OF THE TRANSLATION,
THE ACCURACY CANNOT BE GUARANTEED. APPROVED AMETEK CONTENT IS CONTAINED
WITH THE ENGLISH LANGUAGE VERSION, WHICH IS POSTED AT
WWW.PROGRAMMABLEPOWER.COM.
Date and Revision
March 2015 Revision P
Part Number
M162084-01
Contact Information
Telephone: 800 733 5427 (toll free in North America)
858 450 0085 (direct)
Fax: 858 458 0267
Email: sales.ppd@ametek.com
service.ppd@ametek.com
Web: www.programmablepower.com
CSW Series 3
Page 4
User Manual California Instruments
Important Safety Instructions
Before applying power to the system, verify that your product is configured properly for your
particular application.
WARNING
WARNING
Only qualified personnel who deal with attendant hazards in power supplies, are allowed to perform
installation and servicing.
Ensure that the AC power line ground is connected properly to the Power Rack input connector or
chassis. Similarly, other power ground lines including those to application and maintenance equipment
must be grounded properly for both personnel and equipment safety.
Always ensure that facility AC input power is de-energized prior to connecting or disconnecting any
cable.
In normal operation, the operator does not have access to hazardous voltages within the chassis.
However, depending on the user’s application configuration, HIGH VOLTAGES HAZARDOUS TO
HUMAN SAFETY may be normally generated on the output terminals. The customer/user must ensure
that the output power lines are labeled properly as to the safety hazards and that any inadvertent
contact with hazardous voltages is eliminated.
Guard against risks of electrical shock during open cover checks by not touching any portion of the
electrical circuits. Even when power is off, capacitors may retain an electrical charge. Use safety
glasses during open cover checks to avoid personal injury by any sudden component failure.
Neither AMETEK Programmable Power Inc., San Diego, California, USA, nor any of the subsidiary
sales organizations can accept any responsibility for personnel, material or inconsequential injury, loss
or damage that results from improper use of the equipment and accessories.
Hazardous voltages may be present when covers are removed. Qualified
personnel must use extreme caution when servicing this equipment.
Circuit boards, test points, and output voltages also may be floating above
(below) chassis ground.
The equipment used contains ESD sensitive parts. When installing
equipment, follow ESD Safety Procedures. Electrostatic discharges might
cause damage to the equipment.
4 CSW Series
Page 5
User Manual California Instruments
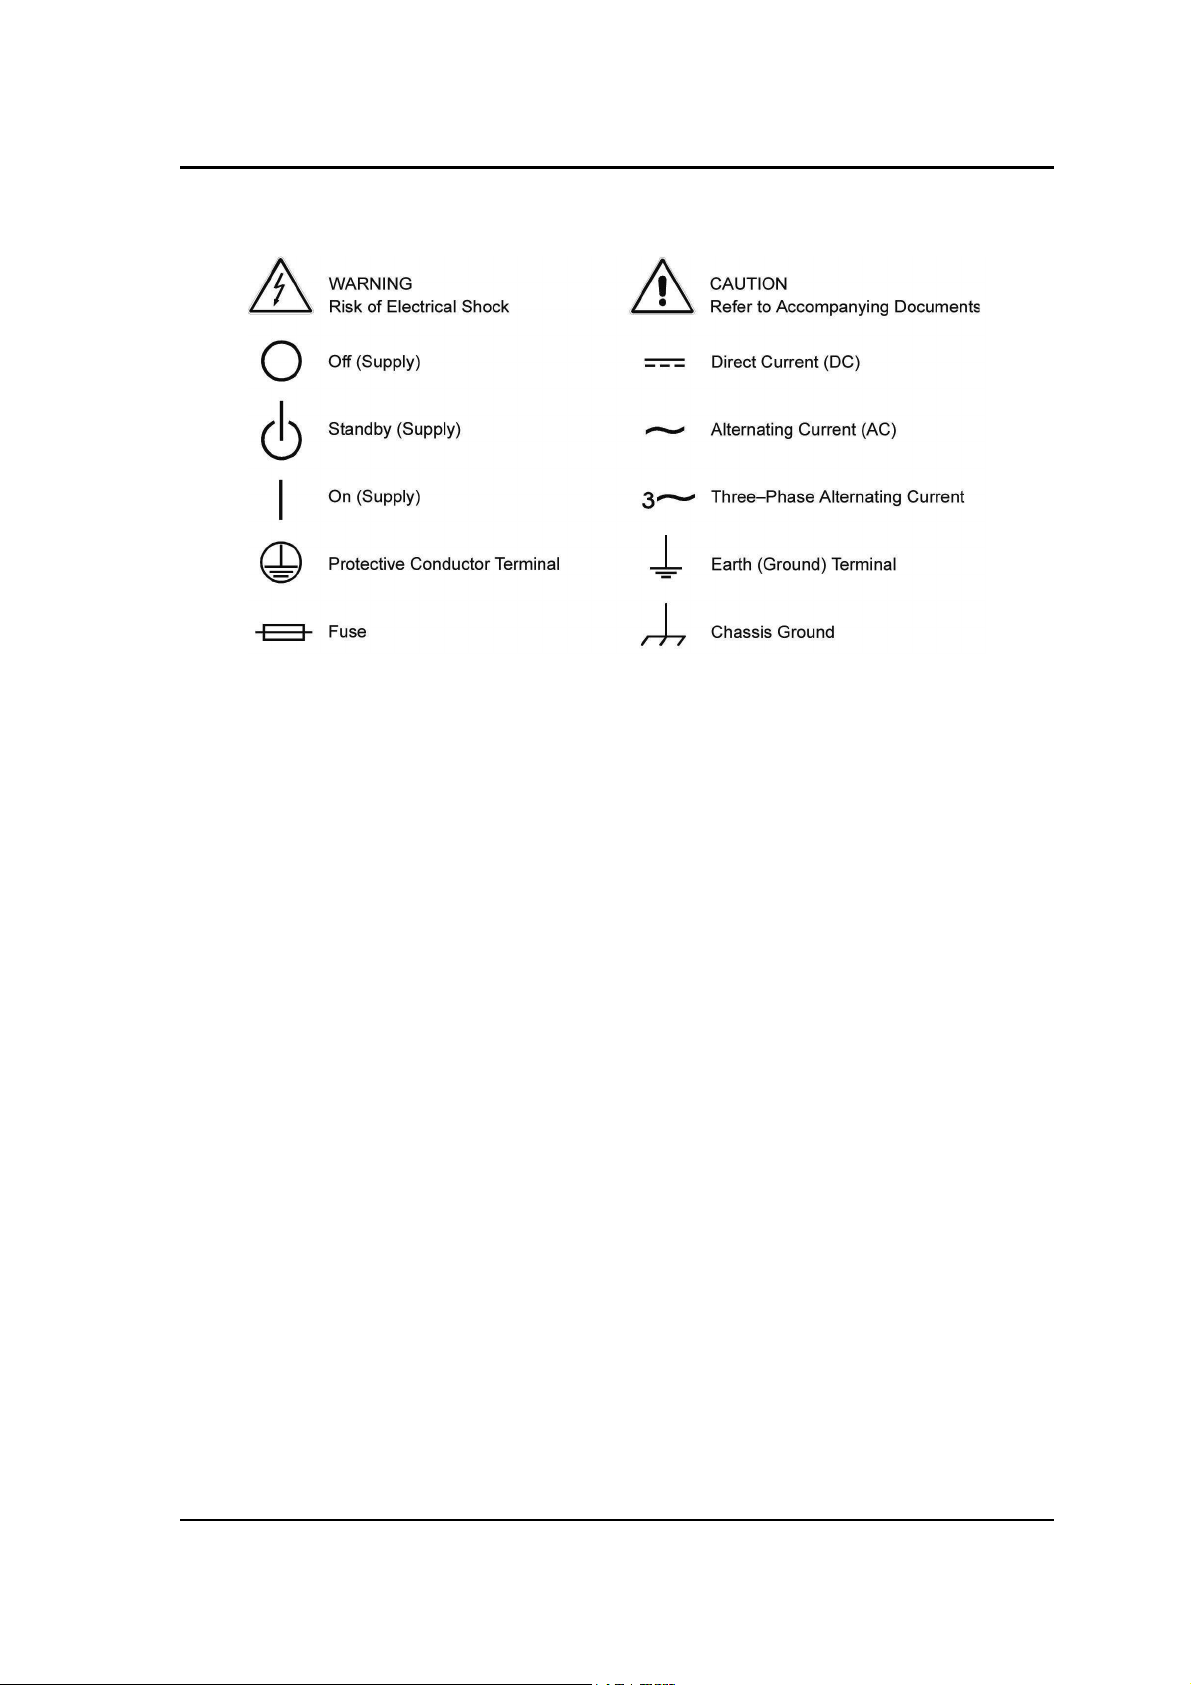
SAFETY SYMBOLS
CSW Series 5
Page 6

User Manual California Instruments
Product Family: CSW Series Power Source
Warranty Period: 1 Year
WARRANTY TERMS
AMETEK Programmable Power, Inc. (“AMETEK”), provides this written warranty covering the
Product stated above, and if the Buyer discovers and notifies AMETEK in writing of any defect in
material or workmanship within the applicable warranty period stated above, then AMETEK may, at
its option: repair or replace the Product; or issue a credit note for the defective Product; or provide
the Buyer with replacement parts for the Product.
The Buyer will, at its expense, return the defective Product or parts thereof to AMETEK in
accordance with the return procedure specified below. AMETEK will, at its expense, deliver the
repaired or replaced Product or parts to the Buyer. Any warranty of AMETEK will not apply if the
Buyer is in default under the Purchase Order Agreement or where the Product or any part thereof:
•
is damaged by misuse, accident, negligence or failure to maintain the same as
specified or required by AMETEK;
•
is damaged by modifications, alterations or attachments thereto which are not
authorized by AMETEK;
•
is installed or operated contrary to the instructions of AMETEK;
•
is opened, modified or disassembled in any way without AMETEK’s consent; or
•
is used in combination with items, articles or materials not authorized by AMETEK.
The Buyer may not assert any claim that the Products are not in conformity with any warranty until
the Buyer has made all payments to AMETEK provided for in the Purchase Order Agreement.
PRODUCT RETURN PROCEDURE
Request a Return Material Authorization (RMA) number from the repair facility (must be done in
the country in which it was purchased):
•
In the USA, contact the AMETEK Repair Department prior to the return of the
product to AMETEK for repair:
Telephone: 800-733-5427, ext. 2295 or ext. 2463 (toll free North America)
858-450-0085, ext. 2295 or ext. 2463 (direct)
•
Outside the United States, contact the nearest Authorized Service Center (ASC). A
full listing can be found either through your local distributor or our website,
www.programmablepower.com, by clicking Support and going to the Service Centers
tab.
When requesting an RMA, have the following information ready:
•
Model number
•
Serial number
•
Description of the problem
NOTE: Unauthorized returns will not be accepted and will be returned at the shipper’s expense.
NOTE: A returned product found upon inspection by AMETEK, to be in specification is subject to an
evaluation fee and applicable freight charges.
6 CSW Series
Page 7

User Manual California Instruments
Table of Contents
1. Introduction ........................................................................................................................... 12
1.1 General Description ............................................................................................................................. 12
1.2 CSW Models ........................................................................................................................................ 13
2. Specifications ....................................................................................................................... 14
2.1 Electrical .............................................................................................................................................. 14
2.2 Mechanical .......................................................................................................................................... 27
2.3 Environmental ...................................................................................................................................... 27
2.4 Regulatory ........................................................................................................................................... 28
2.5 Front Panel Controls ............................................................................................................................ 28
2.6 Special Features, OptionsEP5362706-05 and Accessories ................................................................ 29
2.7 Supplemental Specifications ................................................................................................................ 30
3. Unpacking and Installation ................................................................................................... 31
3.1 Unpacking ............................................................................................................................................ 31
3.2 Power Requirements ........................................................................................................................... 31
3.3 Mechanical Installation ........................................................................................................................ 32
3.4 Input Wiring – TB1 ............................................................................................................................... 32
3.5 Output Power Connections – TB2 ....................................................................................................... 33
3.6 Connectors - Rear Panel ..................................................................................................................... 35
3.7 Single-Phase and Three Phase Multiple Box System Configurations.................................................. 39
3.8 Output Voltage Ranges ....................................................................................................................... 40
3.9 Functional Test .................................................................................................................................... 40
3.10 Tour of the Front Panel ........................................................................................................................ 46
3.11 Menu Structure .................................................................................................................................... 52
3.12 Output Programming ........................................................................................................................... 86
3.13 Waveform Management ...................................................................................................................... 88
3.14 Standard Measurements ..................................................................................................................... 92
3.15 Advanced Measurements .................................................................................................................... 93
3.16 Transient Programming ..................................................................................................................... 102
4. Principle of Operation ......................................................................................................... 107
4.1 General .............................................................................................................................................. 107
4.2 Overall Description ............................................................................................................................ 107
4.3 Controller (A2) (7006-714) ................................................................................................................. 107
4.4 Keyboard/Display Board (A1) (7006-716) .......................................................................................... 107
4.5 Remote Interface (A7) (7006-715) ..................................................................................................... 107
4.6 Analog Board (A3) (5162062) ............................................................................................................ 108
4.7 Auxiliary Power Supply (A8) (5162048) ............................................................................................. 108
4.8 PFC - DC/DC Module (A14, A15 and A16) (5161273) ....................................................................... 110
4.9 Phase A, B and C Amplifiers (A17, A18, A19) (5161274-05) ............................................................. 112
4.10 Output Filter Board (A9) (5162063) ................................................................................................... 112
4.11 Circuit Breaker & Trip Circuit (A5)...................................................................................................... 112
5. Calibration ........................................................................................................................... 114
5.1 Calibration Equipment ....................................................................................................................... 114
5.2 Calibration Screen Access ................................................................................................................. 114
5.3 Routine Calibration ............................................................................................................................ 115
5.4 Non-Routine Calibration .................................................................................................................... 120
6. Service ................................................................................................................................. 122
6.1 Cleaning ............................................................................................................................................ 122
6.2 General .............................................................................................................................................. 122
6.3 Basic operation .................................................................................................................................. 122
6.4 125
CSW Series 7
Page 8

User Manual California Instruments
7. Top Assembly Replaceable Parts ....................................................................................... 125
7.1 Sub assemblies ................................................................................................................................. 125
7.2 126
8. Options ................................................................................................................................ 126
8.1 RTCA/DO-160 Option ....................................................................................................................... 126
8.2 IEC 61000-4-11 Option ..................................................................................................................... 143
8.3 IEC 61000-4-13 Option ..................................................................................................................... 151
8.4 WHM Option ...................................................................................................................................... 164
9. Error Messages ................................................................................................................... 166
10. Index .................................................................................................................................... 172
8 CSW Series
Page 9

User Manual California Instruments
List of Figures
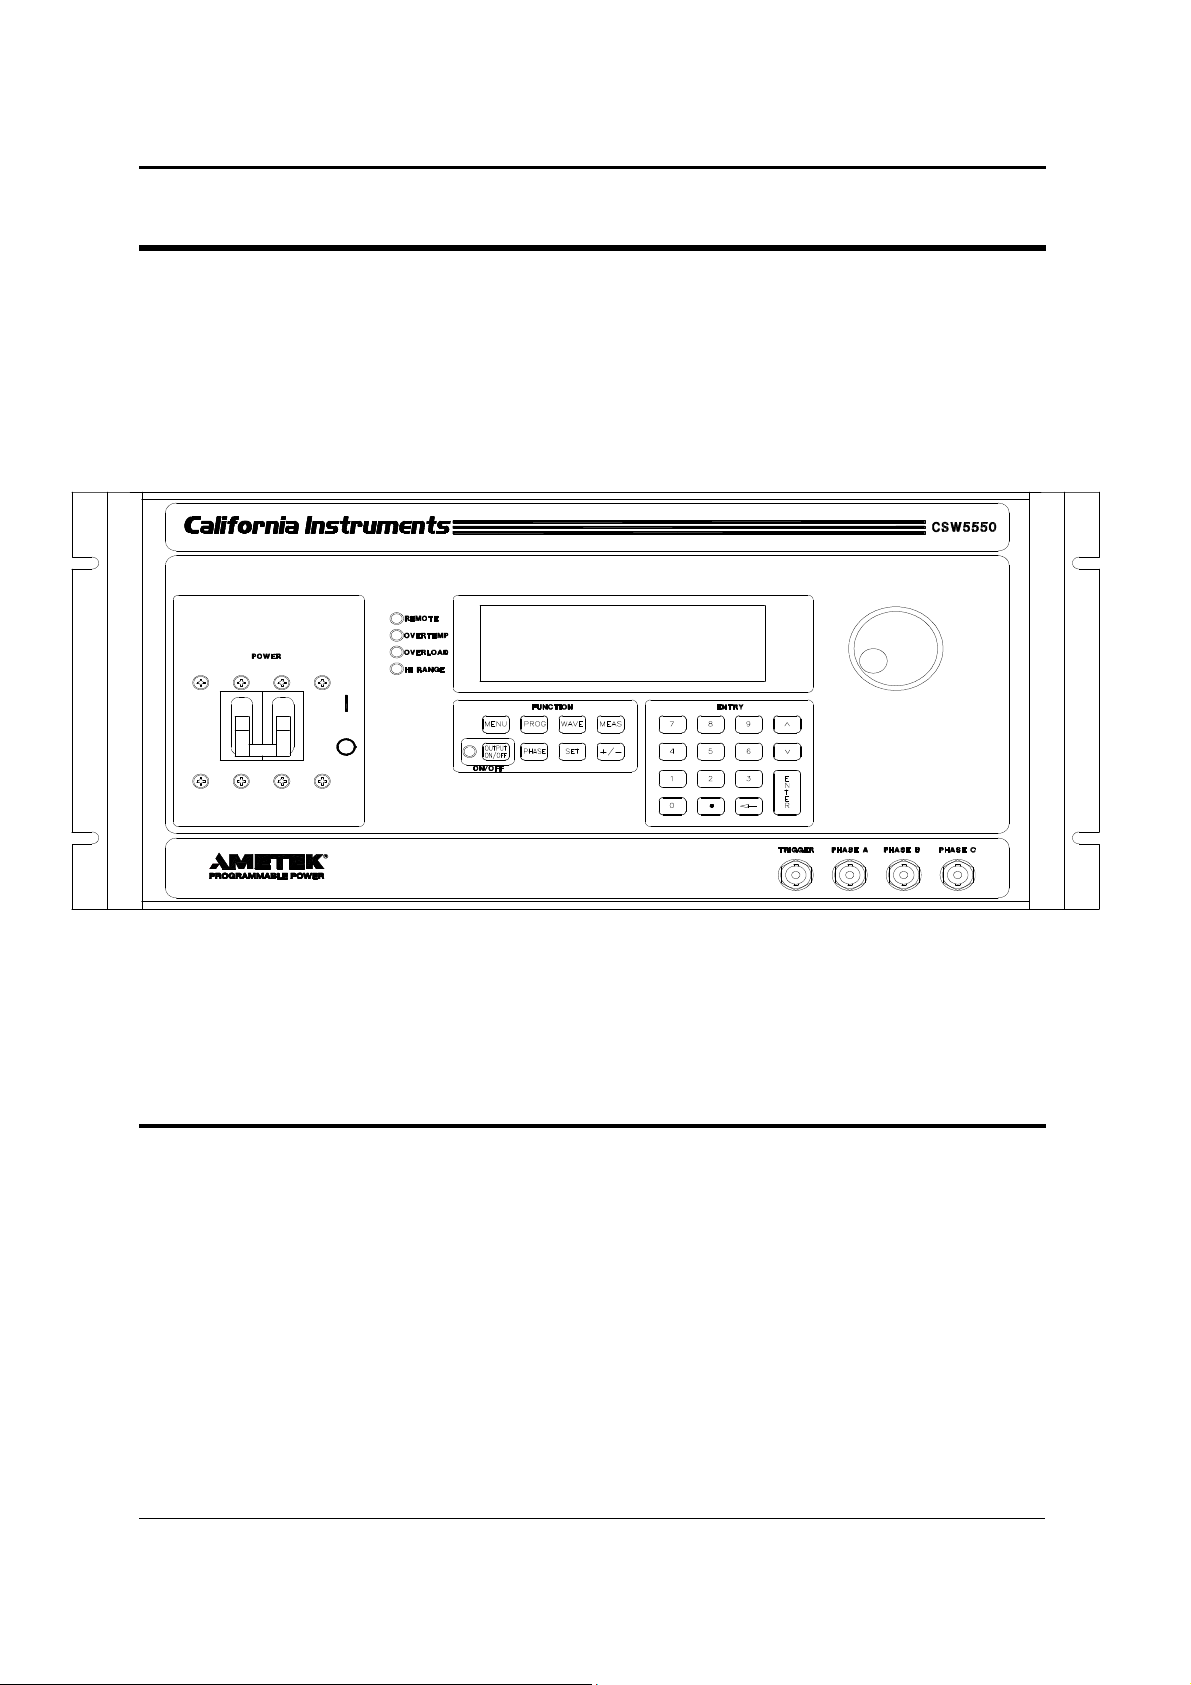
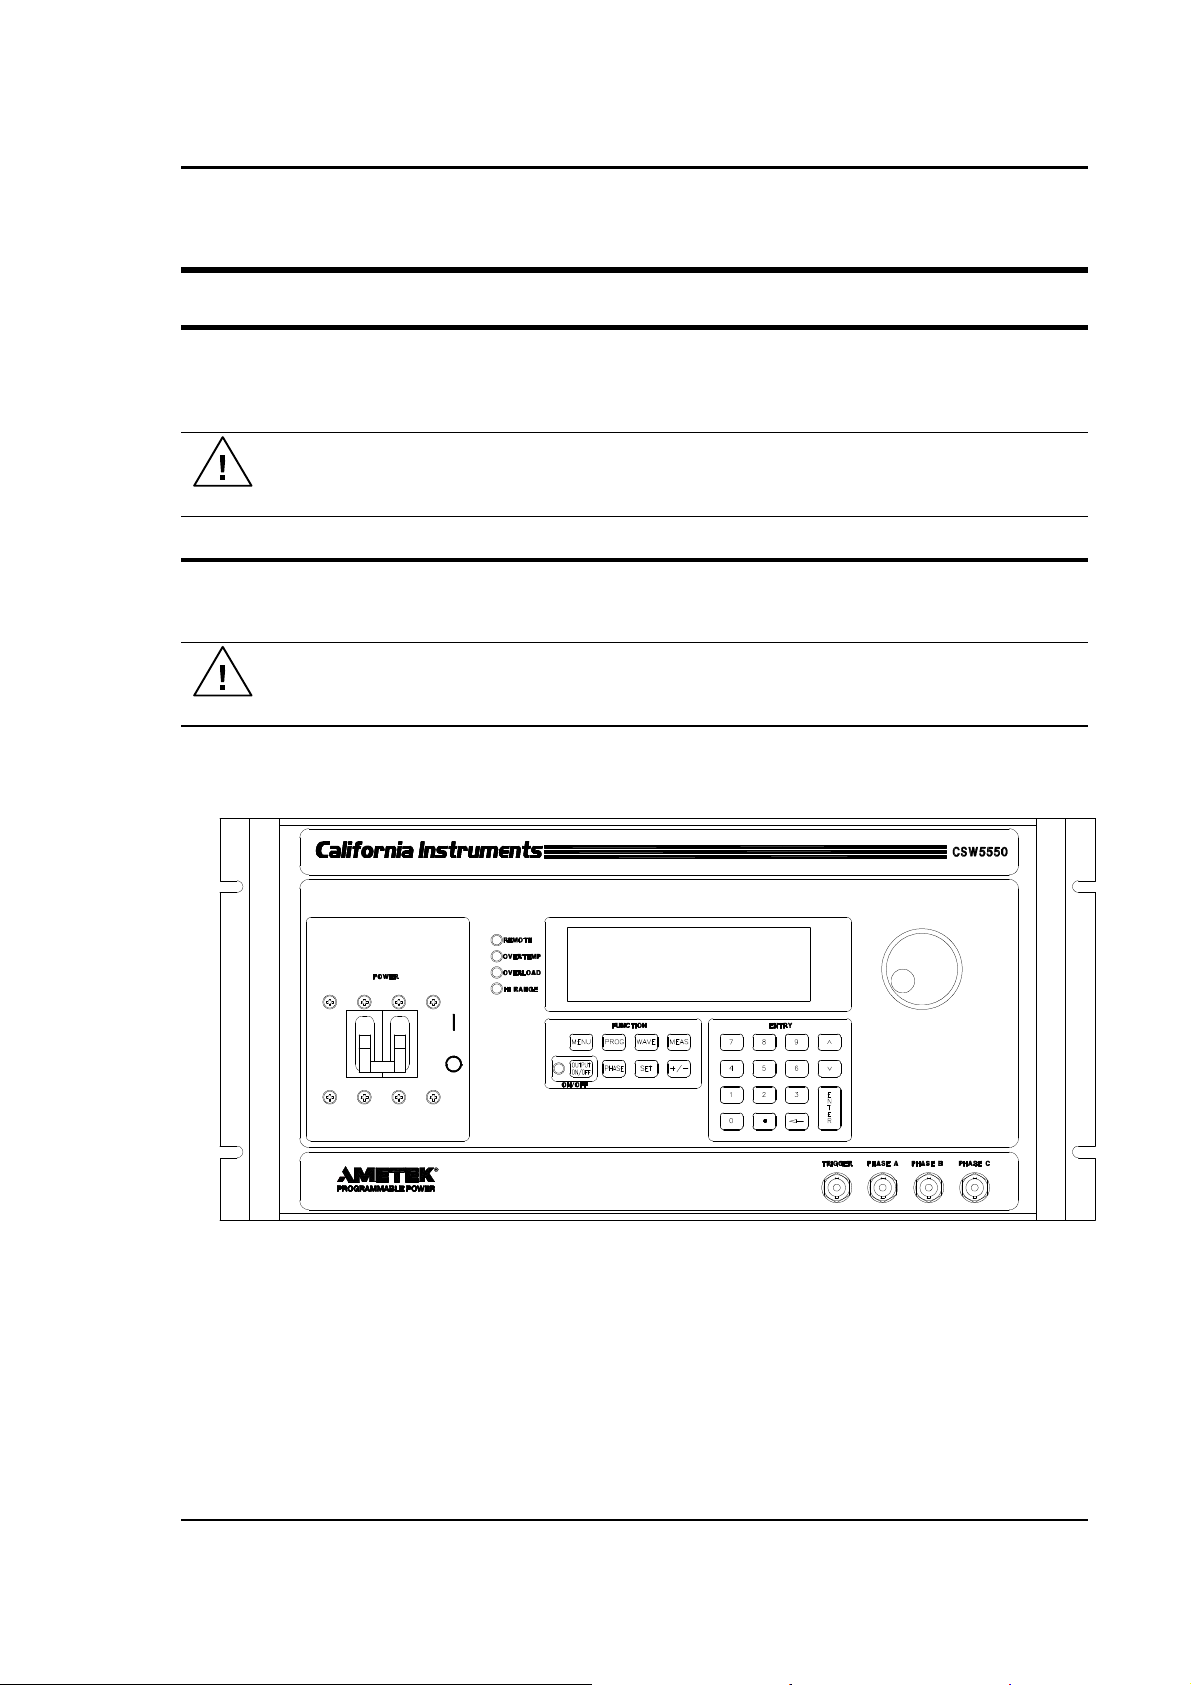
Figure 1-1 California Instruments CSW5550 (With Rack Mount Ears) ................................................................ 12
Figure 2-1: CSW5550 – Typical Current De-Rating Chart for 156v AC Range ................................................... 18
Figure 2-2: CSW5550 – Typical Current De-Rating Chart for 312v AC Range ................................................... 19
Figure 3-1:CSW5550 ........................................................................................................................................... 31
Figure 3-2:USB Connector pin orientation ........................................................................................................... 37
Figure 3-3: Rear Panel View for the CSW5550) .................................................................................................. 39
Figure 3-4: Output Power Connections for 1 Source and Multi-source Systems ................................................. 42
Figure 3-5: Functional Test Setup ....................................................................................................................... 43
Figure 3-6: Three CSW Sources, 9-phases with Clock/Lock ............................................................................... 44
Figure 3-7: Shuttle Knob ...................................................................................................................................... 47
Figure 3-8: FUNCTION keypad .......................................................................................................................... 48
Figure 3-9: Entering value from decimal keypad ................................................................................................ 49
Figure 3-10: Cursor UP key movement .............................................................................................................. 50
Figure 3-11: Cursor DOWN key movement ........................................................................................................ 50
Figure 3-12: Main Menu 1 screen ....................................................................................................................... 51
Figure 3-13: Menu 1 through 3 ........................................................................................................................... 52
Figure 3-14: PROGRAM Menu ........................................................................................................................... 56
Figure 3-15: MEASUREMENTS Screen, single phase and three phase modes ................................................ 58
Figure 3-16: HARMONICS/TRACE ANALYSIS screen ...................................................................................... 60
Figure 3-17: TRANSIENTS menu ....................................................................................................................... 63
Figure 3-18: VOLTAGE SURGE/SAG SETUP screen ....................................................................................... 64
Figure 3-19: VOLTAGE SWEEP/STEP SETUP screen ..................................................................................... 66
Figure 3-20: FREQUENCY SWEEP/STEP SETUP screen ................................................................................ 68
Figure 3-21: VOLTAGE/FREQUENCY SWEEP/STEP SETUP screen .............................................................. 69
Figure 3-22: START/VIEW TRANSIENT SEQUENCE screen ............................................................................ 70
Figure 3-23: WAVEFORMS menu ...................................................................................................................... 71
Figure 3-24: APPLICATIONS menu ................................................................................................................... 73
Figure 3-25: SETUP REGISTERS menu ............................................................................................................ 74
Figure 3-26: UTILITY menus .............................................................................................................................. 75
Figure 3-27: GPIB/RS232 SETUP menu ............................................................................................................ 78
Figure 3-28: VOLTAGE/CURRENT CONTROL SETUP menu........................................................................... 79
Figure 3-29: INITIAL SETUP menus ................................................................................................................... 80
Figure 3-30:LIMIT SETUP menu ......................................................................................................................... 81
Figure 3-31: CONFIGURATION SETUP Menus .................................................................................................. 82
Figure 3-32: MEASUREMENT CAL FACTORS menu ........................................................................................ 84
Figure 3-33: OUTPUT CAL FACTORS menu...................................................................................................... 84
Figure 3-34: Selecting a waveform ...................................................................................................................... 88
Figure 3-35: Selecting waveforms for single phase or all phases ....................................................................... 88
Figure 3-36: Custom waveform creation with GUI program ................................................................................. 89
Figure 3-37: Waveform crest factor affects max. rms voltage.............................................................................. 90
Figure 3-38: Waveform frequency domain view mode ....................................................................................... 91
Figure 3-39: Scrolling through tabular FFT data ................................................................................................. 95
Figure 3-40: Scrolling through bar chart FFT data .............................................................................................. 95
Figure 3-41: Scrolling through acquired waveform data ..................................................................................... 97
Figure 3-42: SET VOLT trigger source acquisition ............................................................................................. 99
Figure 3-43: Positive trigger delay (Post trigger data) ...................................................................................... 100
Figure 3-44: Negative trigger delay (Pre-trigger data) ...................................................................................... 101
Figure 3-45: Pulse Transients........................................................................................................................... 102
Figure 3-46: List Transients .............................................................................................................................. 103
Figure 3-47: Switching waveforms in a transient list ......................................................................................... 105
Figure 3-48: START/VIEW TRANSIENT SEQUENCE menu ........................................................................... 106
Figure 4-1: Power Source Module Block Diagram ............................................................................................. 109
Figure 4-2: Internal Assembly Locations ........................................................................................................... 111
Figure 5-1: Test Equipment Hook-up for Calibration ......................................................................................... 119
Figure 5-2: Front Panel Assembly Adjustment Location (Top View) .................................................................. 120
Figure 8-1: Application Menu ............................................................................................................................. 128
Figure 8-2: DO160 Main Menu .......................................................................................................................... 128
Figure 8-3: Normal state .................................................................................................................................... 129
Figure 8-4: Voltage Modulation......................................................................................................................... 131
Figure 8-5: Frequency Modulation ..................................................................................................................... 132
CSW Series 9
Page 10

User Manual California Instruments
Figure 8-6: Power Interrupt ............................................................................................................................... 133
Figure 8-7: Power Interrupt for Group 2 and 3 .................................................................................................. 134
Figure 8-8: Emergency Screen ......................................................................................................................... 135
Figure 8-9: Abnormal Screen ............................................................................................................................ 137
Figure 8-10: DO-160 DC Main Menu ................................................................................................................ 139
Figure 8-11: Normal State ................................................................................................................................. 139
Figure 8-12: Abnormal State ............................................................................................................................. 141
Figure 8-13: Application menu .......................................................................................................................... 145
Figure 8-14: IEC1000-4-11 Menu ...................................................................................................................... 145
Figure 8-15: IEC Dips and Interrupts ................................................................................................................. 146
Figure 8-16: Voltage Variation screen ............................................................................................................... 148
Figure 8-17: EN 61000-4-11 Voltage Variation specification- Edition 1.0 .......................................................... 149
Figure 8-18: EN 61000-4-11 Voltage Variation specification- Edition 2.0 .......................................................... 149
Figure 8-19: IEC 61000-4-11 GUI screen. ........................................................................................................ 150
Figure 8-20: Application menu .......................................................................................................................... 152
Figure 8-21: IEC 61000-4-13 Menu................................................................................................................... 152
Figure 8-22: IEC 61000-4-13 FCurve ................................................................................................................ 154
Figure 8-23: IEC 61000-4-13 OSwing ............................................................................................................... 154
Figure 8-24: IEC 61000-4-13 Sweep ................................................................................................................. 155
Figure 8-25: IEC 61000-4-13 Harmonics .......................................................................................................... 156
Figure 8-26: IEC 61000-4-13 Inter harmonics ................................................................................................... 157
Figure 8-27: IEC 61000-4-13 Meister Curve ..................................................................................................... 158
Figure 8-28: IEC 61000-4-13 Test Flowchart Class 1 and 2 ............................................................................. 159
Figure 8-29: IEC 61000-4-13 Test Flowchart Class 3 ....................................................................................... 160
Figure 8-30: MENU 2 SCREEN ........................................................................................................................ 162
Figure 8-31: INTERHARMONICS SCREEN ..................................................................................................... 162
Figure 8-43: Application Screen ........................................................................................................................ 164
Figure 8-44 Watt-Hour Meter Screen ................................................................................................................ 164
Figure 8-45: WH-Meter Screen With Function Active ........................................................................................ 164
10 CSW Series
Page 11

User Manual California Instruments
List of Tables
Table 3-1: Wire Sizes ......................................................................................................................................... 34
Table 3-2: System Interface Connector (J32) ..................................................................................................... 35
Table 3-3: RS232 Connector pin out ................................................................................................................... 37
Table 3-4: USB Connector pin out. ...................................................................................................................... 37
Table 3-5: RJ45 LAN Connector pin out. ............................................................................................................. 38
Table 5-1: Load Values for Output Current Calibration ...................................................................................... 115
Table 5-2: External Signal Input Connector Pins ............................................................................................... 117
Table 5-3: AC/DC Zero Adjustment ................................................................................................................... 121
Table 6-1: Basic Symptoms ............................................................................................................................... 122
Table 7-1: Replaceable Parts ........................................................................................................................... 125
Table 8-1: Normal Voltage and Frequency minimum ........................................................................................ 129
Table 8-2: Normal Voltage and Frequency Maximum ........................................................................................ 129
Table 8-3: Normal Voltage Unbalance ............................................................................................................... 130
Table 8-4: Normal VoltageSurge Sequence ...................................................................................................... 134
Table 8-5: Normal Frequency Transient Sequence ........................................................................................... 135
Table 8-6: Normal Frequency Variation Sequence ............................................................................................ 135
Table 8-7: Emergency Voltage and Frequency Minimum .................................................................................. 136
Table 8-8: Emergency Voltage and Frequency Maximum ................................................................................. 136
Table 8-9: Emergency Voltage Unbalance ........................................................................................................ 136
Table 8-10: Abnormal Voltage Minimum ........................................................................................................... 137
Table 8-11: Abnormal Voltage Maximum .......................................................................................................... 137
Table 8-12: Abnormal Frequency Transient ...................................................................................................... 138
Table 8-13: Normal Voltage Minimum ............................................................................................................... 139
Table 8-14: Normal Voltage Maximum .............................................................................................................. 140
Table 8-15: Voltage Surge ................................................................................................................................. 140
Table 8-16: Abnormal Voltage Surge ................................................................................................................ 142
Table 8-17: Phase mapping............................................................................................................................... 144
Table 8-18: IEC 61000-3-34 Table C.2 .............................................................................................................. 144
Table 8-19: Dips and Interruptions Tests Performed During RUN ALL ............................................................ 147
Table 8-20: Voltage Variations Test Performed During RUN ALL .................................................................... 148
Table 9-1: Error Messages. ............................................................................................................................... 171
CSW Series 11
Page 12
User Manual California Instruments
1. Introduction
This instruction manual contains information on the installation, operation, calibration and
maintenance of all power systems that use the CSW5550.
This user manual also covers higher power configurations consisting of multiple units of the
CSW5550 operated in parallel. Such models are the CSW11100, CSW16650, CSW22200,
CSW27750, CSW33300, CSW38850 and CSW44400.
Figure 1-1 California Instruments CSW5550 (With Rack Mount Ears)
1.1 General Description
The CSW5550 is a high efficiency, lightweight AC power source that provides a precise output
with low distortion. The CSW Series offers a 0-156/0-312 AC or DC voltage range. Full power
is available from 115/230V to full-scale voltage using a constant power mode of operation.
Two to eight CSW5550 units can be connected in parallel as a single-phase or 3-phase power
system for an output of up to 44.4 KVA. They can be operated with AC or DC output.
The CSW5550 Series also offers AC+DC output mode.
Remote Interfaces
The CSW5550 has the standard GPIB, RS232 and USB remote interfaces. The LAN (Ethernet)
interface is offered as an option. With the LAN interface the RS232 interface will not be
functional.
12 CSW Series
Page 13
User Manual California Instruments
-
RTCA/DO160
1 0 0 0
-
Mil Std 704
0 2 0 0
-
ABD 0 0 4 0
-
AMD 0 0 0 8
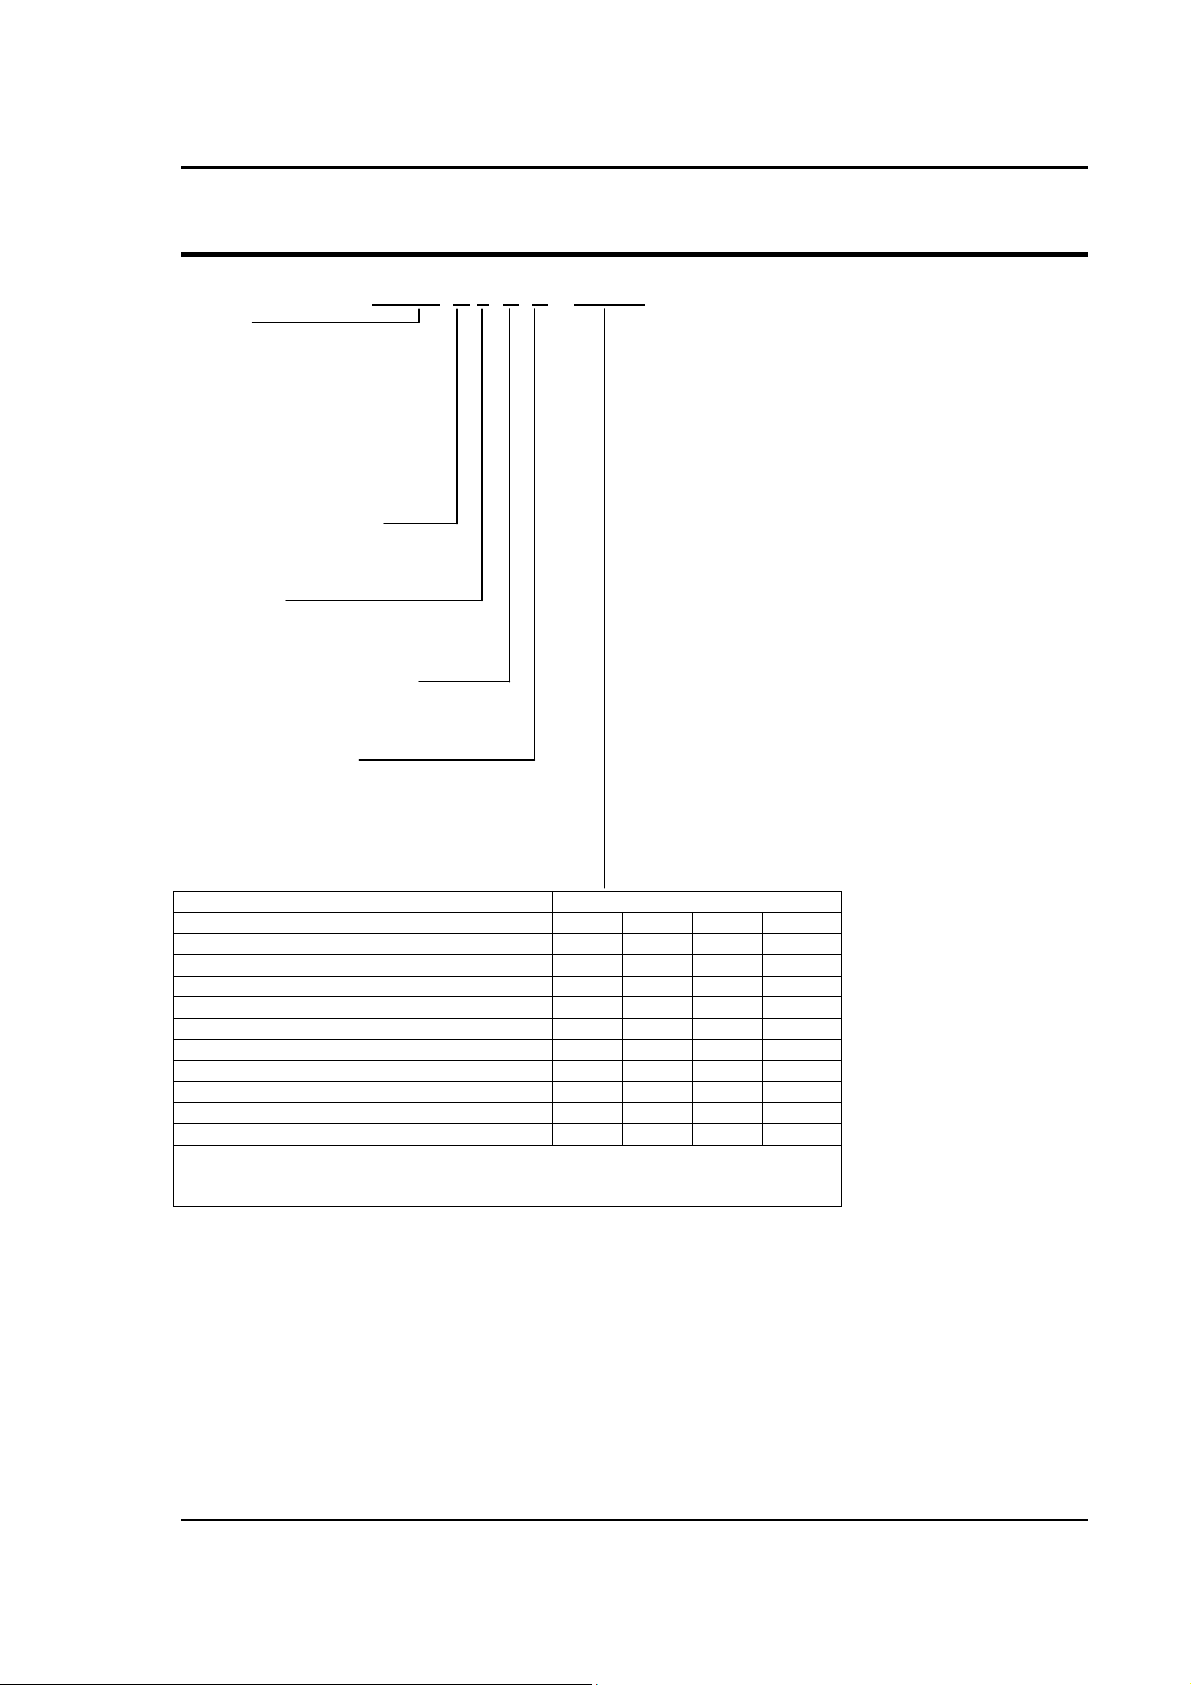
1.2 CSW Models
CSW5 C 0 C X 0 0 0 0
Model
CSW5550= CSW5
CSW11100 = CSW11
CSW16650 = CSW16
CSW22200 = CSW22
CSW27750 = CSW27
CSW33300 = CSW33
CSW38850 = CSW38
CSW44400 = CSW44
Initial Configuration
1-Phase = A
3-Phase = C
I/F Option
Std GPIB/USB/RS232 = 0
LAN/GPIB/USB = 2
AC Line Input Options
PFC USA = C
PFC International = G
Hardware Options
No Option = X
LKM = J
LKS = K
LF = H
LF & LKM = A
Firmware Options CODE
None 0 0 0 0
-IEC61000-4-11 0 4 0 0
-704F 0 1 0 0
-A350 0 0 8 0
-ABL 0 0 2 0
-B787 0 0 0 4
-WHM 0 0 0 1
For multiple options use the HEX sum. For example A350 and ABD would be
00D0
Sum of 0 –9 = HEX 0 –9. Sum of 10 – 15 = HEX A - F
CSW Series 13
Page 14
User Manual California Instruments
Function
Specification
L-L
Surge
in Tables below
REQ’D INPUT
CONNECT 1
-
MAXIMUM
RECOMMENDED
2. Specifications
All specifications are for a single CSW5550 unit and 25 ± 5°C sine wave output with a resistive
load unless noted otherwise.
2.1 Electrical
2.1.1 Input
Input Power
Standard: 208 to 240V
option: 380 to 415V
Input Power Factor 0.99
Input Frequency Range 47 to 440 Hz
Efficiency 70% minimum at full-load
Ride-through or hold-up 10 mSec, minimum
Input Current See Table below
Input Turn-on Current
Limited to less than peak value of RMS listed
MAXIMUM LINE
CURRENT
MAXIMUM
NEUTRAL
CURRENT
USA 27A RMS Not Required 40A RMS
INTL 14A RMS 14A RMS 20A RMS
Input Currents for 3-Phase Input Power
TERMINAL JUMPER
CONNECTIONS
USA ØA to ØB ØA, ØC
INTL
ØA to ØB,
ØB to ØC
PHASE INPUT
POWER TO
ØA, Neutral
VOLTAGE
187-264
VRMS, L-L
187-264
VRMS, L-N
* Only Phase A and Phase B are present at the output.
Single-Phase Input Configurations
±10%, 3φ, 3 wire or
L-L
±10%, 3φ, 4 wire
RECOMMENDED
CIRCUIT BREAKER
RATING (MAX.)
INPUT
CURRENT
CIRCUIT BREAKER
RATING (MAX.)
30A RMS 40A RMS
45A RMS 40A RMS
14 CSW Series
Page 15
User Manual California Instruments
Function
Specification
add ±0.015%/kHz
External Direct Input
DFI output
Transient response (DC
2.1.2 Output
(ALL SPECIFICATIONS ARE FOR AC AND DC UNLESS NOTED OTHERWISE)
Calibration Interval 1 year
Power Factor of Load 0 lagging to 0 leading
AC or DC Output
Voltage
Output Current Per
Phase
Crest Factor 3.25 (peak output current to RMS output current).
Output Frequency DC, or 40 Hz to 5 kHz
Frequency Resolution
( Without CLock/Lock
option enabled)
Frequency Accuracy: ±0.01% at 25ºC ±0.001%/ºC
Output Power 1850 VA, maximum, per phase
AC Noise Level >60 dB RMS below full output (sine wave, 40 to 500 Hz).
Voltage Program and
Measurement
Accuracy
Voltage Program
resolution
Voltage Stability
Voltage Distortion 0.25% maximum, 40 to 100 Hz; 0.5% maximum to 500 Hz; and 1% maximum
Peak to Peak Noise,
DC output (20Mhz)
rms noise, DC output
(300 Khz)
Load Regulation ±0.025% of full scale voltage for a full resistive load to no load; above 1 kHz,
0 to 156 VRMS L-N range ; 0 to 312 VRMS L-N range
16A to 115V in 156V range; 8.0A to 230V in 312V range (1850 VA maximum).
Multiply current by the number of sources in a multiple power source system
40.00 - 81.91 Hz (0.01 Hz resolution)
82.00 – 819.1 Hz (0.1 Hz resolution)
820 – 5000 Hz (1 Hz resolution)
±0.1% of range. Above 1 kHz, add 0.2%/kHz. Add ±0.1% of full scale for "AC
PLUS DC" mode. Valid for 5 to 156 VRMS and 10 to 312 VRMS at 25°C
(77°F), sense leads connected. Temperature coefficient less than 50 ppm/°C
0.1 V from Front Panel
0.01 V from remote programming
±0.1% of full scale over 24 hours at constant line, load and temperature.
(Measured at Remote Sense point)
to 1 kHz plus 1%/kHz to 5 kHz (Full linear load or No load)
Low range: 1.59 Vp-p, typ, @ Iout= 11.7 A, Vout = 156 V
High range: 1.39 Vp-p, typ, @ Iout= 5.9 A, Vout = 312 V
Low range: 164 mV, typ, @ Iout = 11.7 A, Vout = 156 V
High range: 166 mV, typ, @ Iout = 5.9 A, Vout = 312 V
Line Regulation ±0.025% of full scale for a ±10% input line change.
Phase Accuracy
±1º, 40 to 1 kHz plus ±1º/kHz above 1 kHz
Resistive Load
Phase Program
±0.1º
Resolution
External Amplitude
0 to 5 VRMS provides 0 to 20%(±2% of full scale output)
Mod
0 to 5 VRMS (DC to 5 kHz) for 0 to full-scale output (±2% of full scale output to
3 kHz. ±2% from 3 kHz to 5 kHz). Limited to ±7.25 Vpeak
Contact closure to indicate: Loss of AC line and indication of various Status
that can be remotely programmed.
Typically recovers in 30 ms to 1% of steady state output voltage (within 1% of
output)
Vset) for 10 to 90 % load change. Step load 10 to 90 % in 200 uS
CSW Series 15
Page 16
User Manual California Instruments
Function
Specification
External Gain Control, RPV
0 to +7.07 VDC for 0 to programmed output. 0 to full-scale output for CSW.
(±2% of full scale output
External Input Impedance 40K for each of the three inputs.
XLOAD The CSW5550 is guaranteed to be stable for power factors from 0 leading to 0
lagging. The most difficult load for most amplifiers is driving large capacitive
loads (10-10,000µF).Though stable with its normal loop compensation, the
CSW can provide additional phase/gain margin with these unusual loads by
selecting XLOAD On. This significantly improves the transient response of the
amplifier.
X-Load should only be used for reactive loads, and with programmed
frequencies of less than 1000 Hz.
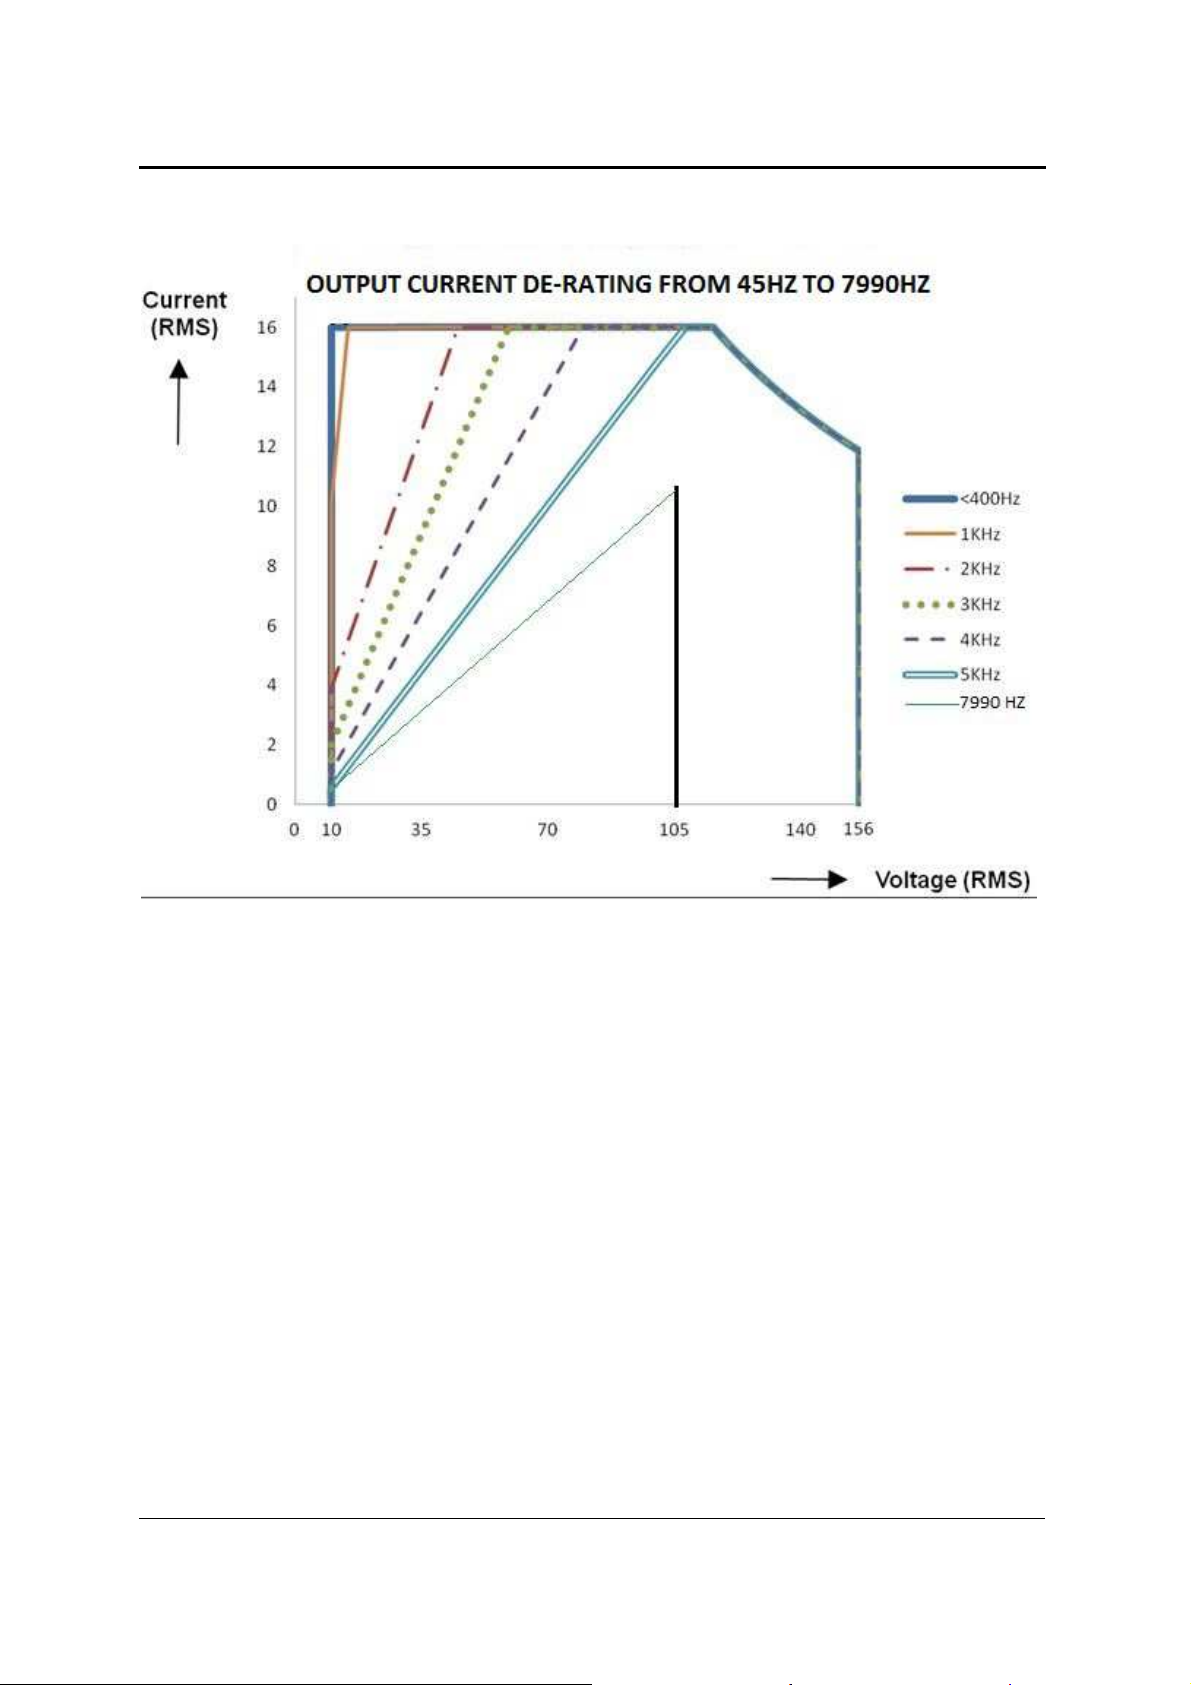
-HF option All of the specifications for the standard CSW5550 apply for frequencies up to
and including 5000 Hz. Note: If the load is disconnected while at maximum
current, voltage below 40V and frequencies above 5,000Hz voltage spikes of
up to 45V could be present. To avoid voltage spikes program the source to
0V then remove the load.
The following specifications apply for frequencies above 5000 Hz:
Voltage Range: Derate the maximum voltage from 156 Vrms at 5 KHz to 106
Vrms at 7990 Hz. For the high voltage range derate the maximum voltage of
312 Vrms at 5 KHz to 202 Vrms at 7990 Hz.
Output Distortion (Full linear Load): The same as the standard CSW5550 to 5
KHz. Above 5KHz add 0.5% additional distortion to the standard specification.
Output Current Per Phase: The same as the standard CSW5550 to 5 KHz.
Above 5 KHz the maximum current with the specified voltage regulation is
reduced to 10.4 amps at 7990 Hz and 106 volts on the low voltage range and
5.1 amps at 7990 Hz and 202 volts on the high voltage range.
Voltage Program and Measurement Accuracy: The same as the standard
CSW5550 to 5KHz and stated spec de-rating to 7990 Hz.
-ELF option The following specifications apply for frequencies below 40 Hz.
Frequency Programming Resolution: 0.01Hz<81.9Hz – standard CSW
specification. 1.0Hz in Clock and Lock mode.
Frequency Accuracy: 0.01% at 25ºC ±0.001%/ºC
Output Distortion (Full linear Load): 1% maximum THD. No de-rating in
voltage.
Line Regulation: ±0.025% for full scale at ±10% input line change.
Output Current Per Phase: 16 amps at 115V in 156V range; 8 amps at 230V
in 312V range. Derate maximum output current from 100% at 40 Hz to 50% at
10 Hz and to 44% at 2 Hz
Load Regulation: 0.40%
-LF option Upper frequency limited to 500 Hz
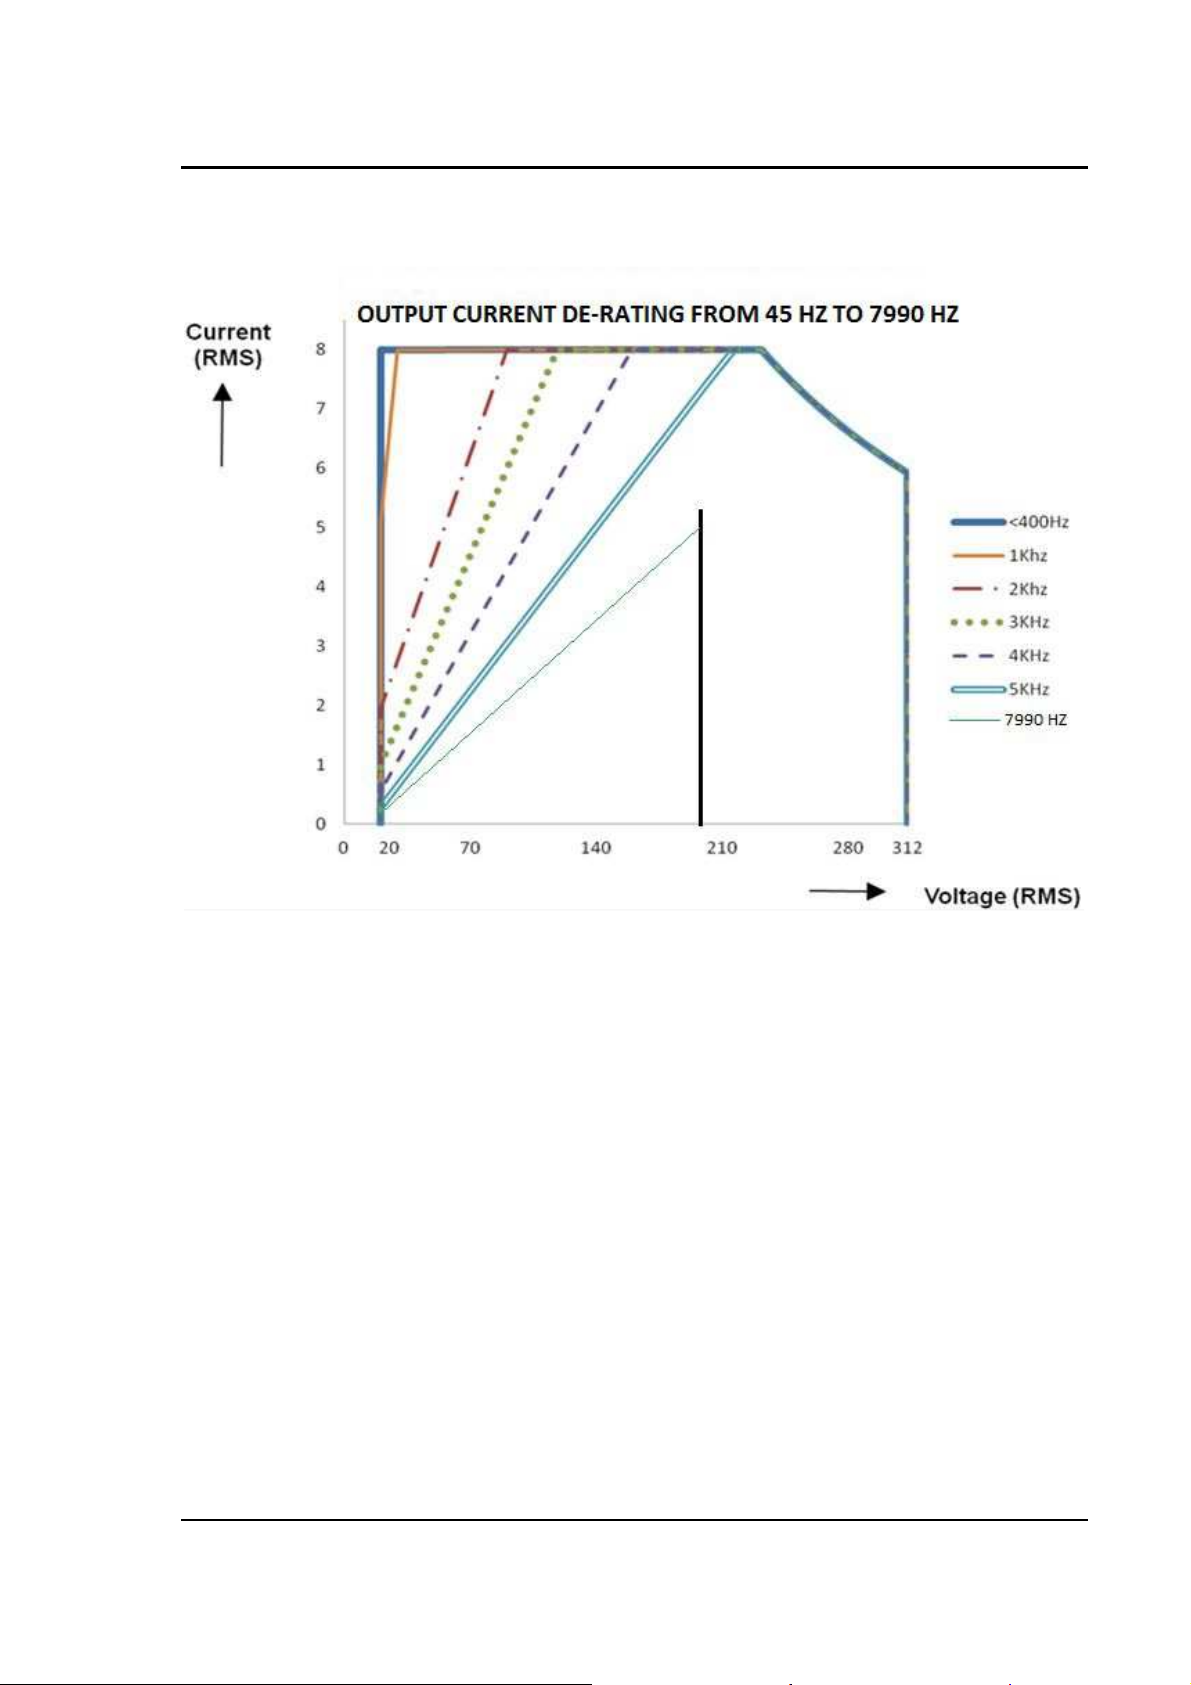
Output current for which specifications apply is de-rated for frequencies above 400Hz as a function of
voltage, and for maximum power of 1850 VA per phase, as shown in Figure 2-1 and Figure 2-2.
16 CSW Series
Page 17

User Manual California Instruments
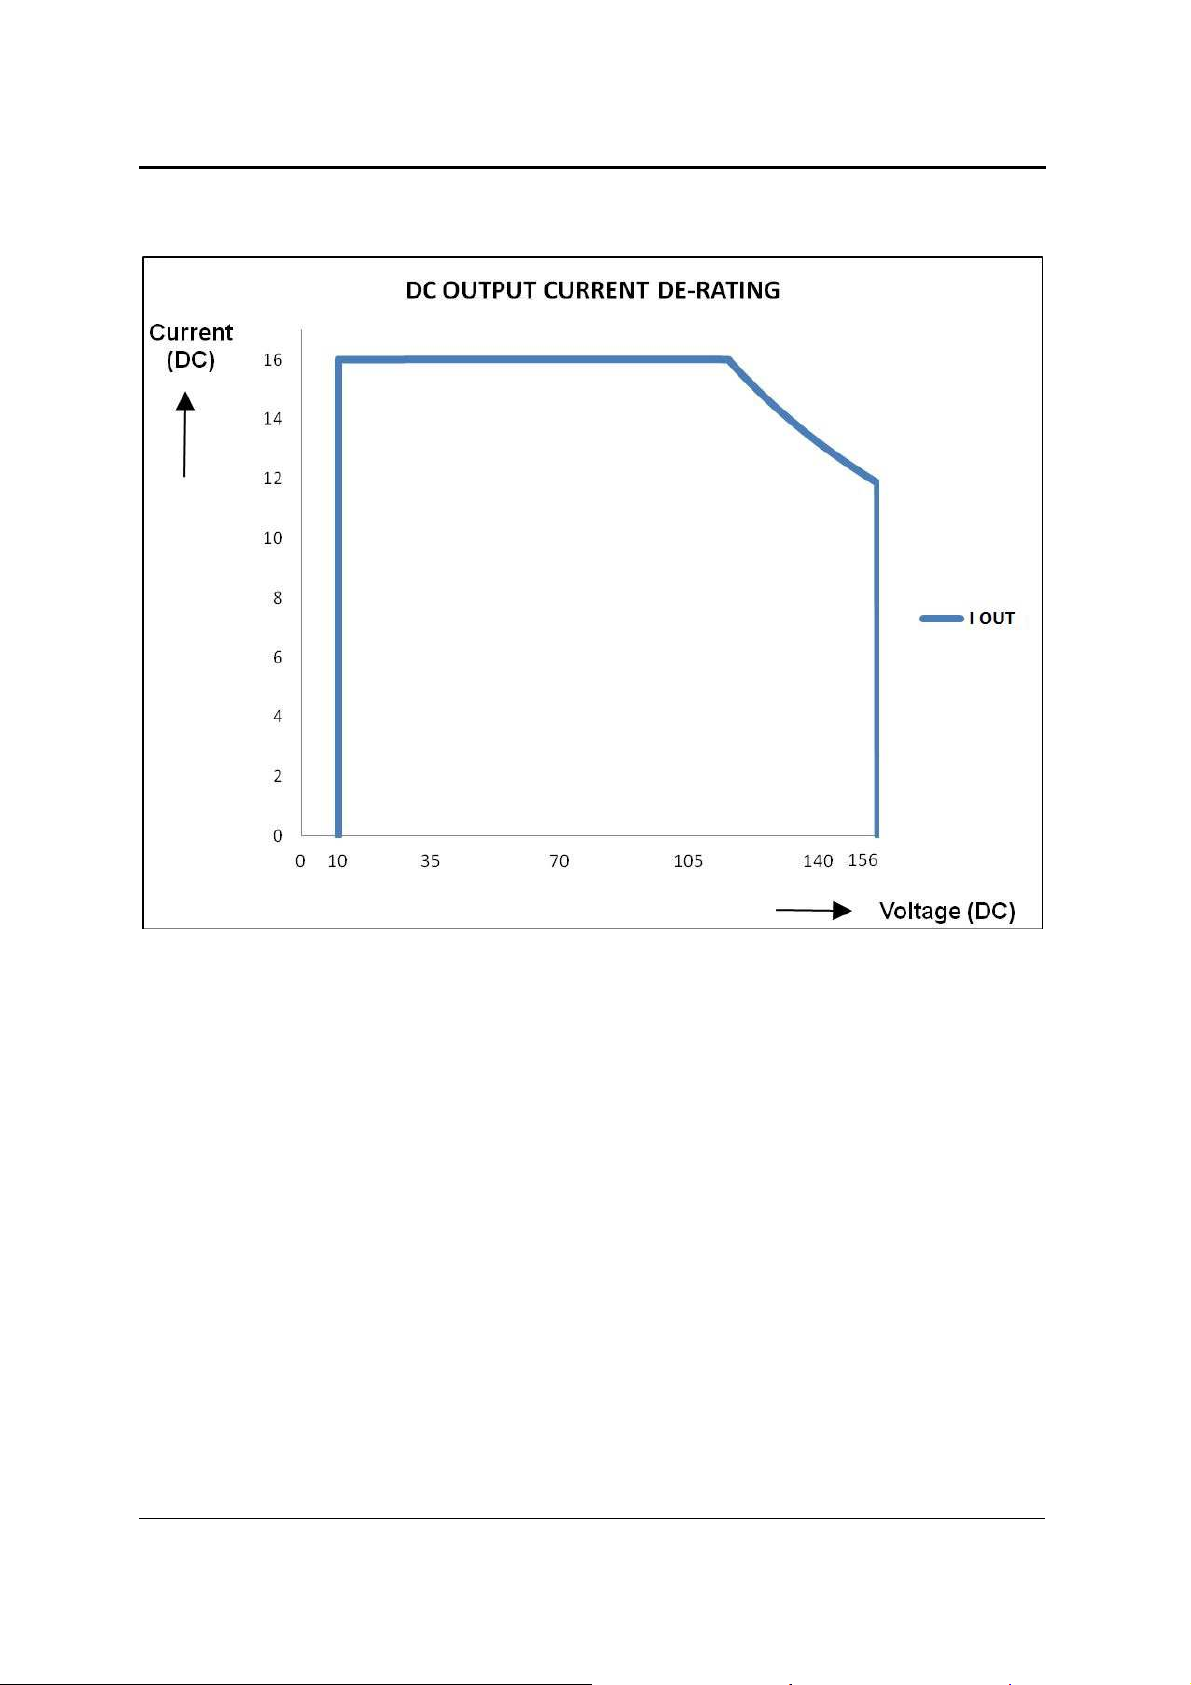
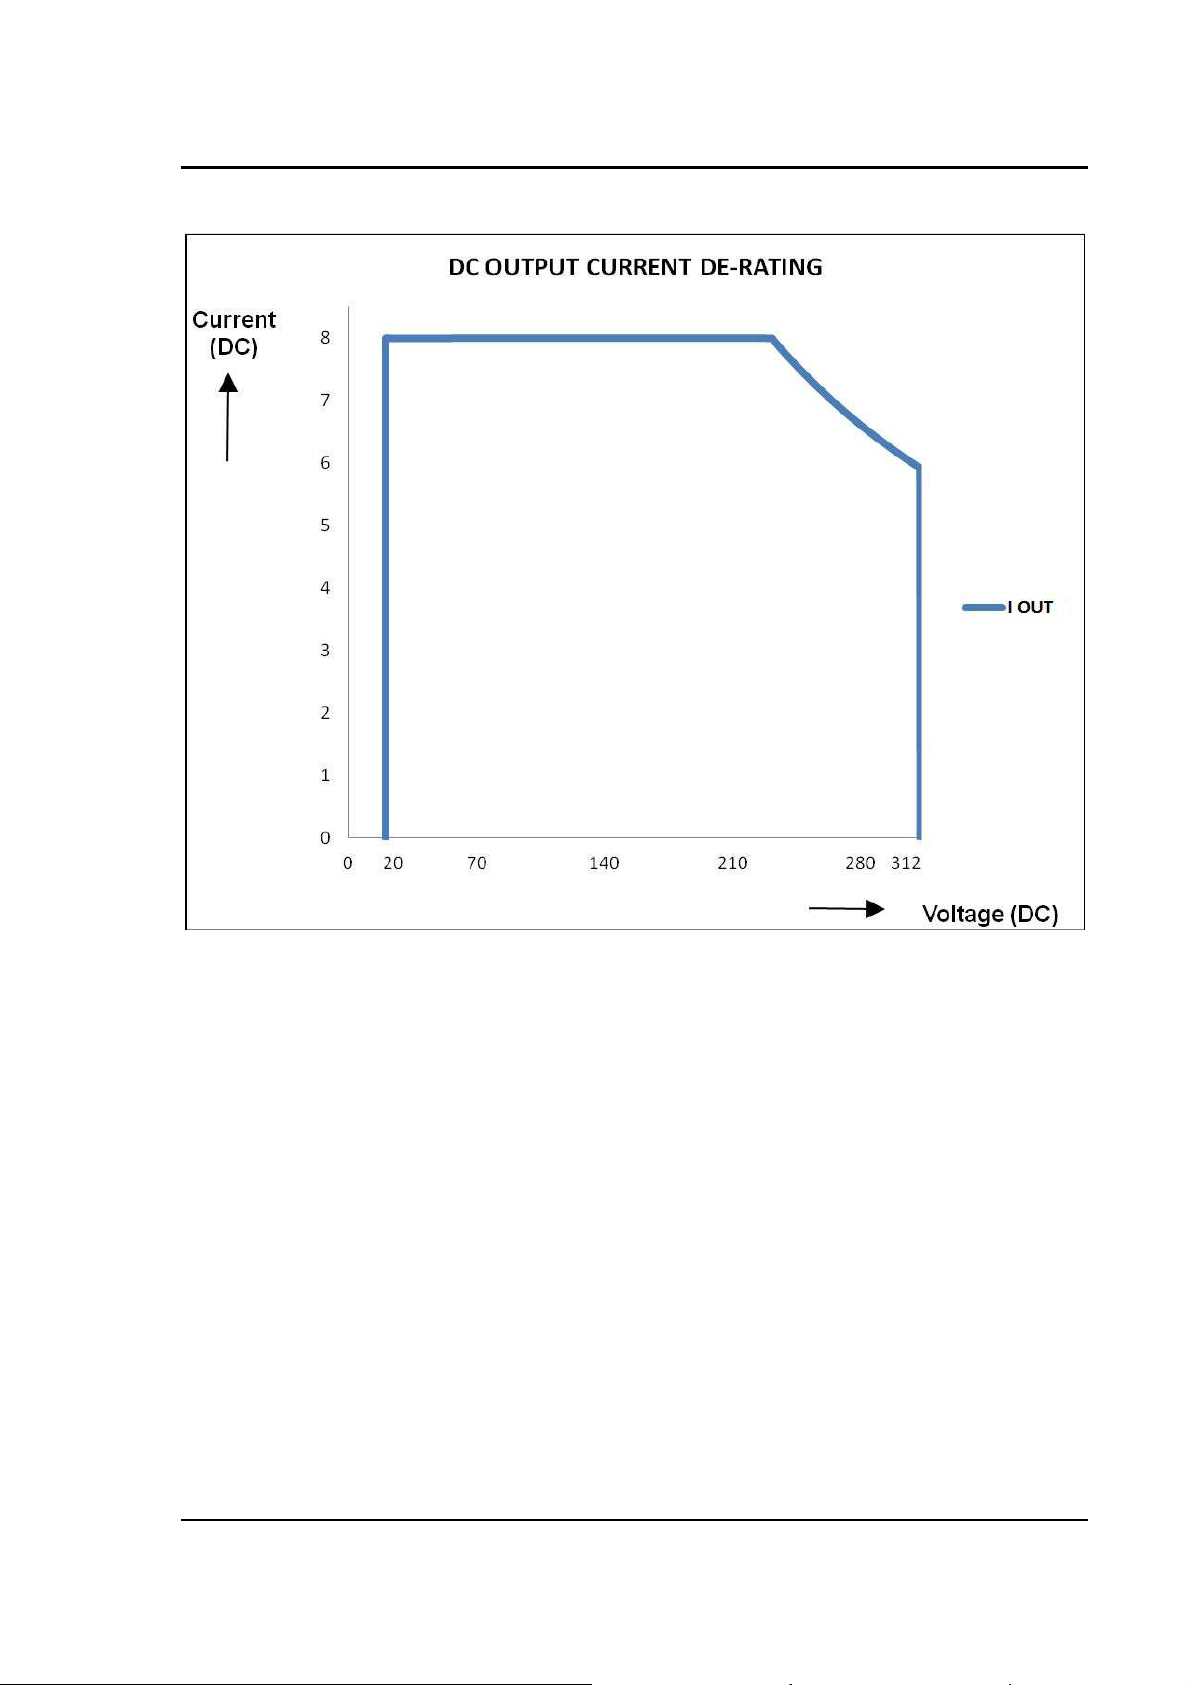
DC output current for which specifications apply is de-rated as a function of voltage and current, and for
maximum power of 1850 Watts, as shown in Figure 2-3 and Figure 2-4.
CSW Series 17
Page 18
User Manual California Instruments
Figure 2-1: CSW5550 – Typical Current De-Rating Chart for 156v AC Range
per Phase
18 CSW Series
Page 19
User Manual California Instruments
Figure 2-2: CSW5550 – Typical Current De-Rating Chart for 312v AC Range
per Phase
CSW Series 19
Page 20
User Manual California Instruments
Figure 2-3: CSW5550 – Typical Current De-Rating Chart for 156V DC Range
per Phase
20 CSW Series
Page 21
User Manual California Instruments
Figure 2-4: CSW5550 – Typical Current De-Rating Chart for 312V DC Range
per Phase
CSW Series 21
Page 22
User Manual California Instruments
Output Parameter
CSW
5550 (multiply current and power by the number of power
sources in multi-source power systems)
Current Limit
Range Programmable 0 to 100% of range for all ranges
Resolution 0.01 Arms
Accuracy ± 1% of Range. Add ±1.5%/kHz above 500 Hz
Frequency Range:
(Without Cloc/ Lock
option enabled)
2.00 Hz – 39.00 Hz (0.01 Hz resolution)
16.00 - 81.91 Hz (0.01 Hz resolution)
81.0 – 819.1 Hz (0.1 Hz resolution)
820 – 5000 Hz (1 Hz resolution)
5001 Hz – 7990 Hz (1 Hz resolution)
Frequency Accuracy:
± 0.01% of programmed value
DC Offset Voltage: Less than 20 mV with linear load in AC Output Mode.
AC Noise Level: >60 dB RMS below full output (sine wave, 40 to 500 Hz)
Output Impedance
(CSW5550 only)
1-phase mode, 312V range- meets requirements of IEC-1000-3-2,
Annex A, Supply Source. Valid for equipment classes A, B, C, and D
Peak Repetitive Current 52 amps for 156 V range 26 amps for 312 V range
Crest Factor: 3.25 (peak output current to RMS output current)
22 CSW Series
Page 23
User Manual California Instruments
Parameter
Resolution
Temperature Coefficient
<±50 ppm for all functions above
↑
2.1.3 Measurements
(All specifications are at 25˚C unless noted otherwise)
Accuracy (±)
Frequency 2 counts
0 to 45˚C
RMS Voltage ±0.1% of range from 5 to 156 or 10
to 312 volts. Above 1kHz add
0.2%/kHz
RMS Current ±1% of range add ±1.5%/kHz above
Peak Current ±5% of range, 40 to 500 Hz; add
VA Power ±2.5% of range, DC or 40 to 500.
Real Power ±2.5% of range, DC or 40 to 500.
Power Factor
(>0.2kVA)
500 Hz
Ranges: 0.5 to 16A: 156V range
0.5 to 8A: 312V range
Multiply by 3 for 1-phase mode
±1%/kHz 500 to 5 kHz
Ranges: 0 to 56A; 156V range
0 to 28A; 312V range
Multiply by 3 for 1-phase mode
Add ±1%/kHz above 500 Hz.
Ranges: 1.8kVA; 3-phase mode
5.6kVA; 1-phase mode
Add ±1%/kHz above 500 Hz.
Ranges: 1.8kW; 3-phase mode
5.6kW; 1-phase mode
±5% of range at full power, 40 to
500 Hz. Add ±1%/kHz above 500 Hz
0.01: 2.00 to 81.91 Hz
0.1: 82.0 to 819.0 Hz
1.0: 820 to 7990 Hz
0.01 Volt
0.001 Amp
0.01 Amp
1 VA
1 W
0.01
Phase ±2˚, 40 to 500 Hz, add ±2˚/kHz
above 500 Hz. (0 to 45
Current and Power Accuracy specifications are percent of Range. The Ranges are listed below .
Measurement bandwidth is limited to 16 Khz.
˚C)
±1˚ for outputs above 20 VRMS
CSW Series 23
Page 24
User Manual California Instruments
2.1.4 Harmonic Measurements (CSW series)
Parameter Range
Frequency fundamental 16.00 - 1000 Hz 2 counts 0.01 Hz to 1 Hz
Frequency harmonics 32.00 Hz - 16 kHz
Voltage Fundamental 0.25V 0.01V
Harmonic 2 - 50 0.25V + 0.1% + 0.1%/kHz 0.01V
Current Fundamental !% of Range 0.01A
Harmonic 2 - 50 1% of Range + 0.1%/kHz 0.01A
Harmonics frequency range in three-phase mode is 32 Hz - 16 kHz. Measurement bandwidth is limited to 16 Khz.
Accuracy ( ± )
2° typ. 0.5°
Resolution
24 CSW Series
Page 25
User Manual California Instruments
Parameter
Specification
2.1.5 System Specification
NV memory storage: 16 complete instrument setups and transient lists, 100 events per list.
Waveforms Sine, square, clipped, user defined
Transients Voltage: drop, step, sag, surge, sweep
Frequency: step, sag, surge, sweep
Voltage and Frequency: step, sweep
IEEE-488 Interface: SH1, AH1, T6, L3, SR1, RL2, DC1, DT1
IEEE 488.2 and SCPI
Response time is 10 ms (typical)
RS232C Interface: Bi-directional serial interface
9 pin D-shell connector
Handshake: CTS, RTS
Data bits: 7, 8
Stop bits: 1,2
Baud rate: 9600, 19200, 38400 (Models without USB I/F)
Baud rate: 9600, 19200, 38400, 57600, 115200, 230400, 460800
IEEE 488.2 and SCPI.
Note: Disconnect any USB connection when using the RS232 interface.
USB Interface: Standard USB 1.1 peripheral.
Data transfer rate: 460,800 bps
Syntax: IEEE 488.2 and SCPI.
Note: Use of the USB port to control more than one power source
from a single PC is not recommended, as communication may not be
reliable. Use GPIB interface for multiple power source control.
LAN Interface: Option –LAN. When the LAN interface is installed, the RS232 interface is
disabled.
RJ45 Connector, 10BaseT, 100BaseT or 1000BaseT,
Data transfer rate: 460,800 bps
Protocol: TCP/IP.
Syntax: IEEE 488.2 and SCP
Note: Disconnect any USB connection when using the LAN interface.
Current Limit
Modes:
Two selectable modes of operation.
Constant current and constant voltage with hold-off time and trip.
CSW Series 25
Page 26
User Manual California Instruments
Parameter
Specification
Parameter
Specification
System Specification (continued)
Front Panel Trigger,
BNC connector
Front Panel Phase
A, B and C, BNC
connectors
External Signal Individual inputs for an external signal for each of the three phases. A 0
External Gain
Control (RPV)
/INHIBIT A logic Lo or contact closure input to inhibit the outputs
MOD An input for an amplitude modulation. 0 to 5 Vrms provides 0 to ≥20%
Trigger Input An input to trigger a function
External Synch A TTL input to frequency synchronize the outputs. The Phase A output
Output available at the front panel BNC connector that provides a
negative going pulse for any programmed voltage or frequency
change. The trigger can be reassigned as an output when running list
transients.
These three outputs are representative of the programmed output
waveform, magnitude and frequency. 0 to 4.86 Vrms represents 0 to a
full-scale output voltage. The output impedance is 100 ohms.
to 5.0 Vrms input provides a 0 to full-scale output voltage of the supplied
waveform. Not available with FC option
Individual inputs for an external DC signal for each of the three phases. A
0 to ±7.07 VDC signal provides a 0 to full-scale output voltage.
modulation for each of the three output phases
can be programmed relative to the external input. Not available with FC
option.
2.1.6 Unit Protection
Input Overcurrent: Circuit breaker with current trip control.
Input Overvoltage: Automatic trip of input circuit breaker.
Input Overvoltage
Transients:
Output Overcurrent: Adjustable level constant current mode with a maximum set point
Output Short Circuit: Peak and rms current limit.
Overtemperature: Automatic shutdown.
Surge protection to withstand EN50082-1 (IEC 801-4, 5) levels.
between 0% and 10% above programmed value.
26 CSW Series
Page 27
User Manual California Instruments
Parameter
Specification
Parameter
Specification
2.2 Mechanical
Dimensions: 19” (483 mm) wide x 8.75” (222 mm) high x 23.5” (597 mm) deep
chassis size which is available in a rack mount or stand-alone
configuration.
Unit Weight: 126.5 lb. (57.2 kg)
Material: Steel chassis and front panel, Aluminum top cover and rear panel.
Finish: Light textured painted external surfaces.
Front and rear panels semi-gloss polyurethane color no. 26440
(medium gray)
Top, bottom and sides semi-gloss polyurethane color no. 26622 (light
gray).
Cooling: Fan cooled with air intake on the sides and exhaust to the rear.
Internal
Construction:
Rear Panel
Connections:
2.3 Environmental
Operating Temp:
Storage Temp:
Altitude: < 2000 m
Relative Humidity:
Modular sub assemblies.
(see section 3 for description of connections)
Input terminal block with cover
Output terminal block with cover
Remote voltage sense terminal block with cover
System interface (not for table top use, use only in rack enclosed
systems)
Clock and Lock (not for table top use, use only in rack enclosed
systems)
RS232, GPIB, USB, LAN (option)
0 to +45 °C (32°F to 113°F)
-40 to +70°C.
85% maximum at 25°C decreasing linearly to 50% at 40°C.
Installation/Over voltage
Category:
Pollution Degree: 2
Indoor Use Only
Vibration: Designed to meet NSTA 1A transportation levels.
Shock: Designed to meet NSTA 1A transportation levels.
CSW Series 27
ΙΙ
Page 28
User Manual California Instruments
Controls:
Displays:
2.4 Regulatory
Electromagnetic
Emissions and Immunity:
Acoustic Noise: 65 dBA maximum at 0% to 50% load, 75 dBA maximum greater
Safety: Designed EN61010-1 European safety standards as required for
2.5 Front Panel Controls
Shuttle knob: Allows continuous change of all values including output calibration
Decimal keypad: A conventional decimal keypad facilitates quick entry of numerical
Up/down arrow keys: A set of up and down arrow keys is used to move the cursor
Function keys: Measure key will display most measurement values. Program key
Designed to meet EN50081-2 and EN50082-2 European
Emissions and Immunity standards as required for the “CE” mark.
than 50% load to 100% load. Measured at one meter.
the “CE” mark.
and range change.
values such as voltage, current limit, etc. The large blue enter
key will make the value you enter effective. Using the SET key
allows the user to preset all parameter values and update them all
at once by pressing the Enter key.
position in all menus. This allows quick selection of the desired
function or parameter.
will show all program parameters. Output on/off key for output
relay control. Phase key will switch display to show program and
measured values for each phase.
LCD graphics display: A large high contrast LCD display with backlight provides easy to
read guidance through all setup operations.
Status indicators: Large and bright status indicators inform the user of important
power source conditions. The Remote lamp informs the user that
the unit is under remote control. The Overload lamp indicates that
excessive current is being drawn at the output. The Over
temperature lamp illuminates when internal heat sink
temperatures are too high. The Hi Range indicator is lit any time
the unit is switched to high output voltage range. The Output
On/Off indicator is on when the power source output relays are
closed.
28 CSW Series
Page 29
User Manual California Instruments
Option
Description
2.6 Special Features, OptionsEP5362706-05 and Accessories
- 704 Mil Std 704D & E test firmware.
Mil Std 704A, B, C, & F test software (refer to Avionics Software Manual P/N
4994-971 for details).
Note: Requires use of CSWGui Windows application software provided on
CD ROM CIC496.
- 787 Boeing 787 Test software (refer to Avionics Software Manual P/N 4994-971
for details).
Note: Requires use of CSWGui Windows application software provided on
CD ROM CIC496.
- 160 RTCA/DO-160D test firmware
RTCA/DO-160E test software (refer to Avionics Software Manual P/N 4994971 for details)..
Note: Requires use of CSWGui Windows application software provided on
CD ROM CIC496.
- 411 IEC 1000-4-11 test firmware
- 413 IEC 1000-4-13 test hardware and firmware
-ABD Airbus ABD0100.1.8 Test software (refer to Avionics Software Manual P/N
4994-971 for details)..
Note: Requires use of CSWGui Windows application software provided on
CD ROM CIC496.
-AMD Airbus AMD24C Test software (refer to Avionics Software Manual P/N 4994-
971 for details)..
Note: Requires use of CSWGui Windows application software provided on
CD ROM CIC496.
-LAN Adds Ethernet interface (RJ45 connector) for local area network connection.
(Available on P/N 7000-485 and 7000-486 models only).
-LF Refer to detailed -LF Function Specification in section 2.1.2
-FC Frequency accuracy is ± 0.25% of program value.
- RMS Rack mounting kit with slides. Removable rack ears/handles standard.
-LK Clock/ Lock Option. With this option enabled the programmed frequency
resolution is 1 Hz for all programmed values of frequency. If the upper
frequency limit is 819 Hz or less the standard program resolution applies.
Not available with FC option.
-HF CSW5550 with HF option have been modified to allow the upper frequency
limit to be extended from 5KHz to 7990 Hz. Refer to detailed -HF Function
Specification in Section 2.1.2
-ELF CSW5550 with ELF option have been modified to allow the lower frequency
limit to be set down to 2 Hz
CSW Series 29
Page 30
User Manual California Instruments
Output Parameter
Voltage:
Frequency:
2.7 Supplemental Specifications
Supplemental specifications are not warranted and generally reflect typical performance
characteristics. These characteristics have been checked on a type test basis only and are not
verified on each unit shipped. They are provided for reference only.
2.7.1 Output
Slew rate: > 6 V/microsecond.
Stability: 0.25 % over 24 hour period at constant line, load and temperature.
Settling time: < 0.5 msec
Temperature
coefficient:
Stability:
± 5 ppm per degree C
± 15 ppm per year
30 CSW Series
Page 31
User Manual California Instruments
3. Unpacking and Installation
3.1 Unpacking
Inspect the unit for any possible shipping damage immediately upon receipt. If damage is
evident, notify the carrier. DO NOT return an instrument to the factory without prior approval.
Do not destroy the packing container until the unit has been inspected for damage in shipment.
WARNING: This power source weighs 126.5 lb (57.2kg). Obtain adequate help when
moving or mounting the unit.
3.2 Power Requirements
The CSW5550 Power Source has been designed to operate from a 3-phase, 3-wire, 187 to 264
V
, AC line or a 3-phase, 4-wire, 342 to 457 V
L-L
CAUTION: Do not connect 400V into the 187-256V unit, the result could be a severely
damaged unit.
,AC line (option -400).
L-L
Figure 3-1:CSW5550
CSW Series 31
Page 32

User Manual California Instruments
3.3 Mechanical Installation
The CSW series power sources are completely self-contained power sources. They may be
used free standing on a bench top or rack mounted using the rack mount/handle kit. The units
are fan cooled, drawing air in from the sides and exhausting at the rear. The sides of each unit
must be kept clear of obstruction and a 6” clearance must be maintained to the rear. Special
consideration of overall air flow characteristics and the resultant internal heat rise must be
allowed for with systems installed inside enclosed cabinets to avoid self heating and over
temperature problems.
Refer to Paragraph 2.2 for information on outline and mounting dimensions of the unit. Refer to
Figure 3-3, Paragraph 3.6 and sub-paragraphs for rear panel connector information.
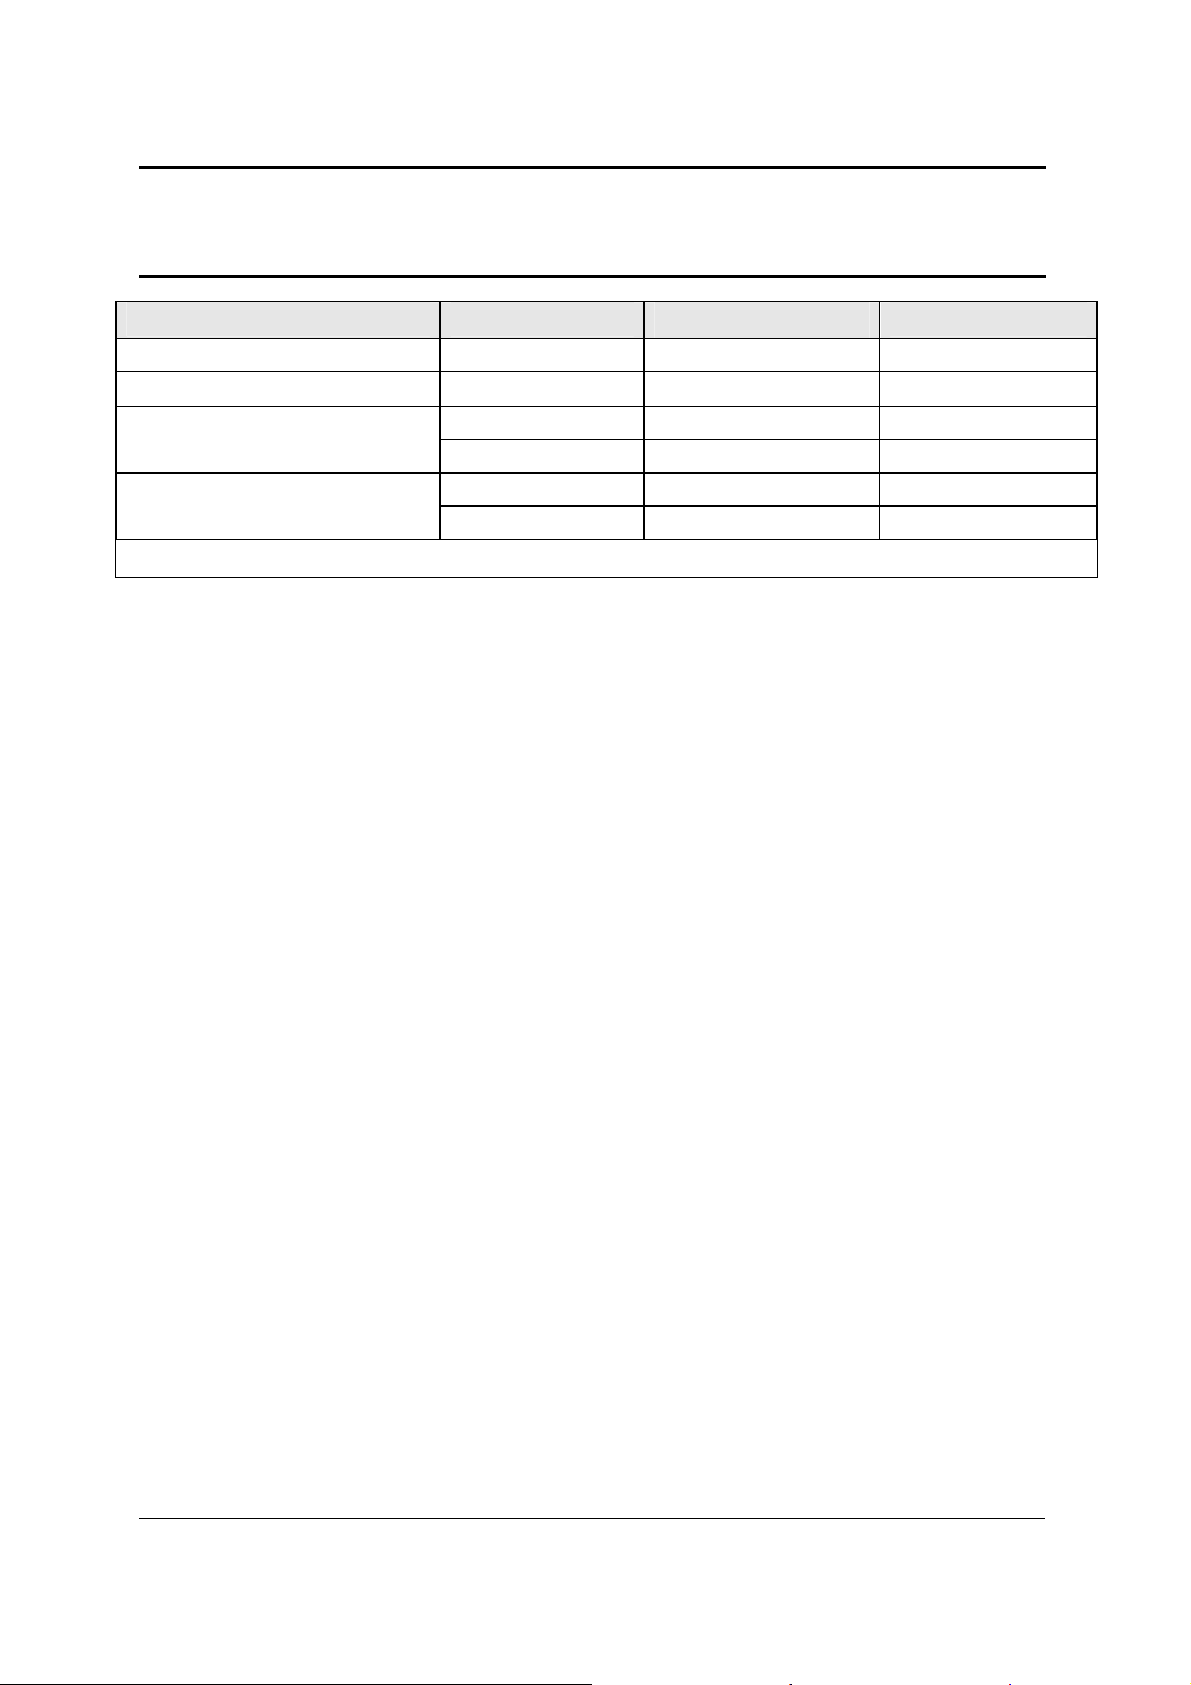
TYPE MANUFACTURER PART NUMBER
Mounting Kit (for slides) Jonathan BK-3
Slides Accuride C-3307-16D
Recommended Mounting Slide
3.4 Input Wiring – TB1
The input terminal block, TB1, is located at the rear of the unit. Ground (earth) wire must be
connected to the chassis of the AC power system. The mains source must have a current rating
equal to or greater than the input circuit breaker and the input wiring must be sized to satisfy the
applicable electrical codes. The input terminal block cover and strain relief must be installed in
table top applications to maintain protection against hazardous voltages.
CAUTION: Capacitors in the power source may hold a hazardous electrical charge
even if the power source has been disconnected from the mains supply. Allow
capacitors to discharge to a safe voltage before touching exposed pins of mains
supply connectors.
3.4.1 187 to 264 VRMS L–L 3-Phase Operation (3-Wire USA)
Connect the input wires to the phase A, B, and C input terminal block terminals
(no Neutral is required). Ensure that the chassis safety ground is also connected. Use cables with
ratings equal to or greater than the current rating listed on the unit or in Paragraph 3.5.1. Any phase
sequence of wiring can be used.
3.4.2 342 to 457 VRMS L–L 3-Phase Operation (4-Wire INTL)
It is essential that the Neutral connection is present when using the unit. Only units that are factory set at
this voltage will operate at this voltage.
Connect the input wires to phases A, B, C and Neutral of the input terminal block. Ensure that the
chassis safety ground is also connected. Use cables with ratings equal to or greater than the current
rating listed on the unit or in paragraph 2.1.1.
32 CSW Series
Page 33

User Manual California Instruments
3.4.3 Single-Phase Input Connections
The CSW system is designed for three-phase input power operation, either 3-wire (USA) or 4-wire
(EUR) plus a chassis safety ground. However, if only single-phase input power is available, the
configurations listed in paragraph 2.1.1 are possible.
3.5 Output Power Connections – TB2
The output terminal block, TB2, is located at the rear of the unit. Refer to Figure 3-3 for an illustration of
the power source rear panel and all terminal strips and connectors. The external sense inputs allow the
power system output voltages to be monitored directly at the load and must be connected either at TB2
or the load. The external sense wires are to be connected to TB3 on the rear panel and should be run as
a twisted pair for short lengths. Sense leads over three (3) feet long should be run as a twisted shielded
pair. Refer to Figure 3-4 for all connections. Included in the power source ship-kit is a safety cover. This
cover is used to cover the AC Line input, TB1, the Power Output terminal block, TB2, and the External
Sense terminal block, TB3. Strain reliefs are included with the safety cover.
Note: The output of the power source is isolated from the input line and floating from
chassis ground. The Output Neutral must not float more than 20 volts or an error
will be reported and the output will shut down.
3.5.1 Wire Gauge Selection
The following guidelines assist in determining the optimum cable specification for
your power applications. These guidelines are equally applicable to both DC and low frequency AC (up
to 450 Hz) power cabling. The same engineering rules apply whether going into or out of an electrical
device. Thus, this guide applies equally to the input cable and output cable for this California Instrument
power source and application loads.
Power cables must be able to safely carry maximum load current without overheating or causing
insulation destruction. It is important to everyday performance to minimize IR (voltage drop) loss within
the cable. These losses have a direct effect on the quality of power delivered to and from instruments
and corresponding loads.
When specifying wire gauge, the operating temperature needs to be considered. Wire gauge current
capability and insulation performance drops with the increased temperature developed within a cable
bundle and with increased environmental temperature. Thus, short cables with generously derated
gauge and insulation properties are recommended for power source applications.
Avoid using published commercial utility wiring codes. These codes are designed for the internal wiring
of homes and buildings and accommodate the safety factors of wiring loss, heat, breakdown insulation,
aging, etc. However, these codes consider that up to 5% voltage drop is acceptable.
Such a loss directly detracts from the quality performance specifications of this power source.
Frequently, these codes do not consider bundles of wire within a cable arrangement.
In high performance applications, as in motor start-up and associated inrush/ transient currents,
additional consideration is required. The cable wire gauge must consider peak voltages and currents,
which may be up to ten times the average values. An underrated wire gauge adds losses, which alter
the inrush characteristics of the application and thus the expected performance. The following table
identifies popular ratings for DC and AC power source cable wire gauges.
CSW Series 33
Page 34

User Manual California Instruments
C
1:
C
2:
C
3:
C
4:
22 AMPS
10 AWG
OLUMN
SIZE
(AWG)
OLUMN
AMPERES
(MAXIMUM)
OLUMN
OHMS/100 FEET
(ONE WAY)
OLUMN
IR DROP/100 FEET
(COL. 2 X COL. 3)
14 15 0.257 3.85
12 20 0.162 3.24
10 30 0.102 3.06
8 40 0.064 2.56
6 55 0.043 2.36
4 70 0.025 1.75
2 95 0.015 1.42
1/0 125 0.010 1.25
3/0 165 0.006 1.04
Recommended Wire Gauge Selection Guide
The output power cables must be large enough to prevent a total voltage drop exceeding 1% of
the rated output voltage between the power source and the load. Table 3-1 shows the AWG size
of the cables that may be used. Cable lengths must not exceed twenty-five (25) feet. For lengths
greater than 25 feet, calculate the voltage drop from the following formula:
2 X DISTANCE X CABLE RESISTANCE PER FT. X CURRENT = VOLT DROP
LOAD CURRENT WIRE GAGE
37 AMPS 8 AWG
74 AMPS 4 AWG
111 AMPS 2 AWG
Table 3-1: Wire Sizes
34 CSW Series
Page 35

User Manual California Instruments
J32 Description
3.6 Connectors - Rear Panel
A number of connectors are located on the rear panel of the power source. The connectors are
identified by J numbers. The terminal strips are identified by TB numbers.
3.6.1 System Interface, Clock and Lock Connectors, J33 and J34
J33 and J34 are the Clock and Lock connectors. These connectors are only available with the
LK option. The LK option is used to synchronize and control the phase shift between the Phase
A output of the Master power source and the Phase A output of additional auxiliary power
sources. The frequency of the auxiliary power sources is determined by the frequency of the
master source. Refer to Figure 3-6 for the Clock and Lock connections to three power sources.
The System Interface connectors, J28A and J28B, are used to connect the Auxiliary power
sources to the Master power source in multiple source systems. The power that is to be the
Master source will have the System Interface cable plugged into its connector labeled “To
Auxiliary”, J28B. The other end of the System Interface cable will plug into J28A, labeled “To
Master”, of the first Auxiliary power source. Additional Auxiliary power sources will be chained
together with additional System Interface cables. Refer to Figure 3-4 for the System
Interconnect. Not available with FC option.
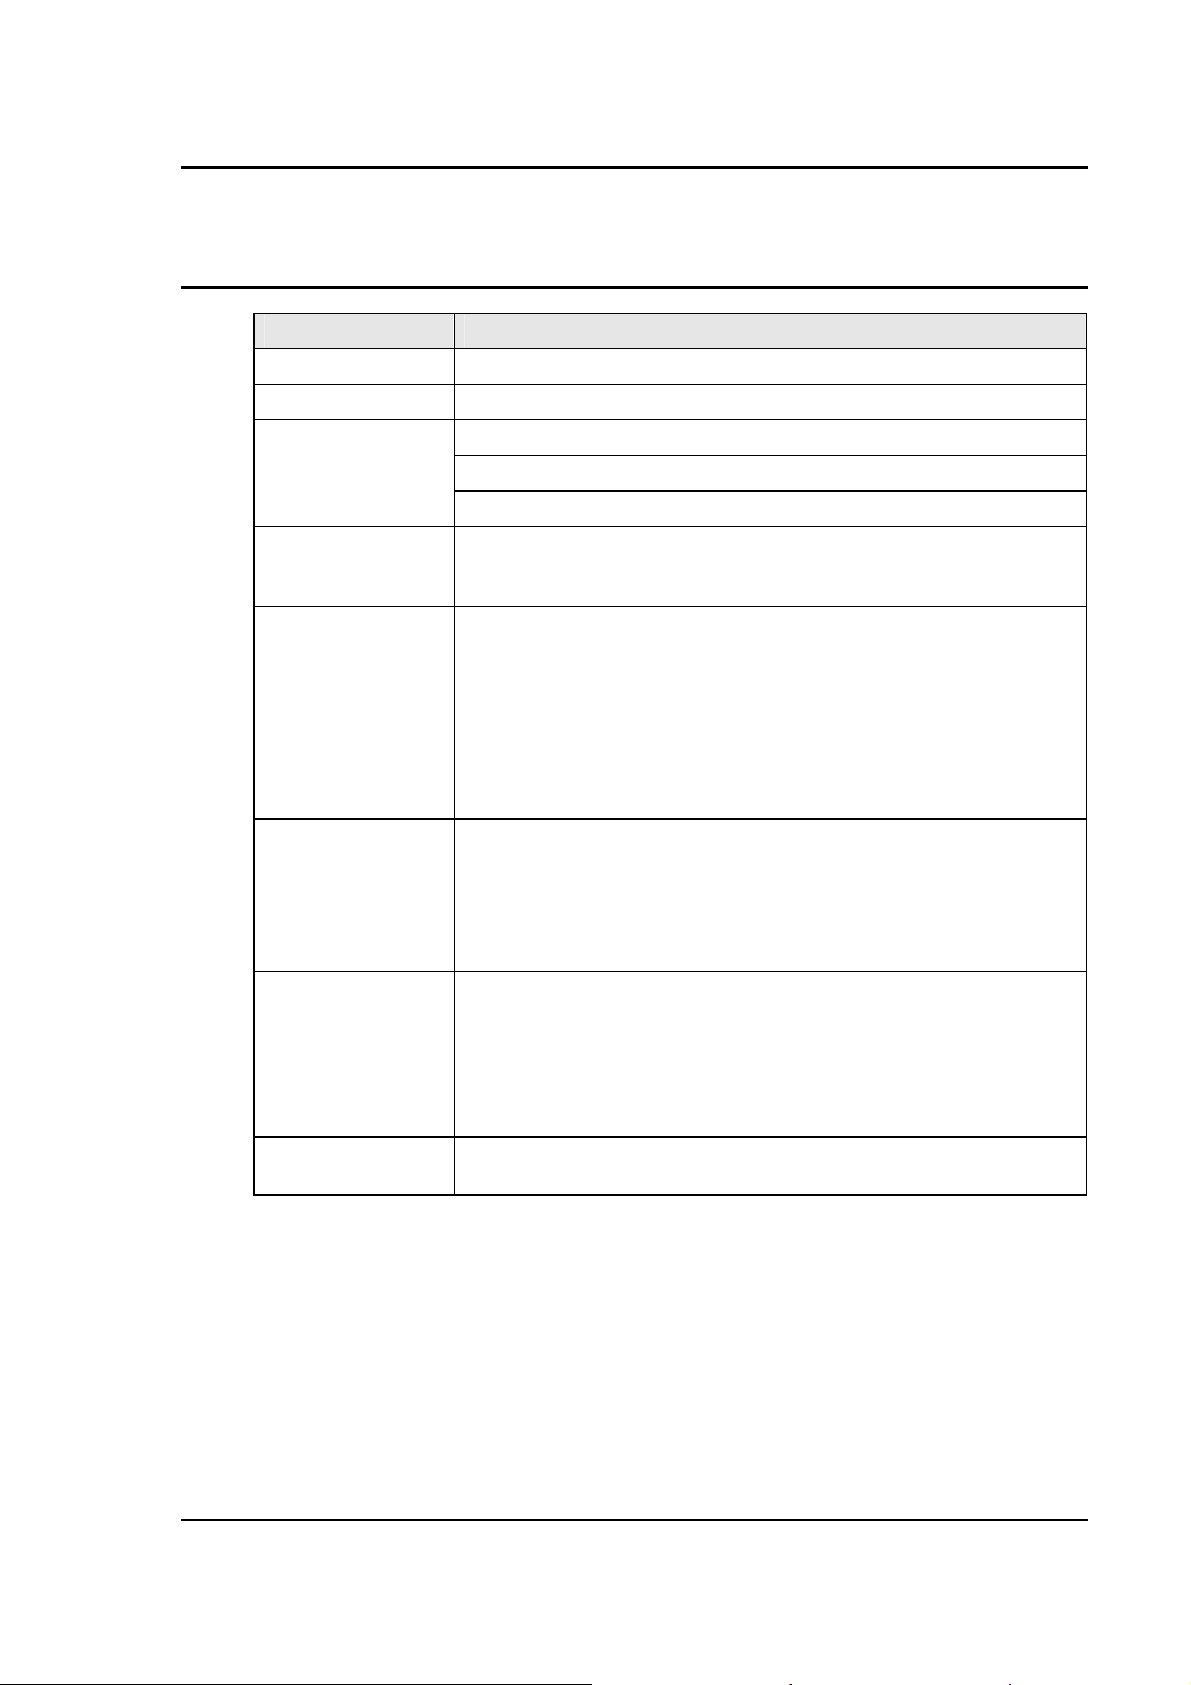
3.6.2 External Input/ Output Signal Connector
The External Input/ Output Connector is J32 on the rear panel. Table 3-2 shows the function for
each pin of this connector.
1 External Signal A: The input for an external signal or RPV for Phase A referenced to pin 10
2 External Signal C: The input for an external signal or RPV for Phase C referenced to pin 10
3 MOD A: The input for an amplitude modulation for Phase A referenced to pin 12
4 MOD C: The input for an amplitude modulation for Phase C referenced to pin 12
5 SYNC-HI: The Hi input for the TTL External Sync input.
6 ISOCOM: The common for the RTIN and /INHIBIT functions
7 /INHIBIT: A logic Lo or contact input to inhibit the outputs referenced to pin 6
8 DFI: Pins 8 and 15 are the two pins for the isolated DFI function
9 External Signal B: The input for an external signal or RPV for Phase B referenced to pin 10
10 External Signal Common: The common for all external signal or RPV inputs
11 MOD B: The input for an amplitude modulation for Phase B referenced to pin 12
12 MOD-COM: The common for all amplitude modulation inputs
13 SYNC-LO: The Lo input for the TTL External Sync input
14 RTIN: An input to trigger a function, referenced to pin 6
15 DFI: Pins 8 and 15 are the two pins for the isolated DFI function
Table 3-2: System Interface Connector (J32)
CSW Series 35
Page 36

User Manual California Instruments
3.6.2.1 /Inhibit (Remote Inhibit)
The /Inhibit input J32 pin 7 can be used to open and close the output relay of the power source.
This input overrides the state of the output relay programmed from the front panel or the bus. It
may be used for safety interlock purposes.
The default level for remote inhibit is a logic low or contact closure between pin J32-7 and pin J23-6
(ISOCON). This will cause the output voltage to be programmed to 0.0 volts and the output relays
to open. Alternative, the level can be reversed using the “output:ri:level high” command over the
bus.
The mode of operation of the remote inhibit can be changed using the Output mode bus command.
This command selects the mode of operation of the Remote Inhibit protection. The following
modes can be selected:
LATChing A TTL low at the RI input latches the output in the protection shutdown state,
which can only be cleared by OUTPut:PROTection:CLEar.
LIVE The output state follows the state of the RI input. A TTL low at the RI input turns
the output off; a TTL high turns the output on.
OFF The instrument ignores the RI input.
The RI output state is saved at power down. The factory default state is LIVE.
For details on programming the remote inhibit function, refer to the CSW programming manual
3.6.2.2 External Signal Inputs
The External Signal Inputs are for either a DC or Direct waveform inputs. The DC input is
programmed by enabling the RPV function. This function is also called the External Gain
Control. A 0 to 7.07 volt DC input will adjust the output voltage from 0 to a full-scale output.
The External Signal input is not available with the FC option.
3.6.2.3 Remote Sense Connector TB3
It is important that the remote sense connections are hooked up at the load for the programmed
voltage to be correct at a load with high load currents. For single-phase systems, connect Phase
A to phase A and neutral to neutral. For three-phase system configurations, connect all three
phase and neutral.
If the sense lines are not connected the power source has internal resistors that will connect the
sense lines to the Master power source output terminals.
NOTE: Do not reverse or swap sense connection phasing or damage to the unit may
result.
For systems consisting of multiple CSW5550 chassis, the end user has to connect the external
sense inputs of the Master power source for the correct External sense function. The Auxiliary
power sources will have no control of the output voltage. Refer to Figure 3-3 for an illustration of
the power source rear panel and the Remote Sense terminal strip. Note that there are multiple
Neutral terminals for TB3. The terminals are all connected in parallel in the power source. Only
one terminal needs to be connected to the sense point.
36 CSW Series
Page 37

User Manual California Instruments
Pin Name
Description
1 VBUS
+5 VDC
4 GND
Ground
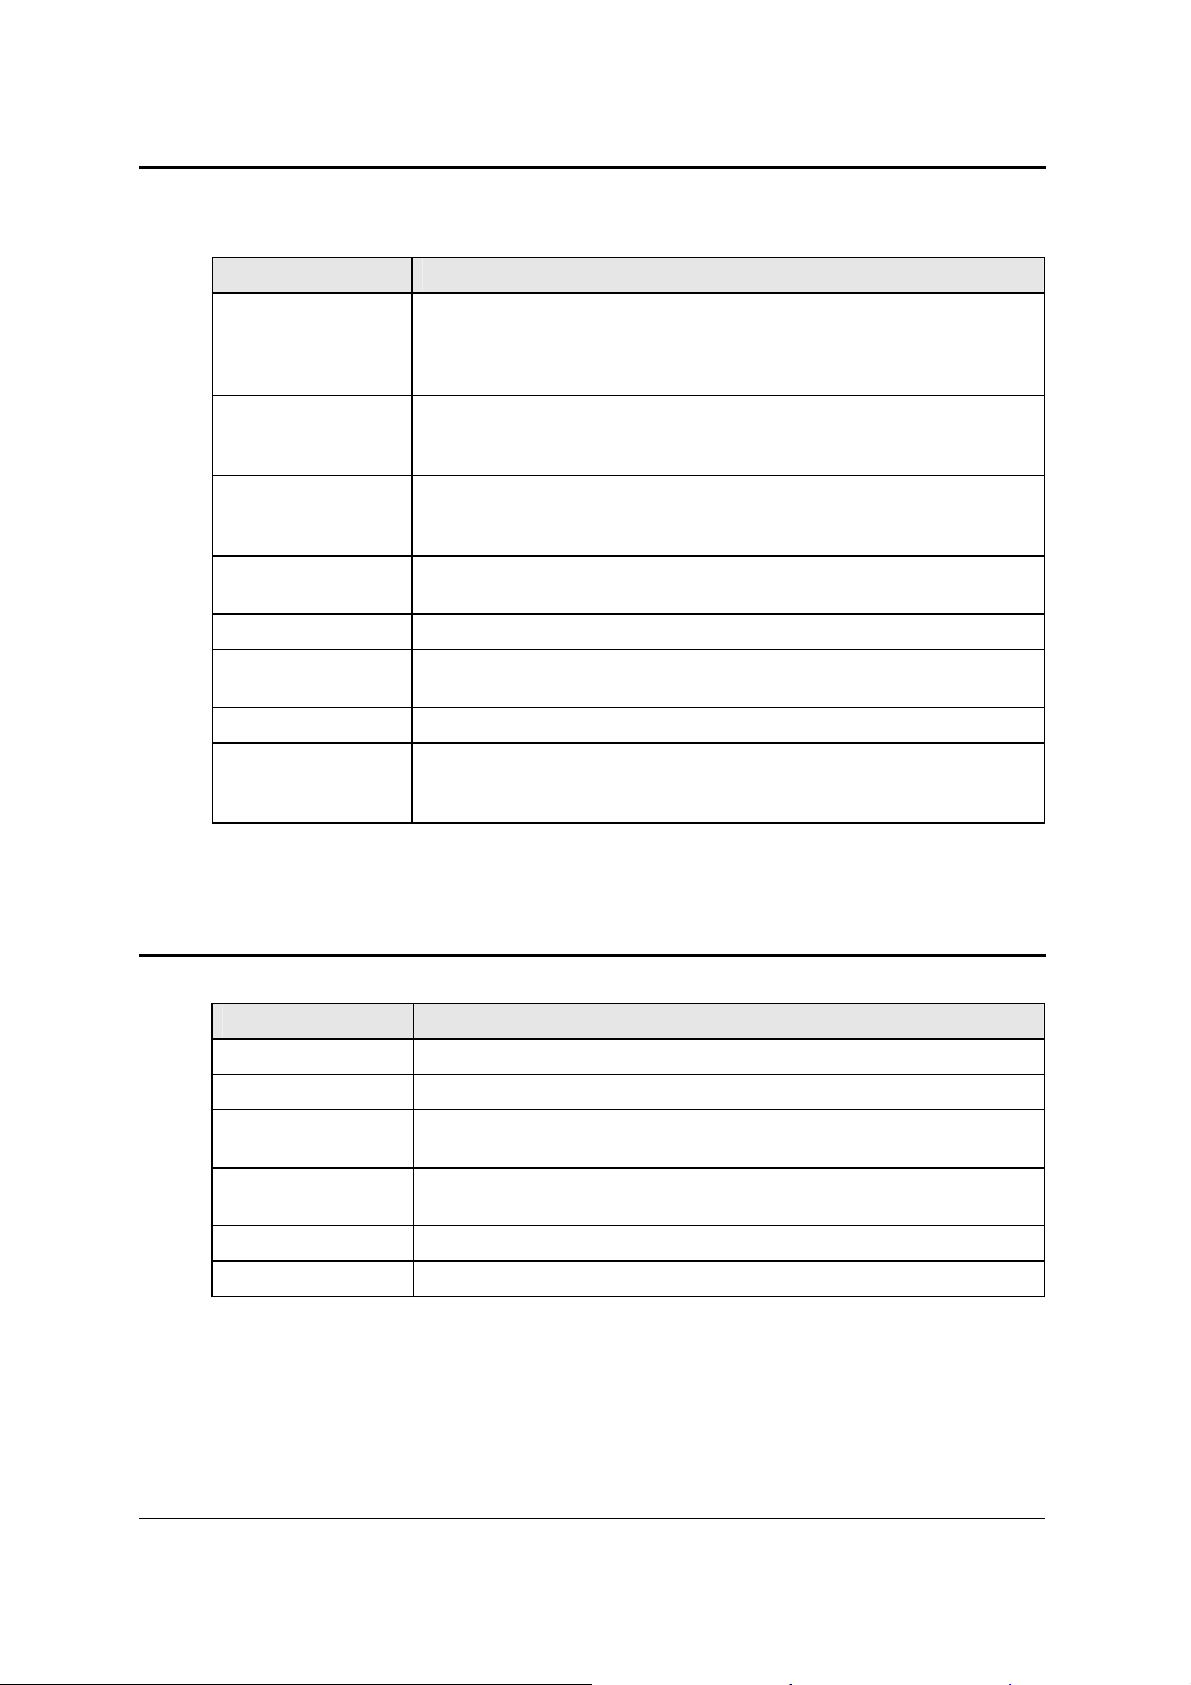
3.6.3 RS232C Serial Interface Connector
Pin Name Direction
1 N/C
2 TxD Output
3 RxD Input
4 N/C
5 Common Common
6 N/C
7 CTS Input
8 RTS Output
9 N/C
Table 3-3: RS232 Connector pin out
The CSW series power sources use a regular straight-through DB9 male to DB9 female serial
cable for the RS232 interface.
3.6.4 USB Interface
A standard USB Series B device connector is located on the rear panel for remote control. A
standard USB cable between the AC Source and a PC or USB Hub may be used.
Note: Use of the USB port to control more than one power source from a single PC is not
recommended, as communication may not be reliable. Use GPIB interface for
multiple power source control.
Figure 3-2:USB Connector pin orientation
2 D- Data 3 D+ Data +
Table 3-4: USB Connector pin out.
CSW Series 37
Page 38

User Manual California Instruments
Pin Ethernet TPE
EIA/TIA 568A
EIA/TIA 568B
5 Transmit/Receive Data 2
- White with blue stripe
White with blue stripe
solid brown.
solid brown
3.6.5 LAN Interface – RJ45
An optional RJ45 Ethernet 10BaseT connector is located on the rear panel for remote control. A
standard RJ45 UTP patch cord between the AC Source and a network Hub may be used to
connect the AC source to a LAN. For direct connection to a PC LAN card, a crossover RJ45
cable is required. Consult your network administrator for directions on connecting the AC source
to any corporate LAN.
If the –LAN Ethernet interface option is present, the MAC Address (Media Access Control) of the
Ethernet port is printed on the serial tag of the power source. The serial tag is located on the
rear panel of the unit.
For information on how to set up a network connection or a direct PC connection using the LAN
interface, refer to the CSW Series Programming Manual P/N M162084-03 distributed in Adobe
PDF format on CD ROM CIC496.
LAN
10BaseT/100BastT/1000BaseT
1 Transmit/Receive Data 0 + White with green stripe White with orange stripe
2 Transmit/Receive Data 0 - Green with white stripe or
solid green
3 Transmit/Receive Data 1 + White with orange stripe White with green stripe
4 Transmit/Receive Data 2 + Blue with white stripe or
solid blue
6 Transmit/Receive Data 1 - Orange with white stripe
or solid orange
7 Transmit/Receive Data 3 + White with brown stripe or
solid brown
8 Transmit/Receive Data 3 - Brown with white stripe or
Table 3-5: RJ45 LAN Connector pin out.
Crossover
Orange with white stripe or
solid orange
Blue with white stripe or
solid blue
Green with white stripe or
solid
White with brown stripe or
solid brown
Brown with white stripe or
38 CSW Series
Page 39

User Manual California Instruments
3.6.6
Figure 3-3: Rear Panel View for the CSW5550)
3.7 Single-Phase and Three Phase Multiple Box System Configurations
Three Phase System:
Refer to Figure 3-4 for the output power connections for a 3-phase power system. For
connections to a single power source disregard the connections to the Auxiliary power sources
shown in Figure 3-4.
All multi-source systems must be interconnected using the system Interface cable. All of the
respective outputs from the power sources must be connected at an external terminal block as
shown in Figure 3-4. The connections to the Output Sense terminal block of the Master power
sources should be connected to the point where the voltage is to be regulated. If the sense lines
are not connected the programmed output voltage will be regulated and the output of the Master
Power source.
For all multi-source power systems only the Master power source can control and report the
measured system output.
Single Phase System:
Refer to Figure 3-4. If the Single Phase mode is programmed the Phase B and C output from all
power sources must be connected to Phase A. The Master power source will still monitor the
total output current from all of the power sources for each phase.
The units must all be connected with the system interface cable.
NOTE: The three Output Neutral connections from each source should be tied together. The
Output Neutrals are connected internally but in the 1-phase mode because of the increased
CSW Series 39
Page 40

User Manual California Instruments
current they must be also connected external to the power source. In addition, the power
source’s also programmed to single phase. ( Menu 3 Ultility1 Voltage/Current control
Setup No. output = One)
See Table 3-1 for cable sizing.
NOTE
After the power source system has been configured for the 1-phase mode of operation the
Phase B and C outputs must be reconfigured as shown in Figure 3-7 for the 3-phase mode.
When the multi-source system is powered up the order of powering the Auxiliary power sources
and the Master power source is not important. After the system is powered up if an Auxiliary
power source is powered down there will be an error message displayed on the Master source,
“Auxiliary Down”. If power is reapplied to the Auxiliary power source the message will disappear
and normal the operation can continue. If the System Interface cable is removed from the
Auxiliary power source while the source is powered down the error message will disappear but
the Master power source will not have the correct configuration. The Master must have the input
circuit breaker toggled from Off to On for the correct configuration.
3.8 Output Voltage Ranges
The CSW Series power sources have two AC or DC voltage ranges (156Vrms and 312Vrms)
The maximum available load current is a function of the selected voltage range (high or low).
3.9 Functional Test
CAUTION: Work carefully when performing these tests, hazardous voltages
are present on the input and output during this test.
Refer to Figure 3-4 and 3.5 for the test set up. Connect the 3-phase line input to the indicated
rear panel terminal block. For the 380 to 415 VAC line input the Line Input Neutral must be
connected. The Neutral connection is not used for the 208 to 240 VAC line input.
1. Connect an oscilloscope, voltmeter and/or distortion analyzer to the AC source output at the
output terminal block (TB2).
2. With the AC mains verified as being off, apply the correct three phase AC power input
voltage connections to the AC source input terminals barrier (TB1). Apply the AC mains
power and turn on the main circuit breaker on the AC source front panel.
3. Verify the front panel LCD display lights up with the initial start up screen showing the unit ID
and serial number. A self check routine screen with follow and finally the system will display
the main “Menu 1” screen with the cursor highlighting the “Program” selection.
4. Press “ENTER” and the unit will display the Program selection screen. Set the following
output parameters: output voltage = 115 volts, frequency = 60 Hz, voltage range = 156 volts,
and current limit = 16.0 amps. Press “ENTER”.
5. Enable the output by pressing the output “on/off” button below the front panel display
screen. The green LED next to the button will light green when the output is on. The output
should be a clean 115 volt AC sinewave having less than 1% distortion.
6. Apply full load to the output of the source and verify the output remains within 2% of the
initial 115 volt value. The output should still be clean and the distortion should still be less
than 1% at 60 Hz.
40 CSW Series
Page 41

User Manual California Instruments
7. Program the power source to the Constant Current mode by first pressing the MENU key
several times to select UTILITY 1. Then select VOLT/CURR CONTROL and then OL
MODE. Program CC. Using the PROGRAM screen set the output current limit value to 8
amps. The system should go into current limit at the program value. Return the current
value to 16.0 amps and press the output on/off button to turn the output off. Disconnect the
load.
8. Repeat steps 4 through 7 but set the output for the following: output voltage = 312 volts,
output range = 230 volts, current limit = 8.0 amps. For step 7, the current limit value can be
set to 4 amps.
9. Repeat steps 4 through 8 for each of the three phases.
In the unlikely event the power source does not pass the functional test, refer to the calibration
procedure in Section 6 or call the Ametek customer service department for further assistance.
CSW Series 41
Page 42

User Manual California Instruments
Figure 3-4: Output Power Connections for 1 Source and Multi-source Systems
NOTE: Connect all source Output Neutral terminals
42 CSW Series
Page 43

User Manual California Instruments
Figure 3-5: Functional Test Setup
CSW Series 43
Page 44

User Manual California Instruments
Figure 3-6: Three CSW Sources, 9-phases with Clock/Lock
44 CSW Series
Page 45

User Manual California Instruments
Figure 3-7a: Parallel (single phase) Connections
Figure 3-7b: Sense Lead Connection for 3-phase Output
CSW Series 45
Page 46

User Manual California Instruments
Front Panel Operation
3.10 Tour of the Front Panel
Before operating the AC source using the front panel, it helps to understand the operation of the
front panel controls. Specifically, the operation of the knob, keyboard and the menu layout are
covered in the next few paragraphs.
3.10.1 Front Panel Controls and Indicators
The front panel can be divided in a small number of functional areas:
• Mains circuit breaker
• Status Indicator lights
• Shuttle knob
• LCD display
• FUNCTION keypad
• DATA ENTRY keypad
3.10.2 Mains Circuit Breaker
The circuit breaker located on the bottom left side of the front panel disconnects the AC source
from the three phase Line input. It will automatically trip when the input current rating of the unit
is exceeded due to some component failure. The contrasting black color and large size throw
bar make it easy to locate in case of an emergency.
3.10.3 Status Indicator Lights
Four LED status indicators are located directly above the mains circuit breaker. These LED’s
correspond to the following conditions:
REMOTE The REMOTE LED indicates that the unit is in remote control
OVERLOAD The OVERLOAD LED indicates an output overload condition.
OVERTEMP The OVERTEMP LED indicates an overheating problem inside
mode. If the IEEE-488 interface is used, this indicator will be lit
whenever the REM line (REMOTE ENABLE) line is asserted by
the IEEE controller. If the RS232C, USB or LAN interface is
used, the REMOTE state can be enabled by the controller
using the SYST:REM command. Any time the REMOTE LED is
lit, the front panel of the i Series unit is disabled. There is no
LOCAL button that allows the user to regain control of the front
panel. This prevents accidental change of settings in ATE
applications.
This condition can be controlled by setting the current limit
value in the PROGRAM menu. Removing the load using the
OUTPUT ON/OFF button will recover from an overload
condition.
the unit. This is an abnormal condition, which will cause the unit
to shut off. Check the air openings to make sure they are not
blocked.
HI RANGE The HI RANGE LED is on when the high voltage output range
has been selected.
46 CSW Series
Page 47

User Manual California Instruments
3.10.4 The Shuttle Knob
Counter
Clock
wise
Clock
wise
INCRDECR
Figure 3-7: Shuttle Knob
The shuttle knob is located to the right of the LCD screen and is used to change setup
parameters. Note that it cannot be used to move the cursor position between menu fields. Use
the UP and DOWN arrow keys in the FUNCTION keypad for this.
The shuttle knob can operate in one of two distinct modes of operation:
MODE DESCRIPTION
IMMEDIATE mode Any time the ENTER key is pressed, the CSW Series returns to
its normal mode of operation. In this mode, changes made with
the shuttle knob or the data entry keypad will take immediate
effect. The IMMEDIATE mode is useful for slewing output
values such as voltage and frequency and observing the effect
on the load.
SET mode When the SET key located in the FUNCTION keypad is
pressed, changes made with the shuttle to any output
parameter will not take effect until the ENTER key is pressed.
In this mode, any changes made to a setup menu will be
blinking to indicate the pending change condition. This mode
allows changes to be made to all output parameters and
executing them all at once by pressing the ENTER key.
CSW Series 47
Page 48

User Manual California Instruments
3.10.5 FUNCTION Keypad
The function keypad provides access to all menus and measurement screens. The following
keys are located in the FUNCTION keypad:
FUNCTION
MENU PROG WAVE MEAS
OUTPUT
ON/OFF
KEY DESCRIPTION
MENU The top level menu is accessed by pressing the MENU key.
Three shortcut keys are used to provide direct access to the
PROGRAM, WAVEFORM, and MEASUREMENT screens as
these are among the most frequently used screens. Thus,
instead of going through the main menu to reach the
PROGRAM, WAVEFORM, and MEASUREMENT screens, they
can be accessed directly by pressing the PROG, WAVE, and
MEAS keys respectively. A map of the Main menus is provided
on the next few pages. There are three top-level menus in the
CSW Series.
PROG The PROG key is a shortcut to access the PROGRAM menu
directly. The PROGRAM menu is one of the most frequently
used menus. Thus, instead of going through the main menu to
reach the PROGRAM menu, it can be accessed directly by
pressing the PROG key.
WAVE The WAVE key is a shortcut to access the WAVEFORM screen
directly. The WAVEFORM screen is used to select a user
defined arbitrary waveform.
PHASE
Figure 3-8: FUNCTION keypad
SET
+/-
MEAS The MEAS key is a shortcut to access the MEASUREMENT
screen directly. The MEASUREMENT screen is one of the most
frequently used screens. Thus, instead of going through the
main menu to reach the MEASUREMENT screen, it can be
accessed directly by pressing the MEAS key.
48 CSW Series
Page 49

User Manual California Instruments
OUTPUT ON/OFF The OUTPUT ON/OFF key toggles the output relay on or off.
The state of the output relay is reflected by the green LED
located directly to the left of the OUTPUT ON/OFF key. If the
green LED is lit, the output relay is enabled (closed) and the
programmed output voltage is present at the output terminals. If
the green LED is off, the output relay is open and both the
HIGH and LO terminal of the output terminal block are
disconnected from the power source. In this mode, the output is
floating. The ON/OFF button provides a convenient way to
disconnect the load without having to remove any wires.
PHASE The PHASE key is used to select the phase while operating in
the 3-phase mode. Pressing the PHASE key will toggle phase
A, B, C or ABC. Some screens may not support the ABC or
show all phase information in which case this mode is skipped.
In the 1-phase mode the PHASE will only select Phase A.
SET The SET key is used to select the mode of operation of the
shuttle. Refer to section 3.10.1 for details on its operation and
the use of the SET key.
+/- The +/- key can be used to toggle the sign for those parameters
for which it is relevant. This is typically the output voltage when
in DC mode of operation. For fields that have only two possible
values such as the voltage range field, the +/- key can be used
to toggle between these two values.
3.10.6 DECIMAL KEYPAD
The decimal keypad may be used to enter any numeric parameter required in any of the menu
fields. Several fields accept input from either the keypad or the knob. Data entered from the
keypad is normally accepted once the ENTER key is pressed unless the front panel mode is in
the SET mode. The following keys are available on the decimal keypad:
ENTRY
7
8 9
4 5 6
1 2 3
.0
Figure 3-9: Entering value from decimal keypad
E
N
T
E
R
CSW Series 49
Page 50

User Manual California Instruments
CURSOR UP The UP key moves the cursor position upwards one position to
the previous available cursor position. If the present cursor
position is at the top of the right hand column, the cursor is
moved to the bottom position of the left hand column. If the
present cursor is at the top of the left hand column, the cursor is
moved to the bottom of the right hand column. Figure 3-10
depicts the cursor movement through a two-column menu.
Figure 3-10: Cursor UP key movement
CURSOR DOWN The DOWN key moves the cursor position downwards one
position to the next available cursor position. If the present
cursor position is at the bottom of the left hand column, the
cursor is moved to the top position of the right hand column. If
the present cursor is at the bottom of the right hand column, the
cursor is moved to the top of the left hand column. Figure 3-11
depicts the cursor movement through a two column menu.
Figure 3-11: Cursor DOWN key movement
The decimal keypad can be used at any time in lieu of the shuttle knob to change output
parameters. Direct data entry is often faster to effect large changes in values than using the
shuttle knob. Note that pressing the ENTER key while in SET mode of operation will cause the
AC source to revert back to IMMEDIATE mode. Thus, to change all parameters in SET mode,
enter a value for each field and then proceed to the next field without pressing the ENTER key.
0 through 9 The numeric keys provide all decimal number for entry of
parameters.
DECIMAL POINT The decimal point key is used to enter fractional parts of values
for fields that have a resolution less than 1. The amount of
resolution for each menu field is normally visible on the LCD. If
more digits are entered after the decimal point than can be
accepted by a field, the value is automatically rounded to the
available resolution when the ENTER key is pressed.
BACKSPACE The BACKSPACE (←) key can be used to erase one digit at a
time if you make a data entry error.
50 CSW Series
Page 51

User Manual California Instruments
3.10.7 LCD Display
The LCD display of the CSW Series power source provides information on instrument settings
and also guides the user through the various menus. To ease reading of the displayed
information, most screens are widely spaced. A sample of the main menu 1 screen that appears
when the source is powered up is shown in Figure 3-12. Due to the amount of space available
on each screen, some menus have been split into parts. The MORE selection located at the
bottom right hand side provides access to menu choices at the same level that did not fit on a
single screen. Thus, to access MENU 2, the cursor should be placed on the ‘MORE’ selection
followed by pressing the ‘ENTER’ key. Alternatively, the MENU key may be pressed to move to
the MENU 2 screen.
The present cursor position is always shown with a inverse bar. The cursor is located on the
‘MORE’ selection in Figure 3-12. Pressing ENTER would cause MENU 2 to be displayed.
The cursor position can be moved by using the UP and DOWN keys located in the DECIMAL
keypad.
Figure 3-12: Main Menu 1 screen
CSW Series 51
Page 52

User Manual California Instruments
3.11 Menu Structure
The next few pages show a map of the available menus in the i/CSW Series. There are three
main level (level 1) menus from which all other menus can be reached. Frequently used (level 2)
menus have a short cut key that provides direct access. Examples of such menus are Program,
Measurements, and Waveform. In any case, there are never more than three levels of menus
although some menus may be spread across more than one screen.
3.11.1 MAIN Menus
Figure 3-13: Menu 1 through 3
The top-level menu is split in three parts, MENU 1 through MENU 3 to allow spacing between
menu entries. MENU 2 and 3 can be reached from MENU 1 by selecting the MORE entry or by
pressing the MENU key repeatedly, which will toggle from MENU 1 to 2 to 3 and back to 1. The
division of menu choices between the two screens is graphically illustrated in sections 3.11.2
and 3.11.3 by the boxes in level 1. Each box represents one screen. Subsequent screens can
be reached using the MORE entry.
52 CSW Series
Page 53

User Manual California Instruments
The following top-level menu choices can be accessed from the MENU key:
Entry Description
MENU 1
PROGRAM The PROGRAM menu allows output parameters the be
changed.
MEASUREMENTS The MEASUREMENTS screens are not menus in that no user
entries are required.
TRANSIENTS The TRANSIENTS menu allows output transients to be
programmed.
WAVEFORMS The WAVEFORMS menu allows different waveforms to be
selected from the waveform library.
MORE The MORE selection causes the second part of the MENU
screen to be displayed. (MENU 2)
MENU 2
ADVANCED MEAS. The ADVANCED MEAS. screens are for display only. No user
entries are required.
APPLICATIONS The APPLICATIONS menu provides access to the optional
firmware application programs that may be installed in the CSW
Series source.
SETUP REGISTERS The SETUP REGISTERS menu allows complete instrument
settings and transient list programs to be saved to nonvolatile
memory.
INTER HARMONICS The INTER HARMONICS screen allows the source to perform
IEC61000-4-13 tests. These tests are for harmonics and interharmonics for low frequency immunity tests.
MORE The MORE selection causes the third part of the MENU screen
to be displayed. (MENU 3)
MENU 3
UTILITY The UTILITY menu provides access to less commonly used
setup screens such as those for the GPIB and RS232C (also
applies to USB and LAN) interface settings, initial startup
values, etc.
EXTERNAL CAL The EXTERNAL CAL menu allows for calibration of all external
inputs. This includes the External Signal and RPV inputs.
MEASUREMENT CAL The MEASUREMENT CAL menu allows for calibration of the
AC source measurement system.
OUTPUT CAL The OUTPUT CAL menu allows for calibration of the AC source
output with the ALC in the OFF state.
Following the Menu overview pages is a detailed description of each menu and sub menu.
CSW Series 53
Page 54

User Manual California Instruments
level 1
level 2
level 3
MENU 1
PROGRAM
PROGRAM1
VOLT
AGE
FREQ
VOLT RANGE
CURR LIMIT
MORE
PROGRAM2
PHASE
CLOCK MODE
VOLT MODE
DC OFFSET
START ø
MEASUREMENTS
MEASUREMENTS1
VOLTAGE
CURRENT
FREQ
POWER
MORE
MEASUREMENTS 2
VA POWER
PEAK CURR
POWER FACT
CREST FACT
PEAK CURR RESET
MEASUREMENTS 3
VOLT THD
CURR TH
D
INST PK CURR
PHASE
HARMONICS/TRACE
ANALYSIS
FUNCTION
VIEW
DATA MODE
SCALE
TRIG MODE
TRIG SOURCE
TRIG PHASE
TRIG DELAY
START
TRANSIENTS
VOLT SURGE/SAG
START ø
VOLT SWEEP/STEP
START ø
GO TO VOLT
FREQ SWEEP/STEP
DURATION
END VOLT
DUR SCALE
VOLT/FREQ SWEEP/STEP
DURATION
END FREQ
DUR SCALE
DURATION
START/VIEW SEQUENCE
START
END VOLT
END DELAY
DURATION
END VOLT
PREVIOUS SCREEN
PAUSE END FREQ
FUNCTION
END DELAY
END DELAY
REPEAT #0
END DELAY
REPEAT
FUNCTION
FUNCTION
CLEAR SEQ
FUNCTION
EVENT#
REPEAT
REPEAT
REPEAT
PREVIOUS SCREEN
EVENT#
EVENT#
#1 SEQUENCE#
PREVIOUS SCREEN
PREV. SCREEN
#2
PREVIOUS SCREEN
..
#98
#99
PREVIOUS SCREEN
WAVEFORMS
CLIP LEVEL
GROUP
MODE
SINE
SQUARE
CLIPPED
USER WAVE
..
..
MORE
USER WAVE
3.11.2 Overview of Menu 1
54 CSW Series
Page 55

User Manual California Instruments
level 1
level 2
level 3
MENU 2
ADVANCE
HARMONICS/TRACE
MEAS.
ANALYSIS
FUNCTION
VIEW
DATA MODE
SCALE
TRIG MODE
TRIG SOURCE
TRIG PHASE
TRIG DELAY
START
APPLICATIONS
APPLICATIONS SETUP 1
STEADY STATE
MIL-STD 704
MODE TRANSIENTS
OMNI OPTION
NORMAL STATE
PREVIOUS SCREEN
ABNORMAL
RTCA-DO160D
IEC 1000
-4-
13 TESTS
IEC 1000
-4-
11 TESTS
EMERGENCY
EMERGENCY
IEC 1000
-4-11 STATE DIPS AND INTER.
ABNORMAL
ALL MIL704 TESTS
APPLICATIONS SETUP 2
RUN VOLT VARIATIONS
PREVIOUS SCREEN
PREVIOUS SCREEN
IEC 1000
-4-13 CLASS PREVIOUS SCREEN
WH METER
GROUP
REGENERATE (n/a)
DWELL
LEVEL
SETUP
SAVE REGISTER #
FRANGE
REGISTERS
VIEW/EDIT REG #
STEP
RECALL REGISTER #
IHFREQ
Previous Screen
RESONANT
UTILITY 1
MENU 3
UTILITY
GPIB/RS232 SETUP
VOLT/CURR CONTROL
GPIB ADDRESS
PREVIOUS SCREEN
VOLT ALC
RS232 BAUDRATE
INITIAL SETUP
OL MODE
RS232 DATA
LIMIT SETUP
VOLTAGE
TRIP DELAY
RS232 PARITY
MORE VOLTAGE
CUR LIMIT
VOLT REF
RS232 STOPBITS
UTILITY 2
CUR LIMIT
PREV. SCREEN
NO. OUTPUT
PREVIOUS SCREEN
CONFIGURATION
FREQ LO
FREQ XLOAD
LANETWORK SETUP
CONFIG SETUP 1
FREQ HI PHASE
ELAPSED TIME
PHASE C
MORE
HH:MM:SS
VIEWING ANGLE
PREVIOUS SCREEN
VOLT RANGE
TEMPERATURE
PREVIOUS SCREEN
VOLT MODE
OL MODE
CONFIG SETUP 2
OUTPUT RELAY
IEC 4-11
MORE
VOLT
REF
WAVE GROUP
EXTERNAL CAL
FS OUT
CLOCK MODE
FS ADC
CONFIG SETUP 3
NO. OUTPUT
ZERO DC
VOLT ALC
PREVIOUS SCREEN
CONFI
G SETUP 4
VOLT FS
MEASUREMENT
CURR FS
CAL
PREVIOUS SCREEN
VOLT FS
OUTPUT CAL
V HI-FREQ
VOLT ZERO
PHASE OFST
PREVIOUS SCREEN
INTER HARMONICS
3.11.3 Overview of Menu 2 and 3
PREVIOUS SCREEN
Inter Harmonics
MORE
REF. VOLT
VOLTAGE
FREQUENCY
REF. COUPLE
REFERENCE
LANGUAGE
ZERO RMS
MEAS RMS/DC
NO. OUTPUT
ADVANCE
DO160
MIL704
IEC 4-13
CLOCK/LOCK
WH METER
MS704
ABD
LF
SYSTEM
MB
MANUAL
OPTn
LAN
SNK
CSW Series 55
Page 56

User Manual California Instruments
3.11.4 PROGRAM Menu
Figure 3-14: PROGRAM Menu
The PROGRAM menu is shown in Figure 3-14. It can be reached in one of two ways:
1. by selecting the PROGRAM entry in the MENU screen and pressing the ENTER key
2. by pressing the PROG key in the FUNCTION keypad
The PROGRAM menu is used to change output parameters. The most commonly used
parameters are all located in PROGRAM 1. The PREVIOUS SCREEN entry, when selected, will
return the user to the most recently selected menu. This is normally the MENU screen unless
the PROGRAM menu was selected using the PROG key on the FUNCTION keypad. Less
frequently used parameters are located in PROGRAM 2, which can be reached from the
PROGRAM 1 screen using the MORE selection, or by pressing the PROGRAM key twice.
The following choices are available in the PROGRAM menus:
Entry Description
PROGRAM 1
VOLTAGE Programs the output voltage in rms. when in AC mode or
absolute voltage when in DC mode. In DC mode, negative
values can be entered.
FREQ Programs the output frequency when in AC mode. If the unit is
in DC mode, the value for FREQ will be set to DC and cannot
be changed until AC mode is selected. When in AC mode, the
frequency can be changed from 16 Hz to 5000 Hz. Values
entered that fall outside this range will generate a -200 RANGE
ERROR and will not be accepted.
VOLT RANGE Selects 156V or 312V range. The actual range values may be
different depending on the configuration. The value of this field
can only be changed with the shuttle or the +/- key.
Note that the voltage range is coupled with the output relay
state. If the output relay is closed (OUTPUT ON), the voltage
range cannot be changed.
CURR LIMIT Sets the current limit value for the current detection system.
When the load current value exceeds the set current limit, a
fault condition is generated. The actual response of the AC
Source to a current limit fault is determined by the protection
mode selected in the CONFIGURATION menu. (CC = Constant
Current, CV = Constant Voltage).
56 CSW Series
Page 57

User Manual California Instruments
PROGRAM 2
PHASE Selects the phase angle between the external clock and the
output of the AC source. If the clock source is internal, this
parameter has no effect.
CLOCK MODE Selects internal or external clock source. The CSW Series uses
an quartz crystal time-base with an accuracy of 100 ppm. To
improve output frequency stability and accuracy, an external
clock generator may be used.
VOLT MODE The CSW Series offers three output modes, AC, DC and
AC+DC. The VOLT MODE field can be used to toggle between
these three output modes. Both the Knob and the +/- key may
be used to toggle through these three selections. In DC mode,
no frequency selection is possible and all maximum current and
power ratings are divided by two.
DC OFFSET When the AC+DC mode is selected, the VOLTAGE field in the
PROGRAM 1 screen is used to set the AC portion of the output
voltage. The DC OFFSET field in the PROGRAM 2 screen can
be used to set the DC offset level. Either the knob or the
decimal keypad may be used to set the DC offset level.
STARTø Selects the start phase angle for output changes made to either
voltage or frequency. This allows changing the output at a
specific phase angle. The output on key also uses this phase
angle setting to program the output voltage up to the set level
after the output relay is closed. The default value for this field is
RANDOM.
CSW Series 57
Page 58

User Manual California Instruments
3.11.5 MEASUREMENTS Screens
The CSW Series uses a DSP based data acquisition system to provide extensive information
regarding the output of the Source. This data acquisition system digitizes the voltage and
current waveforms and calculates several parameters from this digitized data. The result of
these calculations is displayed in a series of measurement data screens. The actual digitized
waveforms can also be displayed by selecting the Harmonics/Trace Analysis screen. A total of
four measurement screens are used to display all this information.
Figure 3-15: MEASUREMENTS Screen, single phase and three phase modes
The first three Measurement screens available on the CSW Series are not menus in that no
changes can be made anywhere. Instead, these three screens provide load parameter readouts.
The fourth measurement screen provides access to the advanced measurements and does offer
several user accessible fields (CSW Series only). The measurement screens can be reached by
successively pressing the MEAS key, which will toggle to all four available screens.
In three-phase configuration CSW Series, measurements are available for each phase
individually. To select the desired phase, use the PHASE key to toggle through phase A, B, C,
or ABC. The ABC mode displays the data for all three phases simultaneously.
The following parameters are available in the first three measurement screens:
Entry Description
MEASUREMENT 1
VOLTAGE When in AC or AC+DC mode, this value is the true rms output
voltage measured at the voltage sense lines. In DC only mode,
the voltage is the DC voltage including polarity.
CURRENT When in AC or AC+DC mode, this value is the true rms output
current drawn by the load. In DC only mode, the current is the
DC current including polarity
FREQ When in AC or AC+DC mode, the output frequency is
measured at the sense lines. When in DC only mode, this value
always reads “DC”.
POWER In both AC and DC mode, this value is the real rms. power
consumed by the load.
MEASUREMENT 2
VA POWER In AC or AC+DC mode, this value is the apparent rms. power
consumed by the load. In DC mode, this value is always the
same as the POWER readout.
PEAK CURR This readout reflects the peak current value detected at the
output. To measure inrush current for a unit under test, open
the output relay and reset the peak current value using the
PEAK CURR RESET entry. Then program the output voltage
and frequency and turn on the output relay. The peak current
measurement will continuously track the maximum current
value detected until reset.
58 CSW Series
Page 59

User Manual California Instruments
POWER FACTOR This readout shows the power factor of the load.
CREST FACTOR This readout displays the ratio between peak current and rms
current.
MEASUREMENT 3
VOLT THD This readout displays the total voltage distortion for the selected
phase. The distortion calculation is based on the H2 through
H50 with the fundamental voltage (H1) in the denominator.
Note that other common definitions of THD use the RMS value
of the voltage as the denominator. This may result in different
readings between instruments depending on the
implementation chosen. The mode used by the power source is
selectable over the bus.
CURR THD This readout displays the total current distortion for the selected
phase. The distortion calculation is based on the H2 through
H50 with the fundamental current (H1) in the denominator. Note
that other common definitions of THD use the RMS value of the
current as the denominator. This may result in different
readings between instruments depending on the
implementation chosen. The mode used by the power source is
selectable over the bus.
INST PK CURR This readout reflects the instantaneous peak current value
detected at the output. This value is updated continuously and
does not require a reset operation like the PEAK CURR
readout. The instantaneous peak current does not use a track
and hold mechanism like the PEAK CURR measurement in the
MEASUREMENT 2 screen. Instead, it tracks the peak current
on a cycle by cycle basis. The INST PK CURR typically tracks
the rms current and the crest factor.
Update Program Functions from Measurement Screen
The Shuttle can be used to update program parameters such as voltage, frequency or current
from the measurement screen. This can be achieved with the following sequence:
1. Select the program 1 screen using the PROG key.
2. Use the up and down key to select the desired function to update. (Selects parameter that
will be changed by the shuttle once in the MEAS1 screen)
3. Select the measurement 1 screen by pressing the MEAS key.
The pointer symbol ( ) points to the programmed parameter (V,F or CL) that will be affected
by turning the shuttle.
CSW Series 59
Page 60

User Manual California Instruments
HARMONICS/TRACE ANALYSIS Screen
The fourth measurement screen is dedicated to the advanced measurements available on the
CSW Series only. This screen is not available on the i Series. The Harmonics/Trace Analysis
measurement screen is a true menu screen offering several user accessible fields. These fields
are used to select the desired acquisition trigger and display mode. The actual data is displayed
whenever the ENTER key is pressed while the cursor is on the VIEW or START field. The
following fields are available on this menu:
Figure 3-16: HARMONICS/TRACE ANALYSIS screen
Entry Description
FUNCTION Selects Voltage, Current or Both parameters for display.
VIEW Available display modes are TABLE, BAR and TRACE.
TABLE mode: displays the first 50 harmonics in a
tabular text format.
BAR mode: displays the first 50 harmonics in a
graphical bar chart display.
TRACE mode: displays the selected Function in a
time domain (waveform) graphical
display.
DATA MODE Selects absolute or relative harmonics display for TABLE and
BAR view modes. In relative mode, all harmonics are shown in
a percentage of the fundamental which is normalized at 100 %.
In absolute mode, the harmonic amplitudes are shown in
absolute volts or amperes.
60 CSW Series
Page 61

User Manual California Instruments
This mode does not apply to the TRACE view display mode
and is ignored when this mode is selected.
SCALE Sets the horizontal time axis for the TRACE view display mode.
The fields range is 4 ms to 42 ms in single-phase mode or 12
ms to 128 ms in three phase mode.
This parameter is ignored when the TABLE or BAR view
display mode is selected.
TRIG MODE This field sets the trigger mode for the acquisition. Available
options are SINGLE (single shot acquisition) or CONT
(continuous acquisition). In SINGLE shot mode, the acquisition
is triggered once each time the START field is selected and the
ENTER key is pressed. The selected trigger source is used to
determine the trigger point. Once the acquisition has been
triggered, the data are displayed and do not change until the
next acquisition is triggered. This mode is most appropriate for
single shot events such as start up currents.
In the CONT mode, acquisitions occur repeatedly and the data
is updated on screen after each trigger occurs. This provides a
continuous update of the data and is most appropriate for
repetitive signals.
TRIG SOURCE The trigger source selects the event that will trigger a
measurement acquisition. Available options for this field are
IMM (immediate), PHASE A or SET VOLT. The IMM trigger
source causes the acquisition to trigger immediately when the
ENTER key is pressed on the START field. Essentially, this is
an asynchronous trigger event. The acquisition will always be
triggered in this mode and data is available immediately.
The PHASE A source will cause the acquisition to trigger on the
occurrence of a set phase angle for the voltage on phase A.
The trigger source is always phase A when in this mode,
regardless of the phase selection shown in the top right corner
of the display. When the acquisition is started, the acquisition
system waits for the specified phase angle to occur before
triggering the acquisition. This mode allows exact positioning of
the acquisition data window with respect to the voltage
waveform.
The SET VOLT mode causes the acquisition to trigger at the
specified voltage. This mode also programs the selected phase
or all three phases when the measurement is started from the
START field. As such, this trigger source selection also
programs the output voltage to the selected rms level.
TRIG PHASE / SET VOLT This field changes purpose, depending on the trigger source
selected immediately above it. If the trigger source equals IMM
or PHASE A, this field can be used to program the trigger
phase angle (TRIG PHASE). In IMM mode, the value of this
field is ignored.
If the trigger source is set to SET VOLT, this field can be used
to specify the rms voltage to program the output to and trigger
the measurement on. The voltage value set here should not
exceed the maximum voltage range selected or the rms
CSW Series 61
Page 62

User Manual California Instruments
capability for the waveshape selected on the phase or phases
programmed.
TRIG DELAY The trigger delay field allows the trigger point to be positioned
anywhere in the acquisition window. A negative value will
provide pre-trigger information on data leading up to the trigger
event. The pre-trigger delay cannot exceed the length of the
acquisition buffer See paragraph 3.15.3.3 for details. A positive
trigger delay positions the data window after the trigger event.
Positive trigger delays can exceed the length of the acquisition
buffer in which case the trigger event itself will not be in the
buffer any more. The maximum value of the trigger delay is
1000 ms. The default trigger delay value is 0.0 ms which puts
the trigger event at the beginning of the acquisition window.
START The START field is used to start a new acquisition run. To start
an acquisition, place the cursor on the START field and press
the ENTER key. Once the ENTER key is pressed, the display
toggles to the data display mode selected in the VIEW field as
soon as the selected trigger event occurs. To return to the
HARMONICS/TRACE ANALYSIS menu, press the ENTER key
while in the data display mode.
To change display modes without triggering a new acquisition,
make the desired changes in the menu and move the cursor to
the VIEW field. Once on the VIEW field, press the ENTER key.
This will not trigger a new acquisition, which means the original
data is retained.
62 CSW Series
Page 63

User Manual California Instruments
3.11.6 TRANSIENTS Menu
Figure 3-17: TRANSIENTS menu
The transient menu provides access to the transient list data. The iM Series does not support
transient programming. The CSW Series has a transient list of up to 100 data points. This is
represented by 100 transient step numbers from 0 through 99. From the Transient menu, the
desired transient step type can be selected. Based on the user’s choice, the relevant transient
type sub menu will be shown. The START/EDIT SEQUENCE sub menu allows the user to
review and change any transient step or execute the transient list. When executing a transient
list, transient steps are executed in a ascending numerical order. Steps that are not defined are
skipped.
The following entries can be found in the TRANSIENTS menu:
Entry Description
VOLT SURGE/SAG Voltage surges and sags are temporary changes in amplitude.
The output voltage will change from its present value to a user
specified value for a specified duration. (Sag if the value is
lower, surge if the value is higher.) After this period has expired,
the output voltage returns to a user specified end value. This
value may or may not be the same as the value present prior to
the start of the sag or surge.
VOLT SWEEP/STEP Voltage sweeps cause the output voltage to change from the
present value to a user specified end value at a specified rate
of change. A voltage step on the other hand is an
instantaneous change in output voltage. The new value will be
held for the duration period specified by the user. The final
output voltage value of a sweep and a step transient step
should be different than the value at the start of the transient
step or no change in output value will occur.
FREQ SWEEP/STEP This transient type is similar to a voltage sweep/step except it
affects the frequency. Refer to the previous paragraph.
VOLT/FREQ SWEEP/STEP This transient type combines the previous two types into a
single step. The effect is that of changing the output voltage
and frequency simultaneously.
Note: While this transient is programmed as a single transient
step, two list entries are required to store this information. As
such, every VOLT/FREQ SWEEP/STEP used will consume two
list entries at a time.
START/VIEW SEQUENCE This entry allows the user to switch to the transient execution
menu. This menu provides a list of all available transient list
steps and their sequence numbers. From this menu, transient
list execution can be started.
The same menu can be used to view or edit any available
transient list step or erase a step using the backspace key.
CSW Series 63
Page 64

User Manual California Instruments
3.11.6.1 VOLT SURGE/SAG sub menu
Figure 3-18: VOLTAGE SURGE/SAG SETUP screen
The Voltage surge and sag screen shown in Figure 3-18 can be reached from the transient
screen as follows:
1. Scroll to the VOLT SURGE/SAG entry using the up and down cursor keys.
2. Press the ENTER key to bring up the VOLT SURGE/SAG screen.
The VOLT SURGE/SAG screen has several data fields. All data fields that are blank to the right
of the equal sign must be filled or an error message will occur when trying to leave this screen.
The EVENT # is the last data field to be filled. Entering the event data field will cause the display
to return to the TRANSIENT screen where a new selection can be made.
The VOLT/SURGE/SAG screen has the following fields:
START ø This field will show the start phase angle of the voltage
transient in degrees. Only one start phase angle per transient
sequence is allowed. The start phase angle must be in the first
transient event in the list. The start phase angle is not valid for
DC transients. If no start phase angle is required, this field can
be set to RANDOM by pressing the BACKSPACE (<-) key on
the decimal keypad.
GO TO VOLT This field will set the voltage level during the transient duration
in volts
DUR SCALE Duration scale default is time in seconds. Use the Shuttle knob
to select CYCLES if desired. Note that durations expressed in
cycles may cause rounding errors if the period of the selected
frequency setting is not an integer number of mss. Thus, for 50
Hz applications, no rounding errors occur but for 60 Hz, the
16.66¯ ms period will cause a rounding error when converted.
The Duration scale selection affects both the DURATION and
END DELAY parameters.
DURATION Duration is the time the output voltage level will dwell at the GO
TO VOLT level. The DUR SCALE defines the time scale of this
parameter in CYCLES or SECONDS
END VOLT This is the output voltage level at the end of the transient
EVENT and after a time specified by the DURATION
END DELAY This is the time delay the voltage level will stay at the END
VOLT level before it proceeds with the next transient event or
completes the transient.
FUNCTION This field can be used to select the waveshape to be used
during this step of the transient sequence. Each step can use a
different waveshape from the available library of 50 user
defined waveforms or the three standard waveforms. The
output waveshape changes upon entry into each step and
remains in effect for the duration of the step. The default
waveshape is always the SINE (sinewave).
64 CSW Series
Page 65

User Manual California Instruments
REPEAT This is the number of times the SURGE/SAG transient event
will repeat before it will proceed to the next event or exit the
transient program. Note that the number of times the transient
event is generated is equal to the REPEAT + 1. Leave this
value at zero if only one execution of this event in the list is
required.
EVENT # This must be the last item in the transient edit screen. All data
fields must be entered before inserting the EVENT #. The
EVENT # takes a value from 1 to 99. The EVENT # defines the
order of execution of the transient events in a multiple event
transient. It is a good practice to enter spaced EVENT #’s to
allow insertion of an EVENT later if needed. (For example,
space them by 5.) Entry of a sequence EVENT # number will
cause the display to return to the TRANSIENT screen.
CSW Series 65
Page 66

User Manual California Instruments
3.11.6.2 VOLTAGE SWEEP/STEP sub menu
Figure 3-19: VOLTAGE SWEEP/STEP SETUP screen
The Voltage sweep and step screen shown in Figure 3-19 can be reached from the transient
screen as follows:
1. Scroll to the VOLT SWEEP/STEP entry using the up and down keys.
2. Press the ENTER key to bring up the VOLTAGE SWEEP/STEP screen.
The VOLTAGE SWEEP/STEP screen has several data fields. All data fields that are blank to the
right of the equal sign must be filled or an error message will occur when trying to leave this
screen. The EVENT # is the last data field to be filled. Entering the event data field will cause
the display to return to the TRANSIENT screen where a new selection can be made.
The VOLTAGE SWEEP/STEP screen has the following fields:
START This field will show the start phase angle of the voltage
transient in degrees. Only one start phase angle per transient
sequence is allowed. The start phase angle must be in the first
transient event in the list. The start phase angle is not valid for
DC transient.
END VOLT This is the output voltage level at the end of the transient event
in volts.
DUR SCALE Duration scale default is time in seconds. Use the Shuttle knob
to select CYCLES if desired. Note that durations expressed in
cycles may cause rounding errors if the period of the selected
frequency setting is not an integer number of mss. Thus, for 50
Hz applications, no rounding errors occur but for 60 Hz, the
16.66¯ ms period will cause a rounding error when converted.
The Duration scale selection affects both the DURATION and
END DELAY parameters.
DURATION Duration is the time it will take for the output voltage to reach
the END VOLT level. As such, “Duration” will define the slew
rate of the output voltage for the event. A duration of 0 seconds
will cause the output voltage to reach the end voltage
immediately. The DUR SCALE defines the time parameter
CYCLES or SECONDS
END DELAY This is the time delay the voltage level will stay at END VOLT
before it proceeds with the next transient event or completes
the transient.
FUNCTION [CSW Series only] This field can be used to select the wave
shape to be used during this step of the transient sequence.
Each step can use a different wave shape from the available
library of 50 user-defined waveforms or the three standard
waveforms. The output wave shape changes upon entry into
each step and remains in effect for the duration of the step. The
default wave shape is always the SINE (sine wave).
66 CSW Series
Page 67

User Manual California Instruments
REPEAT This is the number of times the VOLTAGE SWEEP/STEP
transient event will repeat before it will proceed to the next
event or exit the transient program. Note that the number of
times the transient event is generated is equal to the REPEAT
+ 1. Leave this value at zero if only one execution of this event
in the list is required.
EVENT # This must be the last item in the transient edit screen. All data
fields must be entered before inserting the EVENT #. The
EVENT # takes a value from 1 to 99. The EVENT # defines the
order of execution of the transient events in a multiple event
transient. It is a good practice to enter spaced EVENT #’s to
allow insertion of an EVENT later if needed. (For example,
space them by 5.) Entry of a sequence EVENT # number will
cause the display to return to the TRANSIENT screen.
CSW Series 67
Page 68

User Manual California Instruments
3.11.6.3 FREQUENCY SWEEP/STEP sub menu
Figure 3-20: FREQUENCY SWEEP/STEP SETUP screen
The Voltage sweep and step screen shown in Figure 3-20 can be reached from the transient
screen as follows:
1. Scroll to the FREQ SWEEP/STEP entry using the up and down cursor keys.
2. Press the ENTER key to bring up the FREQ SWEEP/STEP screen.
The FREQ SWEEP/STEP screen has several data fields. All data fields that are blank to the
right of the equal sign must be filled or an error message will occur when trying to leave this
screen. The EVENT # is the last data field to be filled. Entering the event data field will cause
the display to return to the TRANSIENT screen where a new selection can be made.
The FREQ SWEEP/STEP screen has the following fields:
DURATION Duration is amount of the time the output frequency will take to
reach the END FREQ level. Duration will define the slew rate of
the output frequency for the event. A duration of 0 seconds will
cause the output frequency to reach the end frequency
immediately.
END FREQ This is the output frequency at the end of the transient event in
Hz.
END DELAY This is the time delay the frequency will stay at END FREQ
before it proceeds with the next transient event or completes
the transient.
FUNCTION This field can be used to select the waveshape to be used
during this step of the transient sequence. Each step can use a
different waveshape from the available library of 50 user
defined waveforms or the three standard waveforms. The
output waveshape changes upon entry into each step and
remains in effect for the duration of the step. The default
waveshape is always the SINE (sinewave).
REPEAT This is the number of times the FREQUENCY SWEEP/STEP
transient will repeat before it will proceed to the next event or
exit the transient. The number of times the transient event is
generated is equal to the REPEAT + 1. Leave this value at zero
if only one execution of this event in the list is required.
EVENT # This must be the last item in the transient edit screen. All data
fields must be entered before inserting the EVENT #. The
EVENT # takes value from 1 to 99. The EVENT # defines the
order of execution of the transient events in a multiple event
transient. It is a good practice to enter spaced EVENT #’s to
allow insertion of an EVENT later if needed. (For example,
space them by 5.) Entry of a sequence EVENT # number will
cause the display to return to the TRANSIENT screen.
68 CSW Series
Page 69

User Manual California Instruments
3.11.6.4 VOLTAGE/FREQUENCY SWEEP/STEP sub menu
Figure 3-21: VOLTAGE/FREQUENCY SWEEP/STEP SETUP screen
The Volt/freq sweep/step screen shown in Figure 3-21 can be reached from the transient screen
as follows:
1. Scroll to the VOLT/FREQ SWEEP/STEP entry using the up and down cursor keys.
2. Press the ENTER key to bring up the VOLT/FREQ SWEEP/STEP screen.
The VOLT/FREQ SWEEP/STEP screen has several data fields. All data fields that are blank to
the right of the equal sign must be filled or an error message will occur when trying to leave this
screen. The EVENT # is the last data field to be filled. Entering the event data field will cause
the display to return to the TRANSIENT screen where a new selection can be made.
The VOLT/FREQ SWEEP/STEP screen has the following fields:
DURATION Duration is the amount of time the output voltage and frequency
will take to reach the END FREQ and END VOLT levels.
Duration will define the slew rate of the output voltage and
frequency for the event. A duration of 0 seconds will cause the
output voltage and frequency to reach their end value
immediately.
END FREQ This is the output frequency at the end of the transient event in
Hz.
END VOLT This is the output voltage at the end of the transient event in
volts.
END DELAY This is the time delay the output frequency and voltage will stay
at END FREQ and END VOLT before proceeding with the next
transient event or completing the transient.
FUNCTION This field can be used to select the wave shape to be used
during this step of the transient sequence. Each step can use a
different wave shape from the available library of 50 user
defined waveforms or the three standard waveforms. The
output wave shape changes upon entry into each step and
remains in effect for the duration of the step. The default wave
shape is always the SINE (sine wave).
REPEAT This is the number of times the VOLTAGE/FREQUENCY
SWEEP/STEP transient will repeat before it will proceed to the
next event or exit the transient. The number of times the
transient event is generated is equal to the REPEAT + 1. Leave
this value at zero if only one execution of this event in the list is
required.
CSW Series 69
Page 70

User Manual California Instruments
EVENT # This must be the last item in the transient edit screen. All data
fields must be entered before inserting the EVENT #. The
EVENT # takes value from 1 to 99. The EVENT # defines the
order of execution of the transient events in a multiple event
transient. It is a good practice to enter spaced EVENT #’s to
allow insertion of an EVENT later if needed. (For example,
space them by 5.) Entry of a sequence EVENT # number will
cause the display to return to the TRANSIENT screen.
3.11.6.5 START/VIEW TRANSIENT SEQUENCE sub menu
Figure 3-22: START/VIEW TRANSIENT SEQUENCE screen
The START/VIEW TRANSIENT SEQUENCE screen is used to control transient execution. It
also provides an overview of available transient list events. This list appears in the order they
were assigned event numbers. Editing an existing event can be accomplished from this screen
by positioning the cursor on the event to be edited and pressing the ENTER key. This method
can also be used to review the parameters of a previously entered event.
The START/VIEW TRANSIENT SEQUENCE screen has the following fields:
START / ABORT The START field is used to start a transient execution. When
the cursor is positioned on the START field and the ENTER key
is pressed, transient execution starts. The output relay must be
closed or an error message will appear and the transient will
not start.
Once a transient is in progress, this field changes to ABORT
and can be used to abort a transient in progress. If the transient
completes execution, the field reverts back to START.
PAUSE / RESUME The PAUSE field may be used to suspend execution of a
transient list in progress. If the cursor is on the PAUSE field and
the ENTER key is pressed, the transient is suspended and this
field changes to RESUME. Pressing the ENTER key again will
cause the transient list to resume execution from the point
where it was suspended.
REPEAT # This field determines the number of times a transient list is
repeated. The default value is zero, which means the
programmed list runs only once. The range for this field is from
0 through 99999. This repeat function should not be confused
with the REPEAT function available for individual events. The
event specific repeat value will cause only that event to be
repeated, not the entire list.
CLEAR SEQ Moving the cursor to this field and pressing the ENTER key will
cause the entire programmed transient list to be erased. Be
careful not to press ENTER accidentally while on this field as
you will loose the programmed transient list. Note that a list
may be stored as part of the front panel setup in the nonvolatile
memory registers.
70 CSW Series
Page 71

User Manual California Instruments
3.11.7 WAVEFORMS Menu
Figure 3-23: WAVEFORMS menu
The WAVEFORMS menu allows selection of the wave shape for each phase individually or all
phases at once. For three phase operation the mode is determined by the phase coupling. If
only a single phase is selected in the top right corner of the display (øA, øB or øC), the selected
wave shape will be applied to that phase. If all phases are selected (phase coupling), the
selected waveform will apply to all three phases.
For single-phase versions of the CSW Series, the phase coupling is always set to phase A, so
pressing the PHASE button has no effect.
The following fields are available in the WAVEFORMS menu:
CLIP LEVEL This parameter determines the amount of total harmonic
distortion of the built-in CLIPPED sine wave waveform. The
range is 0 % through 20 % THD.
Note that changing the distortion level of the CLIPPED sine
wave while the CLIPPED sinewave is used on the output of one
or more phases, forces the output of the AC Source to be
dropped momentarily. To avoid this, make sure none of the
phases is using the CLIPPED sinewave function when
changing the clip level.
GROUP The group field displays the currently selected waveform group.
The CSW Series provides four groups of 50 user defined
waveforms each for a total of 200 waveforms. Only one group
can be active at a time however. This field only displays the
selected waveform group. It cannot be used to change the
actual group selected. Group selection must occur at power up
and is done from the INITIAL SETUP 3 screen. See section
3.11.11.3 for details.
MODE The mode field determines the operation mode of the
WAVEFORMS display screen. Available options for this field
are:
PROG: This mode is used to change the programmed
wave shape function on the selected phase. This is also the
default mode of operation.
VIEW(T): This mode can be used to display any of the
available user defined waveforms in a time domain display.
Previewing a waveform can be useful if you are unsure about
the nature of the waveform that was stored.
CSW Series 71
Page 72

User Manual California Instruments
VIEW(F): This mode can be used to display any of the
available user defined waveforms in a frequency domain
display. Waveform data is shown by harmonic amplitude and
phase relative to the fundamental frequency. Previewing a
waveform can be useful if you are unsure about the nature of
the waveform that was stored.
SINE The SINE is a standard waveform that is always available. It
does not consume any of the user defined waveform registers
and is always displayed in the waveform list. A right arrow
indicates the waveform is presently selected for the phase. If
the cursor is moved to this field, the ENTER key will execute
the selected MODE. If the mode is set to PROG, pressing
ENTER while the cursor is on the SINE entry will select the sine
wave for the phase shown in the top right corner of the display.
Note that the VIEW modes are not available for any of the three
standard waveforms.
SQUARE The SQUARE is a standard waveform that is always available.
It does not consume any of the user defined waveform registers
and is always displayed in the waveform list. A right arrow
indicates the waveform is presently selected for the phase. If
the cursor is moved to this field, the ENTER key will execute
the selected MODE. If the mode is set to PROG, pressing
ENTER while the cursor is on the SQUARE entry will select the
square wave for the phase shown in the top right corner of the
display.
Note that the VIEW modes are not available for any of the three
standard waveforms.
CLIPPED The CLIPPED is a standard waveform that is always available.
It does not consume any of the user defined waveform registers
and is always displayed in the waveform list. A right arrow
indicates the waveform is presently selected for the phase. If
the cursor is moved to this field, the ENTER key will execute
the selected MODE. If the mode is set to PROG, pressing
ENTER while the cursor is on the CLIPPED entry will select the
clipped sine wave for the phase shown in the top right corner of
the display. The amount of clipping is determined by the CLIP
LEVEL field.
Note that the VIEW modes are not available for any of the three
standard waveforms.
USER DEFINED A list of user defined waveforms appears immediately below the
three standard waveforms. If no user-defined waveforms were
downloaded to the CSW Series AC source, this list will be
blank. User defined waveforms can be given a symbolic name
of up to twelve characters. The use of any of the three standard
waveform names (SINE, SQUARE and CLIPPED) should be
avoided, as it will be rejected by the CSW controller.
72 CSW Series
Page 73

User Manual California Instruments
A right arrow indicates the waveform is presently selected for
the phase. If the cursor is moved to this field, the ENTER key
will execute the selected MODE. If the mode is set to PROG,
pressing ENTER while the cursor is on the user defined entry
will select the custom waveform for the phase shown in the top
right corner of the display.
If the MODE is set to either VIEW option, the waveform data
under the cursor will be displayed when the ENTER key is
pressed. Press the ENTER key again to return to the
WAVEFORMS menu.
3.11.8 ADVANCE MEAS. Menu
This entry in the MENU 2 screen displays the HARMONICS/TRACE ANALYSIS screen which is
covered in section 4.6. This field can be used in lieu of the MEAS key to directly bring up the
advanced measurements screens.
3.11.9 APPLICATIONS Menu
Figure 3-24: APPLICATIONS menu
The APPLICATIONS menu provides access to the optional application specific pre-programmed
test sequences. Since these test sequences are optional, this menu may have no choices if
none of the options are installed. The following entries may be found in the APPLICATIONS
menu:
Entry Description
MIL-STD 704 Test sequence for MIL standard 704 AC and DC tests.
RTCA/DO-160 Test sequence for RTCA DO160 commercial aviation AC and
DC tests.
IEC-1000-4-11 Test sequences for IEC 1000-4-11 Voltage Dips and Variations
test standard.
IEC-1000-4-13 Test sequence for IEC 1000-4-13 Harmonics and Inter
harmonics test standard.
WH METER Watt Hour meter measurement option. Tracks energy usage
over a period of time and calculates Watt Hours used.
CSW Series 73
Page 74

User Manual California Instruments
3.11.10 SETUP REGISTERS Menu
Figure 3-25: SETUP REGISTERS menu
The SETUP REGISTERS menu allows the user to store and recall complete instrument setups,
including transient program lists. A total of 16 non-volatile setup registers is available, numbered
sequentially from 0 through 15.
The following entries can be found in the SETUP REGISTERS menu:
Entry Description
SAVE REGISTER Save present instrument setup to a register number selected by
the user. The numeric data entry keypad should be used to
enter a number between 0 and 15. Once the ENTER key is
pressed, all settings are saved. A message will appear at the
bottom of the screen to confirm the save operation.
RECALL REGISTER Recall instrument setup from a register number selected by the
user. The numeric data entry keypad should be used to enter a
number between 0 and 15. Once the ENTER key is pressed,
all settings are recalled. A message will appear at the bottom
of the screen to confirm the recall operation.
VIEW/EDIT REGISTER The View/Edit entry can be used to display the contents of a
setup register before it is recalled. After the user enters a
register number to view or edit and presses the ENTER key,
the PROGRAM screen will appear. All parameters that will be
changed by recalling the register will be blinking. If ENTER is
pressed again, the register will be recalled and the new values
take effect. To edit the register content, change all parameters
that need to be changed. Pressing ENTER will save the new
values and make them active.
74 CSW Series
Page 75

User Manual California Instruments
3.11.11 UTILITY Menus
Figure 3-26: UTILITY menus
The UTILITY menus provide access to less frequently used setup items. There is no connection
between the various entries in the UTILITY menu other than there is no other logical place to put
them. The following entries can be found in the UTILITY menu:
Entry Description
UTILITY 1
GPIB/RS232 SETUP This entry provides access to the setup parameters for either
the IEEE-488, RS232C, USB or LAN interface. All parameters
are saved in non-volatile memory so there is rarely a need to
change these values.
VOLT/CURR CONTROL The voltage and current control menu can be used to select the
voltage range pair, the current limit method, the voltage sense
source, and the number of output phases.
The standard available voltage range pairs are 156 and 312
volts in all modes, AC or DC.
The two current limit choices are Constant Voltage and
Constant Current. Constant Voltage mode will maintain the set
voltage at the output until the load current exceeds the current
limit setting at which time the voltage will be dropped to zero.
This effectively shuts off the AC source output in case of an
overload condition. This mode has user programmable trip
delay which is located in the same menu.
Constant Current mode will maintain the load current at the
maximum level set by the current limit value, even if the
maximum power level is exceeded. This is done by reducing
the voltage as needed. As such, the voltage will be reduced
from the set level down to zero depending on the load
requirement. This mode is useful for starting up motor or
capacitor loads that may require a high inrush current. This
mode also has a user programmable trip delay.
Voltage Reference (VOLT REF) will select between the internal
programming reference (INT) an external reference (EXT) or an
external gain control (RPV) . The EXT mode will allow an
external signal from 0 to 5.0 Vrms to program an output voltage
from 0 to full-scale. The RPV mode will allow a DC input from 0
to 7.07 VDC to control the programmed output waveform from 0
to the full-scale output voltage.
The number of outputs in a single power source system with
can be switched between 5550 VA in the single phase mode or
1850 VA per phase in the three phase mode. In the 1-phase
mode the B and C outputs must be manually connected to the
Phase A output. These connections must be removed in the 3phase mode.
CSW Series 75
Page 76
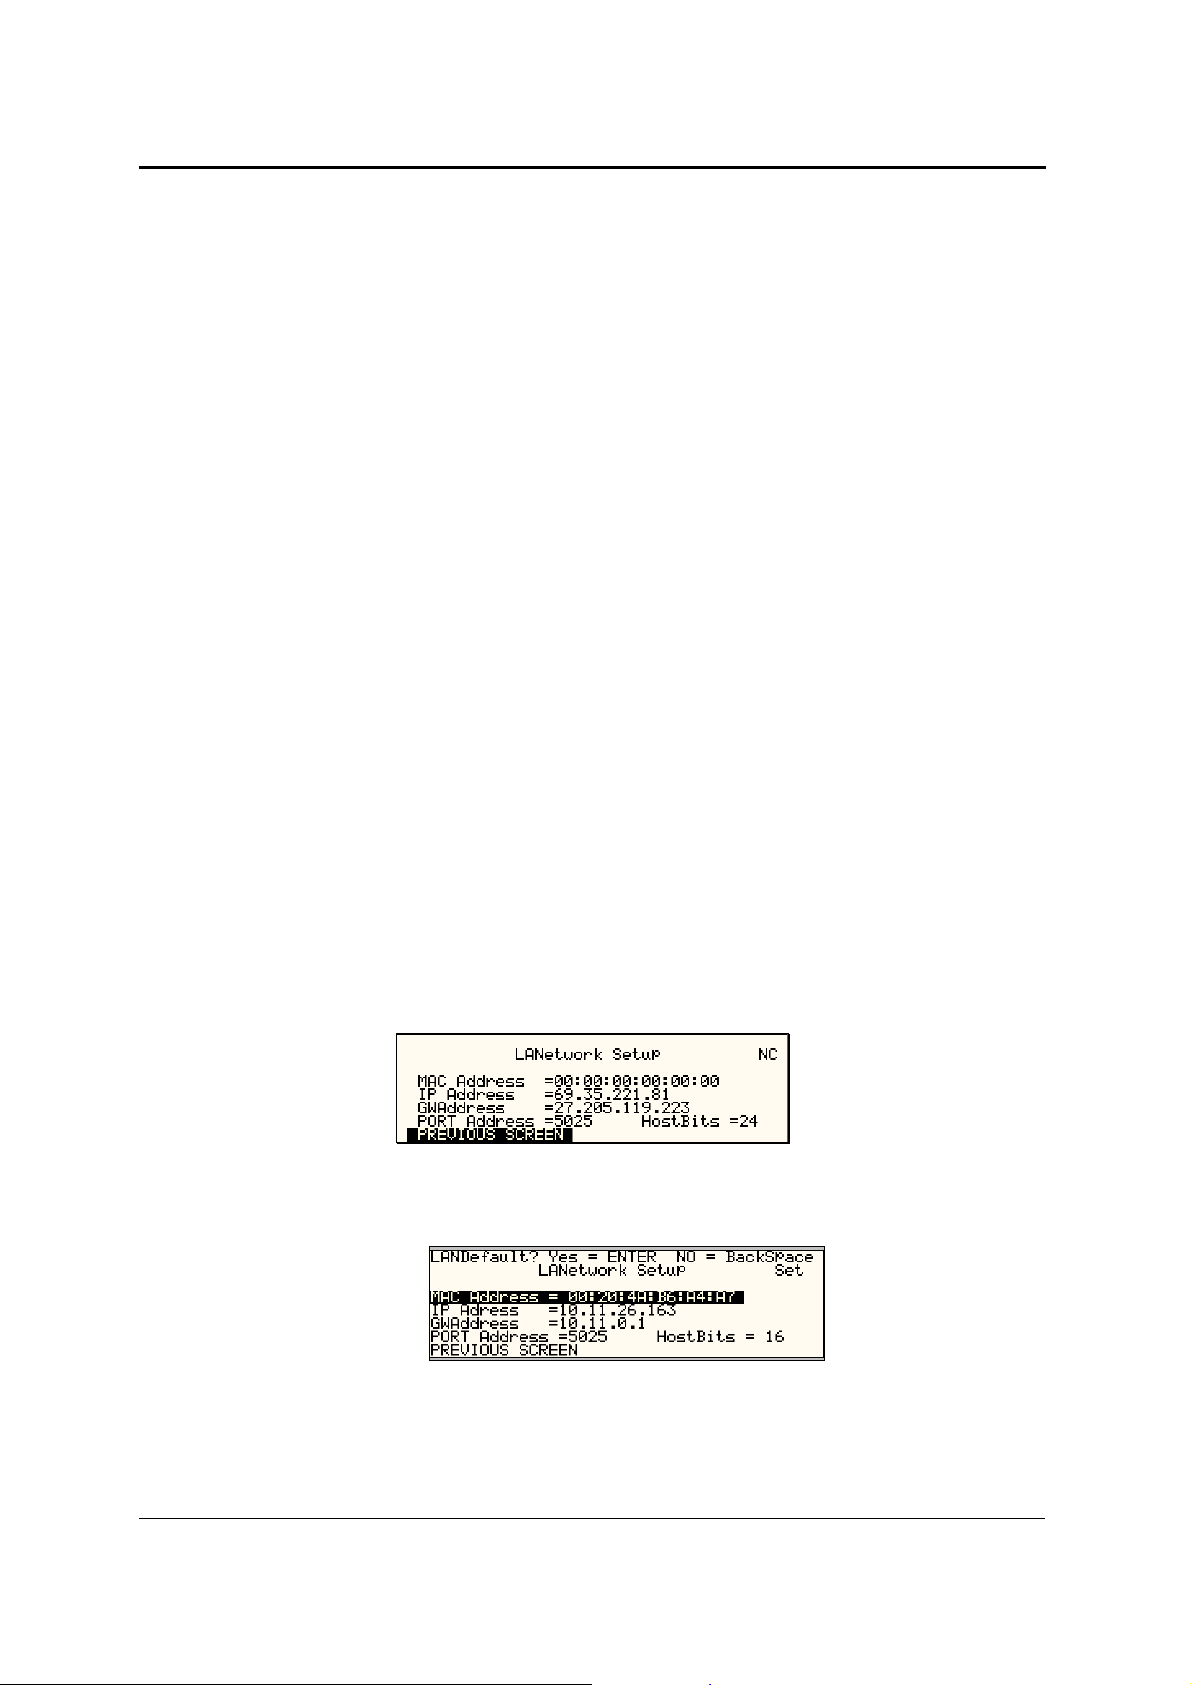
User Manual California Instruments
INITIAL SETUP The initial setup menu can be used to determine the AC source
settings at power up. CAUTION: The initial setup can be used
to power up the AC source with the output on and a high
voltage present at the output. For normal situations, this is not
recommended due to the potential danger to operators. It is
recommended that the initial voltage be set low and/or the
output relay be programmed to OFF for most situations.
LIMIT SETUP The Limit menu shows the frequency, voltage and current limit
capabilities of the AC source. Any attempt to program the
output beyond these limits will result in a “-222 Data Out of
Range error”. Note that these limits are hardware determined
and cannot be changed by the user. They are shown for
reference only.
UTILITY 2
CONFIGURATION The Configuration menu shows the installed options. This
screen is for reference only and no fields can be changed by
the user.
LANETWORK SETUP Displays or sets LAN interface settings. If the LAN option is
present, this screen may be used to view or change LAN
parameters. The MAC address is fixed and cannot be changed.
IP and Gateway addresses are normally assigned by the
network DCHP server. Changes to the other fields can be made
by pressing the SET button first. The indicator in the top right
hand of the screen will change from “NC” to “SET”. Note that
any setting changes made won’t take effect till after the unit has
been powered down and back up.
To set the LAN interface to AUTO IP mode, set the IP and
Gateway address to all zeros. This will cause the IP to be
requested from the network the next time power is cycled. To
manually set the IP and Gateway address, enter the address
from the keypad.
The Port address is normally set to 5025. The number of host
bits is a function of the network address range.
To rest the LAN to its default configuration, select the MAC
Address and press the SET key followed by ENTER key.
Confirm with the ENTER key.
76 CSW Series
Page 77

User Manual California Instruments
ELAPSED TIME The elapsed time screen, when selected from
the UTILITY menu, will appear for about 3 seconds. The
elapsed time shown is the cumulative amount of time the power
source has been on from its initial build. This value is read only
and cannot be changed by the user.
The same screen also displays the internal AC source ambient
temperature in degrees C.
VIEWING ANGLE The viewing angle can be used to change the contrast ratio of
the LCD display. The range of the viewing angle parameter is
from -10 to +10. Setting the right viewing angle is matter of
personal taste. Set this parameter to a value that is most
comfortable for the user.
LANGUAGE The following choices for this field are: SCPI; The standard bus
syntax for the CSW5550, SW SCPI; The bus syntax to match
the Elgar SW5550 or SW5250.
CSW Series 77
Page 78

User Manual California Instruments
3.11.11.1 GPIB/RS232 (incl. USB/LAN) SETUP menu
Figure 3-27: GPIB/RS232 SETUP menu
The GPIB/RS232 SETUP menu may be used to change the interface parameter settings for
both the IEEE-488 interface and the RS232, USB or LAN serial interface. The number of
interfaces available will depend on the specific model and options as well as the time of
manufacture. CSW models can be equipped with as many as 4 different interfaces although only
one can be used at the same time.
Refer to the CSW Series Programming Manual M162084-03 distributed in Adobe PDF format on
the same CD ROM as this user manual for more details on using the RS232, USB or LAN
interface.
The following parameters can be set from this menu:
GPIB ADDRESS Sets the IEEE-488 address used by the AC source. The
address value can be set from 0 through 31. Address 0 is often
reserved for the IEEE-488 controller. The factory setting is
address 1. Once changed, the IEEE-488 address is retained in
nonvolatile memory.
RS232 BAUDRATE This field can be used to set the RS232 baud rate to either
9600, 19,200, 38,400, 57600 or 115,200 baud. The baud rate
set on the AC source must match the one programmed for the
communications port of the controller. Baud rates higher than
115200 are provided for the USB and LAN interface modes
only. The same setting is used for USB and LAN modes. For
use with either USB or LAN, the baud rate in this screen must
be set to 460800. See UTILITY 2 screen for other LAN setup
parameters.
RS232 DATA This field is used to set the number of data bits to either 7 or 8.
Factory setting is 8 bits. This value must match the number of
data bits set on the communications port of the controller.
RS232 PARITY This field is used to set the parity. Available options are Even
(E), Odd (O) or no parity (N). Factory setting is No parity. This
value must match the parity set on the communications port of
the controller. For USB or LAN use, always use factory settings.
RS232 STPBITS This field is used to set the number of stop bits used on the
serial port. Available options are 1 or 2 bits. Factory setting is 1
stop bit. This value must match the parity set on the
communications port of the controller. For USB or LAN use,
always use factory settings.
The number of start bits is always fixed to 1 bit.
78 CSW Series
Page 79

User Manual California Instruments
3.11.11.2 VOLTAGE/CURRENT CONTROL SETUP menu
Figure 3-28: VOLTAGE/CURRENT CONTROL SETUP menu
The VOLTAGE/CURRENT CONTROL SETUP menu may be used to set output voltage and
current control parameters. These parameters are not frequently changed in the normal
operation of the AC source and are thus located on the UTILITY rather than the PROGRAM
menu.
The following options are available in this menu:
ALC MODE Automatic Level Control of programmed output voltage. This
mode will use the internal voltage measurements to adjust the
output voltage continuously as needed. This effectively
increases the output accuracy and regulation beyond what is
possible with ALC off.
There are three settings for the ALC mode, ON, REG and OFF.
ON: If ALC is ON, any event or load condition that prevents
the power source from regulating the programmed voltage will
cause it to trip the output off and generate a –801, “Output
Voltage Fault”. There may be situations where it is desirable to
continue driving the load even if the programmed voltage
cannot be maintained.
REG: In the REG (Regulate) mode ALC will regulate the
output but not trip the output if for some reason it can’t.
OFF: If the ALC is set OFF, no additional regulation is
performed by the controller other than the hardware control
loop.
Note that if the current limit mode is set to CC (Constant
Current) and the ALC is ON, the output will not trip off if the
load current is at the programmed current limit forcing the unit
into the cc operating mode which requires the voltage to be
reduced from the set value.
OL MODE This field is used to select constant current (CC) or constant
voltage (CV) mode. The constant current mode will limit the
maximum amount of current drawn by the load to the set value.
The voltage will be reduced as needed after the trip delay time
to maintain the level of programmed current.
The constant voltage mode will maintain the set voltage as long
as the current drawn by the load does not exceed the current
limit programmed. If the current limit is exceeded, the output will
be shut off after the trip delay time.
TRIP DELAY The trip delay field may be used to set the amount of time to
hold off the current limit trip point. The minimum amount of time
is 100 ms or 0.1 sec. The maximum amount of time is 5.00
sec.
CSW Series 79
Page 80

User Manual California Instruments
VOLT REF The three program options are INT, EXT and RPV. The INT is
selected for the normal internal reference for program voltage
and frequency. EXT is selected to enable the external signal
input. The signal input can be any waveform from 0 to 5.00
Vrms for a 0 to full-scale Vrms output. The RPV mode is the
external gain control. A 0 to 7.07 VDC input will control the
programmed output waveform from 0 to full-scale Vrms.
NO. OUTPUT This allows the number of output phases to be toggled between
single and three-phase mode. In single-phase mode, all power
from all three outputs is in phase. The three outputs must be
wired together. All programming is for the Phase A function in
the 1-phase mode.
3.11.11.3 INITIAL SETUP menu
Figure 3-29: INITIAL SETUP menus
Any time the AC source is powered up, the output will reflect the values stored as the INITIAL
setup values. This allows the unit to be powered up in a known state at all times. The INITIAL
values can be set in the INITIAL SETUP menus.
The initial setup can be used to power up the AC source with the output on and a high voltage
present at the output. For normal situations, this is not recommended due to the potential
danger to the operator. It is recommended that the initial voltage be set low and/or the output
relay be programmed to OFF for most situations.
The following fields are provided in the INITIAL SETUP menus:
Entry Description
INITIAL SETUP 1
VOLTAGE Sets the power-on AC voltage for AC and AC+DC modes or the
DC voltage for DC mode.
CURR LIMIT Sets the power-on current limit value.
FREQ Sets the power-on frequency value.
PHASE Sets the power-on frequency for phase A with respect to an
external sync signal. If the internal oscillator is used (default)
this setting has no effect.
INITIAL SETUP 2
VOLT RANGE Sets the power-on voltage range value. The available choices
are determined by the VOLT PAIR selected in the
VOLTAGE/CURRENT CONTROL SETUP menu.
80 CSW Series
Page 81

User Manual California Instruments
VOLT MODE Sets the power-on voltage mode. Available settings are AC
mode, DC mode or AC+DC mode.
OL MODE Sets the power-on overload mode. Available settings are
Constant Current (CC) or Constant Voltage (CV) mode.
OUTPUT RELAY Sets the power-on state of the output relay. Available settings
are ON or OFF.
INITIAL SETUP 3
VOLT REF Sets the power-on state of the voltage sense mode. Available
settings are Internal (INT) or Remote program voltage(RPV) or
External EXT.
WAVE GROUP Sets the user defined waveform group that will be loaded at
power on. Available groups are 0, 1, 2 and 3. Each group can
contain up to 50 user-defined waveforms. A waveform group
can only be loaded at power up. To change groups, you must
change this field to the desired new group and cycle the power
to the AC source or issue a *RST command over one bus.
CLOCK MODE Sets the clock source used at power up. Available settings are
Stand Alone (STAND), MASTER, and SLAVE.
NO. OUTPUT Sets the phase mode at power up. Available options are single
phase mode (ONE), three phase mode (THREE) or last used
phase mode (LAST).
VOLT ALC Determines ALC mode at power on. The ALC mode adjusts the
output voltage based on internal voltage measurement system
and provides enhanced output regulation and accuracy.
Available settings are ON, OFF or REG.
3.11.11.4 LIMIT SETUP screen
The limit setup screen is not a menu but only serves to inform the user of the hardware
capabilities of the AC source. The cursor can be moved to any of the fields in this screen but
none of these fields can be changed. The following information is provided on this screen:
Entry Description
VOLTAGE Maximum AC rms or DC voltage available in the low voltage
CUR LIMIT Maximum AC rms current limit available in the low voltage
FREQ LO Lowest possible fundamental frequency that can be
FREQ HI Highest possible fundamental frequency that can be
Figure 3-30:LIMIT SETUP menu
range.
range which is the sum of the currents for all three phases. It is
also the maximum current in the 1-phase mode.
programmed.
programmed.
CSW Series 81
Page 82

User Manual California Instruments
PHASE C Phase angle of phase C with respect to phase A in three phase
mode. If the AC source is a single phase model, this field will
shown 0°. If the AC source is a split phase model, this field will
shown 180°.
3.11.11.5 CONFIGURATION SETUP screens
Figure 3-31: CONFIGURATION SETUP Menus
The configuration setup screen is not a menu but only serves to inform the user of the software
options installed in the AC source. The cursor can be moved to any of the fields in this screen
but none of these fields can be changed. The following information is provided on this screen:
Entry Description
CONFIGURATION SETUP 1
NO. OUTPUT Displays the phase mode option. SELECT indicates the phase
mode option is installed and the user can select between single
and three phase modes of operation.
FIXED indicates the phase mode option is not installed and
only single phase or three phase mode of operation is possible.
ADVANCE This field indicates the presence of advanced capabilities for
waveform generation and measurement analysis are present.
DO160 Indicates the presence of the RTCA DO160 test option. If this
option is installed, this field will show ON. If this option is not
installed, this field will show N/A (not available).
MIL704 Indicates the presence of the MIL/STD-704 Revision D and E
test option. If this option is installed, this field will show ON. If
this option is not installed, this field will show N/A (not
available).
CONFIGURATION SETUP 2
IEC 4-11 Indicates the presence of the IEC 61000-4-11 test option. If this
option is installed, this field will show ON. If this option is not
installed, this field will show N/A (not available).
IEC 4-13 Indicates the presence of the IEC 61000-4-13 test option. If this
option is installed, this field will show ON. If this option is not
installed, this field will show N/A (not available).
CLOCK/LOCK Indicates the presence of the -LKS clock and lock auxiliary
option. For units without -LKS, this field is set to N/A. For units
with the -LKS option installed, this field is set to ON. Note that
master unit (with -LKM) also has this field set to N/A.
WH METER Indicates the presence of the Watt Hour Meter option.
82 CSW Series
Page 83

User Manual California Instruments
CONFIGURATION SETUP 3
MS704 Indicates the presence of the MIL/STD-704 Revision A through
F test option. If this option is installed, this field will show ON. If
this option is not installed, this field will show N/A (not
available). This field is available on Series II i/CSW systems
only.
ABD Indicates the presence of the ABD0100.1.8 test option. If this
option is installed, this field will show ON. If this option is not
installed, this field will show N/A (not available).
LF Indicates the presence of the Low Frequency limit option. If this
option is set, the maximum frequency that can be programmed
is 500 Hz.
SYSTEM This field sets the controller for the correct multi box system
model configuration.
If this field is set incorrectly, the current limit scaling and current
measurement will be off by a factor of three. This field is
protected and cannot be changed unless the optional MB
configuration has been enabled.
NOTE: Options –A350, AMD24 and –B787 are only visible using the *OPT? bus command. Refer to
CONFIGURATION SETUP 4 screen.
CONFIGURATION SETUP 4
Note that the fourth configuration screen is only available on models with firmware revision 4.60
or higher. For units with older models, refer to the CONFIGURATION SETUP 3 screen.
MB This configuration parameter does not exist in the CSW series.
MANUAL This configuration parameter does not exist in the CSW series.
OPT0, OPT1, OPT2 This field indicates the presence of the following three options:
OPT0 = A350 Avionics option (-A350)
OPT1 = AMD24 Avionics option (-AMD)
OPT2 = B787 Avionics option (-B787)
The scroll through the three available OPTn fields, use the
shuttle. ON indicates the option is present, N/A indicates the
option is not installed.
LAN This field indicates the presence of the LAN Ethernet interface
option. ON indicates the option is present, N/A indicates the
option is not installed.
CSW Series 83
Page 84

User Manual California Instruments
3.11.12
3.11.13 MEASUREMENT CAL FACTORS Menu
Figure 3-32: MEASUREMENT CAL FACTORS menu
The MEASUREMENT CAL FACTORS menu provides access to the measurement calibration
parameters. The parameters shown are for the mode of operation (AC or DC) selected. The
PHASE key must be used to toggle between the calibration screens for each of the three
phases. These parameters are password protected and can only be changed after the
calibration password has been entered. Refer to the calibration section in this manual for details
on performing a calibration.
The following calibration factors are available from this menu:
Entry Description
VOLT FS Full scale voltage measurement calibration factor. AC or DC
mode.
CURR FS Full scale current measurement calibration factor. AC or DC
3.11.14 OUTPUT CAL FACTORS Menu
Figure 3-33: OUTPUT CAL FACTORS menu
The OUTPUT CAL FACTORS menu provides access to the output calibration parameters.
These parameters are password protected and can only be changed after the calibration
password has been entered. For three phase configurations, the PHASE keys toggle between
the three calibration screens for each phase. Refer to the calibration section in this manual for
details on performing a calibration.
The following calibration factors are available from this menu:
Entry Description
VOLT FS Full scale voltage output calibration factor.
V HI-FREQ High frequency full-scale voltage output calibration factor.
VOLT ZERO Zero offset voltage calibration factor.
PHASE OFST Phase offset calibration factor. Compensates for phase shift
mode.
caused by AC amplifier.
84 CSW Series
Page 85

User Manual California Instruments
3.11.15 EXTERNAL CAL FACTORS menu
Figure 4-28: External Calibration Factors menu
The EXTERNAL CALIBRATION menu provides access to the external input calibration
parameters. These parameters are password protected and can only be changed after the
calibration password has been entered. The PHASE key toggles between the calibration
screens for each of the three phase. Refer to the calibration section in this manual for details on
performing a calibration.
The following calibration factors are available from this menu:
Entry Description
FS OUT This value is set from 0 to 4095. It will set the External gain with the
ALC OFF. The external signal input must be set to the either 5.00
Vac in the EXT mode or +7.07 VDC in the RPV mode while the value
is adjusted for either 156 or 312 volts.
FS ADC This value is to calibrate the converter used for the external input.
With the External signal set to either 5.00 Vac in the EXT mode or
7.07 Vdc in the RPV mode the value should be programmed for 312
in the high voltage range.
ZERO DC This value is to calibrate the External Reference with the relays open.
It should be done before FS ADC and ZERO RMS. Enter the value of
zero with the relays open and press the ENTER key.
ZERO RMS N.A.
CSW Series 85
Page 86

User Manual California Instruments
3.12 Output Programming
3.12.1 Set the Output
Output parameters are all set from the PROGRAM screen.
1. Use the MENU key and select the PROGRAM entry.
2. Press the ENTER key to bring up the PROGRAM menu.
or
2. Use the PROG key to directly bring up the PROGRAM menu.
There are two methods for programming output parameters:
IMMEDIATE mode
SET mode
3.12.2 Slewing Output Values with the Knob in IMMEDIATE Mode
The default mode of operation is an immediate mode in which changes to output parameters
made with the knob or the entry keypad are immediately reflected at the output.
To change the output voltage:
1. Place the cursor on the VOLTAGE entry
2. Rotate the knob clockwise to increase the value, counterclockwise to decrease the value
These changes take effect immediately.
To change the output frequency:
1. Place the cursor on the FREQ entry
2. Rotate the knob clockwise to increase the value, counterclockwise to decrease the value
These changes take effect immediately.
3.12.3 Change Output Values with the Knob in SET Mode
Counter
Clock
wise
Counter
Clock
wise
Clock
wise
Clock
wise
INCRDECR
INCRDECR
The SET mode of operation is a mode in which changes to output parameters made with the
knob or the entry keypad do not affect the output until the ENTER key is pressed. The AC
source is put in this SET mode by pressing the SET key.
86 CSW Series
Page 87

User Manual California Instruments
To change the output voltage:
Counter
Clock
wise
Clock
wise
INCRDECR
1. Press the SET key
2. Place the cursor on the VOLTAGE entry
3. Rotate the knob clockwise to increase the value, counterclockwise to decrease the value
4. The VOLTAGE field will be blinking to indicate a change in settings but the output remains
unchanged.
5. Place the cursor on the FREQ entry
6. Rotate the knob clockwise to increase the value, counterclockwise to decrease the value
7. The FREQ field will be blinking to indicate a change in settings but the output remains
unchanged.
8. Press the ENTER key.
Both new voltage and frequency output values are now present at the output. The unit has
returned to immediate mode of operation until the SET key is pressed again.
CSW Series 87
Page 88

User Manual California Instruments
3.13 Waveform Management
The CSW Series employs independent arbitrary waveform generators for each phase. This
allows the user to create custom waveforms. In addition, the CSW offers three standard
waveforms that are always available. This chapter covers issues that relate to defining,
downloading and managing custom waveforms.
3.13.1 Standard Waveforms
For many AC applications, a sine wave shape is used. The sine wave is one of the standard
waveforms provided on the CSW Series. The standard sine wave is always available and is the
default waveform at power-on. In addition to the sine wave, two more standard waveforms are
available, square and clipped.
Figure 3-34: Selecting a waveform
The square wave provides a high frequency content waveform with relative fast rise and fall
times. Due to AC amplifier bandwidth limitations, the frequency content of the standard square
wave has been kept within the amplifier’s capabilities. As the fundamental frequency is
increased, the relative contribution of higher harmonics is reduced.
The clipped sine wave may be used to simulate voltage distortion levels to the unit under test.
The total harmonic distortion level may be programmed in percent using the CLIP LEVEL field of
the WAVEFORMS menu. Changing the distortion level of the CLIP waveform forces the AC
source to regenerate the CLIPPED sine wave’s data points and reload the waveform register
with the newly requested data. This process requires the output to be dropped briefly. To avoid
interrupting the voltage output to the unit under test, select a different waveform such as the
standard sine wave first, change the clip level and change the waveform back to the CLIPPED
sine wave. This will avoid any output interruption.
3.13.2 Phase Selection
Figure 3-35: Selecting waveforms for single phase or all phases
Different waveforms may be selected for each phase. The number of custom waveforms from
which to select remains 50 but each phase can be assigned a different custom or standard
waveform. The specific output phase for which the wave shape is programmed is selected with
the PHASE key on the front panel. The selected phase is always shown in the top right hand
corner of the WAVEFORMS display.
To select the same wave shape for all three phases in a three phase configuration, press the
PHASE key until the øABC enunciator appears in the top right corner of the WAVEFORMS
menu. Waveform selections made in this mode will apply to all three phases.
88 CSW Series
Page 89

User Manual California Instruments
3.13.3 Creating Custom Waveforms
The CSW Series provides four groups of 50 custom defined waveforms each for a total of 200
waveforms in addition to the 3 standard waveforms. Of these four groups, one may be active at
a time. The active group is selected in the INITIAL SETUP menu.
Custom waveforms cannot be created from the front panel of the CSW Series. Rather, they
have to be downloaded through the IEEE-488 or RS232C interface. A Windows based program
is included with the CSW Series that allows waveforms to be created and downloaded easily.
This Graphical User Interface program allows waveforms to be created by specifying harmonic
amplitudes and phase angles with respect to the fundamental. It also offers an arbitrary
waveform data entry mode that allows individual data points to be specified.
Once downloaded, waveforms remain in non-volatile memory and will be visible in the
WAVEFORMS menu for selection. The user can assign a 12-character name to each custom
waveform. Avoid using any of the standard waveform names (SINE, SQUARE or CLIPPED) as
these names will not be accepted.
Waveforms may be deleted using the IEEE-488 or RS232C interface as well. Custom
waveforms cannot be deleted from the front panel however to avoid accidental erasure.
3.13.4 Waveform Groups
Waveform groups extend the number of available custom waveform to 200. Each group can
contain up to 50 user defined waveforms. Groups are numbered 0 through 3 and may be
selected from the INITIAL SETUP 3 menu. To switch waveform groups, proceed as follows:
1. Press the MENU key three times to select the MENU 3 screen.
2. Move the cursor to the UTILITY entry end press ENTER. You are now in the UTILITY 1
menu.
3. Move the cursor to the INITIAL SETUP field and press ENTER. You are now in the INITIAL
SETUP 1 menu.
4. Move the cursor to the MORE field at the end of this menu and press the ENTER key. You
are now in the INITIAL SETUP 2 menu.
Figure 3-36: Custom waveform creation with GUI program
CSW Series 89
Page 90

User Manual California Instruments
5. Move the cursor to the MORE field at the end of this menu and press the ENTER key. You
are now in the INITIAL SETUP 3 menu.
6. Move the cursor to the WAVE GROUP = field. You can now use the knob or the 0 through 3
key on the front panel to select a different waveform group.
7. Press ENTER to confirm your new selection.
8. To activate your new selection, YOU MUST CYCLE THE POWER so the AC source reinitializes. If the source is operated over the bus, a IEEE-488 Device Clear or reset
command (*RST) command will have the same effect.
The new wave group will be active after you turn the power to the unit back on.
3.13.5 RMS Amplitude Restrictions
The output of a sinewave may be programmed to the full rms value of the voltage range
selected. If the source is in the 312 V range, the maximum programmable rms voltage is 312
Volt. If a custom waveform is used however, the maximum programmable rms voltage may be
less than the maximum range value. The voltage range limit is based on the use of a sine wave
with a 1.414 crest factor. A 312 V rms sine wave has a 441 Volt peak voltage. The AC source
has a maximum peak voltage capability that is determined by the selected voltage range. If the
user selects a custom waveform with a crest factor that is higher than 1.414, the peak voltage
would exceed this maximum if the rms voltage were to be programmed at 312 V rms.
The CSW Series automatically limits the maximum allowable programmed rms voltage of a any
custom waveform by calculating the crest factor of the selected waveform and controlling the
rms limit accordingly. Thus, each custom waveform may have a different maximum rms value.
The CSW controller will prevent the user from programming the rms voltage above this limit. If a
value is entered in the PROGRAM 1 menu above this value, a “Voltage peak error” message is
generated.
Figure 3-37: Waveform crest factor affects max. rms voltage
The figure shown here illustrates the relationship between the crest factor of the wave shape (or
its “peakiness”) and the maximum peak voltage allowed for a given voltage range. Since the
peak voltage cannot exceed the AC source’s capabilities, the programmable rms voltage has to
be restricted, in this case to only 167.8785 volt for the waveform on the left. The sine wave on
the right can be programmed to the full 312 V rms as this still falls within the same peak voltage
limitation of the AC source.
If the CSW Series is used through the bus, the :VOLT? MAX query can be used to determine
the maximum allowable rms voltage for the selected waveform. Using the returned value as part
of a program will prevent range errors.
90 CSW Series
Page 91

User Manual California Instruments
3.13.6 Frequency Response Restrictions
The user may create a waveform that contains any number of harmonic frequencies of the
fundamental. The AC Source itself however has a finite signal bandwidth and will attenuate
higher frequency components of the signal. To limit the maximum frequency component of the
output signal, the CSW controller automatically applies a band-pass filter to all custom
waveforms as they are downloaded.
The controller implements the following process for user-defined waveforms:
Each down loaded waveform will have a computed frequency limit that is less than or equal the
maximum frequency limit of the AC source. The frequency limit is a function of the harmonics
content of the waveform and will follow the equation below.
Fmaxh = Fmax/(level * hn)
If Fmaxh is below the minimum frequency limit, the waveform will be rejected at down load time
and the label will be deleted from the waveform catalogue.
If the power source is used over the bus, the “:FREQ? MAX” query command can be used to
determine the maximum allowable fundamental frequency for the selected waveform. Using the
returned value as part of a program will prevent range errors.
Limits assume a program of full-scale voltage. No adjustments for voltage setting are made
below the full-scale value.
Waveform selection and frequency programming will be subject to the above limit. An error
message will be generated to reflect this type of error:
"22,Waveform harmonics limit"
Transient editing will also generate the above error during keyboard entry. Remote transient
entry will not check for the error until transient execution.
The frequency domain VIEW mode in the WAVEFORMS menu may be used to visualize the
content of each custom waveform register on the LCD.
3.13.7 Switching Waveforms
Waveforms can be switched as part of the transient system. Each transient type setup menu
has a FUNCTION field. This field allows selection of any of the standard or custom waveforms
available in the selected group. Refer to the section on transients for more details on using
transient list to switch output waveforms.
Figure 3-38: Waveform frequency domain view mode
CSW Series 91
Page 92

User Manual California Instruments
Measurement
Operating Mode
3.14 Standard Measurements
Standard measurements are always available through the MEAS key on the front panel. These
measurements are spread across two to four screens to enhance readability. Switching between
these screens can be done by successively pressing the MEAS button on the front panel. This
will cause the screen to cycle through all available measurement screens.
3.14.1 CSW Series Measurements
For CSW Series, the following four measurement screens are available:
Mode AC DC AC+DC
MEASUREMENTS 1
VOLTAGE AC rms voltage DC Voltage AC rms voltage
CURRENT AC rms current DC Current AC rms current
FREQUENCY Frequency n/a Frequency
POWER Real power Power n/a
MEASUREMENTS 2
VA POWER Apparent power power Apparent power
PEAK CURR Highest AC current
found
POWER FACT Power factor n/a Power factor
CREST FACT Crest factor n/a Crest factor
MEASUREMENTS 3
VOLT THD Voltage distortion n/a Voltage distortion
CURR THD Current distortion n/a Current distortion
INST PK CURR Instantaneous peak
current
PHASE Phase angle n/a Phase angle
Highest DC current
found
Highest DC current
found
Highest AC
current found
Instantaneous
peak current
The CSW Series has a fourth measurement screen for harmonics and trace analysis
measurements. This subject is covered in the next chapter.
Measurements are always running in the background. When the user selects a measurement
screen for display, the AC source first updates all the measurement parameters before
displaying the requested screen. This process may take up to a second. Consequently, pressing
the MEAS key may not always bring up the selected screen immediately. There will be a
perceptible delay. This will prevent the screen from appearing with invalid or blank readouts.
The measurement method for voltage and current will depend on the power source operating
mode. The following table shows the return value type (rms or average) and method of coupling
when the measurement command is initiated with a different extension at various operating
modes (AC, DC or AC + DC).
Extension
and Coupling
AC rms rms rms
DC rms rms average
Coupling AC DC DC
AC DC AC + DC
92 CSW Series
Page 93

User Manual California Instruments
3.14.2 Accuracy Considerations
Any measurement system has a finite accuracy specification. Measurement specifications are
listed in Section 2. When using the AC source for measurement purposes, always consider
these specifications when interpreting results. Measurement inaccuracies become more
pronounced as the signal being measured is at the low end of the measurement range. This is
particularly relevant for low current measurements. The CSW Series are high power AC sources
optimized for providing and measuring high load currents. When powering low power loads,
measurement inaccuracies on rms and peak current measurements will greatly affect derived
measurements such as power, power factor and crest factor.
The measurement system on the CSW Series uses a data acquisition system with a 16 kHz
bandwidth. This means that high frequency components of the measured signal are filtered out.
Any contribution to the rms value of voltage and current above this cutoff frequency will not be
reflected in the CSW Series measurements. When using an external measurement reference,
this may account for discrepancies in readings.
3.15 Advanced Measurements
The CSW Series offers advanced power analyzer measurement capabilities. These functions
may be accessed from the MEAS button or the MENU 2 screen. The phase for which the
analysis or waveform acquisition is done may be selected using the PHASE key in three phase
configurations. This chapter covers the use and application of these advanced measurement
functions.
3.15.1 Harmonic Analysis
The CSW power analyzer performs fast fourrier transformation on both voltage and current on
each available phase. The resulting frequency spectrum can be displayed on the LCD display in
a tabular as well as a graphical mode.
3.15.1.1 Acquiring FFT data
To perform an FFT analysis on the output of the AC source, proceed as follows:
1. Press the MEAS button four times or until the HARMONICS/TRACE ANALYSIS screen
appears.
2. Move the cursor to the FUNCTION field and select VOLT or CURR. (The BOTH selection
will default to CURR as only one FFT result can be displayed at a time.)
3. Move the cursor to the VIEW field and select the TABLE or BAR display mode. The TRACE
display mode does not apply to FFT results.
4. Move the cursor to the DATA MODE field and select ABS or REL. Absolute display mode
will show all harmonic components in volts or amps. Relative display mode will use the
fundamental as a 100 % reference and display all harmonics as a percentage of the
fundamental. Phase angles are always shown with respect to the fundamental frequency.
The phase angle of the fundamental is always shown with respect to phase A.
5. Skip the SCALE field as it only applies to the TRACE display mode.
6. Move the cursor to the TRIG MODE and select SINGLE or CONT. The SINGLE mode will
acquire the data once and show the result. If you select CONT, the data will be updated
continuously.
7. Move the cursor to the TRIG SOURCE field and select IMM. We will cover additional trigger
modes later.
CSW Series 93
Page 94

User Manual California Instruments
8. Move the cursor to the START field and press the ENTER key. The display that you
selected will be shown. If you are in CONT trigger mode, the data will be updated about
once per second.
You can return to the HARMONICS/TRACE ANALYSIS screen by pressing the ENTER key. To
display the data in a different format, change to the selections you want and move the cursor to
the VIEW field. Pressing the ENTER key will re-display the data without triggering a new
acquisition. (This is true even if you were in CONT trigger mode.) To start a new acquisition, you
must go through the START field instead.
94 CSW Series
Page 95
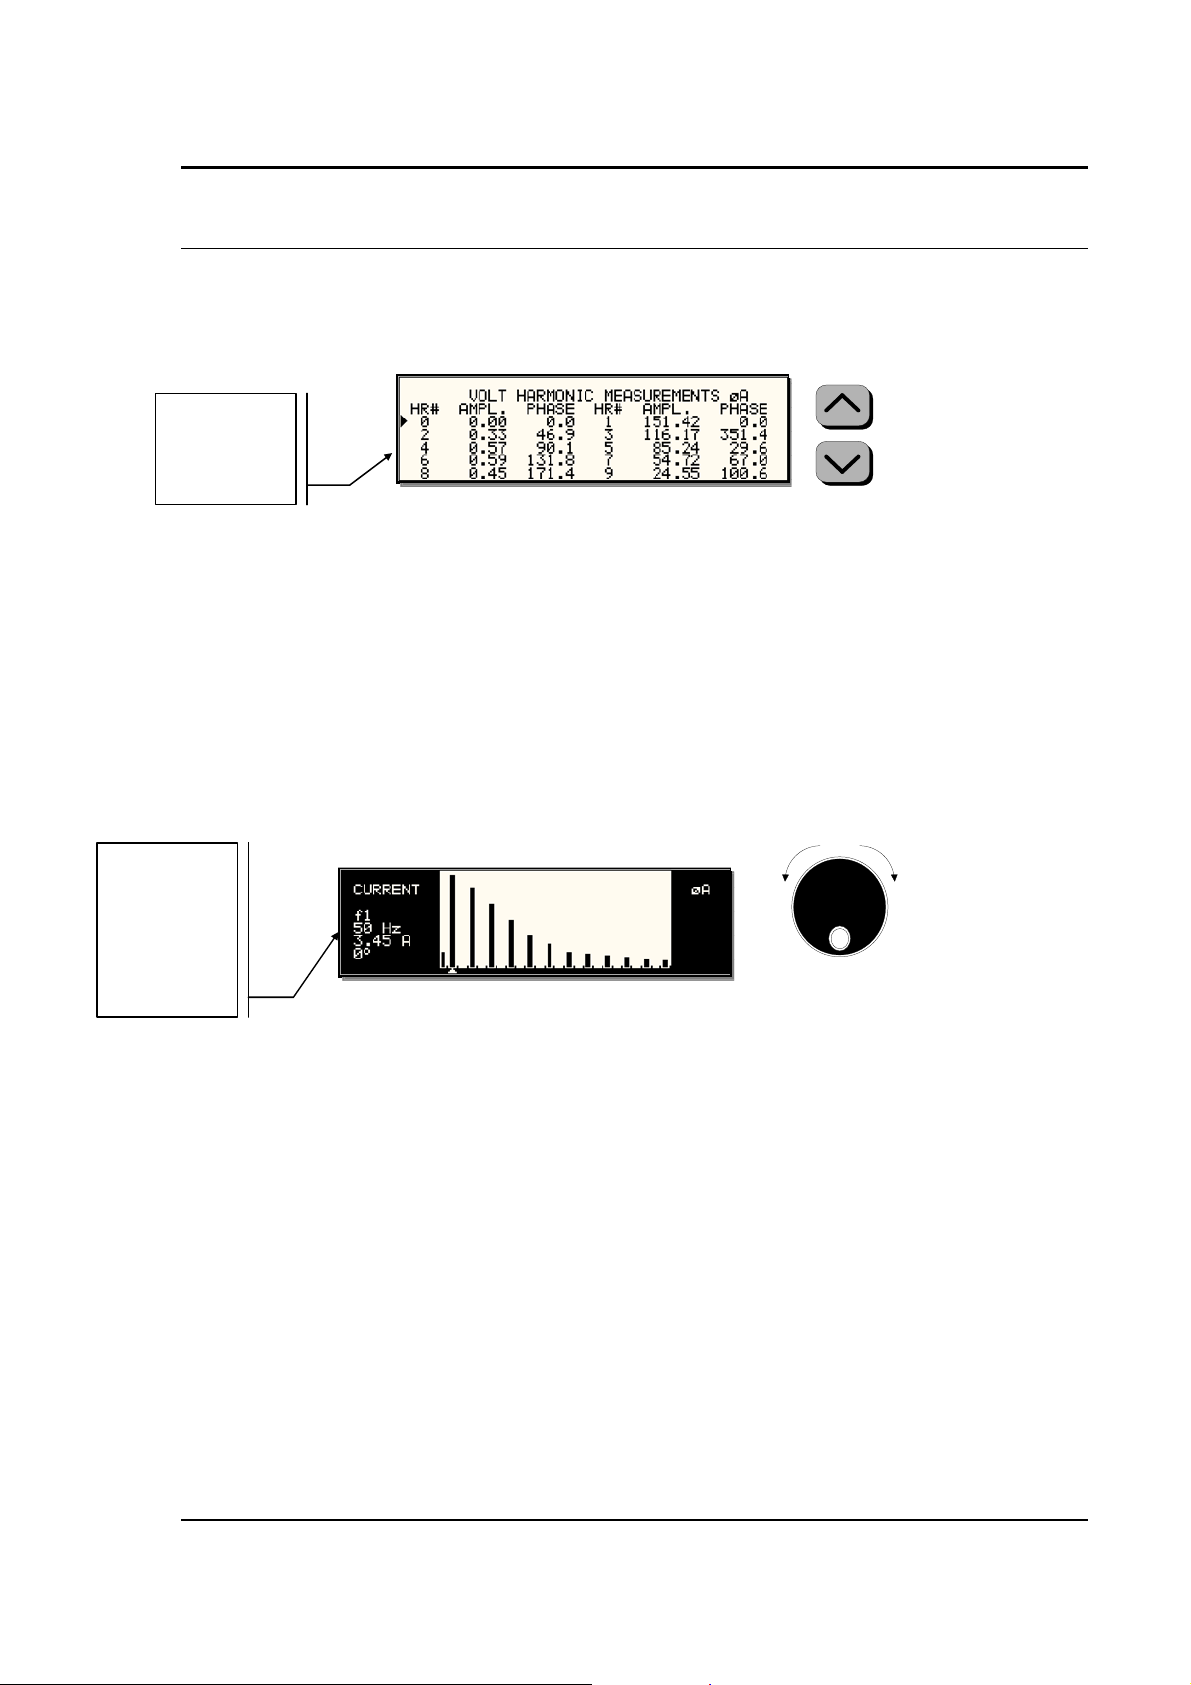
User Manual California Instruments
can be moved up
3.15.1.2 Analyzing FFT data
The data displays available for FFT data allow you to scroll through the entire data set. For
table displays, the UP and DOWN arrow keys may be used to scroll through the table data
vertically. The knob has no function while in this display mode. The triangle on the left edge of
the LCD screen points to the current position in the table.
Arrow indicator
or down using
UP/DOWN
cursor keys.
Figure 3-39: Scrolling through tabular FFT data
Bar chart format FFT data displays show the same data in a graphical format. While the
amplitude information is shown graphically, phase data is only displayed in numeric form to the
left for the currently selected harmonic component. The display can show up to 24 components
at a time. The triangle at the bottom of the display shows the currently selected component for
which numeric data is shown on the left. This data includes the harmonic number (DC through
50), the absolute or relative amplitude (depending on selected VIEW mode) and the phase
angle with respect to the fundamental. The knob can be used to scroll through the display
horizontally. The UP and DOWN cursor keys have no effect in this display mode.
Arrow indicator
points to
harmonic for
which readout is
shown on the
left. Can be
moved with
knob.
Counter
Clock
wise
Figure 3-40: Scrolling through bar chart FFT data
Clock
wise
INCRDECR
CSW Series 95
Page 96

User Manual California Instruments
3.15.2 Waveform Acquisition
The waveform acquisition mode allows voltage and/or current data waveforms to be captured
and displayed. This mode is selected by choosing the VIEW =TRACE mode in the
HARMONICS/TRACE ANALYSIS screen. Voltage and current may be viewed separately or
combined into a single display using the FUNCTION field.
3.15.2.1 Acquiring waveform data
To perform a waveform acquisition on the output of the AC source, proceed as follows:
1. Press the MEAS button four times or until the HARMONICS/TRACE ANALYSIS screen
appears.
2. Move the cursor to the FUNCTION field and select VOLT, CURR or BOTH.
3. Move the cursor to the VIEW field and select the TRACE display mode.
4. Skip the DATA MODE field as it only applies to the TABLE and BAR display modes.
5. Move the cursor to the SCALE field and select a horizontal time base value to allows you to
see at least one cycle of the output waveform. If the output is programmed at 50 Hz, a 20
ms scale would display exactly one signal period.
6. Move the cursor to the TRIG MODE and select SINGLE or CONT. The SINGLE mode will
acquire the data once and show the result. If you select CONT, the data will be updated
continuously.
7. Move the cursor to the TRIG SOURCE field and select IMM. We will cover additional trigger
modes later.
8. Move the cursor to the START field and press the ENTER key. The display that you
selected will be shown. If you are in CONT trigger mode, the data will be updated about
once per second.
You can return to the HARMONICS/TRACE ANALYSIS screen by pressing the ENTER key. To
display the data in a different format or to select voltage instead of current or current instead of
voltage, change to the selections you want and move the cursor to the VIEW field. Pressing the
ENTER key will re-display the data without triggering a new acquisition. (This is true even if you
were in CONT trigger mode.) To start a new acquisition, you must go through the START field
instead.
96 CSW Series
Page 97

User Manual California Instruments
3.15.2.2 Analyzing waveform data
The data displays available for acquired waveform data allow you to scroll through the entire
acquisition buffer. For waveform displays, the knob can be used to scroll through the display
horizontally. The UP and DOWN cursor keys have no effect in this display mode.
Readouts on the
left track the
vertical cursor
position on the
waveform.
Trigger point is
at 0.0 ms.
The acquisition buffer may be longer than the selected horizontal scale in which case only a
portion of the acquisition window will be visible. The left portion of the LCD display is used to
read out the data under the vertical cursor. This cursor is a dotted line that can be moved using
the knob. If the left or right edge of the display window is reached, the entire display will shift so
the cursor always remains visible. The time from the trigger point to the vertical cursor is
displayed in the left hand portion of the LCD in ms. Also displayed here are the absolute voltage
and/or current value under the cursor.
To change the horizontal display scale without re-triggering an acquisition, press the ENTER
key to return to the HARMONICS/TRACE ANALYSIS screen, change the SCALE value, move
the cursor to the VIEW field and press ENTER. This will display the same data set at the new
scale without triggering a new acquisition.
3.15.3 Triggering Measurements
Counter
Clock
wise
Figure 3-41: Scrolling through acquired waveform data
Clock
wise
INCRDECR
Both FFT results and waveform acquisitions may have to positioned at a specific moment in
time. To allow the data acquisition to coincide with user specified events, the measurement
system can be triggered in different ways. Trigger modes are available from both the bus and
the front panel. If the IEEE-488 or RS232C bus is used, acquisitions may also be triggered from
the transient list system. Refer to the programming manual for details on this mode of operation.
3.15.3.1 Trigger mode
The following trigger modes are supported by the CSW Series:
Single (SINGLE) This mode causes the acquisition system to be armed only
once. The CSW source waits for the user to press the ENTER
key while on the START field. As soon as the trigger event
specified occurs, data is acquired and the acquisition system is
put in an idle state. A new user initiated START event must be
given to trigger an new acquisition.
This mode is appropriate for capturing events that occur only
once such as the inrush current when turning on a load.
Continuous (CONT) This mode causes the trigger system to re-arm itself after each
trigger event. Every time a new trigger event occurs, new data
is acquired and the LCD display is updated. No user
intervention is required after the initial START event.
CSW Series 97
Page 98

User Manual California Instruments
This mode is appropriate for capturing repetitive events or to
monitor the source output continuously. Display updates will
occur about once per second.
3.15.3.2 Trigger source
The CSW Series offers a choice of trigger sources in front panel operation mode. The following
trigger sources are available from the HARMONICS/TRACE ANALYSIS, TRIG SOURCE field:
Immediate (IMM) This mode causes a trigger to occur as soon as the ENTER key
is pressed with the cursor on the START field. No trigger
source needs to be specified for this trigger mode. This mode is
equivalent to the INIT:IMM:ACQ bus command.
This trigger source is appropriate if no trigger condition is
known or desired. When using this trigger source, the
acquisition is always triggered.
Phase (PHASE A) This mode causes the CSW acquisition system to wait for a
specified phase angle on the phase A voltage output. This
allows the acquisition to be positioned in time with respect to
any phase angle on phase A, B or C. Note that phase A, B and
C are typically at 0°, 240° and 120° with respect to the specified
trigger phase in this field. An example of this trigger source
mode is shown in Figure 3-43.
When selecting this trigger source, the field below the TRIG
SOURCE field changed to “TRIG PHASE =“. Use this field to
enter the desired voltage phase angle to trigger the
measurement on.
This mode is appropriate when capturing analyzing events at a
specific phase angle such as the zero crossing of the voltage.
Note that the phase angle of the current with respect to the
voltage is determined by the load, so triggering at a specific
phase current angle is not possible as it is not controlled by the
AC source. However, when capturing current waveform data,
the phase relationship to the voltage can be determined easily
by triggering at the 0° point on the voltage.
Voltage step (SET VOLT) This mode performs two functions. It programs the output
voltage for the selected phase or phases to the rms or DC
value specified and it triggers the measurement acquisition at
the same moment in time.
When selecting this trigger source, the field below the TRIG
SOURCE field changed to “SET VOLT =“. Use this field to enter
the desired voltage to program the output to and trigger the
measurement on. If only one phase in a three phase system is
selected, only that phase’s output will be programmed. If all
phases are selected, all three phases’ outputs will be
programmed. Use the PHASE key to select the desired phase
or all phases. Figure 3-42 shows an example of using the SET
VOLT trigger source to capture the turn-on of the voltage. In
this case, a negative trigger delay was specified and the
voltage start phase angle was set to 90° in the PROGRAM 2
screen.
98 CSW Series
Page 99

User Manual California Instruments
START
TRIGGER
DELAY
[ENTER]
TRIGGER =
SET VOLT 120
ACQUISITION WINDOW
Figure 3-42: SET VOLT trigger source acquisition
This mode is appropriate for capturing the inrush current of a
load by programming the voltage to a specified value and
capturing the voltage and current at that moment in time. A
further refinement can be made by specifying the voltage start
phase angle in the PROGRAM 2 screen. If this field is changed
from RANDOM to 90°, the inrush current can be captured under
worst case conditions. In this case, the voltage should be
programmed to 0 volt before triggering the acquisition using the
START field.
Note: When using the SET VOLT trigger source, the output relay MUST be closed to
generate a trigger. If the output is open, the acquisition will be armed when the
START [ENTER] key is pressed but will wait for the trigger event. Closing the
output relay will generate the trigger event. If the output relay was already closed
when the START [ENTER] key is pressed, the trigger will occur immediately.
CSW Series 99
Page 100

User Manual California Instruments
3.15.3.3 Trigger delay
The trigger delay field allows the user the set the amount of pre- or post-trigger data that should
be used when positioning the data acquisition window with respect to the trigger moment.
POST-TRIGGER DELAY
A positive trigger delay value means the acquisition window is delayed by the amount of time
specified. In this case, the actual trigger moment itself is no longer present in the acquisition
buffer. This situation is shown in Figure 3-43 where a 20 ms trigger delay is used after triggering
on phase A = 180°. The fundamental frequency of the output is 50 Hz. The trigger point is
indicated by the dashed line. It occurs on the first 180 degree point that occurs after the user
presses the ENTER key while on the START field. Once the trigger occurs, the acquisition holds
off the specified 20 ms at which point the data requested is captured. Using a positive trigger
delay value always yields post trigger data.
Figure 3-43: Positive trigger delay (Post trigger data)
Positive trigger delay values may be set from 0.0 ms to 1000.0 ms (1 second) in 0.1 ms
increments. The value may be entered directly from the keyboard or using the knob.
100 CSW Series
 Loading...