

Page 1

SMS Basic and Advanced Manual
Page 2

Page 3

Table Of Contents
Introduction............................................................................................................................................................................ 1
Introduction.........................................................................................................................................................................
System Requirements to Run the Software....................................................................................................................... 1
Things You Should Know to Run the Software.................................................................................................................. 1
Getting Started...................................................................................................................................................................
Registering Your Software .................................................................................................................................................
How to Use the Electronic Help .........................................................................................................................................
User Interface ........................................................................................................................................................................
Menus.................................................................................................................................................................................
Main Windows..................................................................................................................................................................
Data Processing...................................................................................................................................................................
Processing Data...............................................................................................................................................................
Syncing With SMS Mobile................................................................................................................................................
Data Management ...............................................................................................................................................................
Data Management............................................................................................................................................................
Workspaces......................................................................................................................................................................
Projects ............................................................................................................................................................................
Mapping and Viewing Data..................................................................................................................................................
Mapping Data...................................................................................................................................................................
Map Backgrounds ............................................................................................................................................................
Layering............................................................................................................................................................................
Data Playback (ADVANCED)...........................................................................................................................................
3D Mapping and Plotting (ADVANCED) .......................................................................................................................... 60
Legends...............................................................................................................................................................................
Legends............................................................................................................................................................................
Creating and Editing Data....................................................................................................................................................
Creating Data...................................................................................................................................................................
Editing Data......................................................................................................................................................................
Jobs and Tasks....................................................................................................................................................................
About Jobs and Tasks......................................................................................................................................................
Creating and Editing Jobs and Tasks .............................................................................................................................. 71
Exporting Jobs and Tasks................................................................................................................................................
Data Analysis and Modification............................................................................................................................................
Data Modification and Creation........................................................................................................................................
Analysis Wizard (ADVANCED) ........................................................................................................................................
Multi-Project Analysis (ADVANCED)................................................................................................................................
Spatial Data Finder (ADVANCED)...................................................................................................................................
Financial Tracking............................................................................................................................................................
Booklet Printing (ADVANCED).........................................................................................................................................
Importing/Exporting Data and Setup Information................................................................................................................. 79
Importing Data..................................................................................................................................................................
Exporting Data..................................................................................................................................................................
Device Setup....................................................................................................................................................................
Printing (Reports, Charts, Map Layouts, etc)....................................................................................................................... 85
Printing.............................................................................................................................................................................
Data Backup, Transfer, and Maintenance ........................................................................................................................... 87
22
53
53
53
55
55
55
56
59
59
59
60
60
63
63
65
65
68
71
71
71
73
73
74
76
76
77
77
79
80
82
85
1
4
4
6
7
7
iii
Page 4

SMS Basic and Advanced Manual
Backing up and Restoring Data........................................................................................................................................ 87
Transfer Settings, Setup Files, Etc...................................................................................................................................
Database Maintenance ....................................................................................................................................................
How to .................................................................................................................................................................................
How to read logged data files into the system. ................................................................................................................ 91
How to migrate your data from Precision Map 2000 or Instant Yield Map Software........................................................91
How to import Greenstar data..........................................................................................................................................
How to reprocess data. ....................................................................................................................................................
How to set your map projection........................................................................................................................................
Using the Management Tree............................................................................................................................................
Using the Preview Window...............................................................................................................................................
Using the Calendar View. (ADVANCED) ......................................................................................................................... 94
How to make a map .........................................................................................................................................................
How to Add a Layer to a Map...........................................................................................................................................
How to display the 3D Terrain View. (ADVANCED)......................................................................................................... 95
Using the Layer Window ..................................................................................................................................................
How to adjust layer and attribute/property options........................................................................................................... 96
How to edit point data.......................................................................................................................................................
How to straighten a pass on a point dataset.................................................................................................................... 97
How to edit a legend.........................................................................................................................................................
How to freeze a boundary................................................................................................................................................
How to create a new attribute...........................................................................................................................................
How to create a new property. .........................................................................................................................................
How to create/edit a custom Operation. (ADVANCED) ................................................................................................... 99
How to define Products....................................................................................................................................................
How to add a property to a management item or dataset.............................................................................................. 100
How to edit property data...............................................................................................................................................
How to enter Financial Tracking entries......................................................................................................................... 101
How to generate a Financial Tracking report. (ADVANCED)......................................................................................... 102
How to create a 3D Plot. (ADVANCED)......................................................................................................................... 103
How to create a boundary..............................................................................................................................................
How to edit a boundary. .................................................................................................................................................
How to create a crop plan. .............................................................................................................................................
How to edit a crop plan...................................................................................................................................................
How to create a generic dataset. ...................................................................................................................................
How to use the Average Data by Polygon Tool. (ADVANCED)..................................................................................... 105
How to use the Vector Overlay Tool. (ADVANCED)...................................................................................................... 106
How to edit generic data.................................................................................................................................................
How to create a guidance dataset..................................................................................................................................
How to create navigation points.....................................................................................................................................
How to edit navigation points. ........................................................................................................................................
How to create a variable rate prescription...................................................................................................................... 107
How to edit a prescription dataset..................................................................................................................................
How to create a soil sampling dataset. .......................................................................................................................... 109
How to edit soil sampling data........................................................................................................................................
How to add Buffer Regions to an object. (ADVANCED) ................................................................................................ 111
How to edit an image. (ADVANCED)............................................................................................................................. 111
How to create spatial notes............................................................................................................................................
How to edit spatial notes................................................................................................................................................
87
89
91
92
92
92
93
93
94
95
96
97
97
98
98
98
99
101
103
104
104
105
105
106
106
107
107
108
110
111
112
iv
Page 5

Table Of Contents
How to create associated data....................................................................................................................................... 112
How to edit an associated dataset. ................................................................................................................................
How to create split planter data......................................................................................................................................
How to add a simple analysis function(s)....................................................................................................................... 113
How to edit a simple analysis function(s)....................................................................................................................... 115
How to remove a simple analysis function(s)................................................................................................................. 115
How to merge cotton pickings........................................................................................................................................
How to straighten a pass on a point dataset.................................................................................................................. 116
How to update a merged cotton dataset. ....................................................................................................................... 116
How to generate correlation results. (ADVANCED)....................................................................................................... 116
How to generate a cluster analysis dataset. (ADVANCED)........................................................................................... 117
How to generate comparison results. (ADVANCED) ..................................................................................................... 118
How to run a batch comparison analysis. (ADVANCED)............................................................................................... 119
How to write an analysis equation. (ADVANCED) ......................................................................................................... 120
How to generate a Multi-Year averages dataset. (ADVANCED) ................................................................................... 122
How to generate a Profit/Loss dataset. (ADVANCED)................................................................................................... 123
How to generate an NDVI dataset. (ADVANCED)......................................................................................................... 124
How to generate a terrain analysis dataset. (ADVANCED) ........................................................................................... 125
How to search for spatial data using the Spatial Da
How to save a workspace. .............................................................................................................................................
How to open a workspace..............................................................................................................................................
How to geo-reference an Image.....................................................................................................................................
How to download imagery from the internet................................................................................................................... 126
How to set a map background(s). ..................................................................................................................................
How to manually move a Farm.......................................................................................................................................
How to create a Job and Task(s). ..................................................................................................................................
How to export a Job. ......................................................................................................................................................
How to manually move a Field.......................................................................................................................................
How to manually move other management items (Year, Load, etc.). ............................................................................ 130
How to spatially sort Fields into Farms........................................................................................................................... 130
How to spatially sort Loads/Regions into Fields............................................................................................................. 130
How to split and sort a load or region............................................................................................................................. 131
How to query a single layer............................................................................................................................................
How to query multiple layers..........................................................................................................................................
How to export a bitmap or other image file type............................................................................................................. 132
How to import an image file............................................................................................................................................
How to import an ESRI Shape, MapInfo Mid/Mif, DEM, or TIGER file........................................................................... 133
How to batch import data (i.e. ESRI Shape,and text files). (ADVANCED)..................................................................... 134
How to export an ESRI Shape file..................................................................................................................................
How to import an ASCII text file. ....................................................................................................................................
How to import non-spatial data (i.e. Soil Lab Results). .................................................................................................. 135
How to export an ASCII text file. ....................................................................................................................................
How to import data using a template.............................................................................................................................. 136
How to export a TGT prescription file............................................................................................................................. 137
How to export an Insight/EDGE/INTEGRA IRX Prescription File .................................................................................. 137
How to export a Case IH or New Holland Voyager PRD Prescription file...................................................................... 138
How to export an Ag Leader Basic or Advanced format file........................................................................................... 138
How to print a map of the current layer.......................................................................................................................... 138
How to print a map of all layers......................................................................................................................................
ta Finder. (ADVANCED)................................................................ 125
112
113
116
126
126
126
128
128
128
129
129
131
132
132
134
135
136
139
v
Page 6

SMS Basic and Advanced Manual
How to print the current map..........................................................................................................................................
How to print a custom map.............................................................................................................................................
How to print the Summary Window Information............................................................................................................. 140
How to print the Map Window summary information...................................................................................................... 140
How to print the query results information...................................................................................................................... 140
How to print a report.......................................................................................................................................................
How to create a custom report. (ADVANCED)............................................................................................................... 141
How to print a chart........................................................................................................................................................
How to create a custom chart. (ADVANCED)................................................................................................................ 142
How to create a backup of your systems data. .............................................................................................................. 143
How to restore a data backup file...................................................................................................................................
How to export and import Transfer Information.............................................................................................................. 143
Troubleshooting.................................................................................................................................................................
Mapping Problems .........................................................................................................................................................
Printing Problems...........................................................................................................................................................
Restore Problems...........................................................................................................................................................
Tutorial Problems...........................................................................................................................................................
Reference Information .......................................................................................................................................................
Glossary of Terminology ................................................................................................................................................
GPS Coordinate Conversions........................................................................................................................................
Ag Leader Basic and Advanced format.......................................................................................................................... 149
Export Data Formats......................................................................................................................................................
SDTS to DEM Converter (ADVANCED)......................................................................................................................... 151
Index..................................................................................................................................................................................
139
139
140
142
143
145
145
145
146
146
147
147
148
150
153
vi
Page 7
Introduction
Introduction
Ag Leader Technology is proud to offer SMS Basic/Advanced to you and thanks you for using our software. SMS
stands for Spatial Management System . The word "Spatial" means involving or relating to space. That’s exactly what
your Farm and Fields are. The space where you are involved (working) every day and the space that relates to all your
business decisions.
SMS is the easiest to use, yet most powerful precision farming software package available for use with your Ag Leader
equipment. It provides unique features to support all the Ag Leader precision farming equipment that you currently own
and also helps integrate information that you may have from other sources or equipment. Simply put, you have chosen
a software package that will continue to grow and adapt with your Ag Leader equipment, current and future, which no
other software package will be able to match.
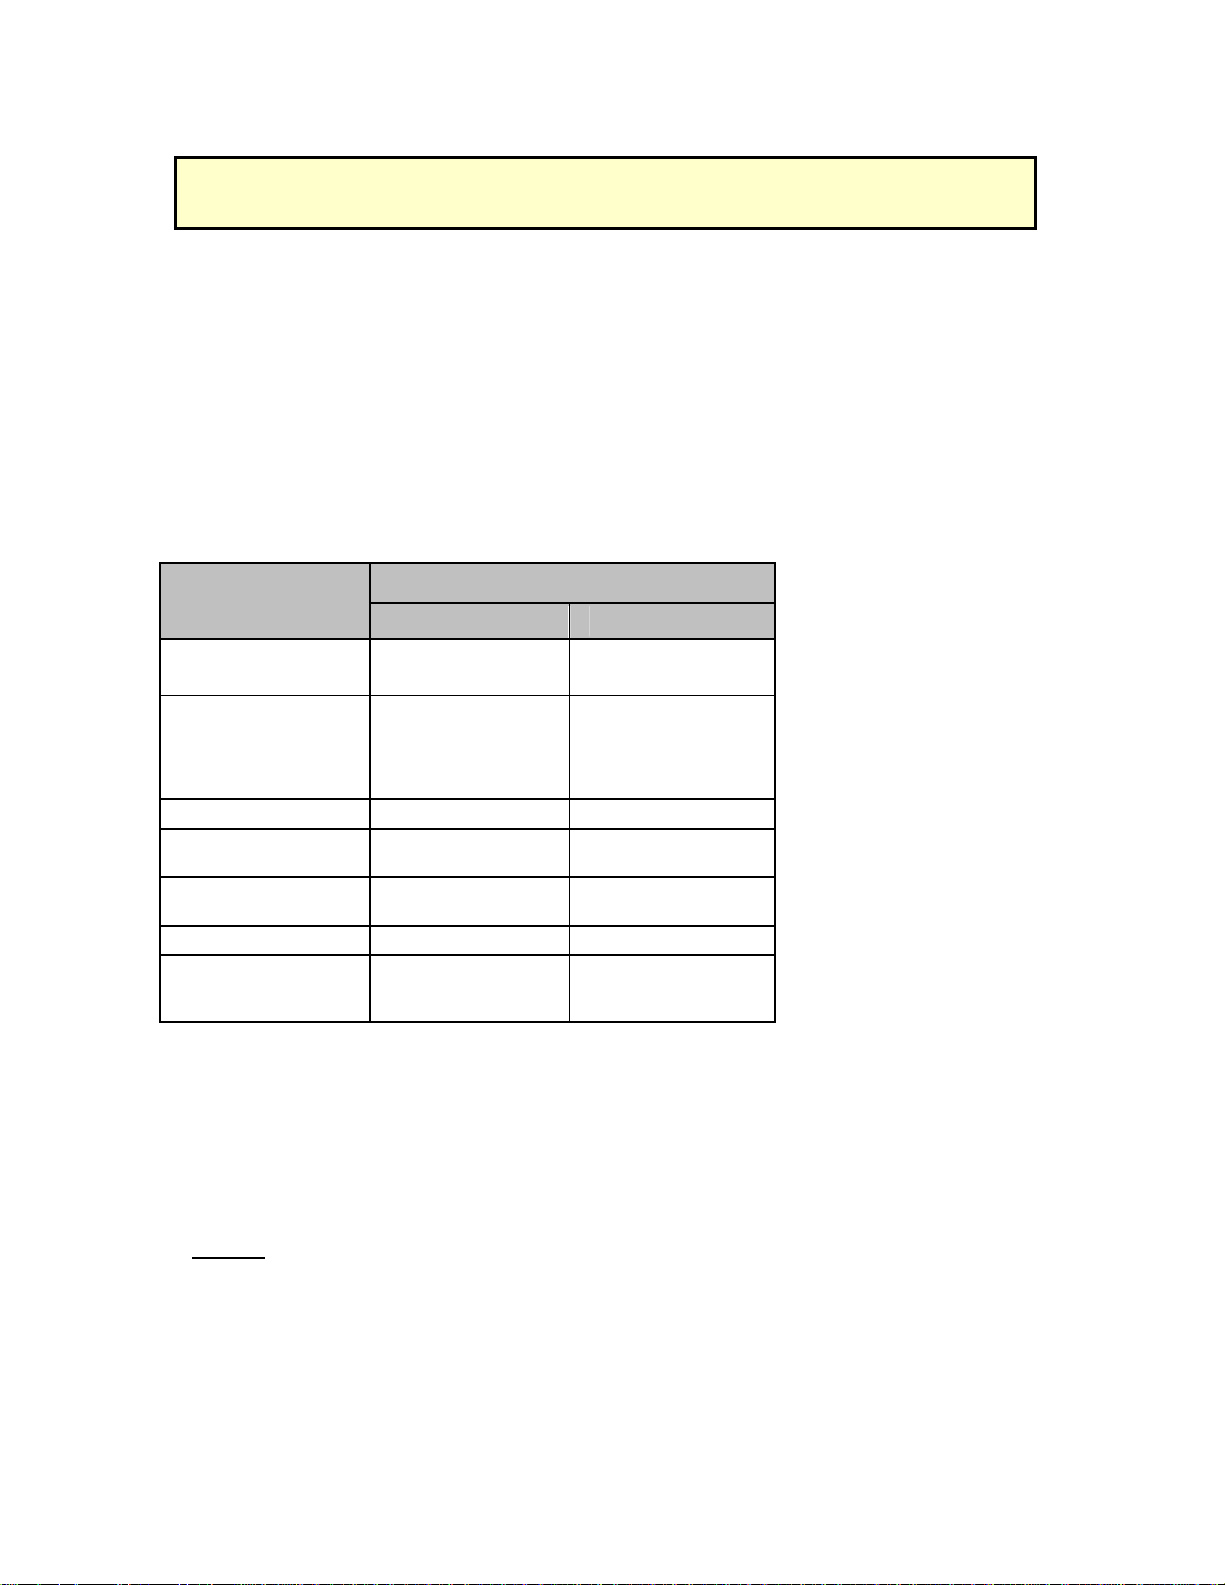
System Requirements to Run the Software
The follo
properly.
wing table outlines the minimum system requirements that are advised you meet in order to run the software
Components
Minimum Requirements
Basic
Processor
Operating System Windows XP
Memory 1 GB RAM 6+ GB RAM
Application/Data
Storage Space
Media Drive CD-ROM or DVD-
Monitor size 17" 19"
Display Resolution
Things You Should Know to Run the Software
The soft
ware was developed with the Windows family of operating systems in mind. The software takes advantage of
many standard features of the Window’s operating systems that you might not be familiar with, but can greatly
enhance your productivity. The following is a list of Windows features that the software uses to provide increased
functionality and ease-of-use:
Keyboard
Pentium III or
Equivalent
(SP3)/Vista
(SP2)/Windows
7(SP1)/Windows 8
(Not RT)
4 GB 12 GB+
ROM
1024x768 at 16-bit
color
Shift key
When used along with the mouse, this allows the selection of multiple, continuous items at once. For example if
you select an item in the Management Tree then press and hold the Shift key down, then click on another item in
the Management Tree, all the selections between your first and last selections will be highlighted and selected.
Release the Shift key and the items will remain selected until the next selection with your mouse.
Ctrl Key
Advanced
Intel iCore 5 or 7
(2 GHz or higher)
Windows 7(SP1)/
Windows 8 (Not
RT)
CD-R or CD-RW
Drive
1280 x1024 or
higher at 24/32 bit
color
1
Page 8

SMS Basic and Advanced Manual
When used alon
wanted to select two fields from the Management Tree to map at the same time but there were 4 fields in the list
between them, you would move your cursor over the first field, click the left mouse button to highlight and select
it. Then press and hold the Ctrl key and repeat the previous step to select the other field. Now release the Ctrl
key and both fields will remain selected until your next mouse click.
g with the mouse, this allows the selection of multiple non-consecutive items. For example if you
Arrow Keys
Allow the user to move through selected lists instead of using the mouse to make each selection. This can be
used to quickly move up and down in the Management Tree if a selection has already been made in the tree with
the mouse. It also allows the opening/closing of a branch in the tree. When a map is active in the software the
arrow keys also serve as panning tools.
" + " and " – " Keys on Numeric Keypad
Use these keys to zoom in and out on a map.
Home Key
Press this key to zoom and world and center the data in question.
F1 Key
Pressing this key brings up the help for the current selection.
Shortcut Key
Pressing this key will bring up the shortcut menu for the currently selected window. This key is commonly
located next to the right CTRL key. It can also be accessed by pressing SHIFT + F10.
Other Keyboard Shortcuts
Function Key(s) to Press to Activate Functions
Measure CTRL + M
Multi-Line Measure CTRL + L
Copy Selection CTRL + C
Paste CTRL + V
Cut Selection CTRL + X
Undo CTRL + Z
Redo CTRL + Y
Reset Cursor END
Delete Selection DELETE
Move Selection CTRL + E
Merge Selections CTRL + R
Snap to Start Point F2
Snap to Center F3
Snap to Midpoint F4
Snap to Endpoint F5
Snap to Closest F6
Snap to Vertex F7
Mouse
Snap Off F8
Clicking on an object or area
Point the cursor to or over the desired object or area and press the left mouse button
once and release.
Double clicking
Point the cursor to or over the desired object or area and quickly press and release
the left mouse button twice.
Dragging Objects
2
Page 9
Introduction
To drag
an object such as a window, move your cursor over the object, click and hold down the left mouse button,
and then move the object to the desired location and release the left mouse button.
The Wheel
If you have a Windows operating system that supports a mouse with a wheel, such as the MS Intellimouse, then
you can use the wheel for several functions, if your mouse has a wheel.
Scrolling – If a scroll bar is available in a window or dialog, move the cursor into that window or
dialog and roll the wheel forward or back and the scroll bar should move accordingly.
Zoom – Holding the Ctrl key down and rolling the wheel forward or back zooms the current map in
and out. This will even work on the Preview Window if the cursor is located over it.
Pan – Rolling the wheel forward or back, pans the current map up and down. Holding the Shift key
down and rolling the wheel forward and back will pan the current map left and right. This will also
work on the Preview Window if the cursor is located over it.
Adjusting and Docking Windows
All the windows that comprise the software’s main window can be adjusted to a different size, and some can be
undocked from there current location and moved around the screen as separate windows from the main window. To
adjust the size of a window move your cursor over the border of a window until you see a symbol with two parallel bars
and arrows on each side. When this icon appears click and hold the left mouse button and drag the edge to adjust the
size of the window. This is most useful for adjusting the size of the Layer window to view more of the legend, or the
opposite to see a larger map. To undock windows, and view them as separate floating windows, click on the gray
double bar above a window, click and hold the left mouse button down, and drag the window to a new location. The
window will now appear as a separate window from the main window. To re-dock the window with the main window,
click and hold the left mouse button down in the area at the top of the window and drag the window until your cursor
crosses one of the edges of the main window. The window will then automatically dock.
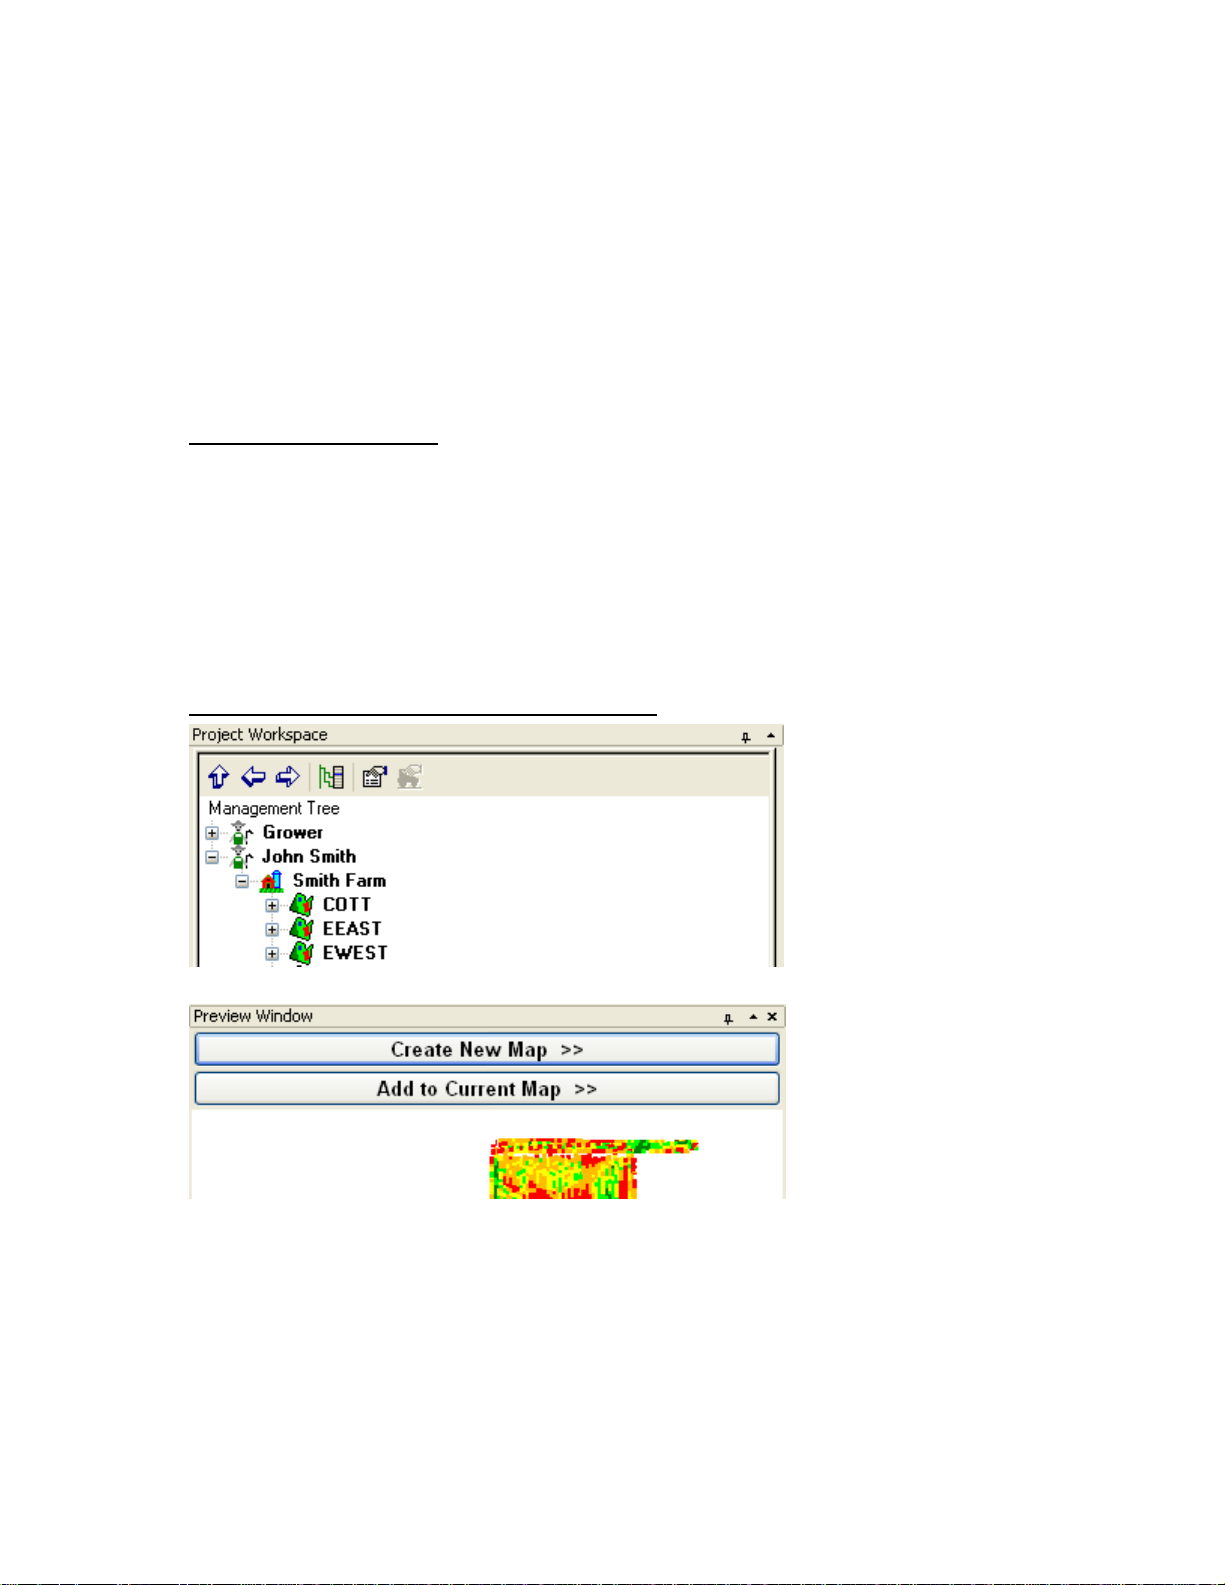
Hiding/Collapsing the Management View or Preview Windows
3
Page 10
SMS Basic and Advanced Manual
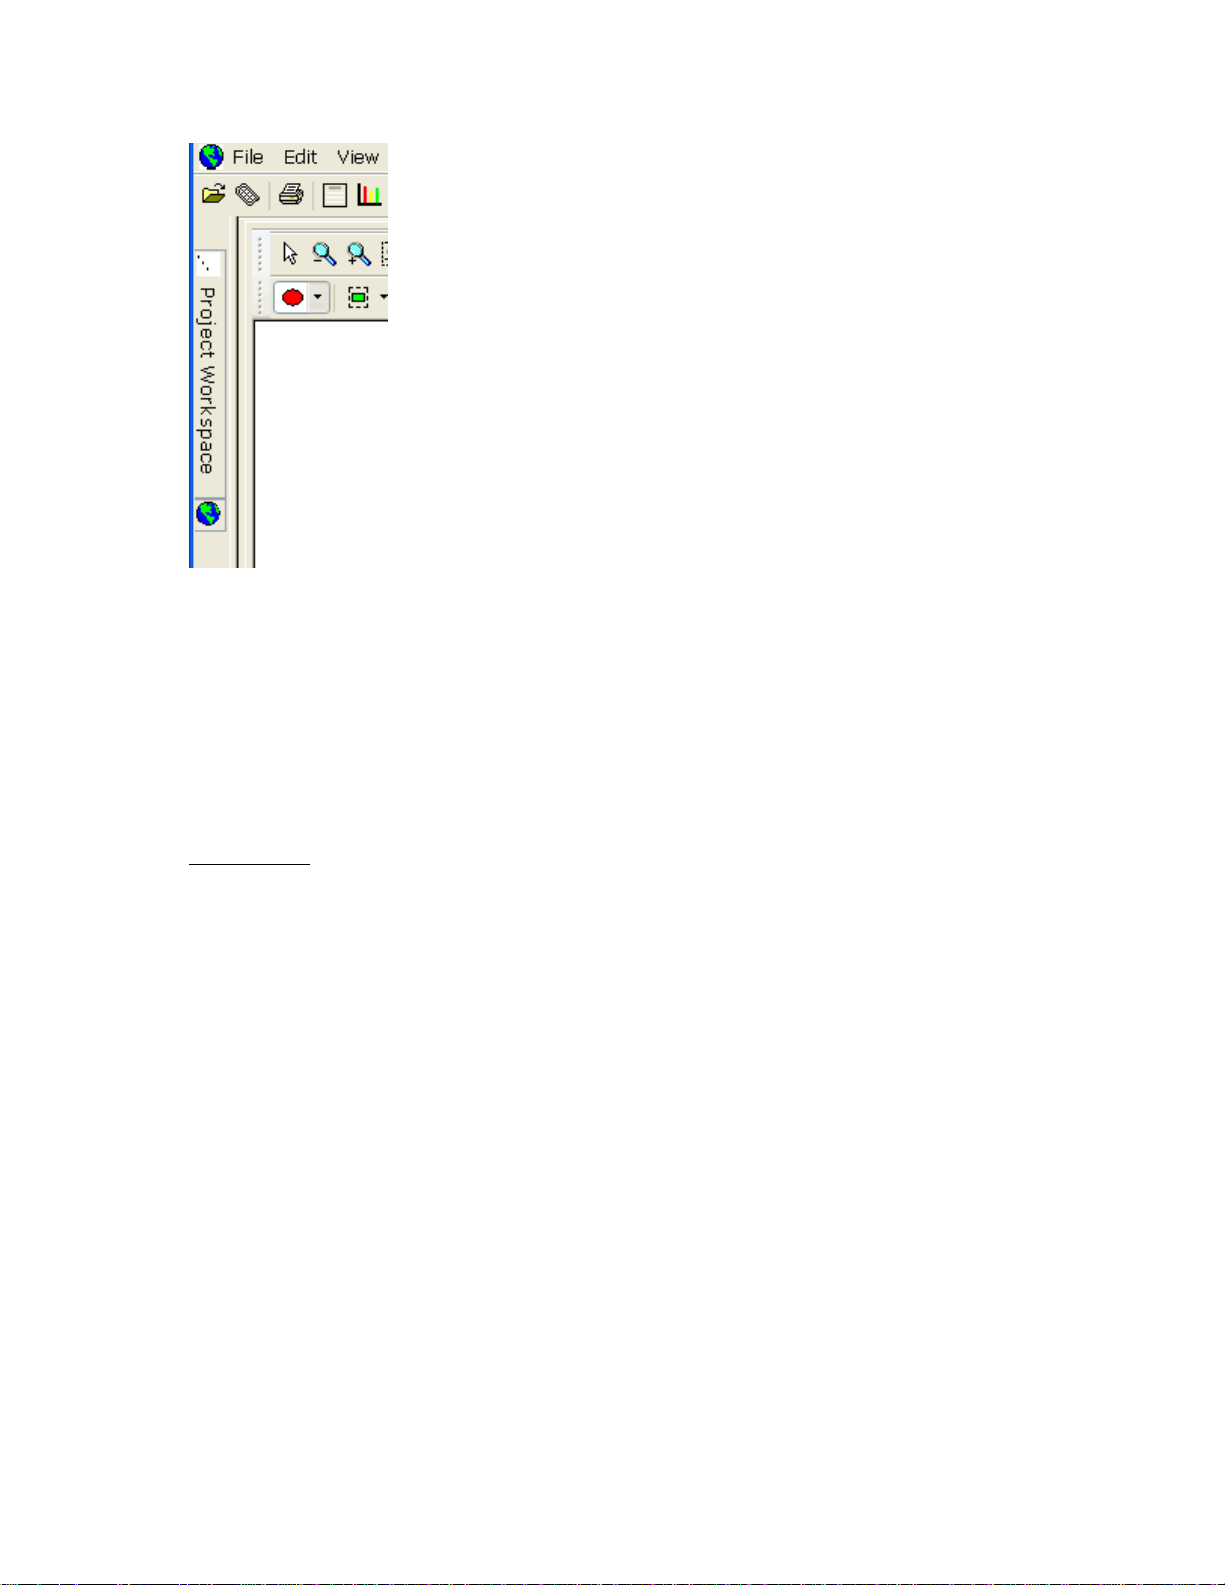
The Management Views window and the Preview window have options in the upper right hand corner of the windows
that allow you to hide/minimize the windows or collapse/expand the windows up/down to maximize/minimize their
display. Clicking on the "pushpin" icon so that it points sideways will cause the window to "hide". When it does this the
window will hide to the left edge of the screen and only be visible, as shown above, as a vertical tab(s). Move your
cursor over the tab and the window will expand out to its full size. When you move your cursor off the expanded
window it will automatically hide again. To un-hide a window then click the "pushpin" icon when the window is
expanded so that it points down and the window will remain visible.
The other option is to expand/collapse the windows vertically. To do this, click the "arrowhead" icon to the right of the
"pushpin" icon in one of the windows shown above and the window will either expand up/down vertically to fill the
window area available. This will cause the window above or below it to effectively hide. Click the icon again to return
the window to its default state.
Shortcut Menus
Shortcut menus appear when you move your cursor over an object and click the right mouse button. Shortcut menus
provided access to specific feature for an object or a quicker method of getting to common functions. The Shortcut Key
or SHIFT + F10 can also provide access to the shortcut menu.
Getting Started
Installation
If
you haven’t already done so, install the software on your computer. It is recommended that you install it on a storage
drive other than your main boot drive that contains your operating system, which is normally your C:\ drive. This is
especially true if your C drive is partitioned and is less than 10GB in size. The reason for this recommendation is due
to the amount of data that must be stored and is generated by your precision farming activities. If you have a smaller C
drive you could quickly fill the drive up or hinder performance of your computer by using to much of the boot drives
storage and operation memory. The software does allow you to install the actual program on a different drive than
where you data and database are stored. For example you can install the actual program on your C drive but have all
your data stored on a second drive.
Follow these steps to install the software on your computer from a CD:
1. Insert the software CD into your CD-ROM or DVD-ROM drive. The CD menu should now automatically start-
2. Follow the directions on the screen to install the software.
Migration
Each new release normally only supports migration and restoring backups from the previous version of the software.
Please see the current release notes for the details on what versions are supported for migration.
Registering Your Software
The soft
ware requires an unlock code to give you unlimited mapping and data creation capability. You have 21 days to
try the program before the program will require an unlock code provided by Ag Leader Technology . Once you have
up, if it does not, then click on the My Computer icon and open your CD-ROM or DVD-ROM drive by doubleclicking on it.
4
Page 11

Introduction
received your code you will be able to make unlimited maps and be entered into the Software Maintenance program
which guarantees that for the first year after you purchase the program, you will receive all minor and major software
releases automatically at no additional cost. After the first year you will be required to pay an annual maintenance fee
to maintain your status in the maintenance program.
To unlock the software follow these steps:
1. Create a map and the registration wizard window will appear, or go to the Help menu and select Register.
2. If you selected the Register option from the Help Menu, the License Manager dialog will now appear. This
dialog displays the software versions and options that you can potentially unlock. Select the item from the list
that you wish to unlock and click the Register button.
3. Now the Registration Wizard Window will open. Select one of the Registration Options and then click the
Register button. If you have an internet connection, please use the Online option. If you do not have any
type of internet service then you will need to use the Phone option to register your software.
1.
4. If you selected the Online registration option please follow these steps.
1. The first step is to log-in or create a registration account for the software. If you already have or
were provided a Username and Password, you can enter them and log-in, otherwise you need to
create a new registration account. To do this, select the Create New Account Button. You will now
be prompted to enter in your contact information from your address to your email address. You
must enter a valid email, otherwise you can not successfully register.
2. Once you have created the new account and it has been accepted, your Username and
Password will automatically be filled in for you on the Login screen and you will be emailed your
Username and Password for your records. Now click the LOGIN button.
3. Once you have registered and entered your login information, and clicked the LOGIN button, you
will now be prompted to enter your activation code. The activation code is attached to the outside
of your CD case.
5. If you selected the Phone registration option please follow these steps.
1. The Phone Registration dialog should now be displayed.
2. If you are located in North America (English Support Only) call 1-515-232-5363, select Option 1
(Technical Support), and then the option for Desktop Software . You will be required to provide the
Computer ID and Registration Code that are listed on the Phone Registration dialog. If you are an
International customer then please contact your local Service Provider and they will help register
you and get your unlock codes.
3. A registration account will be manually created for you and you will be provided with a username
and password.
4. As long as it can be verified that you have paid for the software or are currently enrolled in the
software maintenance program you will be provided with an unlock code that you can then enter
into the available entry on the Phone Registration dialog.
6. The software should now indicate that the software has been unlocked and you now have full access to all
the functionality you paid for.
If you would like to run the software on more than one computer you can do so. You are allowed to unlock the software
on two computers, with the stipulation that you won't be running them at the same time for work purposes. For
5
Page 12
SMS Basic and Advanced Manual
example, you may have a laptop and desktop computer and would like both unlocked so that when you are in the field
or traveling that you can fully use the software. Your registration account automatically allows you to get 2 unlocks
automatically via the internet without contacting technical support.
See one of the topics below on registering your software:
License Manager
Registration Login
Create New Account
Enter Activation Code
How to Use the Electronic Help
The Electronic H
different identifiers that you will encounter in this Help manual and what they mean:
"(ADVANCED)" - If you see this text next to a help topic title or an item in the help that means this feature/topic only
applies to the Advanced version of the software. Anything else without this text next to it applies to all versions of the
software. By default the software is sold as the BASIC version.
Text underlined in green indicates a link to another help page. Click on the text underlined in green to jump to another
help page.
Text underlined with a green dotted-line links to a popup. Click on the text underlined with a dotted green line to see a
popup.
elp is organized to help you learn how to use t quickly and effortlessly. The following outlines the
Click on graphical icons to jump to another Help page or start a movie (w/o sound) -
Some images can be clicked on to link to another Help page. Move your cursor over these images, when indicated by
text below them, and then you see a "hand" icon appear click the left mouse button to go to the linked Help page.
6
Page 13
User Interface
Menus
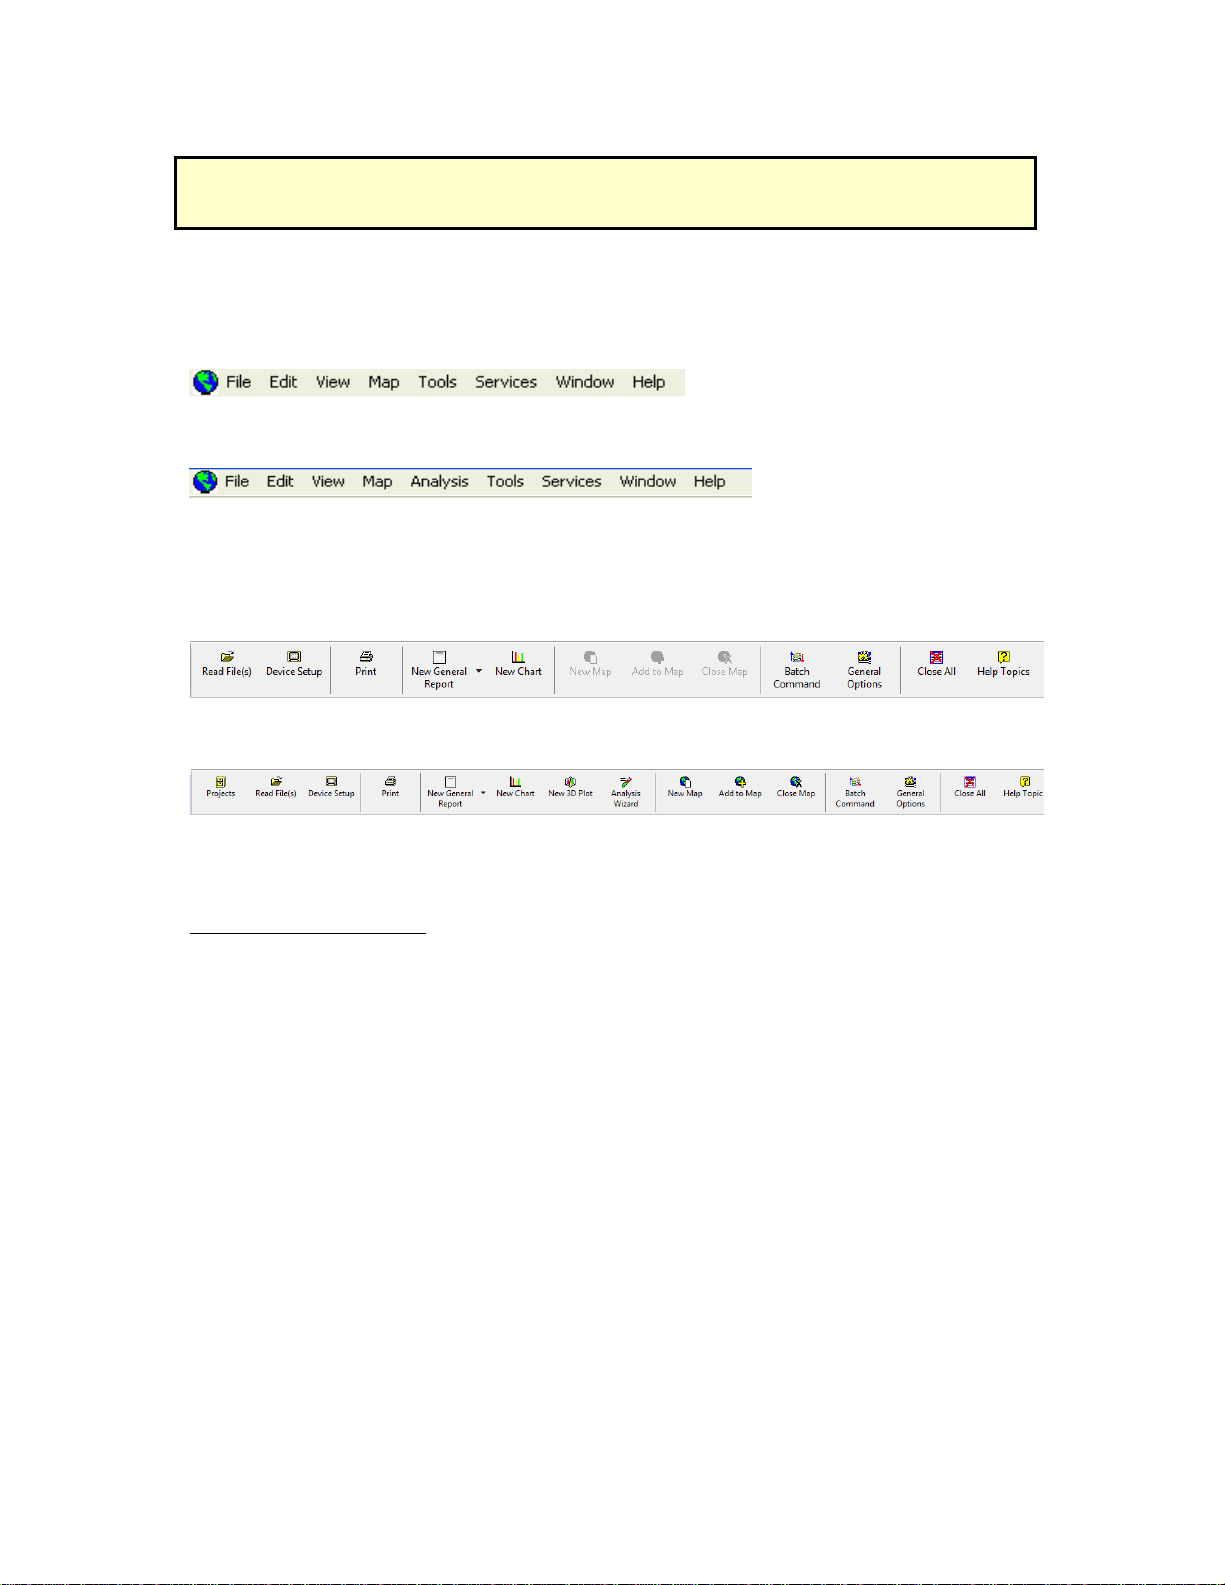
Main Menu Selections and Toolbar
The Main Menu
Basic menu:
Advanced Menu:
Move the cursor over an area you would like more information about and if a hand icon appears click the left
mouse button to see more information.
Basic Toolbar:
Selections allow you to access the core features, settings, and help for the system.
Advanced Toolbar:
Move the cursor over an area you would like more information about and if a hand icon appears click the left
mouse button to see more information.
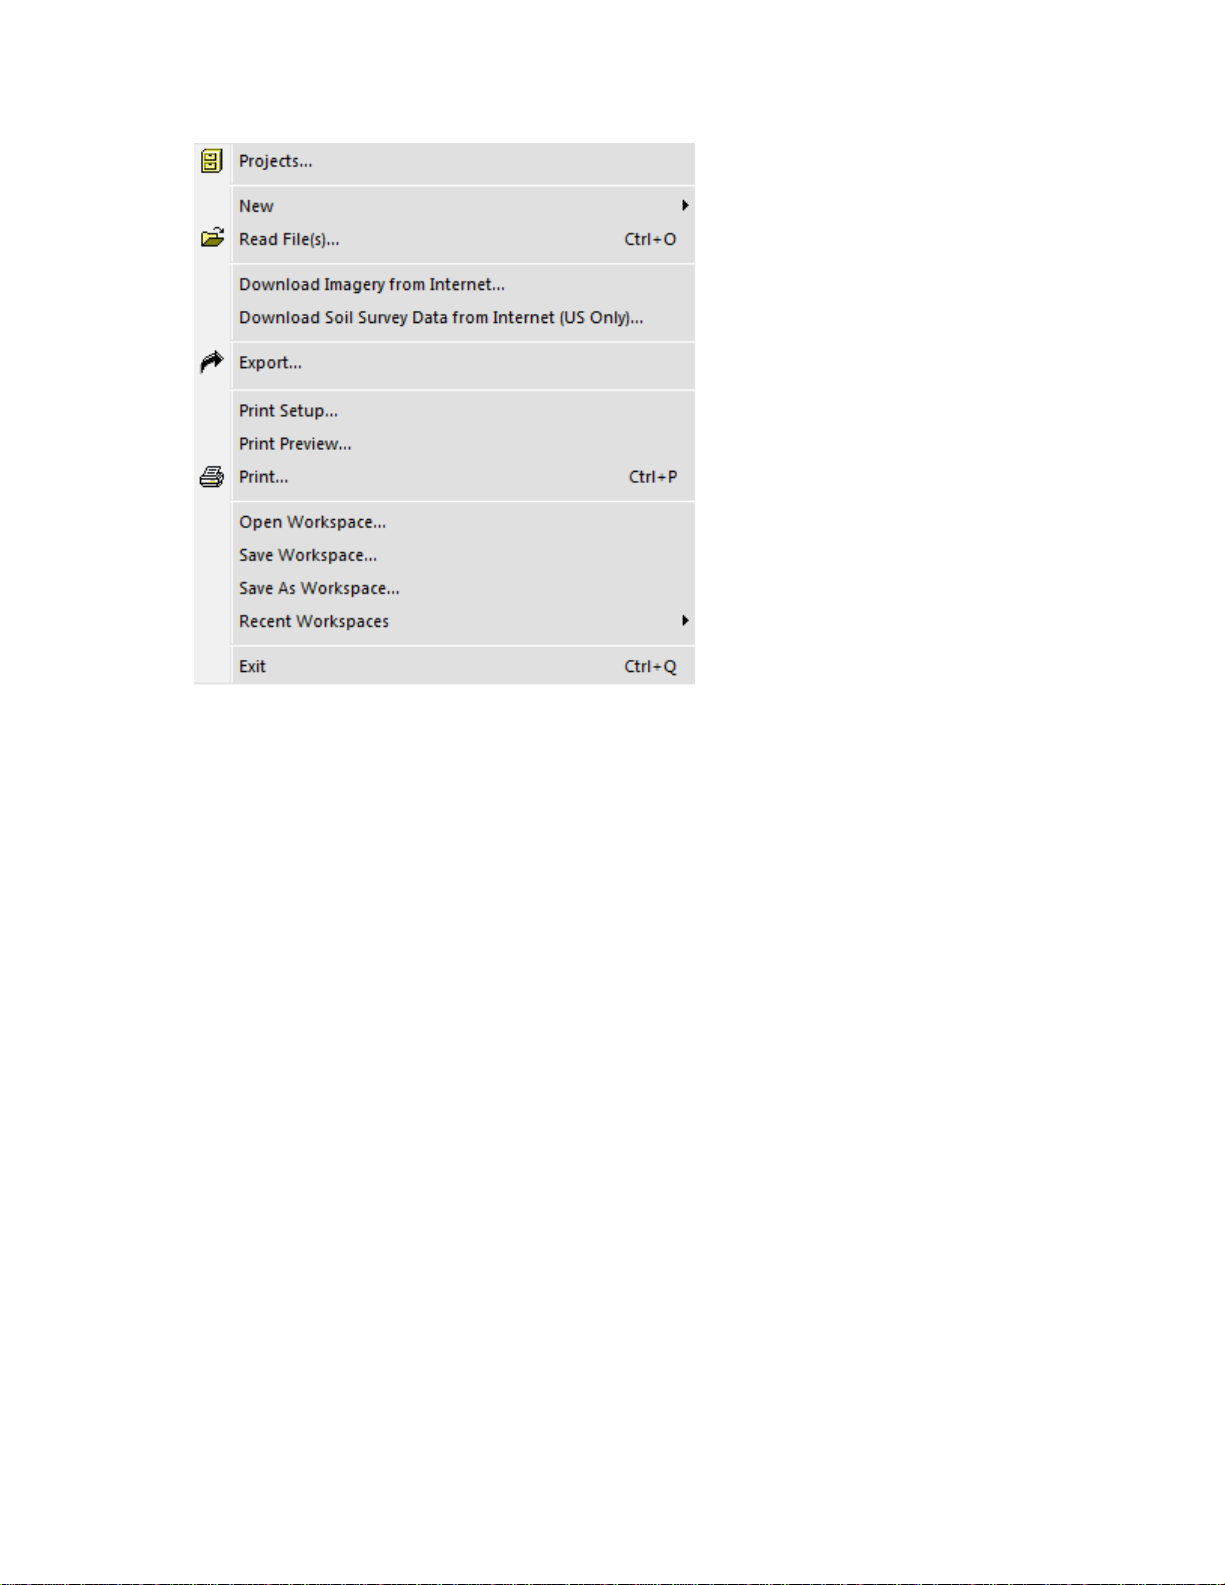
File Menu
Summary Window File Options
7
Page 14
SMS Basic and Advanced Manual
Projects
Projects are normally used to separate data from different users or customers that you want kept in different databases
for security or data size reasons. Advanced users can create, edit, or delete an unlimited number of Projects. Basic
users can only create/edit/manage up to (5) Projects and are limited to a single Data Location where there data is
stored. Advanced users can define multiple Data Locations to store data, which can be on the same computer or on
individual servers spread out around the world.
New
Allows the creation of new views in the main window or datasets. You can create the following:
Map
3D Plot (ADVANCED)
Chart
General Report
Scouting Report
Financial Tracking Report
Crop Plan(s)
Operation Summary Dataset
Read File(s)...
Allows different types of files to be read into the software. Three options for reading in files are provided.
Read File(s) from a Supported Field Display or Monitor
Files from Ag Leader Technology, AGCO, Case IH, CLAAS, Flexi-Coil, John Deere, New Holland, RDS, and Trimble
can be read directly into the software. Options are provided for manually selecting files or automatically searching
folders or hard drives/memory cards.
Sync/Import Projects from SMS Mobile
Allows the user to sync or import a Mobile Project from Ag Leader Technology's SMS Mobile software. This
sync/import process can also update the Mobile project with newer information from your software, such as
updated management item names or edited data.
Import a File from a Generic Source
Allows the user to import generic data files of the following types:
3D Surface Files (ADVANCED)
Allows the import of 3D surface files such as DEM's, NED's, LIDAR, and SDTS Elevation models.
8
Page 15

User Interface
Images
Allow
s the import of BMP, JPEG, JPEG2000, GIF, MrSID, PNG, WMF, TIFF, or GeoTIFF image
files. World files containing geo-referencing for the import image are also supported, if available,
and will be automatically loaded if they are present in the same location as the image file you are
importing.
Management Items Files (Product Lists)...
Allows the import of management items such as Products, Vehicles, and Field names. Generic
lists of items can be imported from ASCII text files or specific formats such as the Management
Setup File (.*MSF) or AgriDNA XML file.
MapInfo MID/MIF File
Allows the import of MapInfo files.
Non-Spatial File (Lab Results)...
Allows the import of ASCII text files that don't contain spatial (position) data that you need to
import and link to spatial data already in the system, i.e. import Soil Lab Results and link them to
a soil sampling points in the system.
Shape File
Allows the import of ESRI Shape files.
Text File
Allows the import of ASCII text files.
TIGER File
Allows the import of TIGER files.
Import a File Using a Saved Template
Allows the user to select an import template that was saved from a previous Spatial or Text file
import to use on a new import file of the same type.
Download Imagery from Internet...
Allows the automatic downloading and import of aerial images from the internet. You must have an internet connection
to use this feature and you should have either automatic, frozen, or set boundaries for fields in your system to get the
best possible images available.
NOTE: No warranty or guarantee of imagery quality or availability is made when using this feature.
Downloaded imagery is made available for the users own private use only and is not to be used for resale or
commercial purposes.
Download Soil Survey from Internet (US Only)...
Allows the automatic download and import of soil survey data from the USDA via the internet. You must have an internet
connection to use this feature and you must have either an automatic, frozen, or set field boundary for your fields in
order to download the soil survey information. The available data may vary from region to region but as much technical
detail as is available is downloaded for the soils that go with your fields.
NOTE: No warranty or guarantee of quality or availability is made when using this feature.
Export
Opens the export wizard dialog and allows the user to export data from the system using 3 possible methods:
Export to a Display Using Device Setup
Allows the export of files to supported field displays. This export option provides full setup for most
supported displays, not just individual files.
Export to a Display With a Single File
Allows the export of individual files (boundaries, VR prescriptions, etc) to a supported field display. This
export method has a smaller list of supported displays than Device Setup and many of the displays listed
for this option are NOT available in Device Setup.
IBY File
Allows the export of a boundary dataset as an IBY file for use in the Ag Leader Insight display.
BDY File
Allows the export of a boundary dataset as a BDY for use in the Ag Leader PF3000 or PF3000
Pro
PFN File
Allows the export of a navigation dataset as a PFN file for use in the Ag Leader PF3000 or
PF3000 Pro
TGT File
9
Page 16

SMS Basic and Advanced Manual
Allow
s the export of a prescription dataset as a TGT prescription file for use in the Ag Leader
PF3000, PF3000 Pro, or Insight displays.
IRX File
Allows the export of a prescription dataset(s) as an IRX prescription file for use in the Ag Leader
Insight display. This format supports multiple product prescriptions.
PAT File
Allows the export of a guidance dataset as a PAT file for use in the Ag Leader Insight display with
the AutoPilot option enabled.
FALCON File
Allows the export of a prescription dataset as a TIF or TRF/INI prescription file(s) for use in an
AGCO/AGCHEM Falcon system.
ENS File
Allows the export of a prescription dataset as an ENS prescription file set for use in Case IH AFS
Concord and Cyclo systems.
PRD File
Allows the export of a prescription dataset as a PRD prescription file for use in the Case IH AFS
PT and New Holland SP series planters running firmware that supports the Voyager file format.
PRE File
Allows the export of a prescription dataset as a PRE prescription file for use in the Case IH ADX
or Flexi-Coil Flexcontrol systems.
ARM File
Allows the export of a prescription dataset as an ARM prescription file for use in Mid-Tech and
Tyler/Case IH AIM systems.
GLN File
Allows the export of a guidance dataset as a GLN file for use in Mid-Tech displays.
Trimble Files
Allows the export of datasets as guidance, boundary, or prescription files for Trimble displays and
mobile software.
EZ-Guide Plus Guidance File
Allows the export of a guidance dataset as a FLD file for use in an EZ-Guide Plus system from Ag
Leader, Case IH, New Holland, and Trimble. Requires v2.0 or higher firmware in the EZ-Guide
Plus and the latest version of the EZ-Toolbox program on your PC.
Remote Data Logger Files
Allows the export of a guidance dataset as a guidance file for use in the Remote Data Logger
(RDL) from Case IH, New Holland, and Trimble.
Export Using a Generic File Format
Allows the export of data in generic formats.
Image Files
Allows the export of bitmap, JPEG, GIF, PNG, TIFF, or GeoTIFF image files.
Shape Files
Allows the export of ESRI Shape files.
KML (Keyhole Markup Language) File
Allows the export of Google KML files that can be used in Google Earth or other GIS applications.
Text Files
Allows the export of ASCII text files.
Ag Leader Basic File
Allows the export of an Ag Leader Basic comma delimited text file.
Ag Leader Advanced File
Allows the export of an Ag Leader Advanced comma delimited text file.
Print Setup
Note: Your Falcon controller must be unlocked by AGCO to provide the ability
to spread from TIF maps.
10
Page 17
User Interface
Standard Windo
Print Preview
Provides a print preview of the information that is currently displayed in the Summary Window.
Print
Prints the information that is currently being displayed in the Summary Window.
Print Report
Allows the user to print a Grower, Farm, or Field Summary report.
HTML Report
Allows the user to create the same type of reports as above but as an HTML page instead of printing to a printer.
Open Workspace
Allows the user to select a saved workspace to open.
Save Workspace
Allows the user to save the current map(s) and layer(s) that are open as a workspace that can be reopened at any time
to return to the same map(s) and layer(s) that were open when the workspace was saved.
Save As Workspace
Allows the user to save the current workspace as a different name.
Recent Workspace
Allows the user to see a list of recent workspaces that have been used and select one to open.
Exit
Closes the application.
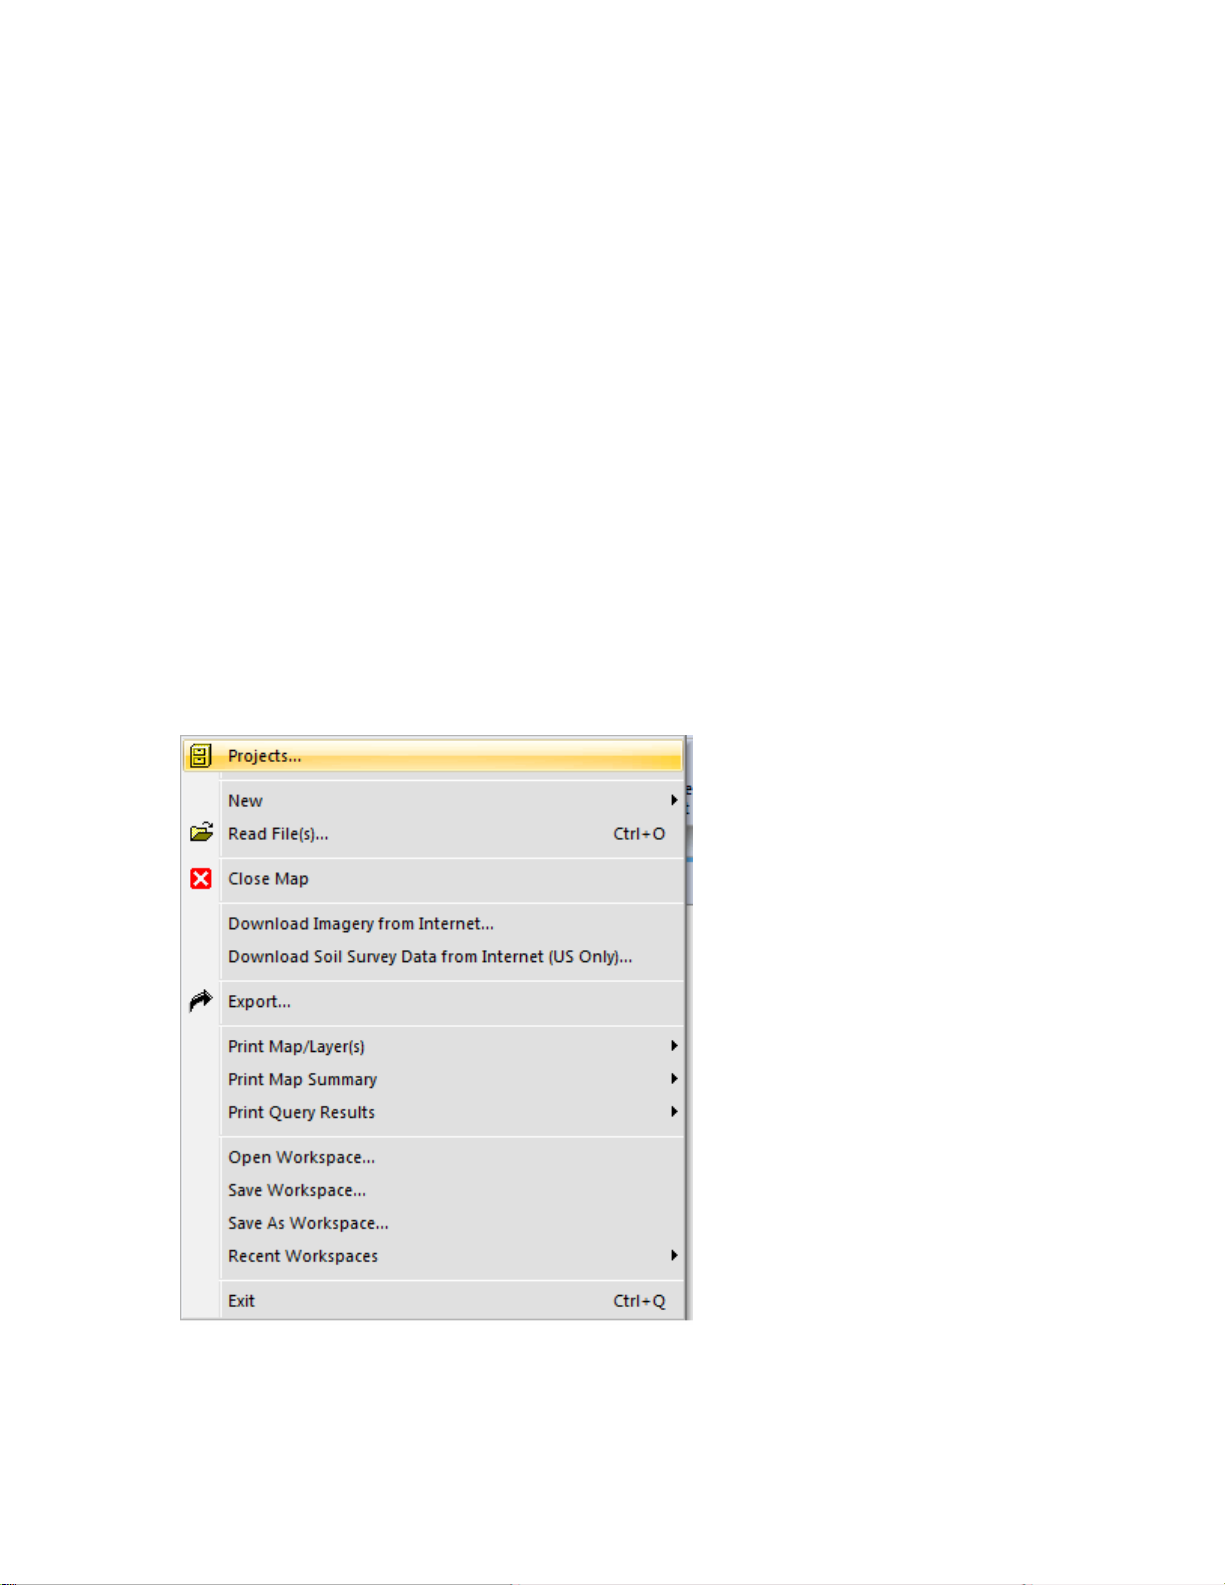
Map Window File Options
w’s printer selection and setup options.
The follo
New
wing menu items differ from those described above when the a Map Window is active:
11
Page 18

SMS Basic and Advanced Manual
Allow
s the user to create one of the following dataset types:
Boundary Layer
Allows the user to create a new field boundary dataset.
Field Crop Plan Layer
Allows the user to create a new crop plan dataset for a single field. This option is only available if you have
a field boundary open in the current map and the crop plan will be added for that field only.
Generic Layer
Allows the user to create a new generic dataset that can contain point, line, or polygon data. The user can
also define and add new attributes for a generic dataset.
Guidance Layer
Allows the user to create a new guidance dataset to be exported to an assisted or automated steering system
or to be used for field work planning.
Navigation Layer
Allows the user to create a new navigation point dataset.
Plot Prescription Layer (ADVANCED)
Allows the user to create a new plot prescription dataset that can be used for research/test plot design.
Prescription Layer
Allows the user to create a new prescription dataset.
Soil Sampling Layer
Allows the user to create a soil sampling dataset using a gridding wizard. Soil sampling lab results can then
be imported and tied to the points.
Scouting Layer
Allows the user to create a scouting dataset(s) by drawing regions or gridding an area. Scouting data specific
to different pests can also be created and saved as their own scouting operations based on pest type.
Tile Plan Layer (ADVANCED)
Allows the user to create a new tile plan dataset.
Map
Allows the creation of a new map based on your selection(s) in the Management/Monitor Tree , Calendar
View, or Job/Task Tree.
Map Layer
Allows the creation of a new layer in the current map, based on your selection(s) in the Management/Monitor
Tree , Calendar View, or Job/Task Tree.
Close Map
Closes the Map that is currently active.
Print Map
The following options are available for printing when a Map window is active:
Current Layer
Prints a map of only the current layer.
All Layers
Prints a map printout for each layer that is open on individual pages.
Current Map
Prints a map of all open layers on one page and then each of the available layers information printed on
the following pages.
Custom Layout
Allows the user to design a completely custom printout that can include such items as bitmaps and text
descriptions.
Print Map Summary
Prints a map summary report for the layers currently open in the active map.
Print Query Results
Prints a report of all the queries that have been performed in the active map.
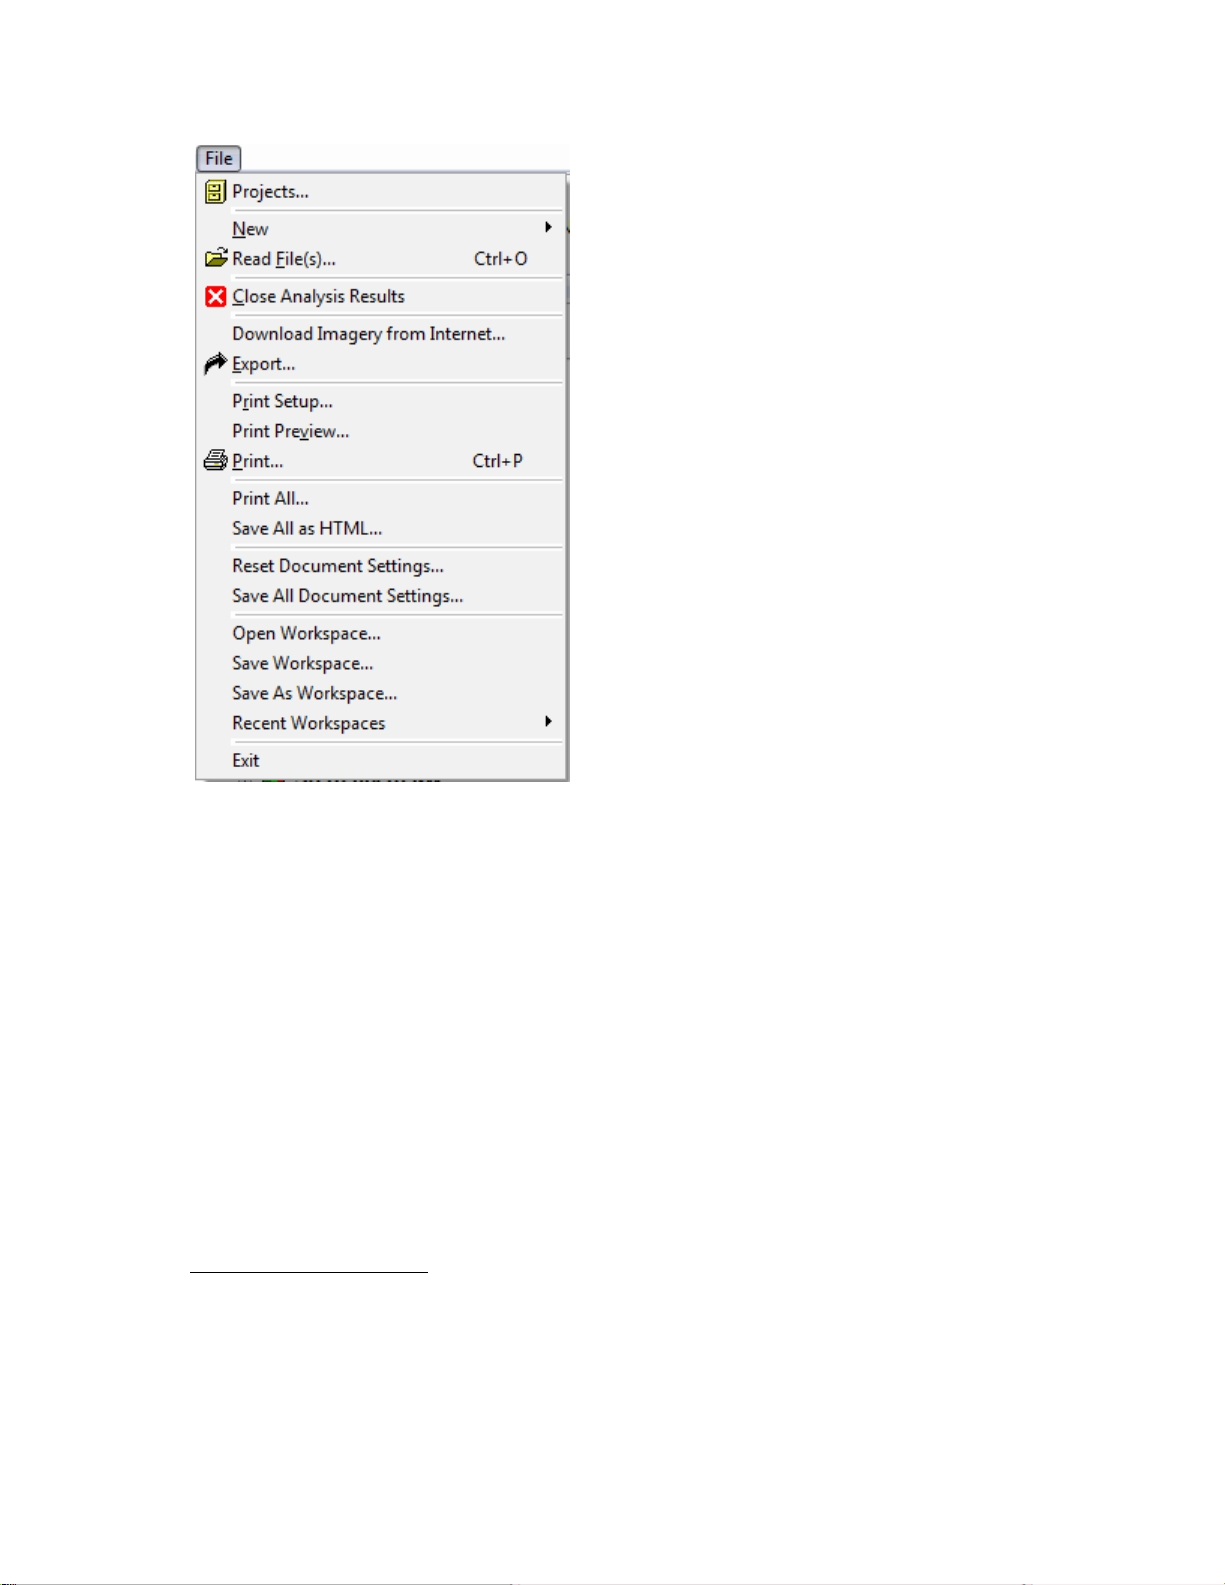
Analysis Results Window File Options (ADVANCED)
12
Page 19
User Interface
The following menu items differ from those described above when the an Analysis Results Window is
active:
Close Analysis Results
Closes the Analysis Results document window that is currently active.
Print All...
Prints all the results currently displayed in the analysis results document.
Save All as HTML...
Saves all the results currently displayed in the analysis results document as a single HTML file with links to each
analysis result.
Reset Document Settings...
Select this option to clear any saved analysis document settings you have set back to the original defaults.
Save All Document Settings...
Select this option to save all the settings you have made for the current analysis result and analysis function that was
run to generate them. When you rerun the same analysis function, these saved settings will be loaded to automatically
format your results the same way as when you saved. If you change the formatting or content of the results though, the
settings will automatically return to the default settings for your current results only.
Edit Menu
Summary Window Edit Options
13
Page 20
SMS Basic and Advanced Manual
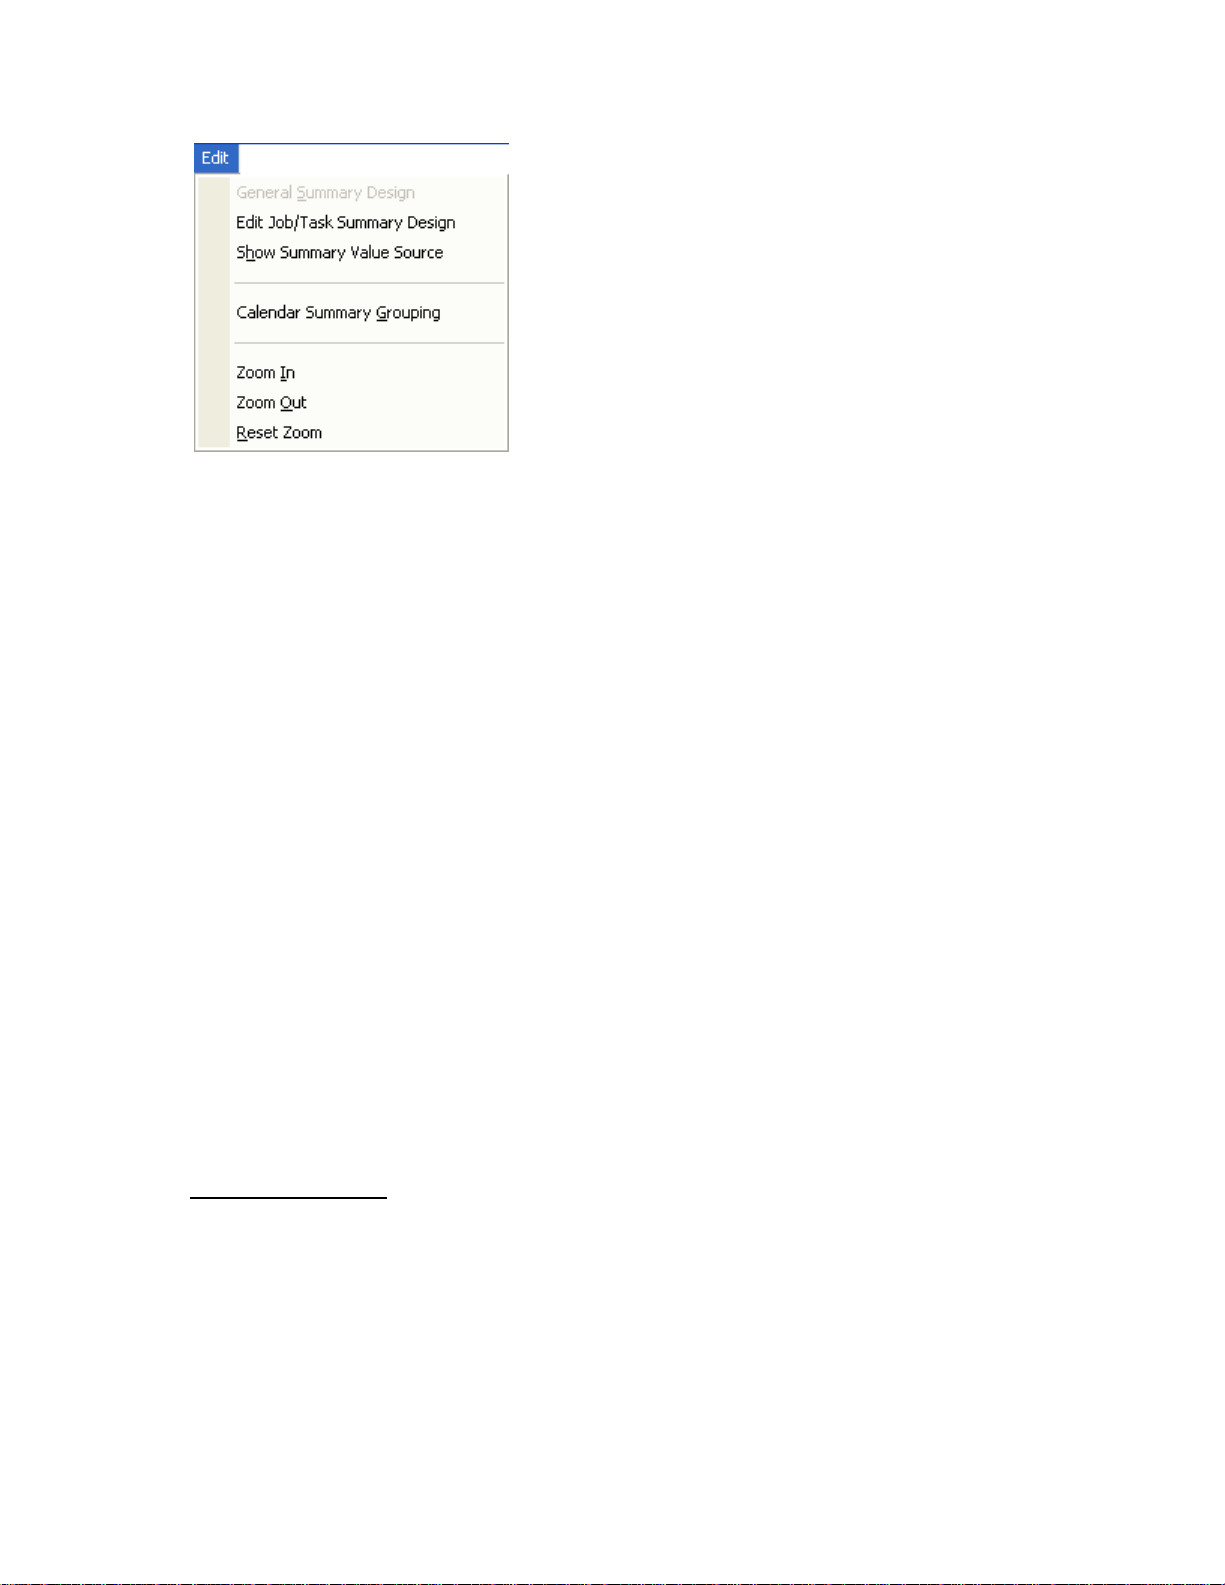
General Summary Design
Allows the user to change what attributes and/or properties that are displayed in the General Summary window for the
current operation selection in the management tree.
Job/Task Summary Design
Allows the user to change what attributes are displayed in the Job or Task summaries. The Job summary can only be
edited when the Job node is selected in the Job/Task Tree. The attributes that can be selected for the Job summary
are limited to ones that are generic across different modes, like Fuel Used. The Task summary can only be edited
when a selection at the Operational Pair level down to Product is made. At the Operational Instance and below, the
normal summary will be displayed and if you wish to change it contents then you must make these changes on similar
data in the Management Tree.
Show Summary Value Source
Check this option to display symbols in the summary grid cells to the right of the values and units that identifies the
source of the displayed data. The following data sources are available for display along with their symbols:
Monitor Summary -
Spatial Data Records -
Manual Entries -
Mixed Types -
Calendar Summary Grouping (ADVANCED)
Allows the user to adjust the grouping of data that is displayed for the current calendar view selection in the General
Summary wind ow.
Zoom In
Select this option to zoom the current document view (i.e. the summary or a report) in, thus enlarging it.
Zoom Out
Select this option to zoom the current document view (i.e. the summary or a report) out, thus reducing its size.
Reset Zoom
Select this option to rest the zoom level to the system default for the current document view.
Map Window Edit Options
‡
†
«
*
14
Page 21
User Interface
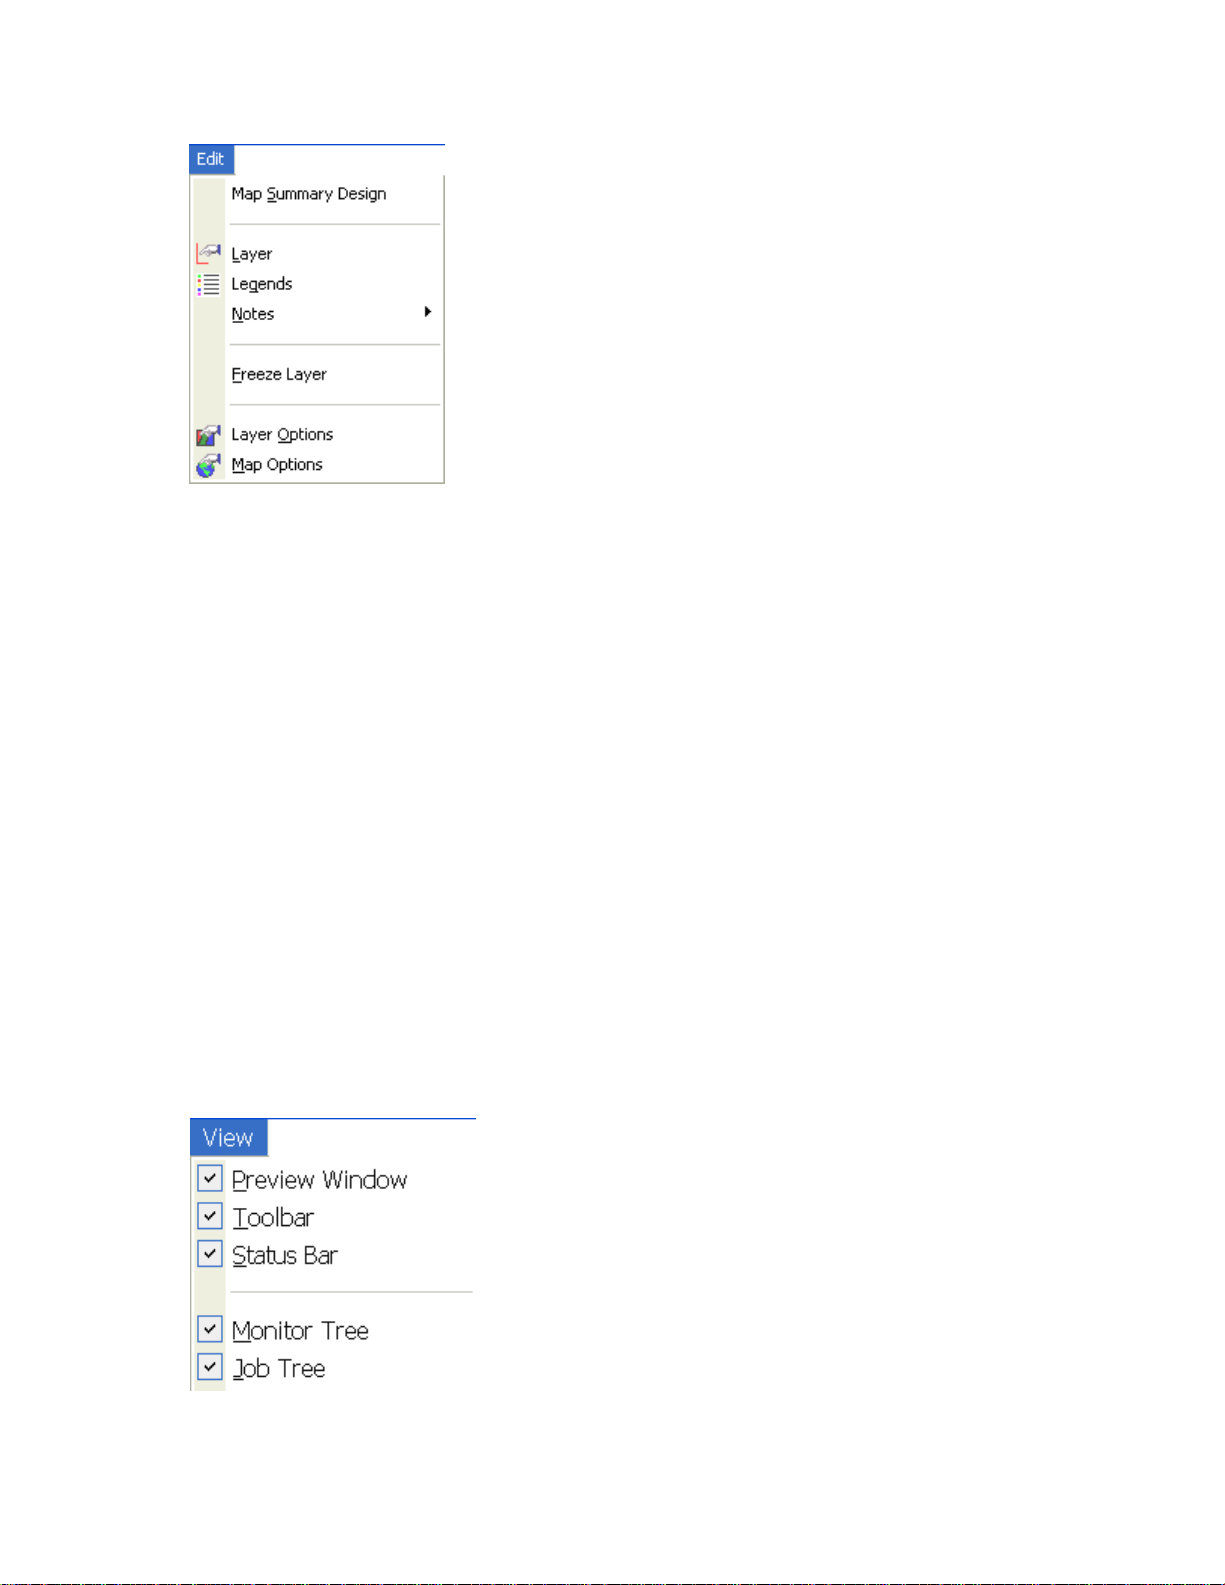
Map Summary Design
Allows the user to change what attributes and/or properties that are displayed in the Map Summary window for the
current layer and operation in the active map.
Layer
Allows the user to edit the data in the current dataset layer and active map, if editable.
Legends
Allows the user to edit the legend for the current layer in the active map.
Notes
Layer Notes
Allows the user to add a spatial note(s) to the current dataset layer. These notes are tied to the specific
dataset they are added to and can only be viewed/edited when the same dataset is mapped.
Landmark Notes
Allows the user to add a landmark note(s) that will be displayed whenever spatial data is mapped. These
landmark notes allow the marking and notation of permanent landscape features such as wells, pump heads,
builds, etc.
Freeze Layer
Allows the user to freeze the current layer. By freezing a layer you can make adjustments to the dataset in the
management tree for example and create a new layer or map which you can compare to the original dataset layer that
you froze. If you had not frozen the layer then it would have been updated with any changes that you had made to the
original dataset. The frozen dataset will only be accessible while you have the current map that contains it open. Once
the map is closed or the layer is removed you can not reopen the frozen layer.
Layer Options
Allows the user to edit the layer, sub-layer, and attribute/property options for the current layer in the active map.
Map Options
Allows the user to edit the map options for the active map.
View Menu
Preview Window
15
Page 22
SMS Basic and Advanced Manual
Allow
s the user to turn the Preview Window on or off. This allows for more viewing space.
Toolbar
Allows the user to turn the Main Toolbar on or off.
Status Bar
Allows the user to turn the Status Bar on or off.
Monitor Tree
Allows the user to hide the Monitor Tree.
Job Tree
Allows the user to hide the Job Tree.
Calendar View (ADVANCED)
Allows the user to hide the Calendar View
Financial Tracking Tree (ADVANCED)
Allows the user to hide the Financial Tracking Tree.
Map Menu
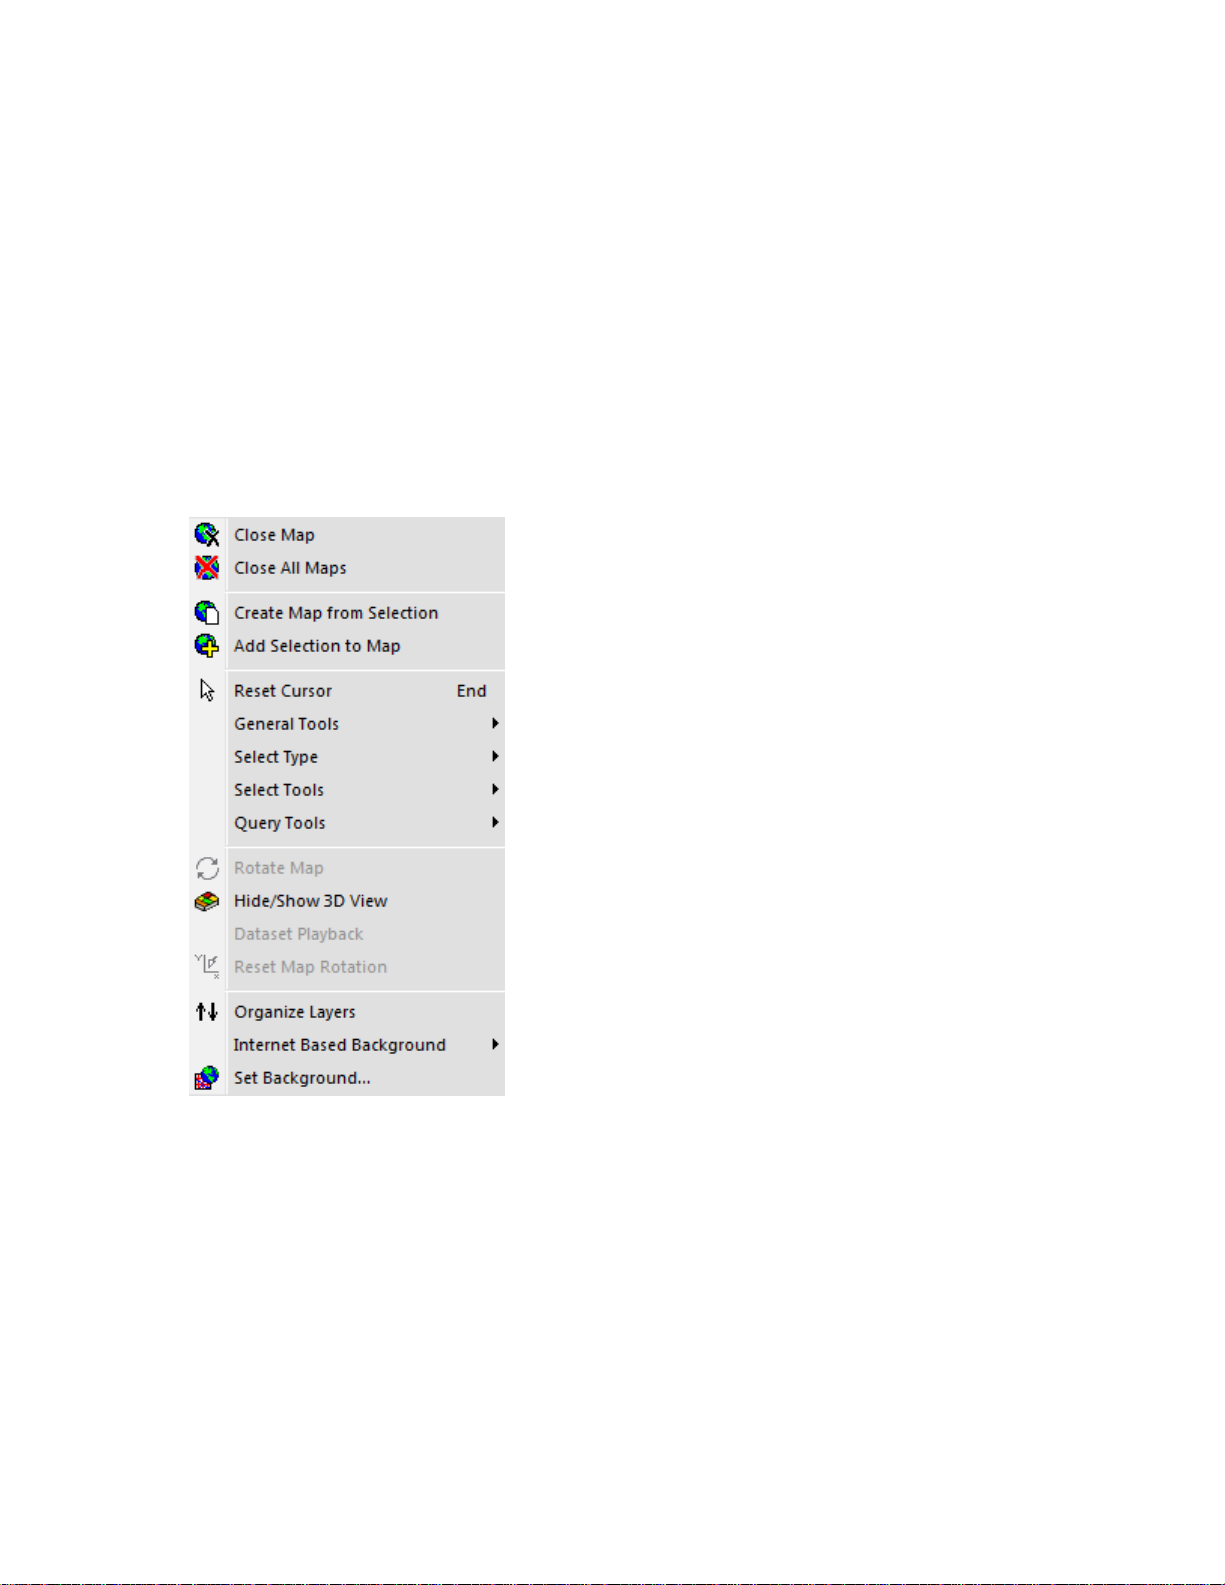
Close Map
Closes the currently active map and its layers.
Close All Maps
Closes all open maps and their layers.
Create Map for Selection
Creates a new map and layer for the current selection in the Management Tree.
Add Selection to Map
Adds a new layer to the active map for the current selection in the Management Tree
Reset Cursor
Resets the toolbar selections so that none are selected. This is useful if you want to cancel a selected function on the
toolbar.
General Tools
Zoom Out
16
Page 23

User Interface
Click this button to scale the map w
Zoom In
Click this button to scale the map window in once.
Zoom to Box
Click this button to zoom to a box area defined by the user.
Specialty Zooms
Zoom World
Click this button to zoom to the extent of all data currently on the map.
Zoom Previous
Click this button to zoom to the last zoom extent.
Zoom Selection
Click this button to zoom to the current layer selection.
Pan
Allows the user to drag the current contents of the map with the mouse in any direction.
Line Measure
Tape measure feature that allows the user to select a start and endpoint for a line and see the distance between the
points.
Multi-Line Measure
Tape measure feature that allows the drawing of multiple, connected line segments and see a running total of overall
distance from the start of the first segment to the endpoint of the last one.
Label Tools
Move Label
When User-Defined is selected on the Label Placement tab when editing Layer Options, this option will
become active. When selected it allows the user to drag labels to any location on a map. To use click on
an object on the active layer that you want to move a label for and hold the mouse button down. The
cursor will jump to the label location. Keep the mouse button held down and move the label to the desired
location and then release the mouse button.
Label Settings
Allows the user to set various parameters for the display of labels for each object in a layer when User-
Defined has been selected as the Label Placement type. Click on an object in the active layer to edit its
label properties.
Select Type
Select Objects
When this selection type is selected, entire objects are selected when using one of the selection tools. For
example if Select Polygon is selected and you draw a selection that crosses the edge of a polygon, the whole
polygon will be selected not just the intersected area.
Select Intersections
When this selection type is selected, only the intersected area of a n object is selected. For example if the
Select Polygon tool is selected and a region is drawn across a quarter of a line segment, then only that length
of the line that fell in the selection area will be selected.
Select Tools
Select Point
Allows the user to select an individual spatial point.
Select Rectangle
Allows the user to select a region with a box.
Select Polygon
Allows the user to select a region with a polygon.
Select Circle
Allows the user to select a region with a circle.
Select Ellipse
Allows the user to select a region with an ellipse.
Select Pass
Allows the user to select a pass. Only valid for point or smart rectangle map types.
indow out once.
17
Page 24
SMS Basic and Advanced Manual
Select b
Allows the user to select a spatial object (point, line, polygon, cell) and all other spatial objects with the
same legend value will also be selected.
Select Via Filter
Allows the user to select a region using data filters that the user defines. Data filters can be based on
spatial statistics, attributes, and properties and in combinations.
Invert Selection
Allows the user to invert the current selection on the map, selecting all other items on the current layer
other than the ones that are currently selected.
Query Tools
Query Current Layer
Activates the query feature for the current layer.
Query through Current Layer
Activates a query that cuts through all layers below the current layer, using the selected area as a "cookie
cutter".
Query Multiple Layers
Activates the query feature for all layers that have been selected to be included in the multi-layer query.
Select Query Layers
Allows selection of all currently open layers in a map to be used in the multi-layer query.
Clear Query Results
Clears all the query results from the Properties Window.
Rotate Map (ADVANCED)
Allows the user to rotate the 3D view about the X, Y, and Z axis.
Hide/Show 3D View (ADVANCED)
Allows the user to toggle between displaying the current map in 2D or 3D view.
Reset Map Rotation (ADVANCED)
Allows the user to reset the orientation and zoom level of the current 3D view to the default orientation.
Dataset Playback (ADVANCED)
Allows the user to start the Dataset Playback Viewer which maps the data in real-time based on the order, time-wise,
that the data was logged.
Set Background
Allows the user to select a background(s) to be viewed on the active map.
Organize Layers
Allows the user to reorder or delete layers in the active map.
Anal y sis M enu (ADVANCED)
y Legend Range
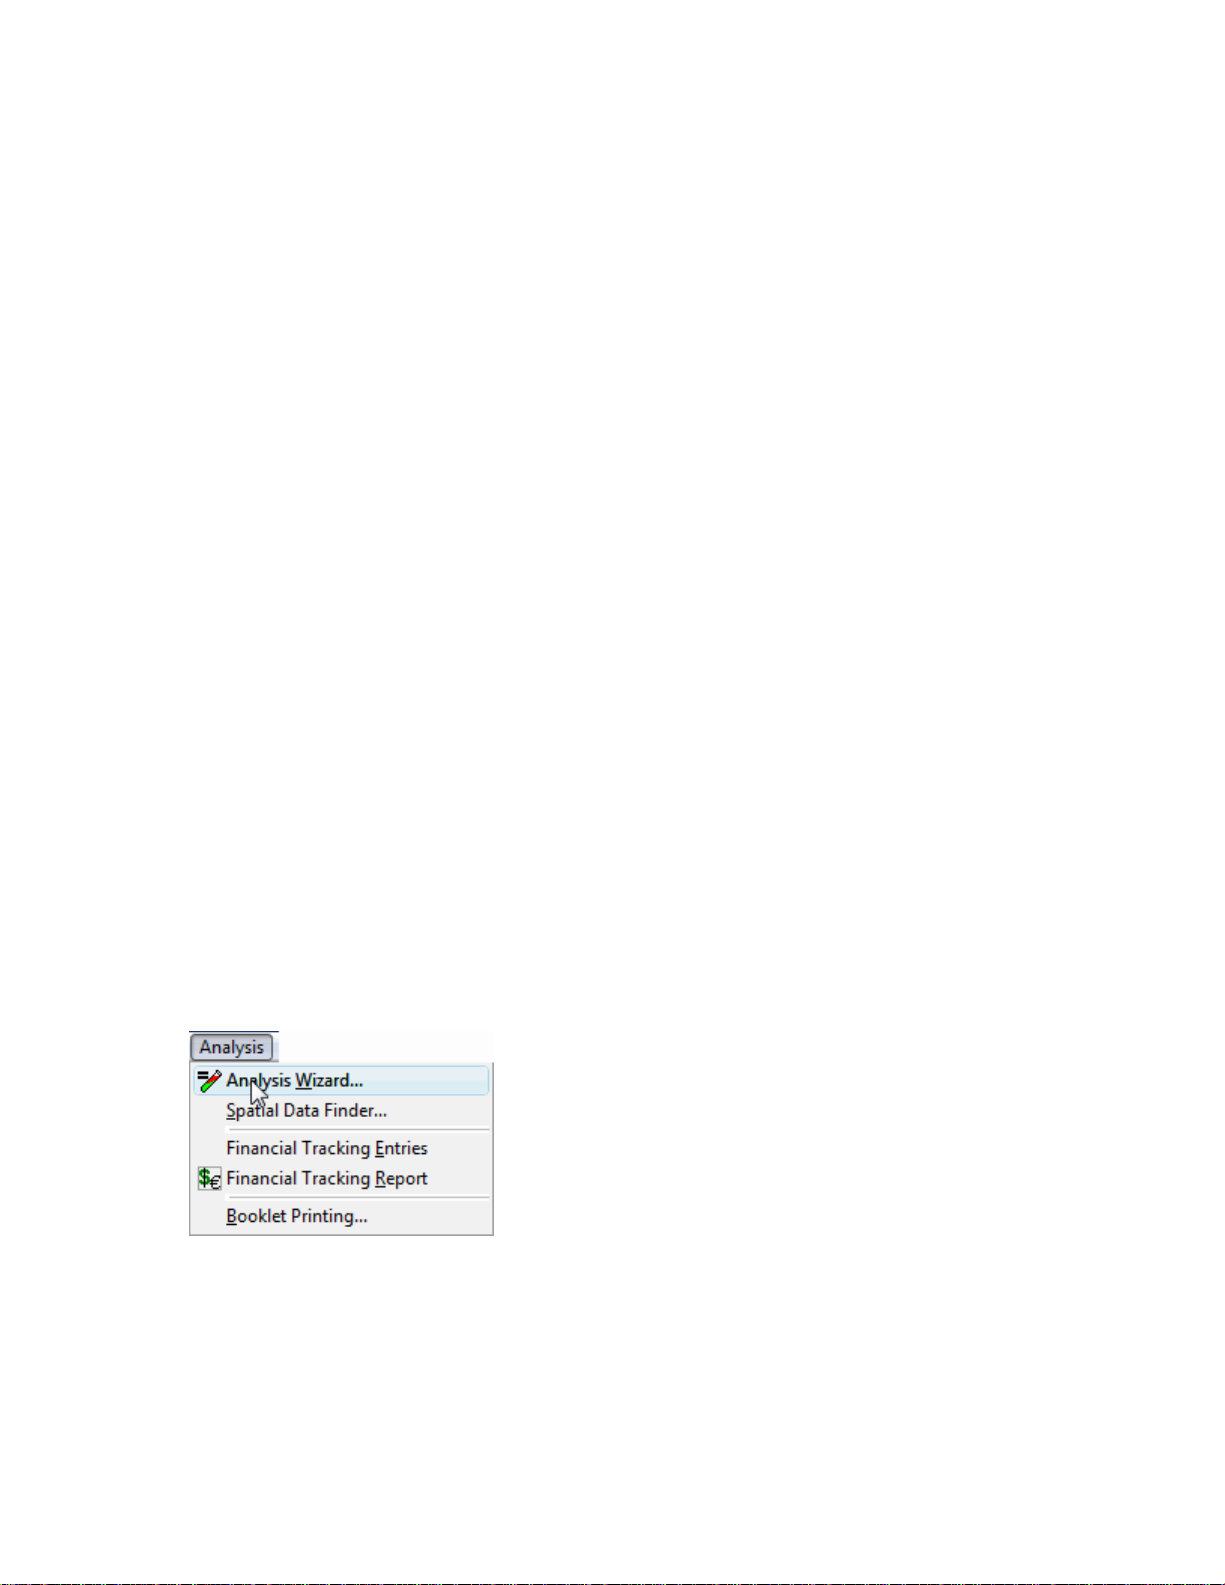
Analysis Wizard...
Select this function to run the available analysis functions such as Comparison Analysis, Equation Based Analysis,
Multi-Year Averages, etc. Analysis functions can be run on a single field, multiple fields, or across projects depending
on their type.
Spatial Data Finder...
18
Page 25
User Interface
Select this function to build and/o
generate a new map or add a new layer(s) to an existing map based on the results. For example, you can run a filter to
create a map of all the Grain Harvest datasets for a certain product such as all your corn harvest data.
Financial Tracking Entries
Select this function to enter detailed production financial values such as income, expenses, expense/income shares,
etc.
Financial Tracking Report
Select this option to generate a non-spatial profit/loss report that represents all the financial entries that you have
made.
Booklet Printing...
Select this option to create, select, or edit a booklet design. Booklets allow you to build an output that can contain a
title page, boundary maps, dataset print layouts, reports, charts, analysis results (single and multi-project), and a table
of contents. The booklet is generated dynamically each time you run it.
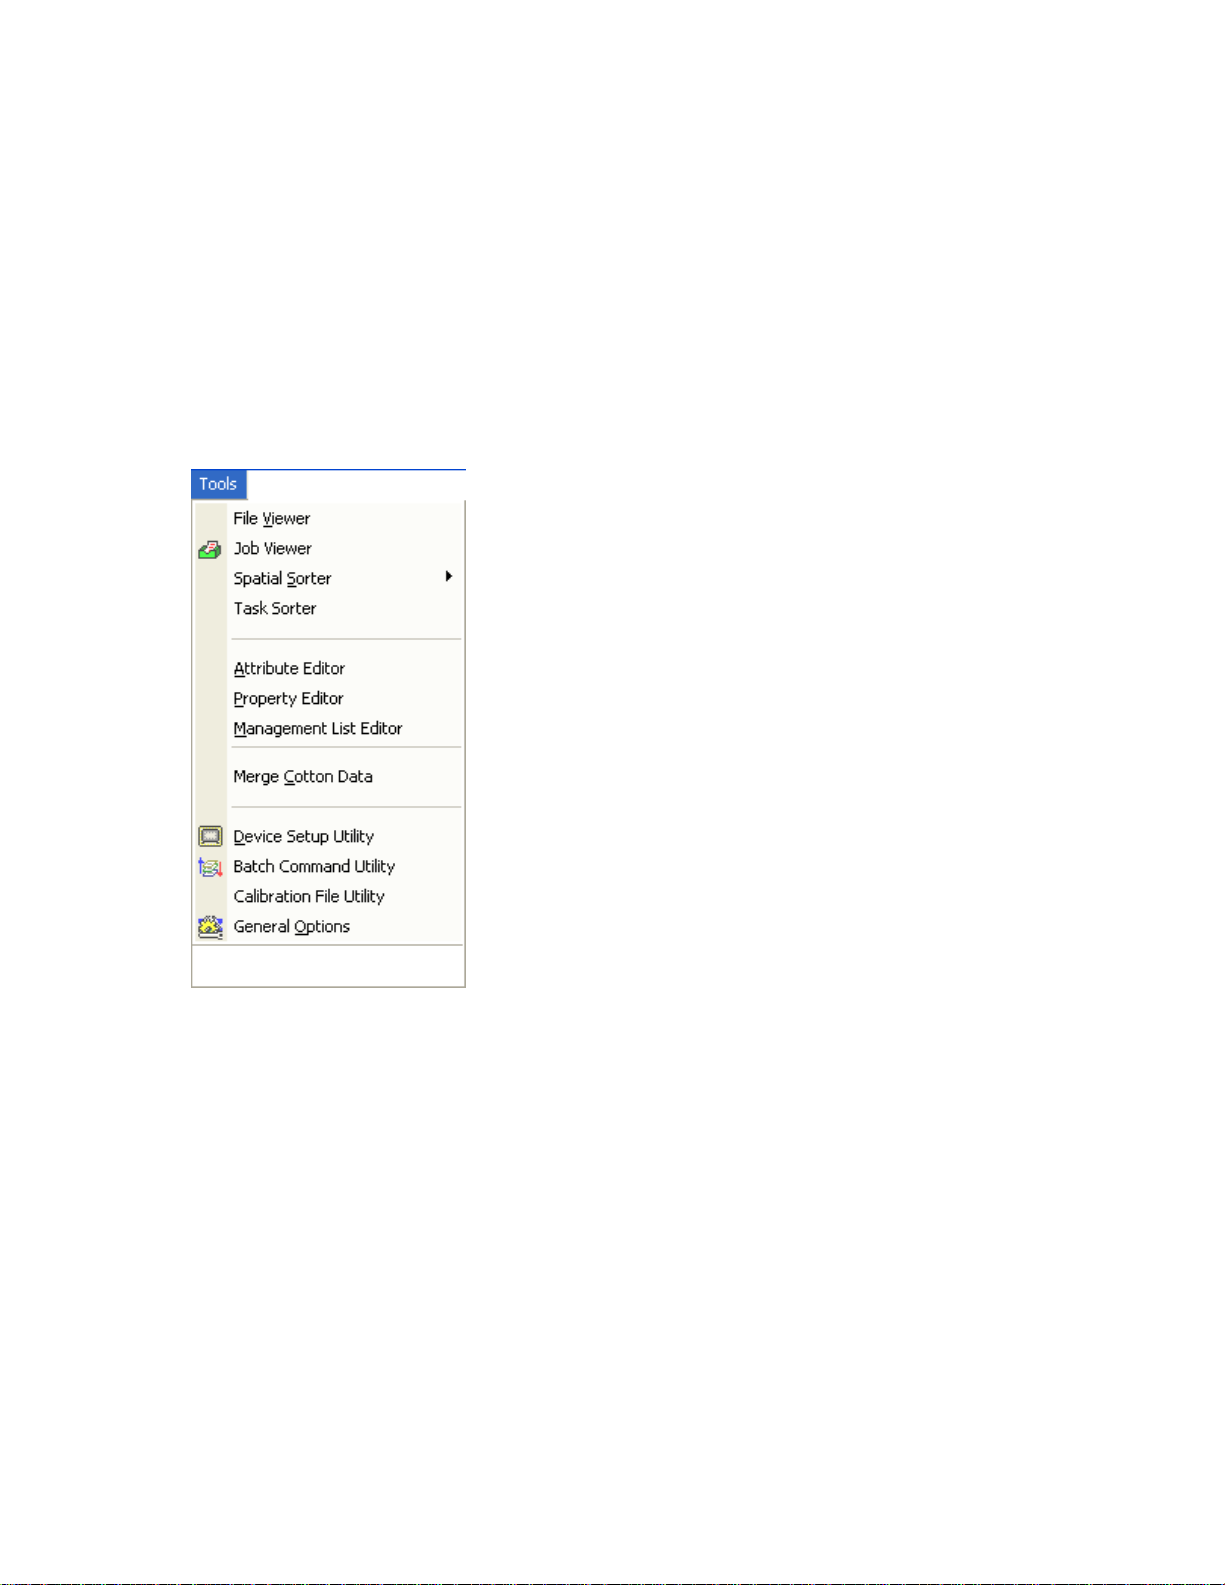
Tools Menu
r run a dataset filter based on Management Items and/or Properties and then
File Viewer
Utility that allows the user to view general information for files archived in the system and to reprocess files that may
not have been properly entered into the management system.
Job Viewer
Opens the Job Viewer which allows the addition, editing, or deletion of Jobs and their associated Tasks from the
system. This viewer can also be reached using the Job Viewer button on the main toolbar.
Spatial Sorter
Utility that sorts spatial information based on its location relative to a set boundary area. There are two options for
sorting spatially:
Sort Fields into Farms
Uses a defined boundary area for a farm to sort fields with GPS into the appropriate farms.
Sort Loads into Fields
Uses a defined boundary area for a field to sort loads with GPS into the appropriate fields.
Task Sorter
Utility that sorts datasets into Tasks and/or creates new Tasks if no matches are found based on dataset sorting
templates that have been defined by the user. It then sorts the Tasks into Jobs.
Attribute Editor
19
Page 26
SMS Basic and Advanced Manual
Allow
s the user to edit and create attributes that can be used in the system. Only a few settings can be changed for
system default attributes, such as display units.
Property Editor
Allows the user to edit and create user-defined properties that can be used in the system. System default properties
are not editable.
Management List Editor
Allows the user to select a Management Item and add new, edit, or delete items from the list of values. This editor can
be used before you read or import data into the system. It also allows you to define Resource Tracking Items such a
Operator, Vehicle, etc before reading your data into the system and allowing for easier and quicker linking of data to
Resource Tracking items when reading data into the system.
Merge Cotton Data
Allows users with cotton data to merge multiple pickings into a new, combined picks dataset. The user is required to
specify pickings (Operational Instances) to be merged. The resulting dataset is gridded, which is required to properly
total the pickings that cover the same spatial area in the same harvest season.
Device Setup Utility
Allows the user to create setup configurations containing Field names that can be exported to monitor systems from
Case IH, New Holland, and Ag Leader.
Batch Command Utility
Allows the user to apply various functions, such as the addition of properties to a group of datasets, in a batch
operation.
Calibration File Utility
Allows the user to edit or create calibration file groupings, called epochs. Epochs cover a period of time, by default a
calendar year. If need the calibration file for a epoch can be changed or a new epoch can be created to divide a year in
to two calibration groups, each with a different calibration file. This feature should not be used without first consulting
with a Technical Support representative.
General Options
Provides access to general operational settings for the entire system.
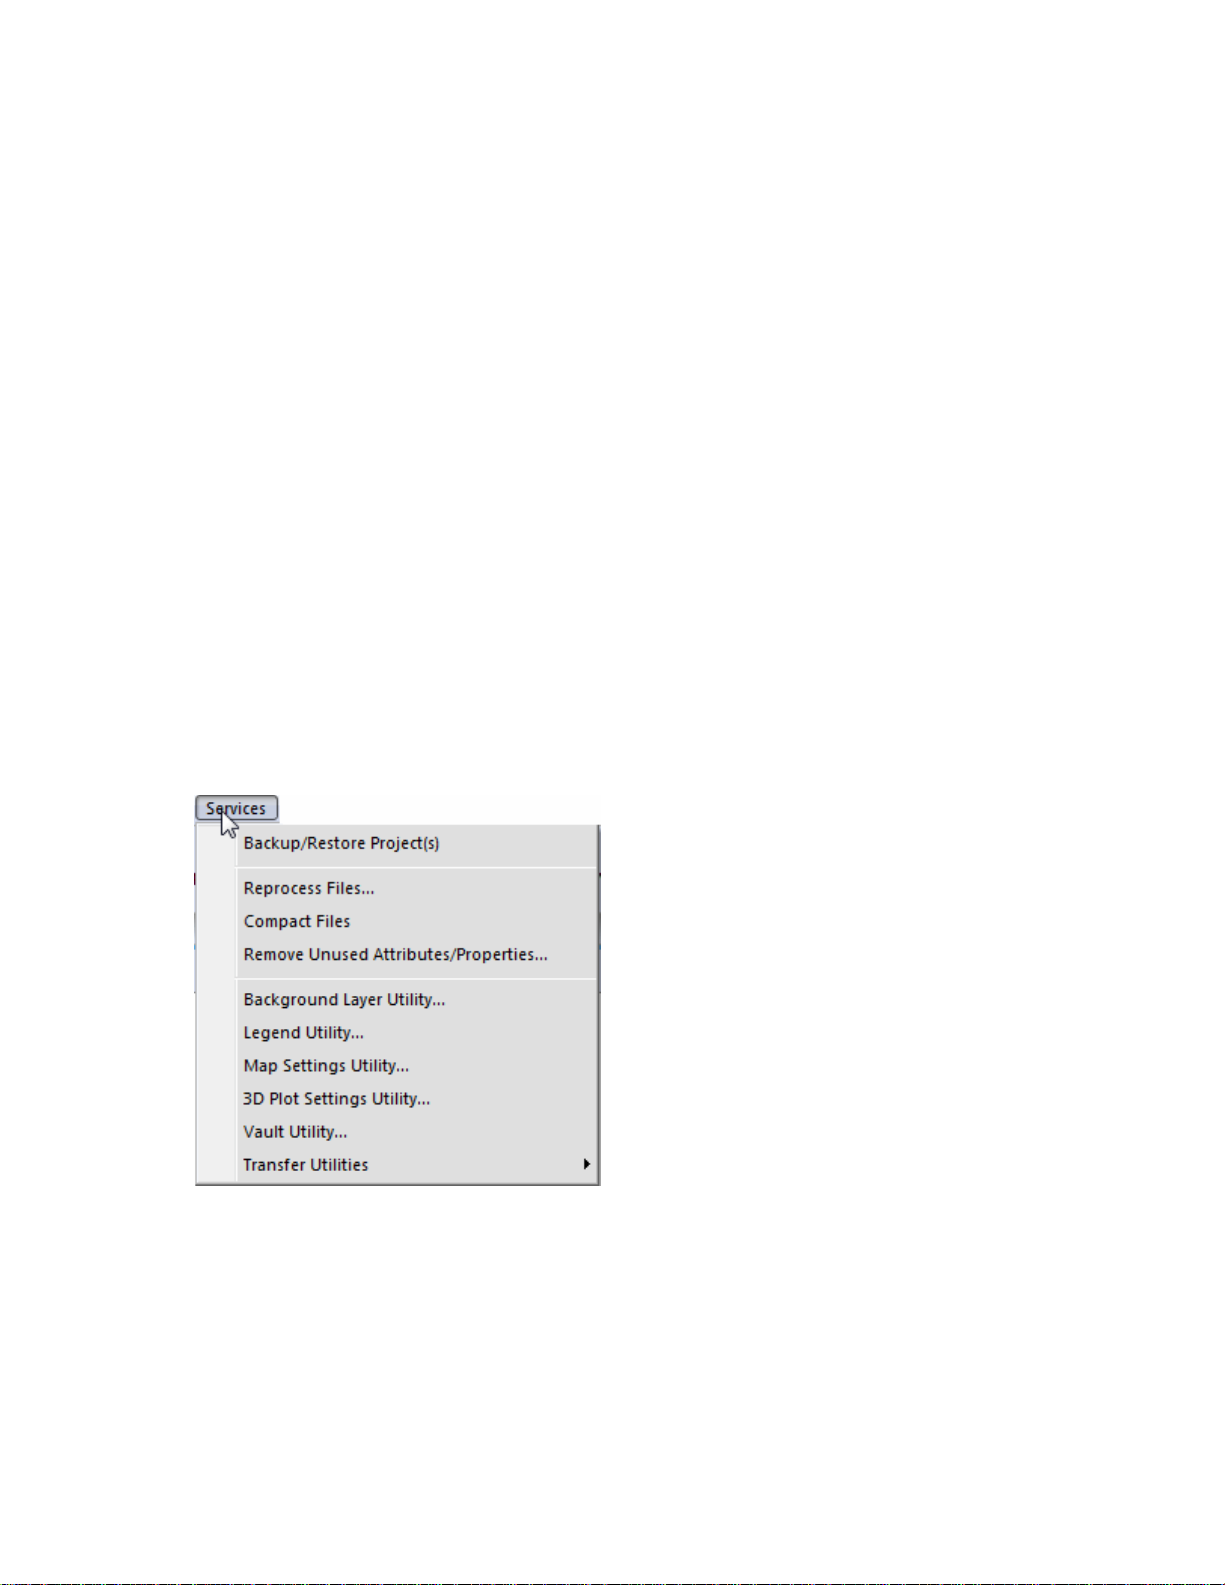
Services Menu
Backup/Restore Project(s)…
Allows the user to select from the following options related to backing up and restoring projects.
Backup Project Data Now
Allows the user to generate a compressed backup of a Project(s) and the data contained in it.
Schedule a Backup for Your Project Data (ADVANCED)
Allows the user to set a day and time to regularly perform an automatic backup of a Project(s) and the data
contained in it.
Restore Project Data
Allows the user to restore a compressed backup of a Project(s) and the data contained in it.
20
Page 27
User Interface
Reproc
ess Files
Allows the user to reprocess data archived in the system to correct proces sing
mistakes or reenter data into the management system that may have been deleted.
Compact Files
Utility that compacts the database to remove unused entries and optimize the database’s performance.
Remove Unused Attributes/Properties
Utility that checks the system for attributes and properties that are not linked to any datasets and then allows the
deletion of these attributes/properties.
Background Layer Utility
Allows the user to manage the archived background images that have been imported or saved. This includes editing
names for backgrounds, deleting them, or just viewing stats for the background files.
Legend Utilities
Allows the user to import compatible legend files from a source outside the system and export legend files to an
outside location. Also allows the user to reset the current default legend settings to the factory defaults.
Map Settings Utility
Allows the user to reset the Layer, Sub-layer, and Attribute/Property settings for a selected operation(s), back to the
system default settings.
3D Plot Settings Utility (ADVANCED)
Allows the user to reset 3D Plot settings that have been saved.
Vault Utility
Allows the user to delete unwanted copies of import files that are stored in the data vault on your computer. These files
can take up large amounts of hard drive space and may not be need to be kept on your computer. The imported data
from these files will remain in your system either as datasets in your management tree or as backgrounds until you
delete them.
Transfer Utilities
Allows the user to Import/Export system settings and setup files for use in another system or other projects in your
system.
Note: Transfer is only supported between systems that are running the same version of the software.
Import Setting and Files...
Allows the import of a transfer file. You can also selectively chose from the contents of Transfer file to only
import the setting and setup files that you want.
Export Settings and Files...
Allows the export of a transfer file containing selected settings and setup files.
Open Transfer File...
Allows the user to open an existing transfer file to view it contents and make changes if needed.
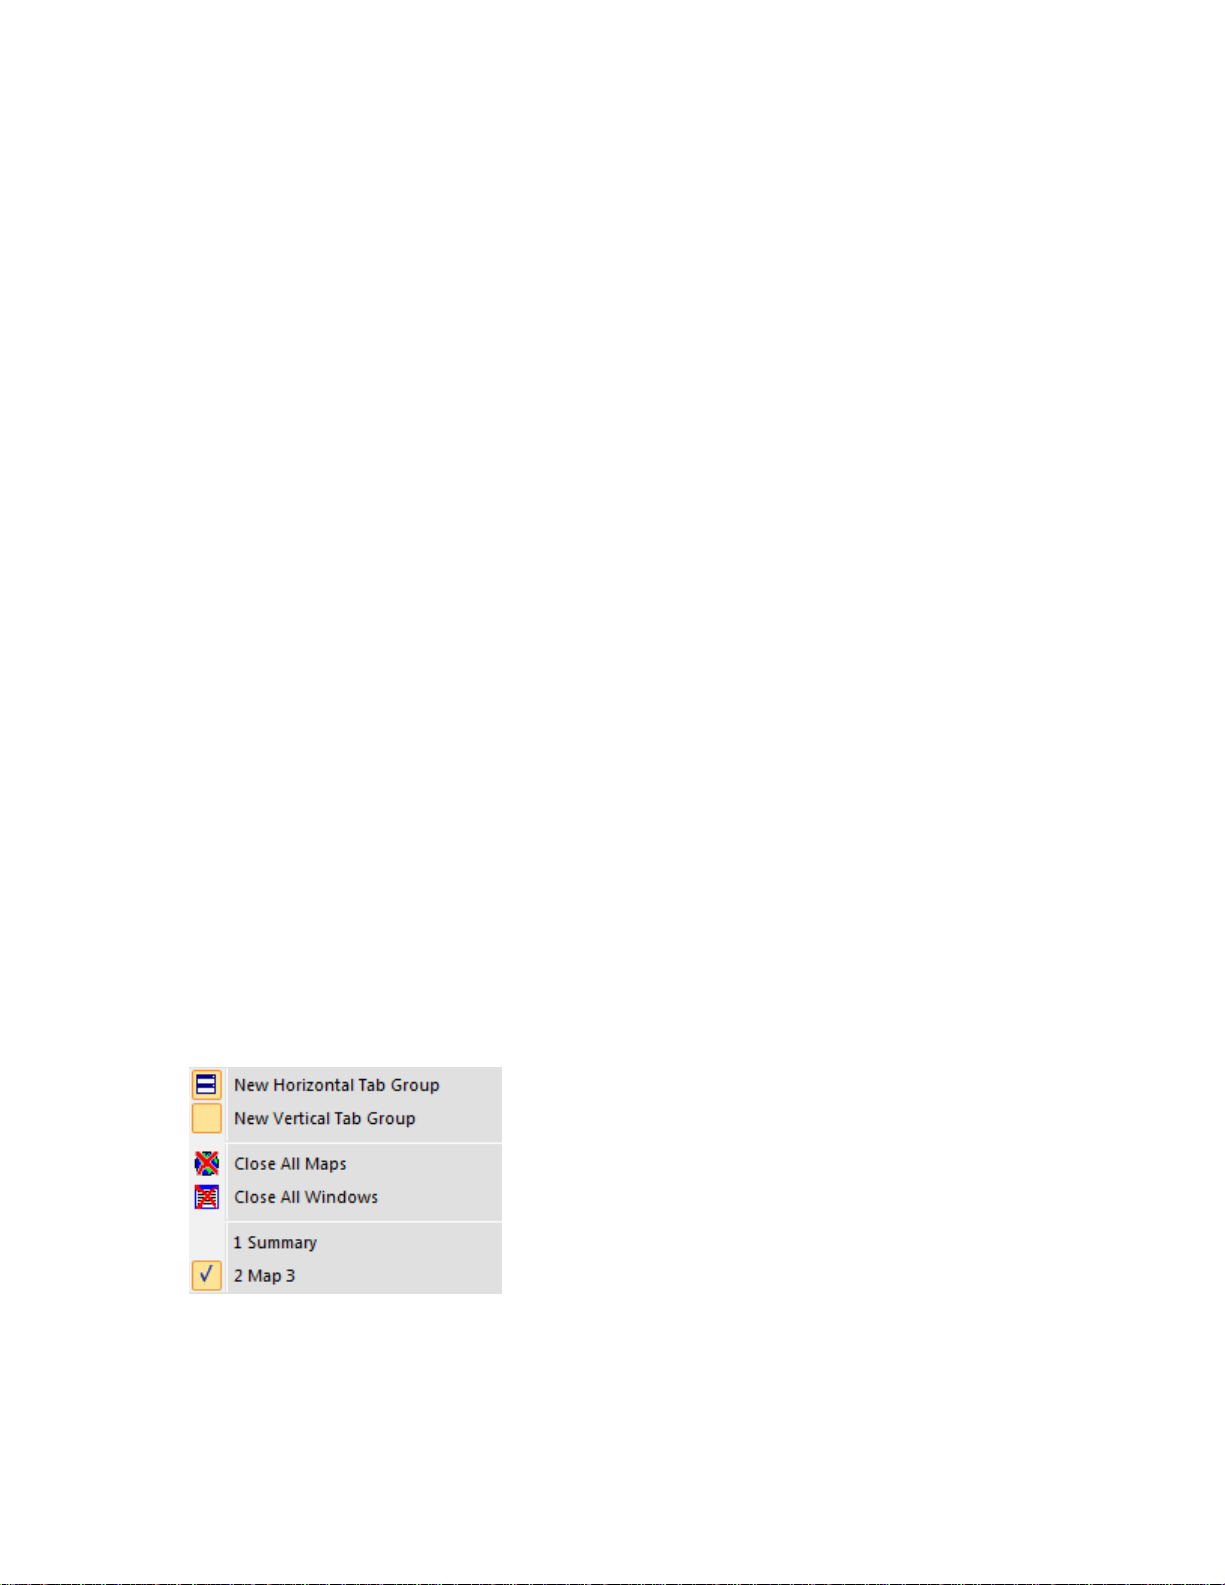
Window Menu
New Horizontal or Vertical Tab Groups
Organizes one or more tabs into horizontal or vertical groups. This allows you view and manage multiple windows at
once, such as being able to view multiple maps in their own windows at once or a summary and a map at the same
time.
Close All Maps
Closes all the windows/tabs that are map based that are currently open in the program.
21
Page 28
SMS Basic and Advanced Manual
Close A
ll Windows
Closes all the window and documents that are currently open in the program.
Active Windows List
Lists the windows that are currently open and which one is active.
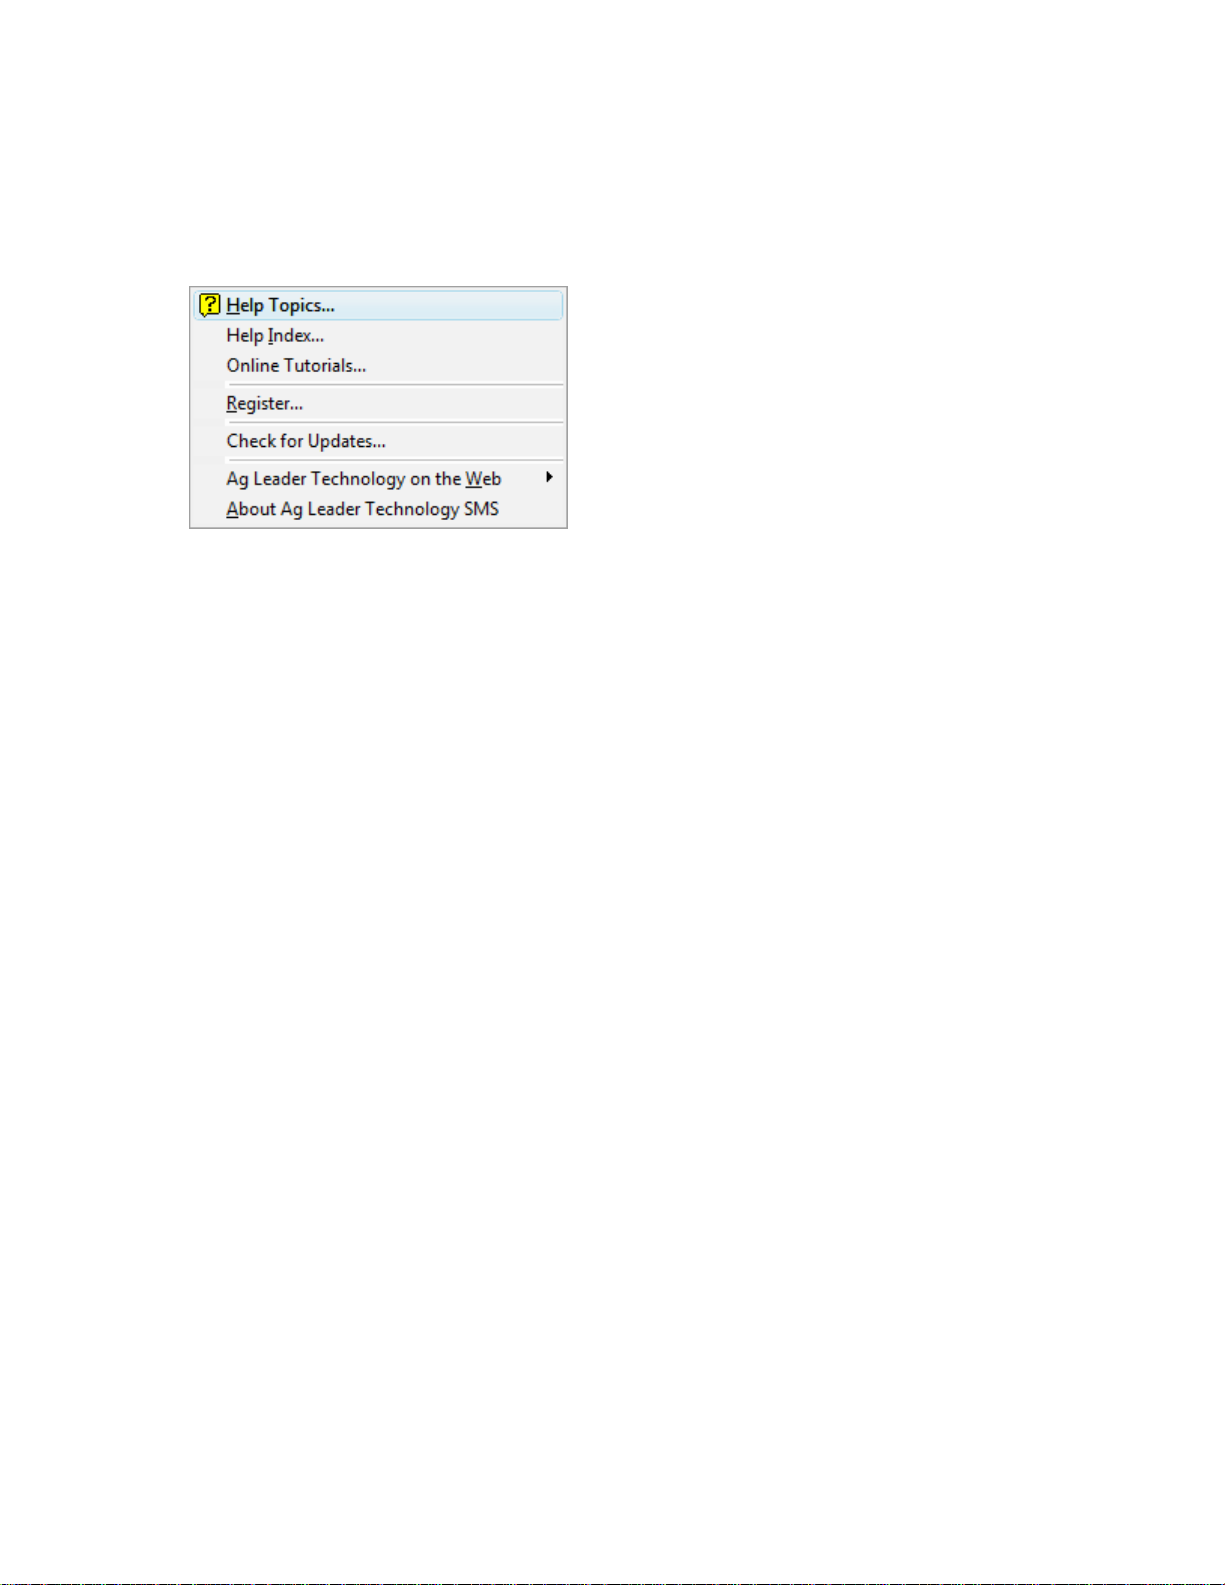
Help Menu
Help Topics
Opens the Table of Content for Help.
Help Index
Opens the Index for Help.
Online Tutorials…
Opens the SMS Tutorial located on the SMS CD. The tutorial contains step by step descriptions and video for some of
the more important functions in SMS.
Register…
Allows the user to register their copy of the software. Registration is handled via the internet by default. If you don't
have an internet connection then you can register by telephone.
Check for Updates...
If you have an internet connection this tool will check to see if you have the latest release of the desktop software, and
if you don't, it will provide the option to download and install the latest update to your software for you assuming you
can upgrade from your current version to the latest version.
Ag Leader Technology on the Web
Provides the user with links to web sites on the Internet. The following links are currently provided:
SMS Home Page
Provides the user with a link to the main page for SMS on the Ag Leader Technology web site.
SMS Links
Provides the user with a link to a page on the Ag Leader Technology web site that contains regularly
updated links to spatial data sources on the Internet that can be used in SMS Basic.
Ag Leader Technology Home Page
Provides a link to the main page of the Ag Leader Technology web site.
About ...
Version and copyright information as well as a tool to check the system information for troubleshooting.
Main Windows
General Layout
The layout of the main window is intended to help organize the large amounts of information that you will be storing,
viewing, creating, editing, and analyzing. It’s also intended to reduce the learning curve associated with some other
precision farming software packages by presenting a consistent and intuitive interface.
22
Page 29
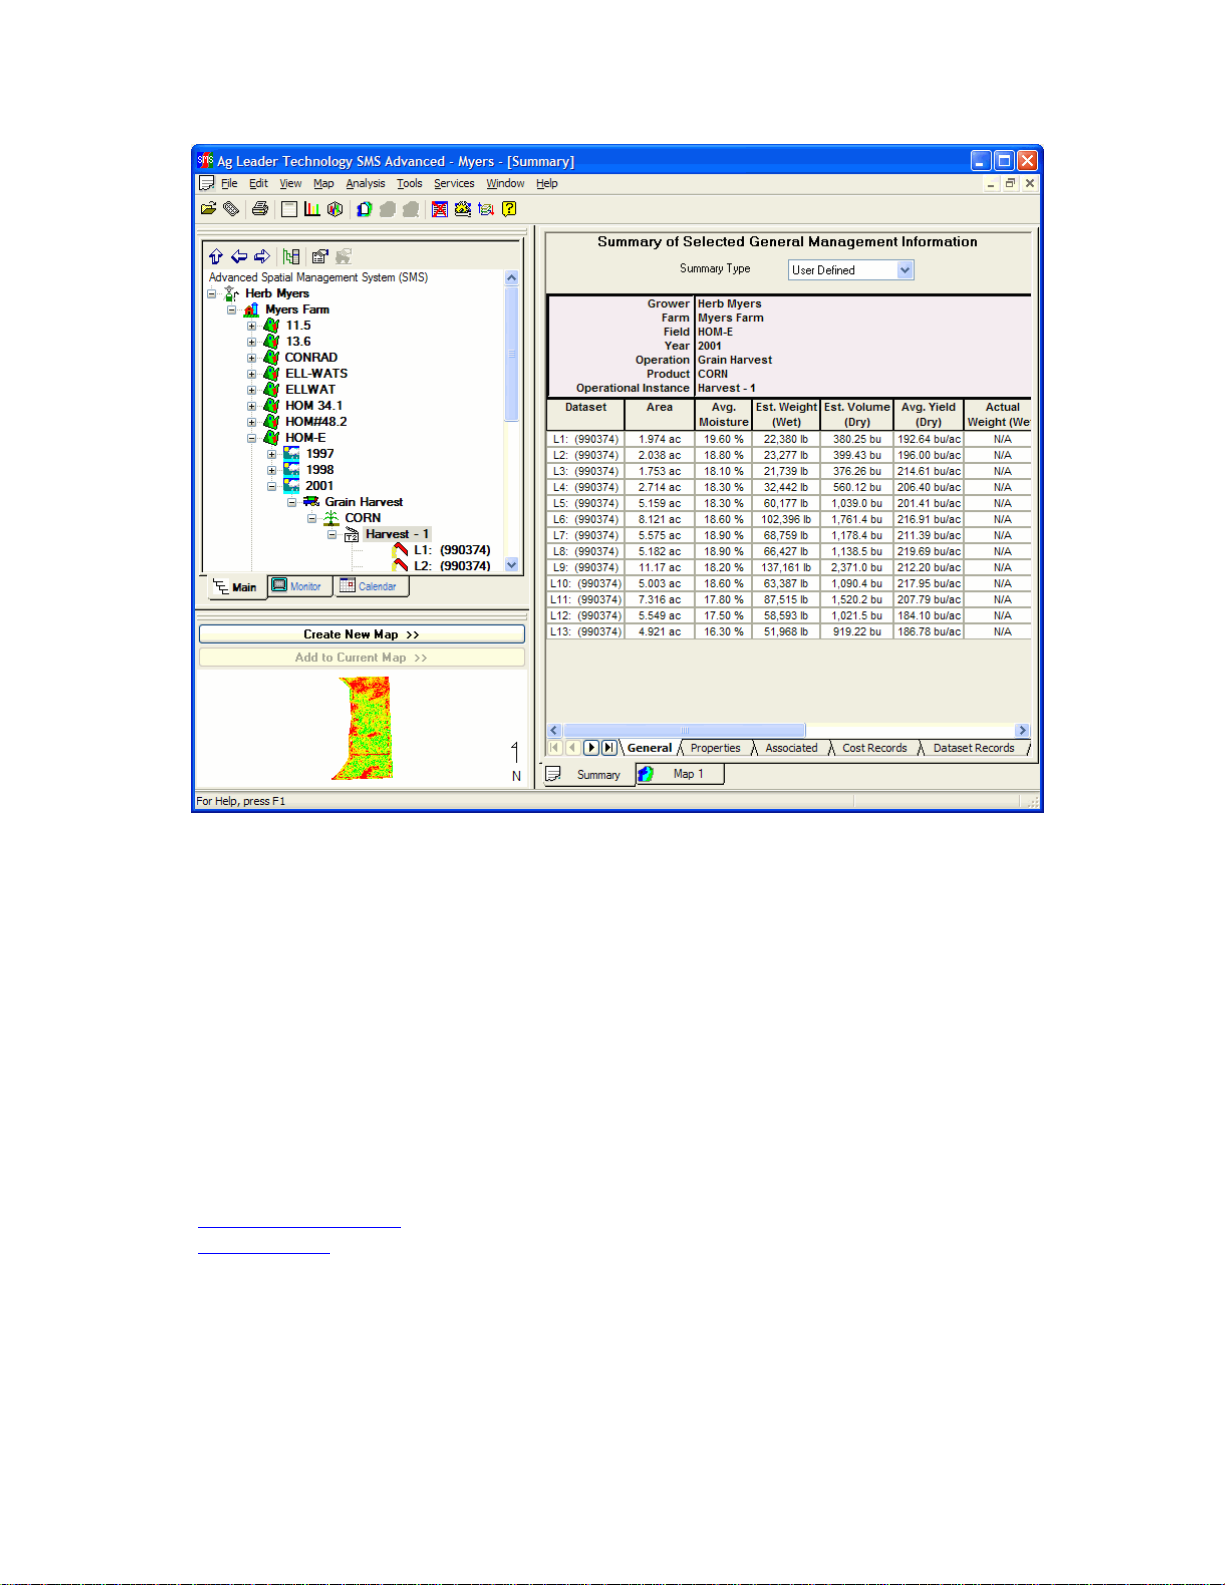
User Interface
Move the cursor over an area you would like more information about and if a hand icon appears click the left
mouse button to see more information.
Management Views
About the Management Tree
The Management Tree allows you to select, manage, and view the data that is stored in the management system. It
provides a visual interaction with your data when deciding what data that you would like to work with since your
selection(s) is tied to what is displayed in the Preview Window. There are two tree options available, the Main Tree and
the Monitor Tree. By default when the Management Tree is discussed, the Main Tree is what is normally being
referenced. The Main Management Tree displays and manages data in its logical form and displays information for all
types of data that have been archived, created, or imported. The Monitor Tree adds a different dimension to the data
management and displays only the data that was logged by a Case IH, New Holland, or Ag Leader monitor and
displays the management items as they were logged in the monitor. We call this a physical tree, which means it is
directly linked to what was logged. You can view and map data based on which monitor it can from and also see what
field numbers data was logged to and the names that were used. No editing or management options are available
when in the Monitor Tree.
How to Information and Other Links:
Using the Management Tree
Data Management
23
Page 30
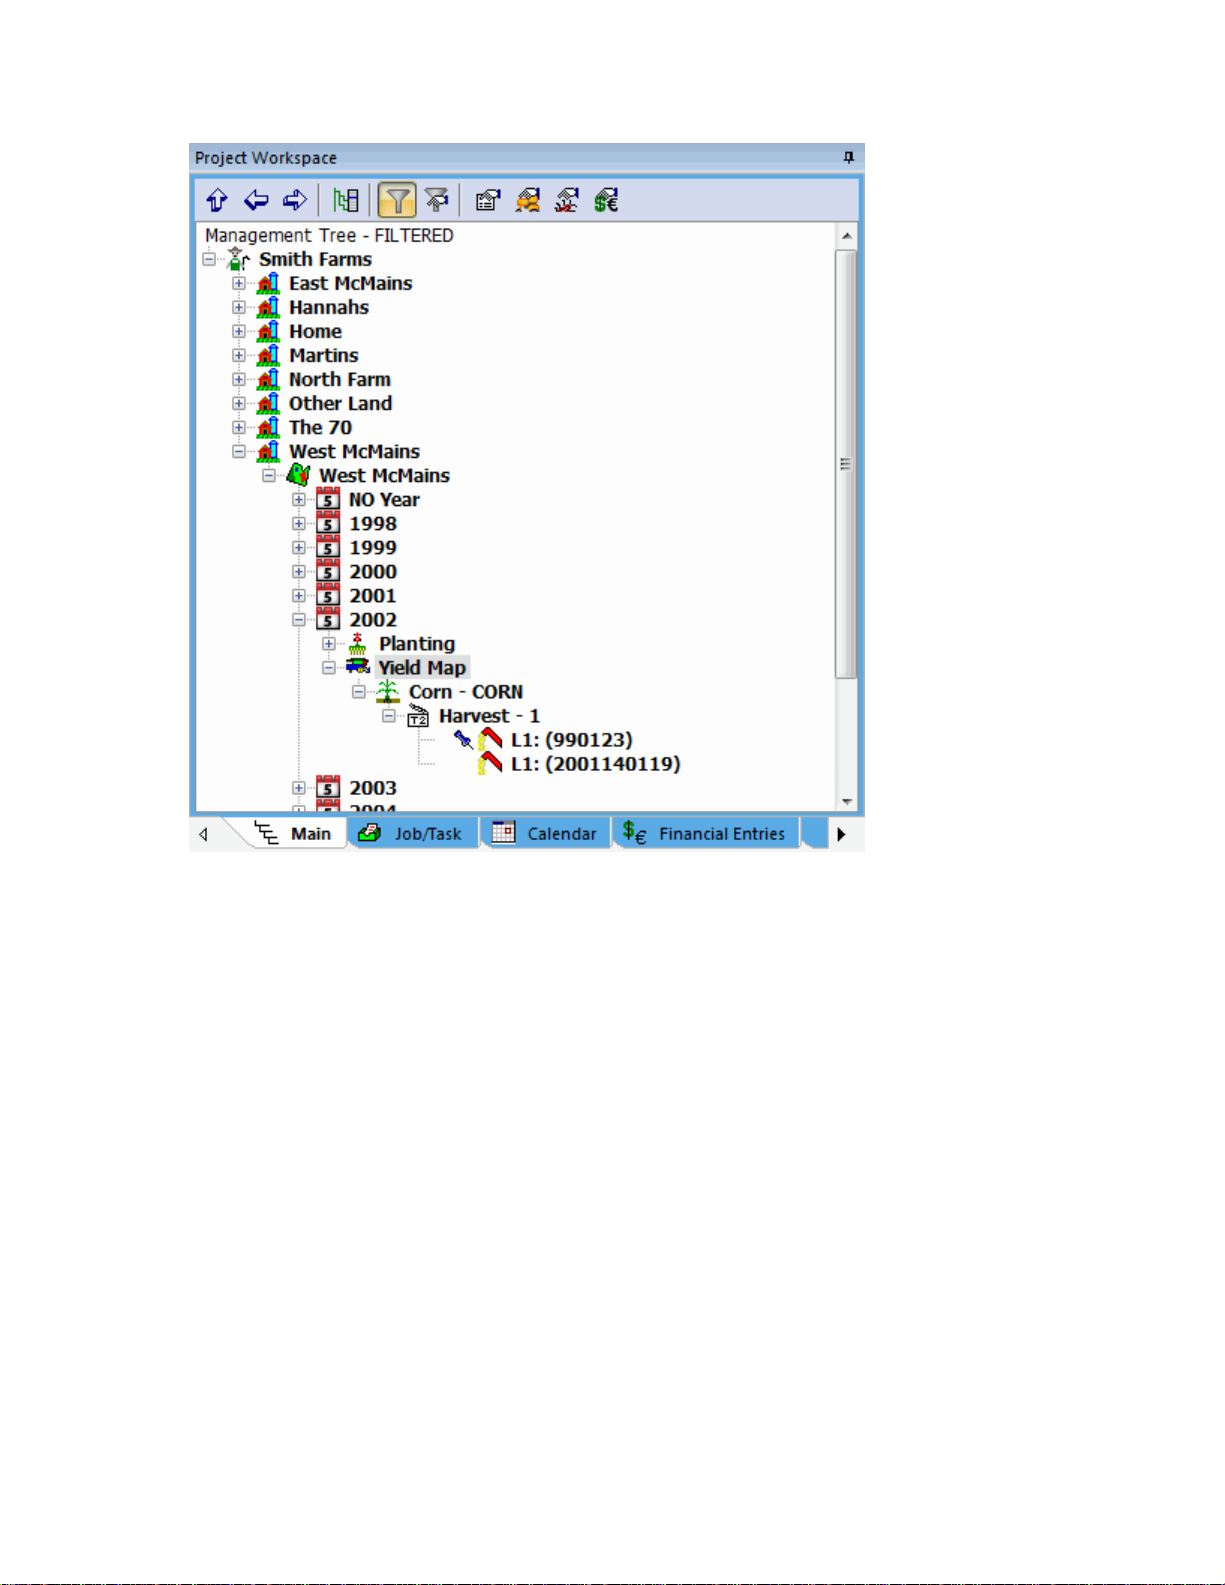
SMS Basic and Advanced Manual
Management Tree Toolbar
Collapse
Click this button to collapse the entire management tree, closing all the branches that are currently open to
the Grower Level.
Collapse Item
Click this button to collapse the management tree up to the currently selected level in the tree.
Expand Item
Click this button to expand the management tree below the currently selected level, opening all branches
below the current selection.
Show Management Tree Menu
Click this button to open the Management Tree Menu. This menu can also be opened by right clicking your
mouse in the management tree window.
Enable/Disable Management Tree Filter
Click this button to enable or disable the Management Tree filter. Once a filter is set you can use this
button to toggle the filter on and off without having to reset or clear your filter manually.
Edit Management Tree Filter
Click this button to open a Data Filter dialog that allows you to select the management items and/or date
ranges for data that you would like to be displayed in the Management Tree. For example you can select a
Year filter to only show data from the current year in the Management Tree.
Edit Item
Click this button to view and/or edit the settings or properties for a selected item in the management tree.
Edit Resource Tracking
24
Page 31

User Interface
Click this button to assign or edit r
Vehicle, Implement, and Containers.
Edit Pest
Click this button to assign or edit a Pest that can be assigned to a dataset. A Pest can be assigned to any
dataset and not just Scouting datasets.
Edit Expense/Income
Click this button to enter/edit simple expense/income values for things like product purchases, commodity
sales, or application expenses. This option is ONLY available at the Product, Operational Instance, and
Dataset levels in the tree.
The Management Tree is organized in the following structure:
Level Example
Grower Jim Farmer
Farm Jim’s Farm
Field North 31.6
Year 2001
Operation Type Spraying
Crop/Product Roundup
Operational Instance First Spraying
Load or Region L1
The Monitor Tree is organized in the following structure:
Level Example
Monitor SN 920305
Year 2001
Field North 31.6
Operation Type Spraying
Crop/Product Roundup
Load or Region L1
Operational Instance is an item in the Management Tree that may not be familiar to you. Operational Instance provides
a means for handling multiple field operations on the same field, same year, and same crop/product. This is useful for
cotton growers who pick their cotton fields twice, within the same harvest season. It is also useful when you have to
spray a field twice with the same chemical in the same season.
To assist in the handling of large amounts of data, not all of which may have GPS, the Management Tree displays data
with GPS in bold font and data without GPS in a non-bolded font. This allows for quicker selection of data that actually
contains data that can be mapped or allows you to close the preview window and make selections to map from the
tree based on their bolding.
Management Tree Menu
To access the options menu for th
Advanced Menu:
e Management Tree click the right mouse button with an item selected in the tree.
esources that can be assigned to a dataset, such as an Operator,
25
Page 32

SMS Basic and Advanced Manual
Edit Item
Allows the user to view and/or edit the settings or properties for a selected item in the management tree.
Reassign Resource Tracking
Allows the user to assign or edit resources that can be assigned to a dataset, such as an Operator, Vehicle,
Imple
ment, and Containers.
Reassign Pest...
Allows the user to assign or edit a Pest that can be assigned to a dataset. A Pest can be assigned to any dataset and
not just Scouting datasets.
Edit Expense/Income
Allow
s the user to enter/edit simple expense/income values for things like product purchases, commodity sales, or
application expenses. This option is ONLY available at the Product, Operational Instance, and Dataset levels in the
tree.
Enter Manual Summary Values
26
Page 33

User Interface
Allow
s the user to enter manual summary values at the Operational Instance level. Entered values will be distributed to
all loads/regions tied to the Operational Instance you have selected. You can still edit individual load/region summaries
via Edit Item for a selected load, but this option allows you enter in totals for a set of loads/regions and let the software
properly distribute the total to each load/region for you.
Alter List
s a list of all the logical items in the system for the selected item type. You can create, edit, or remove logical
Display
items from this dialog, even if they are not being used currently.
Delete Branch
Deletes the selected item and eve
the system, only the Management Tree information. Deleted items still remain in the system, to completely remove
them use the Alter List… selection described above.
Move Branch
Allow
s the user to manually change the management settings for a selected item in the Management Tree.
Edit Associated Data
Allow
s the user to view, edit, or add an Associate dataset, such as a Scale Ticket or Note.
Reassign Associated Data
Allow
s the user to edit the linkage of an Associated dataset to a management item(s) or remove it from the system
completely.
Spatial Sorter
Sorts spatial information based o
tree will only apply the sort to data that is below the current management level selection. Thus you can sort a selected
Grower or Farm only versus the Spatial Sort option located under the Tools menu which will sort all data in the system.
There are two options for sorting spatially:
Sort Fields into Farms
Uses a defined boundary area for a farm to sort fields with GPS into the appropriate farms.
Sort Loads into Fields
Uses a defined boundary area for a field to sort loads with GPS into the appropriate fields.
Merge Fields
Allow
s the merging of two logical fields into one. This option properly alters the data management for the merged fields
so that any changes or new data that is read in will automatically apply to the merged location.
Split Load /Region
Allow
s the user to split and sort a selected load/region into the appropriate spatial location even though it may have
been logged improperly. Once a load/region is split, it can will not be updated with new data or recalibrated when
adjusted data files are read in. This option should only be used once all related data has been read into the system
and you are ready to place the data in the proper spatial location.
Create As-Applied Data (Split Planter or Multi-Product)
Allows the user to create split planter or as-applied data from data that was not logged as such but was actually
planted with a split planter configuration or cases where one product was logged but in reality multiple products were
actually applied from different application operations. This option can only be applied to Site Verification or Application
operation types and is only available when a dataset of this type is selected in the tree. By selecting the Operational
Instance level in the tree, you can create new data for all the loads/regions listed below the instance or by selecting
individual loads/regions. There is also a batch function that allows you to create new as-applied data in bulk. Beyond
the ability to create split planter data a common use may be for data that was logged as Site Verification in the field but
you would document that a multi-product and multi-operation event occurred such as planting and fertilizing at the
same time. This tool allows you to easily generate Planting and Fertilizing as-applied data from the Site Verification
data that was logged.
Create Installed Tile Data
Allows the user to create an Installed Tile dataset from an existing Ti
useful when a plan was made but the installed data wasn't collected or was lost. The Installed Tile dataste can then be
exported back out to the display as a reference layer.
Trace Boundary
Allow
s the user to generate a new boundary that exactly traces the swath edges of a selected dataset(s) in the
management tree. This option is not the default for the system because it does not allow for automatic
building/updating of boundaries when new data is read in. It is a manual process and requires data to be specifically
selected to trace. This function can also be run in batch via the Batch Command Utility. Please also note that Trace
Boundary is a slower process than either Regenerate Boundary or Freeze Boundary because of the detail at which it
traces your selected data.
Regenerate Boundary
rything below it in the Management Tree. This does not remove archived data from
n its location relative to a set boundary area. Using this tool from the management
le Plan dataset. No settings are required. This is
27
Page 34

SMS Basic and Advanced Manual
Regenerates the
Freeze Boundary… selection.
Freeze Boundary
rates a vector boundary area for the selected automatic boundary area that the system generates. The vector
Gene
boundary area is required to use the Spatial Sorter.
Set as Field Boundary
s the user to set a manually created or imported boundary or dataset as the Field boundary that is displayed.
Allow
Regenerate 3D Grid (ADVANCED)
Regenerates the automatic 3D grid surface that is used to display a 3D terrain map of your data. By default the
software uses all the data read into the system to build the 3D grid surface but if errors are contained in some data that
is read in it may be necessary to pick only the data that contains good elevation data and use it to regenerate the
surface.
Set 3D Grid (ADVANCED)
Allows the user to select an imported dataset that contains elevation, swath, and distance data in it to use as the 3D
grid surface required for 3D mapping in place of the automatic 3D grid surface that the software generates. DEM
(Digital Elevation Model)files are the most common file type that could be imported for this purpose, but any of the
supported import files could be used as long as they contain an Elevation, Swath Width, and Distance Attribute.
Add Simple Analysis
Allow
s the user to apply a simple analysis function to a dataset. Examples are Scale, Filter, and Normalize. Once a
simple analysis function is applied to a dataset, it will be displayed in the management tree with a summation icon next
to it which indicates that a simple analysis function has been applied to the dataset, thus modifying it from its original
state when it was read into the system.
Reprocess Analysis
Allow
s the removal, editing, or addition of a simple analysis function for a selected dataset(s). Once all functions have
been removed from a dataset, the raw values will again be displayed and accessible.
Update Analysis Dataset
s the updating of the data that was input into a full analysis function, such as Merge Cotton Data. If new data has
Allow
been read into the system that should be have been or needs to be applied to your analysis result, then selecting this
function will load the latest data available into the analysis function, re-run it automatically, and re-save the new result
dataset over the old data. This saves you the steps of having to manually delete the current analysis results from the
management tree and then re-run the analysis function from scratch.
Reprocess Data
Allow
s the user to reprocess a selected dataset in the Management Tree. Depending on the dataset type, you will be
given options that can be changed or set to effect how the dataset is processed such as data filters and GPS
corrections.
Copy Dataset to Background List
Allows the user to copy a dataset from the Management Tree into the list of available backgrounds. This is very useful
if you've imported data that needed to be edited or that you decide you would just like to use as a background instead
of having it in the Management Tree.
Export
Allows the export of data from the level that is currently selected in the Management Tree.
automatic boundary area based on the selected dataset in the Management Tree. This will undo the
About the Job/Task Tree
The Job/Task Tree allows you to select, view, and edit Jobs and Tasks that you have created. A Job is defined as one
or more Tasks that you plan on occurring during a specified time span. A Task is defined as an operation(s) that you
plan to occur in a specific field during a specified time span. Multiple Tasks can be added to a Job and multiple
operations can be set for a Task. An example would be that you make a Job for your spring planting. You add a Task
for each field you plan to plant, set the Planned datasets for each field to the planting prescription for that field and
leave the Actual datasets selection blank. After you plant your fields and read in the as-applied data, you can then link
the actual planting data to the planting Task for each field. You then have a record of what you planned to do in each
field and what actually happened. Jobs and Tasks also provide a very convenient and easy way to setup your devices
(monitors) and export all the prescriptions that you wish to use, in one process, instead of exporting each field
individually. A summary of the Planned vs Actual values can also be seen based on selected levels in the Job/Task
Tree.
28
Page 35

User Interface
About the Calendar View (ADVANCED)
The Calendar View is a new and unique way to summarize, view, and edit your data. The Calendar View provides
access to your data based on when it was actually logged. This allows you to examine the time it took you to get a field
planted or harvested for example. Or by setting different filters and grouping options, you can see how long your entire
Corn harvest took. The calendar displays data as events, or spans of data based on a selected grouping or type, such
as a Note. These selection options allow you map the selected data in the calendar as well as view a summary of the
selection.
29
Page 36

SMS Basic and Advanced Manual
Move the cursor over an area you would like more information about and if a hand icon appears click the left
mouse button to see more information.
Using the Calendar View.
Calendar Summary Window
Calendar View Window
Print Calendar
Click this button to print the current calendar view.
Calendar Data Filter
Click this button to set a dataset filter for the data to display in the calendar view.
Calendar Data Grouping
Click this button to set the grouping of data displayed in the calendar view. An example would be to set the grouping to
display events in the calendar by Field, Product, and Operation.
Month/Week/Day View Type Selection
Allows the selection of the view type for the Calendar View. You can select to view events on a Month basis(35 days at
a time), a Week view (7 days at a time), or a Day View which shows events for a day from 12 AM to 12 PM.
Date Selection
Allows the selection of a date to display events for, before, or after.
Calendar Menu
Add Event...
Select this option to add a manual event, such as a text Note. This allows you to make notes to document
events on certain days that you want to keep track of.
View/Edit Event...
Select this option to see a more detailed view of an event, such as the datasets it covers, the time span it
covers, etc.
Delete Event
30
Page 37

User Interface
Select this option
Move Event
Select this option to move a manual event that has been added to a new location on the calendar.
Adjust Event Start
Select this option to adjust the start date of a manual event.
Adjust Event End
Select this option to adjust the end date of a manual event.
to delete a manual event that you have selected.
About the Financial Entries Tree (ADVANCED)
The Financial Entries Tree allows you to add, edit, delete, and view Financial Tracking entries. When entries are
selected a summary of the entry will be displayed in the summary document. Click the Add Item icon in the toolbar to
add an entry to the tree or right click in the tree area and select Add Item.
Preview Window
About the Preview Window
The Preview Window allows you to quickly and easily see if spatial data exists for a selection(s) in the Management
Tree. It is a powerful tool that allows you to decide what data to create a new map of or add as a layer on an existing
map. It can also be used in the Job/Task Tree when a selection is made at the Operation level or lower.
31
Page 38

SMS Basic and Advanced Manual
Create New Map >> Button
Click this button w
Add to Current Map >> Button
Click this button w
Map Data Preview Window
indow displays a preview of map data, if available, for the current selection in the Management Tree.
This w
How to Information and Other Links:
Using the Preview Window
How to make a map.
How to Add a Layer to a Map
Document Windows
hen it is bold to add the data in the window below to a new main map window.
hen it is bold to add a new layer to the active map using the data shown in the window below.
About Document Windows
The Document Windows provide a means for displaying maps, reports, charts, results, summaries, etc. They are the
main mechanism in the software for viewing and printing information in the system.
All Document Window names can be edited by clicking your right mouse button on the document tab name and
selecting the Rename Tab option from the menu that appears. Documents can also be closed from the same menu.
Summary Window
The Summary View displays the summary information for the current selection in the Hierarchy Tree and either the
Monitor, Spatial, Manual, or User Defined Summary types. The example below shows a load summary for a field so
that is selected in the Management Tree. The Operational Instance is selected for a particular Operation Type and
Crop/Product, thus displaying all the loads for that instance. Summary information can also be viewed for the
Properties, Associated Data , Financial Tracking Entries , and individual spatial record values that are tied to the
current management item selection.
How to Information and Other Links:
32
Page 39

User Interface
Select/Edit Summary
How to change the items displayed in the summary.
How to print the Summary Window Information.
Basic:
Items to be Displayed
Advanced:
33
Page 40

SMS Basic and Advanced Manual
Summary Type Selection
tions are available for displaying different types of summary information:
Four op
Monitor Summary
Displays summary results based on monitor totals only. Select this option if you want to see summary
results that match the closest with what you saw on your monitor in the field.
Spatial Data Records
Displays summary results based on spatial data only.
Manual Entries
Displays summary results that have been manually entered into the software by the user.
User Defined
Displays the custom summary results that can be defined and edited under the Edit Menu and General
Summary. The software defaults to this option and the default setup is a mixture of Monitor and Spatial
Data Record summaries.
Summary Tabs
General
Displays summary information for the currently selected management item in the Management Tree or for
a calendar event selected in the Calendar View .
Properties
Displays the properties and Resource Tracking entries (Only at the dataset level) for a selected
management item in the Management Tree.
Linked Items
Displays the items that have been linked to the selected management item in the Management tree.
Images, documents, or any file can be linked to a management item. From this window you can view or
open a linked item or create a copy of the linked item to be saved at a location you select, such as on a
PC card, USB stick, or server location.
34
Page 41

User Interface
A
ssociated
Displays associated data entries for a selected management item in the Management Tree.
Financial Entries (ADVANCED)
Displays the Financial Tracking values for a selected management item in the Management Tree or
displays a Financial Tracking entry definition(s) based on a selection in the Financial Entries Tree..
Dataset Values
Click the Load Raw Data button to load the actual data entries for a selected dataset(s) in the
Management Tree. This is very useful for viewing soil sampling results or values for a group of polygons
like a soil type mad. The main difference between this tab and the General Summary tab is that the
General tab shows totals and/or averages for the entire dataset and not the individual entries that make up
the dataset. It is not advised that this option be used on large yield datasets, as it can take a long amount
of time to load and display all the raw data for these types of datasets.
Map Window
The Map View contains the map display, map toolbar and the Layer window. Multiple Map Views can be created and
toggled.
How to Information and Other Links:
Mapping
How to make a map.
How to Add a Layer to a Map
Basic:
Advanced:
35
Page 42
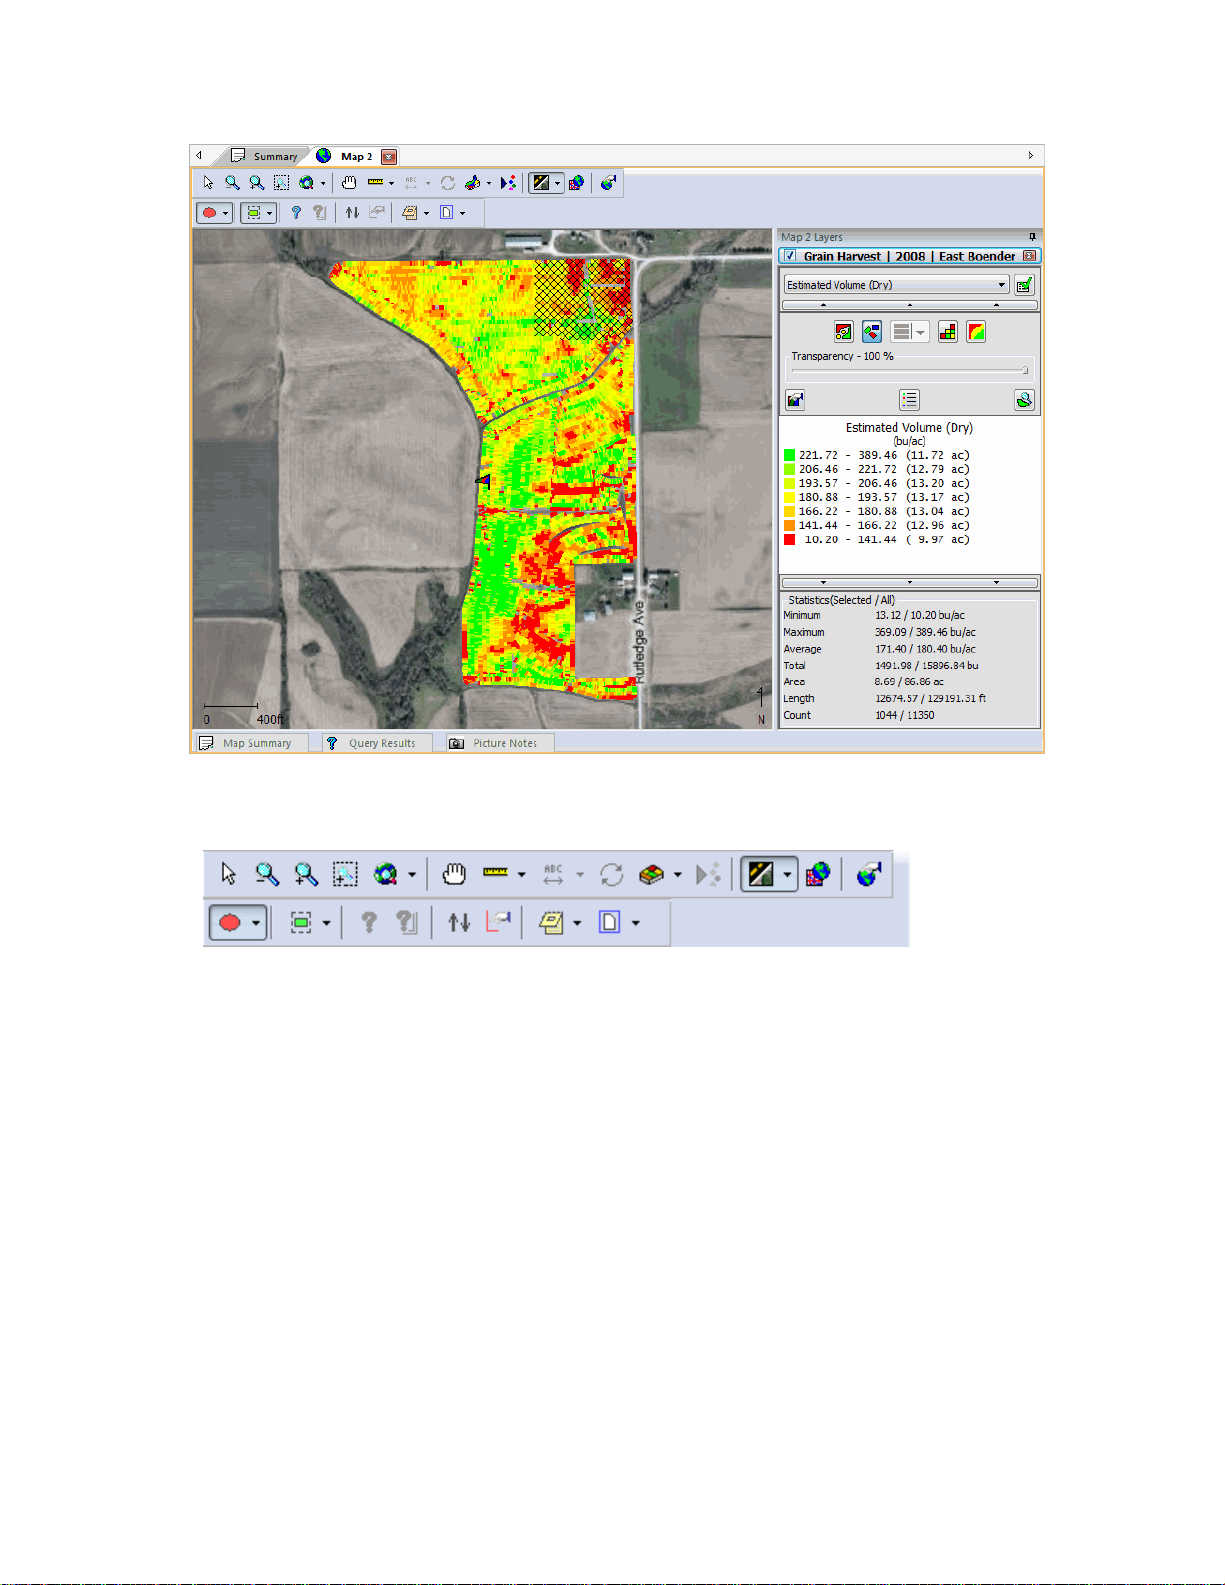
SMS Basic and Advanced Manual
Move the cursor over an area you would like more information about and if a hand icon appears click the left
mouse button to see more information.
Map Window Toolbar
Reset Cursor
Resets the toolbar selections so that none are selected. This is useful if you want to cancel a selected function on
the toolbar.
Zoom Out
Click this button to scale the map window out once.
Zoom In
Click this button to scale the map window in once.
Zoom to Box
Click this button to zoom to a box area defined by the user.
Specialty Zooms
Zoom World
Click this button to zoom to the extent of all data currently on the map.
Zoom Previous
Click this button to zoom to the last zoom extent.
Zoom Selection
Click this button to zoom to the current layer selection.
Pan
Allows the user to drag the current contents of the map with the mouse in any direction.
36
Page 43

User Interface
Measure
Line
Tape measu
between the points.
Multi-Line
Tape measure feature that allows the drawing of multiple, connected line segments and see a running
total of overall distance from the start of the first segment to the endpoint of the last one.
Label Tools
Move Label
When User-Defined is selected on the Label Placement tab when editing Layer Options, this option will
become active. When selected it allows the user to drag labels to any location on a map. To use, click on
an object on the active layer that you want to move a label for and hold the mouse button down. The
cursor will jump to the label location. Keep the mouse button held down and move the label to the desired
location and then release the mouse button. Any label adjustments made from the map toolbar will not be
saved after the map is closed. Only label changes made in an editor can be saved.
Label Settings
Allows the user to set various parameters for the display of labels for each object in a layer when User-
Defined has been selected as the Label Placement type. Click on an object in the active layer to edit its
label properties. Any label adjustments made from the map toolbar will not be saved after the map is
closed. Only label changes made in an editor can be saved.
Rotate Map (ADVANCED)
Allows the user to rotate the 3D view about the X, Y, and Z axis.
Hide/Show 3D View (ADVANCED)
Allows the user to toggle between displaying the current map in 2D or 3D view.
Reset Map Rotation (ADVANCED)
Allows the user to reset the orientation and zoom level of the current 3D view to the default orientation.
Dataset Playback (ADVANCED)
Opens the Dataset Playback viewer which allows you to replay a logged field operation such as harvest or planting.
You can control the speed at which the data plays as well as transparency, legend, etc. Multiple vehicles can also be
played at the same time, such as if you harvest a field with two combines equipped with yield monitors and GPS.
This playback tool only works with data that contains swath width and date/time data, which is required to play the
data back based on time. The playback also displays a real-time summary of the data as you play it, displaying the
instantaneous value of the points as they are mapped as well as a running average and total for the data.
Internet Based Background
Allows the user to select which internet based background they would like displayed in their map, if any. You can
select None, Aerial, Road Map, or a combination of aerial and road map. These backgrounds are not saved in the
management tree or anywhere else in the software, they are temporary in nature and downloaded dynamically.
Set Background
Allows the user to select a background(s) to be viewed on the active map.
Map Options
Allows the user to edit the map options for the active map.
Select Type
Select Objects
When this selection type is selected, entire objects are selected when using one of the selection tools. For
example if Select Polygon is selected and you draw a selection that crosses the edge of a polygon, the
whole polygon will be selected not just the intersected area.
Select Intersections
When this selection type is selected, only the intersected area of an object is selected. For example if the
Select Polygon tool is selected and a region is drawn across a quarter of a line segment, then only that
length of the line that fell in the selection area will be selected.
Select Tools
Select Point
Allows the user to select an individual spatial point.
Select Rectangle
Allows the user to select a region with a box.
re feature that allows the user to select a start and endpoint for a line and see the distance
37
Page 44

SMS Basic and Advanced Manual
Select Pol
Allows the user to select a region with a polygon.
Select Circle
Allows the user to select a region with a circle.
Select Ellipse
Allows the user to select a region with an ellipse.
Select Pass
Allows the user to select a pass. Only valid for point or smart rectangle map types.
Select by Legend Range
Allows the user to select a spatial object on the map and all other spatial objects with the same legend
value will also be selected.
Select Via Filter
Allows the user to select a region using data filters that the user defines, from the current layer. Data filters
can be based on spatial statistics, attributes, and properties and in combinations. Advanced allows you to
filter based on multiple layers and not just the current layer.
Invert Selection
Allows the user to invert the current selection on the map, selecting all other items on the current layer
other than the ones that are currently selected.
Query Tools
Query Current Layer
Activates the query feature for the current layer.
Query Multiple Layers
Activates the query feature for all layers that have been selected to be included in the multi-layer query.
Organize Layers
Allows the user to reorder or delete layers in the active map.
Edit Layer
Allows the user to edit the current layer in the active map if it is editable.
Notes
Layer Notes
Allows the user to add a spatial note(s) to the current dataset layer. These notes are tied to the specific
dataset they are added to and can only be viewed/edited when the same dataset is mapped.
Landmark Notes
Allows the user to add a landmark note(s) that will be displayed whenever spatial data is mapped. These
landmark notes allow the marking and notation of permanent landscape features such as wells, pump
heads, builds, etc.
New
Allows the user to create one of the following file types:
Boundary Map
Allows the user to create a new boundary dataset for the current layer in the active map.
Generic
Allows the user to create a new generic dataset that can contain point, line, or polygon data. The user can
also define and add new attributes for a generic dataset.
Navigation Map
Allows the user to create a new navigation dataset for the current layer in the active map.
Prescription Map
Allows the user to create a new prescription dataset for the active map.
Soil Sampling Map
Allows the user to create a soil sampling dataset using a gridding wizard. Soil sampling lab results can
then be imported and tied to the points.
Scouting Map
Allows the user to create a scouting dataset(s) by drawing regions or gridding an area. Scouting data specific
to different pests can also be created and saved as their own scouting operations based on pest type.
ygon
38
Page 45

User Interface
Map Properties Tabs
Properties for the map are displayed at the bottom of each map as buttons/tabs which open views of additional
information related to the current map. To open the views, move your mouse over the button/tab and it will
automatically expand as long as you keep the cursor over its displayed area, and then hide again when move you
move off the area. You can also click the pin icon in the right corner of the window to make it have a fixed location and
not auto hide.
Map Summary, Query Results, Elevation Profile, and Picture Notes views are available currently for viewing.
Select one of the topics below for more information:
Map Summary View
Query Results View
Picture Notes View
Elevation Profile View
3D Plot Window (ADVANCED)
The 3D Plot document window displays a 3D plot of a selected dataset from the Management Tree. It provides various
tools and settings for manipulating and displaying the 3D Plot. The 3D Plot can also be printed.
39
Page 46

SMS Basic and Advanced Manual
3D Plot Toolbar
Reset Cursor
Resets the toolbar selections so that none are selected. This is useful if you want to cancel a selected function on
the toolbar.
Zoom Out
Click this button to scale the map window out once.
Zoom In
Click this button to scale the map window in once.
Zoom to Box
Click this button to zoom to a box area defined by the user.
Specialty Zooms
Pan
Allows the user to drag the current contents of the map with the mouse in any direction.
Rotate Map
Allows the user to rotate the 3D view about the X, Y, and Z axis. .
Reset Plot Rotation
Allows the user to reset the orientation and zoom level of the current 3D plot to the default orientation.
Plot Options
Zoom World
Click this button to zoom to the extent of all data currently on the map.
Zoom Previous
Click this button to zoom to the last zoom extent.
Zoom Selection
Click this button to zoom to the current layer selection.
40
Page 47

User Interface
Allow
s the user to set various plot options that are independent of what attribute is being plotted, such as line colors,
orientation, etc.
3D Plot Control Window
Attribute Selection
Allows the selection of an attribute to be plotted from the current dataset.
Plot Display Type
There are two possible display types for plots. One is a smooth Surface (gridded and contoured) and the other is a
Bar Plot where each gridded cell represents a bar with a vertical (Z) height based on the selected attribute to plot.
Edit Options
Allows editing of the various display and generation parameters for the 3D Plot. Defaults for viewing selected
operations and attributes can also be saved.
Edit Legend
Allows the editing and saving of legends to be displayed.
Plot Legend
Displays the legend for the plotted attribute.
Calendar Summary Document Window (ADVANCED)
The Calendar Summary Document Window displays a summary of the current event selection in the Calendar View.
The grouping selections can be changed for the summary display, but the attributes that are displayed are based on
the summary attributes that have been set for the operation that data is being displayed for. The Calendar summary
can be printed and exported to HTML.
41
Page 48

SMS Basic and Advanced Manual
Report Document Window
The Report Document displays the results of generating a report. You can edit the dataset filters for the report and the
options for displaying the repot from the document without rerunning the report. You can also print the report to export
it to HTML.
Job/Task Summary Document Window
The Job Summary Document Window displays a summary of the current selection in the Job/Task Tree. The
summary formatting will vary based on the selected level in the Job/Task Tree. The Job/Task summary can be printed
and/or exported to HTML.
42
Page 49

User Interface
Chart Document Window
The Chart Document displays the results of generating a chart. You can edit the dataset filters for the chart and the
options for displaying the chart from the document without rerunning the chart .You can print the chart or save it as an
image file.
43
Page 50

SMS Basic and Advanced Manual
Analysis Document Window (ADVANCED)
The Analysis Document window displays the analysis results that are of a report and/or chart type. The Comparison
analysis function and the Financial Tracking Reports/Charts are the only analysis functions that use the Analysis
document currently. The Report and Chart(s) can be edited in terms of what and how they display. You can also print
them and either export to HTML or save them as image files. New charts can also be added based on available
attributes in the result data by going to the Edit Menu and selecting Add Chart.
44
Page 51

User Interface
45
Page 52

SMS Basic and Advanced Manual
Booklet Document Window (ADVANCED)
The Booklet Document window displays the result of running the Booklet Printing... option. Each type of output you
selected for you booklet and the instances of those types depending on what level in the management hierarchy you
place them, will generate a tab in the booklet document. Some of these tabs will show the final result that will be
printed, such as the Title Page or Analysis Reports/Charts. But other types such as Print Layouts will only display the
base data that will be used to generate the final print layout. This is done to save memory, since each print layout page
can take up 5-6MB of memory at default settings and there can be multiple pages defined for a print layout. It should
also be noted that the Table of Contents page is not generated until you start printing. It will also be the last page
printed, and then you can manually insert it after the Title Page.
Once the Booklet Document is generated, you can then preview individual pages by selecting the tabs and then Print
Preview or you can delete individual pages that you want removed from the booklet. Result pages can even be edited
in some cases, such as for reports or charts, which you can change the formatting of before you print. In addition to
printing you can also save the booklet as an HTML result which will generate multiple files for you that link to an index
page that allows you to link to the individual booklet result pages that have been generated.
46
Page 53

User Interface
Linked Item Document Window
The Linked Item Document window allows the user to view linked items that can be viewed within the desktop software
without requiring and external viewer. Currently images/photos, PDF's, web links, and text files can be viewed directly
within the software. Any other unknown/unsupported formats will be loaded if possible by the application that your
computer has associated with that format, such as MS Word for *.doc files or MS EXCEL for *.xls files. Each viewer for
the supported formats will provide tools that are appropriate for the format, such as zoom or search tools for PDF
documents.
47
Page 54
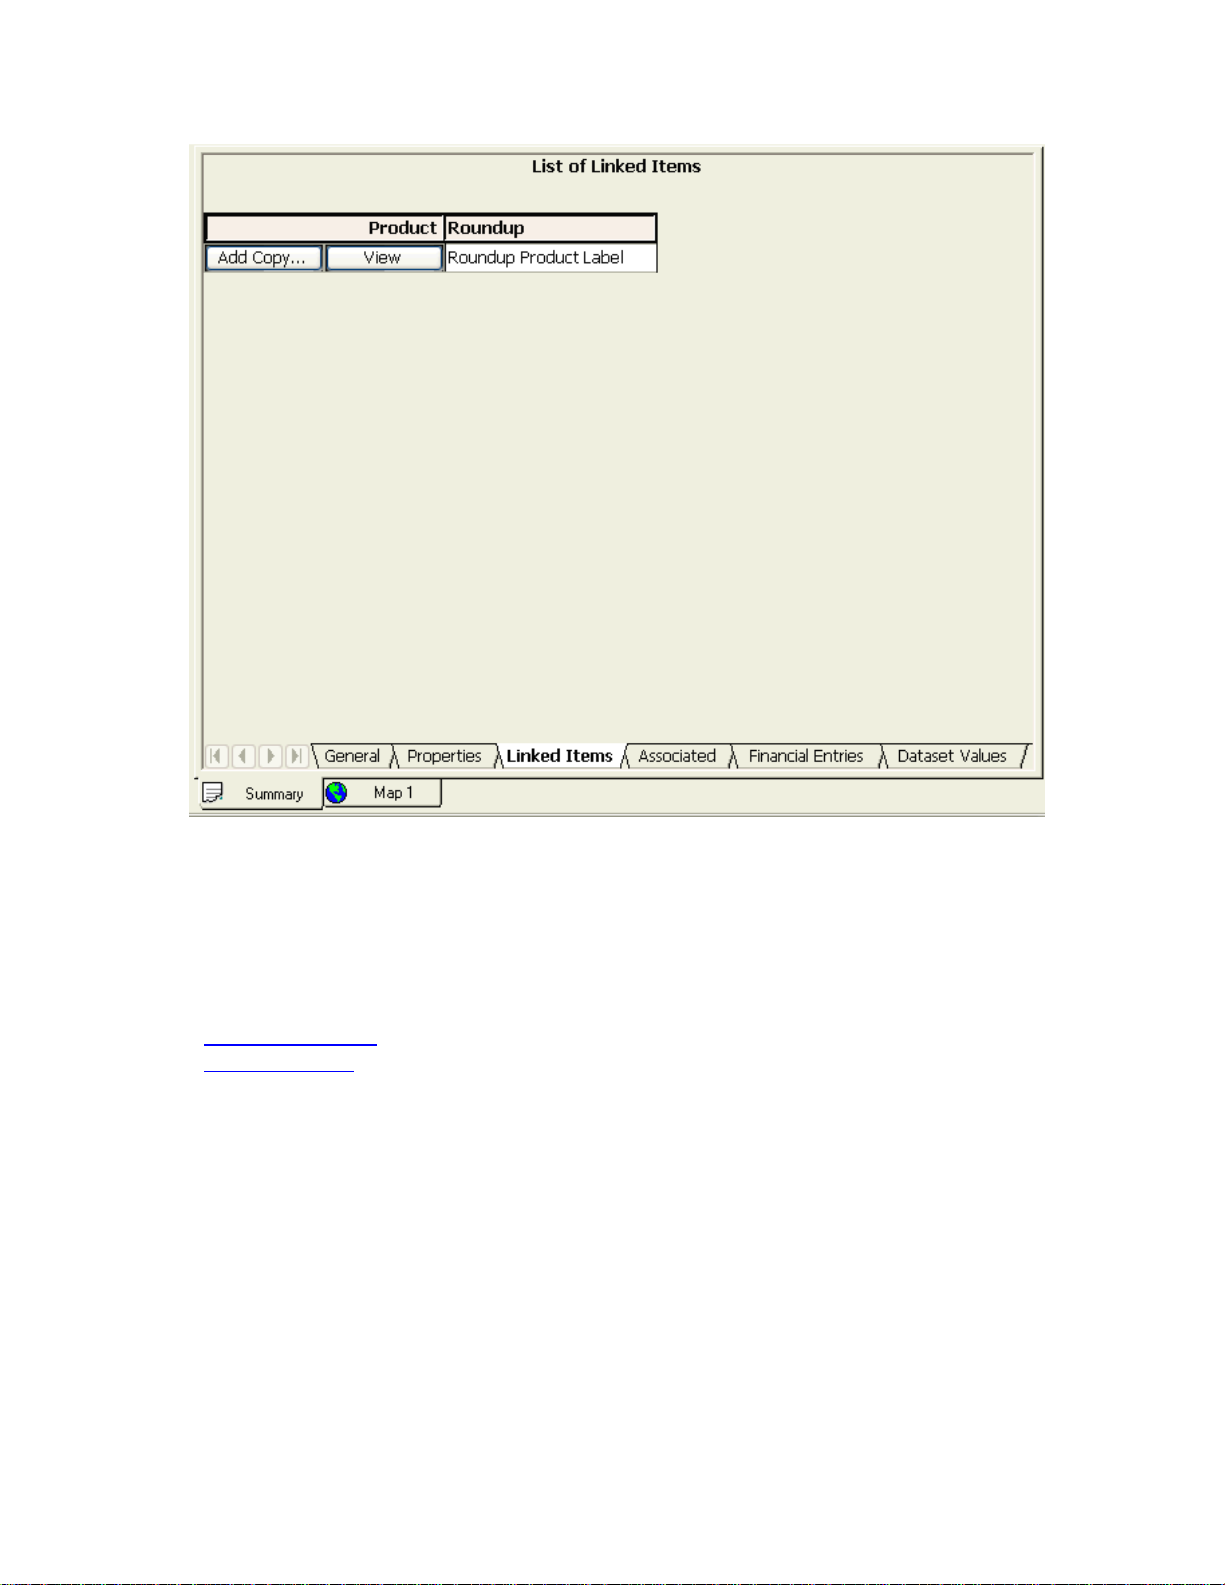
SMS Basic and Advanced Manual
Layer Window
About the Layer Window
The Layer Window contains information and controls pertaining to the data contained in a map. This can include a
single dataset/layer or multiple layers. The window allows you to easily move between layers, change the visualization
method, control data visibility, edit/create legends, zoom, select attributes/properties to map, etc.
How to Information and Other Links:
Edit Legend
Using the Layer Window
How to edit a legend.
48
Page 55

User Interface
Layer Button
Display
s the layer visible check box, layer name, and the remove layer button. Also indicates whether a layer is the
active layer and whether it is on or off. The active layer is the one with a border around the layer button and on some
OS's will display with a highlighted color. Clicking on a layer button expands the button to show all the options, current
settings, legend for the layer, and makes it the active layer. Right clicking the mouse button while the cursor is over a
layer button will provide a menu of options for changing how a layer is displayed in the Layer Control, also see Layer
Display Menu Button description below.
Layer ON/OFF Check Box
This check box makes the select
for the same spatial area.
ed layer visible when checked. This is useful when many layers are open
49
Page 56

SMS Basic and Advanced Manual
Close La
Click this button to close the layer.
Attribute/Property Selection Box
s the current attribute or property that is being mapped for the layer in the Map window. Clicking on the down
Display
arrow on the right side of this box shows a drop down list of all the attributes and properties that can be mapped for
the current layer. Click on one of the attributes or properties to change the data being mapped in the Map Window for
the current layer.
Select Mappable Attributes/Properties Button
s button to select the attributes or properties that will be available to map. Selected properties will be saved per
Click thi
the operation of your current layer that is mapped. All selections you to set to mappable will be displayed in the
Attribute/Property Selection Box in the Layer Control.
Show/Hide Extended Layer Options Button
This button, the t
controls below it.
Map Type Buttons
These five button
Spatial Map
Creates a raw data map of a spatial dataset, i.e. point data, polygons, lines, etc in their raw form.
Smart Rectangle Map
Creates a map based on spatial points plotted as rectangular objects that are created from the swath
width, distance traveled and heading (track) for the logged point. Track must be included in the dataset
being mapped to display the data as smart rectangles.
Swath Segment Map
Creates a map of the individual segments contained in a dataset. This allows the mapping of sensor data that
was logged at a higher resolution than a full swath, such as row by row. Not all data supports or contains
segment level information. To make swath segment data available you must check the "Create individual
swath segments if available" option on the GPS Settings tab when archiving files or reprocessing data and
select either to generate Section or Row level data.
Grid Map
Creates a map based on averaged values for a user set grid size. See Edit Layer Options.
Contour Map
Creates a map based on averaged and smoothed values for a user set grid size. See Edit Layer Options.
Transparency Slider Bar
Sets the transpar
completely solid.
Edit Layer Options Button
Click this button to go to the La
and attribute/property options for the current layer in the active map. This includes setting whether marks are turned
on or off, point diameter size, grid size, properties for spatial datasets, contour parameters, etc..
Edit Legend Button
Clicking this button opens the Edi
and view statistical information for the layer.
Layer Zoom Button
ing this button will zoom to the extents of the current layer on the map. This is useful when you have many layers
Click
open and would like to quickly go to a specific layer on the map.
Layer Display Menu (Right click in grey areas of the Layer control or on the Layer button)
Right click to displa
layers up/down, renaming them, or removing them.
Legend Area
s the legend for the current layer and selected attribute. Also displays the legend for marks , buffers, and layer
Display
notes data if present. Double clicking with the left mouse button in the legend area will open the Edit Legend dialog.
Show/Hide Layer Statistics Button
yer Button
hin button with three arrowheads on it, allows you to show or hide the layer option buttons and
s change the way that data is displayed in the Map Window.
Configure Swath Segment(s) Button
Allows the selection of which segments to map. You can select all, one, or a combination of
segments to display.
ency level of the current layer and attribute to a value from 10 to 100 percent, 100 percent being
yer and Attribute/Property Options Dialog. Allows the user to edit the layer, sub-layer,
t Legend Dialog. This allows you set the various parameters for the legend, marks,
y a menu of options that modify how a layer is displayed in the Layer Window, such as moving
50
Page 57

User Interface
This button, the thin button with three arrowheads on it, allows you to show or hide the layer stats displayed below the
legend.
Layer Statistics Area
This area displays summary stats for numeric attribute/property items for the current layer and a selection on the layer.
This area can be hidden.
51
Page 58

Page 59

Data Processing
Processing Data
The software provides a number of options for processing the data you are reading into the system or data already in
the system. The software allows you to set processing settings for the particular type of data and the product/crop that
data was collected for as well as settings for GPS position data correction and filtering.
Select one of the following topics below on processing data and files:
Select File Reading Option
File Selection/Search Options
Select Files to Download and/or Import From AgFiniti
Results of File Search/Selection
Set Management Items for New Data
Select Management
Archiving Options
Management and Processing Settings
Processing New Data
The soft
ware provides a wizard interface for reading Ag Leader, Case IH, Flexi-Coil, JD Greenstar, Mid-Tech, New
Holland, RDS , and Trimble files into the system. This wizard interface greatly simplifies entering your files into the
system.
How to read Ag Leader, Case IH, JD Greenstar, RDS, New Holland
How to migrate your data from Precision Map 2000 or Instant Yield Map Software
A process for reading Ag Leader AGDATA and AGSETUP files is also provided via the AgFiniti cloud-based service. It
provides similar functionality and the same processing wizards as above but allows you to download files that have
been placed in the AgFiniti cloud. This feature requires an AgFiniti File Transfer license to function.
Reprocessing Data Already in the System
Once data th
make changes to the data that is displayed when you create a map(s) or layer(s).
How to reprocess data.
Reprocessing Files that have Already Been Read into the System
If
you delete files from the Management Tree using the Delete Branch selection, the proper way to get the deleted data
back into the system is to use the Reprocess Files…selection under the Services menu. The reason this is the
preferred method is that the software does not allow duplicate files to be read into the Data Vault where all the files you
read in are stored. Since the file has already been read into the system once, this feature allows you to select files
already in the vault and reprocess them. Please note that this tool should not be used to adjust processing settings for
data already in the system, use Reprocess Data..under the Management Tree Menu to do that.
Reprocess Files
Syncing With SMS Mobile
The soft
feature allows you to directly sync with an SMS Mobile project(s) that was exported from the software or you can
import data that was created in another software or that was created from scratch in the field.
Select one of the topics below for more information on syncing or importing from SMS Mobile:
SMS Mobile Data Folder Search Options
Select Mobile Projects
Mobile Project Processing Settings
How_to_Sync/Import_from_SMS_Mobile
at supports reprocessing has been read into the system, you have the option to reprocess the data to
ware provides you the ability to sync or import data from Ag Leader Technology's SMS Mobile software. This
, Mid-Tech, or Flexi-Coil files into the system.
53
Page 60

Page 61

Data Management
Data Management
The software provides a number of different methods and tools for ensuring that your data is managed properly. These
include automatic management features like the Spatial Sorter or manually setting the management settings for an
item in the Management Tree such as a Field.
NOTE: Do not remove any files, such as YLD’s, from the system Data Vault. Doing so may cause unexpected
results such as not being able to map data in the system or read in new files. Files stored in the vault are
linked to other data files within the system or database. Removing these files will cause problems for other
items in the system that are referenced to them. Please contact Technical Support for assistance in removing
data files from the system properly. In general, do not delete any files from the system Data directory without
first consulting with Technical Support.
Select one of the topics below on data management in the system:
Select Management
Management Item Editor
Apply Management Changes
Archiving Options
Reassign Resource Tracking
Reassign Pest
Reassign Associated Data
Managing Farms
How to manually move a Farm
How to spatially sort Fields into Farms.
Managing Fields
Merge Fields
How to freeze a boundary.
How to spatially sort Loads/Regions into Fields.
How to split and sort a load or region.
How to manually move a Field.
Managing Other Items in the Management Tree
How to manually move other management items (Year, Load, etc.).
Workspaces
ware allows you to save and open Workspaces. A workspace is like a bookmark you would place when
The soft
reading a book or pausing your VCR. It allows you to save the map(s) and layer(s) that you currently have open, close
the software or clear all your maps and work on something else, and then reopen a workspace and start back from
where you were when you saved the workspace. The added benefit of workspaces is that even though you have
saved a workspace from a previous session, any new data that has come into the system for the saved workspace will
be updated with the latest information. This saves a lot of time and confusion that can be caused by not knowing if
your data layers are always up-to-date or not.
Workspaces can also be launched from wherever they have been saved by double clicking on the workspace icon. If
you save a workspace to your desktop for example, you can double click on the software icon with the workspace
name you entered and the software will automatically start and load the saved workspace.
Note:
Workspaces created in prior versions may not be supported in newer versions.
55
Page 62

SMS Basic and Advanced Manual
How to save a workspace.
How to open a workspace.
Projects
Projects are a high level w
unique databases and data vaults for the data processed into them. You can not access, view, map, etc data from a
different project; only the one that you currently have open.
Project control is provided for both Basic and Advanced users, but is limited in functionality for Basic users. Basic
users are limited to five total projects while Advanced users can create an unlimited number. Basic users also don't
have access to all the available tools for Projects such as Move, Check-in/Out, and using multiple Data Locations.
Projects also provide added security by allowing for the entry of passwords to restrict who can open and use/modify
data in a project. Individual projects can even be backed up and sent to another user to restore into their system. This
is especially useful when dealing with another user if you need to transfer all the data you have processed and setup
for them.
Notes: Restoring an individual project or an entire set of projects can delete your current project(s) from
your system and replace it with the one(s) in the backup if you select the option to replace your project(s)
during restore. Make sure you have backed up any data that you do not want to lose prior to replacing a
project with another one.
Files should not be removed, added, or edited in the Vault unless you are directed to do so by Technical
Support. Doing so will cause damage to your data structure in the software and lead to data corruption,
crashes, and issues when migrating to new versions.
For Advanced, multiple Data Locations can be created and managed. A Data Location is where your projects and data
are stored. You can quickly switch between different Data Locations which may be on your local machine, on your
local network, or on remote servers in different locations. You can move projects between Data Locations, create
scheduled backups across Data Locations, check out projects between Data Locations, or even run multi-project
analysis functions across multiple Data Locations.
The Transfer Utilities can also be used in regard to projects in that you can create new management items such as
products or vehicles, write equations, or custom reports and charts in one project and then select an option in the
Transfer Utilities called Set as Project Transfer Default. Then the next time you open a different project it will check to
see if it has the latest default transfer that was set and if not it will prompt you to load the default transfer, which will
then help make sure that all your projects have custom items and settings that you create, without having to reenter
them manually in each unique project.
Comparison and Correlation analysis functions can be run across multiple projects, providing an extremely powerful
tool for comparing data across projects (different growers data) thus allowing you to keep the data between the
projects private and secure but still allowing access for analysis purposes.
Project Check-In/Out is allowed to provide another level of control for Projects for Advanced users. This allows you to
Check-Out a project from one Data Location to another (say from a server to your local computer), where you can
access the project even when you aren't connected to the server. This is extremely useful when you are using a laptop
and visiting customers and you want to take their project with you. Once you have made any changes to the project or
done consulting with the customer, you can Check-In the project and replace the old version that was on the server
with your updated version of the project. History information is also maintained on the projects that can be viewed to
indicate when and why the project was checked-in/out and by whom. New projects that are created while you are
disconnected from the server can also be moved onto the server when you reconnect to it. This allows you to add new
customers/projects while disconnected and then easily/quickly add them to your server installation (Data Location) so
they can be properly managed and backed up.
Select one of the topics below on projects:
ay to manage and separate data from multiple users, clients, partners, etc. Projects create
56
Page 63

Projects Dialog
Create New Project
Edit Project
Project Groups
Forgot Password?
Move Projects
Edit Data Location(s)
Data Management
57
Page 64

Page 65

Mapping and Viewing Data
Mapping Data
The software allows you to create multiple maps that can have multiple layers within each map. Mapping in the
software is point-and-click orientated. Selections in the Management Tree (if it has GPS data) can be used to create a
map or added to a current map as another layer.
Map projection is another important feature of the software. A map datum and projection ensures that your data is
properly displayed for your specific location on Earth. Data is almost always collected with the datum WGS84 with a
Lat/Lon projection. This can create maps that may not be spatially correct for your farm when mapped, so selecting a
proper datum and projection for your region is a good idea. The software will automatically recommend a datum and
projection for your data when you make your first data map unless you have already manually set them by selecting a
Grower and then Edit Item.
Select one of the following topics to see more information on mapping in the software:
Map Window
Using the Layer Window
Map Options
How to set your map projection.
How to make a map.
How to Add a Layer to a Map
Map Backgrounds
The soft
only and are not selectable or viewable in the Management Tree and can not be ordered or controlled through the
Layer window. Multiple backgrounds can be set for display. Backgrounds can currently be imported from the following
sources; Image files (BMP’s, TIFF’s, GeoTIFF’s, MrSid, etc), ESRI Shape files, MapInfo Mid/Mif files, and TIGER files.
Backgrounds can also be linked to an existing Farm or Field for display whenever the Farm, its associated Grower, or
a Field is selected to map. To link Backgrounds, edit the Farm or Field from the Management Tree or via the
Management List Editor under the Tools Menu. In addition options are provided for assigned/linked backgrounds in
terms of where and how they will be displayed and used.
Background layers can also be created by copying a selected dataset from the Management Tree via the Copy
Dataset to Background List option in the Management Tree menu
In addition background layers can also be saved back to the Management Tree as normal datasets via the
Background Layer Utility under the Services Menu.
If you have an internet connection available, a special internet based background layer can be enabled for your current
map as well. The Internet Based Background is available for all maps and provides the option to show aerial only, road
map only, or a combination of aerial and road map as a background layer. You can still have the backgrounds
described above as well but the Internet Based Background will always display as the bottom layer below all other
layers. The Internet Based Background is not saved into your software and updates as needed and will automatically
try to display the highest accuracy information that it has access to from the internet.
Lastly, special options are provided for including backgrounds on print layouts that allow control of displaying
background layers with other map data that is being printed.
Select a topic below on map backgrounds:
Set Background
Select Background
Background Settings
Farm/Field Backgrounds
Background Layer Utility
Background Layer Edit
How to geo-reference an Image
ware allows you to set background layers for maps. Background layers are intended for reference purposes
.
59
Page 66

SMS Basic and Advanced Manual
How to import a GeoTIFF image file.
How to import an ESRI Shape, MapInfo Mid/Mif,
How to set a map background(s).
Layering
ware allows you to create multiple layers of data on a map. This means you can create a map with a yield
The soft
layer, a boundary area, and an imported soil type map all stacked on top of each other, in the order you want. The
choice is yours.
The software also allows you to edit the name of a layer in the Layer window, change its order in the list of layers,
make a copy of the current layer in the active map, or remove the layer from the Layer window and map completely.
To access these options move your cursor over the layer button in the Layer window and click your right mouse button
and then make a selection from the menu that appears. You can also go to the Map menu and select Organize Layers
or select the Organize Layers icon on the Map toolbar to access the same function as above.
Select a topic below on layering:
About the Layer Window
Organize Map Layers
Layer and Attribute/Property Options
How to adjust layer and attribute/property options.
How to query a single layer.
How to query multiple layers.
Data Playback (ADVANCED)
ware provides the ability to playback your logged data in real time or an accelerated time. This means that
The soft
your map will display each point that you logged in the order it was logged. This gives you a view of actually how your
field was worked, which can be very valuable if you aren't operating your machinery and want to know what was going
on during field operations. You can even see a playback summary that shows, in real time, the values being logged
for each log point as you are running the playback. The playback summary displays the instantaneous, average, and
total values for selected attributes.
Any dataset that you have read into the system that contains swath width and date/time information can be run in the
Dataset Playback tool. To access the tool, create a map of the data to be played back and select the Dataset Playback
icon from the Map Toolbar or from the Map menu.
Select one of the following to see more information on this topic:
Dataset Playback
3D Mapping and Plotting (ADVANCED)
The soft
ware allows you to view data in different ways to a help you better visualize the data you have collected or
imported. Two such ways are the 3D Terrain view and 3D Plotting.
3D Terrain View
This is an option for viewing your data for any dataset that you have mapped that has a reference to a 3D grid. A 3D
grid is must be manually generated (in previous releases this was automatically generated). Any point data read into
the system or imported that contains latitude, longitude, and elevation data can be used to generate a 3D grid surface
using the Regenerate 3D Grid option in the Management Tree. Using the Batch Command Regenerate 3-D Grid you
can generate the 3D grid surface for multiple fields.
This option for data display is called the 3D Terrain view because it only displays the data based on the topography,
i.e. the elevation information. So what you see is an accurate, depending on the accuracy of the data used to build the
3D grid, depiction of the actual lay of your land. You can then add as many dataset layers onto the 3D surface as you
want to better visualize how your data might be affected by terrain.
The 3D terrain view can be toggled on and off from the Map Toolbar or menu. It can also be rotated as well as
zoomed. In addition, tooltips do still function in 3D but there can be an offset at times from what is displayed as a
value(s) vs where it appears the cursor is located, which is due to the rotation angle of the map. Also, the Query tools
do not function when the 3D Terrain view is toggled on.
Map Window
DEM, or TIGER file.
60
Page 67

Mapping and Viewing Data
3D View Settings
How to display the 3D Terrain View.
3D Plot
This is a display option that takes your selected dataset from the Management Tree and generates a 3D Plot, which is
independent of normal mapping. 3D Plotting differs from the 3D Terrain View in that 3D Plotting is more geared
towards raw data visualization and is not as interested in accurate mapping, layering, etc. 3D Plotting allows the
selection of any of the attributes in a dataset to be selected to use for generation of the Z-Axis, which is the surface of
the 3D Plot. The 3D Terrain View only uses elevation for the surface and is intended to try and depict as best as
possible the actual terrain of a field. 3D Plot only allows the plotting of one dataset or Operation Instance at a time to
help you visualize the data in the third-dimension.
3D Plot Window
3D Plot Attribute Options
3D Plot Options
3D Plot Settings
3D Plot Settings Utility
How to create a 3D Plot
61
Page 68

Page 69

Legends
Legends
The software provides a number of useful features and customization options for legends. You can load and save
legends you create and also set your legends as defaults for a particular layer, an operation, or as a global default.
Custom legends can be set for attributes, properties, marks, buffers (ADVANCED), and notes. This allows you to set
specific legends for data that was used for testing purposes or that you want segregated from similar data.
Select one of the following topics on legends:
Legend Window
Edit Legend
Load Legend
Save Legend
Legend Utilities
How to edit a legend.
63
Page 70

Page 71

Creating and Editing Data
Creating Data
The software allows you to create many different types of data that can be managed in the system or used for export
purposes only.
Select a topic below on creating data in the system:
Attributes
Attributes are def
operation. So yield data that is logged continuously and is varying from logged value to logged value, would be an
attribute for example. The system has many predefined attributes already which do have some adjustable settings, but
there are times when a user defined attribute may be needed to support data contained in an import file. Also, User
Defined operations can be created and you can create your own attributes specifically for them in Advanced..
Attribute Editor
Select Attribute
Remove Unused Attributes/Properties
How to create a new attribute.
Properties
Properties are
Farms, Fields, and Loads are examples of predefined properties within the system. User defined properties can be
created that can be linked to management items and datasets. This can be useful for general management purposes
for attaching additional information to an item. An example would be to create a property called Variety and then add
this property to harvest loads and then entering the variety name for the crop that was planted or harvested in the load.
Once a property has been added it can be used to filter data in queries, reports, and charts for example. Properties
created in the system can be deleted if they have not been applied to a dataset so when creating new properties
carefully consider what type of property you will be creating and how you intend to use it.
Property Editor
Select Property
Additional Proper
Remove Unused Attributes/Properties
How to create a new property.
How to add a property to a management item or dataset.
Operations (ADVANCED)
Custom O
Generic Editor for data creation and editing purposes. The unique aspect of these custom operations is that you select
what attributes will be tied to the operation and also which attributes will be required to be set when importing data for
this operation. this allows you to make specific operations for a specific type of data you will be importing and the data
will not import unless you set the required attributes for the operation. To create or edit a new Operation go to the
Tools Menu and select Management List Editor.
Only new operations that are created can me modified, except for the Soil Sampling, Scouting, and Crop Plan
Operations that already exist in the system. These are the only factory default operations that are editable, the reason
being so that if you desire you can set-up these operations to only have the attributes by default that you actually use
and also in the units that you desire, such as Lbs/ac vs PPM.
Edit Management Item Lists
How to create/edit a custom Operation
Crop Plans
Crop plans can be created in the software to help you track and plan your crop production cycle, spatially.
plans can be created for each of your crop production operations and their unique products. By default
Crop
the system has a number of predefined crop plan types, such as for Planting, Spraying, and Fertilizing.
ined as frequently changing data and are used to convey actual values, logged or entered, for an
defined as infrequently changing data used to define other management and data items. Names for
ties
perations can be created in the software. These custom operations will all be of a Generic type and use the
65
Page 72

SMS Basic and Advanced Manual
Additional custom Crop Plan types can also be created as new operations and you can assign your own
attributes to define a custom crop plan. Default Crop Plans can also be customized. Crop plan datasets are
polygon based only, and by default are created from your frozen/traced field boundary but can be edited if
desired.
Crop Plan Editor
Select Crop Plan Oper
Define Crop Plan
How to create a crop plan.
As-Applied and Split Planter Data
Because many system cannot log multiple products or rates and sometimes just log coverage there is a need
operly document what actually was applied in the field. The Create As-Applied tool allows you to take
to pr
data that was not logged as split planter or multi-product/rate data, but was applied as such, and create new
data that represents teh real applications that occurred. The tool works on any As-applied or Site Verification
data. In the case of Planting and Seeding data it allows you to properly define the section swath widths and
the product and/or rates that were not logged. For Site Verification, it allows you to define rates and section
swath widths to create application rate data even though it wasn't logged as such. The Create As-Applied tool
can be run on selected datasets from the Management Tree or via a batch command function.
Create As-Applied Data Settings
Application Equipment Settings
Equipment Swath Section Settings
How to create as-applied or split planter data
Boundary Data
y data can be created based on a map and its layers. The boundary that is created can then be set as a Farm
Boundar
or Field boundary for Spatial Sorting, saved into the management system and displayed in the Management Tree, or
exported directly to an ESRI Shape file or ASCII text file.
Boundary Editor
How to create a boundary
Generic Data
Generic Data can be created based on a map and its layers.
created in the generic editor. Attributes can be added to or created for a generic dataset, thus allowing full
customization of the data that can be entered for generic data that is created. Generic data can also be edited or
exported in many of the available export formats. Using the generic editor you can create Tile Line maps, landmark
feature maps such as bin locations and equipment storage buildings, etc.
Generic Editor
How to create a generic dataset.
Guidance Data
Guidance data c
guidance area, headlands if set, and parallel guidance lines within the guidance area. The guidance data can then be
used for planning of field operations and/or exported to a supported field device that can use the guidance data to
provide assisted or automated guidance.
Guidance Editor
Guidance Settings
Headland Settings
Straight Line Settings
How to create a guidance dataset.
Navigation Data
Navigation data
or manually entered in. Navigation data can be saved in the management system and displayed in the Management
Tree and exported as ESRI Shape, MID/MIF, ASCII text, or PFN navigation file for use in the Ag Leader PF3000 or
PF3000 Pro.
ation(s) and Product(s)
Objects such a polygons, points, and lines can be
an be create based on a map and its layers. Guidance data created in the software consists of a
can be created based on a map and its layers. Navigation points can either be selected from the map
66
Page 73

Creating and Editing Data
Navigation Editor
How to create navigation points.
Prescription Data
Prescription data can be created based on a map and its layers. Prescription rate values can be either manually
created using paint tools or can be created from the values contained in another data layer. The created prescription
data can be saved in the management system and displayed in the Management Tree and exported as an ESRI
Shape, MID/MIF, TGT prescription file for use in the Ag LeaderPF3000 or PF3000 Pro, PRE prescription files for use
in Flexi-Coil FlexControl systems or Case IH ADX Air Systems, and ENS prescription files for use in Case IH AFS
Planting and Seeding Systems.
Prescription Editor
Prescription Reference Layer Selection
Prescription Gridding Selection
Prescription Attribute Type and Units Selection
Edit Prescription Legend
Assign Legend Ranges
How to create a variable rate prescription.
Soil Sampling Data
Soil Sampling data can be created based on a map and its layers and or from imported data. Soil Sampling plans can
be generated manually by drawing regions or through the soil sampling wizard which guides you through the process
of creating sample points, grids, or regions. You can also manually add new sample points or edit existing sampling
datasets. Soil test results can also be imported to populate the soil sampling attribute entries for each sample point,
grid, or region or they can be manually entered. Soil sampling data can be saved in the management system and
displayed in the Management Tree and exported as ESRI Shape, MID/MIF, ASCII text, or PFN navigation file for use
in the Ag Leader PF3000 or PF3000 Pro.
Soil Sampling Editor
How to create a soil sampling dataset.
Scouting Data
Scouting data can be created based on a map and its layers. Scouting data can consist of just general observations
about crop conditions or it can also include pest observations. Scouting data is created and edited as a single dataset
but when saved, the different types of scouting information will be broken out automatically for you into unique scouting
operations in the management tree. Also scouting datasets are area based only, meaning they cant just be points or
lines. Once you have created and saved scouting data, you can then export this data as ESRI Shape, MID/MIF, ASCII
text, or to Ag Leader's SMS Mobile software.
Scouting Editor
How to create a Scouting dataset.
Plot Prescription Data (ADVANCED)
Plot Prescription data can be created based on a map and its layers. Only a single Plot Prescription can be created per
dataset. Plot Prescriptions are also created based on settings/parameters that are entered and only the start location
(baseline) for the plots are drawn or manually entered. Once created Plot Prescriptions can be exported as generic file
formats or as a planting prescription that can be export to the ALMACO SP360 controller.
Plot Prescription Editor
Tile Plan Data (ADVANCED)
Tile Plan data can be created based on a map and its layers. Tile Plans consist of tile runs that can be drawn. If a 3D
surface grid exists for the field then the tile runs will get a surface elevation value from the surface otherwise they will
get a value of zero. Tile Plans can be exported for use by the Ag Leader based Intelislope system or the Gradient
Intelislope system to install drainage tile.
Tile Plan Editor
How to create a tile plan.
Buffer Regions (ADVANCED)
Buffer regions can be created and tied to any object in the system. For example you can add a buffer region (polygon)
to a point, line, or polygon object. The unique thing about Buffer regions is that they remain associated to the object
you add them to, which is very much different than the Create Rings Tool, which make buffer/ring polygons for a
selected object that can be saved as whatever you want and loses any association with the object it was created from.
When you add a Buffer region to an object though, that buffer is then available for display, query, analysis, etc
67
Page 74

SMS Basic and Advanced Manual
whenever that object is mapped, printed, used in analysis, etc. It becomes a living addition that data that is always at
your disposal.
The Buffer Region tools are available on the Boundary, Generic, and Prescription Editors. A single inner and outer
Buffer Region can be added to a single object. Buffer Regions are considered a Sub-Layer like Mark and Note data
and settings can be set form them just like the other Sub-layer types. Specific legends can also be set for the Buffer
Regions.
How to add Buffer Regions to an object
Mosaic Data (ADVANCED)
Mosaic data is created by merging multiple single images into a single new image dataset. This is useful for reducing
the time it takes you to add images for each field. It is also useful for cleaning up image quality across multiple images
that may have been imported from different sources or from different times.
Mosaic Editor
Select Mosaic Layers
Mosaic Color Remap
Image Georeference
Notes Data
Spatial notes can be created based on a map and/or its layers. Two different types of spatial notes can be created;
Layer notes and Landmark notes. A Layer Note is a spatial note that is added to a specific dataset layer, such as a
yield map of soybeans for 1997. You could add a Layer Note to this dataset that indicated that there was a tile hole or
weed patch at a certain location. Only when you mapped this particular dataset would the Layer Note would appear on
the layer, as long as the Show Notes sub-layer option was turned on. A Landmark note on the other hand is intended
to apply to all maps that are made. You would add a Landmark Note to mark and note an area, terrain feature, etc that
is a permanent feature of the landscape that you want to make a note for. An example would be to add notes where
you had well heads or pump stations for irrigation. You would mark these using a Landmark Note because they are
independent of specific datasets and should be displayed when any dataset is mapped, for your reference. Spatial
notes can be edited and exported in various supported export formats.
Notes Editor
How to create spatial notes.
Associated Data
Associated data is a special type of data that can be created and associated with a management item, but is not used
for spatial or mapping purposes. Currently there are three types of associated data that can be created within the
system. They are Notes, Scale Tickets, and Cotton Gin Tickets. At this time data entered as associated data can only
be viewed in the Associated Data Viewer or in the Summary Window on the Associated tab. Printing of associated
data can only be accomplished from the Summary Window and the Associated tab.
Associated Data Viewer
Associated Editor
How to create associated data.
Editing Data
ware allows you to edit certain types of data that are stored in the management system.
The soft
Select a topic below on editing data in the system:
Properties
Property data added by the user can be edited or removed from a management item or dataset at any time by
selecting the management item o
then Additional Properties.
Additional Properties
How to edit property data.
Operations
Some of the factory default Operations (Soil Sampling, Scouting, and Crop Plans) allow of customization of the
Operation. You can change what attributes are defaulted for that operation and they will automatically be added to new
datasets made for that Operation. Default values can even be set for attributes for use in exports and you can set
r dataset to edit in the Management Tree, right clicking and selecting Edit Item, and
68
Page 75

Creating and Editing Data
whether or not an attribute is required to import data for the operation . New Operations that are created by the user
can also be fully edited.
Edit Management Item Lists
How to create/edit a custom Operation
Crop Plans
Crop plan dat
Map toolbar. One thing to note when editing a crop plan dataset is that even if you only have a single dataset from a
crop plan for a field selected to edit, when you enter the Crop Plan editor, all the datasets that currently exist for the
crop plan for the current year, operation, and operation instance will load into the editor as well. So if you have a field
split into Soybeans and Corn for your plan and you have just the Soybeans mapped and you select to edit the layer,
then the editor will actually show the Corn data as well. This was done to ensure that when editing you always know
what other data exists for your current crop plan so you and make more informed changes.
Crop Plan Editor
How to edit a crop plan.
Point Data
Point data can b
on the Map toolbar. The only editing that can be done on point data from a map is the removal of points and the
straightening of passes. These editing options can be useful when there are GPS points plotted on the map that were
logged in error and the software was unable to filter or you have GPS data in a pass that could not be corrected by the
software and requires you to manually specify a line to straighten the pass by.
Point Map Edit
How to edit point data.
How to straighten a pass on a point dataset.
Boundary Data
Boundar
Map toolbar.
Boundary Edit
How to edit a boundary.
Generic Data
Gene
Map toolbar.
Generic Editor
How to edit generic data.
Guidance Data
Guidance data c
Map toolbar. When editing guidance data the guidance area can not be edited, only the settings for the generation of
the headlands and guidance passes within the area. If you need to redefine the guidance area you must recreate it
from scratch. Also, imported guidance data in most cases can not be edited, especially if the imported data did not
have a guidance area defined with it.
Guidance Editor
Image Data (ADVANCED)
Imaged data that has been saved in the Management Tree can be edited by using the Layer selection under
the Edi
Image Editor
How to edit an image.
Navigation Data
Navigation data
Map toolbar.
a can be edited on a map by using the Layer selection under the Edit menu or the Edit Layer icon on the
e manually edited on a map by using the Layer selection under the Edit menu or the Edit Layer icon
y data can be edited on a map by using the Layer selection under the Edit menu or the Edit Layer icon on the
ric data can be edited on a map by using the Layer selection under the Edit menu or the Edit Layer icon on the
an be edited on a map by using the Layer selection under the Edit menu or the Edit Layer icon on the
t menu or the Edit Layer icon on the Map toolbar.
can be edited on a map by using the Layer selection under the Edit menu or the Edit Layer icon on the
(ADVANCED)
69
Page 76

SMS Basic and Advanced Manual
Navigation Edit
How to edit navigation points.
Prescription Data
Prescription data can be edited on
the map toolbar.
Prescription Editor
How to edit a prescription dataset.
Soil Sampling Data
Soil sampling data can be edited on a map by using the Layer selection under the Edit menu or the Edit Layer icon on
the Map toolbar.
Soil Sampling Editor
How to edit soil sampling data.
Scouting Data
Scouting data can be edited on a map by using the Layer selection under the Edit menu or the Edit Layer icon on the
Map toolbar.
Scouting Editor
How to edit scouting data
Plot Prescription Data (ADVANCED)
Plot Prescription data can be edited on a map by using the Layer selection under the Edit menu or the Edit Layer icon
on the Map toolbar.
Plot Prescription Editor
Tile Plan Data (ADVANCED)
Tile Plan data can be edited on a map by using the Layer selection under the Edit menu or the Edit Layer icon on the
Map toolbar.
Tile Plan Editor
How to create a tile plan.
Installed Tile Data
Installed Tile data can be edited on a map by using the Layer selection under the Edit menu or the Edit Layer icon on
the Map toolbar.
Installed Tile Editor
Notes Data
Notes data can be edited on a map by using the Notes selection under the Edit menu and then Layer or Landmark
Notes or the Edit Layer icon on the Map toolbar and either Layer or Landmark Notes.
Notes Editor
How to edit spatial notes.
Associated Data
Associated Editor
How to edit an associated dataset.
a map by using the Layer selection under the Edit menu or the Edit Layer icon on
70
Page 77

Jobs and Tasks
About Jobs and Tasks
The software uses what we call Jobs and Tasks to help organize and summarize your field operations and make
setting up field devices, such as your monitor, easier. A Job is defined as a grouping of one or more Tasks that you
plan to perform during a certain time span. A Task is defined as one or more operations that are planned to occur in a
specific field.
The purpose of Jobs and Tasks is to provide planning and tracking of operations that will occur during the crop
production cycle. An example would be planning your entire spring planting. You would first write all your planting
prescriptions for all your fields that will be planted, then create a Job called "Spring 2004 Planting" and then add
Tasks, i.e. for each field you created a prescription for , to the Job. Now you have a record of what your plan for
planting your 2004 crop is, and if you log as-applied data with a monitor system and read it into the software, the
actual data will link up with the planned data and can be viewed in a summary so that you can compare your planned
vs actual results. Using Jobs you can also export all your assigned tasks at one time to your field device, so if you
have assigned 50 Tasks (fields) to a Job you can export their prescriptions, boundaries, or setup all in one simple
process.
Jobs and Tasks are also shown in the Calendar View. The planned time span of the Job will be displayed and when
the Job event is selected in the calendar, a summary is displayed that list all the Tasks that are assigned to the Job
and various properties of those tasks. The actual data that is logged and related to the Job and Task will also be
displayed in the calendar as its own event, based on the grouping and filtering that you have set for the Calendar
View, so that you can visually see what was planned for the Job vs the actual time span of the operations.
(ADVANCED)
Select a topic below on Jobs/Tasks:
Job/Task Summary Document Window
Job Summary Items
Job/Task Summary Item Pairs
Creating and Editing Jobs and Tasks
Jobs and Tasks can be created s
monitor, they can be manually created, or you can create a Task template that will automatically create Tasks or sort
data to existing Tasks when you run it.
Select a topic below on Jobs/Tasks:
Job Viewer
Job Editor
Task Editor
Define Task Sorting Template
How to create a Job and Task(s)
Exporting Jobs and Tasks
Jobs and Tasks can be used as a
to export data in bulk, such as all the prescriptions for all the fields that you plan to work during an operation such as
planting. It also can export the setup information to provide such information as Field Names and boundaries.
Select a topic below on Jobs/Tasks:
Select Job Export Format
Export Setup File
How to export a Job
everal different ways. Jobs and Tasks can come from a field device such as a
way to organize exports for a field device such as a monitor. It also provides a way
71
Page 78

Page 79

Data Analysis and Modification
Data Modification and Creation
The software provides various functions and tools to modify data from its raw form and provide adjusted or new
results. Functions that can be applied to data are broken down into two categories; Simple and General Analysis.
Select a topic below on data analysis and modification:
Manual Summary Entries
Manual summary values can be entered for attributes in a dataset. These values don’t replace existing monitor or
spatial summary values but are stored as an additional summary type that can be viewed in summaries and added to
reports, map layouts, etc. Manual summary values can also be added when actual data for attributes is not available
but is needed to calculate the values for other standard attributes in the system.
Manual Summary
Simple Analysis
Simple analysis involves applying a function to a specific attribute in a dataset. Simple analysis functions create a
modified version of the original data, but do not change the raw data itself. Five simple analysis functions are currently
available: Clip to Field Boundary, Filter Data, Normalize Data, Optimize Swath Widths, Reassign Attribute Values, and
Scale Data. Clip to Field Boundary allows you to clip any dataset in the system to a field boundary which is useful
when dealing with data that is of a spatial type only which can nor be clipped normally in the software. Filter Data
allows you to add a Minimum and Maximum filter values to a selected attribute. This is useful for imported data that
needs filtering, since imported data is not processed and filtered like YLD data files, for example. Normalize Data
creates a new normalized attribute based on a selected attribute. The data for the selected attribute is normalized
based on one of two normalization methods that are provided. Optimize Swath Widths checks each smart rectangle in
a dataset for overlap with another smart rectangle. If smart rectangles overlap then the software creates a polygon
area for each value that represents the true area of that value, thus eliminating the overlap that was present and
adjusting the values as appropriate. Reassign Attribute Values allows you to assign values in a dataset to a single new
value based on an entered range or a specific value to reassign. Scale data applies a scale factor to a selected
attribute. This is useful when your data needs to be manually adjusted, which can be the case if data being imported
into the system was not logged properly. Multiple simple analysis functions can be applied to a dataset, thus allowing
you to filter a dataset and also apply a scale factor to it for example.
Once a simple analysis function is applied to a dataset, a summation icon will display next to the dataset that has had
the function applied to it in the management tree. All data displayed in the summary, reports, etc will be spatially based
and not monitor based. If the function is removed and the data is reprocessed then the original summary data will be
displayed, as either monitor or spatial data depending on what it is and what it was originally set to. Also, when a
simple analysis function(s) has been applied to a dataset, and that data is used to generate a report, chart, or map
printout, the output format will be clearly marked that it contains modified data.
Select Analysis Operation
Analysis Attribute Selection
Analysis Value Entry
Reprocess Analysis
How to add a simple analysis function.
How to edit a simple analysis function(s).
How to remove a simple analysis function(s).
General Analysis - Merge Cotton Data
General analysis functions are different from simple analysis in that they are used to create new datasets or results.
They are not intended to modify the contents of an existing dataset. Currently, only one general analysis function is
available, the Merge Cotton Data function. This function is located under the Tool menu and is used to merge multiple
cotton pickings into a new dataset that represents the single area covered by the pickings but with the sum and
gridded average for the two pickings together.
Once a general analysis function has been used to generate a new dataset, a function icon will display next to the
dataset that has been create through general analysis.
73
Page 80

SMS Basic and Advanced Manual
When ne
analysis, the Update Analysis tool can be run. This tool can be accessed by right clicking your mouse button on the
Management Tree which will re-run the general analysis function with the latest data contained in the system that
pertains to the general analysis dataset. This is very useful if you are harvesting over multiple days and need to update
the merged dataset or if you make calibrations changes in the monitor that you want applied to your base data and the
merged dataset.
How to merge cotton pickings.
How to update a merged cotton dataset.
Analysis Wizard (ADVANCED)
The Anal
are provided in a wizard format to make using them easier and more structured, helping insure that your results don't
contain errors. The Analysis Wizard also allows the management and running of saved analysis function as well as the
ability to run functions in batch and some functions across separate projects.
Most of the analysis function are raster based, meaning all the analysis occurs on gridded data and the results
generated are gridded except for Cluster analysis results which are vector. Most of the functions allow you to specify
the grid size(s) that is used to increase or decrease the resolution of the results and analysis functions. Increasing the
grid size used can also reduce the time it takes for a function to run.
Image datasets can also be used in a number of the analysis functions. If you select an image dataset as an input, you
will have access to three attributes for that image dataset; Image Red, Image Green, and Image Blue bands. These
attributes are dimensionless and their values represent the image pixel values for each band, from 0-255.
Select a topic below on the Analysis Wizard and the analysis functions in it:
Select Analysis Type to Run
Analysis Editor
Multi-Project Analysis
Cluster Analysis
This analysis function provides a powerful tool for defining regions in a field of similar data. You define how many
clusters (regions) that should be generated from the input data and selected attributes/properties. For example you
can use it to help identify regions where Yield and Soil pH share a similarity. This tool is sometimes used to help
identify management zones.
Select Cluster Attributes/Properties
Cluster Analysis Settings
How to generate a cluster analysis dataset
Comparison Analysis
This analysis function is an extremely powerful tool for showing relationships between all the various types of data that
you have in your system. It allows you to select a dataset, such as yield data and compare it by soil type, pH values,
etc. You can even perform this function in batch to analysis results across all your fields, farms, years, etc. An example
would be to compare Yield and Moisture values by Field and Soil Type. It can also be run across multiple projects.
Select Datasets for Comparison
Select Result Attribute(s) to Output
Select Result Grouping
Define Attribute Value Ranges
Analysis Report Options
How to generate comparison results
w data is read into the system that could affect the results presented in a dataset created through general
ysis Wizard provides access to various analysis functions that are available in the software. These functions
Batch Related Topics
Select Reference Dataset
Select Related Data Filter
Select Fixed Value
74
Page 81

Data Analysis and Modification
How to run a batch comparison analysis
Correlation Analysis
This analysis function provides the ability to help determine what variables that influence your crop production may
have a positive, negative, or no affect at all on each other. An example you may want to see what the historical affect
of different soil properties like pH, OM, or CEC may be on yield in your fields over all the years that you have been
collecting data. You may find that pH and CEC have no relationship at all but OM has a high correlation meaning as its
value increases so do yield levels and vice versa. This function can be performed in batch or even across multiple
projects.
Select Correlation Attributes
How to generate correlation results
Equation Based Analysis
This analysis function allows you to write your own equations to apply to the data in your system. For example, you
can enter in equations from your state for fertilizer recommendations using inputs such as yield values, soil test result
values, soil type, etc. Equations can also be run in batch to generate results for multiple datasets at one time, so you
can write a prescription equation and then run it against all your fields at once using the batch option.
Define Output Attribute
Set Analysis Result Type(s)
Select Analysis Input Datasets
Define Result Equation(s)
Add/Edit Equation Variables and Spatial Functions
Understanding Equation Formatting
How to write an analysis equation
Multi-Year Averages Analysis
This analysis function takes multiple years of data and combines them into one result dataset that is an averaged
equivalent of all the datasets that are input. You can also select to have the attributes normalized so as to allow for
proper averaging and comparison of datasets from different products, such as Corn and Soybean yield data which is
directly comparable since the yield scale of these products are not the same, thus not directly comparable. This
function is very useful for taking many years of yield data and combining them into one dataset that is easier top work
with for input into other analysis functions and also can show overall trends that exist year after year. It can also be run
in batch.
Aggregate Options
How to generate a Multi-Year averages dataset
NDVI Analysis
This analysis function creates an NDVI dataset set from an NIR image. NDVI stands for Normalized Difference
Vegetative Index and is an indicator of a crops health. Healthy crops will have a high NDVI value. Bare soil, rocks, etc
will have NDVI values near zero. Clouds, water, and snow will have negative NDVI values.
it is often referred to, is also generated using this analysis function.
NDVI Settings
How to generate an NDVI dataset
Profit/Loss Analysis
This analysis function uses the Financial Tracking entries you have made to generate a profit/loss dataset for a field at
a time. Three attributes are created; Expenses, Income, and Profit/Loss. The results will not be as accurate as the
totals or results you get from the Financial Tracking Report though due to the strictly spatial nature of this analysis and
the gridding that occurs, but it will still reflect financial trends in your fields that can be used to make adjustments to
your operation or as an input into the equation analysis function for further analysis. This function can also be run in
batch.
Financial Tracking
How to generate a Profit/Loss dataset
Terrain Analysis
Raw NIR data, or Vigor as
75
Page 82

SMS Basic and Advanced Manual
This anal
gradient direction (degrees), stream power, etc attributes for a selected field. These results can then be used as an
input into the equation analysis function for further analysis. This function can also be run in batch.
How to generate a terrain analysis dataset.
Multi-Project Analysis (ADVANCED)
Multi-Project Analy
which have no link to each other. This is powerful because it provides a means for "pooling" of data from many
growers for example across a county or even an entire state for example. This ability would allow you to compare the
yield performance of a certain hybrid/variety across multiple growers in a region, without compromising the privacy of a
specific growers detailed information. You can also perform a correlation to see if there maybe was a correlation
between yield levels and pH values for a group of growers in a region.
Select a topic below on multi-project analysis:
Select Projects to Analyze
Select Reference Dataset
Select Related Data Filter
Select Data Filters
Correlation Analysis
This analysis function provides the ability to help determine what variables that influence your crop production may
have a positive, negative, or no affect at all. An example you may want to see what the historical affect of different soil
properties like pH, OM, or CEC may be on yield in your fields over all the years that you have been collecting data.
You may find that pH and CEC have no relationship at all but OM has a high correlation meaning as its value
increases so do yield levels and vice versa.
Select Analysis Input Datasets
Select Correlation Attributes
How to generate correlation results.
Comparison Analysis
This analysis function is an extremely powerful tool for showing relationships between all the various types of data that
you have in your system. It allows you to select a dataset, such as yield data and compare it by soil type, pH values,
etc.
Select Datasets for Comparison
Select Result Attribute(s) to Output
Select Result Grouping
Define Attribute Value Ranges
Analysis Report Options
How to generate comparison results
Spatial Data Finder (ADVANCED)
The Spatial Data
manually select it from the management tree or the calendar view. You define a custom filter, similar to what you would
do for a report, that allows you to search the system for any spatial data that meets your selected filters. For example
you can setup a filter that finds all Grain Harvest data of a specific product, such as Corn. The result is that you get an
output that generates one or more layers (based on how you select to group the results) in a new map or the currently
active map.
Select a topic below on finding spatial data:
Spatial Filter Type Selection
Select Spatial Filter Items
Spatial Filter Results
How to search for spatial data using the Spatial Data Finder
ysis function uses the 3D grid that is used to display the 3D terrain view to generate slope (dimensionless),
sis provides a very powerful tool for performing certain analysis functions over separate projects,
Finder provides a tool for finding data in the system that you would like to map without having to
76
Page 83

Data Analysis and Modification
Financial Tracking
The soft
ware allows you to enter financial values to track your expenses and income to provide detailed information
such as total and average expenses for performing certain operations and profit/loss information. We call this type of
analysis Financial Tracking. Financial Tracking entries can be used to generate a Financial Tracking Report,
Profit/Loss datasets (ADVANCED Only), or calculated expense, income, and profit/loss attributes for your datasets.
In Basic, you can only create/edit Simple Expense/Income entries. These entries can be added to Products,
Operational Instances, or Datasets from the management tree. They can also be added via the Management Item
Editor for Products and Operational Instances. Simple Expense/Income entries are all based on Money PER type
entries so money/bag or money/gallon for example.
In Advanced, you can create/edit Simple and Calculated Expense/Income Entries. Calculated entries are different in
that they are often based on multiple values and aren't normally entered as money PER entries. Advanced users also
have access to the Financial Tracking Tree and also Profit/Loss Analysis that generates a single analysis result
dataset for all the expense/income entries for a single year.
Select one of the topics below on Financial Tracking:
Simple Expense/Income Entries
About the Financial Entries Tree (ADVANCED)
Select Expense/Income Type
Expense/Income Info (ADVANCED)
Expense/Income Entry (ADVANCED)
Profit/Loss Report Options
Analysis Wizard (ADVANCED)
How to enter Financial Tracking entries
How to generate a Financial Tracking report
How to generate a Profit/Loss dataset (ADVANCED).
Booklet Printing (ADVANCED)
This option is available to Advanced users onl
have to print or export manually for each type of output that you wanted to generate. Booklet Printing streamlines and
organizes this task and allows you to build a booklet template that can be run to automatically generate all your
desired results in one result booklet than can be printed or saved to HTML.
The Booklet Printing option is unique because it allows you to generate a complete solution that includes a title page,
table of contents, reports, charts, maps, and analysis results. Without this option all these results would require many
separate steps that would have to be manually configured and run individually which could be very time consuming
and lead to possible errors in terms of including the proper data between all the results you would manually be
generating. Booklets all help insure consistency in the results you are generating.
Select one of the following topics on Booklet Printing:
Booklet Type Selection
Booklet Item Selection
y. It allows you to build up a booklet of results that normally you would
77
Page 84

Page 85

Importing/Exporting Data and Setup Information
Importing Data
The software provides a number of import options. You can import image, ESRI Shape, ASCII text files, and other into
the management system.
There are a number of sources for spatial data to import into the system, some free and others fee based. Your local
input supplier may already have files that have been collected for your fields that they can provide you to import into
the system.
Select a topic below on importing data into the system:
Image Files
Image files in a BMP, JPEG, JPEG2000,
system and manually geo-referenced, if needed. Imported images can be managed in the Management Tree or stored
as background images for maps. World files containing geo-referencing for the import image are also supported, if
available, and will be automatically loaded if they are present in the same location as the image file you are importing.
MrSid and JPEG2000 are image formats used in the GIS industry to compress, manage, and transfer very large image
files, at very high resolutions. These files can be imported into the system, but by doing so they will not be compressed
any longer, which means they can take up large amounts of storage space on your hard drive. Make sure that when
importing these formats that you either use one of the available clipping options when importing or try to acquire
images located around your fields specifically and not county wide images for example. Some files may not import,
such as an image of an entire county, if they are to large because your computer may not have enough available
memory or storage to open and save the file. Also, these formats can contain geo-referencing information like a
GeoTIFF but it is not required. If it does not have the geo-referencing you will be required to geo-reference the image
the same as you would when importing a regular image file.
Image Geo-reference
How to geo-reference an Image
Image Clipping Options
Manually Clip Image
Image Import Settings
Set Background
Download Imagery from Internet...
Allows the automatic downloading and import of color aerial images from the internet. You must have an internet
connection to use this feature and you should have either automatic, frozen, or set boundaries for fields in your system
to get the best possible images available. The download process is very simple and allows you to select the fields that
you wish to download images for via a filter and then where you want the images stored in the system and whether or
not you would like them to clip to your frozen field boundaries. Images can also be downloaded from the internet by
entering a manual Latitude/Longitude or by selecting entering a location name.
NOTE: No warranty or guarantee of imagery quality or availability is made when using this feature.
Downloaded imagery is made available for the users own private use only and is not to be used for resale or
commercial purposes.
Internet Imagery Download Options
How to download imagery from the internet
Set Background
Download Soil Survey Data from Internet (US Only)...
Allows the automatic download and import of soil survey data from the USDA via the internet. You must have an
internet connection to use this feature and you must have either an automatic, frozen, or set field boundary for your
fields in order to download the soil survey information. The available data may vary from region to region but as much
technical detail as is available is downloaded for the soils that go with your fields.
NOTE: No warranty or guarantee of quality or availability is made when using this feature.
How to Download Soil Survey Data from the Internet
Soil Survey Clipping Options
Spatial Files
GIF, MrSID, PNG, WMF, TIFF, or GeoTIFF format can be imported into the
.
79
Page 86

SMS Basic and Advanced Manual
ESRI Shape, MapInfo MID/MIF, DEM, BIL(NED), and TIGER (general data or county subdivisions) files can be
imported into the system and displayed in the Management Tree as well as mapped, or stored as backgrounds for
maps.
Import Preview
Select Import Type
Select Column Attributes
TIGER Data Options
How to import an ESRI Shape, MapInfo Mid/Mif,
ASCII Text Files
ASCII text files can be imported i
Text Import Format
Select Lat/Lon
Import Preview
Select Import Type
Select Column Attributes
How to import an ASCII text file.
Non-Spatial File (Lab Results)...
Non-spatial ASCII text files can be imported into the s
read into or created in the system. The most common example of non-spatial data that you would want to import is soil
sample lab results. Weather data might also be another example of data that doesn't have spatial references with it but
that you want to link to spatial datasets that you have such as a field area.
Text Import Format
Select Field Name Column
Assign Import Data by Field Names
Select Linking At
Select Column Attributes
How to import non-spatial data(i.e. Soil Lab Results).
Management Items (Products)...
Specifically supported file formats that contain reference item lists, such as AgriDNA XML files or generic ASCII text
files containing lists of items and their properties can be imported using this import wizard. Common uses of this import
would be to import Product, Vehicle, or Implement lists. The Ag Leader Management Setup File (*.MSF) is also
supported for import of management items such as Grower/Farm/Field.
Select Import Columns
Management Item Import Preview
Using a Template
The soft
ware allows you to use import templates that have the column attributes already defined for a specific file type
and format. You can save a template when importing data for the first time and then use the template the next time you
import data of the same type and format.
Import Template
How to import data using a template.
Exporting Data
ware provides a number of options for exporting data. You can export data as an image, ESRI Shape, KML,
The soft
ASCII text, etc. Not all types listed above are available when exporting some selections from the Management Tree or
the current map. Exporting can also be performed from within all dataset editors.
NOTE: Device Setup should be used to export when you want to export multiple files or a complete setup for a
supported display/monitor. Export is more provided as a general tool for exporting files in general formats or when only
single files are needed to be exported. Jobs/Tasks can also be used to export to displays/monitors and should be used
tribute
nto the system and displayed in the Management Tree as well as mapped.
DEM, BIL(NED), or TIGER file.
ystem and linked to spatial datasets that have already been
80
Page 87

Importing/Exporting Data and Setup Information
when you want to plan and track specific field operations. See Device Setup
information.
Select an Export Method
Device Setup
Select a Display File Format to Export to
Select a Generic File Format to Export to
Export Settings
Select a topic below on exporting data from the system:
Image Files
Mapped data ca
from the management tree or the current map. If you export an image from the management tree the resulting image
will be exported in an un-projected state. If the current map is exported, all its layers will be used to create the image
file and the image will look just like the map was displayed.
Mapped data can also be exported as a GeoTIFF image file. The exported GeoTIFF file contains spatial reference
information that will allow other programs that support GeoTIFF’s to map the image file without requiring
georeferencing information from you. If you export a GeoTIFF from the management tree the resulting image will be
exported in WGS84 Lat/Lon. If the current map is exported, all its layers will be used to create the image file and the
GeoTIFF will be exported in the current projection that the map was set to.
How to export a bitmap or other image file type.
Spatial Files
Selected data in the Manageme
the Management Tree or the current map can be exported as a Shape file. The attribute and properties that are
exported can also be customized and export templates can be created for common exports and to speed up exporting.
How to export an ESRI Shape file.
Text Files
Selected data in the Manageme
the Management Tree or the current map can be exported as an ACSII text file. . The attribute and properties that are
exported can also be customized and export templates can be created for common exports and to speed up exporting.
How to export an ASCII text file.
Ag Leader Basic or Ag Leader Advanced Files
Onl
y YLD file based yield data can be exported as an Ag Leader Basic or Advanced file.
How to export an Ag Leader Basic or Advanced format file.
Boundary Files
An
y items at or below the Field level can be selected for export as a boundary file. The format of the export file can be
an ESRI Shape, KML, ASCII text, IBY boundary files for the Ag Leader Insight display, or BDY boundary file for use in
the Ag Leader PF3000 or PF3000 Pro. Boundary files can also be exported from the Boundary Edit dialog.
Navigation Files
Navigation datasets that are selected in the Manag
Shape, KML, ASCII text, or PFN navigation file for use in the Ag Leader PF3000 or PF3000 Pro. Navigation files can
also be exported from the Navigation Edit dialog.
Prescription Files - Single and Multiple Layer
Prescription datasets that are selected in the Mana
KML, ASCII text, ARM prescription files for use with Mid-Tech or Tyler/Case IH AIM systems. TGT prescription files for
use in the Ag Leader PF3000/PF3000 Pro or Insight display, IRX files for use in the Insight display, Case IH/New
Holland Voyager PRD, ENS, or PRE prescriptions, or Flexi-Coil PRE prescription files. Prescriptions for the
AGCO/AGCHEM FALCON system can be exported as TIF or TRF/INI file(s). Prescription files can also be exported
from the Prescription Editor dialog.
n be exported as an image file in a bitmap, JPEG, GIF, PNG, or TIFF format. You can export an image
nt Tree or the current map can be exported as an ESRI Shape file. Not all selections in
nt Tree or the current map can be exported as an ASCII text file. Not all selections in
ement Tree or the current map can be exported as either an ESRI
gement Tree or the current map can be exported as ESRI Shape,
Single Layer Only
and About Jobs and Tasks for more
81
Page 88

SMS Basic and Advanced Manual
Ag
Leader TGT Export Settings
How to export a TGT prescription file.
Voyager Prescription Settings
How to export a Case IH or New Holland Voyager PRD Prescription file
Single or Multiple Layer
Insight IRX Export Options
How to export an Insight IRX Prescription File
Case IH ENS Export Settings
Flexi-Coil FlexControl/Case IH ADX Export Settings
How to export a Case IH ENS Prescription File.
Guidance Files
Guidance datasets that are selected in the Management Tree or the current map can be exported as either generic
ESRI Shape, KML, ASCII text, GLN guidance file for use with MidTech systems, guidance files for use with Case
IH/New Holland/Trimble Remote Data Logger, guidance files for use with the Trimble AgGPS160/170, and FLD
guidance files for use with the EZ-Guide Plus system(v2.X> firmware). Guidance files can also be exported from the
Guidance Editor dialog.
Marks Files with or without Logged Data
Mark data that is
as either an ASCII text, ESRI Shape, KML, or PFN navigation file for use in the Ag Leader PF3000 or PF3000 Pro.
This option is only available when the selected dataset in the Management Tree or the current map contains mark
data. Marks data is exported by itself and not with the data it was collected with such as harvest data.
Export Templates
Export templates can be created in the software for Spatial export types. You can setup the export settings for a
particular file format and then save the settings so that they can be loaded each time you need to export data in the
specific format and formatting.
Device Setup
The soft
field device to set up things like Field Names, default calibration values, mark names, etc.
A setup configuration can be created that can contain the following: Growers/Farms/Fields, Resource Tracking Items,
Pests, Drainage Tile (ADVANCED), Products, and Spatial Datasets. These items when added to the setup
configuration can then be exported to various supported monitors and field devices. Setup Configurations can be
saved for exporting to multiple monitor systems, even if the monitors were not made by the same manufacture and use
different file formats. Setup Configurations are generic and thus can be reused independent of what system you
currently are using. Setup Configurations can also be created if different names are needed for different seasons or
different customers for example.
Spatial Data can also be selected for export in the setup configuration using a Year and Operation filter and the
Grower/Farm/Field(s) that are selected in the setup configuration. So once you have picked your Fields you will be
working in, all you have to do is select a Year and then an Operation you have data for and that spatial data can then
be exported in the appropriate file format for the device you have selected to export to. Common examples would be to
pick the Guidance operation to export guidance patterns that can then be used by your field device to provide
guidance in the field or to export variable rate prescription files by picking one of the prescription operations that you
had created prescription data for. Please note that not all Operations that can be selected are supported by all field
devices and their file formats. Device export will only export the spatial data and operations that are supported by the
selected export format and all other spatial data you have in your setup configuration will be ignored.
Support is also available for exporting a device setup for Ag Leader AGSETUP files to the AgFiniti cloud-based
service. This allows you to place your setup file in the cloud where it can be downloaded by other users and displays
that have access to your AgFiniti account. This feature requires an AgFiniti File Transfer license to function.
When creating and exporting a device setup for SMS Mobile there are a number of exceptions to the normal rules for a
Setup Configuration. First is that Farm and Field backgrounds that have been set will automatically export based of the
Farms and Fields you select to export and you can not disable this, they always export. Second is that all Products
export to SMS Mobile, you don't have to custom select Products to export they will all be exported. Third is that all
How to export a Case IH or Flexi-Coil PRE Prescription File.
contained in a dataset that is selected in the Management Tree or the current map can be exported
ware allows you to export a device setup file(s) that can be loaded into your monitor, SMS Mobile, or other
.
82
Page 89

Importing/Exporting Data and Setup Information
attributes and properties are exported to SMS Mobile, including user created ones. The last exception is that all usercreated or altered Operations are exported automatically.
Select a topic below on Device Setup:
Device Setup Utility
Add/Edit Setup Configuration - Setup Info
Add/Edit Setup Configuration - Fields Setup
Add/Edit Setup Configuration - Resource Tracking Setup
Add/Edit Setup Configuration - Pest Setup
Add/Edit Setup Configuration - Drainage Tile
Add/Edit Setup Configuration - Products Setup
Add/Edit Setup Configuration - Spatial Data Setup
Select Display to Export to
How to create and export a Device Setup.
83
Page 90

Page 91

Printing (Reports, Charts, Map Layouts, etc)
Printing
The software provides a number of methods for printing out the data that you have read into the management system.
There are five main types of printing that you can perform: Screen prints, Report printouts, Scouting reports, Charts,
and Map printouts.
Select one of the following topics to see more information on printing in the software:
Printing Screen Information
The soft
ware provides the option to print information that is displayed on the screen in a number of areas. In general
always look under the File Menu for your print options for the current view or document that is active or right click in a
document window to see its print or save options, if any are available.
How to print the Map Window summary information.
How to print the query results information.
How to print the Summary Window Information.
Printing General Reports
ware allows you to print summary reports for data that is stored in the management system. Reports can even
The soft
be generated for data that is imported and was not collected by your equipment. You have the option to set filters for
each report type that is available. Reports can even be output as an HTML (Hypertext Markup Language) files for use
on the Internet.
Report Type Selection
Report Options
How to print a report.
How to create a custom report
Printing Scouting Reports
The software allows you to generate a special report for any data you have collected or created as a Scouting
operation. This report is special because it combines aspects of a normal report with a print layout to provide summary
data as well as map data for your scouting data. It is also unique in that the general formatting of the report is fixed in
its design but you can customize some of the content of the summary, what operations to display, and even colors for
formatting the look of the report. Two types of report can be generated; a Condensed Scouting Report or a Detailed
Scouting report. The condensed version is designed to generate a minimal number of pages with only key information
while the detailed version will provide multiple pages with more detail on each of the scouting operations you collected
data for.
Select a Scouting Report Type
Select Report Content Settings
Select Report Formatting Settings
Scouting Report Preview
Printing Charts
The software allows you to print charts of both attribute and property data. You can generate various types of bar and
pie charts, which ever best fits your visualization needs. Charts can either be printed with a printer or saved as image
files.
Chart Type Selection
Chart Options
How to print a chart.
How to create a custom chart
Printing Map Layouts
The soft
ware provides a preview of the printout that will be created when one of the print layer/map options is selected.
You can alter the dimensions, location, and properties of the default data boxes on these layouts. The Custom Layout
selection allows you to save any changes to existing layouts or create new layouts.
85
Page 92

SMS Basic and Advanced Manual
Select one of the following links to see a description of each of the different types of layouts:
Single or Multi-Layer Layout
How to print a map of the current layer.
How to print a map of all layers.
Current Map Layout
How to print the current map.
Custom Layout
How to print a custom map.
86
Page 93

Data Backup, Transfer, and Maintenance
Backing up and Restoring Data
The software provides you the ability to create a backup copy of all the data and settings that you have stored in the
system. Backup files can then be restored at a latter date to go back to a previous state of your data or to recover data
that may have been lost.
Backup
This feature cre
directory. It is recommended that you periodically create backups of your system to protect the data you have loaded
into it and the management settings that you have made. Advanced allows you to create backups for all your projects,
a single project, or selectively pick specific projects you want to backup at the same time.
How to create a backup of your systems data.
Backup Scheduling...
This feature allows you to define a date/time when a backup of either all your projects or a single project will occur,
unattended. This is extremely useful in situation where you have very large projects and need to have backups occur
overnight when you don't need access to your projects. Your computer must be left on for a scheduled backup to
occur, but the software must be closed. You also do not have to be logged into your computer for the backup to occur,
as the your computer login is required to setup a backup so that the backup can occur without you having to physically
login to your computer.
Schedule Backup
Restore
This feature allo
files, and settings to the same state that they were when you created the backup(s).
How to restore a system data backup file.
Transfer Settings, Setup Files, Etc.
nsfer options provide a means of sharing various settings and setup files that you have created or modified,
The tra
with other users of the software. You can transfer selection lists, properties, attributes, backgrounds, analysis function,
operations, years, operational instances, products, vehicles, implements, containers, operators, legends, print layouts,
import templates, export templates, reports, and charts. If you transfer an item, such as a report or analysis function
that uses an attribute or property that is user-defined the transfer will automatically add the attributes or properties that
you defined and are unique to your system to the transfer list under the appropriate item group. This insures that your
transferred items will function properly on another users system even though they may not have all the same items in
their system that you have.
Transfers can also be used by Advanced users to "sync" items and settings between projects. This means that you
can setup all your custom settings and items in one project, select all the items for transfer, click the Set As Transfer
Project Default button, and now when you open any other project it will check to see if it has the latest transfer loaded
and if not it will ask you if you would like to load the latest transfer. The result is that you can quickly and easily share
your items with all the projects you use, which is extremely useful when you have items that you add that you would
like to add to all your projects for general use.
How to export and import Transfer Information
Transfer Export Dialog
ates a compressed backup of all the data, archived files, and settings that are stored in your Data
Note: Basic users have limited access to project editing or control, and are limited to five. Basic users can
provide a backup that can be restored into Advanced, and vice versa.
ws you to select one or more backup files that were previously created, to restore your data, archive
Note: When you perform a restore in Basic, up to five projects can be restored. Any projects beyond the
first five will be ignored. You can also select to have it replace existing data if you want.
87
Page 94

SMS Basic and Advanced Manual
Available Items to Export
Select from the listed settings, files, etc that are available for transfer.
Show Default System Items
Check this option to show all items in the system, including factory defaults. The only time you should need
to transfer factory defaults is if you have altered the defaults and you want to transfer them.
Selected Items to Export
Lists the settings, file, etc that have been selected for transfer.
Set As Transfer Project Default (ADVANCED)
Click this button to set the items that you have chosen for transfer as a global default for all projects in your system.
Each time you open a project it checks to see if it has the latest global transfer that is available. If it does not, then you
will be asked if you would like to load the transfer into the project you are opening or continue on without loading it.
This is very useful for keeping items and settings that you often you or add over time to other projects so that you don't
have to manually create them again or transfer and import them manually.
Transfer Import Dialog
88
Page 95

Data Backup, Transfer, and Maintenance
Available Items to Import
Lists items that are available for import, but should only list items that have been removed from the Selected Items
tree.
Show Default System Items
Check this option to show all items in the system, including factory defaults. The only time you should need
to transfer factory defaults is if you have altered the defaults and you want to transfer them.
Selected Items to Import
Lists the items that are contained in the selected transfer file for import. You can selectively remove items that you do
not want to import from the transfer file by removing them.
Create New Items if Duplicates Exist
Select this option if you want to create new item entries in your system if duplicates are found between
items in your system and those being imported from the transfer file. This option insures that you don't
overwrite existing items that you may want to keep as is but can also lead to a number of additional
number items being created that could be duplicates of items you already have and really should have just
replaced.
Replace Duplicate Items with Import Items
Select this option if you want to replace any duplicate settings, files, etc that are already in your system
with the ones from the transfer file. Remember that this option will overwrite any existing items in your
system that are the same, so be careful because you will lose the current version of these items in your
system.
Set As Transfer Project Default (ADVANCED)
Click this button to set the items that you have chosen for import as a global default for all projects in your system.
Each time you open a project it checks to see if it has the latest global transfer that is available. If it does not, then you
will be asked if you would like to load the transfer into the project you are opening or continue on without loading it.
This is very useful for keeping items and settings that you often you or add over time to other projects so that you don't
have to manually create them again or transfer and import them manually.
Database Maintenance
89
Page 96

SMS Basic and Advanced Manual
The software uses the ACCESS 2007 database engine to store and manage data in the management system. Due to
the deleting of data, number of datasets (loads) read into the system, and management changes there can be a fair
amount of wasted or unused space in the database which can slow down the performance of the system. To keep the
system performing at a high-level, it is recommended that you use the Compact Files… feature located under the Tool
menu. This function will cleanse your database of unused information that is wasting space. This feature will also
optimize the database to increase performance. It would be good practice to run this feature once a month.
90
Page 97

How to ...
How to read logged data files into the system.
Follow these steps to read files into the system:
Start the program.
1.
2.
Now go to the FILE menu or the main toolbar and select READ FILE(S)...
3.
A dialog will now appear with four options on it for reading files into the software. To read files logged
or created by a supported field display there are two options. The first option is READ FILE(S) FROM A
SUPPORTED FIELD DISPLAY OR MONITOR. The option is selected if there is a green check mark over
the top right corner of the display icon. Once the option is selected, click the START READING FIELD
DISPLAY FILES... button. The second option is DOWNLOAD AND READ FILES FROM AGFINITI CLOUD
SERVICES but this option is only for Ag Leader AGDATA and AGSETUP files currently.
°
The AgFiniti option is only available if you have an AgFiniti account and a File
Transfer license.
A dialog will now appear that lists all the companies that the software can read files directly from as
4.
well as the options for searching for or selecting files. Click one of the company names to select it, then in
the list to the right of the buttons a list of supported displays/file formats will be displayed. By default the
SEARCH FOR ALL FILE FORMATS BELOW option should be selected and it is recommended that
generally you leave the selection set to this option. Lastly you can select the search or selection option. By
default the option will be set to search a folder or a directory. You can also manually select files or search
an entire card/drive. Once you have selected your options click the START AUTOMATIC FILE SEARCH...
button.
5.
Depending on which search option you selected you will now either be prompted with either a file
selection dialog, a folder/directory dialog, or the drive/card you selected to search will be searched for files
that match your selection.
Once the search or selection is completed you will now see a dialog that lists the results or the
6.
search or selection as well as the current settings that will be used to read the selected files. At this point
you can edit the selected files to either add more files or remove files by clicking the EDIT... button to the
right of the list of files. File processing options are provided and if you want to edit them select the
EDIT...button to the right of the listed options. Lastly, there is an ON/OFF button that controls how
management information will be created for the data being read in as well as whether you will see the data
processing settings. it is HIGHLY recommended that you leave this option set to ON.
7.
Once you are happy with the selected files to be read in and the various processing settings click the
START PROCESSING SELECTED FILES... button.
Now depending on what type of file(s) you selected to read and the options selected, you may be
8.
prompted to enter/set management information or set format specific information that is missing.
°
The following are examples of some formats that will require you enter/select
management information. The CNH Voyager format requires the entry/selection of a
Grower. The Case IH’s and New Holland’s ENS file format contains only Farm and Field
names and requires the creation/selection of a Grower for data from a new monitor. If the
file being read in is an Ag Leader BDY, TGT, or PFN file you will have to enter/select
Grower, Farm, and Field names.
°
The following are examples of formats you have to enter settings for. You must select
an archive data type for all Harvest or Site Verification files from Ag Leader’s YM2000’s and
early firmware versions of the PF3000 as well as all Case IH AFS yield mapping systems.
Newer Ag Leader PF3000 YLD’s provide the information to auto-detect the type when read
in. Another example is for the CNH Voyager 2 file format you will be asked to select whether
or not you want to also read in addition files such as field boundaries, guidance files, etc
when the logged data is read in.
9.
The file(s) will now be read into the software. When processing is finished, the data will be selectable
in the Management Tree.
How to migrate your data from Precision Map 2000 or Instant Yield Map Software
Follow
these steps to transfer data from Precision Map 2000 or Instant Yield Map Software:
1. Start the software.
2. Go to the File Menu and then select Open or select the Open icon from the main toolbar.
3. The Select Files dialog will now appear on the screen. Click on the Add File(s) button.
4. The Open dialog will now appear. Now click on the down arrow to the right of the Look In: box. Now select
the location where you installed Precision Map or Instant Yield Map and find the folder that contains the
91
Page 98

SMS Basic and Advanced Manual
serial number of your monitor(s). This folder will contain all the YLD files that you have read into Precision
Map 2000 or Instant Yield Map for that monitor. Select all the files that you would like to read in and then
click the Open button.
5. You will now return to the Select Files dialog. The files to be loaded into the system will now be listed in the
dialog. If all the selected files are from the same year, Grower, Farm, and are of the same Operation Type
and you would like to read the files in quicker, you can select the Batch Process Files item. If you are ready
to continue and load these files, click the Next> button and follow the rest of the directions for reading files
Note:
The same procedure as above should be used to transfer data from other mapping software programs that you have
been using that kept an archived YLD file. Locate the YLD files within the program and follow the steps detailed above.
How to import Greenstar data.
Gree
exported from JDMap or JDOffice and then imported into the software using a template. Reading directly from the
original GSY files is recommended.
Follow these steps to import Greenstar data into the system:
How to reprocess data.
Follow
Note: Currently only YLD files support reprocessing of data. All other formats can only be reprocessed through the
Reprocess File(s) functionality.
How to set your map projection.
Follow
into the system.
nstar data can be imported either directly from the GSY files that are logged or via an ASCII text file that can be
1. See How to read logged data files into the system.
OR
1. Go to the File menu and select Import, then Using a Template.
2. The Select Template dialog will now appear. Click the Browse button for Template File and then select the
Greenstar.imt file in the Open dialog and click Open.
3. Click the Browse button for Import File and select the Greenstar ASCII text data file that was exported from
your software. Click Open.
4. Select a Data Type and a Management Type for the imported data. Select Grain Harvest for the Data Type if
the data being imported in yield data. Select Add to Management Hierarchy for the management type. Click
Next> once you make these selections.
5. The attribute columns should all be set and ready to continue. Make sure that there is data for all the
columns that are set and that they match properly. Click Next> when done.
6. Select the management information for the imported data then click Next>.
7. Click Finish.
these steps to reprocess load data that has already been read into the system:
1. Select the load(s) that you would like to reprocess from the Management Tree, either by selecting the
Operation Instance to select all the loads below it or selecting an individual load(s).
2. Click the right mouse button and select Reprocess Data…from the menu that pops up.
3. A dialog with a settings tab(s) will now appear, depending on what settings can be reprocessed for the
selected data. Make the settings changes that you would like applied to the selected data and then click OK.
4. If more than one file contains data for the selected loads then the settings dialog will reappear for each file.
Repeat Step 3) for each of these dialogs.
5. Once all the files have been set, the software will begin reprocessing the load data based on your edited
settings.
6. Reselect the reprocessed data from the Management Tree to see the effects of the changes that were
made.
these steps to set the default map projection for all maps that made:
1. To create a more accurate map of your data you need to select a special projection that is specific to the
area you farm, click on a Grower in the Management Tree.
2. Click the right mouse button and select Edit Item.
3. Click on the Projection Tab.
4. Click the down arrow in the box under Datum and select NAD83 for example for the United States.
92
Page 99

How to ...
5.
Click the down arrow in the box under Projection and select the state and region description that best fits the
area you farm.
6. Click OK. Any new maps you make will now reflect this change.
Note: Reference maps showing UTM zones for the entire world and State Plane regions for the United States are
available by clicking the Help button on the Projection tab.
Using the Management Tree
The Manag
The following steps describe how to use the Management Tree to find information that you are looking for:
Note: All levels in the Management Tree that have a (+) or (-) next to then can be expanded or compressed. Doubleclick on the item with the left mouse button to do this.
Hint: If you are having trouble finding information you want because there is to much information shown in your
Management Tree then you should try using the Management Tree Filter option to reduce the items that are displayed
in your Management Tree. Click the Filter icon in the Management Tree Toolbar or right click your mouse in the
Management Tree window and select the Management Tree Filter option. A filter dialog should now appear that lets
you pick specific management items to include data from in your Management Tree. In addition or on its own you can
also set a date range to include data from. Once you have selected your filter items, select OK and your Management
Tree should not be updated to only show the items that match the filter items that you set. A common example would
be to set the filter to a specific Year you want to see data for or a specific Operation or Product.
Using the Preview Window
ement Tree allows you to quickly and easily find information that you would like to view.
1. Click on a Grower name. A map of all the farm boundaries (If defined) and fields associated with the Farm
and Grower should appear in the Preview Window (if it is active). Summary information should also appear
in the summary window showing all the Farms and Fields that are associated with the Grower. A map can
now be created/added to the Map Window as a boundary layer.
2. To proceed down in the tree, double-click the left mouse button on the Grower name. The tree will expand to
show all the Farms associated with the Grower. The Management Tree will automatically expand to the next
level that has multiple entries, so if all the following levels down to the Load level only have one entry then
the tree will expand all the way down to that level. The Summary Window will now display a list of Fields
associated with the Farm and the Years that data is available. Click on a specific Farm to see a boundary
map of the Farm (if defined) and all the Fields associated with the Grower and Farm in the Preview Window,
if it is active. Double-click on a Farm to expand it and see a list of the fields associated with it. A map can
now be created/added to the Map Window as a boundary layer.
3. Now double-click the left mouse button on a Farm and/or click on a Field. A boundary map for the field
should now be displayed in the Preview Window (if there is spatial data for that field). The Summary Window
should now display the Years and Operation Types that data is available for the selected field. A map can
now be created/added to the Map Window as a boundary layer.
4. Next, double-click the left mouse button on a Field name and/or click on a Year. The tree will now expand to
show a list of all the Years that data is available for the field, or expand to the next level with multiple entries.
The same boundary map as above should still be visible in the Preview Window (if active). The Summary
Window will now display the Operation Types that data has been collected for in that Year and the
Crop/Products that were used. A map can now be created/added to the Map Window as a boundary layer.
5. Now double-click the left mouse button on a Year and/or click on an Operation Type. The tree will now
expand to show a list of all the Operation Types that data is available for that Year or expand to the next
level with multiple entries. The same boundary map as above should still be visible in the Preview Window (if
active). The Summary Window will now display the Crops/Products and the Operational Instances that data
is available for. A map can now be created/added to the Map Window as a boundary layer.
6. Next, double-click the left mouse button on the Operation Type and/or click on a Crop/Product. The tree will
now expand to show a list of all the Crops/Products that data is available for or expand to the next level with
multiple entries. A default data map should now be displayed if spatial data is available in the Preview
Window, if active. The Summary Window should now display field summary information for the selection if
available. A data map can now be created/added to the Map Window.
7. Now double-click the left mouse button on the Crop/Product and/or click on an Operational Instance. A
default data map should now be displayed if spatial data is available in the Preview Window (if active). The
Summary Window will now display load summary information for all the loads that data is available for. A
data map can now be created/added to the Map Window.
8. Lastly, double click the left mouse button on the Operational Instance and/or click on a Load. A default data
map should now be displayed for the selected Load in the Preview Window, if active. The Summary Window
will display the summary information for the selected load. A data map of the selected load can now be
created/added to the Map Window. You have now reached the bottom level of the Management Tree
hierarchy.
93
Page 100

SMS Basic and Advanced Manual
The following steps outline a general procedure for using the Preview Window:
1. Start the software.
2. Make a selection(s) in the Management Tree.
3. If the Preview Window is not visible by default, it is located below the Management Tree, then select View
from the main menu then click Preview Window. The Preview Window should now be displayed.
4. If spatial data is available for the selection(s), then a map of the data should be visible in the Preview
Window. The map that is displayed will depend on the level at which you have made your selection in the
Management Tree. If you selected any level above Crop/Product then you will see a boundary map for the
selection(s), if you have selected the Crop/Product level or a lower level then you will see a default data map
for the selection(s).
5. If you would like to create or add to a map then click on the appropriate button at the top of the Preview
Note: The Preview Window can not be zoomed, unless you have a wheel-type mouse, or edited. It can however be
undocked from its default location, resized, or turned off.
Using the Calendar View. (ADVANCED)
Follow
Window or click on the appropriate icon in the main toolbar.
these steps to use the Calendar View:
1. Click the Calendar View Tab in the Main Window. The Tab should switch and you will now see a calendar
displayed where the Management Tree was previously.
2. The area above the calendar displays the available tools for working with the calendar. The current date
should be displayed in a selection in the upper right corner of the window.
3. Adjust the date to a time when you know you have logged data, such as the month and year that you have
harvested with a yield monitor and GPS receiver. The date can be changed by selecting the number you
want to edit and either typing in a number or using the arrow keys on the keyboard to increment the values.
Additionally, you can select the down arrow beside the date values and a small calendar will appear that you
can use to select a new date.
4. Once you find a date range with spatial data in it, you will see a gray bar(s) with a Year/Product/Operation
based name. These bars are called Calendar Events and are based on a grouping filter that can be set to
group data into events of your choosing.
5. Left click on one of the gray boxes; it should then turn blue to indicate it is selected. The Summary Window
should now update with a summary of the selected calendar event. This summary view is different than
other summaries in that it lists different management items together and provides a sum of the entries at the
bottom. The summary can also be printed.
6. In addition to the Summary, displaying the Preview Map should display all the data for the selected calendar
event, which can then be mapped. This is an excellent way to make a quick map of all your Soybean or Corn
harvest data, for example, with one button press.
7. You can also change the resolution of the calendar between a Month, Week, and Day View for better
resolution of the calendar view. On the Day View, Daily Stats/Info is also available that summarizes the data
that was collected on that day, but no map will be displayed.
8. Two filter and grouping buttons are available above the calendar view:
The first filter is a standard Data Filter that limits the data that can be viewed in the calendar, such
as only displaying data from a certain Grower or an Operation.
The second button is for selecting the calendar event grouping. This allows you to organize how
the calendar will group the data it displays. For example, you could set the grouping to display
events by Operator, Field, and Product or Vehicle, Field, and Operation. You are only limited by
the management items that are in the system and the properties associated with those
management items.
9. A print button is also provided in the Calendar View that will print the current calendar that is displayed, and
in the format that it is displayed.
10. Notes can also be added to a date on the calendar by selecting a day in the calendar, which should then
highlight at the top in blue, click the right mouse button, and select the Add Event... function. This will allow
you to add text notes that will only be available in the calendar, but provides yet another way for you to
document your operational activities.
11. Lastly, you can select to view more detailed information on a calendar event by double-clicking with the left
mouse button on a calendar event bar or by clicking your right mouse button with a bar selected and
selecting View/Edit Event... from the menu that appears. This will bring up the View Event dialog which will
display a tree of all the management items and datasets that make up the selected event. Most
management items can even be edited from this view, except for Farm and Field.
How to make a map
94
 Loading...