

Page 1

User’s Guide
11970 SERIES
HARMONIC MIXERS
(K, A, Q, U, V, and W Models)
Manufacturing Part Number: 11970-90031
Supersedes 11970-90030
Printed in USA
October 2003
© Copyright 1992, 1999, 2001
−2003 Agilent Technologies, Inc.
Page 2

Notice
The information contained in this document is subje ct to change without notice.
Agilent Technologies makes no warranty of any kind with regard to this material,
including but not limited to, the implied warranties of merchantability and fitness for a
particular purpose. Agilent Technologies shall not be liable for errors contained herein or
for incidental or consequential damages in connec tion with the furnishing , perfor mance, or
use of this material.
Certification
Agilent T echnologi es certifies that this product met its published specif ications at the ti me
of shipment from the factory. Agilent Technologies further certifies that its calibration
measurements are traceable to the United States National Institute of Standards and
Technology, to the extent allowed by the Institute’s calibration facility, and to the
calibration facilities of other International Standards Organization members.
Warranty
This Agilent T echnologies instrument pr oduct is warranted agains t defects in material and
workmanship for a period of one year from date of shipm ent. During the warranty period,
Agilent Technologies will, at its option, either repair or replace products which prove to be
defective.
For warranty service or repair, this product must be returned to a service facility
designated by Agilent Technologies. Buyer shall prepay shipping charges to Agilent
Technologies and Agilent Technologies shall pay shipping charges to return the product to
Buyer. However, Buyer shall pa y all shipping charges, duties, and taxes for products
returned to Agilent Technologies from another country.
Agilent Technologies warrants that its software and firmware designate d by Agilent
Technologies for use with an instrument will execute its programming instructions when
properly installed on that instrument. Agilent Technologies does not warrant that the
operation of the instrument, or software, or firmware will be uninterrupted or error-free.
2
Page 3

LIMITATION OF WARRANTY
The foregoing warranty shall not apply to def ects resulting from improper or inadequate
maintenance by Buyer, Buyer-supplied software or interfacing, unauthorized modification
or misuse, operation outside of the environmental specifications for the product, or
improper site preparation or maintenance.
NO OTHER WARRANTY IS EXPRESSED OR IMPLIED. AGILENT TECHNOLOGIES
SPECIFICALLY DISCLAIMS THE IMPLIED WARRANTIES OF MERCHANTABILITY
AND FITNESS FOR A PARTICULAR PURPOSE.
EXCLUSIVE REMEDIES
THE REMEDIES PROVIDED HEREIN ARE BUYER’S SOLE AN D EXCLUSIVE
REMEDIES. AGILENT TECHNOLOGIES SHALL NOT BE LIABLE FOR ANY DIRECT,
INDIRECT, SPECIAL, INCIDENTAL, OR CONSEQUENTIAL DAMAGES, WHETHER
BASED ON CONTRACT, TORT, OR ANY OTHER LEGAL THEORY.
Assistance
Product maintenance agreements and other customer assis tance agreements are availa ble
for Agilent Technologies products.
For any assistance, contact your nearest Agilent Technologies Sales and Service Office
listed on page 77.
This guide uses the following conventions:
Instrument Key This represents a key physically l ocated on the ins trument, or a key with a
label that is determined by the instrument firmware.
Screen Text This indicates text displayed on the spectrum analyzer screen.
3
Page 4

4
Page 5

Contents
1. General Information
Introduction. . . . . . . . . . . . . . . . . . . . . . . . . . . . . . . . . . . . . . . . . . . . . . . . . . . . . . . . . . . . . . . . . . . . . . . . . . . 8
Mixers Covered by Manual. . . . . . . . . . . . . . . . . . . . . . . . . . . . . . . . . . . . . . . . . . . . . . . . . . . . . . . . . . . . . 8
11970 Series Harmonic Mixers. . . . . . . . . . . . . . . . . . . . . . . . . . . . . . . . . . . . . . . . . . . . . . . . . . . . . . . . . . 9
Options . . . . . . . . . . . . . . . . . . . . . . . . . . . . . . . . . . . . . . . . . . . . . . . . . . . . . . . . . . . . . . . . . . . . . . . . . . . . 9
Spectrum Analyzer Retrofit Requirements. . . . . . . . . . . . . . . . . . . . . . . . . . . . . . . . . . . . . . . . . . . . . . . . . 9
Specifications . . . . . . . . . . . . . . . . . . . . . . . . . . . . . . . . . . . . . . . . . . . . . . . . . . . . . . . . . . . . . . . . . . . . . . . . 11
Equipment Supplied . . . . . . . . . . . . . . . . . . . . . . . . . . . . . . . . . . . . . . . . . . . . . . . . . . . . . . . . . . . . . . . . . 11
Environmental Limitations . . . . . . . . . . . . . . . . . . . . . . . . . . . . . . . . . . . . . . . . . . . . . . . . . . . . . . . . . . . . 11
2. Operation
Introduction. . . . . . . . . . . . . . . . . . . . . . . . . . . . . . . . . . . . . . . . . . . . . . . . . . . . . . . . . . . . . . . . . . . . . . . . . . 18
Operating Precautions. . . . . . . . . . . . . . . . . . . . . . . . . . . . . . . . . . . . . . . . . . . . . . . . . . . . . . . . . . . . . . . . 18
Getting Started . . . . . . . . . . . . . . . . . . . . . . . . . . . . . . . . . . . . . . . . . . . . . . . . . . . . . . . . . . . . . . . . . . . . . . . 19
Mixer Connections . . . . . . . . . . . . . . . . . . . . . . . . . . . . . . . . . . . . . . . . . . . . . . . . . . . . . . . . . . . . . . . . . . 19
Using a Conversion-Loss Data Disk with the ESA or PSA Series Analyzers . . . . . . . . . . . . . . . . . . . . . . . 21
Loading Data. . . . . . . . . . . . . . . . . . . . . . . . . . . . . . . . . . . . . . . . . . . . . . . . . . . . . . . . . . . . . . . . . . . . . . . 21
Viewing Data . . . . . . . . . . . . . . . . . . . . . . . . . . . . . . . . . . . . . . . . . . . . . . . . . . . . . . . . . . . . . . . . . . . . . . . 21
Using the Mixers with the E4407B Spectrum Analyzer (Option AYZ). . . . . . . . . . . . . . . . . . . . . . . . . . . . 22
Set up the equipment. . . . . . . . . . . . . . . . . . . . . . . . . . . . . . . . . . . . . . . . . . . . . . . . . . . . . . . . . . . . . . . . . 22
Using the Mixers with the E4440A, E4446A, or E4448A
PSA Series Spectrum Analyzer (Option AYZ). . . . . . . . . . . . . . . . . . . . . . . . . . . . . . . . . . . . . . . . . . . . . . . 26
Set up the equipment. . . . . . . . . . . . . . . . . . . . . . . . . . . . . . . . . . . . . . . . . . . . . . . . . . . . . . . . . . . . . . . . . 26
Using the Mixers with the 856X Series Spectrum Analyzers. . . . . . . . . . . . . . . . . . . . . . . . . . . . . . . . . . . . 30
Set up the equipment . . . . . . . . . . . . . . . . . . . . . . . . . . . . . . . . . . . . . . . . . . . . . . . . . . . . . . . . . . . . . . . . 30
Select the Frequency Band . . . . . . . . . . . . . . . . . . . . . . . . . . . . . . . . . . . . . . . . . . . . . . . . . . . . . . . . . . . . 31
Save the average conversion-loss value . . . . . . . . . . . . . . . . . . . . . . . . . . . . . . . . . . . . . . . . . . . . . . . . . . 32
Signal Identification . . . . . . . . . . . . . . . . . . . . . . . . . . . . . . . . . . . . . . . . . . . . . . . . . . . . . . . . . . . . . . . . . 33
Identify signals with the frequency-shift method . . . . . . . . . . . . . . . . . . . . . . . . . . . . . . . . . . . . . . . . . . . 34
Identify signals in wide frequency spans . . . . . . . . . . . . . . . . . . . . . . . . . . . . . . . . . . . . . . . . . . . . . . . . . 36
Using the Mixers with MMS Analyzers. . . . . . . . . . . . . . . . . . . . . . . . . . . . . . . . . . . . . . . . . . . . . . . . . . . . 38
Preliminary Operation. . . . . . . . . . . . . . . . . . . . . . . . . . . . . . . . . . . . . . . . . . . . . . . . . . . . . . . . . . . . . . . . 38
Operation. . . . . . . . . . . . . . . . . . . . . . . . . . . . . . . . . . . . . . . . . . . . . . . . . . . . . . . . . . . . . . . . . . . . . . . . . . 39
Conversion Loss Versus Frequency Correction . . . . . . . . . . . . . . . . . . . . . . . . . . . . . . . . . . . . . . . . . . . . 43
Using the Mixers with the 8566B Spectrum Analyzer. . . . . . . . . . . . . . . . . . . . . . . . . . . . . . . . . . . . . . . . . 45
Set up the equipment. . . . . . . . . . . . . . . . . . . . . . . . . . . . . . . . . . . . . . . . . . . . . . . . . . . . . . . . . . . . . . . . . 45
Amplitude Calibration. . . . . . . . . . . . . . . . . . . . . . . . . . . . . . . . . . . . . . . . . . . . . . . . . . . . . . . . . . . . . . . . 46
Signal Identification . . . . . . . . . . . . . . . . . . . . . . . . . . . . . . . . . . . . . . . . . . . . . . . . . . . . . . . . . . . . . . . . . 47
Table of Contents
3. Performance Tests
Introduction. . . . . . . . . . . . . . . . . . . . . . . . . . . . . . . . . . . . . . . . . . . . . . . . . . . . . . . . . . . . . . . . . . . . . . . . . . 50
Test Record . . . . . . . . . . . . . . . . . . . . . . . . . . . . . . . . . . . . . . . . . . . . . . . . . . . . . . . . . . . . . . . . . . . . . . . . 50
Performance Test Procedures . . . . . . . . . . . . . . . . . . . . . . . . . . . . . . . . . . . . . . . . . . . . . . . . . . . . . . . . . . . . 51
Description . . . . . . . . . . . . . . . . . . . . . . . . . . . . . . . . . . . . . . . . . . . . . . . . . . . . . . . . . . . . . . . . . . . . . . . . 51
Conversion Loss and Frequency Response. . . . . . . . . . . . . . . . . . . . . . . . . . . . . . . . . . . . . . . . . . . . . . . . . . 57
Specifications . . . . . . . . . . . . . . . . . . . . . . . . . . . . . . . . . . . . . . . . . . . . . . . . . . . . . . . . . . . . . . . . . . . . . . 57
Description . . . . . . . . . . . . . . . . . . . . . . . . . . . . . . . . . . . . . . . . . . . . . . . . . . . . . . . . . . . . . . . . . . . . . . . . 58
AVERAGE NOISE LEVEL TEST. . . . . . . . . . . . . . . . . . . . . . . . . . . . . . . . . . . . . . . . . . . . . . . . . . . . . . . . 68
5
Page 6

Contents
Table of Contents
Specification . . . . . . . . . . . . . . . . . . . . . . . . . . . . . . . . . . . . . . . . . . . . . . . . . . . . . . . . . . . . . . . . . . . . . . . 68
Description . . . . . . . . . . . . . . . . . . . . . . . . . . . . . . . . . . . . . . . . . . . . . . . . . . . . . . . . . . . . . . . . . . . . . . . . 68
4. Service
Maintenance . . . . . . . . . . . . . . . . . . . . . . . . . . . . . . . . . . . . . . . . . . . . . . . . . . . . . . . . . . . . . . . . . . . . . . . . . 74
Repairs . . . . . . . . . . . . . . . . . . . . . . . . . . . . . . . . . . . . . . . . . . . . . . . . . . . . . . . . . . . . . . . . . . . . . . . . . . . 74
Replaceable Parts . . . . . . . . . . . . . . . . . . . . . . . . . . . . . . . . . . . . . . . . . . . . . . . . . . . . . . . . . . . . . . . . . . . 74
Circuit Description . . . . . . . . . . . . . . . . . . . . . . . . . . . . . . . . . . . . . . . . . . . . . . . . . . . . . . . . . . . . . . . . . . 74
6
Page 7

General Information
1 General Information
7
Page 8

General Information
Introduction
Introduction
The Agilent Models 11970K, 11970A, 11970Q, 11970U, 11970V and 11970W are
general-purpose harmonic mixers with very flat frequency re sponse characteristics and
low conversion loss. Collectively, they cover the frequency range of 18 to 110 GHz. The
11970K covers the 18 - 26. 5 GHz range; the 1197 0A, t he 26.5 - 40 GHz range; the 11970Q,
the 33 - 50 GHz range; the 11970U, the 40 - 60 GHz range; the 11970V, the 50 - 75 GHz
range; and the 11970W, the 75 - 110 GHz range.
The overall local oscillator (LO) frequency range of the 11970 Series Mixers is 3.0 to 6.1
GHz. Each of the mixers employs a different LO harmonic, and as a result has a different
optimum LO range within the overall LO range of the series.
The 11970 Series Mixers use the Agilent 11975A Amplifier to raise the LO power to their
required LO input level of 14 to 18 dBm. By taking advantage of the power leveling
capability of the 11975A, the mixers are able to achieve maximum measurement accuracy
(at optimum LO input level of 14.5 to 16 dBm).
A label on the end of each mixer shows a Conversion Loss Calibration table printed
General Information
especially for that part icular mixer. An 8-1/ 2 by 11-inch calibration table shi ppe d with th e
mixer provides a larger, easi er to read, version of th e same table shown on the label, plus a
graph which shows the conversion loss and reference level offset across the mixer’s
frequency range. This calibration table must be employed for absolute amplitude
measurements . Also supplied with each mixer are five screws (four required) for attaching
the mixer RF input flange to the waveguide.
Mixers Covered by Manual
Serial Numbers
Attached to your mixer, is a label which s hows both the mixer model number and its ser ial
number (two parts). The first four digits and the letter of the serial number are the serial
number prefix; the last five digits are the suffix. The contents of this manual apply to
mixers with the serial number prefixe s lis ted under “Serial Number Prefixes” on the title
page of this manual.
8 Chapter 1
Page 9
11970 Series Harmonic Mixers
Figure 1-1.
General Information
Introduction
General Information
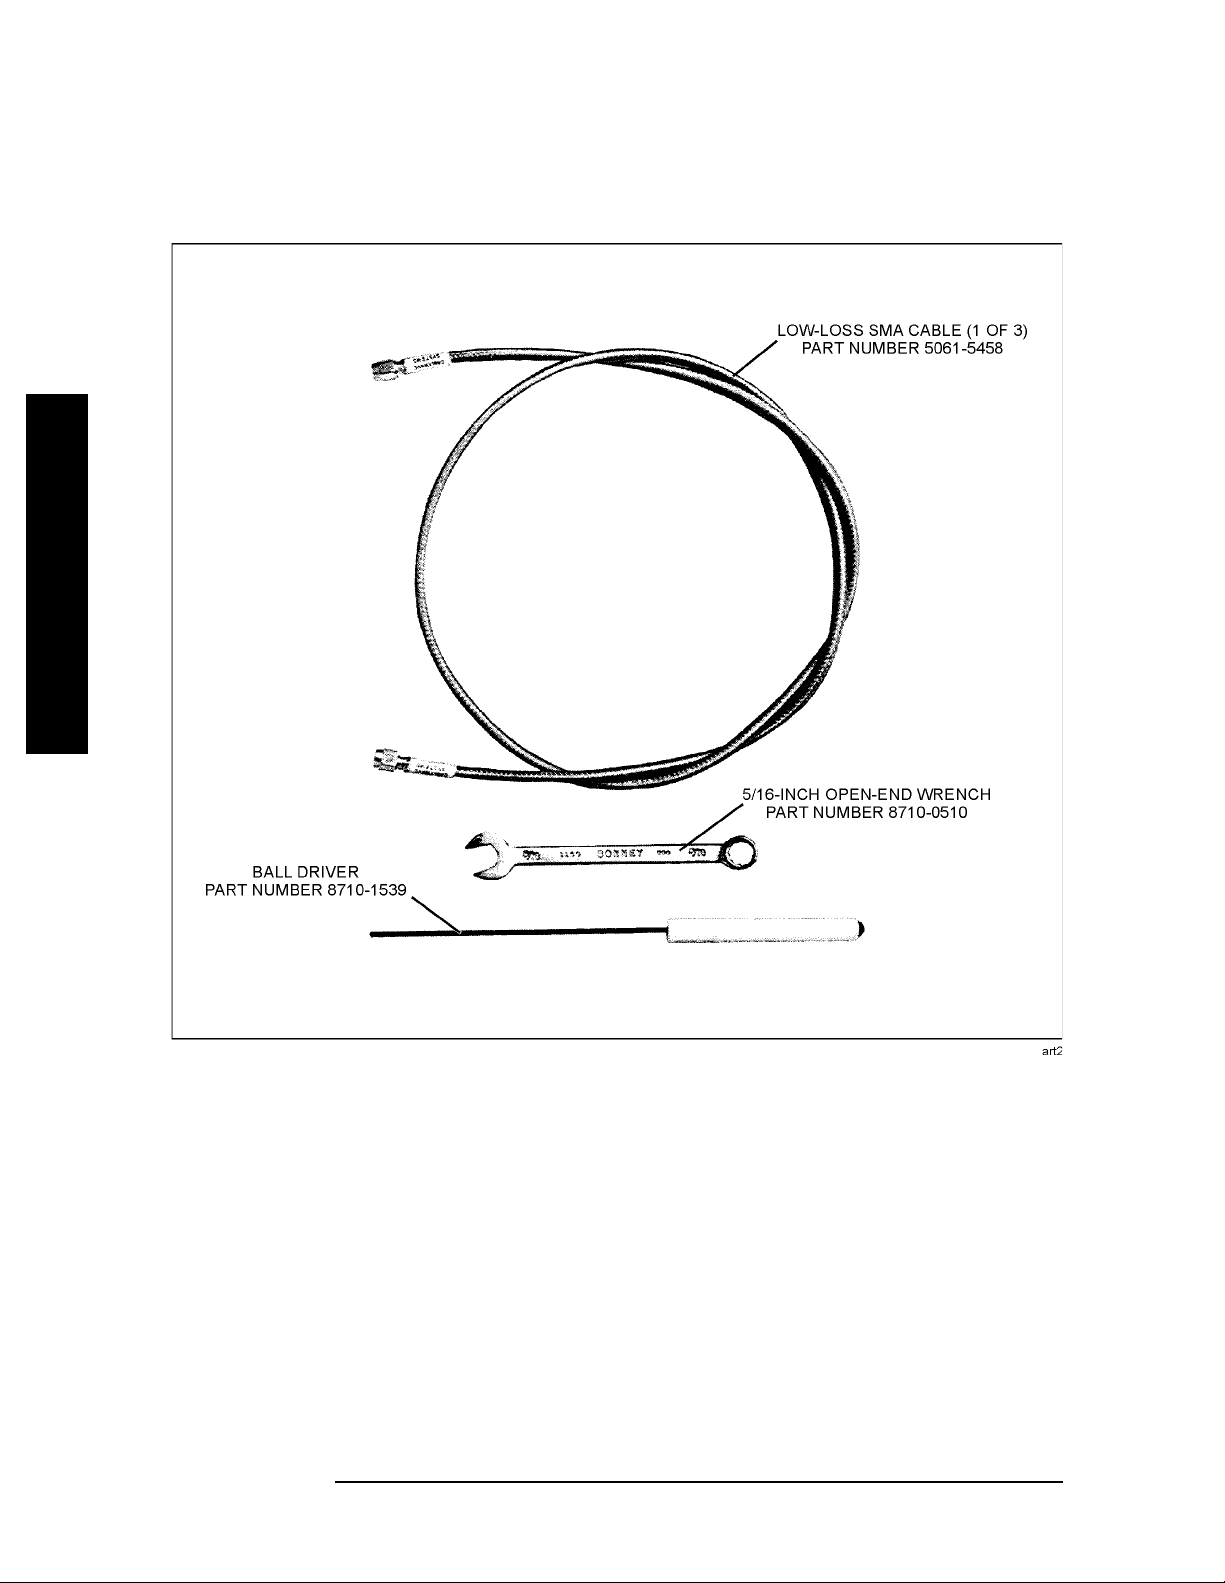
Options
Option 009, shown in Figure 1-2. is a Mixer Connection Kit. It includes three low-loss SMA
cables (Part Number 5061-5458), one hex-head balldriver (Part Number 8710-1539) for
tightening the wave guide connector screws, and one 5/16-inch open-end wrench (Part
Number 8710-0510) for use on the SMA connectors.
Spectrum Analyzer Retrofit Requirements
• The 11970 Series Mixers are fully compatible with all 8566B Spectrum Analyzers.
• 856x Series portable spectrum analyzers with options 002 (tracking generator ) and 327
(no IF IN on front panel) do not have external mixing capability.
• 856x Series Portable Spectrum Analyzers require option 008, or FW date code
for signal id e n ti fication functional i ty.
• Agilent E4407B spectrum analyzers require option AYZ (LO Out and IF IN
connections).
• MMS analyzers using 11970 series mixers must have a front end model 70907A,
70907B, 7090 9A, or 70910A, a s well as a 70900A/B with f irmw ar e new eno ugh for tho se
modules:
Model FW Date Code:
(or newer)
≤ 920528,
70907A
70907B
70909A
70910A
-
860203
-
900314
-
910802
-
910802
Chapter 1 9
Page 10
General Information
Introduction
• PSA Series E4440A, E4446A, and E4448A spectrum analyzers require Option AYZ (LO
OUT and IF IN connectors). The E4443A and E4445A do not support external mixing.
Figure 1-2. Mixer Connection Kit, Option 009
General Information
10 Chapter 1
Page 11

General Information
Specifications
Specifications
Specifications for the 11970 Serie s Mixers are listed in Table 1-1. These are the performance
standards against which the mixers are tested (p erformance tests are provided in
3 ,“Performance Tests,”
). Typical or nominal operating values are listed in Table 1-2.
NOTE Supplemental characteristics are included only as additional information;
they are not specifications.
Chapter
Equipment Supplied
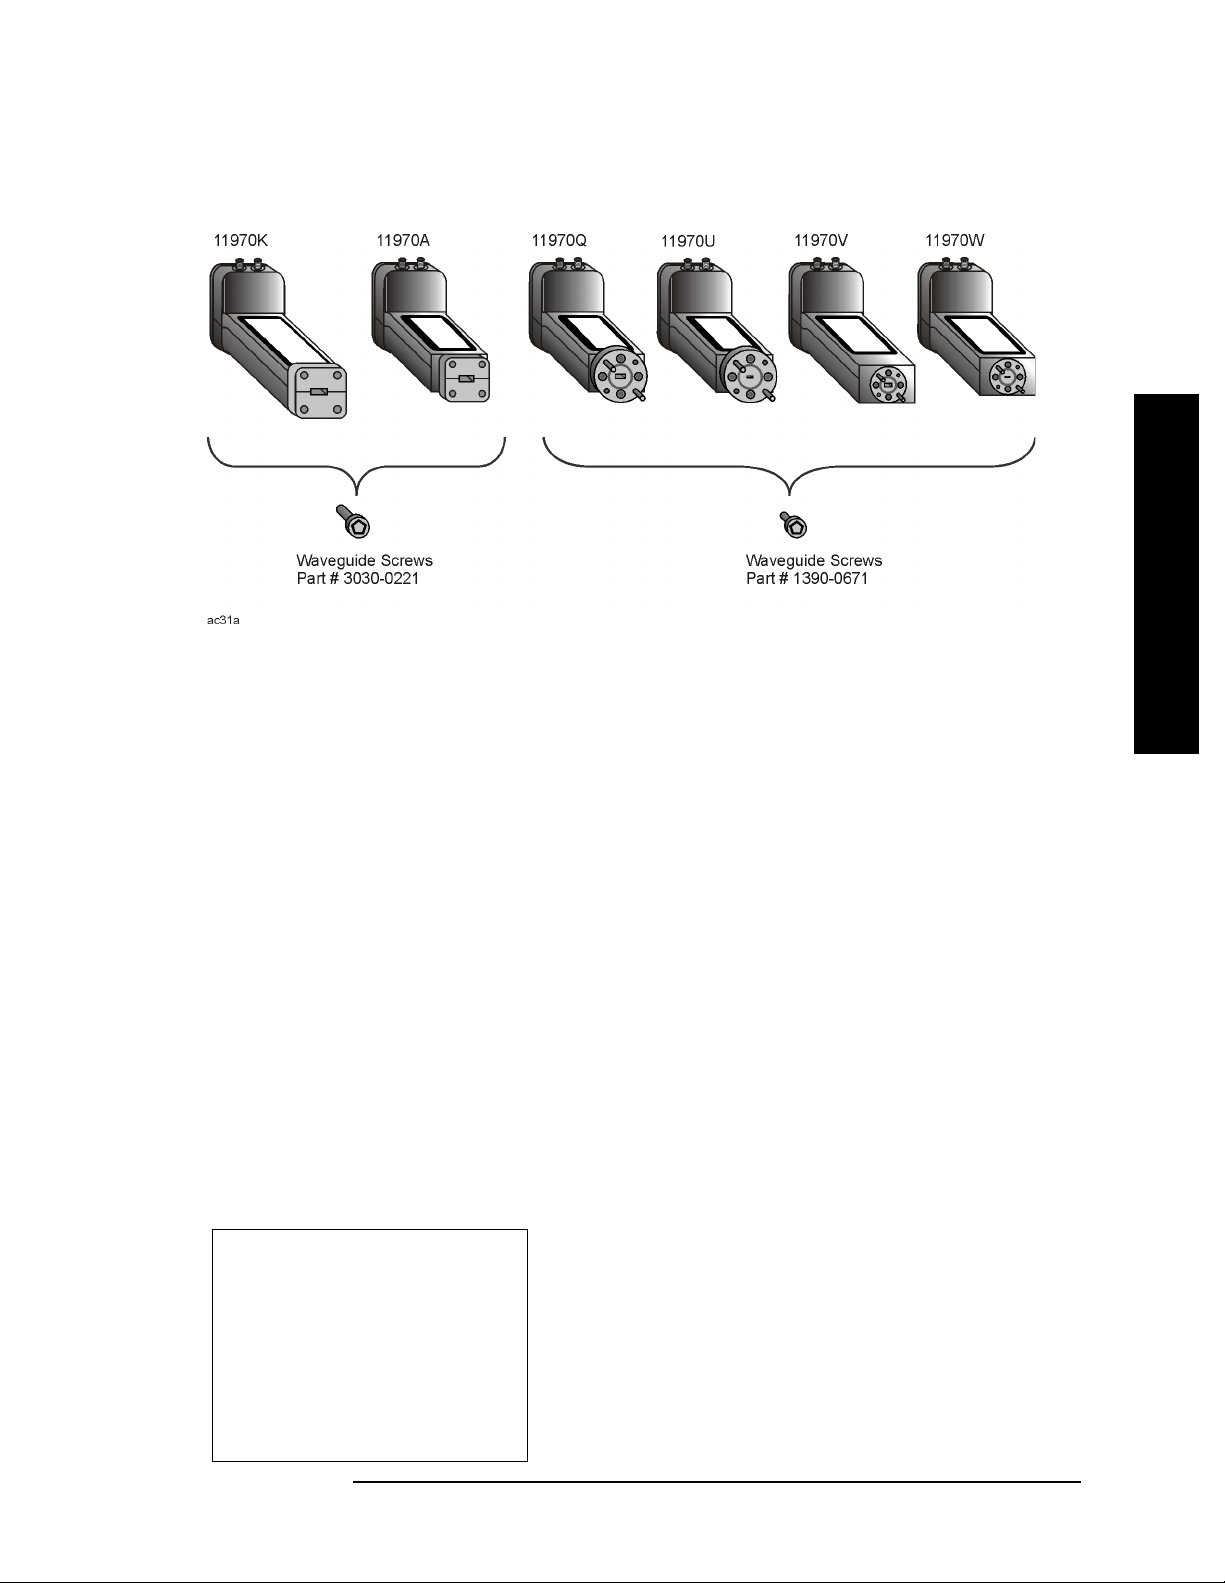
Waveguide Connector Screws
Five hex-head screws are supplied with each mixer. Four are required to make the mixer-to-waveguide
connection, one is a spare. Use ONLY the screws supplied t o attach the mixe r to the waveguid e. Because
of slight diffe rences in t he way the mixer s couple with the waveguide, the square-fl ange mixers (1 1970K
and 11970A) and the round-flange mixer (1970Q, 11970U, 11970V and 11970W) require different
screws.
If your mixer has a square waveguide flange, use four hex-head screws with Part Number
3030-0221. If it has a round waveguid e flange, use four hex-head captive screws with Part
Number 1390-0671. The special balldrive r hex scr ewdriver available in the Option 009
Mixer Connector Kit simplifies installation of the waveguide connector screws.
NOTE See Chapter 4 ,“Service,” for a list of replacement parts.
Environmental Limitations
The 11970 Series Mixers meet or exceed the environmental requirements of MIL-T-28800C, Type III,
Class 3, Style C. Specific environmental qualifications for the mixers are as follows:
Temperature, Non-operating: -40
o
C to 75oC
General Information
Temperature, Operating: 0
Relative Humidity: 95 ±5% (up to 30
o
C to 55oC
o
C)
Altitude, Non-operating: Less than 12,195 meters (40,000 ft.)
Altitude, Operating: Less than 3,048 meters (10,000 ft.)
Maximum Vibration Levels: 2 G’s at 5 to 2000 Hz
Maximum Shock: 30 G’s
Chapter 1 11
Page 12

General Information
Specifications
Table 1-1 11970 Series Specifications
NOTE
Unless otherwise stated, all specifications apply for an IF of 321.4 MHz and for RF input amplitudes of
less than -20 dBm.
GENERAL
LO Amplitude Range: 14 to 18 dBm
Calibration Accuracy: Maximum CW RF Input Level:
11970K/A/Q/U:
± 2.0 dB with LO amplitude r ange of 14.5 to 16 dBm
11970V/W:
± 2.2 dB with LO amplitude r ange of 14.5 to 16 dBm
11970K/A/Q/U:
± 3.0 dB with LO amplitude r ange of 16 to 18 dBm
General Information
11970V/W: ± 3.2 dB with LO amplitude range of 16 to
18 dBm
1
Bias Requirements: None
20 dBm (l00mW)
Maximum Peak Pulse Power:
24 dBm with < 1µsec pulse
Environmental:
Meets MIL-T-28800C, Type III, Class 3, Style C
IF/LO Connectors:
SMA female
(avg. power: + 20 dBm)
12 Chapter 1
Page 13

General Information
Specifications
Table 1-1 11970 Series Specifications
NOTE
Unless otherwise stated, all specifications apply for an IF of 321.4 MHz and for RF input amplitudes of
less than -20 dBm.
MODEL 11970K MODEL 11970A
RF Frequency Range:
18 - 26.5 GHz
LO Harmonic Number: 6 LO Harmonic Number: 8
LO Input Frequency Range:
2.95 - 4.36 GHz
Maximum Conversion Loss: 24 dB
8566B Noise Level at 1 kHz Bandwidth, and
14.5 to 16 dBm
LO Input Power:
Frequency Response at 14.5 to 16 dBm
LO Input Power: ±1.9 dB
Frequency Response at 14 to 18 dBm
LO Input Power: ±2.8 dB
RF Frequency Range:
33 - 50 GHz
LO Harmonic Number: 10
-105 dBm
MODEL 11970Q
RF Frequency Range:
26.5 - 40 GHz
LO Input Frequency Range:
3.27 - 4.96 GHz
Maximum Conversion Loss: 26 dB
8566B Noise Level at 1 kHz Bandwidth, and
14.5 to 16 dBm
LO Input Power: -102 dBm
Frequency Response at 14.5 to 16 dBm
LO Input Power: ±1.9 dB
Frequency Response at 14 to 18 dBm
LO Input Power: ±2.8 dB
MODEL 11970U
RF Frequency Range:
40 - 60 GHz
LO Harmonic Number: 10
General Information
LO Input Frequency Range:
3.27 - 4.97 GHz
Maximum Conversion Loss: 28 dB Maximum Conversion Loss: 28 dB
8566B Noise Level at 1 kHz Bandwidth, and
14.5 to 16 dBm
LO Input Power: -101 dBm
Frequency Response at 14.5 to 16 dBm
LO Input Power: ±1.9 dB
Frequency Response at 14 to 18 dBm
LO Input Power: ±2.8 dB
LO Input Frequency Range:
3.97 - 5.97 GHz
8566B Noise Level at 1 kHz Bandwidth, and
14.5 to 16 dBm
LO Input Power: -101 dBm
Frequency Response at 14.5 to 16 dBm
LO Input Power: ±1.9 dB
Frequency Response at 14 to 18 dBm
LO Input Power: ±2.8 dB
Chapter 1 13
Page 14

General Information
Specifications
Table 1-1 11970 Series Specifications
NOTE
Unless otherwise stated, all specifications apply for an IF of 321.4 MHz and for RF input amplitudes of
less than -20 dBm.
MODEL 11970V
RF Frequency Range:
50 - 75 GHz
LO Harmonic Number: 14 LO Harmonic Number: 18
LO Input Frequency Range:
3.55 - 5.33 GHz
Maximum Conversion Loss: 40 dB
8566B Noise Level at 1 kHz Bandwidth, and
14.5 to 16 dBm
LO Input Power: -92 dBm
Frequency Response at 14.5 to 16 dBm
General Information
LO Input Power: ±2.1 dB
Frequency Response at 14 to 18 dBm
LO Input Power: ±2.8 dB
RF Frequency Range:
75 - 110 GHz
LO Input Frequency Range:
4.15 - 6.09 GHz
Maximum Conversion Loss: 46 dB
8566B Noise Level at 1 kHz Bandwidth, and LO Input
Power: - 85 dBm
Frequency Response at 14.5 to 16 dBm
LO Input Power: ±3.0 dB
Frequency Response at 14 to 18 dBm
LO Input Power: ±4.0 dB
MODEL 11970W
2
1. The 11975A Amplifier, or a similar amplifier, can be used to provide sufficient LO power (14 to
18 dBm) to the mixers. Leveled power capability of 16 dBm, as is available with the 11975A, is necessary to achieve the maximum amplitude accuracy with the mixers. Assuming the 1 meter cables
supplied with the instrum ent are used , only the 85 66B LO ou tput requ ires ampl ificati on. Howe ver,
if longer or lower quality cables are used LO amplification may be necessary.
2. Typically ± 2.5 dB with LO supplied by 8566B Spectrum Analyzer, 11975A Amplifier set to
16 dBm, and P/N 5061-5458 SMA cables.
14 Chapter 1
Page 15
General Information
Specifications
Table 1-2 11970 Supplemental Characteristics
NOTE
Supplemental characteristics are included only as additional information; they are not specifications.
3 dB IF Bandwidth: DC to 1.3 GHz Odd Order Mixing Product Suppression:
11970K/A/Q/U: >20 dB
11970V/W: >15 dB
Spectrum Analyzer Absolute Amplitude
Accuracy (using calibration data with a 14.5 to
16 dBm LO):
11970K, 18 - 26.5 GHz: ±3.2 dB
11970A, 26.5 - 40 GHz: ±3.2 dB
11970Q, 33 - 50 GHz: ±3.2 dB
11970U, 40 - 60 GHz: ±3.2 dB
11970V, 50 - 75 GHz: ±3.4 dB
11970W: 75 - 110 GHz: ±3.4 dB
RF Input SWR:
11970K/A/Q/U: <2.2:1
11970V/W: <2.6:1
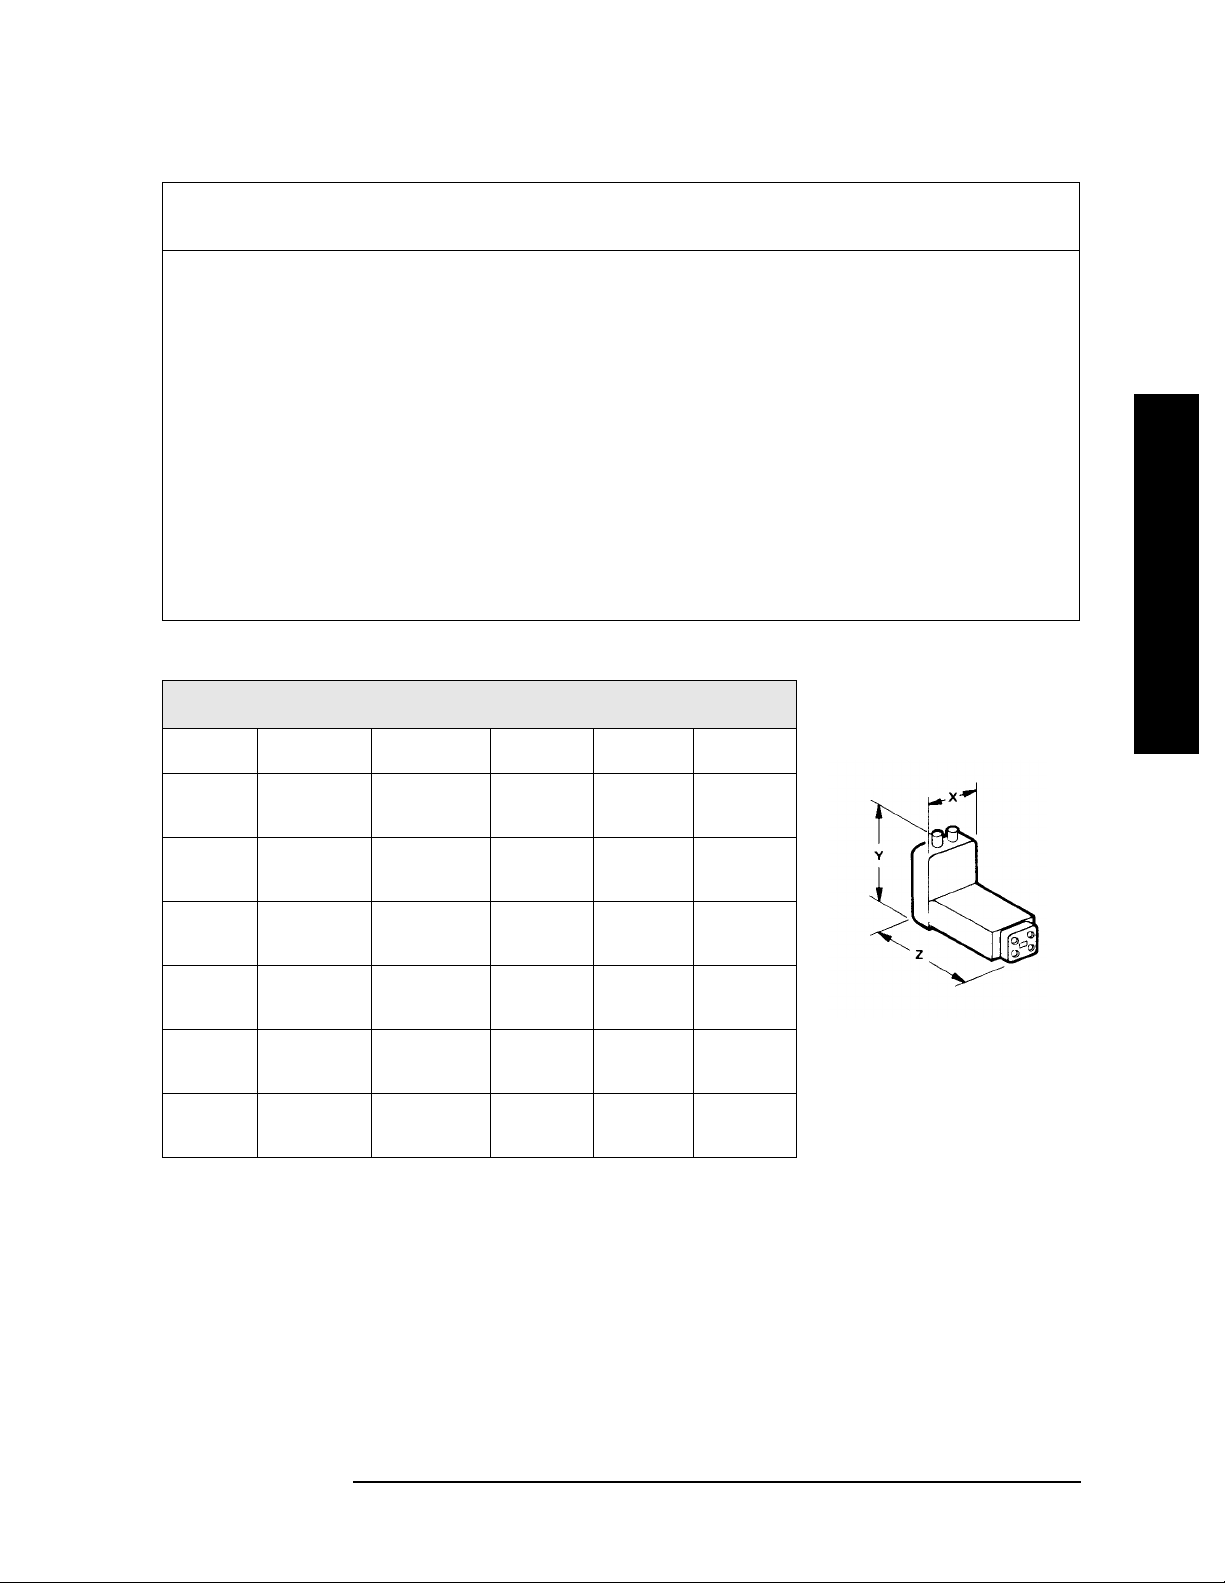
PHYSICAL CHARACTERISTICS
Model
11970K
Flange
UG-595/U
WR-42
11970A UG-599/U
WR-28
11970Q
UG-383/U
WR-22
1
Weight X Y
0.17 kg
0.36 lb
0.14 kg
0.32 lb
0.14 kg
0.32 lb
36 mm
1.4 in
36 mm
1.4 in
36 mm
1.4 in
Gain Compression Level (<1 dB):
11970K: -3 dBm
11970A: -5 dBm
11970Q: -7 dBm
11970U: -7 dBm
11970V: -3 dBm
11970W: -1 dBm
5061-5458 Cable Insertion Loss:
.8 dB at 2 GHz
1.1 dB at 6 GHz
Z
51 mm
2.0 in
51 mm
2.0 in
51 mm
2.0 in
90 mm
3.5 in
71 mm
2.8 in
76 mm
3.0 in
General Information
11970U
11970V UG-385/U
11970W
UG-383/U-M
WR-19
WR-15
UG-387/U-M
WR-10
0.14 kg
0.32 lb
0.14 kg
0.32 lb
0.14 kg
0.32 lb
36 mm
1.4 in
36 mm
1.4 in
36 mm
1.4 in
51 mm
2.0 in
51 mm
2.0 in
51 mm
2.0 in
1. Waveguide attachment screws enter blind holes in the flanges of the mixers.
Chapter 1 15
76 mm
3.0 in
76 mm
3.0 in
76 mm
3.0 in
Page 16

General Information
Specifications
General Information
16 Chapter 1
Page 17

2 Operation
Operation
17
Page 18

Operation
Introduction
Introduction
This section provides information on how to make effective use of the 11970 mixers.
Operating Precautions
Refer to the sections below for specific pa r ameters to follow prior to m i xer operation.
WARNING Do not exceed the maximum ratings listed below or permanent
damage to the mixer will result.
RF Input Power
Use the following parameters:
CW: No greater than 20 dBm
Pulse: No greater than 24 dBm at < 1 mSec
Average: No great e r th a n 20 dBm
LO Input Power
Make sure the LO input power is no greater than 20 dBm.
Electrostatic Discharge
When installing the mixer, you must always connect the SMA cables to the spectrum
analyzer and LO amplifier BEFORE connecting them to the mixer. This will minimize the
danger of an electrostatic discharge damaging the mixer diodes.
Operation
11975A ALC Switch
BEFORE using the 11975A Amplifier to increase the LO input power, set the amplifier
ALC switch to the ON position. When this switch is in the OFF position the LO power can
be greater than 20 dBm. This level of LO power can destroy the mixer diodes. The ALC
switch is on the amplifier rear panel.
Waveguide Protective Foam
Do not remove, displace, or damage the white, nonconductive foam installed in the ope n
end of the waveguide. Since the mixer is amplitude calibrated with this foam in place,
tampering with it affects the calibration.
18 Chapter 2
Page 19

Operation
Getting Started
Getting Started
The 11970 series of millimeter wave mixers ha ve no bias or back-s hort adjustment s. 11970
Mixers require an LO power of 14 to 18 dBm at the LO input. If the spectrum analyzer
used with the 11970 does not have sufficient LO power, an 11975A Amplifier or an
equivalent is required to increase this power.
CAUTION Before connecting the 11975A Amplifi er, set its rear panel ALC switch to ON.
Failure to do this can damage the mixer.
Mixer Connections
With the three SMA cables (Part Number 5061-5458, each) provided in the Option 009
Mixer Connection Kit, connect the 11970 Mixer, the spectrum analyzer, and the 11975A
Amplifier. An example connection for an 8566B Spectrum Analyzer is shown in Figure 2-1.
NOTE The example below shows an 8566B analyzer, other spectrum analyzers do
not require the amplifier and third SMA cable.
Figure 2-1. 11970 Mixer Connections
Leave the waveguide flange cap on whenever the mixer is not connected to a device under
test. This protects the flange mating s urface from scrat ches , which can degrade th e mixer’s
performance. Use an appropriate waveguide attenuator if the output power of the unit
under test exceeds the RF Input Power indicated in the specifications.
Operation
Chapter 2 19
Page 20

Operation
Getting Started
If you are using an 11970Q, 11970U, 11970V or 11970W Mixer, and the shoulder of its waveguide
flange is not properl y a ligned with th e flan ge of t he de vi ce unde r t est, amplit ude measure ment err ors ca n
result. To ensure proper alignment, tighten each of the four flange screws in turn by small amounts,
moving clockwise around the flange.
NOTE 11970K and 11970A Mixers require flange screws that are different from
those used with the 11970Q, 11970U, 11970V and 11970W; 11970K and
11970A use Part Number 3030-0221 (#4-40 hex head screw). 11970Q,
11970U, 11970V and 11970W use Part Number 1390-0671 (#4-40 hex head
captive sc re w ) .
Operation
20 Chapter 2
Page 21

Operation
Using a Conversion-Loss Data Disk with the ESA or PSA Series Analyzers
Using a Conversion-Loss Data Disk with the ESA or PSA
Series Analyzers
The conversion-loss data for your mixer can be quickly lo aded in the memory of an ESA or
PSA series analyzer from a floppy disk. The following process works with the floppy disk
provided by the factory with your new mixer, or with one that you have st ored the
correction data. This process eliminates the time consuming and sometimes error-prone
process of manually entering the data from a table.
Loading Data
1. Insert the conversion-loss data disk (fr om th e factory or your own) into the floppy drive
of the analyzer.
2. Press
3. Press
4. Press
5. Use the down arrow to select the file. The factory supplied disk has a file with the OTH
extension which places the data in the corrections set “other” location.
6. Press
analyzer.
File, then Load.
Type, More, then select Corrections.
Directory Select, highlight drive -A-, then press Directory Select again.
Load Now to load the conversion loss values into the correction table of the
Viewing Data
1. Press Amplitude, More, Corrections, Other (ON) and Edit to view the correction values.
2. Use the front-panel knob or up/down arrows to scroll through the lis t of correction
values.
Operation
Chapter 2 21
Page 22
Operation
Using the Mixers with the E4407B Spectrum Analyzer (Option AYZ)
Using the Mixers with the E4407B Spectrum Analyzer
(Option AYZ)
The Agilent Technologies E4407B spectrum analyzer contains an extensive menu of
functions that help with millimeter measure ments . The foll owing examples explain how to
connect external mixers to the spectrum analyzer, how to choose the ba nd of interest, how
to store and activate conversion-loss factors, and how to use the signal-identification
functions.
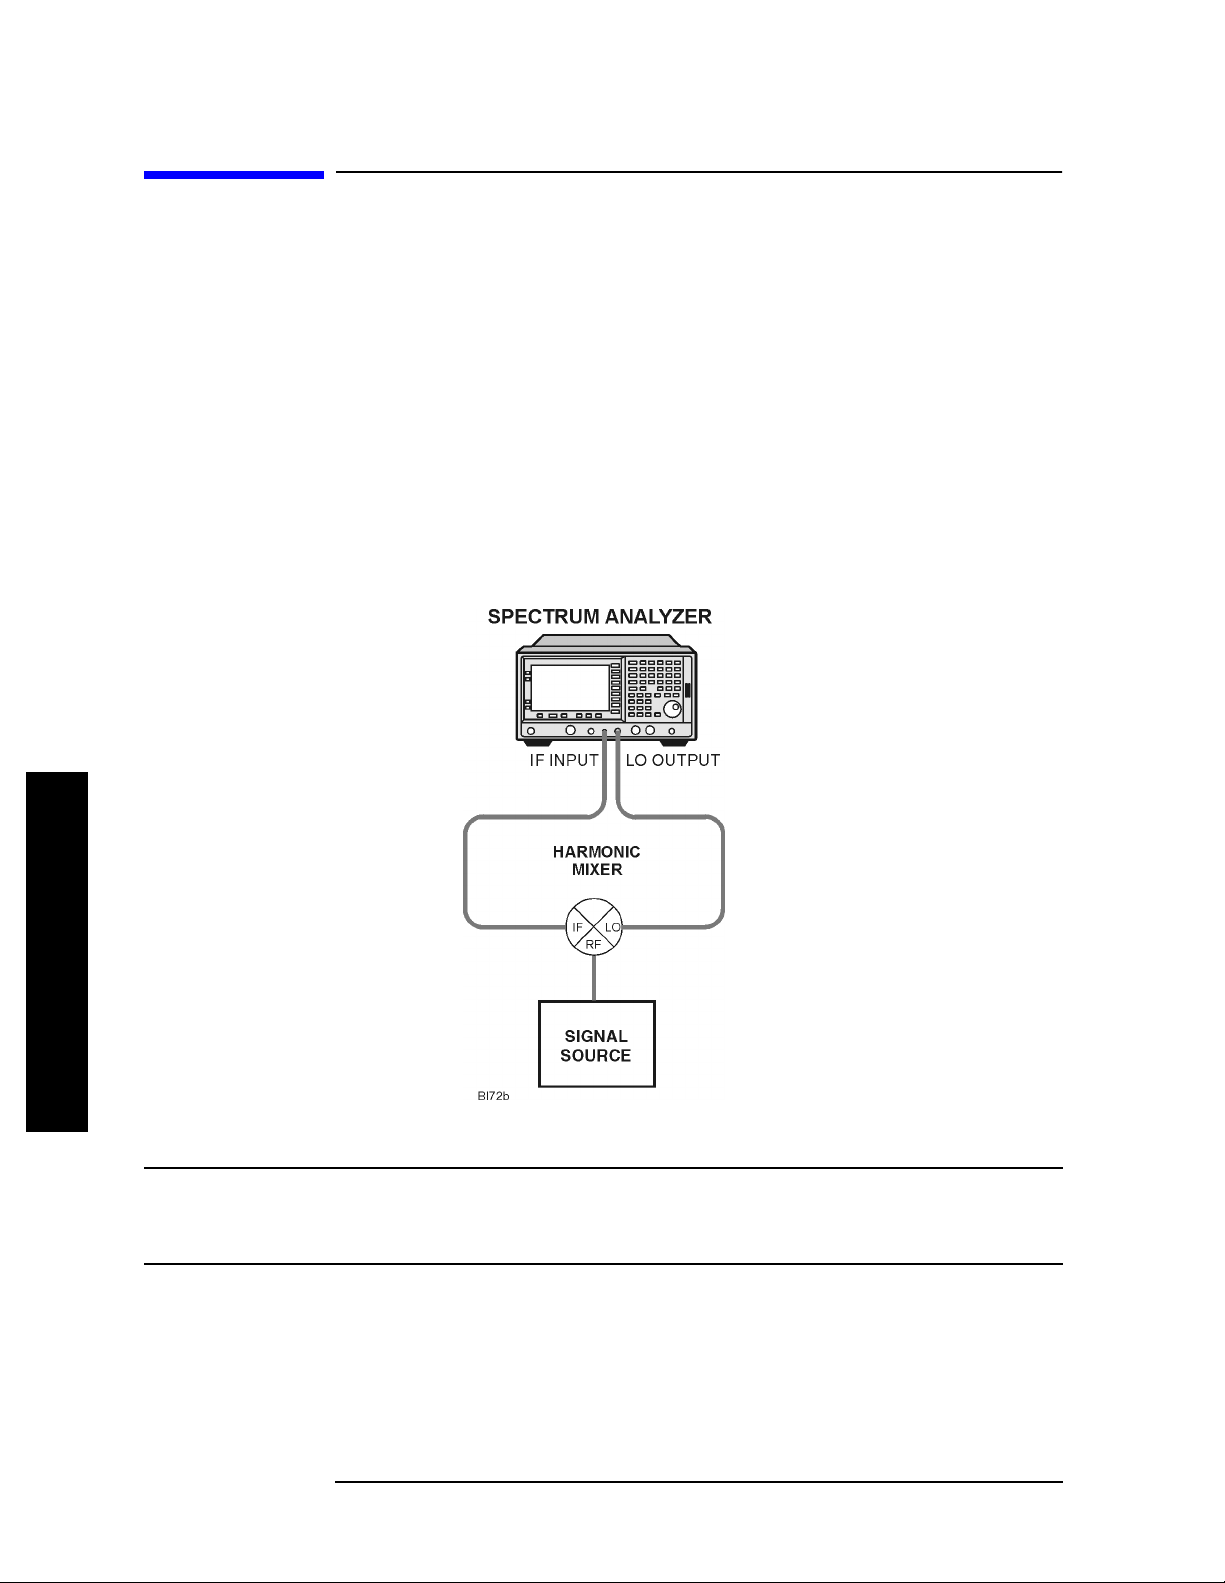
Set up the equipment
1. Connect the signal source and harmonic mixer to the analyzer, as shown in Figure 2-2.
Figure 2-2 Harmonic Mixer Setup
Operation
NOTE Agilent 5061-5458 SMA type cables should be used to connect the mixer IF
and LO ports to th e an a l y z e r. Do not over-tighten the ca b l es. The ma x i m u m
torque should not exceed 112 N-cm (10 in-lb.)
22 Chapter 2
Page 23

Using the Mixers with the E4407B Spectrum Analyzer (Option AYZ)
2. On the analyzer, press Preset, Factory Preset, if present.
Operation
3. Select external mixing by pressing
4. The analyzer frequency band will be set to
Ext Mix Band , then press the desired band frequency range/letter key. For this
press
Input/Output, Input Mixer, Input Mixer (Ext).
26.5 - 40 GHz (A). To choose a different band,
example, we will use band A, which ranges from 36.5 GHz to 40 GHz.
Amplitude Calibration
The conversion loss versus frequency data can be entered on your analyzer from one of
three sources.
• From a Conversion Loss Data Disk, supplied with your mixer . See “Using a
Conversion-Loss Data Disk with the ESA or PSA Series Analyzers” on page 21 .
• Data from the calibration sheet supplied with your mixer.
• From conversion-loss data located on the mixer bo dy label.
Manually Enter i ng Co n v er sio n -L os s D ata
1.The analyzer frequency band will be set to
Ext Mix Band and then press the desired band frequency range/letter key. For this
press
26.5 – 40 GHz (A). To choose a different band,
example, we will use band A, which ranges from 26.5 GHz to 40 GHz.
NOTE To correct for the conversion-loss of the harm onic mixer in use, the analyzer
amplitude correction feature is used .
2. Press
external mixing. The recommended set to use is
AMPLITUDE Y Scale, More , Corrections. Select a correction set for use with
Other although any available set could
be used.
3. Press
Edit to enter the appropriate conversion loss data for the mixer in use. These
values are listed on the mixer, or a calibration sheet that is supplied with the mixer.
NOTE More correction points entered across the band in use will improve frequency
response accuracy. Up to 200 points may be defined for each set.
4. Once the desired correction points are entered, press
correction set
Other. This will also turn corrections on resulting in a calibrated display.
Return, Correction (On) to activate
It is recommended that the correction set entered be saved on the internal memory or
the floppy dr ive for futur e reference. See th e ES A User’s and Programmer’s Reference
guide for information on saving correction values.
Operation
Chapter 2 23
Page 24
Operation
Using the Mixers with the E4407B Spectrum Analyzer (Option AYZ)
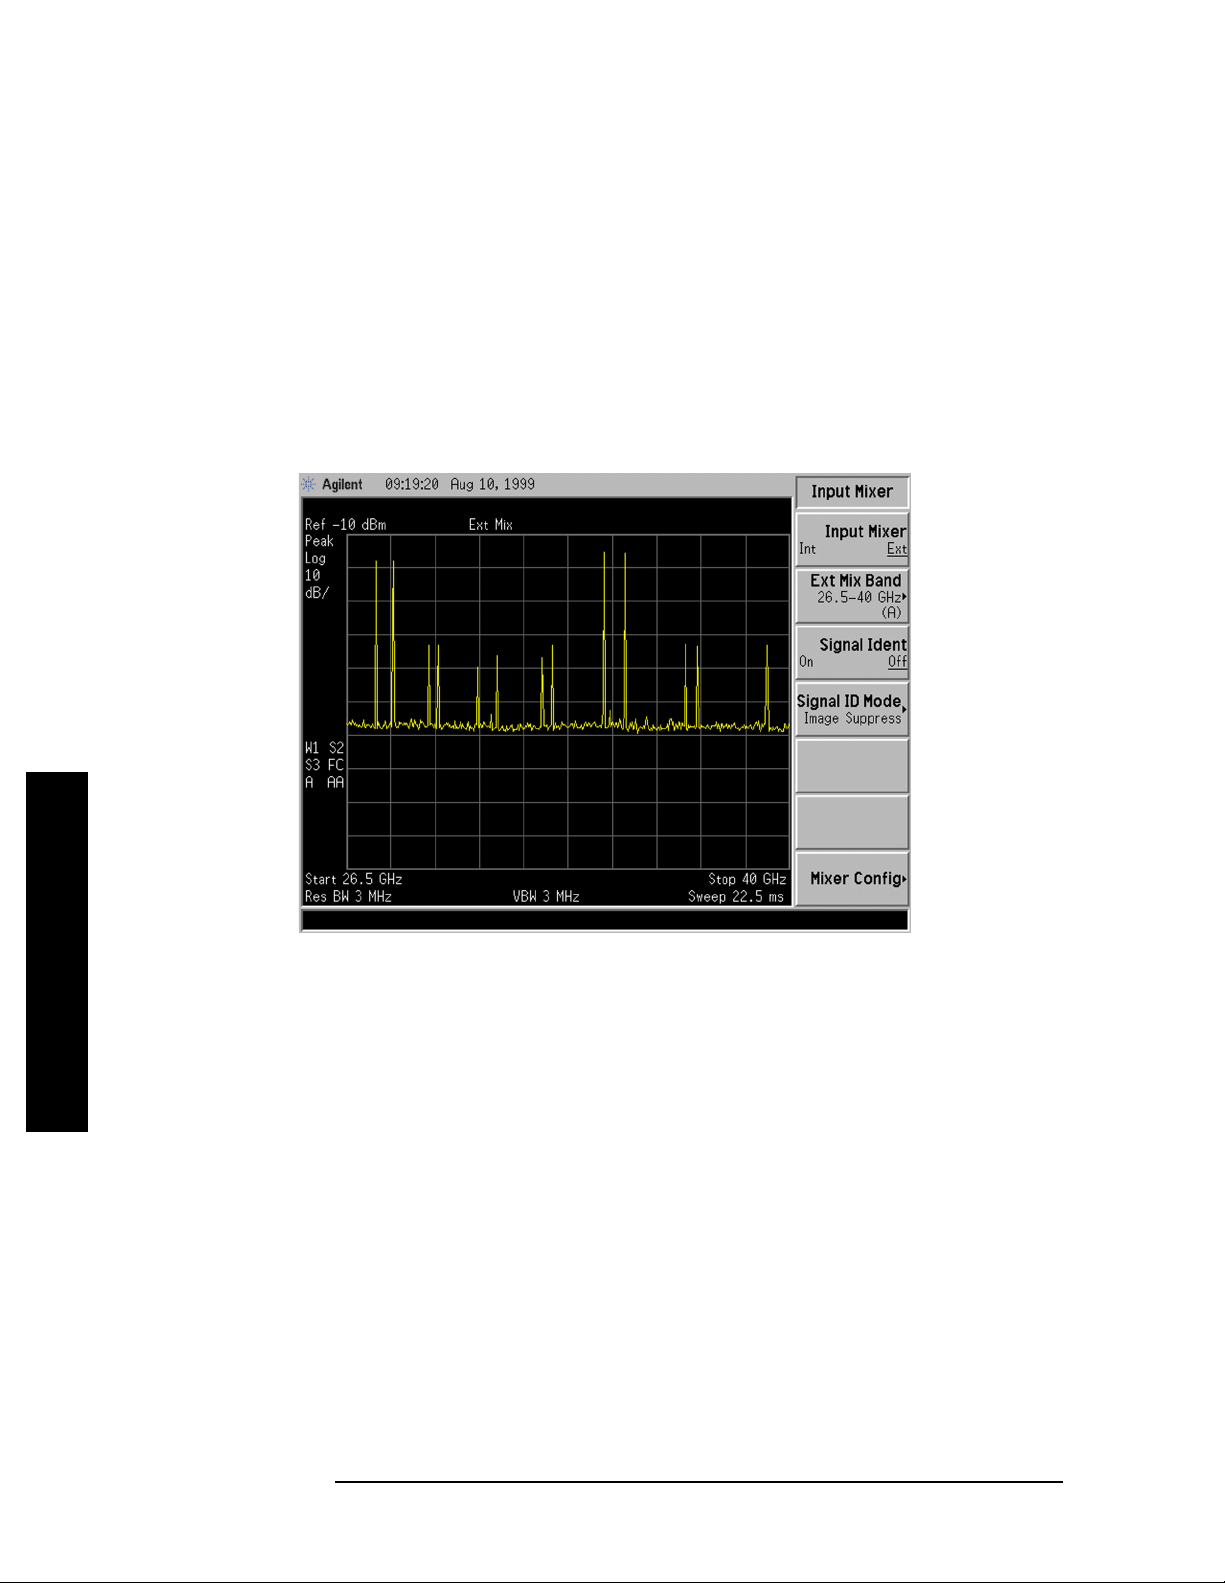
Signal Identification
The IF output of a harmonic mixer will contain a signal at the intermediate frequency of the
analyzer whenever the harmonic frequency of the LO and the frequency of the RF differ by the
intermediate frequency.
As a result, within a single harmonic band, a single input signal can produce multiple responses on
the analyzer display, only one of which is valid (see Figure 2-3.). These responses come in pairs,
where members of the valid response pair are separated by 642.8 MHz and either the right-most
(for negative harmonics) or left-most (for positive harmonics) member of the pair is the correct
response.
Figure 2-3.
Operation
Identification of valid responses is achieved by simply turning on the signal-identification feature.
(instrument preset selects the Image Suppress signal identification mode.) Press
Mixer
, Signal Ident (On) and note that now only the valid response (35 GHz) remains.
Press
Peak Search to place a marker on the remaining response. The signal-identification routine
Input/Output, Input
can introduce slight amplitude errors which is indicated by the message Signal Ident On,
Amptd Uncal. Refer to Figure 2-4..
After identifying a signal of interest, press
Signal Ident (Off) before making final amplitude
measurements. Note that Image Suppress should only be used to identify the fundamental signal
and not for accurate amplitude measurements.
24 Chapter 2
Page 25

Figure 2-4.
Operation
Using the Mixers with the E4407B Spectrum Analyzer (Option AYZ)
Operation
Chapter 2 25
Page 26

Operation
Using the Mixers with the E4440A, E 4446A, or E 4448A P SA Series Spectrum Anal yzer ( Option AYZ)
Using the Mixers with the E4440A, E4446A, or E4448A
PSA Series Spectrum Analyzer (Option AYZ)
Be sure to refer to “Spectrum Analyzer Retrofit Requirements” on page 9 for instrument
requirements for the PSA Series spectrum analyzers . The Agilent Technologies PSA Ser ies
spectrum analyzers contain an extensive menu of functions that help with millimeter
measurements. The following examples explain how to connect external mixers to the
spectrum analyzer, how to choose the band of interest, how to store and activate
conversion-loss factors, and how to use the signal-identification functions.
Set up the equipment
1. Connect the signal source and harmonic mixer to the analyzer, as shown in Figure 2-2.
Figure 2-5 Harmonic Mixer Setup
Spectrum Analyzer
IF INPUT
1st LO OUTPUT
Operation
SIGNAL
SOURCE
unpremix5
NOTE Agilent 5061-5458 SMA type cables should be used to connect the mixer IF
and LO ports to th e an a l y z e r. Do not over-tighten the ca b l es. The ma x i m u m
torque should not exceed 112 N-cm (10 in-lb.)
SMA Cable
SMA Cable
RF Input
IF
LO
Agilent 11970 SERIES
HARMONIC MIXER
26 Chapter 2
Page 27

Using the Mixers with the E4440A, E4446A, or E4448A PSA Series Spectrum Analyzer (Option
2. On the analyzer, press Preset, Factory Preset, if present.
Operation
AYZ)
3. Select external mixing by pressing
4. The analyzer frequency band will be set to
Ext Mix Band , then press the desired band frequency range/letter key. For this
press
Input/Output, Input Mixer, Input Mixer (Ext).
26.5 - 40 GHz (A). To choose a different band,
example, we will use band A, which ranges from 36.5 GHz to 40 GHz.
Amplitude Calibration
The conversion loss versus frequency data can be entered on your analyzer from one of
three sources.
• From a Conversion Loss Data Disk, supplied with your mixer . See “Using a
Conversion-Loss Data Disk with the ESA or PSA Series Analyzers” on page 21 .
• Data from the calibration sheet supplied with your mixer.
• From conversion-loss data located on the mixer bo dy label.
Manually Enter i ng Co n v er sio n -L os s D ata
1.The analyzer frequency band will be set to
Ext Mix Band and then press the desired band frequency range/letter key. For this
press
26.5 – 40 GHz (A). To choose a diff erent band,
example, we will use band A, which ranges from 26.5 GHz to 40 GHz.
NOTE To correct for the conversion-loss of the harm onic mixer in use, the analyzer
amplitude correction feature is used .
2. Press
external mixing. The recommended set to use is
AMPLITUDE Y Scale, More , Corrections. Select a correction set for use with
Other although any available set could
be used.
3. Press
Edit to enter the appropriate conversion loss data for the mixer in use. These
values are listed on the mixer, or a calibration sheet that is supplied with the mixer.
NOTE More correction points entered across the band in use will improve frequency
response accuracy. Up to 200 points may be defined for each set.
4. Once the desired correction points are entered, press
correction set
Other. This will also turn corrections on resulting in a calibrated display.
Return, Correction (On) to activate
It is recommended that the correction set entered be saved on the internal memory or
the floppy dr ive for futur e reference. See th e ES A User’s and Programmer’s Reference
guide for information on saving correction values.
Operation
Chapter 2 27
Page 28

Operation
Using the Mixers with the E4440A, E 4446A, or E 4448A P SA Series Spectrum Anal yzer ( Option
AYZ)
Signal Identification
The IF output of a harmonic mixer will contain a signal at the intermediate frequency of the
analyzer whenever the harmonic frequency of the LO and the frequency of the RF differ by the
intermediate frequency.
As a result, within a single harmonic band, a single input signal can produce multiple responses on
the analyzer display, only one of which is valid (see Figure 2-6.). These responses come in pairs,
where members of the valid response pair are separated by 642.8 MHz and either the right-most
(for negative harmonics) or left-most (for positive harmonics) member of the pair is the correct
response.
Figure 2-6.
Operation
Identification of valid responses is achieved by simply turning on the signal-identification feature.
(instrument preset selects the Image Suppress signal identification mode.) Press
Mixer
, Signal Ident (On) and note that now only the valid response (35 GHz) remains.
Press
Peak Search to place a marker on the remaining response. Refer to Figure 2-7.
After identifying a signal of interest, press
Signal Ident (Off) before making final amplitude
Input/Output, Input
measurements. Note that Image Suppress should only be used to identify the fundamental signal
and not for accurate amplitude measurements.
28 Chapter 2
Page 29

Figure 2-7.
Operation
Using the Mixers with the E4440A, E4446A, or E4448A PSA Series Spectrum Analyzer (Option
AYZ)
Operation
Chapter 2 29
Page 30

Operation
Using the Mixers with the 856X Series Spectrum Analyzers
Using the Mixers with the 856X Series Spectrum Analyzers
External millimeter mixers can be used to extend the frequency coverage of the 8560
E-Series and EC-Series spectrum analyzers. (The 8560E/ EC Option 002 and Option 327 do
not have external mixing capability.)
The 8560 E-Series and EC-Series spectrum analyzers contain an extens ive me nu of
functions that help with millimeter measurements. This example explains how to connect
external mixers to the spectrum analyzer, how to choose the band of interest, how to store
conversion-loss factors, and how to use the optional automat i c sig nal-identification
functions.
Set up the equipment
1. Figure 2-8 illustrates how to connect an external harmonic mixer to the s pectrum
analyzer.
Figure 2-8 External Mixer Setup
Operation
NOTE Good-quality shielded SMA-type cable s should be used to connect the mixer t o
the spectrum analyzer to ensure that no signa l attenuation occurs. Agilent
5061-5458 SMA-type cables may be used. Do not over-tighten the cables; the
maximum torque should not exceed 112 N-cm (10 in-lb.) .
30 Chapter 2
Page 31

Operation
Using the Mixers with the 856X Series Spectrum Analyzers
Select the Frequency Band
2. Specify unpreselected external mixing by pressing CONFIG, then EXT MXR PRE UNPR
until UNPR is selected.
3. To select a frequency above 18 GHz:
a. Press
AUX CTRL, EXTERNAL MIXER to set the analyzer to external mixer mode.
b. Enter the desired frequency directly using the center-frequency function.
c. Notice i n Table 2-1 that some frequencies overlap and fall into two bands. To be sure
that the desi re d band is select ed , re f e r to Table 2-1 and select the desired frequency
band, then use the full band function to enter this band.
d. In the external mixer menu, press
FULL BAND, then press the step up ⇑ key until the
letter preceding BAND in the active function area corresponds to the desired
frequency band.
Table 2-1 External Mixer Frequency Ranges
Frequency
Band
K 18.0 to 26.5 6
A 26.5 to 40.0 8− 30 dB
Q 33.0 to 50.0 10
U 40.0 to 60.0 10
V 50.0 to 75.0 14− 30 dB
E 60.0 to 90.0 16
Frequency
Range (GHz)
Mixing
Harmonic
− 30 dB
− 30 dB
− 30 dB
− 30 dB
Conversion
Loss
Operation
W 75.0 to 110.0 18
F 90.0 to 140.0 24− 30 dB
D 110.0 to 170.0 30
G 140.0 to 220.0 36
Y 170.0 to 260.0 44− 30 dB
J 220.0 to 325.0 54
Chapter 2 31
− 30 dB
− 30 dB
− 30 dB
− 30 dB
Page 32

Operation
Using the Mixers with the 856X Series Spectrum Analyzers
In this example, we’ll look at U-band, which ranges from 40 GHz to 60 GHz, as shown in
Figure 2-9. The
ensuring that the spectrum analyzer sweeps onl y the chosen band.
automatica l l y se t to O N when
LOCK HARMONIC function “locks” the spectrum analyzer in that band,
LOCK ON OFF is
FULL BAND is pressed.
Figure 2-9 Select the band of interest.
Save the average conversion-loss value
4. Default conversion-loss values that are stored in the analyzer for each fre quency band
are listed in Table 2-1. These values approximate the values for the Agilent 11970 series
Operation
mixers. Other conversion-loss values may be entered into the spectrum analyz er in two
ways. The first method lets you to save the average conversion-los s value for the entire
band using
a. Press
A VERAGE CNV LOSS. To activate this function:
AUX CTRL, EXTERNAL MIXER, AMPTD CORRECT, AVERAGE CNV LOSS.
b. Enter the appropriate average conversion-loss value. On Agilent 11970 Series
harmonic mixers, these values are printed on the mixer. The U-band mixer used for
this example had an average conversion loss of 23.5 dB, as shown in Figure 2-10.
32 Chapter 2
Page 33

Using the Mixers with the 856X Series Spectrum Analyzers
Figure 2-10 Store and correct for conversion loss.
Operation
The second method for storing conversion-loss information lets you save individual
conversion-loss data points at specific intervals across the harmonic band, using
LOSS VS FREQ
.
CNV
To view or enter a conversion-loss data point:
a. Press
CNV LOSS VS FREQ.
b. Enter the conversion-loss data at the frequency shown.
c. Use the step up
⇑ key to step through the band, entering the conve rsion loss at each
step.
Signal Identification
5. The IF output of a harmonic mixer contains many mixer products (frequencies of LO ±
source, 2LO
harmonic band, a single input signal can produce many responses, only one of which is
valid.
These responses come in pairs, where the members of the valid pair are spaced 621.4
MHz apart (see Figure 2-11) and the right-most member for the pair is the correct
response (for this analyzer, the left member of a pair is not valid).
± source, 3LO ± source…nLO ± source). As a result, within a single
Operation
Chapter 2 33
Page 34

Operation
Using the Mixers with the 856X Series Spectrum Analyzers
Figure 2-11 Signal Responses Produced by a 50 GHz Signal in U Band
Identify signals with the frequency-shift method
6. Signal-identification routines that identify the signal and images are available on
instrument s w i th fi r m wa re re v isi ons
method of identifying valid signal s uses the spectrum-analyzer function
When using this function, smaller spans will yield more accurate measurements.
a. Span down to 50 MHz.
Operation
b. Press
c. Press
AUX CTRL, EXTERNAL MIXER, SIGNAL IDENT.
SIG ID ON OFF until ON is selected.
Any signal not produced by the currently se lected harmonic will be shifted horizontally
on alternate sweeps (see Figure 2-12). Therefore, when viewing the display, on alternate
sweeps the signal will app ear, then not appear, at the frequency of interest. The correc t
signal produced by the selected harmonic will be shifted in a vertical direction only, as
shown in Figure 2-13.
≤920528, or with Option 008. The frequency-shift
SIG ID ON OFF.
34 Chapter 2
Page 35

Figure 2-12 Response for Invalid Signals
Operation
Using the Mixers with the 856X Series Spectrum Analyzers
Figure 2-13 Response for Valid Signals
Operation
Chapter 2 35
Page 36

Operation
Using the Mixers with the 856X Series Spectrum Analyzers
Identify signals in wide frequency spans
SIG ID AT MKR identifies signals in wide frequency spans, using harmonic search. SIG ID
7.
AT MKR
automatically determines the proper frequency of a signal and displays its
value on the spectrum analyzer.
• Activating
SIG ID AT MKR on an image of the signal will yield a reading in the active
block, as shown in Figure 2-14. The true signal frequency is given with an identifier
that the marker resides on an image. If the marker is placed on a true signal, and
SIG ID AT MKR is activated, the si g nal frequency will appear without the IMAGE
notation, as shown in Figure 2-15.
8. To activate
SIG ID AT MKR:
a. Place a marker on a signal.
b. Press
9. To exit the external mixer mode, press
Figure 2-14
AUX CTRL, EXTERNAL MIXER, SIGNAL IDENT, SIG ID AT MKR.
AUX CTRL, then INTERNAL MIXER.
SIG ID AT MKR Performed on an Image Signal
Operation
36 Chapter 2
Page 37

Using the Mixers with the 856X Series Spectrum Analyzers
Figure 2-15 SIG ID AT MKR P erformed on a True Signal
Operation
Operation
Chapter 2 37
Page 38

Operation
Using the Mixers with MMS Analyzers
Using the Mixers with MMS Analyzers
Preliminary Operation
NOTE This section provides information for the Agilent 70907A (or B), however the
operation of the Agilent 70909A and Agilent 70910A is similar. Minor
differences may be noted , but the necessary deviations from these exact
instructions will be obvious.
Equipment Connection
Connect the equipment as shown in Figure 2-16 Use the following checklist to verify the
connections:
• Agilent 11970 LO IN to Agilent 70907B LO OUTPUT (SMA cable, 5061-5458)
• Agilent 11970 IF OUT to Agilent 70907B IF INPUT (SMA cable, 5061-5458)
Figure 2-16 Agilent 11970 Connections to the Agilent 71000 Series Spectrum Analyzer
Operation
38 Chapter 2
Page 39

Operation
Using the Mixers with MMS Analyzers
Operation
Band Selection
Use the following key sequence to enter the external mixing mode and to select the desired
band of operation:
MENU
Select Input
State
ext mixer
fulband KAQUVE
- choose external mixer input, for example: “IN 2 EM 70910A”
Press the softkey for the desired band.
NOTE The above band selection key sequence must be used to enter the external
mixing band of operation. Do not enter in the center frequency of the band
directly.
Amplitude Calibration for a Single Frequency
Enter the conversion loss at the desired frequency from either the calibration label on the
end of the Agilent 11970 or the supplied calibration sheet by using the following key
sequence:
State
ext mixer
Operation
CONV LOSS
Enter the conversion loss value of the desired frequency, then terminate the entry with dB.
NOTE The above procedure is a single-point conversion-loss correction. For an
alternative procedure, available by remote programming only, refer to
“Conversion Loss Versus Frequency Correction” on page 43.
Chapter 2 39
Page 40

Operation
Using the Mixers with MMS Analyzers
General Descriptions of Agilent 71000 Series Spectrum Analyzer
External-Mixing Functions
ext mixer Allows access to the following softkey func tions that control the
measurement range when an external mixer extends the
ext mixer softkey can be
fulband KAQUVE
spectrum analyzer frequency range. The
found under the
fulband KAQUVE
fulband WFDGYJ
CONV LOSS
SIGNAL IDENT
State key.
and
fulband WFDGYJ Specify the frequency range for measurements made with
external mixers. Twelve frequency bands are available. Table 2-2
lists the start and stop frequencies of each band and also shows
which local-oscillator harmonic (N) is used for the mixing process .
Once a band is selected, the frequency range is locke d and the
spectrum a n a l y z er tunes with the local-o s c i l la tor harmon i c for
that band only.
Table 2-2 External Mixing Bands and Associated Mixing Harmonics
Band Harmon ic Number (N) Frequency Range (GHz)
K6
A 8+ 26.5 to 40.0
Operation
Q 10+ 33.0 to 50.0
U 10+ 40.0 to 60.0
V 14+ 50.0 to 75.0
E 16+ 60.0 to 90.0
W 18+ 75.0 to 110.0
F 24+ 90.0 to 140.0
D 30+ 110.0 to 170.0
G 36+ 140.0 to 220.0
Y 42+ 170.0 to 260.0
J 50+ 220.0 to 330.0
− 18.0 to 26.5
40 Chapter 2
Page 41

Operation
Using the Mixers with MMS Analyzers
CONV LOSS
(conversion loss) Offsets the reference level to compens ate for amplitude losses at
the active input port. If necessary, use
select input to activate the
desired inp u t po rt before spec i fying its conv e rsion-loss of fset.
To clear the offset, enter a conversion loss of zero.
After the instrument preset, a default value of 30 dB is activated
automatically for the input port of the external-mixer-interface
module.
Preset Input Sets which active input port will be selected when the INSTR
PRESET
pressing
INSTR PRESET R esets to the preset input and to the lowest full frequency range
is pressed. The preset input softkey can be accessed by
State, then MORE.
available. (For an external mixer, this is band A.) This is a front
panel key.
SIGNAL IDENT
(signal i dentify) Press Frequency, More, sig id options.
Executes a routine to identify real, in-band signals using either
the image (default) or shift methods.
Several options are available under
SIG ID ⇒ CF Places the marker on the identified real signal and
-
sig id options:
centers the signal on the display.
SIG ID MAN OFF Selects manual or automatic (default) mode.
-
-
IMAGE/SHIFT Selects the routine to use for identification.
-
SIG ID AMPTD ∆ Specifies the amplitude difference between the
marked signal and signals tested as images or
harmonics (default is 10 dB; applies only to IMAGE
mode.)
IMAGE N START Determines the frequency range for possibl e image or
harmonic responses by sele cting the lowest and
highest local oscillator harmonic used for mixing,
according to the tuning equation below:
= N x FLO ± IF
F
s
Default is 1.
-
IMAGE N STOP See “IMAGE N START” definition above.
Operation
Default is 40.
Chapter 2 41
Page 42

Operation
Using the Mixers with MMS Analyzers
NOTE See the tabl e below for available frequency ranges and related harmonic numbers. Use
the IMAGE N START and IMAGE N STOP softkeys for the image identification only.
Table 2-3 Frequency Ranges and Corresponding Harmonic Numbers
Band/Range Harmonic Number and Sign of
IF (N)
Internal Mixing - Agilent
71210C
Internal Mixing - Agilent
71200C
External Mixing - Agilent
70907A
7090
7B
709
10A
709
09A
2.9 - 6.2
6.0 - 12.7
12.5 - 19.9
19.7 - 22.0/26.5
2.9 - 6.2
6.0 - 12.8
12.6 - 22.0
K 18.0 - 26.5
A 26.5 - 40.0
Q 33.0 - 50.0
U 40.0 - 60.0
V 50.0 - 75.0
E 60.0 - 90.0
W 75.0 - 110.0
F 90.0 - 140.0
D 110.0 - 170.0
G 140.0 - 220.0
Y 170.0 - 260.0
J 220.0 - 330.0
−1
−2
+3
+4
−1
−2
−4
+6
+8
+10
+10
+14
+16
+18
+24
+30
+36
+42
+50
Operation
42 Chapter 2
Page 43

Operation
Using the Mixers with MMS Analyzers
Conversion Loss Versus Frequency Correction
The Agilent 71000 Series Spectrum Analyzers with the Agilent 70907A (or B) External
Mixer Interface Module installed has the am plitude-correction function (AMPCOR)
available by remote programming.
Use AMPCOR to compensate for the Agilent 11970 Series frequency-dependent
conversion-loss variations. Up to 200 pairs of frequency-amplitude correction p oints can be
entered, depending on the amount of available internal memory. The frequency values
entered must be in increasing order, or an error condition results. Whenever AMPCOR is
on, the correction values are added to all measurement results.
The values of the correction points are applied across the active measurement range.
Between points, the correction value are interpolated. When the measuring at frequencies
outside of the first and last correction pairs from memory.
When AMPCOR is executed, the frequency pairs are stored in internal memory. The
remote commands DISPOSE ALL, FORMAT, ERASE, and DISPOSE AMP COR erase the
amplitude-correction pairs from memory.
NOTE DISPOSE ALL, FORMAT, and ERASE erases much more than the
amplitude-correction pairs from memory. Do not use these commands without
referring to the programmer’s manual for the Agilent 70000 and Agilent
70900B to determine their effect on instrument programming.
Because AMPCOR adjusts IF gain and attenuation, AMPCOR should be used with care
when measuring signals near the compression level (also at a frequency that is corr ected
by the AMPCOR command).
To use AMPCOR for the Agilent 11970 conversion los s c orrection, first set the single- point
conversion loss function to zero with the following command:
OUTPUT 718; “CNVLOSS 0DB;”
Then build the AMPCOR table with frequency conversion loss pairs. The following
example program line shows three pairs of frequency conversion loss values for a typical
Agilent 11970V.
OUTPUT 718; “AMPCOR 50GHZ, 49.6DB, 51GHZ, 49.1DB, 52GHZ,48.6DB;”
The conversion loss corrections are activated by the AMPCOR ON command; use
AMPCOR OFF to deactivate the function (be sure to manually enter a single-point
conversion-loss value if AMPCOR has been used).
Operation
Chapter 2 43
Page 44

Operation
Using the Mixers with MMS Analyzers
To pr int out an existing AMPCOR table, use the program listed below:
10 dim A$ (1:20) [30]
20 OUTPUT 718; “CONVLOSS 0DB;”
30 OUTPUT 718; “AMPCOR 50 GHZ, 46.1DB, 52GHZ, 46.7DB, 53GHZ,47.2DB;”
40 !
50 OUTPUT 718; “AMPCOR?;”
60 ENTER 718 USING “%,k”;A$ (*)
70 !
80 FOR I=1 TO 10
90 PRINT “Point “;I,A$ (I)
100 NEXT I
110 END
Line 30: Generates an AMPCOR table.
Line 60: % specifies that an EOI terminates the en tire stat ement. “K” specifie s that
an
terminates the individual string entry.
L
F
Returned values are in the format where the frequen cy in Hz is listed first, fo llowed by the
conversion loss in dB . See the following example:
Point 1 50.00000000E+9,46.1
Point 2 52.00000000E+9,46.7
Point 3 53.00000000E+9,47.2
Point 4
Point 5
Point 6
Point 7
Point 8
Point 9
Point 10
Operation
Point 11
NOTE For further information, consult the Agilent 70900B
Local-Oscillator-Controlled Modules Programming Manual, part number
70900-90284.
44 Chapter 2
Page 45

Operation
Using the Mixers with the 8566B Spectrum Analyzer
Using the Mixers with the 8566B Spectrum Analyzer
Set up the equipment
1. Co n nect the exte r n a l harmonic m i x e r to the spectr u m a n a lyzer, as shown in Figure 2-17.
NOTE Good-quality shielded SMA-type cable s should be used to connect the mixer t o
the spectrum analyzer to ensure that no signa l attenuation occurs. Agilent
5061-5458 SMA-type cables may be used. Do not over-tighten the cables; the
maximum torque should not exceed 112 N-cm (10 in-lb .).
Figure 2-17
External Mixer Connection
Operation
CAUTION Before connecting the Agilent 11975A Amplifier, set the ALC switch to ON.
Failure to do so can damage the mixer.
2. Power up the spectrum analyzer and then the amplifier.
3. Adjust the amplifier power to 16 dBm.
4. To access the spectrum analyzer’s millimeter bands, press
⇑
until the desired band is displaye d on the screen, as shown in Figure 2-18. Note that
SHIFT and then the up arrow
this is important because toggling throu gh the bands , causes the band to autom atically
harmonic lock as evidenced by the on-screen annotatio n of “Harmonic 6” changing to
Chapter 2 45
Page 46

Operation
Using the Mixers with the 8566B Spectrum Analyzer
“Harmonic 6L”, where “L” stands for locked, or you could press Shift+z to manually
harmonic lock.
Figure 2-18
TYPICAL MILLIMETER SIGNAL DISPLAY
A menu of millimeter measurement functions is accessed by pressing SHIFT, 1, MHz. Even
though the spectrum analyzer is in an external mixer band, the 8566B spectrum analyzer
retains full operation capabil ity (except for use of the RF input attenuator and prese lector).
Amplitude Calibration
Procedure
Operation
Each 11970 series harmonic mixer is characterized at the factory and comes with a
calibration chart (See Figure 2-19). The horizontal axis of the chart gives the frequency
range of the mixer and the two vertical axis scales are calibrated in conversion loss and in
reference level offset.
To correct the amplit ude calibrati on of the spectrum analyzer to account for the conv ersi on
loss of the harmonic mixer, press
SHIFT, 5, MHz to access conversion loss entry and key in the appropriat e value on the
press
SHIFT, 1, MHz, which accesses the mil limeter menu . Then
spectrum analyzer as shown on the mixer calibration chart.
For measurements that span the entire band, choose an average value of conversion loss
from the conversion loss chart. For those spectrum analyzers with date codes earlier than
13.8.86, the conversion loss is changed using the ref erence level function. Press
REFERENCE LEVEL, then key in the reference level offset shown on the right side of the
SHIFT, then
mixer calibration chart.
46 Chapter 2
Page 47

Operation
Using the Mixers with the 8566B Spectrum Analyzer
Signal Identification
Figure 2-18 shows a typical full-band display of a single input signal. Direct interpretation
of the display is difficult because of the large number of responses produced by several
local oscillator harmonics generated in the mixer. To solve this problem the 8566B
spectrum analyzer uses two methods of signal identification.
The first is an automatic image search in which the spectrum analyzer looks for a signal
image within a preset range of harmonic numbers. This automatic signal identification
routine is initiated by pressing
appears on the CRT: SIGNAL NOT IDENTIFIED, SIGNAL IDENTIFIED OUT OF BAND (w i t h
the frequency), or CENTER (with the identified signal frequency). The range of harmonic
numbers through which the spectrum analyzer searches can be changed by accessing
“search start HN” and “sea rch st op HN,” which are
respectively.
The second method, manual signal identification, is a fast method of verifying that the
displayed signal is a true signal in the specified band. Press
function. P ositive signal ident ification is ind icated if the signal in question does not change
frequency and is reduced in amplitud e by one to two divisions on alt ernate sweeps . A faile d
signal identification is indicated by the signal disap pear i ng or shifting in frequency.
SHIFT, 3, MHz. Upon completion, one of three messages
SHIFT, 7, MHz and SHIFT, 8, MHz,
SHIFT, 4, MHz to activate this
Operation
Chapter 2 47
Page 48

Operation
Using the Mixers with the 8566B Spectrum Analyzer
Figure 2-19 Sample Mixer Calibration Ta ble
Operation
48 Chapter 2
Page 49

3 Performance Tests
Performance Tests
49
Page 50

Performance Tests
Introduction
Introduction
This section contains instructions for testing the performance of the 11970 Series Mixers.
Performance tests are used to check the mixers at incoming inspection and for periodic
evaluation. The tests verify the specifications listed for the mixers in Table 1-1.
Test equipment required for the performance tests is listed in Table 3-1. for the 11970K,
Table 3-2. for the 11970A, Table 3-3. for the 11970Q, Table 3-4. for the 11970U, Table 3-5. for
the 11970V and Table 3-6. for the 11970W. Test ins truments other than those lis ted may be
used provided their performance equals or exceeds the critical specifications listed in
Tables 3-1 through 3-6.
Test Record
At the end of each test is a test record, which is used for recording the performance test
data. Make copies of these test records and use them as worksheets when doing the tests.
Performance Tests
50 Chapter 3
Page 51

Performance Tests
Performance Test Procedures
Performance Test Procedures
Description
Each performance test procedure is contained in a single paragraph. The first entry in
each paragraph is the specification for the parameter being measured as described in Table
1-1 This is followed by a general description of the test and any special instructions or
problem areas. Appropriate test setup illustrations are included in this section and are
referenced in the proc edures . You MUST do the tests, and the ste ps within eac h tes t, in the
order they are given.
Table 3-1. Recommended Test Equipment for 11907K
Instrument Critical Specifications Recommended Model
Spectrum Analyzer LO and IF ranges compatible with mixer 8566B
Synthesized Sweeper Frequency: 18 to 26.5 GHz
Output Level: >-10 dBm
Amplifier Output Level: >18 dBm leveled
Frequency Range: 3 to 4.5 GHz
Power Meter Compatible with Power Sensor 436A
Power Sensor SWR: <1.3 8485A
Directional Coupler
Isolator Insertion Loss: <1.5 dB
Adapter (2 required) 3.5 mm female to WR-42
Cables (3 required) Connectors: SMA male P/N 5061-5458
Cable Connectors: SMA
1
Coupling: 10 dB
Directivity: >40 dB
Primary Arm SWR: <1.05
Auxiliary Arm SWR: <1.2
Isolation: >20 dB
SWR: <1.2
SWR: <1.1
Loss: <1.0 dB @ 20 GHz
8340A
11975A
K752C
P/N 0960-0081
K281C
P/N 8120-4396
1. Calibration data for the coupling ratio b etween the output arm and the auxiliary
arm is necessary for accurate measurement s.
Performance Tests
Chapter 3 51
Page 52

Performance Tests
Performance Test Procedures
Table 3-2. Recommended Test Equipment for 11970A
Instrument Critical Specifications Recommended
Model
Spectrum Analyzer LO and IF ranges compatible with mixer 8566B
Synthesized Sweeper Frequency: 8 to 13.5 GHz
8340A
Output Level: >0 dBm
Amplifier Output Level: >18 dBm leveled
11975A
Frequency Range: 3 to 5 GHz
Amplifier Frequency Range: 8 to 13.5 GHz
8349A
Output Level >15 dBm
Power Meter Compatible with Power Sensor 436A
Power Sensor SWR: <2.0 R8486A
Power Sensor SWR: <1.3 @ 6 GHz 8485A
Directional Coupler
1
Coupling: 20 dB
R752D
Directivity: >40 dB
Primary Arm SWR: <1.05
Auxiliary Arm SWR: <1.2
Isolator Insertion Loss: <1.5 dB
P/N 0960-0082
Isolation: >20 dB
SWR: <1.2
Frequency Tripler Input Power: >10 dBm minimum
Conversion Loss: <15 dB
Spacekom Microwave
TKa-1
2
Adapter SMA female to SMA female P/N 1250-1158
Adapter SMA female to Type N female P/N 1250-1404
Adapter (2 required) Type N male to SMA female P/N 1250-1250
Cables (3 required) Connectors: SMA male P/N 5061-5458
Cable Connectors: SMA male
P/N 8120-4396
Loss: <1.0 dB @ 20 GHz
Cable Connectors: BNC male 11086A
1. Calibration data for the coupling ration between the output arm and the auxiliary arm is necessary for accurate measurements.
2. Honeywell, Inc. Spacekom Microwave Cente r, Santa Barbara, CA
Performance Tests
52 Chapter 3
Page 53

Performance Tests
Performance Test Procedures
Table 3-3. Recommended Test Equipment for 11970Q
Instrument Critical Specifications Recommended Model
Spectrum Analyzer LO and IF ranges compatible with mixer 8566B
Synthesized Sweeper Frequency: 11.0 to 16.7 GHz
8340A
Output Level: >0 dBm
Amplifier Output Level: >18 dBm leveled
11975A
Frequency Range: 4 to 6 GHz
Amplifier Frequency Range: 11.0 to 16.7 GHz
8349A
Output Level >15 dBm
Power Meter Compatible with Power Sensor 436A
Power Sensor SWR: <2.0 Q8486A
Power Sensor SWR: <1.3 @ 6 GHz 8485A
Directional Coupler
Coupling: 20 dB
Q752D
1
Directivity: >30 dB
Auxiliary Arm SWR: <1.2
Isolator Insertion Loss: <2 dB
Q365A
Isolation: >20 dB
SWR: <1.5
Frequency Tripler Conversion Loss: <20 dB
Spacekom Microwave
TKa-1
Adapter SMA female to Type N female P/N 1250-1404
2
Adapter SMA female to SMA female P/N 1250-1158
Adapter (2 required) Type N male to SMA female P/N 1250-1250
Cables (4 required) Connectors: SMA male P/N 5061-5458
Cable Connectors: SMA male
P/N 8120-4396
Loss: <1.0 dB @ 20 GHz
Cable Connectors: BNC male 11086A
1. Calibration data for the coupling ration between the output arm and the auxiliary arm is necessary for accurate measurements.
2. Honeywell, Inc. Spacekom Microwave Cente r, Santa Barbara, CA
Chapter 3 53
Performance Tests
Page 54

Performance Tests
Performance Test Procedures
Table 3-4. Recommended Test Equipment for 11970U
Instrument Critical Specifications Recommended Model
Spectrum Analyzer LO and IF ranges compatible with mixer 8566B
Synthesized Sweeper Frequency: 13.3 to 20 GHz
8340A
Output Level: > 9 dBm
Amplifier Output Level: > 18 dBm leveled
11975A
Frequency Range: 4 to 6 GHz
Amplifier Frequency Range: 13.3 to 20 GHz
8349A
Output Level >15 dBm
Power Meter Compatible with Power Sensor 432A
Thermistor Mount SWR: <2.0
Hughes
1
45773H-1100
Thermistor Mount SWR: <1.3 @ 6 GHz 478A
Directional Coupler
2
Coupling: 20 dB
U752D
Directivity: >30 dB
Auxiliary Arm SWR: <1.2
Isolator Insertion Loss: <2 dB
U365A
Isolation: >20 dB
SWR: <1.5
Frequency Tripler Conversion Loss: <20 dB
Spacekom Microwave
TKa-1
Adapter SMA female to Type N female P/N 1250-1404
3
Adapter SMA female to SMA female P/N 1250-1158
Adapter (2 required) Type N male to SMA female P/N 1250-1250
Cables (4 required) Connectors: SMA male P/N 5061-5458
Cable Connectors: SMA male
P/N 8120-4396
Loss: <1.0 dB @ 20 GHz
Cable Connectors: BNC male 11086A
1. Hughes Aircraft Co. Electron Dynamics Division, Torrance, CA
2. Calibration data for the coupling ration between the output arm and the auxiliary arm is necessary for accurate measurements.
3. Honeywell, Inc. Spacekom Microwave Cente r, Santa Barbara, CA
Performance Tests
54 Chapter 3
Page 55

Performance Tests
Performance Test Procedures
Table 3-5. Recommended Test Equipment for 11970V
Instrument Critical Specifications Recommended Model
Spectrum Analyzer LO and IF ranges compatible with mixer 8566B
Swept Source Compatible with V-Band Plug-In 8350B
V-Band Source Plug-In Frequency Range: 50 to 75 GHz
Hughes
1
47724H-1510
Output Level: >0 dBm
Amplifier Output Level >18 dBm leveled
11975A
Frequency Range: 4 to 6 GHz
Power Meter Compatible with Power Sensor 432A
Thermistor Mount SWR: <2.0 Hughes 45774H-1100
Thermistor Mount SWR: <1.3 @ 6 GHz 478A
Directional Coupler
2
Coupling: 20 dB
Hughes 45324H-1220
Directivity: >20 dB
Auxiliary Arm SWR: <1.5
Variable Attentuator Range: 0 to 15 dB
TRG
3
510V/385
Adapter SMA female to Type N female P/N 1250-1404
Adapter SMA female to SMA female P/N 1250-1158
Adapter (2 required) Type N male to SMA female P/N 1250-1250
Cables (4 required) Connectors: SMA male P/N 5061-5458
Cable Connectors: SMA male
P/N 8120-4396
Loss: <1.0 dB @ 20 GHz
Cable Connectors: BNC male 11086A
1. Hughes Aircraft Co. Electron Dynamics Division, Torrance, CA
2. Calibration data for the coupling ration between the output arm and the auxil iary
arm is necessary for accurate measurement s.
3. Alpha Industries Inc. TRG Division, Woburn, MA
Chapter 3 55
Performance Tests
Page 56

Performance Tests
Performance Test Procedures
Table 3-6. Recommended Test Equipment for 11970W
Instrument Critical Specifications Recommended
Model
Spectrum Analyzer LO and IF ranges compatible with mixer 8566B
Swept Source Compatible with W-Band Plug-In 8350B
W-Band Source Plug-In Frequency Range: 75 to 110 GHz
Hughes
1
47726H-1510
Output Level: >0 dBm
Amplifier Output Le v el >18 dBm leveled
11975A
Frequency Range: 4 to 6 GHz
Power Meter Compatible with Power Sensor 432A
Thermistor Mount SWR: <2.0 Hughes 45776H-1100
Thermistor Mount SWR: <1.3 @ 6 GHz 478A
Directional Coupler
2
Coupling: 20 dB
Hughes 45326H-1220
Directivity: >20 dB
Auxiliary Arm SWR: <1.5
Variable Attentu ator Range: 0 to 15 dB
TRG
3
W510
Adapter SMA femal e to Ty p e N fe ma l e P/N 1250-140 4
Adapter SMA female to SMA female P/N 1250-1158
Adapter (2 required) Type N male to SMA female P/N 1250-1250
Cables (4 required) Connectors: SMA male P/N 5061-5458
Cable Connectors: SMA male
P/N 8120-4396
Loss: <1.0 dB @ 20 GHz
Cable Connectors: BNC male 11086A
1. Hughes Aircraft Co. Electron Dynamics Division, Torrance, CA
2. Calibration data for the coupling ration between the output arm and the auxiliary arm is necessary for accurate measurements.
3. Alpha Industries Inc. TRG Division, Woburn, MA
Performance Tests
56 Chapter 3
Page 57

Conversion Loss and Frequency Response
Conversion Loss and Frequency Response
Specifications
Conversion Loss:
For a CW RF input power of less than -20 dBm
11970K: 24 dB maximum
11970A: 26 dB maximum
11970Q: 28 dB maximum
11970U: 28 dB maximum
11970V: 40 dB maximum
11970W: 47 dB maximum
Performance Tests
Frequency Response:
For an LO amplitude between 14.5 and 16.0 dBm
11970K: ±1.9 dB
11970A: ±1.9 dB
11970Q: ±1.9 dB
11970U: ±1.9 dB
11970V: ±2.1 dB
11970W: ±3.0 dB
For an LO amplitude between 14.0 and 18.0 dBm
11970K: ±2.8 dB
11970A: ±2.8 dB
11970Q: ±2.8 dB
1197OU: ±2.8 dB
11970V: ±2.8 dB
Performance Tests
11970W: ±4.0 dB
Chapter 3 57
Page 58

Performance Tests
Conversion Loss and Frequency Response
Description
The frequency response and conve rsion loss are checked at four LO power levels. A known
input power is applied to the input of the mixer. The IF output power is measured on the
8566B Spectrum Analyzer. From these measurements, the conversion loss and frequency
response are calculated.
1. Connect an SMA cable from the 1st LO OUTPUT of the spectrum analyzer to the
INPUT of the amplifier. Connect a second SMA cable to the OUTPUT of the amplifier.
2. For 11970K: Zero and c alibrate the power meter. For 11970A, 11970Q, 11970U, 11970V
or 11970W: Connect the 478A Power Sensor to the power meter sensor cables , then zero
the power meter.
3. Set the 8566A/B Spectrum Analyzer controls as follows:
SHIFT, ↑, KSU
FREQUENCY SPAN, 0, Hz
SHIFT
, SWEEP, CONT, KSt
CENTER
, 2, 4, [.] 5, GHz
CAUTION When you are using a 11975A Amplifier with a 11970 Series Mixer, you
MUST set the amplifier rear-panel ALC switch to ON before you connect the
amplifier into the test set up . If the ALC switc h is left in the OFF posit ion, the
amplifier output power is high enough to destroy the mixer diodes.
4. On the 11975A Amplifier, set the rear panel ALC switch to ON, then connect the power
sensor to the free end of the cable installed on the OUTPUT connector of the amplifier.
Set the power meter Cal Factor to the appropriate value for a frequency of 4 GHz.
5. Adjust the amplifier OUTPUT POWER LEVEL for a reading of 14.0 ± 0.1 dBm on the
power meter. Record the LO power in Table 3-7.
6. Set the power meter Cal Factor to 100 percent.
7. Connect the equipment, as shown in Figure 3-1.
CAUTION Make sure the 8349A Amplifier, used in the signal generator system for
11970A, Q and U tests, is set for external leve ling before you turn it on.
Failure to do so may allow the amplifier output to rise about 20 dBm (high
enough to damage the frequency tripler).
8. Set the signal generator for a CW output signal at the frequencies listed below:
11970K: 18.0 GHz
11970A: 26.5 GHz
11970Q: 33.0 GHz
Performance Tests
11970U: 40.0 GHz
58 Chapter 3
Page 59

11970V: 50.0 GHz
11970W: 75.0 GHz
Performance Tests
Conversion Loss and Frequency Response
Chapter 3 59
Performance Tests
Page 60

Performance Tests
Conversion Loss and Frequency Response
9. Adjust the output power of the signa l gene rato r for a r eading of ap pr oximately -10 dBm
on the power meter for the 11970K, V or W and for approximately -3 dBm for the
11970A, Q or U. (Make sure that the unleveled light is not on for the 11970V and
11970W. Vary the power by adjusting the rotary vane attenuator.)
10.On the spectrum analyzer, press
11.Set spectrum analyzer
CENTER FREQUENCY to:
SHIFT and [MKR/∆ ⇑ STP SIZE].
11970K: 22 GHz
11970A: 33 GHz
11970Q: 41 GHz
11970U: 50 GHz
11970V: 62 GHz
11970W: 92 GHz
12.On the spectrum analyzer, press
SHIFT and SWEEP, CONT.
13.Set the spectrum analy zer controls as follows:
For 11970K, A, Q or U:
SHIFT, REFERENCE LEVEL, 3, 0, -dB
SCALE
RES BW
FREQUENCY SPAN, 2, 0, MHz
ENTER dB/DIV, 2, dB
, 1, MHz
CF STEP SIZE
, 5, 0, 0, MHz
For 11970V or W:
SHIFT, REFERENCE LEVEL, 3, 0, -dB
SCALE
RES BW
FREQUENCY SPAN, 2, 0, 0, MHz
CF STEP SIZE
ENTER dB/DIV, 2, dB
, 3, MHz
, 1, GHz
Press REFERENCE LEVEL:
11970K:
3, 6, -dBm
11970A: 3, 8, -dBm
11970Q: 4, 0, -dBm
11970U: 4, 0, -dBm
11970V: 4, 8, -dBm
Performance Tests
11970W: 5, 6, -dBm
60 Chapter 3
Page 61

Then press CENTER FREQUENCY:
Performance Tests
Conversion Loss and Frequency Response
11970K:
1, 8, GHz
11970A: 2, 6, [.] 5, GHz
11970Q: 3, 3, GHz
11970U: 4, 0, GHz
11970V: 5, 0, GHz
11970W: 7, 5, GHz
14.Press MARKER, PEAK SEARCH. If necessary, press MKR→CF and use DISPLAY LINE
ENTER to find the average of the signal’s peak variations. (When testing 11970V or
11970W mixers, it is important to re-zero the power meter for each measurement.)
15.Record the following in Table 3-7:
Marker Frequency
Marker Amplitude
Power Meter Reading
Power Sensor Cal Factor or Correction Factor (dB)
Directional Coupler Coupling Factor
NOTE For the purposes of this measurement, the directional coupler coupling factor
is defined as the ratio of the power at the output flange to the power at the
coupled flange.
16.Calculate the conversion loss of the mixer with the following equation:
Conversion Loss = Power Meter Reading - 10 log(Cal Factor) - Spectrum Analyzer
Marker Amplitude - Coupling Factor
(or given the Power Meter Correction Factor in dB: Conversion Loss = Power Meter
Reading + Power Meter Correction Factor - Spectrum Analyzer Marker Amplitude Coupling Factor)
For examp le:
Power Meter Reading = -10.03 dBm
Cal Factor = 94.8%
or Correction Factor = -0.232 dB
Spectrum Analyzer reading = -39.78 dBm
Coupling Factor 8.93 dB
then:
Performance Tests
Conversion Loss (-10.03) - 10 log(.948) - (-39.78 dBm) - 8.93 dB = 21.05 dB
Chapter 3 61
Page 62

Performance Tests
Conversion Loss and Frequency Response
or Conversion Loss = (-10.03 dBm) - (-0.232) - (-39.78 dBm) - 8.93 dB = 21.05 dB
17.Record the conversion loss in Table 3-7.
Performance Tests
62 Chapter 3
Page 63

Performance Tests
Conversion Loss and Frequency Response
NOTE The conversion loss indicated on the mixer calibration label includes the loss
in the IF cable. If other than the specified cable is used, then the loss in that
cable must be compensated for when making amplitude measurements.
18.Increment the frequency of the signal generator 500 MHz higher.
19.Press DATA [
↑], then PEAK SEARCH and MKR→CF on the spectrum analyzer.
20.Repeat steps 15 through 18 until the appropriate frequency listed below is reached.
11970K: 26.5 GHz
11970A: 40.0 GHz
11970Q: 50.0 GHz
1197OU: 60.0 GHz
11970V: 75.0 GHz
11970W: 110.0 GHz
21.Repeat steps 1 through 19 for LO inputs to the mixer of 14.5 dBm, 16.0 dBm, and
18.0 dBm. In step 5, measure each of these levels at the end of the cable normally
connecte d to the mixer L O in put.
22.Frequency response is the difference between the maximum and minimum conversion
losses rec orded in Table 3-7. For LO power levels between 14.5 and 16.0 dBm this
difference must be less than:
3.8 dB (for 11970K, 11970A, 11970Q or 1197OU)
4.2 dB (for 11970V)
6.0 dB (for 11970W)
• For LO power levels between 14.0 and 18.0 dBm, the difference must be less than:
5.6 dB (for 11970K, 11970A, 11970Q, 11970U or 11970V)
8.0 dB (for 11970W)
23.Maximum conversion loss must not exceed the following limits:
For an LO input power between 14.0 and 18.0 dBm.
11970K: 24 dB
11970A: 26 dB
11970Q: 28 dB
11970U: 28 dB
11970V: 40 dB
11970W: 46 dB
Chapter 3 63
Performance Tests
Page 64

Performance Tests
Conversion Loss and Frequency Response
Figure 3-1 Performance Test Setups (1 of 2)
Performance Tests
64 Chapter 3
Page 65

Figure 3-2 Performance Test Setups (2 of 2)
Performance Tests
Conversion Loss and Frequency Response
Chapter 3 65
Performance Tests
Page 66

Performance Tests
Conversion Loss and Frequency Response
Table 3-7 Conversion Loss and Frequency Response Test Record
CONVERSION LOSS AND FRE QUENCY RESPONSE for an LO POWER
of_____________dBm
Model Number_________ ___ Date_____________
Serial Number______________Tested By _________________
Marker
Frequency
GHz dBm dBm % or dB dB dB
Marker
Amplitude
Power Meter
Readings
Power Sensor
Cal Factor
Directional Coupler
Coupling Factor
Conversion
Loss
Performance Tests
66 Chapter 3
Page 67

Conversion Loss and Frequency Response
Table 3-7 Conversion Loss and Frequency Response Test Record
CONVERSION LOSS AND FRE QUENCY RESPONSE for an LO POWER
of_____________dBm
Performance Tests
Marker
Frequency
GHz dBm dBm % or dB dB dB
Frequency Response = _______________dB
Marker
Amplitude
Power Meter
Readings
Power Sensor
Cal Factor
Directional Coupler
Coupling Factor
Conversion
Loss
Chapter 3 67
Performance Tests
Page 68

Performance Tests
AVERAGE NOISE LEVEL TEST
AVERAGE NOISE LEVEL TEST
Specification
11970K: -110 dBm
11970A: -108 dBm
11970Q: -104 dBm
11970U: -104 dBm
11970V: -92 dBm
11970W: -85 dBm
Description
The average displayed noise level in a 1 kHz bandwidth, using external mixing with the
8566A/B Spectrum Analyzer, is checked at several LO power levels. This is accompli shed
by applying a known power to the input of the mixer. The difference between the
amplitude of the known signal and t he noise floor is meas ured. Fro m these measurements,
the average noise level in a 1 kHz bandwidth is calculated.
1. Connect an SMA cable from the spectrum analyzer LO OUTPUT to the INPUT of the
11975A Amplifier. Connect a second SMA cable to the amplifier OUTPUT.
2. For 11970K: Zero and c alibrate the power meter. For 11970A, 11970Q, 11970U, 11970V
or 11970W: Connect the 478A Power Sensor to the power meter sensor cables , then zero
the power meter.
3. On the 8566A/B Spectrum Analyzer, set the controls as follows:
SHIFT, DATA STEP [↑] KSU
FREQUENCY SPAN
SHIFT
, SWEEP, CONT, KSt
CENTER FREQUENCY, 2, 4 [.] 5, GHz
, 0, Hz
CAUTION When you are using a 11975A Amplifier with a 11970 Series Mixer, you
MUST set the amplifier rear-panel ALC switch to ON before you connect the
amplifier into the test set up . If the ALC switc h is left in the OFF posit ion, the
amplifier output power is high enough to destroy the mixer diodes.
Performance Tests
68 Chapter 3
Page 69

Performance Tests
AVERAGE NOISE LEVEL TEST
4. On the 11975A Amplifier, set the rear panel ALC switch to ON. Then connect the power sensor to
the free end of the cable connected to the output of the amplifier. Set the power meter calibration
factor to the value shown on the power sensor calibration label for 4 GHz.
5. Adjust the amplifier OUTPUT POWER LEVEL control for a reading of 14.5 ± 0.1 dBm
on the power meter.
Chapter 3 69
Performance Tests
Page 70

Performance Tests
AVERAGE NOISE LEVEL TEST
CAUTION Make sure the 8349A Amplifier, used in the signal generator system for
11970A, Q and U tests, is set for external leve ling before you turn it on.
Failure to set this amplifier for external leveling may allow the amplifier
output to rise about 20 dBm, which is high enough to damage the frequency
tripler.
6. Disconnect the power sensor and connect the equipment as shown in Figure 3-1.
7. On the 8566A/B Spectrum Analyzer, set the controls as follows:
For 11970K, A, Q or U:
SHIFT, DATA STEP [↑] KSU
FREQUENCY SPAN
VIDEO BW, 1, 0, 0, Hz
RES BW,
1, 0, 0, kHz
3, 0, MHz
For 11970V or W:
SHIFT, DATA STEP [↑] KSU
FREQUENCY SPAN
VIDEO BW, 3, MHz
RES BW
, 3, MHz
, 1, 0, 0, MHz
and CENTER FREQUENCY:
For 11970K:
2, 2, GHz
For 11970A: 3, 3, GHz
For 11970Q: 4, 1, GHz
For 11970U: 5, 0,GHz
For 11970V: 6, 2,[.] 5, GHz
For 11970W: 9, 2,[.] 5,GHz
8. Press SHIFT and SWEEP, CONT, KSt.
9. Press
For 11970K:
CENTER FREQUENCY again and enter the appr opriate ce nter frequenc y as fo llows :
1, 8, GHz
For 11970A: 2, 6, [.] 5, GHz
For 11970Q: 3, 3, GHz
Performance Tests
For 11970U: 4, 0, GHz
70 Chapter 3
Page 71

For 11970V: 5, 0, GHz
Performance Tests
AVERAGE NOISE LEVEL TEST
For 11970W:
7, 5, GHz
10.Record the center frequency in Table 3-8.
11.Set the power meter CAL FACTOR to the value shown on the sensor calibration label
for the center frequency indicated on the spectrum analyzer.
12.Set the signal gener ator output to produce a CW signal near the center of the spectrum
analyzer display. Next, set the signal generator outp ut power level to pr oduce a read ing
of approximately -10 dBm on the power meter. Record the power meter reading in Table
3-8. (When testing the 11970V or W, re-zero the power meter for each measurement.)
13.Subtract the coupling factor for the directional coupler from the power meter reading,
then add the power meter correction factor (d B) to the power meter reading . Record this
corrected power reading in Table 3-8.
Corrected Power Reading = Power Meter Reading - Coupling Factor + Power Meter
Correction Factor .
For examp le:
(-10.03 dBm) - 9.82 dB + 0.73 = -19.1 dBm
14.On the 8566A/B , press
MARKER, PEAK SEARCH, then MKR→REF LVL. Record the marker
amplitude in Table 3-8.
15.Move the marker to the displayed noise floor, or turn off the CW signal, and record the
marker amplitude in Table 3-8. (Some sources may have excessive wide band noise when
the RF signal is turned off, so that the noise floor must be measured with the s ignal l eft
on.)
NOTE Step 15 requires a signal source with a wide band phase noise characteristic
that is at least 6 dB better than the measured average noise leve l.
16.The Average Noise Level is calculated as follows:
Average Nois e Level = Cor rec ted Power Reading (step 13) - Marker Amplitude (step 14)
+ Marker Amplitude (step 15) - Measurement Bandwidth Correction Factor
11970K, A, Q and U Bandwidth Correction = 10log(l00kHz/ 1 kHz)
11970V and W Bandwidth Correction = 10log(3MHz/ 1 kHz)
For examp le:
Average Noise Level = (- 19.1 dBm) - (-32.3 dBm) + (-77.7 dBm) - 34.77 dB = - 99.3
dBm
17.Enter the calculated value in Table 3-8.
The Average Noise Level must be less than:
-110 dBm (for the 11970K)
-108 dBm (for the 11970A)
Chapter 3 71
Performance Tests
Page 72

Performance Tests
AVERAGE NOISE LEVEL TEST
-104 dBm (for the 11970Q)
-104 dBm (for the 11970U)
-92 dBm (for the 11970V)
-85 dBm (for the 11970W)
18.Enter the following push button commands on the 8566A/B:
MARKER, OFF
REFERENCE LEVEL
, 0, dBm
19.Repeat steps 9 through 17 at the following center fre quencies:
11970K: 22 and 26.5 GHz
11970A: 33 and 40 GHz
11970Q: 41 and 50 GHz
11970U: 50 and 60 GHz
11970V: 62 and 75 GHz
11970W: 92 and 110 GHz
20.Repeat steps 1 through 18 for a power level of 16.0 dBm at the 11970 Mixer LO
connector.
Table 3-8 Average Noise Test Record
AVERAGE NOISE LEVEL
Model Number______________ Date______________
Serial Number________________ Tested By______________
Center
Frequency
Power
Meter
Reading
Power
Meter
Correction
Factor
Directional
Coupler
Coupling
Factor
Corrected
Power
REading
Signal
Marker
Amplitude
Noise
Floor
Marker
Amplitude
Bandwidth
Correction
Factor
Average
Noise
Level
UnitsGHzdBmdBdBdBmdBmdBdBdBm
Step 10 12 13 13 13 14 15 16 16
LO
Power
= 14.5
LO
Power
= 16.0
Performance Tests
72 Chapter 3
Page 73

Service
4 Service
73
Page 74

Service
Maintenance
Service
Maintenance
The only maintenance required for the 11970 Series Mixers is preventive maintenance.
When you are not using your mixer, cover its waveguide input with its waveguide cap.
Also, though the 11970 Mixers can abso rb mor e punishment than is normal for such
devices, you should avoid subjecting them to unnecessary shock or vibration.
Repairs
The 11970 Mixers are NOT field-repairable. If your mixer fails, DO NOT try to repair it
yourself, you will void the warranty. Instead, notify the nearest Agilent office.
Replaceable Parts
For a list of replaceable parts and accessories, see Table 4-2.
Circuit Description
A schematic diagram of a 11970 Series Harmonic Mixer is shown in Figure 4-1. The mixer
circuit employs two diodes arranged as an anti-parallel pair. These diodes are the
termination for the open end of the w a vegu ide output . By employing a matc hed diod e pair,
even harmonic mixing is enhanced while odd harmonic mixing is suppressed.
The waveguide input is exponential ly tapered in both height and width. The height taper
provides impedance matching between the high impedance waveguide input and the low,
dynamic impedance of the diodes. The width taper creates a high-pass filter response
which isolates the LO harmonics from the standard-heig ht waveguide. Without this
isolation, the LO harmonics would reflect fr om the stand ard-height waveguide ba ck into
the mixer and destructively interfere with the desired mixing product.
LO harmonics are confined to the immediate vicinity of the diode pair by the low-pass
filter, which has as its first element a metal -insulator -semiconductor (MIS) capacitor.
This improves the out-of-band response . The diplexer separates the 3 - 6 GHz LO signal
from the 321.4 MHz IF signal.
74 Chapter 4
Page 75

Service
Maintenance
Figure 4-1 11970 Series Mixer Schematic Diagram
Service
Table 4-1
Model
11970K 4.4
11970A 5.0
11970Q 5.0
11970U 6.2
11970V 5.4
11970W 6.2
LPF Fco
(GHz)
Chapter 4 75
Page 76

Service
Maintenance
Table 4-2 Accessories and Replaceable Parts
Service
Part Number Description
5061-5460:
5061-5458
8710-0510
8710-1539
3030-0221 Socket Head Cap Screw, 4-40 thread, .375 inches long (flange
1390-0671 Socket Head Cap Screw, captive, 4-40 thread, .290 inches long
11970-40001 11970K Waveguide Cap
11970-40002 11970A Waveguide Cap
11970-40003 Waveguide Cap for 11970Q or 11970U
08486-40103 Waveguide Cap for 11970V or 11970W
Mixer Connector Kit (Option 009), includes the following three
items:
Cable, 1 meter long, SMA male connectors (3 required)
Wrench, 5/16-inch, open-end
Ball Driver, 3/32-inch
connecting screw for 11970K and 11970A)
(flange connecting screw for 11970Q, 11970U, 11970V or
11970W)
76 Chapter 4
Page 77

Service
Maintenance
Table 4-3 Agilent Technologies Sale s and Service Offices
UNITED STATES
Instrument Support Center
Agilent Technologies
(800) 403-0801
EUROPEAN FIELD OPERATIONS
Headquarters
Agilent Technologies S.A.
150, Route du Nant-d’Avril
1217 Meyrin 2/ Geneva
Switzerland
(41 22) 780.8111
Great Britain
Agilent Technologies Ltd.
Eskdale Road, Winn er sh
Triangle Wokingham, Berkshire
RG41 5DZ England
(44 118) 9696622
France
Agilent Technologies France
1 Avenue Du Canada
Zone D’Activite De
Courtaboeuf
F-91947 Les Ulis Cedex
France
(33 1) 69 82 60 60
Service
Germany
Agilent Technologies GmbH
Agilent Technologies Strasse
61352 Bad Homburg v.d.H
Germany
(49 6172) 16-0
Headquarters
Agilent Technologies
3495 Deer Creek Rd.
Palo Alto, CA 94304-1316
USA
(415) 857-5027
Japan
Agilent T echno logies Ja pan, Ltd.
Measurement Assi st anc e Center
9-1, Takakura-Cho, Hachioji-Shi,
Tokyo 192-8510, Japan
TEL (81) -426-56-7832
FAX (81) -426-56-7840
China
China Agilent Technologies
38 Bei San Huan X1 Road
Shuang Yu Shu
Hai Dian District
Beijing, China
(86 1) 256-6888
INTERCON FIELD OPERATIONS
Australia
Agilent T echnologie s Australia
Ltd.
31-41 Joseph St reet
Blackburn, Vict ori a 3130
(61 3) 895-2895
Singapore
Agilent Technologies
Singapore (Pte.) Ltd.
150 Beach Road
#29-00 Gateway West
Singapore 0718
(65) 291-9088
Canada
Agilent Technologies (Canada)
Ltd.
17500 South Service Road
Trans-Canada Highway
Kirkland, Quebec H9J 2X8
Canada
(514) 697-4232
Taiwan
Agilent Technologies Taiwan
8th Floor, H-P Building
337 Fu Hsing North Road
Taipei, Taiwan
(886 2) 712-0404
Chapter 4 77
Page 78

Service
Maintenance
Service
78 Chapter 4
 Loading...