

Page 1
Electronic Test System
Copyright © 2019, 3M. All rights reserved.
Page 2

Electronic Test System 2
Table of Contents
1 Preface ....................................................................................................... 6
1.1 General System Description ............................................................................ 6
1.1.1 Intended Use .................................................................................. 6
1.1.2 Compatibility ................................................................................... 7
1.1.3 Safety ............................................................................................. 8
1.1.4 Warranty ......................................................................................... 8
1.1.5 Service ........................................................................................... 8
1.1.6 Approvals ....................................................................................... 8
1.1.7 Disposal .......................................................................................... 9
1.2 Conditions for Sale .......................................................................................... 9
1.2.1 Disclaimer ....................................................................................... 9
1.2.2 Intellectual Property ........................................................................ 9
1.2.3 Distribution ..................................................................................... 9
1.2.4 No Copy, Disassembly and Decryption .......................................... 9
2 ETS Sensing Unit .................................................................................................... 10
2.1 General Description ....................................................................................... 10
2.2 Technical Data .............................................................................................. 11
2.3 Instructions for Use ....................................................................................... 12
2.3.1 Identification System .................................................................... 12
2.3.2 Operation ...................................................................................... 12
2.3.2.1 Bowie and Dick Mode .................................................. 12
2.3.2.2 Data Logger Mode ....................................................... 13
2.3.3 Results and Status ....................................................................... 14
2.3.3.1 Retrieval of Results and Status ................................... 14
3 ETS USB Data Reader ............................................................................................ 15
3.1 General Description ....................................................................................... 15
3.2 Technical Data .............................................................................................. 16
3.3 Installation ..................................................................................................... 16
4 ETS PC Software 4110............................................................................................ 17
4.1 General Description ....................................................................................... 17
4.2 Technical Data .............................................................................................. 17
4.3 Installation ..................................................................................................... 17
4.4 Starting the Software ..................................................................................... 17
4.5 Logging on..................................................................................................... 18
4.6 Configuration ................................................................................................. 18
5 LED Guides ..................................................................................................... 19
5.1 Appearance of Coloured LEDs ...................................................................... 19
5.2 Result ..................................................................................................... 20
5.3 Status ..................................................................................................... 21
5.4 Special ..................................................................................................... 22
5.5 ETS USB Data Reader .................................................................................. 23
Page 3

Electronic Test System 3
6 Graphical User Interface ........................................................................................ 24
6.1 Screen Layout ............................................................................................... 24
6.1.1 Customizing the Layout ................................................................ 24
6.1.1.1 Resizing Windows ....................................................... 25
6.1.1.2 Fixing and Auto Hiding Windows ................................. 25
6.1.1.3 Repositioning Windows ............................................... 26
6.1.1.4 Selecting Data Tabs .................................................... 27
6.2 Navigation ..................................................................................................... 28
6.2.1 Open and Close Sub Sections ..................................................... 28
6.2.2 Auto Hide Navigation .................................................................... 28
6.2.3 Selecting Functions from the Navigation Bar ................................ 28
6.3 Menu Bar ..................................................................................................... 29
6.4 Icon Bar ..................................................................................................... 29
6.5 View Data ..................................................................................................... 29
6.5.1 Graph ........................................................................................... 30
6.5.1.1 Modifying the graph ..................................................... 30
6.5.1.1.1 Showing and Hiding Data Records ....... 31
6.5.1.1.2 Showing and Hiding Curves .................. 31
6.5.1.1.3 Showing and Hiding the Legend ........... 32
6.5.1.1.4 Showing and Hiding Sterilization
Temperature Band ................................ 32
6.5.1.1.5 Showing and Hiding the Grid ................ 32
6.5.1.1.6 Zooming the Graph ............................... 32
6.5.1.1.7 Moving the Graph.................................. 34
6.5.2 Test Information ........................................................................... 34
6.5.3 Logbook ........................................................................................ 35
6.5.4 Evaluating Data ............................................................................ 35
6.5.5 Print .............................................................................................. 36
6.5.5.1 Printing Graph and Information .................................... 36
6.5.5.2 Printing the Graph only ................................................ 36
6.5.5.3 Printing the Logbook .................................................... 36
6.6 Status Bar ..................................................................................................... 37
7 Data Management ................................................................................................... 38
7.1 File System.................................................................................................... 38
7.2 IT consideration ............................................................................................. 38
7.2.1 Access Rights ............................................................................... 38
7.2.2 Shares on Servers ........................................................................ 38
7.3 Logbook ..................................................................................................... 39
7.3.1 Logbook File Location .................................................................. 39
7.3.2 Data Records ............................................................................... 39
7.3.3 Opening Data Records ................................................................ . 39
7.3.4 Sorting Columns ........................................................................... 40
7.3.5 Importing ETS Files to Data Records ........................................... 40
7.3.6 Setting a Filter for Specific Data Record Properties ..................... 41
7.3.7 Recovery and Synchronising of Data ........................................... 42
7.4 Saving the Graph .......................................................................................... 42
7.5 Copying the Graph ........................................................................................ 42
7.6 Saving Comments and Approvals ................................................................. 43
Page 4

Electronic Test System 4
7.7 Exporting ..................................................................................................... 43
7.7.1 Exporting the Table ...................................................................... 43
7.7.2 Exporting the Control Points ......................................................... 43
7.7.3 Exporting Data Records to Files ................................................... 43
7.7.4 Exporting the Summary ................................................................ 44
7.7.5 Exporting the Software Settings ................................................... 44
7.8 Data Transfer ................................................................................................ 45
7.8.1 Typical Procedure......................................................................... 45
7.8.2 Status of the System before, during and after Data Transfer ....... 46
7.8.3 Test Identification ......................................................................... 46
7.8.4 Trace ability, Authenticity and Data Integrity ................................ 48
8 Data Analysis ..................................................................................................... 49
8.1 Master Overlay (Tab "Master") ...................................................................... 49
8.1.1 Typical Procedure......................................................................... 49
8.1.2 Designating a Data Record as Master Record ............................. 49
8.2 Control Points (Tab "Control Points") ............................................................ 49
8.2.1 Condensed List with Control Points .............................................. 50
8.2.2 Control Points in Table ................................................................. 50
8.2.3 Differences between ETS and Sterilizer ................................ ....... 51
8.2.3.1 Setting a Filter for Control Point Recognition ............... 51
8.3 Table (Tab "Table") ....................................................................................... 51
8.3.1 Add or Remove Columns ............................................................. 51
8.4 EN 285 Leak Rate Test (Tab "Leake Rate") .................................................. 52
8.4.1 Definition of the Test..................................................................... 52
8.4.2 Typical Procedure......................................................................... 52
8.4.3 Leak Rate Test Pass and Fail Critera ........................................... 53
8.4.4 Changing the Leak Rate Test Criteria .......................................... 54
8.4.5 Storing the EN 285 Leak Rate Test .............................................. 54
8.5 Pressure Change Rate (Tab "Pressure Change") ......................................... 55
8.5.1 Definition of the Test..................................................................... 55
8.5.2 Typical Procedure......................................................................... 55
8.6 Dilution ..................................................................................................... 56
8.6.1 Overall Dilution Factor ................................................................ .. 56
8.6.2 Continuous Dilution Factor ........................................................... 57
8.7 Residual Air ..................................................................................................... 57
8.7.1 Residual Air as Single Value ........................................................ 57
8.7.2 Residual Air as Curve or Table ..................................................... 57
8.8 F0 Lethality .................................................................................................... 57
8.8.1 Formula ........................................................................................ 57
8.8.2 Change Temperature for Calculation............................................ 57
8.9 Sterilization (Tab Sterilization) ....................................................................... 58
8.9.1 Sterilization Temperature Band .................................................... 58
8.9.2 Sterilization Parameter Indication ................................................. 58
8.9.3 Evaluation Period ......................................................................... 58
8.9.3.1 Typical Procedure ........................................................ 59
8.9.4 Residual Air at Start of Sterilization .............................................. 60
8.10 Data Scanner ................................................................................................ 60
8.10.1 Selecting a Point of Interest .......................................................... 60
8.10.2 Showing / Hiding Data Scanner Information ................................. 60
8.11 Theoretical Temperature ............................................................................... 61
8.12 Vacuum Pump Efficiency .............................................................................. 61
8.13 Generating a Summary ................................................................................. 62
Page 5

Electronic Test System 5
9 Setting up the software .......................................................................................... 63
9.1 Installing the Software ................................................................................... 63
9.2 Configuring the Software ............................................................................... 63
9.2.1 First Time ..................................................................................... 63
9.2.2 Showing and Hiding Diagnostic Data ........................................... 64
9.2.3 Language ..................................................................................... 64
9.2.4 File Locations ............................................................................... 64
9.2.5 Internet ......................................................................................... 65
9.2.6 Locations ................................ ................................ ...................... 65
9.2.7 21 CFR part 11 ............................................................................. 65
9.2.8 Sterilizers ...................................................................................... 66
9.2.9 Preset Values ............................................................................... 66
9.2.10 Assigning an ETS Sensing Unit to a Sterilizer .............................. 67
9.2.11 Units ............................................................................................. 67
10 Operating Mode ..................................................................................................... 68
10.1 Bowie and Dick Mode .................................................................................... 68
10.2 Data Logger Mode ......................................................................................... 68
11 User Administration ............................................................................................... 69
11.1 Logon Password ............................................................................................ 69
11.2 Creating a New User Account ....................................................................... 69
11.3 Group Membership ........................................................................................ 70
11.4 Editing an Existing User Account .................................................................. 71
11.5 Deleting a User Account ................................................................................ 71
11.6 Password Expiry ............................................................................................ 72
11.7 Change Password ......................................................................................... 72
11.8 Logon Timout ................................................................................................ 72
11.9 Disabling / Enabling an Account .................................................................... 72
12 Electronic Signature - 21 CFR Part 11 .................................................................. 73
12.1 Adding Comments ......................................................................................... 73
12.2 Adding Approvals / Rejections....................................................................... 73
12.3 Audit Trail ..................................................................................................... 73
13 Index ..................................................................................................... 74
Remark: The term “ETS Sensing Unit” in this
document always includes ETS Sensing Unit 4108,
ETS Sensing Unit 4208 and ETS Sensing Unit 4308.
The term “ETS USB Data Reader” always includes
ETS Data Reader 4109 and ETS Data Reader 4309
Page 6

Electronic Test System 6
1 Preface
1.1 General System Description
The Electronic Test System (ETS) is an easy to use electronic test system that provides the
user with comprehensive objective information on the physical variables of a steam sterilizer.
In addition to providing an alternative to the Bowie and Dick test, a number of other important
functions and tests can be performed by the device.
Its performance is highly reproducible and equivalent in terms of the performance of a standard
Bowie and Dick test pack as described in EN 285 and EN ISO 11140-3. It is tested in
accordance with the methods described in EN ISO 11140-4.
It therefore satisfies the requirements for a daily steam penetration test as prescribed in EN ISO
17665-1.
An "Early Warning" indication is given to further qualify the pass result of a Bowie and Dick test
cycle.
A "Fail" result is indicated if there is sufficient residual air within the chamber to create a Bowie
and Dick test failure as described in EN 285. A "Fail" result will also be indicated if the
fundamental sterilization parameters defined in EN 285 and by the WHO (134°C / 3 min) are not
met.
The main component is the ETS Sensing Unit which functions as a stand-alone measurement
system, providing clear "Pass" or "Fail" results and, if applicable, the "Early Warning" indication.
The system can be further enhanced by using the optional ETS USB Data Reader. The ETS
USB Data Reader enables data transfer from the ETS Sensing Unit to a computer.
In combination with the optional ETS PC Software 4110, additional information on the sterilizer's
performance can be obtained, such as the Leak Rate Test (EN 285), Dilution factor, F
0
Integration and Sterilization Parameter Indication (according to EN 285 and WHO 134°C for 3
min). The software also offers diagnostic functions such as a cycle comparison. This important
function helps to identify process variations and supports finding causes of failure(s) and
recommendations for possible remedial action.
Additionally, the ETS PC Software 4110 provides a secure and easy to use digital archive in
which all relevant information is stored required for full trace ability.
_
Note: To facilitate the installation process for the entire system it is recommended to
install and start the ETS PC Software 4110 first. The installation (connection) of the
ETS USB Data Reader shall be the second step.
This procedure provides also the benefit of access to the full documentation
available in the on-line help of the software package. The ETS Sensing Unit
requires no installation.
1.1.1 Intended Use
The primary function of the ETS Sensing Unit is to monitor the air removal stage and the
sterilization phase of a steam sterilization cycle as required by EN ISO 17665-1.
The ETS Sensing Unit can be used as alternative to the Bowie and Dick test as described
in EN 285. Furthermore, data logged by the ETS Sensing Unit can be used for calculation
of a Leak Rate in accordance to EN 285.
The ETS Sensing Unit can also be set in Data Logging Mode for use in steam sterilization
cycles operating at temperatures other than 134°C for 3 minutes. When used in this
mode the software allows individual interpretation of sampled data. No Bowie and Dick
result will be available then.
Page 7

Electronic Test System 7
_The ETS Sensing Unit offers the following functions and features:
• Daily steam penetration test (Bowie and Dick test)
• Early Warning (as part of steam penetration test result)
• SPI (Sterilization Parameter Indication)
_
In combination with the ETS USB Data Reader and the ETS PC Software 4110:
_
All of the above plus:
• Complete trace ability information
• 21 CFR part 11 compliance
• Dilution factor / Residual air calculation
• Master Overlay evaluation
• Multiple test comparison
• Pressure control points detection
• Superheated steam detection (via theoretical temperature curve calculation)
• Sterilization period evaluation
• SPI evaluation
• F0 Integration
• Calibration check
• Data logging
• Leak Rate test
• Pressure change rate test
• Intelligent data handling, logbook, sorting and filtering
1.1.2 Compatibility
The Electronic Test System contains a number of technical upgrades. These upgrades
are implemented in the ETS Sensing Unit, the ETS USB Data Reader and the ETS PC
Software 4110 latest revision. All three components are fully compatible with each other.
ETS Sensing Unit
All ETS Sensing Units (4108 (old) / 4208 (current) / 4308 (new)) can be used in
combination with the ETS PC Software 4110 latest revision and ETS USB Data Reader
4109 / 4309.
Note: The user can keep using the ETS Sensing Units 4108 and 4208 until the 400
uses are reached.
ETS USB Data Reader
The ETS USB Data Reader is compatible with computers that have a free USB port and
operating system Microsoft Windows 10 and previous versions.
The ETS USB Data Reader is a Human Interface Device and requires no additional USB
driver installation. The required driver is available in Windows.
Page 8

Electronic Test System 8
ETS PC Software 4110
The ETS PC Software 4110 is compatible with operating system Microsoft Windows 10
and previous versions.
New or special operating systems must be tested and validated before.
Files from a previous ETS PC Software version:
All historical ETS files can be imported into the ETS PC Software 4110 data base.
New ETS data records generated with the new system can be exported to original ETS
files (*.ets).
1.1.3 Safety
The ETS Sensing Unit is only to be used according to the User Manual.
Only those parts which are listed and described in Section 2.3 Instructions for Use on
Page 12 shall be used.
Caution: After usage in a sterilizer cycle, the ETS Sensing Unit will be hot.
Protective gloves shall be worn when handling the ETS Sensing Unit.
After activation the switch will return to its start position. If for whatever reason, the switch
stays in the pulled position the ETS Sensing Unit should not be used.
The product was tested under EN 61010-1 and EN 50081-1.
After switching on, do not use compressed air etc. to e.g. dry the ETS Sensing Unit.
The ETS Sensing Unit shall only be used in the environment as described in the Section
2.2 Technical Data on Page 11.
1.1.4 Warranty
This product has a warranty of two years or 400 uses, whichever is earlier.
In case of a legitimate complaint, 3M's sole obligation as regards warranties shall be to
either replace the defective product or refund the purchase price.
1.1.5 Service
The ETS Sensing Unit does not require any dedicated or routine service, e.g. no battery
change. In case of any malfunction, please contact your local 3M representative.
1.1.6 Approvals
The product meets the basic requirements of the RoHS directive 2011/65/EU and is
therefore CE marked.
Page 9

Electronic Test System 9
1.1.7 Disposal
WEEE (Waste Electrical and Electronic Equipment) symbol
Do NOT dispose your products as unsorted municipal waste! The crossed-out wheeled
bin symbol indicates that all EEE (Electrical and Electronic Equipment), batteries and
accumulators must be disposed of according to local law by the use of available return
and collection systems.
By separating a marked item from household waste, you will help reduce the volume of
waste sent to incinerators or land-fill and minimize any potential negative impact on
human health and the environment.
Thank you for your assistance in complying with this regulation and contributing to
environmental stewardship. If you have further questions, please contact your local 3M
subsidiary or sales rep.
1.2 Conditions for Sale
1.2.1 Disclaimer
ETS PC Software 4110 Copyright © 2007, 3M Company. All Rights Reserved.
You shall carefully read the following terms and conditions before using this software.
Your use of this software indicates your acceptance of the limitations and disclaimers
detailed below.
ETS PC Software 4110 is supplied as is. 3M Company disclaims all warranties,
expressed or implied, including, without limitation, the warranties of merchantability and of
fitness for any purpose. 3M Company assumes no liability for damages, direct or
consequential, which may result from the use of ETS PC Software 4110.
Any liability of 3M Company will be limited exclusively to product replacement or refund of
the purchase price.
1.2.2 Intellectual Property
This program is owned by 3M Company and is protected by U.S. and international
copyright laws. Violation of copyright is an offense.
1.2.3 Distribution
The ETS PC Software 4110 shall not be distributed without the expressed prior written
permission of 3M Company.
1.2.4 No Copy, Disassembly and Decryption
You may not copy, disassemble, decompile or decrypt the software without the expressed
prior written permission of 3M Company.
Page 10
Electronic Test System 10
2 ETS Sensing Unit
2.1 General Description
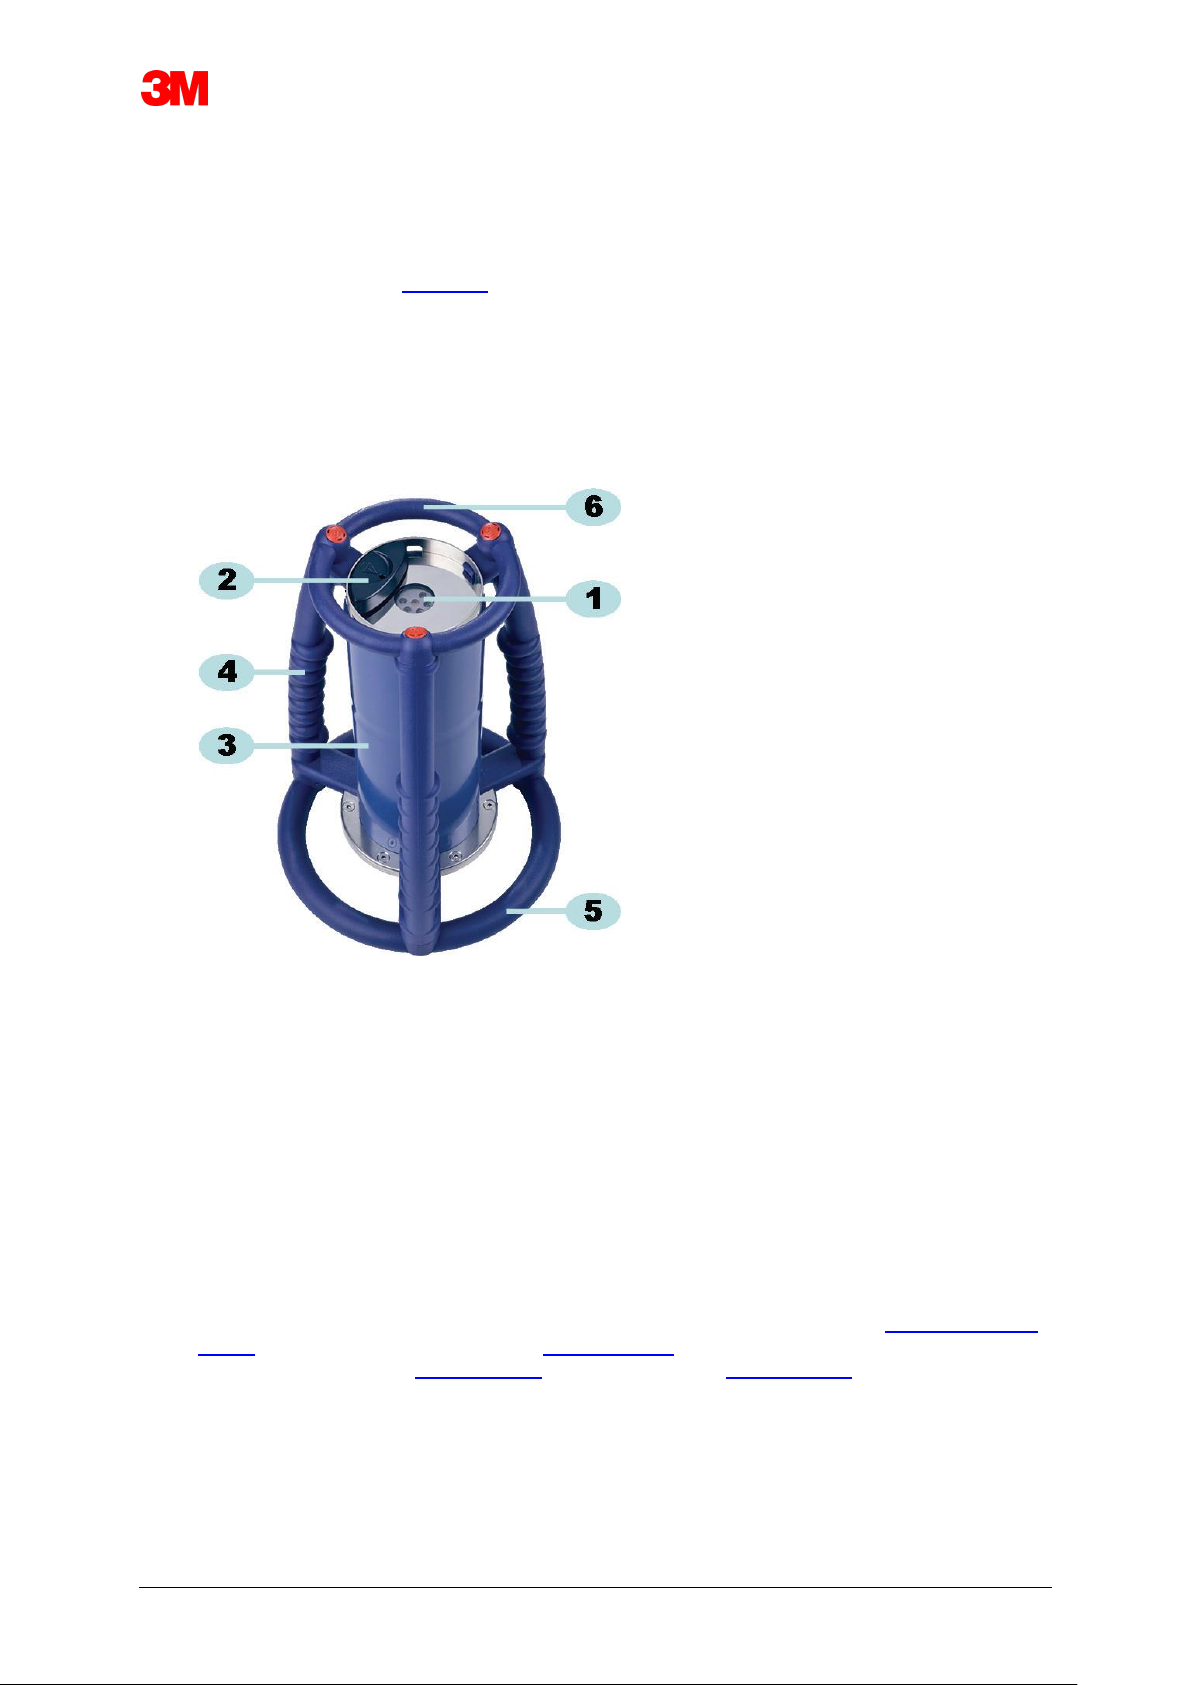
The ETS Sensing Unit (Figure 1) is a battery powered, stand-alone measurement system for the
physical parameters of a steam sterilizer. It can be used as an alternative to the Bowie and Dick
test. It consists of a data logger for time, temperature, pressure and air removal efficiency. It
contains embedded evaluation software which provides a simple "Pass / Fail" decision based on
the measured and recorded data.
The configuration has defined thermal characteristics in order to simulate the standard steam
penetration tests, described in EN 285, EN ISO 11140-3 and EN ISO 11140-4.
_
_
Figure 1: ETS Sensing Unit
1 – Data transfer LEDs (Light Emmiting Diodes)
2 – Switch
3 – Sensing Unit core
4 – Handle
5 – Bottom ring
6 – Top ring
_
The design of the ETS Sensing Unit consists of an outer handle arrangement (Figure 1 – # 4, 5
and 6) with the ETS Sensing Unit core (Figure 1 – #3) placed in the centre. On top of the ETS
Sensing Unit is a switch (Figure 1 - #2) and indicator LED's (Figure 1 - #1) are located. The
indicator LEDs provide result and status information. Data transfer is achieved via the
transmitter and receiver LEDs and the optional ETS USB Data Reader using infra-red
technology.
The ETS Sensing Unit is a reusable device capable of 400 test cycles. A LED code will indicate
when 20 test cycles remain. This allows the operator to re-order a new ETS Sensing Unit to
ensure uninterrupted usage.
Page 11

Electronic Test System 11
2.2 Technical Data
_
Dimensions:
Height: 268 mm
Diameter: 200 mm
Weight: ~2900 g
Life cycle: 400 test cycles
Power supply: build-in battery
_
Technical specification of pressure sensor:
Scale range: 0 mbar to 4000 mbar (0 kPa-400 kPa absolute)
Resolution: 1 mbar (100 Pa)
Accuracy: +/- 20 mbar / 0.5% (FS) @ 20°C
+/- 20 mbar /@ 121°C at 2.1 bar
-10/+ 30 mbar /@ 134°C at 3.1 bar
Accuracy includes temperature drift and long-term drift.
_
Technical specification of temperature sensors (3x Pt1000):
Scale range: 0°C to 150°C
Resolution: 0.01°C
Accuracy: +/- 0.2°C (at operating temperature)
Accuracy includes temperature drift and long-term drift.
_
Technical specification of time measurement (crystal oscillator):
Scale range: 1 second to 60 minutes
Resolution: 1 second
Accuracy: +/- 0.2% FSD (Full Scale Deflection) (at operating temperature)
Accuracy includes temperature drift and long-term drift.
_
Environmental operation limitations:
Temperature: Maximum 140°C for 60 minutes
Pressure: Maximum 4000 mbar
_
Environmental storage limitations:
Temperature: 0 - 50°C
Humidity: 20 - 80% RH
_
Note: The ETS Sensing Unit will only provide a Bowie and Dick test result when
the internal starting temperature is below 35°C. If the unit is stored above
35°C or when the unit is still hot due to a recently conducted test the unit has
to be cooled down below 35°C before use in the Bowie and Dick Test Mode.
Page 12
Electronic Test System 12
2.3 Instructions for Use
2.3.1 Identification System
You may want to dedicate an ETS Sensing Unit to a specific sterilizer. A tag can be
attached to one of the handle bars or the upper ring of the ETS Sensing Unit. The
adherance of labels to the silicon material of the ETS Sensing Unit may be poor. This
may cause loss of identification.
2.3.2 Operation
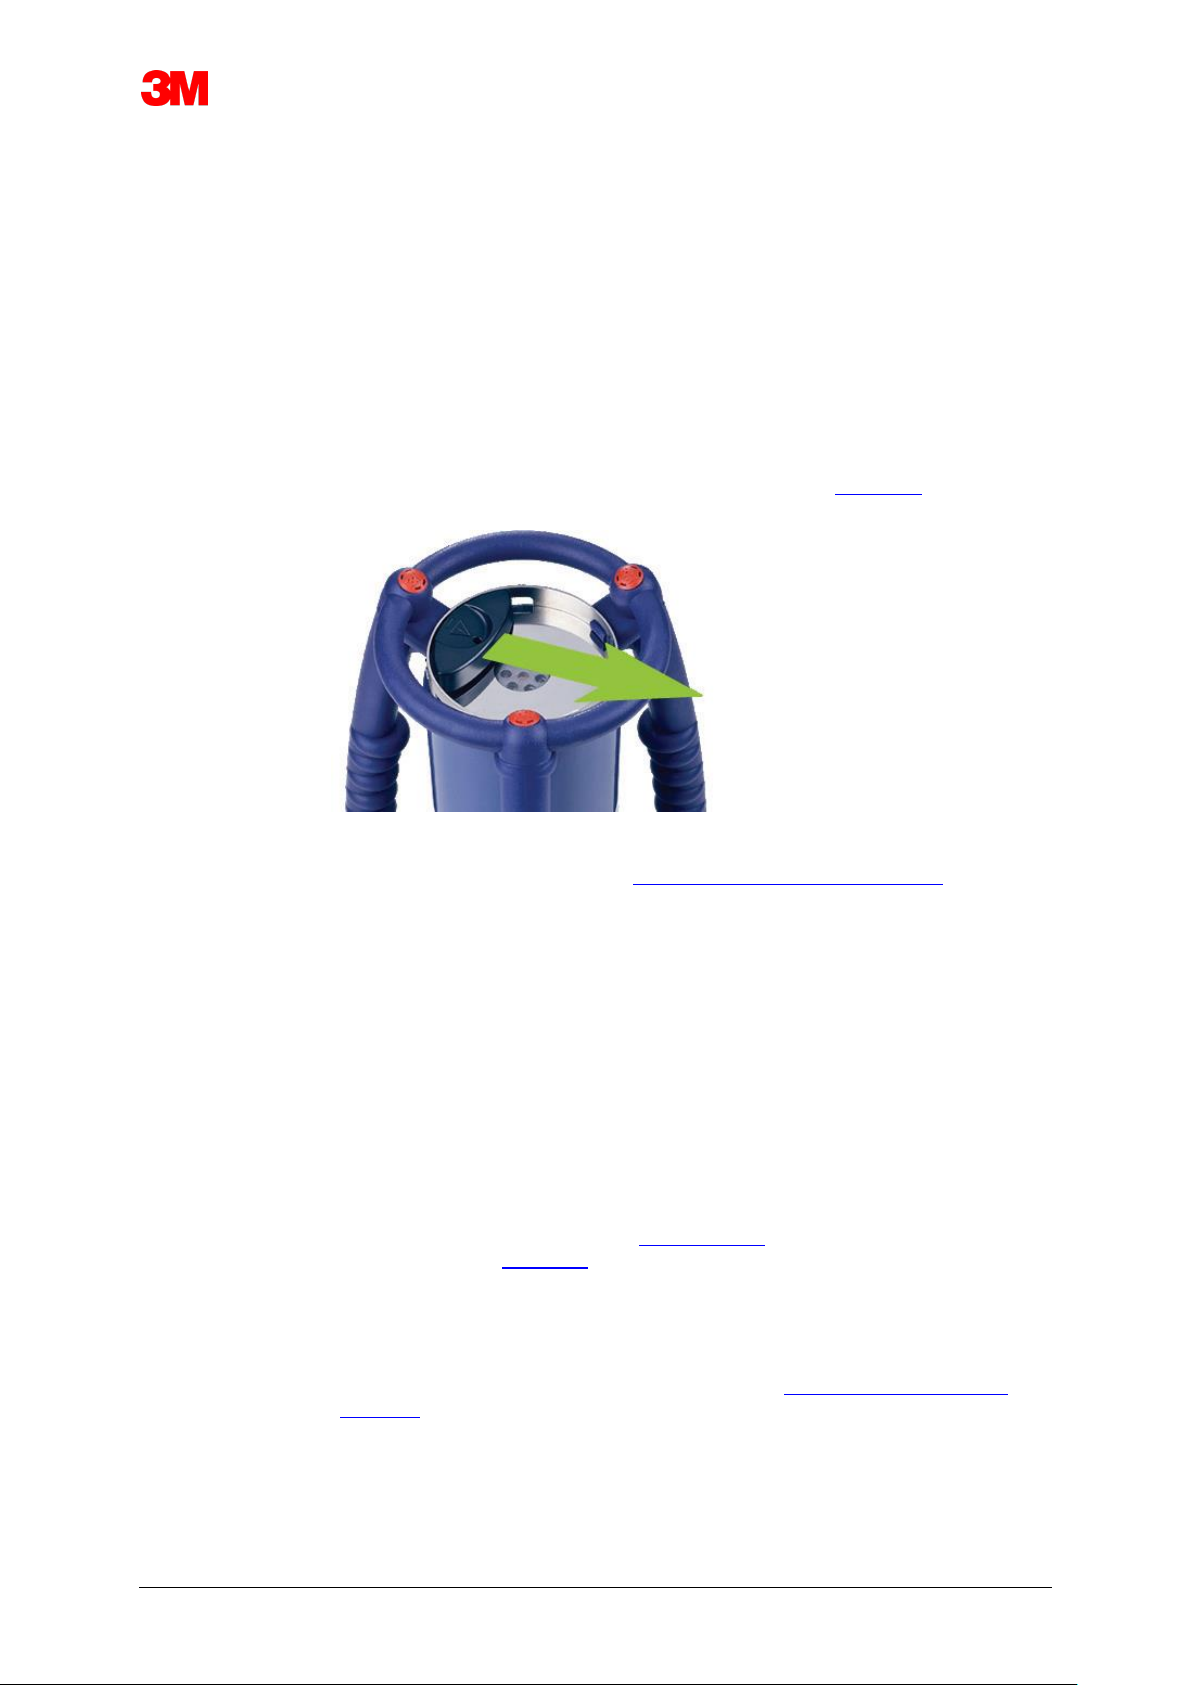
2.3.2.1 Bowie and Dick Test Mode
• The Bowie and Dick Test Mode is activated by pulling the switch on top of
the ETS Sensing Unit once in the indicated direction (Figure 2). Ensure that
the switch returns to its original position. The status of the unit is shown.
_Figure 2: Actuation of the ETS Sensing Unit switch
• _Check status before use. See Section 5 LED Guides on Page 19.
• When a single flashing yellow LED is shown place the ETS Sensing Unit in
the centre of the steam sterilizer at a height of about 10 cm above the base.
• Start the Bowie and Dick test cycle on your sterilizer. Ensure that the cycle
starts within 5 minutes after switching on the ETS Sensing Unit otherwise it
will switch off automatically to save energy.
• After the Bowie and Dick test cycle is completed remove the ETS Sensing
Unit from the sterilizer, holding it by the handles.
Caution: Wear protective gloves, as the ETS Sensing Unit will still be hot.
• Check the LEDs on top of the ETS Sensing Unit:
if a single yellow flashing LED (Figure 3 - #3) is seen, the unit is still logging.
Pull the switch (Figure 2) to stop the unit. All LED's shall be off. Wait 15
seconds for the unit to calculate the result and pull the switch once again to
see the result. If no LED is on or flashing after removal from the sterilizer,
pull the switch once. If no immediate result indication occurs, wait 15
seconds and pull switch again.
The result is shown and held for 30 seconds. See Section 5 LED Guides on
Page 19.
Page 13

Electronic Test System 13
Note: Allow the ETS Sensing Unit to cool down at room conditions for
at least 2 hours (preferably longer) before re-use in a Bowie and
Dick test cycle. The ETS Sensing Unit will indicate if the
temperature is low enough when the black switch is pulled. See
Section 5 LED Guides on Page 19.
2.3.2.2 Data Logger Mode
_
The following applications can only be enabled by using the ETS PC Software
4110.
_
This mode allows the ETS Sensing Unit to be used in the following applications:
• Leak Rate Test
• Testing steam sterilization cycles other than those operating at 134°C for 3
minutes or longer.
• A number of special functions.
_
Procedure:
• Set the ETS Sensing Unit in Data Logger Mode using the procedure
described in Section 10.2 Data Logger Mode on Page 68. Data logging will
continue for a maximum of 60 minutes.
_
Note: Do not activate the switch or put the ETS USB Data Reader on
top of the ETS Sensing Unit before you are sure data logging
shall be stopped.
_
• Check status before use. See Section 5 LED Guides on Page 19.
• Place the ETS Sensing Unit in the steam sterilizer chamber.
• Operate the cycle to be tested.
• Remove the ETS Sensing Unit from the sterilizer after completion of the
cycle.
Caution: Wear protective gloves, as the ETS Sensing Unit will still be hot.
_
• Activate the black switch to stop data logging (the ETS Sensing Unit will
automatically stop data logging after 60 minutes).
• Transfer data to the PC using the ETS USB Data Reader. See Section 7.8.1
Typical Procedure on Page 45.
_
Note: A Bowie and Dick test result is not available in the Data Logger
Mode.
Page 14
Electronic Test System 14
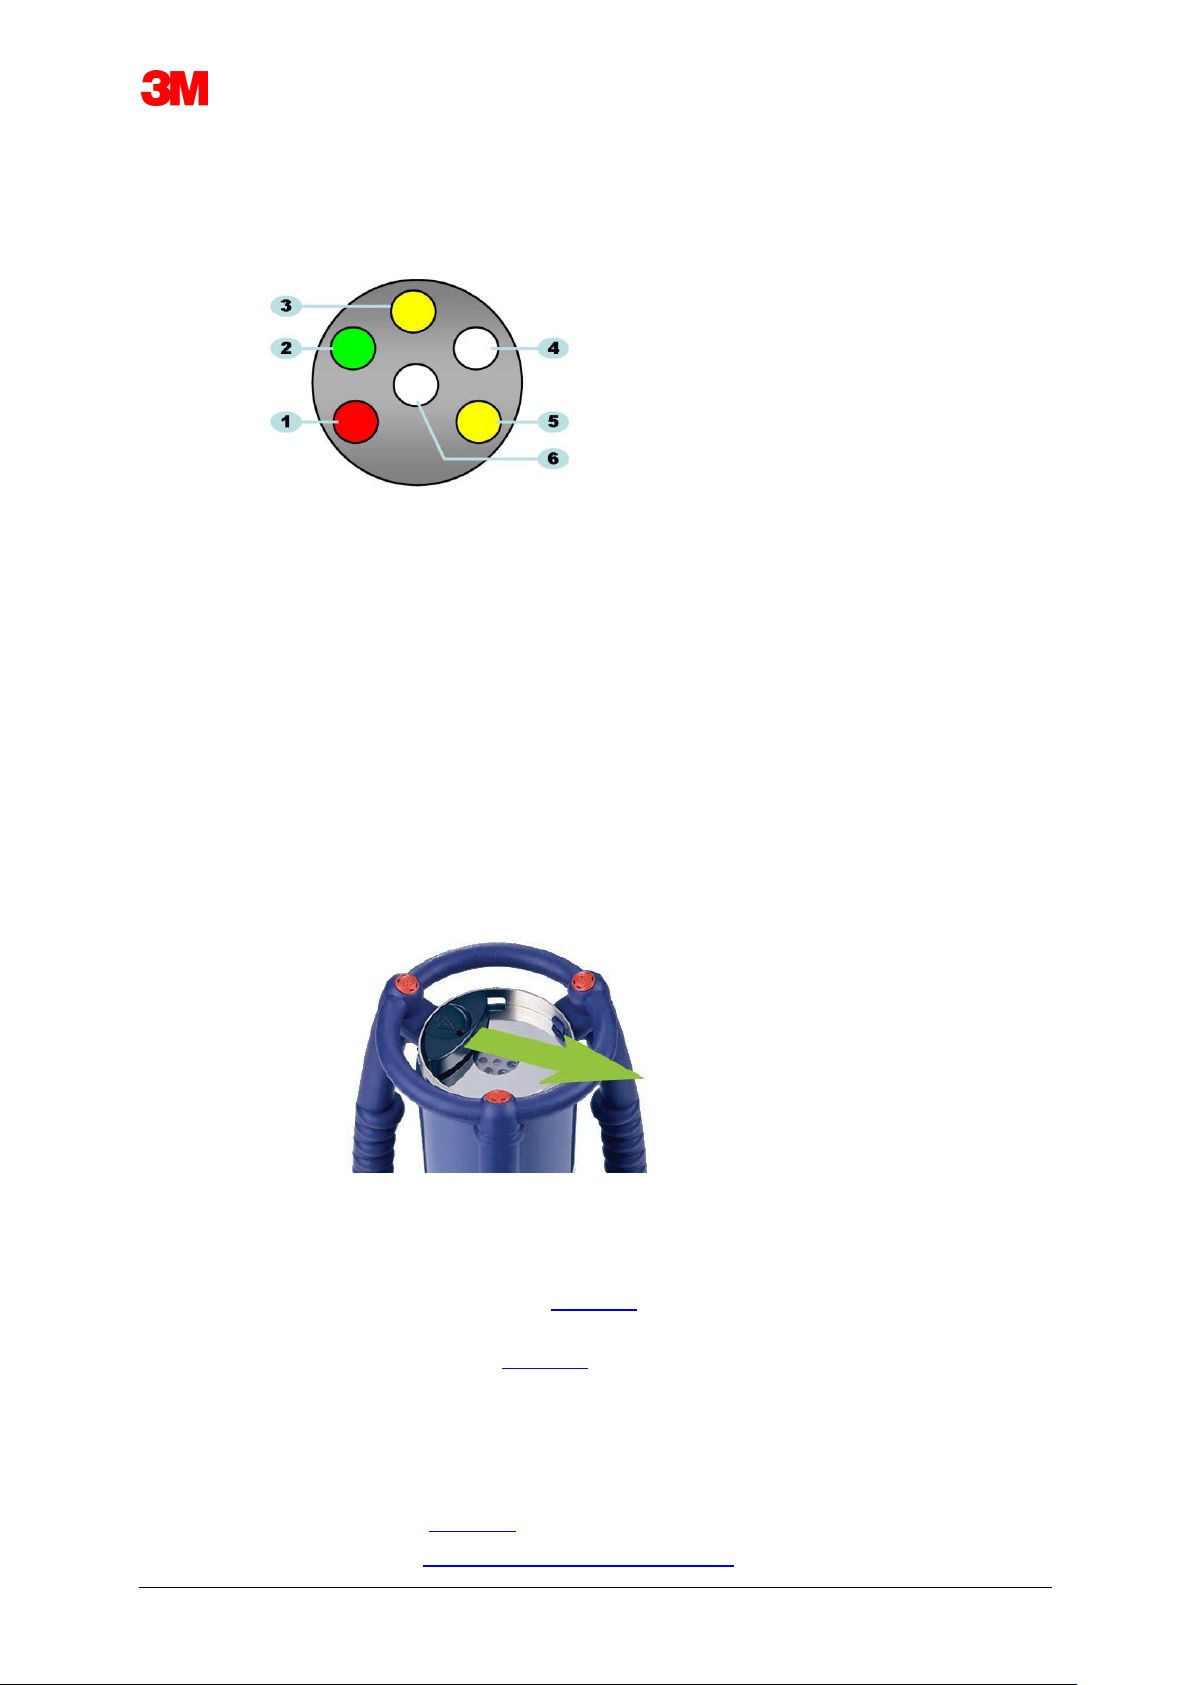
2.3.3 Results and Status
The result of a Bowie and Dick test and the status of the ETS Sensing Unit are indicated
by four coloured LEDs (Light Emitting Diods).
_
Figure 3: Light Emmiting Diods (LEDs)
1: Red LED
2: Green LED
3: Yellow 1 LED
4: Infrared receiver LED
5: Yellow 2 LED
6: Infrared transmitter LED
2.3.3.1 Retrieval of Results and Status
The ETS Sensing Unit will always contain the result of the latest test cycle. The
result only changes potentially when a new test cycle is performed.
_Figure 4: Actuation of the ETS Sensing Unit switch
To retrieve the test result and status:
• Pull the switch once (Figure 4) for result read-out after a Bowie and Dick test
cycle. The result will be indicated for 30 seconds maximum.
• Pull the switch (Figure 4) once more for status read-out. The status will be
indicated for 10 seconds maximum. Status indication can be read-out any
time during or after result indication.
• The status indication is shown every time the switch is pulled once towards
the centre of the top plate.
• The previous result indication can be recalled at any time by pulling the
switch (Figure 4) three times within three seconds.
See also Section 5 LED Guides on Page 19.
Page 15

Electronic Test System 15
3 ETS USB Data Reader
3.1 General Description
The ETS USB Data Reader enables data transfer from the ETS Sensing Unit to a computer. It
consists of a reader and a special (RJ12) / Standard (A-B) USB cable (Figure 5a and 5b).
_
_ Figure 5a: Special USB Cable for 4109 Figure 5b:
Standard USB Cable for 4309
_
The ETS USB Data Reader is designed to fit exactly into the top ring of the ETS Sensing Unit.
This ensures good alignment of the infrared transmitter and receiver LEDs.
The data set logged by the ETS Sensing Unit is transferred by the ETS USB Data Reader to the
computer using infrared technology.
Note: The ETS USB Data Reader contains a magnet. Do not place disks or other
magnetic storage media on or near the ETS USB Data Reader. Stored data
may become corrupted.
Also keep the ETS USB Data Reader away from the computer display since
it may have a distorting effect.
Figure 6a: ETS USB Data Reader 4109 Figure 6b: ETS USB Data Reader 4309
_
1: LED 1
2: LED 2
3: Switch to start data transfer
4: Special (RJ12) USB cable (4109) / Standard (A-B) USB cable (4309)
The two LEDs on the ETS USB Data Reader indicate its status:
• LED 1 shows the status of the connection to the PC.
• LED 2 shows the status of connection to the ETS Sensing Unit.
Page 16

Electronic Test System 16
To perform data transfer, the ETS PC Software 4110 is required. This software package controls
the data communication between the ETS Sensing Unit, ETS USB Data Reader and the
computer.
3.2 Technical Data
_
Dimensions Reader:
Height: 55 mm
Diameter: 93 mm
_
USB Cable:
Length: 1,8 - 2.0 m
_
Environmental conditions:
Temperature: 0 - 50°C
Humidity: 20 - 80% RH
3.3 Installation
_
The ETS USB Data Reader is a HID (Human Interface Device) type. Therefore, it requires no
installation of a specific USB driver on the Microsoft™ Windows™ operating system. Other
typical HID devices are a computer keyboard, computer mouse and display devices.
_
Note: As soon as the ETS USB Data Reader is connected to the computer text balloons
will appear in the windows taskbar indicating that new hardware has been found.
This happens only when a connection is made on a USB port which has not been
used before to connect the ETS USB Data Reader. These balloons will
automatically disappear. Alternatively, the balloons can be closed by clicking the
cross in the upper right corner.
Either way the USB driver installation is handled completely by windows and
requires no user interaction.
_
Procedure:
• Connect the special connector (RJ12) or the Standard (A-B) USB-plug of the supplied cable
to the ETS USB Data Reader. When the connector snaps into place it is propperly
connected.
• Locate a free USB port on the computer and plug-in the other side of the supplied cable.
• For the first installation on a selected USB port of the computer, MS Windows will
automatically install the standard HID USB driver for the ETS USB Data Reader.
User interaction is not required.
• Check the status of the LED. See Section 5.5 ETS USB Data Reader on Page 23.
• Verify if the LED indication matches the connection status of your system.
• Data transfer is only possible when the ETS PC Software 4110 is running.
• When LED 1 is GREEN and LED 2 is RED the ETS USB Data Reader is ready to be used.
For a complete overview of the ETS USB Data Reader LED indications and their significance
see Section 5.5 ETS USB Data Reader on Page 23.
Page 17

Electronic Test System 17
4 ETS PC Software 4110
4.1 General Description
The ETS PC Software 4110 package enables data transfer from the ETS Sensing Unit via ETS
USB Data Reader to your computer. The stored data provides the possibility for further analysis,
graphical representation and structured digital archiving of data on your computer or server.
4.2 Technical Data
Minimum system requirements
Operating System: Windows
RAM: 512Mb
Required Hard Disk Space: 50Mb
CD ROM drive: 6 speed
Screen Resolution: 1024 x 768, 65536 colours (16 Bit)
USB Interface: USB 1.1, 2.0, 3.0
_
The typical file size per test is 33 Kilobyte. (exported file).
4.3 Installation
_
The PC Software is provided on a CD (compact disc). It contains an automated installation
program. If your computer is setup to automatically play the CD the installation program starts
automatically. If not locate the setup file (setup.exe) in the root directory of the CD and run it.
The installation requires a minimum of user interaction. The installation program guides you
through the steps necessary for a successful installation of the software. See Section 9.1
Installing the Software on Page 63.
_
Note: The users of the software need appropriate access rights to run the software and to
save, open and add information to data records. You may wish to consult your IT
department to assure alignment with your local IT policy.
4.4 Starting the Software
_
To start the software:
• Click the desktop Application Icon for ETS PC Software 4110.
• Click Start - All Programs - Application line for ETS PC Software 4110.
Page 18

Electronic Test System 18
4.5 Logging on
_
As soon as the software has started the Logon window opens:
_
1 - First time logon
A default administrator is available in the software
To start using the software:
• Enter Admin in the User Name field.
• Enter Admin as Password.
• Click OK to confirm.
_
A second logon window opens that requests to a change the password. See Section 11.7
Change Password on Page 72.
_
Note: The administrator shall now complete the configuration described in Section 9.2
Configuration the Software on Page 63.
_
To provide access to the software for other administrators and / or users the administrator shall
add the required accounts in the User Administration tool. See Section 11.2 Creating a New
User Account on Page 69.
_
2 - First time Logon for users and additional administrators
To start using the software:
• Enter your User Name. (provided by administrator).
• Enter your preliminary Password. (provided by administrator).
• Click OK to confirm.
_
A second logon window opens in which requests to a change the password. See Section 11.7
Change Password on Page 72.
_
3 - Normal Logon
• Enter your User Name.
• Enter your Password.
• Click OK to confirm.
4.6 Configuration
_
See Section 9.2 Configuring the Software on Page 63.
Page 19
Electronic Test System 19
5 LED Guides
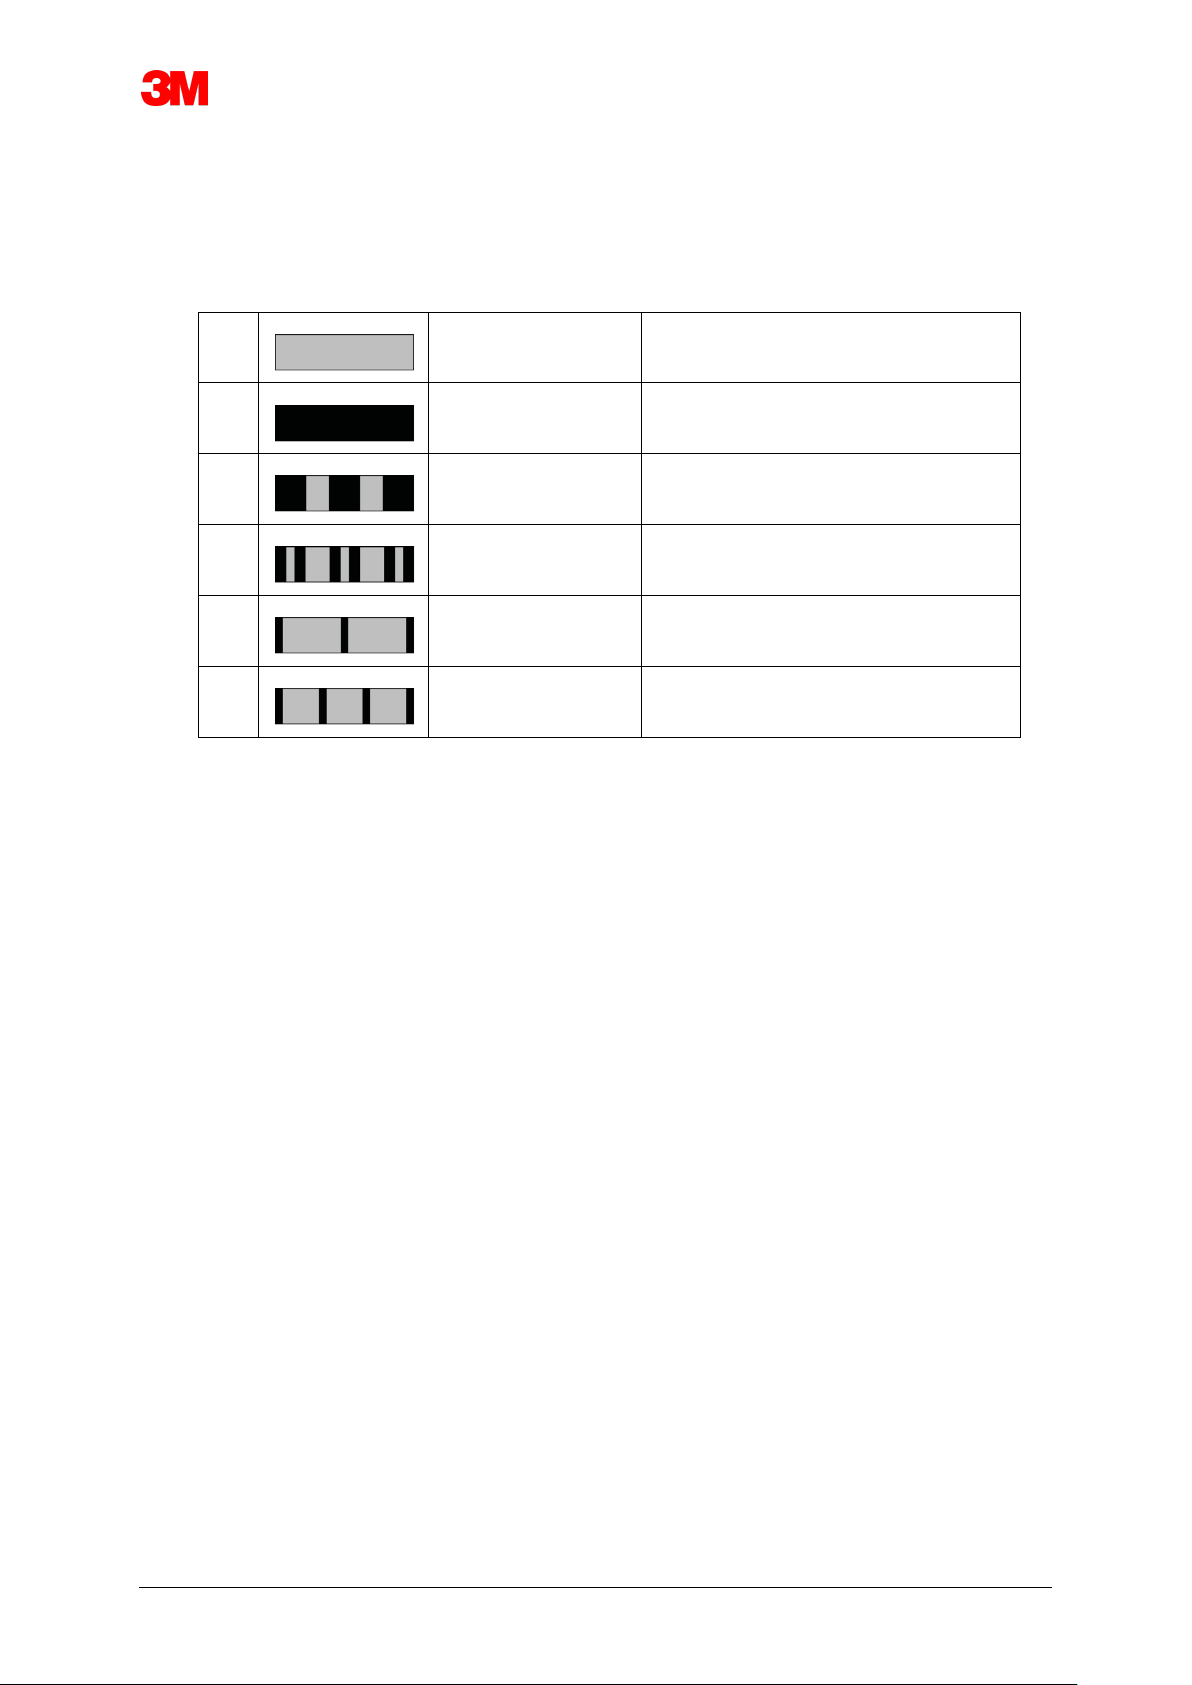
5.1 Appearance of Coloured LEDs
ETS Sensing Unit - Appearance of the Coloured LEDs
A
Off
No illumination
B
On
Continuous illumination
C
Flash
Intermittent illumination
D
Double flash
Intermittent illumination, two flashes in
quick succession
E
Small flash (slow)
Intermittent illumination, but dimmed
(1 flash per second)
F
Small flash (fast)
Intermittent illumination, but dimmed
(3 flashes per 2 seconds)
Page 20
Electronic Test System 20
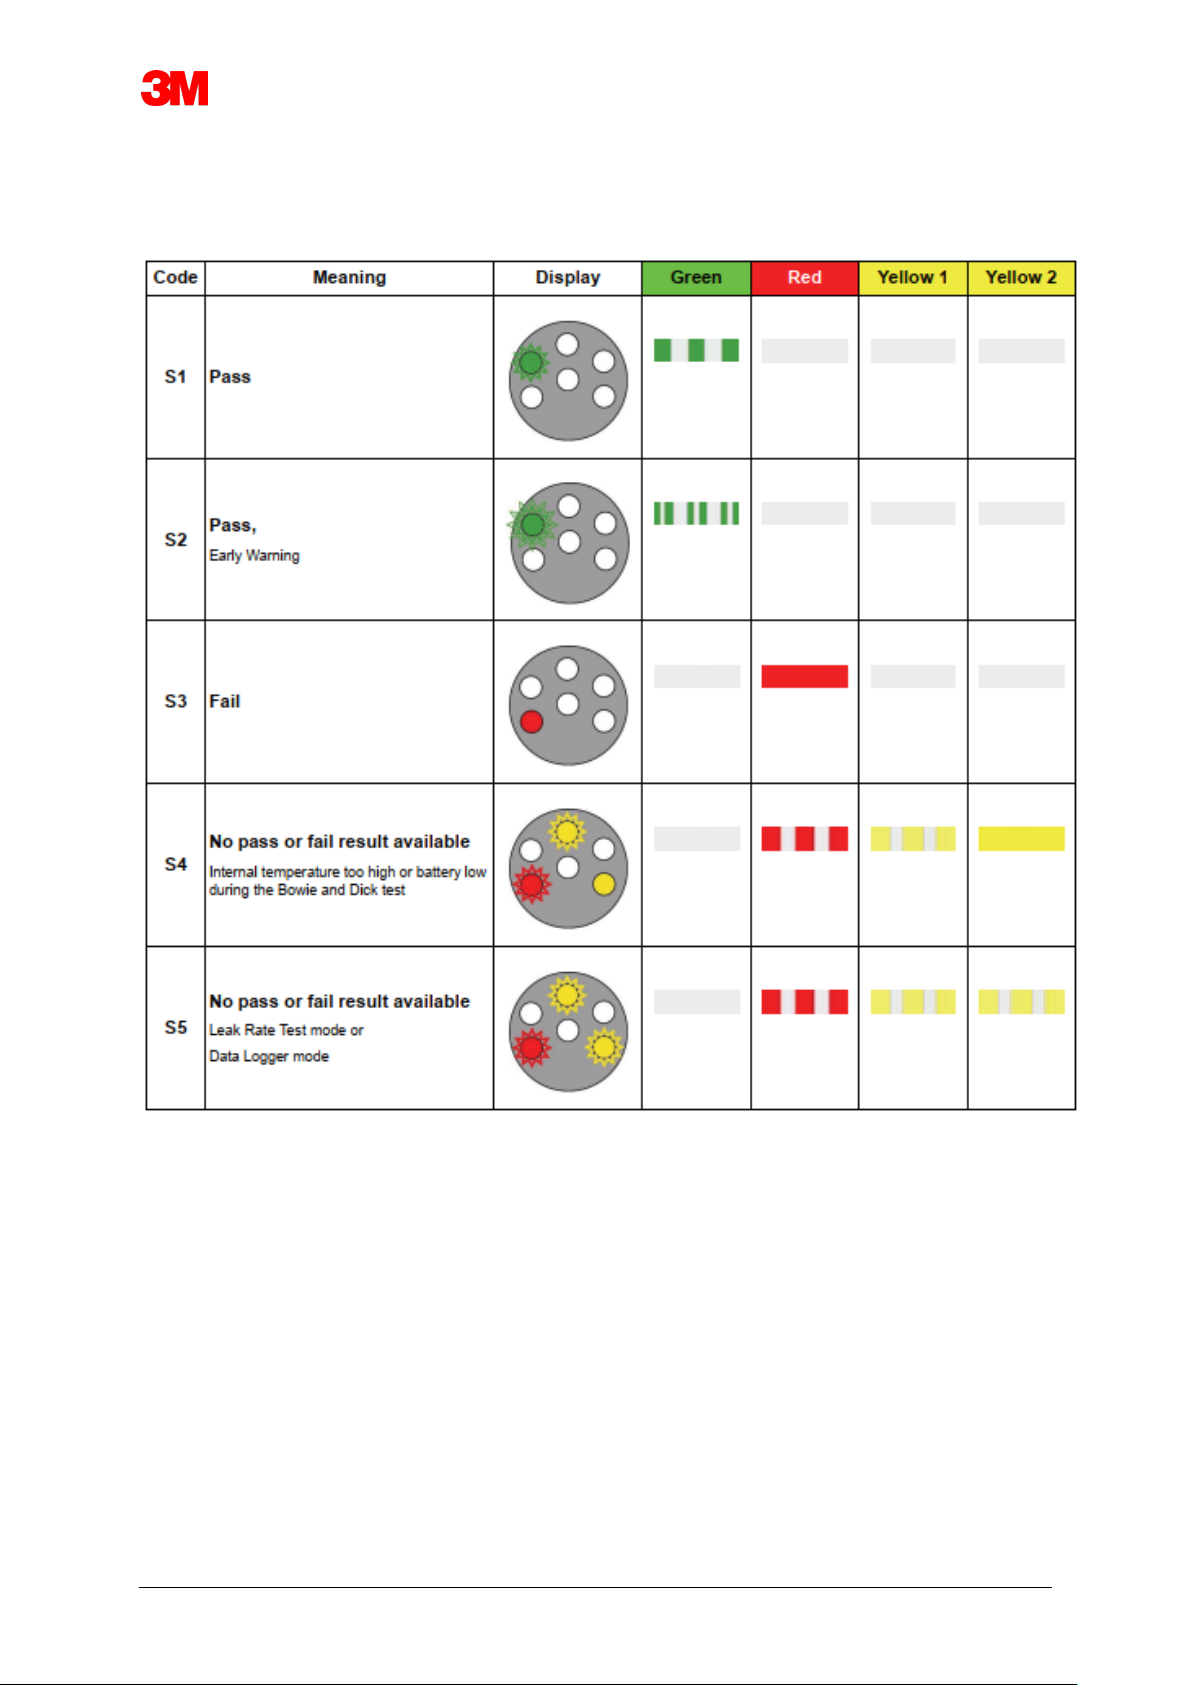
5.2 Result
ETS Sensing Unit - Result (30 seconds visible)
Page 21
Electronic Test System 21
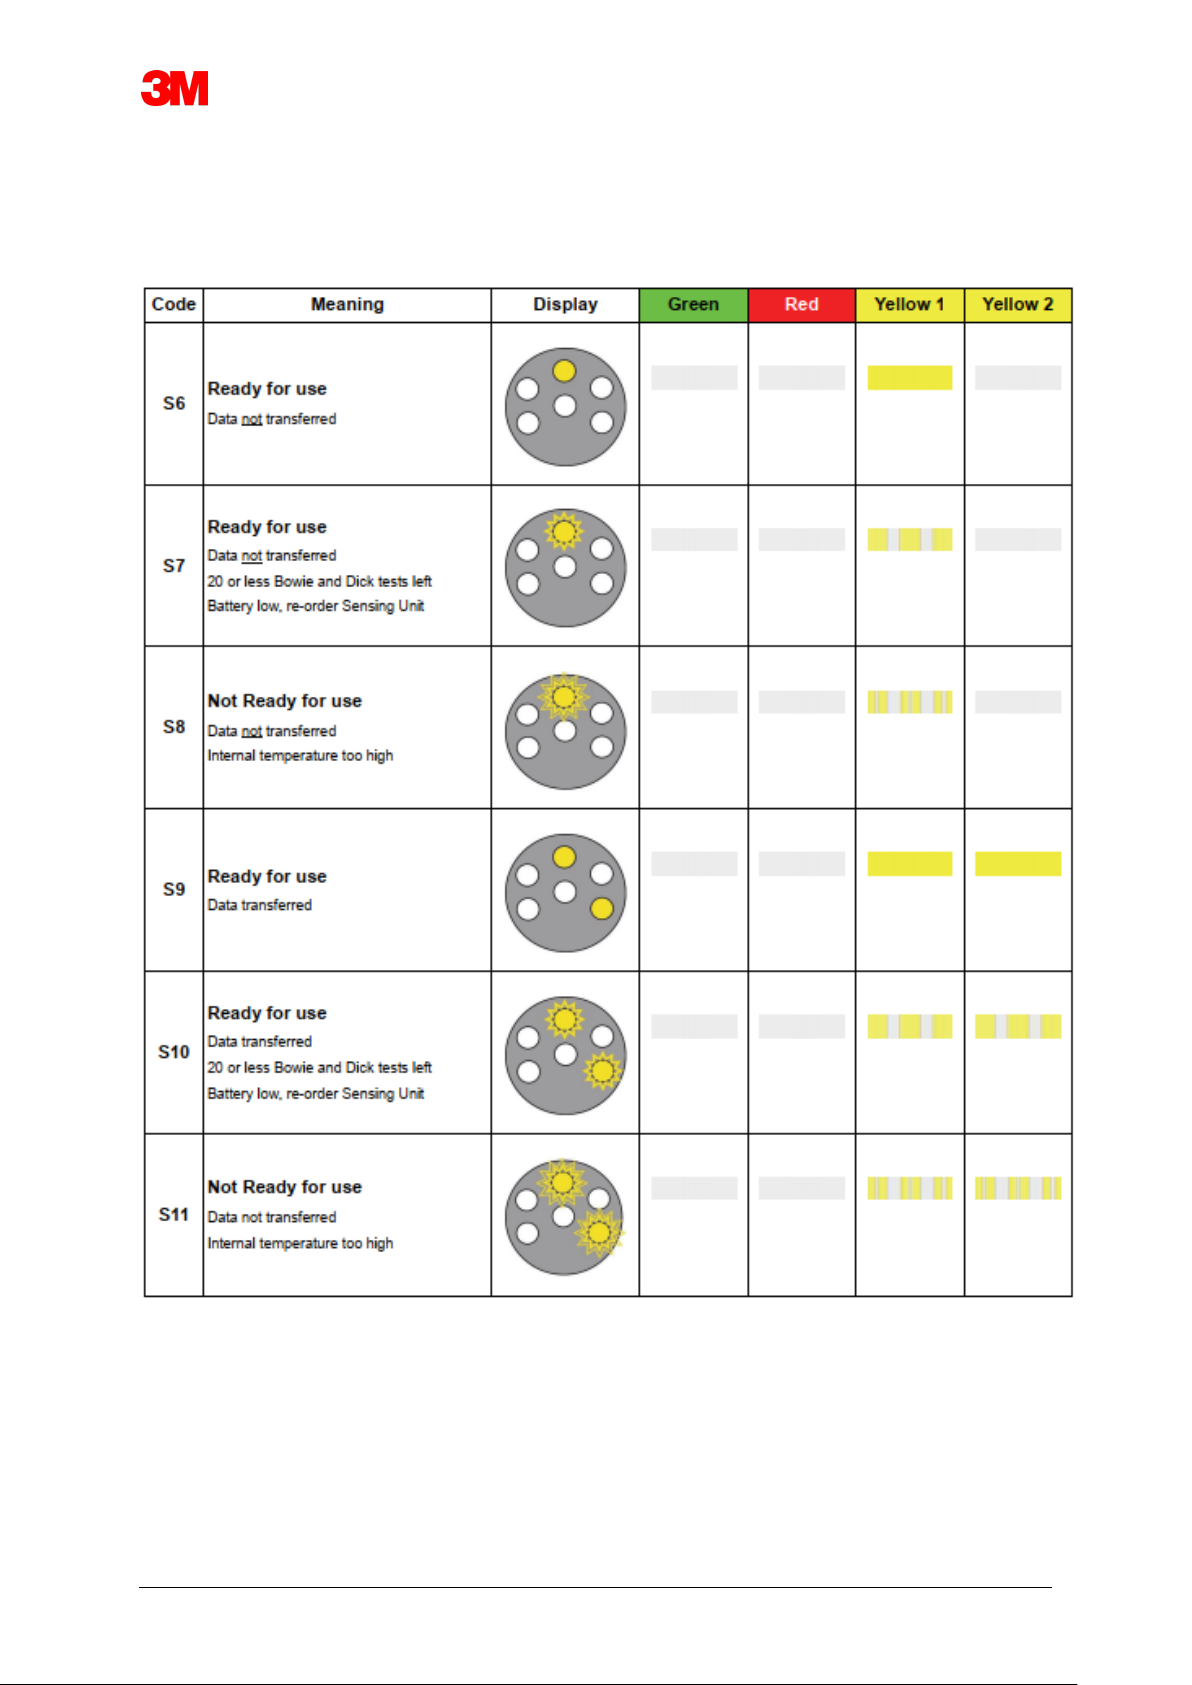
5.3 Status
ETS Sensing Unit - Status (10 seconds visible)
Page 22
Electronic Test System 22
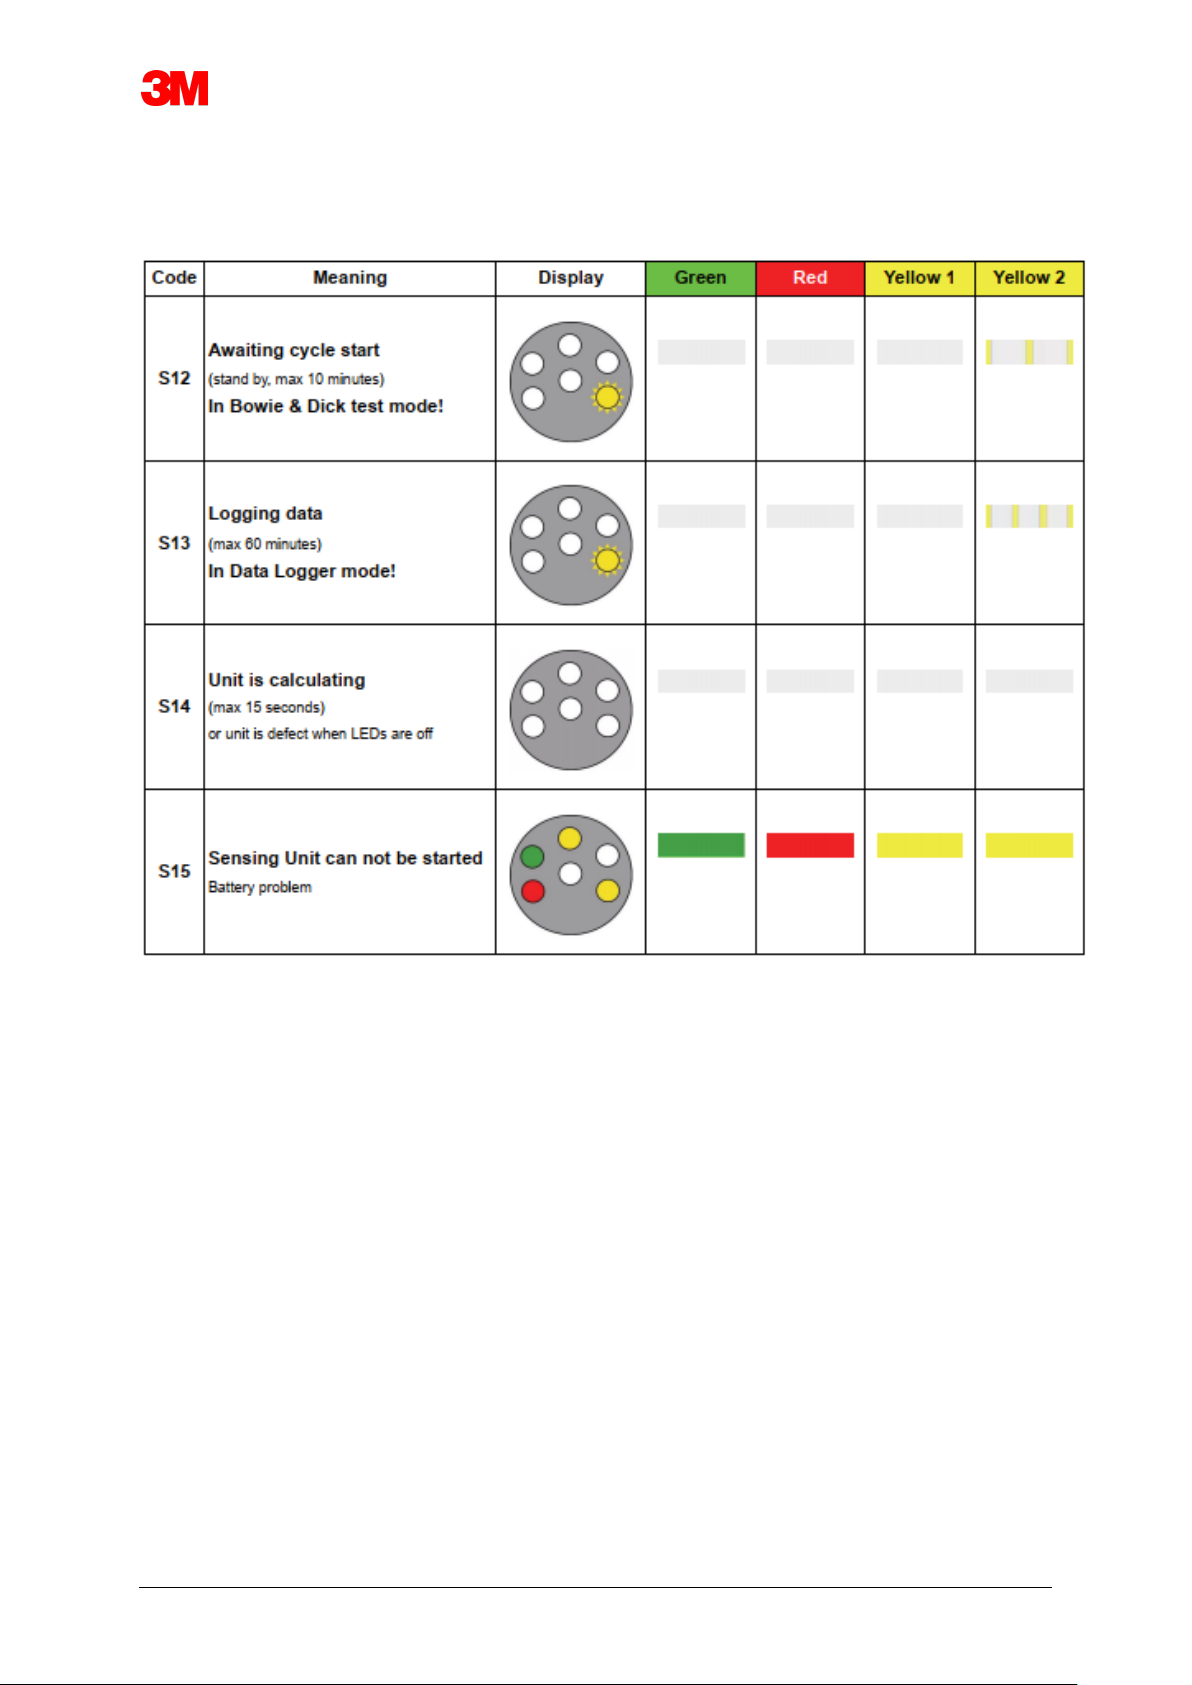
5.4 Special
ETS Sensing Unit – Special
Page 23
Electronic Test System 23
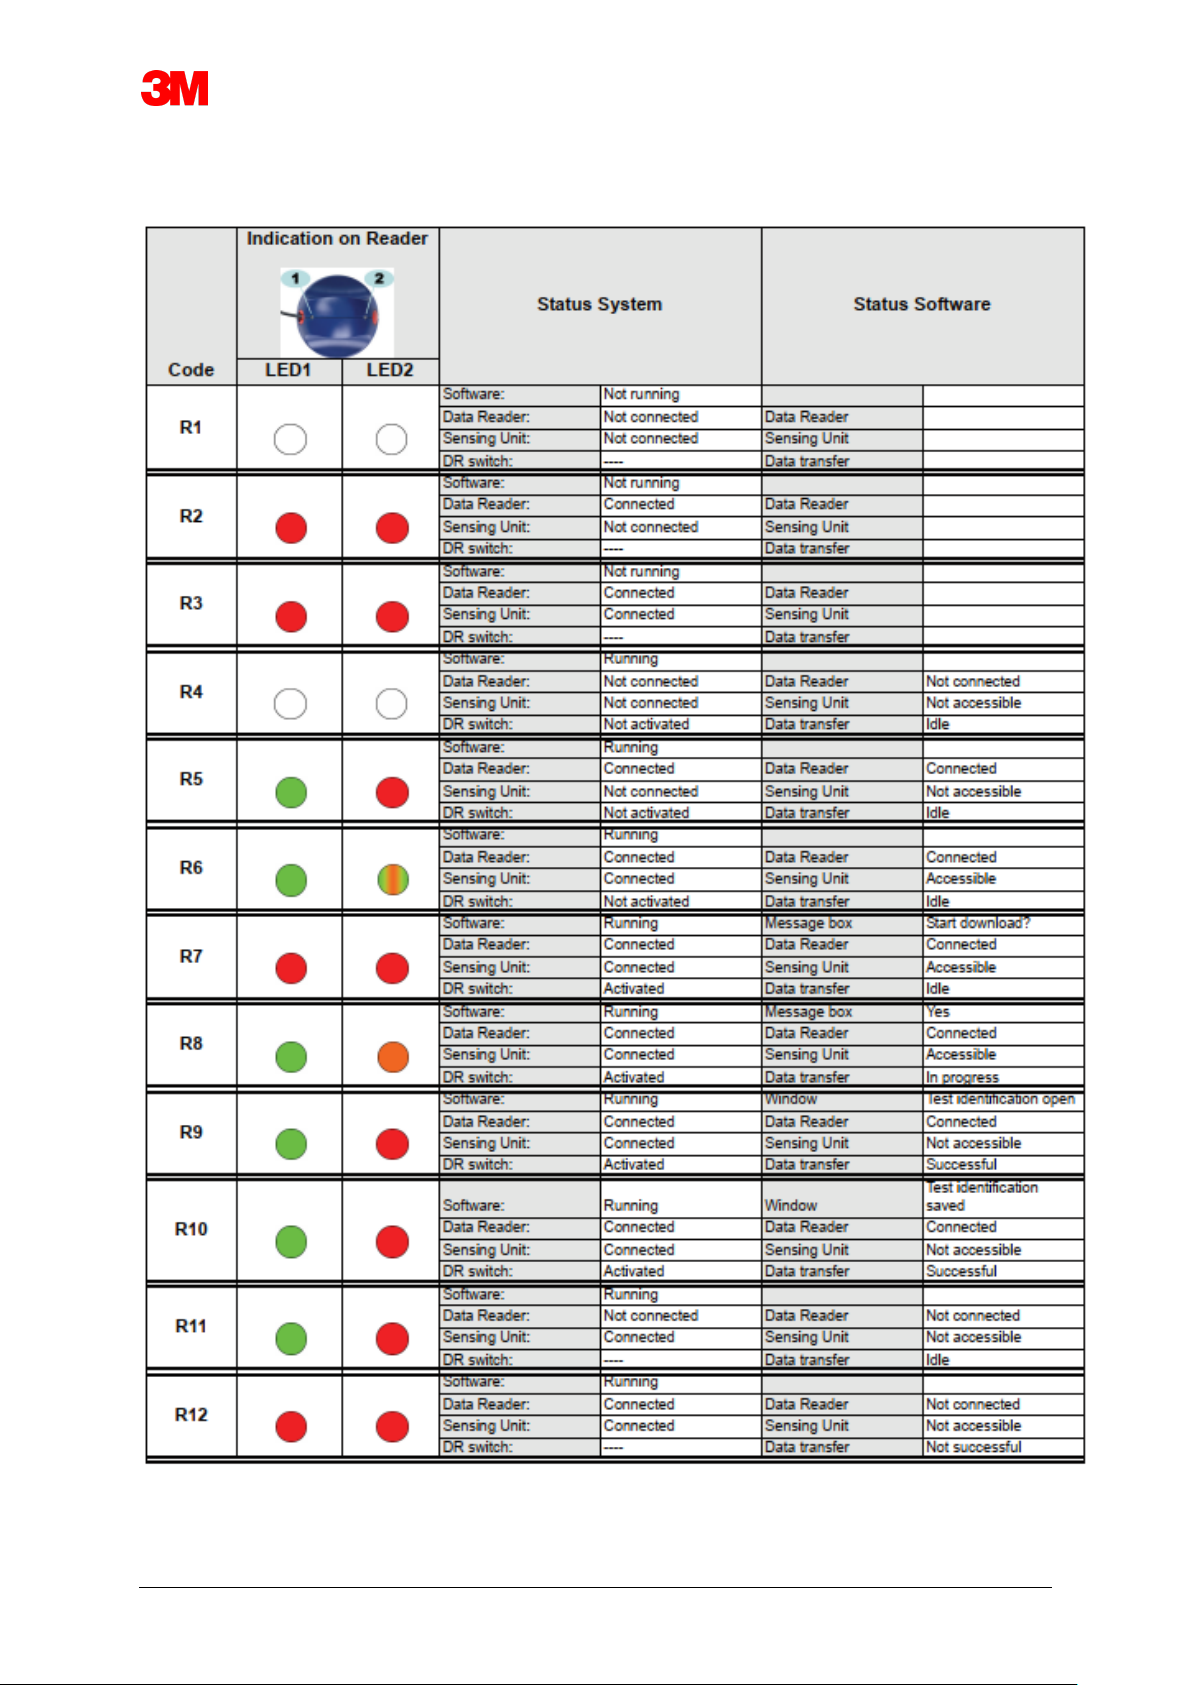
5.5 ETS USB Data Reader
Page 24

Electronic Test System 24
6 Graphical User Interface
6.1 Screen Layout
After a successful logon the software displays the MAIN SCREEN. Within the main screen all
windows providing information are available. The main screenprovides a Navigation, a Main, a
File, a Data and a Status bar window. You can hide or show all windows except the main
window and the status bar. See Section 6.1.1 Customizing the Layout on Page 24.
Screen layout:
1: Main Screen
2: Menu Bar
3: Icon Bar
4: Icon Bar (Graph)
5: Main Window
6: File Window
7: Data Window
8: Status Bar
9: Navigation
6.1.1 Customizing the Layout
When the software is started the default layout appears. Each user can change the
layout. However, the changes will only be active for the duration of the session. Once a
new user logs on the default layout is restored.
Page 25

Electronic Test System 25
6.1.1.1 Resizing Windows
_
To resize a window:
_
• Position the cursor on the border of the window you want to resize
• If this or this figure appears hold down the left mouse key and drag
it in the direction you want the window to resize.
• Release the left mouse key
Note: All windows will always be completely visible. When a window is
re-sized the adjacent window is automatically adapted.
Overlappig the windows is not possible.
6.1.1.2 Fixing and Auto Hiding Windows
_
In the upper right corner of the Navigation, File information and Data window a
push- pin is visible.
When you click on the push-pin its orientation changes.
: means that the window is fixed in position (Fixed mode). The window is
alway visible regardless of where the cursor is located.
: means that the window disappears as soon as the cursor is moved off of
the window (Auto hide mode). You can make the window reappear by
positioning the cursor over its tab.
The Files and the Data tabs are located at the bottom left corner of the main
screen.
The Navigation tab is located at the upper left corner of the main screen.
Page 26

Electronic Test System 26
6.1.1.3 Repositioning Windows
_
To reposition the windows:
• Position the cursor on the title bar of the window.
• Hold down the left mouse key. The cursor changes to .
• Drag the cursor into the other window.
• Position the cursor on one of the five areas:
1: The source window is positioned above the target window.
2: The source window is positioned right from the target window.
3: The source window is positioned below the target window.
4: The source window is positioned left from the target window.
5: The source window is positioned on top of the target window.
_
• A transparent dark blue area indicates where the dragged window will be
positioned.
• Release the left mouse key.
When windows are positioned on top of each other in fixed mode you can
show them again by clicking the relevant tab at the lower left corner of the main
screen.
When windows are positioned on top of each other in auto hide mode you can
show them again by moving the cursor over the relevant tab at the lower left
corner of the main screen.
See Section 6.1.1.2 Fixing and Auto Hiding Windows on Page 25.
• To restore the windows next to each other you shall drag the TAB (Files or
Data) and drop it onto 6 or 7.
6: The source window is positioned above the target window.
7: The source window is positioned below the target window.
_
• Now perform the steps described at the top of this paragraph.
Page 27

Electronic Test System 27
6.1.1.4 Selecting Data Tabs
_
In the Data window you can select from a number of data information views.
The active window is indicated by an orange background.
To select a different tab:
• Move the cursor onto the desired tab. The background colour changes to
light orange.
• Click the left mouse key once to confirm your choice.
In case the Data Window is not wide enough to display all tabs, a scroll bar will
automatically appear. By clicking the triangle at the right lower corner of the
window you can navigate to the tab you desire.
Page 28

Electronic Test System 28
6.2 Navigation
The Navigation window provide access to all available sections of the software. The Menu bar
and Icon bar provide only a "most used" selection.
6.2.1 Open and Close Sub Sections
_
Sub sections can individually be opened and closed by clicking once in the title area of a
section.
A double chevron pointing downward indicates that the section can be opened.
• A single click on the double chevron opens or closes the individual sections.
All sections opened All sections closed
6.2.2 Auto Hide Navigation
_
See Section 6.1.1.2 Fixing and Auto Hiding Windows on Page 25.
6.2.3 Selecting Functions from the Navigation Bar
_
To select items from the Navigation bar:
• Position the finger pointing hand on the item.
• When the item is underlined and displayed in a lighter shade of blue click the left
mouse key.
Page 29

Electronic Test System 29
6.3 Menu Bar
The Menu bar located at the top of the Main Screen provides a selection of most used
functions.
To select an item from the menu bar:
• Click with the left mouse key on the item
In case sub items are available a pull-down window will open.
• Select the sub item by clicking with the left mouse key on the item
6.4 Icon Bar
The Icon bar located directly below the Menu bar at the top of the Main Screen provides a
selection of most used functions.
To select an item from the Icon bar:
• Click with the left mouse key on the item.
6.5 View Data
__
There are three different ways to view the data in the Main window.
1 - Test information
• Click: Navigation - View Data - Test Information
This window shows information which uniquely identifies the test by:
• Test and data transfer date and time
• ETS Sensing Unit identification
• User information
• File information
• Comments and approvals
See Section 6.5.2 Test information on Page 34.
2 - Graph
• Click: Navigation - View Data - Graph
The display shows measurement data as well as calculated data as curves.
See Section 6.5.1 Graph on Page 30.
3 - Logbook
• Click: Navigation - Main - Open Logbook
The logbook provides a complete overview of all tests that are transferred from the sensing unit
to the computer. The log book is the primary tool to open ETS records.
See Section 6.5.3 Logbook on Page 35.
There is an additional way to view the data in the Datawindow
The available tabs provide the option to explore the measurement data.
See Section 8 Data Analysis on Page 49.
Page 30

Electronic Test System 30
6.5.1 Graph
The graph is displayed in the Main Window.
From any view the graph can be displayed in three different ways:
• from the Navigation section View Data
• from the View menu on the Menu bar
• from the Graph icon on the Icon bar
6.5.1.1 Modifying the Graph
A record that is opened is always displayed first in a predefined way.
Predefining the first view of the graph is typically done by the administrator
during configuration of the software.
You can change the appearence of the graph when this is appropriate for your
diagnostic activities.
_
The aspects of the graph which can be modified are:
• the number of displayed data records
• scaling of the Y-axis and X-axis
• positioning of the curves
• number of curves visible
• availability of the legend
• availability of the Sterilization Temperature Band
• availability of grid
Page 31

Electronic Test System 31
6.5.1.1.1 Showing and Hiding Data Records
Opened data records are displayed in list in the Files window.
Column Description
1 Identification of data records assigned in chronological order.
2 Indicates if data records are displayed in the graph
3 Indicated Bowie and Dick result
4 Indicates SPI result
5 Indicates leak rate result (if available)
6 Unique data record name
7 Date and time of test
To show or hide a data record in the graph:
• Check or uncheck the box in column 2 (Graph)
To show or hide related information (test information, table, control points
etc.):
• Click once on the line in the Files window showing the data record you
want to explore.
The line is highlighted
The line width of all curves in the graph doubles compared with other visible
graphs. This indicates which curves belong to the active (high- lighted) file.
6.5.1.1.2 Showing and Hiding Curves
To hide or show a function / curve during a session:
• Select Functions from the Navigation window
• Check or uncheck the desired function
• Click OK to confirm the selection
or
• Click Cancel to close the window leaving the settings unchanged.
Curves representing the chamber pressure and temperature are always
automatically displayed and can not be hidden.
Curves that shall be displayed by default can be preset in Preferences Diagnostics. See Section 9.2.2 Showing and Hiding Diagnostic Data on
Page 64.
Page 32

Electronic Test System 32
6.5.1.1.3 Showing and Hiding the Legend
To hide or show the legend
• Click on the icon bar in the graph.
The icon is highlighted to indicate that the function is active
6.5.1.1.4 Showing and Hiding Sterilization Temperature Band
To hide or show the Sterilization Temperature Band
• Click on the icon bar in the graph.
The icon is highlighted to indicate that the function is active
6.5.1.1.5 Showing and Hiding the Grid
To hide or show the grid
• Click on the icon bar in the graph.
The icon is highlighted to indicate that the function is active
Activating or deactivating this function has an effect for ALL grids in case
multiple Y-axis are used.
6.5.1.1.6 Zooming the Graph
A selected part of the graph can be zoomed. The following tools are
available:
1 - The Zoom Box
The Zoom Box enlarges the part of the graph enclosed in the box.
• Click the tool icon
the cursor adopts this shape:
• Hold down the left mouse key and move the cursor in any direction.
A rectangle box (dotted lines) indicates the area of interest.
• Release the left mouse key
The graph is rebuilt enlarging the defined box to full scale.
2 - Zoom out / in
The Zoom out / in tool changes the scale of a selected axis
stepwise.
• Click with cursor on the axis that shall be zoomed.
The selected Y-axis text is black and boxed.
Page 33

Electronic Test System 33
As soon as the cursor is over the axis it adopts this shape:
• Click the tool icon or
The selected axis increases or decreases the scale stepwise by 50%. The
center of the axis is fixed.
_
3 - Fit all
The Fit all tool reverts all zooming to full scale.
• Click the Fit all tool icon
4 - Zoom SPI
The Zoom SPI tool displays the sterilization temperature band.
• Click the Zoom SPI tool icon
5 - Zoom Axis
The Zoom axis tool changes the scale of a selected axis gradually
• Click the Zoom Axis tool icon
• Click with cursor on the axis that shall be zoomed.
As soon as the cursor is over the axis it adopts this shape: (Y-axis),
(X-axis)
The selected axis text turns black and boxed.
Method 1
• On the selected axis hold down the left mouse key.
• Move the cursor up to zoom in or down to zoom out (Y- axis).
• Move the cursor right to zoom in or left to zoom out (X- axis).
The zoom factor depends on the distance the cursor is moved. The center of
the axis is fixed.
Method 2
• Move the scroll wheel of the mouse up to zoom in or down to zoom
out.
Note: The tools Zoom Axis and Scroll Axiscan not be active
simultaneously. One of both is always active. Switching very
fast between the two modes can be achieved by using the
control [CTRL] key.
_
While in one mode, holding the [CTRL] key down switches to the other
function. Releasing the [CTRL] key switches back to the original function.
Page 34

Electronic Test System 34
6.5.1.1.7 Moving the Graph
When a graph is zoomed, selected axis (curves) can be scrolled within its
fullscale range.
_
Scroll Axis
The Scroll axis tool changes the range of the scale of a selected axis.
• Click the Scroll Axis tool icon
• Click with cursor on the axis that shall be scrolled.
As soon as the cursor is over the axis it adopts this shape:
The selected axis text turns black and boxed.
Method 1
• On the selected axis hold down the left mouse key.
• Move the cursor up to scroll up in or down to scroll down (Y-axis).
• Move the cursor right to scroll right or left to scroll left (X-axis).
The scroll factor depends on the distance the cursor is moved.
Method 2
• Move the scroll wheel of the mouse up to scroll up in or down to scroll
down (Y-axis).
• Move the scroll wheel of the mouse up to scroll right or down to scroll
left (X-axis).
Note: The tools Zoom Axis and Scroll Axiscan not be active
simultaneously. One of both is always active. Switching very
fast between the two modes can be achieved by using the
control [CTRL] key.
While in one mode, holding the [CTRL] key down switches to
the other function. Releasing the [CTRL] key switches back to
the original function.
6.5.2 Test Information
_
From any view Test Information can be displayed in three different ways:
• from the Navigation bar
• from the Menu bar
• from the Icon bar
Test Information is displayed in the Main Window.
It contains all information required for full trace ability of the test results to the tested
equipment, test equipment, test type, test person, times, dates, file identity, comments
and approvals.
Page 35

Electronic Test System 35
The information originates from:
• User entries made completing the data transfer process
• User entries made it in subsequent sessions
• administrator defined settings in Preferences
• the PC's operating system
• the ETS Sensing Unit
_
1: Result (Pass, Early Warning, Fail, No Result)
2: Test information
3: User information
4: File information
5: Comments
The information displayed in Test Info and User Info can not be changed. This ensures
the authenticity of the test.
See also Section 7.8.3 Test Identification on Page 46.
6.5.3 Logbook
_
See Section 7.3 Logbook on Page 39.
6.5.4 Evaluating Data
The software provides a wide variety of data analysis tools. Most of the calculations
required for data analysis is performed automatically as soon as a data record is opened.
Some tests can be manually controlled. The analysis data can be evaluated graphically
(Section 6.5.1 Graph on Page 30) and numerically. The numeric data is displayed in the
control window.
Page 36

Electronic Test System 36
See Section 6.1 Screen Layout on Page 24.
For detail on the various data analysis tools.
See Section 8 Data Analysis on Page 49.
6.5.5 Print
6.5.5.1 Printing Graph and Information
_
To print the graph and the information identifying the test:
• Compose the graph as desired (in/exclude curves, legend, axis,grid, etc ...).
See Section 6.5.1.1 Modifying the Graph on Page 30.
• Click File on the menu bar.
• Select Print from the menu.
• Select Graph and Info.
• Change the printer settings if required.
• Click OK to print.
or
• Click the Print Graph and Info icon .
• Change the printer settings if required.
• Click OK to print.
Note: All that is currently visible in the graph is printed.
6.5.5.2 Printing the Graph only
_
To quickly printout of the graph only:
Note: All that is currently visible in the graph is printed.
• Compose the graph as desired (in / exclude curves, legend, axis, grid, etc ...)
See Section 6.5.1.1 Modifying the Graph on Page 30.
• Click the print icon on the graph icon bar
• Change the printer settings if required
• Click OK to print
6.5.5.3 Printing the Logbook
To print the contents of the log book:
_
Note: All information that is currently visible in the logbook is printed.
Page 37

Electronic Test System 37
_
• Use the filter setting to display what shall be printed.
See Section 7.3.6 Setting a Filter for Specific Data Record Properties on
Page 41.
• Click File on the menu bar
• Select Print from the menu
• Select Log book
• Change the printer settings if required
• Click OK to print.
_or
• Click the Print Log book icon
• Change the printer settings if required
• Click OK to print
6.6 Status Bar
The status bar is located at the bottom of the Main Screen
The Status Bar presents the status of the various components and activities of the ETS system.
Communication Status (1)
Data Reader (2)
• Connected
The ETS USB Data Reader is plugged into the USB port of the computer. The device is
properly recognized by MS Windows.
• Not Connected
The ETS USB Data Reader is not plugged into the USB port of the computer or the device is
properly recognized by MS Windows.
Sensing Unit (3)
• Accessible
The ETS USB Data Reader is properly positioned on the ETS Sensing Unit. Communication
between the ETS USB Data Reader and the ETS Sensing Unit is possible.
• Not Accessible
The ETS USB Data Reader is not or not properly positioned on the ETS Sensing Unit or the
ETS Sensing Unit is unable to respond.
Data Transfer (4)
• Idle
No data transfer activity.
• In progress (5)
Data is being transferred (the progress indicator shows what percentage of the data transfer
is already completed)
• Successful
Data Transfer is completed successfully
• Not Successful
Data Transfer is not completed successfully
Page 38

Electronic Test System 38
7 Data Management
The measurement and calculated data are transferred from the ETS Sensing Unit to the Computer
Data is defined as:
ETS Data Set: Data stored in the ETS Sensing Unit memory
ETS Data Record: Data transferred to the PC and stored in the ETS database
ETS Data File: Data transferred for the ETS Sensing Unit and stored as a file on a file system (e.g.
Hard disk or network drive (recommended))
Data records from the ETS Database exported to the file system.
7.1 File System
By default, the installation folder for the ETS software 4110 is C:\Program Files\3M\3M 4110
ETS Software
The Drive (C:\) will be different in case you prefer to install the software on a different drive.
Caution: Do not delete the application folder nor its sub-folder.
7.2 IT consideration
7.2.1 Access Rights
Administrator rights are required for installing the software on the computer. The
installation shall preferably be for All Users. When the software is installed using the
default paths all access rights are allocated correctly.
Note: When the default path is changed it is important to check that users have
read, write and delete rights (full control) for the new folder and related sub
folders.
7.2.2 Shares on Servers
The location of the ETS log book database file and the exported ETS files can be
changed.
Note: When the default path is changed it is important to check that users have
read, write and delete rights (full control) for the new folder and related sub
folders on the network share.
To change the file location see Section 9.2.4 File Locations on Page 64.
Page 39

Electronic Test System 39
7.3 Logbook
The Logbook can be started in three different ways:
1 - From the Navigation bar
• Click Main - Open Logbook
2 - From the Menu bar
• Click View - Logbook
3 - From the Icon bar
• Click Logbook
7.3.1 Logbook File Location
To change the file location see Section 9.2.4 File Locations on Page 64.
7.3.2 Data Records
_
A data record is a package that contains specific information related to one test and is
available in the ETS PC Software 4110 database.
The format of the record name is:
YYMMDD_HHMM_#####_9999xx
YYMMDD: Year - Month – Day (Date of test)
HHMM: Hours – Minutes (Time of test)
#####: 5 digits (ETS serial Number)
9999: 4 digits (ETS counter)
xx: 2 characters (Result indicator)
7.3.3 Opening Data Records
_
To open a single data record from the logbook:
• Double click a row in the logbook
To open multiple data records from the logbook:
_
Method 1
• Click once on a row to select the first data record
• Hold down the [Shift] key and click once on the last data record (All data records in
between the selected first and last data record are now selected)
Page 40

Electronic Test System 40
Method 2
• Hold down the [CTRL] key and click once on the rows you want to add to your
selection
_
Method 3
• Click once on the first row and hold down the left mouse key
• Drag the mouse down until the last row of your selection.
• Click in the File menu Open... to open all data records
• Or click the Open Record Icon
7.3.4 Sorting Columns
To sort a column:
• Click once on the header of the column you want to sort.
Subsequent clicks on the header changes the sorting direction between ascending and
descending.
7.3.5 Importing ETS Files to Data Records
_
The Import function provides the possibility to integrate ETS files e.g. generated with a
previous version of the software into a new or different database.
Note: A function for copying of files is not available in the ETS PC Software 4110.
Use Microsoft Windows Explorer or an equivalent tool.
Files can de imported individually or as a batch. The files shall be copied to the
designated import folder.
See Section 9.2.4 File Locations on Page xx.
The default file location is C:\Users\Public\Documents\3M ETS 4110\Import.
It is possible to copy a complete folder including sub folders with ETS files into the Import
folder.
Note: Copy the folders / files to the import folder. Do not move the folders /
files into the import folder. The import folder will be empty after successful
completion of the import process. Moving the files can lead to loss of data.
To import the file(s):
• Assure that the files/folders are available in the designated import folder
• In the File menu click Import
The duration of the import process depends on the amount of files to import.
Note: To reduce the probability of errors in the import process the database is not
accessible for other activity.
Page 41

Electronic Test System 41
When the process is completed the files are integrated into the database. Folders and
files are removed from the import folder.
_
• Excluded from integration are:
• Corrupted files
• Incompatible files
• Duplicates
• Files with modified file names
• Files with incomplete file names
_
These files are moved to the folder C:\Users\Public\Documents\3M ETS
4110\No_Import.
Note: Files generated with previous versions of the ETS PC Software 4110 may
contain less information compared to data records generated with the latest
version. Data fields for which no information is available show "- - -".
7.3.6 Setting a Filter for Specific Data Record Properties
_
The logbook contains all data records that have been entered. A selection of filters is
available to reduce the displayed list to data records containing only specific information.
_
To set the filter:
_
Date of test
1. Select start date From
2. Select end date To
3. Or click the Today button to show only today's data records
_
Organization, Department, Operator, Sterilizer, ETS serial number, Approver.
1. Click to open the selection box
2. Make a selection
_
Result (pass, fail, etc..) and Approval Status
• Click the radial button in front of the preferred selection
Note: The logbook list is updated as soon as a filter is set.
Page 42

Electronic Test System 42
7.3.7 Recovery and Synchronising of Data
_
To view logbook data from networked computers the ETS database can be located on a
network share.
To define the network location. See Section 9.2.4 File Locations on Page 64.
When the administrator has defined a network share for storage of the ETS data base it
can happen that data is not available for use due to network connectivity problems.
The logbook will not be available!
Data from ETS Sensing Units can still be transfered. The data sets from the ETS Sensing
Unit will be stored temporarily as data files in the recovery folder on the workstation.
To view the transferred data:
• Click the File Open Icon
Note: All information including the graph is available. Comments, approvals or leak
rate test results can NOT be included.
As soon as the network connectivity is re-established the ETS software will automatically
update the contents of the network database with that of the local recovery folder. No
user activity is required.
Note: Comments, approvals and leak rate test results can now be included again.
_
7.4 Saving the Graph
_
To save the graph of an opened ETS record:
• Click on the icon Save
• The save as dialog window opens
• Select the folder location
• Enter the filename
• Select graphic format
• Click on Save
7.5 Copying the Graph
_
To copy the graph of an opened ETS record:
• Click on the icon Copy
• The image data is copied to the MS Windows clipboard
• Use the Paste function to include the graph in another application
Page 43

Electronic Test System 43
7.6 Saving Comments and Approvals
_
Comments and approvals are saved to the ETS data record as soon as the function is closed.
They can not be modified or removed.
7.7 Exporting
7.7.1 Exporting the Table
To export the table of an active ETS data record
• In the File menu click Export - Table
• Click the preferred data format (Excel or ASCII)
The file name is extended by "_TB" to indicate that the file concerns the complete data
table (YYMMDD_HHMM_#####_9999xx_TB.ext)
The file is located in the designated export folder. See Section 9.2.4 File Locations on
Page 64.
7.7.2 Exporting the Control Points
To export the Control Points of an active ETS data record:
• In the File menu click Export - Control Points
• Click the preferred data format (Excel or ASCII)
The file name is extended by "_CP" to indicate that the file concerns a table with control
points (YYMMDD_HHMM_#####_9999xx_CP.ext)
The file is located in the designated export folder. See Section 9.2.4 File Locations on
Page 64.
7.7.3 Exporting Data Records to Files
To select a single data record to export:
• Click once on a row in the logbook
To select multiple data records from the logbook:
Method 1
• Click once on a row to select the first data record
• Hold down the [Shift] key and click once on the last data record (All data records in
between the selected first and last data record are now selected)
_
Method 2
• Hold down the [CTRL] key and click once on the rows you want to add to your
selection
_
Page 44

Electronic Test System 44
Method 3
• Click once on the first row and hold down the left mouse key
• Drag the mouse down until the last row of your selection.
To select multiple data record using a filter:
• Set the filter(s). See Section 7.3.6 Setting a Filter for Specific Data Record Properties
on Page 41.
• To export:
Select all displayed Data Records press [CTRL A]
• In the File menu click Export - As ETS file
_
Data records exported to ETS files are located in the designated Export folder. See
Section 9.2.4 File Locations on Page 64.
7.7.4 Exporting the Summary
_
See Section 8.13 Generating a Summary on Page 62.
7.7.5 Exporting the Software Settings
To export the Software Settings:
• In the File menu click Export - Settings
The file name is set.bin
The file is located in the designated export folder. See Section 9.2.4 File Locations on
Page 64.
Page 45

Electronic Test System 45
7.8 Data Transfer
7.8.1 Typical Procedure
The procedure describes a normal data transfer process.
• Remove the ETS Sensing Unit from the sterilizer
Caution: Wear protective gloves, as the ETS Sensing Unit will still be hot.
• Move the black switch on top of the ETS Sensing Unit towards the center of the top
plate.
• Read the result. See Section 5.2 Result on Page 20.
The result is shown for 30 seconds.
Check the status of the Sensing Unit. See Section 5.3 Status on Page 21.
The status appears automatically after the 30 seconds or if the switch is activated again.
• Place the ETS Sensing Unit on a stable surface
• Reassure yourself that the ETS PC Software 4110 is running and that you are logged
on with your own user name and password.
• Verifiy the communication status in the status bar of the software on the computer.
See Section 6.6 Status Bar on Page 37.
• When the status bar indicates:
ETS USB Data Reader: Connected
ETS Sensing Unit: Not Accessible
Data transfer: Idle
Progress indicator: 0 %
Position the ETS USB Data Reader firmly inside the top ring of the ETS Sensing Unit.
The LEDs of the ETS USB Data Reader shall be directed downward facing the LEDs
of the ETS Sensing Unit.
• Verifiy the communication status in the status bar of the software on the computer.
• When the status bar indicates:
ETS USB Data Reader: Connected
ETS Sensing Unit: Accessible
Data transfer: Idle
Progress indicator: 0 %
push the red button on the ETS USB Data Reader.
• A window opens asking if you want to proceed.
• Click YES to confirm
• The window closes and the data transfer starts
• Verifiy the communication status in the status bar of the software on the computer.
• Wait while the status bar indicates:
ETS USB Data Reader: Connected
ETS Sensing Unit: Accessible
Data transfer: In Progress
Progress indicator: Increasing percentage
Page 46

Electronic Test System 46
• After completion of the data transfer the Test Identificationwindow opens.
• The status bar indicates:
ETS USB Data Reader: Connected
ETS Sensing Unit: Not Accessible
Data transfer: Successful
Progress indicator: 100%
• The pre-defined fields are filled automatically
• Fill out the blank field(s)
• Verify the correctness of all entries and make changes if necessary
• Click Save to save the information
• The status bar indicates:
ETS USB Data Reader: Connected
ETS Sensing Unit: Not Accessible
Data transfer: Idle
Progress indicator: 0%
• Remove the Data Reader from the Sensing Unit and locate it in a safe place with the
LEDs facing down.
• The status bar indicates:
ETS USB Data Reader: Not Connected
ETS Sensing Unit: Not Accessible
Data transfer: Idle
Process indicator: 0%
• The data transfer process is now complete.
_
After saving the Test Identification window the graph is opened automatically. You can
repeat the described process for other ETS Sensing Units. It is possible to transfer data
while you are investigating other data. The software will automatically put the data
analysis on hold when input is required. After entering the required information, the data
analysis will resume.
_
Note: Besides the information provided in the status bar the two LED on the data
reader will indicate also the status of the system. See Section 9.2.4 File
Locations on Page 64.
7.8.2 Status of the System before, during and after Data Transfer
_
See Section 5.5 ETS USB Data Reader on Page 23.
7.8.3 Test Identification
_
Each time a data set is transferred from the ETS Sensing Unit to the PC a window opens
in which specific data shall be entered. All fields are mandatory.
All of the information is linked to the test result assuring that each test result can be fully
traced to the tested equipment, test equipment, test type, test person, times, dates, file
identity and approvals.
Page 47

Electronic Test System 47
Test Date & Time:
Description: The date and the time the test is performed.
Source: ETS Sensing Unit timing algorithm
Source: PC system time (ETS Sensing Unit)
Data Transfer Date & Time:
Description: The date and the time the data of a test is transferred to the computer.
Source: PC system time
ETS Serial Number:
Description: The serial number of the ETS Sensing Unit that is used to record the
data and to calculate the result.
Source: ETS Sensing Unit
ETS counter:
Description: The number of tests already performed with the ETS Sensing Unit.
Source: ETS Sensing Unit
Sterilizer Name:
Description: The name of the sterilizer in which the test is performed.
Source: Automatically entered from Preferences entry by the administrator
Selected from drop down list by the user
Manually entered by user
Sterilizer Cycle Number:
Description: The number of processes carried out by the sterilizer.
Source: Manually entered by the user
Organization:
Description: The name of the organization at which the test is performed.
Source: Automatically entered.
Selected from Preferences entry by the administrator
Selected from drop down list by the user
Manually entered by user
Department:
Description: The name of the department at which the test is performed.
Source: Automatically entered. Selected from Preferences entry by the
administrator.
Selected from drop down list by the user
Manually entered by user
Page 48

Electronic Test System 48
Operator:
Description: The name of the person carrying out the test.
Source: Automatically entered. Operator is identified by log on procedure.
Supervisor:
Description: The name of the person the operator reports to.
Source: Automatically entered. Selected from Preferences entry by the
administrator
Selected from drop down list by the user
Manually entered by user
See also Section 6.5.2 Test information on Page 34.
7.8.4 Trace ability, Authenticity and Data Integrity
_
The measurement data as captured by the ETS Sensing Unit can not be accessed in any
other way than by transfering the data to a PC using the ETS USB Data Reader and the
ETS PC Software 4110. The data stored in the ETS Sensing Unit can therefore not be
manipulated.
The transferred data must be identified in a unique manner by completing the window
which opens after successful data transfer. Saving the data set to the PC is only possible
when all mandatory entries are made.
In case of unsuccessful data transfer the data is NOT lost. It is still available in the ETS
Sensing Unit for as long as it is not re-used for a subsequent test. It is therefore important
that each time before an ETS Sensing Unit is used for a test, it is verified that the data set
is transferred. See Section 5.3 Status on Page 21.
The data stored on a computer is encrypted. Delibarate manipulation of the file will render
it useless.
Note: To achieve a secure level of data security a data back-up procedure shall be
established. This is the responsibility of the individual organization.
Page 49

Electronic Test System 49
8 Data Analysis
8.1 Master Overlay (Tab "Master")
_
The Master Overlay function provides a quick comparison between an active record and the
master record for the sterilizer in which the test was performed. Based on the mandatory entry
of the sterilizer name in the data transfer process the software identifies automatically the
matching master record.
8.1.1 Typical Procedure
_
• Open a data record (from logbook or data transfer).
• Display the graph.
• Click the Master tab.
The master record is opened automatically. The graph opens. The graph contains two Xaxis.
• Move the active record left or right to synchronize the pressure profile to the desired
control point. See Section 6.5.1.1.7 Moving the Graph on Page 34.
The table displayed on the Master tab shows the values (time, pressure, temperatures) at
the control points for both records.
_
Note: The zoom factors for both records shall be the same for meaningful visual
comparison.
8.1.2 Designating a Data Record as Master Record
_
To designate a record as master record:
• Open the record.
• Click Options - Master - Designate as master record.
• Click Yes to confirm the decision.
The name of the master record for the actual sterilizer will appear in Preferences Sterilizer. See Section 9.2.8 Sterilizers on Page 66.
Note: There can only be one master record per sterilizer. Each subsequent record
that is promoted to master record will replace the previous master record.
The replaced records are not deleted.
8.2 Control Points (Tab "Control Points")
_
The control points indicate the time and pressure level during the pre-vacuum stage at which
the "pressure change direction" of the sterilization cycle changes.
A pressure control points is identified:
• when a vacuum valve is opened (1, 9)
• when a steam valve is opened and vacuum valve is closed (3, 5, 7)
• when a vacuum valve is opened and a steam valve is closed (2, 4, 6)
• when a steam valve is opened (1)
• when the valve for sterile air admission is opened (11)
Page 50

Electronic Test System 50
The pressure control points list is extended with points of interest showing the time and
pressure:
• at first measured value after achieving 134.00°C (8)
• at last measured value still above 134.00°C (10)
• when the end of the cycle is reached (12)
The control point list can display more data. This depends on the selected functions to display in
the graph. See Section 6.5.1.1.2 Showing and Hiding Curves on Page 31.
For pressure profiles that contain multiple small pulses or pressure control noise a dampening
filter is available to define the sensitivity for the designation of control points. See Section 9.2.9
Preset Values on Page 66 - Pressure Control Points.
8.2.1 Condensed List with Control Points
The control points are displayed in a table on theControl Points Tab. Each line in the
table contains measured and calculated data related to the control point.
The condensed list with control points can be exported for further analysis. See Section
7.7.2 Exporting the Control Points on Page 43.
8.2.2 Control Points in Table
The full data table is displayed on theTable Tab. The row that represents a control point is
indicated by a chronological numeric label in the column Control Point. The row is also
high-lighted.
Page 51

Electronic Test System 51
8.2.3 Differences between ETS and Sterilizer
Due to the wide variation in sterilizers and sterilization programs and the dynamic nature
of the sterilization process the control points determined by the ETS can deviate from
those indicated on your sterilizer documentation.
Fast pressure changes in combination with a 1-per-second measurement interval and
pressure sensor inaccuracy are the main reason for this.
It can also happen that the ETS software detects more or less control points. This is
caused by the nature of the pressure control of your sterilizer. "Noise" on the pressure
curve can be interpreted as real control points. They might, however, be only the result of
rapidly opening and closing steam and/or vacuum valves in order to force a controlled
pressure increase or decrease.
8.2.3.1 Setting a Filter for Control Point Recognition
_
The ETS software algorithm can be fine-tuned to match the sterilizer
documentation.
Analysis of a large number of pressure control curve show that a vast majority is
correctly interpreted by the algorithm using the default settings.
The default values for the filter are:
• Absolute threshold for recognition: 256mbar
• Relative threshold for recognition: 20%
Changing these values increases or decreases the sensitivity of the algorithm to
detect control points.
8.3 Table (Tab "Table")
The tab "Table" contains multiple columns with data. The table contents represent
measurement data and / or calculated data. Each line in the table shows data that belongs to a
single measurement. The sampling rate is fixed at one measurement per second. The number
of lines in the table therefore represents the duration of the entire measurement in seconds
The complete table can be exported for further analysis. See Section 7.7.3 Exporting Data
Records to Files on Page 43.
8.3.1 Add or Remove Columns
Table columns that shall display calculated data by default can be preset in Preferences
- Diagnostics. See Section 9.2.2 Showing and Hiding Diagnostic Data on Page 64.
Measurement data is always automatically displayed.
Preset columns can be blended out by using unchecking the functions in the window
Functions
Calculation data that is not selected to be shown by default can be added by checking the
functions in the Functionswindow
Page 52

Electronic Test System 52
8.4 EN 285 Leak Rate Test (Tab "Leak Rate")
8.4.1 Definition of the Test
The Leak Rate test is used to demonstrate that the quantity of air leakage into the
sterilizer chamber during the periods of vacuum does not exceed a level that will inhibit
the penetration of steam into the sterilizer load and will not be a potential cause of
recontamination of the sterilizer load during drying. The test complies with the Air leakage
test described in EN 285.
_
_
• P1 represents the minimum pressure value required to comply to the standard
(70mbar). This is also the start of the equilibrium period.
• P2 is the first pressure measurement after the equilibration period has ended.
• P3 is the pressure measurement after 600 seconds.
• The leak rate is calculated as: (P3-P2) / 10 mbar/min
8.4.2 Typical Procedure
_
• Activate the ETS Sensing Unit.
• Place an ETS Sensing Unit in an empty sterilizer cycle.
• Activate the sterilizer's "EN 285 leak rate" test program.
• Remove the ETS Sensing Unit from the sterilizer after completion of the test
program.
• Transfer the data to the PC.
• Open the data record and display the graph.
• Click on the Leak Rate tab to open display the leak rate test information.
• The software will automatically look whether or not the data record contains a portion
that meets the test criteria.
• The result of the test is displayed graphically (bar in graph) and numerically (values in
Leak Rate table).
Page 53

Electronic Test System 53
8.4.3 Leak Rate Test Pass and Fail Critera
_
• A portion of in the data record is found that meets the test requirements of EN 285.
When the actual leak rate is equal or smaller then 1.3 mbar/min the bar in the graph
is displayed Green indicating a "pass"
Leak Rate field in the table on the Leak Rate tab indicates the actual leak rate value.
_
_
• A portion of in the data record is found that meets the test requirements of EN 285.
When the actual leak rate exceeds 1.3 mbar/min the bar in the graph is displayed
Red indicating a "fail"
Leak Rate field in the table on the Leak Rate tab indicates the actual leak rate value.
_
_
• No portion of in the entire data record could be found that meets the test requirements
of EN 285.
The bar in the graph is displayed grey.
Leak Rate field in the table on the Leak Rate tab is empty (no result).
_
_
__
• If there exist more potions in the data record that meet the test requirements of EN
285 the highest value for the leak rate will be calculated and displayed graphically
and numerically.
Page 54

Electronic Test System 54
8.4.4 Changing the Leak Rate Test Criteria
To change the portion of the data record from which the leak rate is calculated you can
change the time at which the start and end measurement of the pressure is taken. The
measurement interval is fixed at 600 seconds.
_
Method 1:
• position the cursor over the coloured bar in the graph.
• The cursor changes to a finger-pointing hand
• Hold down the left mouse key and drag the coloured bar to in the desired direction (left
or right)
All leak rate information is instantly updated as you move the bar
• Release the left mouse key to freeze the results of the modification
_
Method 2:
• In the table on the Leak Rate tab double click on the value for First measurement in
column t[s]
• Enter a new time
• Confirm with [Enter]
The value for the second measurement is automatically updated (first measurement +
600s)
The leak rate is instantly recalculated
The bar moves to the new position.
8.4.5 Storing the EN 285 Leak Rate Test
Document the result of the leak rate test by clicking the Save Leak Rate Result button.
The value will be attached to the original data record. The leak rate value is displayed in
the LRT column in the Files window and in the Logbook.
It is possible to perform a new leak rate calculation on a data record that already has a
leak rate value attached to it. The original leak rate result however, can not be
overwritten.
Note: If required you can add the results of the new calculation manually as a
comment in the Test Informationwindow
Page 55

Electronic Test System 55
8.5 Pressure Change Rate (Tab "Pressure Change")
8.5.1 Definition of the Test
The pressure change rate test is a tool that can be used to determine the rate at which
the pressure of a pulse changes.
The result is only meaning full when the entire measurement interval of interest is
between two successive control points.
• The measurement interval bar is grey when it includes one or more control points.
• The measurement interval bar is blue when it includes no control points.
_
• The same applies to evacuation pulses.
8.5.2 Typical Procedure
• Open the data record and display the graph.
• Use the zoom function to display the area of interest (optional).
• Click on the Pressure Change tab to display the information.
A coloured bar appears in the graph from 40% to 60% of the visible time range.
The rate at which the pressure of a pulse changes can be measured and calculated in the
following manners:
Method 1:
• Enter a time for First measurement in column t[s].
• Confirm with [Enter].
• Enter a time for Second measurement in column t[s].
• Confirm with [Enter].
The pressure change rate is instantly calculated.
The coloured bar in the graph indicates the measurement interval.
Values for first and/or second measurement can be changed as required.
Page 56

Electronic Test System 56
Method 2:
• Position the cursor over the border of the coloured bar so that the cursor changes to a
double-sided arrow
• Hold down the left mouse key and move the cursor to the left or right.
The coloured bar in the graph changes width thus indicating the measurement interval.
All information in the table is instantly updated while moving the cursor
• Release the left mouse key to fix the measurement.
Values for first and/or second measurement can be changed as required using method 1.
Alternatively:
• repositioning the cursor on the right or left border of the coloured bar until it changes
to a double-sided arrow .
• Hold down the left mouse key and move the cursor to the right or left.
• Release the left mouse key to fix the measurement.
To change the position of the measurement interval leaving the interval itself unchanged:
• position the cursor over the coloured bar
• The cursor changes to a finger pointing hand
• Move the entire bar to the left or the right
• Release the left mouse key to fix the measurement.
8.6 Dilution
The theoretical dilution factor is a dimensionless numerical value. It it represents the dilution
based on the pressure control points detected during the portion of the cycle preceding the start
of the sterilization period.
The formula used to calculate the theoretical dilution factor is:
P2/P1 x P4/P3 x P6/P5 x ...... x Pn/Pn-1
8.6.1 Overall Dilution Factor
The Dilution factor presented as a single value (Info tab and Sterilization tab) indicates
the dilution reached at the start of the sterilization phase.
Page 57

Electronic Test System 57
8.6.2 Continuous Dilution Factor
The Dilution presented as a curve or table represents the actual dilution reached at the
indicated time.
8.7 Residual Air
The dilution factor is used to calculate thetheoretical amount of residual air in the chamber. The
chamber volume of the related sterilizer under test is derived from the entry made in the
Sterilizer Name field when the data is transferred from the ETS Sensing Unit to the computer.
The calculation does not consider quantities of air coming from air leakage or poor steam quality
(NCG)
8.7.1 Residual Air as Single Value
The Residual Air presented as a single value (Info tab and Sterilization tab) indicates the
amount of air present in the sterilizer at the start of the sterilization phase.
8.7.2 Residual Air as Curve or Table
The Residual Air presented as a curve or table represents the actual (theoretical) amount
of air present in the chamber at the indicated time.
8.8 F0 Lethality
A technique commonly applied to steam sterilization is to integrate the lethality of the process
using the familiar F0 function. This process involves measuring the temperature within the
sterilizer and fitting this data into the F0 equation.
F0 is the integrated lethality function (the equivalent time of exposure at a specified reference
temperature, which for F0 is 121°C but could also be 134 °C.
Thus, for a sterilization cycle operating at 134°C for 3 minutes the Fo value would be
approximately 60. In other words, exposure at 134°C for 3 minutes is equivalent to an exposure
at 121°C for 60 minutes in terms of the microbial lethality of the process.
8.8.1 Formula
The formula used to calculate the F0:
F
0
= 10
(T-121/z)
dt
Where:
• F0 is the equivalent heating time at 121°C, thus 1 F0 unit is equal to 1 minute at 121°C.
• T is the temperature at time interval dt (typical 1 second or 0.0166 of a minute).
• z is the z value of the microbial population for which the lethality is being calculated
(normally 10)
8.8.2 Change Temperature for Calculation
_
To change the temperature see Section 9.2.9 Preset Values on Page 66.
Page 58

Electronic Test System 58
8.9 Sterilization (Tab Sterilization)
The Sterilization tab provides a table with information specific to the sterilization phase.
8.9.1 Sterilization Temperature Band
_
Lower limit
• User defined temperature as lower limit for the sterilization temperature band. See
Section 9.2.9 Preset Values on Page 66.
Upper limit
• User defined temperature as upper limit for the sterilization temperature band. See
Section 9.2.9 Preset Values on Page 66.
Measured start
• First measured value after the chamber temperature is above the preset temperature
for the lower limit of the sterilization temperature band.
Measured end
• Last measured chamber temperature value which is still above the preset temperature
for the lower limit of the sterilization temperature band.
Maximum temperature
• Maximum temperature during sterilization temperature band.
Duration
• Total time within sterilization temperature band (from start to end).
8.9.2 Sterilization Parameter Indication
Measured start
• First measured value after the chamber temperature is above 134°C.
Measured end
• Last measured chamber temperature value which is still above 134°C.
Duration
• Total time above 134°C.
8.9.3 Evaluation Period
_
Exclude from start
• Interval starting at the beginning of the sterilization temperature band which is
excluded from the evaluation of the sterilization temperature band.
Exclude from end
• Interval ending at the end of the sterilization temperature band which is excluded from
the evaluation of the sterilization temperature band.
Start
• Start of the user defined interval of interest (evaluation period).
Page 59

Electronic Test System 59
End
• End of the user defined interval of interest (evaluation period).
Duration
• Total time of evaluation period.
Average temperature
• Average temperature over evaluation period.
Temperature range
• The difference between the maximum temperature and minimum temperature during
evaluation period.
Maximum temperature
• Maximum temperature during evaluation period.
Minimum temperature
• Minimum temperature during evaluation period.
Average pressure
• Average pressure over evaluation period.
Pressure range
• The difference between the maximum pressure and minimum pressure during
evaluation period.
Maximum pressure
• Maximum pressure during evaluation period.
Minimum pressure
• Minimum pressure during evaluation period.
8.9.3.1 Typical Procedure
• Click on the Sterilization tab to display the information.
A coloured bar appears in the graph from 40% to 60% of the visible time range.
Modify the evaluation range by changing the time to exclude from the start and
end of the sterilization phase.
Method 1:
• Enter a time for Exclude from start in column t[s]
• Confirm with [Enter]
• Enter a time for Exclude from end in column t[s]
Method 2:
• Position the cursor over the border of the coloured bar so that the cursor
changes to a double-sided arrow
• Hold down the left mouse key and move the cursor to the left or right.
To fix the evaluation range:
• Release the left mouse key.
Page 60

Electronic Test System 60
The values are updated instantaneously.
The coloured bar in the graph indicates the evaluation range.
8.9.4 Residual Air at Start of Sterilization
See Section 8.7.1 Residual Air as Single Value on Page 57.
8.10 Data Scanner
Use the data scanner to show the measured and calculated data at a selected time. The
indicated values correspond with the intercept of each individual curve and the vertical slider in
the graph.
8.10.1 Selecting a Point of Interest
_
To select a point of interest:
• Click on the icon bar in the graph on the data cursor icon to activate the data
scanner
A vertical red line appears in the middle of the graph. Also, a table opens automatically.
The table is situated at the far-right side of the graph.
• Move the cursor over the red line
The cursor changes to a finger-pointing hand
• Hold down the left mouse key and move the data cursor to the left or right.
The data belonging to the time indicated by the slider is shown the table.
• Release the left mouse key at the desired time.
Data is also shown on the Table tab. This view provides also data directly preceding and
succeeding the time indicated by the slider. The data range that is shown depends on the
size of the Data Window.
8.10.2 Showing / Hiding Data Scanner Information
The table for the data scanner is opened in a window at the right of the graph. Between
the table and the graph is a separator.
• Position the cursor over the separator so that the cursor changes to a double-sided arrow
and the separator changes from blue to orange.
Page 61

Electronic Test System 61
A single click on the separator closes or opens the data scanner window revealing the
table.
• The width of the data scanner window can be adjusted by dragging the separator to the
left or the right while holding the left mouse key down.
8.11 Theoretical Temperature
The theoretical temperature is calculated from the pressure measured by the ETS pressure
sensor.
Calculated results are conforming the steam table.
Both the pressure sensors and the temperature sensor for the chamber temperature have a
defined measurement accuracy. See Section 2.2 Technical Data on Page 11. Taking this
accuracy into account the theoretical temperature curve can be used to compare the actual
chamber temperature with the theoretical temperature that should be obtained when the
pressure results from 100% dry saturated steam.
The function can be displayed by default (See Section 9.2.2 Showing and Hiding Diagnostic
Data on Page 64) or shown / hidden on demand (See Section 6.5.1.1.2 Showing and Hiding
Curves on Page 31)
8.12 Vacuum Pump Efficiency
The vacuum pump efficiency provides information on the capacity of the vacuum pump to
reduce the pressure.
During a steam admission pulse the vacuum pump efficiency is 0.
The value displayed indicates the pressure reduction in relation to the previous pressure
measurement.
The calculation of each value is performed on two consecutive pressure measurements (1
second interval).
_
_
The formula for calculating the vacuum pump efficiency is:
_
(P1-P2) / P1 x 100%
The pressure values are averaged over the interval P - 2 second to P + 2 seconds. (5
measurements)
Page 62

Electronic Test System 62
8.13 Generating a Summary
_
The summary generator is a tool that generates a file containing a table with information which
can be used for further analysis in other data analysis software e.g. Microsoft Excel or statistical
software.
A summary table can contain all historical ETS records available in the ETS databank (logbook)
or a selection.
Use the logbook to make a selection.
To select the records to summarize:
• Use the filter setting options. See Section 7.3.6 Setting a Filter for Specific Data Record
Properties on Page 41.
To start the generation of the summary file:
• In the File menu click Export – Summary.
The file name is Summary_Date_Time.ext
The file is located in the designated export folder. See Section 9.2.4 File Locations on Page 64.
Page 63

Electronic Test System 63
9 Setting up the software
9.1 Installing the Software
_
To install the ETS PC Software 4110 on your computer:
• Insert the CD into your CD-ROM Drive.
• Locate the SETUP.EXE on the CD-ROM.
• Start SETUP.EXE.
• Follow the instructions on the screen.
_
Note: It is highly recommended to install the software as suggested by the
installation program. No changes are required then.
• Click the Next button to progress to the next window each time a new dialog window pops
up.
• Click the Close button after the installation procedure is completed.
9.2 Configuring the Software
The configuration process adapts the ETS PC Software 4110 to the working environment.
9.2.1 First Time
_
To ensure a maximum easy-to-use software it is important to complete the entire
configuration process. In this process the person setting up the software is required to
enter specific data that is required for:
• Full trace ability
• Automated calculation
• Minimizing the number of manual entries
• Eliminating as much typing as possible
• Personalizing / Customizing
• Data security and integrity
This process is to be completed by the administrator of the software. Entries made by the
administrator are valid for all users. Modifications after completing the initial configuration
can only be made by the administrator.
_
Note: This configuration procedure shall be completed before the software is used.
If it is not completed correctly or specific information is missing error
messages may appear or certain information will not be calculated and
displayed. This, however, will not lead to damage to data or software.
Page 64

Electronic Test System 64
9.2.2 Showing and Hiding Diagnostic Data
The diagnostic information for an ETS file is calculated automatically as soon as the
record is opened (exception: Leak Rate Test and Pressure Change Rate Test).
The administrator can define what information shall be displayed by default when the file
is opened. Depending on the function the curve in the graph, the numerical data in the
table and specific calculated results (single values) can be hidden or shows by default.
To hide / show the available function:
• select from the Navigation window: Options - Preferences
The Preference window opens.
• Select Diagnostic from the list on the left side of the window.
All available functions are displayed.
• Check or uncheck the boxes to define your preference.
• Confirm the selection by clicking OK.
• or click Cancel close the window leaving the settings unchanged.
During a session the information can be shown or hidden as desired by using the
Functions selection feature. See Section 6.2.3 Selecting Functions from the Navigation
Bar on Page 28.
Ending a session resets the visualization of diagnostic information to the default defined
by the ETS software administrator.
9.2.3 Language
_
To select the language of your preference:
• select from the Navigation window: Options – Preferences.
The Preference window opens.
• Select Language from the list on the left side of the window.
• Open the selection box and click on the desired language.
• Confirm the selection by clicking OK.
• Exit and restart the software.
The selected language is the new default .
9.2.4 File Locations
To change the file location:
• From the Menu bar or Navigation click Options - Preference - Communication
• Click (next to the fields ETS Database location or ETS File Export location).
• Select the desired path/folder from the dialog window.
• Click OK to confirm.
• Click OK to confirm and close the Preference window.
Page 65

Electronic Test System 65
9.2.5 Internet
_
To Change the Internet settings:
• select from the Navigation window: Options – Preferences.
The Preference window opens.
• Select Communication from the list on the left side of the window.
3M Homepage
• Enter the preferred 3M home page.
Contact us
• Enter the e-mail address for the preferred contact at 3M.
9.2.6 Locations
Add the name of the organization and department from which you want to administer the
ETS results. The names appear in selection lists for fields that shall uniquely identify test
data.
To add an organization and / or department:
• select from the Navigation window: Options – Preferences.
The Preference window opens.
• Select Location from the list on the left side of the window.
• Below the entry box for Organization click Add.
• Enter the name of the new organization.
• Click Save.
To add a department:
• select a previously entered organization.
• Below the entry box for Department click Add.
• Enter the name of the new department.
• Click Save.
The departments are linked to the selected organization.
Use Remove or Rename to modify the list of locations.
9.2.7 21 CFR part 11
_
The software meets the FDA requirements for validated software and 21 CFR Part 11
electronic signatures. The default setting is Basic
_Software Features
Low
Basic
High
21 CFR part 11
Logon procedure
Yes
Yes
User administration
Yes
Yes
Meet User name convention
Yes
Yes
Page 66

Electronic Test System 66
Meet Password convention
Yes
Yes
Audit Trail
Yes
Yes
Comments
Yes
Yes
Approvals
No
Yes
Password Expiry after 3 months
No
Yes
Session Time out after 15 minutes
No
Yes
_To change the level of compliance
• Click the radial button for the desired level of compliance.
_
Note: It is highly recommended to configure the software with full 21 CFR part 11
compliance.
_
See Section 12 Electronic Signature - 21 CFR Part 11 on Page 73.
9.2.8 Sterilizers
Add the name(s) of the sterilizer(s) from which you want to administer the ETS results.
The Sterilizer names appear in selection lists when test data shall be designated.
To add a Sterilizer:
• select from the Navigation window: Options – Preferences.
The Preference window opens.
• Select Sterilizer from the list on the left side of the window.
Entry fields appear in the window.
• Complete the entries for Sterilizer.
• Click Add Sterilizer.
The entries are automatically saved.
Use Edit Sterilizer to modify the entries.
Use Sterilizer decommissioned to delete a sterilizer. Information about the deleted
sterilizer will still be available. This ensures trace ability.
See also Section 9.2.10 Assigning an ETS Sensing Unit to a Sterilizeron Page 67.
See also Section 8.1 Master Overlay (Tab "Master") on Page 49.
9.2.9 Preset Values
In Preset Values all values used for calculation of information displayed on the various
tabs are shown. The values are either variables (white background) or constants (grey
background).
To change the variables:
• Double click the value that you want to change.
• Enter a new value.
• Click OK to confirm.
Page 67

Electronic Test System 67
9.2.10 Assigning an ETS Sensing Unit to a Sterilizer
_
An ETS Sensing Unit can be assigned to a specific sterilizer in case frequently the same
Sensing Unit is used. As soon as the data is transferred from this allocated Sensing Unit
the correct field entries for sterilizer department and organization are suggested
automatically. In case of exceptions the entry can be changed by selecting a different
item from the list.
To allocate an ETS Sensing Unit to a sterilizer:
• select from the Navigation window: Options - Preferences
The Preference window opens
• Select Sterilizer from the list on the left side of the window
• Select the sterilizer to which the Sensing Unit shall be assigned or add a sterilizer
• Enter the full ETS serial number in the field Assigned ETS Sensing Unit
• Click OK
9.2.11 Measuring Units
_
To select the units of your preference
• select from the Navigation window: Options - Preferences
The Preference window opens
• Select Units from the list on the left side of the window
• Click the radial button in front of the preferred unit
• Confirm the selection by clicking OK
Page 68

Electronic Test System 68
10 Operating Mode
An ETS Sensing Unit can be operated in two different modes:
• Bowie and Dick Mode
• Data Logger Mode
10.1 Bowie and Dick Mode
The ETS Sensing Unit is a stand-alone device which means that it can be used without an
additional computer.
Activating the ETS Sensing Unit by pulling the black switch on top activates the unit in Bowie
and Dick Mode by default. See Section 2.3.2 Operation on Page 12.
When the ETS Sensing Unit is exposed to the right conditions the unit will automatically
calculate a Result.
10.2 Data Logger Mode
In data logger mode the ETS Sensing Unit merely records all sensor data for temperature and
pressure. The maximum logging capacity is 1 hour (3600 seconds: 3600 measurements for
each sensor).
No calculation is performed after the logging of data has stopped.
To activate the data logger mode:
• Position the ETS USB Data Reader correctly on top of the ETS Sensing Unit.
• Click on the Advance menu or in the Navigation section Advanced.
• Select Select Mode.
• Click OK to confirm and activate the ETS Sensing Unit in data logger mode.
• Remove the ETS USB Data Reader from the ETS Sensing Unit
The ETS Sensing Unit starts recording as soon as the OK button is clicked.
To stop the logging
• Pull the black switch on the ETS Sensing Unit once or
• Position the ETS USB Data Reader correctly on top of the ETS Sensing Unit.
_
After 1 hour the logging stops automatically.
Logging has stopped when no LEDs flash any longer.
Page 69

Electronic Test System 69
11 User Administration
Note: The User Administration function is only available to accounts belonging to the
Administrator group.
_
The User Administration can be started in three different ways.
1 - From the Navigation bar
• Click Options - User administration.
2 - From the Menu bar
• Click Options - User administration.
3 - From the Icon bar
• Click User administration .
To open the User Administration:
• Select your preferred access to user administration (see above).
• Click on User Administration.
A Dialog window User Administration opens.
11.1 Logon Password
To ensure full trace ability it is essential to record certain activities that influence authenticity and
integrity of the data record.
All relevant activities will be linked to the person who is logged on the ETS software.
When setting up an account a preliminary password will be provide by the administrator. Both
user name and preliminary password shall be communicated to the user. The user can log on
the fist time using this information.
The option Password expires after first login is activated by default. This will force the user to
change his / her password during the first logon session.
Password convention:
• Minimum lengths: 8 characters
• Maximum lengths: 64 characters
• A password can not contain the more than four sequential characters from the user name.
• A total of five previously used passwords is blocked for reuse.
• Passwords shall be renewed every three months.
11.2 Creating a New User Account
_
Note: Only a member of the Administrator Group can create a new user account.
_
To add a new user account:
• Click Add Account.
• Enter a User Name.
Page 70

Electronic Test System 70
• Enter the Full Name of the new user.
• Enter a preliminary Password.
• Re-type the preliminary password in Confirm Password.
• Select the appropriate Group Membership for the new account.
• Select from scroll list or enter Supervisor, Organization and Department.
_
Note: New entries for Organization and Department will also be added to Locations
in Preferences
_
By default, the function Password expires after first logon and Account Enabled are
activated.
To deactivate these functions:
• Uncheck the box.
_
Note: The Save button will become active only when all fields are filled.
_
• Click Save to complete adding the new account.
• Click Close to exit and close the User Administration Window.
• Alternatively, click Cancel to close the User Administration Window without saving any
changes.
User name convention:
• Minimum lengths for user name: 6 characters
• Maximum lengths for user name: 16 characters
• The user name can only be assigned once. User names must differ by at least one
character.
11.3 Group Membership
Two membership groups are available:
1 - Administrator
2 - User
The table illustrates available functions for the Administrator and User group.
An example of typical members for the group:
Administrator
• IT personal, department managers and designated responsible personal.
User
• Personnel or designated testers involved with day to day testing and data transfer of ETS
data records to the PC.
Group
Function
Administrator
User
Start application
Yes
Yes
Transfer data from ETS SU to PC
Yes
Yes
Page 71

Electronic Test System 71
Identify test
Yes
Yes
Save downloaded file
Yes
Yes
Open downloaded file
Yes
Yes
Open existing file
Yes
Yes
View graph
Yes
Yes
View all that is preset by admin
Yes
Yes
Add comments to ETS file
Yes
Yes
Turn curves off/on
Yes
Yes
Open logbook
Yes
Yes
Open records from logbook
Yes
Yes
Use logbook filter
Yes
Yes
Print graph & information
Yes
Yes
Print graph
Yes
Yes
Print logbook
Yes
Yes
Designate master record
Yes
No
Export records to files
Yes
No
Export table
Yes
No
Export control points
Yes
No
Import ETS files into database
Yes
No
Start User administration
Yes
No
Add/Delete Users
Yes
No
Change Group membership
Yes
No
Set-up and modify preferences
Yes
No
View audit trail
Yes
No
11.4 Editing an Existing User Account
_
To edit a user account:
• Click once on the user name in the list User to select the user you want to edit.
• Click Edit Account to change the actual account data.
_
Note: The user name can not be changed.
Note: The Password can be changed, however the user of this account will be
asked to change it at next logon.
11.5 Deleting a User Account
_
To delete a user account:
• Click once on the user name in the list User to select the user you want to delete.
• Click Delete Account to delete the account.
Page 72

Electronic Test System 72
_
Note: Deleted accounts cannot be restored. The deleted user name will be blocked
to assure full trace ability. It is no longer available as a user name for a
new user account.
11.6 Password Expiry
The Passwords expires every 90 days. A window will open requesting to enter a new password.
See Section 11.7 Change Password on Page 72.
11.7 Change Password
To change the password, select option 1 or 2:
1 - From the Navigation bar:
• Click Options - Change Password.
2 - From the Menu bar:
• Click Options - Change Password.
A Dialog window Change Password opens.
• Enter old password (Password characters will be shown as black dots).
• Enter new password.
• Re-type new password.
_
Note: Consider password convention.
See Section 11.1 Logon Password on Page 69.
_
• Click OK to confirm password change and close window.
• or click Cancel to exit without any changes and close window.
11.8 Logon Timout
When the ETS software does not register any activity for 15 minutes it will automatically close
the session of the user which was logged on most recently. The software is not closed. As soon
as the somebody wants to use the software again a new logon is required.
11.9 Disabling / Enabling an Account
An administrator can disable a user account. The account is not deleted but the user can not log
on to the system any longer.
Also, as a result from an incorrect logon procedure an account is automatically disabled (after 4
failing attempts).
The account can be enabled again by the administrator.
See Section 11.4 Editing an Existing User Account on Page 71.
Page 73

Electronic Test System 73
12 Electronic Signature - 21 CFR Part 11
12.1 Adding Comments
The Comments field displays all information related to the file's history. Comment can only be
added, not changed or deleted. It can be used as an audit trail of an individual file.
Any information considered relevant by the user can be added to the ETS data record.
To add a comment:
• Click the Append Comment button on the Test Information window or select Add
Comment form the Navigation window
The Append Comments window opens
• Enter the comment.
• Click the Save button to store the comment and close the window.
The maximum length of a single comment is 256 characters. The comment can be split in
several comments in case the comment is longer. The maximum number of comments per data
record is 42.
Each comment is preceded by the time, the date and the user name.
12.2 Adding an Electronic Signature
An electronic signature is considered to be the official prove that a responsible person has been
informed about the result of a test.
A signature can only be given by an administrator.
To sign:
• Click the Sign button on the Test Information window or select Add Signature from the
Navigation window.
A window opens requesting a password. This shall be the password of the person that is
currently logged on.
• Enter the Password.
• Click OK to confirm and close the window.
12.3 Audit Trail
The audit trail independently records the date and time of operator entries and actionsthat
create or modifies electronic records.
The audit trail records only activities related to:
• Logon / off
• Data transfer
• Comments
• Signature
• User administration
The audit trail can be viewed by an administrator only.
The entire contents of the audit trail can be exported.
Page 74

Electronic Test System 74
13 Index
Numerics
General 73
21 CFR Part 11 65, 73
Saving 43
EN 285 Leak Rate Test 52
A
Evaluating Data 35
Access Rights 38
Export 43
Approvals 8
Audit Trail 73
F
Authenticity 48
F0 Lethality 57
Features 7
B
File Locations
Bowie and Dick Mode 12
Changing 64
Default 38
C
Filtering Data Records 41
Comments
Functions 7
Adding 73
Saving 43
G
Configuration of the Software 63
General Description 6
Control points tab 50
Graph
Curves 31
Copying 42
Modifying 30
D
Saving 43
Data 38
Viewing 31
Recovery 42
Zooming 32
Synchronizing 42
Grid 32
Data Integrity 48
Data Logger 13
H
Data Logger Mode 13
Hiding
Data Management 38
Curves 31
ETS USB Data Reader 15
Data Records 31
Description 15
Data Scanner 60
General 15
Diagnostic Data 64
Installation 16
Grid 32
LED guide 23
Legend 32
LEDs 19
Sterilization Temperature Band 32
Technical Data 16
Data Records
I
Export 43
Icon Bar 29
Filtering 41
Identification of Tests 46
Format 40
Identification System 12
Import 40
Import 40
Opening 39
Installation of the Software 63
Showing and Hiding 31
Intended Use 6
Sorting 40
Data Scanner 60
L
Diagnostic Data 64
Language 64
Dilution 56
Layout 24
Leak Rate Test 52
E
LED Guide
Electronic signature
ETS USB Data Reader 23
Adding 73
ETS Sensing Unit 20
Page 75

Electronic Test System 75
LEDs
Sterilization Temperature Band 32
ETS USB Data Reader 15
Software
ETS Sensing Unit 14
Configuration 63
Legend 32
Description 17
Legitimate Complaint 8
General 17
Logbook 39
Graphical User Interface 24
Installation 63
M
Setting up 63
Master Overlay Tab 49
Technical Data 17
Menu Bar 29
Status Bar 37
Steam Sterilization Cycle 13
N
Sterilization Tab 58
Navigation 28
Sterilization Temperature Band 32
Navigation Bar 29
Sterilizers
Administration 66
O
Assigning ETS Sensing Units 66
Operating Mode 68
Summary Generator 62
Operation
Synchronizing Data 42
ETS Sensing Unit 12
T P
Table Tab 51
Password 69
Tabs
Preset Values 66
Control Points 50
Pressure Change Rate 55
Leak Rate Test 52
Primary Function 6
Master Overlay 49
Printing 36
Pressure Change Rate 55
Selecting 28
R
Sterilization 58
Recovery of Data 42
Table 51
Repositioning Windows 26
Technical Data
Residual Air 57
ETS USB Data Reader 16
Resizing Windows 25
ETS Sensing Unit 11
ETS PC Software 17
S
Test Identification 46
Safety 8
Test Information 34
Screen Layout 25
Test Results 14
ETS Sensing Unit
Theoretical Temperature 61
Core 10
Traceability 48
General 10
LED Guide 20
U
LEDs 14
USB cable 15
Operation 12
ETS USB Data Reader 15
Technical Data 11
User Administration 69
Service 8
Shares on Servers 38
V
Showing
Vacuum Pump Efficiency 61
Curves 31
Viewing Data 29
Data Records 31
Data Scanner 60
W
Diagnostic Data 64
Warranty 8
Grid 32
Legend 32
Z
Zooming the Graph 32
Page 76

Electronic Test System 76
3M Deutschland GmbH
Health Care Business
Carl-Schurz-Str. 1
41453 Neuss
Germany
 Loading...