

Page 1

WT5000
Precision Power Analyzer
Features Guide
IM WT5000-01EN
1st Edition
Page 2

List of Manuals
Thank you for purchasing the WT5000 Precision Power Analyzer. This manual contains useful
information about the features of this instrument. To ensure correct use, please read this manual
thoroughly before operation.
Keep this manual in a safe place for quick reference in the event a question arises. The following
manuals, including this one, are provided as manuals for this instrument. Please read all manuals.
Manual Title Manual No. Description
WT5000
Precision Power Analyzer
Features Guide
WT5000
Precision Power Analyzer
User’s Manual
WT5000
Precision Power Analyzer
Getting Started Guide
WT5000
Precision Power Analyzer
Communication Interface User’s Manual
WT5000
Precision Power Analyzer
The “EN” and “Z1” in the manual numbers are the language codes.
IM WT5000-01EN This manual. The supplied CD contains the
PDF file of this manual. This manual explains
all the instrument’s features other than the
communication interface features.
IM WT5000-02EN The supplied CD contains the PDF file of this
manual. The manual explains how to operate
this instrument.
IM WT5000-03EN This guide explains the handling precautions,
basic operations, and specifications of this
instrument.
IM WT5000-17EN The supplied CD contains the PDF file
of this manual. The manual explains the
instrument’s communication interface
features and instructions on how to use
them.
IM WT5000-92Z1 Document for China
Notes
Contact information of Yokogawa offices worldwide is provided on the following sheet.
Document No. Description
PIM 113-01Z2 List of worldwide contacts
• The contents of this manual are subject to change without prior notice as a result of continuing
improvements to the instrument’s performance and functions. The figures given in this manual
may differ from those that actually appear on your screen.
• Every effort has been made in the preparation of this manual to ensure the accuracy of its
contents. However, should you have any questions or find any errors, please contact your
nearest YOKOGAWA dealer.
• Copying or reproducing all or any part of the contents of this manual without the permission of
YOKOGAWA is strictly prohibited.
• The TCP/IP software of this product and the documents concerning it have been developed/
created by YOKOGAWA based on the BSD Networking Software, Release 1 that has been
licensed from the Regents of the University of California.
1st Edition: September 2018 (YMI)
All Rights Reserved, Copyright © 2018 Yokogawa Test & Measurement Corporation
IM WT5000-01EN
i
Page 3

Trademarks
Revisions
• Microsoft, Internet Explorer, MS-DOS, Windows, Windows 7, Windows 8.1, and Windows 10 are
registered trademarks or trademarks of Microsoft Corporation in the United States and/or other
countries.
• Adobe and Acrobat are either registered trademarks or trademarks of Adobe Systems
Incorporated.
• In this manual, the ® and TM symbols do not accompany their respective registered trademark
or trademark names.
• Other company and product names are trademarks or registered trademarks of their respective
holders.
• 1st Edition: September 2018
ii
IM WT5000-01EN
Page 4

Contents
1 Items That This Instrument Can Measure
Measurement Functions Used in Normal Measurement............................................................... 1-1
Harmonic Measurement Functions ............................................................................................... 1-3
Delta Computation Functions........................................................................................................ 1-5
Motor Evaluation Functions (Option) ............................................................................................ 1-5
Auxiliary Input Measurement Functions (Option) .......................................................................... 1-5
What Is a Measurement Function? ............................................................................................... 1-7
Measurement Period..................................................................................................................... 1-7
2 Setup Menu
Navigation ..................................................................................................................................... 2-1
Setup Menu (Setup, MENU(SETUP)) ........................................................................................... 2-1
Measurement Mode (Measurement Mode)................................................................................... 2-1
Initialize Settings (Initialize Settings)............................................................................................. 2-1
File List (File List) .......................................................................................................................... 2-1
Saving Setup Data (Save Setup, SAVE(SETUP)) ........................................................................ 2-3
Loading Setup Data (Load Setup, LOAD(SETUP)) ...................................................................... 2-4
3 Input Settings (Basic Measurement Conditions)
Input Settings (Basic Measurement Conditions, Input (Basic))..................................................... 3-1
Wiring System (Wiring) ................................................................................................................. 3-1
Selecting the Element for Setting the Measurement Range (Element1 to 7, 1 to 7 (ELEMENTS))
Voltage Range (Voltage, VOLTAGE RANGE) ............................................................................... 3-4
Auto Voltage Range (Auto (Voltage), AUTO (VOLTAGE RANGE)) .............................................. 3-5
Current Range (Current, CURRENT RANGE) .............................................................................. 3-6
Auto Current Range (Auto (Current), AUTO (CURRENT RANGE)) ............................................. 3-6
External Current Sensor On/O (Ext Sensor) ............................................................................... 3-7
Power Range ................................................................................................................................ 3-9
Scaling (Scaling) ......................................................................................................................... 3-10
Line Filter (Line Filter) ................................................................................................................. 3-12
Frequency Filter (Freq Filter) ...................................................................................................... 3-13
Measurement Period (Sync Source) ........................................................................................... 3-14
....... 3-3
4 Input Settings (Advanced/Options)
IM WT5000-01EN
Input Settings (Advanced/Options, Input (Advanced/Options)) .................................................... 4-1
Measurement Range (Range) ...................................................................................................... 4-1
Crest Factor (Crest Factor) ........................................................................................................... 4-2
Range Σ link (Range Σ Link) ......................................................................................................... 4-3
Display Format of External Current Sensor Range (Ext Sensor Range Display Format) ............. 4-4
Valid Measurement Range (Valid Measurement Range) .............................................................. 4-5
Line Filter (Line Filter) ................................................................................................................... 4-6
Frequency Filter, Rectier, Level (Freq Filter/Rectier/Level) ....................................................... 4-8
Null Feature (Null Settings) ..........................................................................................................4-11
Enabling and Disabling the Null Feature (Null, NULL) ................................................................ 4-12
iii
Page 5

Contents
5 Motor Evaluation and Auxiliary Input (Option)
Motor Evaluation/Auxiliary Inputs (Motor/Aux) .............................................................................. 5-1
MTR Conguration (MTR Conguration) ...................................................................................... 5-2
Motor/Aux Settings (Ch Settings).................................................................................................. 5-4
Input Signal Name (Aux Name) .................................................................................................... 5-4
Scaling Factor (Scaling) ................................................................................................................ 5-5
Unit (Unit) ...................................................................................................................................... 5-5
Input Signal Type (Sense Type) .................................................................................................... 5-6
Analog Input Range ...................................................................................................................... 5-7
Linear Scaling of Analog Input ...................................................................................................... 5-8
Line Filter (Line Filter(Butterworth)) ............................................................................................ 5-10
Pulse Noise Filter (Pulse Noise Filter) ........................................................................................ 5-10
Sync Source (Sync Source) ........................................................................................................ 5-10
Upper and Lower Limits of Pulse Input Range (Pulse Range Upper, Pulse Range Lower) ........5-11
Torque Signal Pulse Rating..........................................................................................................5-11
Revolution Signal Pulses per Revolution (Pulse N) .................................................................... 5-13
Sync Speed(Sync Speed) ........................................................................................................... 5-14
Electrical Angle Measurement (Electrical Angle Measurement) ................................................. 5-15
Computing the Motor Eciency and Total Eciency .................................................................. 5-16
6 Computation and Output Conguration
Computation and Output (Computation/Output) ........................................................................... 6-1
Eciency Equation (Eciency) ..................................................................................................... 6-2
Delta Computation (Δ Measure).................................................................................................... 6-3
Data Update Interval (Update rate) ............................................................................................... 6-6
Averaging (Averaging) .................................................................................................................6-11
D/A Output (D/A Output, option).................................................................................................. 6-13
7 Harmonic Measurement Conditions
Harmonic Measurement Conditions (Harmonics) ......................................................................... 7-1
Input Element Group (Elements) .................................................................................................. 7-1
PLL Source (PLL Source) ............................................................................................................. 7-1
Measured Harmonic Orders (Min Order/Max Order) .................................................................... 7-2
Distortion Factor Equation (Thd Formula)..................................................................................... 7-3
Number of FFT Points (FFT Points) .............................................................................................. 7-3
Anti-Aliasing Filter ......................................................................................................................... 7-3
8 Computation
Computation (Measure) ................................................................................................................ 8-1
User-Dened Functions (User Dened Functions) ....................................................................... 8-1
Measuring the Average Active Power ........................................................................................... 8-5
MAX Hold (Max Hold) ................................................................................................................... 8-5
User-Dened Events (User Dened Event) .................................................................................. 8-6
Equation for Apparent Power (S Formula) .................................................................................... 8-8
Apparent Power and Reactive Power Computation Types (S,Q Formula) ................................... 8-9
Equation for Corrected Power (Pc Formula) ............................................................................... 8-10
Phase Dierence Display Format (Phase) ...................................................................................8-11
Master/Slave Synchronous Measurement (Sync Measure)........................................................ 8-12
iv
IM WT5000-01EN
Page 6

9 Display
Display (Display) ........................................................................................................................... 9-1
Single Screen Display (Full Screen Display) ................................................................................ 9-1
Split Display .................................................................................................................................. 9-1
Display Settings ............................................................................................................................ 9-1
10 Numeric Data Display
Numeric Data Display (NUMERIC) ............................................................................................. 10-1
Switching the Displayed Page (Page Scroll)............................................................................... 10-3
Number of Displayed Digits (Display Resolution) ....................................................................... 10-3
Display Items (Items, Numeric) ................................................................................................... 10-4
All display (All Items)................................................................................................................... 10-6
4-, 8-, and 16-Value Displays (4 Items/8 Items/16 Items) ........................................................... 10-7
Matrix display (Matrix) ................................................................................................................. 10-8
Harmonics List Single/Dual (Hrm List Single/Dual)..................................................................... 10-9
11 Graph Display
Graph Display (GRAPH) ..............................................................................................................11-1
Waveform display (Wave) ............................................................................................................11-1
Display Group (Group) .................................................................................................................11-2
Display Items (Items, Wave) ........................................................................................................11-2
Display Format (Form, Wave) ......................................................................................................11-4
Number of Windows (Format) ......................................................................................................11-4
Time Axis (Time/div) .....................................................................................................................11-4
Vertical Axis (Amplitude) ..............................................................................................................11-6
Advanced Waveform Display Settings (Advanced) .....................................................................11-7
Cursor Measurement (Cursors) ...................................................................................................11-7
Trend Display (Trend) ..................................................................................................................11-8
Display Group (Group) .................................................................................................................11-8
Display Items (Items, Trend) ........................................................................................................11-9
Display Format (Form, Trend) ....................................................................................................11-10
Cursor Measurement (Cursors) ................................................................................................. 11-11
Measurement Display (Value) .................................................................................................... 11 -11
Bar Graph Display (Bar).............................................................................................................11-12
Display Group (Group) ...............................................................................................................11-12
Display Items (Items, Bar)..........................................................................................................11-12
Display Format (Form, Bar) .......................................................................................................11-13
Cursor Measurement (Cursors) .................................................................................................11-13
Vector Display (Vector) ..............................................................................................................11-14
Display Group (Group) ...............................................................................................................11-14
Display Items (Items, Vector) .....................................................................................................11-15
Display Format (Form, Vector) ...................................................................................................11-15
Contents
12 Custom Display
13 Holding Measured Values, Performing Single Measurements, and
IM WT5000-01EN
Custom Display (CUSTOM) ........................................................................................................ 12-1
Zero-Level Compensation
Holding Measured Values (Hold, HOLD) .................................................................................... 13-1
Single Measurement (Single Execute, SINGLE) ........................................................................ 13-1
Zero-Level Compensation (Cal Execute, CAL) ........................................................................... 13-1
v
Page 7

Contents
14 Integrated Power (Watt Hours/Ampere Hours)
Integrated Power (Integration, MENU (INTEGRATION)) ............................................................ 14-1
Integration-Related Display......................................................................................................... 14-1
Number of Displayed Digits (Display Resolution) ....................................................................... 14-3
Integration Mode (Integration Mode)........................................................................................... 14-5
Integration Timer (Integration Timer)........................................................................................... 14-8
Scheduled Times for Real-Time Integration (Start Time/End Time) ............................................ 14-9
Enabling or Disabling Independent Integration (Independent Control) ..................................... 14-10
Integration Source Elements (Element Objects) ....................................................................... 14-10
Integration Auto Calibration On/O (Auto Cal) ...........................................................................14-11
Watt Hour Integration Method for Each Polarity (WP ± Type) .................................................... 14-11
Current Mode for Current Integration (q Mode) .........................................................................14-11
Integration resume action at power failure recovery (Resume Action) ..................................... 14-12
Starting, Stopping, and Resetting Integration ........................................................................... 14-13
15 Cursor Measurement
Cursor Measurement (Cursors) .................................................................................................. 15-1
Turning Cursor Measurement On and O (Cursors)................................................................... 15-1
Waveform Measured by Cursor 1 (+) (C1+ Trace) ..................................................................... 15-1
Position of Cursor 1 (+) (C1+ Position) ....................................................................................... 15-2
Position of Cursor 1 (+) (C1+ Order)........................................................................................... 15-2
Waveform Measured by Cursor 2 (x) (C2x Trace) ...................................................................... 15-2
Position of Cursor 2 (x) (C2x Position)........................................................................................ 15-2
Position of Cursor 2 (x) (C2x Order) ........................................................................................... 15-2
Cursor Path (Cursor Path) .......................................................................................................... 15-2
Linking Cursor Movement (Linkage) ........................................................................................... 15-2
Measured Items .......................................................................................................................... 15-3
Cursor Movement ....................................................................................................................... 15-4
16 Data Storage
Data Storage (Store, MENU (STORE)) ...................................................................................... 16-1
Storage Conditions ..................................................................................................................... 16-1
Storage Control ........................................................................................................................... 16-2
Stored Items................................................................................................................................ 16-5
File Save Conditions ................................................................................................................... 16-7
Starting, Pausing, and Ending Storage Recording ..................................................................... 16-9
Storage Operations in Each Storage Mode ...............................................................................16-11
17 Saving Numeric Data, Waveform Data, and Screen Images
Saving Data (Data Save, MENU (DATA SAVE)) ......................................................................... 17-1
Storage Device ........................................................................................................................... 17-2
Saved Items (Saved Objects) ..................................................................................................... 17-3
Conditions for Saving Numeric Data ........................................................................................... 17-4
Conditions for Saving Screen Images......................................................................................... 17-5
File Save Conditions ................................................................................................................... 17-6
Saving (Save Exec, EXEC)......................................................................................................... 17-6
vi
IM WT5000-01EN
Page 8

18 Ethernet Communication
Ethernet Communication (Network) ............................................................................................ 18-1
TCP/IP(TCP/IP) .......................................................................................................................... 18-2
FTP Server (FTP Server) ............................................................................................................ 18-3
Network Drive (Net Drive) ........................................................................................................... 18-4
SNTP(SNTP) .............................................................................................................................. 18-5
19 Utility
Utility (Utility, UTILITY) ................................................................................................................ 19-1
Instrument Information (System Overview)................................................................................. 19-2
System Conguration (System Conguration) ............................................................................ 19-3
Remote Control (Remote Control) .............................................................................................. 19-7
Releasing Remote Mode (UTILITY)............................................................................................ 19-8
Key Lock (KEY LOCK) ................................................................................................................ 19-9
Touch Lock (TOUCH LOCK) ....................................................................................................... 19-9
Self-test (Selftest) ....................................................................................................................... 19-9
Index
Contents
IM WT5000-01EN
vii
Page 9

1 Items That This Instrument Can Measure
Click here.
The items that you can measure with this instrument are listed below. For details about how the values of the
measurement functions are determined, see appendix 1 in the Getting Started Guide, IM WT5000-03EN. For
explanations of the terms measurement function, input element, and wiring unit, see “What Is a Measurement
Function?”
The input elements and wiring units referred to in each measurement function table are listed below. However,
the input elements and wiring units that you can measure vary depending on how many input elements are
installed in this instrument.
• Input elements: Element1 to Element7
• Wiring units: ΣA, ΣB, ΣC
• Motor numbers: Motor1 to Motor4
Measurement Functions Used in Normal Measurement
Voltage
Function Description Input Element Wiring Unit
Urms True rms voltage Yes Yes
Umn Rectified mean voltage calibrated to
the rms value
Udc Simple voltage average Yes Yes
Urmn Rectified mean voltage Yes Yes
Uac AC voltage component Ye s Ye s
Ufnd Fundamental voltage component Yes Yes
U+pk Maximum voltage Yes No
U−pk Minimum voltage Yes No
CfU Voltage crest factor Yes No
Yes Yes
Current
Power
IM WT5000-01EN
Function Description Input Element Wiring Unit
Irms True rms current Yes Yes
Imn Rectified mean current calibrated to the
rms value
Idc Simple current average Yes Yes
Irmn Rectified mean current Yes Yes
Iac AC current component Yes Yes
Ifnd Fundamental current component Yes Ye s
I+pk Maximum current Ye s No
I−pk Minimum current Yes No
CfI Current crest factor Yes No
Function Description Input Element Wiring Unit
P Active power Yes Yes
S Apparent power Ye s Yes
Q Reactive power Yes Yes
λ
Φ
Pfnd Fundamental active power Yes Ye s
Sfnd Fundamental apparent power Yes Ye s
Qfnd Fundamental reactive power Yes Ye s
fnd
λ
fnd
Φ
Pc Corrected Power Yes Yes
P+pk Maximum power Yes No
P−pk Minimum power Yes No
Power factor Yes Yes
Phase difference Yes Yes
Fundamental power factor Yes Yes
Fundamental phase difference Yes No
Yes Yes
1-1
Page 10

1 Items That This Instrument Can Measure
Frequency
Function Description Input Element Wiring Unit
fU Voltage frequency Yes No
fI Current frequency Ye s No
f2U Voltage frequency Ye s No
f2I Current frequency Yes No
fPLL1 Frequency of PLL1 No No
fPLL2 Frequency of PLL2 No No
Integrated Power (Watt hours)
Function Description Input Element Wiring Unit
ITime Integration time Yes No
WP Sum of positive and negative watt
hours
WP+ Sum of positive P values Yes Yes
WP− Sum of negative P values Yes Ye s
q Sum of positive and negative ampere
hours
q+ Sum of positive I values Yes Yes
q− Sum of negative I values Ye s Ye s
WS Volt-ampere hours Yes Yes
WQ Var hours Yes Yes
Yes Yes
Yes Yes
Efficiency
Function Description
η1 to η4 Efficiency
User-Defined Functions
Function Description
F1 to F20 User-defined functions
User-Defined Events
Function Description
Ev1 to Ev8 User-defined events
1-2
IM WT5000-01EN
Page 11

1 Items That This Instrument Can Measure
Harmonic Measurement Functions
Function Description Input Element Wiring Unit
U(k) Rms voltage of harmonic order k Ye s Ye s
I(k) Rms current of harmonic order k Yes Ye s
P(k) Active power of harmonic order k Yes Ye s
S(k) Apparent power of harmonic order k Yes Ye s
Q(k) Reactive power of harmonic order k Yes Yes
λ(k) Power factor of harmonic order k Yes Yes
Φ(k) Phase difference between the voltage
and current of harmonic order k
ΦU(k) Phase difference between the
fundamental signal, U(1), and
harmonic voltage U(k)
ΦI(k) Phase difference between the
fundamental signal, I(1), and harmonic
current I(k)
Z(k) Impedance of the load circuit Yes No
Rs(k) Series resistance of the load circuit Yes No
Xs(k) Series reactance of the load circuit Yes No
Rp(k) Parallel resistance of the load circuit Yes No
Xp(k) Parallel reactance of the load circuit Ye s No
Uhdf(k) Harmonic voltage distortion factor Ye s No
Ihdf(k) Harmonic current distortion factor Ye s No
Phdf(k) Harmonic active power distortion factor Yes No
Uthd Total harmonic voltage distortion Yes No
Ithd Total harmonic current distortion Ye s No
Pthd Total harmonic active power distortion Yes No
Uthf Telephone harmonic factor of the
voltage
Ithf Telephone harmonic factor of the
current
Utif Telephone influence factor of the
voltage
Itif Telephone influence factor of the
current
hvf Harmonic voltage factor Yes No
hcf Harmonic current factor Ye s No
K−factor K factor Yes No
1
ΦUi−Uj
Phase difference between the
fundamental voltage of element i,
Ui(1), and the fundamental voltage of
element j, Uj(1)
1
ΦUi−Uk
Phase difference between Ui(1) and
the fundamental voltage of element k,
Uk(1)
1
ΦUi−Ii
Phase difference between Ui(1) and
the fundamental current of element i,
Ii(1)
1
ΦUj−Ij
Phase difference between Uj(1) and
the fundamental current of element j,
Ij(1)
1
ΦUk−Ik
Phase difference between Uk(1) and
the fundamental current of element k,
Ik(1)
1 i, j, and k are input element numbers. For example, when the number of input elements in wiring unit ΣA is
six and the wiring system of elements 1, 2, and 3 is three phase, four wire, i is 1, j is 2, and k is 3. ΦUi – Uj
represents ΦU1 – U2, the difference between the fundamental voltage signal of element 1, U1(1), and the
fundamental voltage signal of element 2, U2(1). In the same way ΦUi – Uk, ΦUi – Ii, ΦUj – Ij, and ΦUk−Ik
represent to ΦU1 – U3, ΦU1 – I1, ΦU2 – I2, and ΦU3 – I3, respectively.
2 Setting i to an input element, is the same as setting k to 1 in Φ(k).
Yes No
Yes No
Yes No
Yes No
Yes No
Yes No
Yes No
No Yes
No Yes
2
Yes
Yes
No Yes
No Yes
IM WT5000-01EN
1-3
Page 12

1 Items That This Instrument Can Measure
Harmonic Measurement Function Orders
The harmonic orders that you can specify are indicated below.
Input Element Harmonic Measurement Functions
Measurement
Function
U( ) Yes Yes Ye s 2 to 500
I( ) Yes Ye s Ye s 2 to 500
P( ) Yes Ye s Yes 2 to 500
S( ) Yes Ye s Yes 2 to 100
Q( ) Yes Always zero Yes 2 to 100
λ( ) Ye s Ye s Yes 2 to 100
Φ( ) Yes No Yes 2 to 500
ΦU( ) No No No 2 to 500
ΦI( ) No No No 2 to 500
Z( ) No Yes Ye s 2 to 100
Rs( ) No Ye s Yes 2 to 100
Xs( ) No Yes Ye s 2 to 100
Rp( ) No Yes Ye s 2 to 100
Xp( ) No Ye s Yes 2 to 100
Uhdf( ) No Yes Ye s 2 to 500
Ihdf( ) No Ye s Ye s 2 to 500
Phdf( ) No Ye s Yes 2 to 500
Uthd Yes No No No
Ithd Yes No No No
Pthd Ye s No No No
Uthf Ye s No No No
Ithf Yes No No No
Utif Yes No No No
Itif Ye s No No No
hvf Yes No No No
hcf Yes No No No
K-factor Yes No No No
Functions with parentheses will produce different values depending on which of the following is contained in their
parentheses.
• Total: Total value (The total value of all harmonic components from the minimum order to N.* For information
about how the value is determined, see appendix 12 in the Getting Started Guide, IM WT5000-03EN.)
• 0(DC): DC value
• 1: Fundamental harmonic value
• k: The value of any order from 2 to N.*
Characters or Numbers in Parentheses
Total Value 0(DC) 1 k
* N is the maximum measurable order. he maximum measurable harmonic order is the smallest of the three
orders listed below.
• The specified maximum measurable harmonic order
• The value determined automatically according to the PLL source frequency (see section 6.7 in the Getting
Started Guide, IM WT5000-03EN)
• When the data update interval is 50 ms or Auto, the maximum measurable harmonic order is 100.
1-4
IM WT5000-01EN
Page 13

Click here.
1 Items That This Instrument Can Measure
Wiring Unit Harmonic Measurement Functions (Σ functions)
Measurement
Function
UΣ( ) Yes Ye s
IΣ( ) Yes Yes
PΣ( ) Ye s Yes
SΣ( ) Ye s Yes
QΣ( ) Ye s Ye s
λΣ( ) Ye s Yes
Characters or Numbers
in Parentheses
Total Value 1
Functions with parentheses will produce different values depending on which of the following is contained in their
parentheses.
• Total: Total value
• 1: Fundamental harmonic value
Delta Computation Functions
Function Description
U1
Δ
U2
Δ
U3
Δ
ΔUΣ
I
Δ
P1
Δ
P2
Δ
P3
Δ
ΔPΣ
For details about delta computation functions, see “Delta Computation (Δ Measure).”
The values returned by the delta computation
functions vary depending on the specified delta
computation type.
Motor Evaluation Functions (Option)
Function Description Motor Number Input Element
Speed Motor rotating speed Yes No
Torque Motor torque Yes No
SyncSp Synchronous speed Yes No
Slip Slip (%) Yes No
Pm Mechanical output of the motor
(mechanical power)
EaM1U,
EaM1I
EaM3U,
EaM3I
Electrical angles: Phase angles of the
fundamental waves of U1 to I7 with
the rising edge of the signal received
through the Motor1 (MTR1) Z terminal
of the motor evaluation function as the
reference (specify an input element).
Electrical angles: Phase angles of the
fundamental waves of U1 to I7 with
the rising edge of the signal received
through the Motor3 (MTR2) Z terminal
of the motor evaluation function as the
reference (specify an input element).
Yes No
No Yes
No Yes
Auxiliary Input Measurement Functions (Option)
Function Description
Aux1 to 8 Auxiliary inputs 1 to 8
IM WT5000-01EN
1-5
Page 14

1 Items That This Instrument Can Measure
Measurement Range
Function Description Input Element Motor Number
RngU Voltage measurement range Yes No
RngI Current measurement range Ye s No
RngSpd Speed measurement range No Yes
RngTrq Torque measurement range No Ye s
RngAux1 to 8 Aux measurement range No No
For measurement range functions, data can be acquired using the following methods.
• By setting a user-defined function
• By storing or by saving numeric data
• By outputting through communication
1-6
IM WT5000-01EN
Page 15

Click here.
Click here.
Click here.
1 Items That This Instrument Can Measure
What Is a Measurement Function?
Measurement Function
The physical values (such as rms voltage, average current, power, and phase difference) that this instrument
measures and displays and measurement range and other measurement information are called measurement
functions. Each measurement function is displayed using symbols that correspond to its physical value. For
example, “Urms” corresponds to the true rms voltage.
Element
Element refers to a set of input terminals that can receive a single phase of voltage and current to be measured.
This instrument can contain up to seven elements, numbered from 1 to 7. An element number is appended to
the measurement function symbol for the measured data that this instrument displays, so that you can tell which
data belongs to which element. For example, “Urms1” corresponds to the true rms voltage of element 1.
Wiring System
You can specify five wiring systems on this instrument to measure the power of various single-phase and
threephase power transmission systems: single-phase, two-wire; single-phase, three-wire; three-phase, threewire; three-phase, four-wire; and three-phase, three-wire with three-voltage, three-current method.
Wiring Unit
The wiring unit is a set of two or three input elements of the same wiring system that are grouped to measure
three-phase power. There can be up to three wiring units: ΣA, ΣB, and ΣC.
Σ Functions
The measurement function of a wiring unit is called a Σ function.
For example, “UrmsΣA” corresponds to the average of the voltages of the input elements that are assigned to
the wiring unit ΣA. The average value represents the true rms value.
Element number
3
Three-phase
three-wire
Wiring system
Wiring unit
4 5 6 7
Three-phase
four-wire
Σ
B
Σ
C
Voltage input
Current input
1
Three-phase
three-wire
2
Σ
A
Measurement Period
For information about the measurement period for computing measurement functions, see “Measurement Period
(SYNC SOURCE).”
IM WT5000-01EN
1-7
Page 16

2 Setup Menu
Click here.
This section explains the following settings:
• Navigation
• Setup Menu (Setup, SETUP)
Navigation
When you start the instrument, the navigation window appears.
Select whether to display the setup menu to configure the instrument or not display the setup menu and change
to the measurement screen.
Setup Menu (Setup, MENU(SETUP))
Configure or execute the following items according to how the instrument is to be used.
• Measurement Mode (Measurement Mode)
• Input Settings (Basic Measurement Conditions, Input (Basic))
• Input Settings (Advanced/Options, Input (Advanced/Options))
• Computation/Output (Computation/Output)
• Utility (Utility)
• Initialize Settings (Initialize Settings)
• File List (File List)
• Save Setup (Save Setup)
• Load Setup (Load Setup)
Measurement Mode (Measurement Mode)
The measurement mode is fixed to normal measurement (Normal).
Initialize Settings (Initialize Settings)
You can reset the instrument settings to their factory default values. This feature is useful when you want to
cancel all the settings that you have entered or when you want to redo measurement from scratch.
For information about how initialize the settings, see section 3.7 in the Getting Started Guide, IM WT5000-03EN.
File List (File List)
You can perform file operations such as creating folders on the storage device, deleting and copying files, and
changing file names.
Storage Device Displayed in the File List
IM WT5000-01EN
2-1
Page 17

2 Setup Menu
Up to 512 files and folders can be displayed in the file list. If there are more than a total of 512 files and
folders in a given folder, the file list for that folder will display only 512 files and folders. There is no way to set
which files and folders are displayed.
Display Format
Select whether to display the file list in a one-column list, two-column list, or using thumbnails.
Sorting the File List
You can sort the file list by file name, size, or date and time.
Selecting Files
Select the files or folders you want to manipulate. Selecting multiple files is useful when you want to copy or
delete multiple files at the same time.
Selecting Files Collectively
• Selecting All Files
When the cursor is on a device or folder in the file list, select ALL Set to select all of the files and folders within
the device or folder that the cursor is on.
• Deselecting All Files
All of the selected files and folders are deselected.
Making Folders (New folder)
You can make folders. You can use the same characters in folder names that you can in file names.
Copying (Copy)
You can copy selected files and folders to other storage devices or folders. You can copy multiple files at the
same time.
Moving (Move)
You can move selected files and folders to other storage devices or folders. You can move multiple files at the
same time.
Renaming (Rename)
You can rename a selected file or folder.
Protecting (Protect)
You can set or release the protection of selected files.
Deleting (Delete)
You can delete selected files and folders.
2-2
IM WT5000-01EN
Page 18

Click here.
Second
20180130_121530_0 (2018/01/30 12:15:30)
Sequence number (0 to 9 then A to Z) for when multiple files
Click here.
2 Setup Menu
Saving Setup Data (Save Setup, SAVE(SETUP))
You can save the setup data of this instrument to the specified storage device. The date, time, and
communication setup parameters are not saved.
The extension is .SET.
File List (File List)
On the file list, specify the save destination. You can perform file operations such as creating folders on the
storage device, deleting and copying files, and changing file names.
Auto Naming (Auto Naming)
OFF
The auto naming feature is disabled. The name that you specify using the File Name setting is used. If there is a
file with the same name in the save destination folder, you cannot save the data.
Auto Numbering (Numbering)
This instrument automatically adds a four-digit number from 0000 to 0999 after the common name specified
using the File Name setting and saves files.
Date (Date)
The date and time when the file is saved are used as its name. The file name specified for the File Name setting
is ignored.
Year
Month
Day
Hour
Minute
A sequence number is appended to the date and time when multiple files are saved at the same time (second).
The number starts at 0 and is incremented by one each time a file is added. The number 9 is followed by letters
of the alphabet.
Save Destination Folder for Storage Caused by User-Defined Events
are saved at the same time (second)
File Name (File Name)
You can set the common file name that is used when the auto naming feature is turned off or when the auto
naming feature is set to Numbering. The maximum number of characters that you can use for file names and
folder names is 32 characters. The following restrictions apply.
• Of those characters on the keyboard that appears on the screen, the characters that can be used are 0-9,
A-Z, a-z, _, –, =, (, ), {, }, [, ], #, $, %, &, ~, !, `, and @. @ cannot be entered consecutively.
• The following exact strings cannot be used due to MS-DOS limitations:
AUX, CON, PRN, NUL, CLOCK, LPT1, LPT2, LPT3, LPT4, LPT5, LPT6, LPT7, LPT8, LPT9, COM1, COM2,
COM3, COM4, COM5, COM6, COM7, COM8, COM9
• Keep the full path name (absolute path from the root folder) within 255 characters. If this is exceeded, an
error will occur when you perform file operations (save, copy, rename, create folder, etc.). When an operation
is being performed on a folder, the full path is up to the name of the folder. When an operation is being
performed on a file, the full path is up to the name of the file.
The following additional restrictions apply when you use the file name auto naming feature.
• If you set auto naming to Numbering, a file name will consist of the characters that you entered for the file
name and a four-character sequence number.
• If you set auto naming to Date, the characters that you entered for the file name will not be used. File names
will only consist of the date information.
IM WT5000-01EN
2-3
Page 19

Click here.
2 Setup Menu
Comment (Comment)
You can add a comment that consists of up to 30 characters when you save a file. You do not have to enter a
comment. You can use all characters and spaces that are displayed on the keyboard.
Settings That Are Shared with Those of Other Menus
The following settings are shared by the menus for saving setup data, storing data, saving data.
• File list display and save destination settings (File List)
• Automatic file naming settings (Auto Naming)
• File name (File Name)
The comment settings (Comment) are shared by the menus for saving setup data and storing data.
Saving (Save Exec)
Saves the data to the specified save destination with the specified file name.
Loading Setup Data (Load Setup, LOAD(SETUP))
On the file list, specify a file to load setup data from. The extension is .SET. For information about how to
configure the file list display and how to operate files and folders, see “File List (File List).”
Loading (Execute Load)
Loads the data of the specified file.
• If you change the extension of the saved data file, by using a PC or some other device, the instrument will
no longer be able to load it.
• When setup data is loaded from a file, the setup data for each key is changed to match the loaded settings,
and it cannot be changed back. We recommend that you save the current settings before loading different
setup data.
• The date, time, and communication setup parameters are not saved. So even if you load setup data from a
file, the date, time, and communication settings will not change.
• This instrument cannot load setup data that has been saved by a product with an incompatible firmware
version.
• This instrument cannot load setup data that was saved by an instrument with a different element
configuration, different options, etc.
2-4
IM WT5000-01EN
Page 20

3 Input Settings (Basic Measurement Conditions)
Input Settings (Basic Measurement Conditions, Input (Basic))
You can specify the following items.
• Wiring system (Wiring)
• Selecting the element for setting the measurement range (Element1 to 7, 1 to 7 (ELEMENTS))
• Voltage range (Voltage, VOLTAGE RANGE)
• Auto voltage range (Auto (Voltage), AUTO)
• Current range (Current, CURRENT RANGE)
• Auto current range (Auto (Current), AUTO)
• External current sensor on/off (Ext Sensor)
• External current sensor conversion ratio (Sensor Ratio)
• Scaling (Scaling)
• Line filter (Line Filter)
• Frequency filter (Freq Filter)
• Measurement Period (Sync Source)
Wiring System (Wiring)
The following five wiring systems are available on the instrument. The selectable wiring systems vary depending
on the number of installed input elements.
• 1P2W: Single-phase two-wire system
• 1P3W: Single-phase three-wire system
• 3P3W: Three-phase three-wire system
• 3P4W: Three-phase four-wire system
• 3P3W(3V3A): Three-voltage three-current method
Wiring Unit
Wiring units are sets of two or three input elements of the same wiring system that are grouped together. You
can define up to three wiring units: ΣA, ΣB, and ΣC.
• When there is one wiring unit, that unit is ΣA. You cannot make ΣB or ΣC the first wiring unit.
• When there are two wiring units, those units are ΣA and ΣB. You cannot make ΣC one of the first two wiring
units.
• When there are three wiring units, those units are ΣA, ΣB, and ΣC.
• When there are multiple wiring units, element numbers are assigned to them in ascending order. The element
numbers are assigned to ΣA, ΣB, and then ΣC.
• Wiring units are composed of input elements that are next to each other. Wiring units cannot consist of input
elements that are not next to each other.
• Wiring units cannot consist of input elements that are different types.
Σ Functions
The measurement function of a wiring unit is called a Σ function.
For example, “UrmsΣA” corresponds to the average of the voltages of the input elements that are assigned to
the wiring unit ΣA. The average value represents the true rms value.
IM WT5000-01EN
3-1
Page 21
When the wiring systems
of elements 1 to 7 are set
to single-phase two-wire
When the wiring system of elements 1, 2, and 3 is
of elements 5 and 6 is set to three-phase three-wire
3 Input Settings (Basic Measurement Conditions)
Wiring System Combinations
You can configure any pattern that meets the conditions for wiring units described above.
For details about the relationship between wiring systems and how the values of the measurement functions are
determined, see appendix 1 in the Getting Started Guide, IM WT5000-03EN.
Select the wiring system to match the actual wiring of the circuit under measurement. he method in which the
Σ functions (wiring unit measurement functions) are determined varies depending on the wiring system. If the
selected wiring system does not match the wiring of the actual circuit, measurements and computation will not
be correct.
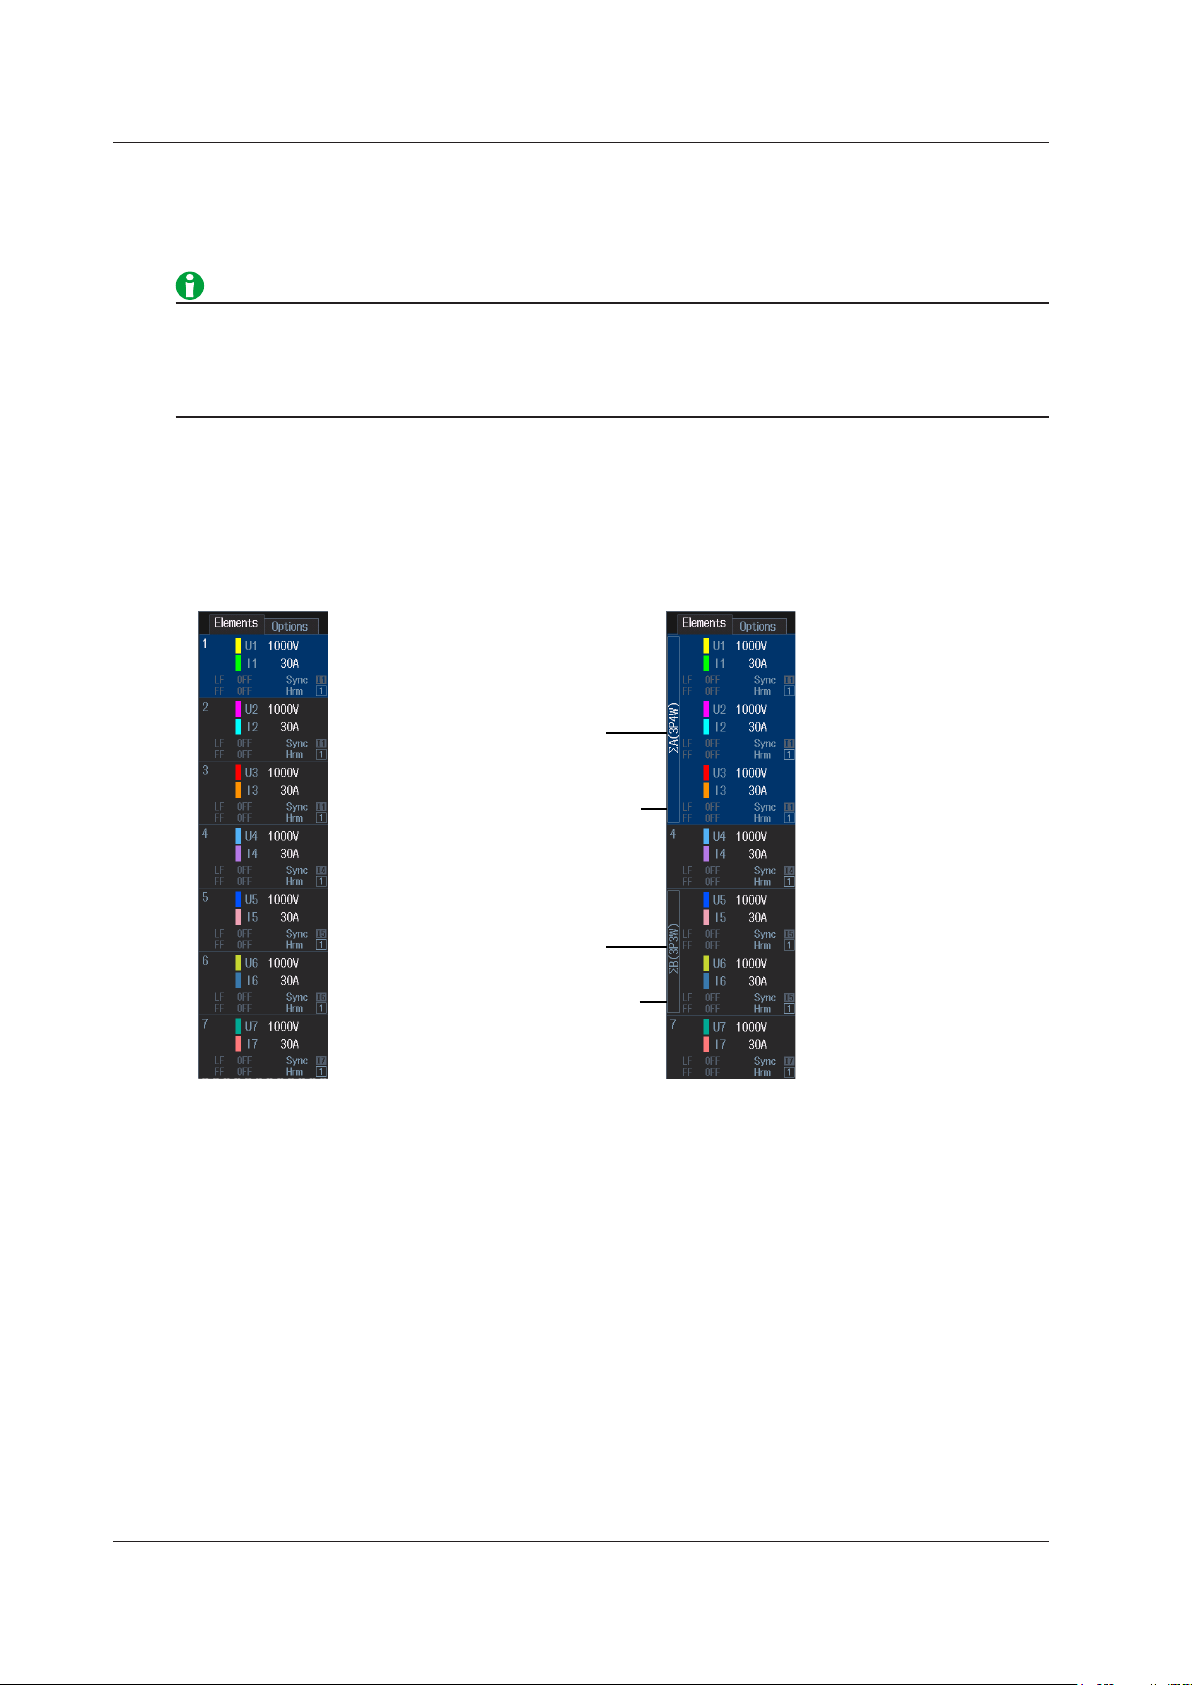
Wiring System Display
The wiring system settings are displayed on the Elements tab in the input information area on the right side
of the screen. The figure below shows wiring system display examples for a model with seven input elements
installed.
set to three-phase four-wire and the wiring system
Settings of Elements Grouped in a Wiring Unit
If a wiring system other than 1P2W is selected when the measurement range, valid measurement range, or sync
source settings of each input element are different, these settings are changed in the manner described below:
• When range Σ link is set to on, the measurement range is set to the greatest of the measurement ranges of
the input elements assigned to the same wiring unit. The external current sensor input range has precedence
over the direct input current range.
• When range Σ link is set to on, The auto range on/off settings are changed to match the setting of the
input element whose measurement range is highest. If multiple input elements are set to a common
highest measurement range, the setting of the input element with the smallest input element number takes
precedence.
• When range Σ link is set to on, in the valid measurement range settings, all measurement ranges are enabled
(selected).
• The sync source, line filter, frequency filter, and the group of the harmonic measurement input element are
set to the settings of the input element with the smallest input element number among the input elements
assigned to the same wiring unit.
At the same time that you press 1 to 7 (ELEMENTS) to select the element that you want to set the voltage or
current range of, the keys of the input elements that have been assigned to the same wiring unit illuminate.
3-2
Wiring unit and system
The elements that compose
the wiring unit are shown
in the frame.
Wiring unit and system
The elements that compose
the wiring unit are shown
in the frame.
IM WT5000-01EN
Page 22

3 Input Settings (Basic Measurement Conditions)
Selecting the Element for Setting the Measurement Range (Element1 to 7, 1 to 7 (ELEMENTS))
The following methods are available for selecting the element for setting the measurement range.
• 1 to 7 (ELEMENTS) keys
• Element 1 to 7 of the S menu
When range Σ link is set to on, the selected elements will switch for each wiring unit according to the wiring
system.
IM WT5000-01EN
3-3
Page 23

Click here.
3 Input Settings (Basic Measurement Conditions)
Voltage Range (Voltage, VOLTAGE RANGE)
The voltage range can be fixed (when auto range is set to off) or determined automatically (when auto range is
set to on).
Fixed Ranges
When the voltage range is fixed, you can select a range from the available options. The selected voltage range
does not change even if the amplitude of the input signal changes. Set the range in reference to the rms value of
the input signal.
760901 (30A High Accuracy Element), 760902 (5A High Accuracy Element)
• When the Crest Factor Is Set to CF3
Select from 1.5V, 3V, 6V, 10V, 15V, 30V, 60V, 100V, 150V, 300V, 600V, and 1000V.
• When the Crest Factor Is Set to CF6 or CF6A
Select from 0.75V, 1.5V, 3V, 5V, 7.5V, 15V, 30V, 50V, 75V, 150V, 300V, and 500V.
Auto range
• Set the range in reference to the rms value of the input signal. For example, if you are applying a 100-Vrms
sinusoidal signal, set the range to 100 V.
• When measuring a signal other than a sine wave (such as a distorted wave), you can obtain accurate
measurements by selecting the smallest measurement range that does not produce any of the conditions
below.
• The input peak over-range indicator at the top of the screen illuminates or blinks in red.
• The measured values of the voltage and current are indicated as being overload values (“-OL-”).
• The peak over-range indicator may not illuminate or blink in the following cases.
• If the pulse width is narrow, and the peak value of the waveform cannot be acquired at the sampling rate
of this instrument (approximately 10 MS/s).
• If the high frequency components of the pulse waveform attenuate due to the bandwidth limitations
of this instrument measurement circuit, causing the waveform peak value to be less than the peak
overrange detection level.
• When the secondary output of a VT (voltage transformer) is being applied to the voltage input terminal, set
the voltage range according to the maximum value of the VT output. Then, use the scaling feature to set
the VT ratio.
3-4
IM WT5000-01EN
Page 24

3 Input Settings (Basic Measurement Conditions)
Auto Voltage Range (Auto (Voltage), AUTO (VOLTAGE RANGE))
When auto range is turned on, the range change automatically according to the amplitude of the input signal as
described below. The different ranges used in the auto range are the same as those available for the fixed range.
760901 (30A High Accuracy Element), 760902 (5A High Accuracy Element)
Range increase
The measurement range is increased when any of the following conditions is met.
• The crest factor is set to CF3 or CF6 and the data of measurement function Urms or Irms exceeds 110% of
the measurement range.
• The crest factor is set to CF6A and the data of measurement function Urms or Irms exceeds 220% of the
measurement range.
• The crest factor is set to CF3 and the data of Upk* or Ipk* exceeds approximately 310% of the measurement
range.
• The crest factor is set to CF6 or CF6A and the data of Upk* or Ipk* exceeds approximately 620% of the
measurement range.
* Even if the null feature is on, the values are determined as if it were off.
• When a wiring unit is configured, the measurement range is increased on all input elements in the wiring unit
when any of the elements in the unit meets the range-increase conditions described above.
Range decrease
The measurement range is decreased when all the following conditions are met.
• The data of Urms or Irms is less than or equal to 30% of the measurement range.
• The data of Urms or Irms is less than or equal to 105% of the next lower range.
• The crest factor is set to CF3 and the data of Upk* or Ipk* is less than or equal to 290% of the next lower
range.
• The crest factor is set to CF6 or CF6A and the data of Upk* or Ipk* is less than or equal to 580% of the next
lower range.
* Even if the null feature is on, the values are determined as if it were off.
• When a wiring unit is configured, the measurement range is decreased on all input elements in the wiring unit
when all the elements in the unit meets the range-decrease conditions described above.
• If you disable a measurement range in the valid measurement range settings, that measurement range is
• When non-periodic pulse waveforms are applied, the range may not remain constant. If this happens, use
IM WT5000-01EN
skipped, and the auto range feature operates using only the valid measurement ranges.
the fixed range setting.
3-5
Page 25

Click here.
Click here.
3 Input Settings (Basic Measurement Conditions)
Current Range (Current, CURRENT RANGE)
The current range can be fixed (when auto range is set to off) or determined automatically (when auto range is
set to on).
Fixed Ranges
When the current range is fixed, you can select a range from the available options. The selected current range
does not change even if the amplitude of the input signal changes. Set the range in reference to the rms value of
the input signal.
760901(30A High Accuracy Element)
• When the Crest Factor Is Set to CF3
Select from 500mA, 1A, 2A, 5A, 10A, 20A, and 30A.
• When the Crest Factor Is Set to CF6 or CF6A
Select from 250mA, 500mA, 1A, 2.5A, 5A, 10A, and 15A.
760902 (5A High Accuracy Element)
• When the Crest Factor Is Set to CF3
Select from 5mA, 10mA, 20mA, 50mA, 100mA, 200mA, 500mA, 1A, 2A, and 5A.
• When the Crest Factor Is Set to CF6 or CF6A
Select from 2.5mA, 5mA, 10mA, 25mA, 50mA, 100mA, 250mA, 500mA, 1A, and 2.5A.
Auto range
This is the same as the auto range feature for voltage.
• When the secondary output of a CT (current transformer) or a clamp-type current sensor that outputs
current is being applied to the current input terminal, set the current range according to the maximum value
of the CT or current sensor output. Then, use the scaling feature to set the CT ratio or the conversion ratio
of the clamp-type current sensor that outputs current.
Auto Current Range (Auto (Current), AUTO (CURRENT RANGE))
This is the same as the auto range feature for voltage.
3-6
IM WT5000-01EN
Page 26

Click here.
3 Input Settings (Basic Measurement Conditions)
External Current Sensor On/Off (Ext Sensor)
To apply the output of current sensors that produce voltage, such as shunts and clamps, to an element’s external
current sensor input terminal (EXT) and perform measurements, set Ext Sensor to on.
External Current Sensor Range
Set the external current sensor range according to the output of the external current sensor.
The external current sensor range can be fixed (when auto range is set to off) or determined automatically (when
auto range is set to on).
Fixed Ranges
When the current range is fixed, you can select a range from the available options. The selected current range
does not change even if the amplitude of the input signal changes. Set the range in reference to the rms value of
the input signal.
760901 (30A High Accuracy Element), 760902 (5A High Accuracy Element)
• When the Crest Factor Is Set to CF3
Select from 50mV, 100mV, 200mV, 500mV, 1V, 2V, 5V, and 10V.
• When the Crest Factor Is Set to CF6 or CF6A
Select from 25mV, 50mV, 100mV, 250mV, 500mV, 1V, 2.5V, and 5V.
Auto range
This is the same as the auto range feature for voltage.
IM WT5000-01EN
3-7
Page 27

Click here.
3 Input Settings (Basic Measurement Conditions)
External Current Sensor Conversion Ratio (Sensor Ratio)
Set the conversion ratio used to measure the signal received by the external current sensor input terminal (EXT)
from a current sensor that produces voltage. Set how many millivolts the current sensor transmits when 1 A of
current is applied (conversion ratio). Then, the input signal can be made to correspond to the numeric data or
waveform display data that is obtained when the current is directly applied to the current input terminals.
When using a current sensor that produces current, set the conversion ratio as the CT ratio.
Measurement Function Conversion
Ratio
Current I E I
Active Power P E P
Apparent power S E S
Reactive power Q E Q
Max./min. current Ipk E Ipk
Data before Conversion Conversion
Result
(current sensor output) IS/E
S
S
S
S
(current sensor output) IpkS/E
S
PS/E
SS/E
QS/E
Selectable range: 0.0001 to 99999.9999
External Current Sensor Range and Conversion Ratio Configuration Example
When you measure a current with a maximum value of 100 A using a current sensor that produces 10 mV
when 1 A of current is flowing, the maximum voltage that the current sensor produces is 10 mV/A × 100 A = 1 V.
Therefore, configure the settings as indicated below.
• External current sensor range: 1 V
• External current sensor conversion ratio: 10 mV/A
• When you want to divide the external current sensor output by the conversion ratio and read the current of
the circuit under measurement directly, turn the external VT/CT scaling feature off. If the feature is turned
on, the value will be further multiplied by the CT ratio.
• When you are measuring a signal other than a sine wave (such as a distorted wave), you can obtain
accurate measurements by selecting the smallest measurement range that does not produce any of the
conditions below.
• The input peak over-range indicator at the top of the screen illuminates or blinks in red.
• The measured values of the voltage and current are indicated as being overload values (“-OL-”).
3-8
IM WT5000-01EN
Page 28

Click here.
3 Input Settings (Basic Measurement Conditions)
Power Range
The measurement ranges (power ranges) of active power (P), apparent power (S), and reactive power (Q) are
as follows:
Wiring System Power Range
1P2W (single-phase two-wire) Current range × voltage range
1P3W (single-phase three-wire)
3P3W (three-phase three-wire)
3P3W (3V3A, three-voltage
three-current method)
3P4W (three-phase four-wire) Voltage range × current range × 3
• When the result of the equation voltage range × current range exceeds 1000 W (VA or var), the displayed unit
changes to kW (kVA or kvar).
• Number of displayed digits (display resolution)
For a detailed list of the available voltage and current range combinations and power ranges when all the
elements have the same voltage or current range, see appendix 4 in the Getting Started Guide, IM WT500003EN.
Voltage range × current range × 2
(when the voltage and current ranges on the elements in the
wiring unit are set to the same range)
(when the voltage and current ranges on the elements in the
wiring unit are set to the same range)
In auto range mode, because the voltage and current ranges switch independently according to range
increase and decrease conditions, different power ranges may be set for the same power value.
IM WT5000-01EN
3-9
Page 29

3 Input Settings (Basic Measurement Conditions)
Scaling (Scaling)
You can set coefficients for when you apply a voltage or current signal from an external VT (voltage transformer)
or CT (current transformer).
Turning Scaling On and Off (Scaling)
You can select whether to apply the VT ratio, CT ratio, and power coefficient to applicable measurement
functions.
When reading measured values directly by using a VT or CT (or current sensor), select ON. When you select
ON, the “Sc” indicator turns on in the input information area on the right side of the screen.
Applicable Measurement Functions
Voltage (U), current (I), power (P, S, and Q), maximum and minimum voltages (U+pk and U-pk), and maximum
and minimum currents (I+pk and I-pk)
• ON: The measurement functions above are multiplied by the VT ratio, CT ratio, or power coefficient.
• OFF: The measurement functions above are not multiplied by the VT ratio, CT ratio, or power coefficient. The
output values of the VT and CT are displayed directly as numeric data.
VT Ratio (VT Scaling)
Set the VT ratio when applying the secondary output of a VT to the voltage input terminal. Then, set the voltage
range according to the maximum VT output.
Selectable range: 0.0001 to 99999.9999
CT Ratio Preset (CT Preset)
• When using the CT sold separately
Select the CT ratio from the preset settings. Select a preset (CT name) from the following:
Preset CT Ratio (CT Ratio)
Others Set using the number setting box.
CT2000A 2000.0000
CT1000 1500.0000
CT200 1000.0000
CT60 600.0000
If you set this item, the scaling ON/OFF (Scaling) is set to ON.
• When using other sensors
Select Others. If you select Others, the scaling ON/OFF and CT ratio do not change.
CT Ratio (CT Scaling)
Set the CT ratio (or the conversion ratio of the current sensor that produces current) when applying the
secondary output of a CT or clamp-type current sensor that produces current to the current input terminal. Then,
set the current range according to the maximum CT or current sensor output.
Selectable range: 0.0001 to 99999.9999
3-10
IM WT5000-01EN
Page 30

3 Input Settings (Basic Measurement Conditions)
Power Coefficient (SF Scaling, Scaling Factor)
By setting the power coefficient (SF), you can display the measured active power, apparent power, and reactive
power after they have been multiplied by a coefficient.
Measurement Function Data before Conversion Conversion Result
Voltage U U
Current I I
Active power P P
Apparent power S S
Reactive power Q Q
Max./min. voltage Upk Upk
Max./min. current Ipk Ipk
Selectable range: 0.0001 to 99999.9999
• If the value of the result of multiplying the measured value by the VT ratio, CT ratio, or power coefficient
(scaling factor) exceeds 9999.99 M, “-OF-” will appear in the numeric data display frame.
• To correctly compute the power and efficiency of Σ functions, set the power coefficients of all elements so
that all power units used in the computation are the same. For example, the efficiency cannot be computed
correctly if elements or wiring units used in the computation have different power units, such as W (watt)
and J (joule). To compute the efficiency correctly, make all the power units the same (either all W or all J).
(secondary output of the VT) U2×V V: VT ratio
2
(secondary output of the CT) I2×C C: CT ratio
2
2
2
2
(secondary output of the VT) Upk2×V
2
(secondary output of the CT) Ipk2×C
2
P2×V×C×SF SF: Power coefficient
S2×V×C×SF
Q2×V×C×SF
Copying the VT Ratio, CT Ratio, or Power Coefficient (Exec Copy Σ)
Copying the VT Ratio (VT Scaling Copy Exec)
Copy the VT ratio of the selected input element to the other input elements in the same wiring unit.
Copying the CT Ratio (CT Scaling Copy Exec)
Copy the CT ratio of the selected input element to the other input elements in the same wiring unit.
Copying the Power Coefficient (SF Scaling Copy Exec)
Copy the power coefficient of the selected input element to the other input elements in the same wiring unit.
Because the scaling feature sets each input element independently, regardless of the range Σ link on /off
setting, execute copying if necessary.
IM WT5000-01EN
3-11
Page 31

Voltage/
current input
Frequency measurement
filter
Click here.
Click here.
3 Input Settings (Basic Measurement Conditions)
Line Filter (Line Filter)
There are two types of input filters, line filters and frequency filters.
Because the 1 MHz line filter is inserted as shown in the following figure, it affects normal measurement,
harmonic measurement, and frequency measurement (for details, see the block diagram in appendix 11 of the
Getting Started Guide, IM WT5000−03EN).
Line filter
(1 MHz)
Line filter
(0.1 kHz to
100.0 kHz)
Frequency
Normal measurement
Harmonic measurement
• You can set the line filter type by specifying Line Filter Type under line filter (Line Filter) in the input settings
(advanced/options).
• When Line Filter Advanced Settings under line filter (Line Filter) in the input settings (advanced/options) is
set to on, that filter function is enabled, and the settings explained in this section are disabled.
Turning the Line Filter On and Off (Line Filter)
When the line filter is turned on, measured values will not contain high frequency components. Thus, the voltage,
current, and power of inverter waveforms, strain waveforms, etc., can be measured with their high frequency
components eliminated.
Turning it off disables the line filter.
When the line filter is turned on, the accuracy and the upper limit of the measurement band change. For details,
see sections 6.15 and 6.16 in the Getting Started Guide, IM WT5000−03EN.
Cutoff Frequency (CutOff)
Set the cutoff frequency in the following range.
0.1 kHz to 100.0 kHz (in 0.1 kHz steps), 1 MHz
The line filter functions as shown in the above figure according to the set frequency.
The line filter setting (off, or the cutoff frequency when set to on) is shown on the Elements tab of the input
information area.
3-12
IM WT5000-01EN
Page 32

Voltage/
current input
Frequency measurement
filter
3 Input Settings (Basic Measurement Conditions)
Frequency Filter (Freq Filter)
Turning the Frequency Filter On and Off (Freq Filter)
Because the frequency filter is inserted as shown in the following figure, it affects frequency measurement (see
the block diagram in appendix 11 of the Getting Started Guide, IM WT5000−03EN).
Line filter
(1 MHz)
Frequency
Normal measurement
Harmonic measurement
Moreover, if the computing method is sync source period average, it affects the detection of the measurement
period for voltage, current, and power measurement. In this case, the frequency filter functions as a filter for
detecting the cross point of the sync source signal more accurately. The frequency filter is not inserted in normal
measurement or harmonic measurement. Therefore, the measured values include high frequency components
even when the frequency filter is turned on.
• This instrument detects the cross point with a hysteresis of approximately 5% of the measurement range.
• The frequency filter setting (off, or the cutoff frequency when set to on) is shown on the Elements tab of the
input information area.
• Even when the frequency filter is off, if the line filter (1 MHz) described earlier is on, the line filter (1 MHz) will
affect frequency measurement.
• We recommend that the frequency filter be turned on and the cutoff frequency set as follows according to the
input signal frequency.
Input Signal Frequency Cutoff Frequency of the Frequency Filter
100 Hz or less 0.1 kHz
1 kHz or less 1 kHz
100 kHz or less 100 kHz
Cutoff Frequency (CutOff)
Set the cutoff frequency in the following range.
0.1 kHz to 100.0 kHz (in 0.1kHz steps)
IM WT5000-01EN
3-13
Page 33

Data update interval
Sync source
Falling
Data update interval
Sync source
3 Input Settings (Basic Measurement Conditions)
Measurement Period (Sync Source)
When the Computing Method Is Sync Source Period Average
Measurement Period of Normal Measurement Functions
The measurement period is determined by the input signal that is used as the reference (sync source). The
measurement period is set within the data update interval between the first point where the sync source crosses
the specified level (center of the amplitude by default) on a rising slope (or falling slope) and the last point where
the sync source crosses the specified level on a rising slope (or falling slope).
Measurement period
Rising
If there is no more than one cross point within the data update interval, the measurement period is the entire
data update interval.
Measurement period
3-14
IM WT5000-01EN
Page 34

3 Input Settings (Basic Measurement Conditions)
The measurement period for determining the numeric data of the peak voltage or peak current is always the
entire span of the data update interval. Therefore, the measurement period for the measurement functions that
are determined on the basis of the maximum voltage or current value (U+pk, U-pk, I+pk, I-pk, CfU, P+pk, P-pk,
and CfI) is also the entire span of the data update interval.
For details, see appendix 5 in the Getting Started Guide, IM WT5000-03EN.
Measurement Period of Harmonic Measurement Functions
The measurement period is from the first sampled data in the data update interval to 1024 points or 8192 points
(selected with the number of FFT points setting) counted at the sampling frequency for harmonics.
This instrument determines the harmonic sampling frequency automatically based on the period of the signal
that is set as the PLL source. The sampling data and measurement period that are used to determine the
values of harmonic measurement functions may be different from those used to determine the values of normal
measurement functions.
Sync Source (Sync Source)
Select the signal to use as the sync source from the options listed below. The available options vary depending
on the installed elements. When range Σ link is set to on, elements in the same wiring unit have the same sync
source.
U1, I1, U2, I2, U3, I3, U4, I4, U5, I5, U6, I6, U7, I7, Ext Clk (external clock) 1, Z Phase 1 (Ch D) 2, Z Phase 3 (Ch
H) 2, None
1 When you select Ext Clk, the external signal applied to the external clock input connector (EXT CLK) on
the rear panel is used as the sync source. For the EXT CLK connector specifications, see section 4.3 in the
Getting Started Guide, IM WT5000-03EN.
2 Models with the motor evaluation 1 or 2 option
• If sync source is set to None
All of the sampled data within the data update interval is used to determine the numeric data.
When you are measuring DC signals, this method can be used to prevent noise from causing errors in the
detection of the measurement period.
• When the computing method is sync source period average, if the sync source is not set correctly, the
measured value may fluctuate or be incorrect. See appendix 5 in the Getting Started Guide, IM WT500003EN.
IM WT5000-01EN
3-15
Page 35

3 Input Settings (Basic Measurement Conditions)
When the Computing Method Is Digital Filter Average
The measurement period is determined by the data update interval and response speed. You do not need to set
the sync source (Sync Source).
3-16
IM WT5000-01EN
Page 36

4 Input Settings (Advanced/Options)
Input Settings (Advanced/Options, Input (Advanced/Options))
You can specify the following items.
• Measurement range (Range)
• Line filter (Line Filter)
• Frequency filter, rectifier, level (Freq Filter/Rectifier/Level)
• Null Feature (Null)
• Motor Evaluation/Auxiliary inputs (Motor/Aux)
Measurement Range (Range)
You can specify the following items.
• Crest factor (Crest Factor)
• Range Σ link (Range Σ Link)
• Display format of external current sensor range (Ext Sensor Range Display Format)
• Valid measurement range (Valid Measurement Range)
IM WT5000-01EN
4-1
Page 37

Peak value
Rms value
Crest factor (CF) =
Peak value
Input signal waveform
Peak value that can be input
Measurement range
Crest factor (CF) =
{measurement range × CF setting (3 or 6)}
Measured value (rms value)
Crest factor (CF) =
4 Input Settings (Advanced/Options)
Crest Factor (Crest Factor)
The crest factor is defined as the ratio of the peak value of the waveform to the rms value.
Rms value
On this instrument, the crest factor is the ratio of the maximum applicable peak value to the measurement range.
You can set the crest factor to CF3, CF6, or CF6A.
• CF3: The crest factor is 3.
• CF6: The crest factor is 6.
• CF6A: The input range of the measurement range is expanded as follows as compared to when the crest
factor is set to 6. This is used to suppress frequent range changes when measuring a distorted waveform in
auto range mode.
• Condition for increasing the range in auto range mode
The voltage or current exceeds 220% of the currently set measurement range.
• Condition that cause an overload indication (“- - O L - -”) (for details, see section 1.3 in the Getting Started
Guide, IM WT5000-03EN)
The measured voltage or current exceeds 280% of the currently set measurement range.
The measurable crest factor is as follows:
* However, the peak value of the input signal must be less than or equal to the maximum allowable input.
If the crest factor of the input signal is greater than the specifications of this instrument (the crest factor defined
at the rated input), you can measure the signal by setting a greater measurement range. For example, even
if CF is set to 3, measurement is possible for signals with a crest factor greater than or equal to 5 when the
measured value (rms value) is less than 60% of the measurement range. If the minimum effective input (1% of
the measurement range) is being applied when CF is set to 3, measurement for CF = 300 is possible.
The voltage range, current range, effective input range, and measurement accuracy vary depending on the crest
factor setting. For details, see chapter 6 in the Getting Started Guide, IM WT5000−03EN.
• When you change the crest factor, the following settings change for all elements.
• All elements are automatically set to their maximum voltage and current ranges.
• In the valid measurement range settings, all measurement ranges are enabled (selected).
• If the crest factor is set to CF6 or CF6A, the measurement conditions of crest factor 5 and higher required
by IEC 62018 are met.
• When measuring waveforms whose crest factor is less than or equal to CF3, you can achieve more
accurate measurements by setting the crest factor to 3.
4-2
IM WT5000-01EN
Page 38

4 Input Settings (Advanced/Options)
Range Σ link (Range Σ Link)
You can select whether to collectively or independently set the measurement ranges of input elements assigned
to the same wiring unit in the wiring system settings.
Turning Range Σ Link On and Off
For example, assume that the wiring system on a model with three input elements is set as follows:
Input elements 1 to 3: Three-phase, four-wire system (3P4W). Input elements 1 to 3 are assigned to a single
wiring unit ΣA.
• OFF
The measurement range can be set independently for each input element included in a wiring unit.
• ON
The measurement range of input elements 1 to 3 are set to the same setting. This is convenient because
when you are measuring a three-phase device, you can set the measurement range settings of all input
elements included in a wiring unit simultaneously.
Settings That Are Shared between Input Elements When Range Σ Link Is Set to On
• Measurement range (including auto range on or off)
• Direct current input or external current sensor input
• Valid measurement range
How Settings Are Aligned When Range Σ Link Is Changed from Off to On
When range Σ link is changed from off to on, the measurement range, direct current input or external current
sensor input, and valid measurement range settings of each input element in a wiring unit (ΣA, ΣB, or ΣC) are
changed as follows:
• The measurement range is set to the greatest of the measurement ranges of the input elements assigned to
the same wiring unit. The external current sensor input range has precedence over the direct input current
range. The external current sensor input range has precedence over the direct input current range.
• The auto range on/off settings are changed to match the setting of the input element whose measurement
range is highest. If multiple input elements are set to a common highest measurement range, the setting of
the input element with the smallest input element number takes precedence.
• In the valid measurement range settings, all measurement ranges are enabled (selected).
IM WT5000-01EN
4-3
Page 39

4 Input Settings (Advanced/Options)
Display Format of External Current Sensor Range (Ext Sensor Range Display Format)
You can select the external current sensor range display format from the following options.
• Direct input value display (Direct)
Values are displayed within the external current sensor range (voltage). This setting is useful when you want
to set the external current sensor range using the voltage received by this instrument from the external current
sensor as a guide.
• Measurement range display (Measure)
The external current sensor range is divided by the external current sensor conversion ratio, and the resulting
(current) range is displayed. This setting is useful when you want to set the external current sensor range
using the current measured by the external current sensor as a guide. For example, if you are using a current
sensor that produces 10 mV when it receives 1 A (external current sensor conversion ratio: 10 mV/A) and you
set the external current sensor range to 1 V, the displayed current range is 100 A.
4-4
IM WT5000-01EN
Page 40

4 Input Settings (Advanced/Options)
Valid Measurement Range (Valid Measurement Range)
his instrument switches between enabled measurement ranges. Disabled measurement ranges are skipped. For
example, when using auto range to measure the current of a device that produces 2 A when operating and 100
mA when in standby, disable the 200 mA, 500 mA, and 1 A ranges. When the device is in standby, the range will
be 200 mA. When the device begins operating, this instrument will skip the intermediate 200 mA, 500 mA, and 1
A ranges and switch directly to the 2 A range.
Valid Measurement Range (Valid Measurement Range)
Element1 to Element7
For each input element or wiring unit, you can set all ranges as valid measurement ranges (All ON).
Measurement Range Box (Left column of the list)
For each range, you can set whether the range is a valid measurement range for all input elements (All ON) or
not (All OFF).
Measurement Range to Switch to When a Peak Over-Range Occurs (Peak Over Jump)
You can specify which measurement range to switch to when the auto range feature is enabled and a peak
over-range occurs. The background of the selected measurement range turns yellow. If a peak over-range
occurs when this feature is disabled, this instrument increases the measurement range, switching between valid
measurement ranges (measurement ranges whose check boxes have been selected).
You can specify valid current measurement ranges for each input element type.
• 30A
Select the valid direct input measurement ranges of 30 A input elements.
• 5A
Select the valid direct input measurement ranges of 5 A input elements.
• Ext Sensor
Select the valid external current sensor input measurement range.
• You cannot set all measurement ranges to off. There must be at least one valid range.
• The settings for the valid range and for the measurement range to switch to when peak over-range occurs
are shared by all the input elements in a wiring unit.
• When range Σ link is on and you change the wiring system, all measurement ranges are enabled (set to
their initial setting).
• When range Σ link is changed from off to on, all measurement ranges are enabled (set to their initial
setting).
• If you set the valid range setting for the current measurement range to OFF, this instrument switches to the
next highest measurement range. If there is no measurement range above the current one, this instrument
switches to the next lowest measurement range.
IM WT5000-01EN
4-5
Page 41

4 Input Settings (Advanced/Options)
U
Measurement
Measurement
Click here.
Click here.
Line Filter (Line Filter)
You can set the line filter in detail.
When the line filter is turned on, the accuracy and the upper limit of the measurement band change. For details,
see sections 6.15 and 6.16 in the Getting Started Guide, IM WT5000−03EN.
Advanced Line Filter Setting (Line Filter Advanced Setting)
Turn the advanced line filter setting on or off.
When the Advanced Line Filter Setting Is Off
The line filter is configured as shown in the following figure. It is common low-pass filter for normal measurement
and harmonic measurement.
Normal
I
Line Filter Type (Line Filter Type)
Set the line filter type to Butterworth or Bessel.
However, if the cutoff frequency is set to 1 MHz, the line filter type is fixed to Bessel.
LPF
Harmonic
Turning the Line Filter On and Off (Line Filter)
This is the same as turning the line filter on and off in the input settings (basic measurement conditions). The
setting is shared.
Cutoff Frequency (CutOff)
This is the same as the line filter cutoff frequency in the input settings (basic measurement conditions). The
setting is shared.
Setting All Input Elements Collectively
If you select the top cell of each item in the table, you can set the item collectively on all input elements.
4-6
IM WT5000-01EN
Page 42

U
Measurement
Measurement
Aliased signal Input signal Sampled points
4 Input Settings (Advanced/Options)
When the Advanced Setting (Line Filter) Is On
The line filter consists of an AAF, DLF(N), and DLF(H). You can set a different line filter for normal measurement
and harmonic measurement.
Normal
I
Line Filter Type (DLF) (Line Filter Type (DLF))
Set the DLF(N) and DLF(H) types to Butterworth or Bessel.
Anti-Aliasing Filter (Anti-Aliasing Filter: AAF)
Turn the anti-aliasing filter to off or on (1 MHz).
When an FFT is taken through the performance of A/D conversion on a repetitive waveform, a phenomenon
occurs in which frequency components that exceed half the frequency of the sampling frequency are detected as
low frequency components. This phenomenon is called aliasing.
AAF DLF(N)
Harmonic
DLF(H)
If you use the 1 MHz anti-aliasing filter, harmonic components around 1 MHz and higher are removed to prevent
aliasing.
Digital Line Filter (for normal measurement) (Digital Line Filter (Normal): DLF(N))
Set the digital line filter for normal measurement.
• Turning DLF(N) On or Off (Digital Line Filter (Normal)
Turn DLF(N) on or off.
• Cutoff Frequency (Cutoff)
Set the DLF(N) cutoff frequency in the following range.
0.1 kHz to 100.0 kHz (in 0.1 kHz steps)
Digital Line Filter (for harmonic measurement) (Digital Line Filter (Harmonics): DLF(H))
Set the digital line filter for harmonic measurement.
• Turning DLF(H) On or Off (Digital Line Filter (Harmonics)
Turn DLF(H) on or off.
• Cutoff Frequency (Cutoff)
Set the DLF(H) cutoff frequency in the following range.
0.1 kHz to 100.0 kHz (in 0.1 kHz steps)
Setting All Input Elements Collectively
If you select the top cell of each item in the table, you can set the item collectively on all input elements.
IM WT5000-01EN
4-7
Page 43

Click here.
Click here.
Sync Src
Sync Src
U
Click here.
Click here.
4 Input Settings (Advanced/Options)
Frequency Filter, Rectifier, Level (Freq Filter/Rectifier/Level)
You can set the frequency filter in detail.
Sync Source and Frequency Measurement (Sync Source/Freq Measurement)
This instrument has a frequency filter for detecting the cross points of the sync source and measuring
frequencies.
You can set a high-pass filter (High Pass Filter: HPF), rectifier, low-pass filter (Low Pass Filter: LPF), and level to
remove unneeded low and high frequencies and measure the frequency of the waveform component you want
to measure.
Second frequency measurement (Freq2 Measurement)
This instrument can measure two frequencies for a single input signal. For example, if the voltage signal of
element 1 is a 50 Hz signal with a 1 kHz signal superimposed, the instrument can simultaneously measure
the 50 Hz as Freq and 1 kHz as Freq2. To measure the 50 Hz frequency, you would set the sync source and
frequency measurement described above, and to measure the 1 kHz frequency, you would set the frequency
filter of the second frequency measurement.
Sync Source and Frequency Measurement (Sync Source/Freq Measurement)
Advanced Frequency Filter Setting (Freq Filter Advanced Setting )
Turn the advanced frequency filter setting on or off.
When the Advanced Frequency Filter Setting Is Off
The frequency filter consists of a high-pass filter and a low-pass filter.
FreqU
LPFHPF
I
FreqI
• Frequency Filter (HPF)
The high-pass filter is fixed to on. The cutoff frequency is 0.1 Hz.
• Turning the Frequency Filter (LPF) On and Off (Freq Filter)
This is the same as turning the frequency filter on and off in the input settings (basic measurement
conditions). The setting is shared.
• Cutoff Frequency (Cutoff)
This is the same as the frequency filter cutoff frequency in the input settings (basic measurement conditions).
The setting is shared.
• Setting All Input Elements Collectively
If you select the top cell of each item in the table, you can set the item collectively on all input elements.
4-8
IM WT5000-01EN
Page 44

U
Sync Src
Sync Src
Click here.
Click here.
4 Input Settings (Advanced/Options)
When the Advanced Frequency Filter Setting Is On
The frequency filter consists of a high-pass filter, a rectifier, a low-pass filter, and a cross level.
Rectifier
HPF
I
Rectifier
LPF
Level
Level
FreqU
FreqI
• Turning the Frequency Filter (HPF) On and Off (Freq Filter)
Turn the frequency filter (HPF) on or off.
• HPF Cutoff Frequency (CutOff)
Set the HPF cutoff frequency in the following range.
0.1 Hz, 1 Hz, 10 Hz, 0.1 kHz to 100.0 kHz (in 0.1 kHz steps)
• Voltage Rectifier and Current Rectifier (Voltage Rectifier/Current Rectifier)
Select whether to rectify the voltage and current (on/off).
* If rectifier is set to ON, reactive power Q, phase difference Φ, and QΣ measurements may change. See
appendix 1 in the Getting Started Guide, IM WT5000-03EN.
• Turning the Frequency Filter (LPF) On and Off (Freq Filter)
This is the same as turning the frequency filter on and off in the input settings (basic measurement
conditions). The setting is shared.
• LPF Cutoff Frequency (CutOff)
This is the same as the frequency filter cutoff frequency in the input settings (basic measurement conditions).
The setting is shared.
• Voltage Cross Level and Current Cross Level (Voltage Level/Current Level)
You can set the voltage cross level and current cross level in the following ranges.
• When the rectifier is off: −100.0% to 100.0%
• When the rectifier is on: 0.0% to 100.0% (absolute value)
• Setting All Input Elements Collectively
If you select the top cell of each item in the table, you can set the item collectively on all input elements.
IM WT5000-01EN
4-9
Page 45

U
Freq2U
4 Input Settings (Advanced/Options)
Second frequency measurement (Freq2 Measurement)
Set the frequency filter of the second frequency measurement (Freq2 Measurement).
The frequency filter consists of a high-pass filter and a cross level.
Level
HPF
I
Level
• Turning the Frequency Filter (Freq2) On and Off (Freq Filter (Freq2))
Turn the frequency filter (Freq2) on or off.
• HPF Cutoff Frequency (CutOff)
Set the HPF cutoff frequency in the following range.
0.1 Hz, 1 Hz, 10 Hz, 0.1 kHz to 100.0 kHz (in 0.1 kHz steps)
• Voltage Cross Level (Freq2) and Current Cross Level (Freq2)) (Voltage Level (Freq2)/Current Level
(Freq2))
You can set the voltage cross level and current cross level in the following ranges.
• When the rectifier is off: −100.0% to 100.0%
• When the rectifier is on: 0.0% to 100.0% (absolute value)
Freq2I
• Setting All Input Elements Collectively
If you select the top cell of each item in the table, you can set the item collectively on all input elements.
4-10
IM WT5000-01EN
Page 46

4 Input Settings (Advanced/Options)
Null Feature (Null Settings)
You can use the null feature to subtract the DC offset while a measurement cable or external sensor is
connected.
Items to Configure Null Settings for (Target Element)
All (All)
Each time you tap Null or press NULL, you can enable or disable the null feature for all the following input
signals.
• U and I signals of each element
• Speed, Torque, and Aux signals (on models with the motor evaluation option)
Independent Selection (Select)
Tap Null or press NULL to select the input signals that you want to enable, hold, or disable the null feature for.
Voltage (U)
• All (All): You can enable or disable the null feature for the voltage signals of all elements at the same time.
• U1 to 7: You can enable or disable the null feature for the voltage signals of each element separately.
Current (I)
• All (All): You can enable or disable the null feature for the current signals of all elements at the same time.
• I1 to 7: You can enable or disable the null feature for the current signals of each element separately.
Motor/Aux (Options)
• All (All): You can enable or disable the null feature for the Speed, Torque, and Aux signals at the same time.
• Speed1 to 4, Torque1 to 4, Aux1 to 8: You can enable or disable the null feature for the Speed, Torque, and
Aux signals separately.
Null Status (Status)
Enable or disable the null feature for each input signal.
• ON: When you tap Null or press NULL, this Instrument sets or updates the null value. Afterwards, the null
value is used to correct the measurement function values.
• Hold (Hold): The function of this key varies depending on whether the null value has yet to be set or has
already been set.
• When the null value has yet to be set
When you enable the null feature, this Instrument sets the null value. Afterwards, the null value is used
to correct the measurement function values. Even if you disable the null feature in this condition, the null
value is stored in the instrument.
• When the null value has already been set
Even if you enable the null feature, the null value is not updated. The saved null value discussed above is
used to correct the measurement function values.
For example, if you turn on the power and then immediately enable the null feature, the null value has not yet
been set, so the value measured then is used as the null value. If you disable the null feature in this condition,
the specified null value is stored in the instrument. If you enable the null feature again, the null value is not
updated. The saved null value discussed above is used to correct the measurement function values.
• OFF: Even if you tap Null or press NULL, the null feature is not enabled. Measurement function values are
produced with no null correction.
IM WT5000-01EN
4-11
Page 47

Null
Indicator
4 Input Settings (Advanced/Options)
The held null value is cleared under the following circumstances.
• Operations that cause the null values of all inputs to be cleared
• Turning on the power (the null values are not backed up when you turn off the power)
• Initializing the settings
• Loading a setup data file
• Operations that cause the null value of the input whose settings were changed to be cleared
• Switching between direct current input and external current sensor input
• Changing the Sense Type setting for the Speed or Torque motor evaluation input signal
Null Values
When you enable the null feature, the following measurement values are used as the null values.
• Udc and Idc (simple voltage and current averages)
• Speed, Torque, and Aux signals (on models with the motor evaluation option)
Measurement Functions Affected by the Null Feature
All measurement functions are affected by the null values.
• If there are no previously measured values for Udc, Idc, Speed, Torque, or Aux, because for example the
null feature has been turned on before any measurements have been made, the null values are set to
zero.
• For measurement functions that are computed based on an element’s voltage and current values, the null
values are subtracted from the sampled voltage and current values.
• For motor evaluation measurement functions and auxiliary input measurement functions, the null values
are subtracted from the computed numeric data.
Enabling and Disabling the Null Feature (Null, NULL)
• When you tap Null or press NULL, the null feature is enabled. The NULL key illuminates.
For items that null states are set (Target Element), Null indicators illuminate to the left of the elements, motors,
AUX inputs that are set to ON or Hold.
• If you tap Null or press NULL while the null feature is enabled, the NULL key light and Null indicators turn off,
and the null feature is disabled.
4-12
IM WT5000-01EN
Page 48

4 Input Settings (Advanced/Options)
• To make accurate measurements, we recommend that you execute zero-level compensation before
enabling the null feature.
• The null feature is disabled when:
• The power is turned on.
• The settings are initialized.
• A setup data file is loaded.
• You switch between direct current input and external current sensor input.
• You change the Sense Type setting for the Speed or Torque motor evaluation input signal.
• If the null feature is enabled or disabled while the display is held, the Null indicator will illuminate or turn off,
but the held data will not be affected. Also, the Null indicator will be highlighted.
• The DC values that the null value is based on when the null feature is ON are held, but the upper limit of
the null value is ±10% of the range when the crest factor is set to CF3. The upper limit of the null value is
±20% of the range when the crest factor is set to CF6 or CF6A.
• When the range is changed, the null value upper limit will be determined by the new range. The null value
upper limit will also be adjusted when the range is decreased by the auto range feature.
IM WT5000-01EN
4-13
Page 49

5 Motor Evaluation and Auxiliary Input (Option)
Click here.
Click here.
Motor Evaluation/Auxiliary Inputs (Motor/Aux)
Motor Evaluation Function
This instrument can determine the motor rotating speed, torque, and output. It determines them using the
revolution sensor signal, which is proportional to the motor rotating speed, and the torque meter signal, which
is proportional to the motor torque. You can configure this instrument to receive analog (DC voltage) signals or
pulse signals from the revolution sensor and torque meter. Also, you can set the number of motor poles and
determine the motor’s synchronous speed and slip. Furthermore, you can use the active power, frequency, and
motor output measured by this instrument to compute the motor efficiency and total efficiency.
For a list of the measurement functions that can be measured with the motor evaluation feature and their
descriptions, see “Motor Evaluation Functions” under “Items That This Instrument Can Measure.”
Auxiliary Input
You can apply signals from illuminance sensors, wind sensors, temperature sensors, and the like and display
these physical quantities.
Motor/Auxiliary Input Displays
The motor/auxiliary input settings are displayed on the Options tab in the input information area on the right side
of the screen. The following figure shows a display example when motor evaluation function 1 is set to single
motor (revolution signal, pulse) and motor evaluation function 2 is set to auxiliary input (Aux).
Motor evaluation function 1 settings
Motor evaluation function 2 settings
IM WT5000-01EN
5-1
Page 50

Motor 3Motor 1
5 Motor Evaluation and Auxiliary Input (Option)
MTR Configuration (MTR Configuration)
Select the functions of signal input Ch A to Ch H for motor evaluation function 1 and motor evaluation function 2.
• Single Motor (revolution signal: pulse) (Single Motor (Speed:Pulse))
The revolution signals are the pulses of phases A, B, and Z.
/MTR1 /MTR2 Function Signal
Ch A Ch E Torque Analog/pulse
Ch B Ch F Speed A Pulse A phase (used for velocity measurement)
Ch C Ch G Speed B Pulse B phase (used for rotation direction
detection)
Ch D Ch H Speed Z Pulse Z phase (used for electrical angle
reference measurement)
Motor number assignments (Motor 1, Motor 3)
Motor 3Motor 1
• Single Motor (revolution signal: analog) (Single Motor (Speed:Analog))
The revolution signals are analog.
/MTR1 /MTR2 Function Signal
Ch A Ch E Torque Analog/pulse
Ch B Ch F - Not use
Ch C Ch G Speed Analog
Ch D Ch H - Not use
Motor number assignments (Motor 1, Motor 3)
5-2
IM WT5000-01EN
Page 51

5 Motor Evaluation and Auxiliary Input (Option)
• Double Motor (Double Motor)
You can apply the torque and speed (pulse) signals from two circuits.
/MTR1 /MTR2 Function Signal
Ch A Ch E Torque Analog/pulse
Ch B Ch F Speed Pulse
Ch C Ch G Torque Analog/pulse
Ch D Ch H Speed Pulse
Motor number assignments (Motor 1 to 4)
Motor 3Motor 1
Motor 4Motor 2
• Auxiliary Input (Aux) (Auxiliary)
You can apply analog voltage signals or pulse signals (e.g., frequency) from illuminance sensors, wind
sensors, temperature sensors, and the like and display these physical quantities.
/MTR1 /MTR2 Function Signal
Ch A Ch E Aux Analog/pulse
Ch B Ch F Aux Pulse
Ch C Ch G Aux Analog/pulse
Ch D Ch H Aux Pulse
Aux number assignments (Aux 1 to 8)
Aux 5 to 8Aux 1 to 4
IM WT5000-01EN
5-3
Page 52

5 Motor Evaluation and Auxiliary Input (Option)
Motor/Aux Settings (Ch Settings)
Set the following items according to the MTR configuration.
When the MTR Configuration Is Set to Single Motor (revolution signal: pulse), Single Motor (revolution
signal: analog), or Double Motor
• Scaling factor (Scaling)
• Unit (Unit)
• Input signal type (Sense Type)
• Analog input auto range (Analog Auto Range)
• Analog input range (fixed range) (Analog Range)
• Setting the linear scaling of analog input manually (Linear Scale A, B)
• Computing the linear scaling of analog input from two points (Calculation)
• Line filter (Line Filter(Butterworth))
• Pulse noise filter (Pulse Noise Filter)
• Sync source (Sync Source)
• Upper and lower limits of pulse input range (Pulse Range Upper, Pulse Range Lower)
• Torque signal pulse rating
• Revolution Signal Pulses per Revolution (Pulse N)
• Motor Poles (Pole)
• Frequency Measurement Source (Source)
When the MTR Configuration Is Set to Auxiliary Input (Aux)
• Input signal name (Aux Name)
• Scaling factor (Scaling)
• Unit (Unit)
• Input signal type (Sense Type)
• Analog input auto range (Analog Auto Range)
• Analog input range (fixed range) (Analog Range)
• Setting the linear scaling of analog input manually (Linear Scale A, B)
• Computing the linear scaling of analog input from two points (Calculation)
• Line filter (Line Filter(Butterworth))
• Pulse noise filter (Pulse Noise Filter)
• Upper and lower limits of pulse input range (Pulse Range Upper, Pulse Range Lower)
Input Signal Name (Aux Name)
When you set the MTR configuration auxiliary input (Aux), set the input signal name.
• Number of characters: Up to eight
• Usable characters: Spaces and all characters that are displayed on the keyboard
5-4
IM WT5000-01EN
Page 53

2π
60
Motor output Pm = ×Speed×Torque×S
5 Motor Evaluation and Auxiliary Input (Option)
Scaling Factor (Scaling)
When the MTR Configuration Is Set to Single Motor (revolution signal: pulse), Single
Motor (revolution signal: analog), or Double Motor
Setting the Scaling Factor for Scaling the Revolution Signal
You can set the factor for scaling the revolution signal. Set the factor to a value from 0.0001 to 99999.9999.
• When the Revolution Signal Type is Analog
This setting is used as the scaling factor in the equation for the linear scaling of analog input.
• • When the Revolution Signal Type is Pulse
This setting is used as the scaling factor in the equation for the number of revolution signal pulses per
revolution.
Setting the Scaling Factor for Scaling the Torque Signal
You can set the factor for scaling the torque signal to motor torque. Set the factor to a value from 0.0001 to
99999.9999.
• When the Torque Signal Type is Analog
This setting is used as the scaling factor in the equation for the linear scaling of analog input.
• When the Torque Signal Type is Pulse
This setting is used as the scaling factor in the equation for the torque signal pulse rating.
Setting the Scaling Factor for Computing the Motor Output
You can specify the scaling factor for computing the motor output (mechanical power) from the rotating speed
and torque. Set the factor to a value from 0.0001 to 99999.9999.
The equation is indicated below. The scaling factors of the rotating speed and torque are set so that the unit of
the rotating speed is min
specified here is 1, the unit of the motor output Pm is W. Because the efficiency computation uses W as the unit
of Pm, we recommend that you set the scaling factor of each item so that the unit of Pm is W.
Speed: The rotating speed, determined from the number of pulses per revolution
Torque: The torque, determined from the torque signal pulse rating
S: The scaling factor
–1
(or rpm) and the unit of torque is N•m. When the scaling factor of the motor output
When the MTR Configuration Is Set to Auxiliary Input (Aux)
You can set the factor for scaling the auxiliary signal. Set the factor to a value from 0.0001 to 99999.9999.
This setting is used as the scaling factor in the equation for the linear scaling of analog input.
Unit (Unit)
• Number of characters: Up to eight
• Usable characters: Spaces and all characters that are displayed on the keyboard
IM WT5000-01EN
5-5
Page 54

5 Motor Evaluation and Auxiliary Input (Option)
Input Signal Type (Sense Type)
Select the input signal from the following two types.
• Analog (Analog): Select this option when this instrument will receive DC voltage (analog) signals.
• Pulse (Pulse): Select this option when this instrument will receive pulse signals.
Settings for Different Input Signal Types
As indicated below, the settings that you need to configure vary depending on the input signal type.
Settings Related to the Signal Type
Setting Signal Type
Analog Pulse
Analog auto range Ye s No
Analog range Yes No
Linear scale A, B Yes No
Line filter Yes No
Pulse noise filter No Ye s
Sync source*
Pulse range No Ye s
Number of pulses per revolution* No Yes
Yes: Must be set.
No: Does not need to be set.
—: Measurement can be performed when the sync source is set to None (the default setting), but you can
increase synchronicity with power measurement by specifying a sync source.
— —
Common Settings Unrelated to the Signal Type
• Scaling factor
• Unit
• Motor poles*
• Sync speed frequency measurement source*
* When the MTR configuration is set to auxiliary input (Aux), do not set this item.
5-6
IM WT5000-01EN
Page 55

5 Motor Evaluation and Auxiliary Input (Option)
Analog Input Range
Set the analog input range for input signals whose type has been set to analog. For input signals whose type
has been set to pulse, there is no need to set the analog input range.
Analog Input Auto Range (Analog Auto Range)
Select whether to turn auto range on or off. When auto range is on, this instrument automatically switches
between the following ranges according to the size of the input signal.
20 V, 10 V, 5 V, 2 V, 1 V
Range Increase
• The measurement range is increased when the input signal exceeds 110% of the measurement range.
• The measurement range is increased when the peak value of the input signal exceeds approximately150% of
the measurement range.
Range Decrease
The measurement range is decreased when the input signal falls below 30% of the measurement range and the
peak value of the input signal is less than 125% of the lower range.
When non-periodic pulse waveforms are applied during auto range, the range may not remain constant. If this
happens, use the fixed range setting.
Analog Input Range (Fixed Range) (Analog Range)
You can select one of the following input ranges.
20 V, 10 V, 5 V, 2 V, 1 V
IM WT5000-01EN
5-7
Page 56

5 Motor Evaluation and Auxiliary Input (Option)
Linear Scaling of Analog Input
Set the input signal slope and offset when the input signal type is set to analog.
Set the input signal slope and offset also when the MTR configuration is set to auxiliary input (AUX) and the
input signal type is set to pulse.
The following two methods are available.
• Set the values manually.
• Specify two points, and use those points to compute the values.
Setting the Linear Scaling of Analog Input Manually (Linear Scale A, B)
You can set the slope (A) and offset (B) of the input signals to values within the following ranges.
Slope (A)
• When the MTR configuration is set to single motor (revolution signal: pulse), single motor (revolution signal:
analog), or double motor
1.000 m to 1.000 M
• When the MTR configuration is set to auxiliary input (Aux)
−1.000 M to 1.000 M
However, A cannot be set to zero.
Offset (B)
−1.000 M to 1.000 M
The following equation is used to compute the measured values of an input signal.
Measured values of an input signal = S(AX + B – NULL)
When the input signal type is set to analog
S: The scaling factor
A: The input signal slope
X: The input signal voltage
B: The offset
NULL: The null value
When the MTR configuration is set to auxiliary input (AUX) and the input signal type is set to pulse
S: The scaling factor
A: The pulse coefficient
X: The pulse frequency
B: The offset
NULL: The null value
When There Is No Offset in the Input Signal Voltage
If you set A to 1 and B to 0, the linear scaling settings do not affect computation, and the previous equation
becomes:
Measured values of an input signal = S(X – NULL)
The input signal is scaled when you set the scaling factor to the input signal per 1 V of input voltage.
When There Is Offset in the Input Signal Voltage
If you set S to 1, the scaling factor does not affect the computation, and the previous equation becomes
Measured values of an input signal = AX + B – NULL
The input signal is scaled when you set the input signal slope (A) to the input signal per 1 V of input voltage and
offset (B) to the offset value.
5-8
IM WT5000-01EN
Page 57

Point2Y
Input value
Measured value
5 Motor Evaluation and Auxiliary Input (Option)
If you enable the null function and then change the input signal slope (A) or offset value (B), null correction
will be offset. Reset the null value.
Computing the Linear Scaling of Analog Input from Two Points (Calculation)
The input signal slope and offset are computed from two points.
On the input characteristic graphs of the input signal, you can specify two measured rpm or N•m values (Point1Y
and Point2Y) in relation to two input voltage values (Point1X and Point2X).
Measured values (Point1X and Point2X): –1.000 T to 1.000 T
Computed values (Point1Y and Point2Y): –1.000 T to 1.000 T
Select Execute to use these four values to determine and set the input signal slope (A) and offset (B).
y = Ax + B
Point2
Point1Y
Point1
Point1X
Measurement range
Point2X
IM WT5000-01EN
5-9
Page 58

5 Motor Evaluation and Auxiliary Input (Option)
Line Filter (Line Filter(Butterworth))
You can remove high-frequency noise by inserting a line filter into the circuit used to measure the input signals.
You can select the cutoff frequency from the following options. The filter type is Butterworth.
OFF, 100 Hz, 500 Hz, 1 kHz
Selecting OFF disables the filter.
The line filter setting applies to input signals whose type has been set to analog. For input signals whose type
has been set to pulse, there is no need to configure this setting.
Pulse Noise Filter (Pulse Noise Filter)
You can remove high-frequency noise by inserting a pulse noise filter into the circuit used to measure the input
signals.
You can select the cutoff frequency from the following options. The filter type is Butterworth.
OFF, 10kHz, 100kHz, 1MHz
Selecting OFF disables the filter.
The pulse noise filter setting applies to input signals whose type has been set to pulse. For input signals
whose type has been set to analog, there is no need to configure this setting.
Sync Source (Sync Source)
When Measurement Method Is Set to Sync Source Period Average
When the MTR configuration is set to single motor (revolution signal: pulse), single motor (revolution signal:
analog), or double motor, set the sync source.
• When you are measuring analog revolution and torque signals, you can select the element's input signal
to use as the sync source from the following options. The available options vary depending on the installed
elements.
U1, I1, U2, I2, U3, I3, U4, I4, U5, I5, U6, I6, U7, I7, Ext Clk (external clock)*, Z Phase 1 (Ch D), Z Phase 3 (Ch
H), None
*
For the EXT CLK connector specifications, see section 4.3 in the Getting Started Guide, IM WT5000-03EN.
• The measurement period is determined according to the cross point of the selected sync source. This
instrument uses the measurement period to measure the analog revolution and torque signals.
• If sync source is set to None
All the sampled data within the data update interval is used to determine the rotating speed and torque.
•
When the revolution or torque signal is a pulse signal, its value is the pulse signal period averaged over the
measurement period. The measurement period is determined according to the sync source. If the pulse signal
period does not fit within the measurement period, the previous period is used to determine the measured value.
• To achieve stable motor efficiency measurements, we recommend that you set the sync source for motor
efficiency measurement to the same sync source that is set in the basic measurement conditions. This
ensures that the measurement period is in sync with the measurement functions, such as those for voltage,
current, and active power.
When Measurement Method Is Set to Digital Filter Average
The sync source setting is invalid.
5-10
IM WT5000-01EN
Page 59

5 Motor Evaluation and Auxiliary Input (Option)
Upper and Lower Limits of Pulse Input Range (Pulse Range Upper, Pulse Range Lower)
Set an appropriate range for the maximum and minimum input signal values. For example, when you are
measuring signals for rotating speeds of 120 rpm to 180 rpm and torques of –18 N•m to +18 N•m, set the
rotating speed pulse input range to 100 rpm to 200 rpm, and set the torque pulse input range to –20 N•m to +20
N•m.
You can set the pulse range for each input signal within the following limits.
• Torque signal: 10000.0000 to 10000.0000 [N•m]
• Revolution signal: −99999.9999 to 99999.9999 [rpm]
• Aux signal: −10.00 M to 10.00 M
When the input signal type is pulse, the waveform display lower and upper limits are the values that you set
here.
On models with the D/A output option, the rated D/A output values are as follows.
Input Signal D/A Output
Setting for Pulse Range Upper +5 V
Setting for Pulse Range Upper × (–1) −5 V
Torque Signal Pulse Rating
When the torque signal type is pulse, refer to the torque meter’s specifications to set its rated positive and
negative values.
Positive and Negative Rated Torque Signal Values (Rated Upper, Rated Lower)
Range: –10000.0000 to 10000.0000 (N•m)
Positive and Negative Rated Torque Signal Pulse Frequencies (Rated Freq (Upper),
Rated Freq (Lower))
Range: 1 to 100000000 (Hz)
The following equation is used to compute the torque.
Torque = S(AX + B) – NULL
S: The scaling factor
A: The torque pulse coefficient
X: The pulse frequency
B: The torque pulse offset
NULL: The null value
1 If the torque signal is a changed signal, you can set the scaling factor to determine the torque before the
change.
2 The torque pulse coefficient and torque pulse offset are determined from the torque signal pulse rating as
shown in the next figure.
1
2
2
IM WT5000-01EN
5-11
Page 60

Torque sensor specifications
Pulse signal corresponding to –20 N•m to +20 N•m
±5 V for –20 N•m to +20 N•m
5 Motor Evaluation and Auxiliary Input (Option)
Relationship between the Torque Signal Pulse Input Range and Pulse Rating
To measure a torque of –20 N•m to +20 N•m using a torque meter with specifications in the figure below,
configure the pulse input range and pulse rating settings as indicated below.
• Upper limit of the pulse input range (Pulse Range Upper): 20.0000
• Lower limit of the pulse input range (Pulse Range Lower): –20.0000
• Positive rated torque signal value (Rated Upper): 50.0000
• Negative rated torque signal value (Rated Lower): –50.0000
• Positive rated torque signal pulse frequency (Rated Freq Upper): 15000
• Negative rated torque signal pulse frequency (Rated Freq Lower): 5000
Pulse rating (positive): 15 kHz is output at a torque
of 50 N•m
Pulse rating (negative): 5 kHz is output at a torque
of –50 N•m
15 kHz
Slope: Torque pulse
coefficient (A)
Torque pulse offset (B)
Output axis
–50 N•m
Number of
output pulses
5 kHz
50 N•m Torque input
Motor
Pulse output
torque sensor
WT5000
Load
Torque signal
Recorder
D/A output signal to the recorder
The pulse input range setting applies to input signals whose type has been set to pulse. For input signals
whose type has been set to analog, there is no need to configure this setting.
5-12
IM WT5000-01EN
Page 61

5 Motor Evaluation and Auxiliary Input (Option)
X
N
Rotating speed =
Revolution Signal Pulses per Revolution (Pulse N)
Set the number of pulses per revolution to a value from 1 to 9999.
The following equation is used to compute the rotating speed.
−NULL
S
S: The scaling factor*
X: The number of input pulses from the revolution sensor per minute
N: The number of pulses per revolution
NULL: The null value
* When the scaling factor is 1, the rotating speed is the number of revolutions per minute (min
the revolution signal is a changed signal, you can set the scaling factor to determine the rotating speed
before the change.
The setting specifying the number of revolution signal pulses per revolution applies to input signals whose
type has been set to pulse. For input signals whose type has been set to analog, there is no need to configure
this setting.
–1
or rpm). If
IM WT5000-01EN
5-13
Page 62

120×Fs
Pole
Sync speed (min
Slip (%) = ×100
SyncSp
−
Speed
SyncSp
5 Motor Evaluation and Auxiliary Input (Option)
Sync Speed(Sync Speed)
Motor Poles (Pole)
Set the number of motor poles to a value from 1 to 99. This number is used to compute the sync speed.
Frequency Measurement Source (Source)
• Select the frequency measurement source to use to compute the sync speed from the options below. This
number is used to compute the sync speed. The available options vary depending on the installed elements.
U1, I1, U2, I2, U3, I3, U4, I4, U5, I5, U6, I6, U7, I7
• Normally, you should select the voltage or current that is being applied to the motor. If you select the
frequency of a voltage or current that is not being applied to the motor, the sync speed may not be determined
properly.
Sync Speed Equation
The sync speed unit is fixed at min–1 or rpm.
1
−
) =
Fs: The frequency of the frequency measurement source (Hz)
Pole: The number of motor poles
Slip Equation
The sync speed unit is fixed at min–1 or rpm. To determine the slip, configure the rotating speed scaling factor so
that the unit of the rotating speed is also min
–1
(or rpm).
SyncSp: The synchronous speed (min–1)
Speed: The rotating speed (min
–1
)
Set the frequency measurement source to a stable voltage or current signal that is being applied to the motor
and that has low distortion and noise.
5-14
IM WT5000-01EN
Page 63

Click here.
5 Motor Evaluation and Auxiliary Input (Option)
Electrical Angle Measurement (Electrical Angle Measurement)
Turning Electrical Angle Measurement On and Off
When the MTR configuration is set to single motor (revolution signal: pulse), select whether to measure electrical
angles.
Harmonic Analysis Trigger (Harmonics Trigger)
Each input element can be divided into two groups Hrm1 and Hrm2, and harmonics can be measured.
Select the Hrm1 and Hrm2 harmonic analysis triggers from the following options.
• Z Phase 1 (Ch D): Motor1’s phase Z (channel D). This appears as an option when the electrical angle
measurement of Motor1 is set to on.
• Z Phase 3 (Ch H): Motor3’s phase Z (channel H). This appears as an option when the electrical angle
measurement of Motor3 is set to on. (Models with the motor evaluation 2 option)
• None
Harmonic Element Group (Hrm Element Group)
This is the dividing of each input element into groups Hrm1 and Hrm2.
Valid Electrical Angle Measurement Items (Valid EA Items)
These are the electrical angle measurement items. They are set automatically according to the harmonic
analysis trigger and harmonic element group settings.
Example: EaM1U1 is the electrical angle of M1 (motor 1) and U1 (voltage of element 1).
Electrical Angle Correction (Correction)
Set the electrical angle correction value.
Electrical Angle Correction (Electrical Angle Correction)
Set the correction value to a number from –180.00° to 180.00°.
Auto Correction Entry (Auto Enter Correction)
This instrument automatically sets the correction value to the difference between the phase of the voltage or
current whose correction value is being automatically computed and the current electrical angle phase.
Auto Correction Entry Target(Target)
Select the voltage or current to automatically enter the calibration value. The available options vary depending
on the installed elements.
U1, I1, U2, I2, U3, I3, U4, I4, U5, I5, U6, I6, U7, I7
Executing the auto correction entry (Execute)
An automatic electrical angle correction entry will be executed.
IM WT5000-01EN
5-15
Page 64

Click here.
×100
Motor output Pm (W)
Motor efficiency (%)
consumption
Motor output Pm (W)
Motor efficiency (%) =
Total efficiency (%) =
output
consumption
power consumption
Motor output Pm (W)
Motor efficiency (%) =
Total efficiency (%) =
power consumption
output
5 Motor Evaluation and Auxiliary Input (Option)
Computing the Motor Efficiency and Total Efficiency
This instrument can compute the motor efficiency (the ratio of power consumption to motor output) and total
efficiency from the active power and motor output that it measures.* You can set the efficiency equation using
the η Formula setting.
* The total efficiency is the ratio of total power consumption—not just the power consumption of the motor but
also the power consumption of the converter that supplies the motor with power—to motor output.
The following is an example of how the values are computed.
When the Motor Input Is Wired to ΣA
PΣA(W)
P
ΣA
Motor power
When the Converter and Motor Inputs Are Wired to ΣA and ΣB, Respectively
Motor
Motor output Pm
×100
×100
PΣBPΣA
Motor power
Motor
Motor
Pm
Motor and converter
PΣB(W)
Motor output Pm (W)
PΣA(W)
Converter
(inverter, etc.)
When the Converter and Motor Inputs Are Wired to ΣB and ΣA, Respectively
×100
×100
PΣA
Motor power
consumption
Motor
Motor
Pm
PΣB
Motor and converter
PΣA(W)
Motor output Pm (W)
PΣB(W)
Converter
(inverter, etc.)
If ΣA or ΣB is a three-phase, three-wire (3P3W) system, you can use delta computation to perform
3P3W>3V3A transformation on ΣA and ΣB. From the 3P3W>3V3A transformation, you can determine one
unmeasured line voltage and one unmeasured common mode current.
5-16
IM WT5000-01EN
Page 65

6 Computation and Output Configuration
Computation and Output (Computation/Output)
You can specify the following items.
• Efficiency equation (Efficiency)
• Delta computation (Δ Measure)
• Data update interval (Update Rate)
• Averaging (Averaging)
• Harmonic measurement conditions (Harmonics)
• Computation (Measure)
• Display (Display)
• Data storage (Store)
• Data saving (Data Save)
• Integrated power (watt hours, Integration)
• D/A output (D/A Output, option)
IM WT5000-01EN
6-1
Page 66

6 Computation and Output
Efficiency Equation (Efficiency)
You can create an efficiency equation by combining measurement function symbols. This instrument can
determine the energy conversion efficiency of the device using the numeric values of the measurement
functions.
η1 to η4
You can create four efficiency equations (η1 to η4), using the following measurement functions as operands.
• The active powers of each element (P1 to P7)
• The active powers of the Σ functions (PΣA to PΣC)
• The motor output (Pm1 to Pm4, on models with the motor evaluation 1 or 2 option)
• Udef1, Udef2
Udef1, Udef2
To add active powers and motor output and use them in η1 to η4, use Udef1 and Udef2. You can add up to four
operands consisting of the measurement functions listed above.
Equation Examples
• Efficiency of a Single-Phase, Two-Wire Input/Single-Phase, Two-Wire Output Device
Input: Power of element 1 (P1)
Output: Power of element 2 (P2)
Efficiency equation: P2/P1 × 100 (%)
Input power: P1
Converter
(inverter, etc.)
Output power: P2
• Efficiency of a Single-Phase, Two-Wire Input/Three-Phase, Three-Wire Output Device
Input: Power of element 1 (P1)
Output: Σ power of elements 2 and 3 (PΣA)
Efficiency equation: PΣA/P1 × 100 (%)
• Efficiency of a Three-Phase, Three-Wire Input/Three-Phase, Three-Wire Output Device
Input: Σ power of elements 1 and 2 (PΣA)
Output: Σ power of elements 3 and 4 (PΣB)
Efficiency equation: PΣB/PΣA × 100 (%)
• Efficiency of Motor 1 with a Single-Phase, Two-Wire Input
Input: Power of element 1 (P1)
Output: Motor 1 output (Pm1)
Efficiency equation: Pm1/P1 × 100 (%)
• Efficiency of Motor 1 with a Three-Phase, Three-Wire Input
Input: Σ power of elements 1 and 2 (PΣA)
Output: Motor 1 output (Pm1)
Efficiency equation: Pm1/PΣA × 100 (%)
To correctly compute the efficiency, set the power coefficients of all elements so that all power units used in
the computation are the same. For example, the efficiency cannot be computed correctly if elements or wiring
units used in the computation have different power units, such as W (watt) and J (joule).
6-2
IM WT5000-01EN
Page 67

Click here.
T
R
ST
R
S
±
I
R
T
Click here.
6 Computation and Output
Delta Computation (Δ Measure)
The sum or difference of the instantaneous voltage or current values (sampled data) between the elements in
a wiring unit can be used to determine various types of data such as the differential voltage and phase voltage.
This calculation is called delta math.
Types of Delta Computation (ΔMeasure Type)
The following types of delta computation are available:
• Differential voltage and differential current (Difference)
• Line voltage and phase current (3P3W > 3V3A)
• Star-delta transformation (Star>Delta)
• Delta-star transformation (Delta>Star)
The delta computation types that you can select vary as indicated below according to the wiring system.
Wiring System Delta Computation Type
1P3W Difference, 3P3W>3V3A
3P3W Difference, 3P3W>3V3A
3P4W Star>Delta
3P3W(3V3A) Delta>Star
• Differential Voltage and Differential Current (Difference)
The differential voltage and differential current between two elements can be computed on a single-phase,
three-wire system or on a three-phase, three-wire system.
When you perform delta computation on wiring unit ΣA, the available measurement functions are as follows.
ΔU1rms[UdiffA], ΔU1mn[UdiffA], ΔU1dc[UdiffA], ΔU1rmn[UdiffA], ΔU1ac[UdiffA]
ΔIrms[IdiffA], ΔImn[IdiffA], ΔIdc[IdiffA], ΔIrmn[IdiffA], ΔIac[IdiffA]
* In the measurement functions, rms, mn(mean), dc, rmn(r-mean), and ac are the delta computation modes.
A indicates the wiring unit.
• Line Voltage and Phase Current (3P3W > 3V3A)
You can compute unmeasured line voltages and phase currents by converting the data of a three-phase
three-wire system to the data of the three-voltage, three-current method (3V3A).
When you perform delta computation on wiring unit ΣA, the available measurement functions are as follows.
ΔU1rms[UrsA], ΔU1mn[UrsA], ΔU1dc[UrsA], ΔU1rmn[UrsA], ΔU1ac[UrsA]
ΔIrms[ItA], ΔImn[ItA], ΔIdc[ItA], ΔIrmn[ItA], ΔIac[ItA]
I1
Urs
N
S
I2
±
I
It
U2
U
U1
±
U
±
* In the measurement functions, rms, mn(mean), dc, rmn(r-mean), and ac are the delta computation modes.
A indicates the wiring unit.
IM WT5000-01EN
6-3
Page 68

R
ST
R
ST
I
I
R
±
Click here.
R
ST
R
ST
6 Computation and Output
• Star-Delta Transformation (Star>Delta)
You can use the data from a three-phase, four-wire system to compute the data of a delta connection from the
data of a star connection.
When you perform delta computation on wiring unit ΣA, the available measurement functions are as follows.
ΔU1rms[UrsA], ΔU1mn[UrsA], ΔU1dc[UrsA], ΔU1rmn[UrsA], ΔU1ac[UrsA]
ΔU2rms[UstA], ΔU2mn[UstA], ΔU2dc[UstA], ΔU2rmn[UstA], ΔU2ac[UstA]
ΔU3rms[UtrA], ΔU3mn[UtrA], ΔU3dc[UtrA], ΔU3rmn[UtrA], ΔU3ac[UtrA]
ΔUΣrms[UΣA], ΔUΣmn[UΣA], ΔUΣdc[UΣA], ΔUΣrmn[UΣA], ΔUΣac[UΣA]
ΔIrms[InA], ΔImn[InA], ΔIdc[InA], ΔIrmn[InA], ΔIac[InA]
Utr
T
N
Ust
Urs
I1
In
S
I2
±
I
I3
±
U
U1
±
±±
U2U3
U
U
* In the measurement functions, rms, mn(mean), dc, rmn(r-mean), and ac are the delta computation modes.
A indicates the wiring unit.
• Delta-Star Transformation (Delta>Star)
Using the data from a three-phase three-wire system that uses a three-voltage, three-current method, you can
compute the data of a star connection from the data of a delta connection. This function is useful when you
wish to observe the phase voltage of an object that has no neutral line, such as a motor. The center N of the
star connection is computed as the center of the delta connection. If the actual center of the star connection
does not match the center of the delta connection, an error results.
When you perform delta computation on wiring unit ΣA, the available measurement functions are as follows.
ΔU1rms[UrA], ΔU1mn[UrA], ΔU1dc[UrA], ΔU1rmn[UrA], ΔU1ac[UrA]
ΔU2rms[UsA], ΔU2mn[UsA], ΔU2dc[UsA], ΔU2rmn[UsA], ΔU2ac[UsA]
ΔU3rms[UtA], ΔU3mn[UtA], ΔU3dc[UtA], ΔU3rmn[UtA], ΔU3ac[UtA]
ΔUΣrms[UΣA], ΔUΣmn[UΣA], ΔUΣdc[UΣA], ΔUΣrmn[UΣA], ΔUΣac[UΣA]
ΔIrms[InA], ΔImn[InA], ΔIdc[InA], ΔIrmn[InA], ΔIac[InA]
ΔP1[PrA]
ΔP2[PsA]
ΔP3[PtA]
ΔPΣ[PΣA]
6-4
IM WT5000-01EN
Page 69

I
±
Click here.
Click here.
6 Computation and Output
Us
I
I1
In
S
I2
±
I
I3
±
U3U2U1
± ±
U
±
UU
R
Ur
Ut
N
T
* In the measurement functions, rms, mn(mean), dc, rmn(r-mean), and ac are the delta computation modes.
A indicates the wiring unit.
For information about equations, see appendix 1 in the Getting Started Guide, IM WT5000-03EN.
For information about the measurement period, see “Measurement Period.”
Delta Computation Modes (ΔMeasure Mode)
You can select the voltage or current mode to be displayed as delta computation values from the following:
rms, mean, dc, r−mean, ac
• We recommend that you set the measurement range and scaling (VT/CT ratio and coefficients) of the
elements that are undergoing delta computation as closely as possible. Using different measurement
ranges or scaling causes the measurement resolutions of the sampled data to be different. This results in
errors.
• The numbers (1, 2, and 3) that are attached to delta computation measurement function symbols have no
relation to the element numbers. The computation of all delta measurement functions, from ΔU1 to ΔPΣ,
varies depending on the wiring system and the delta computation type. For details, see appendix 1 in the
Getting Started Guide, IM WT5000-03EN.
• When only one element is installed in this instrument, this feature cannot be used, and its settings do not
appear.
• Delta computation cannot be performed on a single-phase, two-wire (1P2W) wiring system.
IM WT5000-01EN
6-5
Page 70

6 Computation and Output
Data Update Interval (Update rate)
The data update interval is the interval at which the data that is used in measurement functions is sampled.
Update Mode (Update Mode)
Select the trigger for updating data from the following options.
• Constant interval (Constant)
• Trigger (Trigger)
Constant Interval (Constant)
At each data update interval, the numeric data is updated, stored, transmitted through a communication
interface, and converted and output as analog signals.
The measurement mode display at the upper right of the screen shows Normal Mode.
To capture relatively fast load fluctuations in the power system, select a fast data update rate. To capture low
frequency signals, select a slow data update rate.
Trigger (Trigger)
Numeric data is updated once according to the waveform display trigger operation.
The measurement mode display at the upper right of the screen shows Normal Mode (Trg).
If the update mode is set to trigger, measurement takes place from when a trigger is detected over the data
update interval. The following amount of time is required for the instrument to compute the measured data,
process it for displaying, and so on, and become ready for the next trigger.
• When the data update interval is 50 ms to 500 ms: Approx. 1 s
• When the data update interval is 1 s to 20 s: Data update interval + 500 ms
In this case, storage, communication output, and D/A output operate in sync with the triggers.
If the update mode is set to constant interval, storage, communication output, and D/A output operate in sync
with the data update interval.
• If you do not set the trigger level properly, the waveform display start point (the signal level on the left edge
of the screen) may be unstable, or waveforms may not appear.
• Even when the update mode is set to trigger, the mode is set to constant interval in the following situations.
• During integration
6-6
IM WT5000-01EN
Page 71

6 Computation and Output
Data Update Interval (Update Rate)
Select from the following.
50ms, 100ms, 200ms, 500ms, 1s, 2s, 5s, 10s, 20s
The data update interval setting is displayed at the top of the screen.
Computing Method (Measurement Method)
Set the how to compute measurement values to one of the options below.
• Sync Source Period Average (Sync Source Period Average)
The sampled data in the data update interval is computed using the sync source period average method to
derive the measured values. (However, this excludes integrated power WP and integrated current q in DC
mode.)
This method requires the period of the specified sync source signal to be detected accurately. Check whether
the sync source signal frequency is being measured correctly by following the procedures in sections 3.1 and
3.4 in the User’s Manual, IM WT5000-02EN.
• Digital Filter Average (Digital Filter Average)
The sampled data is averaged by applying a digital filter to derive the measured values.
This method does not require the input signal period to be detected.
The computing method setting is displayed as SP or DF at the top of the screen.
Response Speed (Response)
If the computing method is set to digital filter average, set the response speed to one of the options below.
The lower measurement frequency limit is set as follows according to the response speed.
• Fast (≥100 Hz): 100 Hz
• Mid (≥10 Hz): 10 Hz
• Slow (≥1 Hz): 1 Hz
• VSlow (≥0.1 Hz): 0.1 Hz
The response speed setting is displayed as F, M, S, or V at the top of the screen.
IM WT5000-01EN
6-7
Page 72

6 Computation and Output
Trigger (Trigger Settings)
If you set the update mode to trigger, set the trigger.
The trigger determines when a waveform is displayed. A trigger is said to “occur” when the trigger condition is
met and a waveform is displayed.
Trigger mode (Trigger Mode)
The trigger mode determines the conditions for updating the display. Select from the following options.
• Auto (Auto)
If the trigger conditions are met before an approximately 100 ms timeout, this instrument updates the
displayed waveforms on each trigger occurrence. If not, this instrument automatically updates the displayed
waveforms. If the period of the trigger signal is greater than 100 ms, the display is updated as the two
conditions described above alternate. If this occurs, set the trigger mode to normal.
• Normal (Normal)
The instrument updates the waveform display only when the trigger conditions are met. If no triggers occur,
the display is not updated. If you want to view waveforms that this instrument cannot trigger on, or if you want
to check the ground level, set the trigger mode to auto.
Trigger Source (Trigger Source)
The signal that this instrument checks for the trigger condition is referred to as the trigger source. Select from the
following options. The available options vary depending on the installed elements.
U1, I1, U2, I2, U3, I3, U4, I4, U5, I5, U6, I6, U7, I7, Ext Clk (external clock)*
* When you select Ext Clk, the external signal applied to the external clock input connector (EXT CLK) on the
rear panel is used as the trigger source. For the EXT CLK connector specifications, see section 4.3 in the
Getting Started Guide, IM WT5000-03EN. When Ext Clk is set as the trigger source, the trigger slope and
trigger level are set as follows:
• Trigger slope: Falling. Trigger slope setting will be invalid.
• Trigger level: 0.0% Trigger level setting will be invalid.
Trigger Slope (Slope)
Slope refers to the movement of the signal from a low level to a high level (rising edge) or from a high level to a
low level (falling edge). When the slope is used as one of the trigger conditions, it is called a trigger slope.
The following trigger slope settings are available for triggering the instrument.
•
: An edge is detected when the trigger source changes from a level below the trigger level to a level above
the trigger level (rising).
•
: An edge is detected when the trigger source changes from a level above the trigger level to a level below
the trigger level (falling).
•
: The instrument triggers on both rising and falling edges.
6-8
IM WT5000-01EN
Page 73

Trigger level
This instrument triggers here (the trigger point)
when the trigger edge is set to rising ( ).
Trigger source
−
100% (−300 Vpk)
• Measurement range: 100 Vrms when the crest factor is set to CF3.
• Trigger level: 25%
25% trigger level (75 V)
Trigger point
Time
6 Computation and Output
Trigger Level (Trigger Level)
The trigger level is the level at which the trigger slope is determined. When the trigger source passes through
the trigger level on a rising or falling edge, a trigger occurs.
• You can select a value between 0.0 and ±100.0%.
• A value of 100% corresponds to half the height of the waveform display. If the zero level of the input signal
is set to the center of the vertical axis, 100% corresponds to the top of the waveform display, and –100%
corresponds to the bottom of the waveform display. The upper and lower limits of the waveform display
correspond to three times the voltage or current measurement range of each element when the crest factor is
set to CF3. Likewise, the limits are six times when the crest factor is set to CF6 or CF6A.
• When Ext Clk is set as the trigger source, the trigger level setting is invalid.
50 Vrms when the crest factor is set to CF6 or CF6A.
100% (300 Vpk)
Trigger level
Input zero line
(center of the
vertical axis)
T
If you do not set the trigger level properly, the waveform display start point (the signal level on the left edge of
the screen) may be unstable, or waveforms may not appear.
Trigger Point
The trigger point is the point at which a trigger occurs. The trigger point is always displayed at the left end of the
screen.
After the trigger is activated, the waveform display continues from the left of the screen to the right of the screen
with the passage of time.
(The arrow below the word “Trigger point” in the figure below is just for illustration. The arrow does not appear on
the actual display.)
IM WT5000-01EN
6-9
Page 74

6 Computation and Output
• To prevent noise-related errors, the trigger feature has a hysteresis of approximately 1% when the crest
factor is set to CF3. For example, when the trigger slope is set to
level falls approximately 1% below the trigger level and then passes through the trigger level on a rising
edge. The trigger feature has a hysteresis of approximately 2% when the crest factor is set to CF6 or
CF6A.
• The trigger feature for displaying waveforms does not work in the following circumstances.
• When the update mode is set to constant interval
• During integration
Therefore, the waveform display start point (the signal level at the left edge of the screen) may not be
stable. Also, the numeric data measurement period may not be synchronized with the waveform data
measurement period.
, a trigger will occur if the input signal
6-10
IM WT5000-01EN
Page 75

D
(Mn−
D
)
K
D
M
+ • • • M
+ M
+ M
m
6 Computation and Output
Averaging (Averaging)
You can take exponential or moving averages of the numeric data. The averaging function is effective when
reading of the numeric display is difficult due to fluctuations. This occurs when the fluctuation of the power supply
or the load is large or when the input signal frequency is low.
Turning Averaging On and Off (Averaging)
Measurement Functions Used in Normal Measurement
You can select whether to average values. When you enable averaging (ON), the AVG indicator at the top of the
screen illuminates.
Harmonic Measurement Functions
• If averaging is turned on, and the averaging type is exponential averaging, averaging is performed on
harmonic measurement functions.*
• Even if averaging is turned on, if the averaging type is moving average, averaging is not performed on
harmonic measurement functions.*
* In addition to the harmonic measurement functions, averaging is also applied to Ufnd, Ifnd, Pfnd, Sfnd, Qfnd,
λfnd, and Φfnd.
Averaging Type (Averaging Type)
You can use exponential (Exp) or moving averages (Lin).
Exponential Averaging (Exp)
With the specified attenuation constant, the numeric data is exponentially averaged according to the equation
below.
n =
D
n−1 +
n−1
Dn: Displayed value that has been exponentially averaged n times. (The first displayed value, D1, is equal to M1.)
D
: Displayed value that has been exponentially averaged n – 1 times.
n–1
M
: Measured data at the nth time.
n
K: Attenuation constant (select from 2 to 64)
Moving Average (Lin)
The specified average count is used to compute moving averages according to the equation below.
n =
n−(m−1)
n−2
n−1
n
Dn: Simple average of m numeric data values from n−(m−1)th to nth time
M
: Numeric data at the n–(m–1)th time
n–(m–1)
………………………………………………
………………………………………………
M
: Measured data at the n – 2th time.
n–2
M
: Measured data at the n – 1th time.
n–1
M
: Measured data at the nth time.
n
m: Average count (select a number from 8 to 64)
Attenuation Constant or Average Count (Averaging Count)
• If the averaging type is exponential averaging, set the attenuation constant to a value within the following
range.
2 to 64
• If the averaging type is moving average, set the average count to a value within the following range.
8 to 64
IM WT5000-01EN
6-11
Page 76

6 Computation and Output
Measurement Functions That Are Averaged
The measurement functions that are directly averaged are indicated below. Other functions that use these
functions in their computation are also affected by averaging. For details about how the values of the
measurement functions are determined, see appendix 1 in the Getting Started Guide, IM WT5000-03EN.
Measurement Functions Used in Normal Measurement
• Urms, Umn, Udc, Urmn, Uac, Irms, Imn, Idc, Irmn, Iac, P, S, Q, Ufnd, Ifnd, Pfnd, Sfnd, Qfnd, fU, fI, f2U, f2I
• ΔU1 to ΔPΣ (delta computation)
• Torque, Speed, Pm, Aux (models with the motor evaluation 1 or 2 option)
• λ, Φ, λfnd, Φfnd, CfU, CfI, Pc, q, q+, q–, and η1 to η4 are computed using the averaged values of Urms, Irms,
P, S, and Q.
• SyncSp is computed using the averaged value of fU or fI (models with the motor evaluation 1 or 2 option).
• Slip is computed using the averaged value of Speed (models with the motor evaluation 1 or 2 option).
Harmonic Measurement Functions
• U(k), I(k), P(k), S(k), Q(k)
• λ(k), and Φ(k) are computed using the averaged values of P(k) and Q(k).
• Z, Rs, Xs, Rp, Xp, Uhdf, Ihdf, Phdf, Uthd, Ithd, Pthd, Uthf, Ithf, Utif, Itif, hvf, hcf, and K–factor are computed
using the averaged values of U(k), I(k), and P(k).
k: The harmonic order
Measurement Functions That Do Not Perform Averaging
The following measurement functions do not perform averaging.
Measurement Functions Used in Normal Measurement
U+pk, U−pk, I+pk, I−pk, P+pk, P−pk, ITime, WP, WP+, WP−, WPΣ, WP+Σ, WP−Σ, WS, WQ
Harmonic Measurement Functions
ΦU (k), ΦI (k), ΦUi−Uj, ΦUi−Uk, ΦUi−Ii, ΦUj−Ij, ΦUk−Ik, fPLL1, fPLL2, EaM1U, EaM1I, EaM3U, EaM3I
* k: The harmonic order
Measurement Functions Used in Normal and Harmonic Measurement
F1 to F20, Event1 to Event8
• When averaging is turned on, the average value of multiple measurements is determined and displayed. If
the input signal changes drastically, it will take longer for the change to be reflected in the measured values
when averaging is used.
• A larger attenuation constant (for exponential averaging) or average count (for moving averages) will result
in more stable (and less responsive) measured values.
6-12
IM WT5000-01EN
Page 77

Click here.
Click here.
Click here.
Click here.
Click here.
6 Computation and Output
D/A Output (D/A Output, option)
You can generate numeric data as ±5 V FS DC voltage signals from the rear panel D/A output terminal. You can
set up to 20 items (channels).
Output Items (Item)
The measurement functions that you select under Function and Element/Σ appear here.
Function (Function)
• You can select any of the measurement functions listed under “Items That This Instrument Can Measure.”
• To output integrated values through D/A conversion, set the rated time for integrated D/A output.
• You can also choose not to output a measurement function (None). The output for channels that have been
set to none is 0 V, because they have no corresponding numeric data.
• When the D/A output range mode is set to Fixed, the D/A output of channels whose measurement function
has been set to Z, Rs, Xs, Rp, Xp, Utif, Itif, or F1 to F20 is Fixed at 0 V. When the range mode is manual, the
channels produce voltages.
Element (Element/Σ)
• When the function (Function) is set to something other than Speed, Torque, Pm, Slip, or SyncSp
• Depending on the function, select the element/wiring unit from the following options, or you may not need
to select it. The available options vary depending on the installed elements.
Element1, Element2, Element3, Element4, Element5, Element6, Element7, ΣA, ΣB, ΣC
• If an element in the selected wiring unit does not exist, because there is no data, the output is 0 V. For
example, if elements are assigned to ΣA but not to ΣB, the output for the measurement function for ΣB is 0 V.
• If you set the function (Function) to Speed, Torque, Pm, Slip, or SyncSp, you can select the motor number
(Motor 1, Motor 2, Motor 3, or Motor 4).
Harmonic Order (Order (k))
When you select a function that has harmonic data, you can set the displayed harmonic order within the
following range.
Total (Total value) or 0 (DC) to 500
The harmonic orders that can be specified vary depending on the measurement function. For details, see
“Harmonic Measurement Function Orders.”
The outputs of orders that exceed the maximum measurable order are 0 V. For information about the maximum
measurable harmonic order, see “Maximum Harmonic Order to Be Measured (Max Order).”
D/A Output Range Mode (Range Mode)
You can select the D/A output range mode from the following options.
Fixed (Fixed)
When a measurement function’s rated value is received, +5 V is output. For details, see “Relationship between
Output Items and the D/A Output Voltage.”
IM WT5000-01EN
6-13
Page 78

1.0 A
0.8 A
0.6 A
Time
Measured current
Fixed range mode Manual range mode
–5.0 V
6 Computation and Output
Manual (Manual)
You can set which measurement function values result in a D/A output of -5 V, and which result in a D/A output of
+5 V.
This enables the D/A output to be expanded or reduced for each channel (D/A zoom). For example, if you are
measuring a current that fluctuates between 0.6 A and 0.8 A with a measurement range of 1 A, when the D/A
output range mode is Fixed, the D/A output voltage will fluctuate between 3.0 V and 4.0 V. When you want to
observe the fluctuations more closely, you can use the D/A zoom feature. If you set the D/A output range mode
to Manual and set the minimum value to 0.6 and the maximum value to 0.8, this Instrument will produce –5 V
when the measured current value is 0.6 A and +5 V when the measured current value is 0.8 A.
D/A output D/A output
5.0 V
5.0 V
4.0 V
3.0 V
Time
(D/A zoom)
Maximum (Max) and Minimum (Min) Range Values
When the D/A output range mode is Manual, you can set the maximum (Max) and minimum (Min) values within
the following range.
−9.999T to 9.999T
6-14
• The output is 0 V if a measurement function is not selected or if there is no numeric data.
• If a scaling factor such as a VT ratio, CT ratio, or power coefficient is applied to a voltage, current, or power
value and scaling is enabled, this Instrument produces 100% output (5 V) when the scaled measured value
is the same as the scaled rated value (measurement range × scaling factor).
• For Σ functions, this Instrument produces 100% output (5 V) when the measured value is equivalent to the
value that is measured when all of the elements in the group are at their rated values. When the elements
have different scaling factors, this Instrument produces 100% output (5 V) when the scaled measured
values are the same as the scaled rated values (measurement range × scaling factor).
IM WT5000-01EN
Page 79

6 Computation and Output
Rated Time for Integrated D/A Output (Integration Rated Time)
When integrated values are output through D/A output, a rating value (the same value as the measurement
range) is continuously applied, the integrated value after the specified amount of time has elapsed is taken to
be 100%, and the D/A output at that point is 5 V. It is assumed that the change in the D/A output from 0% of the
integrated value (0 V) to 100% of the integrated value (5 V) will occur linearly over time, and the D/A output value
is determined by the ratio of the actual input level to this assumed straight line.
For the relationship between measured integrated D/A output and voltage, see “Relationship between Output
Items and D/A Output Voltage.”
Setting the Rated Time for Integrated D/A Output
• You can set the hour, minute, and second within the following range.
00000:00:00 to 10000:00:00
• This setting is valid in the following integration modes.
• Manual integration mode
• Real-time normal integration mode when the integration timer is set to 00000:00:00
• In the following integration modes, the rated time for integrated D/A output is set to the same time that the
timer is set to.
• Standard integration mode
• Continuous integration mode
• Real-time normal integration mode when the integration timer is not set to 00000:00:00
• Real-time continuous integration mode
When the rated time for integrated D/A output is set to 00000:00:00, the D/A output for the integrated value is
fixed at 0 V.
IM WT5000-01EN
6-15
Page 80

D/A output
Approx. 7.5 V
Displayed
1 Hz
100 Hz
10 kHz
1 MHz
100 MHz
1.5 GHz
D/A output
Approx. 7.0 V
Integration time
The timer time in normal or continuous integration mode.
Displayed Output
value
140% Approx. 7.0 V
100%
0%
−
–
D/A output
Displayed
6 Computation and Output
Relationship between Output Items and D/A Output Voltage
Frequency (the figure is simplified)
5.0 V
0.5 V
0.1 Hz
10 Hz
1 kHz
User-Defined Events
• When the event is occurring (True): +5 V
• When the event is not occurring (False): 0 V
Integrated Values
At 140% of the rated input
5.0 V
At the rated input
0
t0: The rated time of integrated D/A output in manual integration mode.
Other Items
100 kHz
10 MHz
t
0
value
1 GHz
• The outputs for λ, Φ, EaM1U, EaM1I, EaM3U, and EaM3I do not exceed ±5 V. When the display format of Φ
is set to 360 degrees, the output for Φ ranges from 0 V to +5 V. When the display format of Φ is set to 180
degrees (lagging 180° to leading 180°), the output for Φ ranges from –5 V to +5 V. However, when an error
occurs, the output is approximately 7.5 V. Only the outputs for U–pk and I–pk are approximately –7.5 V when
an error occurs.
• The outputs for η1 to η4, Uhdf, Ihdf, Phdf, Uthd, Ithd, Pthd, Uthf, Ithf, hvf, hcf, and Slip* are +5 V at 100%.
6-16
5.0 V
0 V
100%
140% Approx. −7.0 V
−
5.0 V
Approx. 7.5 V
Approx. 7.0 V
−
100
−
140
5.0 V
0
−
Approx. –7.0 V
Approx. –7.5 V
5.0 V
100
140
value (%)
IM WT5000-01EN
Page 81

6 Computation and Output
• The output for an analog torque signal is +5 V when the torque reaches the value of the input range × the
torque scaling factor × the input signal slope (this is the rated value).* For example, when the input range is 10 V,
if the scaling factor is set to 1 N•m of torque per 1 V of input voltage, the output is +5 V when the torque is 10
N•m.
• The output for a pulse torque signal is –5 V when the torque reaches the value specified for Pulse Range
Upper × –1, and the output is +5 V when the torque reaches the value specified for Pulse Range Upper.*
• The output for an analog rotating speed signal is +5 V when the rotating speed reaches the value of the input
range × the revolution scaling factor × the input signal slope (this is the rated value).* For example, when the
input range is 10 V, if the scaling factor is set to 100 rpm per 1 V of input voltage, the output is + 5 V when the
rotating speed is 1000 rpm.
• The output for a pulse rotating speed signal is –5 V when the rotating speed reaches the value specified for
Pulse Range Upper × –1, and the output is +5 V when the rotating speed reaches the value specified for
Pulse Range Upper.*
• The output for SyncSp is +5 V when SyncSp is at the rated value for Speed.*
• The output for Pm is +5 V when Pm reaches the motor output value obtained from the rated values for the
torque and rotating speed.
1
• When the auxiliary signal is analog, the output for Aux is +5 V when Aux reaches the value of the analog
signal’s input range × the scaling factor for Aux × the auxiliary signal slope (this is the rated value).*
• When the auxiliary signal is pulse, the output for Aux is –5 V when the auxiliary signal reaches the value
specified for Pulse Range Upper × –1, and the output is +5 V when the auxiliary signal reaches the value
specified for Pulse Range Upper.*
* Applies to models with the motor evaluation 1 or 2 option.
IM WT5000-01EN
6-17
Page 82

7 Harmonic Measurement Conditions
Click here.
Harmonic Measurement Conditions (Harmonics)
Using harmonic measurement, you can measure functions that are based on the voltage, current, and power
harmonics and their distortion factors; on the phase angle of each harmonic relative to the fundamental; etc. You
can also compute the harmonic distortion factors for voltage and current.
For a list of the measurement functions that can be measured with harmonic measurement and their
descriptions, see “Harmonic Measurement Functions” under “Items That This Instrument Can Measure.”
The following menu items appear.
• Input element group (Elements)
• PLL source (PLL Source)
• Measured harmonic orders (Min Order/Max Order)
• Distortion factor equation (Thd Formula)
• Number of FFT points (FFT Points)
Input Element Group (Elements)
You can divide all the input elements into two groups: Hrm1 and Hrm2, and measure harmonics using two PLL
sources with different frequencies. You can measure the input and output harmonics of an AC–AC converter
whose input and output frequencies are different.
Element1 to Element7
Set the group of each element to Hrm1 or Hrm2. Input elements that are assigned to the same wiring unit are set
to the same group.
PLL Source (PLL Source)
For harmonics to be measured, the fundamental period (the period of the fundamental signal) that will be used to
analyze the harmonics must be determined. The signal for determining the fundamental period is the PLL (phase
locked loop) source.
Select the PLL source of groups Hrm1 and Hrm2 from the following options. The available options vary
depending on the installed elements.
U1, I1, U2, I2, U3, I3, U4, I4, U5, I5, U6, I6, U7, I7, Ext Clk
* If you select Ext Clk, the frequency of the signal applied to the rear panel’s external clock input connector
(EXT CLK) is used as the fundamental frequency for harmonic measurement. For the EXT CLK connector
specifications, see section 4.3 in the Getting Started Guide, IM WT5000-03EN.
IM WT5000-01EN
7-1
Page 83

Click here.
7 Harmonic Measurement Conditions
• Select a signal that has the same period as the signal that you want to measure the harmonics of. For
stable harmonic measurement, choose an input signal for the PLL source that has as little distortion and
fluctuation as possible. If the fundamental frequency of the PLL source fluctuates or if the fundamental
frequency cannot be measured due to waveform distortion, correct measurements will not be obtained.
When the measured item is a switching power supply and in other cases where the distortion of the voltage
signal is smaller than that of the current signal, we recommend that the PLL source be set to the voltage.
• If all of the input signals are distorted or the amplitude is small compared to the measurement range, the
specifications may not be met. To achieve stable, accurate measurements on high harmonics, set the
PLL source to an external clock signal and apply a signal with the same period as the input signal to the
external clock input terminal.
• If the fundamental frequency of the input signal is less than the following frequencies and the input signal
contains high frequency components, we recommend that you turn on the frequency filter and set the cutoff
frequency as follows.
Fundamental Frequency of the Input Signal Cutoff Frequency of the Frequency Filter
100 Hz or less 0.1 kHz
1 kHz or less 1 kHz
10 kHz or less 10 kHz
100 kHz or less 100 kHz
• If the amplitude level of the signal applied to the element that is specified as the PLL source is small compared
to the measurement range, PLL synchronization may not be achieved. If the crest factor is set to CF3, set the
measurement range so that the amplitude level of the PLL source is at least 50%. If the crest factor is set to
CF6 or CF6A, set the measurement range so that the amplitude level of the PLL source is at least 100%.
• If the frequency of the PLL source changes, correct measured values are displayed four data updates
after the change. Correct measured values may not be obtained immediately after the PLL source or its
frequency changes, because the PLL circuit inside this instrument redetects the frequency.
Measured Harmonic Orders (Min Order/Max Order)
The harmonic measurement range can be specified for groups Hrm1 and Hrm2. The harmonic orders specified
here are used to determine the numeric data of the distortion factor.
Minimum Harmonic Order to Be Measured (Min Order)
Select from the following.
• 0: The 0th order (DC) component is included when numeric harmonic waveform data is determined.
• 1: The 0th order (DC) component is not included when numeric harmonic waveform data is determined.
The harmonic measurement data (the harmonic waveform data) is determined from the 1st order (the
fundamental wave).
Maximum Harmonic Order to Be Measured (Max Order)
You can select a value between 1 and 500.
However, the maximum measurable harmonic order is the smallest of the three orders listed below.
• The specified maximum harmonic order to be measured
• The value determined automatically according to the PLL source frequency (see section 6.7 in the Getting
Started Guide, IM WT5000-03EN)
• When the data update interval is 50 ms or Auto, the maximum measurable harmonic order is 100.
The numeric data corresponding to harmonic orders above the maximum measurable harmonic order is
displayed as “-------” (no data).
• If the minimum harmonic order to be measured is set to 1, the data of the DC component is not included
when the distortion factor is determined.
• There is no overload value indication (“-OL-”) or zero indication (rounding to zero) for the numeric data
of harmonic orders 0 (DC) to 500. For information about the overload value indication (“-OL-”) and zero
indication (rounding to zero) in normal measurement, see sections 6.15 and 6.16 in the Getting Started
Guide, IM WT5000-03EN.
7-2
IM WT5000-01EN
Page 84

Aliased signal Input signal Sampled points
Click here.
7 Harmonic Measurement Conditions
Distortion Factor Equation (Thd Formula)
When determining the harmonic measurement functions Uhdf, Ihdf, Phdf, Uthd, Ithd, and Pthd, you can select
to use one of the denominators described below as the denominator for the equation. For information about
equations, see appendix 1 in the Getting Started Guide, IM WT5000-03EN.
1/Total (1/Total)
The denominator is the measured data of all orders from the minimum measured order (0 or 1st) to the maximum
measured order (within the upper limit of harmonic analysis).
1/Fundamental (1/Fundamental)
The denominator is the data of the fundamental signal component (1st order).
Number of FFT Points (FFT Points)
Set the number of FFT points to 1024 or 8192.
Anti-Aliasing Filter
When an FFT is taken through the performance of A/D conversion on a repetitive waveform, a phenomenon
occurs in which frequency components that exceed half the frequency of the sampling frequency are detected as
low frequency components. This phenomenon is called aliasing.
Aliasing causes problems such as increased errors in measured values and incorrect measurements of the
phase angles on each harmonic. An anti-aliasing filter is used to prevent aliasing and eliminate high frequency
components that are irrelevant to the harmonic measurement.
For example, when an input signal with a fundamental frequency of 50 Hz is measured up to the 50th
order, the frequency of the 50th order is 2.5 kHz. Thus, a 5-kHz anti-aliasing filter is used to eliminate high
frequency components that are greater than or equal to approximately 5 kHz, which are irrelevant to harmonic
measurement.
This instrument uses the line filter as an anti-aliasing filter for harmonic measurements. For information about
how to configure the filter, see “Line Filter (Line Filter).”
The accuracy and the upper limit of the measurement bandwidth change when the anti-aliasing filter (line filter)
is turned ON. For details, see sections 6.15 and 6.16 in the Getting Started Guide, IM WT5000−03EN.
IM WT5000-01EN
7-3
Page 85

8 Computation
Computation (Measure)
You can specify the following items.
• User-defined functions (User Defined Functions)
• Measuring the average active power
• MAX hold (Max Hold)
• User-defined events (User Defined Events)
• Equation for apparent power (S Formula)
• Apparent power and reactive power computation types (S,Q Formula)
• Equation for corrected power (Pc Formula)
• Phase difference display format (Phase)
• Master/slave synchronous measurement (Sync Measure)
User-Defined Functions (User Defined Functions)
You can combine function symbols to create equations and use the numeric data of the combined functions to
determine the value of the equation.
User-defined functions allow you to determine physical values other than those of the measurement functions
by combining operands. The measurement functions that you can specify for the efficiency equation are fixed
at power and motor output. However, by using user-defined functions, you can create equations consisting of
measurement functions other than power and motor output measurement functions to determine ratios other
than efficiency.
Selecting Which User-Defined Function to Configure
Select the number of the user-defined function that you want to configure from the options below.
• F1−F5: User-defined functions F1 to F5
• F6−F10: User-defined functions F6 to F10
• F11−F15: User-defined functions F11 to F15
• F16−F20: User-defined functions F16 to F20
Turning the Computation of User-Defined Functions On or Off
Turn the computation of user-defined functions on or off.
User-Defined Function Name (Name)
• Number of characters: Up to 8
• Usable characters: Spaces and all characters that are displayed on the keyboard
IM WT5000-01EN
8-1
Page 86

8 Computation Function
Expression (Expression)
Operation Type
You can use combinations of measurement functions and element numbers (e.g., Urms1) as operands to
configure up to 20 equations (F1 to F20). There can be up to 16 operands in 1 equation.
The different types of operands are listed below (measurement function: operand).
• Normal Measurement
Voltage, current, and power
Urms: URMS( ) Irms: IRMS( ) P: P( ) Pfnd: PFND( )
Umn: UMN( ) Imn: IMN( ) S: S( ) Sfnd: SFND( )
Udc: UDC( ) Idc: IDC( ) Q: Q( ) Qfnd: QFND( )
Urmn: URMN( ) Irmn: IRMN( ) λ: LAMBDA( ) λfnd: LAMBDAFND( )
Uac: UAC( ) Iac: IAC( ) Φ: PHI( ) Φfnd: PHIFND( )
Ufnd: UFND( ) Ifnd: IFND( ) Pc: PC( ) −−−
U+pk: UPPK( ) I+pk: IPPK( ) P+pk: PPPK( ) −−−
U−pk: UMPK( ) I−pk: IMPK( ) P−pk: PMPK( ) −−−
CfU: CFU( ) CfI: CFI( ) −−− −−−
fU: FU( ) fI: FI( ) −−− −−−
f2U: F2U( ) f2I: F2I( ) −−− −−−
Integrated power
Wp: WH( ) q: AH( ) ITime: ITIME( )
Wp+: WHP( ) q+: AHP( ) WS: SH( )
Wp−: WHM( ) q−: AHM( ) WQ: QH( )
Efficiency
η1: ETA1( ) to η4: ETA4( )
User-defined functions
F1: F1( ) to F20: F20( )
• Harmonic measurement
U(k):UK( , ) I(k):IK( , ) P(k):PK( , )
S(k):SK( , ) Q(k):QK( , )
U(k):UPHI( , )
Φ
Z(k):ZK( , ) Rs(k):RSK( , ) Xs(k):XSK( , )
−−− Rp(k):RPK( , ) Xp(k):XPK( , )
Uhdf(k):UHDF( , ) Ihdf(k):IHDF( , ) Phdf(k):PHDF( , )
Uthd: UTHD( ) Ithd: ITHD( ) Pthd: PTHD( )
Uthf: UTHF( ) Ithf: ITHF( ) −−−
Utif: UTIF( ) Itif: ITIF( ) −−−
hvf: HVF( ) hcf: HCF( ) −−−
fPLL1:PLLFRQ1( ) fPLL2:PLLFRQ2( ) Kfactor:KFACT( )
U1−U2: PHIU1U2( )
Φ
U2−I2: PHIU2I2( )
Φ
I(k):IPHI( , )
Φ
U1−U3: PHIU1U3( )
Φ
U3−I3: PHIU3I3( )
Φ
(k):LAMBDAK( , )
λ
Φ
Φ
−−−
(k):PHIK( , )
U1−I1: PHIU1I1( )
8-2
IM WT5000-01EN
Page 87

• Delta computation
U1( ): DELTAU1( )
Δ
U2( ): DELTAU2( )
Δ
U3( ): DELTAU3( )
Δ
( ): DELTAUSIG( )
ΔUΣ
U1rms( ): DELTAU1RMS( )
Δ
U2rms( ): DELTAU2RMS( )
Δ
U3rms( ): DELTAU3RMS( )
Δ
rms( ): DELTAUSIGRMS( )ΔUΣmean( ): DELTAUSIGMN( )ΔUΣrmean( ): DELTAUSIGRMN( )
ΔUΣ
U1dc( ): DELTAU1DC( )
Δ
U2dc( ): DELTAU2DC( )
Δ
U3dc( ): DELTAU3DC( )
Δ
dc( ): DELTAUSIGDC( )
ΔUΣ
−−− −−−
I( ): DELTAI( )
Δ
−−−
−−−
−−−
U1mean( ): DELTAU1MN( )
Δ
U2mean( ): DELTAU2MN( )
Δ
U3mean( ): DELTAU3MN( )
Δ
U1ac( ): DELTAU1AC( )
Δ
U2ac( ): DELTAU2AC( )
Δ
U3ac( ): DELTAU3AC( )
Δ
ac( ): DELTAUSIGAC( )
ΔUΣ
• Motor evaluation (option)
Speed: SPEED( ) Torque: TORQUE( ) Pm: PM( )
Slip: SLIP( ) SyncSp: SYNC( ) −−−
EaM1U: EAM1U( ) EaM1I: EAM1I( ) −−−
EaM3U: EAM3U( ) EaM3I: EAM3I( ) −−−
• Auxiliary input (option)
Aux1:AUX1( ) Aux2:AUX2( ) Aux3:AUX3( )
Aux4:AUX4( ) Aux5:AUX5( ) Aux6:AUX6( )
Aux7:AUX7( ) Aux8:AUX8( ) −−−
8 Computation Function
P1( ): DELTAP1( )
Δ
P2( ): DELTAP2( )
Δ
P3( ): DELTAP3( )
Δ
( ): DELTAPSIG( )
ΔPΣ
U1rmean( ): DELTAU1RMN( )
Δ
U2rmean( ): DELTAU2RMN( )
Δ
U3rmean( ): DELTAU3RMN( )
Δ
Irms( ): DELTAIRMS( )
Δ
Imean( ): DELTAIMN( )
Δ
Irmean( ): DELTAIRMN( )
Δ
Idc( ): DELTAIDC( )
Δ
Iac( ): DELTAIAC( )
Δ
• Measurement range
RngU:RNGU( ) RngI:RNGI( )
RngSpd:RNGSPD( )
RngAux: RNGAUX1( ) to RNGAUX8( )*
1
RngTrq:RNGTRQ( )
*
* Models with the motor evaluation 1 or 2 option
Setting the Operand Parameters
The parameters that you need to enter depend on whether the function is followed by “( , )” or “( )”.
• ( , ) Notation
Specify the element to the left of the comma, and specify the harmonic order to the right of the comma. For
example: (E1,OR2).
• Symbols representing elements
E1 to E7: Elements 1 to 7
SA to SC: Wiring units ΣA to ΣC
• Symbols representing harmonic orders (Order)
ORT: Total value
OR0: dc
OR1: Fundamental wave
OR2 to OR500: Harmonic orders 2 to 500
• Setting Parameters for Functions Followed by “( )”
• For measurement functions other than Speed, Torque, Pm, Slip, or SyncSp, depending on the function,
set the symbol representing the element, or you may not need to set it. For example, set it as (E1). For
information about the symbols that can be used for the parameters of each operand, see appendix 6 in the
Getting Started Guide, IM WT5000−03EN.
• For the Speed, Torque, Pm, Slip, and SyncSp measurement functions, set M1 to M4, which are symbols
representing the motor numbers. For example, set it as (M1).
IM WT5000-01EN
8-3
Page 88

(Total rms voltage value)2 – (Rms value of the fundamental voltage signal)
8 Computation Function
Values Substituted in Operands
• The unit of ITIME( ) is seconds.
• η1 to η4 are displayed as percentages (see in appendix 1 in the Getting Started Guide, IM WT5000-03EN).
However, in this section ETA1 to ETA4 are described as ratios.
Example: When η1 is 80%, ETA1 is 0.8
• The U1 in PHIU1U2 represents the voltage signal of the element whose element number is the smallest in
the wiring unit (ΣA, ΣB, or ΣC). For example, if input elements 2, 3, and 4 are assigned to wiring unit ΣA,
PHIU1U2 is the phase difference between the voltage signals of input elements 2 and 3.
• User-defined equations can use other user-defined equations with smaller numbers as operands. For
example, the equation for user-defined function F3 can be set to F1( ) + F2( ). This allows equations that
would otherwise exceed 50 characters in length to be computed. This can be accomplished by for example
setting equations in F1 and F2, and then adding or dividing those equations in F3. This feature is also
convenient when defining multiple equations that include common operands. For example, you can set
common operands in F1, and then set F4 as F3( ) divided by F1( ) and set F5 as F4( ) divided by F1( ).
However, if you enter a user-defined equation with a number that is greater than or equal to its own number,
correct results will not be obtained. For example, if you set user-defined function F3 to F1( )+F3( ) or to F1(
)+F4( ), the computed result will be displayed as “-------” (no data) or “-OF-” (overflow).
Operators
The following operators can be used in equations.
Operators Example Description
+, −, *, / U(E1,OR1)−U(E2,OR1) Basic arithmetic
ABS ABS(P(E1,ORT)+P(E2,ORT)) Absolute value
SQR SQR(I(E1,OR0)) Square
SQRT SQRT(ABS(I(E1,OR3))) Square root
LOG LOG(U(E1,OR25)) Natural logarithm
LOG10 LOG10(U(E1,OR25)) Common logarithm
EXP EXP(U(E1,OR12)) Exponent
NEG NEG(U(E1,OR12)) Negation
SIN SIN(URMS(E1)) Sine
COS COS(URMS(E1)) Cosine
TAN TAN(URMS(E1)) Tangent
ASIN ASIN(URMS(E1)) Arcsine
ACOS ACOS(URMS(E1)) Arccosine
ATAN ATAN(URMS(E1)) Arctangent
Number and Type of Characters That Can Be Used in Equations
• Number of characters: Up to 60
• Usable characters: Spaces and all characters that are displayed on the keyboard
On the keyboard, press
to enter operand and equation characters. The characters that you can select are
indicated below.
ABS( NEG( CF HCF( MN(
SQR( SIN( ITIME( KFACT( RMN(
SQRT( COS( THD( EAM1U( DC(
LOG( TAN( THF( EAM1I( AC(
LOG10( PPK( TIF( PLLFRQ1( PC(
EXP( MPK( HVF( RMS(
Equation Examples
An equation to determine the rms value of the harmonic components of the voltage signal of input element 2.
2
SQRT(SQR(U(E2,ORT))−SQR(U(E2,OR1)))
8-4
IM WT5000-01EN
Page 89

Integrated power
Elapsed integration time
Average active power =
8 Computation Function
If an operand in an equation is undetermined, the computed result is displayed as “-------” (no data). This
occurs when a delta computation measurement function is in the equation, but delta computation is turned
OFF, or when a measurement function of an element that is not installed is in the equation.
Unit (Unit)
• Number of characters: Up to 8
• Usable characters: Spaces and all characters that are displayed on the keyboard
Measuring the Average Active Power
The average active power can be computed for devices, such as intermittent control devices, whose power
fluctuates. Use a user-defined function to specify the equation for computing the average active power.
For example, to determine the average active power of element 1, set the equation of a user-defined function as
follows:
WH(E1)/(ITIME(E1)/3600)
The unit of ITIME( ) is seconds.
MAX Hold (Max Hold)
Select whether to hold the maximum numeric value (MAX value) (on or off). You can determine the measurement
functions whose maximum values will be held using a user-defined function. The different types of operands are
listed below (measurement function: operand).
Urms: MAXURMS( ) Irms: MAXIRMS( ) P: MAXP( )
Umn: MAXUMN( ) Imn: MAXIMN( ) S: MAXS( )
Udc: MAXUDC( ) Idc: MAXIDC( ) Q: MAXQ( )
Urmn: MAXURMN( ) Irmn: MAXIRMN( ) −−−
Uac: MAXUAC( ) Iac: MAXIAC( ) −−−
U+pk: MAXUPPK( ) I+pk: MAXIPPK( ) P+pk: MAXPPPK( )
U−pk: MINUMPK( ) I−pk: MINIMPK( ) P−pk: MINPMPK( )
To hold the maximum value of the Urms for element 1, enter MAXURMS(E1) in the equation for a user-defined
function, and enable MAX hold.
• For information about the symbols that can be used for the parameters of each operand, see appendix 6 in
the Getting Started Guide, IM WT5000−03EN.
• The maximum values of the data above are held while the MAX hold function is enabled.
• Numeric data list output through the D/A output and the communication values all reflect the held maximum
values.
IM WT5000-01EN
• When MAX hold is applied to measurement functions that have positive and negative values, this
instrument compares the absolute values to determine the maximum value.
• To reset held maximum values, turn MAX hold off, and then turn it on again.
8-5
Page 90

Click here.
Click here.
8 Computation Function
User-Defined Events (User Defined Event)
User-defined events can be used to trigger data storage. You can define up to eight user-defined events.
Turning User-Defined Events On and Off
Select whether to enable user-defined events.
User-Defined Event Name (Name)
• Number of characters: Up to 8
• Usable characters: Spaces and all characters that are displayed on the keyboard
Judgment Conditions (Expression)
Set the judgment conditions.
Judgment Method (Expression Type)
Select the judgment method from the following options.
• Range (Range): Specify judgment conditions using ranges of measurement function values or differences
from a reference value.
• Condition (Condition): Specify judgment conditions using user-defined events.
Indication of User-Defined Event Occurrence (Indications)
Set the character strings to show when a user-defined event occurs (True) and when it does not occur (False).
• Number of characters: Up to 6
• Usable characters: Spaces and all characters that are displayed on the keyboard
Range (Range)
Specify the judgment condition here when you have set the judgment condition specification method to Range.
• Function (Function)
You can select any of the measurement function types listed under “Items That This Instrument Can
Measure.”
• Element (Element/Σ)
• If you select a function other than Speed, Torque, Pm, Slip, or SyncSp, depending on the function, select
the element/wiring unit from the following options, or you may not need to select it. The available options
vary depending on the installed elements.
Element1, Element2, Element3, Element4, Element5, Element6, Element7, ΣA, ΣB, ΣC
• If you select Speed, Torque, Pm, Slip, or SyncSp for the function (Function), select the motor number from
the following options. The options vary depending on the installed motor evaluation function option.
Motor 1, Motor 2, Motor 3, Motor 4
• Harmonic Order (Order (k))
This is the same as setting the harmonic order in all items display of the numeric data display.
• Judgment Condition
Select the method for comparing the measured value and the reference value from the following options.
OFF, <, <=, =, >, >=, !=(not equal)
• Reference Value
Select a number from –9.9999 T to 9.9999 T.
8-6
IM WT5000-01EN
Page 91

AND/OR/END Specification Boxes
Inversion of judgment conditions
8 Computation Function
For example, a condition that is true when 150 < the measured power value of element 1 < 160 W and false
otherwise would be configured as shown below.
Condition (Condition)
Specify the judgment condition here when you have set the judgment condition specification method to
Condition.
Event Specification Boxes
Turning the Judgment Condition Inversion On and Off (Inverse)
You can invert the judgment of the condition (true or false) indicated to the right of the check box.
Event Specification Boxes
You can select the number of a user-defined event that is smaller than the number of the user-defined event that
you are currently configuring. For example, when you are configuring the conditions of user-defined event Ev3,
you can select Ev1 or Ev2.
AND/OR/END Specification Boxes
• AND, OR
To use multiple user-defined events to configure a condition, set the method of combining the events to
logical AND or logical OR. When you select AND or OR, an event specification box appears to the right of the
AND/OR/END specification box. The number of user-defined events that you can combine is indicated below.
When you reach the maximum number of combinable user-defined events, no AND/OR/END specification
box appears to the right of the last event.
• Ev1: 0. You cannot use other user-defined events as conditions. Set the judgment condition using a range.
• Ev2: 1 (Ev1)
• Ev3: 2 (Ev1 and Ev2)
• Ev4: 3 (Ev1 to Ev3)
• Ev5: 4 (Ev1 to Ev4)
• Ev6: 5 (Ev1 to Ev5)
• Ev7: 6 (Ev1 to Ev6)
• Ev8: 7 (Ev1 to Ev7)
• END
Select END to end the definition of the condition. No event specification box appears to the right of an AND/
OR/END specification box that has been set to END.
If you set the event judgment condition to a range and the function of the judgment condition returns a value
of “-------” (no data), because judgment cannot be performed, the judgment result is FALSE. For example,
when integration is not being performed, if the function of event Ev1 is set to integrated power (WP) and
the judgment condition is WH(E1)>0, the measured data is displayed as “-------” (no data), so the judgment
for Ev1 is FALSE. Also, if you set the judgment condition specification method to Condition and events that
cannot be judged are included in the judgment conditions, the judgment result is FALSE. For example, if you
set the judgment condition of event Ev2 to NOT(EV1()), if the judgment for Ev1 is FALSE because of the
reason given in the example above, the result for Ev2 is not TRUE but FALSE.
IM WT5000-01EN
8-7
Page 92

8 Computation Function
Equation for Apparent Power (S Formula)
You can select the voltage and current to use to compute the apparent power (voltage × current) from the
following options.
• Urms*Irms
The product of the true rms values of the voltage and current
• Umean*Imean
The product of the voltage’s and current’s rectified mean values calibrated to the rms values
• Udc*Idc
The product of the simple averages of the voltage and current
• Umean*Irms
The product of the voltage’s rectified mean value calibrated to the rms value and the current’s true rms value
• Urmean*Irmean
The product of the voltage’s and current’s rectified mean values
8-8
IM WT5000-01EN
Page 93

(= s1× (U1×I1)2−P12 + s2× (U2×I2)2−P22 + s3× (U3×I3)2−P3
)
QΣ = SΣ2−PΣ
2
SΣ = PΣ2+QΣ
8 Computation Function
Apparent Power and Reactive Power Computation Types (S,Q Formula)
There are three types of power: active power, reactive power, and apparent power. In general, they are defined
by the following equations.
Active power P = UIcosΦ (1)
Reactive power Q = UIsinΦ (2)
Apparent power S = UI (3)
U = rms voltage; I = rms current; Φ = Phase difference between voltage and current
The power values are related as follows:
(Apparent power S)
The three-phase power is the sum of the power of each phase.
These definitions only apply for sine waves. The measured values for apparent power and reactive power
vary for distorted waveform measurement depending on which of the above definitions are combined for the
computation. Because the equations for deriving the apparent and reactive power for distorted waveforms are
not defined, none of the equations can be said to be more correct than the other. Therefore, this instrument
allows you to select the apparent power and reactive power equations.
Unlike apparent power and reactive power, active power is derived directly from the sampled data, so errors
resulting from different definitions do not occur.
Type 1 (Type 1) (The method used in the normal mode of conventional WT series power meters)
This instrument calculates the apparent power of each phase using equation 3, calculates the reactive power of
each phase using equation 2, and sums the results to derive the power.
Active power for a three-phase four-wire system PΣ = P1 + P2 + P3
Apparent power for a three-phase four-wire system SΣ = S1 + S2 + S3 ( = U1 × I1 + U2 × I2 + U3 × I3)
Reactive power for a three-phase four-wire system QΣ = Q1 + Q2 + Q3
2
= (Active power P)2 + (Reactive power S)2 (4)
2
The signs for s1, s2, and s3 are negative when the current leads the voltage and positive when the current lags
the voltage.
Type 2 (Type 2)
This instrument calculates the apparent power of each phase using equation 3 and sums the results to derive
the three-phase apparent power. This instrument calculates the three-phase reactive power from the threephase apparent power and the three-phase active power using equation 4.
Active power for a three-phase four-wire system PΣ = P1 + P2 + P3
Apparent power for a three-phase four-wire system SΣ = S1 + S2 + S3 ( = U1 × I1 + U2 × I2 + U3 × I3)
Reactive power for a three-phase four-wire system
Type 3 (Type 3) (The method used in the harmonic measurement modes of the WT1600, WT3000 and
PZ4000)
This instrument calculates the reactive power of each phase using equation 2 and calculates the three-phase
apparent power using equation 4.
Active power for a three-phase four-wire system PΣ = P1 + P2 + P3
Apparent power for a three-phase four-wire system
2
Reactive power for a three-phase four-wire system QΣ = Q1 + Q2 + Q3
IM WT5000-01EN
8-9
Page 94

Pc =
Type 1: IEC76-1(1976) Type 2: IEC76-1(2011)
Pc: Corrected Power
P: Active power
Urms: True rms voltage
Umn: Voltage’s rectified mean calibrated to the rms value
P1, P2: Coefficients specified by the applicable standard
8 Computation Function
Equation for Corrected Power (Pc Formula)
Some standards require that a voltage transformer’s active power be corrected when the load connected to the
voltage transformer is very small. You can select an equation to use for this correction and specify the coefficient.
Applicable Standard (Pc Formula)
Select from the following.
• Type 1 (Type 1): IEC76−1 (1976)
• Type 1 (Type 2): IEC76−1(2011)
Equations for each applicable standard
Umn
−
Urms
Umn
1 + P2
P
P
Urms
Umn
2
Pc =
1 +
P
Coefficients (P1 and P2)
You can set coefficients P1 and P2 to values within the range of 0.0001 to 9.9999.
The IEEE C57.12.90-2010 equation is the same as IEC761 (1976).
8-10
IM WT5000-01EN
Page 95

8 Computation Function
Phase Difference Display Format (Phase)
The phase difference Φ between the voltage and current indicates the current phase relative to the voltage of
each element. Set the display format to one of the options below.
• 180 degrees (180 degrees)
If the current phase is in the counterclockwise direction with respect to voltage, the current is leading (D) the
voltage. If the current phase is in the clockwise direction with respect to the voltage, the current is lagging
(G) the voltage. The phase difference is expressed by an angle between 0 and 180° (see appendix 2 in the
Getting Started Guide, IM WT5000-03EN).
• 360 degrees (360 degrees)
The phase difference is expressed as an angle between 0 and 360° in the clockwise direction.
• If the measured voltage or current value is zero, “Error” is displayed.
• Phase difference Φ for lead (Lead) and lag (Lag) is displayed correctly only when both the voltage and
current are sine waves and the ratio of the input to the measurement range is not greatly different between
the voltage and current.
• If the computation result of power factor λ exceeds 1, Φ is displayed as follows:
• If the power factor λ is greater than 1 and less than or equal to 2, Φ returns 0.
• If λ is greater than 2, Φ returns an error (“Error” is displayed).
• For harmonic measurement, the phase differences ΦU and ΦI of harmonic orders 1 to 500 of the voltage
and current are always displayed using an angle between 0 and 180° (no sign for lead and negative sign
for lag).
IM WT5000-01EN
8-11
Page 96

8 Computation Function
Master/Slave Synchronous Measurement (Sync Measure)
Connect the external start signal input/output terminals (MEAS. START) of the master and slave instruments
using a BNC cable (sold separately). You can synchronize the measurement of two instruments making one
the master and the other the slave. The master outputs a measurement start signal, and the slave receives the
signal.
For the specifications of the external start signal input/output terminals, see section 4.3 in the Getting Started
Guide, IM WT5000-03EN.
The measurement of the master and slave units cannot be synchronized under the following conditions:
• When the data update interval differs between the master and slave.
• During real-time integration mode or real-time storage mode.
Follow the procedure below to hold values during synchronized measurement.
• To hold the display: Hold the display of the master first.
• To unhold the display: Unhold the display of the slave first.
8-12
IM WT5000-01EN
Page 97

9 Display
Display (Display)
Single Screen Display (Full Screen Display)
Split Display
Display Settings
Single Screen Display (Full Screen Display)
You can display the following screens.
Numeric: Numeric display
Graph: Graph display
Split Display
You can split the screen into top and bottom halves, and select a display to show in each half.
Numeric: Numeric display
Graph: Graph display
Display Settings
Numeric Display
Each time you press NUMERIC, the display format switches, in order, between All Items, 4 Items, 8 Items, 16
Items, Matrix, Hrm List Single, and Hrm List Dual.
Graph Display
Each time you press GRAPH, the screen switches, in order, between waveform display, trend display, bar graph
display, and vector display.
IM WT5000-01EN
9-1
Page 98

10 Numeric Data Display
Click here.
Click here.
Click here.
Click here.
Click here.
Numeric Data Display (NUMERIC)
You can press NUMERIC to make the numeric data display appear.
Each time you press NUMERIC, the display format switches, in order, between All, 4 Items, 8 Items, 16 Items,
Matrix, Hrm List Single, and Hrm List Dual.
Numeric Data Display Format
You can select the number of numeric data items that are displayed simultaneously from the choices below or
choose to display a list of items.
All Display (All Items)
A table of numeric data is displayed with measurement functions listed vertically and symbols indicating
elements and wiring units listed horizontally. You cannot change the order of the displayed items. The number of
displayed items varies depending on the number of elements that are installed in this instrument.
4-Value Display (4 Items)
Four numeric data values are displayed in two columns.
8-Value Display (8 Items)
• When the display format is single screen display (full screen display), eight numeric data values are displayed
in two columns.
• When the display format is split display, eight numeric data values are displayed in four columns.
16-Value Display (16 Items)
Sixteen numeric data values are displayed in four columns.
Matrix Display
A table of numeric data is displayed with measurement functions listed vertically and symbols indicating
elements and wiring units listed horizontally. You can change the order of the displayed items and the number of
columns.
IM WT5000-01EN
10-1
Page 99

Click here.
Click here.
10 Numeric Data Display
Harmonics List Single Screen (Hrm List Single)
• When the display format is single screen display, 42 harmonic order data items of a single measurement
function are displayed in two columns.
• When the display mode is split display, 22 harmonic order data items of a single measurement function are
displayed in two columns.
Measurement function display area
(Data concerning all harmonics)
Harmonic order data display area
Measurement function
Numeric data for each
harmonic
Distortion factors of each harmonic
(When the selected measurement function
is U, I, or P, Uhdf, Ihdf, or Phdf is displayed.)
Harmonics List Dual Screen (Hrm List Dual)
• When the display format is single screen display, the harmonic order data items of two measurement
functions are displayed in two separate columns, each containing up to 22 values.
• When the display format is split display, the harmonic order data items of two measurement functions are
displayed in two separate columns, each containing up to 12 values.
Measurement function display area
(Data concerning all harmonics)
Harmonic order data display area
Measurement function 1
Measurement function 2
10-2
Numeric data for each
harmonic
Distortion factors of each harmonic
(When the selected measurement function is
U, I, or P, Uhdf, Ihdf, or Phdf is displayed.)
IM WT5000-01EN
Page 100

Click here.
10 Numeric Data Display
Switching the Displayed Page (Page Scroll)
You can switch the displayed page and display a new set of items.
•
on the screen or + on the Display menu: The next page is displayed.
•
on the screen or – on the Display menu: The previous page is displayed.
• If you tap between
In the All Items Display
The first page is always displayed in the top half of the screen. You can switch between pages 2 and later pages
in the bottom half of the screen. When the display is split and the All Items display is shown, you can switch
between all pages, including page 1, in order.
In the 4-, 8-, and 16-Value Displays
You can switch between and display pages 1 to 12.
In the Matrix Display
You can switch between and display pages 1 to 9.
In the Harmonics List Single Screen or Harmonics List Dual Screen
You can switch separately between the pages of the measurement function display (on the left side of the
screen) and the harmonic order data display (on the right side of the screen). When scrolling with the + and –
buttons on the Display menu, use the Header/List button on the same menu to select the display whose pages
you want to switch between.
and , a page is displayed according to the tapped position.
Number of Displayed Digits (Display Resolution)
The number of displayed digits (display resolution) for voltage, current, active power, apparent power, reactive
power, and so on is as follows:
• If the value is less than or equal to 600000: Six digits.
• If the value is greater than 600000: Five digits.
For details, see appendix 4 in the Getting Started Guide, IM WT5000-03EN. When the range rating (rated value
of the specified measurement range) is specified, the Σ functions of the voltage, current, active power, apparent
power, reactive power, and so on, are set to the decimal place and unit of the element with the lowest number of
displayed digits (display resolution) in the wiring unit. For details about the display resolution during integration,
see “Number of Displayed Digits (Display Resolution)” under “Integrated Power (Watt hours).”
IM WT5000-01EN
10-3
 Loading...