

Page 1

IM 760201-01E
1st Edition
Power Analyzer
Page 2

Product Registration
Thank you for purchasing YOKOGAWA products.
YOKOGAWA provides registered users with a variety of information and
services.
Please allow us to serve you best by completing the product registration
form accessible from our homepage.
http://www.yokogawa.com/tm/
PIM 103-02E
Page 3

i
IM 760201-01E
Thank you for purchasing the WT500 Power Analyzer. The WT500 is an instrument
capable of measuring parameters such as voltage, current, and power with high
precision.
This user’s manual explains the features, operating procedures, and handling
precautions of the WT500. To ensure correct use, please read this manual thoroughly
before beginning operation. Keep this manual in a safe place for quick reference in the
event that a question arises.
This manual is one of two WT500 manuals. Please read both manuals.
Manual Title Manual No. Description
WT500 Power Analyzer
User’s Manual
IM760201-01E This manual. Explains all WT500 features,
except for the communication features, and
the operating procedures that relate to them.
WT500 Power Analyzer
Communication Interface
User’s Manual (CD-ROM)
IM760201-17E Explains the features related to using
communication commands to control the
WT500.
Notes
• The contents of this manual are subject to change without prior notice as a result
of continuing improvements to the instrument’s performance and functionality. The
appearance of the figures given in this manual may differ from the appearance of your
actual display.
•
Every effort has been made in the preparation of this manual to ensure the accuracy
of its contents. However, should you have any questions or find any errors, please
contact your nearest YOKOGAWA dealer.
•
Copying or reproducing all or any part of the contents of this manual without the
permission of YOKOGAWA is strictly prohibited.
•
The TCP/IP software of this product and the documents concerning it have been
developed/created by YOKOGAWA based on the BSD Networking Software, Release
1 that has been licensed from the Regents of the University of California.
Trademark Acknowledgements
• Microsoft, Internet Explorer, MS-DOS, Windows, Windows NT, and Windows Vista
are either registered trademarks or trademarks of Microsoft Corporation in the United
States and/or other countries.
•
Adobe, Acrobat, and PostScript are trademarks of Adobe Systems Incorporated.
• In this manual, the TM and ® symbols do not accompany their respective registered
trademark or trademark names.
•
Other company and product names are registered trademarks or trademarks of their
respective holders.
Revisions
• 1st Edition: June 2008
1st Edition : June 2008 (YK)
All Rights Reserved, Copyright © 2008 Yokogawa Electric Corporation
Page 4
ii
IM 760201-01E
Checking the Package Contents
After receiving the product and opening the package, check the items described below.
If the wrong items have been delivered, if items are missing, or if there is a problem with
the appearance of the items, contact your nearest YOKOGAWA dealer.
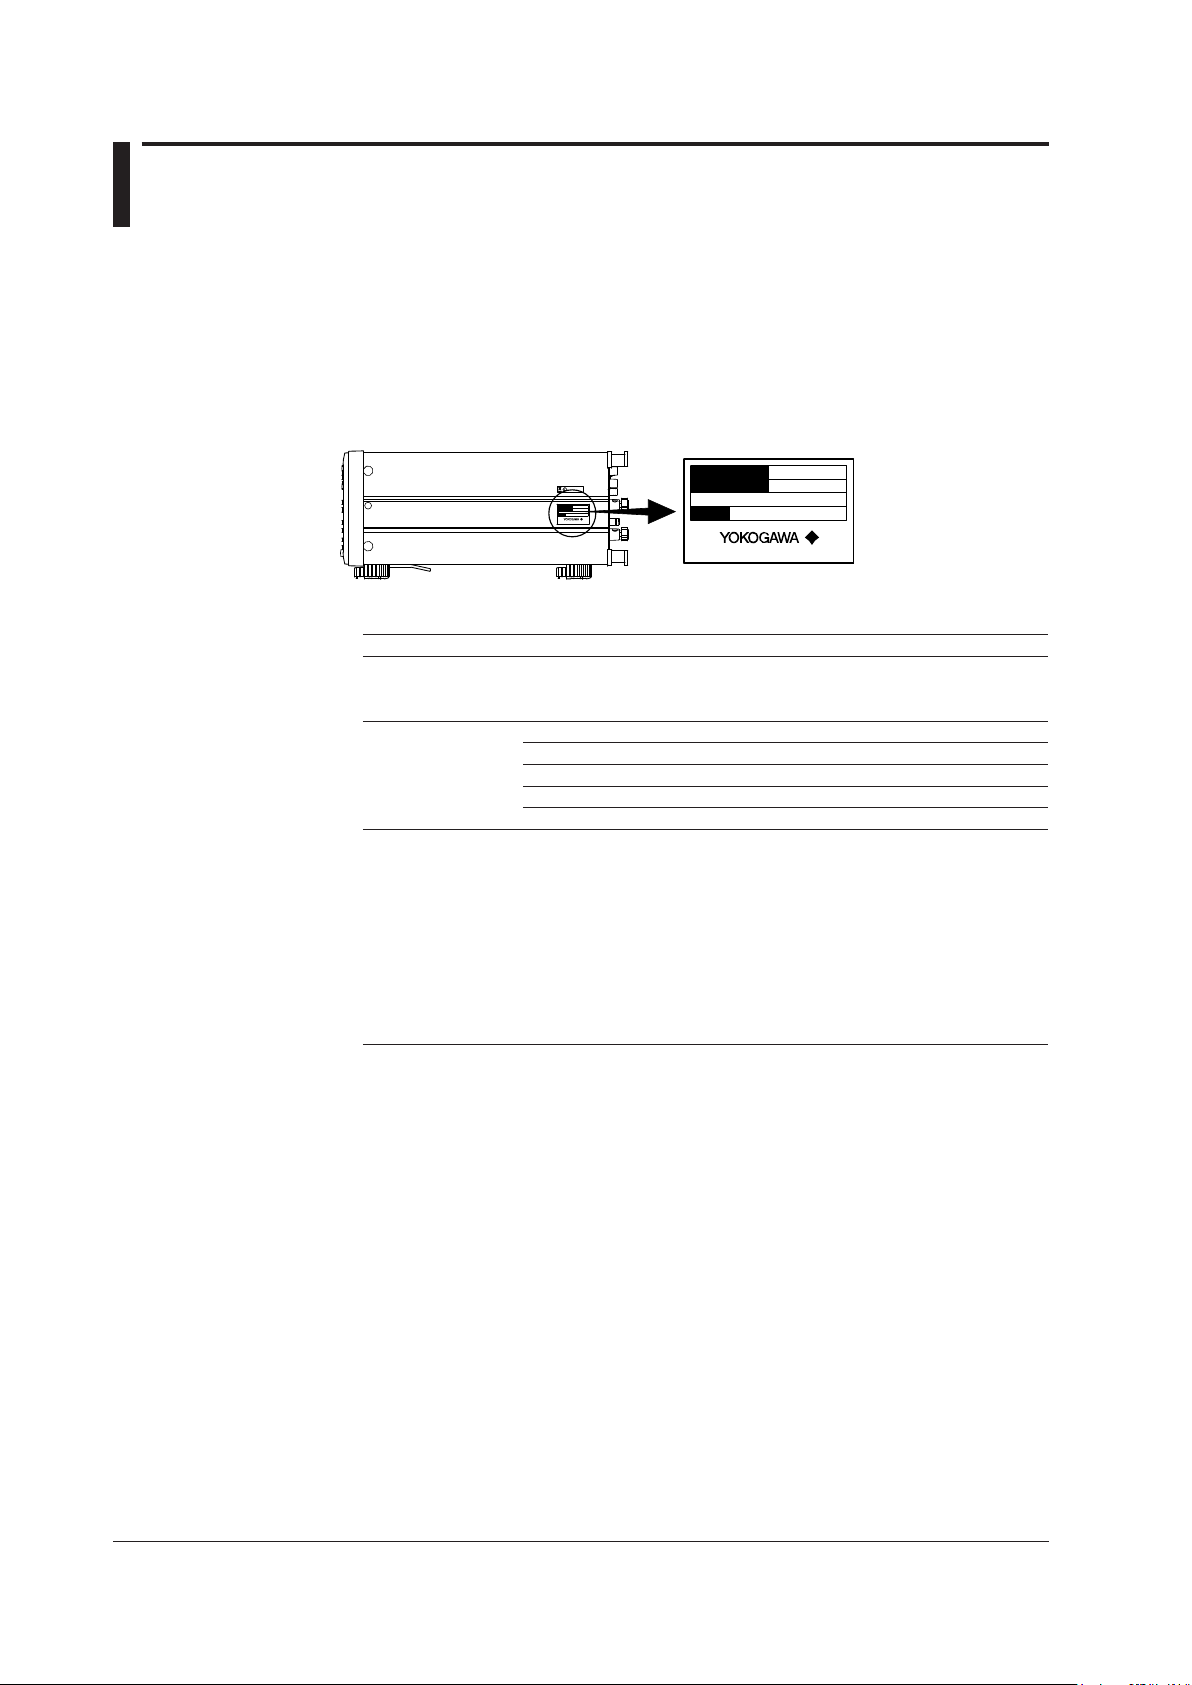
WT500
Check that the model name and suffix code given on the name plate on the side panel
are the same as those on your order.
MODEL
SUFFIX
NO.
Made in Japan
MODEL
SUFFIX
NO.
Made in J apan
MODEL and SUFFIX Codes
Model/Item Suffix Code Description
760201
760202
760203
Number of installed input elements: 1
Number of installed input elements: 2
Number of installed input elements: 3
Power cord -D UL, CSA standard power cord
-F VDE standard power cord
-Q BS standard power cord
-R AS standard power cord
-H GB standard power cord (CCC-compatible)
Options /C1 GP-IB interface
/C7 Ethernet interface
/EX1 External sensor input (only selectable with the 760201)
/EX2 External sensor input (only selectable with the 760202)
/EX3 External sensor input (only selectable with the 760203)
/G5 Harmonic measurement
/DT Delta computation
/FQ Frequency measurement add-on (enables simultaneous
measurement of all input elements)
/V1 VGA output
Suffix Code Example
On a model with three input elements installed that comes with the GP
-IB interface, external
input sensor, and harmonic measurement options and a UL, CSA standard power cord, the
suffix code is 760203-D/C1/EX3/G5.
NO. (Instrument number)
When contacting the dealer from which you purchased the instrument, please give them
the instrument number.
Page 5
iii
IM 760201-01E
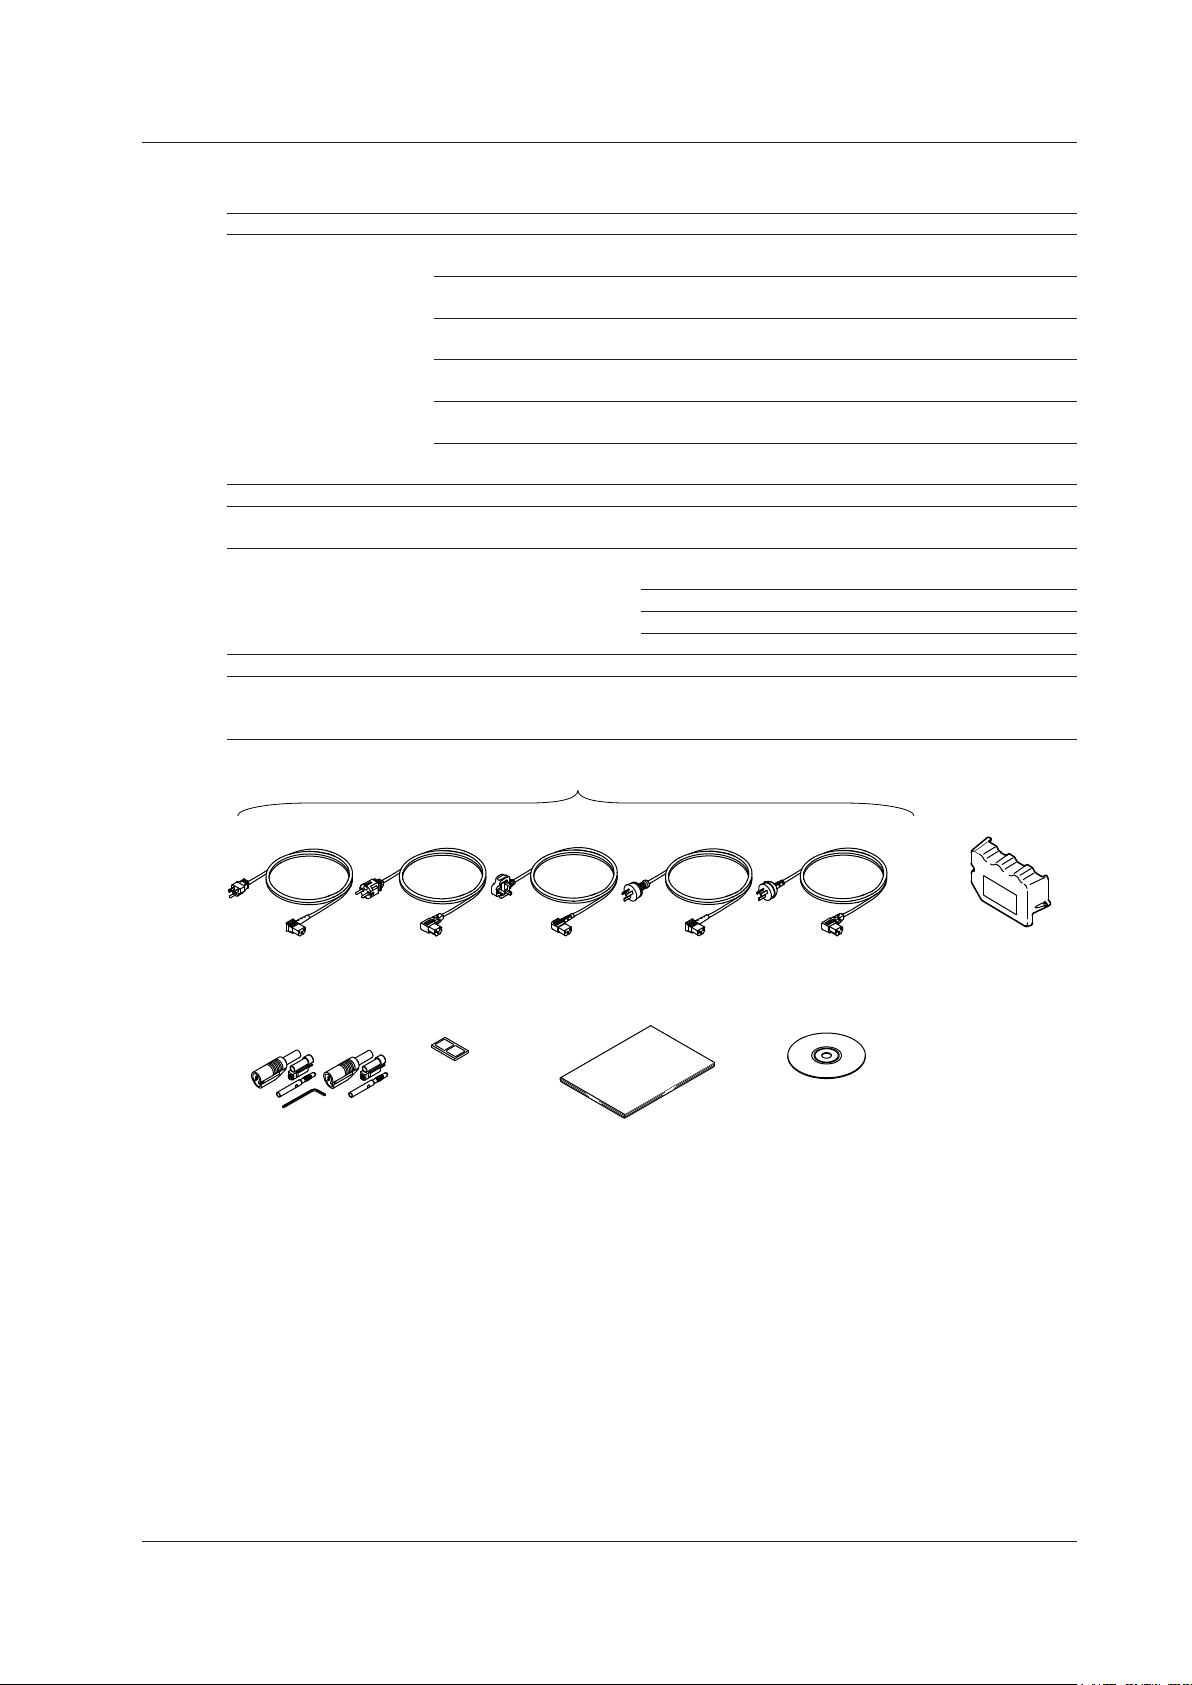
Standard Accessories
The WT500 is shipped with the following accessories.
Item Model/Part No. Quantity Note
Power cord One of the following power cords is included according to the suffix code on the previous
page.
A1006WD 1 UL, CSA standard power cord
Maximum rated voltage: 125 V, Maximum rated current: 7 A
A1009WD 1 VDE standard power cord
Maximum rated voltage: 250 V, Maximum rated current: 10 A
A1054WD 1 BS standard power cord
Maximum rated voltage: 250 V, Maximum rated current: 10 A
A1024WD 1 AS standard power cord
Maximum rated voltage: 250 V, Maximum rated current: 10 A
A1064WD 1 GB standard power cord (CCC-compatible)
Maximum rated voltage: 250 V, Maximum rated current: 10 A
Rubber feet A9088ZM 1 There are two feet in a pair
.
Current input protective
cover
B9319BX 1 Comes with two screws.
Safety terminal adapter set 758931 See the
note on
the right.
Same number of sets as the number of installed input
elements
760201:
One set with one hexagonal socket wrench
760202: Two sets with one hexagonal socket wrench
760203: Three sets with 1 hexagonal socket wrench
User’s Manual IM760201-01E 1 This manual
Communication Interface
User’s Manual
IM760201-17E 1 CD-ROM
(CD-ROM part number: B9319ZZ)
(Printed manuals can be purchased separately. Contact your nearest YOKOGAWA dealer.)
Rubber feet
A9088ZM
Current input
protective cover
B9318BX
Safety terminal
adapter set
758931
User’s Manual
(this manual)
IM760201-01E
Communication Interface
User’s Manual
IM760201-17 (CD-ROM)
A1006WD
(-D)
A1009WD
(-F)
A1024WD
(-R)
Power cord (One of the following power cords is included according to the suffix code)
A1054WD
(-Q)
A1064WD
(-H)
Checking the Package Contents
Page 6
iv
IM 760201-01E
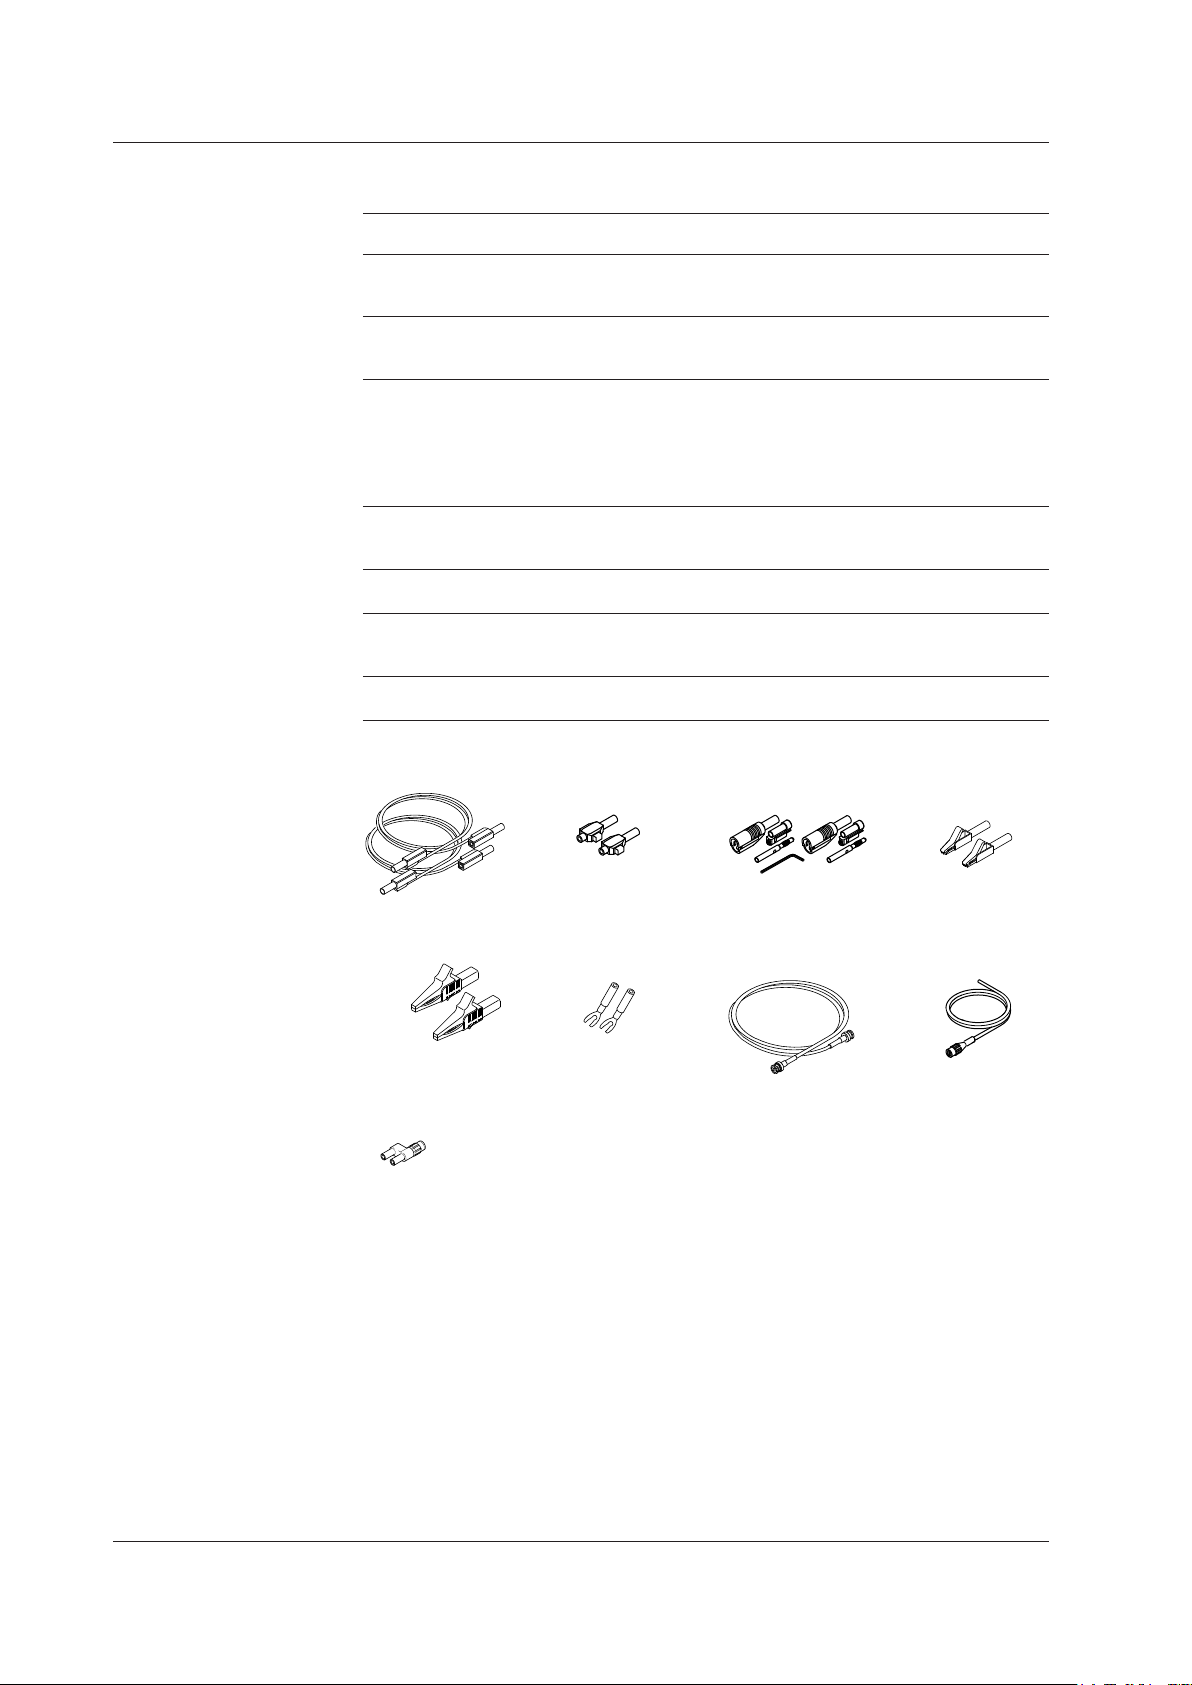
Optional Accessories (Sold separately)
The following optional accessories are available for purchase separately.
Item Model/Part
No.
Quantity
Sold
Note
Measurement lead 758917 1 Two leads in one set. Used with the
separately sold 758922 or 758929 adapter.
Length: 0.75 m. Rated voltage: 1000 V.
Safety terminal adapter set 758923 1 Two pieces in one set. Rated voltage 600 V.
758931 1 Two pieces in one set. Rated voltage
1000V.
Alligator clip adapter set 758922 1 Two pieces in one set. For the 758917
measurement lead.
Rated voltage: 300 V.
758929 1 Two pieces in one set. For the 758917
measurement lead.
Rated voltage: 1000V.
Fork terminal adapter set 758921 1 Two pieces in one set. For the 758917
measurement lead.
Rated voltage: 1000 V. Rated current: 25 A.
BNC-BNC 366924 1 42 V or less. Length: 1 m.
Measurement lead 366925 1 42 V or less. Length: 2 m.
External sensor cable B9284LK 1 For connecting the current sensor input
connector of the WT500.
Length: 0.5 m.
Conversion adapter 758924 1 BNC-4 mm socket adapter. Rated voltage:
500 V.
Measurement lead
758917
Alligator clip
adapter set
758922
Alligator clip
adapter set
758929
Fork terminal
adapter set
758921
Safety terminal
adapter set
758923
External sensor
cable
B9284LK
Safety terminal
adapter set
758931
BNC cable
366924 (1 m)
366925 (2 m)
Conversion adapter
758924
Checking the Package Contents
Page 7

v
IM 760201-01E
Safety Precautions
This instrument is an IEC safety class 01 instrument (provided with a terminal for
protective earth grounding).
The general safety precautions described herein must be observed during all phases
of operation. If the instrument is used in a manner not specified in this manual, the
protection provided by the instrument may be impaired. Yokogawa Electric Corporation
assumes no liability for the customer’s failure to comply with these requirements.
The following symbols are used on this instrument.
Handle with care. To protect the instrument and its users, refer to the explanation
in the User’s Manual or Service Manual.
Electric shock, danger
Alternating current
Both direct and alternating current
Power on
Power off
Power-on state
Power-off state
Grounding
Page 8

vi
IM 760201-01E
Failure to comply with the precautions below could lead to injury or death.
WARNING
Use the Correct Power Supply
Make sure that the power supply voltage matches the WT500 rated supply voltage
and that it does not exceed the maximum voltage range specified for the power
cord.
Use the Correct Power Cord and Plug
To prevent fire and electric shock, use the power cord supplied by YOKOGAWA.
The main power plug must be plugged into an outlet with a protective earth
terminal. The earth protection will be nullified if you use an ungrounded extension
cord.
Connect to a Protective Earth Terminal
To prevent electric shock, be sure to connect to a protective earth terminal before
turning on the power. The power cord that comes with the instrument is a threeprong cord. Connect the power cord to a properly grounded three-prong outlet.
Do Not Impair the Protective Grounding
Never cut off the internal or external protective earth wire or disconnect the wiring
to the protective earth terminal. Doing so may result in electric shock or damage to
the instrument.
Do Not Operate with Defective Protective Grounding or Fuses
Do not operate the instrument if its protective grounding or one of its fuses might be
defective. Check the grounding and the fuses before operating the instrument.
Do Not Operate in an Explosive Atmosphere
Do not operate the instrument in the presence of flammable gasses or vapors.
Doing so is extremely dangerous.
Do Not Remove Covers
Only qualified YOKOGAWA personnel should remove the instrument’s covers. The
inside of the instrument is dangerous because parts of it have high voltages.
Ground the Instrument before Making External Connections
Securely connect the protective grounding before connecting to the item under
measurement or to an external control unit. Before touching a circuit, turn off its
power and check that it has no voltage.
Operating Environment Limitations
CAUTION
This is a class A instrument designed for an industrial environment. Operation of
this equipment in a residential area can cause radio interference, in which case
users will be required to correct the interference.
Safety Precautions
Page 9

vii
IM 760201-01E
Waste Electrical and Electronic Equipment
Waste Electrical and Electronic Equipment (WEEE), Directive 2002/96/EC
(This directive is only valid in the EU.)
This product complies with the WEEE Directive (2002/96/EC) marking
requirement. This marking indicates that you must not discard this electrical/
electronic product in domestic household waste.
Product Category
With reference to the equipment types in the WEEE direct
ive Annex 1, this
product is classified as a “Monitoring and Control instrumentation” product.
Do not
dispose in domestic household waste. When disposing products in the EU,
contact your local Yokogawa Europe B. V. office.
Page 10

viii
IM 760201-01E
Conventions Used in This Manual
Notes and Cautions
The notes and cautions in this manual are categorized using the following symbols.
Improper handling or use can lead to injury to the user or damage
to the instrument. This symbol appears on the instrument to indicate
that the user must refer to the user’s manual for special instructions.
The same symbol appears in the corresponding place in the user’
s manual to identify those instructions. In the manual, the symbol is
used in conjunction with the word “WARNING” or “CAUTION.”
WARNING
Calls attention to actions or conditions that could cause serious or
fatal injury to the user, and precautions that can be taken to prevent
such occurrences.
CAUTION
Calls attention to actions or conditions that could cause light injury
to the user, or cause damage to the instrument or user’s data, and
precautions that can be taken to prevent such occurrences.
Note
Calls attention to information that is important for proper operation of
the instrument.
Symbols Used in Procedural Explanations
The procedural explanations in chapters 3 to 13 use the following symbols, characters,
and words to identify their contents.
Procedure
Follow the order of the step numbers when carrying out procedures.
Procedural explanations assume that the procedures are being
performed for the first time. You may not need to perform every step
in a procedure when you are altering settings that have already been
made before.
Explanation
Limitations and settings related to the procedure are explained here.
The feature itself is not usually explained here. For information about
the features themselves, see chapter 2.
Characters and Terminology Used in Procedural Explanations
Panel Keys and Soft Keys
Bold characters in procedural explanations are used to indicate panel keys that are used in the
procedure and menu items that appear on the screen.
SHIFT+Panel Key
When SHIFT+panel key appears in a procedural explanation, it means to press the shift key so
that it lights, and then to press the indicated panel key. The setup menu marked in purple below
the panel key that you pressed appears on the screen.
Units
k Denotes 1000. Example: 12 kg, 100 kHz
K Denotes 1024. Example: 459 KB (file size)
Page 11
ix
IM 760201-01E
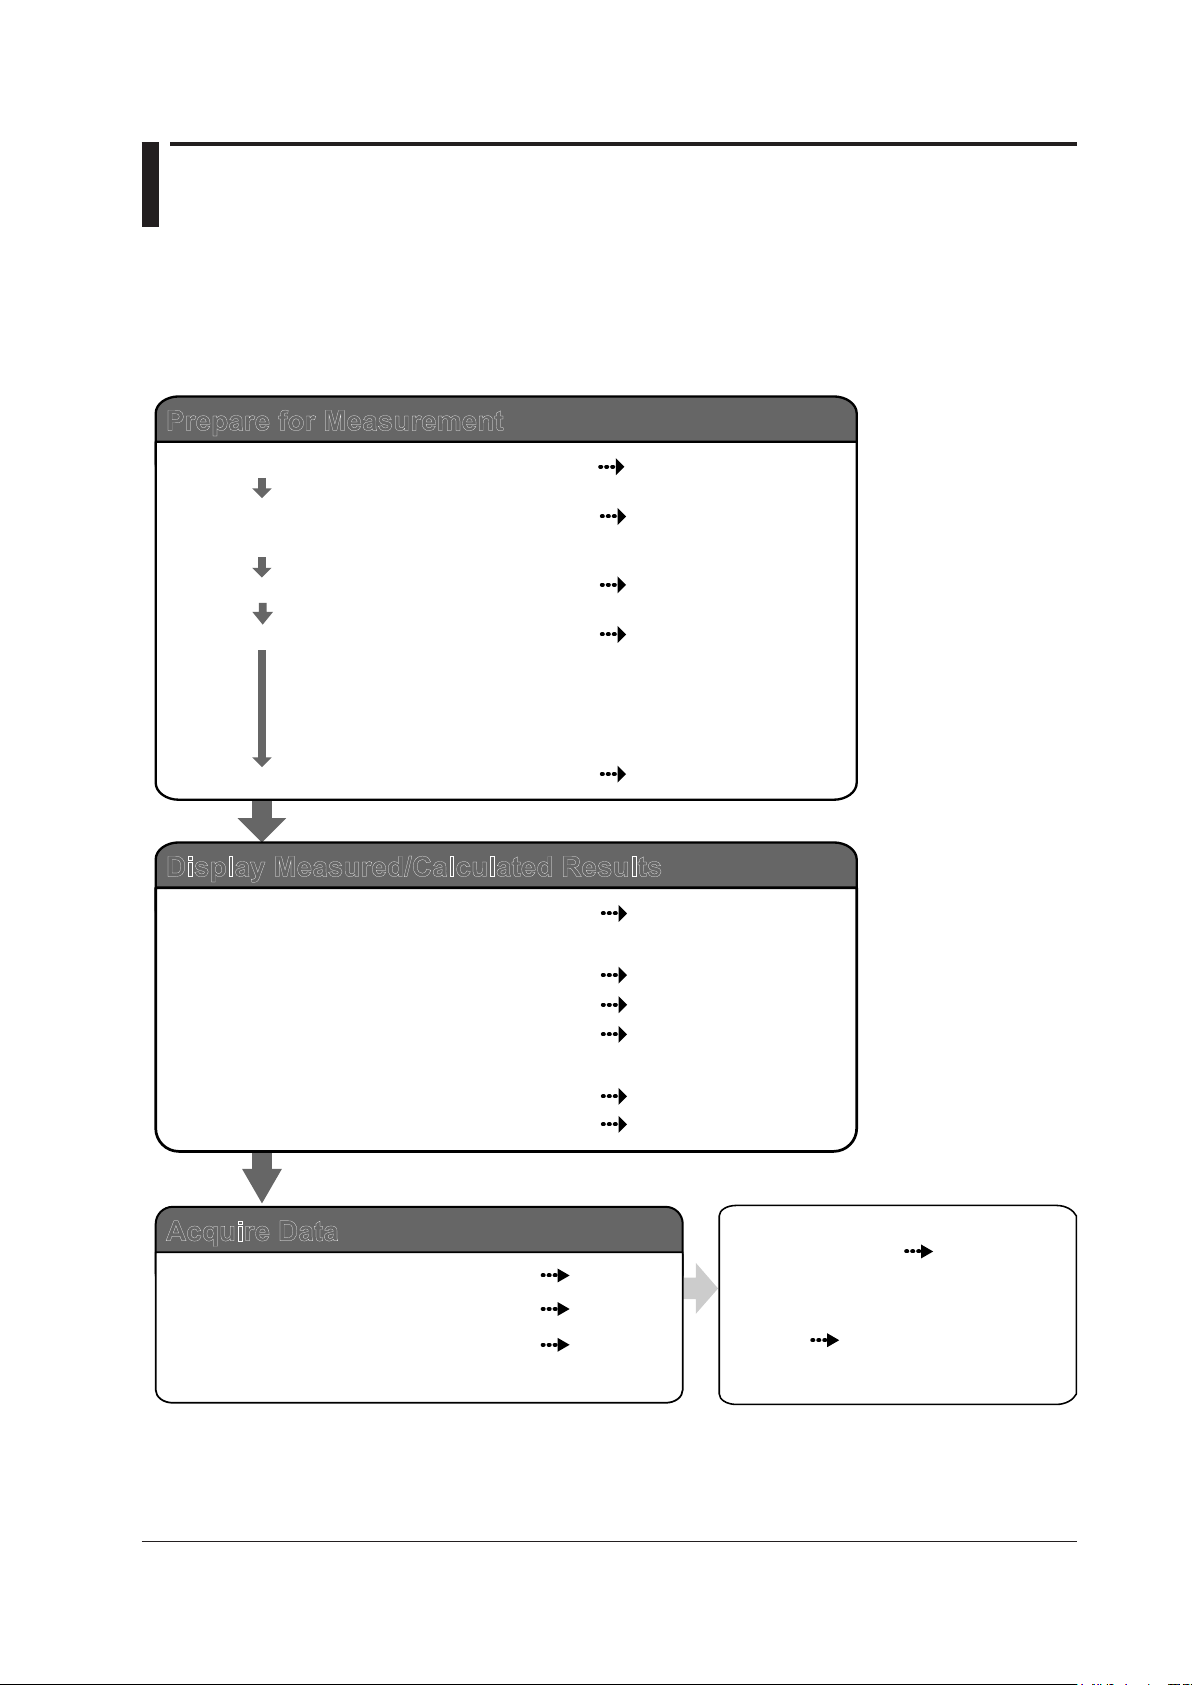
Workflow
The figure below is provided to familiarize the first-time user with the workflow of WT500
operation. For a description of an item, see the relevant section or chapter. In addition
to the sections and chapters that are referenced in the figure below, this manual also
contains safety precautions for handling the instrument and performing wiring work. Be
sure to observe the precautions.
Section 3.2
Sections 3.3 and 3.4
Section 3.8
Sections 3.9 to 3.11
Chapter 4
Sections 5.1 to 5.5 and
5.13 to 5.16
Sections 5.6 to 5.12
Section 5.17
Chapter 6
Chapter 7
Chapter 8
Install the instrument
Connect the power supply and
turn the power switch on
Select the measurement method
Wire the circuit that you will measure
Set the measurement conditions
Read the precautions in sections 3.5 and 3.7 thoroughly before connecting
the wires. Also, if necessary, assemble the input terminal adapter that
connects to the voltage input terminal (see section 3.6) before connecting
the wires.
RGB video signal (VGA)
output (optional)
Send data through USB or the
optional GP-IB or Ethernet interface.
Prepare for Measurement
Display Measured/Calculated Results
Measured power values
Integrated values
Delta computation (optional)
Harmonic measurements (optional),
bar graphs, vectors
Voltage/current waveforms
Trends
Chapter 11
Acquire Data
Store data to internal memory
Save data to USB memory
Send data through the optional
Ethernet interface
Communication Interface
User’s Manual
IM760201-17E (CD-ROM)
Section 12.1
Chapter 9
Chapter 10
Page 12

x
IM 760201-01E
Contents
Checking the Package Contents.......................................................................................................ii
Safety Precautions ............................................................................................................................v
Waste Electrical and Electronic Equipment .................................................................................... vii
Conventions Used in This Manual ................................................................................................. viii
Workow .......................................................................................................................................... ix
Chapter 1 Component Names and Functions
1.1 Front Panel, Rear Panel, and Top Panel .......................................................................... 1-1
1.2 Setup Menu Display and Operation Keys ........................................................................ 1-3
1.3
Screen Display ................................................................................................................. 1-8
Chapter 2 Features
2.1 SystemCongurationandBlockDiagram ........................................................................ 2-1
2.2 Measurement Functions and Periods ............................................................................... 2-3
2.3
Measurement Conditions ............................................................................................... 2-10
2.4
Power Measurement ...................................................................................................... 2-16
2.5
Computation ................................................................................................................... 2-19
2.6
Integration ...................................................................................................................... 2-22
2.7
Waveform Display .......................................................................................................... 2-26
2.8
Trend, Bar Graph, and Vector Displays .......................................................................... 2-33
2.9
Saving and Loading Data, and Other Miscellaneous Functions ..................................... 2-36
Chapter 3 Before You Start Measuring
3.1 Handling Precautions ....................................................................................................... 3-1
3.2 Installing the Instrument ................................................................................................... 3-3
3.3 Connecting the Power Supply .......................................................................................... 3-5
3.4 Turning the Power Switch On and Off .............................................................................. 3-6
3.5 Precautions for Wiring the Circuit That You Will Measure ................................................ 3-8
3.6 Assembling the Adapter for the Voltage Input Terminal .................................................. 3-10
3.7
Wiring for Accurate Measurements ................................................................................ 3-12
3.8
Guide for Selecting the Method Used to Measure the Power ........................................ 3-13
3.9
Wiring the Circuit That You Will Measure for Direct Input............................................... 3-14
3.10
Wiring the Circuit That You Will Measure with a Current Sensor ................................... 3-17
3.1
1 Wiring the Circuit That You Will Measure with a VT or CT ............................................. 3-21
3.12
Setting the Date and Time .............................................................................................. 3-24
3.13
Initializing the Settings .................................................................................................... 3-26
3.14
Entering Values and Character Strings .......................................................................... 3-27
3.15
Entering Character Strings on a USB Keyboard ............................................................ 3-29
3.16
Switching the Display ..................................................................................................... 3-31
3.17
Displaying a List of Setup Parameters ........................................................................... 3-33
3.18
Selecting the Message Language .................................................................................. 3-34
3.19
Setting the USB Keyboard Language ............................................................................ 3-35
Chapter 4 Measurement Conditions
4.1 Panel Keys and Setup Menus Used in This Chapter ....................................................... 4-1
4.2 Selecting a Wiring System ............................................................................................... 4-2
4.3
SelectingIndependentInputElementConguration ........................................................ 4-5
4.4
Setting the Measurement Ranges for Direct Input ........................................................... 4-7
Page 13

3
2
1
4
5
6
7
8
9
10
11
12
13
14
App
Index
xi
IM 760201-01E
xi
IM 760201-01E
4.5 Setting the Measurement Ranges for an External Current Sensor (Optional) ............... 4-13
4.6 Setting the Scaling Feature When Using a VT or CT ..................................................... 4-16
4.7 Setting the Measurement Period .................................................................................... 4-19
4.8 Selecting an Input Filter .................................................................................................. 4-22
4.9
Selecting the Data Update Rate ..................................................................................... 4-24
4.10
Selecting an Averaging Method ...................................................................................... 4-26
4.1
1 Selecting a Crest Factor ................................................................................................. 4-29
4.12
Holding the Display and Performing Single Measurements ........................................... 4-30
Chapter 5 Power Measurement
5.1 Panel Keys and Setup Menus Used in This Chapter ....................................................... 5-1
5.2 Displaying Numeric Data and Changing Displayed Items ................................................ 5-2
5.3
Setting the EquationforEfciency ................................................................................... 5-9
5.4
Setting the Equations for Apparent and Reactive Power ................................................5-11
5.5
Selecting a Phase Difference Display Format ................................................................ 5-13
5.6
Integration ......................................................................................................
................ 5-15
5.7 Setting Manual Integration ............................................................................................. 5-20
5.8
Setting Normal or Continuous Integration ...................................................................... 5-23
5.9
Setting Real-Time Integration or Real-Time Continuous Integration .............................. 5-26
5.10
Turning Integration Auto Calibration On or Off ............................................................... 5-30
5.1
1 Selecting a Watt Hour Integration Method for Each Polarity .......................................... 5-31
5.12
Selecting a Current Integration Mode ............................................................................. 5-32
5.13
Setting User-DenedFunctions ..................................................................................... 5-33
5.14
Setting the MAX Hold Feature ........................................................................................ 5-38
5.15
Measuring the Average Active Power ............................................................................. 5-40
5.16
Selecting What Frequency to Measure .......................................................................... 5-41
5.17
Setting Delta Computation (Optional) ............................................................................. 5-42
Chapter 6 Harmonic Measurement (Optional)
6.1 Panel Keys and Setup Menus Used in This Chapter ....................................................... 6-1
6.2 Changing Numeric Data Display Items ............................................................................ 6-2
6.3 Selecting the PLL Source ................................................................................................. 6-8
6.4 Setting the Measured Harmonic Orders ......................................................................... 6-10
6.5
Selecting a Distortion Factor Equation ........................................................................... 6-12
6.6
Setting the Anti-Aliasing Filter ........................................................................................ 6-13
6.7
Displaying Bar Graphs and Making Cursor Measurements ........................................... 6-15
6.8
Displaying Vectors .......................................................................................................
... 6-20
Chapter 7 Waveform Display
7.1 Panel Keys and Setup Menus Used in This Chapter ....................................................... 7-1
7.2 Displaying Waveforms ...................................................................................................... 7-2
7.3
Selecting Which Waveforms to Display ............................................................................ 7-3
7.4
Setting the Time Axis .......................................................................................................
. 7-4
7.5 Setting the Trigger ............................................................................................................ 7-5
7.6 Vertically Zooming and Shifting Waveforms ..................................................................... 7-9
7.7
Displaying Waveforms in Split Screens ...........................................................................7-11
7.8
Selecting a Graticule and Turning Interpolation, Scale Value Display, and
Wave Labels On or Off ................................................................................................... 7-13
7.9
Measuring with Cursors .................................................................................................. 7-17
Contents
Page 14

xii
IM 760201-01E
xii
IM 760201-01E
Contents
Chapter 8 Trend Display
8.1 Panel Keys and Setup Menus Used in This Chapter ....................................................... 8-1
8.2 Displaying Trends .......................................................................................................
...... 8-2
8.3 Selecting What Trend Data to Display .............................................................................. 8-3
8.4
Setting Which Measurement Functions to Display Using Trends ..................................... 8-4
8.5
Setting Trend Scaling ......................................................................................................
. 8-7
8.6 Setting the Time Axis .......................................................................................................
. 8-9
8.7 Displaying Trends in Split Screens ................................................................................. 8-10
8.8
Selecting a Graticule and Turning Interpolation, Scale Value Display, and
Wave Labels On or Off .
....................................................................................................... 8-11
8.9 Restarting Trends ......................................................................................................
..... 8-12
8.10 Measuring with Cursors ..................................................................................................... 8-13
Chapter 9 Storing Numeric Data and Saving Stored Numeric Data
9.1 Panel Keys and Setup Menus Used in This Chapter ....................................................... 9-1
9.2 Setting the Storage Mode ................................................................................................. 9-2
9.3
Setting What Numeric Data to Store ................................................................................ 9-3
9.4
Setting the Store Count, Store Interval, and the Scheduled Storage Start and
End Times ......................................................................................................
.................. 9-5
9.5 Choosing Where to Store Numeric Data .......................................................................... 9-8
9.6
Storing Numeric Data ..................................................................................................... 9-13
9.7
Converting a Stored Binary Format File to CSV Format ................................................ 9-15
Chapter 10 Saving and Loading Data
10.1 Panel Keys and Setup Menus Used in This Chapter ..................................................... 10-1
10.2 About USB Memory .......................................................................................................
. 10-2
10.3 Saving Setup Parameters, Waveform Display Data, and Numeric Data ........................ 10-4
10.4
Saving Screen Image Data .......................................................................................... 10-12
10.5
Loading Setup Parameters and Displaying File Properties .......................................... 10-16
10.6
Deleting Files .......................................................................................................
......... 10-19
10.7 Copying Files .......................................................................................................
......... 10-22
Chapter 11 Ethernet Interface (Optional)
11.1 Panel Keys and Setup Menus Used in This Chapter ......................................................11-1
11.2 Connecting to a Network .................................................................................................11-2
1
1.3 ConguringTCP/IP Settings ............................................................................................11-3
1
1.4 Accessing the WT500 from a PC or Workstation (FTP server feature) .........................11-12
1
1.5 Checking the MAC Address and Whether the WT500 Is Equipped with the
Ethernet Interface Option ..............................................................................................11-15
Chapter 12 RGB Video Signal (VGA) Output (Optional) and Other Features
12.1 Panel Keys and Setup Menus Used in This Chapter ..................................................... 12-1
12.2 RGB Video Signal (VGA) Output (Optional) ................................................................... 12-2
12.3
Zero-Level Compensation .............................................................................................. 12-3
12.4
NULL Feature ......................................................................................................
........... 12-4
12.5 Setting the Key and Shift Locks ..................................................................................... 12-5
12.6 Master and Slave Synchronized Measurement .............................................................. 12-6
Chapter 13 Troubleshooting, Maintenance, and Inspection
13.1 Troubleshooting .............................................................................................................. 13-1
13.2 Error Messages and Troubleshooting Methods .............................................................. 13-2
13.3
Self-Test ......................................................................................................
................... 13-6
Page 15

3
2
1
4
5
6
7
8
9
10
11
12
13
14
App
Index
xiii
IM 760201-01E
xiii
IM 760201-01E
Contents
13.4 Displaying the System Overview .................................................................................... 13-9
13.5
Recommended Part Replacement ............................................................................... 13-10
Chapter 14 Specications
14.1 Input ............................................................................................................................... 14-1
14.2 Display ............................................................................................................................ 14-2
14.3
Normal Measurement Functions (Measured Items) ....................................................... 14-3
14.4
Harmonic Measurement Functions (Measured Items) ................................................... 14-5
14.5
Accuracy ......................................................................................................................... 14-6
14.6
Functions ...................................................................................................................... 14-10
14.7
External Input and Output (Master and slave synchronization signals and
clock input) ......................................................................................................
............. 14-15
14.8 RGB Video Signal (VGA) Output (Optional) ................................................................. 14-15
14.9
USB PC Interface ......................................................................................................... 14-16
14.10
USB PERIPHERAL Interface ....................................................................................... 14-16
14.1
1 GP-IB Interface Option ................................................................................................. 14-16
14.12
Ethernet Interface Option ............................................................................................. 14-17
14.13
Safety Terminal Adapter ............................................................................................... 14-17
14.14
GeneralSpecications ................................................................................................. 14-18
14.15
External Dimensions .................................................................................................... 14-19
Appendix
Appendix 1 Symbols and Determination of Measurement Functions ...................................App-1
Appendix 2 List of Initial Settings and Numeric Data Display Order ..................................... App-7
Appendix 3
Power Basics (Power, harmonics, and AC RLC circuits) .................................App-13
Appendix 6
USB Keyboard Character Assignments ........................................................... App-29
Index
Page 16
1-1
IM 760201-01E
Component Names and Functions
1
Chapter 1 Component Names and Functions
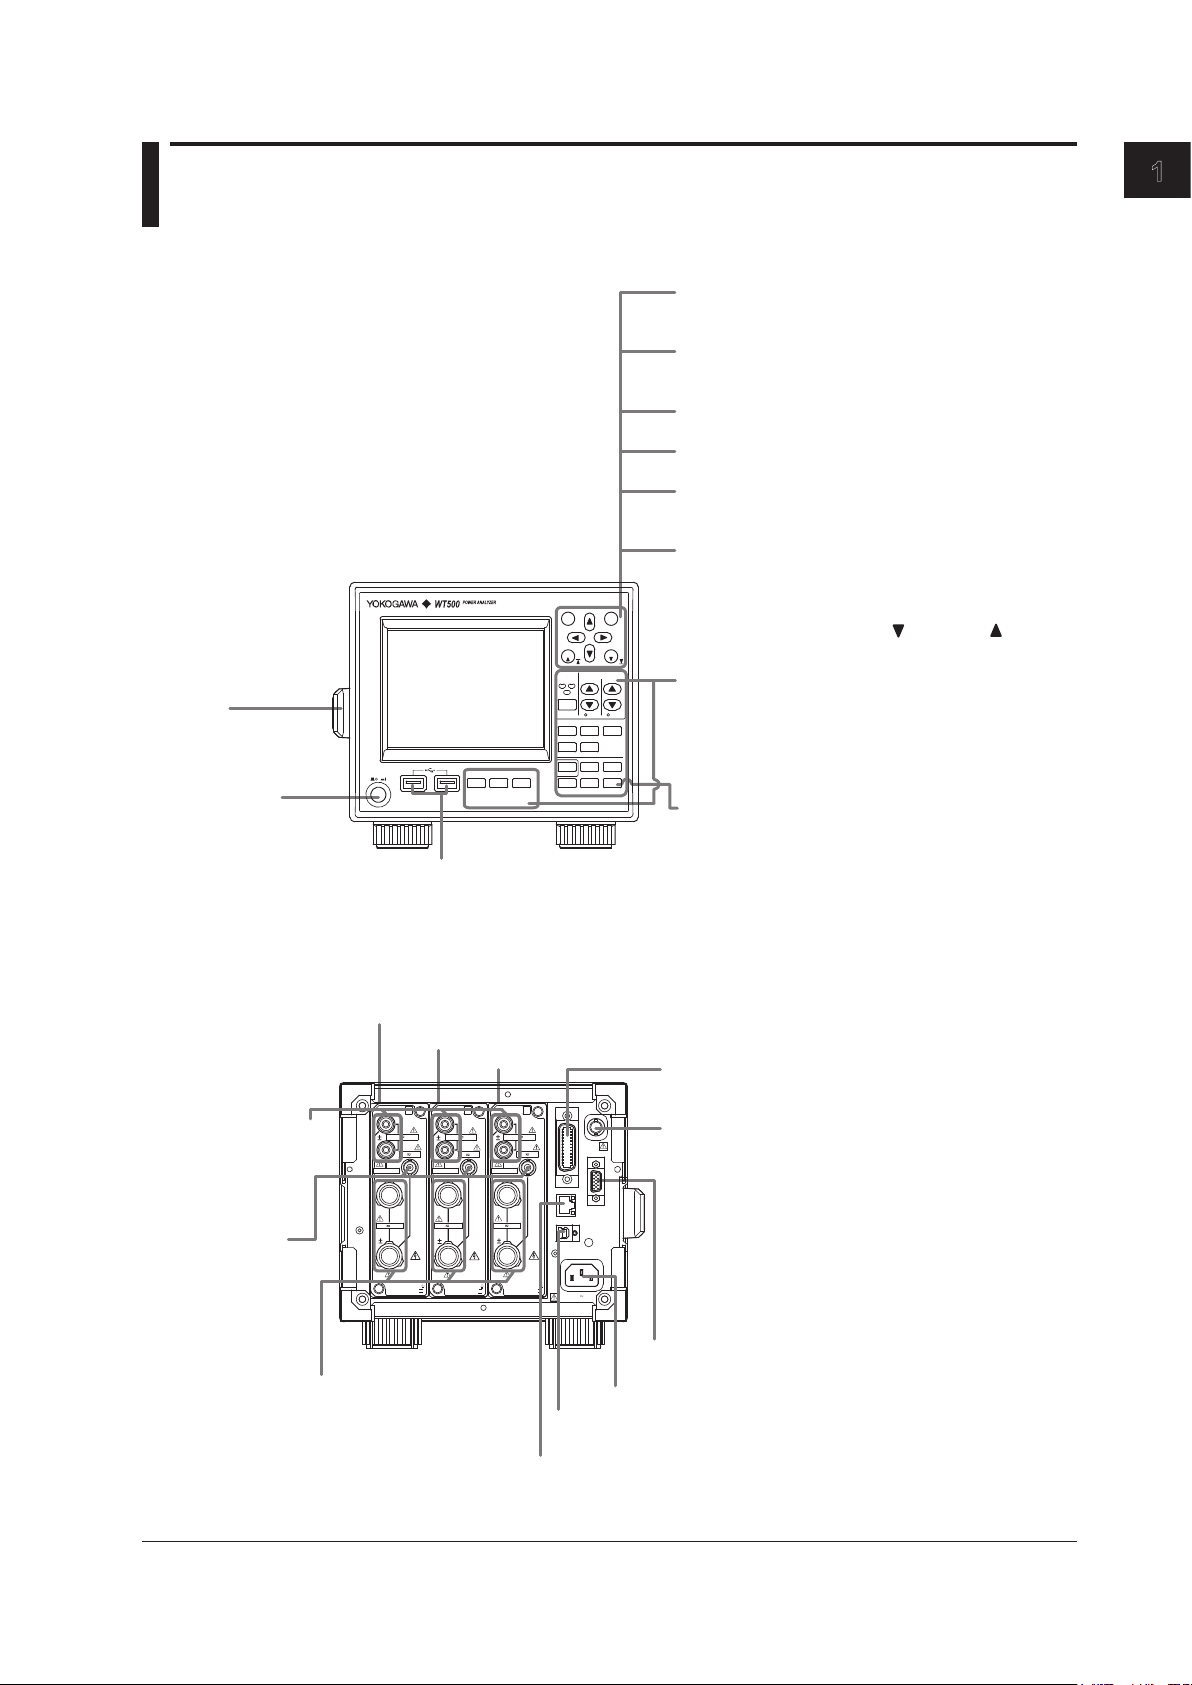
1.1 Front Panel, Rear Panel, and Top Panel
Front Panel
Power switch
(see section 3.4)
LCD
Handle
Use this handle to
move the WT500.
(see section 3.1)
Setup menu display and operation keys
These are the first keys that you press when you make
settings or perform operations. Pressing a setup menu
display key will display its corresponding setup menu.
Pressing an operation key will execute its
corresponding operation. (see section 1.2)
SHIFT key
When you press the SHIFT key, the key illuminates,
and pressing a panel keys produces the effect
indicated by the purple letters below it.
USB ports
Use to connect USB memory
or a USB keyboard.
ESC
RESET
SET
CAL
PAGE
PAGE
ELEMENT
1
2
3
ELEMENT
ALL
RANGE
VOLTAGE CURRENT
AUTO AUTO
DISPLAY
NUMERIC WAVE OT HERS
FORM ITE M
CURSOR
INTEGRATOR
SETUP
INPUT INF O
START/
STOP
RESET
HOLD
SINGLE
SHIFT
MISC
NULL
LOCAL
KEY LOCK
FILE IMAGE
MENU
STORE
STORE SET
POWER
Cursor keys
Set values (and select digits), move the cursor, and
select items in setup operations.
SET key
Enters or confirms the item or value selected using the
cursor keys.
SHIFT + SET (CAL) key combination
Executes zero-level compensation.
ESC key
Closes setup menus and dialog boxes.
SHIFT + ESC (RESET) key combination
Returns the item or value selected with the cursor to its
default value.
PAGE key
Because not all measured items can be displayed
on the screen at the same time, the WT500 uses
pages to display measured values. You can switch
between pages using PAGE and PAGE .
(see section 5.1)
Rear Panel
Input element 1
(see section 2.3)
Input element 2
Input element 3
Ethernet port (optional) (see section 11.2)
Power connector (see section 3.3)
USB port (PC) See the Communication Interface User’s Manual
IM760201-17E (CD-ROM).
External clock input/External start signal output
connector
• Receives the synchronization source (signal), which
defines the measurement period. (see section 4.7)
• Receives the external PLL source (signal) for
harmonic measurement. (see section 6.3)
• Used when performing master/slave synchronized
measurement.(see section 12.6)
• Receives the external trigger, which determines when
a waveform is displayed. (see section 7.5)
GP-IB Connector (optional; see the Communication
Interface User's Manual IM760201-17E on the
CD-ROM)
RGB video signal (VGA) output connector (optional)
Transmits image signals. (see section 12.2)
Current input terminal
For connecting current
measurement cables.
(see sections 3.8, 3.9,
and 3.11)
External current
sensor input
connector (optional)
For connecting the
external current
sensor cable.
(see section 3.10)
Voltage input terminal
For connecting voltage
measurement cables.
(see sections
3.8 to 3.11)
ELEME NT
VOLTAGE
1000V
MAX
EXT
CURREN T
ALL TE RMINA LS
1000V MAX
TO
CAT
II
EXT. CLK
GP-IB
(
IEEE 488
)
LINK/
ACT
VIDEO-OU T
(
VGA
)
100LINK
ETHERN ET 1 00BA SE-T X
USB
100- 240 V AC
50 VA MAX 50/60 Hz
10V
MAX
1000VMA X
40A
MAX
ELEME NT
VOLTAGE
1000V
MAX
EXT
CURREN T
ALL TE RMINA LS
1000V MAX
TO
CAT
II
10V
MAX
1000VMA X
40A
MAX
ELEME NT
VOLTAGE
1000V
MAX
EXT
CURREN T
ALL TE RMINA LS
1000V MAX
TO
CAT
II
10V
MAX
1000VMA X
40A
MAX
Page 17
1-2
IM 760201-01E
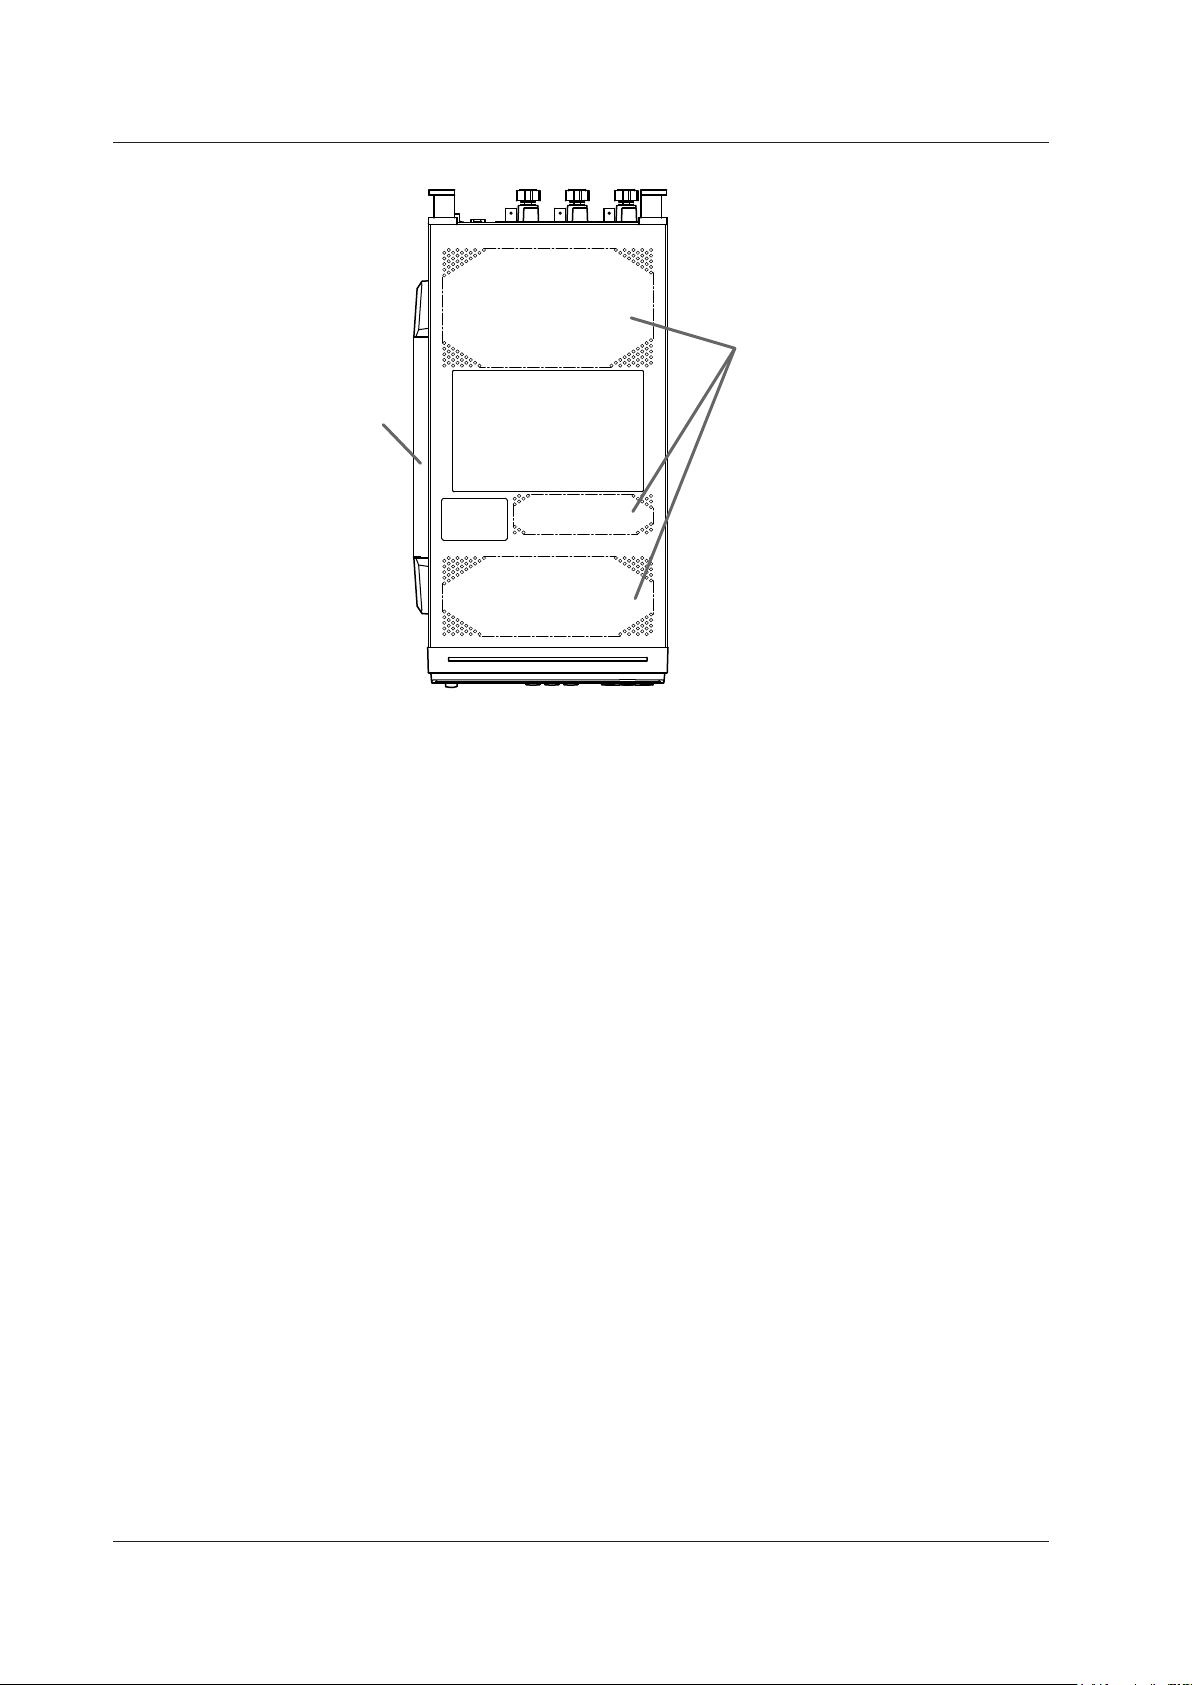
Top Panel
Handle
Vent holes (see section 3.2
for details)
There are inlet holes on the bottom panel.
1.1 Front Panel, Rear Panel, and Top Panel
Page 18
1-3
IM 760201-01E
Component Names and Functions
1
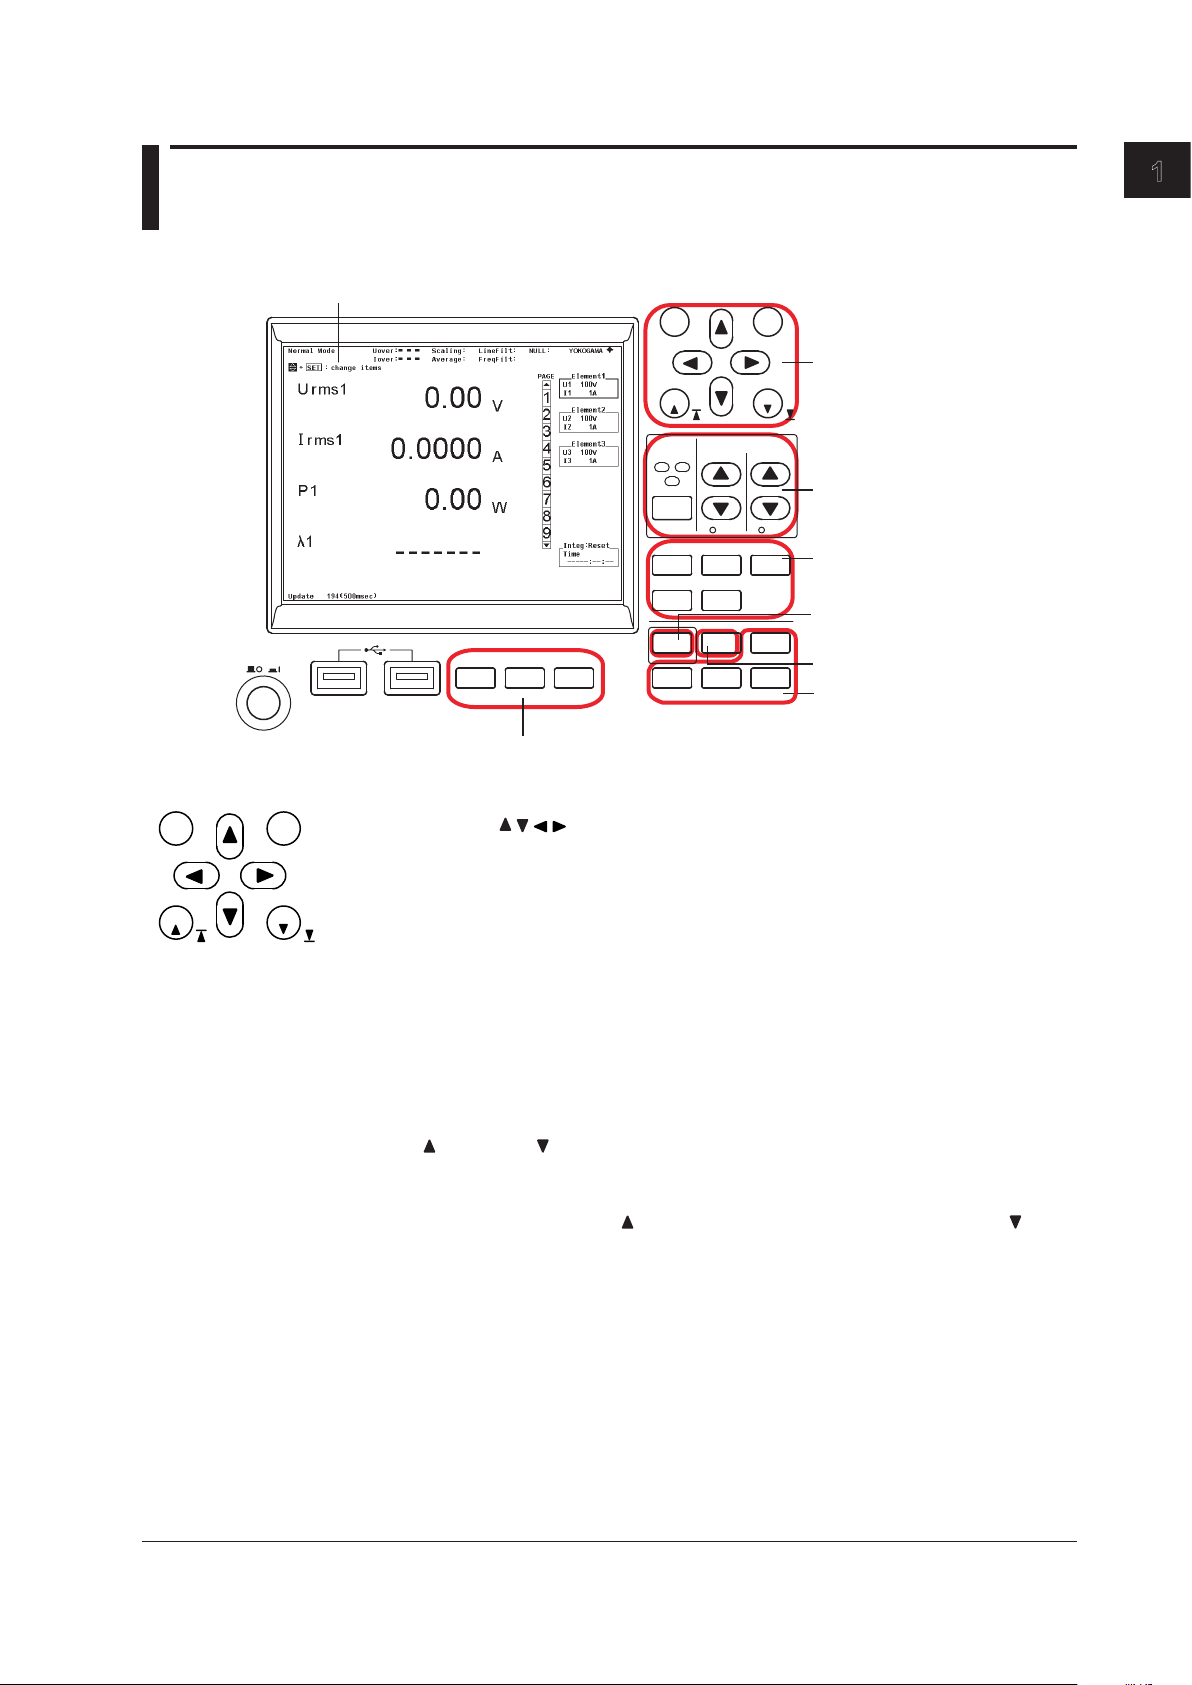
1.2 Setup Menu Display and Operation Keys
This section describes the WT500 panel keys and their functions.
Keys for data storage and saving
Display (see section 1.3)
Keys for setting measurement
conditions
Keys for setting the measurement
range
Keys for displaying
measured/calculated
results
Other keys
Integration key
Keys for changing the display
ESC
RESET
SET
CAL
PAGE
PAGE
ELEMENT
1
2
3
ELEM ENT
ALL
RANGE
VOLTAGE CURRENT
AUTO AUTO
DISPLAY
NUME RIC WAVE OTH ERS
FORM ITE M
CUR SOR
INTEGR ATOR
SETU P
INPU T INFO
START/
STOP
RESE T
HOLD
SING LE
SHIF T
MISC
NULL
LOC AL
KEY L OCK
FILE IMAGE
MENU
STOR E
STORE SET
POWE R
Keys for Changing the Display
ESC
RESET
SET
CAL
PAGE
PAGE
Cursor Keys ( )
Use these keys to move the cursor in setup menus and dialog boxes, to set values, to
select digits when setting numbers, and to select menu items.
SET
Use this key to display menus that you select with the cursor keys, confirm items and
values, and open a menu for changing displayed items when the menu display is turned
off in a numeric data display.
ESC
Use this key to close setup menus and dialog boxes, and to move up a level in a menu.
SHIFT+ESC (RESET) Key Combination
Use this key combination to return the item or value selected with the cursor to its default
value.
PAGE and PAGE
Use these keys in numeric value displays and other displays, when all of the measured
items do not fit into a single page, to change the displayed page. You can go to the first
page by pressing SHIFT+PAGE
and to the last page by pressing SHIFT+PAGE .
SHIFT+SET (CAL) Key Combination
Use this key combination to execute zero-level compensation. When zero level
compensation is executed, the WT500 creates a zero input condition in its internal
circuitry and sets the level at that point to the zero level.
Page 19
1-4
IM 760201-01E
1.2 Setup Menu Display and Operation Keys
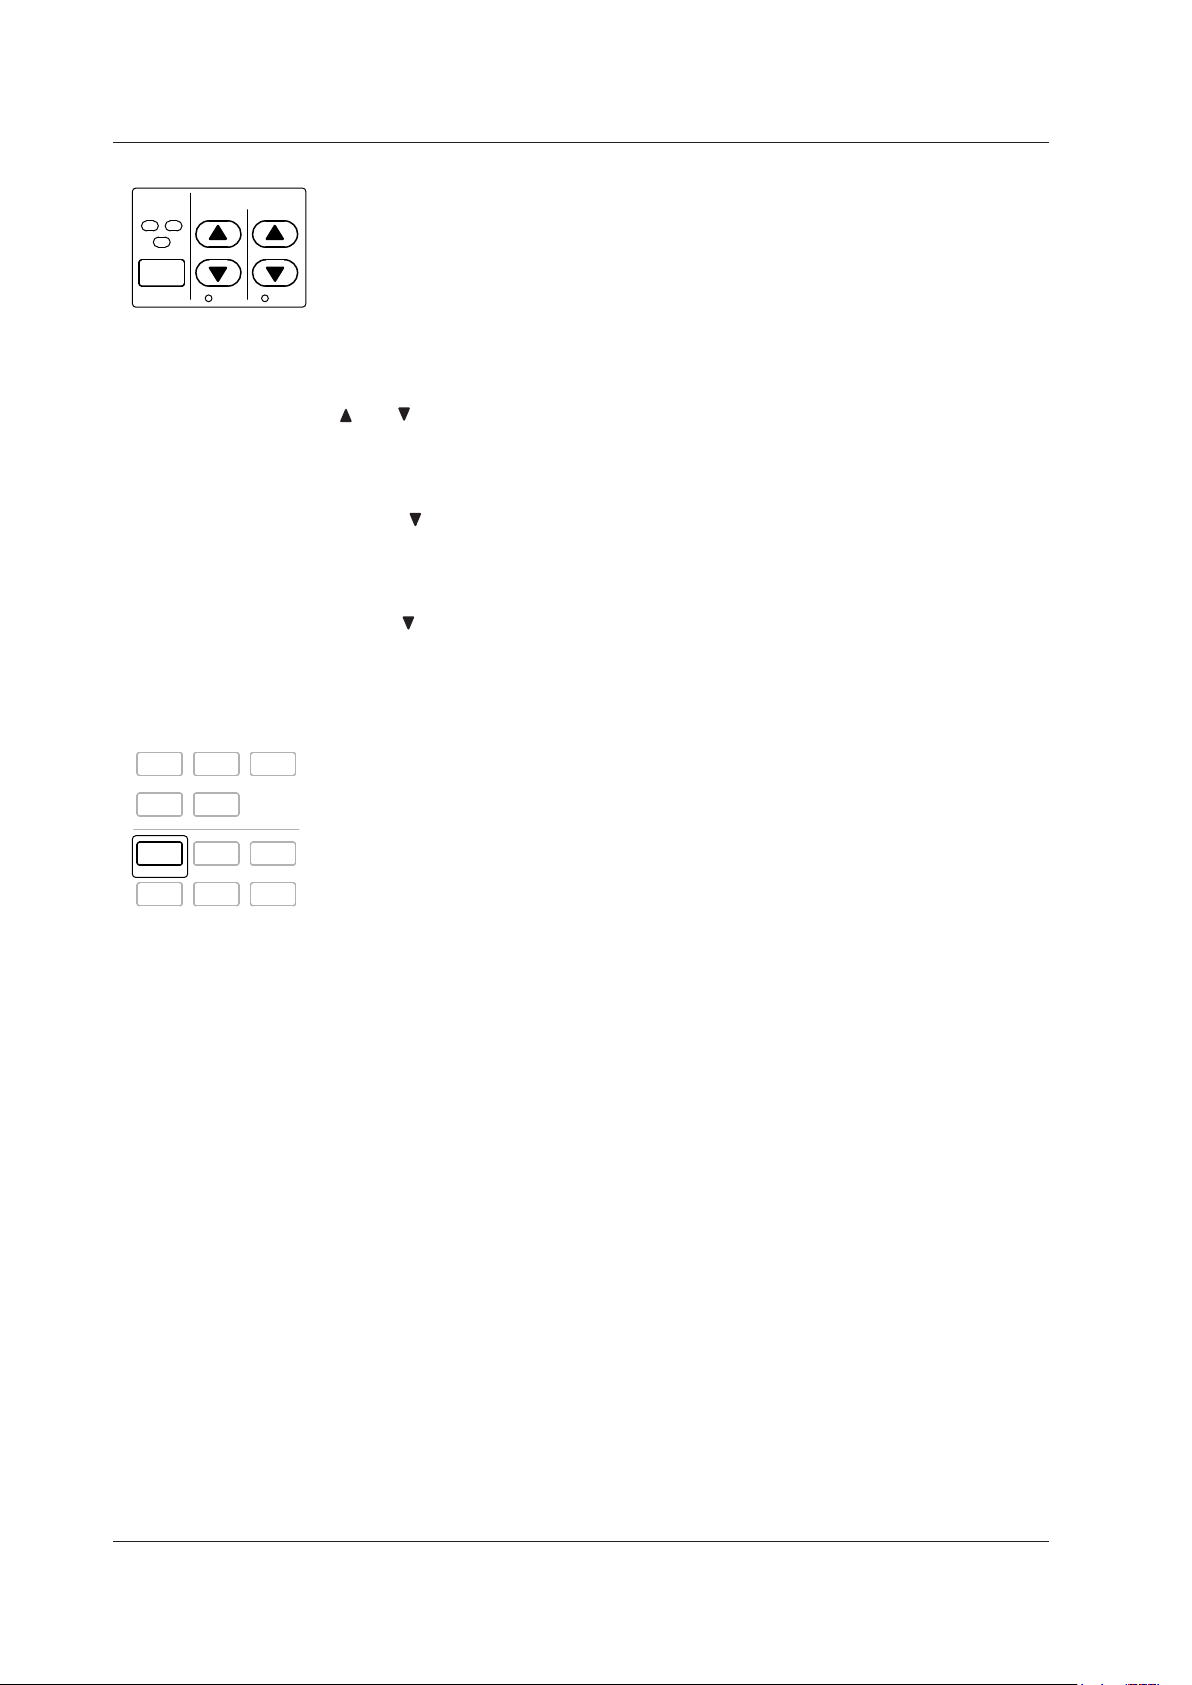
Keys for Setting the Measurement Range
ELEMENT
1
2
3
ELE MENT
ALL
RANGE
VOLTAGE CURRENT
AUTO A UTO
ELEMENT
• Use this key to select the input element that you want to set the measurement range
for. The selected input element will change each time you press ELEMENT.
•
When selecting a wiring system, the input elements that are part of the same wiring
system will be selected together.
SHIFT+ELEMENT (ALL) Key Combination
Use this key combination to set the voltage and current ranges of all elements at the
same time. Press ELEMENT again to make settings for individual elements.
and (See sections 4.3 and 4.4)
Use these keys to select the voltage, current, and current sensor ranges. The ranges
selected with these keys are valid when the AUTO indicators described below are not
lighted (when the manual range feature is being used).
SHIFT+ (AUTO) Key Combination
Use this key combination to activate the auto range feature (the AUTO indicator will light
when this feature is activated). This feature automatically sets the voltage, current, or
current sensor range depending on the amplitude of the received electrical signal. Press
SHIFT+
(AUTO) again to activate the manual range feature (the AUTO indicator light
will turn off).
Keys for Setting Measurement Conditions
SETU P
INPU T INFO
DISPLAY
NUM ERIC WAVE OTH ERS
FOR M ITEM
CUR SOR
INTEG RATOR
START /
STOP
RESE T
HOLD
SING LE
SHIF T
MIS C
NULL
LOC AL
KEY LOCK
SETUP
Use this key to display the Setup menu for setting measurement conditions. The following
items appear in the Setup menu:
• Wiring (See sections 4.1, 4.2, 5.7, and 5.8)
Select this item to display a menu for selecting the wiring system, configuring
individual input element settings, setting the efficiency equation, etc.
• Ranges (See sections 4.3 and 4.4)
You can select this item to set the voltage, current, or current sensor range, just as
you can with the panel RANGE keys. If you select AUTO, the auto feature will be
activated and the AUTO indicators underneath the RANGE keys will light.
• Scaling (See section 4.5)
Select this item to display a menu for setting the VT and CT ratios and the power
factor for each input element. The power coefficients are used to convert the VT/CT
output or the power derived from measuring the VT and CT outputs to the voltage,
current, and power of the object being measured.
• Sync Source (See section 4.7)
Select this item to display a menu for setting the synchronization source for each
wiring unit. The synchronization source defines the period (measurement period) over
which sampled data, which is used to produce numeric data (i.e., measured values
such as voltage, current, and power), is acquired.
• Filters (See section 4.8)
Select this item to display a menu for setting the line filter (which is inserted into the
measurement circuit) and the frequency filter (which is inserted into the frequency
measurement circuit) for each element.
• Update Rate (See section 4.9)
Select this item to display a menu for selecting the period (data update rate) at which
sampled data, which is used to produce numeric data (i.e., measured values such as
voltage, current, and power), is acquired.
• Averaging (See section 4.10)
Select this item to display a menu for setting the measured value averaging feature.
Page 20

1-5
IM 760201-01E
Component Names and Functions
1
• Integration (See sections 5.6 to 5.12)
Select this item to display a menu for setting the integration mode, integration auto
calibration, the integration timer, the reservation time, the watt hour integration method
for each polarity, and the ampere hour integration mode.
• Details.../Hide Details
Select this item to switch between displaying all menu items and only displaying a
portion of the menu items.
• Measure (See sections 5.3 to 5.5 and 12.6)
Select this item to display a menu for setting master/slave synchronized measurement
and for selecting the equation for apparent/reactive power and the format for phase
difference display.
• User Function (See sections 5.13 and 5.14)
Select this item to display a menu for setting user-defined functions and the MAX hold
feature.
• Freq Items (See section 5.16)
This item only appears on models without the frequency measurement option. Select
this item to display a menu for selecting which frequencies to measure. Because
models with the frequency measurement option measure all voltages and currents,
this menu will not appear.
• Harmonics (See sections 6.3 to 6.5)
This item only appears on models with the harmonic measurement option. Select this
item to display a menu for setting the PLL source, the measured harmonic orders, and
the equation for the harmonic distortion factor, in harmonic measurement.
• Delta Measure (See section 5.17)
This item only appears on models with the delta computation option. Select this item
to display a menu for selecting the delta computation type and the voltage or current
mode that will be the object of delta computation.
Note
While displaying any submenu in the Setup menu, you can press PAGE or PAGE to display
the previous or next menu. This feature is useful when you want to check the measurement
conditions set in each menu.
SHIFT+SETUP (INPUT INFO) Key Combination
Use this key combination to display a list of the conditions for acquiring the data from
a measured voltage or current signal, such as the wiring system for each element, the
wiring unit, the measurement range, the scaling, the synchronization source, and the
input filter.
1.2 Setup Menu Display and Operation Keys
Page 21

1-6
IM 760201-01E
Keys for Displaying Measured/Computed Results
SETU P
INPU T INFO
DISPLAY
NUM ERIC WAVE OTH ERS
FOR M ITEM
CUR SOR
INTEG RATOR
START /
STOP
RESE T
HOLD
SING LE
SHIF T
MIS C
NULL
LOC AL
KEY LOCK
NUMERIC (See sections 3.16, 5.1, and 6.2)
Use this key to display numeric data.
• Each time you press NUMERIC, the number of displayed items switches in this order:
4 Items > 8 Items > 16 Items > Matrix > All Items > Single List
*
> Dual List* > 4 Items >
and so on.
* Only appears on models with the harmonic measurement option.
• When you are displaying numeric data, you can press FORM, which is described later
in this section, to display a menu for changing the number of displayed items.
•
When you are displaying numeric data, you can press ITEM, which is described later
in this section, to display a menu for changing the displayed items.
WAVE (See sections 3.16, 6.7, and 7.2)
Use this key to display waveforms.
• Each time you press WAVE, the waveform display split screen setting switches in this
order: Single > Dual > Triad > Quad > Single > and so on.
•
When you are displaying waveforms, you can press FORM, which is described later
in this section, to display a menu for setting the time-axis of the displayed waveforms,
the trigger for waveform display, the number of waveform display split screens, and
the assignment of waveforms to split screens.
•
When you are displaying waveforms, you can press ITEM, which is described later
in this section, to display a menu for selecting and zooming in on the displayed
waveforms.
OTHERS (See sections 3.16, 6.7, 6.8, 7.2, and 8.2)
Use this key to switch between the Trend, Bar Graph*, and Vector* displays.
Each time you press OTHERS, the display switches in this order: Trend > Bar* > Vector*
> Trend > and so on.
* Only appears on models with the harmonic measurement option.
FORM (See sections 5.2, 6.2, 6.7, 6.8, 7.4, 7.5, 7.7, 7.8, and 8.6 to 8.9)
Use this key to display a menu for setting the format of the display that has been selected
using NUMERIC, WAVE, or OTHERS.
SHIFT+FORM (CURSOR) Key Combination (See sections 7.9 and 8.10)
Use this key when you are displaying waveforms, trends, or bar graphs* to display a
menu for using cursors to measure waveform and graph values.
* Only appears on models with the harmonic measurement option.
ITEM Key (See sections 5.2, 6.2, 6.7, 6.8, 7.3, 7.6, and 8.3 to 8.5)
Use this key to display a menu for setting the displayed items in the display that has
been selected using NUMERIC, WAVE, or OTHERS.
Keys for Data Storage/Saving
FILE IMA GE
MENU
STOR E
STOR E SET
FILE
Use this key to display a menu for saving and loading setup parameters, saving
measured data, deleting files, copying files, and so on.
IMAGE
Use this key to save the screen image data.
SHIFT+IMAGE (MENU) Key Combination
Use this key combination to display a menu for setting screen image data save options
such as the file name, data format, color mode, data compression, and comments.
STORE
Use this key to execute, stop, or reset a storage operation.
SHIFT+STORE (STORE SET) Key Combination
Use this key to display a setup menu for the storage feature.
1.2 Setup Menu Display and Operation Keys
Page 22

1-7
IM 760201-01E
Component Names and Functions
1
Other Keys
SETU P
INPU T INFO
DISPLAY
NUM ERIC WAVE OTH ERS
FOR M ITEM
CUR SOR
INTEG RATOR
START /
STOP
RESE T
HOLD
SING LE
SHIF T
MIS C
NULL
LOC AL
KEY LOCK
START/STOP Key
Use this key to start or end integration. You can view the integration condition in the
integration setup/condition display (see section 1.3).
SHIFT+START/STOP (RESET) Key Combination
Use this key combination to reset the integrated value.
HOLD (See section 4.12)
Press HOLD to stop data measurement and display operations and to hold the numeric
display (the HOLD key illuminates when the numeric display is held). During integration,
the numeric display is held but measurement is not stopped. Press HOLD again to allow
the numeric data display to be updated (the HOLD key will no longer be illuminated).
SHIFT+HOLD (SINGLE) Key Combination (See section 4.12)
Use this key combination while the display is held to measure the signal once at the set
data update rate, and then to re-hold the display.
LOCAL
Use this key to switch from remote mode (the REMOTE indicator will appear at the upper
right of the screen) to local mode (in which front panel key operations are valid). This key
is invalid when the WT500 is in local lockout mode.
SHIFT+LOCAL (KEY LOCK) Key Combination
Use this key combination to turn the key lock on or off. When the key lock is on, no keys
or key combinations other than SHIFT+LOCAL are valid, and LOCK appears in the upper
right of the screen.
MISC
Use this key to display a menu for viewing the system status, initializing setup
parameters, configuring or viewing the settings of remote control through communication
commands (using the USB, GP-IB, or Ethernet interface option), setting the date/time,
selecting the message and menu languages, selecting the crest factor, setting the USB
peripheral interface, setting the optional Ethernet interface, setting the self test, etc.
SHIFT+MISC (NULL) Key Combination
Use this key combination to activate the NULL feature, which removes the DC
component from the sampled data (the NULL indicator appears on the screen when the
NULL feature is activated). Press SHIFT+MISC (NULL) again to deactivate the NULL
feature (the NULL indicator will no longer appear).
SHIFT
When you press the SHIFT key, the key illuminates, and pressing a panel key produces
the effect indicated by the purple letters below it. Holding down SHIFT for 2 seconds or
more will lock the WT500 into the shifted state. Pressing SHIFT again will release the
shifted state (and the SHIFT key will no longer be illuminated).
1.2 Setup Menu Display and Operation Keys
Page 23
1-8
IM 760201-01E
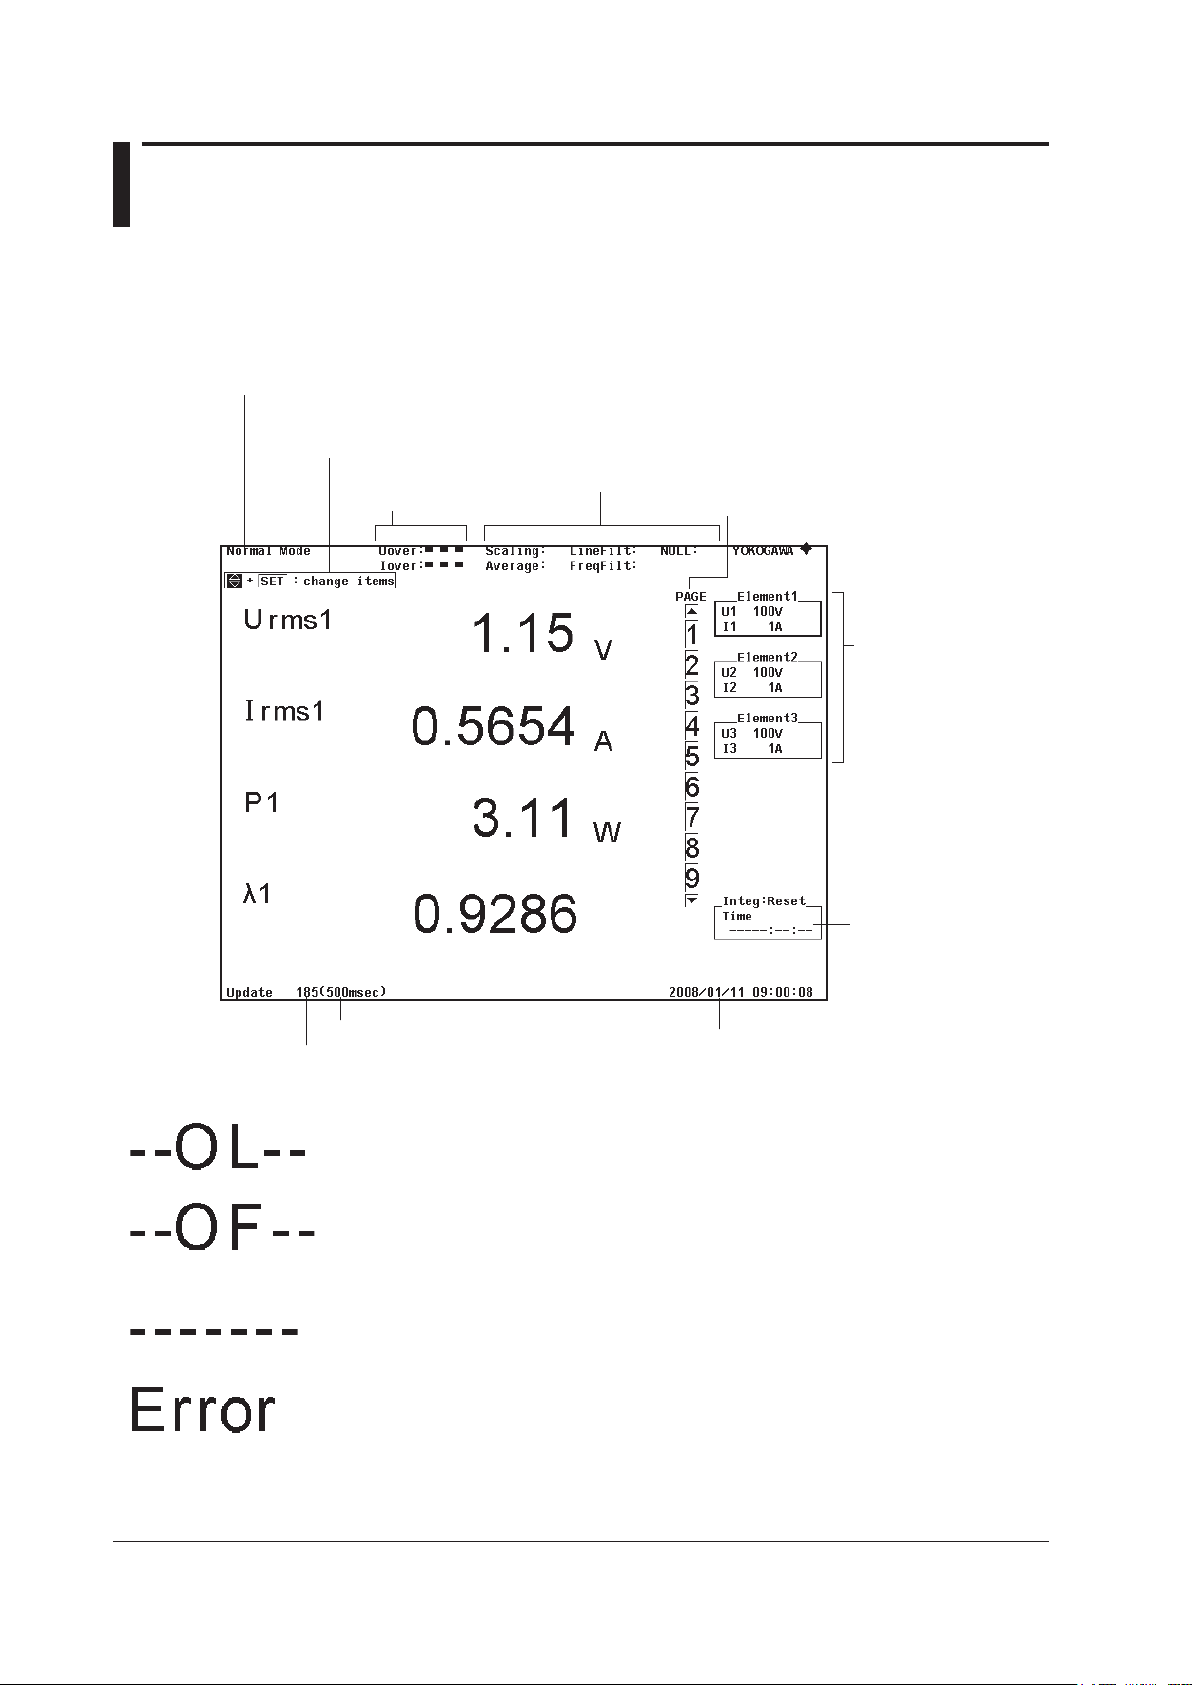
1.3 Screen Display
Display Example When Measuring Power (Numeric display) in Normal
Measurement Mode
For a description of the screens in other display modes, see the chapters that cover
those modes.
Date/time (see section 3.11)
Input peak over-range
indicator (see section 5.2)
Measurement mode (see section 7.2)
Display items that can
be changed directly
(see section 5.2)
Indication of on/off status of various features
• Scaling (see section 4.6)
• Averaging (see section 4.10)
• Line filter (see section 4.8)
• Frequency filter (see section 4.8)
• NULL feature (see section 12.4)
Page bar (see section 5.2)
Input element setup
parameters
• Measurement range
(see sections 4.4 to 4.5)
• Wiring system
(see section 4.2)
Integration setting/status
(see section 5.11)
Data update count (see section 5.2)
Data update rate (see section 4.9)
Non-Numeric Displays
Overload
Displayed if the measured value exceeds 140% of the measurement range.
Overflow
Displayed if the measured or computed result cannot be displayed using the specified
decimal place or unit.
No data
Displayed if a measurement function is not selected or if there is no numeric data.
Error
Displayed in cases such as when a measured value is outside of its determined range.
Page 24
2-1
IM 760201-01E
Features
2
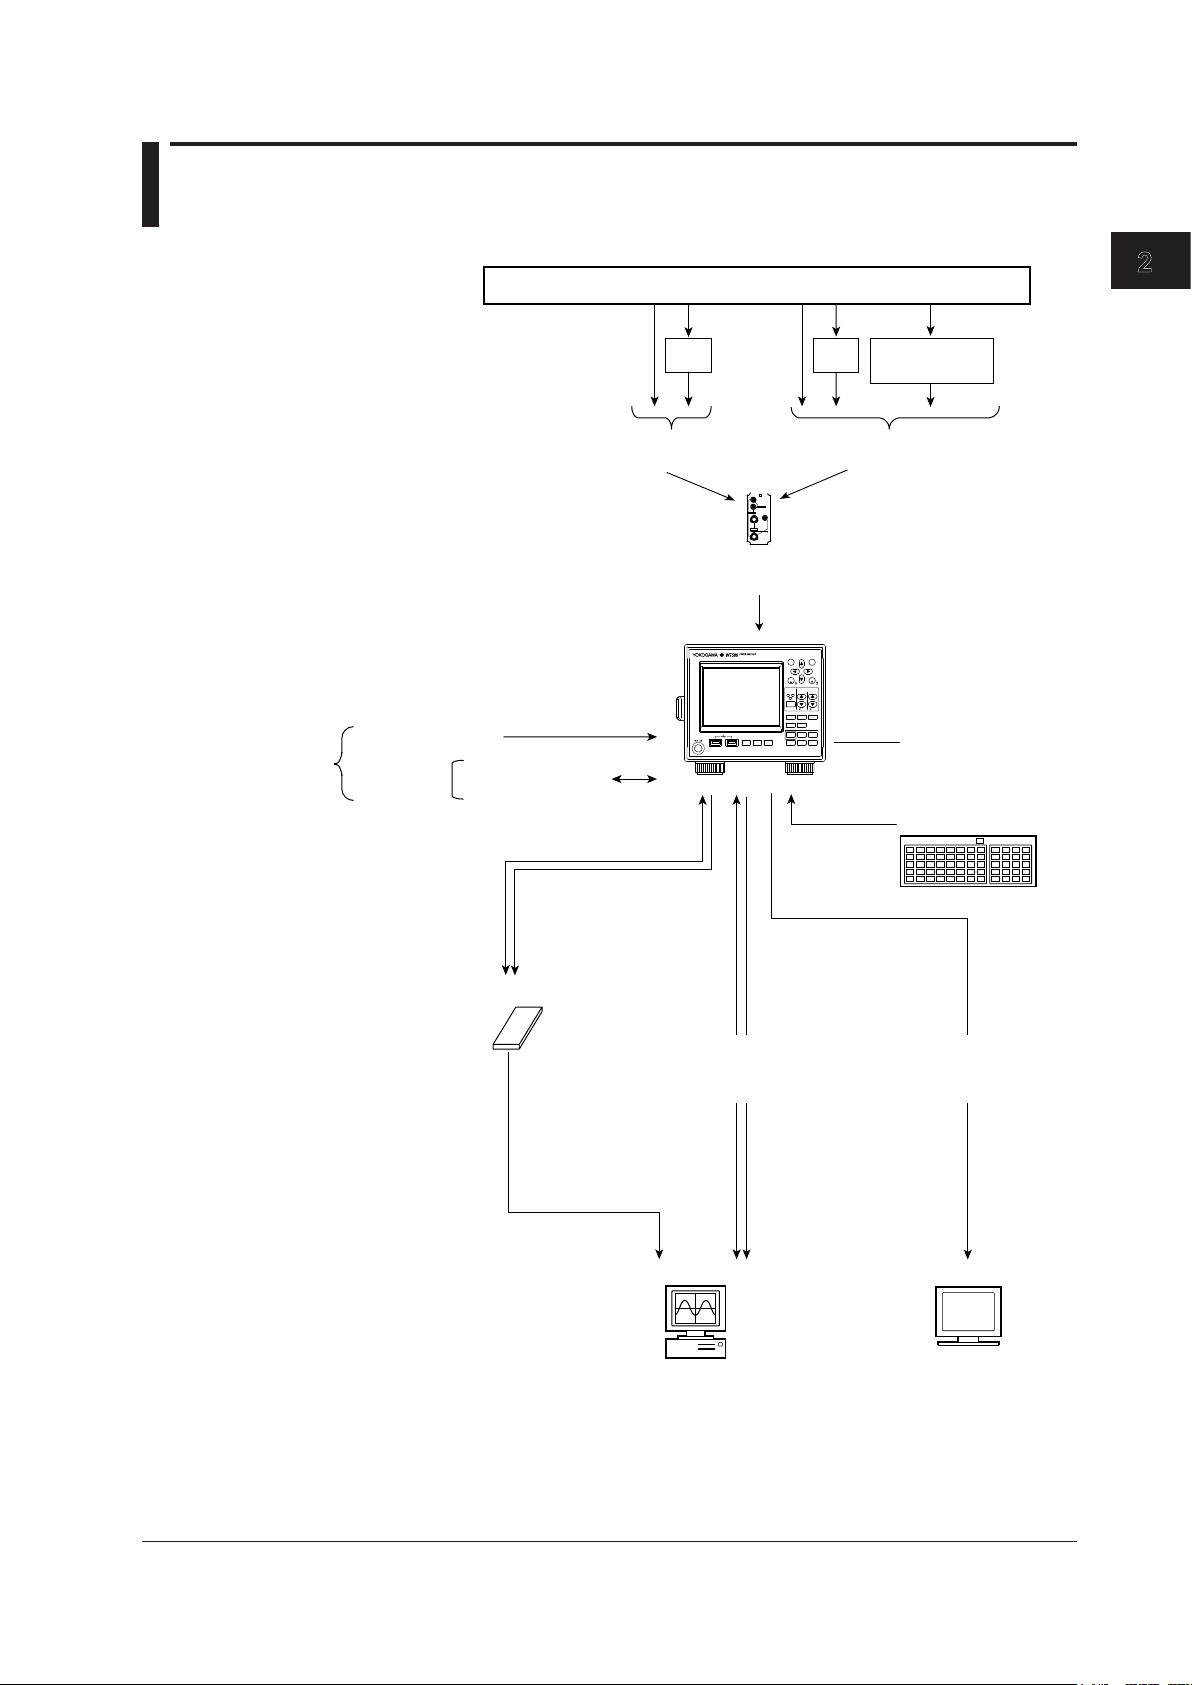
1
2.1 System Configuration and Block Diagram
System Configuration
ESC
RESET
SET
CAL
PAGE
PAGE
ELEMENT
1
2
3
ELEMENT
ALL
RANGE
VOLTAGE CURRENT
AUTO AUTO
DISPLAY
NUMERIC WAVE O THERS
FORM ITEM
CURSOR
INTEGRATOR
SETUP
INPUT INFO
START/
STOP
RESET
HOLD
SINGLE
SHIFT
MISC
NULL
LOCAL
KEY LOCK
FILE IMAGE
MENU
STORE
STORE SET
POWER
ELEMENT
VOLTAGE
±
±
CURRENT
EXT
Object Being Measured
VT
CT
Voltage
(Apply one or the other)
Current
(Apply one of them)
Current sensor
(optional)
Input element
External clock input
Master/slave
sync signal
USB keyboard
Internal memory
Stores numeric data
USB memory
CRT
Numeric data
Waveform display data
Screen image data
Stored data
Setup parameters
Numeric data
Waveform display data
Screen image data
Setup
parameters
PC
Measurement start/
Measurement stop
GP-IB interface (optional)/
Ethernet interface (optional)/
USB interface
RGB video signal (VGA)
output (optional)
Image signal
(Apply one or the other)
Chapter 2 Features
Page 25
2-2
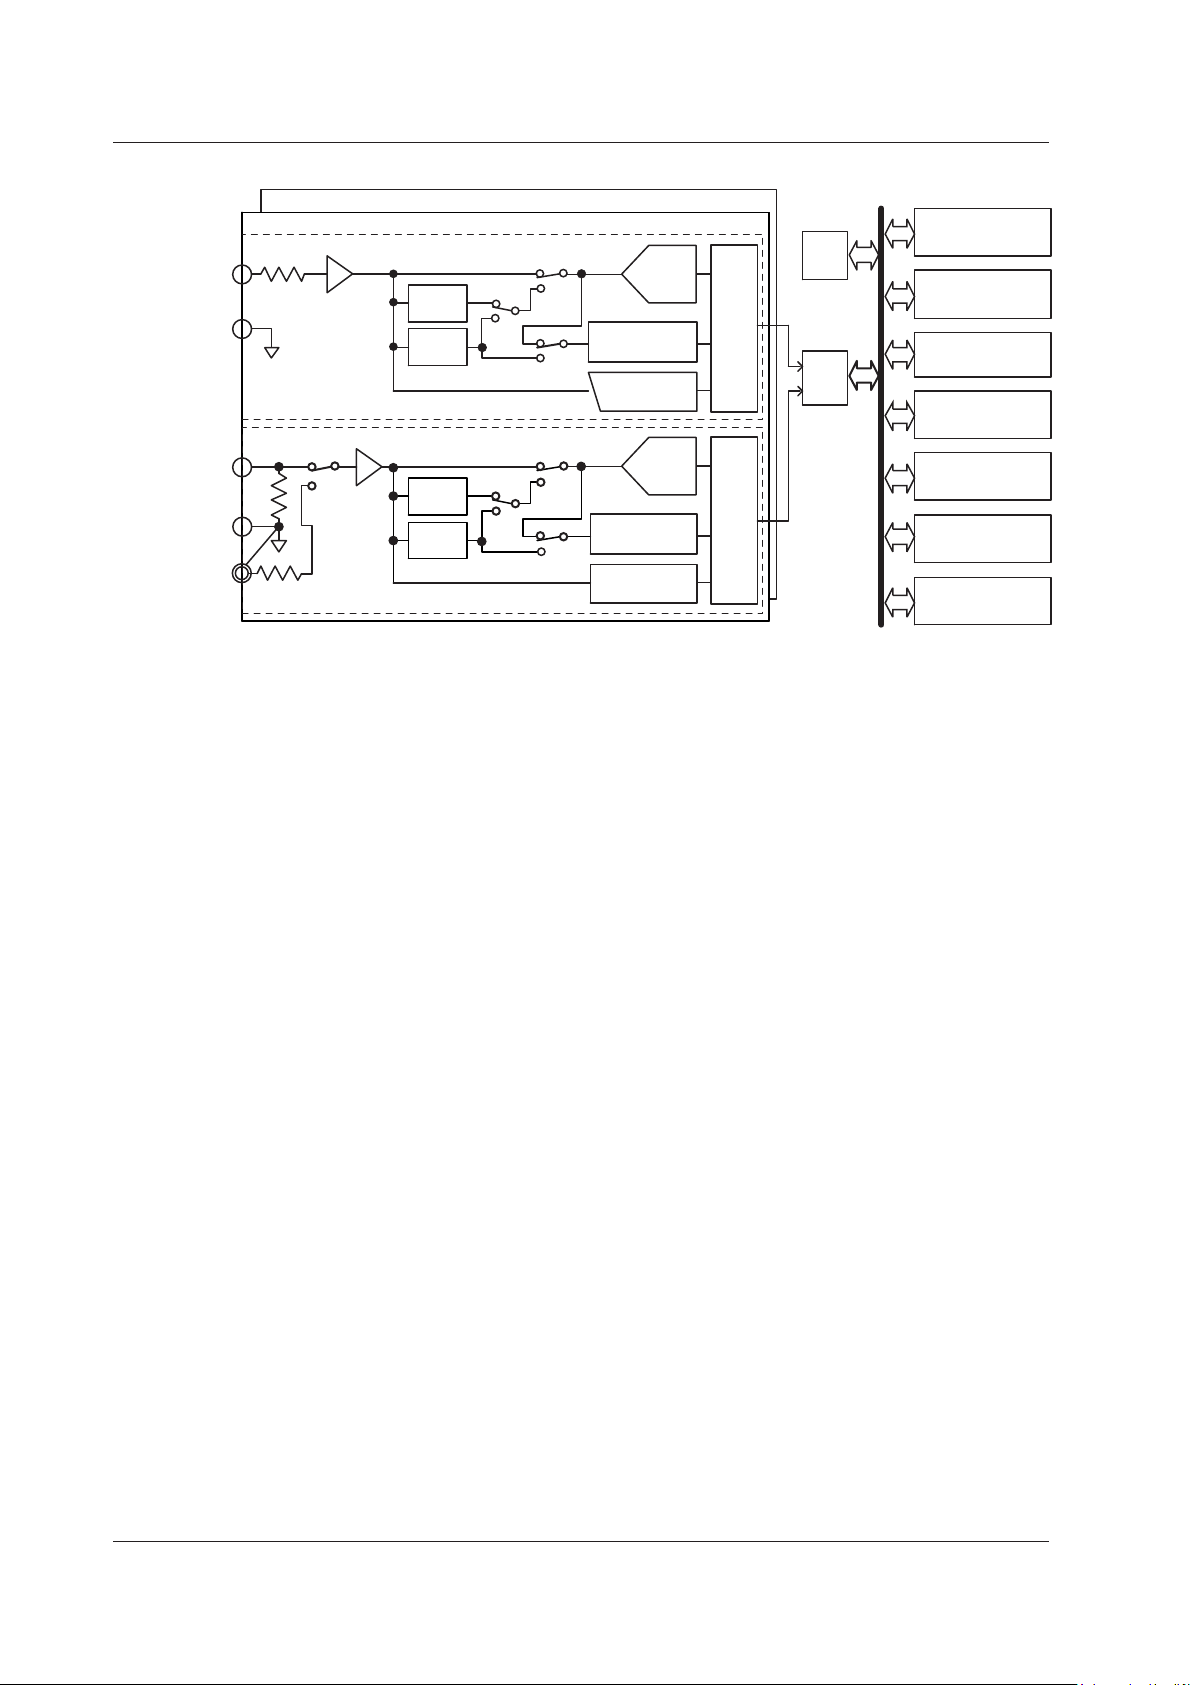
IM 760201-01E
Block Diagram
U
±
L.P.F.
5.5 kHz
L.P.F.
500 Hz
L.P.F.
5.5 kHz
L.P.F.
500 Hz
A/D
Isolator Isolator
Zero-crossing
detector
Peak
detector
I
±
Current sensor
(EXT; optional)
Voltage input circuit
Current input circuit
Input element 1
Input elements 2 and 3
DSP
CPU
LCD
USB port
(for peripherals)
USB port
(PC)
GP-IB
(optional)
Ethernet
(optional)
VGA output
(optional)
KEY
Voltage Input
Current input
A/D
Zero-crossing
detector
Peak
detector
Input Signal Flow and Process
Input elements 1 through 3 consist of a voltage input circuit and a current input circuit.
The input circuits are mutually isolated. They are also isolated from the case.
The voltage signal that is applied to the voltage input terminal (U, ±) is normalized using
the voltage divider and the operational amplifier (op-amp) of the voltage input circuit . It is
then sent to a voltage A/D converter.
The current input circuit is equipped with two types of input terminals, a current input
terminal (I, ±) and an optional current sensor input connector (EXT). Only one can be
used at any given time. The voltage signal from the current sensor that is received at the
current sensor input connector is normalized using the voltage divider and the operational
amplifier (op-amp). It is then sent to a current A/D converter. The current signal that is
applied to the current input terminal is converted to a voltage signal by a shunt. Then, it
is sent to the current A/D converter in the same fashion as the voltage signal from the
current sensor.
The voltage signal that is applied to the voltage A/D converter and current A/D converter
is converted to digital values at an interval of approximately 10 µs. These digital values
are isolated by the isolator and passed to the DSP. In the DSP, the measured values
are derived based on the digital values. The measured values are then transmitted to
the CPU. The measured values and computed values are displayed and transmitted as
measurement functions of normal measurement.
The harmonic measurement functions are derived in the following manner (harmonic
measurement is an option). The voltage signal sent to the A/D converter is converted to
digital values at a sampling frequency that is determined by the PLL source signal. The
DSP derives the measured value of each harmonic measurement item by performing an
FFT on the converted digital values.
2.1 System Configuration and Block Diagram
Page 26

2-3
IM 760201-01E
Features
2
1
2.2 Measurement Functions and Periods
Measurement Functions
The physical values (such as rms voltage, average current, power, and phase difference)
that the WT500 measures and displays are called measurement functions. Each
measurement function is displayed using symbols that correspond to its physical value.
For example, “Urms” corresponds to the true rms voltage.
Types of Measurement Functions Used in Normal Measurement
The data of measurement functions (numeric data) is measured or computed from the
sampled data that is described in “Measurement Period” on page 2-9.
1
1 The WT500 samples the instantaneous values of the voltage and current signals at the
specified sample rate. The sampled data is processed as numeric data or data used to
display waveforms on the screen (waveform display data).
The sample rate is the number of data points that are sampled within 1 s. For example, at a
sample rate of 100 kS/s, 100000 data points are sampled every second.
Types of Measurement Functions
• Input Element Measurement Functions
The following 23 measurement functions are available. For details about the
determination of measurement function data, see appendix 1.
U (voltage Urms, Umn, Udc, Urmn, Uac), I (current Irms, Imn,
Idc, Irmn, Iac), P (active
power), S (apparent power), Q (reactive power), λ (power factor), f (phase difference),
fU/fI (also expressed as FreqU/FreqI; measures the frequencies of up to two voltage/
current signals),
2
U+pk/U-pk (maximum/minimum voltage values), I+pk/I-pk (maximum/
minimum current values), and CfU/CfI (crest factor of voltage/current; peak-to-rms
ratio)
2 The voltage and current frequencies of all input elements can be measured on models with
the frequency measurement add-on option.
• Wiring UnitΣ Measurement Functions (Σ Functions)
The following 15 measurement functions are available. For details about the
determination of measurement function data, see appendix 1.
UΣ (voltage average UrmsΣ, UmnΣ, UdcΣ, UrmnΣ, UacΣ), IΣ (current average IrmsΣ,
ImnΣ, IdcΣ, IrmnΣ, IacΣ), PΣ (sum of active powers), SΣ (sum of apparent powers),
QΣ (sum of reactive powers), λΣ (power factor average), and fΣ (phase difference
average)
•Efficiency (Σ functions) and User-Defined Functions
There are two ef
ficiency functions, η1 and η2. The available user-defined functions
are F1 to F8. For details, see section 2.5.
•
Integration Functions
See section 2.6.
• Delta Computation (Optional)
There are four delta functions, ΔF1 to Δ F4. For details, see section 5.17.
Page 27
2-4
IM 760201-01E
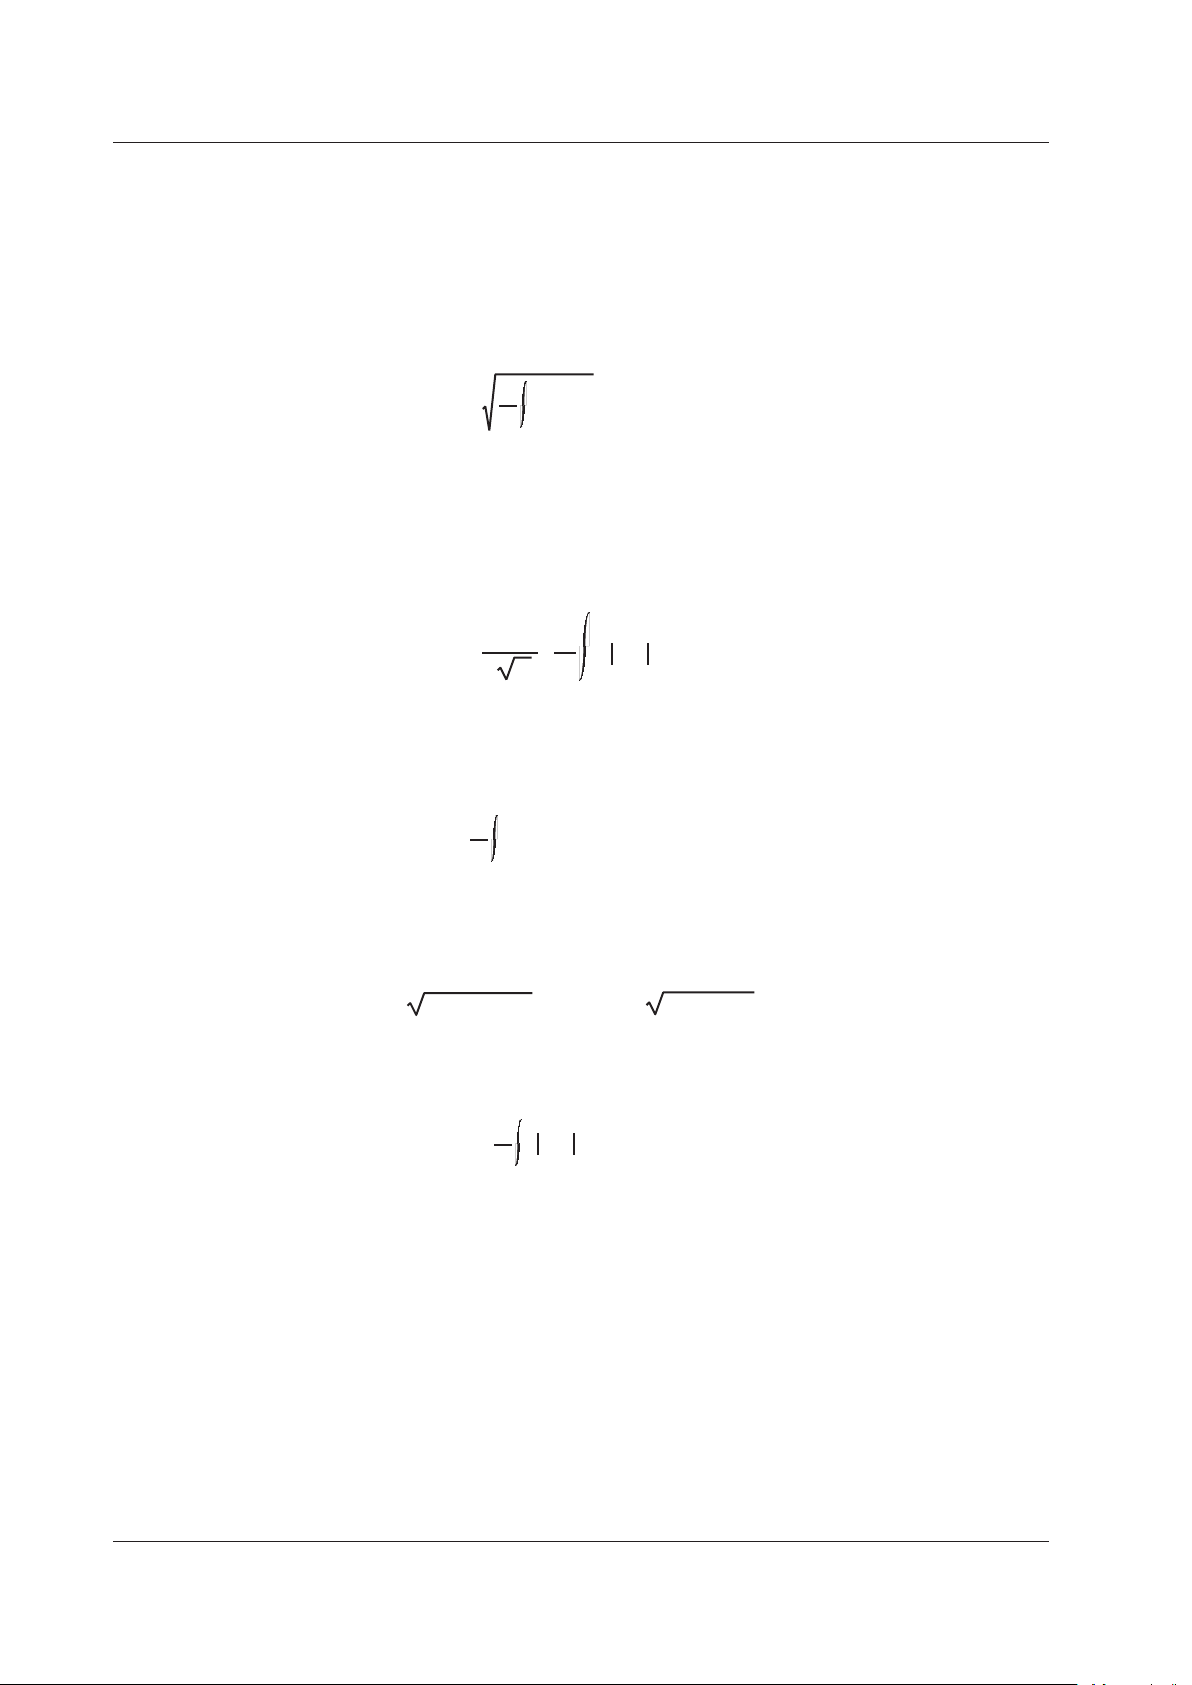
Determining Voltage and Current
The following five types of voltage (U) and current (I) measurement functions are
available.
•
Urms and Irms (True rms value)
These values are the true rms values of the voltage and current. The instantaneous
values over one period are squared and averaged. Then, the square root of the
average is determined. f(t) is the input signal as a function of time. T is the period of
the input signal.
Urms or Irms =
1
T
0
T
f(t)2 dt
• Umn and Imn (Rectified mean value calibrated to the rms value)
This function rectifies one period of the voltage or current signal, determines the
average, and multiplies the result by a coefficient. The coefficient is a value that when
applied to a sinusoidal input signal, gives the true rms value. When the input signal is
a distorted or DC waveform, these values will differ from the true rms values. f(t) is the
input signal as a function of time. T is the period of the input signal.
Umn or Imn =
π
2
2
•
1
T
0
T
f(t) dt
• Udc and Idc (Simple average, DC)
These are the average values of the voltage and current signal over one period. This
function is useful when determining the average value of a DC input signal or the DC
component that is superimposed on an AC input signal.
Udc or Idc =
1
T
0
T
f(t) dt
• Uac and Iac (AC component)
This function determines the AC component of the voltage or current. The function
calculates the square root of the square of the true rms value minus the square of the
DC component.
Uac=
Urms
2
–Udc
2
Iac=
Irms
2
–Idc
2
, or
• Urmn and Irmn (Rectified mean value)
This function rectifies one period of the voltage or current signal and determines the
average.
Urmn or Irmn =
1
T
0
T
f(t) dt
Elements
Element refers to a set of input terminals that can receive a single phase of voltage and
current to be measured. The WT500 can contain up to three elements, numbered from
1 to 3. An element number is appended to the measurement function symbol for the
measured data that the WT500 displays, so that you can tell which data belongs to which
element. For example, “Urms1” corresponds to the true rms voltage of element 1.
Wiring Systems
You can specify five wiring systems on the WT500 to measure the power of various
single-phase and three-phase power transmission systems: single-phase, two-wire;
single-phase, three-wire; three-phase, three-wire; three-phase, four-wire; and threephase, three-wire with three-voltage, three-current method. For details, see section 2.3.
2.2 Measurement Functions and Periods
Page 28
2-5
IM 760201-01E
Features
2
1
Wiring Unit
The wiring unit is a set of two or three input elements of the same wiring system that
are grouped to measure three-phase power. The wiring unit is represented by Σ. The
measurement function of a wiring unit is called a Σ function.
For example, “UrmsΣ” corresponds to the average of the voltages of the input elements
that are assigned to the wiring unit. The average represents the true rms value.
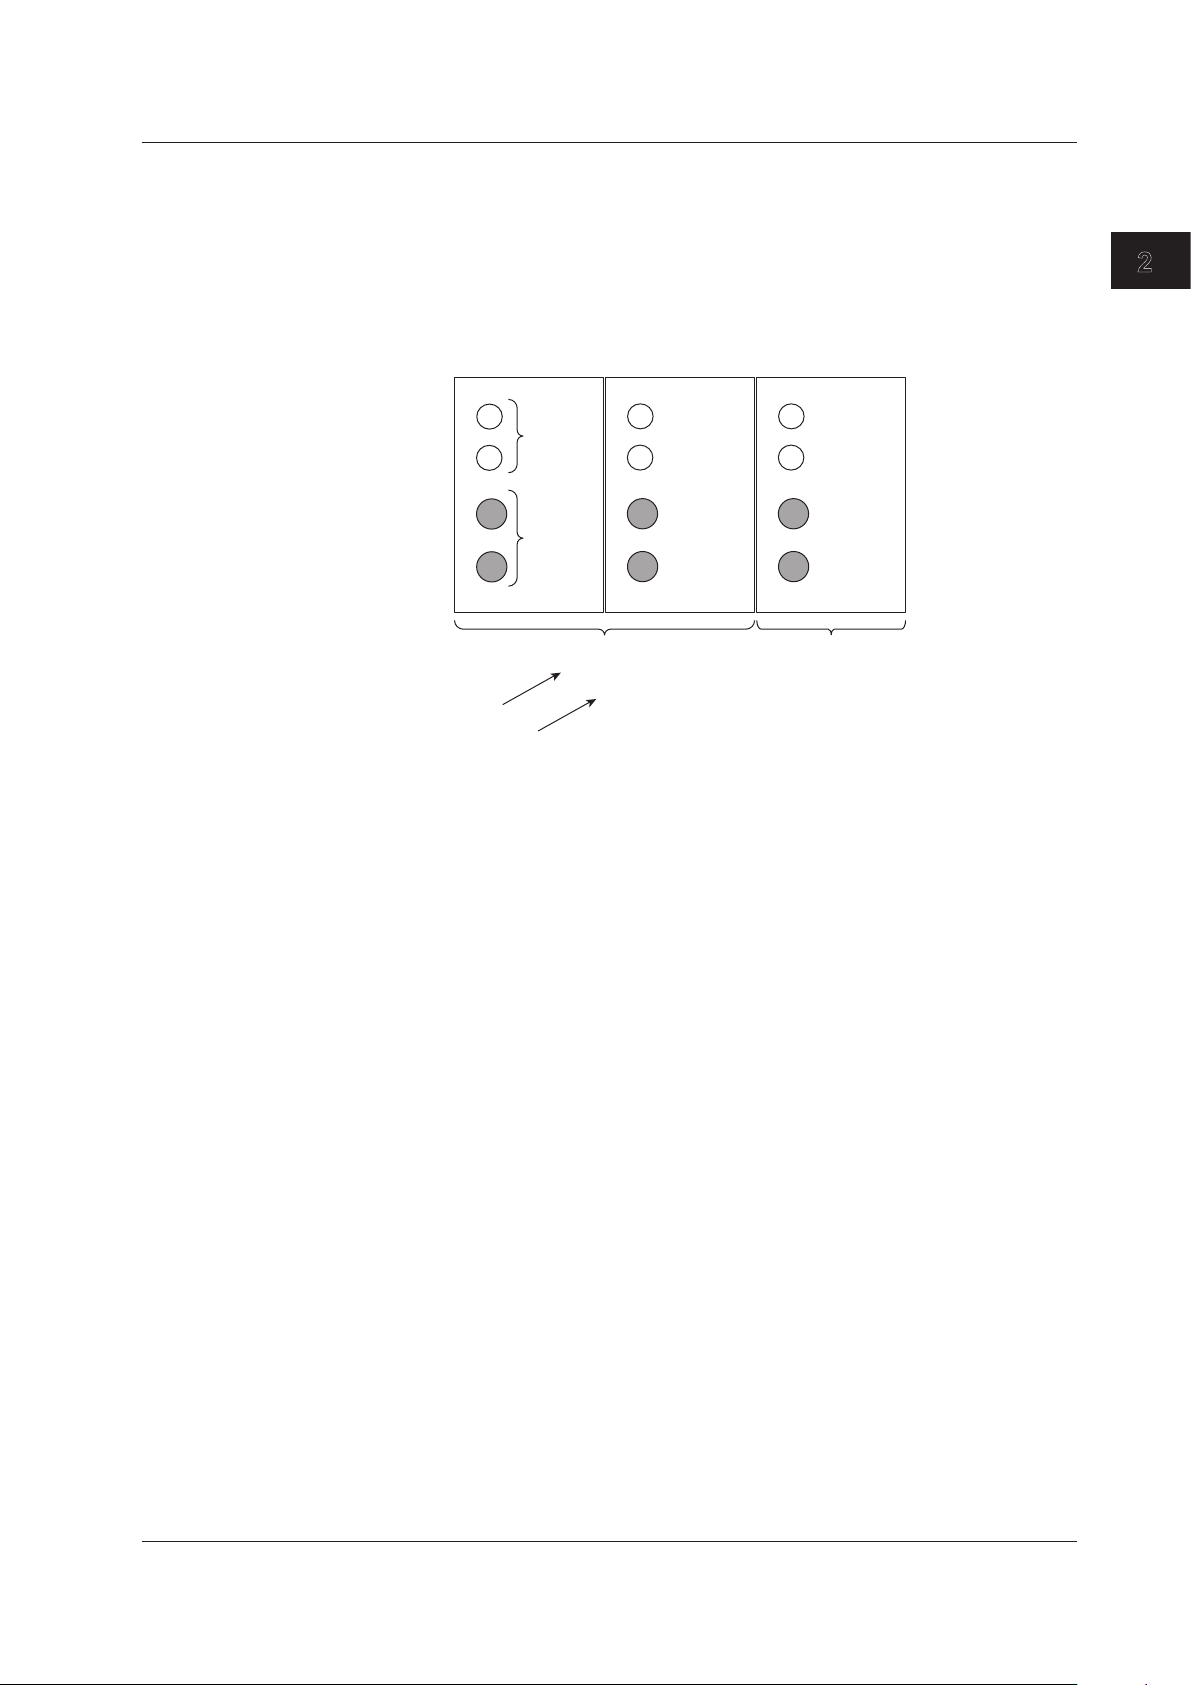
•
Wiring System and Wiring Unit Configuration Example
Voltage
input
Current
input
Three-phase,
three-wire
3
Element 1
Element 2 Element 3
Single-phase,
two-wire
Wiring system
Wiring unit
2.2 Measurement Functions and Periods
Page 29

2-6
IM 760201-01E
Types of Measurement Functions Used in Harmonic Measurement (Optional)
The data of harmonic measurement functions (numeric data) is measured or computed
from the sampled data that is described later in “Measurement Period.”
*
* For information about sampled data, see the explanation under “Types of Measurement
Functions Used in Normal Measurement,” earlier in this section.
Types of Harmonic Measurement Functions
• Input Element Harmonic Measurement Functions
The following 15 harmonic measurement functions are available. For details about the
determination of measurement function data, see appendix 1.
dc
Yes
Yes
Yes
Yes
Always 0
Yes
No
No
No
Yes
Yes
Yes
No
No
No
1
Yes
Yes
Yes
Yes
Yes
Yes
Yes
No
No
Yes
Yes
Yes
No
No
No
Total
Yes
Yes
Yes
Yes
Yes
Yes
Yes
Yes
Yes
Yes
Yes
Yes
No
No
No
k
Yes
Yes
Yes
Yes
Yes
Yes
Yes
Yes
Yes
Yes
Yes
Yes
No
No
No
All
No
parentheses
No
No
No
No
No
No
No
No
No
No
No
No
Yes
Yes
Yes
U( )
I( )
P( )
S( )
Q( )
λ( )
φ( )
φU( )
φI( )
Uhdf( )
Ihdf( )
Phdf( )
Uthd
Ithd
Pthd
Characters or Numbers
in Parentheses
Measurement
Function
Yes: Numeric data available
No: No numeric data available
• Functions with parentheses will produce different values depending on which of the
following is contained in their parentheses.
•
total: The total value is displayed.
•
dc: The dc component numeric data is displayed.
• 1: The numeric data of the fundamental signal is displayed.
• k: The numeric data from harmonic orders 2 to N is displayed. N is the upper
limit of harmonic order analysis (see section 17.6 for details). The upper
limit of harmonic analysis is either set to an automatically determined value
or to the value that you set, whichever is smaller. It can go up to the 50th
harmonic order.
•
All: Functions without parentheses display numeric data.
• Functions Uhdf to Pthd are measurement functions that express values that
are unique to harmonics. For details about how the values are determined, see
appendix 1.
2.2 Measurement Functions and Periods
Page 30

2-7
IM 760201-01E
Features
2
1
• Harmonic Measurement Functions That Express the Voltage and Current Phase
Differences (f) between and within Input Elements
There are five kinds of harmonic measurement functions that e
xpress phase
differences:
fUi-Uj, fUi-Uk, fUi-Ii, fUi-Ij, fUi-Ik
(i, j, and k are input element numbers)
The following explanation of the five kinds of harmonic measu
rement functions is for
the case when the number of input elements in wiring unit Σ is three and their common
wiring system is three phase, four wire. Also, i = 1, j = 2, and k = 3.
In this case, the following numeric data for the phase dif
ferences between elements 1,
2, and 3 is calculated.
•
fU1-U2
The phase dif
ference between the fundamental voltage of element 1, U1(1), and
the fundamental voltage of element 2, U2(1).
•
fU1-U3
The phase dif
ference between the fundamental voltage of element 1, U1(1), and
the fundamental voltage of element 3, U3(1).
•
fU1-I1
The phase dif
ference between the fundamental voltage of element 1, U1(1), and
the fundamental current of element 1, I1(1).
• fU1-I2
The phase dif
ference between the fundamental voltage of element 1, U1(1), and
the fundamental current of element 2, I2(1).
•
fU1-I3
The phase dif
ference between the fundamental voltage of element 1, U1(1), and
the fundamental current of element 3, I3(1).
•
Functions for Averaging and Summing Input Elements (Σ functions)
The following six harmonic measurement functions are available. For details about
how the measurement function values are determined, see appendix 1.
1
Yes
Yes
Yes
Yes
Yes
Yes
Total
Yes
Yes
Yes
Yes
Yes
Yes
U3( )
I3( )
P3( )
S3( )
Q3( )
L3( )
Characters or number
in parentheses
Measurement
Function
Yes: Numeric data available
Functions with parentheses will produce different values depending on which of the
following is contained in their parentheses.
•
total: The total value is displayed.
• 1: The numeric data of the fundamental signal is displayed.
2.2 Measurement Functions and Periods
Page 31

2-8
IM 760201-01E
Elements
Element refers to a set of input terminals that can receive a single phase of voltage
and current to be measured. The WT500 can contain up to three elements, numbered
from 1 to 3. The element number follows the function symbols discussed in “Input
Element Harmonic Measurement Functions” earlier in this section. For example, “U1(2)”
corresponds to the voltage of the second harmonic of element 1.
Wiring Systems
The selectable wiring system patterns vary depending on the number of input elements
that are installed in the WT500.
Wiring Unit
The wiring unit is a set of two or three input elements of the same wiring system that
are grouped to measure three-phase power. The wiring unit is represented by Σ. The
measurement function of a wiring unit is called a Σ function.
For example, “UΣ(1)” corresponds to the average of the fundamental voltages of the
input elements that are assigned to the wiring unit.
PLL Source (See section 6.3 for operating instructions)
To measure harmonics, the fundamental period (the period of the fundamental
signal) that will be used to analyze the harmonics must be determined. The signal for
determining the fundamental period is the PLL (phase locked loop) source. For stable
harmonic measurement, choose an input signal for the PLL source that has as little
distortion and fluctuation as possible. The ideal signal when the crest factor is set to 3
(see section 5.11 for details) is a rectangular wave with an amplitude that is 50% or more
of the measurement range (see section 1.3 for details). When the crest factor is set to
6, the ideal signal is a rectangular wave with an amplitude that is 100% or more of the
measurement range.
Also, applying a clock signal (Ext Clk) with the same period as the waveform whose
harmonics are being measured makes stable harmonic measurement possible.
2.2 Measurement Functions and Periods
Page 32

2-9
IM 760201-01E
Features
2
1
Measurement Period (See section 4.7 for operating instructions)
Measurement Functions Used in Normal Measurement
• The measurement period is set within the data update interval between the first point
where the reference input signal (synchronization source) crosses the level zero point
(center of the amplitude) on the rising trigger slope (or falling trigger slope) and the
last point where the synchronization source crosses the level zero point (center of the
amplitude) on the rising slope (or falling slope).
1, 2
However, the measurement period
for determining the numeric data of the peak voltage or peak current is the entire span
of the data update interval. Therefore, the measurement period for the measurement
functions that are determined using the maximum voltage or current value (U+pk,
U-pk, I+pk, I-pk, CfU, and CfI) is also the entire span of the data update interval.
•
The WT500 determines whether to define the measurement period using the rising
or falling edge automatically by choosing the method that will result in the longest
measurement period.
•
If there is not more than one rising or falling slope within the data update interval, the
entire data update interval is set as the measurement period.
•
You can select which input signal will be the synchronization source (synchronized
to the zero-crossing point of the input signal) for each element. You can set the
synchronization source signal to the voltage, current, or external clock input signal.
•
For details, see appendix 6.
1 Trigger slope refers to the movement of the signal from a low level to a high level (rising edge)
or from a high level to a low level (falling edge).
2 The data update interval is the interval at which the data that is used in measurement
functions is sampled. For details on how to set the interval, see section 2.3, “Data Update
Rate.”
Data update interval
Measurement period
Sync source
zero crossing
zero crossing
Data update interval
Measurement period
Measurement Functions Used in Harmonic Measurement
The measurement period is the first 1024 points from the beginning of the data update
interval at the harmonic sampling frequency. The WT500 determines the harmonic
sampling frequency automatically based on the period of the signal that is set as the PLL
source. The sampled data and the measurement period used for computation may differ
from the sampled data and the measurement period used for measurement functions.
2.2 Measurement Functions and Periods
Page 33

2-10
IM 760201-01E
2.3 Measurement Conditions
Number of Installed Input Elements and Wiring Systems (See sections 4.2 and 4.3
for operating instructions)
Wiring Systems
• There are five wiring systems available on the WT500.
1P2W: Single-phase, two-wire system
1P3W: Single-phase, three-wire system
3P3W: Three-phase, three-wire system
3P4W: Three-phase, four-wire system
3P3W
*
(3V3A): Three-voltage, three-current method
* In this manual, “3P3W” is used to indicate a three-phase, three-wire system and a three-
phase, three-wire system with a three-voltage, three-current method. Since the two types of
wiring systems cannot be distinguished if only 3P3W is written, “3P3W (3V3A)” is used to
indicate the three-voltage, three-current method.
• The selectable wiring systems vary depending on the number of installed elements.
Wiring Unit
The wiring unit is a set of two or three input elements of the same wiring system that are
grouped together. The wiring unit is represented by Σ.
For example, “UrmsΣ” corresponds to the average of the voltages of the input elements
that are assigned to the wiring unit. The average value represents the true rms value.
Wiring System Patterns
• The following table shows the relationship between the number of installed input
elements, the selectable wiring system patterns, and the assignment of input elements
to wiring unit Σ.
For example, there are four wiring system patterns on a WT50
0 that has three input
elements installed.
•
The input element assignment to wiring unit Σ and how Σ functions (such as voltage,
current, active power, apparent power, reactive power, power factor, and phase
difference) are determined are based on the wiring system pattern. For details about
the relationship between the wiring system and how Σ functions data is determined,
see Appendix 1.
Number of installed input elements
Wiring system Pattern 1
1
1P2W
Number of installed input elements
Wiring system Pattern 1
Wiring system Pattern 2
1
1P2W
2
1P2W
1P3W:3 or 3P3W:3
Number of installed input elements
Wiring system Pattern 1
Wiring system Pattern 2
Wiring system Pattern 3
Wiring system Pattern 4
1
1P2W
2
1P2W
3
1P2W
1P2W
1P2W
1P3W:3 or 3P3W:3
1P3W:3 or 3P3W:3
3P4W:3 or 3P3W (3V3A):3
Page 34

2-11
IM 760201-01E
Features
2
1
Measurement Range (See section 4.4 for operating instructions)
Set the measurement range using an rms value. When directly applying voltage or
current signals to an input element, two types of measurement ranges are available: fixed
range and auto range. When waveforms are displayed and the crest factor (see section 4.6
for details) is set to 3, the vertical display range corresponds to 3 times the measurement
range. When the crest factor is set to 6, the vertical display range corresponds to 6 times
the measurement range. For details about waveform display, see section 2.7, “Waveform
Display.”
Fixed Range
Select each range from the given choices. The selected range does not change even
if the amplitude of the input signal changes. For voltage, the maximum and minimum
selectable ranges when the crest factor is set to 3 are 1000 V and 15 V. When the crest
factor is set to 6, the maximum and minimum selectable ranges are 500 V and 7.5 V.
Auto Range
The measurement range is switched automatically depending on the amplitude of the
input signal. The different ranges used in the auto range are the same as those available
for the fixed range.
•
Range Increase
• The measurement range is increased when the data of measurement function
Urms or Irms exceeds 110% of the currently set measurement range.
•
The measurement range is increased when the crest factor is set to 3 and the peak
value of the input signal exceeds 330% of the currently set measurement range,
or when the crest factor is set to 6 and the peak value of the input signal exceeds
660% of the currently set measurement range.
•
Range Decrease
The measurement range is decreased when the data of the measurement function
Urms or Irms is less than or equal to 30% of the measurement range and Upk
*
and
Ipk
*
are less than or equal to 300% of the next lower range when the crest factor is set
to 3, or 600% of the next lower range when the crest factor is set to 6.
* Even if the NULL feature is on, the values are determined as if though it were off.
Power Range
The measurement ranges (power ranges) of active power, apparent power, and reactive
power are determined by the wiring system, voltage range, and current range as shown
below. For the actual power range values, see section 4.3, “Setting the Measurement
Range during Direct Input.”
Wiring System Power Range
1P2W (single-phase, two-wire system) Voltage range × current range
1P3W (single-phase, three-wire system)
3P3W (three-phase, three-wire system)
3V3A (three voltage, three current method)
Voltage range × current range × 2
(when the voltage and current ranges on the
elements in the wiring unit are set to the same
range)
3P4W (three-phase, four-wire system) Voltage range × current range × 3
(when the voltage and current ranges on the
elements in the wiring unit are set to the same
range)
2.3 Measurement Conditions
Page 35

2-12
IM 760201-01E
Scaling (See sections 4.5 and 4.6 for operating instructions)
When applying current signals through an external current sensor or applying voltage or
current signals through an external VT (voltage transformer) or CT (current transformer),
the conversion ratio or coefficient can be specified.
When Applying Current Signals through an External Current Sensor
The output of current sensors that output voltage, such as shunts and clamps, can be
applied to the current sensor connector (EXT) and measured. Set how many millivolts
the current sensor transmits when 1 A of current is applied (conversion ratio). Then, the
input signal can be made to correspond to the numeric data or waveform display data
that is obtained when the current is directly applied to the input terminals.
Measurement Function Conversion
Ratio
Data before
Transformation
Transformation
Result
Current I E I
S
(current sensor output) IS/E
Active power P E P
S
PS/E
Apparent power S E S
S
SS/E
Reactive power Q E Q
S
QS/E
Max./Min. current value Ipk E Ipk
S
(current sensor output) IpkS/E
When Applying Voltage or Current Signals through an External VT or CT
• VT ratio and CT ratio
You can convert the input signal into the numeric data or waveform display data of the
voltage or current before transformation by setting the VT ratio, CT ratio, and power
factor (coefficient multiplied to the power determined from the voltage and current).
•
Power factor
By setting the power factor (SF), you can display the measured active power, apparent
power, and reactive power after they have been multiplied by a coefficient.
Measurement Function Data before
Transformation
Transformation Result
Voltage U U
2
(secondary output
voltage of the VT)
U2×V V: VT ratio
Current I I
2
(secondary output of
the CT)
I2×C C: CT ratio
Active power P P
2
P2×V×C×SF SF: Power factor
Apparent power S S
2
S2×V×C×SF
Reactive power Q Q
2
Q2×V×C×SF
Max./Min. voltage value Upk Upk
2
(secondary output
of the VT)
Upk2×V
Max./Min. current value Ipk Ipk
2
(secondary output of
the CT)
Ipk2×C
2.3 Measurement Conditions
Page 36

2-13
IM 760201-01E
Features
2
1
Input Filter (See section 4.8 for operating instructions)
There are two types of input filters. The WT500 makes measurements by synchronizing
to the input signal. Therefore, the frequency of the input signal must be measured
accurately.
Line Filter
The line filter is inserted into the voltage, current, and power measurement input
circuits and directly affects the voltage, current, and power measurements (see the
block diagram in section 2.1). When the line filter is turned on, the measured value
does not contain high frequency components. The voltage, current, and power of
inverter waveforms, strain waveforms, etc., can be measured with their high frequency
components eliminated. You can select the cutoff frequency.
Frequency Filter
The frequency filter is inserted into the frequency measurement input circuit and affects
frequency measurements. It affects the detection of the measurement period for voltage,
current, and power measurements (see section 4.7 and appendix 5). The frequency filter
is also used to accurately detect the zero crossing (see section 2.2 and appendix 5). The
frequency filter is not inserted into the voltage, current, and power measurement input
circuit. Therefore, the measured values include high frequency components even when
the frequency filter is turned on.
Note
The frequency filter is turned on when the line filter is set to 500 Hz.
Data Update Rate (See section 4.9 for operating instructions)
You can select an update interval from 100 ms, 200 ms, 500 ms, 1 s, 2 s, and 5 s.
The numeric data is updated at the selected interval. To capture relatively fast load
fluctuations in the power system, select a fast data update rate. To capture relatively low
frequency signals, select a slow data update rate.
2.3 Measurement Conditions
Page 37

2-14
IM 760201-01E
Averaging (See section 4.10 for operating instructions)
The averaging function is effective when reading of the numeric display is difficult due to
fluctuations. This occurs when the fluctuation of the power supply or the load is large or
when the input signal frequency is low.
During Normal Measurement
Two types of averages are available: exponential averages and moving averages.
• Exponential Average
Numeric data can be exponentially averaged using a specified attenuation constant.
Averaging is performed according to the following equation.
Dn =
(Mn – Dn – 1)
K
Dn – 1 +
Dn: Displayed value that has been exponentially averaged n times. (The first
displayed value D
1
is equal to M1.)
D
n–1
: Displayed value that has been exponentially averaged n–1 times.
M
n
: Measured data at the nth time.
K: Attenuation constant (can be selected from 2, 4, 8, 16, 32, and 64)
•
Moving Average
Numeric data can be linearly averaged using a specified average count. Averaging is
performed according to the following equation.
Dn =
Mn – (m – 1) + •••Mn – 2 + Mn – 1 + Mn
m
Dn: Displayed value obtained by linearly averaging m points of numeric data
from the n–(m–1)
th
to the nth time
M
n−(m–1)
: Measured data at the n–(m–1)th time.
••••••••••••••••••••••••••••••
••••••••••••••••••••••••••••••
M
n–2
: Measured data at the n–2th time.
M
n-1
: Measured data at the n-1st time.
M
n
: Measured data at the nth time.
m: Average count (can be selected from 8, 16, 32, 64, 128, and 256)
During Harmonic Measurement
When exponential averaging is specified, the harmonic measurement functions are
averaged.
When averaging is set to moving average, averaging is only performed on normal
measurement functions, not on harmonic measurement functions.
2.3 Measurement Conditions
Page 38

2-15
IM 760201-01E
Features
2
1
Crest Factor (See section 4.11 for operating instructions)
The crest factor is defined as the ratio of the peak value of the waveform to the rms
value.
Peak value
Rms value
Crest factor (CF) =
Peak value
Rms value
Input signal waveform
The crest factor on the WT500 is determined by the ratio of the maximum peak value
that can be applied for rated input to the measurement range.
Peak value that can be input
Measurement range
Crest factor (CF) =
The crest factor can be set to 3 or 6. The measurable crest factor is as follows:
{measurement range × CF setting (3 or 6)}
Measured value (rms value)
Crest factor (CF) =
* However, the peak value of the input signal must be less than or equal to the maximum
allowable input.
If the crest factor of the measured signal is greater than the specifications of the
measurement instrument (the crest factor defined at the rated input), the signal can be
measured by setting a greater measurement range.
For example, even if CF is set to 3, measurement is possible for signals with a crest
factor greater than or equal to 5 when the measured value (rms value) is less than 60%
of the measurement range.
If the minimum effective input (1% of the measurement range) is being applied at CF = 3,
measurement for CF = 300 is possible.
The voltage range, current range, effective input range, and measurement accuracy vary
depending on the crest factor setting. For details, see chapter 14, “Specifications.”
Hold (See section 4.12 for operating instructions)
The data display of each measurement function can be held. The communication output
data while the display is held is the same as the held numeric data.
Single Measurement (See section 4.12 for operating instructions)
While the display is held, the signal is measured once at the set data update rate, and
then the display is re-held.
2.3 Measurement Conditions
Page 39

2-16
IM 760201-01E
2.4 Power Measurement
When the screen is set to numeric display, measured data such as voltage, current, and
power can be displayed.
Display Resolution
The display resolution for voltage, current, active power, apparent power, reactive power,
and so on is 60000. When the range rating (rated value of the specified measurement
range) is specified, the Σ functions of the voltage, current, active power, apparent power,
reactive power, and so on are set to the decimal place and unit of the element with
the lowest display resolution of the target elements. For information about the display
resolution for integration, see section 5.8.
Numeric Display during Normal Power Measurement (See section 5.1 for
operating instructions)
Selecting the Number of Displayed Items
The number of items can be selected from 4, 8, 16, Matrix, and All Items. Not all of the
data will fit onto a single screen. You can scroll through the displayed items to view data
that is not on the screen.
•
Eight-Item Display Example
Data
Measurement function
• Matrix Display Example
Data
Measurement function
Element and wiring system
• All-Item Display Example
Data
Measurement function
Element and wiring system
Page 40

2-17
IM 760201-01E
Features
2
1
Changing the Displayed Items
You can select a displayed item to change the numeric data that is displayed at that item’
s position.
Change the measurement
function of the third item
Change the element
of the third item
Scrolling through Pages
The numeric display consists of up to nine pages. The number of pages varies depending
on the installed options and the number of displayed items. You can set the displayed
items on each page. The page can be scrolled to switch the page, and the displayed
items can be changed collectively.
Page 1
Page 2
Page 3
Page 4
Display example
Displays the voltage, current,
power, and power factor of
elements 1 to 3 on pages 1 to 3.
Displays the voltage, current,
power, and power factor of
wiring unit Σ on pages 4.
Page bar
The current page is
highlighted.
Resetting the Numeric Display
If the number of displayed items is set 4, 8, 16, or matrix, the display order of
measurement functions can be reset to the factory default configuration.
2.4 Power Measurement
Page 41

2-18
IM 760201-01E
Numeric Display during Harmonic Measurement (See section 6.1 for operating instructions)
In addition to the 4, 8, 16, matrix, and All displays, list displays (the single list and double
list displays) are also available.
Selecting the Number of Displayed Items
Just as in ordinary measurement, the number of items can be selected from 4, 8, 16,
Matrix, and All Items.
List Display
For each measurement function, the numeric data for each harmonic can be displayed in
two columns.
•
Single List
The data of a single measurement function can be divided into even and odd harmonics
and displayed. The selectable measurement functions are U, I, P, S, Q, λ, f, fU, and fI.
Measurement function 1
Data of each harmonic order
Relative harmonic content of each harmonic
(Uhdf, Ihdf, and Phdf are displayed when the
selected measurement function are U, I, and
P, respectively.)
Numeric data of each
harmonic order
Measurement function display
Data related to all harmonics
• Dual List
The data from two different measurement functions can be displayed in two separate
columns. The selectable measurement functions are U, I, P, S, Q, λ, f, fU, and fI.
Measurement function 1
Measurement function 2
Data of each harmonic order
Relative harmonic content of each harmonic
(Uhdf, Ihdf, and Phdf are displayed when the
selected measurement function are U, I, and
P, respectively.)
Numeric data of each
harmonic order
Measurement function display
Data related to all harmonics
Scrolling through Pages
Just as in ordinary measurement, you can scroll through pages one page at a time.
Resetting the Numeric Display
If the number of displayed items is set 4, 8, 16, or matrix, the display order of
measurement functions can be reset to the factory default configuration.
2.4 Power Measurement
Page 42

2-19
IM 760201-01E
Features
2
1
2.5 Computation
The following computations can be performed with the data of measurement functions. In
addition, there is a function that allows you to select the equation used to determine the
measurement function data.
Setting the Equation for Computing Efficiency (See section 5.3 for operating
instructions)
To measure the input/output efficiency of a device, set the equations for η1 and η2.
For example, if the input power to a device is P1 and the output power is PΣ, you can
compute the power conversion efficiency of the device by setting the equation to η =
(PΣ)/(P1) × 100.
Setting the Equation for Computing Apparent Power (See section 5.4 for
operating instructions)
Apparent power is the product of voltage times current. The voltage and current used to
determine the apparent power can be selected from (1) the true rms values explained
under “Determining Voltage and Current” in section 2.2, “Measurement Functions
and Periods”; (2) the rectified mean values calibrated to the rms values; (3) the linear
averages; (4) the rectified mean value calibrated to the rms value of the voltage and the
rms value of the current; and (5) the rms values.
Selecting the Computing Equation for Apparent Power and Reactive Power (See
section 5.4 for operating instructions)
There are three types of power: active power, reactive power, and apparent power.
In general, they are defined by the following equations.
Active power P = UIcosf .............................................................. (1)
Reactive power Q = UIsinf ..........................................................(2)
Apparent power S = UI .................................................................(3)
U = rms voltage; I = rms current; f = Phase difference between voltage and current
The power values are related as follows:
(Apparent power S)
2
= (Active power P)2 + (Reactive power)2 ....(4)
The three-phase power is the sum of the power of each phase.
These definitions only apply for sine waves. The measured values for apparent power
and reactive power vary for distorted waveform measurement depending on which of the
above definitions are combined for the computation. Because the equations for deriving
the power for distorted waveforms are not defined, none of the equations can be said
to be more correct than the other. Therefore, the WT500 provides three equations for
determining the apparent power and reactive power.
Unlike apparent power and reactive power, active power is derived directly from the
sampled data, so errors resulting from different definitions do not occur.
Type 1 (The method used in the normal mode of conventional WT series
power meters)
The apparent power of each phase is calculated using equation 3, and the reactive
power of each phase is calculated using equation 2. The results are summed to derive
the power.
Active power for a three-phase, four-wire system
PΣ = P1 + P2 + P3
Apparent power for a three-phase, four-wire system SΣ = S1 + S2 + S3( = U1×I1 +
U2 × I2 + U3 × I3)
Reactive power for a three-phase, four-wire system
QΣ = Q1 + Q2 + Q3
(= s1×
(U1 × I1)
2
– P12 + s2 × (U2 × I2)2 – P22 + s3 × (U3 × I3)2 – P32)
The sign for s1, s2, and s3 is positive when the current leads the voltage and negative
when the current lags the voltage.
Page 43

2-20
IM 760201-01E
Type 2
The apparent power of each phase is determined from equation 3, and the results are
added to derive the three-phase apparent power. The three-phase reactive power is
calculated from the three-phase apparent power and the three-phase active power using
equation 4.
Active power for a three-phase, four-wire system
PΣ = P1 + P2 + P3
Apparent power for a three-phase, four-wire system
SΣ = S1 + S2 + S3( = U1×I1 +
U2 × I2 + U3 × I3)
Reactive power for a three-phase, f
our-wire system
Q3=
S3
2
– P3
2
Type 3 (The method used in the harmonic measurement mode of the
WT1600, the PZ4000, and the WT3000)
The reactive power of each phase is calculated directly using equation 2. The threephase apparent power is calculated using equation 4. This equation can be selected on
models with the harmonic measurement option.
Active power for a three-phase, four-wire system
PΣ = P1 + P2 + P3
Apparent power for a three-phase, four-wire system
S3=
P3
2
+ Q3
2
Reactive power for three-phase, four-wire system QΣ = Q1 + Q2 + Q3
Phase Difference (See section 5.5 for operating instructions)
You can select the format for displaying the voltage and current phase differences
between and within each element. With the voltage of each element as a reference, one
format displays the phase difference using 360° in the clockwise direction, and the other
format displays lead up to 180° in the counterclockwise direction (D) and lag up to 180°
in the clockwise direction (G). In harmonic measurement (optional), the phase differences
between harmonics 1 to 50 of the voltage and current signals are displayed using a 360°
format or a 180° format with no sign for lead and a negative sign for lag.
User-Defined Functions (See section 5.13 for operating instructions)
Equations can be created (defined) by combining the measurement function symbols and
operators. The numeric data that corresponds to the equation can then be determined.
The combination of a measurement function and an element number, “Urms1:URMS(E1)”
for example, constitutes an operand. Eight equations (F1 through F8) can be defined.
Operators
There are 11 operators: +, –, *, /, ABS (absolute value), SQR (square), SQRT (square
root), LOG (logarithm), LOG10 (common logarithm), EXP (exponent), and NEG (negation).
Number of Operands
There can be up to 16 operands in one equation.
MAX Hold (See section 5.14 for operating instructions)
The maximum value of a type of numeric data can be held. The measurement functions
that the MAX hold is applied to are selected from the user-defined functions.
Setting the Average Active Power (See section 5.15 for operating instructions)
The average active power can be computed for devices, such as intermittent control
devices, whose power fluctuates. The equation for computing the average active power
is specified using a user-defined function.
2.5 Computation
Page 44

2-21
IM 760201-01E
Features
2
1
Delta Computation (Optional; See section 5.17 for operating instructions)
The sum or difference of the instantaneous voltage or current values (sampled data)
between the elements in a wiring unit can be used to determine various types of
data such as the differential voltage and phase voltage. This operation is called delta
computation.
Delta computation can be applied in the following ways:
•
The differential voltage and differential current between two elements can be
computed on a single-phase, three-wire system or on a three-phase, three-wire
system (when using two elements).
•
The line voltage and phase current that are not measured can be computed on
a single-phase, three-wire system or on a three-phase, three-wire system (when
using 2 elements).
T
R
ST
R
S
• Using the data from a three-phase, four-wire system, the data of a delta
connection can be computed from the data of a star connection (star-delta
transformation).
R
ST
R
ST
• Using the data from a three-phase, three-wire system (three-voltage, threecurrent method), the data of a star connection can be computed from the data of
a delta connection (delta-star transformation). This function is useful when you
wish to observe the phase voltage of an object that has no neutral line.
R
ST
R
ST
Equations for Computing the Distortion Factor (See section 6.5 for operating
instructions)
Models with the harmonic measurement option can compute distortion factors. There are
two equations for computing the distortion factor, each with different denominators. For
information about these equations, see appendix 1.
2.5 Computation
Page 45

2-22
IM 760201-01E
2.6 Integration
The WT500 can integrate the active power (watt hour), the current (ampere hour), the
apparent power (volt-ampere hour), and the reactive power (var hour) values. During
integration, the measured and computed values of normal measurements can be
displayed in addition to the watt hour, ampere hour, volt-ampere hour, var hour, and
integration time values.
Integration Functions
Input Element Measurement Functions
The following nine types of numeric data can be determined. For details about the
determination of measurement function data, see appendix 1.
(1) WP: watt hours, i.e., the sum of positive and negative watt hours, (2) WP+: positive
watt hours consumed, (3) WP-: negative watt hours returned to the power supply, (4)
q: ampere hours, i.e., the sum of positive and negative ampere hours, (5) q+: positive
ampere hours consumed, (6) q-: negative ampere hours returned to the power supply, (7)
WS: volt-ampere hours, (8) WQ: var hours, and (9) Time: integration time.
•
Watt Hour Integration Method for Each Polarity (See section 5.11 for operating
instructions)
For positive and negative watt hours, WP+ and WP-, you can
set the integration
equation to determine the DC or AC watt hours. (DC watt hours are computed by
integrating each sampled data item. AC watt hours are computed by integrating the
values at each data update interval.)
•
Current Integration Modes (See section 5.12 for operating instructions)
You can select the type of current whose values will be integrated.
Wiring UnitΣ Measurement Functions (Σ Functions)
The following eight types of numeric data can be determined. For details about the
determination of measurement function data, see appendix 1.
(1) WPΣ: sum of WP values, (2) WP+Σ: sum of WP+ values, (3) WP-Σ: sum of WPvalues, (4) qΣ: sum of q values, (5) q+Σ: sum of q+ values, (6) q-Σ: sum of q- values, (7)
WSΣ: sum of SΣ values, and (8) WQΣ: sum of QΣ values.
Page 46

2-23
IM 760201-01E
Features
2
1
Integration Mode (See sections 5.6 and 5.7 for operating instructions)
The integration feature has five modes: manual integration mode, normal integration
mode, continuous integration mode, real-time integration mode, and real-time continuous
integration mode.
Manual Integration Mode
Integration continues from when you start it until you stop it. However, when the
integration time reaches its maximum (10000 hours) or the integrated value reaches
its maximum or minimum displayable value (see section 5.6 for details), integration is
stopped, and the integration time and integrated value at that point are held.
Integration time
ResetStart
Integrated value
Stop Start Reset
Hold
Hold
Hold
Hold
When STOP is
pressed or the
maximum
integration
time is reached
When the
integrated value
upper limit is reached
Normal Integration Mode
Integration continues for a specified amount of time (which is determined by the timer
setting), and then stops. However, if the integrated value reaches its maximum or
minimum displayable value before the specified amount of time has elapsed, integration
is stopped, and the integration time and integrated value at that point are held.
Integration time
ResetStart
Integrated value
Hold
Hold
Timer value
2.6 Integration
Page 47

2-24
IM 760201-01E
Continuous Integration Mode
Integration continues for a specified amount of time, and then resets and starts again.
Integration repeats until you press STOP. If the integrated value reaches its maximum or
minimum displayable value before the specified amount of time has elapsed, integration
is stopped, and the integration time and integrated value at that point are held.
Start
Reset
Integration time
Integrated value
Hold
Hold
Timer
value
Timer
value
Timer
value
Press
STOP
Real-Time Normal Integration Mode
You specify the dates and times when integration will start and end. When the specified
stop time is reached, or when the integrated value reaches its maximum or minimum
displayable value, integration is stopped, and the integration time and integrated value at
that point are held.
Integration time
Integrated value
Hold
Hold
Start
date/time
End
date/time
Reset
2.6 Integration
Page 48

2-25
IM 760201-01E
Features
2
1
Real-Time Continuous Integration Mode (Continuous integration)
You specify the dates and times when integration will start and end, and integration
repeats within the start and end times at the interval specified by the timer. When the
amount of time specified by the timer elapses, integration resets and starts again. When
the specified stop time is reached, or when the integrated value reaches its maximum
or minimum displayable value, integration is stopped, and the integration time and
integrated value at that point are held.
Integration time
Integrated value
Hold
Hold
Timer
value
Timer
value
Timer
value
Start
date/time
End
date/time
Reset
2.6 Integration
Page 49

2-26
IM 760201-01E
2.7 Waveform Display
The WT500 displays waveforms based on the data sampled within the data update rate.
Selecting the Waveform to Display (See section 3.7 for operating instructions)
You can select whether to show or hide the voltage and current waveforms of each
input element. This makes waveforms easier to see by allowing you to only show the
waveforms that you want to examine.
Vertical (Amplitude) Axis
The range of the vertical display is based on the specified measurement range. For
example, if the crest factor is set to 3 and the voltage measurement range is set to 100
Vrms, the display range is set so that the top of the screen is 300 Vpk (100 Vrms × 3)
and so that the bottom is –300 Vpk (–100 Vrms × 3), with the zero input line at the center.
If the crest factor is set to 6 and the voltage measurement range is set to 50 Vrms, the
display range is set so that the top of the screen is 300 Vpk (50 Vrms × 6) and so that the
bottom is –300 Vpk (–50 Vrms × 6), with the zero input line at the center. The waveform
is clipped if this range is exceeded.
1 grid division
= 300 V
1 grid division
= 100 V
When measured with a
measurement
range of 100 Vrms
When the same signal is
measured with a measurement
range of 300 Vrms
Input zero
line
300 Vpk
–300 Vpk
900 Vpk
–900 Vpk
Horizontal (Time) Axis (See section 7.4 for operating instructions)
Set the length of the horizontal axis by specifying the time per grid division. The time axis
can be set up to the point in which the time corresponding to one screen is equal to the
data update rate, in 1, 2, 5 steps. For example, if the data update rate is 500 ms, the time
per division can be changed in this order: 1 ms > 2 ms > 5 ms > 10 ms > 20 ms > 50 ms.
In this case, the time corresponding to one screen changes in this order: 10 ms > 20 ms
> 50 ms > 100 ms > 200 ms > 500 ms.
1 grid division = 10 ms
1 grid division = 20 ms
100 ms
(Observation time)
200 ms
(Observation time)
Page 50

2-27
IM 760201-01E
Features
2
1
Note
• Waveform sampling data and waveform display data (the number of displayed points
on the screen)
Waveform sampling data and waveform display data are both measured waveform data, but
they differ as described below.
Waveform sampling data: Data derived through A/D conversion of the input signal
The WT500 A/D conversion rate is approximately 100 kS/s. Therefore, if the data update
rate is set to 1 s, the number of data points sampled from a single input signal in a single
measurement is approximately 100000 (see the figure below). Waveform sampling data is
also called acquisition data or raw wave data.
Waveform display data: Waveform data displayed on the WT500 screen (1002 points)
When displaying waveforms on the WT500, data points are displayed in horizontal rasters
(along the time axis). The number of rasters is 501. Each raster contains two points of
waveform display data. The two data points are the maximum and minimum values of the
waveform data in each raster. Therefore, the number of waveform display data points (the
number of points displayed on the screen) for a single input signal is 1002.
Extraction of waveform display data from waveform sampling data (p-p compression)
This example assumes that a 2-Hz sine wave is measured at a data update rate of 1 s.
To display this waveform on the WT500 screen, the number of data points is converted
from approximately 100000 to 1002 (501 pairs of maximum and minimum values). Thus,
two points (a pair) of waveform display data are derived from approximately 200 points
of waveform sampling data. This conversion is called p-p (peak-peak) compression. The
compression rate of p-p compression varies depending on the data update rate and the
horizontal scale (time axis) of the WT500 waveform display.
501 rasters
Number of data points:
1002 (501 pairs)
0 500
Time axis
Waveform sampling data
Waveform display data
(WT500 screen)
p-p compression
Compresses approximately 200 points of
waveform sampling data to 2 points
(Extracts the maximum and minimum
values and draws them in each raster)
A/D-converted data
1 s
Number of data points:
Approx. 100000
With display
interpolation
on
Vertical axis
2.7 Waveform Display
Page 51

2-28
IM 760201-01E
• Aliasing
When the sample rate is low compared to the frequency of the input signal, the high
frequency components of the signal are lost. In accordance with the Nyquist sampling
theorem, the high frequency components in the signal are misread as low frequency
components. This is called aliasing.
Aliased signal Input signal Sampled points
• Sampling of waveform display data
The WT500 samples waveform display data and stores it to memory at a rate of
approximately 100 kS/s. The WT500 can accurately display the waveforms of signals with
frequencies up to approximately 5 kHz.
2.7 Waveform Display
Page 52

2-29
IM 760201-01E
Features
2
1
Trigger (See section 7.5 for operating instructions)
A trigger is said to have “occurred” when the specified trigger condition is met and a
waveform is displayed on the screen.
Trigger Mode
The trigger mode specifies the conditions for updating the display.
• Auto Mode
If a trigger occurs within a set amount of time (about 100 ms), which is referred to as
the timeout period, the waveform display is updated. If the timeout period elapses
without a trigger occurring, the display will be updated automatically.
•
Normal Mode
The display is only updated when the trigger occurs. If the trigger does not occur, the
display will not be updated.
Trigger Source
The trigger source is the signal that is used to check for the trigger condition.
Trigger Slope
Slope refers to the movement of the signal from a low level to a high level (rising edge)
or from a high level to a low level (falling edge). When the slope is used as one of the
trigger conditions, it is called a trigger slope.
Trigger Level
The trigger level is the level at which the trigger slope is determined.
When the trigger source passes through the specified trigger level on a rising or falling
edge, a trigger occurs. You can select the input signal from any element or from the
external clock signal as the trigger source.
Trigger level
When set to rising ( ),
the trigger occurs here (trigger point)
Trigger source
Trigger Point
The trigger point is the point at which a trigger occurs. The trigger point is always
displayed at the left end of the screen. After the trigger is activated, the waveform display
continues from the left of the screen to the right of the screen with the passage of time.
Trigger point
Time
2.7 Waveform Display
Page 53

2-30
IM 760201-01E
Vertical Waveform Zoom (See section 7.6 for operating instructions)
Each displayed waveform can be scaled vertically by a zoom factor of 0.1 to 100. The
waveform is scaled around the zero-input line.
150 Vpk
300 Vpk
–150 Vpk
–300 Vpk
300 Vpk
–300 Vpk
Input zero
line
When the zoom factor is doubled
Range displayed
on the screen
Vertical Waveform Position (See section 7.6 for operating instructions)
You can vertically shift the displayed position of a waveform. This is useful when you
want to view the relationship between voltage and current waveforms, or when the
section of the waveform that you want to view does not fit into the display frame.
100%
–100%
Position moved
by 50%
Position moved
by –50%
2.7 Waveform Display
Page 54

2-31
IM 760201-01E
Features
2
1
Split Waveform Display and Assignment (See section 7.7 for operating
instructions)
The screen can be divided into windows, and waveforms can be assigned to those
windows. The screen can be divided into up to four windows. This function is useful
when there are many waveforms and it is difficult to view them all in a single display.
Waveforms can be assigned to windows in one of the following three ways.
•
Auto
The waveforms whose displays are turned on are assigned in order according to
their element numbers, with an element’s voltage waveform coming before its current
waveform.
•
Fixed
Regardless of whether their displays are on or off, waveforms are assigned in order
according to their element numbers, with an element’s voltage waveform coming
before its current waveform.
•
User
Waveforms can be assigned to windows by the user, regardless of whether their
displays are on or off.
Waveform Display Interpolation (See section 7.8 for operating instructions)
The waveform display data can be connected linearly to display the waveform smoothly.
Linear Interpolation
Fills in the space between two data points with a straight line.
Interpolation OFF
No interpolation is performed. Only the data points are displayed.
Graticule (See section 7.8 for operating instructions)
A grid or cross-hair can be displayed on the screen. You can also choose to not display a
grid or cross-hair.
Scale Value Display (See section 7.8 for operating instructions)
You can turn on or off the display of the upper and lower limits of the vertical axis and the
values at the left and right ends of the horizontal axis (time axis) of each waveform.
2.7 Waveform Display
Page 55

2-32
IM 760201-01E
Waveform Label Display (See section 7.8 for operating instructions)
You can turn the display of waveform labels on or off.
Time at the right end
of the screen
Time at the left end of the screen
Minimum values
Maximum values
Waveform labels
Cursor Measurement (See sections 7.9 and 8.10 for operating instructions)
The value at the crossing point of the waveform and cursor can be measured and
displayed. The voltage or current at specific sections of the waveform and the data on
the horizontal axis (X-axis) can be measured. Cursor measurements are performed on
the data that is displayed on the screen.
Two cursors, marked by a plus sign and an x, appear on the screen. For each cursor, the
vertical value can be measured, and the X-axis value relative to the left end of the screen
can be measured. The differences between the cursor’s vertical values and X-axis values
can also be measured.
Measured values
+ cursor
x cursor
2.7 Waveform Display
Page 56

2-33
IM 760201-01E
Features
2
1
2.8 Trend, Bar Graph, and Vector Displays
Trends of each measurement function, bar graphs of each harmonic, and vectors of the
fundamental signals of each element (when using the harmonic measurement option)
can be displayed.
Trend Display
The trends of all measurement functions that are measured during normal measurement
and harmonic measurement are displayed.
Voltage (Urms1) trend
Voltage (U1) frequency
trend
Trend Display Data
When the sampling of waveform display data is off during normal measurement, the
numeric data of measurement functions that are determined at each data update interval
is P-P compressed for each display segment (raster) and made into trend display data.*
When the sampling of waveform display data is on during normal measurement, the
numeric data of measurement functions that are determined whenever a trigger occurs is
P-P compressed for each display segment (raster) and made into trend display data.*
* In some cases, P-P compression is not performed.
Scale Settings (See section 8.5 for operating instructions)
The WT500 can automatically set the values at the top and bottom of the screen based
on the maximum and minimum values of the trend display data (this is referred to as auto
scaling). The values at the top and bottom of the screen can also be set manually (manual
scaling).
Horizontal (Time) Axis (See section 8.6 for operating instructions)
The time per division can be set in the range of 3 s to 1 day.
Split Display and Window Assignment (See section 8.7 for operating
instructions)
Up to eight trends, T1 to T8, can be displayed. You can set trends T1 to T8 to any
measurement function for any element. In harmonic measurement, you can also set the
trends to harmonic orders.
You can also divide the screen into as many as four windows, and each trend whose
display is turned on will be assigned in numeric order to one of these windows.
Display Interpolation, Graticule, Scale Value Display, and Label Display (See
section 8.8 for operating instructions)
The settings specified for waveform display are used.
Page 57

2-34
IM 760201-01E
Bar Graph Display of Harmonic Data (See section 6.7 for operating instructions)
On models with the harmonic measurement option, you can display harmonics using bar
graphs. The harmonic orders are lined up on the horizontal axis, and the vertical axis
represents the amplitude of each harmonic. You can choose which harmonic function,
element, and orders to display. The selectable harmonic measurement functions are U, I,
P, S, Q, λ, f, fU, and fI.
Bar graph of voltage U1
Bar graph of current I1
Vector Display of Harmonic Data (See section 6.8 for operating instructions)
On models with the harmonic measurement option, you can select a wiring unit to
display vectors of the phase differences and amplitudes (rms values) of the fundamental
signals, U(1) and I(1), in each element in the unit. The positive vertical axis is set to zero
(angle zero), and the vector of each input signal is displayed. You can also zoom in on
vectors or display amplitude values and the phase difference values between signals
simultaneously.
The vector display is shown on the next page.
The elements whose vectors are displayed vary depending on the number of installed
input elements and the selected wiring pattern.
The following explanation is of the vector assignments when the number of input
elements is three and when the wiring system of wiring unit Σ is set to three-phase, fourwire.
The vectors of elements 1, 2, and 3 are displayed. Vectors 1, 2, and 3 correspond to
elements 1, 2, and 3, respectively. The relationships between the phase differences and
amplitudes of U1(1), U2(1), U3(1), I1(1), I2(1), and I3(1) are displayed as vectors.
2.8 Trend, Bar Graph, and Vector Displays
Page 58

2-35
IM 760201-01E
Features
2
1
I1(1)
I3(1)
I2(1)
F2(1)
F1(1),
FU1-I1
F3(1)
FU1-U3
U1(1)
I1(1)
I3(1)
U3(1)
I2(1)
U2(1)
FU1-U2
FU1-I3
FU1-I2
• Vector Display When the Wiring System Is 3P3W (3V3A; Three-voltage, three-current)
U1(1), U2(1), and U3(1) are line voltages. I1(1), I2(1), and I3(1) are line currents.
By moving the vectors U1(1),
U2(1), and U3(1) so that the
starting points of all vectors
are at the origin O, the phase
relationship can be observed
in the same fashion as the
3P4W system.
(The WT500 does not provide a
function for moving the vectors.)
O
U1(1)
I1(1)
I3(1)
U3(1)
I2(1)
U2(1)
• Vector Display When the Wiring System Is 3P3W (Three-phase, three-wire)
U1(1), U2(1), and U3(1) are line voltages. I1(1), I2(1), and I3(1) are line currents.
However, U3(1) and I3(1) are not actually measured for the 3P3W system.
The vectors are displayed through computation.
O
F2(1)
F1(1),
FU1-I1
F3(1)
FU1-U3
FU1-I2
U1(1)
I1(1)
I3(1)
U3(1)
I2(1)
U2(1)
FU1-U2
FU1-I3
• Vector Display When the Wiring System Is 3P4W (Three-phase, four-wire)
U1(1), U2(1), and U3(1) are phase voltages. I1(1), I2(1), and I3(1) are line currents.
U1(1)
U3(1)
U2(1)
FU1-U2
FU2-U3
FU3-U1
The phase difference between the line voltages
can be determined from the phase difference
measurement functions
FU1-U2 and FU1-U3.
FU1-U2 = Measurement function FU1-U2
FU2-U3=(FU1-U3) – (FU1-U2) – 180
FU3-U1=–(FU1-U3)
2.8 Trend, Bar Graph, and Vector Displays
Page 59

2-36
IM 760201-01E
2.9 Saving and Loading Data, and Other Miscellaneous Functions
Storage (See chapter 9 for operating instructions)
Numeric data can be stored to the WT500 internal memory or USB memory. The data is
stored at the data update rate or at a specified time interval.
Saving and Loading from the Storage Medium (See chapter 10 for operating
instructions)
The WT500 has USB ports (for peripheral devices). You can save numeric data,
waveform display data, screen image data, and setup parameters to USB memory. You
can load saved setup parameters as necessary. Also, you can insert image data into
documents in a word-processing application.
PC
USB memory
ESC
RESET
SET
CAL
PAGE
PAGE
ELEMENT
1
2
3
ELEMENT
ALL
RANGE
VOLTAGE CURRENT
AUTO AUTO
DISPLAY
NUMERIC WAVE OTHERS
FORM ITEM
CURSOR
INTEGRATOR
SETUP
INPUT INFO
START/
STOP
RESET
HOLD
SINGLE
SHIFT
MISC
NULL
LOCAL
KEY LOCK
FILE IMAGE
MENU
STORE
STORE SET
POWER
WT500
How WT500 Numeric Data and Waveform Display Data Can Be Transferred to a Personal
Computer
WT500
PC
Save
Load
1 Data acquisition using USB, Ethernet (optional), or GP-IB (optional)
2 Data acquisition using USB memory
Online
1
Offline
2
WT Viewer
Binary format
(*.wta)
Microsoft Excel
CSV format
(*.csv)
ASCII format (*.CSV)
Data stored in binary format
(*.WTS and *.HDS)
Internal RAM disk
Save
Save
USB storage
Numeric display data
Numeric display data
Waveform display data
Waveform display data
Store
Store
Page 60

2-37
IM 760201-01E
Features
2
1
Ethernet Interface (Optional) (See chapter 11 for operating instructions)
Using the FTP server function, you can access the WT500 from an FTP client* on the
network and retrieve files from the WT500 internal memory or USB storage.
* PC or workstation with FTP client features.
PC
File
ESC
RESET
SET
CAL
PAGE
PAGE
ELEMENT
1
2
3
ELEMENT
ALL
RANGE
VOLTAGE CURRENT
AUTO AUTO
DISPLAY
NUMERIC WAVE OTHERS
FORM ITEM
CURSOR
INTEGRATOR
SETUP
INPUT INFO
START/
STOP
RESET
HOLD
SINGLE
SHIFT
MISC
NULL
LOCAL
KEY LOCK
FILE IMAGE
MENU
STORE
STORE SET
POWER
WT500
USB, GP-IB (Optional), and Ethernet (Optional) Communication (See the
Communication Interface User’s Manual IM760201-17E)
You can transfer measured data to a PC through a standard-equipped USB port, the
optional GP-IB interface, or the optional Ethernet interface and analyze it on the PC. You
can also make measurements by using an external controller to control the WT500.
PC
Communication
interface
ESC
RESET
SET
CAL
PAGE
PAGE
ELEMENT
1
2
3
ELEMENT
ALL
RANGE
VOLTAGE CURRENT
AUTO AUTO
DISPLAY
NUMERIC WAVE OTHERS
FORM ITEM
CURSOR
INTEGRATOR
SETUP
INPUT INFO
START/
STOP
RESET
HOLD
SINGLE
SHIFT
MISC
NULL
LOCAL
KEY LOCK
FILE IMAGE
MENU
STORE
STORE SET
POWER
WT500
Entering Values and Strings on a USB Keyboard (See section 3.15 for operating
instructions)
You can connect a USB keyboard to a USB port and enter file names, comments, and so
on.
USB keyboard
ESC
RESET
SET
CAL
PAGE
PAGE
ELEMENT
1
2
3
ELEMENT
ALL
RANGE
VOLTAGE CURRENT
AUTO AUTO
DISPLAY
NUMERIC WAVE OTHERS
FORM ITEM
CURSOR
INTEGRATOR
SETUP
INPUT INFO
START/
STOP
RESET
HOLD
SINGLE
SHIFT
MISC
NULL
LOCAL
KEY LOCK
FILE IMAGE
MENU
STORE
STORE SET
POWER
WT500
Initialization (See section 3.13 for operating instructions)
All setting made using panel keys and soft keys can be restored to their factory default
settings. For information about the initial settings, see appendix 2, “List of Initial Settings
and Numeric Data Display Order.”
2.9 Saving and Loading Data, and Other Miscellaneous Functions
Page 61

2-38
IM 760201-01E
Selecting the Message Language (See section 3.18 for operating instructions)
You can set the language of the error messages displayed on the screen during
operation to English or Japanese.
Selecting the Menu Language (See section 3.18 for operating instructions)
You can set the language of the menus displayed on the screen to English or Japanese.
RGB Video Signal (VGA) Output (Optional) (See section 12.2 for operating
instructions)
The RGB video signal (VGA, Video Graphics Array) can be output to an external monitor.
This allows values and waveforms to be displayed on a large screen.
Zero-Level Compensation (See section 12.3 for operating instructions)
Zero-level compensation is when the WT500 creates a zero input condition in its internal
circuitry and sets the level at that point to the zero level. Zero-level compensation
must be performed to satisfy the specifications of this instrument (see chapter 14).
Zero level compensation is automatically performed when the measurement range or
input filter is changed. However, when the measurement range and input filter are not
changed over an extended time, the zero level may change due to the changes in the
environment surrounding the instrument. In such cases, you can manually perform
zero-level compensation. There is also a function that automatically performs zero-level
compensation during integration.
NULL Feature (See section 12.4 for operating instructions)
When the NULL feature is turned on, the Udc and Idc values (numeric data of the simple
average of the voltage and current) are set as NULL values. The NULL values are
subtracted from the sampled voltage and current values. All measurement functions are
affected by the NULL values.
Setting the Key Lock or Shift Lock (See section 12.5 for operating instructions)
The key lock can be used to prevent inadvertent operation errors. The shift lock can be
used to reduce the number of times you press SHIFT.
Master/Slave Synchronized Measurement (See section 12.6 for operating
instructions)
The measurement of two WT500s can be synchronized by making one WT500 the
master and the other WT500 the slave. The master outputs a measurement start signal,
and the slave receives the signal.
System Condition Check (See section 13.4 for operating instructions)
You can view information about the WT500, such as the model, firmware version (ROM
version), input element configuration, and installed options.
Self-Test Feature (See section 13.3 for operating instructions)
The WT500 can evaluate its internal memory (RAM) and panel keys to determine if they
are working properly.
2.9 Saving and Loading Data, and Other Miscellaneous Functions
Page 62

3-1
IM 760201-01E
Before You Start Measuring
3
2
1
3.1 Handling Precautions
Safety Precautions
If you are using this instrument for the first time, make sure to thoroughly read “Safety
Precautions,” on pages vi and vii.
Do Not Remove the Case
Do not remove the case from the instrument. Some parts of the instrument use high
voltages and are extremely dangerous. For internal inspection and adjustment, contact
your nearest YOKOGAWA dealer.
Unplug If Abnormal Behavior Occurs
If you notice smoke or unusual odors coming from the instrument, immediately turn
off the power and unplug the power cord. Also, turn off the power to any circuits under
measurement that are connected to the input terminals. Then, contact your nearest
YOKOGAWA dealer.
Do Not Damage the Power Cord
Nothing should be placed on top of the power cord, and it should be kept away from any
heat sources. When removing the plug from the power outlet, do not pull on the cord.
Pull from the plug. If the power cord is damaged, purchase a replacement with the same
part number as the one indicated on page iv.
Chapter 3
Before You Start Measuring
Page 63

3-2
IM 760201-01E
General Handling Precautions
Do Not Place Objects on Top of the Instrument
Never stack the instrument or place other instruments or any objects containing water on
top of it. Doing so may damage the instrument.
Keep Electrically Charged Objects Away from the Instrument
Keep electrically charged objects away from the input terminals. They may damage the
internal circuitry.
Do Not Damage the LCD
Because the LCD is very vulnerable and can be easily scratched, do not allow any sharp
objects near it. Also, do not apply vibration or shock to it.
Unplug during Extended Non-Use
Turn off the power to the circuit under measurement and the instrument and remove the
power cord from the outlet.
Carry the Instrument Properly
First, turn off the circuit under measurement and remove the measurement cables. Then,
turn off the instrument and remove the power cord and any attached cables. When
moving the instrument, hold the handles on each side as shown below.
POWER
FILE
IMAGE
MENU
STORE
STORE SET
DISPLAY
NUMERIC
WAVE
OTHERS
FORM ITEM
CURSOR
INTEGRATOR
SETUP
INPUT INFO
START/
STOP
RESET
HOLD
SINGLE
SHIFT
MISC
NULL
LOCAL
KEY LOCK
ELEMENT
1
2
3
ELEMENT
ALL
RANGE
VOLTAGE CURRENT
AUTO AUTO
ESC
RESET
SET
CAL
PAGE
PAGE
When Cleaning the Instrument
When cleaning the case or the operation panel, turn off the circuit under measurement
and the instrument and remove the instrument’s power cord from the outlet. Then,
wipe the instrument lightly with a clean dry cloth. Do not use volatile chemicals such as
benzene or thinner, because they might cause discoloring and deformation.
3.1 Handling Precautions
Page 64

3-3
IM 760201-01E
Before You Start Measuring
3
2
1
3.2 Installing the Instrument
Installation Conditions
Install the instrument in an indoors environment that meets the following conditions.
Flat, Even Surface
Install the instrument on a surface that is flat and even in all directions. If you install the
instrument on an uneven or tilted surface, the accuracy of its measurements may be
impeded.
Well-Ventilated
Inlet holes are located on the top and vent holes are located on the bottom of the
instrument. To prevent internal overheating, allow at least 20 mm of space around the
inlet and vent holes.
When connecting measurement wires and other various cables allow extra space for
operation.
Appropriate Ambient Temperature and Humidity
Ambient temperature: 5 to 40°C
Ambient humidity: 20 to 80% RH
No matter what the circumstances, there must be no
condensation.
Do not install the instrument in the following kinds of places.
• In direct sunlight, or near sources of heat
• In an environment with excessive amounts of soot, steam, dust, or corrosive gases
• Near strong magnetic fields
• Near high voltage equipment or power lines
• In a place that is subject to large levels of mechanical vibration
• On an u
nstable surface
Note
• For the most accurate measurements, use the instrument in the following kind of
environment.
Ambient temperature: 23 ± 5°C Ambient humidity: 30 to 75%RH (no condensation)
When using the instrument in a place where the ambient temperature is 5 to 18°C or 28 to
40°C, add the temperature coefficient to the accuracy as specified in chapter 14.
• When installing the instrument in a place where the ambient humidity is 30% or below, take
measures to prevent static electricity such as using an anti-static mat.
• Condensation may form when the instrument is moved from a low temperature/humidity
environment to a high temperature/humidity environment, or when there is a sudden change
in temperature. In these kinds of circumstances, wait for at least an hour before using the
instrument, to acclimate it to the surrounding temperature.
Storing the Instrument
When storing the instrument, avoid the following kinds of places.
• Where the relative humidity is 80% or higher
• Where the level of mechanical vibration is high
• In direct sunlight
• Where there are corrosive or explosive gasses
• Where the temperature is 60°C or higher
• Where an excessive amount of soot, dust, salt, or iron is present
• Near a strong source of heat or moisture
• Where water, oil, or chemicals may splash
We recommend that the instrument be stored in an environment where the temperature
is between 5 and 40°C and the relative humidity is between 20 and 80% RH.
Page 65

3-4
IM 760201-01E
Installation Position
Desktop
Place the instrument on a flat, even surface as shown in the figure below. If the
instrument is installed in a horizontal position, rubber stoppers can be attached to the
feet to prevent the instrument from sliding. One set of rubber feet (two feet) are included
in the package. Do not install the instrument in positions other than the left two positions
indicated below.
Mounting in a Rack
To mount the instrument in a rack, use the separately sold rack mount kit.
Part Name Model Note
Rack mount kit (for single mount) 751533-E4 for EIA
Rack mount kit (for multiple mount) 751534-E4 for EIA
Rack mount kit (for single mount) 751533-J4 For JIS
Rack mount kit (for multiple mount) 751534-J4 For JIS
An outline of the attachment procedures is given below. For detailed procedures, see the
instructions that are included with the rack mount kit.
1.
Remove the handles from the left side of the instrument.
2.
Remove the four feet from the bottom of the instrument.
3.
Remove the two plastic rivets and the four seals covering the rack mount
attachment holes on each side of the instrument near the front.
4.
Place seals over the feet and handle attachment holes.
5.
Attach the rack mount kit.
6.
Mount the instrument on the rack.
LINK/
ACT
100 LINK
ETHERNET 100BASE -TX ON
LY
USB
VIDEO-OUT
(
VGA
)
100-240 V A C
50 VA MAX
50/60 Hz
EXT
MAX
MAX
TO
CAT
II
MINALS
AX
CLK
88
)
Note
• When mounting the instrument to a rack, allow at least 20 mm of space around the inlet and
vent holes to prevent internal heating.
• Make sure to provide adequate support from the bottom of the instrument while avoiding
blocking the inlet and vent holes.
3.2 Installing the Instrument
Page 66

3-5
IM 760201-01E
Before You Start Measuring
3
2
1
3.3 Connecting the Power Supply
Before Connecting the Power Supply
To avoid electric shock and damage to the instrument, follow the precautions below.
WARNING
• Confirm that the power source voltage matches the instrument’s rated power
source voltage before connecting the power cord.
•
Confirm that the power switch is off before connecting the power cord.
•
To prevent fire and electric shock, use the power cord supplied by YOKOGAWA.
• To prevent electric shock, make sure to
ground the instrument. Insert the
instrument’s power cord into a grounded three-prong outlet.
•
Do not use an ungrounded extension cord. If you do, the device will not be
grounded.
•
Use an AC outlet that matches the power cord provided, and make sure that the
instrument is properly grounded. If an appropriate AC outlet is unavailable and
protective grounding cannot be furnished, do not use the instrument.
Connecting the Power Cord
1.
Check that the power switch is off.
2.
Connect the instrument’s power cord to the power inlet on the rear panel.
3.
Connect the plug on the other end of the power cord to an outlet that meets the
conditions below. The AC outlet must be a three-prong outlet with a protective
earth ground terminal.
Item Specification
Rated supply voltage 100 to 240 VAC
Permitted supply voltage range 90 to 264 VAC
Rated supply frequency 50/60 Hz
Permitted supply voltage frequency range 48 to 63 Hz
Maximum power consumption 80 VA
*
The instrument can use a 100-V or a 200-V power supply. Check that the voltage supplied to
the instrument is less than or equal to the maximum rated voltage of the power cord provided
with the instrument before using it (see page iii for the maximum rated voltage).
3-prong outlet
Power cord
(included in the package)
ALL TER MINAL S
1000V M AX
TO
EXT. CLK
GP-IB
(
IEEE 488
)
LINK/
ACT
100 LINK
ETHERNE T 10 0BAS E-TX ONLY
USB
VIDEO-OUT
(
VGA
)
100-2 40 V A C
50 VA MAX 5 0/60 Hz
ELEMEN T
EXT
MAX
MAX
CAT
II
Page 67

3-6
IM 760201-01E
3.4 Turning the Power Switch On and Off
Before Turning On the Power, Check That:
• The instrument is installed properly (see section 3.2, “Installing the Instrument”).
• The power cord is connected properly (see section 3.3, “Connecting the Power
Supply”).
Power Switch Location
The power switch is located in the lower left of the front panel.
Turning the power switch on and off
The power switch is a push button. Press the button once to turn the instrument on and
press it again to turn the instrument off.
OFF ON
FILE
POWER
Operations Performed When the Power Is Turned On
When the power switch is turned on, a self-test starts automatically. When the self-test
completes successfully, the display shows the screen that was displayed immediately
before the power switch was turned off.
Note
If the instrument does not operate as described above when the power switch is turned on, turn
the power switch off and check that:
• The power cord is securely connected.
• The power outlet is receiving the correct voltage (see section 3.3, “Connecting the Power
Supply”).
• After checking the above, try turning on the power switch while holding down ESC to reset
the settings to their initial values (the factory default). For information about the initial
settings, see section 3.13, “Initialization.”
If the instrument still does not work properly, contact your nearest YOKOGAWA dealer for
repairs.
Page 68

3-7
IM 760201-01E
Before You Start Measuring
3
2
1
To Make Accurate Measurements
• Allow the instrument to warm up for at least 30 minutes after turning on the power
switch.
•
Perform zero-level compensation after you have allowed the instrument to warm up (see
section 12.3, “Performing Zero- Level Compensation”).
Operations Performed When the Power Is Turned Off
After the power switch is turned off, the instrument stores the setup parameters in its
memory before shutting down. The same operation is performed when the power cord is
removed. The next time the power switch is turned on, the instrument powers up using
the stored setup parameters.
Note
A lithium battery is used to retain the setup parameters. When the lithium battery voltage falls
below a certain level and you turn the power switch on, the instrument displays a message
on the screen (see section 13.2 for details). If this message appears frequently, the battery
should be replaced quickly. Do not try to replace the battery yourself. Contact your nearest
YOKOGAWA dealer to have the battery replaced. For information about the battery life, see
section 13.5.
3.4 Turning the Power Switch On and Off
Page 69

3-8
IM 760201-01E
3.5 Precautions for Wiring the Circuit That You Will Measure
To avoid electric shock and damage to the instrument, follow the precautions below.
WARNING
• Ground the instrument before connecting measurement cables. The power cord
that comes with the instrument is a three-prong cord. Insert the power cord into
a grounded three-prong outlet.
• T
urn off the power to the circuit under measurement when wiring or
disconnecting it. Connecting or removing measurement cables while the power
is on is dangerous.
•
Do not wire a current circuit to the voltage input terminal or a voltage circuit to
the current input terminal.
•
Strip the insulation covers of measurement cables so that when they are wired
to the input terminals, the conductive parts (bare wires) do not protrude from the
terminals. Also, make sure to fasten the input terminal screws securely so that
cables do not come loose.
•
Only connect cables that have safety terminals that cover the conductive parts
to the voltage input terminals. Using a terminal with bare conductive parts (such
as a banana plug) can be dangerous if the terminal comes loose.
•
Only connect cables that have safety terminals that cover the conductive parts
to the current sensor input terminals. Using a terminal with bare conductive parts
(such as a banana plug) is dangerous if the terminal comes loose.
•
When the voltage from the circuit under measurement is being applied to the
current input terminals, do not touch the current sensor input terminals. Doing
so is dangerous because the terminals are electrically connected inside the
instrument.
•
When connecting a measurement cable from an external current sensor to a
current sensor input connector, remove the cables connected to the current
input terminals. In addition, when the voltage of the circuit under measurement
is being applied to a current sensor input terminal, do not touch the current
input terminals. Doing so is dangerous because the terminals are electrically
connected inside the instrument.
•
When using an external voltage transformer (VT) or current transformer (CT),
make sure that it has enough dielectric strength for the voltage (U) being
measured (2U + 1000 V recommended). Also, make sure that the secondary
side of the CT does not become an open circuit while the power is being applied.
If this happens, high voltage will appear at the secondary side of the CT, making
it extremely dangerous.
•
When using an external current sensor, make sure to use a sensor that comes in
a case. The conductive parts and the case should be insulated, and the sensor
should have enough dielectric strength for the voltage being measured. Using a
bare sensor is dangerous, because you might accidentally touch it.
•
When using a shunt-type current sensor as an external current sensor, turn off
the circuit under measurement. Connecting or removing the sensor while the
power is on is dangerous.
•
When using a clamp-type current sensor as an external current sensor, confirm
that there are no shock hazards, after making sure that you understand the
voltage of the circuit under measurement and the specifications and handling of
the clamp-type sensor.
•
For safety reasons, when using the instrument on a rack mount, set up a switch
for turning off the circuit under measurement from the front side of the rack.
•
After connecting measurement cables, attach the current input protection cover
using the screws provided. Make sure that the conductive parts do not protrude
from the protection cover.
Page 70

3-9
IM 760201-01E
Before You Start Measuring
3
2
1
• To make the protective measures effective, before applying the voltage or
current from the circuit under measurement, check that:
•
The power cord provided with the instrument is being used to connect to the
power supply and that the instrument is grounded.
•
The instrument’s power switch is turned on.
• The current input protective cover provided with the instrument is being used.
• When the instrument’s power switch is turned on, do not apply a signal that
exceeds the following values to the voltage or current input terminals. When the
instrument is turned off, turn off the circuit under measurement. For information
about other input terminals, see chapter 14.
Instantaneous Maximum Allowable Input (1 s or less)
Voltage Input
Peak value of 2000 V or rms value of 1500 V, whichever is less.
Current input
Direct input
Peak value of 150 A or rms value of 45 A, whichever is less.
External Sensor Input
Peak value less than or equal to 10 times the range.
Continuous Maximum Allowable Input
Voltage Input
Peak value of 1500 V or rms value of 1000 V, whichever is less.
Current input
Direct input
Peak value of 100 A or rms value of 45 A, whichever is less.
External Sensor Input
Peak value less than or equal to 5 times the range.
CAUTION
• Use measurement cables with dielectric strengths and current capacities that
are appropriate for the voltage or current being measured.
Example:
When making measurements on a current of 20 A, use copper wires
that have a conductive cross-sectional area of 4 mm
2
. or greater.
• Connecting cables may cause radio interference, in which case users will be
required to correct the interference.
Note
• After you finish wiring, you must select the wiring system. For details, see section 4.2,
“Selecting the Wiring System.”
•
If you are measuring large currents, voltages or currents that contain high frequency
components, take special care in dealing with mutual interference and noise when wiring.
• Keep measurement cables as short as possible to minimize the loss between the circuit
under measurement and the instrument.
• The thick lines on the wiring diagrams shown in sections 3.9 to 3.11 are the sections where
the current flows. Use wires that are suitable for the current levels.
• To make accurate measurements of the voltage of the circuit under measurement, connect
the cable to the circuit as closely as possible.
• To make correct measurements, separate the measurement cables as far away from the
ground wires and the instrument’s case as possible to minimize static capacitance to the
ground.
•
To measure the apparent power and power factor more accurately on an unbalanced three-
phase circuit, we recommend that you use a three-voltage, three-current method with a
three-phase, three-wire system (3P3W; 3V3A).
3.5 Precautions for Wiring the Circuit That You Will Measure
Page 71

3-10
IM 760201-01E
3.6 Assembling the Adapter for the Voltage Input Terminal
Assembling the 758931 Safety Terminal Adapter
When connecting a measurement cable to a WT500 voltage input terminal, use the
758931 Safety Terminal Adapter that comes with the package or the 758923 Safety
Terminal Adapter that is sold separately. When using the 758931 Safety Terminal
Adapter, assemble it according to the following procedure.
Assembling the Safety Terminal Adapter
1.
Remove approximately 10 mm of the covering from the end of the cable and pass
it through the internal insulator.
Cable
Internal insulator
Attachable cable
Covering: Max. diameter 3.9 mm
Core wire: Max. diameter 1.8 mm
2.
Insert the tip of the cable into the plug. Fasten the cable in place using the
hexagonal wrench.
Insert the hexagonal wrench into the plug and tighten.
Plug
Hexagonal wrench
3.
Insert the plug into the internal insulator.
4.
Attach the external cover. Make sure that the cover does not come off.
Cover
Note
Once the cover is attached, disassembly is difficult. Use care when attaching the cover.
Below is an illustration of the adapter after it has been assembled.
Page 72

3-11
IM 760201-01E
Before You Start Measuring
3
2
1
Explanation
Wire the adapters that come with the WT500 or the adapters and various sensors that
are sold separately as shown below:
Wiring to the Voltage Input Terminal
Voltage under
measurement
758921
758922
758917
758923
758931
758929
WT500 voltage
input terminal
ELEMENT
VOLTAGE
1000V
MAX
EXT
CURRENT
ALL TERMI NALS
1000V MAX
TO
CAT
II
10V
MAX
1000VMAX
40A
MAX
ELEMENT
VOLTAGE
1000V
MAX
EXT
CURRENT
ALL TERMI NAL
1000V MAX TO
CAT
10V MAX
1000VMAX
40A
MAX
Use the separately sold clamp-on probes as follows:
Wiring to the Current Input Terminal
751550
(voltage output type)
* The current input terminal and EXT input terminal cannot be wired (used) simultaneously.
751552
(current output type)
758917 758921
758924
Current under
measurement
WT500 current
input terminal
Connecting a clamp-on probe
WT500 EXT
input terminal
ELEMENT
VOLTAGE
1000V
MAX
EXT
CURRENT
ALL TERMI NALS
1000V MAX
TO
CAT
II
10V
MAX
1000VMAX
40A
MAX
ELEMENT
VOLTAGE
1000V
MAX
EXT
CURRENT
ALL TERMI NAL
1000V MAX TO
CAT
10V MAX
1000VMAX
40A
MAX
3.6 Assembling the Adapter for the Voltage Input Terminal
Page 73

3-12
IM 760201-01E
3.7 Wiring for Accurate Measurements
To make accurate measurements, refer to the items below when wiring the voltage input
and current input terminals.
Effects of Stray Capacitance
When measuring a single-phase device, the effects of stray capacitance on measurement
accuracy can be minimized by connecting the instrument’s current input terminal to the
side that is closest to the earth potential of the power source (SOURCE).
SOURCE
LOAD
U
I
I
U
LOAD
U
U
I
I
SOURCE
• Easily affected • Not easily affected
±
pp
p
Effects of the Measured Voltage and Current Amplitudes
SOURCE
LOAD
U
I
I
U
LOAD
SOURCE
U
I
I
U
• When the measured current is relatively
large
Connect the voltage input
terminal to the load end.
• When the measured current is relatively
small
Connect the current input
terminal to the load end.
± ±
± ±
Explanation
For details on the effects of stray capacitance and the effects of the measured voltage
and current amplitudes, see appendix 4, “How to Make Accurate Measurements.”
Page 74

3-13
IM 760201-01E
Before You Start Measuring
3
2
1
3.8 Guide for Selecting the Method Used to Measure the Power
Select the measurement method according to the amplitude of the measured voltage
or current from the table below. For details about a wiring system or method, see its
corresponding section indicated in the table.
Voltage Measurement Methods
When the voltage is less
than or equal to 1000 V
When the voltage
exceeds 1000 V
See section 3.9
Voltage
wiring
Direct input is not possible
See section 3.11
Direct input
VT (voltage transformer)
Current Measurement Methods
When the voltage is less
than or equal to 1000 V
When the current is
less than or equal
to 40 A
When the current
exceeds 40 A
When the voltage
exceeds 1000 V
See section 3.9
Current
wiring
Direct input is not possible
Shunt resistors
cannot be used
See section 3.10
See section 3.10
See section 3.11
See section 3.11
Direct input
Shunt resistor
Clamp-type current sensor
(voltage output type)
Clamp-type current sensor
(current output type)
CT (current transformer)
Notes when Replacing Other Power Meters with the WT500
In three-phase, three-wire systems (3P3W) and three-phase, three-wire systems that use
a three-voltage, three-current method (3P3W; 3V3A), the wiring system of the WT500
may be different from that of another product (another digital power meter) depending
on whether the reference voltage used to measure the line voltage (see appendix 4 for
details) is based on single-phase or three-phase power. To make correct measurements,
see the referenced sections in the selection guide above and check the wiring method of
the three-phase, three-wire system.
The three-phase, three-wire
systems are different
WT500
WT3000
WT1600
PZ4000
WT2000
WT1000
WT230
WT130
2533
2532
etc.
For example, if you replace the WT2000 (used in a three-phase, three-wire system) with
the WT500 and leave the wiring unchanged, the measured power of each element will
be different between the WT2000 and the WT500. Refer to this manual and re-wire the
system correctly.
Note
In the wiring examples that follow, models are referred to by number. For information about the
different WT500 models and their specifications, see page iii.
Page 75

3-14
IM 760201-01E
3.9 Wiring the Circuit That You Will Measure for Direct Input
This section explains how to wire the measurement cable directly from the circuit that
you will measure to the voltage or current input terminal.
To avoid electric shock and damage to the instrument, follow the precautions given in
section 3.5, “Precautions for Wiring the Circuit That You Will Measure.”
Connecting to the Input Terminal
Voltage Input Terminal
The terminal is a f4-mm safety banana jack (female).
Insert the safety terminal (whose conductive parts are not exposed) into the voltage input
terminal.
If you are using the 758931 Safety Terminal Adapter that comes with the package, see
section 3.6.
Current Input Terminal
• When the voltage of the circuit under measurement is being applied to the current
input terminals, do not touch the current sensor input terminals. Doing so is dangerous
because the terminals are electrically connected inside the instrument.
•
When connecting measurement cables from external current sensors to current
sensor input connectors, remove the cables connected to the current input terminals.
In addition, when the voltage of the circuit under measurement is being applied to
current sensor input terminals, do not touch the current input terminals. Doing so is
dangerous because the terminals are electrically connected inside the instrument.
•
The terminal is a binding post, and the screws are M6. Either wind the wire around the
screw or pass the crimp-on lugs through the screw axis, then tighten firmly with the
terminal knob.
3.1
2.1
6
7
Unit: mm
Number of Installed Input Elements and Wiring Systems
The selectable wiring systems vary depending on the number of installed elements. For
example, the three-phase, four-wire (3P4W) system cannot be selected on models with
two input elements. For details, see “Number of Installed Input Elements and Wiring
Systems” in section 2.3, “Measurement Conditions.”
Page 76

3-15
IM 760201-01E
Before You Start Measuring
3
2
1
The assignment of elements to the input terminals in the wiring example figures below
varies depending on the number of installed input elements. For details, see “Number of
Installed Input Elements and Wiring Systems” in section 2.3, “Measurement Conditions.”
Note
• After you have finished wiring, you must select the wiring system. For details, see section 4.2,
“Selecting the Wiring System.”
• The thick lines on the wiring diagrams are the sections where the current flows. Use wires
that are suitable for the current levels.
Single-Phase, Two-Wire System Wiring Example (Applicable for models 760201,
760202, and 760203)
If three input elements are available, three single-phase, two-wire systems can be set up.
See section 3.7 for information about which of the wiring systems shown below should
be selected.
SOURCE
LOAD
U1
I1
I
U
LOAD
U1
U
I1
I
SOURCE
SOURCE
LOAD
Input terminal
SOURCE
LOAD
Input terminal
I
U
I
U
±
!pm!
±
±
±
±
±
±
Single-Phase, Three-Wire System Wiring Example (Applicable for models 760202
and 760203)
If three input elements are available, two single-phase, three-wire systems can be set up
(elements 1 and 2, or elements 2 and 3).
SOURCE
LOAD
N
N
SOURCE
Input terminal 1
LOAD
Input terminal 2
I
I
U
U
I2
I1
U1
U2
I
U
I
U
±
±
±
±
±
±
±
±
3.9 Wiring the Circuit That You Will Measure for Direct Input
Page 77

3-16
IM 760201-01E
Three-Phase, Three-Wire System Wiring Example (Applicable for models 760202
and 760203)
If three input elements are available, two three-phase, three-wire systems can be set up
(elements 1 and 2, or elements 2 and 3).
R
ST
SOURCE
LOAD
SOURCE
Input terminal 1
LOAD
Input terminal 2
I1
I2
U1
U2
I
I
U
U
R
S
T
I
U
I
U
±
±
±
±
±
±
±
±
Wiring Example of a Three-Phase, Three-Wire System with a Three-Voltage,
Three-Current Method (3P3W; 3V3A) (Applicable for model 760203)
If three input elements are available, one three-phase, three-wire system with a threevoltage, three-current method can be set up (elements 1, 2, and 3).
SOURCE
LOAD
I
I
R
S
T
U
U
U
I
SOURCE
Input terminal 1
LOAD
Input terminal 2
R
S
T
I1
I2
I3
U3 U1
U2
Input terminal 3
I
U
I
U
I
U
±
±
±
±
±
±
±
±
±
±
±±
Three-Phase, Four-Wire System Wiring Example (Applicable for model 760203)
If three input elements are available, one three-phase, four-wire system can be set up
(elements 1, 2, and 3).
SOURCE
LOAD
I
I
R
ST
U
U
U
I
N
SOURCE
Input terminal 1
LOAD
Input terminal
2
R
S
T
N
I1
I2
I3
U1
U2U3
Input terminal 3
I
U
I
U
I
U
±
±
±
±
±
±
±
±
±±
±
±
Note
For details about the relationship between the wiring system and how measured and
computed values are determined, see appendix 1, “Symbols and Determination of
Measurement Functions.”
3.9 Wiring the Circuit That You Will Measure for Direct Input
Page 78

3-17
IM 760201-01E
Before You Start Measuring
3
2
1
3.10 Wiring the Circuit That You Will Measure with a Current Sensor
To avoid electric shock and damage to the instrument, follow the precautions given in
section 3.5, “Precautions for Wiring the Circuit That You Will Measure.”
If the maximum current value of the circuit under measurement exceeds the maximum
range of the current input terminal, 40 Arms, you can measure the current by connecting
an external sensor to the current sensor input connector.
Current sensor output type
• In the wiring example in this section, you can use a shunt resistor or a clamp-type
current sensor as the external current sensor.
•
When using a clamp-type current sensor that outputs current, see section 3.11.
Connecting to the Input Terminal
Voltage Input Terminal
The terminal is a f4-mm safety banana jack (female).
Insert the safety terminal (the conductive parts are not exposed) into the voltage input
terminal.
If you are using the 758931 Safety Terminal Adapter that comes with the package, see
section 3.6.
External Current Sensor Input Terminal
Connect an external sensor cable with a BNC connector (B9284LK, sold separately) to
an external current sensor input connector.
Remove the measurement cable connected to the current input terminal. Because the
current sensor input terminal and the current input terminal are connected internally,
connecting both terminals simultaneously not only results in measurement errors but may
also cause damage to the instrument.
In addition, when the voltage of the circuit under measurement is being applied to the
current sensor input terminal, do not touch the current input terminals. Doing so is
dangerous because the terminals are electrically connected inside the instrument.
Number of Installed Input Elements and Wiring Systems
The selectable wiring systems vary depending on the number of input elements that are
installed in the WT500. For details, see “Number of Installed Input Elements and Wiring
Systems” in section 2.3, “Measurement Conditions.”
Page 79

3-18
IM 760201-01E
Note
• After wiring has been completed, the wiring system must be selected. See section 4.2,
“Selecting the Wiring System.”
• The thick lines on the wiring diagrams are the sections where the current flows. Use wires
that are suitable for the current levels.
• To measure the apparent power and power factor more accurately on an unbalanced three-
phase circuit, we recommend that you use a three-voltage, three-current method with a
three-phase, three-wire system (3P3W; 3V3A).
• The current sensor input conversion feature can be used to convert the input signal data to
the corresponding data that would be acquired from direct measurements. For information
about how to set up this feature, see section 4.5, “Setting the Measurement Range for an
External Current Sensor (Optional).”
• Note that the frequency and phase characteristics of the current sensor affect the measured
data.
• Make sure that you have the polarities correct when you make connections. Otherwise,
the polarity of the measurement current will be reversed, and you will not be able to make
correct measurements. Be especially careful when connecting the clamp type current
sensor, because it is easy to reverse the connection.
• To minimize error when using a shunt resistor, follow the guidelines below when connecting
the external sensor cable.
• Connect the shielded wire of the external sensor cable to the L side of the shunt output
terminal (OUT).
• Minimize the area of the space between the wires connecting the shunt resistor to the
external sensor cable. This reduces the effects of the lines of magnetic force (which are
caused by the measurement current) and the external noise that enter the space.
Shunt resistor
I
±
OUT H
OUT L
Shielded wire
External sensor cable
(B9284LK, sold separately)
WT500
Space between the
connection wires
• Connect a shunt resistor to the power earth ground as shown in the figure below. If you have
to connect the sensor to the non-earth side, use a wire that is thicker than AWG18 (conductive
cross-sectional area of approx. 1 mm2) between the sensor and the instrument to reduce the
effects of common mode voltage. Take safety and error reduction into consideration when
constructing an external sensor cable.
LOAD
Shunt resistor
U
±
External current sensor
input connector
Voltage input terminal
Power meter
• When the circuit under measurement is not grounded and the signal is high in frequency or
large in power, the effects of the inductance of the shunt resistor cable become large. In this
case, use an isolation sensor (CT, DC-CT, or clamp).
Clamp-type current sensor
External current sensor
input connector
U
±
Voltage input terminal
Power meter
LOAD
3.10 Wiring the Circuit That You Will Measure with a Current Sensor
Page 80

3-19
IM 760201-01E
Before You Start Measuring
3
2
1
The following wiring examples are for connecting shunt resistors. When connecting a
clamp-type current sensor that outputs voltage, substitute the shunt-type current sensor
with the clamp-type.
Shunt resistor
±
±±
I
OUT LOUT H
External current sensor
input connector
(EXT)
Input terminal
U
External current sensor
input connector
(EXT)
Input terminal
U
Clamp-type current sensor
that outputs voltage
The assignment of elements to the input terminals in the figures below varies depending
on the number of installed input elements. For details, see “Number of Installed Input
Elements and Wiring Systems” in section 2.3, “Measurement Conditions.”
Wiring Example of a Single-Phase, Two-Wire System (1P2W) with a Shunt
Resistor
SOURCE
LOAD
Earth side
Shunt resistor
±
±
I
OUT L OUT H
External current sensor
input connector
(EXT)
Input terminal
U
Wiring Example of a Single-Phase, Three-Wire System (1P3W) with a Shunt
Resistor
SOURCE LOAD
±I
OUT L
OUT H
±
± ±
I
OUT L
OUT H
N
External current sensor
input connector
(EXT)
Input terminal 1
U
External current sensor
input connector
(EXT)
Input terminal 2
U
3.10 Wiring the Circuit That You Will Measure with a Current Sensor
Page 81

3-20
IM 760201-01E
Wiring Example of a Three-Phase, Three-Wire System (3P3W) with a Shunt
Resistor
SOURCE LOAD
±I
OUT L
OUT H
±
±
±
I
OUT L
OUT H
R
S
T
External current sensor
input connector
(EXT)
Input terminal 1
U
External current sensor
input connector
(EXT)
Input terminal 2
U
Wiring Example of a Three-Phase, Three-Wire System with a Three-Voltage,
Three-Current Method (3P3W; 3V3A) and a Shunt Resistor
SOURCE
LOAD
±I
OUT L
OUT H
±
± ±
±
I
OUT L
OUT H
R
S
T
±
I
OUT L
OUT H
External current sensor
input connector
(EXT)
Input
terminal 1
U
External current sensor
input connector
(EXT)
Input
terminal 2
U
External current sensor
input connector
(EXT)
Input
terminal 3
U
Wiring Example of a Three-Phase, Four-Wire System (3P3W) with a Shunt
Resistor
SOURCE LOAD
±I
OUT LOUT H
±
± ± ±
I
OUT LOUT H
R
S
T
N
±
I
OUT LOUT H
External current sensor
input connector
(EXT)
Input
terminal 1
U
External current sensor
input connector
(EXT)
Input
terminal 2
U
External current sensor
input connector
(EXT)
Input
terminal 3
U
Note
For details about the relationship between the wiring system and how measured and computed
values are determined, see appendix 1, “Symbols and Determination of Measurement
Functions.”
3.10 Wiring the Circuit That You Will Measure with a Current Sensor
Page 82

3-21
IM 760201-01E
Before You Start Measuring
3
2
1
3.11 Wiring the Circuit That You Will Measure with a VT or CT
This section explains how to wire a measurement cable from an external VT or CT to
a voltage or current input terminal. Also refer to this section when wiring a clamp-type
current sensor that outputs current.
To avoid electric shock and damage to the instrument, follow the precautions given in
section 3.5, “Precautions for Wiring the Circuit That You Will Measure.”
When the maximum voltage of the circuit under measurement exceeds 1000 Vrms, you
can make measurements by connecting an external VT to the voltage input terminal.
If the maximum current value of the circuit under measurement exceeds the maximum
range of the input elements, 40 Arms, you can measure the current by connecting an
external CT, or a clamp-type sensor that outputs current, to a current input terminal.
Connecting to the Input Terminal
Voltage Input Terminal
The terminals are f4-mm safety banana jacks (female).
Only insert a safety terminal whose conductive parts are not exposed into a voltage input
terminal.
If you are using the 758931 Safety Terminal Adapter that comes with the package, see
section 3.6.
Current Input Terminal
• When the voltage of the circuit under measurement is being applied to the current
input terminals, do not touch the current sensor input terminals. Doing so is dangerous
because the terminals are electrically connected inside the instrument.
•
When connecting a measurement cable from an external current sensor to a current
sensor input connector, remove the cables connected to the current input terminals.
In addition, when the voltage of the circuit under measurement is being applied to
a current sensor input terminal, do not touch the current input terminal. Doing so is
dangerous because the terminals are electrically connected inside the instrument.
•
The screws used on the terminal (binding post) are M6 screws. Wind the wire around
the screw, use the separately sold Fork Terminal Adapter (758921), or pass the crimpon lugs through the screw axis, then tighten firmly with the terminal knob.
•
For the dimensions of the terminal parts, see section 3.9.
Number of Installed Input Elements and Wiring Systems
The selectable wiring systems vary depending on the number of input elements that are
installed in the WT500. For details, see “Number of Installed Input Elements and Wiring
Systems” in section 2.3, “Measurement Conditions.”
General VT and CT Handling Precautions
• Do not short the secondary side of a VT. Doing so may damage it.
• Do not short the secondary side of a CT. Doing so may damage it.
Also, follow the VT or CT handling precautions in the manual that comes with the VT
or CT that you are using.
Page 83

3-22
IM 760201-01E
Note
• After you have finished wiring, you must select the wiring system. For details, see section 4.2,
“Selecting the Wiring System.”
• The thick lines on the wiring diagrams are the sections where the current flows. Use wires
that are suitable for the current levels.
• Make sure that you have the polarities correct when you make connections. If the polarity
is reversed, the polarity of the measurement current will be reversed, and you will not be
able to make correct measurements. Be especially careful when connecting the clamp type
current sensor, because it is easy to reverse the connection.
• The scaling feature can be used to transform the input signal to data that corresponds to
direct measurements. For information about how to set up this feature, see section 4.6,
“Setting the Scaling Feature When Using a VT or CT.”
• Note that the frequency and phase characteristics of the VT or CT affect the measured data.
• For safety reasons, the common terminals (+/–) of the secondary side of the VT and CT are
grounded in the wiring diagrams in this section. However, the necessity of grounding and
the grounding location (ground near the VT or CT or ground near the power meter) vary
depending on the object being measured.
• To measure the apparent power and power factor more accurately on an unbalanced three-
phase circuit, we recommend that you use a three-voltage, three-current method with a
three-phase, three-wire system (3P3W; 3V3A).
The following wiring examples are for connecting a CT. When connecting a clamp-type
current sensor that outputs current, substitute the CT with the clamp-type current sensor.
The assignment of elements to the input terminals in the figures below varies depending
on the number of installed input elements. For details, see “Number of Installed Input
Elements and Wiring Systems” in section 2.3, “Measurement Conditions.”
Wiring Example of a Single-Phase, Two-Wire System (1P2W) with a VT and CT
SOURCE
LOAD
L
CT
VT
V
vl
SOURCE
LOAD
L
CT
VT
V
vl
Input terminal
I
U
Input terminal
I
U
±
±
±
±
Wiring Example of a Single-Phase, Three-Wire System (1P3W) with a VT and CT
L
CT
VT
V
vl
L
CT
VT
V
vl
SOURCE
LOAD
N
Input terminal 1
I
U
Input terminal 2
I
U
±
±
±
±
3.11 Wiring the Circuit That You Will Measure with a VT or CT
Page 84

3-23
IM 760201-01E
Before You Start Measuring
3
2
1
Wiring Example of a Three-Phase, Three-Wire System (3P3W) with a VT and CT
L
CT
VT
V
vl
L
CT
VT
V
vl
SOURCE
LOAD
R
S
T
Input terminal 1
I
U
Input terminal 2
I
U
±
±
±
±
Wiring Example of a Three-Phase, Three-Wire System with a Three-Voltage,
Three-Current Method (3P3W; 3V3A), a VT, and a CT
L
CT
VT
V
vl
L
CT
VT
V
vl
SOURCE
L
CT
VT
V
vl
LOAD
R
S
T
Input terminal 1
I
U
Input terminal 2
I
U
Input terminal 3
I
U
±
±
±
±
Wiring Example of a Three-Phase, Four-Wire System (3P4W) with a VT and CT
L
CT
VT
V
vl
L
CT
VT
V
vl
SOURCE
L
CT
VT
V
vl
LOAD
R
S
T
N
Input terminal 1
I
U
Input terminal 2
I
U
Input terminal 3
I
U
±
±
±
±
±
±
Note
For details about the relationship between the wiring system and how measured and computed
values are determined, see appendix 1, “Symbols and Determination of Measurement
Functions.”
3.11 Wiring the Circuit That You Will Measure with a VT or CT
Page 85

3-24
IM 760201-01E
3.12 Setting the Date and Time
Procedure
1.
Press MISC to display the Misc Menu.
Turning the Date and Time Display On or Off
2.
Use the cursor keys to select Date/Time.
3.
Press SET to display the Date/Time dialog box.
4.
Use the cursor keys to select Display.
5.
Press SET to select ON or OFF.
Setting the Date or Time Manually
6.
Use the cursor keys to select one of the Date (year, month, and day) or Time (hour,
minute, and second) boxes.
7.
Press SET to display an entry box.
8.
Use the cursor keys to set the year, month, date, hour, minute, or second that
you selected in step 6.
9.
Press SET or ESC to close the entry box.
10.
Repeat steps 6 to 8 to set the year, month, date, hour, minute, and second.
11.
Use the cursor keys to select Set.
12.
Press SET. If you selected ON in step 5, the new date and time are displayed in
the lower right corner of the screen. If you cancel the procedure without pressing
SET, the new settings are not reflected on the display.
Page 86

3-25
IM 760201-01E
Before You Start Measuring
3
2
1
Explanation
Turning the Date and Time Display On or Off
You can select whether or not to display the date and time in the lower right of the
screen.
•
OFF: Do not display the date and time.
• ON: Display the date and time.
Setting the Date and Time
• Setting the Date
The format for setting the date is YY/MM/DD (year/month/day).
• Setting the Date/Time
The format for setting the time is HH:MM:SS (hour:minute:second). The hour can be
set to a value from 0 to 23.
Note
• The date and time information is backed up with an internal lithium battery when the power
is turned off.
• The WT500 contains leap year information. The instrument determines the leap year
calendar when new settings are confirmed. If you enter 2/29 for the date on a non-leap year,
an error message will be displayed.
3.12 Setting the Date/Time
Page 87

3-26
IM 760201-01E
3.13 Initializing the Settings
Procedure
Note
Only initialize the WT500 if you are sure that it is okay for all of the settings to return to their
initial values. You cannot undo an initialization. We recommend that you save the setup
parameters before initializing the WT500 (see section 10.3 for details).
1.
Press MISC to display the Misc Menu.
2.
Use the cursor keys to select Initialize Settings.
3.
Press SET. An alert message appears.
4.
Use the cursor keys to select OK.
5.
Press SET to execute initialization.
To cancel the initialization, select Cancel in step 3 and press SET.
Explanation
The values specified by using the panel keys can be reset to their factory default values.
This is useful when you wish to clear previous settings or start the settings from scratch.
For information about the initial settings, see appendix 2, “List of Initial Settings and
Numeric Data Display Order.”
Settings That Cannot Be Initialized
• Date and time settings
• Menu and message language settings
• The designation of the files display (Filter)
• File utility operation (Function)
• USB interface, GP-IB interface (optional), and Ethernet interface (optional) settings
Initializing at Power Up
To make the WT500 start up with the initial settings, turn on the power. Then, when the
message “Boot OK” appears, press and hold ESC until the NUMERIC key blinks. All of
the settings listed under “Settings That Cannot be Initialized,” except for the date and
time, are initialized. A message indicating that the settings have been initialized appears
on the screen.
Page 88

3-27
IM 760201-01E
Before You Start Measuring
3
2
1
3.14 Entering Values and Character Strings
Entering Values
When you select a setup parameter with SET, an entry box appears. Then, you can
change the value by using the cursor keys. Use the left and right cursor keys to select
digits, and use the up and down cursor keys to set the value of a digit.
Note
Some of the parameters that can be changed using the cursor keys are reset to their initial
values when SHIFT+ESC (RESET) is pressed.
Page 89

3-28
IM 760201-01E
Entering Character Strings
Units, file names, the equations for user-defined functions, and the user name and
password for the Ethernet Interface (optional) can be entered using the keyboard that
is displayed on the screen. Use the cursor keys and SET to navigate the keyboard and
enter a character string.
1.
Use the cursor keys to select a character.
2.
Press SET to enter that character into the entry box.
If there are characters already in the entry box, use the Page and Page cursor keys to
select the entry position.
3.
Repeat steps 1 and 2 to enter all of the characters in the string.
4.
After entering all of the characters, select on the keyboard, and press SET.
If you enter an incorrect user-defined function, an error message appears.
Moves the cursor to the left.
Moves the cursor to the right.
Deletes the previous character.
Enters a character string.
Keys Other Than the Character Keys
• CAPS: Switches between uppercase and lowercase.
• SPACE: Enters a space.
•
: Enters the displayed characters.
Usable Characters and Maximum String Lengths
Setting Max. Length Usable Characters
Equation 1 to 50 characters Spaces and all characters that are displayed on the
keyboard
Unit 1 to 8 characters Spaces and all characters that are displayed on the
keyboard
File name 1 to 8 characters 0-9, A-Z, %, _, parentheses, and minus signs
Comment 0 to 25 characters Spaces and all characters that are displayed on the
keyboard
Server name 0 to 40 characters Spaces and all characters that are displayed on the
keyboard
User name 0 to 15 characters Spaces and all characters that are displayed on the
keyboard
Password 0 to 15 characters Spaces and all characters that are displayed on the
keyboard
Note
File names are not case-sensitive. Comments are case-sensitive. The following file names
cannot be used due to MS-DOS limitations.
AUX, CON, PRN, NUL, CLOCK, COM1 to COM9, and LPT1 to LPT9
3.14 Entering Values and Character Strings
Page 90

3-29
IM 760201-01E
Before You Start Measuring
3
2
1
3.15 Entering Character Strings on a USB Keyboard
You can connect a USB keyboard to a USB port and enter file names, comments, and so
on.
USB PERIPHERAL Connector
Use a USB cable to connect a USB keyboard to a USB PERIPHERAL connector on the
left side of the front panel. There are two USB PERIPHERAL ports.
1
2 3 4
Ports
Pin No. Signal Name
1 VBUS : +5 V
2 D- : -Data
3 D+ : +Data
4 GND : Ground
Usable Keyboards
The following keyboards conforming to USB Human Interface Devices (HID) Class
Ver1.1 can be used.
•
When the USB keyboard language is English: 104 keyboard
• When the USB keyboard language is Japanese: 109 keyboard
Section 3.19 explains how to select one of these two keyboards.
Note
• For USB keyboards that have been tested for compatibility, contact your nearest
YOKOGAWA dealer.
• Do not connect USB devices other than USB keyboards or USB memory to the USB
PERIPHERAL ports.
• The WT500 has two USB PERIPHERAL ports. However, USB devices whose maximum
current consumption exceeds 100 mA cannot be connected simultaneously to the two ports.
Connection Procedure
Connect the USB keyboard to the WT500 directly using a USB cable as shown below.
You can connect/disconnect a USB cable at any time regardless of whether the WT500
is on or off (supports hot-plugging). Connect the type A connector of the USB cable to the
WT500, and connect the type B connector to the keyboard. When the power switch is on,
the keyboard is detected and enabled approximately six seconds after it is connected.
USB connection
USB keyboard
ESC
RESET
SET
CAL
PAGE
PAGE
ELEMENT
1
2
3
ELEMENT
ALL
RANGE
VOLTAGE CURRENT
AUTO AUTO
DISPLAY
NUMERIC WAVE OTHERS
FORM ITEM
CURSOR
INTEGRATOR
SETUP
INPUT INFO
START/
STOP
RESET
HOLD
SINGLE
SHIFT
MISC
NULL
LOCAL
KEY LOCK
FILE IMAGE
MENU
STORE
STORE SET
POWER
WT500
Page 91

3-30
IM 760201-01E
Note
• Connect the keyboard directly, not through a USB hub.
• Do not connect USB devices other than USB keyboards or USB memory to the USB
PERIPHERAL ports.
• Do not connect multiple keyboards.
• Holding down a key on the keyboard does not enter the character or value repetitively.
• Do not connect and disconnect multiple USB devices repetitively. Leave a 10-second
interval between removal and connection.
• Do not connect or disconnect the USB cable after the power is turned on until key operation
is possible (approximately 20 to 30 s).
Confirming What Keyboard Is Connected
To confirm what keyboard is connected to the WT500, carry out the procedure below.
1.
Press MISC.
2.
Use the cursor keys to select USB.
3.
Press SET to display the USB dialog box.
4.
Use the cursor keys to select Device List.
5.
Press SET to select USB Device List. Information about the connected USB
keyboard appears.
Entering File Names, Comments, Etc.
When a keyboard is displayed on the screen, you can enter file names, comments, and
other items using the USB keyboard. The characters that are entered by each key on the
USB keyboard vary depending on the keyboard type.
Executing Functions Corresponding to the Keys on the Front Panel of the
WT500
The keys on a USB keyboard can be used to perform the same operations that can be
performed using the front panel keys. The assignment of front panel key functions to
USB keyboard keys varies depending on the keyboard type. For details, see appendix 6.
3.15 Entering Character Strings on a USB Keyboard
Page 92

3-31
IM 760201-01E
Before You Start Measuring
3
2
1
3.16 Switching the Display
Procedure
Switching to the Numeric Display
1.
Press NUMERIC to display numeric values.
Switching to the Waveform Display
1.
Press WAVE to display waveforms.
Switching to the Trend, Bar Graph, or Vector Display
1.
Press OTHERS to display the Others menu.
Using the Cursor Keys
2.
Use the cursor keys to set the display to Trend, Bar, or Vector.
3.
Press SET. The selected display appears.
Using OTHER
2.
Press OTHER to switch between display modes in this order: Trend > Bar >
Vector > Trend > and so on.
Page 93

3-32
IM 760201-01E
Explanation
On the WT500, you can choose from the following kinds of displays.
Display Mode
Without the harmonic
measurement option
Power measurement
(numeric display)
(Numeric)
Waveform display
(Wave)
Trend display
(Trend)
Bar graph display
(Bar)
Vector display
(Vector)
With the Harmonic
Measurement Option
For operating instructions,
see chapter 5.
For an explanation of the
features, see section 2.4.
For operating instructions,
see chapter 6.
For an explanation of the
features, see section 2.4.
For operating instructions,
see chapter 6.
For an explanation of the
features, see section 2.8.
For operating instructions,
see chapter 6.
For an explanation of the
features, see section 2.8.
For operating instructions, see chapter 7.
For an explanation of the features, see section 2.7.
For operating instructions, see chapter 8.
For an explanation of the features, see section 2.8.
Bar graph display is
not possible.
Vector display is
not possible.
Note
When waveforms are displayed, the measurement mode indicated on the screen is Normal
Mode (Trg). For details, see section 7.1.
3.16 Switching the Display
Page 94

3-33
IM 760201-01E
Before You Start Measuring
3
2
1
3.17 Displaying a List of Setup Parameters
Procedure
Displaying the Setup Parameter List
1.
Press SHIFT+SETUP (INPUT INFO). A list of input conditions (such as the wiring
units for each element, the measurement range, the scaling coefficient, the
synchronization source, and the input filter) appears.
Closing the Setup Parameter List
2.
Press SHIFT+SETUP (INPUT INFO) or ESC (when no menus are displayed). The
list of setup parameters closes.
Explanation
Setup Parameter List
The figure below is an example of a setup parameter list when the crest factor is set to 3.
Note
The list of input conditions shows the settings when measurement took place. If the
measurement range or some other setting is changed while the hold feature is on, the changes
will not be reflected in the list.
Page 95

3-34
IM 760201-01E
3.18 Selecting the Message Language
Procedure
1.
Press MISC to display the Misc Menu.
2.
Use the cursor keys to select System Config.
3.
Press SET to display the System Config menu.
Selecting the Message Language
4.
Use the cursor keys to select Message Language.
5.
Press SET to select JPN or ENG.
Selecting the Menu Language
4.
Use the cursor keys to select Menu Language.
5.
Press SET to select JPN or ENG.
Explanation
Selecting the Message Language
Error messages appear when errors occur. You can choose to display these messages
using one of the following languages. The error codes that accompany error messages
are the same for both English and Japanese messages. For more information about error
messages, see section 13.2.
JPN:
Japanese
ENG: Englis
h
Selecting the Menu Language
You can choose to display menus using one of the following languages.
JPN: Japanese
ENG: English
Page 96

3-35
IM 760201-01E
Before You Start Measuring
3
2
1
3.19 Setting the USB Keyboard Language
Procedure
1.
Press MISC to display the Misc Menu.
2.
Use the cursor keys to select USB.
3.
Press SET to display the USB menu.
4.
Use the cursor keys to select Keyboard.
5.
Press SET to select JPN or ENG.
Explanation
Set the language to use when entering file names, comments, and other items (see
section 3.15 for details) from the USB keyboard. The following keyboards conforming to
USB Human Interface Devices (HID) Class Ver1.1 can be used.
•
ENG: 104 keyboard
• JPN: 109 keyboard
The characters that are entered by each key on the USB keyboard vary depending on
the keyboard type. For details, see appendix 6.
Note
For USB keyboards that have been tested for compatibility, contact your nearest YOKOGAWA
dealer.
Page 97

4-1
IM 760201-01E
Measurement Conditions
3
2
1
4
4.1 Panel Keys and Setup Menus Used in This Chapter
Panel Keys Used in This Chapter
ESC
RESET
SET
CAL
PAGE
PAGE
ELEMENT
1
2
3
ELEM ENT
ALL
RANGE
VOLTAGE CURRENT
AUTO AUTO
DISPLAY
NUME RIC WAVE OTH ERS
FORM ITE M
CUR SOR
INTEGR ATOR
SETU P
INPU T INFO
START/
STOP
RESE T
HOLD
SING LE
SHIF T
MISC
NULL
LOC AL
KEY L OCK
FILE IMAGE
MENU
STOR E
STORE SET
POWE R
Cursor keys
4.4 Setting the Measurement Range
for Direct Input
4.5 Setting the Measurement Ranges
for an External Current Sensor (Optional)
4.4 Setting the Measurement Range
for Direct Input
4.12 Holding and Performing Single
Measurements
Displays the SETUP menu
(see below for the contents of the menu)
Displays the MISC menu
(see below for the contents of the menu)
Select and confirm menu items
Setup Menus Used in This Chapter
To set a parameter, access its menu by pressing the appropriate panel key.
The setup menus and menu items used in this chapter are shown below, along with the
sections that correspond to their operating instructions.
SETU P
MISC
SETUP key
MISC key
4.11 Selecting a Crest Factor
4.10 Selecting an Averaging Method
4.6 Setting the Scaling Feature When Using a VT or CT
4.7 Setting the Measurement Period
4.8 Selecting an Input Filter
4.9 Selecting the Data Update Rate
4.4 Setting the Measurement Range for Direct Input
4.5 Setting the Measurement Ranges
for an External Current Sensor (Optional)
4.2 Selecting a Wiring System
4.3 Selecting Independent Input Element Configuration
Chapter 4 Measurement Conditions
Page 98

4-2
IM 760201-01E
4.2 Selecting a Wiring System
Procedure
1.
Press SETUP to display the Setup menu.
2.
Use the cursor keys to select Wiring.
3.
Press SET to display the Wiring Settings dialog box.
Selecting a Wiring System
4.
Use the cursor keys to select Wiring.
5.
Press SET. The pattern selection dialog box appears.
6.
Use the cursor keys to select a pattern.
7.
Press SET to confirm the pattern.
Page 99

4-3
IM 760201-01E
Measurement Conditions
3
2
1
4
Explanation
Wiring System
• There are five wiring systems available on the WT500. The selectable wiring systems
vary depending on the number of elements installed in the WT500.
(1) 1P2W
, single-phase, two-wire; (2) 1P3W, single-phase, three-wire; (3) 3P3W,
three-phase, three-wire; (4) 3P4W, three-phase, four-wire; and (5) 3V3A, threevoltage, three-current.
•
The wiring system determines how input elements are assignment to wiring unit Σ
and how Σ functions (such as voltage, current, active power, apparent power, reactive
power, power factor, and phase difference) are determined. For details about the
relationship between the wiring system and how Σ functions are determined, see
Appendix 1.
•
The following table shows the relationship between the number of installed input
elements, the selectable wiring systems, and the assignment of input elements to
wiring unit Σ.
Number of installed input elements
Wiring system Pattern 1
1
1P2W
Number of installed input elements
Wiring system Pattern 1
Wiring system Pattern 2
1
1P2W
2
1P2W
1P3W:Σ or 3P3W:Σ
Number of installed input elements
Wiring system Pattern 1
Wiring system Pattern 2
Wiring system Pattern 3
Wiring system Pattern 4
1
1P2W
2
1P2W
3
1P2W
1P2W
1P2W
1P3W:Σ or 3P3W:Σ
1P3W:Σ or 3P3W:Σ
3P4W:Σ or 3P3W (3V3A):Σ
Note
• Select the wiring system to match the actual wiring of the circuit under measurement. The
method in which the
Σ
functions are determined varies depending on the wiring system. If
the selected wiring system does not match the wiring of the actual circuit, measurements
and computation will not be correct.
•
For details about the relationship between the wiring system and how
Σ
functions are
determined, see Appendix 1.
Wiring System Display
The wiring system configuration is displayed on the right side of the screen. Because it is
displayed behind the menu, to view it, you need to press the ESC key to hide the menu.
The figure below shows wiring system display examples for a model with three input
elements installed.
When elements 1 to 3 are
set to single-phase,
two-wire system
When element 1 and 2 are set to single-phase,
three-wire system, and element 3 is set to single-phase,
two-wire system
Wiring unit and system
The elements that make up the
wiring unit are contained in the frame.
4.2 Selecting a Wiring System
Page 100

4-4
IM 760201-01E
Settings of Elements Grouped in a Wiring Unit
If the independent configuration of input elements (described in section 4.3) is off
and a wiring system other than 1P2W is selected when the measurement range or
synchronization source settings of each input element are different, the following settings
are changed in the manner described below:
•
The measurement range of all input elements included in the wiring unit is set to the
highest range among all input elements. The external current sensor input range has
precedence over the direct input current range.
•
The auto range settings are changed to match the setting of the input element whose
measurement range is highest. If multiple input elements are set to a common highest
measurement range, the settings of the input element with the smallest input element
number take precedence.
•
The synchronization source setting is changed to match the setting of the input
element with the smallest input element number among the input elements included in
the wiring unit.
When you press ELEMENT to select the element to be configured, the LEDs of input
elements in the wiring unit light simultaneously.
4.2 Selecting a Wiring System
 Loading...