

Page 1

Digital Power Meter
IM 253421-01E
1st Edition
Page 2

Notes
Trademarks
Revisions
Thank you for purchasing the YOKOGAWA WT200 Digital Power Meter.
This User’s Manual contains useful information regarding the instrument’s functions
and operating procedures, as well as precautions that should be observed during use.
To ensure proper use of the instrument, please read this manual thoroughly before
operating it.
Keep the manual in a safe place for quick reference whenever a question arises.
• The contents of this manual are subject to change without prior notice.
• Every effort has been made in the preparation of this manual to ensure the accuracy
of its contents. However, should you have any questions or find any errors, please
contact your dealer or YOKOGAWA sales office.
• Copying or reproduction of all or any part of the contents of this manual without
YOKOGAWA’s permission is strictly prohibited.
Company and product names that are used in this manual are trademarks or registered
trademarks of their respective holders.
1st Edition: April 2000
Disk No. BA36
1st Edition: April 2000(YK)
All Rights Reserved, Copyright © 2000 Yokogawa Electric Corporation
IM 253421-01E
i
Page 3
Checking the Contents of the Package
Unpack the box and check the contents before operating the instrument. In case the
wrong instrument or accessories have been delivered, or if some accessories are not
present, or if they seem abnormal, contact the dealer from which you purchased them.
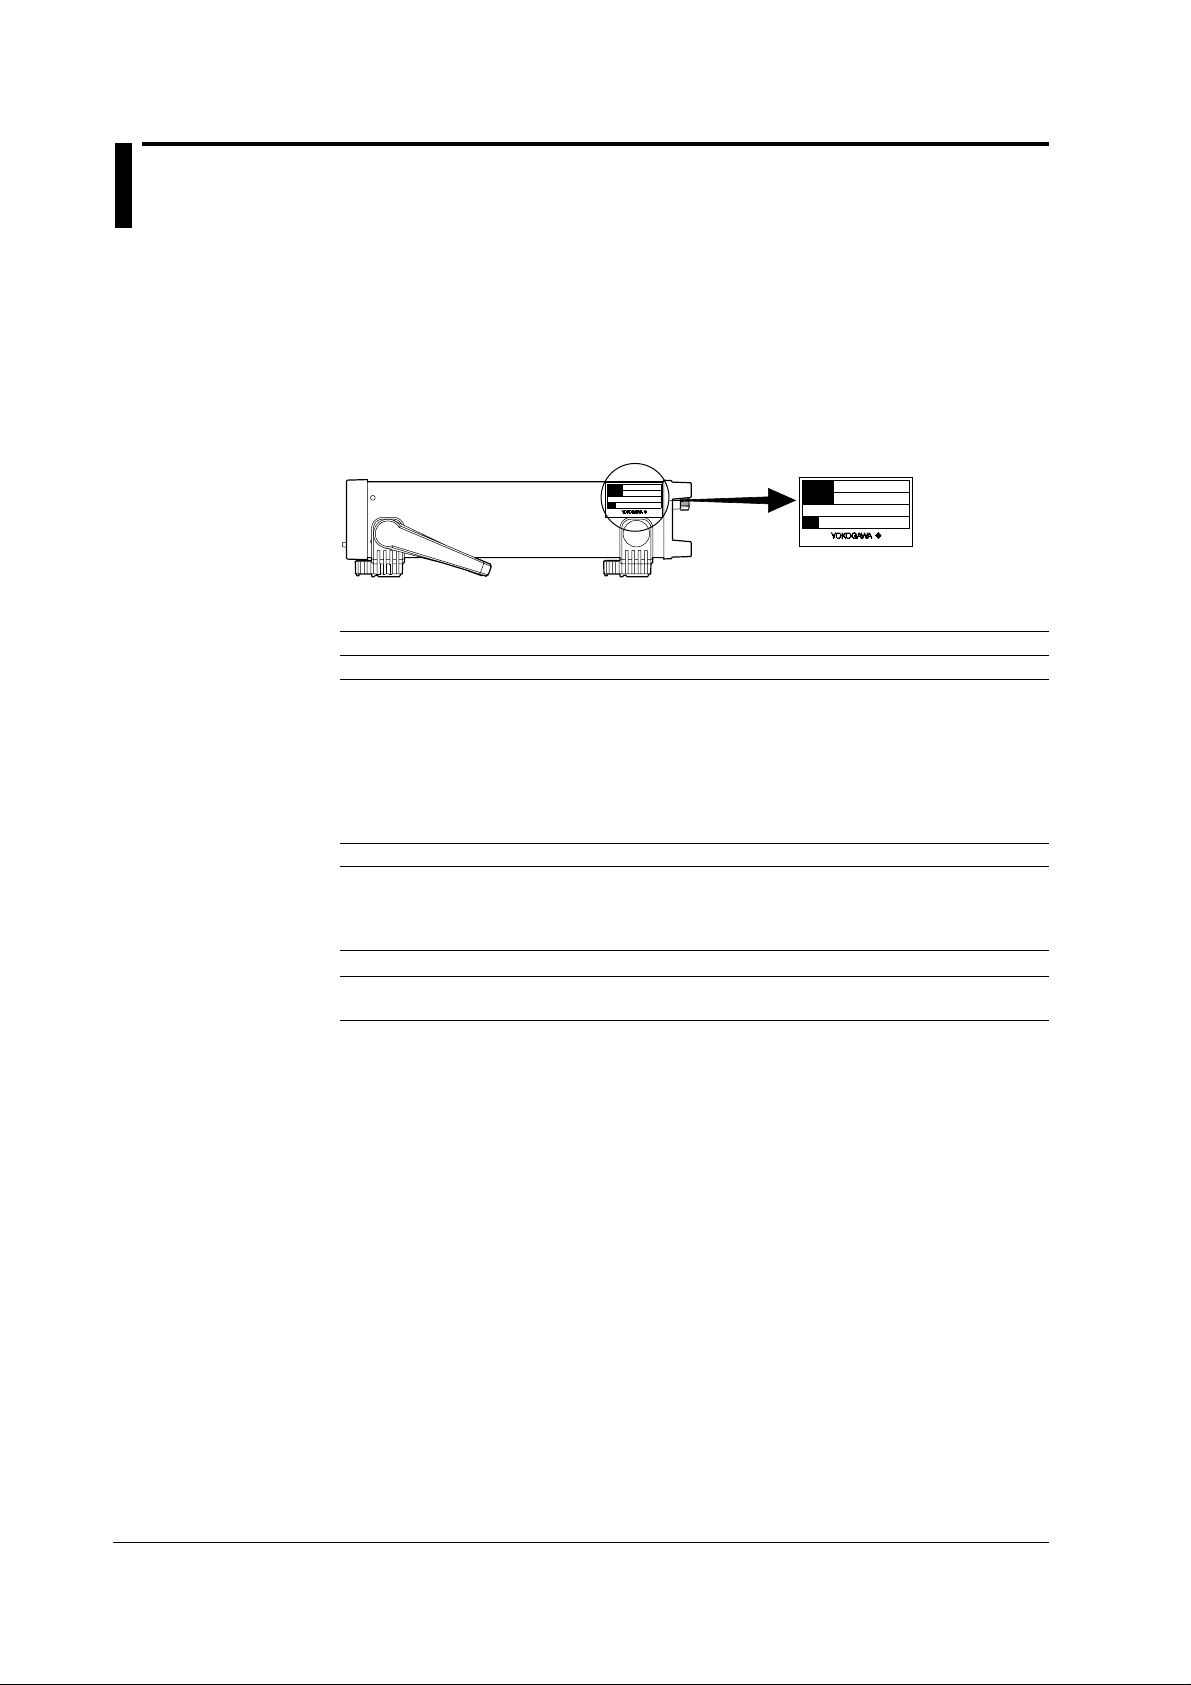
WT200 Main Unit
Check that the model code and suffix code given on the name plate located at the right
side of the main body are according to your order.
WT200 (model code: 253421)
MODEL
SUFFIX
NO.
Madein Japan
MODEL
SUFFIX
NO.
Made inJapan
Model and Suffix codes
Model code Suffix code Specifications
253421.........................................WT200
Power cord -D ..................... UL,CSA Standard Power Cord (Part NO.: A1006WD)
-F......................VDE Standard Power Cord (Part No.: A1009WD)
-R .....................SAA Standard Power Cord (Part No.: A1024WD)
-Q ..................... BS Standard Power Cord (Part No.: A1054WD)
Options
Communication Interface /C1.......GP-IB interface
(Select either one) /C2.......RS-232-C interface
External sensor input function /EX1 .... 2.5/5/10 V range
(Select either one) /EX2 .... 50/100/200 mV range
Harmonic analysis function /HRM ... –
External input/output function /DA4 ... 4-channel D/A output
(Select either one) /CMP .. 4-channel comparator, 4-channel D/A output
Ex: GP-IB interface, with UL/CSA power cord, with external sensor input 50/100/200 mV range,
with harmonic analysis function, and 4 channels D/A output →253421-D/C1/EX2/HRM/DA4
[Maximum rated voltage: 125 V; Maximum rated current: 7 A]
[Maximum rated voltage: 250 V; Maximum rated current: 10 A]
[Maximum rated voltage: 240 V; Maximum rated current: 10 A]
[Maximum rated voltage: 250 V; Maximum rated current: 10 A]
NO. (instrument number)
When contacting the dealer from which you purchased the instrument, please quote the
instrument No.
ii
IM 253421-01E
Page 4
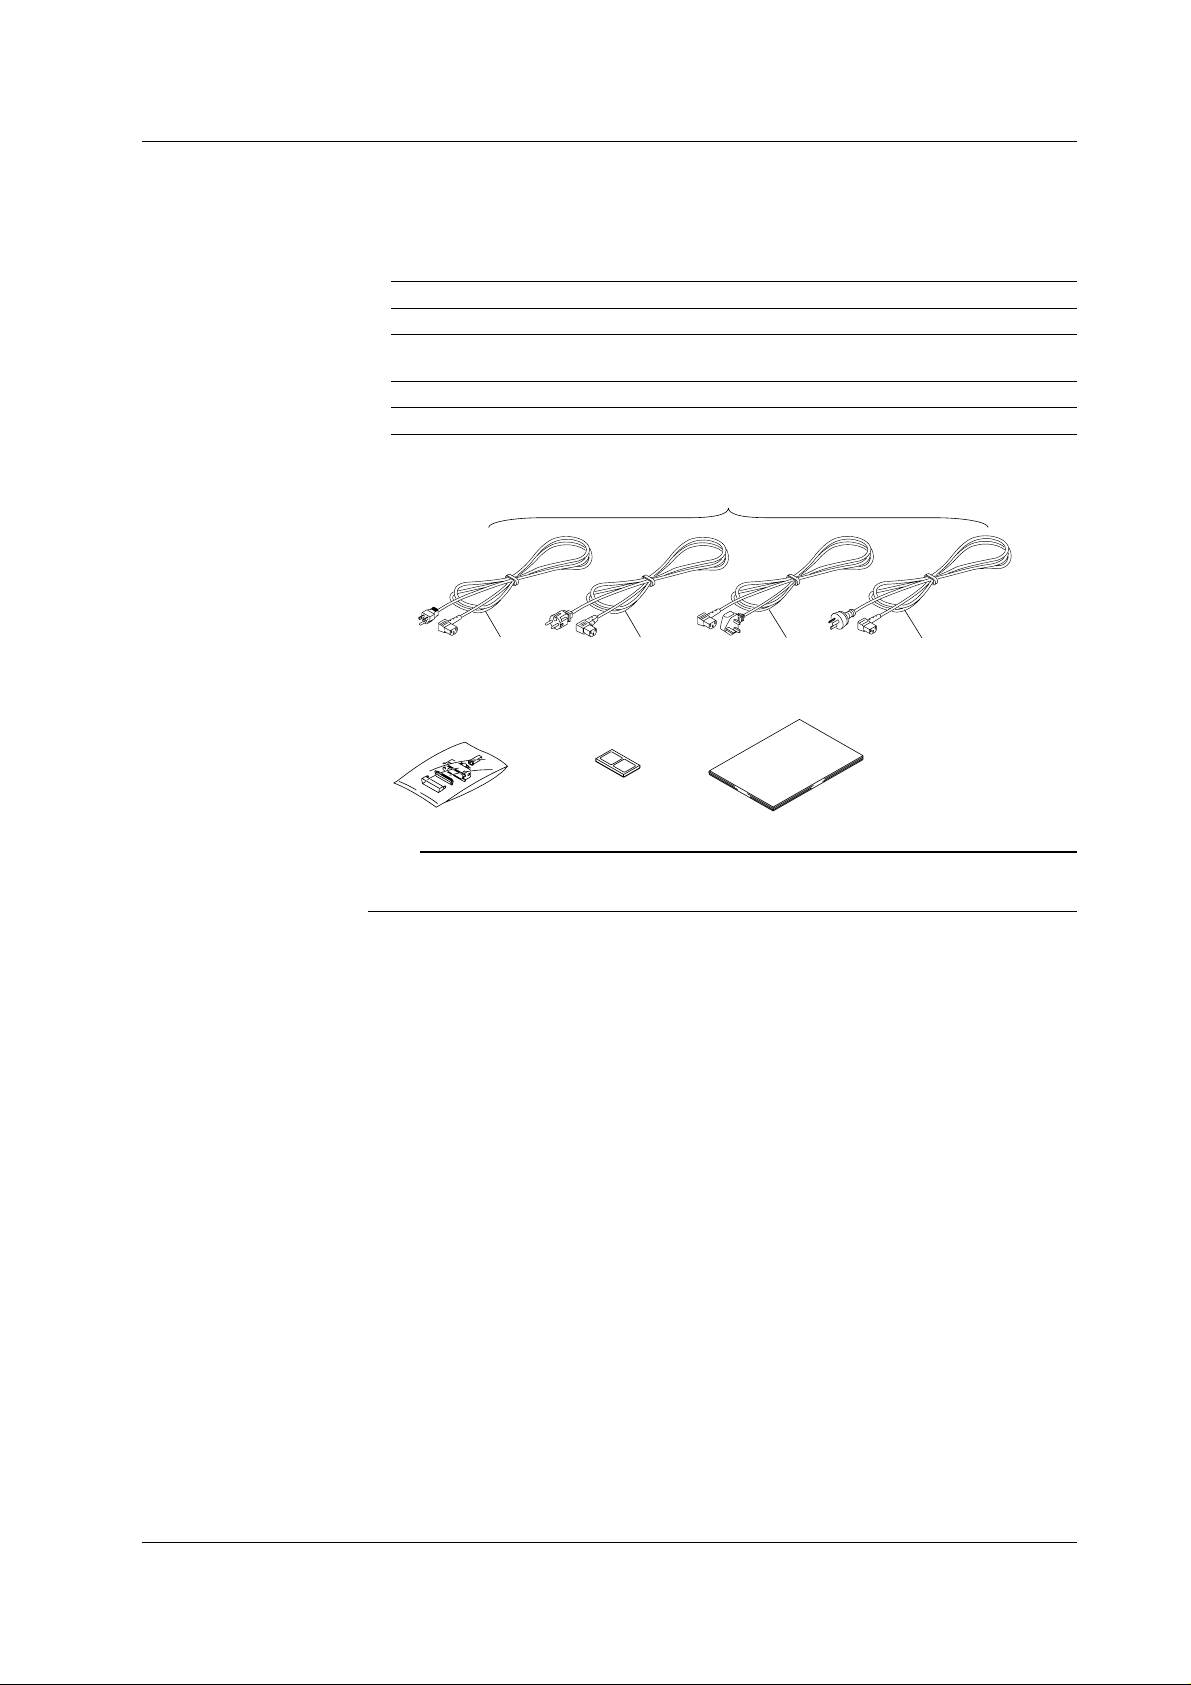
Standard Accessories
The following standard accessories are supplied with the instrument. Make sure that
all items are present and undamaged.
Name Part No. Q’ty Remarks
1 Power cord see page ii 1 —
2 24-pin connector A1004JD 1 For remote, D/A output
3 Rubber feet A9088ZM 1 set
4 User’s Manual IM253421-01E 1 this manual
Checking the Contents of the Package
(only provided with options /DA4 or /CMP)
1. An appropriate power cord according to
the instrument's suffix code is supplied.
D F
2. 3.
Q
4.
R
Note
We recommend you keep the packing box. The box is useful when you need to transport the
instrument.
IM 253421-01E
iii
Page 5
Safety Precautions
This instrument is a IEC safety class I instrument (provided with terminal for protective
grounding).
The following general safety precautions must be observed during all phases of
operation, service and repair of this instrument. If this instrument is used in a manner
not sepecified in this manual, the protection provided by this instrument may be
impaired.
Also,YOKOGAWA Electric Corporation assumes no liability for the customer’s failure to
comply with these requirements.
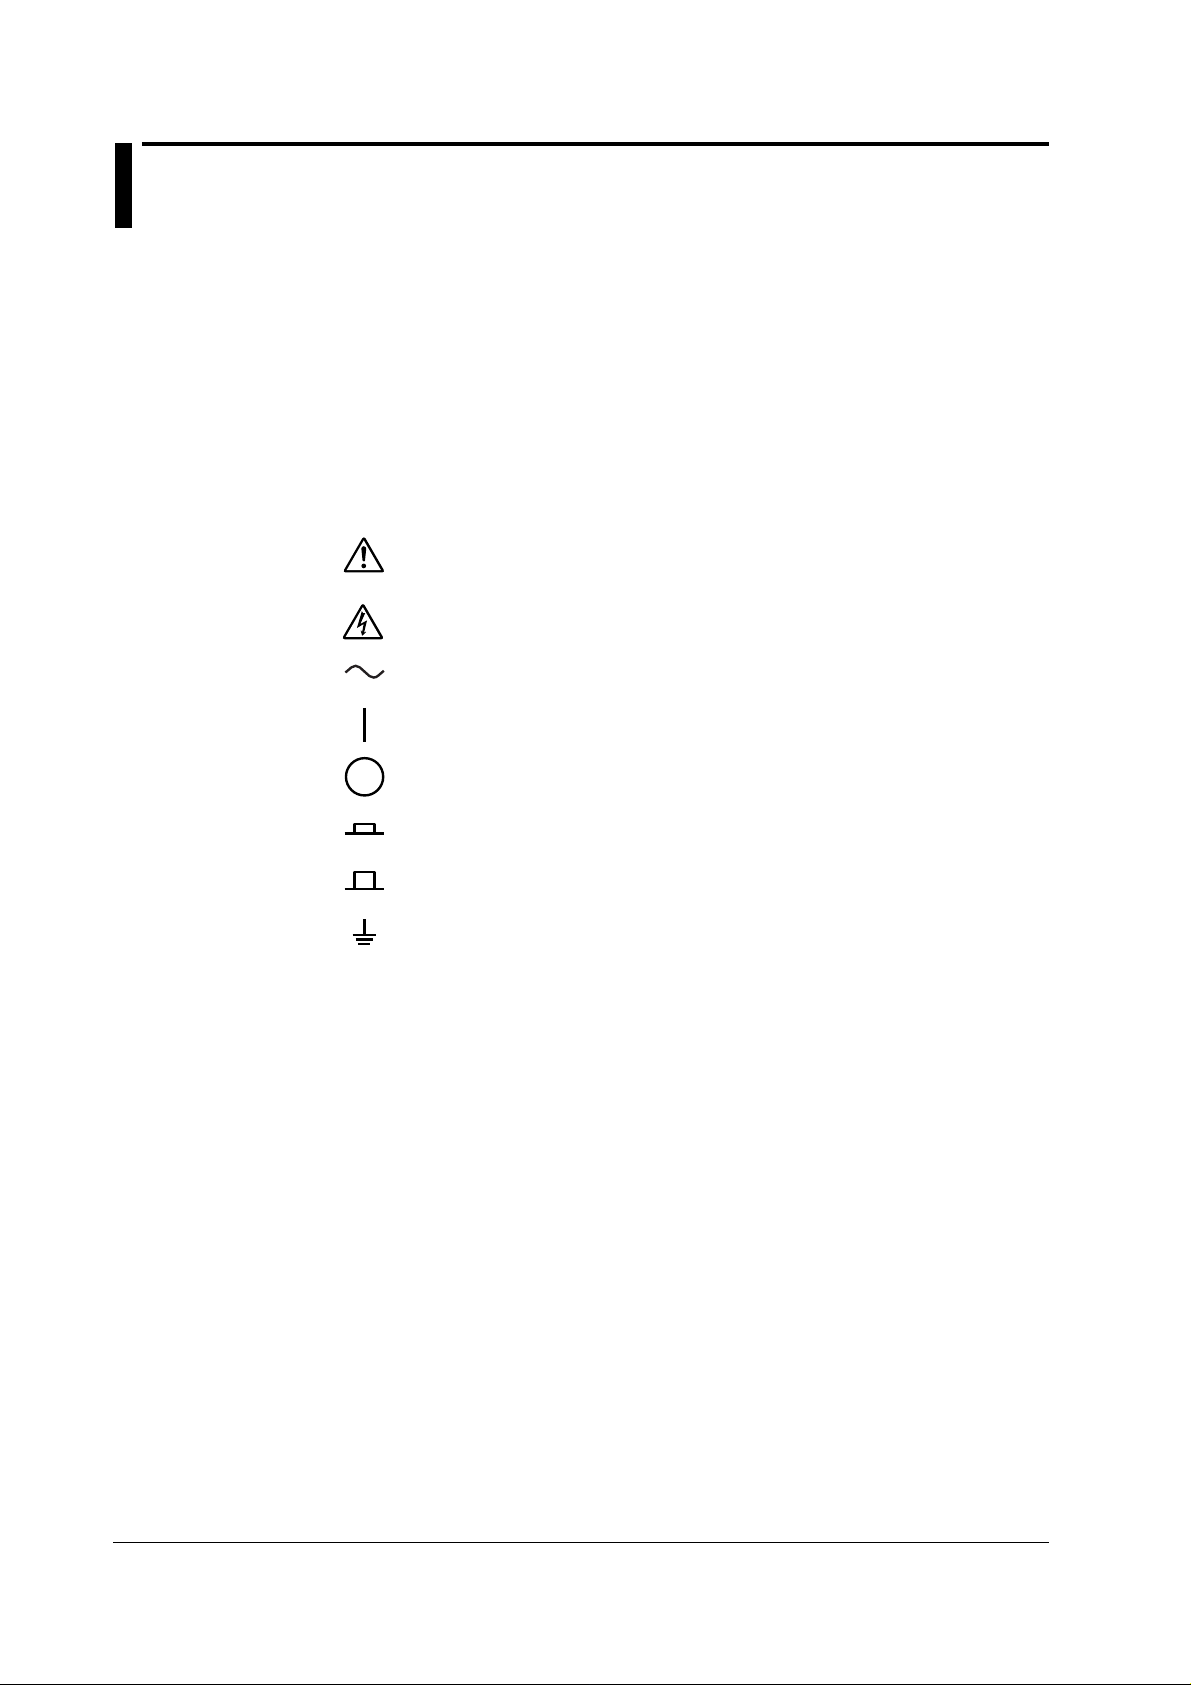
The following symbols are used on this instrument.
To avoid injury, death of personnel or damage to the instrument, the operator
must refer to an explanation in the User's Manual or Service Manual.
Danger, risk of electric shock
Alternating current
ON (power)
OFF (power)
In-position of a bistable push control
Out-position of a bistable push control
Ground
iv
IM 253421-01E
Page 6

Safety Precautions
Make sure to comply with the following safety precautions. Not complying might
result in injury or death.
WARNING
Do not Operate in an Explosive Atmosphere
Do not operate the instrument in the presence of flammable liquids or vapors.
Operation of any electrical instrument in such an environment constitutes a
safety hazard.
Protective Grounding
Make sure to connect the protective grounding to prevent an electric shock
before turning ON the power.
Necessity of Protective Grounding
Never cut off the internal or external protective grounding wire or disconnect the
wiring of protective grounding terminal. Doing so poses a potential shock
hazard.
Defect of Protective Grounding
Do not operate the instrument when protective grounding or fuse might be
defective.
Power Cord and Plug
To prevent an electric shock or fire, be sure to use the power cord supplied by
YOKOGAWA. The main power plug must be plugged in an outlet with
protective grounding terminal. Do no invalidate protection by using an extension
cord without protective grounding.
Power Supply
Ensure the source voltage matches the voltage of the power supply before
turning ON the power.
External Connection
To ground securely, connect the protective grounding before connecting to
measurement or control unit.
Fuse
The power fuse of this instrument cannot be replaced by the user, because it is
located inside the case. If you believe the fuse inside the case is blown, contact
your nearest YOKOGAWA dealer as listed on the back cover of this manual.
Do not Remove any Covers
There are some areas with high voltage. Do not remove any cover if the power
supply is connected. The cover should be removed by qualified personnel only.
IM 253421-01E
v
Page 7

Structure of this Manual
This User's Manual consists of the following 16 chapters and an index.
Chapter 1 Functional Overview and Digital Display
Chapter 2 Names and Uses of Parts and the Overrange and Error Displays
Chapter 3 Before Starting Measurements
Chapter 4 Setting Measurement Conditions and Measurement Range
Chapter 5 Displaying the Results of the Measurement and Computation
Chapter 6 Integration
Chapter 7 Using the Harmonic Analysis Function (Optional)
Chapter 8 Storing/Recalling Measured Data and Setting Parameters from the Internal
Chapter 9 Using External Input/Output
Chapter 10 Using the GP-IB Interface (Optional)
Chapter 11 Using the RS-232-C Interface (Optional)
Chapter 12 Initializing Setup Parameters and Performing Zero Level Compensation
Chapter 13 Communication Commands 1 (System of Commands before the IEEE 488.2-
Chapter 14 Communication Commands 2 (System of Commands Complying to the IEEE
Chapter 15 Adjustment, Calibration and Trouble-Shooting
Chapter 16 Specifications
Index Index of contents.
Describes the input signal flow, functional overview, digital numbers/characters,
initial menus that are displayed when a key is pressed, and other information..
Gives the name of each part and each key, and describes how to use it. This
chapter also gives the displays in case of overrange/error during measurement.
Describes points to watch during use and describes how to install the instrument,
wire the measuring circuits, connect the power cord and switch the power ON/OFF.
Explains settings such as measurement mode, filter ON/OFF, measurement range,
scaling in case of external PT/CT or external sensor (such as shunt or clamp),
averaging and measurement conditions.
Explains the procedures for displaying the voltage, current, active power, apparent
power, reactive power, power factor, phase angle, frequency, peak value, value
derived from four arithmetical operations, and crest factor.
Explains the procedures for integration of active power and current.
Explains the procedures when using the harmonic analysis function.
Memory
Explains the procedures when storing or recalling measured data or setting
parameters from the internal memory.
Explains the procedures for remote control, D/A output (option), external plotter/
printer output and comparator (option).
Explains the procedures for controlling the instrument by personal computer and
for sending measurement/computed data to a personal computer using the GP-IB
interface.
Explains the procedures for controlling the instrument by personal computer/
controller and for sending measurement/computed data to a personal computer/
controller using the RS-232-C interface.
Explains the procedures such as backing up setting parameter and initializing
settings.
1987 Standard)
Describes communication commands and sample programs that follow the rules
that existed before the establishment of the IEEE 488.2-1987 Standard.
488.2-1987 Standard)
Describes communication commands and sample programs that comply with the
IEEE 488.2-1987 Standard.
Explains the procedures for calibration, adjustment, the way to verify trouble, the
contents of error messages and the way to replace the fuse.
Describes the specifications of the instrument.
vi
IM 253421-01E
Page 8
Conventions Used in this Manual
Symbols Used
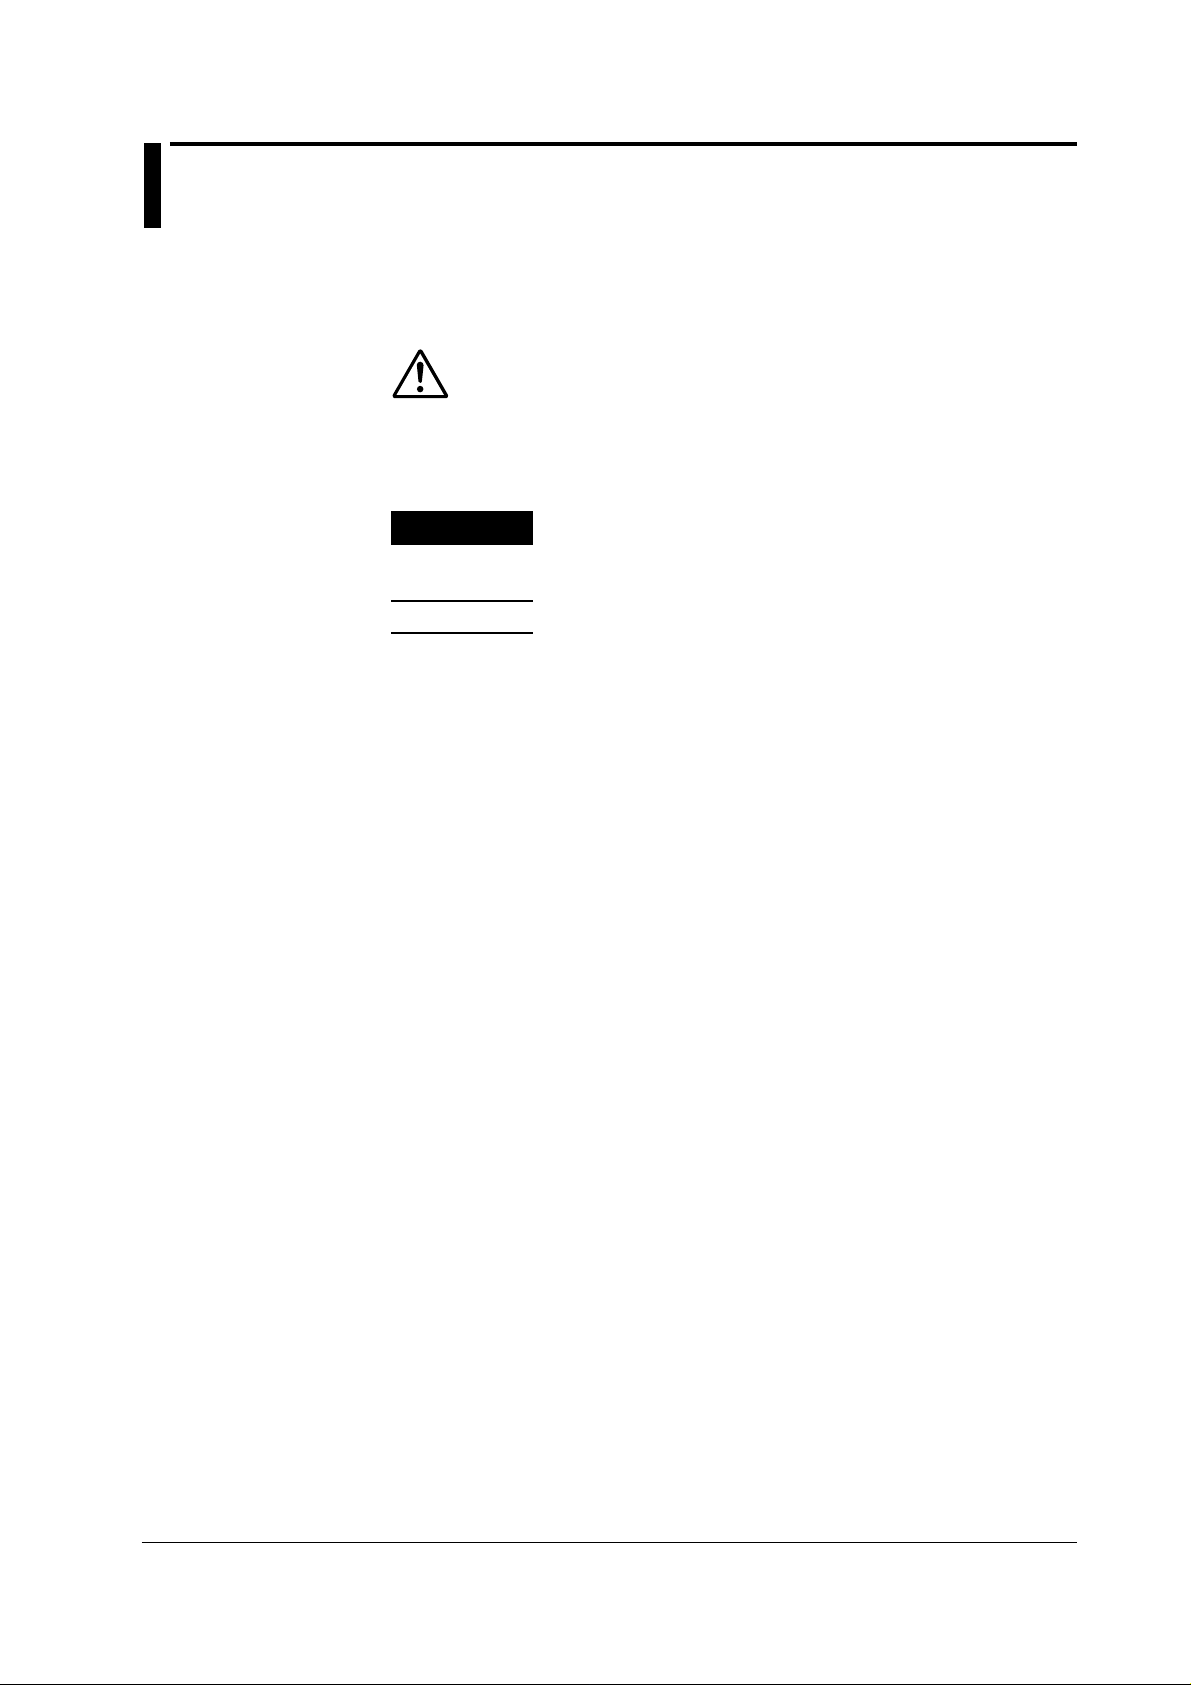
The following symbol marks are used throughout this manual to attract the operator’s
attention.
A symbol mark affixed to the instrument. Indicates danger to
personnel or instrument and the operator must see the User's
Manual. The symbol is used in the User's Manual to indicate the
reference.
WARNING
CAUTION
Note
Displayed Characters on the 7-Segment LED
In order to display all numbers and alphabetic characters on the 7-segment LED, some
of them are displayed in a slightly altered format. For details, see section 1.3.
Describes precautions that should be observed to prevent the
danger of serious injury or death to the user.
Describes precautions that should be observed to prevent the
danger of minor or moderate injury to the user, or the damage to
the property.
Provides information that is important for proper operation of the
instrument.
IM 253421-01E
vii
Page 9
Conventions Used in this Manual
Markings used for Descriptions of Operations
Keys
Indicates the relevant panel keys and indicators to carry out the
operation.
Procedure
The procedure is explained by a flow diagram. For the meaning of
each operation, see the example below. The operating procedures
are given with the assumption that you are not familiar with the
operation. Thus, it may not be necessary to carry out all the steps
when changing settings.
Explanation
Describes settings and restrictions relating to the operation.
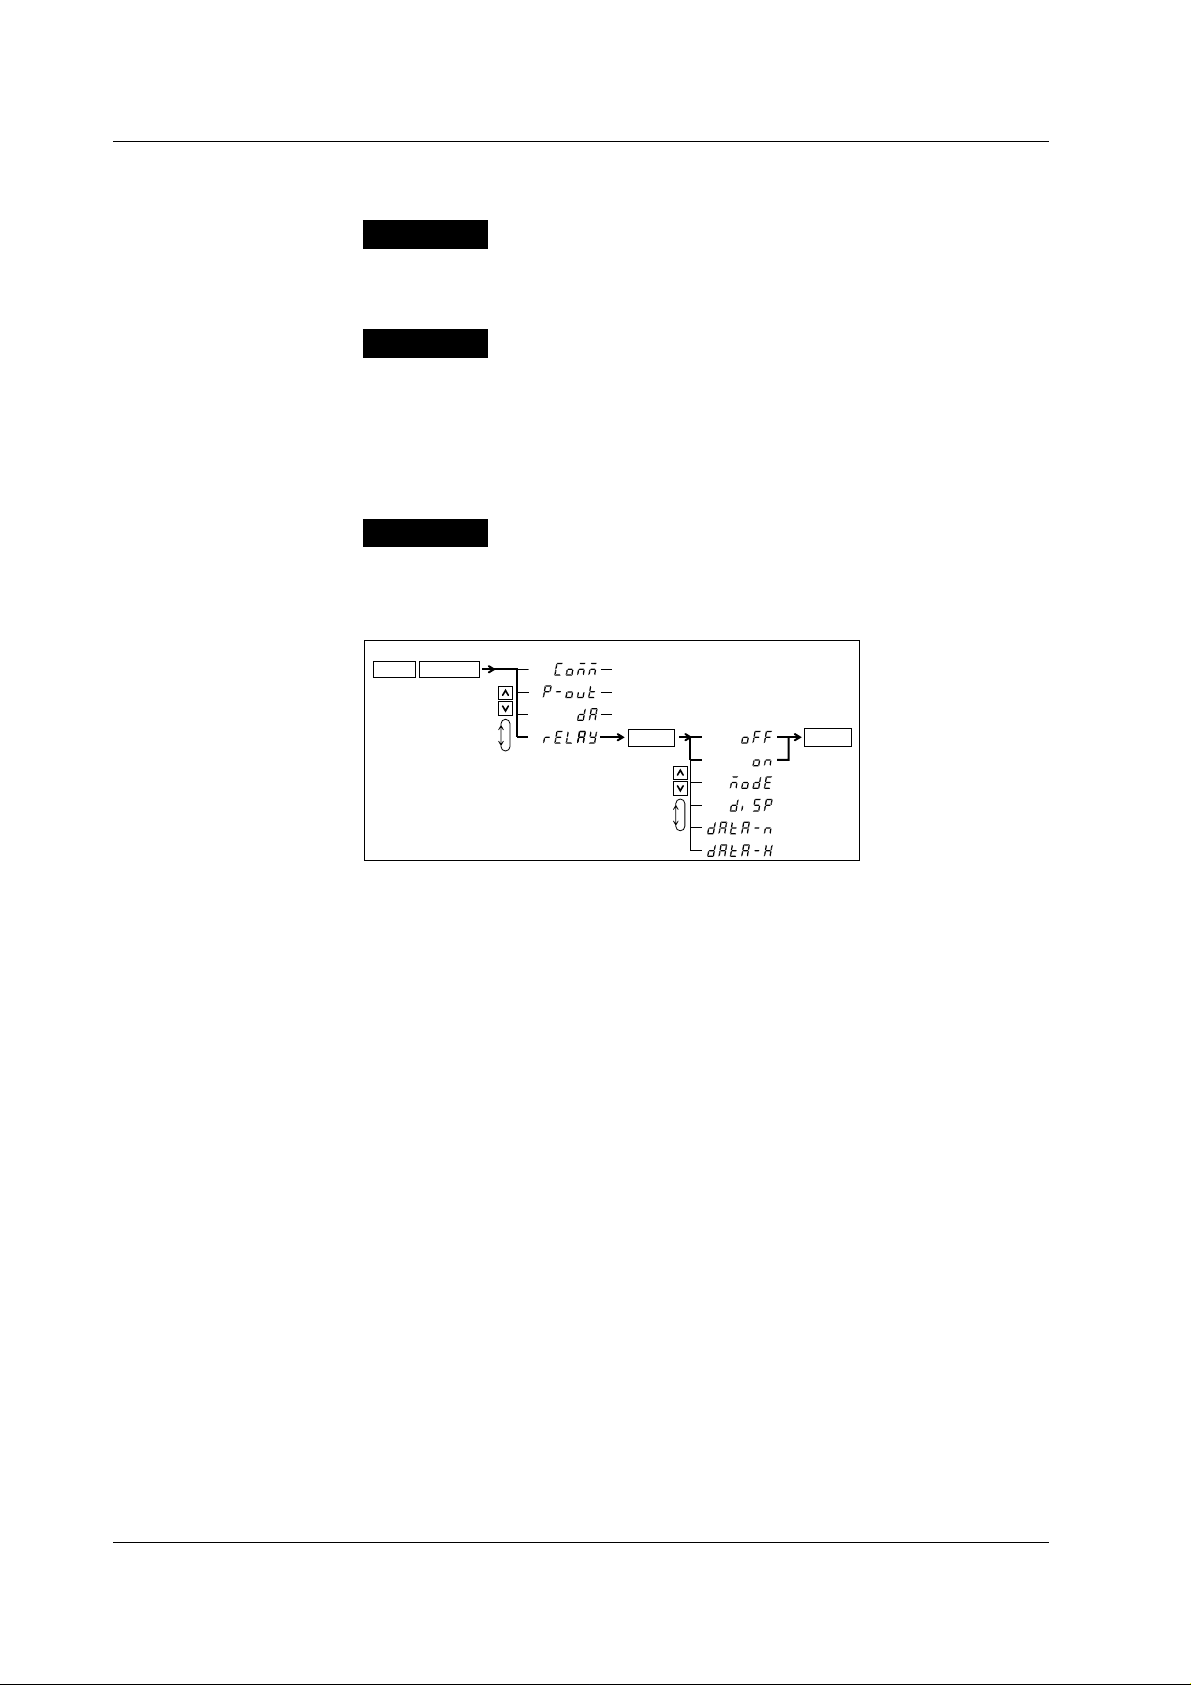
An example of an Operating Procedure
2.
(Display C)
3.
ENTER
1.
SHIFT
SETUP
OUTPUT
4.
(Display C)
5.
ENTER
End of
setting
The items in this figure are obtained by the following setting procedures. The blinking
part of the display can be set.
1. After pressing the SHIFT key and the SHIFT indicator is lit, press the SETUP
(OUTPUT) key. The output setting menu will appear on display C.
2. Select
rELAY
using the up/down keys.
Pressing either key, 4 selectable items will be displayed consecutively.
3. Verify the setting by pressing the ENTER key.
The setting menu corresponding to the item selected at step 2 will appear at
display
C.
4. Select
oFF
or on using the up/down keys.
Pressing either key, 6 selectable items will be displayed consecutively.
5. Verify the setting by pressing the ENTER key.
viii
IM 253421-01E
Page 10

Contents
1
Checking the Contents of the Package ...........................................................................................ii
Safety Precautions .........................................................................................................................iv
Structure of this Manual .................................................................................................................vi
Conventions Used in this Manual..................................................................................................vii
Chapter 1 Functional Overview and Digital Display
1.1 System Configuration and Block Diagram ....................................................................... 1-1
1.2 Functions .........................................................................................................................1-2
1.3 Digital Numbers/Characters, and Initial Menus................................................................1-5
Chapter 2 Names and Uses of Parts and the Overrange and Error Displays
2.1 Front Panel, Rear Panel and Top View............................................................................ 2-1
2.2 Operation Keys and Function Display..............................................................................2-2
2.3 Displays in case of Overrange/Error during Measurement .............................................. 2-3
Chapter 3 Before Starting Measurements
3.1 Usage Precautions...........................................................................................................3-1
3.2 Installing the Instrument ................................................................................................... 3-2
3.3 Wiring Precautions ........................................................................................................... 3-4
3.4 Improving the Measurement Accuracy............................................................................. 3-6
3.5 Connecting the Power Supply.......................................................................................... 3-7
3.6 Wiring the Measurement Circuit....................................................................................... 3-8
3.7 Wiring the Measurement Circuit when Using External PT/CT ......................................... 3-9
3.8 Wiring the Measurement Circuit when Using the External Sensor ................................ 3-10
3.9 Turning the Power ON/OFF, Opening Messages...........................................................3-12
2
3
4
5
6
7
8
9
10
Chapter 4 Setting Measurement Conditions and Measurement Range
4.1 Selecting the Measurement Mode ................................................................................... 4-1
4.2 Selecting the Measurement Synchronization Source ...................................................... 4-3
4.3 Turning the Filter ON/OFF ............................................................................................... 4-4
4.4 Selecting the Measurement Range in case of Direct Input.............................................. 4-5
4.5 Setting the Scaling Constant when External PT/CT is Used ...........................................4-8
4.6 Selecting the Measurement Range and Setting the Scaling Constant when External
Sensor is Used (option) ................................................................................................. 4-10
4.7 Using the Averaging Function ........................................................................................ 4-12
4.8 Using the MAX Hold Function ........................................................................................ 4-14
4.9 Using the Four Arithmetical Operation Function ............................................................ 4-15
4.10 Computing the Crest Factor........................................................................................... 4-18
4.11 Computing the Average Active Power during Integration............................................... 4-19
4.12 Selecting the Number of Displayed Digits...................................................................... 4-20
Chapter 5 Displaying the Results of the Measurement and Computation
5.1 Displaying Voltage, Current, and Active Power................................................................ 5-1
5.2 Displaying Apparent Power, Reactive Power, and Power Factor.....................................5-3
5.3 Displaying the Phase Angle ............................................................................................. 5-4
5.4 Displaying the Frequency ................................................................................................ 5-5
5.5 Displaying Peak Value, Four Arithmetic Operation Value, and Crest Factor.................... 5-7
11
12
13
14
15
16
Index
IM 253421-01E
ix
Page 11
Contents
Chapter 6 Integration
6.1 Integrator Functions ......................................................................................................... 6-1
6.2 Setting Integration Mode, Integration Type, and Integration Timer .................................. 6-4
6.3 Displaying Integrated Values ........................................................................................... 6-6
6.4 Precautions Regarding Use of Integrator Function .......................................................... 6-9
Chapter 7 Using the Harmonic Analysis Function (Optional)
7.1 Harmonic Analysis Function............................................................................................. 7-1
7.2 Setting the PLL Source and Harmonic Distortion Method................................................ 7-3
7.3 Switching the Harmonic Analysis Function ON/OFF........................................................ 7-5
7.4 Setting the Harmonic Order and Displaying the Results of Harmonic Analysis ............... 7-6
Chapter 8 Storing/Recalling Measured Data and Setting Parameters from the
Internal Memory
8.1 Storing/Recalling Measured Data .................................................................................... 8-1
8.2 Storing/Recalling Setting Parameters .............................................................................. 8-5
Chapter 9 Using External Input/Output
9.1 Remote Control and D/A Output Connector (optional)..................................................... 9-1
9.2 Remote Control (optional) ................................................................................................ 9-2
9.3 D/A Output (optional) ....................................................................................................... 9-3
9.4 Comparator Function (optional) ....................................................................................... 9-7
9.5 Setting the Comparator Mode (optional) ........................................................................ 9-10
9.6 Setting the Comparator Limit Values (optional).............................................................. 9-11
9.7 Comparator Display (optional) ....................................................................................... 9-15
9.8 Turning the Comparator Function ON/OFF (optional).................................................... 9-17
9.9 Outputting to an External Plotter or Printer .................................................................... 9-18
Chapter 10 Using the GP-IB Interface (Optional)
10.1 GP-IB Interface Functions and Specifications ............................................................... 10-1
10.2 Responses to Interface Messages................................................................................. 10-3
10.3 Status Byte Format (before the IEEE 488.2-1987 Standard)......................................... 10-4
10.4 Output Format................................................................................................................ 10-5
10.5 Setting the Address/Addressable Mode....................................................................... 10-11
10.6 Setting the Output Items .............................................................................................. 10-13
10.7 System of Commands before the IEEE 488.2-1987 Standard .................................... 10-16
Chapter 11 Using the RS-232-C Interface (Optional)
11.1 RS-232-C Interface Functions and Specifications ......................................................... 11-1
11.2 Connecting the Interface Cable ..................................................................................... 11-3
11.3 Setting the Mode, Handshaking Method, Data Format and Baud Rate ......................... 11-6
11.4 Format and Commands of Output Data (before the IEEE 488.2-1987 Standard) ......... 11-9
Chapter 12
Initializing Setup Parameters and Performing Zero Level Compensation
12.1 Back-up of Setting Parameters...................................................................................... 12-1
12.2 Initializing Setting Parameters ....................................................................................... 12-2
12.3 Performing Zero Level Compensation ........................................................................... 12-4
x
IM 253421-01E
Page 12

Contents
Chapter 13 Communication Commands 1 (System of Commands before the
IEEE 488.2-1987 Standard)
13.1 Commands.....................................................................................................................13-1
13.2 Sample Program.......................................................................................................... 13-13
13.3 For Users Using Communication Commands of Digital Power Meter 2533E.............. 13-21
Chapter 14 Communication Commands 2 (System of Commands Complying to
the IEEE 488.2-1987 Standard)
14.1 Overview of IEEE 488.2-1987........................................................................................14-1
14.2 Program Format............................................................................................................. 14-3
14.2.1 Symbols Used in Syntax Descriptions ............................................................... 14-3
14.2.2 Messages........................................................................................................... 14-3
14.2.3 Commands......................................................................................................... 14-5
14.2.4 Responses ......................................................................................................... 14-7
14.2.5 Data ................................................................................................................... 14-7
14.2.6 Synchronization with the Controller ................................................................... 14-9
14.3 Commands...................................................................................................................14-10
14.3.1 Command List.................................................................................................. 14-10
14.3.2 AOUTput Group ............................................................................................... 14-14
14.3.3 COMMunicate Group ....................................................................................... 14-15
14.3.4 CONFigure Group............................................................................................ 14-17
14.3.5 DISPlay Group ................................................................................................. 14-21
14.3.6 HARMonics Group ........................................................................................... 14-22
14.3.7 INTEGrate Group............................................................................................. 14-23
14.3.8 MATH ............................................................................................................... 14-24
14.3.9 MEASure Group............................................................................................... 14-25
14.3.10 RECall Group................................................................................................. 14-32
14.3.11 RELay Group ................................................................................................. 14-33
14.3.12 SAMPle Group ............................................................................................... 14-35
14.3.13 ST ATus Group................................................................................................ 14-36
14.3.14 STORe Group ................................................................................................ 14-37
14.3.15 Common Command Group............................................................................ 14-38
14.4 Status Report............................................................................................................... 14-41
14.4.1 Overview of the Status Report ......................................................................... 14-41
14.4.2 Status Byte....................................................................................................... 14-42
14.4.3 Standard Event Register.................................................................................. 14-43
14.4.4 Extended Event Register ................................................................................. 14-44
14.4.5 Output Queue and Error Queue....................................................................... 14-45
14.5 Sample Program.......................................................................................................... 14-46
14.6 ASCII Character Codes ............................................................................................... 14-50
14.7 Communication-related Error Messages ..................................................................... 14-51
Chapter 15 Maintenance and Troubleshooting
15.1 Adjustments ................................................................................................................... 15-1
15.2 Calibration...................................................................................................................... 15-5
15.3 In Case of Malfunctioning ............................................................................................ 15-11
15.4 Error Codes and Corrective Actions............................................................................. 15-12
15.5 Replacing the Fuse...................................................................................................... 15-14
15.6 Recommended Replacement Parts............................................................................. 15-15
1
2
3
4
5
6
7
8
9
10
11
12
13
14
15
16
Index
IM 253421-01E
xi
Page 13

Contents
Chapter 16 Specifications
16.1 Input............................................................................................................................... 16-1
16.2 Measurement Functions ................................................................................................ 16-3
16.3 Frequency Measurement............................................................................................... 16-5
16.4 Communication (optional).............................................................................................. 16-5
16.5 Computing Functions..................................................................................................... 16-5
16.6 Display Functions........................................................................................................... 16-6
16.7 Integrator Function......................................................................................................... 16-6
16.8 Internal Memory Function .............................................................................................. 16-7
16.9 D/A Converter (optional) ................................................................................................ 16-7
16.10 External Input (optional)................................................................................................. 16-7
16.11 Comparator Output (optional) ........................................................................................ 16-7
16.12 External Contorol and Input Signals (in combination with the D/A converter and
comparator options) ....................................................................................................... 16-8
16.13 Total Harmonic Analysis Function (optional) .................................................................. 16-8
16.14 General Specifications ................................................................................................... 16-9
16.15 External Dimensions .................................................................................................... 16-10
Index
xii
IM 253421-01E
Page 14
Chapter 1 Functional Overview and Digital Display
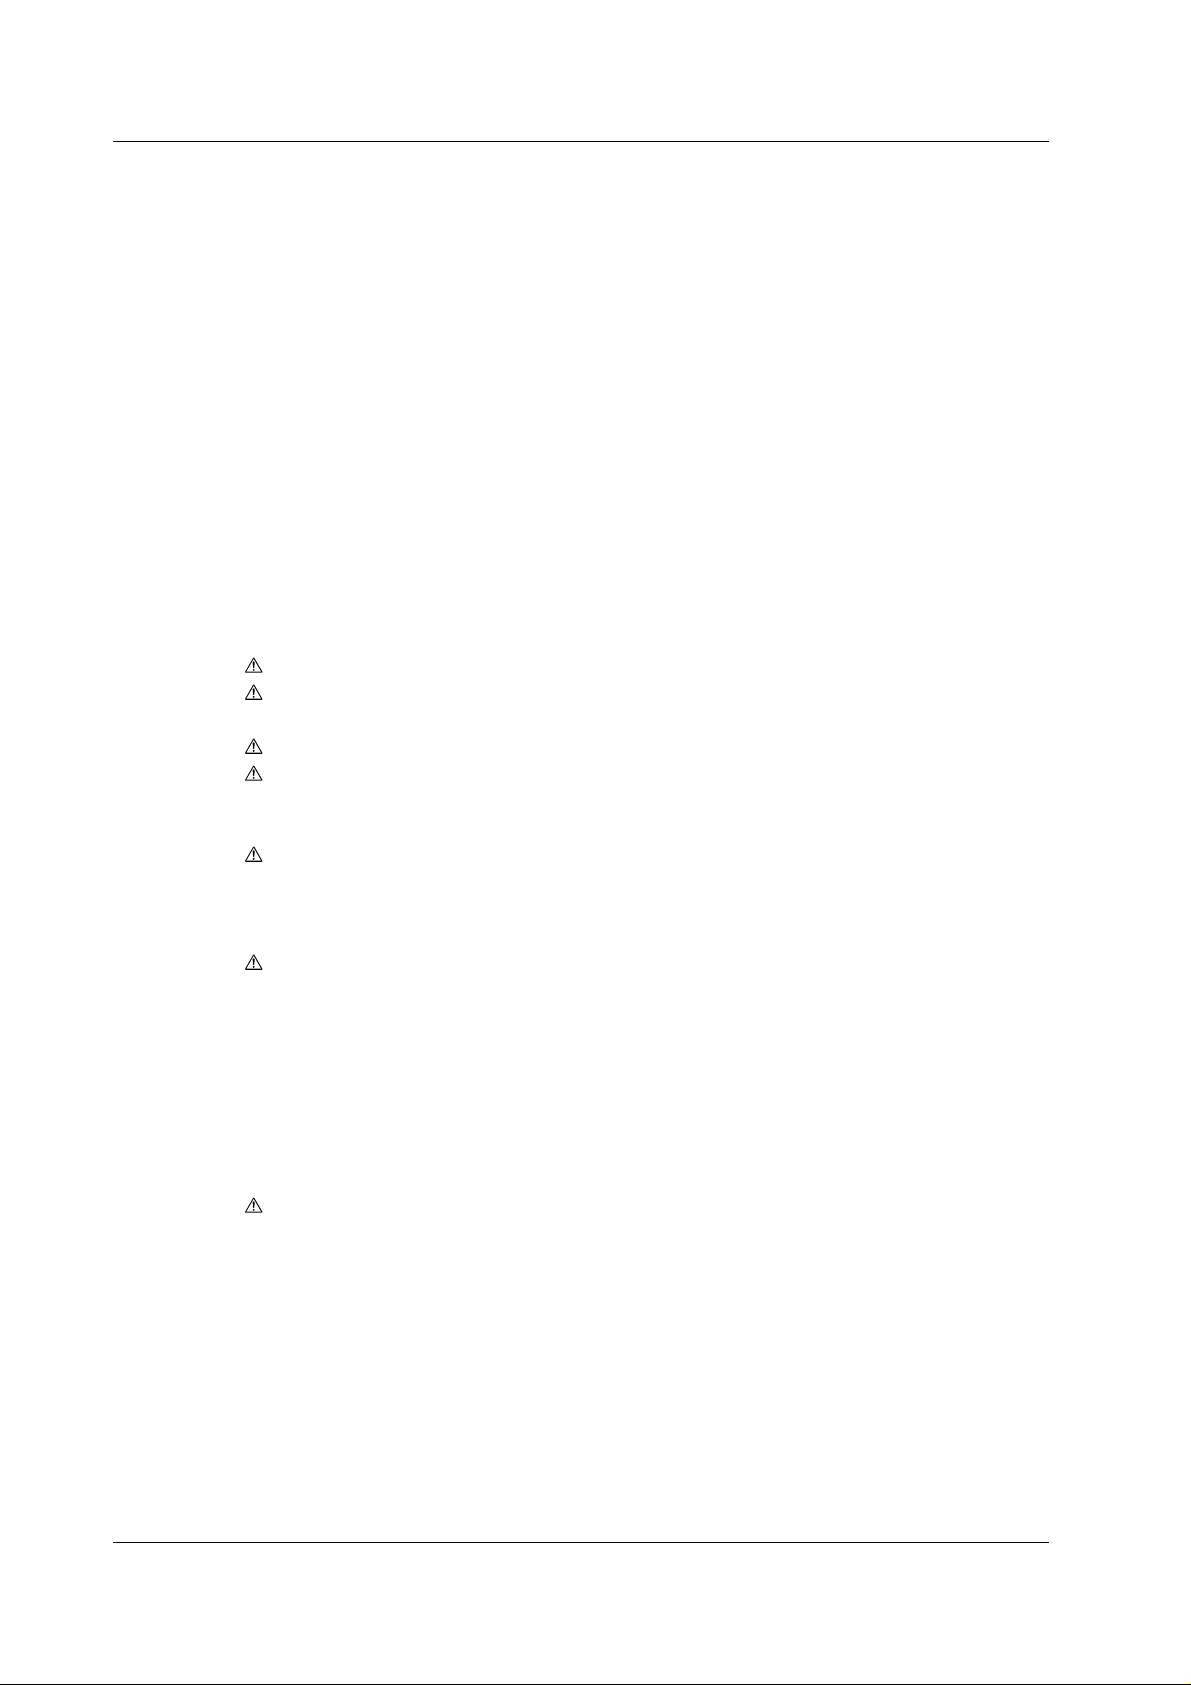
1.1 System Configuration and Block Diagram
System Configuration
Block Diagram
VOLTAGE INPUT
LPF
CURRENT INPUT
LPF
Equipment
under
test
A/D
Zero Cross
A/D
Zero Cross
INPUT
Detector
Detector
PT
CT
sensor
ISO
ISO
Ext.
Voltage
input
Current
input
A/D
interface
Lead/Lag
Detector
EEPROM
DSP
Input
either
one
Input
either
one
WT200
(253421)
COUNTER × 2
CLOCK
Contact / relay output
Analog output
GP-IB or
RS-232-C
CPU
SAMPLING
CLOCK
Bus
Arbiter
FREQUENCY
HARMONICS
PLL
DMAC
RAM
(Option)
Arbiter
CPU
Bus
Recorder
Personal
Computer
Ext. printer
or plotter
ROM
RAM
KEY&DISPLAY
CONTROLLER
GP-IB
or
RS-232-C
D/A OUTPUT
EEPROM
(Option)
COMPARATOR
(Option)
1
Functional Overview and Digital Display
IM 253421-01E
This instrument consists of various sections: input (voltage input and current input
circuits), DSP, CPU, display and interface section.
In the voltage input circuit, the input voltage is formalized by a voltage divider and
operational amplifier, then sent to the A/D converter.
In the current input circuit, the input current passes through a shunt resistor that forms
a closed circuit. The voltage across shunt resistor is amplified and normalized and
then input to the A/D converter. This method enables switching of the current range
without opening the current measurement circuit, so the current range can be switched
while electricitiy is supplied to the circuit. This also enables remote control via
communications outputs.
The output from the A/D converter in the current input and voltage input circuits is sent
to the DSP (Digital Signal Processor) via a photo-isolator, which is used to provide
insulation between the current input circuit (or voltage circuit) and the DSP. One DSP
is provided for each input element (current/voltage). For example, a total of 3 DSP’s
are used for the three-phase, four-wire model. The DSP performs averaging of
voltage, current and active power for each sampled data sent from the A/D converter.
After processing of a certain number of sets of data has been completed, computation
of apparent power, reactive power, power factor and phase angle starts.
Computation results are then sent from the DSP to the CPU, where computation such
as range conversion, and scaling is carried out. Control of display and outputs is also
performed by the CPU.
1-1
Page 15

1.2 Functions
Input Functions
Voltage and Current Input Sections
A voltage or current supplied to each input terminal is normalized then sent to the A/D
converter, where the voltage or current is converted into digital signals. The digital
signals are then sent via photo-isolator to a 16-bits high-speed DSP (Digital Signal
Processor) or CPU, where computation of the measured value is carried out.
Frequency Measuring Range
Measurement of DC voltage, current and power as well as AC voltage and current in
the frequency range 10 Hz to 50 kHz.
Filter
This instrument carries out various measurements after synchronizing the frequency of
the input signals. Therefore, correct measurements are necessary. Thus, a filter is
being applied to the frequency measurement circuit to eliminate noise of waveforms,
such as inverted and distortion waveforms.
Wiring Method
The wiring method indicates the circuit configuration used to measure the voltage,
current, and power. The WT200 uses a single-phase, two-wire (1φ2W) wiring method.
Display Functions
This function enables display of measured/computed values using three red highintensity 7-segment LED displays. A total of three values can be displayed at once.
Peak Measurement Function
This function measures the peak values of the voltage and current. This value is used
to compute the crest factor.
MAX Hold Function
This function holds the maximum values of the voltage, current, active power, apparent
power, reactive power, voltage peak, and current peak. It holds the maximum value
that exists while the MAX hold function is enabled.
Computing Functions
Apparent Power, Reactive Power, Power Factor and Phase Angle
Based on the measurement values of voltage, current and active power, the values of
apparent power, reactive power, power factor and phase angle can be computed.
Scaling
When performing voltage or current measurements with an external PT, CT, shunt,
external sensor (clamp) or such connected, you can set a scaling factor to the primary/
secondary ratio. This is called scaling. This function enables display of the measured
values of voltage, current, active power, reactive power, integrated current and
integrated power factor in terms of primary-side values.
Averaging
This function is used to perform exponential or moving averaging on the measured
values before displaying them in cases where the measured values are not stable.
Four Arithmetic Operation
Results from six types of arithmetic operations can be displayed. (A+B, A–B, A
2
/B, A/B2)
A
*B, A/B,
1-2
Crest Factor
This function determines the crest factor of the voltage and current using peak and
RMS values.
IM 253421-01E
Page 16

1.2 Functions
Integrator Functions
Average active power during integration
This function computes the average active power within the integration period. It is
derived by dividing the watt hour (integrated active power) by the elapsed time of
integration.
This function enables integration of active power and current. All measurement values
(and computed values) can be displayed, even when integration is in progress, except
for the integrated values (watt hour and ampere hour) and elapsed integration time.
Since also integrated values of negative polarity can be displayed, the consumed watt
hour (ampere hour) value of the positive side and the watt hour value returning to the
power supply of the negative side can be displayed seperately.
The following two integration methods are available:
• Standard type
Integrates the active power or current that is obtained using the normal measurement
method, which obtains the active power or current from the sampled data over the
period that is synchronized to the input signal. Select the standard type for steadystate input signals that have a constant period such as a sinusoid.
• Advanced type
Integrates the active power or current obtained over a fixed period of sampled data,
irrespective of the period of the input signal. Select the advanced type for intermittent
signals with a frequency of 50 or 60 Hz.
1
Functional Overview and Digital Display
Frequency Measurement Function
This function measures the frequency of the voltage and current.
Measuring range is from 10 Hz to 50 kHz (however, depending on the internal timing of
the instrument, measurement might be carried out in the range from 4 Hz to 10 Hz
also).
Harmonic Analysis Function (optional)
This function enables computation of voltage, current, active power and so forth of up
to the 50th order, the relative harmonic content of harmonic orders and the phase angle
of each order compared to the fundamental (first order). Furthermore, the total rms
value (fundamental + harmonic) of the voltage, current and active power, and the
harmonic distortion factor (THD) can be calculated.
Storing/Recalling Measured Data and Setting Parameters
This function enables the storage of measured data and setting parameters into the
internal memory. Furthermore, after recalling measured data or setting parameters,
these data can be displayed or output by communication interface.
D/A Output Function (optional)
This function enables output of measured values of voltage, current, active power,
apparent power, reactive power, power factor and phase angle as a DC analog signal
with full scale of ±5 V. Output items of up to 4 channels can be selected.
Comparator Function (optional)
This function compares the measured values of voltage, current, active power,
apparent power, reactive power, power factor and phase angle and such with preset
limit values. When the measured values cross those preset limits, a contact output
relay will be activated. Output items up to 4 channels can be set.
IM 253421-01E
1-3
Page 17

1.2 Functions
Remote Control Functions (optional)
External Input
This instrument can be controlled using the following TTL-level, low pulse, logic
signals.
EXT HOLD (when options /DA4, /CMP are installed)
Holds updating of the displayed values or releases the hold status.
EXT TRIG (when option /DA4 is installed)
Updates the displayed values in hold mode.
EXT START (when option /DA4 is installed)
Starts integration.
EXT STOP (when option /DA4 is installed)
Stops integration.
EXT RESET (when option /DA4 is installed)
Resets the integration results.
External Output
This instrument can output the following TTL-level, low pulse, logic signals.
EXT BUSY (when option /DA4 is installed)
Outputs continuously from integration start through integration stop.
Communication Functions (Option)
Either a GP-IB or RS-232-C interface is provided as standard according to the
custormer’s preference. Measured/computed data of up to 14 channels can be output.
It is also possible to control this instrument from the personal computer.
Output Function to an External Plotter and Printer
Measured/computed data can be printed on an external plotter or printer using the GPIB or RS-232-C interface.
Other Useful Functions
Backup of Setting Parameters
This instrument backs up the setting parameters (including computed values) in case
power is cut off accidentally as a result of a power failure or for any other reason.
Initializing Setting Parameters
This function enables you to reset the setting parameters to initial (factory) settings.
Zero-level compensation
Zero level compensation refers to creating a zero input condition inside the WT200 and
setting the level at that point as the zero level. Zero level compensation must be
performed in order to satisfy the specifications of this instrument. When the
measurement range is changed, zero level compensation is performed automatically.
However, if the measurement range is not changed for a long time, the zero level may
shift due to environmental changes around the instrument. In such case, you can
manually perform zero level compensation.
1-4
IM 253421-01E
Page 18
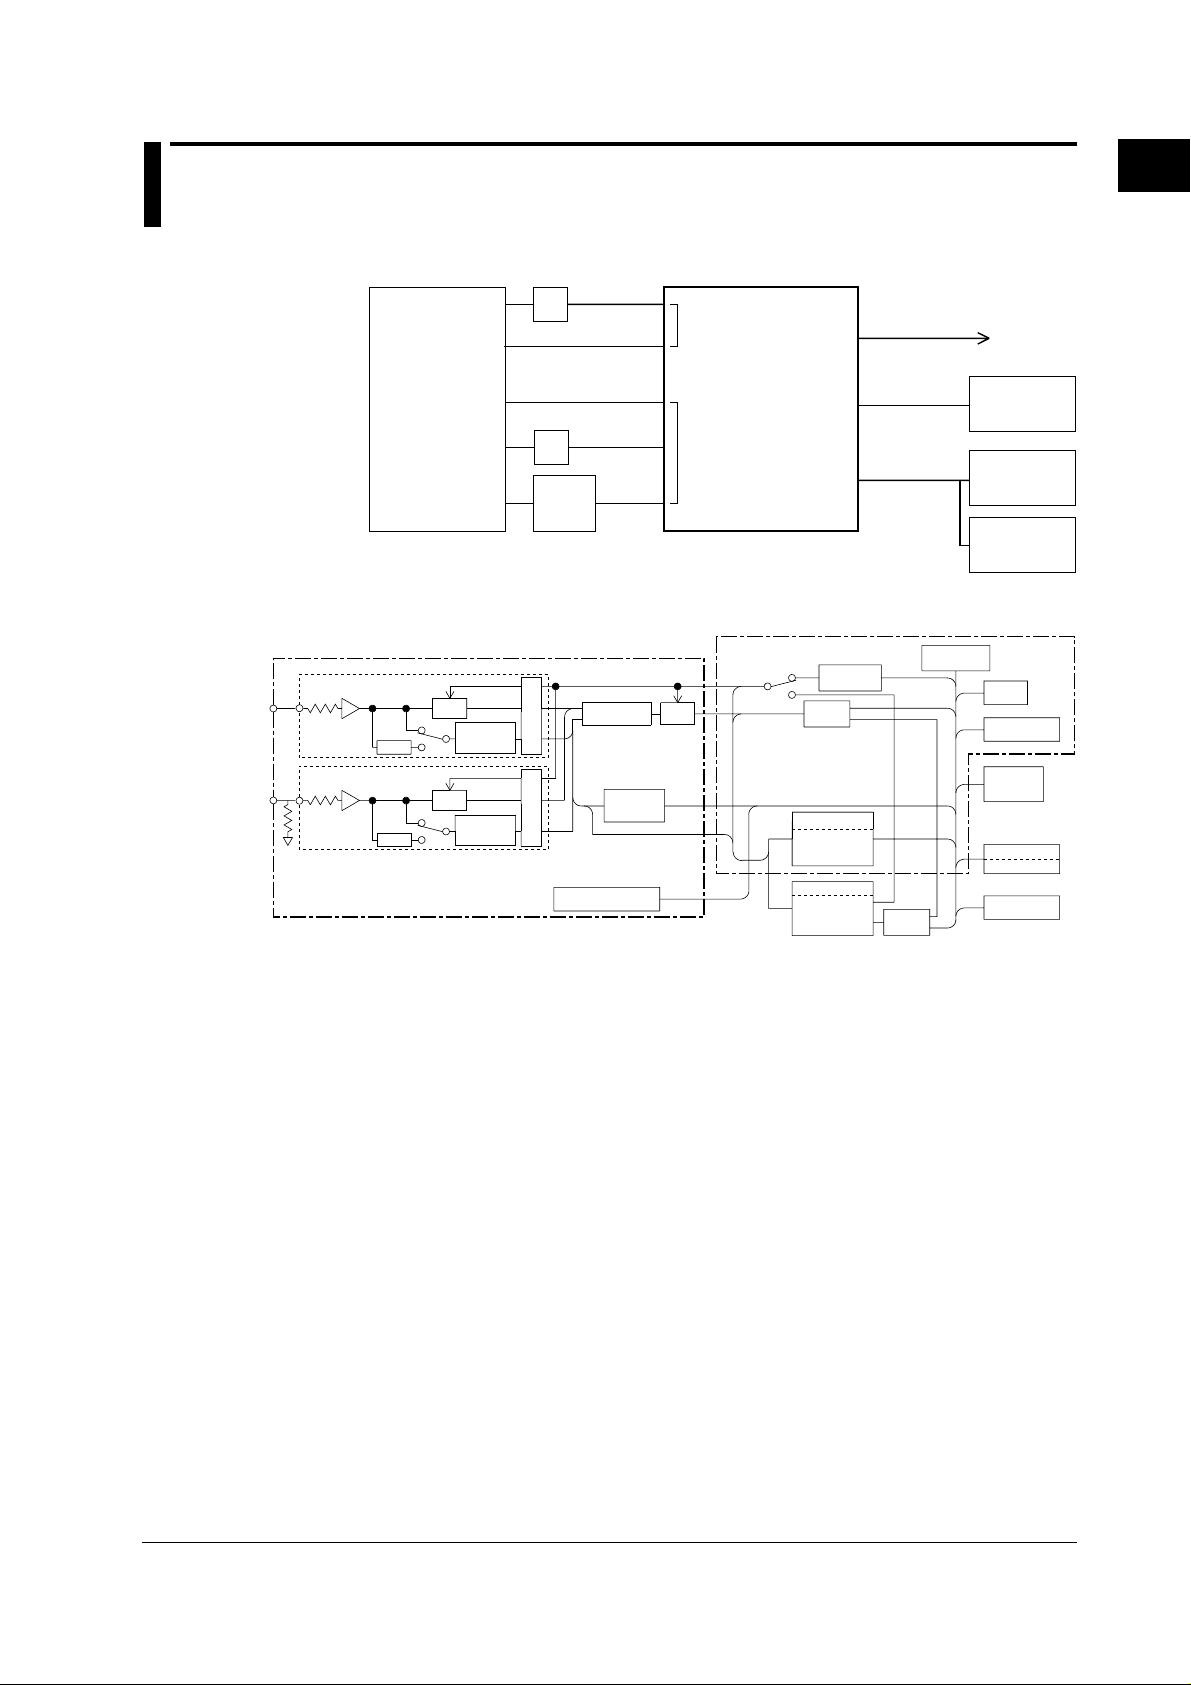
1.3 Digital Numbers/Characters, and Initial Menus
Digital Numbers/Characters
This instrument is equipped with a 7-segment LED which imposes some restrictions on
the usable characters. The numbers/characters are styled as follows.
Initial Menus
0
1
2
3
4
5
6
7
8
9
A
B
Small c
C
D
E
F
G
Small h
H
I
J
K
L
M
N
O
P
Q
R
S
T
U
V
W
X
Y
Z
+
−
×
÷
Every function of this instrument can be set using the menus on the display. The initial
displays which appear when the operation keys are pressed, are shown below.
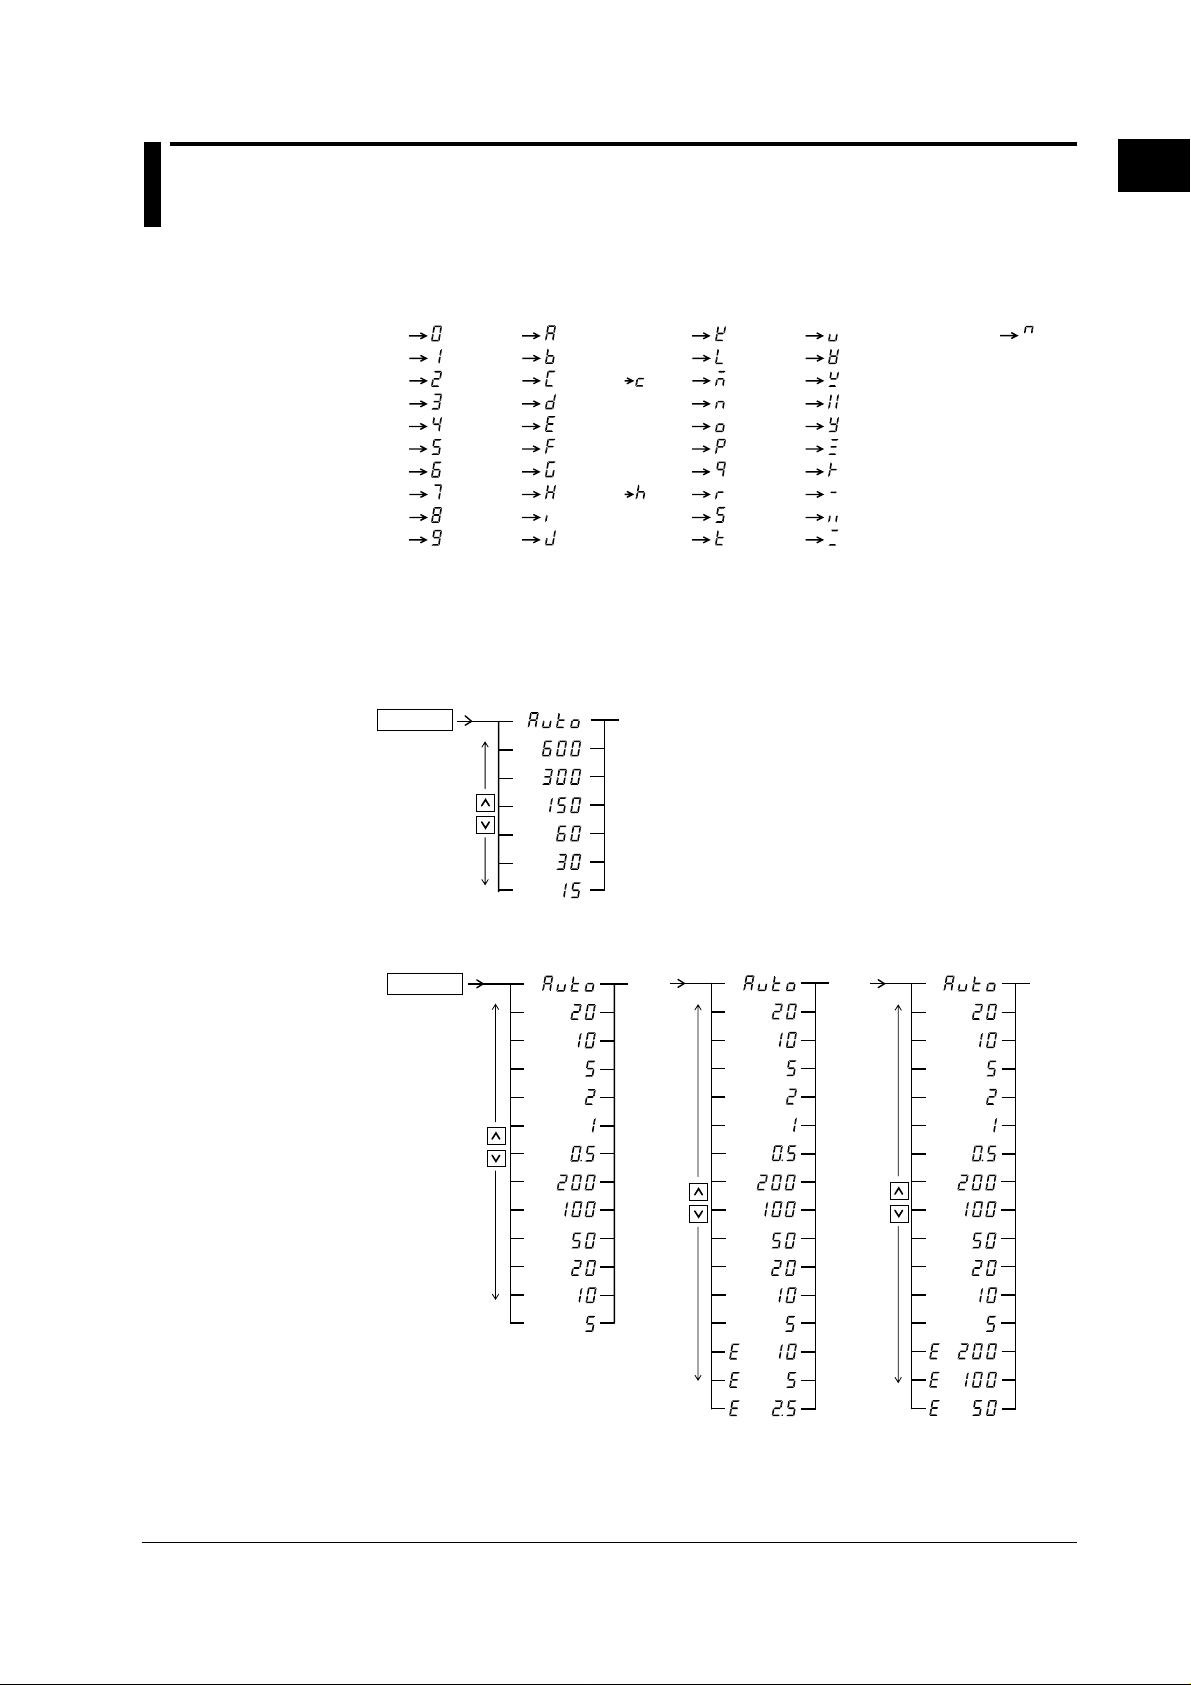
• Voltage Range Setting
1.
V RANGE
(Display C)
2.
^(Exponent)
1
Functional Overview and Digital Display
• Current Range Setting
1.
A RANGE
(Display C)
2.
(A)
(A)
(A)
(A)
(A)
(A)
(mA)
(mA)
(mA)
(mA)
(mA)
(mA)
When equipped with
option /EX1
(Display C)
2.
(A)
(A)
(A)
(A)
(A)
(A)
(mA)
(mA)
(mA)
(mA)
(mA)
(mA)
(V)
(V)
(V)
When equipped with
option /EX2
(Display C)
2.
(A)
(A)
(A)
(A)
(A)
(A)
(mA)
(mA)
(mA)
(mA)
(mA)
(mA)
(mV)
(mV)
(mV)
IM 253421-01E
1-5
Page 19
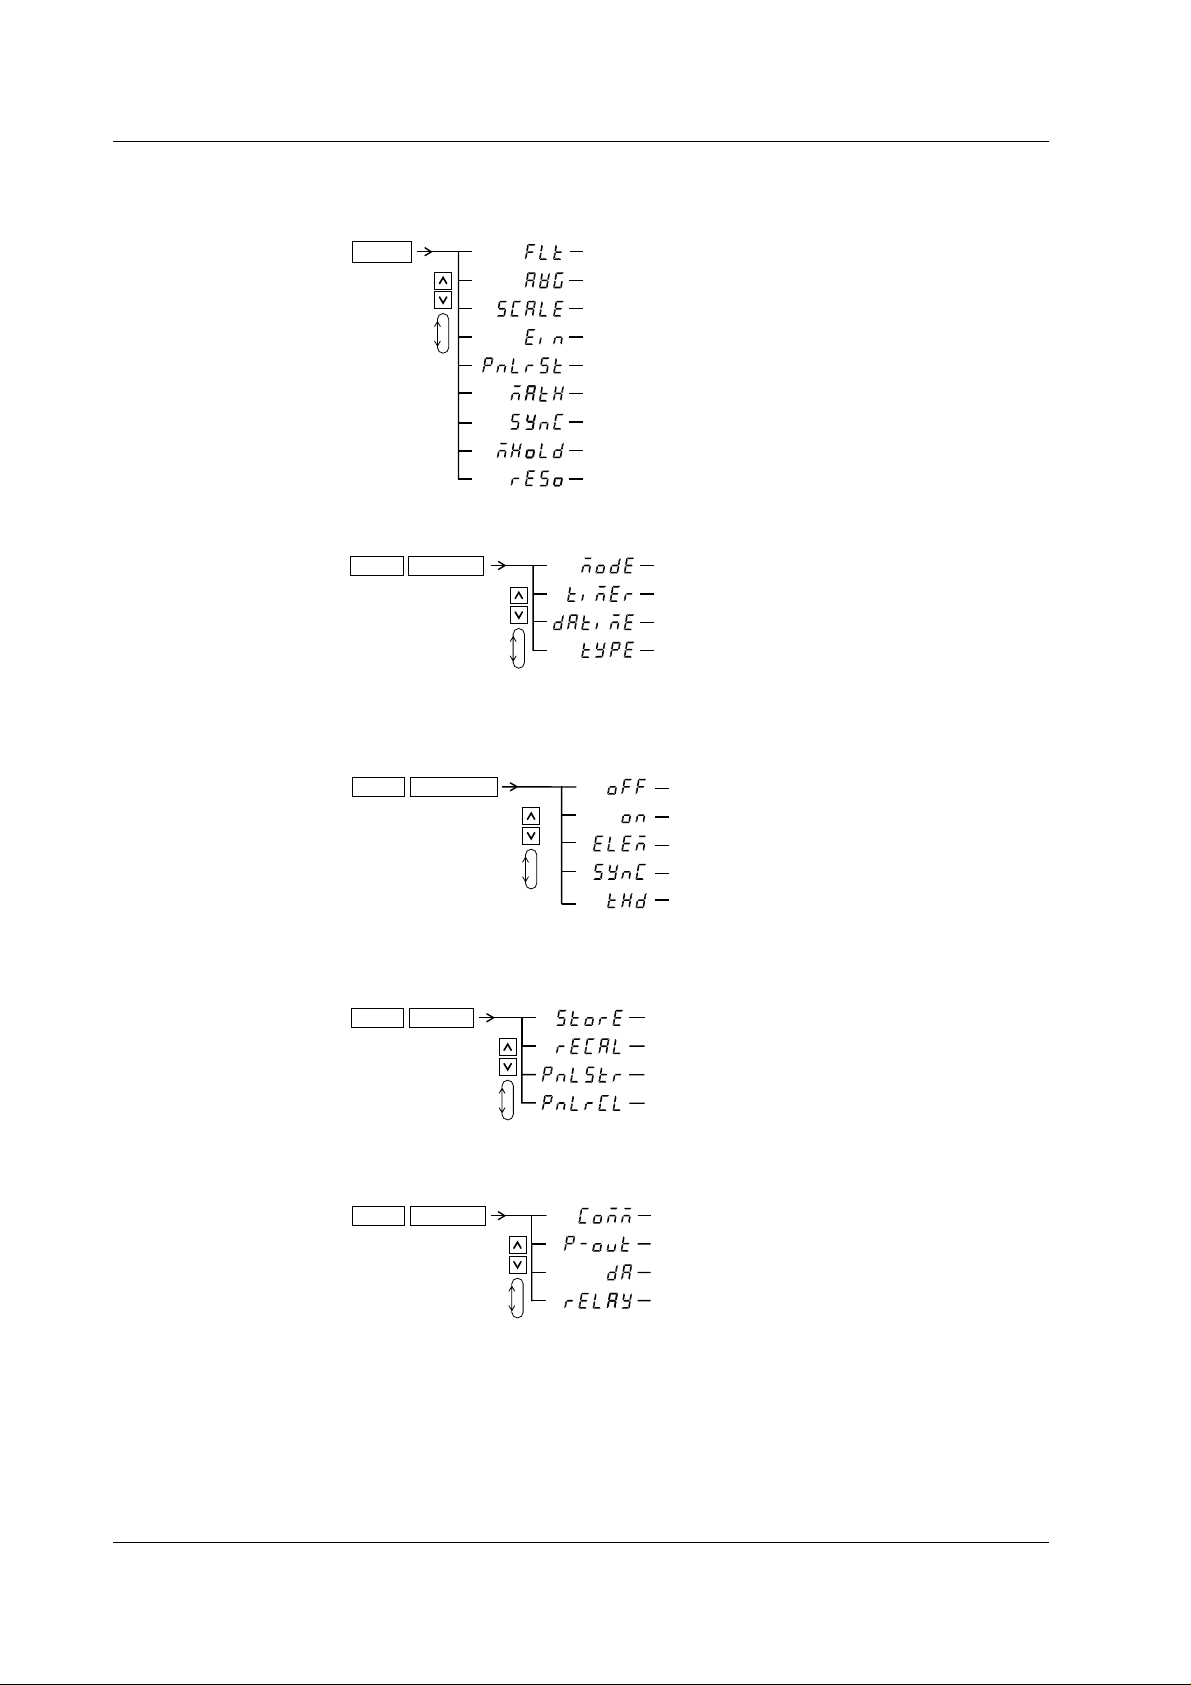
1.3 Digital Numbers/Characters, and Initial Menus
Setting the Filter, Averaging, Scaling, Ext. Sensor Input,
•
and Initializing Setting Parameters
1.
SETUP
( Display C )
2.
• Integration Setting
1.
SHIFT
RESET
INTEG SET
2.
(Filter setting)
(Averaging setting)
(Scaling setting)
(Ext. sensor input setting)
(Initiallizing set-up parameters)
(Computation, crest factor settings)
(Measurement synchronization source setting)
(MAX hold setting)
(Number of displayed digits)
( Display C )
(Setting integration mod)
(Setting integration timer)
(Setting integration preset time)
(Integration type setting)
• Turning the Harmonic Analysis Function ON/OFF
1.
SHIFT
START
HARMONICS
(Display C)
2.
(Setting the element)
(Setting PLL source)
(Setting computation methood
of harmonic distortion)
• Storing/Recalling to/from Internal Memory
1.
SHIFT
STOP
MEMORY
2.
( Display C )
(Storing measurement data)
(Recalling measurement data)
(Storing setting parameters)
(Recalling setting parameters)
• Setting Output
2.
( Display C )
(Setting items for communication,
plotter, or printer output)
(Execute plotter or printer output)
(Setting D/A output)
(Comparator setting:relay output setting)
1.
SHIFT
SETUP
OUTPUT
1-6
IM 253421-01E
Page 20
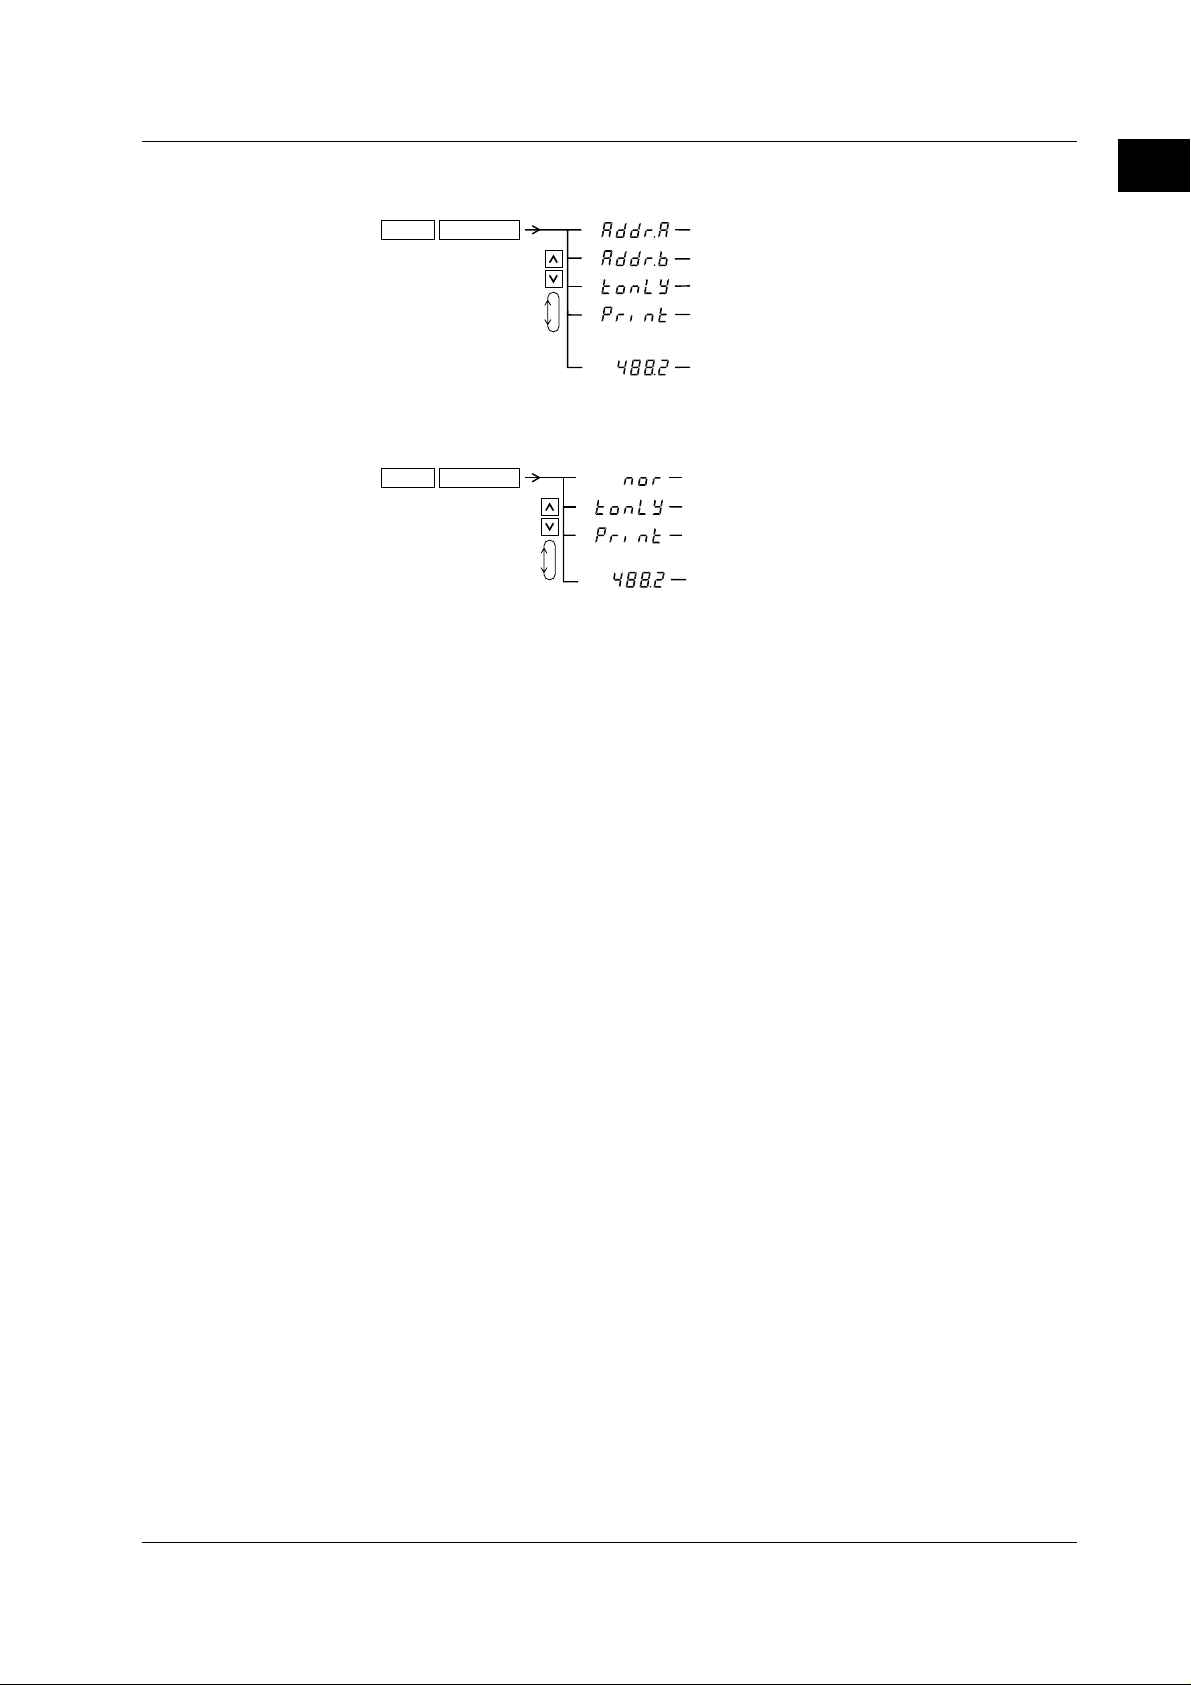
1.3 Digital Numbers/Characters, and Initial Menus
SHIFT
LOCAL
INTERFACE
( Display C )
2.
(Setting normal mode)
(Setting talk-only mode)
1.
• Setting Communication Interface (RS-232-C)
(Setting communication commands
according to IEEE 488.2-1987)
(Print mode setting: Setting plotter
or printer output)
• Setting Communication Interface (GP-IB)
1.
SHIFT
LOCAL
INTERFACE
( Display C )
2.
(Print mode setting: Setting plotter
(Setting addressable mode A)
(Setting addressable mode B)
(Setting talk-only mode)
or printer output)
(Setting communication commands
according to IEEE 488.2-1987)
1
Functional Overview and Digital Display
IM 253421-01E
1-7
Page 21
Chapter 2 Names and Uses of Parts and the Overrange and Error Displays
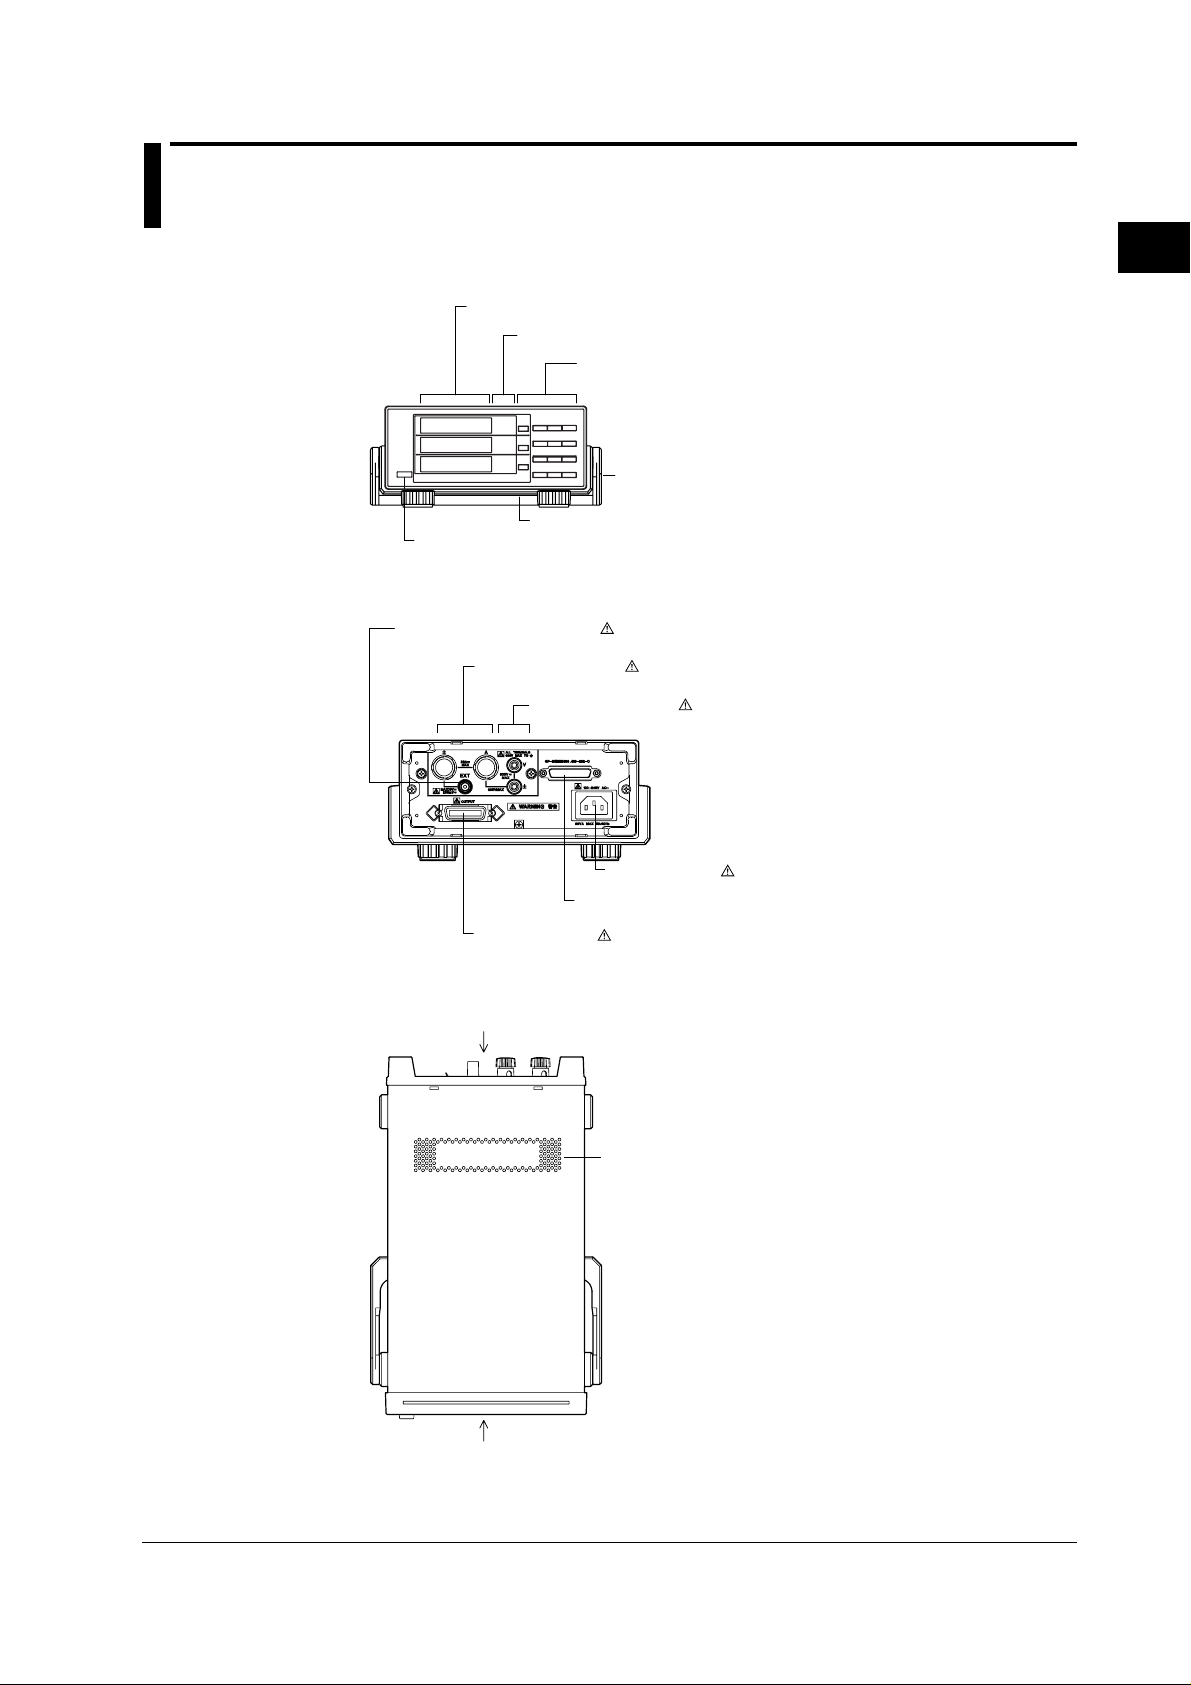
2.1 Front Panel, Rear Panel and Top View
Front Panel
Rear Panel
7-segment display
Function/Unit display
Operation keys
Power switch
page 3-12
→
External sensor input terminal
page 3-10
→
Ventilation slot
Current input terminal
page 3-8 to 3-11
→
Voltage input terminal
page 3-8 to 3-11
→
page 2-2
→
2
Names and Uses of Parts and the Overrange and Error Displays
Handle
Top View
Ext. I/O connector
→
chapter 9
Rear panel
Power connector
page 3-7
→
GP-IB or RS-232-C connector
→
chapter 10, 11
Ventilation slot
IM 253421-01E
Front panel
2-1
Page 22
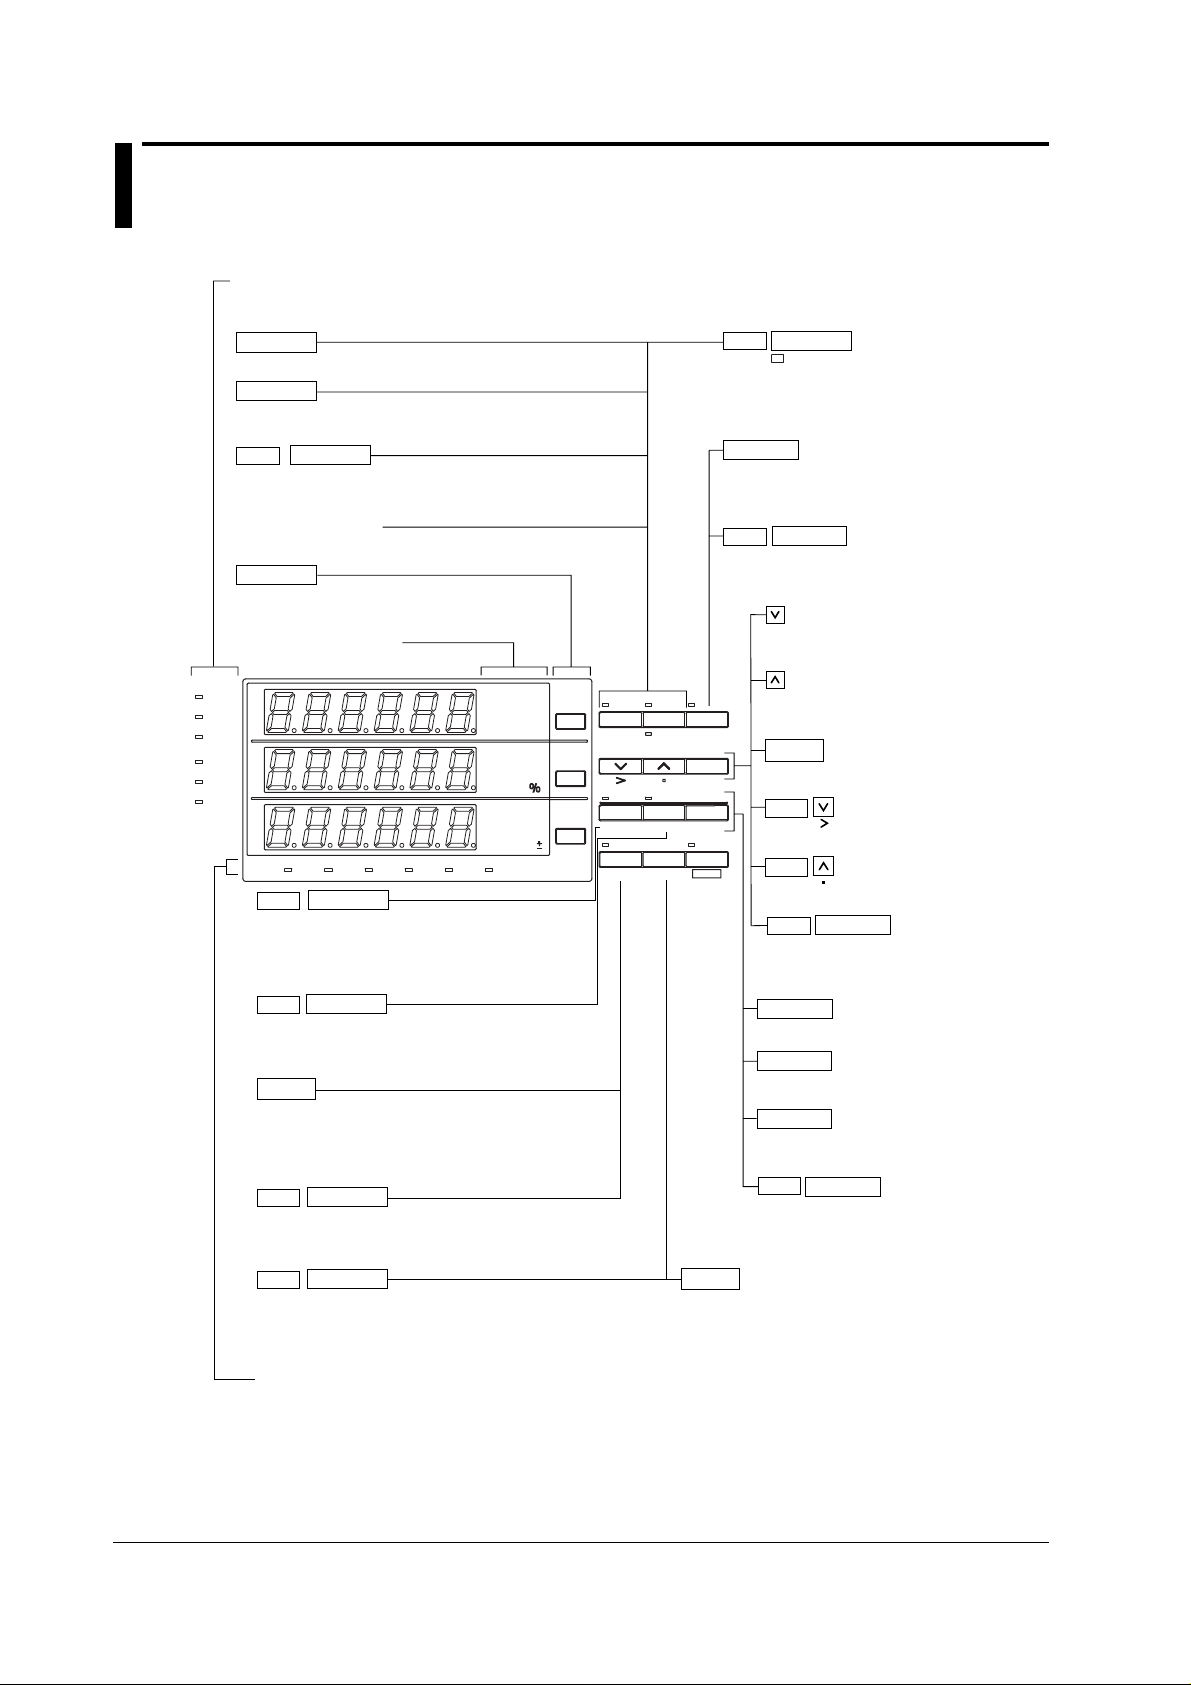
2.2 Operation Keys and Function Display
Indicators for operation conditions
Shows sampling, voltage/current overrange and
measurement mode.
V RANGE
Shows the voltage range setting menu (section 4.4).
A RANGE
Shows the current range setting menu (section 4.4).
V RANGE
SHIFT
MODE
Switches between modes (section 4.1).
AUTO indicator
Lights up when range is AUTO.
FUNCTION
Sets the displayed function
(chapter 5, sections 6.3 and 7.4).
Function/unit display
A RANGE
SHIFT
Turns ON/OFF the MAX hold function.
MAX HOLD
When turned ON, the MAX HOLD indicator lights.
This is the same as the MAX hold setting under
the SETUP key (section 4.8).
HOLD
Holds the displayed value. The HOLD
indicator lights. Pressing the key again turns
OFF the indicator and releases the hold.
HOLD
SHIFT
When in the HOLD condition this results in
TRIG
updating the displayed value.
For decreasing the voltage/current range,
and for setting of functions/values.
SAMPLE
V OVER
A OVER
MODE
RMS
V MEAN
DC
A
B
C
SCALING AVG FILTER STORE RECALL HARMONICS
mV
VA
var
kA
TIME
MW
mV PF
deg
kA
MW
mV Hz
kA h
MW h
START
HARMONICS
SHIFT
Shows the setting menu for harmonics ON/OFF, PLL
source, and element selection (sections 7.2 and 7.3).
STOP
SHIFT
MEMORY
Shows the setting menu for storing/recalling
measurement data and set-up information (chapter 8).
LOCAL
When the REMOTE indicator is lit, the remote
function will be canceled. When the REMOTE
indicator is not lit, the setting menu for
communication/printing will appear.
LOCAL
INTERFACE
SHIFT
Shows the setting menu for communication/printing
(sections 9.9, 10.5, and 11.3).
SETUP
SHIFT
OUTPUT
Shows the setting menu for communication output items, D/A
output, plotter/printer output and comparator output (sections 9.3,
9.5 to 9.9, and 10.6).
Indicators for operating functions
When a function is set and in operation, this indicator will light up.
FUNCTION
FUNCTION
FUNCTION
AUTO
AUTO
A RANGEV RANGE
MODE TRIGMAX HOLD
START
HARMONICS
REMOTE
LOCAL SETUP
INTERFACE OUTPUT SHIFT
HOLD
ENTER
CAL
INTEGRATOR
STOP RESET
MEMORY INTEG SET
SETUP
Sets the filter, averaging, scaling, computation, external
sensor input, measurement synchronization source, MAX
hold, and the initialization of the set-up information (see
sections 4.2, 4.3, 4.5 to 4.11, and 12.2).
For increasing the voltage/current range,
and for setting of functions/values.
ENTER
For verifying the set range/function/value.
SHIFT
Moves the cursor of a value from left to right.
SHIFT
Moves the decimal point from left to right.
ENTER
SHIFT
CAL
Performs zero level compensation
(section 12.3).
START
Starts integration (see section 6.3).
STOP
Stops integration (see section 6.3).
RESET
Sets the integration value and elapsed time of
integration to zero (0) (see section 6.3).
SHIFT
RESET
INTEG SET
Shows the setting menu for integration
mode/type/time, and rated integration time
(see sections 6.2 and 9.3).
2-2
IM 253421-01E
Page 23
2.3 Displays in case of Overrange/Error during Measurement
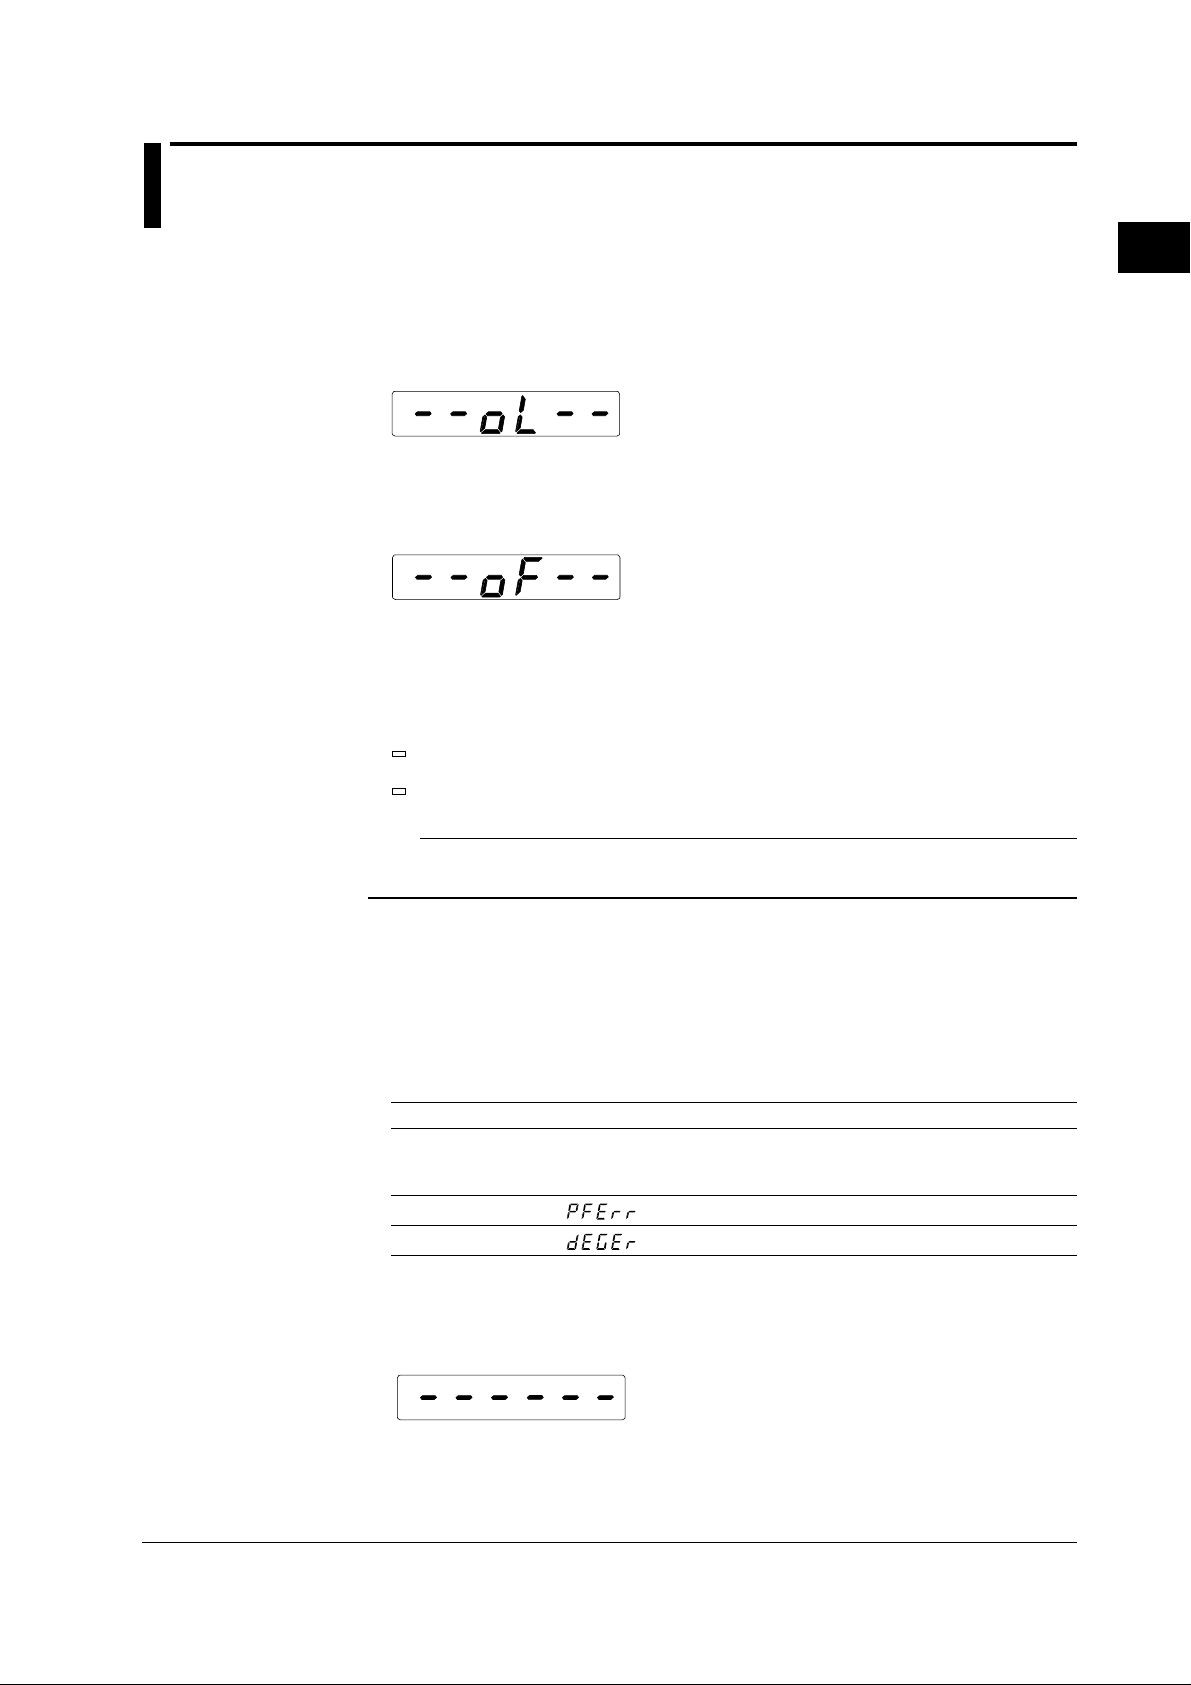
Overrange display
Overrange occurs when the measured voltage or current exceeds 140% of the rated
measurement range. In that case the range will automatically be increased, however
up to 140% of the maximum range. When this level is exceeded, the overrange display
wil appear, which looks as follows.
Computation over display
When the computed value becomes too high during the computation process, the
following display will appear.
Peak over display
When the sampled data (instantaneous voltage or instantaneous current) exceed
approx. 300% of the measurement range, the “V over” or “A over” indicators at the
front panel will light up.
V OVER
2
Names and Uses of Parts and the Overrange and Error Displays
A OVER
Note
The “V over” and “A over” indicators at the front panel will light up in case of overrange or
peak-over of any signal.
Display in case the measurement value is too small
In case either the measured voltage or measured current drops below 0.5% of the
measurement range, the display will indicate as follows. This is only in case the
measurement mode is RMS or V MEAN (see section 4.1, “Selecting the Measurement
Mode”).
Function Display
V(voltage)
A(current) displays zero
var(reactive power)
PF(power factor)
deg(phase angle)
Interruption during measurement
If the measurement range or function is changed and the contents of the display
changes, the display will indicate as follows.
IM 253421-01E
2-3
Page 24
Chapter 3 Before Starting Measurements
3.1 Usage Precautions
Safety Precautions
• Before using the instrument for the first time, make sure you have read the safety
precautions on pages iv and v.
• Do not remove the case from the instrument. Some areas in the instrument use high
voltages, which are extremely dangerous. When the instrument needs internal
inspection or adjustment, contact your nearest YOKOGAWA representative.
Addresses may be found on the back cover of this manual.
• If you notice smoke or unusual odors coming from the instrument, immediately turn
OFF the power and unplug the power cord. Also turn OFF the power to all the objects
being measured that are connected to the input terminals. If such an irregularity
occurs, contact your nearest YOKOGAWA representative. Addresses may be found
on the back cover of this manual.
• Do not place anything on the power cord and keep it away from any heat generating
articles. When unplugging the power cord from the power outlet, always hold the plug
and pull it, never pull the cord itself. If the power cord becomes damaged, contact
your nearest YOKOGAWA representative. Addresses may be found on the back
cover of this manual.Refer to page ii for the part number of the appropriate power cord
when placing an order.
3
Before Starting Measurements
General Handling Precautions
• Never place anything on top of the instrument, especially objects containing water.
Entry of water into the instrument may result in breakdowns.
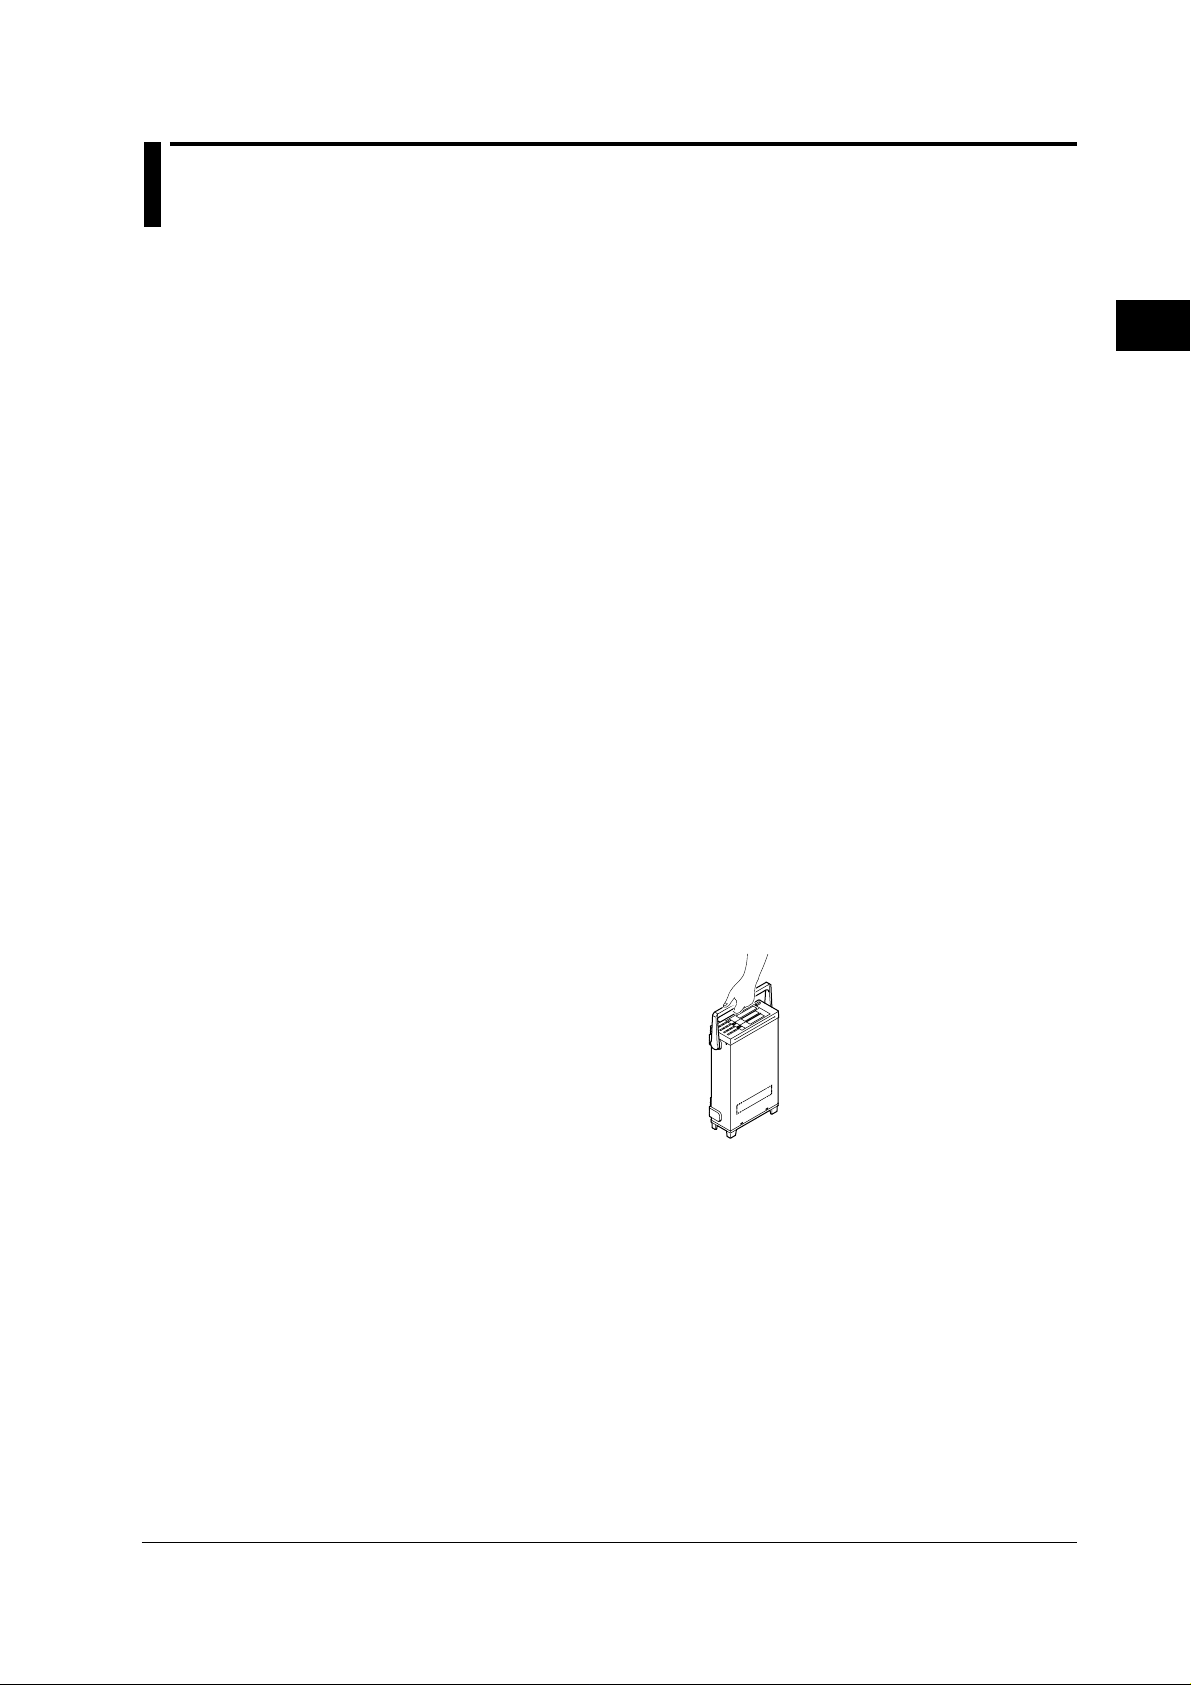
• When Moving the Instrument, first turn off the power of the objects to be measured
and disconnect the connected cables such as for measurement and communication.
Then turn off the power switch and unplug the power cord from the power outlet.
Always carry the instrument by the handles as shown below.
• To prevent internal temperature rise, do not block the vent holes in the instrument
case.
• Keep input terminals away from electrically charged articles as they may damage
internal circuits.
• Do not allow volatile chemicals to come into contact with the case or operation panel.
Also do not leave any rubber or vinyl products in contact with them for prolonged
periods. The operation panel is made of thermoplastic resin, so take care not to allow
any heated articles such as a soldering iron to come in contact with it.
IM 253421-01E
• For cleaning the case and the operation panel, unplug the power cord first, then
gently wipe with a dry, soft and clean cloth. Do not use chemicals such as benzene
or thinner, since these may cause discoloration or damage.
• If the instrument will not be used for a long period, unplug the power cord from the AC
outlet.
3-1
Page 25
3.2 Installing the Instrument
Installation Conditions
The instrument must be installed in a place where the following conditions are met.
Ambient temperature and humidity
• Ambient temperature: 5 to 40˚C
• Ambient humidity: 20 to 80% RH (no condensation)
Horizontal position
The instrument must be installed horizontally. A non-horizontal or inclining position can
impede proper measurement of the instrument.
Well-ventilated location
Vent holes are provided on the top and bottom of the instrument. To prevent rise in internal
temperature, do not block these vent holes.
In case you removed the feet for rack-mounting the instrument, make sure to keep a space of
at least 20 mm as not to block the vent holes.
Never install the instrument in any of the following places
• In direct sunlight or near heat sources;
• Near noise sources such as high voltage equipment or power lines ;
• Where an excessive amount of soot, steam, dust or corrosive gases is present;
• Where the level of mechanical vibration is high;
• Near magnetic field sources;
• In an unstable place.
Installation Position
Note
• To ensure high measurement accuracy, the instrument should only be used under the following
conditions.
Ambient temperature: 23 ± 5˚C
Ambient humidity: 30 to 75% RH (no condensation)
When using the instrument in the temperature ranges of 5 to 18 or 28 to 40˚C, add the temperature
coefficient to the accuracy as specified in chapter 16 “Specifications”.
• If the ambient humidity of the installation site is 30% or below, use an anti-static mat to prevent
generation of static electricity.
• Internal condensation may occur if the instrument is moved to another place where both ambient
temperature and humidity are higher, or if the room temperature changes rapidly. In such cases
acclimatize the instrument to the new environment for at least one hour before starting operation.
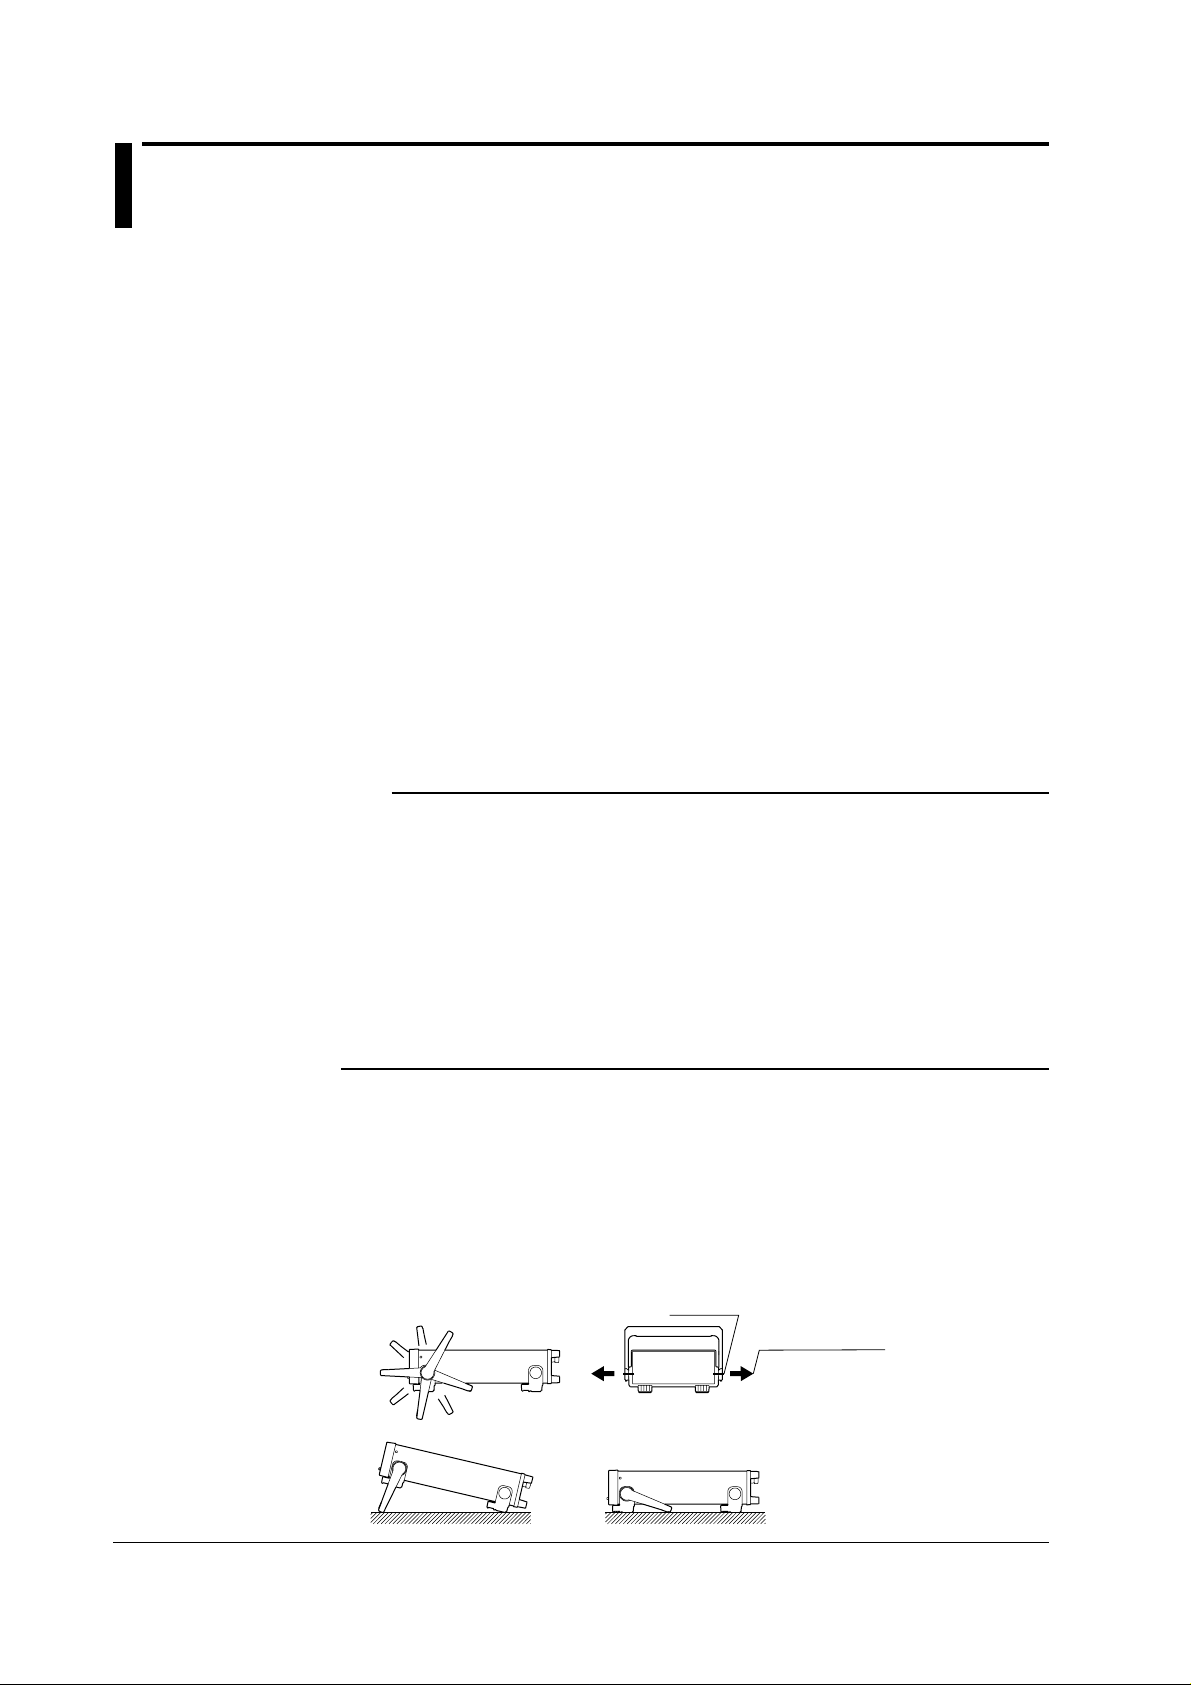
Desktop
As shown below, place the instrument on a flat even surface. When using the handle for
installation, check that the handle is in one of the fixed positions. To change the fixed position of
the handle, pull the handle approximately 2 to 3 mm outward along the rotational axis and slowly
move the handle.
Fixed positions of the handle
(We recommend the positions 1, 3, 5, or 8. When
using no 4, don't put any weight on the instrument.)
7
6
5
4
8
1
2
3
Turning axis
Turn the stands after
pulling them approx.
2-3 mm on both sides.
3-2
3
1
IM 253421-01E
Page 26
3.2 Installing the Instrument
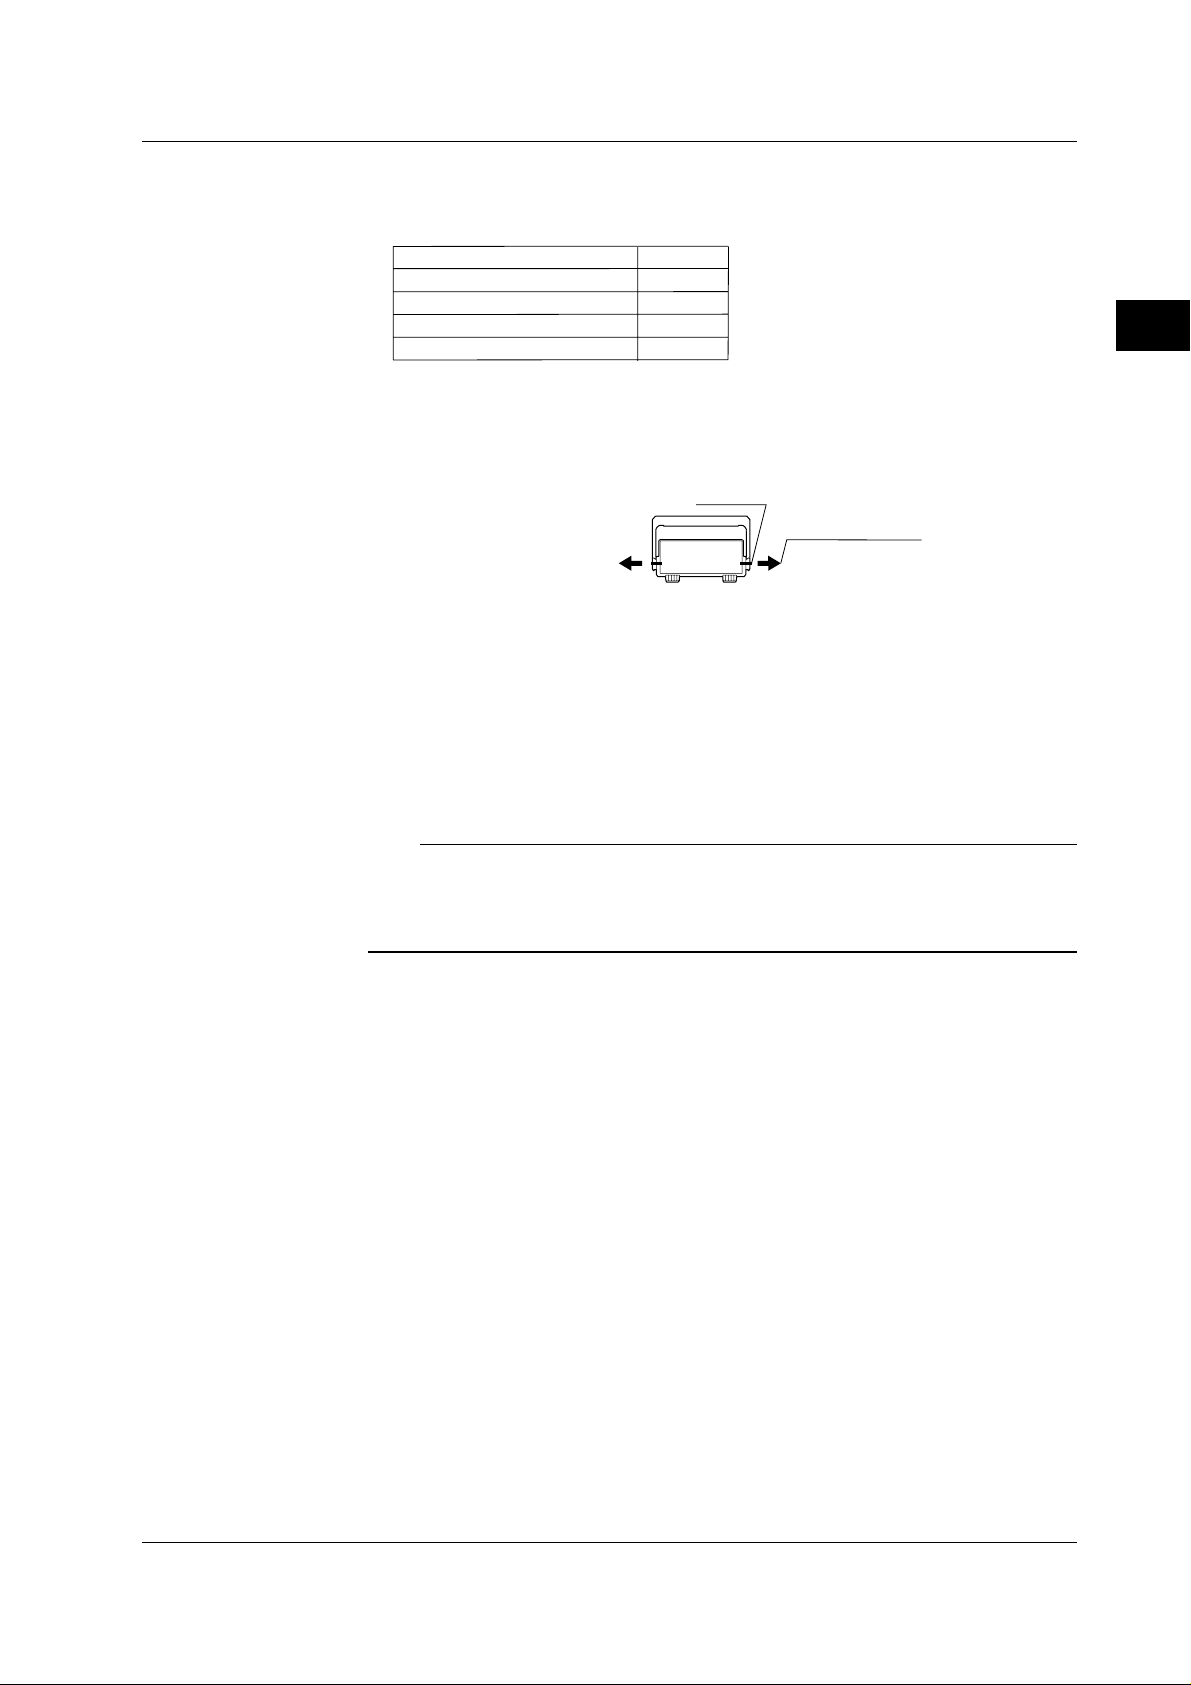
Rack mount
To install the instrument in a rack, use one of the following optional rack mount kits.
• Rack mount kit (option)
Specifications
EIA Standard (for single mount)
JIS Standard (for single mount)
EIA Standard (for multiple mount)
JIS Standard (for multiple mount)
Kit
751533-E2
751533-J2
751534-E2
751534-J2
• Mounting procedure
1. Turn the handle to position 8 (see the figure on the previous page) and remove it
by pulling the handle outward along the rotational axis approximately 10 mm.
Turn the handle to
Turning axis
position 8 and remove
it by pulling it approx.
10 mm from the turning
axes on both sides.
2. Remove the feet from the instrument.
3. Remove the seals covering the mounting holes from the front side of the
instrument.
4. Mount the rack mount brackets.
5. Mount the instrument in the rack.
3
Before Starting Measurements
For more detailed information regarding the rack mount procedure, refer to the
instruction manual accompanied with the rack mount kit.
Note
• When rack mounting the instrument, allow at least 20 mm of space around the vent holes to
prevent internal overheating.
• Make sure to have adequate support for the bottom of the instrument. However, do not block
the vent holes in the process.
IM 253421-01E
3-3
Page 27
3.3 Wiring Precautions
• To prevent hazards, make sure to apply a ground protection before connecting the
object being measured.
• Always turn OFF the power to the object being measured before connecting it to the
instrument. Never connect or disconnect the measurement lead wires from the object
while power is being supplied to it, otherwise a serious accident may result.
• When the power switch is ON, never apply a voltage or current exceeding the level
specified in the table below to the voltage input or current input terminal. When the
power switch is OFF, turn off the power of the instrument under measurement as well.
For details regarding the other terminals, such as the external input terminal, refer to
chapter 16 “Specifications.”
Max allowable input Voltage input Current input
Instantaneous max Peak value of 2000 V or 20 A to 0.5 A range
(for 1s) RMS value of 1500 V, Peak value of 150 A or RMS value of
Continuous Peak value of 1500 V or 20 A to 0.5 A range
WARNING
whichever is less. 40 A, whichever is less.
200 mA to 5 mA range
Peak value of 30 A or RMS value of
20 A, whichever is less.
RMS valueof 1000 V, Peak value of 100 A or RMS value of
whichever is less. 25 A, whichever is less.
200 mA to 5 mA range
Peak value of 30 A or RMS value of
20 A, whichever is less.
• In case you are using an external potential transformer (PT) or current transformer (CT),
use one which has a sufficient withstand voltage against the voltage to be measured (a
withstand voltage of 2E + 1000 V is recommended, where E is the measurement
voltage.) Also be sure not to allow the secondary side of the CT to go open-circuit while
power is supplied, otherwise an extremely dangerous high voltage will be generated on
the secondary side of the CT.
• If the instrument is used in a rack, provide a power switch so that power to the
instrument can be shut off from the front of the rack in an emergency.
• For safety reasons, make sure that the bare end of the measurement lead wire
connected to each input terminal does not protrude from the terminal.
Also make sure that the measurement lead wires are connected to the terminals
securely.
• The voltage rating across the input (voltage and current) and ground varies depending
on the operating conditions.
• When protective covers are used on GP-IB or RS-232-C and external input/output
connectors;
Voltage across each measuring input terminal and ground 600 Vrms max.
• When protective covers are removed from GP-IB or RS-232-C and from external
input/output connectors; or when connectors are used;
Voltage across A, ±(V and A side) input terminals and ground 400 Vrms max.
Voltage across V terminal and ground 600 Vrms max.
3-4
IM 253421-01E
Page 28

3.3 Wiring Precautions
CAUTION
Use lead wires that have sufficient margin in withstand voltage and current
against the signal being measured. The lead wires must also have insulation
resistance that is appropriate for the ratings.
Ex. If measurement is carried out on a current of 20 A, use copper wires with a
conductor cross-sectional area of at least 4 mm
Note
• When measuring high currents, or currents or voltages that contain high-frequency
components, wiring should be made with special attention paid to possible mutual
interference and noise problems.
• Keep the lead wires short as possible.
• For current circuits indicated by thick lines in the wiring diagrams shown in section 3.4 and
later, use thick lead wires appropriate for the current to be measured.
• The lead wire to the voltage input terminal should be connected as close to the load of the
object under measurement as possible.
• To minimize stray capacitance to ground, route both lead wires and grounding wires so that
they are as away from the instrument's case as possible.
2
.
3
Before Starting Measurements
IM 253421-01E
3-5
Page 29
3.4 Improving the Measurement Accuracy
SOURCE
LOAD
V
A
i
V
i
L
SOURCE
LOAD
A
V
Input terminal
WT200
±
±
±
±
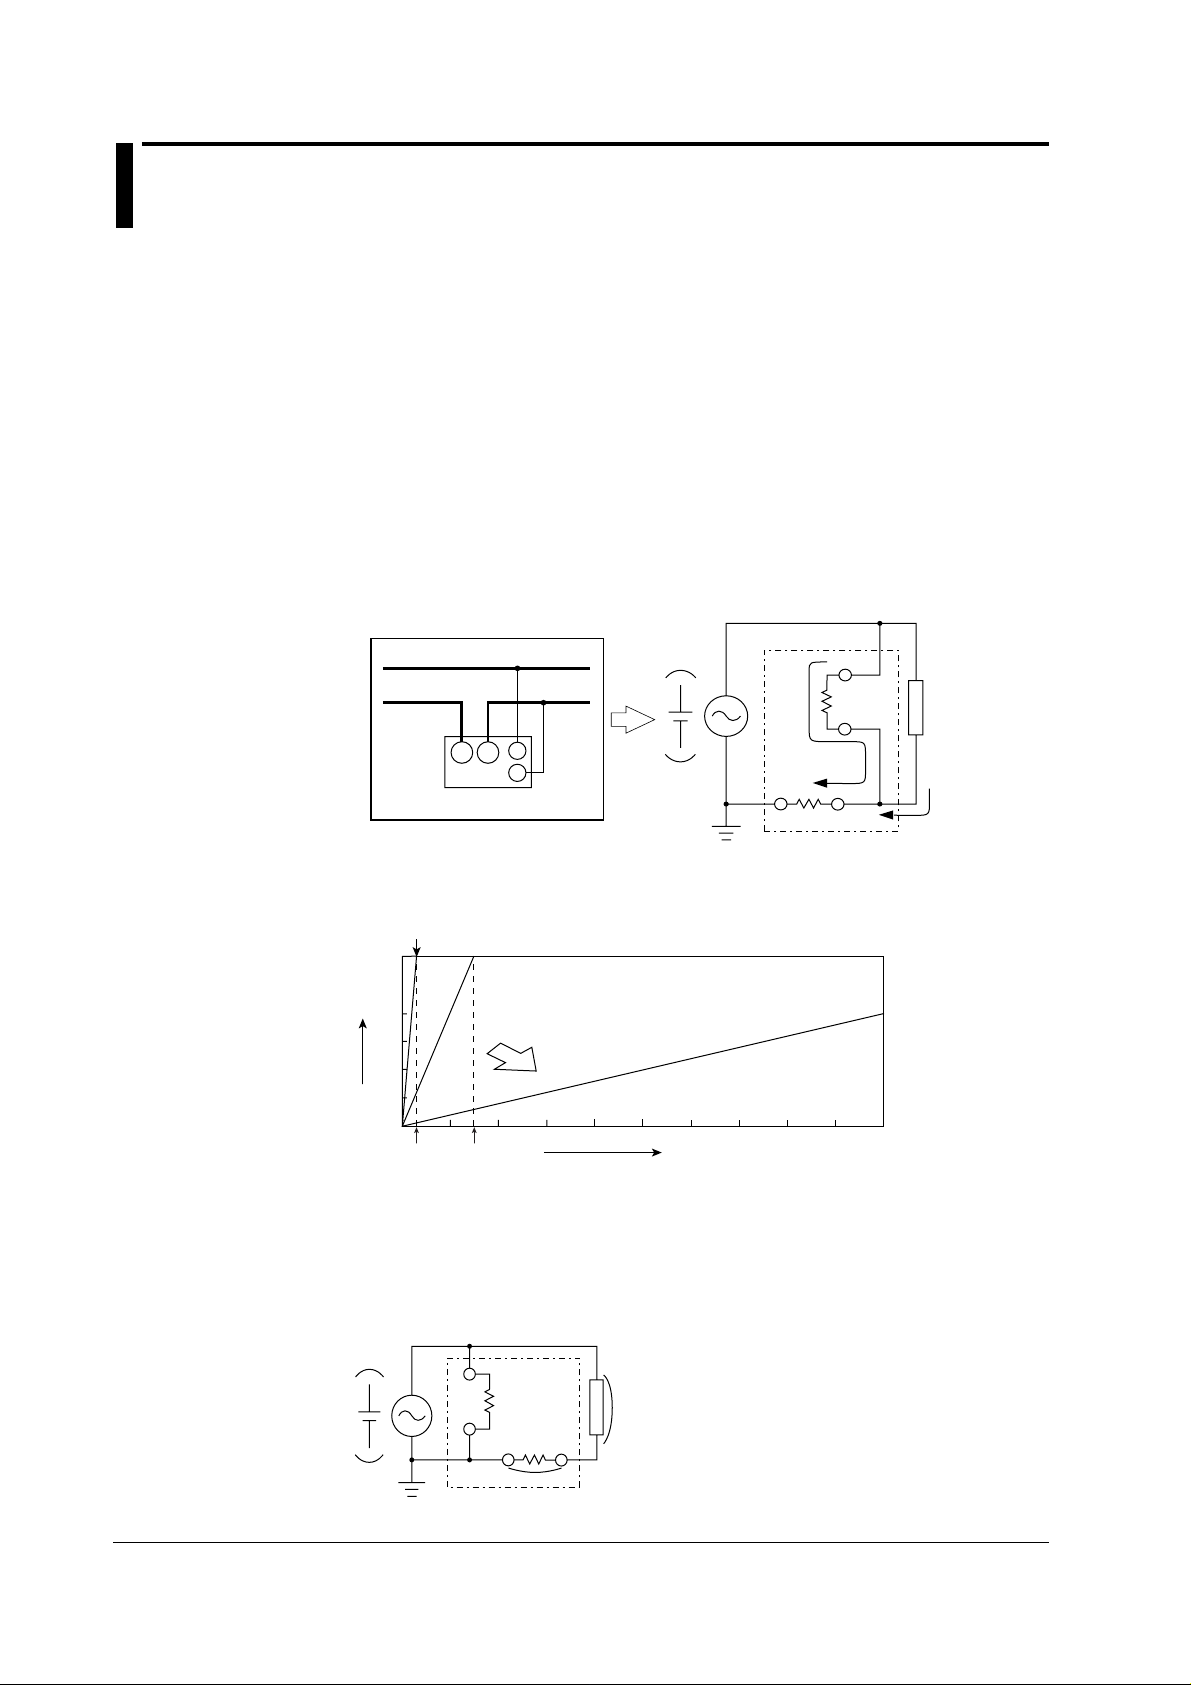
By wiring the circuit to match the load, you can minimize the effect of the power loss on
the measurement accuracy. We will consider a circuit consisting of a current source
(SOURCE) and load resistance (LOAD) below.
• When the measurement current is relatively large
In this case, the voltage measurement circuit is connected to the load side. The
current measurement circuit measures the sum of the current that flows through the
load of the circuit under measurement (i
voltage measurement circuit (i
measurement is i
, iV is the error. The input resistance of the voltage measurement
L
). Since the current flowing through the circuit under
V
circuit is approximately 2 MΩ. For a 600-V input signal, i
(600 V/2 MΩ). If the load current i
200 Ω or less), the effect of the voltage measurement circuit on the measurement
accuracy is less than or equal to 0.01%. As another example, if the input signal is
200 V and 10 A, i
= 0.1 mA (200 V/ 2 MΩ). The effect on the measurement accuracy
V
is 0.001% (0.1 mA/10 A) in this case.
) and the current that flows through the
L
is approximately 0.3 mA
V
is greater than or equal to 3 A (load resistance is
L
3-6
The following figure shows the relationship between the voltage and current that leads
to 0.1%, 0.01%, and 0.001% errors.
Effect or 0.1%
600
Measured voltage (V)
500
400
300
200
100
0
0 2 4 6 8 101214161820
300 mA 3 A
Effect of 0.01%
Less effect
• When the measurement current is relatively small
Connect the current measurement circuit to the load side. In this case, the voltage
measurement circuit measures the sum of the load voltage (eL) and the voltage drop
of the current measurement circuit (e
A). The voltage drop eA is the error. The input
resistance of the current measurement circuit is approximately 6 mΩ. If the load
resistance is 600 Ω, for example, the effect on the measurement accuracy is
approximately 0.001% (6 mΩ/600 Ω).
A
LOAD
e
L
SOURCE
V
±
±
e
A
WT200
Effect of 0.001%
Measured current (A)
IM 253421-01E
Page 30
3.5 Connecting the Power Supply
Before Connecting the Power Supply
Connecting Procedure
WARNING
• Ensure that the supply voltage matches the rated supply voltage of the
instrument before connecting the power cable.
• Check that the power switch is turned OFF before connecting the power cord.
• Make sure to connect the protective earth to prevent electric shock. Connect
the power cord to a three-pin power outlet with a protective earth terminal.
• Do not use an extension cord without protective earth ground. This act will
invalidate the protection.
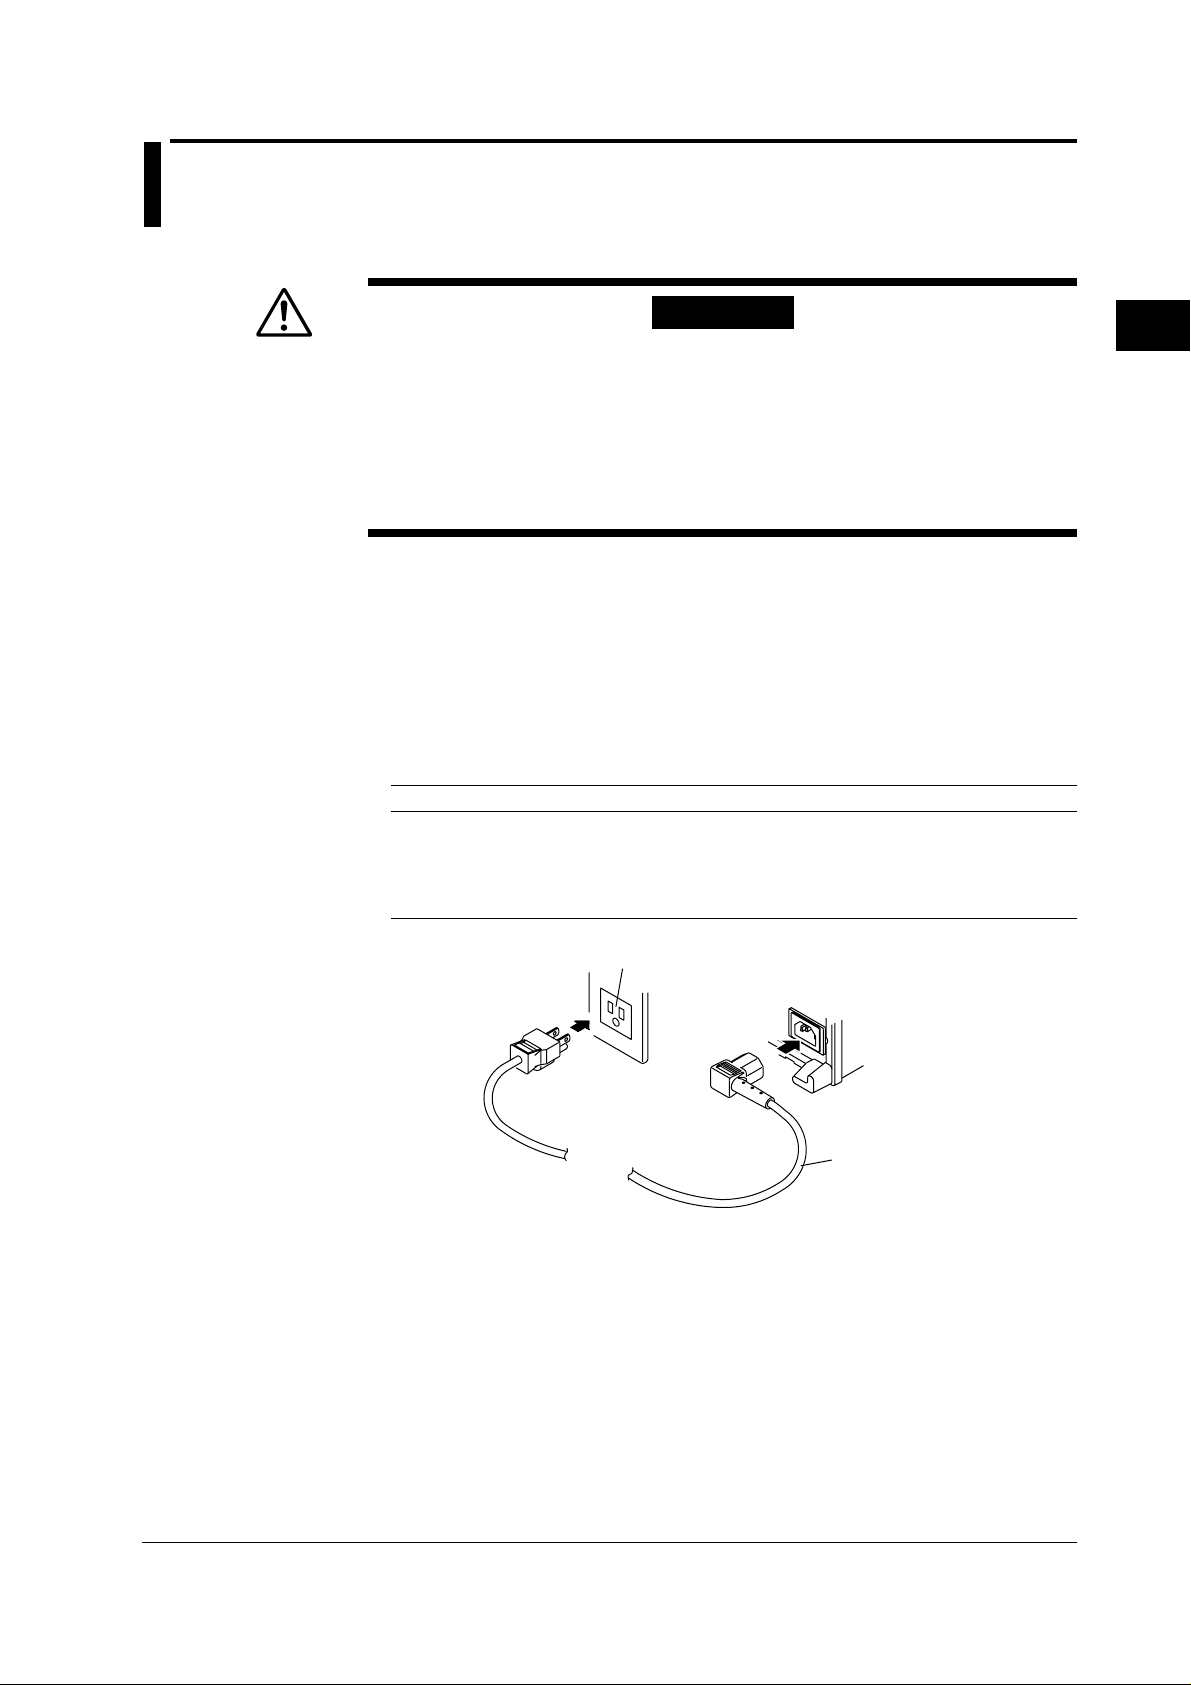
1. Make sure that the power switch of the instrument is turned OFF.
2. Connect the accessory power cord to the power connector on the back of the
instrument.
3. Insert the power cord to the power outlet which conforms to the following
specifications.
Make sure that you use an outlet with a protective grounding terminal only.
Item Specifications
Rated supply voltage 100 to 240 VAC
Permitted supply voltage range 90 to 264 VAC
Rated supply voltage frequency 50/60 Hz
Permitted supply voltage frequency range 48 to 63 Hz
Maximum power consumption 25 VA (at 120 VAC) or 35 VA (at 240 VAC)
3
Before Starting Measurements
3 pin consent
WT200
Power cord
(accessory)
IM 253421-01E
3-7
Page 31

3.6 Wiring the Measurement Circuit
WARNING
When applying a current to be measured directly to the input terminals of the
instrument, disconnect the input cable of the external sensor. A voltage might
be generated by the external sensor input terminal when connected.
CAUTION
A load current flows in the thick lines show in the diagrams; therefore, a wire
with sufficient current capacity must be used for these lines.
Wiring diagram
SOURCE
SOURCE
A
±
Input terminal
±
A
Input terminal
LOAD
V
±
LOAD
V
±
SOURCE
SOURCE
± A
A
A
A
±
V
Note
The wire connected from the source the ± current terminal must be routed as close as
possible to the ground potential in order to minimize measurement error.
V
LOADV
±
V
LOAD
±
3-8
IM 253421-01E
Page 32

3.7 Wiring the Measurement Circuit when Using External PT/CT
WARNING
When using an external CT, do not allow the secondary side of the CT to go
open-circuit while power is supplied, otherwise an extremely high voltage will be
generated on the secondary side of the CT.
CAUTION
A load current flows in the thick lines shown in the diagrams; therefore, a wire
with sufficient current capacity must be used for these lines.
Use of a PT (or CT) enables measurement of voltage or current even if the maximum
voltage or maximum current of the object to be measured exceeds the maximum
measuring range.
• If the maximum voltage of the object to be measured exceeds 600 V, connect an
external potential transformer (PT), and connect the secondary side of the PT to the
voltage input terminals.
• If the maximum current of the object to be measured exceeds 20 A, connect an
external current transformer (CT), and connect the secondary side of the CT to the
current input terminals.
Wiring diagram when using the PT and CT
SOURCE LOAD
SOURCE LOAD
3
Before Starting Measurements
CT
L
l
±
V
A
±
Input terminal Input terminal
PT
V
v
CT
L
l
V
A
±
±
PT
V
v
Note
• Using the scaling function enables direct reading of measured values on the display. Refer to
section 4.5, “Setting the Scaling Constant when External PT/CT is Used.”
• It must be noted that measured values are affected by the frequency and phase
characteristics of PT and CT.
IM 253421-01E
3-9
Page 33

3.8 Wiring the Measurement Circuit when Using the External Sensor
WARNING
• Use an external sensor that is enclosed in a case which has sufficient withstand
voltage against the voltages to be measured. Use of bare sensor may cause an
electric shock if the sensor is touched accidentally.
• Before connecting an external shunt, make sure the power to the shunt is turned
OFF. Always make sure to turn OFF the power switch of the source.
When the power is supplied a voltage will be present at the shunt, so don't touch
the shunt with your hands.
• When using the clamp sensor, make sure you have a thorough understanding of
the specifications and handling of the voltage of the measurement circuit and
the clamp sensor. Check that there are no hazards (places that may cause
electric shock).
• When using the external sensor input terminal, do not touch the current input
terminal or connect measurement leads. This act is dangerous, because when
power is applied to the circuit under measurement (that is connected to the
external sensor input terminal), the voltage of the circuit appears across the
current input terminals.
• The connector to the input terminal for the external sensor should not have bare
wires protruding; make sure to make connections to this terminal according to
safety measures, since voltages will be present at the bare wires, which
constitutes a hazard.
CAUTION
A load current flow in the thick lines shown in the diagrams; therefore, a
wire with sufficient current capacity must be used for these lines.
In cases where the maximum current of the object under measurement exceeds 20 A,
measurement becomes possible by connecting an external sensor. The range for
external sensor input is either 2.5/5/10 V or 50/100/200 mV. Either range is available as
an option.
In the following wiring diagrams, the external shunt is grounded. When using the clamp
sensor, replace the shunt with the clamp sensor.
Wiring diagram when using the external shunt
SOURCE
Connection
side
OUT L
Ext. sensor input
terminal (EXT)
Shunt-type current
sensor
±
A
OUT H
±
Input terminal
(ELEMENT)
V
A
±
LOAD
3-10
IM 253421-01E
Page 34

3.8 Wiring the Measurement Circuit when Using the External Sensor
Note
• The external sensor must be selected carefully, because the frequency and phase
characteristics of the sensor affects the measured value.
• Make the lead wires between the external sensor and the instrument as short as possible to
minimize measurement errors caused by stray capacitance and resistance of the lead wires.
• When using a shunt-type current sensor, note the following points when connecting the
external sensor cable to minimize errors:
• Connect the shield wire of the external sensor cable to the L side of the shunt output
terminal (OUT).
• Make the area that the lead wires create between the sensor and the external sensor
cable as small as possible. This reduces the effects caused by field lines (caused by
measurement current) entering this area and the external noise.
3
Before Starting Measurements
Shunt-type current sensor The area created by the lead wires
I
±
OUT H
OUT L
Input terminal of the WT200
External sensor cable
Shield wires
• As shown in the figure below, connect the shunt-type current sensor to the power grounding
side. If you have to connect the sensor to the non-earth side, use a wire that is thicker than
AWG18 (conductive cross-sectional area of approx. 1 mm2) between the sensor and the
instrument to reduce the effects of common mode voltage. Take safety and error reduction in
consideration when constructing an external sensor cable.
V
Voltage input terminal
±
External shunt
A
Current input terminal
±
Ext. sensor input terminal
LOAD
• If the measurement circuit is not grounded and the measured signal is of high frequency or
high power, the effects of inductance of the shunt-type current sensor cable become large. In
this case, use an isolation sensor (CT, DC-CT, or clamp).
Clamp sensor
V
Voltage input terminal
±
A
Current input terminal
±
Ext. sensor input terminal
LOAD
IM 253421-01E
• Make sure you have the polarities correct when making the connections. Otherwise, the
polarity of the measurement current will be reversed and correct measurements cannot be
made. Be especially careful when connecting the clamp type current sensor, because it is
easy to reverse the polarity.
• You can use the scaling function to directly read the measured values on the display. For the
procedure, see section 4.6, “Selecting the Measurement Range and Setting the Scaling
Constant when External Sensor is Used (option).”
3-11
Page 35

3.9 Turning the Power ON/OFF, Opening Messages
Item to be Checked before Turning ON the Power
• Check that the instrument is installed correctly (see section 3.2, “Installing the
Instrument”).
• Check that the power cord is connected properly (see section 3.5, “Connecting the
Power Supply”).
Location of the Power Switch
The power switch is located in the lower left corner of the front panel.
Turning the Power ON
Turning the power ON will result in staring the test program, which checks each memory.
When the results of these checks are all satisfactory, opening, messages will appear as
described on the next page, after which the instrument will be ready for measurement.
When the test program results in displaying error codes, proper operation of the
instrument cannot be performed. Immediately turn OFF the power and contact you
nearest representative.
Addresses may be found on the back cover of this manual. When contacting your
representative, inform him of the name, suffix and No. code as on the right side panel,
and of the displayed error code(s).
Note
• In case of an error code, refer to section 15.4, “Error Codes and Corrective Actions” , for a
• A warm-up time of approx.30 minutes is required before all spesifications of the instrument
Turning the Power OFF
When turning the power OFF, the previous setting parameters will be kept.
Consequently, turning the power ON again will result in the appearance of the setting
condition of the previous measurements.
Note
description and corrective action.
can be met.
The instrument uses a lithium battery to back up setting parameter. When the voltage level of
the lithium battery falls below a certain value, an error code (see section 15.4, “Error Codes
and Corrective Actions”) appears as the instrument is turned ON. When the battery life is
exhausted, turning ON the power switch will result in an error code and the battery needs to
be replaced. Never replace the battery yourself, but inform your nearest representative.
Addresses may be found on the back cover of this manual.
3-12
IM 253421-01E
Page 36

Opening Messages
Power switch
ON
3.9 Turning the Power ON/OFF,Opening Messages
Display A Display B Display C
1
No display
Display differs
depending on specs
and options.
3
(Model)
(Version)
4
5
(Only for/EX1, EX2)
(Only for/HRM option)
6
7
(For/DA option)
(For/CMP option)
8
All LED`s light up
2
Extinguish
ABC
No display
ABC
No display
ABC
E-1
(E-2)
ABC
ABC
ABC
3
Before Starting Measurements
(/GPIB mode)
9
10
(/GPIB address)
9
(RS-232-C mode)
10
(RS-232-C handshake)
11
(RS-232-C format)
(RS-232-C baud rate)
12
NO
*1 Displays the setting valid before the power was turned OFF.
Any of Addr.A/Addr.b/tonLY/Print can be displayed.
*2 Displays the setting valid before the power was turned OFF.
Any of nor/tonly/Print can be displayed.
ABC
ABC
ABC
ABC
ABC
ABC
All specs/option have
been displayed?
YES
Ready for measurement
*1
*2
IM 253421-01E
3-13
Page 37

Chapter 4 Setting Measurement Conditions and Measurement Range
4.1 Selecting the Measurement Mode
Keys
Procedure
Explanation
A
SAMPLE
V OVER
A OVER
MODE
B
RMS
V MEAN
DC
C
SCALING AVG FILTER STORE RECALL HARMONICS
V RANGE
RMS V MEAN DC
SHIFT
MODE
mV
var
kA
TIME
MW
mV PF
deg
kA
MW
mV Hz
kA h
MW h
SHIFT
VA
FUNCTION
FUNCTION
FUNCTION
V RANGE
MODE
AUTO
AUTO
A RANGEV RANGE
MODE TRIGMAX HOLD
START
HARMONICS
REMOTE
LOCAL SETUP
INTERFACE OUTPUT SHIFT
HOLD
ENTER
INTEGRATOR
STOP RESET
MEMORY INTEG SET
CAL
Measurement Mode
One of the following measurement modes can be selected for measurement of voltage
and current. The initial value is “RMS”.
Indicator Voltage Current
RMS Measures and displays true Measures and displays true RMS
V MEAN Displays rectified mean value Measures and displays
DC Displays DC value obtained by Displays DC value obtained by averaging the input
RMS value value
calibrated to the RMS value true RMS value
averaging the input signal signal
Displays
relevant
keys and
indicator
SHIFT
4
Setting Measurement Conditions and Measurement Range
V RANGE
MODE
Theoretical Equations
• RMS
This mode is selected to display input voltage or current as a true RMS value.
T
1
T
f(t)2dt
0
f (t): input signal
T: one period of the input signal
• V MEAN
This mode is selected to display input voltage or current as a rectified mean value
calibrated to the RMS value. Since a sine wave is used for calibration, the value
displayed will be the same as that obtained in RMS mode if a sine wave is
measured. The value displayed will be different from that obtained in RMS mode if
a distorted or DC waveform is measured.
T
π
•
2
2
1
1
T
(t) dt
f
f (t): input signal
T: one period of the input signal
•DC
This mode is selected when the input voltage or current is DC. The input signal is
averaged and the result is displayed.
IM 253421-01E
4-1
Page 38

4.1 Selecting the Measurement Mode
Typical Waveform Types and Differences in Measured Values between
Measurement Modes
The WT200 does not support the mean value measurement mode in the following table.
Name
Sinewave
Half-wave
rectification
Full-wave
rectification
Direct
current
Triangular
wave
Waveform
0
0
0
0
π
π
π
π
Measurement
mode
Display
Ep
2π
Ep
2π
Ep
2π
Ep
Ep
2π
RMS
value
RMS
Ep
2
Ep
2
Ep
2
Ep
Ep
3
Mean
value
—
2
· Ep
π
Ep
π
2
· Ep
π
Ep
Ep
2
Mean-value
rectification
V MEAN
Ep
2
Ep
2 2
Ep
2
π
· Ep
2 2
π
· Ep
4 2
Linear
averaging
DC
0
Ep
π
2
· Ep
π
Ep
0
Square
wave
Pulse
Pulse
2 2
4π 2
τ
2
π
2 2
π τ
πD
π
· Ep
· Ep
· Ep
0
τ
· Ep
2π
D · Ep
Ep
0
π
2π
τ
Ep
0
2π
Ep
τ
· Ep
2π
When duty D (= ) is applied.
D · Ep
Ep
τ
· Ep
2π
D · Ep
4-2
IM 253421-01E
Page 39

4.2 Selecting the Measurement Synchronization Source
Keys
Procedure
Displays
relevant keys
MODE
SAMPLE
V OVER
A OVER
RMS
V MEAN
DC
A
B
C
SCALING AVG FILTER STORE RECALL HARMONICS
mV
VA
var
kA
TIME
MW
mV PF
deg
kA
MW
mV Hz
kA h
MW h
FUNCTION
FUNCTION
FUNCTION
AUTO
AUTO
A RANGEV RANGE
MODE TRIGMAX HOLD
START
HARMONICS
REMOTE
LOCAL SETUP
INTERFACE OUTPUT SHIFT
HOLD
ENTER
INTEGRATOR
STOP RESET
MEMORY INTEG SET
CAL
• Operate the instrument by following the thick lines in the menu below.
• Press the ENTER key to confirm a selection or setting.
• To leave the current menu in the middle of the operation, press the key indicated in step 1.
The confirmed settings up to that point are kept.
Select the measurement synchronization source.
1.
SETUP
(Display C)
2.
3.
ENTER
(Display C)
4.
5
.
ENTER
End
4
Setting Measurement Conditions and Measurement Range
Explanation
IM 253421-01E
Function used to select the measurement synchronization source
The instrument determines the measured value by averaging the sampled data
(averaging process) over the period synchronized to the input signal period. The input
signal period is detected from the voltage and current signals and you can select which
signal period to use to perform the averaging process. The initial setting is A.
•A
Priority is placed in detecting the current period to be used as the synchronization
source. When the current input is less than 30% of the measurement range, the
voltage is used as the synchronization source.
•V
Priority is placed in detecting the voltage period to be used as the synchronization
source. When the voltage input is less than 30% of the measurement range, the
current is used as the synchronization source.
Note
• Select an input signal with stable input level and frequency (with little distortion) for the
synchronization source.
• If both the voltage and current inputs are less than 30% of the range, a fixed period of 240 ms
is used to sample and average the data.
4-3
Page 40

4.3 Turning the Filter ON/OFF
Keys
Procedure
SAMPLE
V OVER
A OVER
MODE
RMS
V MEAN
DC
A
B
C
SCALING AVG FILTER STORE RECALL HARMONICS
mV
VA
var
kA
TIME
MW
mV PF
deg
kA
MW
mV Hz
kA h
MW h
FUNCTION
FUNCTION
FUNCTION
AUTO
AUTO
A RANGEV RANGE
MODE TRIGMAX HOLD
START
HARMONICS
REMOTE
LOCAL SETUP
INTERFACE OUTPUT SHIFT
HOLD
ENTER
INTEGRATOR
STOP RESET
MEMORY INTEG SET
CAL
Displays
relevant
keys and
indicator
• Operate the instrument by following the thick lines in the menu below.
• Press the ENTER key to confirm a selection or setting.
• To leave the current menu in the middle of the operation, press the key indicated in step 1.
The confirmed settings up to that point are kept.
1.
SETUP
Select the filter
(Display C)
2.
3.
ENTER
(Display C)
4.
5
.
ENTER
End
Explanation
Filter Function
The instrument will perform measurements after synchronizing to the cycle of the
input signal. Consequently, the frequency of the input signal can be measured
properly. The filter, at a cut-off frequency of 300 Hz, will only be applied to the
frequency measurement circuit and will remove noise from distorted and inverted
waves, etc. This allows the frequency to be measured correctly which improves the
accuracy of each measurement value. The filter will not be applied to the voltage and
current circuit. The initial value is oFF.
Note
The filter setting cannot be changed while integration is being carried out.
4-4
IM 253421-01E
Page 41

4.4 Selecting the Measurement Range in case of Direct Input
Keys
Procedure
Displays
relevant
keys and
indicator
MODE
SAMPLE
V OVER
A OVER
RMS
V MEAN
DC
A
B
C
SCALING AVG FILTER STORE RECALL HARMONICS
mV
VA
var
kA
TIME
MW
mV PF
deg
kA
MW
mV Hz
kA h
MW h
FUNCTION
FUNCTION
FUNCTION
AUTO
AUTO
A RANGEV RANGE
MODE TRIGMAX HOLD
START
HARMONICS
REMOTE
LOCAL SETUP
INTERFACE OUTPUT SHIFT
HOLD
ENTER
INTEGRATOR
STOP RESET
MEMORY INTEG SET
CAL
• Operate the instrument by following the thick lines in the menu below.
• Press the ENTER key to confirm a selection or setting.
• To leave the current menu in the middle of the operation, press the key indicated in step 1.
The confirmed settings up to that point are kept.
• Voltage Range Setting
1.
V RANGE
(Display C)
2.
3.
ENTER
End
4
Setting Measurement Conditions and Measurement Range
• Current Range Setting
(Display C)
A RANGE
2.
3.1.
ENTER
End
The unit is “A.”
The unit is “mA.”
IM 253421-01E
4-5
Page 42

4.4 Selecting the Measurement Range in case of Direct Input
Explanation
Manual Range (fixed) versus Automatic Range (auto)
The measurement range can be of one of the following types. The initial setting is
Auto range ON.
• Manual range
Voltage range: Select from 600 V, 300 V, 150 V, 60 V, 30 V, and 15 V.
Current range: Select from 20 A, 10 A, 5 A, 2 A, 1 A, 0.5 A, 200 mA, 100 mA, 50
mA, 20 mA, 10 mA, and 5 mA.
• Auto range: Auto
The measuring range is adjusted automatically according to the input voltage or
current as follows. Overrange is handled the same way as for the manually
selected range.
Range up:
A higher range is selected immediately if the instantaneous input voltage or
current exceeds approx. 300% of the rated value during sampling. If the
meaured voltage or current exceeds 110% of the rated value, a higher range will
be selected at the end of the current measurement cycle.
Range down:
A lower range is selected if the measured voltage or current drops below 30% of
the rated value. However, even when the measured voltage or current drops
below 30% of the rated value, range down will not be done when this would
result in waveforms with a high crest factor causing peak over.
Verifying the Range
To verify the current range setting press the V RANGE key or the A RANGE key. The
result will be shown at display C. In order to return to the measurement status, press
the same key again.
Note
• When the range is set to auto, you cannot move to the minimum range by pressing the ∧ key.
On the other hand, when the range is set to the minimum, you cannot move to auto range by
pressing the ∨ key.
• When the range is set to auto, the range may be adjusted frequently if a waveform such as a
pulse is input. In such a case, set the range manually.
4-6
IM 253421-01E
Page 43

4.4 Selecting the Measurement Range in case of Direct Input
Power Range
The measuring range for active power, apparent power and reactive power is
determined as follows.
Wiring Method Power Range
Single-phase, two-wire (1Φ2W) voltage range × current range
The maximum display is 99999 (when the number of displayed digits is 5).
When the result of “voltage range × current range” exceeds 1000 W (VA or var), the
unit on the display will change to “kW (kVA or kvar)”.
Power range table
• A list of the combination of voltage and current ranges and the power range are
shown below. The table shows the active power range (unit: W). The range for
apparent power (unit: VA) and reactive power (unit: var) will have the same magnitude
as the active power. Read the unit as VA or var for apparent power and reactive
power, respectively.
• The following table shows the case when the number of displayed digits is four.
When the number of displayed digits is set to five, one digit is added to the lowest
digit of the values in the table. For selecting the number of displayed digits, see
section 4.12.
Voltage Range
Current Range 15 V 30 V 60 V 150 V 300 V 600 V
(15.00 V) (30.00 V) (60.00 V) (150.0 V) (300.0 V) (600.0 V)
5 mA 75.00 mW 150.0 mW 300.0 mW 750.0 mW 1.500 W 3.000 W
(5.000 mA)
10 mA 150.0 mW 300.0 mW 600.0 mW 1.500 W 3.000 W 6.000 W
(10.00 mA)
20 mA 300.0 mW 600.0 mW 1.200 W 3.000 W 6.000 W 12.00 W
(20.00 mA)
50 mA 750.0 mW 1.500 W 3.000 W 7.500 W 15.00 W 30.00 W
(50.00 mA)
100 mA 1.500 W 3.000 W 6.000 W 15.00 W 30.00 W 60.00 W
(100.0 mA)
200 mA 3.000 W 6.000 W 12.00 W 30.00 W 60.00 W 120.0 W
(200.0 mA)
0.5 A 7.500 W 15.00 W 30.00 W 75.00 W 150.0 W 300.0 W
(500.0 mA)
1 A 15.00 W 30.00 W 60.00 W 150.0 W 300.0 W 600.0 W
(1.000 A)
2 A 30.00 W 60.00 W 120.0 W 300.0 W 600.0 W 1.200 kW
(2.000 A)
5 A 75.00 W 150.0 W 300.0 W 750.0 W 1.500 kW 3.000 kW
(5.000 A)
10 A 150.0 W 300.0 W 600.0 W 1.500 kW 3.000 kW 6.000 kW
(10.00 A)
20 A 300.0 W 600.0 W 1.200 kW 3.000 kW 6.000 kW 12.00 kW
(20.00 A)
4
Setting Measurement Conditions and Measurement Range
IM 253421-01E
Note
When the range is set to auto, the measuring range switches according to range up/range
down conditions. Therefore, the range may vary even if the measured values remain the
same.
4-7
Page 44

4.5 Setting the Scaling Constant when External PT/ CT is Used
Keys
Procedure
SAMPLE
V OVER
A OVER
MODE
RMS
V MEAN
DC
A
B
C
SCALING AVG FILTER STORE RECALL HARMONICS
mV
VA
var
kA
TIME
MW
mV PF
deg
kA
MW
mV Hz
kA h
MW h
FUNCTION
FUNCTION
FUNCTION
AUTO
AUTO
A RANGEV RANGE
MODE TRIGMAX HOLD
START
HARMONICS
REMOTE
LOCAL SETUP
INTERFACE OUTPUT SHIFT
HOLD
ENTER
INTEGRATOR
STOP RESET
MEMORY INTEG SET
CAL
Displays
relevant
keys and
indicator
• Operate the instrument by following the thick lines in the menu below.
• Press the ENTER key to confirm a selection or setting.
• To leave the current menu in the middle of the operation, press the key indicated in step 1.
The confirmed settings up to that point are kept.
• Setting the Scaling Value
1.
SETUP
Select the scaling function.
(Display C)
2.
3.
ENTER
(Display C)
4.
5.
ENTER
Set PT ratio
(Display A)
9.
ENTER
6.
7.
Set value
Move across digits
SHIFT
8.
SHIFT
Shift decimal point
•
• Selecting Scaling ON/OFF
1.
SETUP
Select the scaling function.
(Display C)
2.
Set CT ratio
(Display B)
10.
Same as steps 6 to 8
3.
ENTER
4.
11.
ENTER
(Display C)
Set power coefficient
(Display C)
12.
Same as steps 6 to 8
5.
ENTER
End
13.
ENTER
End
4-8
IM 253421-01E
Page 45

Explanation
4.5 Setting the Scaling Constant when External PT/CT is Used
About the Scaling Function
This function is useful when measuring parameters such as voltage, current, and
power by using an external transformer such as a potential transformer (PT) or a
current transformer (CT). In this case, the output from the secondary side of the
transformer is applied to the input terminals of the instrument. You can specify the PT
ratio, CT ratio, or power coefficient as the scaling constant on this instrument.
Measured/computed value Scaled result
Voltage V P × V P: Voltage scaling constant (PT ratio)
Current A C × A C: Current scaling constant (CT ratio)
Active power W F × P × C × W F: Power scaling constant
Reactive power var F × P × C × var
Apparent power VA F × P × C × VA
Setting the Scaling Constant
The scaling constants are set in the following order. The setting ranges from 0.001 to
9999. The initial value is 1.000.
• P: Sets the PT ratio on display A
• C: Sets the CT ratio on display B
• F: Sets the power coefficient on display C
4
Setting Measurement Conditions and Measurement Range
Turning Scaling ON/OFF
Select the scaling menu once again after having set the scaling constants. The initial
value is oFF.
• on: When this setting is selected, pressing the ENTER key will start scaling and the
SCALING indicator will light.
• oFF: When this setting is selected, pressing the ENTER key will stop scaling and
SCALING indicator will extinguish.
Note
When the scaling constant × measurement range exceeds 9999M(106), the computation over
display will appear (see section 2.3).
IM 253421-01E
4-9
Page 46

4.6 Selecting the Measurement Range and Setting the Scaling Constant when External Sensor is Used (option)
Keys
Procedure
SAMPLE
V OVER
A OVER
MODE
RMS
V MEAN
DC
A
B
C
SCALING AVG FILTER STORE RECALL HARMONICS
mV
VA
var
kA
TIME
MW
mV PF
deg
kA
MW
mV Hz
kA h
MW h
FUNCTION
FUNCTION
FUNCTION
AUTO
AUTO
A RANGEV RANGE
MODE TRIGMAX HOLD
START
HARMONICS
REMOTE
LOCAL SETUP
INTERFACE OUTPUT SHIFT
HOLD
ENTER
INTEGRATOR
STOP RESET
MEMORY INTEG SET
CAL
Displays
relevant
keys and
indicator
• Operate the instrument by following the thick lines in the menu below.
• Press the ENTER key to confirm a selection or setting.
• To leave the current menu in the middle of the operation, press the key indicated in step 1.
The confirmed settings up to that point are kept.
• Setting the Scaling Value of the External Sensor Input
Select the external sensor function
1.
SETUP
2.
(Display C)
3.
ENTER
4.
5.
6.
(Display C)
SHIFT
SHIFT
Set value
Move across digits
Shift decimal point
•
7
.
ENTER
End
4-10
• Selecting the Measurement Range (Current, with Scaling function ON)
1.
A RANGE
For /EX1 option
(Display C)
2.
3.
ENTER
End End
For /EX2 option
(Display C)
2.
3.
ENTER
The unit is “mV.”The unit is “V.”
IM 253421-01E
Page 47

4.6 Selecting the Measurement Range and Setting the Scaling Constant when External Sensor is Used (option)
Explanation
Scaling Function in combination with External Sensor Input
This function is useful for measuring current, power and such when you are using an
external sensor, and have connected their output to the input connector. You set the
scaling constant to the current or power value, computed from the sensor. When the
scaling function is turned ON, measured values which have been converted to the
corresponding values for the transformer primary sides, can been displayed or
otherwise output. This function is exactly the same as the one described previously
for use with PT/CT.
Measured/computed value Scaled result
Current A E × A E: External sensor scaling constant
Active power W E × W
Reactive power var E × var
Apparent power VA E × VA
Selecting the Setting Format of the Scaling Constant
The range is from 0.001 to 9999. The initial value is 50.00. The scaling constant is
specified using display C.
Selecting the Measurement Range (Current, with Scaling function ON)
After having set the scaling constants, select the menu for the current measurement
range. Select the rated output of the external sensor from this menu (see the
Operating Procedure on the previous page). Scaling of the external sensor input will
start as soon as you press the ENTER key after selecting. Scaling will stop as soon
as you select a measurement range other than external sensor input from the menu.
4
Setting Measurement Conditions and Measurement Range
Setting Example of Scaling Constants for External Sensor Input
• In case the rated specs of the external sensor are 50 A/50 mV, measurement
range is 50 mV, then
50 A/50 mV × 50 mV = 50 A: scaling constant is 50.00
• In case the rated specs of the external sensor are 100 A/50 mV, measurement
range is 50 mV, then
100 A/50 mV × 50 mV = 100 A: scaling constant is 100.00
• In case the rated specs of the external sensor are 50 A/80 mV, measurement
range is 50 mV, then
50 A/80 mV × 50 mV = 31.25 A: scaling constant is 31.25
However, since the setting range is 50 mV, use a setting within the 0 to 50 mV
range.
Note
• When performing measurements using the external sensor, make sure to turn off the scaling
function for the external PT/CT. When this function is ON, the scaling constant of the CT ratio
will interfere.
• The input range for the external sensor can only be of the manual type.
• When you switch from external sensor input to direct, auto range input, an error will appear.
First, select manual range for direct input and afterwards select auto range. (same goes for
setting by communication interface.)
IM 253421-01E
4-11
Page 48

4.7 Using the Averaging Function
Keys
Procedure
1.
SETUP
SAMPLE
V OVER
A OVER
MODE
RMS
V MEAN
DC
• Operate the instrument by following the thick lines in the menu below.
• Press the ENTER key to confirm a selection or setting.
• To leave the current menu in the middle of the operation, press the key indicated in step 1.
The confirmed settings up to that point are kept.
• Setting Averaging
Select the averaging function
2.
(Display C)
A
B
C
SCALING AVG FILTER STORE RECALL HARMONICS
3.
ENTER
4.
mV
VA
var
kA
TIME
MW
mV PF
deg
kA
MW
mV Hz
kA h
MW h
(Display C)
FUNCTION
FUNCTION
FUNCTION
5.
ENTER
AUTO
AUTO
A RANGEV RANGE
MODE TRIGMAX HOLD
START
HARMONICS
REMOTE
LOCAL SETUP
INTERFACE OUTPUT SHIFT
HOLD
ENTER
INTEGRATOR
STOP RESET
MEMORY INTEG SET
Select the type
(Display B)
6.
Displays
relevant
keys and
indicator
CAL
7.
ENTER
Select the
sample number
(Display C)
8.
• Averaging ON/OFF
1.
Select the averaging function
(Display C)
SETUP
2.
9.
ENTER
End
3.
ENTER
4.
(Display C)
5.
ENTER
End
4-12
IM 253421-01E
Page 49

Explanation
4.7 Using the Averaging Function
About the Averaging Function
This function performs exponential averaging or moving averaging on measurement
values. When the displayed values are unsteady due to big fluctuations in power
source or load, or due to the low frequency of the input signal, this function is useful to
stabilize the displayed values for easier reading.
Selecting the Type of Averaging
The following two selections are available. The initial value is “Lin”.
• Exponential Averaging: EP
Exponential averaging is expressed by the following equation.
D
= D
n
+ (Mn – D
n–1
n–1
)/K
where
D
: the exponentially averaged value at the “n”th display;
n
D
: the exponentially averaged value at the “n–1”th display;
n–1
Mn: the measurement value at the “n”th display;
K: attenuation constant
• Moving Averaging: Lin
Moving averaging is expressed by the following equation.
D
= (M
n
n–(m–1)
+ M
n–(m–2)
+ ... M
n–2
+ M
+ Mn)/m
n–1
where
D
: the value at the “n”th display;
n
M
M
: the measurement value at (m–1) display before the “n”th display;
n–(m–1)
: the measurement value at (m–2) display before the “n”th display;
n–(m–2)
:
M
: the measurement value at two displays before the “n”th display;
n–2
M
: the measurement value at one display before the “n”th display;
n–1
Mn: the measurement value at the “n”th display;
m: sample number
4
Setting Measurement Conditions and Measurement Range
Setting the Averaging Sample Number/Attenuation Constant
The following selections are available. The attenuation constant (for exponential
averaging) and the sample number (for moving averaging) are set and saved
seperately. The initial value is “8”.
8, 16, 32, 64
Setting Averaging ON/OFF
Select the averaging menu once again after having set the averaging values. The
initial value is oFF.
• on: When this setting is selected, pressing the ENTER key will start averaging and
the AVG indicator will light.
• oFF: When this setting is selected, pressing the ENTER key will stop averaging
and the AVG indicator will extinguish.
IM 253421-01E
4-13
Page 50

4.8 Using the MAX Hold Function
Keys
Procedure
SAMPLE
V OVER
A OVER
MODE
RMS
V MEAN
DC
A
B
C
SCALING AVG FILTER STORE RECALL HARMONICS
mV
VA
var
kA
TIME
MW
mV PF
deg
kA
MW
mV Hz
kA h
MW h
FUNCTION
FUNCTION
FUNCTION
AUTO
AUTO
A RANGEV RANGE
MODE TRIGMAX HOLD
START
HARMONICS
REMOTE
LOCAL SETUP
INTERFACE OUTPUT SHIFT
HOLD
ENTER
INTEGRATOR
STOP RESET
MEMORY INTEG SET
CAL
Displays
relevant
keys and
indicator
• Operate the instrument by following the thick lines in the menu below.
• Press the ENTER key to confirm a selection or setting.
• To leave the current menu in the middle of the operation, press the key indicated in step 1.
The confirmed settings up to that point are kept.
Select MAX hold function
2.
(Display C)
3.
ENTER
(Display C)
4.
.
5
ENTER
End
1.
SETUP
Explanation
4-14
MAX hold function
The maximum values (MAX) of V (voltage), A (current), W (active power), VA
(apparent power), var (reactive power), Vpk (voltage peak), and Apk (current peak)
can be held while the MAX hold function is enabled. The initial setting is oFF.
• on: The MAX hold function is activated.
• oFF: The MAX hold function is deactivated.
Note
The displayed values of V (voltage), A (current), W (active power), VA (apparent power), var
(reactive power), Vpk (voltage peak), and Apk (current peak) while the MAX hold function is
enabled will be the maximum values (MAX) that are held. The values for D/A output, output to
external plotter and printer, and communication output are also set to the maximum values
(MAX) that are held.
IM 253421-01E
Page 51

4.9 Using the Four Arithmetical Operation Function
Keys
Procedure
SAMPLE
V OVER
A OVER
MODE
RMS
V MEAN
DC
A
B
C
SCALING AVG FILTER STORE RECALL HARMONICS
mV
VA
var
kA
TIME
MW
mV PF
deg
kA
MW
mV Hz
kA h
MW h
FUNCTION
FUNCTION
FUNCTION
AUTO
AUTO
A RANGEV RANGE
MODE TRIGMAX HOLD
START
HARMONICS
REMOTE
LOCAL SETUP
INTERFACE OUTPUT SHIFT
HOLD
ENTER
INTEGRATOR
STOP RESET
MEMORY INTEG SET
CAL
Displays
relevant
keys
• Operate the instrument by following the thick lines in the menu below.
• Press the ENTER key to confirm a selection or setting.
• To leave the current menu in the middle of the operation, press the key indicated in step 1.
The confirmed settings up to that point are kept.
Select the four arithmetical
operations function
1.
SETUP
(Display C) (Display C)
2.
4.
5
.
ENTER
End
3.
ENTER
4
Setting Measurement Conditions and Measurement Range
IM 253421-01E
4-15
Page 52

4.9 Using the Four Arithmetical Operation Function
Explanation
Four Arithmetical Operations Function
Displays the following computation results on display C. “
when the computation results are being displayed.
: A+B
: A
−
B
: A
×
B
: A
÷
B
2
: A
÷
B
2
: A
÷
B
A, B indicates display A, B respectively.
Note
• The meanings of the displayed symbols are as follows:
: + (Addition)
−
(Subtraction)
:
:
×
(Multiplication)
:
÷
(Division)
: ^ (Exponent)
” is displayed at the front
• If the display A function is displaying INTEG TIME (elapsed time of integration), the
computation result displays “- - - - - -” (no data).
• If the value of display B function is less than 0.0001% of the rating, the computation result
displays “- - oF - -”.
Application Example
: Displays the result of display A × display B.
Computation example: This function is valid when display A is set to some function
other than VA (apparent power) and you wish to display VA on
Display C.
Display A Display B Display C
Vrms Arms Vrms × Arms
: Displays the result of display A ÷ display B.
Computation example: The absolute value of the impedance can be computed.
Display A Display B Display C
Vrms Arms |Z|=
Vrms
Arms
4-16
SOURCE
V
A
LOAD
IM 253421-01E
Page 53

4.9 Using the Four Arithmetical Operation Function
: Displays the result of display A ÷ (display B)
2
Computation example: The impedance (Z), resistance (R), and reactance (X) can be
computed.
Display A Display B Display C
VA Arms |Z|=
W Arms R=
Var Arms |X|=
SOURCE
V
VA
(Arms)
W
(Arms)
Var
(Arms)
LOAD
2
2
2
A
: Displays the result of (display A)2 ÷ display B
Computation example: The resistance can be computed.
Display A Display B Display C
2
Vrms W R=
(Vrms)
W
4
Setting Measurement Conditions and Measurement Range
SOURCE
V
LOAD
A
IM 253421-01E
4-17
Page 54

4.10 Computing the Crest Factor
Keys
Procedure
SAMPLE
V OVER
A OVER
MODE
RMS
V MEAN
DC
A
B
C
SCALING AVG FILTER STORE RECALL HARMONICS
mV
VA
var
kA
TIME
MW
mV PF
deg
kA
MW
mV Hz
kA h
MW h
FUNCTION
FUNCTION
FUNCTION
AUTO
AUTO
A RANGEV RANGE
MODE TRIGMAX HOLD
START
HARMONICS
REMOTE
LOCAL SETUP
INTERFACE OUTPUT SHIFT
HOLD
ENTER
INTEGRATOR
STOP RESET
MEMORY INTEG SET
CAL
Displays
relevant
keys
• Operate the instrument by following the thick lines in the menu below.
• Press the ENTER key to confirm a selection or setting.
• To leave the current menu in the middle of the operation, press the key indicated in step 1.
The confirmed settings up to that point are kept.
Select the four arithmetical
operations function
2.
(Display C)
3.
ENTER
4.
(Display C)
5
.
ENTER
End
1.
SETUP
Explanation
4-18
Crest factor computation
The crest factor is determined by peak value/rms value. When displaying the crest
factor, “
” is displayed at the front.
Computing equation for the crest factor and display
CF V: Displays the result of (Vpeak)/(Vrms).
CF A: Displays the result of (Apeak)/(Arms).
Note
• Definition of crest factor:
• If the measurement mode is V MEAN or DC, “- - - - - -” is displayed.
PEAK value
RMS value
IM 253421-01E
Page 55

4.11 Computing the Average Active Power during Integration
Keys
Procedure
SAMPLE
V OVER
A OVER
MODE
RMS
V MEAN
DC
A
B
C
SCALING AVG FILTER STORE RECALL HARMONICS
mV
VA
var
kA
TIME
MW
mV PF
deg
kA
MW
mV Hz
kA h
MW h
FUNCTION
FUNCTION
FUNCTION
AUTO
AUTO
A RANGEV RANGE
MODE TRIGMAX HOLD
START
HARMONICS
REMOTE
LOCAL SETUP
INTERFACE OUTPUT SHIFT
HOLD
ENTER
INTEGRATOR
STOP RESET
MEMORY INTEG SET
CAL
Displays
relevant
keys
• Operate the instrument by following the thick lines in the menu below.
• Press the ENTER key to confirm a selection or setting.
• To leave the current menu in the middle of the operation, press the key indicated in step 1.
The confirmed settings up to that point are kept.
Select the four arithmetical
operations function
1.
SETUP
(Display C) (Display C)
2.
4.
3.
ENTER
4
Setting Measurement Conditions and Measurement Range
Explanation
5
.
ENTER
End
Function used to compute the average active power during integration
This function computes the average active power within the integration period. It is
derived by dividing the watt hour (integrated active power) by the elapsed time of
integration.
Average active power during integration (W)
=
Watt hour (Wh)
Elapsed time of integration(h)
Note
This computation function is enabled during integration (while the integration is in progress or
while the integration is suspended). If the integration is reset, the watt hour and the elapsed
time of integration become zero, and the display shows “ - - - - -.” For details on integrator
functions, see chapter 6.
IM 253421-01E
4-19
Page 56

4.12 Selecting the Number of Displayed Digits
Keys
Procedure
SAMPLE
V OVER
A OVER
MODE
RMS
V MEAN
DC
A
B
C
SCALING AVG FILTER STORE RECALL HARMONICS
mV
VA
var
kA
TIME
MW
mV PF
deg
kA
MW
mV Hz
kA h
MW h
FUNCTION
FUNCTION
FUNCTION
AUTO
AUTO
A RANGEV RANGE
MODE TRIGMAX HOLD
START
HARMONICS
REMOTE
LOCAL SETUP
INTERFACE OUTPUT SHIFT
HOLD
ENTER
INTEGRATOR
STOP RESET
MEMORY INTEG SET
CAL
Displays
relevant keys
• Operate the instrument by following the thick lines in the menu below.
• Press the ENTER key to confirm a selection or setting.
• To leave the current menu in the middle of the operation, press the key indicated in step 1.
The confirmed settings up to that point are kept.
Select the number of displayed digits
1.
SETUP
(Display C)
2.
Explanation
.
3.
ENTER
(Display C)
4.
5
ENTER
End
Function used to select the number of displayed digits
You can select the maximum number of displayed digits for values such as V
(voltage), A (current), W (active power), VA (apparent power), var (reactive power),
Vpk (voltage peak), Apk (current peak), PF (power factor), VHz (voltage frequency),
AHz (current frequency), four arithmetical operation values, crest factor, and harmonic
analysis values (voltage, current, and active power). The initial value is Lo.
•Hi
The number of displayed digits is set to 5 (99999).
•Lo
The number of displayed digits is set to 4 (9999).
Note
• The actual number of displayed digits may be smaller than the maximum number of displayed
digits depending on the combination of the voltage range and current range and the
automatic digit carrying operation.
• Some items such as the phase angle, integrated value, integration time, and relative
harmonic content are not affected by the maximum number of displayed digits specified in
this section. For details, see the sections describing each item.
4-20
IM 253421-01E
Page 57

Chapter 5 Displaying the Results of the Measurement and Computation
5.1 Displaying Voltage, Current, and Active Power
Keys
Procedure
Display
A
B
C
SAMPLE
V OVER
A OVER
MODE
RMS
V MEAN
DC
A
B
C
SCALING AVG FILTER STORE RECALL HARMONICS
mV
VA
var
kA
TIME
MW
mV PF
deg
kA
MW
mV Hz
kA h
MW h
FUNCTION
FUNCTION
FUNCTION
AUTO
AUTO
A RANGEV RANGE
MODE TRIGMAX HOLD
START
HARMONICS
REMOTE
LOCAL SETUP
INTERFACE OUTPUT SHIFT
HOLD
ENTER
INTEGRATOR
STOP RESET
MEMORY INTEG SET
CAL
Displays
relevant
keys and
indicator
1. Selecting the Display Function
Select either V (voltage), A (current) or W (power) by pressing the FUNCTION key.
FUNCTION
VAWVA var
FUNCTION FUNCTION FUNCTION
FUNCTION FUNCTION FUNCTION FUNCTION
FUNCTION
FUNCTION
FUNCTION
TIME
VAWPF deg
FUNCTION FUNCTION FUNCTION FUNCTION
V
FUNCTION
AWV Hz A Hz Wh
& A
FUNCTIONFUNCTIONFUNCTIONFUNCTION
& V
Wh± and Ah± will light twice. and are displayed on the top of display C.
You can reverse the order by first pressing the SHIFT key followed by the FUNCTION key.
Ah±
FUNCTION
FUNCTION
FUNCTION
FUNCTION
AhAh±
5
Displaying the Results of the Measurement and Computation
FUNCTION
Wh±
Wh±
5-1IM 253421-01E
Page 58

5.1 Displaying Voltage, Current, and Active Power
Explanation
Continuous Maximum Allowable Input
• Voltage
Up to a peak value of 1.5 kV or RMS value of 1.0 kV, whichever is less.
• Current
• 20 A to 0.5 A range
Up to a peak value of 100 A or RMS value of 25 A, whichever is less.
• 200 mA to 5 mA range
Up to a peak value of 30 A or RMS value of 20 A, whichever is less.
• External sensor input
Up to five times the measurement range.
Maximum Reading of the Display and Units
• Maximum reading : for voltage, current and power, each 99999 (when the number
of displayed digits is 5)
• Units: V (voltage), A (current), W (power)
• Prefix: m, k, or M
Selecting the Display Function
The following selections are available.
• V: voltage will be displayed
• A: current will be displayed
• W: power will be displayed
Note
• The measurement results may differ even on a same signal if the measurement mode is
changed. For details related to the measurement mode, see section 4.1.
• The displayed values of V (voltage), A (current), and W (active power), while the MAX hold
function (see section 4.8) is enabled, will be the maximum values (MAX) that are held. The
values for D/A output, output to external plotter and printer, and communication output are
also set to the maximum values (MAX) that are held.
5-2 IM 253421-01E
Page 59

5.2 Displaying Apparent Power, Reactive Power, and Power Factor
Keys
Procedure
Explanation
Display
A
B
SAMPLE
V OVER
A OVER
MODE
RMS
V MEAN
DC
A
B
C
SCALING AVG FILTER STORE RECALL HARMONICS
mV
VA
var
kA
TIME
MW
mV PF
deg
kA
MW
mV Hz
kA h
MW h
FUNCTION
FUNCTION
FUNCTION
AUTO
AUTO
A RANGEV RANGE
MODE TRIGMAX HOLD
START
HARMONICS
REMOTE
LOCAL SETUP
INTERFACE OUTPUT SHIFT
HOLD
ENTER
INTEGRATOR
STOP RESET
MEMORY INTEG SET
CAL
Displays
relevant
keys and
indicator
1. Selecting the Display Function
Select either VA (apparant power), var (reactive power) or PF (power factor) by
pressing the FUNCTION key of display A or B.
FUNCTION
VAWVA var
FUNCTION FUNCTION FUNCTION
FUNCTION FUNCTION FUNCTION FUNCTION
FUNCTION
FUNCTION
TIME
VAWPF deg
You can reverse the order by first pressing the SHIFT key followed by the FUNCTION key.
Maximum Reading of the Display and Units
• Maximum reading of apparent and reactive power: 99999 (when the number of
displayed digits is 5)
• Display range of power factor: –1.0000 to 1.0000 (1.0000 if the computed result
between 1.0001 and 2.0000; PFErr if it is greater than 2.0000; –1.0000 if it is
between –1.0001 and –2.0000; PFErr if it is less than –2.0000.)
• Units: VA (apparent power), var (reactive power), power factor (no unit)
• Prefix: m, k, or M
Selecting the Display Function
The following selections are available.
• VA: apparent power will be displayed
• var: reactive power will be displayed
• PF: power factor will be displayed
5
Displaying the Results of the Measurement and Computation
FUNCTION
Note
• Changing the measurement mode might result in different computed results, even when the
input signal is the same. For details on the measurement mode, refer to section 4.1.
• When either the voltage or current drops below 0.5% of the measurement range, PFErr will
be displayed.
• The displayed values of VA (apparent power) and var (reactive power), while the MAX hold
function (see section 4.8) is enabled, will be the maximum values (MAX) that are held. The
values for D/A output, output to external plotter and printer, and communication output are
also set to the maximum values (MAX) that are held.
5-3IM 253421-01E
Page 60

5.3 Displaying the Phase Angle
Keys
Procedure
Explanation
SAMPLE
V OVER
A OVER
MODE
RMS
V MEAN
DC
A
B
C
SCALING AVG FILTER STORE RECALL HARMONICS
mV
VA
var
kA
TIME
MW
mV PF
deg
kA
MW
mV Hz
kA h
MW h
FUNCTION
FUNCTION
FUNCTION
AUTO
AUTO
A RANGEV RANGE
MODE TRIGMAX HOLD
START
HARMONICS
REMOTE
LOCAL SETUP
INTERFACE OUTPUT SHIFT
HOLD
ENTER
INTEGRATOR
STOP RESET
MEMORY INTEG SET
CAL
Displays
relevant
keys and
indicator
Selecting the Display Function
Select deg (phase angle) by pressing the FUNCTION key of display B.
Display
B
You can reverse the order by first pressing the SHIFT key followed by the FUNCTION key.
FUNCTION FUNCTION FUNCTION
FUNCTION
VAWPFdeg
FUNCTION
Display Range and Units
Display range: G180.0 to d180.0 (G meaning phase lag, d meaning phase lead)
Unit: deg
Selecting the Display Function
When you select deg, the phase angle will be displayed.
Note
• Changing the measurement mode might result in different computed results, even when the
input signal is the same. For details on the measurement mode, refer to section 4.1.
• When either the voltage or current drops below 0.5% of the measurement range, dEGEr will
be displayed.
• Distinction between phase lag and lead can be made properly, only when both voltage and
current are sine waves, and when the percentage of voltage or current input relating to the
measurement range does not fluctuate much.
• If the computed result of the power factor exceeds 1, the display will be as follows.
• When the power factor is between 1.0001 and 2.0000 or between –1.0001 and –2.0000:
phase angle display is 0.0.
• When the power factor is greater than 2.0000 or less than 2.0000: phase angle display is
dEGEr.
5-4 IM 253421-01E
Page 61

5.4 Displaying the Frequency
Keys
Procedure
SAMPLE
V OVER
A OVER
MODE
RMS
V MEAN
DC
A
B
C
SCALING AVG FILTER STORE RECALL HARMONICS
mV
VA
var
kA
TIME
MW
mV PF
deg
kA
MW
mV Hz
kA h
MW h
FUNCTION
FUNCTION
FUNCTION
AUTO
AUTO
A RANGEV RANGE
MODE TRIGMAX HOLD
START
STOP RESET
HARMONICS
MEMORY INTEG SET
REMOTE
LOCAL SETUP
INTERFACE OUTPUT SHIFT
Selecting the Display Function
Select either V Hz (voltage frequency) or A Hz (current frequency) by pressing the
FUNCTION key of display C.
Display
C
FUNCTION FUNCTION FUNCTION FUNCTION
V
AWV Hz A Hz Wh
FUNCTION
& A
FUNCTIONFUNCTIONFUNCTIONFUNCTION
V
&
Wh± and Ah± will light twice. and are displayed on the top of display C.
You can reverse the order by first pressing the SHIFT key followed by the FUNCTION key.
Ah±
HOLD
ENTER
CAL
INTEGRATOR
FUNCTION
FUNCTION
Displays
relevant
keys and
indicator
FUNCTION
FUNCTION
AhAh±
5
Displaying the Results of the Measurement and Computation
FUNCTION
Wh±
Wh±
5-5IM 253421-01E
Page 62

5.4 Displaying the Frequency
Explanation
Measurement Range
Maximum Reading of the Display and Units
Selecting the Display Function
Note
The measurement range lies from 10 to 50 kHz. Depending on the internal timing,
however, measurements can be done in the range from 4 to 10 Hz. At 100 Hz, 1 kHz,
10 kHz, 100 kHz, the measurement range is auto range.
• Maximum reading: 99999 (when the number of displayed digits is 5)
• Units: Hz
• Prefix: k
The following selections are available.
• V Hz: voltage frequency will be displayed
• A Hz: current frequency will be displayed
• In case the level of the input signal is low (below approx. 7%), or when the frequency is
smaller than the measurement range, the display will show “ErrLo.” When the frequency is
larger than the measurement range, the display will show “ErrHi.”
• This instrument measures the frequency after synchronizing to the cycle of the input signal.
We recommend to turn ON the filter when measuring an inverted waveform or a waveform
with high noise. However, depending on the signal’s frequency and level, “ErrLo” might
appear on the display. Since the filter’s cutoff frequency is 300 Hz, the signal attenuates and
no signal will be detected.
• Even when the filter is set OFF but the frequency exceeds the measurement range, “ErrLo”
might appear since no signal will be detected anymore due to the internal circuit’s attenuation.
5-6 IM 253421-01E
Page 63

5.5 Displaying Peak Value, Four Arithmetic Operation Value, and Crest Factor
Keys
Procedure
Explanation
SAMPLE
V OVER
A OVER
MODE
RMS
V MEAN
DC
A
B
C
SCALING AVG FILTER STORE RECALL HARMONICS
mV
VA
var
kA
TIME
MW
mV PF
deg
kA
MW
mV Hz
kA h
MW h
FUNCTION
FUNCTION
FUNCTION
AUTO
AUTO
A RANGEV RANGE
MODE TRIGMAX HOLD
START
STOP RESET
HARMONICS
MEMORY INTEG SET
REMOTE
LOCAL SETUP
INTERFACE OUTPUT SHIFT
Selecting the display Function
Select either
(four arithmetical operations, crest factor), (voltage peak value) or
(current peak value) by pressing the FUNCTION key.
Display
C
FUNCTION FUNCTION FUNCTION FUNCTION
V
FUNCTION
A W Wh
A HzV Hz
&A
FUNCTIONFUNCTIONFUNCTIONFUNCTION
&V
Ah±
Wh± and Ah± will light twice. and are displayed on the top of display C.
You can reverse the order by first pressing the SHIFT key followed by the FUNCTION key.
Displaying the peak value
is displayed first on display C followed by the value. If the unit display shows V, the
value is a voltage peak. If it shows A, the value is a current peak.
HOLD
ENTER
CAL
INTEGRATOR
FUNCTION
FUNCTION
Displays
relevant
keys and
indicator
FUNCTION
FUNCTION
AhAh±
5
Displaying the Results of the Measurement and Computation
FUNCTION
Wh±
Wh±
Displaying the result of the four arithmetical operation abd the crest factor
When display C is set to , the result of the computing equation specified in Section
4.9 or the crest factor specified in Section 4.10 is displayed.
However, if the value of display B function is less than 0.0001% of the rating,
“- - oF - -” is displayed for the computation result.
Note
The displayed values of Vpk (voltage peak) and Apk (current peak), while the MAX hold
function (see section 4.8) is enabled, will be the maximum values (MAX) that are held. The
values for D/A output, output to external plotter and printer, and communication output are
also set to the maximum values (MAX) that are held.
5-7IM 253421-01E
Page 64

Chapter 6 Integration
6.1 Integrator Functions
Active power integration and current integration can be carried out. All measurement
values (and computed values) can be displayed, even when integration is in progress,
except for the integrated values (watt hour or ampere hour) and elapsed time of integration.
Since integrated values of negative polarity can be also displayed, the consumed watt hour
(ampere hour: only when the measurement mode is DC) value of the positive side and the
watt hour value returning to the power supply of the negative side (ampere hour: only when
the measurement mode is DC), can be displayed seperately.
Integration Modes
The following three modes are available as integration modes.
Manual Integration Mode
• Integration starts: after having pressed the START key
• Integration stops:
• after having pressed the STOP key;
• when the integrated value reaches the maximum of 999999 MWh/MAh, or when the
integrated value of negative polarity reaches –99999 MWh/MAh;
• when the elapsed time of integration reaches the maximum of 10000 hours 00
minutes 00 seconds.
• Integration holds: the elapsed time of integration and integrated values at the point
where integration stopped will be held until the RESET key is pressed.
Integrated
value
Hold
6
Integration
Max. integrated value
(999999 MWh/MAh)
Display
overflow
Elapsed time
of integration
Start Stop Reset Start
Hold
Hold
Reset
Standard Integration Mode
• Integration starts: after having pressed the START key
• Integration stops:
• when the elapsed time of integration reaches the integration timer preset time;
• when the integrated value reaches the maximum of 999999 MWh/MAh, or when the
integrated value of negative polarity reaches –99999 MWh/MAh.
• Integration holds: the elapsed time of integration and integrated values at the point
where integration stopped will be held until the RESET key is pressed.
Integrated
value
Elapsed time
of integration
Hold
Hold
IM 253421-01E
Integration timer
preset time
Start Reset
6-1
Page 65

6.1 Integrator Functions
Continous Integration Mode (Repeat Integration)
• Integration starts:
• after having pressed the START key;
• when the elapsed time of integration reaches the integration timer preset time, the
integrated value and elapsed time of integration are reset automatically and
restarted immediately.
• Integration stops:
• when the elapsed time of integration reaches the integration timer preset time ;
however, the integrated value and elapsed time of integration are reset
automatically and restarted immediately;
• after having pressed the STOP key;
• when the integrated value reaches the maximum of 999999 MWh/MAh, or when
the integrated value of negative polarity reaches –99999 MWh/MAh;
• Integration holds: the elapsed time of integration and integrated values at the point
where they reached the maximum or at the point where the STOP key was pressed
will be held until the RESET key is pressed.
Integrated
value
Hold
Integration Methods
Elapsed time
of integration
Integration
timer preset
time
Start
Integration
timer preset
time
Integration
timer preset
time
Stop
Hold
Reset
Each display update interval (250 ms) the apparent power values or current values are
added to the integrated values, and will be time converted. The integration equations
are as follows.
Power integration
t
4×3600
T=0
Wi
Wi: Active power between display update interval
t: Elapsed time of integration
Current integration
t
A
i
Ai: Current value between display update interval
T=0
4×3600
t: Elapsed time of integration
6-2
IM 253421-01E
Page 66

Display Resolution during Integration
The display resolution for integrated values is 100000 counts. When the integrated
value reaches 100000 counts, the decimal point shifts automatically. For example, if
0.00001 mWh is added to 9.99999 mWh, the display shows “10.0000 mWh. ”
Display Function of Integrator Values
By selecting the display function, you can display the polarity of the integrator values.
Display function Measurement mode Display contents
Wh RMS,VMEAN,DC both positive and negative watt hour values
*1
Wh±
*1
Wh±
Ah RMS,VMEAN total ampere hour values
*2
Ah±
*2
Ah±
*1 When the Wh function is selected, pressing the FUNCTION key once or twice will result in
Wh±. Pressing the FUNCTION key once will result in displaying the positive watt hour value,
whereas pressing the FUNCTION key twice will result in displaying the negative watt hour
value. In case of the negative watt hour value, “–” will appear in front of the value.
*2 When the Ah function is selected, pressing the FUNCTION key once or twice will result in
Ah±. Pressing the FUNCTION key once will result in displaying the positive ampere hour
value, whereas pressing the FUNCTION key twice will result in displaying the negative
ampere hour value. In case of the negative ampere hour value, “–” will appear in front of the
value.
6.1 Integrator Functions
RMS,VMEAN,DC positive watt hour value
RMS,VMEAN,DC negative watt hour value
DC both positive and negative ampere hour values
RMS,VMEAN total ampere hour values (same as Ah)
DC positive ampere hour value
RMS,VMEAN –0
DC negative ampere hour value
6
Integration
Note
• When negative integrated values are displayed, the maximum display reading will become –
99999 MWh/MAh because of the added minus character.
• When the measurement mode is RMS/VMEAN and the current input drops below 0.5% of the
rated range, the ampere hour value will become zero (0).
• During integration is in progress (until being reset), operation of other functions are restricted.
For details, see section 6.4.
IM 253421-01E
6-3
Page 67

6.2 Setting Integration Mode, Integration Type, and Integration Timer
Keys
Procedure
SAMPLE
V OVER
A OVER
MODE
RMS
V MEAN
DC
A
B
C
SCALING AVG FILTER STORE RECALL HARMONICS
mV
VA
var
kA
TIME
MW
mV PF
deg
kA
MW
mV Hz
kA h
MW h
FUNCTION
FUNCTION
FUNCTION
AUTO
AUTO
A RANGEV RANGE
MODE TRIGMAX HOLD
START
HARMONICS
REMOTE
LOCAL SETUP
INTERFACE OUTPUT SHIFT
HOLD
ENTER
INTEGRATOR
STOP RESET
MEMORY INTEG SET
CAL
Displays
relevant
keys and
indicator
• Operate the instrument by following the thick lines in the menu below.
• Press the ENTER key to confirm a selection or setting.
• To leave the current menu in the middle of the operation, press the key indicated in step 1.
The confirmed settings up to that point are kept.
• Selecting the Integration Mode
1.
SHIFT
RESET
INTEG SET
(Display C)
2. 4.
3.
ENTER
Select the mode
(Display C)
5.
ENTER
End
• Setting the integration type
2.
(Display C)
3.
ENTER
4.
Select type
(Display C)
5.
ENTER
End
1.
SHIFT
RESET
INTEG SET
6-4
• Setting the Integration Timer
1.
SHIFT
RESET
INTEG SET
Minute
(Display B)
7.
Same as steps 4 and 5
8.
(Display C)
2.
9.
ENTER
3.
ENTER
Second
(Display C)
10.
Same as steps 4 and 5
11.
Hour
(Display A)
4.
Set value
5.
SHIFT
12.
ENTER
End
6.
ENTER
Move across digits
IM 253421-01E
Page 68

Explanation
6.2 Setting Integration Mode, Integration Type, and Integration Timer
Selecting the Integration Mode
The following selections are available. The initial value is nor.
• nor: Select this for manual or standard integration mode. Depending on the
integration timer, this instrument will automatically decide the appropriate mode.
• Cont: Select this for the continuous integration mode.
Selecting the Integration Type
The following selections are available. The initial value is St.
• St: Standard type. Integrates the active power or current that is obtained using the
normal measurement method, which obtains the active power or current from the
sampled data over the period that is synchronized to the input signal. Select the
standard type for steady-state input signals that have a constant period such as a
sinusoid.
• Ad: Advanced type. Integrates the active power or current obtained over a fixed
period of sampled data, irrespective of the period of the input signal. Select the
advanced type for intermittent signals with a frequency of 50 or 60 Hz.
Note
Select integration type Ad when integrating the power of devices that are controlled through
intermittent signals or devices on which the amplitude of the voltage or current changes
drastically. If the load fluctuation is large, the value obtained on this instrument may differ
from that obtained on other instruments using a different integration method.
6
Integration
Selecting the Integration Timer
Specify how many hours, minutes, and seconds to perform the integration. The
selectable range is from 0.00.00 (0 hours 0 minutes 0 seconds) to 10000.00.00
(10000 hours, 0 minutes, 0 seconds). The initial value is 0.00.00.
• 0.00.00: When nor is selected in the integration mode menu, integration is
performed in the manual integration mode. If Cont is selected, an error code is
displayed and the integration is not performed.
• 0.00.01 to 10000.00.00: The time during which integration is to be performed when
using the standard or continuous integration mode. The standard or continuous
integration mode is specified in the integration mode menu.
IM 253421-01E
6-5
Page 69

6.3 Displaying Integrated Values
Keys
Procedure
Display
A
C
SAMPLE
V OVER
A OVER
MODE
RMS
V MEAN
DC
A
B
C
SCALING AVG FILTER STORE RECALL HARMONICS
mV
VA
var
kA
TIME
MW
mV PF
deg
kA
MW
mV Hz
kA h
MW h
FUNCTION
FUNCTION
FUNCTION
AUTO
AUTO
A RANGEV RANGE
MODE TRIGMAX HOLD
START
HARMONICS
REMOTE
LOCAL SETUP
INTERFACE OUTPUT SHIFT
HOLD
ENTER
INTEGRATOR
STOP RESET
MEMORY INTEG SET
CAL
Displays
relevant
keys and
indicator
1. Selecting the Display Function
Pressing the FUNCTION key on display A will select TIME (elapsed time of
integration).
Pressing the FUNCTION key on display C will select either Wh/Wh± (power) or Ah/
Ah± (current),
FUNCTION
V A W VA var
FUNCTION FUNCTION FUNCTION FUNCTION
V
FUNCTION
&A
Wh± and Ah± will light twice. and are displayed on the top of display C.
You can reverse the order by first pressing the SHIFT key followed by the FUNCTION key.
. (average active power during integration).
FUNCTION FUNCTION FUNCTION FUNCTION
TIME
FUNCTION
A W V Hz A Hz Wh
&V
FUNCTIONFUNCTIONFUNCTIONFUNCTION
Ah±
FUNCTION
FUNCTION
FUNCTION
FUNCTION
FUNCTION
AhAh±
Wh±
Wh±
2. Starting Integration
Press the START key. The START indicator lights, the integrated value appears on
display C, and the elapsed time of integration appears on display A.
is displayed
first on display C. It is followed by the average active power during integration, if the
function is specified in the computation settings (see section 4.11).
START
3. Holding Integration
Press the HOLD key. The HOLD indicator will light, and the displayed values will be
held.
HOLD
4. Cancelling HOLD, and Updating the Integration
Press the HOLD key while the values are held. The HOLD indicator turns off, and the
display values are updated. You can also update the display by activating a trigger
(press the SHIFT key followed by the HOLD (TRIG) key) while the values are held.
HOLD
TRIG
6-6
IM 253421-01E
Page 70

Explanation
6.3 Displaying Integrated Values
5. Stopping Integration
Press the STOP key. The START indicator will extinguish and the STOP indicator will
light. The displayed values will be held.
STOP
6. Resetting Integration
Press the RESET key. The STOP indicator will extinguish and the values on display
A will be reset to 0.00.00.
RESET
Maximum Reading of the Display and Units
Maximum reading
• Integrated value: 999999 (–99999 in case of minus display)
• Elapsed time of integration: 10000
• Units: Wh (power integration: watt hour value), Ah(current integration: ampere hour
value)
• Prefix: m, k, or M
Selecting the Display Function
The following selections are available.
• Wh: displays both the positive and negative watt hour values
•Wh±: displays the positive and negative watt hour values separately
• Ah: displays the total ampere hour values
•Ah±: displays the total ampere hour values, or the positive and negative ampere
hour values separataly
•
: The average active power during integration is displayed, if the function is
specified in the computation settings (see section 4.11).
6
Integration
Update Hold Function
Although the held values will not be updated, integration continues. When hold is
being cancelled, the integration results (values and time) corresponding to the point of
cancellation, will be displayed.
For details regarding the relation with the START/STOP key, refer to the following
section.
Integration Reset
Resetting will result in returning the integration results to the status before integration
started.
Pressing the RESET key is useful after integration has been stopped.
For details regarding the relation with the START/STOP key, refer to the following
section.
Display in case of Integration Over
When the maximum integration value has been reached (999999 MWh/MAh or
–99999 MWh/MAh), integration will stop and that result will be held on the display.
When the maximum integration time has been reached (up to 10000 hrs), integration
will stop and that result will be held on the display.
IM 253421-01E
6-7
Page 71

6.3 Displaying Integrated Values
Note
• The maximum number of digits used to display the elapsed time of integration is nine (when
the hour, minute, and second digits are added together). The WT200 displays the elapsed
time of integration on display A. However, because the maximum number of digits that can
be displayed on display A is five, all the digits of the elapsed time of integration may not be
displayed in certain cases. Therefore, the number of digits that are displayed varies
depending on the elapsed time of integration as follows:
• For details related to Wh, Wh±, Ah, and Ah±, see page 6-3. For details related to the
average active power during integration, see section 4.11.
• The displayed values of V (voltage), A (current), W (active power), VA (apparent power), var
(reactive power), Vpk (voltage peak), and Apk (current peak), while the MAX hold function
(see section 4.8) is enabled, will be the maximum values (MAX) that are held. The values for
D/A output, output to external plotter and printer, and communication output are also set to
the maximum values (MAX) that are held. The integrated value is determined and displayed
by summing the value that is measured at every display update rate, irrespective of the MAX
hold function.
Elapsed Time of Integration Display on Display A Display Resolution
0 to 9 hours 59 minutes 59 seconds 0.00.00 to 9.59.59 1 s
10 hours to 99 hours 59 minutes 59 seconds 10.00.0 to 99.59.5 10 s
100 hours to 999 hours 59 minutes 59 seconds 100.00 to 999.59 1 min
1000 hours to 9999 hours 59 minutes 59 seconds 1000.0 to 9999.5 10 min
10000 hours 10000 1 hour
6-8
IM 253421-01E
Page 72

6.4 Precautions Regarding Use of Integrator Function
Relation between Integration Hold and the START/STOP key
When the HOLD key is pressed, the display and communication output of the integrated
results is being held while integration continues. The relation between this hold function
and the START/STOP key is as follows.
• Even when starting integration while the hold function is on, the display and
communication output will remain unchanged. Only canceling the hold function or
activating a trigger (pressing the SHIFT key followed by the HOLD (TRIG) key) will
result in displaying or outputting the integrated results of the time of cancellation.
ON
HOLD
OFF
Displayed
value
(Dotted line shows integrated value)
Elapsed time
of integration
6
Integration
START
STOP RESET
• Even when stopping integration while the hold function is on, the displayed integrated
value will remain unchanged. However, as soon the hold function is turned off or a
trigger is activated, the integrated results of the time when integration was stopped will
be displayed or output.
ON
HOLD
OFF
TRIG
Displayed
value
(Dotted line shows integrated value)
Elapsed time
of integration
START
ON ON ON
STOP RESET
Relation between Integration Reset and the START/STOP key
The relation between integration reset and the start/stop key is as follows.
Reset
Restart
Integration timer preset time
Integrated
value
Start
Interrupt
Interrupt
Restart
Auto stop Reset
IM 253421-01E
Elapsed time
of integration
START STOP START STOP RESET START RESET
6-9
Page 73

6.4 Precautions Regarding Use of Integrator Function
Backup During Power Failures
• If there is a power failure while integration is in progress, the integrated value and
elapsed time of integration will be backed up. When the power is restored, the display
will show the integrated results up to the time the power failure occurred.
• To start integration after the power is restored, it is necessary to reset integration first.
Operating Restrictions during Integration
Certain key operations are restricted during integration, and are shown below.
(START Indicator)
(STOP Indicator)
Function
Measurement mode
Measurement synchronization source
Filter
Measurement range
Scaling
Averaging
MAX hold
Display function
Number of displayed digits
Hold
Trigger
Integration
reset
Not lit
Not lit
yes
yes
yes
yes
yes
yes
yes
yes
yes
yes
yes
Integration status
Integration in
progress
Lit
Not lit
no
no
no
no
yes
no
yes
yes
yes
yes
yes
Integration
interrupted
Not lit
Lit
no
no
no
no
yes
no
yes
yes
yes
yes
yes
Integration mode
Integration type
Integration timer
Integration start
Integration stop
Integration reset
Harmonic analysis function (option)
Store/recall
Comparator
Plotter and printer
Zero level compensation
yes
yes
yes
yes
no
yes
yes
yes
yes
yes
yes
Settings cannot be changed, but can be
displayed
Settings cannot be changed, but can be
displayed
Settings cannot be changed, but can be
displayed
no
yes
no
no
no (
Store possible)
yes
yes
no
yes
no
yes
no
Store possible)
no (
yes
yes
no
• yes: Settings can be changed
•no: Settings cannot be changed. Attempts will result in an error code.
• When integration is started during auto range, the measurement range will change to manual range.
Integration Computation when the Measured Value Exceeds Measurement Limits
When the active power, measurement current, instantaneous voltage or current exceeds
the measurement range, the integration computation will be handled as follows.
• When the active power or measurement current exceeds the measurement range by
163.84%, their integrated values become 163.84% of the measurement range.
• When the instantaneous voltage or current exceeds the measurement range by
300%, their integrated values become 300% of the measurement range.
6-10
IM 253421-01E
Page 74

Chapter 7 Using the Harmonic Analysis Function (Optional)
7.1 Harmonic Analysis Function
This chapter explains the harmonics analysis function which can be applied to normal
measurements of voltage, current and power.
Analyzed/Displayed Items
After having set the harmonic analysis function to ON, the harmonic component of
voltage, current, or active power, will be analyzed and displayed for one of the input
elements. Depending on the setting of the display function, the display changes as
follows.
Display
A
No display function lit
FUNCTION FUNCTION FUNCTION
FUNCTION
V
A
W
No display function lit
Display function V, A, W
Display
B
Display function
Display
C
FUNCTION
VAW PF
V
: Displays the voltage analysis value of the order shown on display A
A
: Displays the current analysis value of the order shown on display A
W
: Displays the active power analysis value of the order shown on display A
PF
: Displays the power factor of the fundamental (1st order)
V %
: Displays the voltage harmonic distortion, proceeded by “t” on display B
A %
: Displays the current harmonic distortion, proceeded by “t” on display B
V %
: Displays the relative harmonic content of the voltage of the order shown on display A
A %
: Displays the relative harmonic content of the current of the order shown on display A
W %
: Displays the relative harmonic content of the active power of the order shown on
V deg
A deg
display A
: · In case the 1st order (fundamental) is shown on display A:
· In case the order 2 to 50 is shown on display A:
: · In case the 1st order (fundamental) is shown on display A:
· In case the order 2 to 50 is shown on display A:
FUNCTION
V A W V Hz
: Displays the harmonic order (1 to 50)
: Displays all rms values (computed values) of 1up to 50
components of voltage, current or active power
FUNCTION
FUNCTION
FUNCTION
FUNCTION
FUNCTION
V% A%
FUNCTION FUNCTIONFUNCTIONFUNCTIONFUNCTION
Adeg
Displays the phase angle between the voltage of the first order and the current of
the first order
Displays the phase angle between the voltage of the first order and each voltage of
the 2nd to 50th order
Displays the phase angle between the voltage of the first order and the current of
the first order (same as V deg)
Displays the phase angle between the current of the first order and each current of
the 2nd to 50th order
FUNCTION
FUNCTION
W%Vdeg A% V%
FUNCTION FUNCTION
A Hz
7
Using the Harmonic Analysis Function (Optional)
Display function : Displays all rms values (computed values) of 1 up to 50 components of voltage,
Auto Range Operation
Display Renewal Rate
IM 253421-01E
V, A, W
current or active power.
: Displays the fundamental frequency of the voltage for PLL synchronization
V Hz
(displays the measurement value for only the selected voltage input)
: Displays the fundamental frequency of the current for PLL synchronization
A Hz
(displays the measurement value for only the selected current input)
The up/down operation of the measurement range is the same as for normal
measurement.
Note
When the range changes, the PLL synchronization will be re-established. Therefore, correct
measurement values might not be obtained which might result in an unstable range. If this is the
case, set the measurement range to a fixed range.
Harmonic analysis data will be updated approx. every 3 seconds.
7-1
Page 75

7.1 Harmonic Analysis Function
Holding the Display
When you use the display hold function and change the order or display function while
the harmonic analysis function is ON, you can display the harmonic data analyzed at the
corresponding time.
Updating the Displayed Data
The display can be updated in the same way as for normal measurement.
Overrange/Error Displays
In case the fundamental frequency of the PLL synchronization signal lies outside the
measurement range. Display B will show “FrqEr”.
Note
Display in case of Overrange
The overrange display (being the same as for normal measurement) will appear when
all rms values of the 1st to 50th order reach the following value:
The relative harmonic content and harmonic distortion are related to voltage and current.
Error Display
The power factor or phase angle will show PFErr or dEGEr when either the voltage,
range or power exceeds 200% of the range.
Computation Over Display
Appears in the same way as for normal measurement.
Dot Display
The display will show dots in any of the following cases.
• When there are no more analysis data to be displayed during harmonic analysis;
• Soon after the harmonic analysis function has been turned ON;
• When the PLL synchronization is being re-established;
• Until the initial analysis data are obtained, after having changed the settings;
• When the analysis order which depends on the fundamental frequency, exceeds
• When the display function is set to relative harmonic content (%) and the order at
• When the PLL source is set to voltage, and an attempt is made to display the
Averaging Function
Exponential averaging is performed with an attenuation constant of 8.
Output to an External Plotter
Using the GP-IB or RS-232-C interface, harmonic analysis data can be printed as value
or graph on an external plotter.
Effect of Aliasing
This instrument is not equipped with an internal aliasing filter. Due to aliasing accidental
errors may occur under the following circumstances.
Fundamental frequency f in Hz
40≤f<70 errors may occur in case of harmonic components of the 256th or higher;
70≤f<130 errors may occur in case of harmonic components of the 128th or higher;
130≤f<250 errors may occur in case of harmonic components of the 64th or higher;
250≤f≤440 errors may occur in case of harmonic components of the 32nd or higher.
The measurement range of the fundamental frequency of the harmonic analysis function is
different from the frequency measurement range of normal measurement. For details, see
chapter 16, “Specifications.”
• 140% of the rated range for the 600 V voltage range, or 20 A current range
• 200% of the rated range for voltage ranges except 600 V, or current ranges
except 20 A
the upper limit, after having set the order at display A;
display A is set to 1;
current frequency (AHz); or when the PLL source is set to current, and an attempt
is made to display the voltage frequency (VHz);
7-2
IM 253421-01E
Page 76

7.2 Setting the PLL Source and Harmonic Distortion Method
Keys
Procedure
SAMPLE
V OVER
A OVER
MODE
RMS
V MEAN
DC
A
B
C
SCALING AVG FILTER STORE RECALL HARMONICS
mV
VA
var
kA
TIME
MW
mV PF
deg
kA
MW
mV Hz
kA h
MW h
FUNCTION
FUNCTION
FUNCTION
AUTO
AUTO
A RANGEV RANGE
MODE TRIGMAX HOLD
START
HARMONICS
REMOTE
LOCAL SETUP
INTERFACE OUTPUT SHIFT
HOLD
ENTER
INTEGRATOR
STOP RESET
MEMORY INTEG SET
CAL
Displays
relevant
keys and
indicator
• Operate the instrument by following the thick lines in the menu below.
• Press the ENTER key to confirm a selection or setting.
• To leave the current menu in the middle of the operation, press the key indicated in step 1.
The confirmed settings up to that point are kept.
• Setting the PLL source
1.
SHIFT
START
HARMONICS
2.
(Display C)
3.
ENTER
Set the PLL source
(Display C)
4.
5.
ENTER
End
7
Using the Harmonic Analysis Function (Optional)
• Setting the Computation Method of the Harmonic Distortion
1.
SHIFT
START
HARMONICS
2.
(Display C)
Set the computation method
3.
ENTER
(Display C)
4.
5.
ENTER
End
IM 253421-01E
7-3
Page 77

7.2 Setting the PLL Source and Harmonic Distortion Method
Explanation
Setting the PLL source
For harmonic analysis, it is necessary to select the input to be used as the
fundamental frequency (PLL source) for synchronization. (PLL stands for Phase
Locked Loop.)
• V1: Sets the voltage as the PLL source.
• A1: Sets the current as the PLL source.
Note
• If the fundamental frequency of the PLL source cannot be measured due to fluctuations or
distortion, it is not possible to obtain correct measurement results. In this case, it is
suggested that voltage with relatively small distortion be selected as the PLL source.
• It is recommended to turn ON the filter in cases where the fundamental frequency is 300 Hz
or less and high frequency components are present.
• If the amplitude of the input signal selected as the PLL source is smaller than the rated range
value, PLL synchronization may sometimes fail. In this case, it is suggested that a suitable
measurement range be selected so that the input level exceeds 30% of the rated range value.
Setting the Computation Method of Harmonic Distortion
The computation method of harmonic distortion can be selected from the following
two. In the following explanation a maximum of 50 analysis orders is assumed. In
case of a maximum less than 50, computation/display will be performed up to that
order.
• iEC: Computes the ratio of the rms value of the 2nd to 50th order component to
that of the fundamental (1st order).
• CSA: Computes the ratio of the rms value of the 2nd to 50th order component to
that of the rms value of the 1st to 50th component.
Computation Equation
In case of iEC
n
2
(Ck)
/
C
k=2
1
In case of CSA
n
(Ck)
k=2
C1: Fundamental component (1st order)
Ck: Fundamental or harmonic component
k: Analysis order
n: Maximum order. The maximum order depends on the fundamental frequency of the
n
2
/
(Ck)
k=1
input set as the PLL source. For details, see chapter 16, “Specifications.”
2
7-4
IM 253421-01E
Page 78

7.3 Switching the Harmonic Analysis Function ON/OFF
Keys
Procedure
Explanation
SAMPLE
V OVER
A OVER
MODE
RMS
V MEAN
DC
A
B
C
SCALING AVG FILTER STORE RECALL HARMONICS
mV
VA
var
kA
TIME
MW
mV PF
deg
kA
MW
mV Hz
kA h
MW h
FUNCTION
FUNCTION
FUNCTION
AUTO
AUTO
A RANGEV RANGE
MODE TRIGMAX HOLD
START
HARMONICS
REMOTE
LOCAL SETUP
INTERFACE OUTPUT SHIFT
HOLD
ENTER
INTEGRATOR
STOP RESET
MEMORY INTEG SET
CAL
Displays
relevant
keys and
indicator
• Operate the instrument by following the thick lines in the menu below.
• Press the ENTER key to confirm a selection or setting.
• To leave the current menu in the middle of the operation, press the key indicated in step 1.
The confirmed settings up to that point are kept.
• Turning the Harmonic Analysis Function ON/OFF
2.
(Display C)
3.
ENTER
End
1.
SHIFT
START
HARMONICS
Turning the Harmonic Analysis Function ON/OFF
• on : Pressing the ENTER key after selecting on will result in starting of the harmonic
analysis and the HARMONICS indicator will light up. The harmonic order will be
displayed on display A.
• oFF: Pressing the ENTER key after selecing off will result in stopping of the harmonic
analysis and the HARMONICS indicator will extinguish.
7
Using the Harmonic Analysis Function (Optional)
IM 253421-01E
Note
• When the harmonic analysis function is turned ON, the measurement mode will automatically
change to RMS mode. When the harmonic analysis function is turned OFF, the measurement
mode will stay the RMS mode.
• When the harmonic analysis function is ON, integration cannot be started. And accordingly,
when the integration is in progress, the harmonic analysis function cannot be started (see
page 6-10).
7-5
Page 79

7.4 Setting the Harmonic Order and Displaying the Results of Harmonic Analysis
Keys
Procedure
SAMPLE
V OVER
A OVER
MODE
RMS
V MEAN
DC
A
B
C
SCALING AVG FILTER STORE RECALL HARMONICS
mV
VA
var
kA
TIME
MW
mV PF
deg
kA
MW
mV Hz
kA h
MW h
FUNCTION
FUNCTION
FUNCTION
AUTO
AUTO
A RANGEV RANGE
MODE TRIGMAX HOLD
START
HARMONICS
REMOTE
LOCAL SETUP
INTERFACE OUTPUT SHIFT
HOLD
ENTER
INTEGRATOR
STOP RESET
MEMORY INTEG SET
CAL
The following operations assume that the harmonic analysis function is turned ON.
Setting the Harmonics Order
1. Turn off the display function indicator of display A.
Display
A
Display function turns off
You can reverse the order by first pressing the SHIFT key followed by the FUNCTION key.
FUNCTION FUNCTION FUNCTION
V
A
2. Set the harmonics order.
(Display A)
Displays
relevant
keys and
indicator
W
FUNCTION
Displaying the Values of Harmonic Analysis
Displays each analysis value after having set the display function of either display B or
C.
Display
B
FUNCTION
FUNCTION
VAW PF
FUNCTION FUNCTIONFUNCTIONFUNCTIONFUNCTION
Adeg
Display
C
FUNCTION
FUNCTION
V A W V Hz
You can reverse the order by first pressing the SHIFT key followed by the FUNCTION key.
FUNCTION
FUNCTION
FUNCTION
FUNCTION
FUNCTION
V% A%
W%Vdeg A% V%
FUNCTION FUNCTION
A Hz
7-6
IM 253421-01E
Page 80

Explanation
7.4 Setting the Harmonic Order and Displaying the Results of Harmonic Analysis
Setting the Order of Harmonics
The maximum order for which analysis results can be displayed varies depending on
the frequency of the fundamental.
Example
• When the fundamental frequency is 50 Hz, up to 50 orders can be displayed;
• When the fundamental frequency is 400 Hz, up to 30 orders can be displayed.
When an order is set exceeding the maximum order, display B will change to the dot
display. For details related to the upper limit of the order of analysis, see chapter 16,
“Specifications.”
Displaying the Results of Harmonic Analysis
Depending on the setting of display function of display B and C, the analyzed items
will appear on the display as follows. In the following explanation a maximum of 50
analysis orders is assumed. In case of a maximum less than 50, computation/display
will be performed up to that order.
Display B
• V: Shows the analysis value of the voltage corresponding to the order shown
on display A;
• A: Shows the analysis value of the current corresponding to the order shown
on display A;
• W: Shows the analysis value of the active power corresponding to the order
shown on display A;
• PF: Shows the power factor of the fundamental (1st order);
• V%: Shows the harmonic distortion of the voltage followed by the character “t”;
Two computation methods are available; See section 7.2 for details. The
display range is 0.00 to 99.99 and 100.0 to 999.9%.
• A%: Shows the harmonic distortion of the current followed by the character “t”;
Two computation methods are available; See section 7.2 for details. The
display range is 0.00 to 99.99 and 100.0 to 999.9%.
• V%: Shows the relative harmonic content of the voltage corresponding to the
order shown on display A; The display range is 0.00 to 99.99 and 100.0 to
999.9%.
• A%: Shows the relative harmonic content of the current corresponding to the
order shown on display A; The display range is 0.00 to 99.99 and 100.0 to
999.9%.
• W%: Shows the relative harmonic content of the active power corresponding to
the order shown on display A; The display range is 0.00 to ±99.99 and
±100.0 to ±999.9%.
• V deg: When the fundamental (1st order) is shown on display A
Shows the phase angle between the 1st order of the current and the 1st
order of the voltage. G (phase lag) or d (phase lead) will also be displayed.
When the 2nd to 50th order is shown on display A
Shows the phase angle between the 1st order of the voltage and the 2nd to
50th order of each voltage. A – (minus) will be displayed in front of the order
only when the 2nd to 50th order is phase-lagged. The display range is
–180.0 to 180.0 deg.
• A deg: When the fundamental (1st order) is shown on display A
Shows the same as in case of V deg.
When the 2nd to 50th order is shown on display A
Shows the phase angle between the 1st order of the current and the 2nd to
50th order of each current. A – (minus) will be displayed in front of the order
only when the 2nd to 50th order is phase-lagged. The display range is
–180.0 to 180.0 deg.
7
Using the Harmonic Analysis Function (Optional)
IM 253421-01E
7-7
Page 81

7.4 Setting the Harmonic Order and Displaying the Results of Harmonic Analysis
Display C
V: Shows each rms (computed) value of the 1st to 50th harmonic component of
the voltage;
A: Shows each rms (computed) value of the 1st to 50th harmonic component of
the current;
W: Shows each rms (computed) value of the 1st to 50th harmonic component of
the active power;
Computation Equation
n
n
Wk
(Vk)
(Ak)
2
2
V=
A=
W=
k=1
k=1
n
k=1
Vk, Ak, Wk:Each component of 1st to 50th order of voltage, current and active
power;
k: Analysis order
n: Maximum order. The maximum order depends on the fundamental
frequency of the input set as the PLL source. For details, see
chapter 16, “Specifications.”
V Hz: Shows the fundamental frequency of the voltage of the PLL source. This
frequency applies only to the element selected as PLL source. For details
regarding the PLL source setting, see section 7.2. The measurement range
is the same as in case of normal measurement.
The range of fundamental frequencies in case of harmonic analysis is 40 to
440 Hz. However, depending on internal timing, there are cases where
measurements in the 20 to 700 Hz range can be performed.
A Hz: Shows the fundamental frequency of the current of the PLL source. The rest
is the same as in case of V Hz.
Note
• A bar display appears if you select a display function that is not being analyzed or measured.
• When pressing the FUNCTION key on display A, and the display function becomes V, A or
W, then display A will show the same analysis items as the V, A or W shown on display C.
• Characteristics such as maximum reading, display range, units, etc. which are not described
on the previous page, are not different from the characteristics of normal measurement.
7-8
IM 253421-01E
Page 82

Chapter 8 Storing/Recalling Measured Data and Setting Parameters from the Internal Memory
8.1 Storing/Recalling Measured Data
Keys
A
SAMPLE
V OVER
A OVER
MODE
B
RMS
V MEAN
DC
C
SCALING AVG FILTER STORE RECALL HARMONICS
Procedure
• Operate the instrument by following the thick lines in the menu below.
• Press the ENTER key to confirm a selection or setting.
• To leave the current menu in the middle of the operation, press the key indicated in step 1.
The confirmed settings up to that point are kept.
• Setting the Storage Interval for Measurement Data
Select the store function
2.
(Display C)
3.
ENTER
1.
SHIFT
STOP
MEMORY
• Storage of Measurement Data ON/OFF
1.
SHIFT
STOP
MEMORY
Select the store function
(Display C)
2.
3.
ENTER
mV
kA
MW
mV PF
kA
MW
mV Hz
kA h
MW h
4.
4.
VA
FUNCTION
var
TIME
FUNCTION
deg
FUNCTION
(Display C)
(Display C)
AUTO
AUTO
A RANGEV RANGE
MODE TRIGMAX HOLD
START
HARMONICS
REMOTE
LOCAL SETUP
INTERFACE OUTPUT SHIFT
HOLD
ENTER
INTEGRATOR
STOP RESET
MEMORY INTEG SET
5.
ENTER
6.
7.
5.
ENTER
End
CAL
Set interval
(Display C)
hour min
SHIFT
Displays
relevant
keys and
indicator
sec
Up/down
Shift cursor
8.
ENTER
End
8
Storing/Recalling Measured Data and
Setting Parameters from the Internal Memory
IM 253421-01E
• Setting the Recall Interval for Measurement Data
1.
SHIFT
STOP
MEMORY
Select the recall function
(Display C)
2.
3.
ENTER
• Recalling Measurement Data ON/OFF
Select the recall function
2.
(Display C)
3.
ENTER
1.
SHIFT
STOP
MEMORY
4.
4.
(Display C)
(Display C)
5.
ENTER
5.
ENTER
End
Set Interval
(Display C)
hour min
6.
Up/down
7.
SHIFT
sec
Shift cursor
8.
ENTER
End
8-1
Page 83

8.1 Storing/Recalling Measured Data
Explanation
Storing Measured Data (Storing into Internal Memory)
The number of blocks which can be stored into the internal memory is as follows.
During Normal Measurement During Harmonic Analysis
600 blocks 30 blocks
Items which can be stored
All the data that are obtained while the display is updated once are stored as one
block of data. The data number increases by the number of used input elements
and therefore the number of blocks that can be stored depends on the model as
described above.
• When storing normal measured data (harmonic analysis function is turned OFF)
Each measured/integrated data of normal measurement will be stored.
However, only either the voltage frequency or current frequency will be stored
* When either the V Hz or A Hz display function is lit, the frequency of that
• When storing harmonic analysis data (harmonic analysis function is turned ON)
Normal measurement data are not stored. All analyzed data are stored.
function will be stored. When neither is lit, the frequency of the latest lit
display function will be stored. Regarding the element, the frequency of the
latest set element will be stored.
*
.
Aborting Storage
• When all the above described blocks are full;
• When during the storage process “oFF” is selected at the store ON/OFF setting.
Setting the Storage Interval
Sets the time during which storage will be carried out.
• When storing normal measured data (harmonic analysis function is turned OFF)
• Setting range: 00.00.00 (0 hrs, 0 min, 0 sec) to 99.59.59 (99 hrs, 59 min, 59 sec)
• Initial value: 00.00.00
When the setting is 00.00.00, the interval will become 250 ms.
• When storing harmonic analysis data (harmonic analysis function is turned ON)
• Setting range: 00.00.00 (0 hrs, 0 min, 0 sec) to 99.59.59 (99 hrs, 59 min, 59 sec)
• Initial value: 00.00.00
When the setting ranges from 00.00.00 to 00.00.03, the interval will become 3s;
from 00.00.04 to 00.00.06, the interval will become 6 s; from 00.00.07 to
00.00.09, the interval will become 9 s; in other cases, the set interval will be
valid.
Note
The displayed values of V (voltage), A (current), W (active power), VA (apparent power), var
(reactive power), Vpk (voltage peak), and Apk (current peak), while the MAX hold function
(see section 4.8) is enabled, will be the maximum values (MAX) that are held. The values for
D/A output, output to external plotter and printer, and communication output are also set to
the maximum values (MAX) that are held. The measured data that are stored are values that
are measured at every display update rate, irrespective of the MAX hold function.
8-2
IM 253421-01E
Page 84

8.1 Storing/Recalling Measured Data
Storage ON/OFF
After having set the storage interval, select the store menu once again. The initial
value is oFF.
• on: Storing will start by pressing the ENTER key after selecting “on”; the STORE
indicator will light while storage is in progress.
• oFF: Storing will stop by pressing the ENTER key after selecting “oFF”; the STORE
indicator will extinguish.
Note
• After storing has been stopped and storing is restarted, the existing data in the memory will
be overwritten. Previous data will therefore be lost.
• Stored data will be kept even after the power has been turned OFF because of the internal
lithium battery.
• When integrated values are not present, the dot display will be stored as data, whereas
0.00.00 will be stored as integration preset time.
• When the fundamental frequency is high and up to 50 windows of harmonic analysis data are
not present, the dot display will be stored as data.
• While storage is in progress, several settings cannot be changed, such as switching the
harmonic analysis function ON/OFF, changing the related input element, the PLL source, the
harmonic distortion factor computation method, nor can scaling, averaging and filter settings
be changed, nor integration mode, integration time and storage interval.
• If you press the HOLD key while storing data, the measurement operation and the counting
operation of the store interval are suspended. The storage operation itself is also suspended.
However, if integration is in progress, measurement and integration continues internally.
8
Storing/Recalling Measured Data and
Setting Parameters from the Internal Memory
Recalling Measured Data (Retrieving Data from the Internal Memory)
After displaying data stored in the internal memory on the panel, you can use all
display functions and carry out integration and display these data. Furthermore, by
using the communication function, data can be output.
Items which can be recalled
all data which can be stored.
Aborting Recalling
when all stored data are retrieved;
when during the recall process “oFF” is selected at the store ON/OFF setting.
Setting the Recalling Interval
Sets the time during which recalling will be carried out.
Setting range: 00.00.00 (0 hrs, 0 min, 0 sec) to 99.59.59 (99 hrs, 59 min, 59 sec)
Initial value: 00.00.00
When recalling normal measured data, the interval will become 250 ms when the
setting is 00.00.00.
When recalling harmonic analysis data, the interval will become 1s when the setting is
00.00.00.
IM 253421-01E
8-3
Page 85

8.1 Storing/Recalling Measured Data
Recalling ON/OFF
After having set the recalling interval, select the recall menu once again. The initial
value is oFF.
• on: Recalling will start by pressing the ENTER key after selecting “on”; the
RECALL indicator will light while recalling is in progress.
• oFF: Recalling will stop by pressing the ENTER key after selecting “oFF”; the
RECALL indicator will extinguish
Note
• During recalling, the measurement conditions and range* will become as those of the data
being recalled. After recalling finishes, the original measurement conditions will return.
* Measurement range, measurement mode, filter ON/OFF, scaling ON/OFF, scaling
constants, averaging ON/OFF, averaging mode, averaging constants, integration mode,
integration type, integration time, harmonic analysis function ON/OFF, PLL source,
computation method of harmonic distortion factor, etc.
• When recalling data to a personal computer by communication interface, data might be cut
due to the data length or used personal computer. In such a case, increase the recalling
interval.
8-4
IM 253421-01E
Page 86

8.2 Storing/Recalling Setting Parameters
Keys
Procedure
SAMPLE
V OVER
A OVER
MODE
RMS
V MEAN
DC
A
B
C
SCALING AVG FILTER STORE RECALL HARMONICS
mV
VA
var
kA
TIME
MW
mV PF
deg
kA
MW
mV Hz
kA h
MW h
FUNCTION
FUNCTION
FUNCTION
AUTO
AUTO
A RANGEV RANGE
MODE TRIGMAX HOLD
START
HARMONICS
REMOTE
LOCAL SETUP
INTERFACE OUTPUT SHIFT
HOLD
ENTER
INTEGRATOR
STOP RESET
MEMORY INTEG SET
CAL
Displays
relevant
keys and
indicator
• Operate the instrument by following the thick lines in the menu below.
• Press the ENTER key to confirm a selection or setting.
• To leave the current menu in the middle of the operation, press the key indicated in step 1.
The confirmed settings up to that point are kept.
• Storing Setting Parameters
1.
SHIFT
Select storage of setting parameters
(Display C)
STOP
MEMORY
2.
3.
ENTER
Select file for storage
(Display B)
4.
5.
ENTER
End
8
Storing/Recalling Measured Data and
Setting Parameters from the Internal Memory
• Recalling Setting Parameters
1.
SHIFT
Select recalling of setting parameters
(Display C)
STOP
MEMORY
2.
3.
ENTER
When setting parameters are stored to a
file, display C will show " "
When no data are stored yet, display C
will show " "
Select file for recalling
(Display B)
4.
5.
ENTER
End
When setting parameters are stored to a
file, display C will show " "
When no data are stored yet, display C
will show " "
IM 253421-01E
8-5
Page 87

8.2 Storing/Recalling Setting Parameters
Explanation
Storing Setting Parameters
Stores the current setting parameters which consist of the following. Four
destinations (FiLE1/FilE2/FiLE3/FiLE4) are available.
Measurement range, measurement mode, scaling settings, averaging settings, filter
settings, integration settings, harmonic settings, plotter output settings, store/recall
settings, and communication settings.
When data are saved in a file and you want to save data in the same file, display C
will show “SAVEd”. Pressing the ENTER key will result in overwriting the previously
saved data.
Setting parameters are saved in another internal memory than measured data.
Saved setting parameters are backed up by the lithium battery in the same way as
measured data.
Recalling Setting Parameters
When setting parameters are being retrieved, all setting parameters are being set
accordingly. After that, measurements can be carried out.
8-6
IM 253421-01E
Page 88

Chapter 9 Using External Input/Output
9.1 Remote Control and D/A Output Connector (optional)
Using the remote control and the D/A output connector, this instrument can be remotely
controlled and D/A output can be done. The connector’s pin sequence and signal
assignment is as follows.
Connector’s Pin Sequence
112
24 13
(Rear panel)
Pin Assignment
remote control, 4 channel D/A output
Pin No. Signal Pin No. Signal
1
2
3
4
5
6
7
8
9
10
11
12
DIGITAL COM
EXT HOLD
EXT START
EXT RESET
No Connection
No Connection
No Connection
No Connection
No Connection
DA 3ch
DA 1ch
DA COM
(Input)
(Input)
(Input)
(Output)
(Output)
Remote control: input circuit
+5 V
10 kΩ
TTL level
100 Ω
0.01 µF
: 0 to 0.8 V
L
: 2.0 to 5 V
H
13
14
15
16
17
18
19
20
21
22
23
24
DIGITAL COM
EXT TRIG
EXT STOP
INTEG BUSY
No Connection
No Connection
No Connection
No Connection
No Connection
DA 4ch
DA 2ch
DA COM
(Input)
(Input)
(Output)
(Output)
(Output)
Remote control: output circuit
+5 V
100 Ω
TTL level
: 0 to 0.4 V(8 mA)
L
: 2.4 to 5 V(–400 µA)
H
WARNING
The connectors used in this function have protective covers. When the covers
are removed or when using connectors, the voltage ratings across the
measuring input and the ground become as follows:
Voltage across A, ±(V and A side) input terminals and ground 400 Vrms max.
Voltage across V terminal and ground 600 Vrms max.
Put the protective cover on the connector when this function is not used.
9
Using External Input/Output
IM 253421-01E
9-1
Page 89

9.2 Remote Control (optional)
Controlling Integration
To control integration, apply timing signals according to the timing chart below.
StopStart Reset StopStart
5 ms min.
EXT START
5 ms min.
EXT STOP
EXT RESET
INTEG BUSY
Holding Display Data Update (same function as HOLD key)
Approx.
15 ms
As shown in the timing chart, the INTEG BUSY output
signal level goes low while integration is in progress.
The signal can be used to monitor integration, etc.
Approx.
15 ms
5 ms
Approx.
15 ms
Approx.
15 ms
To hold the display update, apply the
EXT. HOLD
EXT. HOLD signal according to the timing chart below.
Display hold
5 ms min.
Updating Display Data which has been held (same function as TRIG key)
Applying an EXT.TRIG signal when the display is on hold updates the display data.
⋅Update timing during normal measurement/integration
Measurement start
250 ms min.
EXT. TRIG
⋅Update timing while harmonic analysis function is in progress
Measurement start
EXT. TRIG
Display update
5 ms min.
3 s min.
5 ms min.
Display update
5 ms min.
9-2
CAUTION
Do not apply a voltage which exceeds the TTL level to the remote controller pin.
Also, do not short the output pins nor apply a voltage to them.
The instrument might be damaged.
IM 253421-01E
Page 90

9.3 D/A Output (optional)
Keys
Procedure
A
SAMPLE
V OVER
A OVER
MODE
B
RMS
V MEAN
DC
C
SCALING AVG FILTER STORE RECALL HARMONICS
• Operate the instrument by following the thick lines in the menu below.
• Press the ENTER key to confirm a selection or setting.
• To leave the current menu in the middle of the operation, press the key indicated in step 1.
The confirmed settings up to that point are kept.
• Setting D/A Output
1.
SETUP
SHIFT
OUTPUT
Select D/A output function
(Display C)
2.
mV
kA
MW
mV PF
kA
MW
mV Hz
kA h
MW h
3.
ENTER
VA
var
TIME
deg
FUNCTION
FUNCTION
FUNCTION
AUTO
MODE TRIGMAX HOLD
START
HARMONICS
REMOTE
LOCAL SETUP
INTERFACE OUTPUT SHIFT
Select output format
(Display C)
4.
AUTO
A RANGEV RANGE
HOLD
ENTER
CAL
INTEGRATOR
STOP RESET
MEMORY INTEG SET
5.
ENTER
End
(Select default setting)
Displays
relevant
keys and
indicator
9
Using External Input/Output
6.,10.
Select
output channel
(Display B)
7.
ENTER
11.
ENTER
End
Select output item
(Display C)
8.
(Select desired item)
*
9.
ENTER
*
When you press the key in step 9,
the output channel displayed on display B
changes to the next channel
(from ch1 to ch2, for example).
ENTER
IM 253421-01E
9-3
Page 91

9.3 D/A Output (optional)
• Setting Preset Integration Time
1.
SHIFT
Select preset integration time
RESET
INTEG SET
(Display C)
2.
3.
ENTER
Hour
(Display A)
4.
5.
Set value
SHIFT
6.
ENTER
Move across digits
Explanation
Minute
(Display B)
7.
Same as steps 4 and 5
8.
9.
ENTER
Second
(Display C)
10.
Same as steps 4 and 5
11.
12.
ENTER
End
D/A Output
Voltage, current, active power, apparent power, reactive power, power factor, phase angle,
harmonic analysis data and integrated data values will be output as a 5V FS analog voltage.
Default Setting of the Output Format
The default items which will be output can be selected as follows.
• dFLt-n (normal measurement values are set as default)
Select this when you want to output normal measurement values. Which items are output
to which channel is described below.
Output Channel
ch1
ch2
ch3
ch4
* If either one of the display functions, V Hz or A Hz, is turned on, the frequency of the
corresponding function is output. If both functions are turned OFF, the frequency of the function
that was lighted last will be output.
Output Item
V
A
W
*
Hz
• dFLt-i (integration measurement values are set as default)
Select this when you want to output integration measurement values. Which items are
output to which channel is described below.
Output Channel
ch1
ch2
ch3
ch4
* If either one of the display functions, V Hz or A Hz, is turned on, the frequency of the
corresponding function is output. If both functions are turned OFF, the frequency of the function
that was lighted last will be output.
Output Item
W
Wh
Ah
*
Hz
Selecting the Desired Item of the Output Format
The items to be output are set per each output channel.
• Setting the output channel
The number of channels is 4. You can select the channel that will output each item.
• Setting the output item (corresponds to column A in the procedure)
The output item can be set to any of the following.
V (voltage), A (current), P (active power), VAr (reactive power), VA (apparent power), PF
(power factor), VFrq (voltage frequency)
*1
, AFrq (current frequency)*1, Ph (total Watt-hour
Wh), Ah (total Ampere-hour), dEG (phase angle), VP(peak value of voltage), AP(peak
value of current), MATH(computation), Ph+ (positive watt hour value Wh+), Ph– (negative
watt hour value Wh–), Ah+ (positive ampere hour value
*2
value
),
*2
), Ah– (negative ampere hour
– – – – (D/A output 0 V; no further elements can be set)
9-4
*1 If either one of the display functions, V Hz or A Hz, is turned on, the frequency of the
corresponding function is output. If both functions are turned OFF, the frequency of the function
that was lighted last will be output.
*2 For details concerning the positive value of the ampere hour, see page 6-3.
IM 253421-01E
Page 92

9.3 D/A Output (optional)
Setting the Integration Preset Time
The D/A output of integrated values will be 5.0 V FS when the rated range has been
input consequently during the preset integration time (rated integration time).
Setting range: 0.00.00 (0 hrs 0 min 0 sec) to 10000.00.00 (10000 hrs 0 min 0 sec)
The initial value is 1.00. When 0.00.00 is set, the D/A output value will be 0 V.
Note
• The displayed values of V (voltage), A (current), W (active power), VA (apparent power), var
(reactive power), Vpk (voltage peak), and Apk (current peak), while the MAX hold function
(see section 4.8) is enabled, will be the maximum values (MAX) that are held. The values for
D/A output are also set to the maximum values (MAX) that are held.
• The D/A output of each output item is adjusted so that 5.0 V is output when the value
corresponding to the range rating of the voltage, current, or power is applied.
• Even when scaling constants for voltage, current, and power are specified, the D/A output is
adjusted so that 5.0 V is output when the value corresponding to the range rating is applied.
• When (computation) is specified, the D/A output is 0 V.
9
Using External Input/Output
IM 253421-01E
9-5
Page 93

9.3 D/A Output (optional)
Relation between the output item and the D/A output voltage
• Frequency
D/A output
Approx. 7.5 V
5.0 V
2.5 V
0.5 V
0.2 V
10
4
100
1 k
10 k
50 k
• Integrated value
D/A output
Approx. 7.0 V
5.0 V
In case of 140% of
rated value input
Displayed
value [Hz]
0
• Other items
Displayed value
140%
100%
0%
–100%
–140%
However, for PF and deg, points in
the range from +5 to +7 V and from
–5 to –7 V are not output.
If there is an error, the output will
be about ±7.5 V .
For Vp and Ap, the output will be
±5 V when the value is three times
the range rating. In addition, output
will not be ±7.5 V when Vp and Ap
are over the range.
Output
Approx. 7.0 V
5.0 V
0 V
–5.0 V
Approx. –7.0 V
In case of rated
value input
Approx. 7.5 V
Approx. 7.0 V
–140
–100
to:rated integration time
D/A output
5.0 V
–5.0 V
Approx. –7.0 V
Approx. –7.5 V
Time
t
o
100 140
Displayed
value[%]
9-6
IM 253421-01E
Page 94

9.4 Comparator Function (optional)
When the instrument is equipped with option /CMP you can compare the measured,
computed, integrated, and analysis values with previously set limits and these results
can be output by contact relay.
Contact Relay Output
This instrument is equipped with four contact relays (4ch) as follows. If the relay is not
operating, the NC (Normally Closed) contact is closed. If the relay is operating, the NC
contact is opened and the NO (Normally Open) contact is closed.
Relay specifications
• Contact capacity: rated 24 V/0.5 A (max. 30 V/0.5 A)
• Minimum load: 10 mV/10 µA
• Electric switching life: approx. 500000 times (at contact rating)
• Mechanical life: approx. one hundred million times
• Contact Response time: less than 500 ms
Note
Since this relay is subject to wear, it is excluded from the 3-year warranty.
Comparator Mode
CAUTION
Damage to the relays may occur when a voltage or current exceeding the specified
range is applied to the contact output terminal.
The following two comparator modes are available.
Single Mode
If the measured/computed/integrated/analysis values exceed the previously set limits,
the relay contact will become NO. This mode is useful when you want to assign each
of the four relays individually. See the figure below.
When the current value is less than 3 A: NO-GO will be determined and the
circuit becomes open.
When the current value is 3 A or more: GO will be determined and the circuit
becomes closed.
Current
3 A
Limit of ch2 is set to 3 A
NO-GO determination area
Time
Below limit
⇒ open status
24 V
NC
NO
COM
9
Using External Input/Output
ch 2
IM 253421-01E
Current
3 A
GO determination area
Limit of ch2 is set to 3 A
Time
Exceeding limit
⇒ closed status
24 V
NC
NO
COM
ch 2
9-7
Page 95

9.4 Comparator Function (optional)
Dual Mode
This mode allows you to combine the limit values of two relays (e.g. the upper value
(Hi) and the lower value (Lo)) to determine the contact status. The four relays will be
fixed as two pairs of ch1 & ch2 and ch3 & ch4. Setting the limit values of a pair of
relays (e.g. ch1 & ch2) can only be done at the same display function. The setting
method, relay operation, etc. are the same as in the single mode, and when the
measured/computed/integrated/analysis values exceed the preset limits, the contact
status will become NO.
The following shows an example.
When the current value exceeds 1 A, but is less then 3 A: GO will be ditermined
and the circuit becomes closed.
When the current value lies below 1 A, or exceeds3 A:NO-GO will be determined
and the circuit becomes open.
Current
Upper limit(Hi)
3 A
Lower limit(Lo)
1 A
Current
Upper limit(Hi)
3 A
1 A
Lower limit(Lo)
Limit of ch1 is set to 3 A
Limit of ch2 is set to 1 A
NO-GO determination area
Time
Limit of ch1 is set to 3 A
GO determination area
Limit of ch2 is set to 1 A
Time
Below lower limit
⇒ open circuit
24 V
Exceeding lower
limit, below upper
⇒ closed circuit
24 V
COM
COM
NC
NO
NC
NO
NC
NO
NC
NO
COM
COM
ch 1
ch 2
ch 1
ch 2
Exceeding upper
Current
Upper limit(Hi)
3 A
1 A
Lower limit(Lo)
NO-GO determination area
Limit of ch1 is set to 3 A
Limit of ch2 is set to 1 A
Time
limit
⇒ open circuit
24 V
COM
NC
NO
Note
• In the dual mode, the combinations ch1&ch2, and ch3&ch4 are fixed. The combinations
ch1&ch3 and ch2&ch4 are not possible.
• Within a pair you can set either channel as upper or lower limit.
• The values of V (voltage), A (current), W (active power), VA (apparent power), var (reactive
power), Vpk (voltage peak), and Apk (current peak), while the MAX hold function (see section
4.8) is enabled, will be displayed according to the maximum values (MAX) that are held. The
values that are compared against the limit values are also the maximum values (MAX) that
are held.
NC
NO
COM
ch 1
ch 2
9-8
IM 253421-01E
Page 96

9.4 Comparator Function (optional)
CAUTION
Make sure not to greatly vary the input signal when using the comparator function.
Depending on the input signal used for determination, the instrument may display
error codes (i.e. overrange) and this will change the output relays as follows.
When using the output relay as a control signal, make sure to match these control
signals with other equipments to eliminate erroneuous control.
Displayed error Relay status
oL (over range) The NC contact is closed.
oF (over flow) The NC contact is closed.
dEGEr (phase angle error) The NC contact is closed.
PFErr (power factor error) The NC contact is closed.
ErrLo (frequency error) The NC contact is closed.
ErrHi (frequency error) The NO contact is closed for this
FrqEr (frequency error in case of harmonic analysis) The NC contact is closed.
- - - - - (error when no data are present) The NC contact is closed.
case only.
9
Using External Input/Output
IM 253421-01E
9-9
Page 97

9.5 Setting the Comparator Mode (optional)
Keys
Procedure
1.
SHIFT
SETUP
OUTPUT
SAMPLE
V OVER
A OVER
MODE
RMS
V MEAN
DC
A
B
C
SCALING AVG FILTER STORE RECALL HARMONICS
mV
VA
var
kA
TIME
MW
mV PF
deg
kA
MW
mV Hz
kA h
MW h
FUNCTION
FUNCTION
FUNCTION
AUTO
AUTO
A RANGEV RANGE
MODE TRIGMAX HOLD
START
HARMONICS
REMOTE
LOCAL SETUP
INTERFACE OUTPUT SHIFT
HOLD
ENTER
INTEGRATOR
STOP RESET
MEMORY INTEG SET
CAL
Displays
relevant
keys and
indicator
• Operate the instrument by following the thick lines in the menu below.
• Press the ENTER key to confirm a selection or setting.
• To leave the current menu in the middle of the operation, press the key indicated in step 1.
The confirmed settings up to that point are kept.
Select the comparator function
(Display C)
2.
3.
ENTER
4.
(Display C)
5.
ENTER
Select the mode
(Display C)
6.
7.
ENTER
End
Explanation
Setting the Comparator Mode
The following two settings are available. For details related to the mode, see section
9.4. The initial value is SinGL.
• SinGL: the comparator mode will be set to single mode;
• duAL: the comparator mode will be set to dual mode.
Note
• When you change the comparator mode after having set the comparator limit (See section
9.6 and the following sections), the situation will change as follows. Also verify the
comparator limits again.
• When you change the mode to dual mode after setting the limits in the single mode, the limit
item (see section 9.6) for ch2 and ch4 are set to those for ch1 and ch3, respectively. When
the mode is set back to the single mode, the limit item of each channel returns to its original
value.
CAUTION
Do not change the comparator mode, measurement mode or harmonic analysis
ON/OFF, while the comparator function is turned ON (see section 9.8). Similar
to the Note above, changing the limit item might result in unexpected statuses of
the output relay.
9-10
IM 253421-01E
Page 98

9.6 Setting the Comparator Limit Values (optional)
Keys
SAMPLE
V OVER
A OVER
MODE
RMS
V MEAN
DC
A
B
C
SCALING AVG FILTER STORE RECALL HARMONICS
mV
VA
var
kA
TIME
MW
mV PF
deg
kA
MW
mV Hz
kA h
MW h
FUNCTION
FUNCTION
FUNCTION
Procedure
• Operate the instrument by following the thick lines in the menu below.
• Press the ENTER key to confirm a selection or setting.
• To leave the current menu in the middle of the operation, press the key indicated in step 1.
The confirmed settings up to that point are kept.
• Setting the Comparator Limit Values in case of Normal Measurement
1.
SHIFT
Select the comparator function
SETUP
OUTPUT
2.
(Display C)
3.
ENTER
(Display C)
4.
AUTO
AUTO
A RANGEV RANGE
MODE TRIGMAX HOLD
START
HARMONICS
REMOTE
LOCAL SETUP
INTERFACE OUTPUT SHIFT
HOLD
ENTER
INTEGRATOR
STOP RESET
MEMORY INTEG SET
Displays
relevant
keys and
indicator
CAL
9
Using External Input/Output
6.,16.
Relay setting
(Display C)
7.
ENTER
17.
ENTER
End
Set limit item
(Display A)
8.
5.
ENTER
9.
ENTER
10. Up/down
Set limit value
(Display B)
13.
ENTER
Set exponent
(Display C)
14.
11. Shift cursor
SHIFT
12. Shift decimal
SHIFT
* When you press the key in step 15, the output channel displayed
on display C changes to the next channel (from ch1 to ch2, for example).
point
•
ENTER
*
15.
ENTER
IM 253421-01E
9-11
Page 99

9.6 Setting the Comparator Limit Values (optional)
• Setting the Comparator Limit Values in case of Harmonic Anaiysis
1.
SHIFT
Select the comparator function
SETUP
OUTPUT
(Display C)
2.
6.,18.
Relay setting
(Display C)
7.
ENTER
Set limit item
(Display A)
8.
A
8.
9.
SHIFT
10.
3.
ENTER
11.
ENTER
B
Sets the A column
Moves to the B column
Select from 1 to 3
(Display C)
4.
Set limit value
(Display B)
12.
13.
SHIFT
14.
point
SHIFT
*1 When you press the key in step 17, the output
channel displayed on display C changes to the next
channel (from ch1 to ch2, for example).
*2 Because the maximum order of harmonic analysis varies
depending on the fundamental frequency, the analysis
data may not be available up to 50th order (bar display)
in some cases. In this case, comparison will not be
performed even if the limit value is specified.
*3 The first digit of the limit value is used to display the sign.
Select “–” to set a negative limit value. Select no sign to
set a positive value.
*2
Up/down
Shift cursor
Shift decimal
•
5.
ENTER
*3
15.
ENTER
Set exponent
16.
ENTER
(Display C)
*1
17.
ENTER
9-12
19.
ENTER
End
IM 253421-01E
Page 100

Explanation
9.6 Setting the Comparator Limit Values (optional)
Setting the Comparator Limit Values in case of Normal Measurement
You can set the type of the limit and its value for each relay seperately.
• Relay setting
Selects the relay (ch1 to ch4) for which the limit item and its value will be set.
• Setting the limit item
The following sections are available. When the comparator mode is dual, ch1&ch2
and ch3&ch4 are pairs and the same limit item should be set for the channels of
one pair.
V (voltage), A (current), P (active power), VAr (reactive power), VA (apparent
power), PF (power factor), VFrq (voltage frequency)
*1
, AFrq (current frequency)*1,
Ph (total Watt-hour Wh), Ah (total Ampere-hour), dEG (phase angle), VP(peak
value of voltage), AP(peak value of current), MATH(computation), Ph+ (positive
watt hour value Wh+), Ph– (negative watt hour value Wh–), Ah+ (positive ampere
hour value
*2
), Ah– (negative ampere hour value*2),
– – – – (no data)
*1 If either one of the display functions, V Hz or A Hz, is turned on, the frequency of
the corresponding function is output. If both functions are turned OFF, the frequency of
the function that was lighted last will be output.
*2 For details related to the positive and negative directions of the ampere hour, see page
6-3.
• Setting the limit value
Setting range: 0.000 to ±9999
Initial setting: The limit item: limit value: exponent of the limit value (see next
section) are initialized for each channel.
ch1 : V1 : 600.0 : E+0 (set 600 V of voltage to ch1)
ch2 : A1 : 20.00 : E+0 (set 20.00 A of current to ch2)
ch3 : P1 : 1.200 : E+3 (set 1.2 kW of active power to ch3)
ch4 : PF1 : 1.000 : E+0 (set a power factor of 1 to ch4)
• Setting the exponent
The following selections are available. The initial value is as described above.
E–3 (10
–3
), E+0 (100), E+3 (103), E+6 (106)
9
Using External Input/Output
IM 253421-01E
Setting the Comparator Limit Values in case of Harmonic Analysis
You can set the type of the limit and its value for each relay seperately.
• Relay setting
Selects the relay (ch1 to ch4) for which the limit item and its value will be set.
• Setting the limit item(corresponding to column A in the procedure)
The following selections are available. When the comparator mode is dual,
ch1&ch2 and ch3&ch4 are pairs and the same limit item should be set for the
channels of one pair.
V (voltage), A (current), P (active power), PF (power factor),
Vt (harmonic distortion of voltage), At (harmonic distortion of current),
CV (relative harmonic content of each voltage harmonic order),
CA (relative harmonic content of each current harmonic order),
CP (relative harmonic content of each active power harmonic order),
Vd (voltage phase angle of each order), Ad (current phase angle of each order),
– – – – (no data)
* For the meanings of the harmonic analysis values, see chapter 7, “Using the Harmonic
Analysis Function (Optional).”
9-13
 Loading...