

Page 1

User ’s
Manual
Model TB400G
Surface Scattering Light Turbidity Meter
[Style: S3]
IM 12E04A02-02E
IM 12E04A02-02E
9th Edition
Page 2

INTRODUCTION
n Structure of this Manual
This manual describes the specications, installation, operation, maintenance, and
troubleshooting for the TB400G Surface Scattering Light Turbidity Meter. To use this instrument
correctly, read this manual thoroughly.
n SpecicationCheck
When the instrument arrives, unpack the package with care and check that the instrument has
not been damaged during transportation. Please check that the product received meet the
specied specications by conrming the model code indicated on the nameplate. For details of
the model code, refer to Section 2.3.
n Before Measurement
The TB400G turbidimeter is preset with defaults prior factory shipment. Before measurement,
verify that these factory default settings meet the operating conditions and if necessary,
recongure parameters. For checking the default settings and recording changed parameters,
use an Operation Parameter Setting List at the end of this manual.
i
n Signal Words
Throughout this user’s manual, you will nd several different types of symbols are used to identify
different sections of text. This section describes these icons.
CAUTION
This symbol gives information essential for understanding the operations and functions.
NOTE
This symbol indicates information that complements the present topic.
n Symbol of unit “liter”
In this manual, the unit “liter” is described using the symbol of “L”, not “ l ”. On the real Turbidity
Meter, the unit “liter” of the display unit is described as “ l ”. So, the real display unit of turbidity is
“mg/l”, not “mg/L”.
n TrademarkNotices
• All company and product names mentioned in this user’s manual are trademarks or
registered trademarks of their respective companies.
• We do not use TM or ® mark to indicate those trademarks or registered trademarks in this
user’s manual.
Media No. IM 12E04A02-02E 9th Edition : Mar. 2018 (YK)
All Rights Reserved Copyright © 2006, Yokogawa Electric Corporation
IM 12E04A02-02E
9th Edition : Mar. 16, 2018-00
Page 3

SAFETY PRECAUTIONS
n Safety,Protection,andModicationoftheProduct
• In order to protect the system controlled by the product and the product itself and ensure
safe operation, observe the safety precautions described in this user’s manual. We assume
no liability for safety if users fail to observe these instructions when operating the product.
• If this instrument is used in a manner not specied in this user’s manual, the protection
provided by this instrument may be impaired.
• If any protection or safety circuit is required for the system controlled by the product or for
the product itself, prepare it separately.
• Be sure to use the spare parts approved by Yokogawa Electric Corporation (hereafter
simply referred to as YOKOGAWA) when replacing parts or consumables.
• Modication of the product is strictly prohibited.
• The following symbols are used in the product and user’s manual to indicate that there are
precautions for safety:
n Notes on Handling User’s Manuals
• Please hand over the user’s manuals to your end users so that they can keep the user’s
manuals on hand for convenient reference.
• Please read the information thoroughly before using the product.
• The purpose of these user’s manuals is not to warrant that the product is well suited to any
particular purpose but rather to describe the functional details of the product.
• No part of the user’s manuals may be transferred or reproduced without prior written
consent from YOKOGAWA.
• YOKOGAWA reserves the right to make improvements in the user’s manuals and product at
any time, without notice or obligation.
• If you have any questions, or you nd mistakes or omissions in the user’s manuals, please
contact our sales representative or your local distributor.
ii
n Warning and Disclaimer
The product is provided on an “as is” basis. YOKOGAWA shall have neither liability nor
responsibility to any person or entity with respect to any direct or indirect loss or damage arising
from using the product or any defect of the product that YOKOGAWA can not predict in advance.
IM 12E04A02-02E 9th Edition : Mar. 16, 2018-00
Page 4

Model TB400G
Surface Scattering Light Turbidity Meter
[Style: S3]
IM 12E04A02-02E 9th Edition
CONTENTS
INTRODUCTION .......................................................................................................i
SAFETY PRECAUTIONS ........................................................................................ii
1. OVERVIEW ................................................................................................ 1-1
1.1 SystemConguration ......................................................................................1-2
1.1.1 TB400G-
1.1.2 TB400G-
cleaning or automatic zero calibration) .............................................. 1-2
1.1.3 TB400G-
automatic zero calibration) ................................................................. 1-2
1.1.4 TB400G-
1.2 Operating Principle ........................................................................................... 1-3
¨-¨-NN, -KC (without sampling system) ........................ 1-2
¨-¨-A1 (with sampling system, without automatic
¨-¨-A2 (with automatic cleaning and without
¨-¨-A3 (with automatic cleaning and zero calibration) .. 1-3
iii
2. SPECIFICATIONS ..................................................................................... 2-1
2.1 StandardSpecications ................................................................................... 2-1
2.2 Characteristics .................................................................................................. 2-4
2.3 ModelandSufxCodes ................................................................................... 2-5
2.4 Accessories ....................................................................................................... 2-5
2.5 ExternalDimensions ........................................................................................2-6
2.5.1 TB400G-
2.5.2 TB400G-
2.5.3 TB400G-
2.5.4 TB400G-
2.5.5 TB400G-
2.5.6 TB400G-
2.5.7 TB400G-
2.5.18 TB400G-
2.5.9 TB400G-
2.5.10 TB400G-
2.5.11 TB400G-
2.5.12 TB400G-
2.5.13 TB400G-
2.6 Piping System Diagrams ................................................................................ 2-33
2.6.1 TB400G-
2.6.2 TB400G-
2.6.3 TB400G-
¨-¨-NN, -KC ................................................................... 2-7
¨-¨-A1 ............................................................................ 2-9
¨-¨-A2 .......................................................................... 2-11
¨-¨-A3 .......................................................................... 2-13
¨-¨-A1/PHU5 ............................................................... 2-15
¨-¨-A2/PHU5 ............................................................... 2-17
¨-¨-A3/PHU5 ............................................................... 2-19
¨-¨-A1/PHN5 ............................................................... 2-21
¨-¨-A2/PHN5 ............................................................... 2-23
¨-¨-A3/PHN5 ............................................................... 2-25
¨-¨-A1/FC .................................................................... 2-27
¨-¨-A2/FC .................................................................... 2-29
¨-¨-A3/FC .................................................................... 2-31
¨-¨-A1 .......................................................................... 2-33
¨-¨-A2 .......................................................................... 2-33
¨-¨-A3 .......................................................................... 2-34
IM 12E04A02-02E 9th Edition : Mar. 16, 2018-00
Page 5

2.6.4 TB400G-¨-¨-A1/PHU5, /PHN5 .................................................. 2-34
2.6.5 TB400G-
2.6.6 TB400G-
2.6.7 TB400G-
2.6.8 TB400G-
2.6.9 TB400G-
2.7 Internal Wiring Diagram ................................................................................. 2-38
¨-¨-A2/PHU5, /PHN5 .................................................. 2-35
¨-¨-A3/PHU5, /PHN5 .................................................. 2-35
¨-¨-A1/FC .................................................................... 2-36
¨-¨-A2/FC .................................................................... 2-36
¨-¨-A3/FC .................................................................... 2-37
3. INSTALLATION, PIPING, AND WIRING ................................................... 3-1
3.1 Installation ......................................................................................................... 3-1
3.1.1 Unpacking .......................................................................................... 3-1
3.1.2 Installation Location ...........................................................................3-1
3.1.3 Installation .......................................................................................... 3-2
3.2 Piping ................................................................................................................. 3-3
3.2.1 TB400G-
3.2.2 TB400G-
3.3 ExternalWiring .................................................................................................. 3-5
3.3.1 Power and Grounding Wiring.............................................................3-7
3.3.2 Analog Output Wiring ......................................................................... 3-7
3.3.3 Digital Output Wiring .......................................................................... 3-8
3.3.4 Contact Input and Contact Output (Range Output) Wiring ................ 3-9
3.3.5 Contact Output Wiring......................................................................3-10
3.3.6 With Arrester (/ARS) ........................................................................ 3-11
¨-¨-NN, -KC (without sampling system) ........................ 3-3
¨-¨-A1, -A2, and -A3 (with sampling system) ................ 3-4
iv
4. OPERATION .............................................................................................. 4-1
4.1 Preparation for Operation ................................................................................ 4-1
4.1.1 Checking Piping and Wiring Conditions ............................................ 4-1
4.1.2 Supplying Power ................................................................................ 4-1
4.1.3 Supplying Zero Water ........................................................................4-1
4.1.4 Adjustment for Leveling Detector.......................................................4-2
4.1.5 Supplying Cleaning Water ................................................................. 4-2
4.1.6 Setting Output Range ........................................................................ 4-3
4.1.7 Running-in .......................................................................................... 4-3
4.1.8 Zero and Span Calibrations ............................................................... 4-3
4.1.9 Supplying Sample and Adjusting Flowrate ........................................ 4-4
4.2 Operation ........................................................................................................... 4-4
4.2.1 Starting Measurement ....................................................................... 4-4
4.2.2 Automatic Cleaning Operation ........................................................... 4-5
4.2.3 Automatic Zero-calibration Operation ................................................ 4-9
5. FUNCTIONS .............................................................................................. 5-1
5.1 Functions Related to Failure Detection .......................................................... 5-1
5.2 Functions Related to Analog Output .............................................................. 5-4
5.2.1 Output Range Selection ..................................................................... 5-4
IM 12E04A02-02E 9th Edition : Mar. 16, 2018-00
Page 6

5.2.2 Other Functions Related to Output .................................................... 5-5
5.3 Manual Cleaning and Calibration Functions ................................................. 5-6
5.4 Functions Related to Display .......................................................................... 5-8
5.5 Functions Related to Contact Output ............................................................. 5-9
5.6 Other Functions ................................................................................................ 5-9
5.6.1 Overview of the Spike Detection Function ......................................... 5-9
5.6.2 Settings of Spike Detection Function ............................................... 5-10
6. PROCEDURES FOR CONVERTER OPERATION .................................. 6-1
6.1 Components of Control Panel and Their Functions and Actions ............... 6-1
6.2 Operation Modes and Functions ..................................................................... 6-3
6.2.1 Functions in <MEAS.> Mode ............................................................. 6-4
6.2.2 Functions in <MAINT.> Mode ............................................................ 6-5
6.2.3 Functions in <PROGRAM1> Mode ...................................................6-6
6.2.4 Functions in <PROGRAM2> Mode ...................................................6-7
6.3 Key Operation .................................................................................................... 6-8
6.3.1 Mode Switching ..................................................................................6-8
6.3.2 Function Switching ............................................................................. 6-8
6.3.3 Numerical Input .................................................................................. 6-8
6.3.4 Opening/Closing Valves ..................................................................... 6-9
6.4 Operation in <Meas.> Mode ............................................................................. 6-9
6.5 Operation in <MAINT.> Mode ......................................................................... 6-11
6.6 Operation in <PROGRAM1> Mode ................................................................ 6-20
6.7 Operation in <PROGRAM2> Mode ................................................................ 6-35
6.8 Valve Operation ............................................................................................... 6-37
v
7. MAINTENANCE ......................................................................................... 7-1
7.1 Inspection and Maintenance Intervals ........................................................... 7-1
7.2 Washing with Cleaning Water ..........................................................................7-1
7.3 Cleaning of Measuring Cell .............................................................................. 7-2
7.4 CleaningofHeadTank...................................................................................... 7-3
7.5 Lamp Replacement ........................................................................................... 7-4
7.6 Zero Calibration ................................................................................................. 7-6
7.6.1 Zero Calibration with "Zero Water" .................................................... 7-6
7.6.2 Zero Calibration by Turning Off Light Source ....................................7-7
7.7 Span Calibration ............................................................................................... 7-8
7.7.1 Span Calibration Using Calibration Plate .......................................... 7-8
7.7.2 Span Calibration Using Standard Solution ........................................ 7-9
7.8 Cleaning of Lenses ......................................................................................... 7-10
7.9 Replacement of Filter (for "zero water") ....................................................... 7-11
7.10 Replacement of Fuses .................................................................................... 7-12
7.11 Cleaning of Piping ........................................................................................... 7-13
7.12 CheckingFlowrate(WaterLevel) .................................................................. 7-14
7.13 Operation If Water Supply is Suspended ..................................................... 7-14
IM 12E04A02-02E 9th Edition : Mar. 16, 2018-00
Page 7

7.14 Operation During Power Failure and at Power Recovery .......................... 7-15
7.15 Zero and Span Standards .............................................................................. 7-16
7.15.1 Zero Turbidity Standard ................................................................... 7-16
7.15.2 Span Standards ............................................................................... 7-16
7.16 Replacement of Silicone Tube ....................................................................... 7-17
8. TROUBLESHOOTING .............................................................................. 8-1
8.1 Events in Which FAIL Lamp Is Lit ...................................................................8-1
8.2 Events in Which FAIL Lamp Is Not Lit ............................................................8-5
9. SPARE PARTS .......................................................................................... 9-1
vi
Customer Maintenance Parts List ........................................
CMPL 12E04A02-03E
Revision Information ...............................................................................................i
IM 12E04A02-02E 9th Edition : Mar. 16, 2018-00
Page 8
<1. OVERVIEW>
1. OVERVIEW
The applications of turbidimeters, which have been used for operation or control of ltration
plants, are expanding into turbidity detection in chemical processes and in measurement of
suspended solid particulates in various types of industrial wastewater.
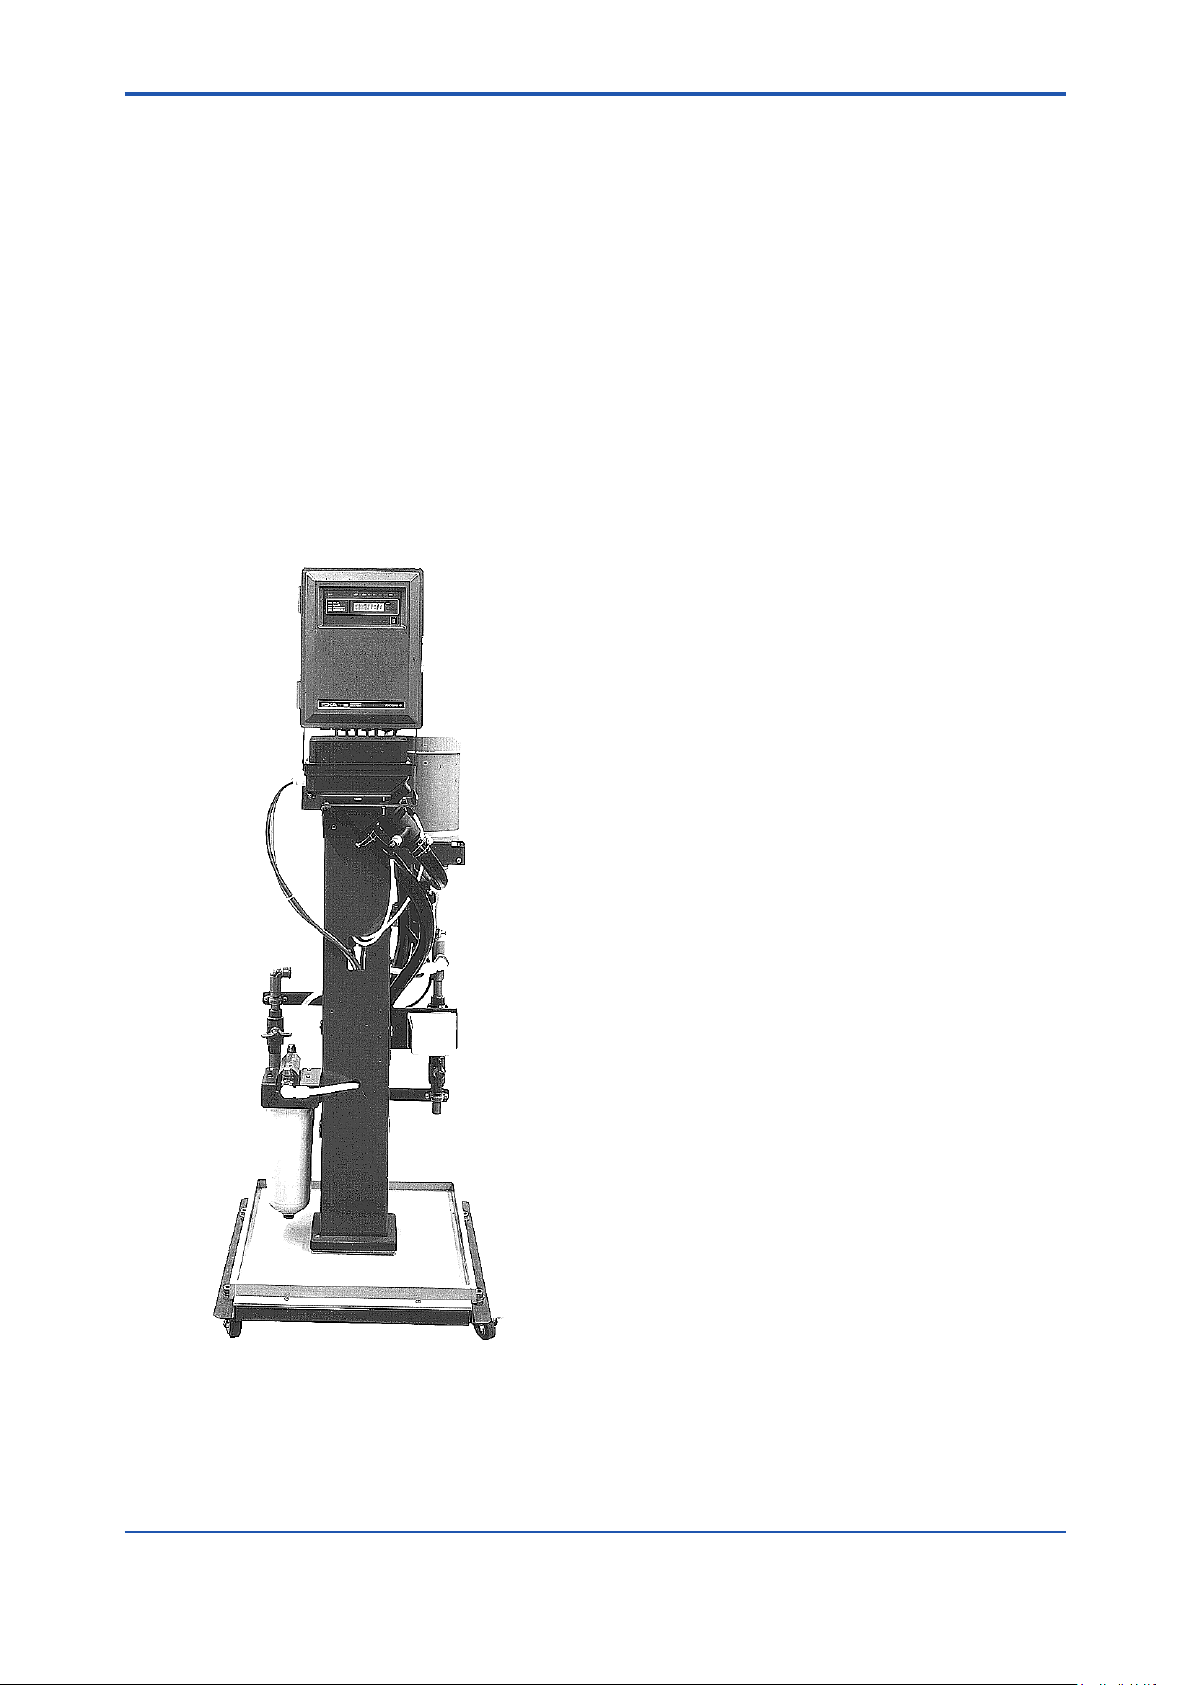
Model TB400G Surface Scattering Light Turbidity Meter is a process turbidimeter employing the
principle of measuring surface-scattered light. This instrument has the following features.
• High performance, high reliability
• Self-diagnostic functions (such as detection of a disconnected lamp, automatic converter
checking functions, and upper and lower limit alarms).
• Choice of functionality (such as automatic cleaning, range-free function, automatic zero
calibration, etc).
• Easy maintenance through small, light-weight, and accessible design.
• No window surfaces to become contaminated.
• Bubble rejection signal processing.
1-1
Figure1.1 ExternalViewoftheTB400GSurfaceScatteringLightTurbidityMeter(withautomatic
cleaning and automatic zero calibration)
IM 12E04A02-02E 9th Edition : Mar. 16, 2018-00
Page 9

<1. OVERVIEW>
1.1 SystemConguration
The TB400G Surface Scattering Light Turbidity Meter comprises a detector, converter and
sampling system (which supplies process sample water, zero-calibration water (“zero water”),
and cleaning water). This instrument is classied into three types depending on the specications
for the sampling system. However, if specied in advance, the detector and converter may be
delivered separately.
Here, four types of the instrument, including the delivery of detector and converter separately,
will be described. Details on the detector and converter are described in Section 1.2, “Operating
Principle”.
1.1.1 TB400G-¨-¨-NN, -KC (without sampling system)
The detector and converter are available separately and can be assembled into any sampling
system.
The owrate condition for sample is 1.5 to 2 L/min. If the owrate exceeds this range, satisfy the
owrate condition by providing a head tank (constant-level chamber) or the like.
For measurements of low turbidity (less than 200 mg/L), prepare a sampling system which can
supply the zero water (tap water ltered with a zero-turbidity lter).
1.1.2 TB400G-¨-¨-A1 (with sampling system, without
1-2
automatic cleaning or automatic zero calibration)
This is a system which combines the detector and converter with a sampling system to manually
supply process sample, zero water, and cleaning water (see subsection 2.6.1).
The measuring water ows into a header tank (constant-level chamber), serving also as a bubble
separation tank, after passing the ball valve located after the tap water inlet port.
Debubbled sample in this tank ow into the measuring cell in the detector at a constant owrate,
and drains through the drain outlet after overowing at the measuring cell.
The cleaning water passes the ball valve located after the tap water inlet port and ows into
the measuring cell in the detector from the cell side. The cleaning water then starts swirling
and removes dirt on the measuring cell wall. The dirt, together with the opening the ball valve
mounted under the header tank.
During zero check, the zero water is ltered by passing through a zeroturbidity lter from the tap
water inlet. This zero water ows into the measuring cell in the detector via the head tank through
a tube separate from that for the sample and drains through the drain outlet.
1.1.3 TB400G-¨-¨-A2 (with automatic cleaning and without automatic zero calibration)
This is a system which comprises the TB400G---A1 model with the automatic cleaning
function added (see subsection 2.6.2).
The sampling system of this system incorporates a solenoid valve at the cleaning water tube and
an electric motor-operated valve under the header tank. These provisions automatically clean the
measuring cell under the detector in a sequence preset in the converter.
IM 12E04A02-02E 9th Edition : Mar. 16, 2018-00
Page 10

<1. OVERVIEW>
1.1.4 TB400G-¨-¨-A3 (with automatic cleaning and zero calibration)
This is a system which comprises the TB400G---A1 model with the automatic cleaning and
automatic zero calibration functions added (see subsection 2.6.3).
The sampling system of this system incorporates solenoid valves at the cleaning water tubing
and zero calibration tubing and electric motor-operated valves under the header tank and at the
measuring-water tubing. These provisions automatically clean the measuring cell in the detector
and perform zero calibration in a sequence preset in the converter.
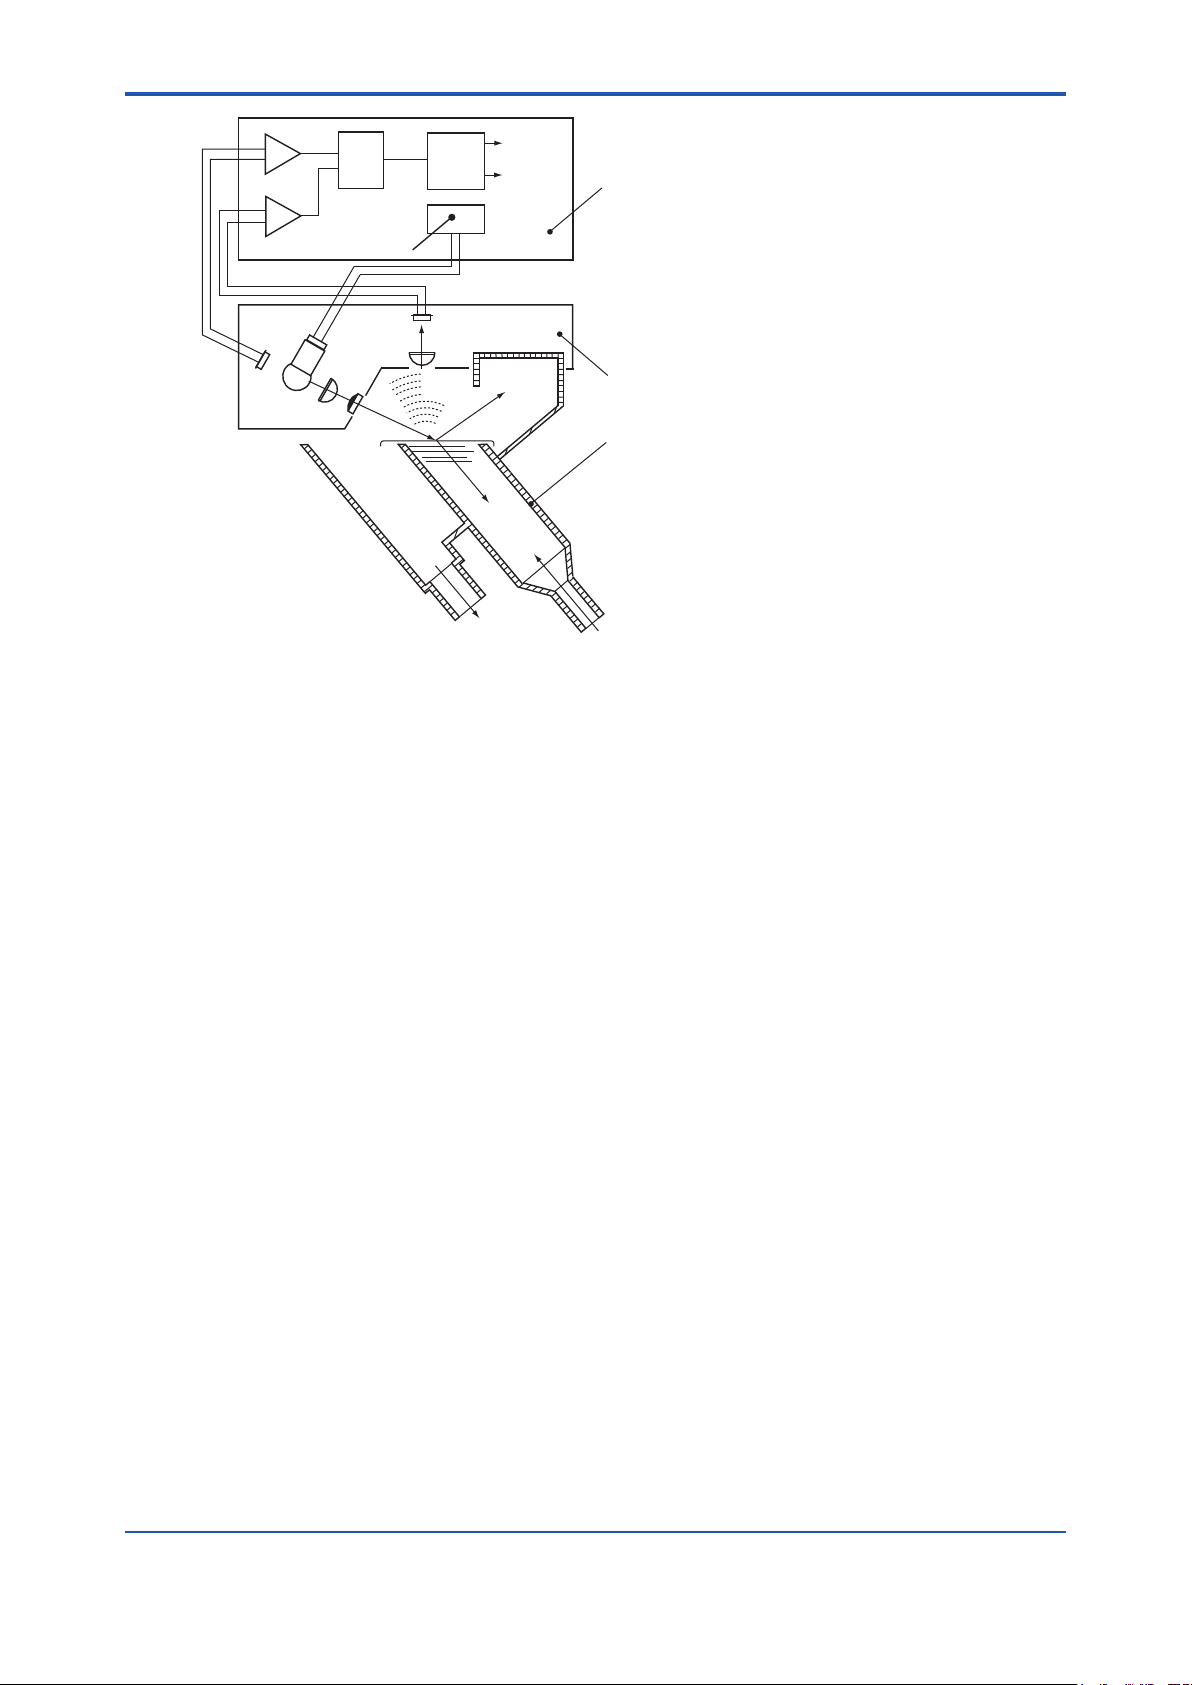
1.2 Operating Principle
The operating principle of the Surface Scattering Light Turbidity Meter employs a method of
measuring the amount of the light scattering that takes place close to the surface of the water
sample. The measuring system comprises a detector and a converter. This section describes the
meter conguration and operating principle.
The detector is comprises a measuring cell and a detecting section. Sample that ows into the
measuring cell from the bottom of the cell overows at the top of the cell.
Meanwhile, a tungsten lamp closed inside the detector emits light onto the surface of the sample
through a system of lenses. This light is separated into scattered, reected, and transmitted
light on the water’s surface. The transmitted light and reected light are absorbed in a dark area
equivalent to a black body.
1-3
This scattered-light intensity (L) is proportional to the turbidity as shown here:
L = K • Q • S
Where K: a constant relative to turbidity,
S: turbidity,
Q: amount of light from the lamp.
The scattered light is detected by a turbidity element (a silicon photodiode). It is focused onto
the element with a lens inside the detecting section. This gives the scattered light signal to the
converter.
In addition, a reference element is incorporated in the detecting section to hold the amount a light
(Q) from the lamp constant, and it also provides a light-detection signal to the converter.
The measuring circuit of the converter is sealed in a housing of aluminum alloy together with the
operating panel and a terminal block for external wiring. This measuring circuit amplies and
calculates the input from the turbidity element in the detector and outputs a signal (1 to 5 V DC or
4 to 20 mA DC) corresponding to the measuring range.
The converter also calculates the reference element input from the detector to control the lamp
voltage so that the amount of light from the lamp is constant.
IM 12E04A02-02E 9th Edition : Mar. 16, 2018-00
Page 11
<1. OVERVIEW>
1-4
AD
Amplifier
Lamp
Lamp
power
supply
Lens
Turbidity
element
Scattered
light
Amplifier
Reference
element
Lenses
Figure 1.2 Operating Principle
CPU
Display
Analog
output
Reflected
light
Transmitted
light
Drain
Converter
Detector
Measuring cell
Measuring water
F0102.ai
IM 12E04A02-02E 9th Edition : Mar. 16, 2018-00
Page 12

<2. SPECIFICATIONS>
2. SPECIFICATIONS
2.1 StandardSpecications
Measurement: Turbidity of tap water, river water, and water used in general processes
Measurement method: Surface scattering-light measurement
Measuring Range: 0-2 to 0-2000 mg/L
Display: 4-digit LED display (resolution; 0.01 mg/L, maximum display value; 2200
mg/L)
Display Unit: “mg/L (default)” or “
Note: “FTU” unit, a turbidity unit when formazin standard is used, is also available. Since the instrument uses kaolin standard,
reference sensitivity calibration using formazin standard is required for the FTU display.
In this manual, the unit “liter” is described as “L”.Real display unit is “mg/l”.The unit “
Output Range: 3 range switching
Remote or local (default) range switching, selectable
Auto or manual (default) range, selectable
For auto range, changeover point is user congurable.
3 ranges are user congurable. The span should be 20% or more of the
upper range limit or 2 mg/L (default), whichever is greater.
Analog Output Signal: 4 to 20 mA DC (maximum load resistance: 550 Ω) or 1 to 5 V DC (output
resistance: 100 Ω or less)
Digital Output Signal: Conforms to RS-232C
Communication Specications:
Data format: ASCII
Data length: 8 bits
Baud rate: 1200 bps
Parity: None
Start bit: 1 bit
Stop bit: 2 bits
Transmission method: Mono-directional (transmission only), asynchronous system
Communication Data:
Measured turbidity values: Converter's display data (turbidity indicated value) are transmitted.
Data consists of 6 characters including signs and decimal points.
Example 1: #0050.0
Example 2: #001.00
Example 3: #-00.50
Example 4: #_O.L_ _
Note: A space code is transmitted by “_”
High/low alarm signal: Transmitted continuously when high/low limit is detected.
#ALARMCRLF
Range output signal: Transmitted once when range is changed over.
Range 1: #RANGE1
Range 2: #RANGE2
Range 3: #RANGE3
Auto cleaning/calibration signal: Transmitted once when auto cleaning or calibration starts
and ends. Note that this is not transmitted when cleaning or calibration
is manually performed in <MAINT.> mode.
Start: #CLEANING_START
End: #CLEANING_END
Maintenance/measurement signal: Transmitted once when mode is switched.
Maintenance: #MAINTENANCE
Measurement: #MEASURE
”, selectable
CRL
F
CRL
F
CRL
F
CRL
F
CRL
F
CRL
F
CRL
F
CRL
CRL
F
CRL
F
F
CRL
” means degree.
F
2-1
IM 12E04A02-02E 9th Edition : Mar. 16, 2018-00
Page 13
<2. SPECIFICATIONS>
Failure signal: Transmitted continuously when failure occurs. Transmitted in
succession when multiple failures occur.
#ERR**
Example 1: #ERR11
Example 2: #ERR11_ERR18
Note: A space code is transmitted by “_”
CRL
, error numbers (11, 12, 13, 14, 15, 18, 25, 26) in **.
F
CRL
F
CRL
F
Data Update Interval: Approx. 1 second
Cable Length: 10 m max.
Contact Output: Maintenance output (during maintenance)
Fail output (when an error is detected)
Range output (corresponding to the output range selected) (shared COM)
High/low limit alarm (default) or auto calibration/cleaning output,
selectable.
Type of contact output Power off
Maintenance Closed Open Closed
Fail Open Closed Open
High/low alarm Closed Closed Open
Auto zero calibration/cleaning Closed Open Closed
*1: Contact status (open/closed) when power is turned on is user congurable.
Not in Action In Action
Power on *1
Contact Rating:
Maximum switching voltage: 250 V AC or 220 V DC (resistive load)
Maximum carrying current: 2 A AC or 2 A DC (resistive load)
Maximum switching capacity: 120 VA or 60 W (resistive load)
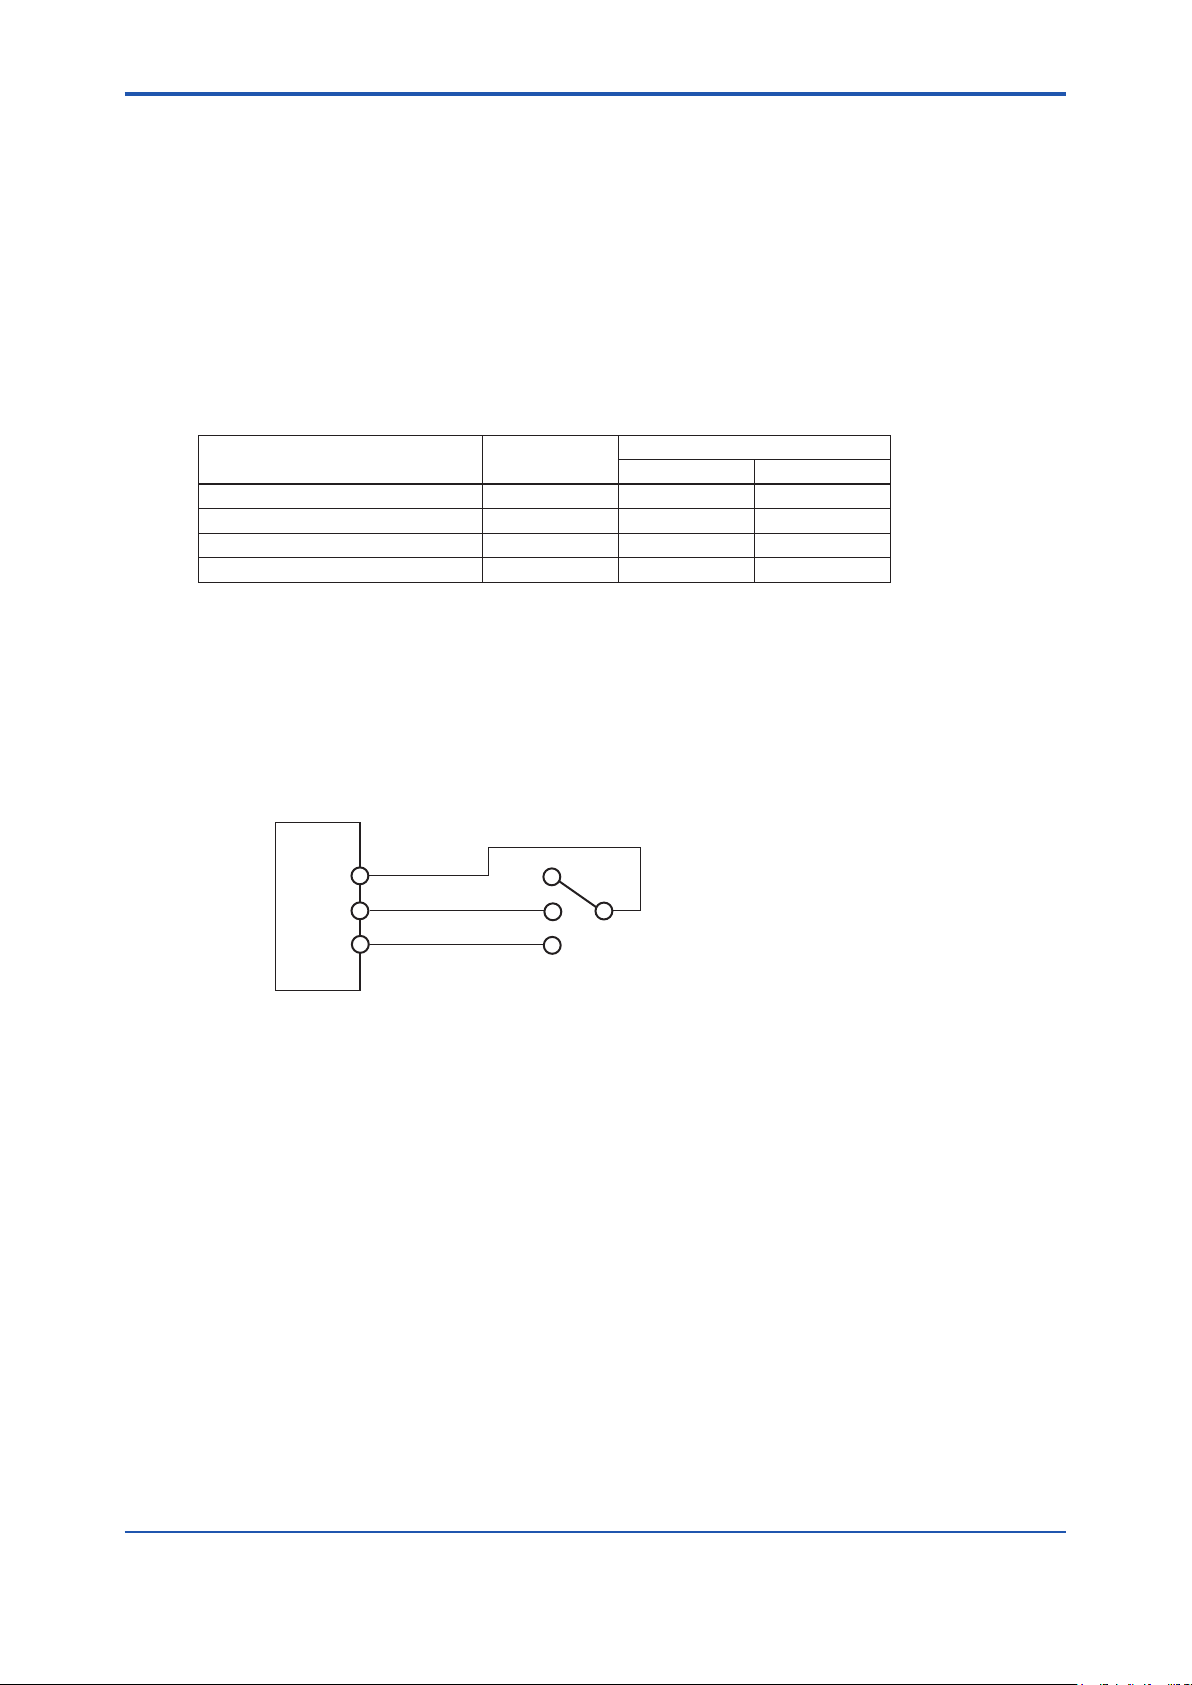
Contact Input: Remote range switching (shared COM)
On input resistance: 200 Ω or less
Off input resistance: 100 kΩ or more
Converter
2-2
R1
R2
R3
Remote Range Switching Diagram
S1
S2
S3
Switch
S1: Output range 1
S2: Output range 2
S3: Output range 3
F0200.ai
Converter's Functions:
Display Function:
Data: LED display – turbidity, lamp voltage, turbidity element detecting
current, reference element detecting current, analog output in %,
analog output in mA, zero point error and slope.
Operation status: Lamp – <MEAS.>, <MAINT>, <PROGRAM 1> and <PROGRAM 2>
modes.
Indicator – output signal, HOLD, CAL, WASH, FAIL
Instrument status: Indicator – lamp and each solenoid valve.
Maintenance Functions (<MAINT.> mode):
Zero calibration, shift calibration, span calibration, sensitivity correction
calibration, manual start of auto cleaning, manual start of auto zero
calibration, error code indication, error reset and calibration of lamp
control reference value.
Setting Functions:
<PROGRAM.1> mode: Setting of output range, average coefcient, output value in
failure condition, bi-linear output, high alarm, low alarm and spike
detection function.
<PROGRAM.2> mode: Setting of auto cleaning time and auto zero calibration time, and
selection of enabling/disabling failure detection functions.
IM 12E04A02-02E 9th Edition : Mar. 16, 2018-00
Page 14

<2. SPECIFICATIONS>
Automatic Cleaning Function: Water jet cleaning. Cleaning time and interval are user
congurable. (When auto cleaning is specied)
Automatic Zero Calibration Function: Zero point calibration using zero water (When auto
cleaning/zero calibration is specied)
Error Detection Function: Turbidity overrange, lamp disconnection, lamp voltage failure, AD
circuit failure, memory failure and CPU failure.
Check Function: Converter operation check
Manual Calibration:
Zero calibration: Using zero water or light source off zero (selectable)
Span calibration: Using calibration plate
Other Functions Breakpoint line-segment (bi-linear) output, upper and lower limits alarms
Material:
Detector: Modied black PPE (wetted part)
Piping: Hard PVC, polyethylene resin, and polypropylene resin (all for
wetted parts)
Stanchion: Carbon steel or stainless steel
Converter: Aluminum alloy casting
Finish and Color:
Converter: Baked polyurethane resin nish
Color; Munsell 0.6GY3.1/2.0 and Munsell 2.5Y8.4/1.2
Stanchion: Baked polyurethane resin nish
Color; Munsell 0.6GY3.1/2.0
Ambient Temperature: -5 to 50°C (sample and tap water freeze in winter may need protection
against freezing)
Ambient Humidity: 5 to 95%RH (non-condensing)
Storage Temperature: -30 to 70°C
Installation Location: Indoors (For outdoor installation, a protection against rain is required
separately)
Installation: Detector and converter: Pipe- or rack- mounted
With sampling system: Anchor bolt mounting
Piping Connection:
With sampling system: Drain: VP40
Others: VP16
Without sampling system: 25 mm ID hose joint
Cable Inlet: 5 cable glands (bottom of the converter)
Applicable wire: 6 to 12 mm, 9 to 11 mm when with arrester option
Wiring: Power, analog output, digital output, contact output, contact input
and ground (using the ground terminal inside the converter or the
ground terminal on the outside of the case)
Power Supply: 100/110 V AC, 50/60 Hz, or 200/220 V AC, 50/60 Hz
Noise lter assembly: (only for TB400G-□-□-KC)
Ambient temperature: -10 to 50°C (no dew condensation allowed)
Storage temperature: -25 to 70°C
Construction: JIS C 0920 Watertight (IP53)
Power Consumption:
Detector and converter: 50 VA or less, respectively
With sampling system: 200 VA or less (in full specications, excluding combination
instruments)
Weight: Detector: Approx. 3 kg
Converter: Approx. 9 kg
With sampling system: Approx. 50 kg (in full specications, excluding
combination instruments)
Dimensions: Detector: 245 (W) x 250 (H) x 200 (D) mm
Converter: 260 (W) x 340 (H) x 150 (D) mm
With stanchion: 530 (W) x 1450 (H) x 550 (D) mm
2-3
IM 12E04A02-02E 9th Edition : Mar. 16, 2018-00
Page 15

<2. SPECIFICATIONS>
Water Sample:
With sampling system:
Flow rate: 2 to 10 L/min
Pressure: 20 to 500 kPa
Temperature: 0 to 50°C (Ambient temperature should not exceed 30°C)
Without sampling system:
Flow rate: 1.5 to 2 L/min
Temperature: 0 to 50°C (Ambient temperature should not exceed 30°C)
Zero Water and Cleaning Water (Tap Water): (With Sampling System)
Turbidity: 2 mg/L or less
Temperature: 0 to 50°C (Ambient temperature should not exceed 30°C)
Pressure: 100 to 500 kPa
Flow rate: Zero water: 2 to 10 L/min
Cleaning water: 3 to 6 L/min
Consumption: Zero water: Approx. 380 L/day (at a ow rate of 2 L/min)
Cleaning water: Approx. 90 L/min (at a ow rate of 3 L/min)
(when auto cleaning/zero calibration is enabled and time setting is
factory default)
2.2 Characteristics
2-4
Linearity (when using kaolin standard):
Upper range limit of 1000 mg/L (degrees) or less; ±2% of upper range limit
Upper range limit of 2000 mg/L (degrees) or less; ±5% of upper range limit
Linearity (when using polystyrene latex standard):
Upper range limit of 100 mg/L or less; ±2% of upper range limit
Repeatability:
Standard solution; 2% of upper range limit
Supply voltage effects: ± 1% of upper range limit / within ± 10% of rated voltage
Ambient temperature effects: ± 1% of upper range limit / 10°C (when using calibration plate)
Response Time: 2 minutes or less
(90% response, with sampling system, ow rate of 3 L/min)
Warm-up Time: Approx. 30 minutes
Regulatory Compliance (for TB400G-□-□-KC)
Korea Electromagnetic Conformity Standard Class A
A급 기기 (업무용 방송통신기자재)
이 기기는 업무용(A급) 전자파적합기기로서 판매자 또는
사용자는 이 점을 주의하시기 바라며, 가정외의 지역에서
사용하는 것을 목적으로 합니다.
한국 전자파적합성 기준
IM 12E04A02-02E 9th Edition : Mar. 16, 2018-00
Page 16
<2. SPECIFICATIONS>
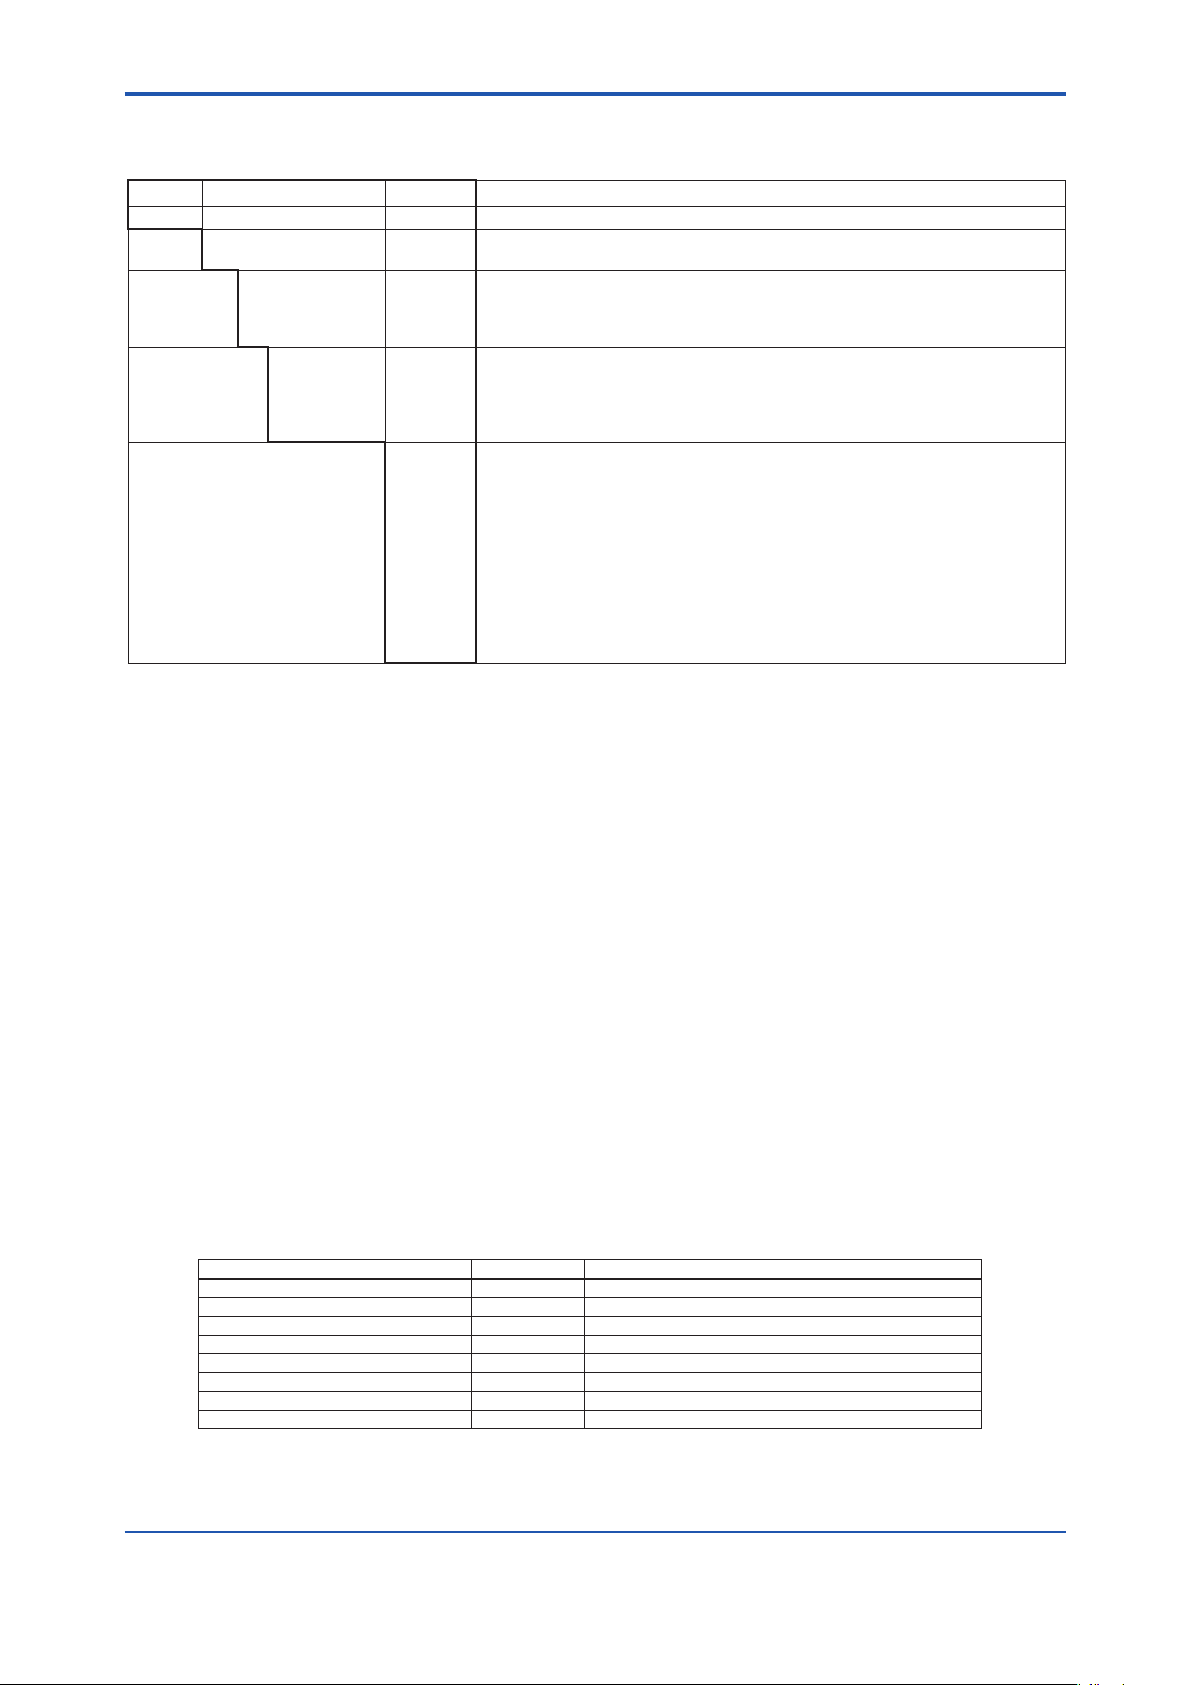
2.3 ModelandSufxCodes
Piping
Option Code
................
................
................
................
................
................
................
................
................
................
................
/P
/R
/B
/S
/L
/SCT
/PHN5
/PHU5
/TT3
/FC
/ARS
/PSL
Description
Surface Scattering Light Turbidity Meter
4 to 20 mA DC
1 to 5 V DC
100 V AC, 50/60 Hz
110 V AC, 50/60 Hz
200 V AC, 50/60 Hz
220 V AC, 50/60 Hz
Without sampling system, automatic cleaning, or automatic zero calibration *1
With sampling system, but without automatic cleaning or automatic zero calibration
With sampling system and automatic cleaning, but without automatic zero calibration
With sampling system, automatic cleaning, and automatic zero calibration
For Korea. Without sampling system. (without cleaning,without auto.zero calibration) *8
Mounting bracket: For pipe mounting *2
Mounting bracket: For rack mounting *2
Tie-in with rear piping *3
Stainless steel stanchion *3
Bubble retardant for low range *3 *4
Stainless steel tag plate
With PH450G pH meter (without ultrasonic cleaning) *3 *5
With PH450G pH meter (with ultrasonic cleaning) *3 *5
With 500 mL KCl reserve tank for pH sensor *5
With non-reagent type free available chlorine analyzer *3 *5
With arrester *6
Calibration using polystyrene latex *7
Model SufxCode
TB400G
Output -4
Power supply
Device
conguration and
Application
Optional
specication
.................................... ................
-5
-1
-3
-6
-7
-NN
-A1
-A2
-A3
-KC
Mounting bracket
Stanchion material
Bubble treatment
Combination analyzer
PSL calibration
Tag plate
Arrester
2-5
[Style: S3]
*1: A de-foaming tank (head tank) is to be provided. It is to be installed to adjust the sample ow to the detector at 1.5 to 2 L/min.
*2: These options are available for the specication of “without sampling system” (sufx code: -NN, -KC).
*3: These options are available for the specication of “with sampling system” (sufx code: -A1, -A2 or -A3).
*4: When measuring range is low (200 mg/L or less) and if air bubbles are likely to be formed on the sample, this option is to be specied.
When measuring range is high (more than 200 mg/L), this option is not to be specied. Because air bubbles in high ranges don’t disturb
the measurement, and because clogging or reduction of ow rate may occur at the removal port of air bubbles on the ow line.
*5: A pH meter with necessary units, or non-reagent type free available chlorine analyzer should be purchased separately.
Both of a pH meter and non-reagent type free available chlorine analyzer can not be installed together on the TB400G.
Available model & sufx codes are as follows;
Non-reagent type free available chlorine analyzer (refer to the GS 12F5A1-E)
FC400G-□-□*A/ST (for /FC)
* The power supply of FC400G is to be suitable for the power supply of TB400G.
pH meter (refer to the GS 12B07B02-E, GS 12J05C02-00E and GS 12B07C05-01E)
pH sensor
PH8EFP-03-TN-TT1-N-G*A (for /PHN5 or /PHU5, without /TT3)
PH8EFP-03-TN-TT3-N-G*A (for /PHN5 or /PHU5, and /TT3)
pH holder
PH8HF-PP-JPT-T-NN-NN*A (without cleaning) (for /PHN5)
PH8HF-PP-JPT-T-S3-C1*A (with ultrasonic cleaning) (for /PHU5)
pH converter
PH450G-A-J (for /PHN5 or /PHU5)
Ultrasonic oscillator
PUS400G-NN-NN-□-J
* The power supply of PUS400G is to be suitable for the power supply of TB400G.
*6: This option is not available for the options of /PHN5, /PHU5 or /FC.
*7: Polystyrene latex solution of which concentration is 2 degrees is used as a standard solution to calibrate the TB400G.
Without this option, the standard TB400G is calibrated with a Kaolin solution.
*8: No additional specications other than “/P”,”/R” and “/SCT” can be chosen.
2.4 Accessories
Standard calibration plate 1 Housed in the converter
Silicone cloth 1
Lamp 1 As a spare
Fuse 4 each 1 A and 3 A (as spares)
Pipe mounting bracket (optional) 1 set When specifying option code "/P"
Rack mounting bracket (optional) 1 set When specifying option code "/R"
Soft PVC tube, 1 m 2 For detector piping (for without sampling system)
Clamp 2 For detector piping (for without sampling system)
Item Quantity Remarks
IM 12E04A02-02E 9th Edition : Mar. 16, 2018-00
Page 17

<2. SPECIFICATIONS>
2.5 ExternalDimensions
Dimensions, piping and internal wiring diagram for the TB400G are shown on following pages.
For gure numbers to be referred corresponding each models and codes are shown in the Table
2.1. Table 2.1 uses following signs. FC: free available chlorine analyzer, pH: pH meter, US:
ultrasonic oscillator, ARS: arrester, Yes: installed, No: not installed, Op: optionally installed
Table2.1 Indexofdimensions,pipingandinternalwiringdiagram
Model and codes (option) FC pH US ARS Dimensions Piping Wiring *1
2-6
TB400G-¨-¨-NN
TB400G-¨-¨-KC
TB400G-¨-¨-A1(/ARS) (Bottom Piping)
TB400G-¨-¨-A1(/ARS)/B (Rear Piping)
TB400G-¨-¨-A2(/ARS) (Bottom Piping)
TB400G-¨-¨-A2(/ARS)/B (Rear Piping)
TB400G-¨-¨-A3(/ARS) (Bottom Piping)
TB400G-¨-¨-A3(/ARS)/B (Rear Piping)
TB400G-¨-¨-A1/PHU5 (Bottom Piping)
TB400G-¨-¨-A1/PHU5/B (Rear Piping)
TB400G-¨-¨-A2/PHU5 (Bottom Piping)
TB400G-¨-¨-A2/PHU5/B (Rear Piping)
TB400G-¨-¨-A3/PHU5 (Bottom Piping)
TB400G-¨-¨-A3/PHU5/B (Rear Piping)
TB400G-¨-¨-A1/PHN5 (Bottom Piping)
TB400G-¨-¨-A1/PHN5/B (Rear Piping)
TB400G-¨-¨-A2/PHN5 (Bottom Piping)
TB400G-¨-¨-A2/PHN5/B (Rear Piping)
TB400G-¨-¨-A3/PHN5 (Bottom Piping)
TB400G-¨-¨-A3/PHN5/B (Rear Piping)
TB400G-¨-¨-A1/FC (Bottom Piping)
TB400G-¨-¨-A1/FC/B (Rear Piping)
TB400G-¨-¨-A2/FC (Bottom Piping)
TB400G-¨-¨-A2/FC/B (Rear Piping)
TB400G-¨-¨-A3/FC (Bottom Piping)
TB400G-¨-¨-A3/FC/B (Rear Piping)
No No No No Fig. 2.1.1
No No No No Fig. 2.1.2
No No Op Fig. 2.2.1
No
No No No Op Fig. 2.2.2
No No No Op Fig. 2.3.1
No No No Op Fig. 2.3.2
No No Op Fig. 2.4.1
No
No No No Op Fig. 2.4.2
No Ye s Yes No Fig. 2.5.1
Yes
No
No Ye s Yes No Fig. 2.6.1
No Ye s Yes No Fig. 2.6.2
No Ye s Yes No Fig. 2.7.1
No
No Ye s No No Fig. 2.8.1
No Ye s No No Fig. 2.8.2
No
No Ye s No No Fig. 2.9.2
No Ye s No No Fig. 2.10.1
No Ye s No No Fig. 2.10.2
Yes No No No Fig. 2.12.1
Yes
Yes No
Yes No No No Fig. 2.12.2
Yes No No No Fig. 2.13.1
Yes No No No Fig. 2.13.2
Yes
Yes
No
Yes No
Yes No
No No
No
No
No Fig. 2.12.1
No
Fig. 2.5.2
Fig. 2.7.2
Fig. 2.9.1
Fig. 2.11.2
Fig. 2.14
Fig. 2.21
Fig. 2.22
Fig. 2.23
Fig. 2.24
Fig. 2.25
Fig. 2.23
Fig. 2.24
Fig. 2.25
Fig. 2.26
Fig. 2.27
Fig. 2.28
Fig. 2.33
Fig. 2.31
Fig. 2.30
Fig. 2.32
*1: First of all see Figure 2.29 and Table 2.2, then refer to described Figure in this table also.
IM 12E04A02-02E 9th Edition : Mar. 16, 2018-00
Page 18
<2. SPECIFICATIONS>
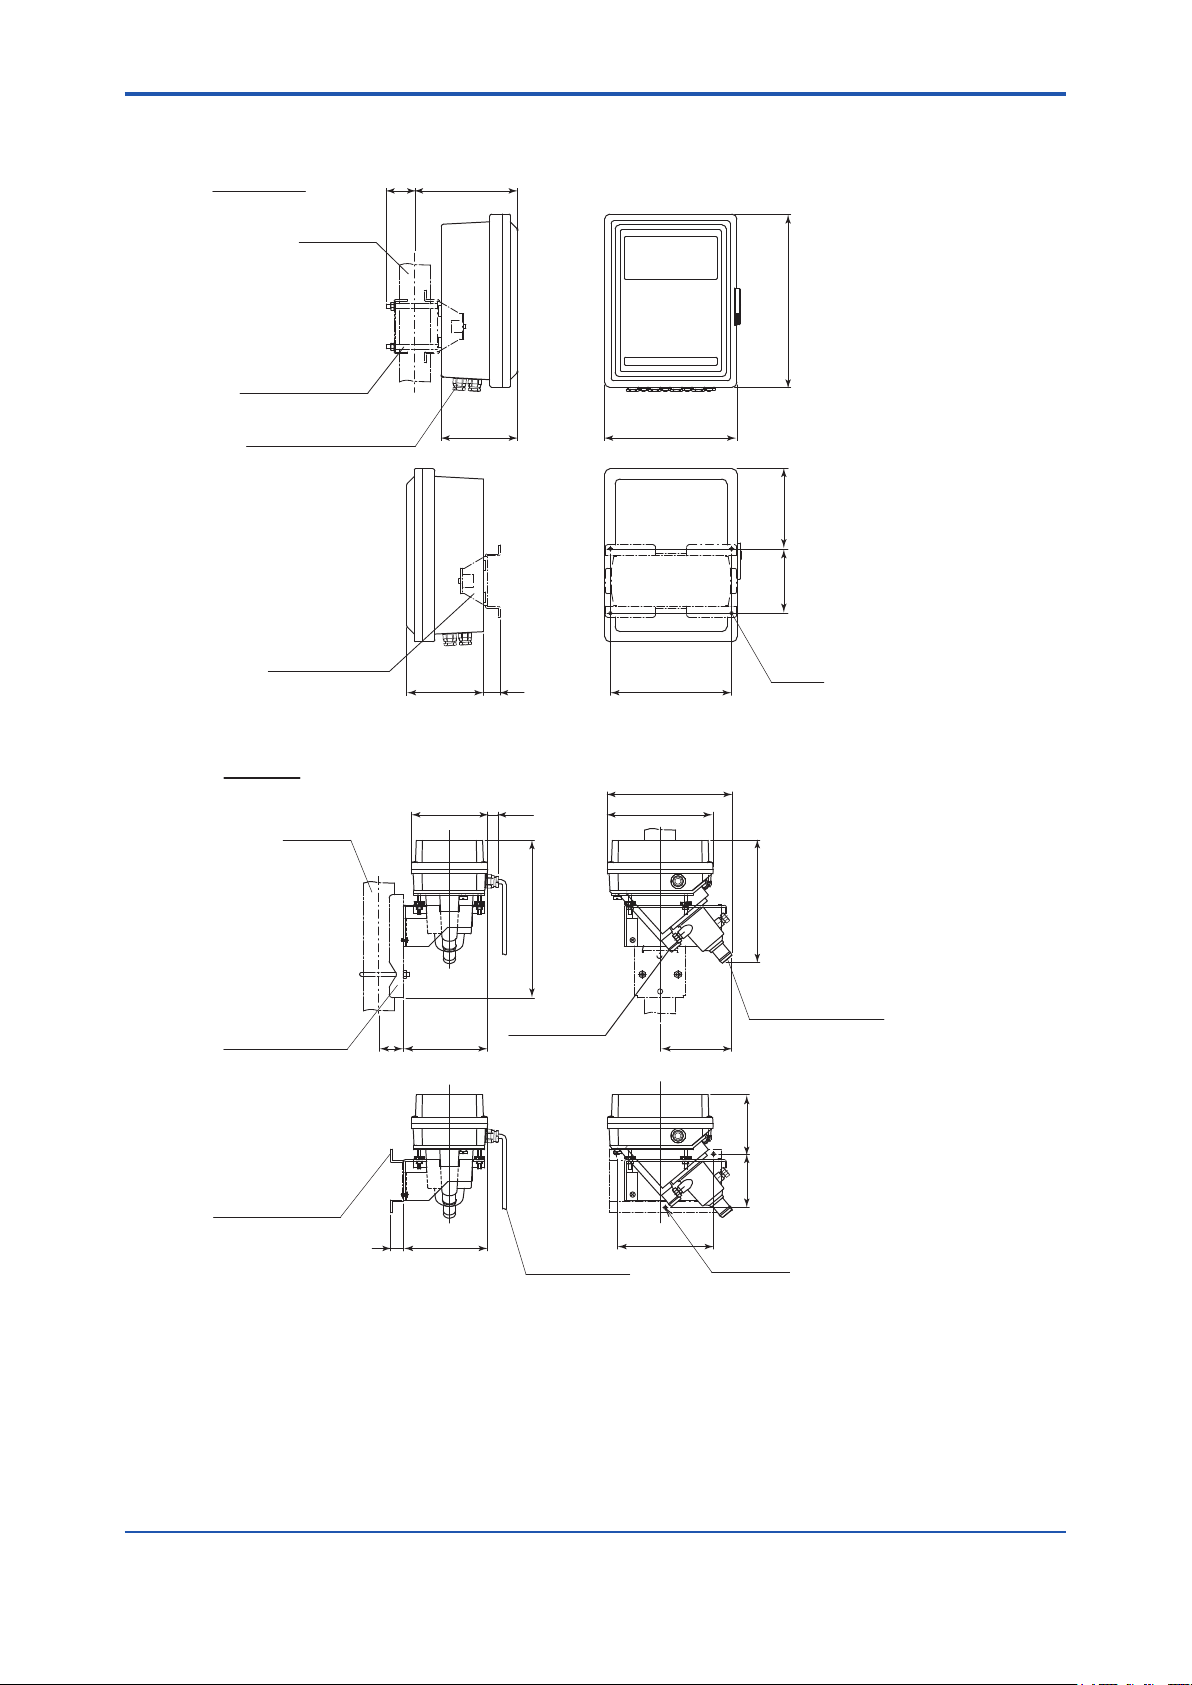
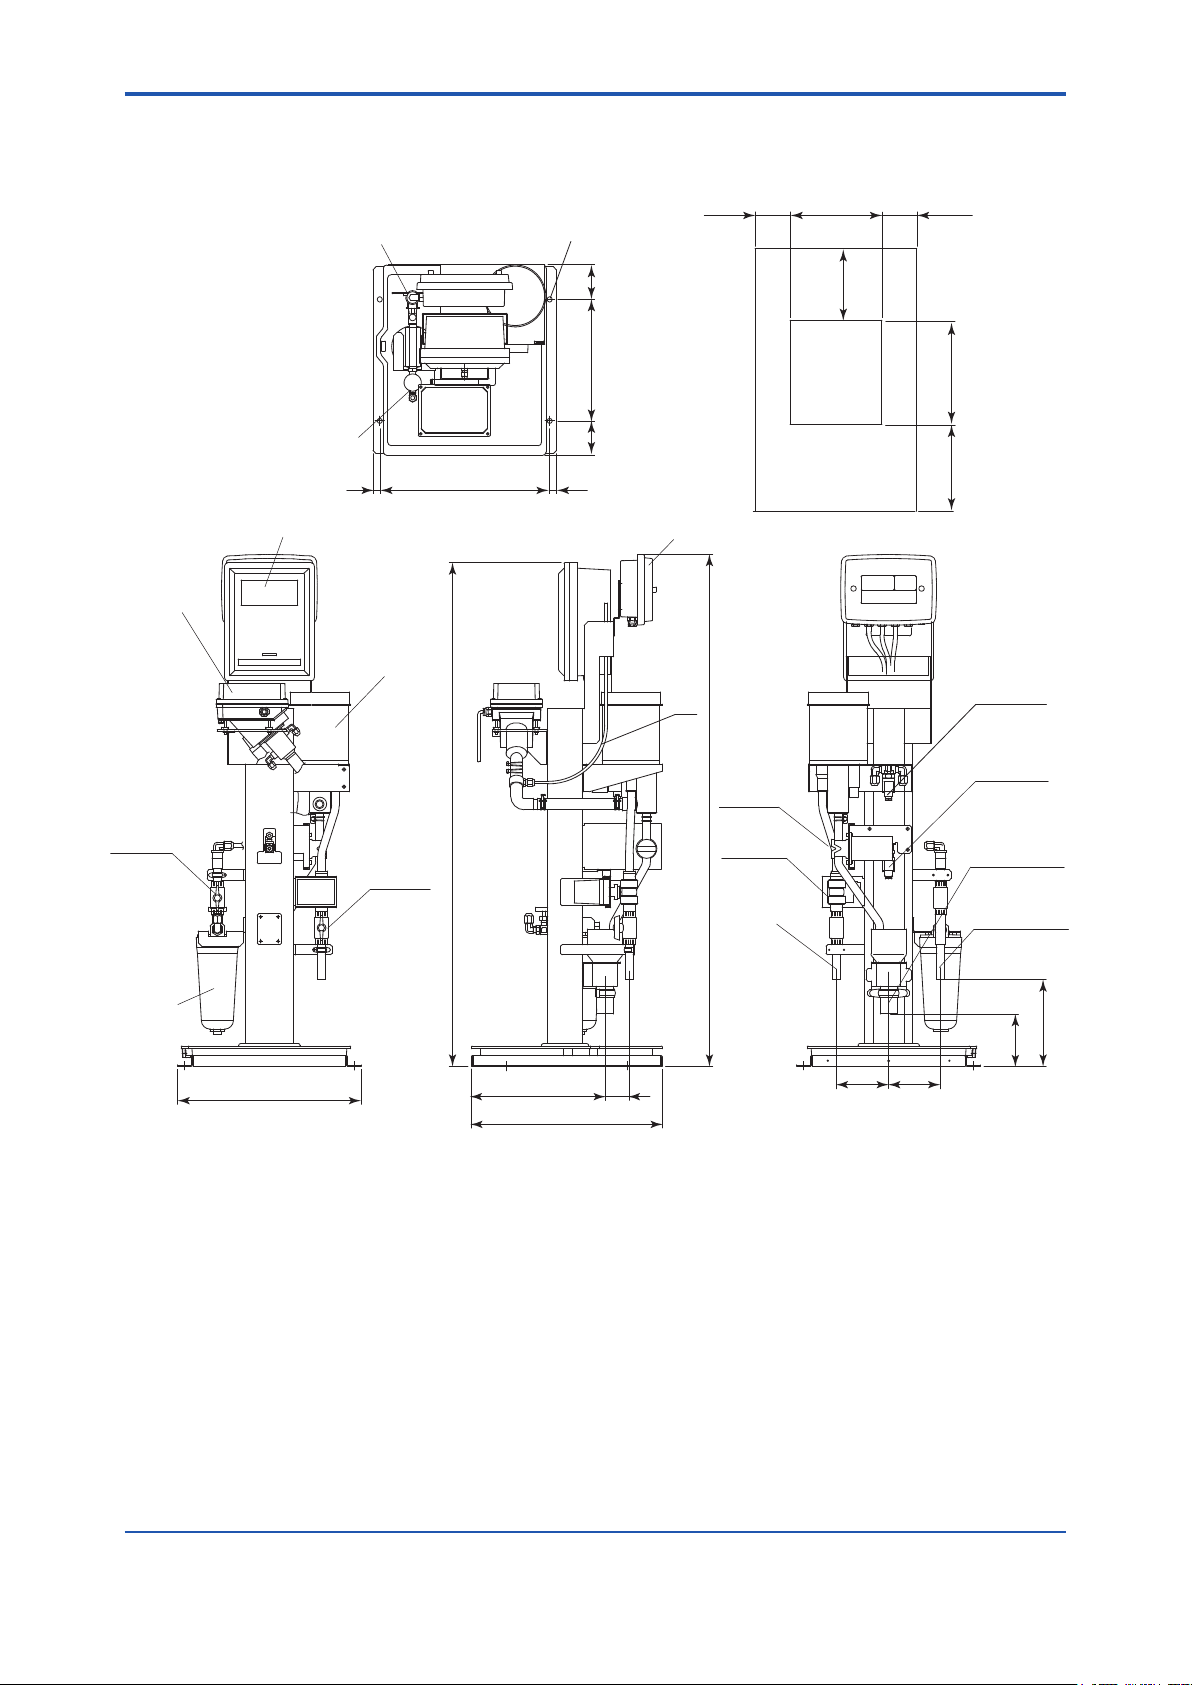
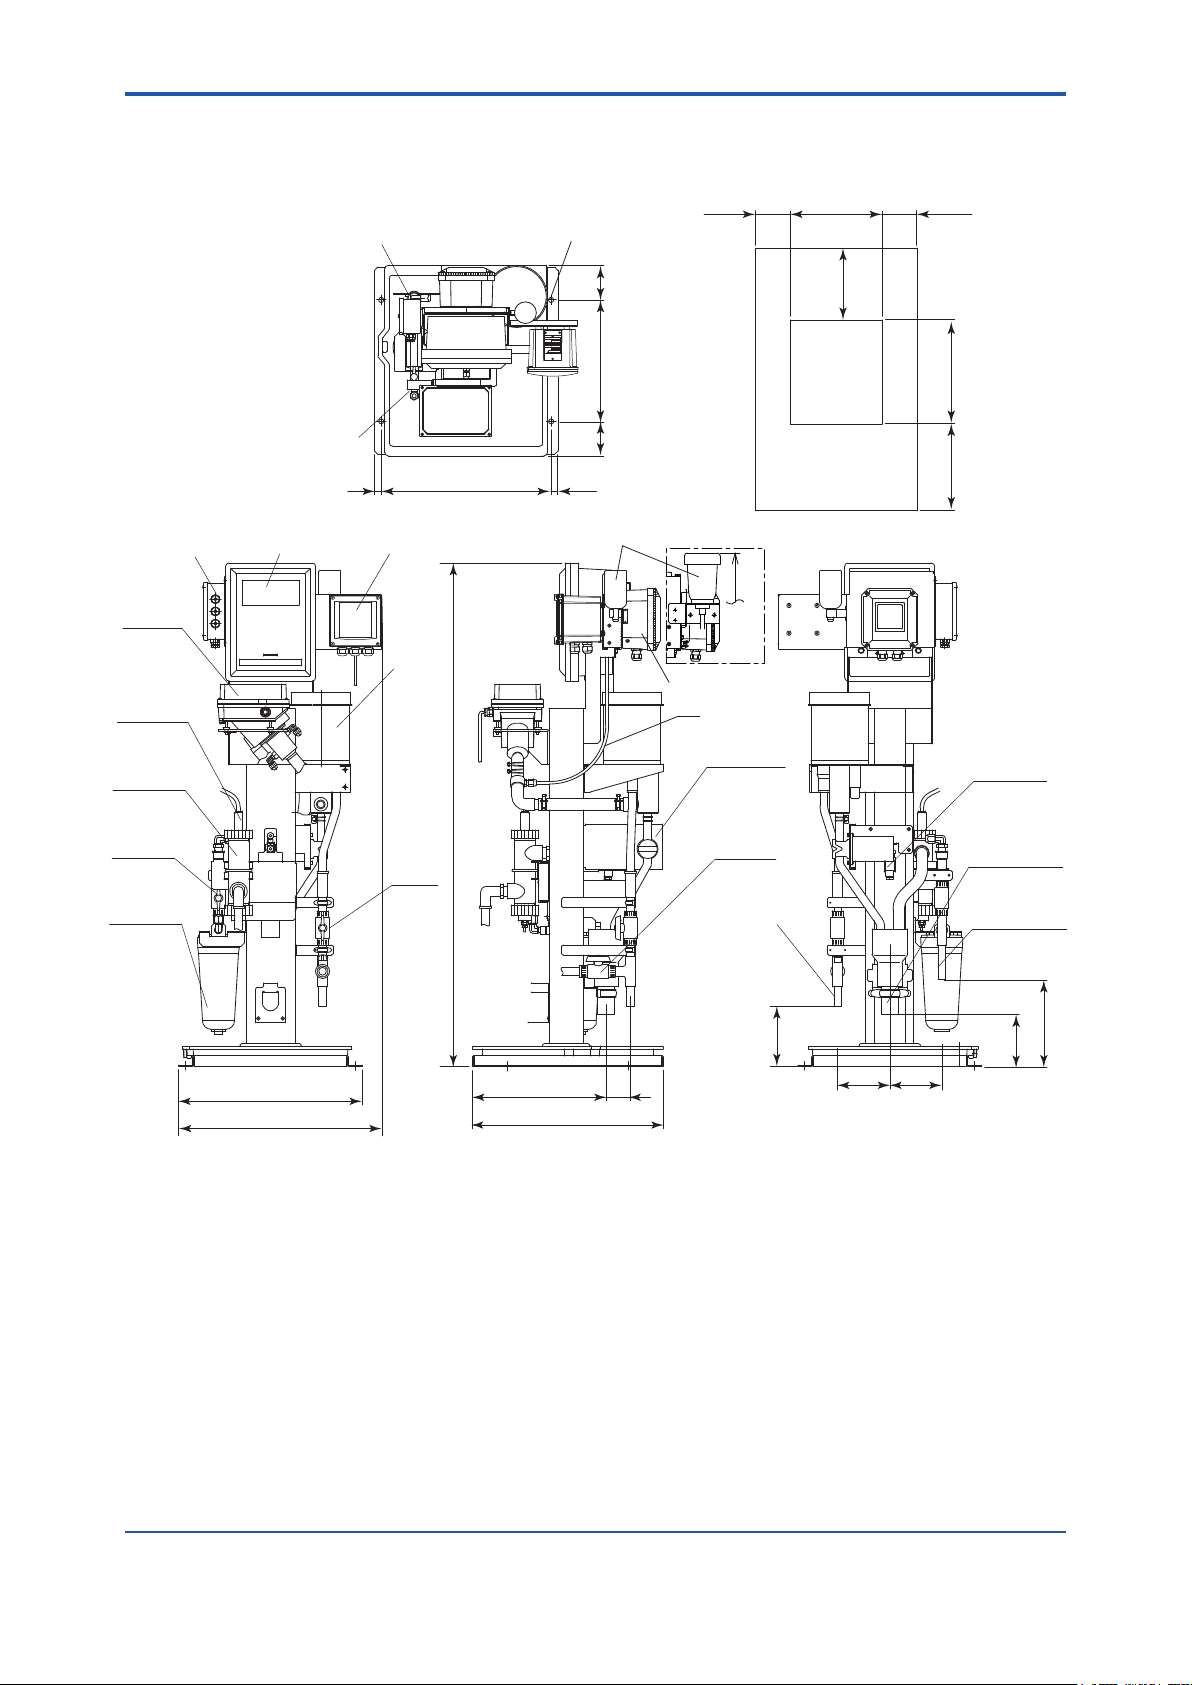
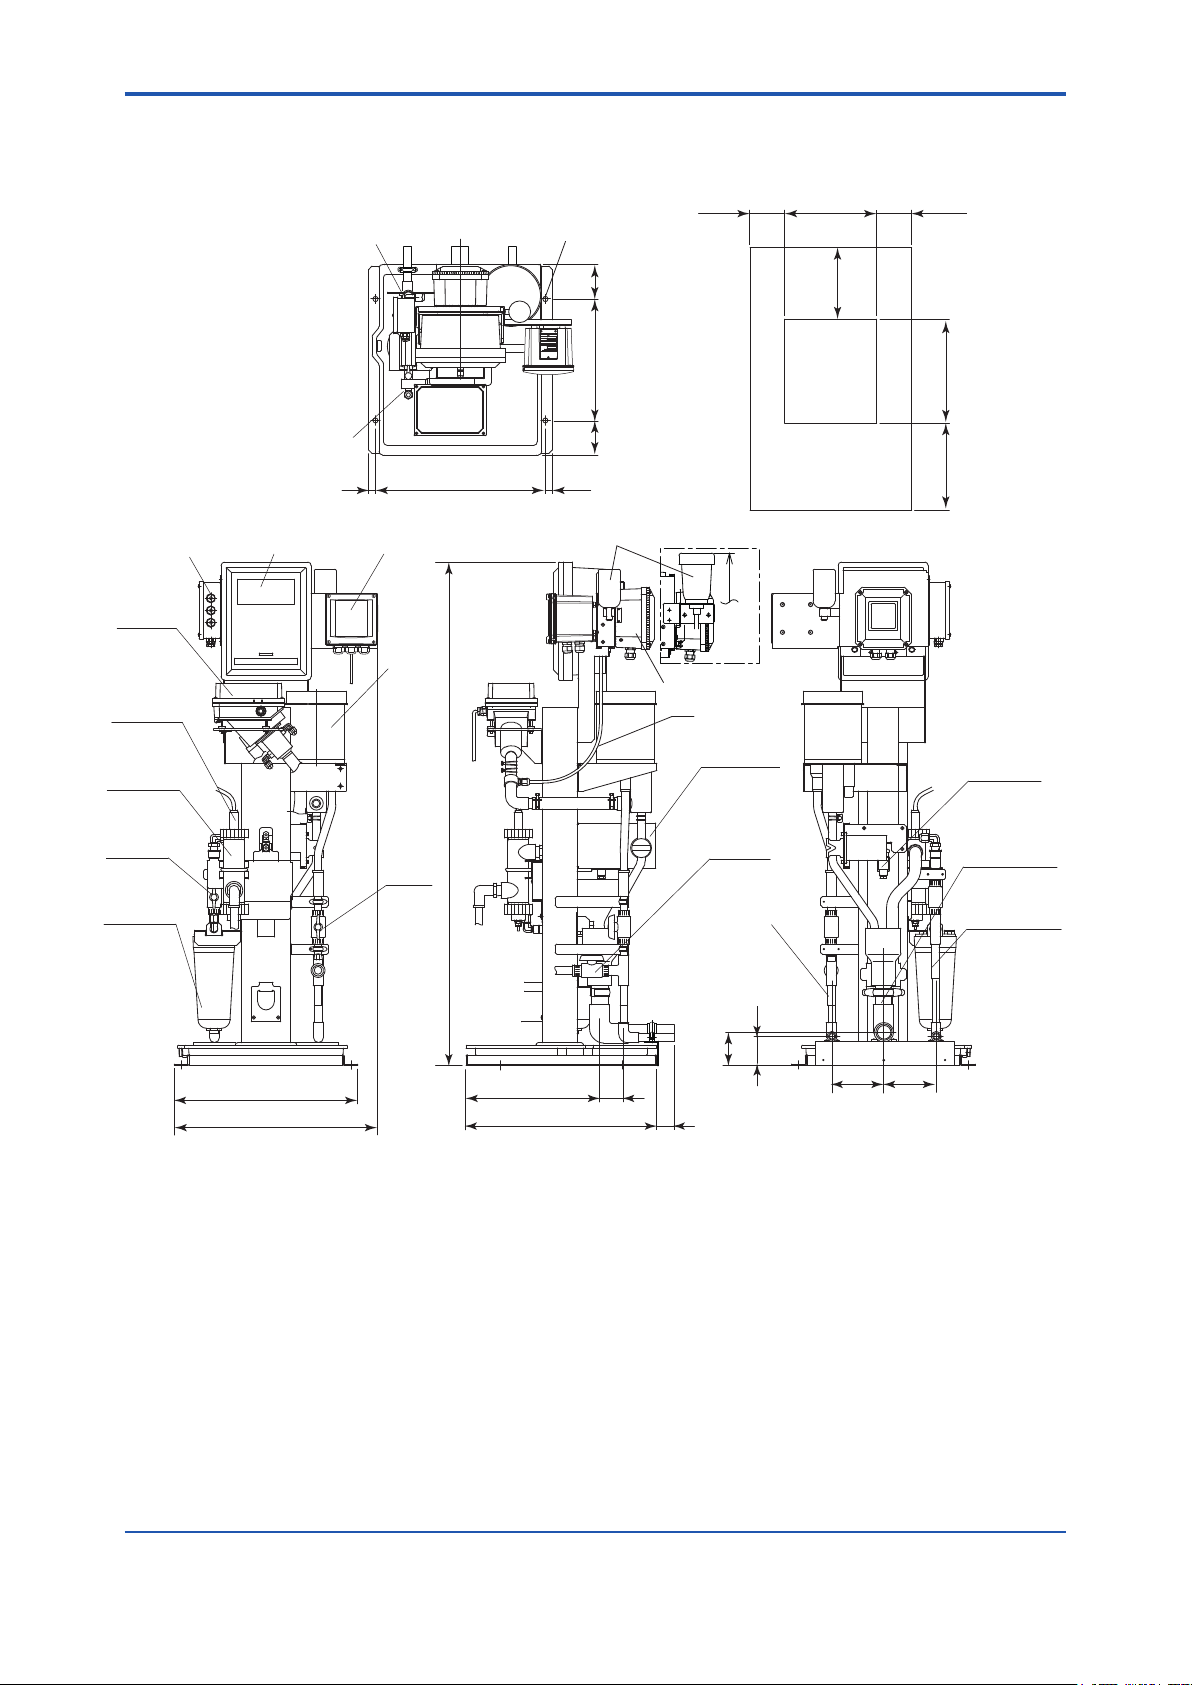
2.5.1 TB400G-¨-¨-NN, -KC
2-7
Converter
2B pipe
(Ø60.5)
Pipe mounting
bracket
(Option code: /P)
Cable inlet
(Ø6 to Ø12 o.d. waterproof plug)
Rack mounting
bracket
(Option code: /R)
150
20256
340
150
33
260
238
158126.5
4-Ø6 holes
Unit: mm
Detector
)(
30
310
Sample water
output
Ø25 i.d. hose joint
Dedicated cable
2B pipe
(Ø60.5)
Pipe mounting
bracket
(Option code: /P)
Rack mounting
bracket
(Option code: /R)
25
48
150
170
Figure 2.1.1 TB400G-¨-¨-NNExternalDimensions
245
208
190170
145
250
Sample water input
Ø25 i.d. hose joint
105 120
3-Ø6 holes
F0201.ai
IM 12E04A02-02E 9th Edition : Mar. 16, 2018-00
Page 19
<2. SPECIFICATIONS>
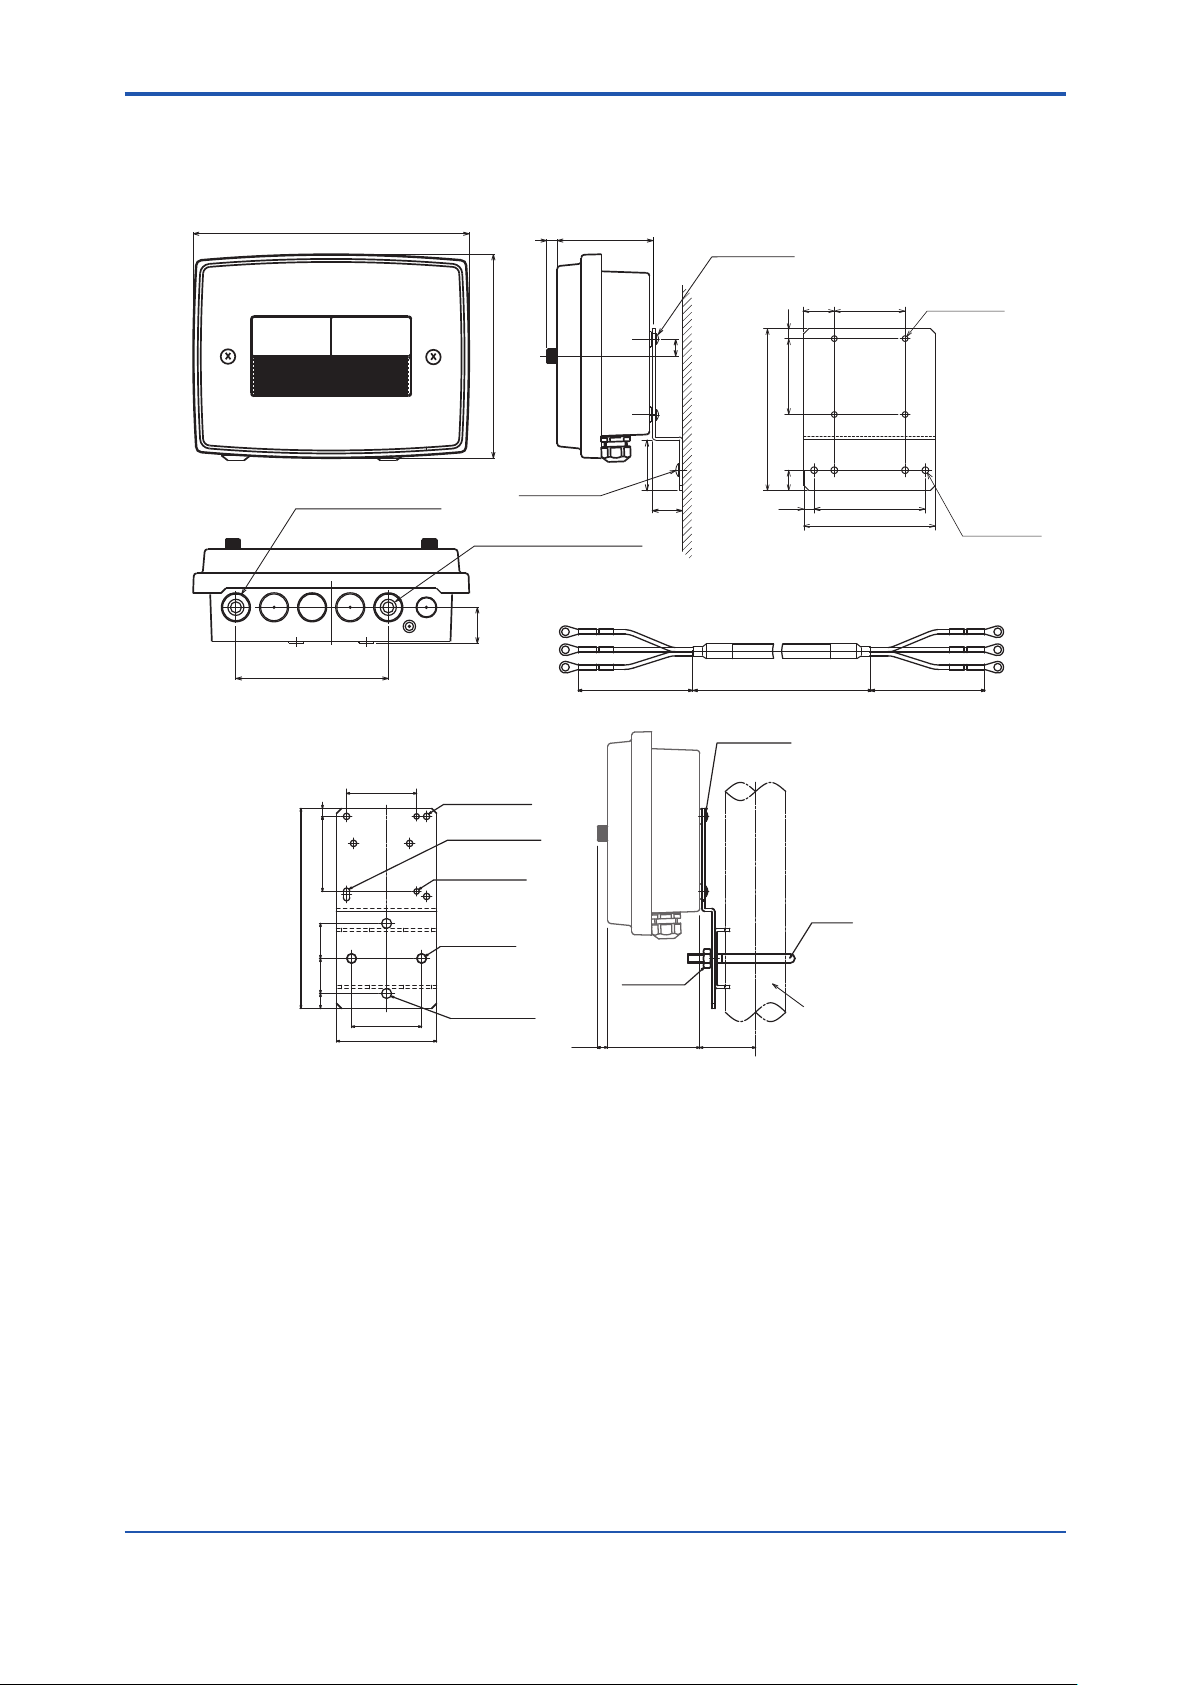
The converter and the detector are the same as gure 2.1.1.
• Noise lter assembly
275
203
10 92
4-M5 screws
Mounting bracket for noise filter assembly
30
10
17
75
160
70
2-8
Unit: mm
4-ø5.5 holes
External power cable inlet
(cable OD of Ø6 to Ø12)
2-M5 screws
Dedicated power cable outlet
Dedicated power cable for noise filter assembly
36
Black L1
White L2
152
Weight of noise filter assembly: Approx. 2 kg
Green G
Approx. 80 Approx. 80
Panel mounting bracket for noise filter assembly (Option code: /P)
Weight: Approx. 0.7 kg
200
70
75 8
35
3515
70
100
5- Ø6.5 holes
Ø6.5 x 13 hole
2- Ø5.5 holes
2-Ø9 holes
M8 nut ×2
4-Ø10 holes
(10)
50
30
Cable length : Approx. 0.7 m
4-M5 screw
(92) 54
20
10
Weight of power cable: Approx. 0.2 kg
2-inch pipe (vertical mounting OD Ø60.5)
110
130
Weight: Approx. 0.7 kg
U-bolt
4-ø6.5 holes
L1 Black
L2 White
G Green
In the case of optional cord /P, the standard mounting bracket for noise lter assembly is not attached.
Figure 2.1.2 TB400G-¨-¨-KCExternalDimensions
IM 12E04A02-02E 9th Edition : Mar. 16, 2018-00
Page 20
<2. SPECIFICATIONS>
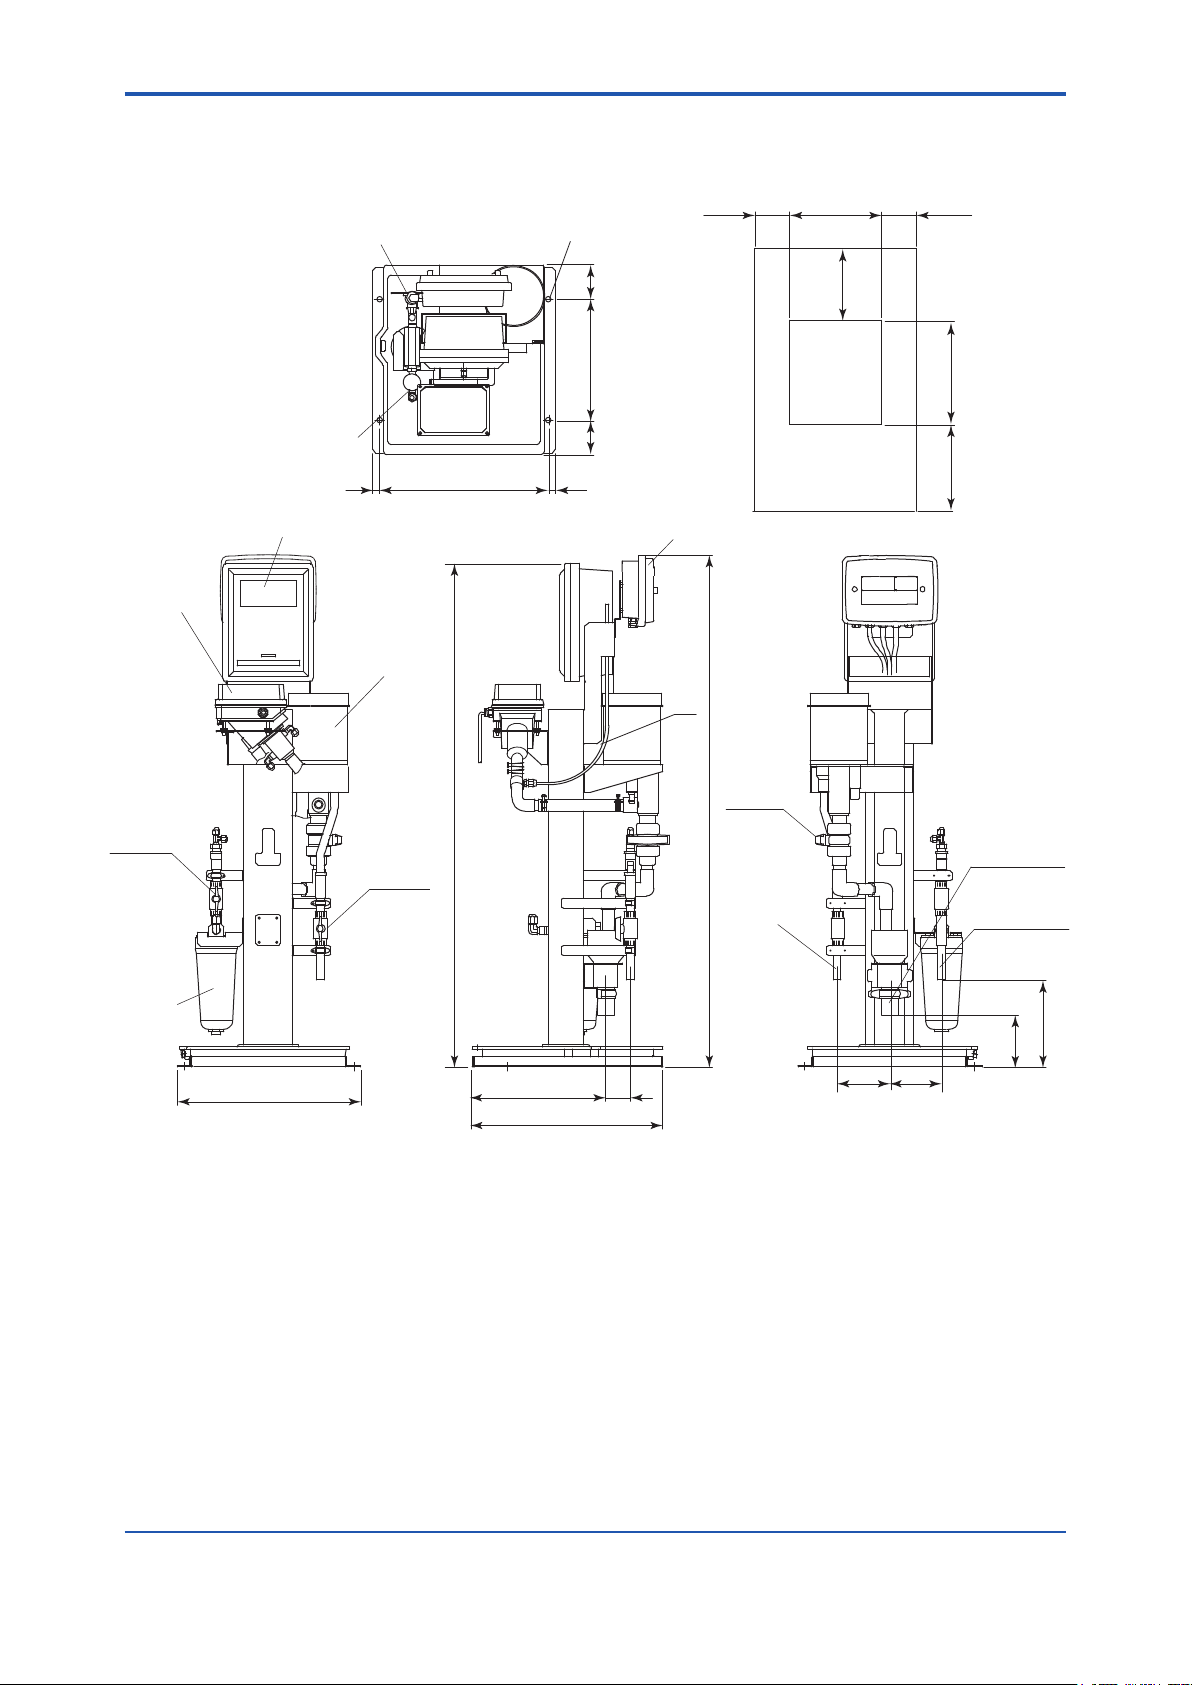
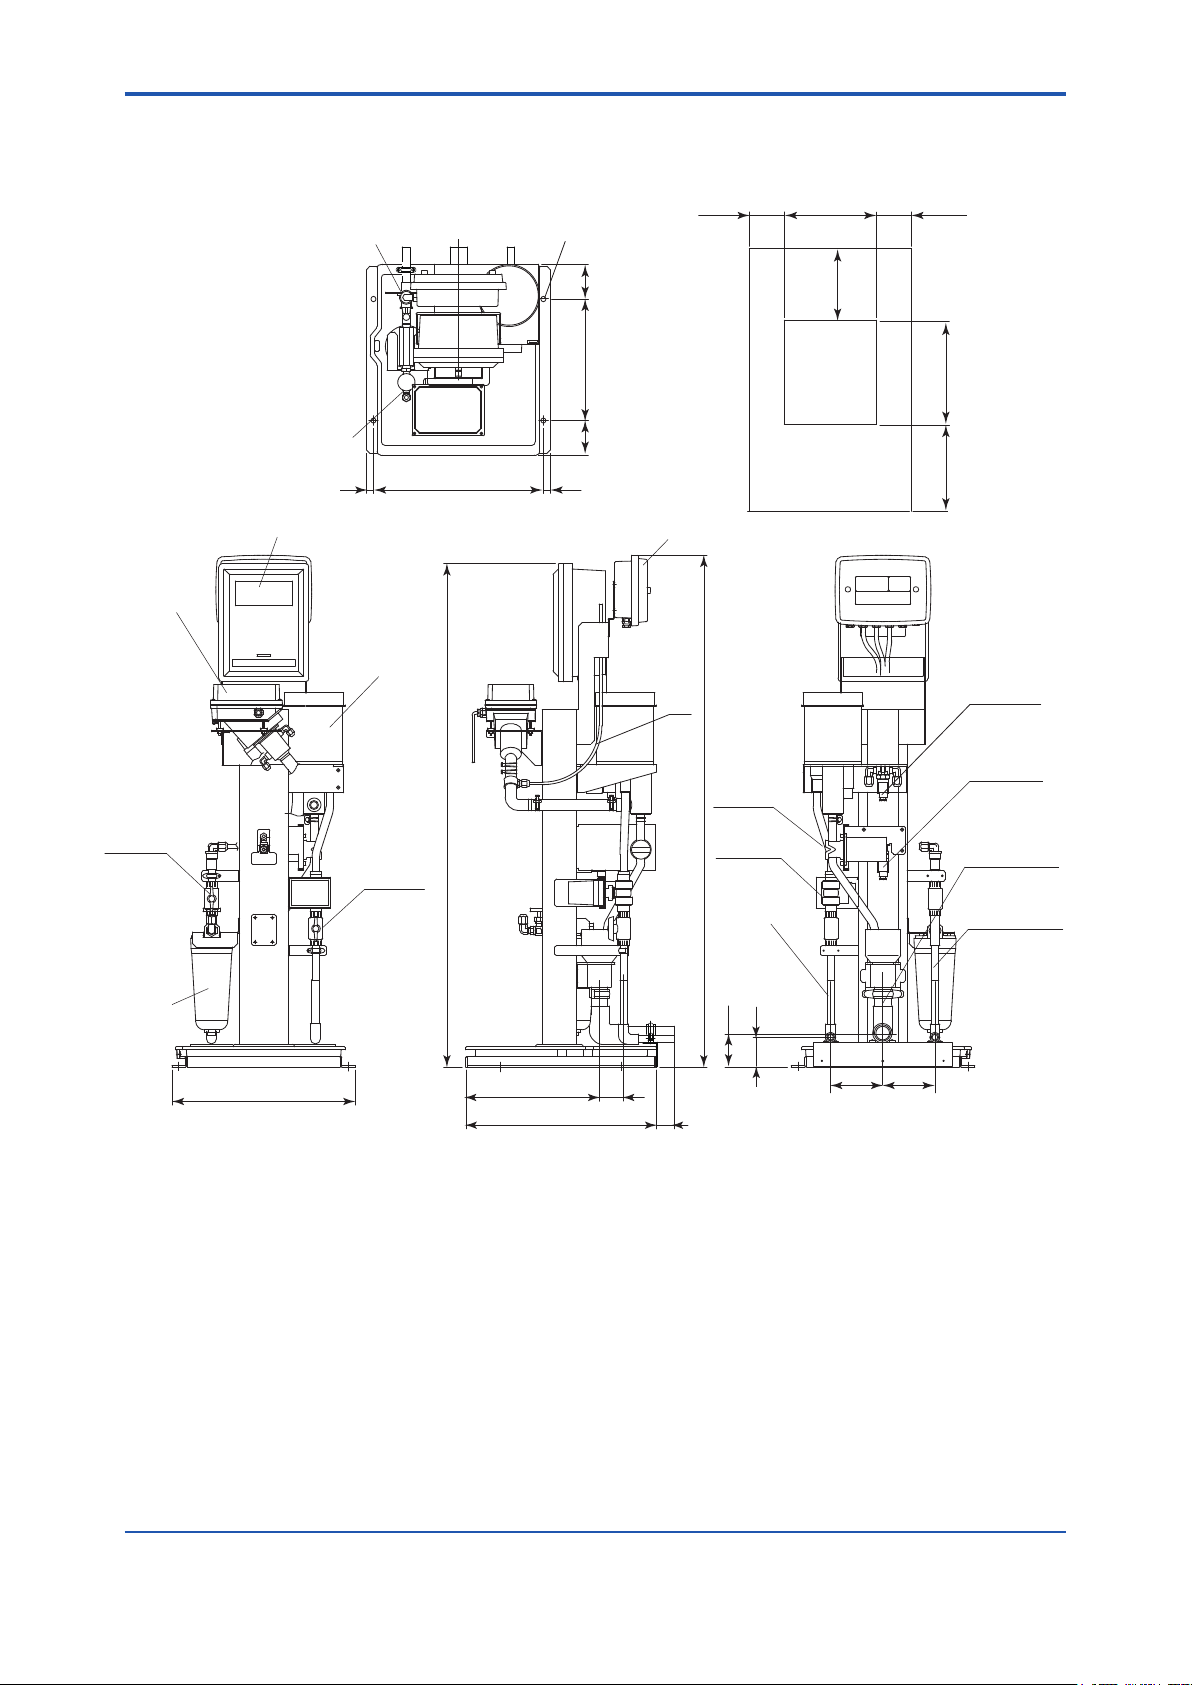
2.5.2 TB400G-¨-¨-A1
530
Manually operated
valve V2
4-ø15 Holes
for anchor bolts
Maintenance
space
2-9
Unit: mm
Approx. 200Approx. 200
Maintenance
space
Detector
Manually
operated
valve V4
Manually operated
valve V3
20
Converter
Head
tank
Manually
operated
valve V1
490
*1
1450
(100)
350100
)(20
Terminal box *2
*1
1475
Manually
operated
valve V5
Sample water
inlet
VP16 pipe
400
Approx.
Cabinet
Front
600
Maintenance
500
space
Approx.
Drainage port
VP40 pipe
Tap water inlet
VP16 pipe
Zero-turbidity
reference
filter
550
70
*1: Option code /L specified for bubble retardant.
*2: Option code /ARS specified for with arrester.
530
385
Figure 2.2.1 TB400G-¨-¨-A1(BottomPiping)ExternalDimensions
250
150
150150
Weight:Approx.50kg
IM 12E04A02-02E 9th Edition : Mar. 16, 2018-00
Page 21
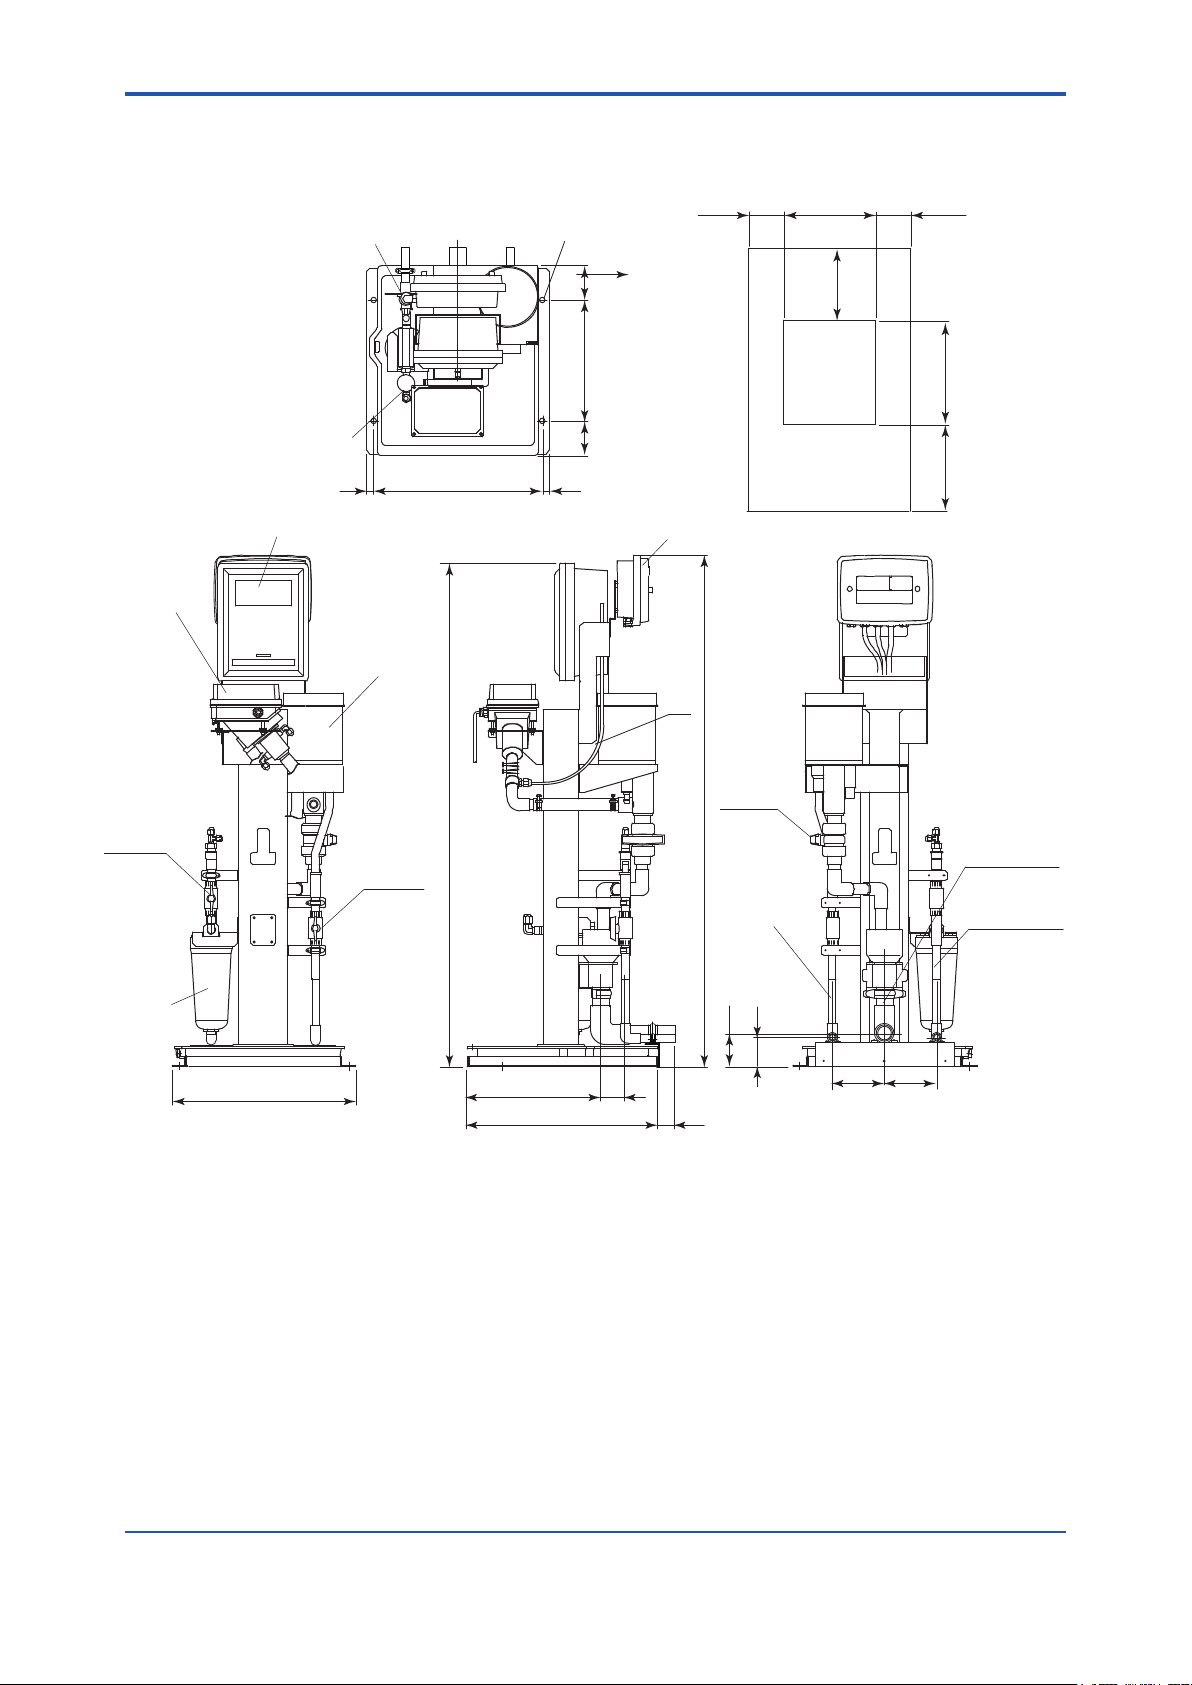
<2. SPECIFICATIONS>
530
Manually operated
valve V2
4-ø15 Holes
for anchor bolts
Maintenance
space
2-10
Unit: mm
Approx. 200Approx. 200
Maintenance
space
Detector
Manually
operated
valve V4
Manually operated
valve V3
20
Converter
Head
tank
Manually
operated
valve V1
490
*1
1450
(100)
350
100
)(20
Terminal box *2
*1
1475
Sample water
inlet
VP16 pipe
Manually
operated
valve V5
400
Approx.
Cabinet
Front
600
Maintenance
500
space
Approx.
Drainage port
VP40 pipe
Tap water inlet
VP16 pipe
Zero-turbidity
reference
filter
80
93
550
70
*1: Option code /L specified for bubble retardant.
*2: Option code /ARS specified for with arrester.
50
530
385
Figure 2.2.2 TB400G-¨-¨-A1/B(RearPiping)ExternalDimensions
150150
Weight:Approx.50kg
IM 12E04A02-02E 9th Edition : Mar. 16, 2018-00
Page 22

<2. SPECIFICATIONS>
2.5.3 TB400G-¨-¨-A2
530
Manually operated
valve V2
4-ø15 Holes
for anchor bolts
Maintenance
space
2-11
Unit: mm
Approx. 200Approx. 200
Maintenance
space
Detector
Manually
operated
valve V4
Manually operated
valve V3
20
Converter
Head
tank
Manually
operated
valve V1
490
1450
*1
(100)
350
100
)(20
Terminal box *2
*1
1475
Sample water
inlet
VP16 pipe
Pinch valve
SV1
400
Approx.
Cabinet
Front
600
Maintenance
500
space
Approx.
Solenoid
valve SV2
Drainage port
VP40 pipe
Tap water inlet
VP16 pipe
Zero-turbidity
reference
filter
550
70385
*1: Option code /L specified for bubble retardant.
*2: Option code /ARS specified for with arrester.
530
Figure 2.3.1 TB400G-¨-¨-A2(BottomPiping)ExternalDimensions
250
150
150150
Weight:Approx.50kg
IM 12E04A02-02E 9th Edition : Mar. 16, 2018-00
Page 23

<2. SPECIFICATIONS>
530
Manually operated
valve V2
4-ø15 Holes
for anchor bolts
Maintenance
space
2-12
Unit: mm
Approx. 200Approx. 200
Maintenance
space
Detector
Manually
operated
valve V4
Manually operated
valve V3
20
Converter
Head
tank
Manually
operated
valve V1
490
*1
1450
(100)
350
100
)(20
Terminal box *2
*1
1475
Sample water
inlet
VP16 pipe
Pinch valve
SV1
400
Approx.
Cabinet
Front
600
Maintenance
500
space
Approx.
Solenoid
valve SV2
Drainage port
VP40 pipe
Tap water inlet
VP16 pipe
Zero-turbidity
reference
filter
93
550
70385
*1: Option code /L specified for bubble retardant.
50
*2: Option code /ARS specified for with arrester.
530
Figure 2.3.2 TB400G-¨-¨-A2/B(RearPiping)ExternalDimensions
80
150150
Weight:Approx.50kg
IM 12E04A02-02E 9th Edition : Mar. 16, 2018-00
Page 24
<2. SPECIFICATIONS>
2.5.4 TB400G-¨-¨-A3
530
Manually operated
valve V2
4-ø15 Holes
for anchor bolts
Maintenance
space
2-13
Unit: mm
Approx. 200Approx. 200
Maintenance
space
Detector
Manually
operated
valve V4
Manually operated
valve V3
20
Converter
Head
tank
Manually
operated
valve V1
490
1450
*1
(100)
350
100
)(20
Terminal box *2
*1
Pinch valve
SV1
1475
Sample water
inlet
VP16 pipe
Solenoid
valve SV3
400
Approx.
Cabinet
Front
600
Maintenance
500
space
Approx.
Solenoid
valve SV4
Solenoid
valve SV2
Drainage port
VP40 pipe
Tap water inlet
VP16 pipe
Zero-turbidity
reference
filter
550
70
*1: Option code /L specified for bubble retardant.
*2: Option code /ARS specified for with arrester.
530
385
Figure 2.4.1 TB400G-¨-¨-A3(BottomPiping)ExternalDimensions
250
150
150150
Weight:Approx.50kg
IM 12E04A02-02E 9th Edition : Mar. 16, 2018-00
Page 25
<2. SPECIFICATIONS>
530
Manually operated
valve V2
4-ø15 Holes
for anchor bolts
Maintenance
space
2-14
Unit: mm
Approx. 200Approx. 200
Maintenance
space
Detector
Manually
operated
valve V4
Manually operated
valve V3
20
Converter
Head
tank
Manually
operated
valve V1
490
*1
1450
(100)
350
100
)(20
Terminal box *2
*1
Pinch valve
SV1
1475
Solenoid
valve SV3
Sample water
inlet
VP16 pipe
400
Approx.
Cabinet
Front
600
Maintenance
500
space
Approx.
Solenoid
valve SV4
Solenoid
valve SV2
Drainage port
VP40 pipe
Tap water inlet
VP16 pipe
Zero-turbidity
reference
filter
80
93
550
70
*1: Option code /L specified for bubble retardant.
*2: Option code /ARS specified for with arrester.
50
530
385
Figure 2.4.2 TB400G-¨-¨-A3/B(RearPiping)ExternalDimensions
150150
Weight:Approx.50kg
IM 12E04A02-02E 9th Edition : Mar. 16, 2018-00
Page 26
<2. SPECIFICATIONS>
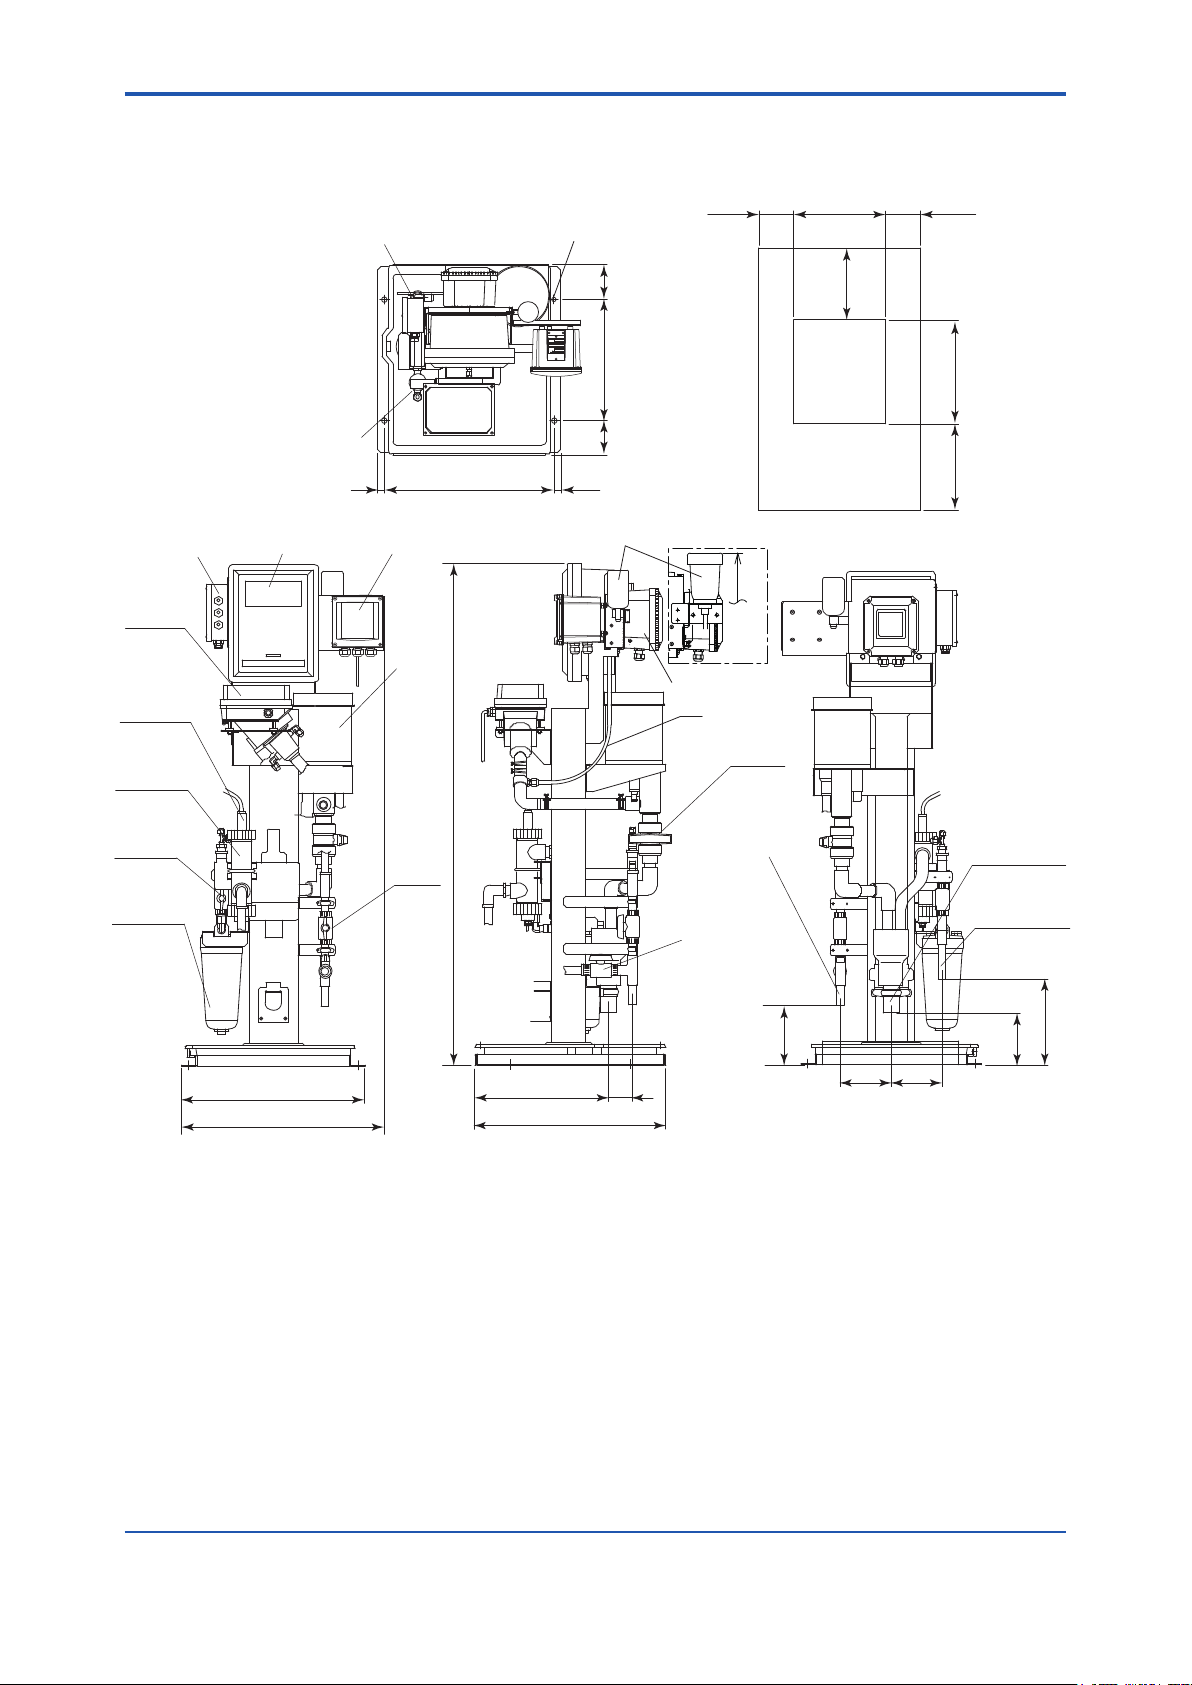
2.5.5 TB400G-¨-¨-A1/PHU5
530
Manually operated
valve V2
4-ø15 Holes
for anchor bolts
Maintenance
space
2-15
Unit: mm
Approx. 200Approx. 200
Maintenance
space
Terminal box
Turbidity
detector
pH sensor
Flow-through
type holder
Manually
operated
valve V4
Zero-turbidity
reference filter
Manually operated
valve V3
Turbidity converter
pH converter
Head
tank
1450
Manually
operated
valve V1
(100)
350
100
490 (20)20
KCl tank
*1
Option code /TT3
Approx. 1487
Ultrasonic oscillator
*1
Manually
operated
valve V5
Sample water inlet
VP16 pipe
Manually
operated
valve V6
400
Approx.
Cabinet
Front
600
Maintenance
500
space
Approx.
Drainage port
VP40 pipe
Tap water inlet
VP16 pipe
173.5
530
587
70385
550
*1: Option code /L specified for bubble retardant.
Figure 2.5.1 TB400G-¨-¨-A1/PHU5(BottomPiping)ExternalDimensions
IM 12E04A02-02E 9th Edition : Mar. 16, 2018-00
250
150
150150
Weight:Approx.60kg
Page 27
<2. SPECIFICATIONS>
530
Manually operated
valve V2
4-ø15 Holes
for anchor bolts
Maintenance
space
2-16
Unit: mm
Approx. 200Approx. 200
Maintenance
space
Terminal box
Turbidity
detector
pH sensor
Flow-through
type holder
Manually
operated
valve V4
Zero-turbidity
reference filter
Manually operated
valve V3
Turbidity converter
pH converter
Head
tank
1450
Manually
operated
valve V1
(100)
350
100
490 (20)20
KCl tank
*1
Option code /TT3
Approx. 1487
Ultrasonic oscillator
*1
Manually
operated
valve V5
Sample water inlet
VP16 pipe
Manually
operated
valve V6
400
Approx.
Cabinet
Front
600
Maintenance
500
space
Approx.
Drainage port
VP40 pipe
Tap water inlet
VP16 pipe
80
93
550
70385
50
*1: Option code /L specified for bubble retardant.
530
587
Figure 2.5.2 TB400G-¨-¨-A1/PHU5/B(RearPiping)ExternalDimensions
IM 12E04A02-02E 9th Edition : Mar. 16, 2018-00
150150
Weight:Approx.60kg
Page 28
<2. SPECIFICATIONS>
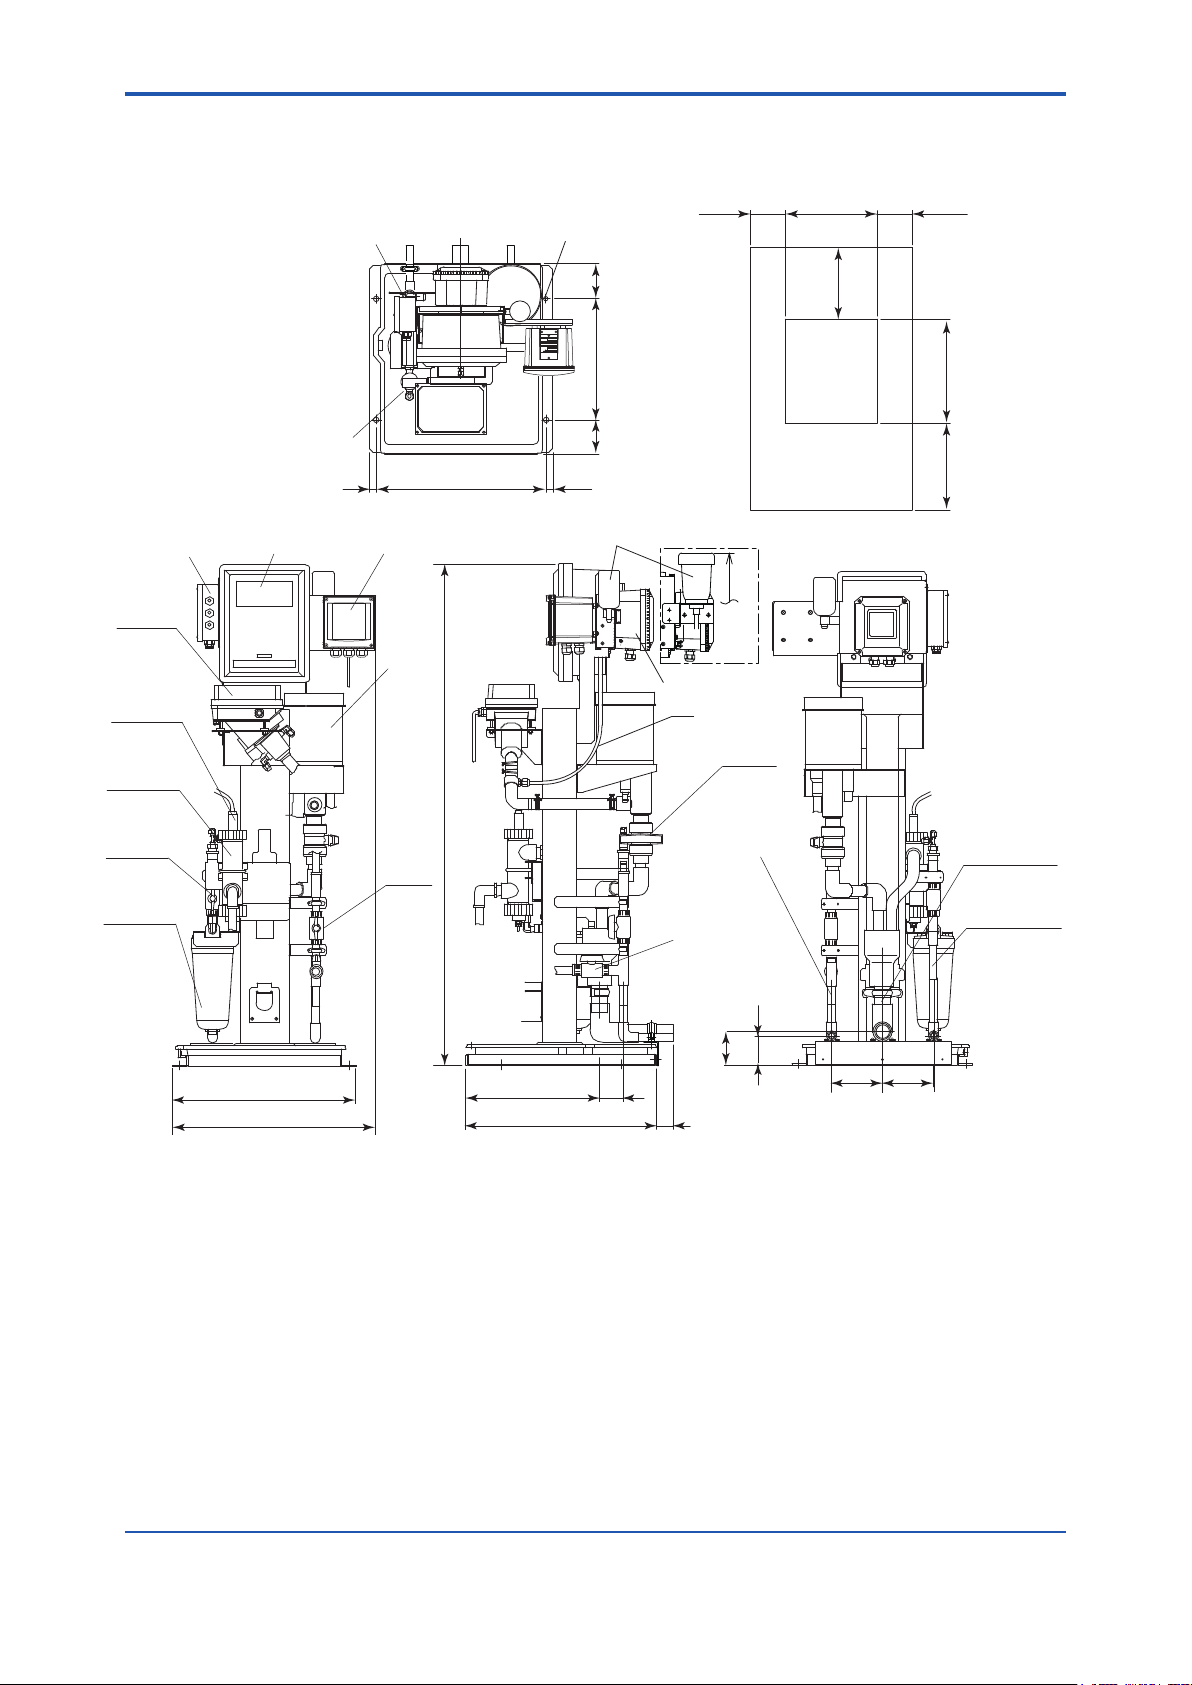
2.5.6 TB400G-¨-¨-A2/PHU5
530
Manually operated
valve V2
4-ø15 Holes
for anchor bolts
Maintenance
space
2-17
Unit: mm
Approx. 200Approx. 200
Maintenance
space
Terminal box
Turbidity
detector
pH sensor
Flow-through
type holder
Manually
operated
valve V4
Zero-turbidity
reference filter
Manually operated
valve V3
Turbidity converter
pH converter
Head
tank
Manually
operated
valve V1
490 (20)20
1450
*1
(100)
350
100
KCl tank
Option code /TT3
Approx. 1487
Ultrasonic oscillator
*1
Pinch valve
SV1
Manually
operated
valve V6
Sample water inlet
VP16 pipe
400
Approx.
Cabinet
Front
600
Maintenance
500
space
Approx.
Solenoid
valve SV2
Drainage port
VP40 pipe
Tap water inlet
VP16 pipe
173.5
530
587
385
70
550
*1: Option code /L specified for bubble retardant.
Figure 2.6.1 TB400G-¨-¨-A2/PHU5(BottomPiping)ExternalDimensions
IM 12E04A02-02E 9th Edition : Mar. 16, 2018-00
250
150
150150
Weight:Approx.60kg
Page 29
<2. SPECIFICATIONS>
530
Manually operated
valve V2
4-ø15 Holes
for anchor bolts
Maintenance
space
2-18
Unit: mm
Approx. 200Approx. 200
Maintenance
space
Terminal box
Turbidity
detector
pH sensor
Flow-through
type holder
Manually
operated
valve V4
Zero-turbidity
reference filter
Manually operated
valve V3
Turbidity converter
pH converter
Head
tank
Manually
operated
valve V1
490 (20)20
1450
*1
(100)
350
100
KCl tank
Option code /TT3
Approx. 1487
Ultrasonic oscillator
*1
Pinch valve
SV1
Manually
operated
valve V6
Sample water inlet
VP16 pipe
400
Approx.
Cabinet
Front
600
Maintenance
500
space
Approx.
Solenoid
valve SV2
Drainage port
VP40 pipe
Tap water inlet
VP16 pipe
80
93
550
70
50
*1: Option code /L specified for bubble retardant.
530
587
385
Figure 2.6.2 TB400G-¨-¨-A2/PHU5/B(RearPiping)ExternalDimensions
IM 12E04A02-02E 9th Edition : Mar. 16, 2018-00
150150
Weight:Approx.60kg
Page 30

<2. SPECIFICATIONS>
2.5.7 TB400G-¨-¨-A3/PHU5
530
Manually operated
valve V2
4-ø15 Holes
for anchor bolts
Maintenance
space
2-19
Unit: mm
Approx. 200Approx. 200
Maintenance
space
Terminal box
Turbidity
detector
pH sensor
Flow-through
type holder
Manually
operated
valve V4
Zero-turbidity
reference filter
Manually operated
valve V3
Turbidity converter
pH converter
Head
tank
Manually
operated
valve V1
490 (20)20
1450
*1
(100)
350
100
KCl tank
Option code /TT3
Approx. 1487
Ultrasonic oscillator
*1
Pinch valve
SV1
Solenoid
valve SV3
Manually
operated
valve V6
Sample water inlet
VP16 pipe
400
Approx.
Cabinet
Front
600
Maintenance
500
space
Approx.
Solenoid
valve SV4
Solenoid
valve SV2
Drainage port
VP40 pipe
Tap water inlet
VP16 pipe
173.5
530
385
587
70
550
*1: Option code /L specified for bubble retardant.
Figure 2.7.1 TB400G-¨-¨-A3/PHU5(BottomPiping)ExternalDimensions
IM 12E04A02-02E 9th Edition : Mar. 16, 2018-00
250
150
150150
Weight:Approx.60kg
Page 31

<2. SPECIFICATIONS>
530
Manually operated
valve V2
4-ø15 Holes
for anchor bolts
Maintenance
space
2-20
Unit: mm
Approx. 200Approx. 200
Maintenance
space
Terminal box
Turbidity
detector
pH sensor
Flow-through
type holder
Manually
operated
valve V4
Zero-turbidity
reference filter
Manually operated
valve V3
Turbidity converter
20
pH converter
Head
tank
Manually
operated
valve V1
490
1450
*1
(100)
350100
)(20
KCl tank
Option code /TT3
Approx. 1487
Ultrasonic oscillator
*1
Pinch valve
SV1
Solenoid
valve SV3
Manually
operated
valve V6
Sample water inlet
VP16 pipe
400
Approx.
Cabinet
Front
600
Maintenance
500
space
Approx.
Solenoid
valve SV4
Solenoid
valve SV2
Drainage port
VP40 pipe
Tap water inlet
VP16 pipe
80
93
550
70
*1: Option code /L specified for bubble retardant.
50
530
587
385
Figure 2.7.2 TB400G-¨-¨-A3/PHU5/B(RearPiping)ExternalDimensions
IM 12E04A02-02E 9th Edition : Mar. 16, 2018-00
150150
Weight:Approx.60kg
Page 32

<2. SPECIFICATIONS>
2.5.18 TB400G-¨-¨-A1/PHN5
530
400
Approx.
Manually operated
valve V2
4-ø15 Holes
for anchor bolts
)(100
Maintenance
space
2-21
Unit: mm
Approx. 200Approx. 200
Maintenance
space
Terminal box
Turbidity
detector
pH sensor
Flow-through
type holder
Manually
operated
valve V4
Zero-turbidity
reference filter
Manually operated
valve V3
Turbidity converter
20
pH converter
Manually
operated
valve V1
Head
tank
490
1450
*1
350
100
)(20
KCl tank
Option code /TT3
Approx. 1487
*1
Manually
operated
valve V5
Manually
operated
valve V6
Sample water inlet
VP16 pipe
Cabinet
Front
600
Maintenance
500
space
Approx.
Drainage port
VP40 pipe
Tap water inlet
VP16 pipe
173.5
530
587
385
70
550
*1: Option code /L specified for bubble retardant.
Figure 2.8.1 TB400G-¨-¨-A1/PHN5(BottomPiping)ExternalDimensions
IM 12E04A02-02E 9th Edition : Mar. 16, 2018-00
250
150
150150
Weight:Approx.56kg
Page 33

<2. SPECIFICATIONS>
530
400
Approx.
Manually operated
valve V2
4-ø15 Holes
for anchor bolts
)(100
Maintenance
space
2-22
Unit: mm
Approx. 200Approx. 200
Maintenance
space
Terminal box
Turbidity
detector
pH sensor
Flow-through
type holder
Manually
operated
valve V4
Zero-turbidity
reference filter
Manually operated
valve V3
Turbidity converter
20
pH converter
Manually
operated
valve V1
Head
tank
490
1450
*1
350
100
)(20
KCl tank
Option code /TT3
Approx. 1487
*1
Manually
operated
valve V5
Manually
operated
valve V6
Sample water inlet
VP16 pipe
Cabinet
Front
600
Maintenance
500
space
Approx.
Drainage port
VP40 pipe
Tap water inlet
VP16 pipe
80
93
550
70
*1: Option code /L specified for bubble retardant.
50
530
587
385
Figure 2.8.2 TB400G-¨-¨-A1/PHN5/B(RearPiping)ExternalDimensions
IM 12E04A02-02E 9th Edition : Mar. 16, 2018-00
150150
Weight:Approx.56kg
Page 34

<2. SPECIFICATIONS>
2.5.9 TB400G-¨-¨-A2/PHN5
530
400
Approx.
Manually operated
valve V2
4-ø15 Holes
for anchor bolts
Maintenance
space
2-23
Unit: mm
Approx. 200Approx. 200
Maintenance
space
Terminal box
Turbidity
detector
pH sensor
Flow-through
type holder
Manually
operated
valve V4
Zero-turbidity
reference filter
Manually operated
valve V3
Turbidity converter
pH converter
Head
tank
Manually
operated
valve V1
490
1450
*1
350 )(100100
)(2020
KCl tank
Option code /TT3
Approx. 1487
*1
Pinch valve
SV1
Manually
operated
valve V6
Sample water inlet
VP16 pipe
Cabinet
Front
600
Maintenance
500
space
Approx.
Solenoid
valve SV2
Drainage port
VP40 pipe
Tap water inlet
VP16 pipe
173.5
530
587
385
70
550
*1: Option code /L specified for bubble retardant.
Figure 2.9.1 TB400G-¨-¨-A2/PHN5(BottomPiping)ExternalDimensions
IM 12E04A02-02E 9th Edition : Mar. 16, 2018-00
250
150
150150
Weight:Approx.56kg
Page 35

<2. SPECIFICATIONS>
530
400
Approx.
Manually operated
valve V2
4-ø15 Holes
for anchor bolts
Maintenance
space
2-24
Unit: mm
Approx. 200Approx. 200
Maintenance
space
Terminal box
Turbidity
detector
pH sensor
Flow-through
type holder
Manually
operated
valve V4
Zero-turbidity
reference filter
Manually operated
valve V3
Turbidity converter
pH converter
Head
tank
Manually
operated
valve V1
490
1450
*1
350 )(100100
)(2020
KCl tank
Option code /TT3
Approx. 1487
*1
Pinch valve
SV1
Manually
operated
valve V6
Sample water inlet
VP16 pipe
Cabinet
Front
600
Maintenance
500
space
Approx.
Solenoid
valve SV2
Drainage port
VP40 pipe
Tap water inlet
VP16 pipe
80
93
550
70
*1: Option code /L specified for bubble retardant.
50
530
587
385
Figure 2.9.2 TB400G-¨-¨-A2/PHN5/B(RearPiping)ExternalDimensions
IM 12E04A02-02E 9th Edition : Mar. 16, 2018-00
150150
Weight:Approx.56kg
Page 36

<2. SPECIFICATIONS>
2.5.10 TB400G-¨-¨-A3/PHN5
530
400
Approx.
Manually operated
valve V2
4-ø15 Holes
for anchor bolts
)(100
Maintenance
space
2-25
Unit: mm
Approx. 200Approx. 200
Maintenance
space
Terminal box
Turbidity
detector
pH sensor
Flow-through
type holder
Manually
operated
valve V4
Zero-turbidity
reference filter
Manually operated
valve V3
Turbidity converter
20
pH converter
Head
tank
Manually
operated
valve V1
490
1450
*1
350
100
)(20
KCl tank
Option code /TT3
Approx. 1487
*1
Pinch valve
SV1
Solenoid
valve SV3
Manually
operated
valve V6
Sample water inlet
VP16 pipe
Cabinet
Front
600
Maintenance
500
space
Approx.
Solenoid
valve SV4
Solenoid
valve SV2
Drainage port
VP40 pipe
Tap water inlet
VP16 pipe
173.5
530
385
587
70
550
*1: Option code /L specified for bubble retardant.
Figure 2.10.1 TB400G-¨-¨-A3/PHN5(BottomPiping)ExternalDimensions
IM 12E04A02-02E 9th Edition : Mar. 16, 2018-00
250
150
150150
Weight:Approx.56kg
Page 37

<2. SPECIFICATIONS>
530
400
Approx.
Manually operated
valve V2
4-ø15 Holes
for anchor bolts
)(100
Maintenance
space
2-26
Unit: mm
Approx. 200Approx. 200
Maintenance
space
Terminal box
Turbidity
detector
pH sensor
Flow-through
type holder
Manually
operated
valve V4
Zero-turbidity
reference filter
Manually operated
valve V3
Turbidity converter
20
pH converter
Head
tank
Manually
operated
valve V1
490
1450
*1
350
100
)(20
KCl tank
Option code /TT3
Approx. 1487
*1
Pinch valve
SV1
Solenoid
valve SV3
Manually
operated
valve V6
Sample water inlet
VP16 pipe
Cabinet
Front
600
Maintenance
500
space
Approx.
Solenoid
valve SV4
Solenoid
valve SV2
Drainage port
VP40 pipe
Tap water inlet
VP16 pipe
80
93
550
70
*1: Option code /L specified for bubble retardant.
50
530
587
385
Figure 2.10.2 TB400G-¨-¨-A3/PHN5/B(RearPiping)ExternalDimensions
IM 12E04A02-02E 9th Edition : Mar. 16, 2018-00
150150
Weight:Approx.56kg
Page 38

<2. SPECIFICATIONS>
2.5.11 TB400G-¨-¨-A1/FC
530
Manually operated
valve V2
4-ø15 Holes
for anchor bolts
Maintenance
space
2-27
Unit: mm
Approx. 200Approx. 200
Maintenance
space
Terminal box
Turbidity
detector
FC400G
(detector)
Manually
operated
valve V4
Manually
operated
valve V7
Manually operated
valve V3
Turbidity converter
20
FC400G(converter)
Head
tank
Manually
operated
valve V1
490 (20)
*1
1450
(100)
350
100
*1
Manually
operated
valve V5
Manually
operated
valve V6
Sample water inlet
VP16 pipe
400
Approx.
Cabinet
Front
600
Maintenance
500
space
Approx.
Drainage port
VP40 pipe
Tap water inlet
VP16 pipe
Zero-turbidity
reference
filter
173.5
530
587
70385
550
*1: Option code /L specified for bubble retardant.
Figure 2.11.1 TB400G-¨-¨-A1/FC(BottomPiping)ExternalDimensions
IM 12E04A02-02E 9th Edition : Mar. 16, 2018-00
250
150
150150
Weight:Approx.56kg
Page 39

<2. SPECIFICATIONS>
530
Manually operated
valve V2
4-ø15 Holes
for anchor bolts
Maintenance
space
2-28
Unit: mm
Approx. 200Approx. 200
Maintenance
space
Terminal box
Turbidity
detector
FC400G
(detector)
Manually
operated
valve V4
Manually
operated
valve V7
Manually operated
valve V3
Turbidity converter
20
FC400G(converter)
Head
tank
Manually
operated
valve V1
490 (20)
*1
1450
(100)
350
100
*1
Manually
operated
valve V5
Manually
operated
valve V6
Sample water inlet
VP16 pipe
400
Approx.
Cabinet
Front
600
Maintenance
500
space
Approx.
Drainage port
VP40 pipe
Tap water inlet
VP16 pipe
Zero-turbidity
reference
filter
80
93
550
70385
*1: Option code /L specified for bubble retardant.
50
530
587
Figure 2.11.2 TB400G-¨-¨-A1/FC/B(RearPiping)ExternalDimensions
150150
Weight:Approx.56kg
IM 12E04A02-02E 9th Edition : Mar. 16, 2018-00
Page 40

<2. SPECIFICATIONS>
2.5.12 TB400G-¨-¨-A2/FC
530
Manually operated
valve V2
4-ø15 Holes
for anchor bolts
Maintenance
space
2-29
Unit: mm
Approx. 200Approx. 200
Maintenance
space
Terminal box
Turbidity
detector
FC400G
(detector)
Manually
operated
valve V4
Manually
operated
valve V7
Manually operated
valve V3
Turbidity converter
20
FC400G(converter)
Head
tank
1450
Manually
operated
valve V1
490
*1
(20)
(100)
350
100
*1
Pinch valve
SV1
Manually
operated
valve V6
Sample water inlet
VP16 pipe
400
Approx.
Cabinet
Front
600
Maintenance
500
space
Approx.
Solenoid
valve SV2
Drainage port
VP40 pipe
Tap water inlet
VP16 pipe
Zero-turbidity
reference
filter
173.5
530
587
385
70
550
*1: Option code /L specified for bubble retardant.
Figure 2.12.1 TB400G-¨-¨-A2/FC(BottomPiping)ExternalDimensions
IM 12E04A02-02E 9th Edition : Mar. 16, 2018-00
150
150
Weight:Approx.56kg
150
250
Page 41

<2. SPECIFICATIONS>
530
Manually operated
valve V2
4-ø15 Holes
for anchor bolts
Maintenance
space
2-30
Unit: mm
Approx. 200Approx. 200
Maintenance
space
Terminal box
Turbidity
detector
FC400G
(detector)
Manually
operated
valve V4
Manually
operated
valve V7
Manually operated
valve V3
Turbidity converter
20
FC400G(converter)
Head
tank
1450
Manually
operated
valve V1
490
*1
(20)
(100)
350
100
*1
Pinch valve
SV1
Manually
operated
valve V6
Sample water inlet
VP16 pipe
400
Approx.
Cabinet
Front
600
Maintenance
500
space
Approx.
Solenoid
valve SV2
Drainage port
VP40 pipe
Tap water inlet
VP16 pipe
Zero-turbidity
reference
filter
93
80
530
587
385
550
70
*1: Option code /L specified for bubble retardant.
50
Figure 2.12.2 TB400G-¨-¨-A2/FC/B(RearPiping)ExternalDimensions
150
150
Weight:Approx.56kg
IM 12E04A02-02E 9th Edition : Mar. 16, 2018-00
Page 42

<2. SPECIFICATIONS>
2.5.13 TB400G-¨-¨-A3/FC
530
Manually operated
valve V2
4-ø15 Holes
for anchor bolts
Maintenance
space
2-31
Unit: mm
Approx. 200Approx. 200
Maintenance
space
Terminal box
Turbidity
detector
FC400G
(detector)
Manually
operated
valve V4
Manually
operated
valve V7
Manually operated
valve V3
Turbidity converter
20
FC400G(converter)
Head
tank
Manually
operated
valve V1
490 (20)
*1
1450
(100)
350
100
*1
Pinch valve
SV1
Solenoid
valve SV3
Manually
operated
valve V6
Sample water inlet
VP16 pipe
400
Approx.
Cabinet
Front
600
Maintenance
500
space
Approx.
Solenoid
valve SV4
Solenoid
valve SV2
Drainage port
VP40 pipe
Tap water inlet
VP16 pipe
Zero-turbidity
reference
filter
173.5
530
587
550
70385
*1: Option code /L specified for bubble retardant.
Figure 2.13.1 TB400G-¨-¨-A3/FC(BottomPiping)ExternalDimensions
IM 12E04A02-02E 9th Edition : Mar. 16, 2018-00
250
150
150150
Weight:Approx.56kg
Page 43

<2. SPECIFICATIONS>
530
Manually operated
valve V2
4-ø15 Holes
for anchor bolts
Maintenance
space
2-32
Unit: mm
Approx. 200Approx. 200
Maintenance
space
Terminal box
Turbidity
detector
FC400G
(detector)
Manually
operated
valve V4
Manually
operated
valve V7
Manually operated
valve V3
Turbidity converter
20
FC400G(converter)
Head
tank
Manually
operated
valve V1
490 (20)
*1
1450
(100)
350100
*1
Pinch valve
SV1
Solenoid
valve SV3
Manually
operated
valve V6
Sample water inlet
VP16 pipe
400
Approx.
Cabinet
Front
600
Maintenance
500
space
Approx.
Solenoid
valve SV4
Solenoid
valve SV2
Drainage port
VP40 pipe
Tap water inlet
VP16 pipe
Zero-turbidity
reference
filter
93
80
530
587
550
70385
*1: Option code /L specified for bubble retardant.
50
Figure 2.13.2 TB400G-¨-¨-A3/FC/B(RearPiping)ExternalDimensions
150150
Weight:Approx.56kg
IM 12E04A02-02E 9th Edition : Mar. 16, 2018-00
Page 44

<2. SPECIFICATIONS>
2.6 Piping System Diagrams
2.6.1 TB400G-¨-¨-A1
2-33
Water sample (VP16)
Manually operated valve V1
Tap water (VP16) *2
Manually
operated
valve V2
Zero-turbidity reference filter
Manually
operated valve V4
Head tank
Manually
operated
valve V5
Manually
operated
valve V3
Detector
Drain (VP40)
*1: Option Code /L (For bubble retardant)
*2: Reverse flow of tap water should be prevented using with a check valve on the supply line of tap water.
Figure 2.14 TB400G-¨-¨-A1 Piping Diagram
*1
PVC tray
F0214.ai
2.6.2 TB400G-¨-¨-A2
Water sample (VP16)
Manually operated valve V1
Tap water (VP16) *2
Manually
operated
valve V2
Zero-turbidity reference filter
Manually operated
valve V4
Drain (VP40)
*1: Option Code /L (For bubble retardant)
*2: Reverse flow of tap water should be prevented using with a check valve on the supply line of tap water.
Figure 2.15 TB400G-¨-¨-A2 Piping Diagram
Manually
operated
valve V3
Head tank
Pinch valve
SV1
Detector
*1
Solenoid valve
SV2
PVC tray
F0215.ai
IM 12E04A02-02E 9th Edition : Mar. 16, 2018-00
Page 45

<2. SPECIFICATIONS>
2.6.3 TB400G-¨-¨-A3
2-34
Water sample (VP16)
Tap water (VP16) *2
Motor-operated
valve SV3
Manually operated valve V1
Manually
operated
valve V2
Zero-turbidity reference filter
Manually operated
valve V4
Manually
operated
valve V3
Head tank
M
Pinch valve
SV1
Solenoid valve
SV4
Detector
Drain (VP40)
*1: Option Code /L (For bubble retardant)
*2: Reverse flow of tap water should be prevented using with a check valve on the supply line of tap water.
Figure 2.16 TB400G-¨-¨-A3 Piping Diagram
*1
Solenoid valve
SV2
PVC tray
F0216.ai
2.6.4 TB400G-¨-¨-A1/PHU5, /PHN5
Head tank
Water sample (VP16)
Manually
operated
Tap water (VP16) *2
operated valve
valve V1
Manually
operated
valve V6
Manually
operated
valve V2
Zero-turbidity reference filter
Manually
pH sensor
V4
Manually
operated
valve V3
Manually
operated
valve V5
Drain (VP40)
*1: Option Code /L (For bubble retardant)
*2: Reverse flow of tap water should be prevented using with a check valve on the supply line of tap water.
Figure 2.17 TB400G-¨-¨-A1/PHU5, /PHN5 Piping Diagram
Detector
*1
PVC tray
F0217.ai
IM 12E04A02-02E 9th Edition : Mar. 16, 2018-00
Page 46

<2. SPECIFICATIONS>
2.6.5 TB400G-¨-¨-A2/PHU5, /PHN5
2-35
Head tank
Detector
Water sample (VP16)
Tap water (VP16) *2
Manually
operated
valve V1
Manually
operated
valve V6
Manually
operated
valve V2
Zero-turbidity reference filter
Manually operated
valve V4
pH sensor
Manually
valve V3
Pinch valve
SV1
operated
Drain (VP40)
*1: Option Code /L (For bubble retardant)
*2: Reverse flow of tap water should be prevented using with a check valve on the supply line of tap water.
Figure 2.18 TB400G-¨-¨-A2/PHU5, /PHN5 Piping Diagram
*1
Solenoid valve
SV2
PVC tray
F0218.ai
2.6.6 TB400G-¨-¨-A3/PHU5, /PHN5
Water sample (VP16)
Tap water (VP16) *2
Drain (VP40)
Motor-operated
valve SV3
Manually
operated
valve V1
Manually
operated
valve V6
Manually
operated
valve V2
Zero-turbidity reference filter
Manually operated
valve V4
pH sensor
Manually
valve V3
operated
M
Pinch valve
Solenoid valve
Head tank
SV1
SV4
Detector
*1
Solenoid valve
SV2
PVC tray
*1: Option Code /L (For bubble retardant)
*2: Reverse flow of tap water should be prevented using with a check valve on the supply line of tap water.
Figure 2.19 TB400G-¨-¨-A3/PHU5, /PHN5 Piping Diagram
IM 12E04A02-02E 9th Edition : Mar. 16, 2018-00
F0219.ai
Page 47

<2. SPECIFICATIONS>
2.6.7 TB400G-¨-¨-A1/FC
2-36
Free available chlorine
analyzer detector
Needle valve
Head tank
Turbidity
detector
V7
Water sample (VP16)
Tap water (VP16) *2
operated valve V4
Manually
operated
valve V1
Manually
operated
valve V6
Manually
operated
valve V2
Zero-turbidity reference filter
Manually
Manually
operated
valve V5
Manually
operated
valve V3
Drain (VP40)
*1: Option Code /L (For bubble retardant)
*2: Reverse flow of tap water should be prevented using with a check valve on the supply line of tap water.
Figure 2.20 TB400G-¨-¨-A1/FC Piping Diagram
*1
PVC tray
F0220.ai
2.6.8 TB400G-¨-¨-A2/FC
Free available chlorine
analyzer detector
Needle valve
V7
Water sample (VP16)
Tap water (VP16) *2
Drain (VP40)
*1: Option Code /L (For bubble retardant)
*2: Reverse flow of tap water should be prevented using with a check valve on the supply line of tap water.
Manually
operated
valve V1
Manually
operated
valve V6
Manually
operated
valve V2
Zero-turbidity reference filter
Manually operated
valve V4
Manually
operated
valve V3
Head tank
Pinch valve
SV1
Turbidity
detector
*1
Solenoid valve
SV2
PVC tray
F0221.ai
Figure 2.21 TB400G-¨-¨-A2/FC Piping Diagram
IM 12E04A02-02E 9th Edition : Mar. 16, 2018-00
Page 48

<2. SPECIFICATIONS>
2.6.9 TB400G-¨-¨-A3/FC
2-37
Free available chlorine
analyzer detector
Needle valve
Head tank
Turbidity
detector
V7
Motor-
M
Water sample (VP16)
Tap water (VP16) *2
Manually
operated
valve V1
Manually
operated
valve V6
Manually
operated
valve V2
Zero-turbidity reference filter
valve V4
Manually
operated
valve V3
operated
valve SV3
Pinch valve
SV1
Solenoid valve
SV4
Drain (VP40)
*1: Option Code /L (For bubble retardant)
*2: Reverse flow of tap water should be prevented using with a check valve on the supply line of tap water.
Figure 2.22 TB400G-¨-¨-A3/FC Piping Diagram
*1
Solenoid valve
SV2
PVC trayManually operated
F0222.ai
IM 12E04A02-02E 9th Edition : Mar. 16, 2018-00
Page 49

<2. SPECIFICATIONS>
2.7 Internal Wiring Diagram
Figure 2.23 shows the internal wiring diagram of the turbidimeter with a sampling system. For
external wiring, see Section 3.3.
If the detector and the converter are to be delivered as separate units, a dedicated cable is
shipped connected to the detector.
2-38
Detector Dedicated cable Converter Valves
S1
Turbidity
element
Reference
element
Lamp
*1 : Valve connections vary with the specifications as shown Table 2.2. F0223.ai
S2
V
V
AG
P1
P2
+
-
S1
S2
+
V
-
V
AG
P1
P2
G L1 L2
V1
V2
V3
V4
V5
V6
V7
V8
V9
V10
0
S
C
1
2
1
2
Figure 2.23 Internal Wiring Diagram
Table2.2 SpecicationsandConnections
Sufxcode
Specicationswith/withoutsamplingsystem,automaticcleaning
and zero calibration
Valves to be
connected
-NN, -KC W/o sampling system, automatic cleaning, or automatic zero calibration No valve connection
-A1 W/ sampling system, but w/o automatic cleaning or automatic zero
No valve connection
calibration
-A2 W/ sampling system and automatic cleaning but w/o automatic zero
SV1, SV2
calibration
-A3 W/ sampling system, automatic cleaning, and automatic zero calibration SV1, SV2, SV3, SV4
*1
SV1
SV3
SV2
SV4
IM 12E04A02-02E 9th Edition : Mar. 16, 2018-00
Page 50

<2. SPECIFICATIONS>
l -A3
2-39
Detector
S1
S2
V+
V-
AG
P1
P2
Dedicated cable
Pinch valve
*4
*5
*4
*5
SV1
Solenoid valve
SV3
Solenoid valve
SV2
Solenoid valve
SV4
O
S
C
1
2
1
2
Converter
S1
S2
V+
V-
AG
P1
P2
V1
V2
V3
V4
V5
V6
V7
V8
V9
V10
G L1 L2
M1
M2
F1
F2
C1
C2
R1
R2
R3
A1
A2
A3
A4
TD
RD
DG
G
+
G
Mainatenance contact output
Fail contact output
Upper and lower limit alarms or
automatic calibration/cleaning contact output
Remote range
switching input *2
COM
Output range 1
Output range 2
Range contact output *3
Output range 3
Digital output signal
(RS-232C)
-
Analog output signal
(4 to 20 mA DC or
1 to 5 V DC)
*1
Noise filter assembly *6
*1
Power supply
*1: Ground terminal on the outside of the converter case with a grounding resistance of 100 Ω or less.
Ground the power cord instead only if the above grounding is not feasible.
(Note) Do not use two-point grounding.
*2: Remote range switching method
R1 to R2 R1 to R3
Output
Contact
Output range 1 OFF OFF
Output range 2 ON OFF
Output range 3 OFF ON
Resistance (ON): 200 Ω or less
(OFF): 100 kΩ or more
*3: Output range switching method
A1 to A2 A1 to A3 A1 to A4
Output
Contact
Output range 1 Close Open Open
Output range 2 Open Close Open
Output range 3 Open Open Close
*4: In the case of with automatic cleaning (-A2, -A3)
*5: In the case of with automatic zero calibration (-A3)
*6: Only for Korea (-KC)
Figure 2.24 Internal Wiring Diagram for -A3
IM 12E04A02-02E 9th Edition : Mar. 16, 2018-00
Page 51

<2. SPECIFICATIONS>
l /PHU5, /PHN5
PH450G pH converter
Power
supply
*1
Terminal box
1
2
3
4
5
6
7
8
Detector
S1
S2
V+
V-
AG
P1
P2
Input/output
signal *7
Dedicated cable
*4
Solenoid valve
*5
Solenoid valve
*4
Solenoid valve
*5
(/PHU5, /PHN5)
1L
2N
21
CONTACT
22
S1~S3
S4
(FAIL SAFE)
61(+)
62(-)
63
Pinch valve
SV1
SV3
SV2
SV4
IMPLOW
mA1
(SHIELD)
O
S
C
1
2
1
2
(S)16
(GE)15
(SE)14
(RE)13
(T2)12
(T1)11
Jumper
S1
S2
V+
V-
AG
P1
P2
V1
V2
V3
V4
V5
V6
V7
V8
V9
V10
Sensor cable
(Wired by the customer)
*8
Converter
M1
M2
F1
F2
C1
C2
R1
R2
R3
A1
A2
A3
A4
TD
RD
DG
G
-
G L1
+
L2
G
pH sensor (PH8EFP)
(Installed by the customer)
pH holder
(PH8HF)
Ultrasonic oscillator
(PUS400G) *6
U1
U2
S
L1
L2
Mainatenance contact output
Fail contact output
Upper and lower limit alarms or
automatic calibration/cleaning contact output
Remote range
switching input *2
COM
Output range 1
Output range 2
Output range 3
Digital output signal
(RS-232C)
Analog output signal
(4 to 20 mA DC or
1 to 5 V DC)
Range contact output *3
2-40
*1: Ground the power cord (8) with a grounding resistance of 100 Ω or less.
*2: Remote range switching method
R1 to R2 R1 to R3
Output
Output range 1 OFF OFF
Output range 2 ON OFF
Output range 3 OFF ON
*3: Output range switching method
A1 to A2 A1 to A3 A1 to A4
Output
Output range 1 Close Open Open
Output range 2 Open Close Open
Output range 3 Open Open Close
*4: In the case of with automatic cleaning (-A2, -A3)
*5: In the case of with automatic zero calibration (-A3)
*6: In the case of with ultrasonic cleaning (/PHU5)
*7: Refer to the User's Manual of the PH450G for details of input/output signals.
*8: Refer to the User's Manual of the PH450G for details of jumper setting.
Contact
Contact
Figure 2.25 Internal Wiring Diagram for /PHU5, /PHN5
Resistance (ON): 200 Ω or less
(OFF): 100 kΩ or more
IM 12E04A02-02E 9th Edition : Mar. 16, 2018-00
Page 52

<2. SPECIFICATIONS>
l /FC
2-41
Power
supply
*1
Terminal box
1
2
3
4
5
6
7
8
Detector
S1
S2
V+
AG
P1
P2
Free available chlorine
analyzer converter
Free available chlorine
analyzer detector (FC400G)
(FC400G)
Dedicated cable
Output signal
*6
M1
M2
T1
L1
T2
L2
RE
ME
F1
F2
G
C1
C2
+
T1
T2
RE
ME
G
C1
C2
-
Dedicated cable
V-
Pinch valve
*4
*5
*4
*5
SV1
Solenoid valve
SV3
Solenoid valve
SV2
Solenoid valve
SV4
O
S
C
1
2
1
2
Converter
S1
S2
V+
V-
AG
P1
P2
V1
V2
V3
V4
V5
V6
V7
V8
V9
V10
G L1 L2
M1
M2
F1
F2
C1
C2
R1
R2
R3
A1
A2
A3
A4
TD
RD
DG
Mainatenance contact output
Fail contact output
Upper and lower limit alarms or
automatic calibration/cleaning contact output
Remote range
switching input *2
COM
Output range 1
Output range 2
Range contact output *3
Output range 3
Digital output signal
(RS-232C)
G
-
+
G
Analog output signal
(4 to 20 mA DC or
1 to 5 V DC)
*1: Ground the power cord (8) with a grounding resistance of 100 Ω or less.
*2: Remote range switching method
R1 to R2 R1 to R3
Output
Contact
Output range 1 OFF OFF
Output range 2 ON OFF
Output range 3 OFF ON
*3: Output range switching method
A1 to A2 A1 to A3 A1 to A4
Output
Contact
Output range 1 Close Open Open
Output range 2 Open Close Open
Output range 3 Open Open Close
*4: In the case of with automatic cleaning (-A2, -A3)
*5: In the case of with automatic zero calibration (-A3)
*6: Refer to the User's Manual of the FC400G for details of input/output signals.
Figure 2.26 Internal Wiring Diagram for /FC
Resistance (ON): 200 Ω or less
(OFF): 100 kΩ or more
IM 12E04A02-02E 9th Edition : Mar. 16, 2018-00
Page 53

<2. SPECIFICATIONS>
l /ARS
2-42
Detector
S1
S2
V+
V-
AG
P1
P2
Terminal box
AR2
AR2
CB1
G
2
1
AR1
Dedicated cable
Pinch valve
*4
*5
*4
*5
SV1
Solenoid valve
SV3
Solenoid valve
SV2
Solenoid valve
SV4
+
S
-
+
G
L2
L1
G
L2
L1
G
L2
L1
Converter
S1
S2
V+
V-
AG
P1
P2
V1
V2
V3
O
S
C
1
2
1
2
V4
V5
V6
V7
V8
V9
V10
G L1 L2
*1
M1
M2
F1
F2
C1
C2
R1
R2
R3
A1
A2
A3
A4
TD
RD
DG
G
G
Mainatenance contact output
Fail contact output
Upper and lower limit alarms or
automatic calibration/cleaning contact output
Remote range
switching input *2
COM
Output range 1
Output range 2
Range contact output *3
Output range 3
Digital output signal
(RS-232C)
-
+
Analog output signal
(4 to 20 mA DC or
1 to 5 V DC)
AR1, AR2: Arrester
CB1: Circuit breaker
*1
Power supply
Output signal
*1: Ground terminal on the outside of the converter case with a grounding resistance of 100 Ω or less.
Ground the power cord instead only if the above grounding is not feasible.
(Note) Do not use two-point grounding.
*2: Remote range switching method
R1 to R2 R1 to R3
Output
Contact
Output range 1 OFF OFF
Output range 2 ON OFF
Output range 3 OFF ON
Resistance (ON): 200 Ω or less
(OFF): 100 kΩ or more
*3: Output range switching method
A1 to A2 A1 to A3 A1 to A4
Output
Contact
Output range 1 Close Open Open
Output range 2 Open Close Open
Output range 3 Open Open Close
*4: In the case of with automatic cleaning (-A2, -A3)
*5: In the case of with automatic zero calibration (-A3)
Figure 2.27 Internal Wiring Diagram for /ARS
IM 12E04A02-02E 9th Edition : Mar. 16, 2018-00
Page 54

<3. INSTALLATION, PIPING, AND WIRING>
3. INSTALLATION, PIPING, AND WIRING
3.1 Installation
3.1.1 Unpacking
The Surface Scattering Light Turbidity Meter is shipped only after being packed so as not to be
damaged during transportation. When the turbidimeter is delivered, unpack the meter carefully. If
the turbidimeter with a sampling system is delivered, unpack them near the location where they
are to be installed.
3.1.2 Installation Location
The Surface Scattering Light Turbidity Meter should be installed in a location where:
(1) rainwater cannot get inside, such as in a building or a cabinet,
(2) there is little vibration,
(3) corrosive gases are not present,
(4) there is low humidity,
3-1
(5) temperature changes are kept to a minimum and the temperature is maintained between -5
to 50 °C,
(6) there is enough clearance for maintenance and maintenance work can be easily done,
(7) drainage can be provided.
IM 12E04A02-02E 9th Edition : Mar. 16, 2018-00
Page 55

<3. INSTALLATION, PIPING, AND WIRING>
3.1.3 Installation
Installation of the Surface Scattering Light Turbidity Meter differs depending on whether the
sampling system is provided or not. If the sampling system is provided, secure the entire system
with anchor bolts (M12 (12 mm) bolts) to a well-drained “concrete base”. If the sampling system
is not provided, mount the detector and converter onto pipes (2-inch pipe) or racks with the
special mounting bracket. (See Model Code Option Specication.)
In the case of TB400G---KC (for Korea), a noise lter assembly is attached. Please refer to a
gure of external dimensions for the attachment means of the noise lter assembly.
3-2
50 mm dia. pipe
Pipe mounting bracket
Figure 3.1 Pipe Mounting
Converter
Detector
50 mm dia. pipe
Converter
Pipe mounting bracket
F0301.ai
Unit: mm
238
M5 mounting screws (4 places)
M5 mounting screws (3 places)
Figure3.2 RackMounting
Rack mounting bracket
Detector
Rack mounting
bracket
Mounting dimensions
190
Mounting dimensions
126.5
4-M5
105
3-M5
F0302.ai
IM 12E04A02-02E 9th Edition : Mar. 16, 2018-00
Page 56

<3. INSTALLATION, PIPING, AND WIRING>
3.2 Piping
3.2.1 TB400G-¨-¨-NN, -KC (without sampling system)
(1) Measuring water piping
For a sample ow of 1.5 to 2 L/min, the sample can be introduced directly into the detector.
Connect the attached ø33 mm X ø25 mm black soft PVC pipe to the Sample inlet. However, if
the sample ow exceeds the range of 1.5 to 2 L/min, satisfy the ow condition by providing, for
example, a head tank (constant level tank) also used for bubble removal. In this case, also use
an ø33 mm X ø25 mm black soft PVC pipe for the piping connection between the head tank and
the detector.
(2) Drain piping
Connect an ø33 mm X ø25 mm black soft PVC pipe to the drain outlet of the detector. In doing
this, carefully run the piping so that a trip does not form in the pipe. If water is trapped in the drain
piping, the detector may be harmed by becoming ooded.
3-3
(3) Cleaning water piping
The cleaning water inlet of the detector is sealed with a blind plug.
Note: If a low turbidity (less than 200 mg/L) is to be measured, prepare a sampling system which allows a supply of zero water (tap
water ltered with a zero-turbidity lter).
Sample outlet
Hose joint
for Ø25 mm hose
Figure 3.3 Detector Piping Connections
Cleaning water inlet
Sample inlet
Hose joint
for Ø25 mm hose
F0303.ai
IM 12E04A02-02E 9th Edition : Mar. 16, 2018-00
Page 57

<3. INSTALLATION, PIPING, AND WIRING>
3.2.2 TB400G-¨-¨-A1, -A2, and -A3 (with sampling system)
(1) Sample-water piping
This is piping to supply sample to the detector. The pressure and ow rate for the Sample are 20
to 500 kPa and 2 to 10 L/min, respectively. Piping connections are designed for a rigid PVC pipe
of nominal size VP16 (ø22 mm). Do the piping using any anges or unions conforming to the pipe
diameter.
(2) Tap-water piping
This is piping to supply cleaning water and zero water to the detector. Supply water having a
turbidity of 2 mg/L or less, such as tap water. The pressure of the water to be used is 100 to 500
kPa. Piping connections are designed for a rigid PVC pipe of nominal size VP16 (ø22 mm). Do
the piping using any ttings conforming to the pipe diameter similar to the piping for sample.
Note: Please consider to install a check valve so that cleaning water does not ow backward in the tap water side.
(3) Drain piping
This is piping for draining the sample and tap water supplied to the detector to a drain or the like.
The piping connection is designed for a rigid PVC pipe of nominal size VP40.
3-4
Connect such a pipe of nominal size VP40 (VU40) or more and do the piping so that debris does
not remain or get trapped or get trapped in the pipe.
Sample inlet
VP16 pipe
Drain outlet
VP40 pipe
Tap water inlet
VP16 pipe
F0304.ai
Figure 3.4 Piping Connections for Turbidimeter with Sampling System
IM 12E04A02-02E 9th Edition : Mar. 16, 2018-00
Page 58

<3. INSTALLATION, PIPING, AND WIRING>
3.3 ExternalWiring
There are the following categories for wiring to the turbidimeter.
Figure 3.5 shows the external wiring diagram. When the arrester (option code /ARS) is specied,
refer to Figure 3.10.
(1) Wiring for power supply and grounding
(2) Analog output wiring
(3) Digital output wiring
(4) Contact input (remote range selection) wiring and contact output (range output) wiring (if
necessary)
(5) Contact output (maintenance, failure, upper and lower limit alarms, or automatic zero
calibration/cleaning output) wiring (if necessary)
3-5
Turbidity converter
R1
Remote range
selection
contact input
Range contact
output
Digital output
(RS-232C)
R2
R3
A1
A2
A3
A4
TD
RD
DG
G
Ground
REMOTE
RANGE
ANSWER
BACK
DIGITAL
OUTPUT
POWER
G
L1
To power supply
Figure3.5 ExternalWiringDiagram
G
ANALOG
OUTPUT
MAINT
FAIL
AUX
+
–
M1
M2
F1
F2
C1
C2
L2
Dedicated power cable *1
Noise filter assembly *1
Receiving instrument
Analog output wiring
+
–
Maintenance
contact output
Failure
contact output
Upper and lower limit alarm
or automatic cleaning and
zero-calibration contact output
*1: Only for TB400G-□-□-KC
G
To power supply
F0305.ai
For the wiring of each combined equipment, refer to relevant user’s manuals.
IM 12E04A02-02E 9th Edition : Mar. 16, 2018-00
Page 59

<3. INSTALLATION, PIPING, AND WIRING>
Wiring terminal brock
External wiring cable glands
(5 places)
F0306.ai
Figure3.6 ConverterExternalWiringTerminalBlockandCableConnections
Where as the converter has 5 cable inlet ports. As a rule, use one cable for each port.
Note: Be sure to insert cable gland with blind plugs into the unused cable connections.
3-6
IM 12E04A02-02E 9th Edition : Mar. 16, 2018-00
Page 60

<3. INSTALLATION, PIPING, AND WIRING>
3.3.1 Power and Grounding Wiring
[Power Wiring]
This is the wiring to supply power, conforming to the frequency and voltage specications, to the
converter. Connect converter terminals L1 and L2 to the power supply.
Use a two-conductor cable having a nished of ø6 to ø12 mm (/ARS : The occasion with the
arrester ø9 to ø11 mm) for the power wiring.
The cable end-treatment procedure for the end to be connected to the converter is described in
the following:
(1) Strip off about 80 mm of the cable insulation covering from the end.
(2) Attach clamp terminal lugs tted to M4 (4 mm) screws to the tips of the conductors.
In the case of TB400G---KC (for Korea), please wire a noise lter assembly by all means.
[Grounding Wiring]
Do the grounding wiring using the grounding terminal at the bottom of the converter case.
As the grounding terminal is for an M5 (5 mm) screw, connect a grounding conductor whose
end is end-treated (obtaining sufcient continuity) and do the grounding (JIS class D, grounding
resistance of 100 ohms or less).
3-7
Note: If grounding cannot be done using the ground terminal of the converter case, connect
the grounding conductor to terminal G (M4 (4 mm) screw) within the converter and ground the
conductor on the power supply side. In this case, use 3-conductor or 2-conductor shielded cables
for the power and grounding wiring.
Do not use two-point grounding.
3.3.2 Analog Output Wiring
This is the wiring for transmitting a 1 to 5 V DC or 4 to 20 mA DC output signal corresponding
to the output range to a receiving instrument such as a recorder. For Wiring, use a 2-conductor
shielded cable of nished ø6 to ø12 mm (/ARS : The occasion with the arrester ø9 to ø11 mm).
The cable end-treatment procedure and connection procedure on the connecting side to the
converter are shown below.
(1) Strip off about 40 mm of the insulation covering and shield from the cable end and solder a
leadwire to the root of the exposed shield. Protect the soldered part with wound a insulation
tape.
(2) Make the soldered leadwire length almost the same as other conductor lengths and attach
crimp terminal lugs conforming to as M4 (4 mm) screw to the tips of each conductor and this
leadwire.
(3) Connect the cable to the converter terminals + and -. Connect the plus pole conductor to
the OUTPUT “+” terminal and the minus pole conductor to the OUTPUT “-” terminal. Also,
connect the leadwire of the shield to terminal G. (Do not ground the shield on the receiving
side.)
IM 12E04A02-02E 9th Edition : Mar. 16, 2018-00
Page 61

<3. INSTALLATION, PIPING, AND WIRING>
3.3.3 Digital Output Wiring
This is the wiring for outputting turbidity signals and generated failure details as digital signals
(through RS-232C). For details of specications and transmission, see Section 2.1, “Standard
Specications”.
For wiring, use a 3-conductor shield cable of nished ø6 to ø12 mm. Limit the cable length up 10 m.
The cable end-treatment procedure and connection procedure on the connecting side to the
converter are shown below.
(1) Strip off about 40 mm of the insulation covering and shield from the cable end and solder a
leadwire to the root of the exposed shield. Protect the soldered part with wound insulation
tape.
(2) Make the soldered leadwire length almost the same as other conductor lengths and attach
crimp terminal lugs conforming to an M4 (4 mm) screw to the tips of each conductor and this
leadwire.
(3) Connect the cable to the converter terminals (TD, RD, DG, and G). Connect the conductors
as shown in Figure 3.7 (Do not ground the shield on the receiving side).
3-8
Converter
TD
RD
DG
Shield
G
TM1
Figure 3.7 Digital Output Wiring Connection
Receiving equipment
TD
RD
DG
G
F0307.ai
IM 12E04A02-02E 9th Edition : Mar. 16, 2018-00
Page 62

<3. INSTALLATION, PIPING, AND WIRING>
3-9
3.3.4 Contact Input and Contact Output (Range Output) Wiring
As output ranges, three types of ranges can be set, and output can be obtained by freely
switching these ranges. The output range selection is “remote”, “local” or “auto” mode.
This wiring is applied if the range is changed in “remote” mode (see Section 6.6 (12)) or the range
contact output is used.
Use a 2-conductor cable of nished
ø
6 to ø12 mm for the wiring. However, use a 3-conductor
cable when remote range selection only is used and a 4-conductor cable when only range
contact output is used.
The on and off contact statues are identied with the resistance value conditions shown in Table
3.1. In doing wiring, conrm that a contact meeting these conditions is used.
Table3.1 On/offIdenticationofContactInputforSwitching“Remote”Range
Onstatusidentication Offstatusidentication
Resistance value (contact) 200Ω or less 100 kΩ or more
The cable end-treatment procedure and connection procedure on the converter connection side
are shown below.
(1) Strip off about 40 mm of the cable insulation covering from the end and attach suitable
terminal lugs tted to M4 (4 mm) screws to the tip of each conductor.
(2) Connect the cable conductors to “remote” range selection terminals R1, R2, and R3 and
range contact output terminals A1, A2, A3 and S4.
“Remote” range switching on/off contact input is performed between terminals R1 and R2, and
between terminals R1 and R3 (See gure 3.8). The relationship between the on/off contact input
and the output range is as shown in Table 3.2.
R1
R2
R3
Figure 3.8 Remote Range Switching Contact Input
Table 3.2 Contact Input and Output Range
R1-R2 R1-R3 Output range
OFF OFF RANGE 1
ON OFF RANGE 2
OFF ON RANGE 3
F0308.ai
The range contacts can be output as in Figure 3.9.
A1
A2
A3
A4
Figure 3.9 Range Contact Output
COM
RANGE 1
RANGE 2
RANGE 3
F0309.ai
IM 12E04A02-02E 9th Edition : Mar. 16, 2018-00
Page 63

<3. INSTALLATION, PIPING, AND WIRING>
3.3.5 Contact Output Wiring
The converter outputs contact signals for failure, maintenance, and upper and lower limit alarm
or automatic cleaning/in calibration. Use a nished
4-, or 6-conductor cable depending on the number of contact outputs used). The contact rating
for contact output relays is as shown in Table 3.3. For the instrument to be connected, select that
which satises the conditions in Table 3.3.
Table 3.3 Contact Rating for Contact Output Relay
DC relay AC relay
Maximum permissible contact voltage 220 V 250 V
Maximum permissible contact current 2 A 2 A
Maximum permissible contact power 60 W 125 VA
Connect each conductor of the cable to terminals F1, F2, M1, M2, C1, and C2 respectively.
Before connection, end-treat the cable conductors. Strip off the cable insulation covering by
about 40 mm and attach crimp terminal lugs conforming to M4 (4 mm) screws to each conductor.
Table 3.4 shows the operation of each contact output.
Table 3.4 Contact Output Operation
Contact Operation
M1, M2 Closed (setting upon shipment from the factory) for maintenance
(other than the <MEAS.> mode. *2
F1, F2 Open when a failure occurs (setting upon shipment from the factory). *2
C1, C2 *1 Open when the upper or lower alarm is generated (at shipment from the factory). *2
or
Closed during automatic calibration or automatic cleaning. *2
*1: Contacts C1 and C2 can be used in two ways: for upper and lower limit alarms and for automatic cleaning and calibration. These
can be selected with FUNCTION "E" in the <PROGRAM1> mode. When shipped from the factory, this is set for the upper and
lower alarms.
*2: Either open or closed can be selected when the contact operates. Set them with FUNCTIONs "C" to "F" in the <PROGRAM2>
mode.
ø
6 to ø12 mm cable for this wiring (select a 2-,
3-10
IM 12E04A02-02E 9th Edition : Mar. 16, 2018-00
Page 64

<3. INSTALLATION, PIPING, AND WIRING>
3.3.6 With Arrester (/ARS)
A power supply and signal wire in relay wires in terminal box (refer to gure 3.10).
Cables use 9 to 11 mm.
3-11
Detector
S1
S2
V+
V-
AG
P1
P2
Terminal box
AR2
AR2
CB1
G
2
1
AR1
Dedicated cable
Pinch valve
*4
*5
*4
*5
SV1
Solenoid valve
SV3
Solenoid valve
SV2
Solenoid valve
SV4
+
S
+
G
L2
L1
G
L2
L1
G
L2
L1
Converter
S1
S2
V+
V-
AG
P1
P2
V1
V2
V3
O
S
C
1
2
1
2
V4
V5
V6
V7
V8
V9
V10
G L1 L2
*1
M1
M2
F1
F2
C1
C2
R1
R2
R3
A1
A2
A3
A4
TD
RD
DG
G
+
G
Mainatenance contact output
Fail contact output
Upper and lower limit alarms or
automatic calibration/cleaning contact output
Remote range
switching input *2
COM
Output range 1
Output range 2
Range contact output *3
Output range 3
Digital output signal
(RS-232C)
Analog output signal
(4 to 20 mA DC or
1 to 5 V DC)
AR1, AR2: Arrester
CB1: Circuit breaker
*1
Power supply
Output signal
*1: Ground terminal on the outside of the converter case with a grounding resistance of 100 Ω or less.
Ground the power cord instead only if the above grounding is not feasible.
(Note) Do not use two-point grounding.
*2: Remote range switching method
R1 to R2 R1 to R3
Output
Contact
Output range 1 OFF OFF
Output range 2 ON OFF
Output range 3 OFF ON
Resistance (ON): 200 Ω or less
(OFF): 100 kΩ or more
*3: Output range switching method
A1 to A2 A1 to A3 A1 to A4
Output
Contact
Output range 1 Close Open Open
Output range 2 Open Close Open
Output range 3 Open Open Close
*4: In the case of with automatic cleaning (-A2, -A3)
*5: In the case of with automatic zero calibration (-A3)
Figure3.10ExternalWiringDiagramfor/ARS
IM 12E04A02-02E 9th Edition : Mar. 16, 2018-00
Page 65

Blank Page
Page 66

<4. OPERATION>
4. OPERATION
4.1 Preparation for Operation
For preparation, proceed with the work in turn according to the items in subsections 4.1.1 to
4.1.9.
Since the types and number of values vary with the specications for sampling, automatic
cleaning, and automatic zero calibration (Sufx code: -NN, -KC, -A1, -A2, and -A3), see the
piping diagrams in Section 2.6. For meaning of the codes, see Section 2.3.
NOTE
When the detector is opened for preparation, take extreme care not to get the lenses in the
detector (in two places) dirty.
If they get dirty, clean the lenses (see Section 7.8).
4.1.1 CheckingPipingandWiringConditions
Examine that the piping and wiring have been done properly.
4-1
4.1.2 Supplying Power
First conrm that the power supply is of the voltage and frequency that meet the specications.
Also, check that the cap of the fuse holder in the converter is securely tightened.
Turn on the power switch in the converter. Then, press the [MODE] key on the converter to go to
the <MAINT.> mode.
4.1.3 Supplying Zero Water
If the turbidity to be measured is higher than 200 mg/L, remove the lter element and use tap
water directly as zero water.
(1) Supply tap water of the predetermined specications (see Section 2.1) to the tap water inlet.
(2) Close all the values except V2 and SV4 (for the Sufx code: -A3).
Note: Use the value operating keys of the converter to operate SV1, SV2, SV3, and SV4.
(3) Vent the air by loosening the knob of the air vent on the top of the lter until tap water spills
over. After air venting is completed, tighten the knob securely.
(4) Loosen screw A at the lower part of the detector (see Figure 4.1) to open the detector.
(5) Gradually open V3 and conrm that the water surface becomes as smooth as a mirror nish
as shown in Figure 4.2 (b).
IM 12E04A02-02E 9th Edition : Mar. 16, 2018-00
Page 67

<4. OPERATION>
4.1.4 Adjustment for Leveling Detector
There are ripples on the
measuring surface.
Measuring cell
(a) Measurement is impossible.
4-2
B
Measuring cell
Screw A
F040102.ai
Sample outlet
The measuring surface is as
smooth as a mirror finish.
(b) Measurement is possible
Figure 4.1 Lower Part of Detector Figure 4.2 Water Level of Detector
(1) For the turbidimeter with a sampling system, as the detector level has been adjusted
before shipment from the factory, normally it is not necessary to be adjusted for horizontal
adjustment (adjustment for owrate of Sec. 4.1.9 is necessary). If the sampling system is
not provided, or level adjustment is needed even with the sampling system provided, place
a level at the drain outlet of the measuring cell and adjust the level so that the detector is
level in two orthogonal directions with the B screws (in four places) shown in Figure 4.1 (see
Figure 4.3).If a level is not available, visual adjustment may be acceptable. In this case,
make the adjustment so that water spills out uniformly from the drain outlet of the measuring
cell.
Measuring cell
Adjustment screw
Lock nut
First loosen the lock nut and then turn the adjustment screw.
When adjustment is completed, lock the screw by tightening
the lock nut.
Figure 4.3 Level-Adjustment Screw
4.1.5 Supplying Cleaning Water
Conrm that the owrate of the cleaning water is adequate when “zero water” is owing.
(1) Open cleaning water valve SV2 using the [SV2] key of the converter.
Note 1: There is no SV2 valve for models with Sufx code -NN, -KC, or -A1.
(2) Open valve V4 and conrm that the water is not splashing.
(3) Close valve SV2.
(4) Close the detector.
Note 2: For Sufx code -A1, close V4 and open it subsequently to clean the cell.
F0403.ai
IM 12E04A02-02E 9th Edition : Mar. 16, 2018-00
Page 68

<4. OPERATION>
4.1.6 Setting Output Range
Set the analog output range selection (local/remote) and the range. (When shipped from the
factory, this is set to local range selection and to RANGE1 (0 to 2 mg/L).)
For output range setting, see Section 5.2.
4.1.7 Running-in
Carry out running-in for an hour or more while allowing “zero water” to ow.
4.1.8 Zero and Span Calibrations
After the indication is stable, zero calibration and span calibration is made in use of zero water
and calibration plate respectively.
First, carry out zero calibration.
(1) Set FUNCTION “1” in the <MAINT.> mode. --> “Turbidity value” is displayed.
(2) Wait for the indication to stabilize, and then press [ENT] --> [>] --> [ENT] keys in this order to
carry out zero calibration.
Next, carry out span calibration.
(1) Set FUNCTION “D.” In the <PROGRAM1> mode and conrm that “on” is displayed. “on”
means the calibration using the calibration plate (“on” is set when shipped from the factory).
4-3
(2) Set FUNCTION “4” in the <MAINT.> mode. --> “Turbidity valve” is displayed.
(3) Set to the drain status.
• Close V2 and open V5 (for Sufx code: -A1).
• Close V2 and open SV1 (for Sufx code: -A2).
• Close SV3, SV4 and open SV1 (for Sufx code: -A3).
(4) Loosen screw A at the lower part of the detector to open the detector (see Figure 4.1).
(5) Set the attached calibration plate as shown in Figure 4.4 (the calibration plate is housed in
the converter).
(6) Close the detector and tighten screw A.
(7) Wait for the indication to stabilize and press [ENT] --> [>] --> [ENT] to calibrate.
(8) Open the detector and remove the calibration plate and then tighten screw A.
Press the calibration plate to
the edge of the measuring cell.
Calibration plate
Screw A
Measuring cell
Figure 4.4 Calibration Plate Setting
Sample outlet
F0404.ai
IM 12E04A02-02E 9th Edition : Mar. 16, 2018-00
Page 69

<4. OPERATION>
4.1.9 Supplying Sample and Adjusting Flowrate
(1) Press the converter [mode] key to got the <MEAS.> mode.
(2) Place the hand-operated valve in a measuring status (see Section 4.2, Table 4.1).
Note 1: Valves SV1 to SV4 are automatically brought to the measuring status when the <MEAS.> mode is selected.
(3) Supply the specied ow (2 to 10 L/min) of sample.
Note 2: For the model with the specications for no sampling system and no automatic cleaning or zero calibration (Sufx code: -NN,
-KC), set the owrate of the Sample at 1.5 to 2 L/min.
4.2 Operation
This section describes measurement in the <MEAS.> mode, the on/off operation of each valve in
automatic cleaning and automatic zero calibration, and the settings related to operation.
4.2.1 Starting Measurement
When the [MODE] key in the converter is pressed to move to the <MEAS.> mode, the internal
timer starts and analog output hold (set when shipped form the factory) is reset according to the
predetermined specications.
The maintenance contact outputs (M1 and M2) also open (set when shipped from the factory)
and the mode information is output only once to the digital output (see the contact output
operation in Subsection 3.3.5 and digital communication specications in Section 2.1).
4-4
Table 4.1 shows valve status in the <MEAS.> mode. Valves SV1 to SV4 automatically operate
according to the predetermined specications. The statuses shows in Table 4.1 are those when
no automatic cleaning or automatic zero calibration operates.
Table 4.1 Value Statuses When Measurement Is Carried Out
Sufxcodes V1 V2 V3 V4 V5 SV1 SV2 SV3 SV4
-A1 Open Closed Closed Closed Closed — — — —
-A2 Open Open Closed Open — Closed Closed — —
-A3 Open Open Open Open — Closed Closed Open Closed
IM 12E04A02-02E 9th Edition : Mar. 16, 2018-00
Page 70

<4. OPERATION>
4.2.2 Automatic Cleaning Operation
When automatic cleaning is specied (Sufx code: -A2 or -A3), the detector is automatically
cleaned in the <MEAS.> mode. With measuring water (or zero water) owing, dirty substances
on the measuring cell wall and the measuring surface edge are washed out by jets of cleaning
water (tap water) from two outlets on the side of the measuring cell in the detector. After cleaning,
dirt on the measuring cell, header tank, and in the piping between the header tank and the
detector is washed out by opening the drain outlet of the header tank.
The above cleaning operation is repeated a predetermined number of times.
The information of start or end is output when automatic cleaning is started or ended.
In addition, there are two types depending on the specications for automatic cleaning.
• Withoutautomaticzerocalibration(Sufxcode:-A2)
• Withautomaticzerocalibration(Sufxcode:-A3)
The explanation for each types are followed.
a. WithoutAutomaticZeroCalibration(Sufxcode:-A2)
Automatic cleaning can be started in the following two ways:
• Startup with the internal timer
4-5
• Startup with FUNCTION “6” in the <MAINT.> mode (see Section 6.5).
Note: Startup with the internal timer can be selected for execution (on)/stop (off) using FUNCTION “A.” in the <PROGRAM1> mode. It
has been set to execute (on) when shipped from the factory.
The internal timer operation is shown below. The automatic-cleaning operation is repeated at
every preset time of the cleaning period (A) (Figure 4.5).
Measurement start *1
Cleaning Cleaning Cleaning Cleaning Cleaning Cleaning
A
*1: Measurement start is defined to be the point specified in the following:
Other mode <MEAS.> mode
Power off Power on (<MEAS.> mode)
Figure 4.5 Cleaning Period
A
A A A A
F0405.ai
Figure 4.6 shows the automatic-cleaning operation time chart and Table 4.2 the list of settings for
automatic cleaning.
<Valve used>
SV1: Drain valve
SV2: Cleaning water valve
IM 12E04A02-02E 9th Edition : Mar. 16, 2018-00
Page 71

<4. OPERATION>
<Time chart> Example: N (number of cleaning repetitions) = 4
Measurement
SV1
(Drain)
Power on
OFF
start
Cleaning cycle
Cleaning time 1
N*2 =
ON
Drain time 1
Water fill time 1
ON
1 2 3 4
Recovery time
4-6
SV2
(Cleaning)
Output
holding *1
OFF
HOLD HOLD ON
OFF
*1 During cleaning, the output is always in the hold state.
The display is also set to be held using FUNCTION "8." in the <PROGRAM1> mode.
Contact outputs C1 and C2 can be used as contacts for the period during cleaning and
calibration. This is set using FUNCTION "E." in the <PROGRAM1> mode.
*2: N; Number of cleaning repeats
*3: One automatic cleaning cycle = N (cleaning + draining + water filling) + relaxation
One cleaning cycle*3
F0406.ai
Figure4.6 Automatic-cleaningOperationTimeChart(Sufxcode:-A2)
Table 4.2 Cleaning Operation Setpoints
Item
Setting
range
Factory
setting
Unit
Setting mode
Mode FUNCTION
Cleaning period 0.1 to 24.0 2.0 Hours PROGRAM 2 1
Cleaning time 1 10 to 120 30 Sec PROGRAM 2 4
Draining time 1 10 to 120 10 Sec PROGRAM 2 6
Water lling time 1 10 to 120 100 Sec PROGRAM 2 8
Relaxation time 30 to 600 150 Sec PROGRAM 2 A
Number of cleaning repetitions 1 to 20 5 times PROGRAM 2 3
See Section 6.7 for the setting procedures for each setpoint.
IM 12E04A02-02E 9th Edition : Mar. 16, 2018-00
Page 72

<4. OPERATION>
F0407.ai
b. WithAutomaticZeroCalibration(Sufxcode:-A3)
Automatic cleaning can be start in the following two ways.
• Startup with the internal timer.
• Startup with FUNCTION “6” in the <MAINT.> mode (see Section 6.5).
Note: Startup with the internal timer can be selected for execution (on)/stop (off) using FUNCTION “A” in the <PROGRAM1> mode. It
has been to execution (on) when shipped from the factory.
The internal timer operation is shown in Figure 4.7.
As shown in the gure, the automatic cleaning operation is repeated at every set time of the
cleaning period (A) and automatic zero calibration is implemented once in every 3 repetitions (for
cleaning calibration ratio B = 3).
Measurement start *1
Cleaning Cleaning Calibrattion Cleaning Cleaning Calibrattion
4-7
A
B=1 2 3 1 2
*1: Measurement start is defined to be the point specified in the following:
Other mode <MEAS.> mode
Power off Power on (<MEAS.> mode)
Figure4.7 Cleaning(calibration)period(Example:forcleaningcalibrationratio=3)
A
A A A A
3
However, if startup of the automatic zero calibration with the internal timer is stopped, the
cleaning operation becomes the same as in Figure 4.5 because the automatic zero calibration
operation is eliminated.
Figure 4.8 shows the automatic-cleaning operation time chart and Table 4.3 the settings.
<Valve used>
SV1: Drain valve
SV2: Cleaning-water valve
SV3: Measuring-water valve
SV4: “Zero-water” valve
IM 12E04A02-02E 9th Edition : Mar. 16, 2018-00
Page 73

<4. OPERATION>
<Time chart> Example: N (number of cleaning repetitions) = 4
Cleaning start
4-8
Drain time 2
Water fill time 2
Cleaning time 2
ON
SV1
(Draining)
SV2
(Cleaning)
SV3
(Water sample)
SV4
(Zero water)
Output
holding *1
*1: During cleaning, the output is always in the hold state.
The display is also set to be held using FUNCTION "8." in the <PROGRAM1> mode.
Contact outputs C1 and C2 can be used as contacts for the period during cleaning and
calibration. This is set using FUNCTION "E." in the <PROGRAM1> mode.
*2: N; Number of cleaning repetitions
*3: One automatic cleaning cycle = N (draining + filling + cleaning) + (draining + filling + recovery)
OFF
N*2 = 1 2 3 4
ON
OFF
ON
OFF
ON
OFF
One cleaning cycle*3
HOLD ON
OFF
Water fill time 2
F0408.ai
Figure4.8 Automatic-cleaningOperationTimeCheat(Sufxcode:-A3)
Recovery time
Table 4.3 Setpoints for Automatic Cleaning and Automatic Zero Calibration
Item
Setting
range
Factory
setting
Unit
Setting mode
Mode FUNCTION
Cleaning period 0.1 to 24.0 2.0 Hours PROGRAM 2 1
Cleaning calibration ratio 1 to 10 1 times PROGRAM 2 2
Cleaning time 2 10 to 120 30 Sec PROGRAM 2 5
Draining time 2 10 to 120 10 Sec PROGRAM 2 7
Water lling time 2 10 to 120 100 Sec PROGRAM 2 9
Relaxation time 30 to 600 150 Sec PROGRAM 2 A
Number of cleaning repetitions 1 to 20 5 times PROGRAM 2 3
For the setting procedures for each setpoint, see Section 6.7.
IM 12E04A02-02E 9th Edition : Mar. 16, 2018-00
Page 74

<4. OPERATION>
4.2.3 Automatic Zero-calibration Operation
If the specications including automatic zero calibration (Sufx code: -A3) are used, zero
calibration is automatically performed. The automatic zero-calibration computation is
implemented by passing zero water and at a stabilized indication after performing the same
cleaning operation as automatic cleaning in subsection 4.2.2 b.
In addition, at the start and end of automatic zero calibration, all starting and completing digital
information is output (see digital communication specications in Section 2.1).
Automatic zero calibration can be started in the following two ways.
• Startup with the internal timer (see Figure 4.7).
• Startup with FUNCTION “7” in the <MAINT.> mode (see Section 6.5).
Note: Startup with the internal timer can be selected for execution (on)/stop (off) using FUNCTION “B.” in the <PROGRAM1> mode. It
has been set to execution (on) when shipped from the factory.
Figure 4.9 shows the automatic zero-calibration operation time chart.
For the setting, see Table 4.3.
<Valve used>
SV1: Drain valve
SV2: Cleaning-water valve
SV3: Measuring-water valve
4-9
SV4: “Zero-water” valve
<Time chart> Example: N (number of cleaning repetitions) = 4
Calibration start
Drain time 2
Water fill time 2
Cleaning time 2
SV1
(Drain)
SV2
(Cleaning)
SV3
(Water sample)
SV4
(Zero water)
Output
holding *1
*1: During cleaning, the output is always in the hold state.
The display is also set to be held using FUNCTION "8." in the
<PROGRAM1> mode.
Contact outputs C1 and C2 can be used as contacts for the period
during cleaning and calibration. This is set using FUNCTION "E."
in the <PROGRAM1> mode.
*2: N: Number of cleaning repetitions
*3: One automatic cleaning cycle = N (draining + filling + cleaning)
+ 2 (draining + filling + relaxation)
OFF
N*2= 1 2 3 4
OFF
ON
OFF
OFF
ON
OFF
ON
One calibration cycle*3
HOLD ON
Recovery time
Water fill time 2
ON
Figure 4.9 Automatic Zero-calibration Time Chart
Drain time 2
Calculation for
zero calibration
Water fill
time 2
ON
F0409.ai
Recovery
time
IM 12E04A02-02E 9th Edition : Mar. 16, 2018-00
Page 75

<4. OPERATION>
NOTE
When Option Code, /PHN¨, /PHU¨ or /FC is specied, a pH sensor for the pH meter and
ceramic beads for the non-reagent type free available chlorine detector will be shipped in
separate packages. Be sure to install them properly while referring to the relevant user's
manuals. Improper installation may result in malfunction or failure.
This instrument starts with the supply of water sample to each equipment. Refer to Section 2.6,
“Piping System Diagrams,” operate the relevant valves, and set the ow rate of the equipment as
follows.
(1) pHow-throughholder:3to11L/min
(2) Non-reagent type free available chlorine detector: 0.1 to 2.5 L/min
For the operation of each combined equipment, refer to the relevant user's manuals.
4-10
IM 12E04A02-02E 9th Edition : Mar. 16, 2018-00
Page 76

<5. FUNCTIONS>
5. FUNCTIONS
This chapter describes the functions of the converter. For each function, the relevant topics are
listed. For the setting procedures, see Chapter 6, the operation procedure for each FUNCTION in
each mode.
5.1 Functions Related to Failure Detection
Table 5.1 shows the failure detection functions.
5-1
IM 12E04A02-02E 9th Edition : Mar. 16, 2018-00
Page 77

<5. FUNCTIONS>
Table 5.1 Failure Detection Function
Detected item Details
1 Turbidity
overrange
2 Lamp
disconnection
3 Lamp voltage
failure
4 AD circuit
failure
5 Memory
comparison
failure
6 RAM failure Detected if the result of a comparison of specied
7 EEPROM
failure
8 Reference
signal voltage
failure
9 Zerocalibration
range
exceeded
10 Span
calibration
range exceed
11 Zero-shift
calibration
range exceed
12 Calibration
plate failure
13 Lamp life *1 Detected of the lamp voltage reaches the upper
14 Failure in
automatic
zero
calibration *2
15 High and low
alarm *3
16 CPU failure CPU failure. Normally this does not occur. All modes Only the "FAIL" lamp is lit and no
• In the "FAIL lamp" column, ○ means the lamp lights and × the lamp goes out.
• The items for detected failures for which both the mode and function are described can be selected for execution/stop of detection (see
Section 6.7).
• Errors detected other than in calibration are automatically reset at the time when the cause of failure is removed.
This is detected if the measurement signal from the
detector is out of the permissible range is approx.
+0.5 V to -2.45 V across S1 and AG terminals in the
converter.
This is detected if the lamp goes off and the reference
signal drops to approximately -0.5 V or less.
This is detected if the lamp voltage is out of the
permissible range. The permissible range is
approximately 3 V to 6 V across terminals P1 and P2
in the converter.
(1) Detected if analog-to-digital conversion is not
completed in the predetermined time.
(2) If the converted data are out of the permissible
range, this is detected if the input is swiched to a
simulated input and the converted data are again
out of range.
Data such as setpoints are stored in two places in the
EEPROM. This is detected if the results of regular
comparisons of such data do not agree.
data in writing and reading immediately after turning
on power does not agree. If detected, subsequent
operations cannot be accepted.
Immediately after turning on power, the data stored
in two places in the EEPROM are compared. If they
do not agree, this item is detected if the result of the
comparison of specied data in writing and reading
does not agree. If detected, subsequent operations
cannot be accepted.
If the reference signal from the detector is out of
the permissible range, this item is detected. The
permissible range is approximately +0.5 V to -2.45 V
across terminals S2 and AG.
Detected when the input value in zero calibration is out
of the permissible range. The permissible range is ±10
mV.
Detected if the input value in span calibration is out of
the permissible range. For span calibration (standard
solution reference), the permissible range is 50 to
400%.
For span calibration (sensitivity correction), the
permissible range is 0.25 to 400.
For details, see section 5.3 *3.
Detected if the zero-correction coefcient in zeroshift
calibration is out of the permissible range.
The permissible range is ±9 mg/L.
Detected if the input value in span calibration is out of
the permissible range. The permissible range is ±50%
of the calibration plate setpoint.
control limit. The upper limit is approx. 4.8 V *4
across terminals P1 and P2.
Detected if the zero input value in automatic zero
calibration is out of the permissible range. The
permissible range is ±10 mV.
Detected if the turbidity signal exceeds the upper or
lower limit setpoint. When shipped from the factory,
these are set at -10 (lower) and 2200 (upper) mg/L.
Generation
mode
MEAS. Err11
MEAS. Err12
MEAS. Err13
All modes Err14
All modes Err15
When
power is
turned on
When
power is
turned on
MEAS. Err18
When
calibration is
carried out
When
calibration is
carried out
When
calibration is
carried out
When
calibration is
carried out
MEAS. Err25
MEAS. Err26
MEAS. "MEAS."
Error
No.
Err16
Err17
Err21 X
Err22 X
Err23 X
Err24 X
ashes.
operations are accepted.
FAIL
lamp
○
GRAM 2
○
GRAM 2
○
GRAM 2
○
GRAM 2
○
GRAM 2
○
○
○
GRAM 2
○
GRAM 2
○
GRAM 2
X PRO-
GRAM 2
Detection on/
off setting
Mode
PRO-
PRO-
PRO-
PRO-
PRO-
PRO-
PRO-
PRO-
5-2
FUNC-
TION
1.
2.
3.
4.
5.
6.
7.
8.
9.
IM 12E04A02-02E 9th Edition : Mar. 16, 2018-00
Page 78

<5. FUNCTIONS>
• If the "FAIL" lamp is lit, error numbers can be conrmed with FUNCTION "A" in the <MAINT.> mode, while the error can be reset with
FUNCTION "B" in the <MAINT.> mode.
• If the "FAIL" lamp is lit, analog output mode selection (non-hold, hold, or preset) is possible with FUNCTION "5" in the <PROGRAM1> mode.
• If the"FAIL" lamp is lit, FAIL contact output is also obtained.
• If an Err11 to 15, Err18, Err25, or Err26 failure is detected, error numbers are output by virtue of digital output (see Section 2.1, digital
communication specications).
• If Err16 or Err17 is detected, other operations cannot be accepted with the error number displayed.
*1: The TB400G controls the lamp voltage so that a constant light quantity is obtained. If the amount of lamp light diminishes, the lamp
voltage increases.
Thus, the lamp voltage may be an index for the life of the lamp.
*2: Err26 is detected only if the specications are for automatic zero-calibration (Sufx code: -A3).
*3: 15 high and low alarm setpoints can be set using FUNCTION "8" and "9" in the <PROGRAM1> mode.
*4: If the program version number is 1.08, the upper limit is set to 4.1 V. (The version number can be conrmed in FUNCTION "E" in
<MAINT.> mode. Refer to Subsection 6.5 (13)).
5-3
IM 12E04A02-02E 9th Edition : Mar. 16, 2018-00
Page 79

<5. FUNCTIONS>
5.2 Functions Related to Analog Output
5.2.1 Output Range Selection
The output range can be set up in three ways: auto range, remote range, and local range.
The relationship between these is as shown in Figure 5.1. Table 5.2 shows the setting modes and
function numbers related to the output range selection.
Operation
5-4
Auto-range
Note: The turbidimeter is shipped with the output range set to 1 for the local range.
Execution
Stop
Remote range
Execution
Stop
Auto-range
Remote range
Local range
F0501.ai
Figure 5.1 Output Range Selection
Table 5.2 Function Related to Output Range Selection
Detected item Details Mode FUNCTION
1 Output range 1
The upper and lower limits for analog output 1 are set.
PROGRAM 1
1.
setting
2 Output range 2
The upper and lower limits for analog output 2 are set.
PROGRAM 1
2
setting
3 Output range 3
The upper and lower limits for analog output 3 are set.
PROGRAM 1
3
setting
4 Auto-range
selection
5 Remote range
selection
The function that automatically switches the output ranges
(1, 2, and 3) depending on the turbidity value.
The function that switches the output ranges (1, 2, and 3)
by contact inputs (R1, R2, and R3) (when function 4) is
PROGRAM 1
PROGRAM 1
1.
2.
"oFF").
6 Local range
selection
The function that switches the output ranges (1, 2, and 3)
using converter key operations (when function 4) and 5)
PROGRAM 1
3.
are "oFF").
7 Auto-range
switching point
The auto-range switching point is arbitrarily set when auto-
range is used.
PROGRAM 1
7
setting
• Corresponding to switching of the output range, the range contact outputs (A1, A2, A3, A4) are switched and the RNG1, RNG2, or
RNG3 lamp is lit.
(1) Output range 1: Range contact outputs A1 and A2 are closed; RNG1 lamp is lit.
(2) Output range 2: Range contact outputs A1 and A3 are closed; RNG2 lamp is lit.
(3) Output range 3: Range contact outputs A1 and A4 are closed; RNG3 lamp is lit.
• When the output range is switched, digital range information is output only once (see Section 2.1, "Digital Communication
Specications").
• When the turbidimeter is used with auto-range, the output should be set as shown below.
(1) Set the Low side of the setting to 0 (display is "L00.00").
(2) Set the High side of the setting so that range 1 <= range 2 <= range 3 holds.
(3) If two ranges are required, set range 2 = range 3.
(4) If one range is required, set range 1 = range 2 = range 3.
• Range switching timing in auto-range should be taken as follows:
(1) The timing of switching from a low range to a higher range is a point where the measured value just becomes larger than the
auto-range switching point of the lower range.
(2) The timing of switching from a higher range to a lower range is a point where the measured value just becomes smaller than
-10% of the auto-range switching point in the lower range (10% is provided for range switching hysteresis).
Note: Auto-range switching should be set in item 7. When the turbidimeter is shipped from the factory, this is set to 80% of the range.
• In auto-range, the output ranges are switched for contact inputs (R1, R2, and R3).
(1) No contact input: Output range 1
(2) Contact input (R1, R2) = Closed: Output range 2
(3) Contact inputs (R1, R3) = Closed: Output range 3
IM 12E04A02-02E 9th Edition : Mar. 16, 2018-00
Page 80

<5. FUNCTIONS>
5.2.2 Other Functions Related to Output
Table 5.3 shows other functions related to analog output and the operation modes and function
numbers for setting.
Table 5.3 Other Functions Related to Output
Detected item Details Mode FUNCTION
1 Bi-linear output Setting of break points when an analog signal is output
with line-segment approximation.
2 Output hold during
maintenance
3 Output mode when
a failure is detected
4 Holding an output of
4 mA or less
5 Setting of output
value if a failure is
When maintained (other than the <MEAS.> mode), the
function to hold the analog output.
Analog output mode (non-hold, hold, or preset)
selection when the "FAIL" lamp is lit.
If a turbidity value becomes smaller than the output
range lower limit, the output is held at 4 mA (1 V).
If "preset" is selected in function 3), the value set here
is output.
detected.
(1) Bi-linear Output
The point where a setpoint (%) of the output range span (mg/L) corresponds to 59% of the output
signal (4 to 20 mA or 1 to 5 V) span is the break point. The setting range is 0 to 100%. Figure 5.2
shows an example of a setting.
PROGRAM 1 6
PROGRAM 1 4.
PROGRAM 1 5.
PROGRAM 1 6.
PROGRAM 1 5
5-5
20
Break point
Output
signal
mA
12
4
0 1 4
2
3
Output range (mg/L, (deg.))
40 % setting
Example of setting
Output range: 0 to 5 mg/L (deg.)
Output: 4 to 20 mA
Break point setting: 40 % (2 mg/L (deg.))
5
F0502.ai
Figure5.2 ExampleofBi-linearOutput
If the output range setpoint is determined to be 50%, the output is linear. Also, if set at 0% or
100%, the output is as shown in Figure 5.3 respectively.
Output
signal
mA
20
12
Output
signal
mA
20
12
4
Lower
limit
Output range (mg/L, (deg.))
In the case of setting 0 %
Upper
limit
4
Lower
limit
Output range (mg/L, (deg.))
In the case of setting 100 %
Figure5.3 OutputWhentheBreakPointIsSetat0%and100%oftheOutputRange
IM 12E04A02-02E 9th Edition : Mar. 16, 2018-00
Upper
limit
F0503.ai
Page 81

<5. FUNCTIONS>
5.3 Manual Cleaning and Calibration Functions
Table 5.4 shows a list of manual cleaning and calibration functions. For operation and setting
procedures, see the procedures for each mode and the functions in Chapter 6.
Table 5.4 Manual Cleaning and Calibration Functions
Function Description
1
Zero calibration (zero
Zero-point calibration using zero water
water)
2
Zero calibration (lamp
OFF) *1
Zero-point calibration with the lamp turned off When the
measurement is over 200 mg/L turbidity, zero calibration
can be made at Lamp off.
3
Zero-shift calibration *3
A function to make the zero point agree with the desired
value.
4
Span calibration
(calibration plate/
standard solution)
Span calibration using the calibration plate and standard
solution.
the calibration plate and standard solution should be
selected
according to function.
5
Span calibration
(sensitivity correction) *3
6
Manual start of
A function to make the point at the upper end of the span
agree with the desired value
Cleaning operation can be started in the <MAINT.> mode.
automatic cleaning *2
7
Manual start of
Calibration operation can be started in the <MAINT.> mode.
automatic calibration *2
8
Reference sensitivity
calibration
Reference span calibration carries out with standard
solution upon shipment from the factory. This sensitivity
becomes the reference of the slope display and slope
failure assessment.
Normally, this is not used except upon shipment from the
factory.
9
Lamp control reference
value
The converter lamp voltage is xed at 3.6 V and the
reference signal voltage at the time is stored as the
reference.
The lamp voltage is controlled by this reference value.
10
Setting of calibration
plate turbidity value
11
Setting of zero
correction factor
12
Setting of sensitivity
correction factor
13
Selection of calibration
plate/standard solution
The calibration plate turbidity value is set (marked at the
rear of the calibration plate).
The zero correction factor obtained in item (3) can be
displayed and changed.
The sensitivity correction factor obtained in item (5) can be
displayed and changed.
Which span reference is used, either the calibration plate
or the standard solution, for span calibration in item (4), is
selected.
*1: The difference in the zero point between the procedures using "zero water" and the lamp being off is approximately 1 mg/L.
*2: For the automatic cleaning operation in the <MEAS.> mode, see subsection 4.2.2.
For the automatic calibration operation in the <MEAS.> mode, see subsection 4.2.3.
*3: Normal zero and span calibration is carries out using items (1) or (2) and (4) of Table 5.4 taking the standard solution as the
reference (equation 5.1). However, if the indications are to agree with the arbitrary values using a solution other than the standard
solution as the reference, calibration with items (3) and (5) of Table 5.4 is carried out. In this case, the zero correction factor and
sensitivity correction standard solution (see equation 5.2).
T1 = S (V - A) Eq. 5.1
T2 = K (T1 + B) Eq. 5.2
where,
T1: Turbidity value using standard solution as the reference
S: Span calibration coefcient (referencing to standard solution)
This is calculated when calibrating item (4) in Table 5.4, and the ration of the span calibration coefcient (S0)
calculated by reference sensitivity calibration in item (8) in Table 5.4 (normally implemented upon shipment from
the factory) to this coefcient, S0/S, is displayed as the slope in item (8).
The permissible range for item (4) in Table 5.4 is 50% <= S0/S <= 400%.
A: Zero-calibration coefcient (refered to standard solution)
This is calculated in calibration for items (1) and (2) in Table 5.4 and the turbidity-converted value of this
coefcient (S x A) is displayed as a zero-point error because of item (7) in Table 5.5.
-10 mV <= A <= 10 mV is the permissible range of items (1) and (2) in Table 5.4.
Mode FUNCTION
MAINT.
MAINT.
MAINT.
MAINT.
MAINT.
MAINT.
MAINT.
MAINT.
MAINT.
PROGRAM 1
PROGRAM 1
PROGRAM 1
PROGRAM 1
5-6
1
2
3
4
5
6
7
8
C
A
B
C
D.
IM 12E04A02-02E 9th Edition : Mar. 16, 2018-00
Page 82

<5. FUNCTIONS>
V: Measuring signal, a voltage signal from the detector
T2: Turbidity value after correction
K: Sensitivity correction factor
This is calculated in the calibration of item (5) in Table 5.4, and can be displayed and changed using item (12) in
Table 5.4.
The permissible range in items (5) and (12) in Table 5.4 is 0.25 <= K <= 4.00.
B: Zero-correction coefcient
This is calculated in item (3) in Table 5.4 and can be displayed and changed using item (11) in Table 5.4.
-9 mg/L <= B <= 9 mg/L is the permissible range for items (3) and (11) in Table 5.4.
Note 1: Turbidity in the <MEAS.> mode is displayed in T2 (turbidity after correction). However, when the turbidimeter is shipped from
the factory, the zero and sensitivity correction factors are 0.0 mg/L and 1, respectively. Thus, T1 = T2.
Note 2: For zero and span calibration of (1), (2), (4), and (8) referencing the standard solution, T1 (turbidity before correction) is
always displayed as turbidity.
5-7
IM 12E04A02-02E 9th Edition : Mar. 16, 2018-00
Page 83

<5. FUNCTIONS>
5.4 Functions Related to Display
In the <MEAS.> mode, each item in Table 5.5 can be selectivity displayed. In addition, Table 5.6
shows the functions related to turbidity display.
Table 5.5 Functions Related to Display
5-8
Function Description Mode
1 Turbidity display *1 Turbidity is displayed. MEAS. 1
2 Lamp voltage display The lamp voltage in the converter is displayed. *1 MEAS. 2
3 Measured signal
current display
4 Reference signal
voltage display
5 Analog output %
display
6 Analog output mA
display
7 Zero error display The measured signal in zero calibration does not
8 Slope display Sensitivity at the latest span calibration to the sensitivity
*1: Owing to item 3 in Table 5.6, the unit indication can be changed.
Table 5.6 Functions Related to Turbidity Display
Function Description Mode
1 Negative turbidity
display hold *1
2 Display hold
automatic cleaning or
zero calibration
3 Selection of turbidity
unit indication
*1: Even if this function is on, a negative value is displayed in other than the <MEAS.> mode.
The measured value by the receiving element that
measures scattered light is displayed in the current
value.
The signal of the receiving element that controls the
lamp light quantity is displayed in the voltage value.
The analog output is displayed after being converted
into % FS.
The analog output is displayed after being converted
into 4 to 20 mA.
become 0 mV exactly. This error (mV) is displayed after
being converted to turbidity.
at reference sensitivity calibration is displayed in %.
If the value of the turbidity is negative, the turbidity is
xed at 0.00 mg/L.
The display in the automatic cleaning or zero calibration
is xed.
The unit of turbidity indication (mg/L, degree, and FTU)
can be selected.
MEAS. 3
MEAS. 4
MEAS. 5
MEAS. 6
MEAS. 7
MEAS. 8
PROGRAM 1
PROGRAM 1
PROGRAM 1
FUNCTION
FUNCTION
C.
7.
8.
IM 12E04A02-02E 9th Edition : Mar. 16, 2018-00
Page 84

<5. FUNCTIONS>
5.5 Functions Related to Contact Output
An on or off operation can be selected for every contact output.
The output AUX (C1, C2) is used for either upper and lower limit alarm output or automatic
cleaning and calibration output.
Table 5.7 Functions Related to Contact Output
Function Description Contact Mode FUNCTION
Selection of maintenance
contact output open or close
Selection of FAIL contact output
open or close
Selection of upper and lower
limit alarm output open or close
Selection of automatic cleaning
or zero calibration output open
or close
Selection of C1 and C2 outputs Selection of upper and lower limit
Open or closed (factory setting) M1, M2
Open (factory setting) or closed F1, F2
Open (factory setting) or closed C1, C2
Open or closed (factory setting) C1, C2
alarm output or automatic cleaning
or calibration output
C1, C2
PROGRAM 2
PROGRAM 2
PROGRAM 2
PROGRAM 2
PROGRAM 2
5-9
C
D
E
F
E.
5.6 Other Functions
Table 5.8 shows other functions.
Table 5.8 Other Functions
Function Description Mode FUNCTION
Converter check It can be conrmed that the converter operates normally.
Setting of turbidity
signal average factor
5.6.1 OverviewoftheSpikeDetectionFunction
If air bubbles occur or dust is present on the sample surface of the detector's measuring cell at
which the light is scattered, the reading, in general, rises rapidly. The uctuation is dependent on
the size of air bubbles or dust and their behavior on the sample surface.
A head tank is supplied when the TB400G with a sampling system is specied. It is for removing
air bubbles and thus for preventing them from reaching the detector. In rare cases, however,
air bubbles occur and grow in the pipe between the head tank and the detector, and rise to the
surface of the measuring cell, resulting in reading uctuation.
The converter has a signal averaging function with a user-congurable averaging factor.
Small changes in readings due to air bubbles or dust can be compensated for, to some degree,
by increasing the averaging factor. However, it is not practical to set the averaging factor too high
because it can cause a delay in the response of the turbidity signal.
Setting of the average factor of turbidity indication analog
output
MAINT.
PROGRAM 1
9
4
The spike detection function is the one of detecting and suppressing a rapid change due to air
bubbles or dust, preventing it from affecting the reading and output. (Note that this function is
available in models with ROM number K9410SE with version 1.04 or later).
IM 12E04A02-02E 9th Edition : Mar. 16, 2018-00
Page 85

<5. FUNCTIONS>
How It Functions
To suppress a rapid change due to air bubbles or dust, the TB400G:
• Checks a turbidity signal before averaging;
• Calculates the difference between the current signal and the previous signal;
• Compares the difference with the Detection Level;
• If it is less than the Detection Level, proceeds to averaging and gives the turbidity reading;
• If it is greater than the Detection Level, holds the output for a specied Hold Time period;
• During that period, suspends the Detection Level check;
• After the Hold Time has elapsed, averages signals without the Detection Level check for a
specied Sampling Time period and gives turbidity readings; and,
• After the Sampling Time has elapsed, performs the Detection Level check again.
Instructions for Use
The spike detection function is effective in processes where turbidity changes are relatively small
under normal conditions, but it may not be suitable for processes where rapid changes occur
often. Even if rapid changes do not usually occur, this function may be activated and may cause
a delay in the response of the reading or output if stepwise turbidity changes occur occasionally.
Therefore, before using this function process conditions should be carefully considered, and in
order to use it properly, determine optimum setpoints for the operating conditions while changing
them little by little.
5-10
When using the function, pay attention to the following.
• Adjust the Detection Level according to the degree of reading change due to air bubbles or dust.
• If an excessively long Hold Time is set, the turbidimeter may not be able to detect a change
in reading that may have occurred and should have been recognized as a real change.
• If the function is responsible for the delay in the response of the turbidity reading, try setting
the Sampling Time longer without changing the Hold Time.
• When an abnormal turbidity reading is suspected, turn off the function once and wait for
a while and see. The function may have prevented the turbidimeter from giving readings
properly.
5.6.2 SettingsofSpikeDetectionFunction
To enable the function, set necessary parameters in <PROGRAM1> mode following the
procedure below.
• Turn ON the function (FUNCTION “F.”)
• Set the Detection Level (FUNCTION “D”)
• Set the Hold Time (FUNCTION “E”)
• Set the Sampling Time (FUNCTION “F”)
a.DetectionLevel(%)
The Detection Level is a value used to determine whether a reading is a spike due to air bubbles
or dust or not. It is dened as a percentage of the upper limit of the analog output range currently
selected. The percentage setpoint is converted to the corresponding turbidity signal in the
computer. (The ratio of the sensitivity correction factor is also calculated automatically).
For the Detection Level check, a pre-averaging turbidity value is used. To determine the
Detection Level, it may be needed to know the degree of uctuation in pre-averaging turbidity
signals. Set the averaging factor to 1 in FUNCTION “4” in <PROGRAM1> mode to allow the
turbidimeter to give turbidity readings directly without averaging.
Check readings to know the degree of uctuation. Generally, the Detection Level is set to a value
greater than the uctuation.
IM 12E04A02-02E 9th Edition : Mar. 16, 2018-00
Page 86

<5. FUNCTIONS>
b. Hold Time
When a signal exceeds the Detection Level, the readings and output signals are held for a
specied Hold Time. The Hold Time should be long enough for air bubbles and dust to move
away from the sample surface. Normally, air bubbles and dust will run off the sample surface or
disappear within a short time (in a few seconds). In practice, rst set the Hold Time to a shorter
time, and then increase it if the function does not work satisfactorily.
c. Sampling Time
After the Hold Time has elapsed, the turbidimeter gives readings without any processing for a
specied Sampling Time to verify that no uctuation occurs in turbidity readings.
The time count begins after the Hold Time. It is unlikely that air bubbles or dust occur
consecutively. Therefore, the Sampling Time may not need to be too short. If the Sampling Time
is set too short, the response is delayed when a sudden change in turbidity actually occurs. First
set the Sampling Time slightly longer. If something is wrong with the behavior of the function,
shorten the time. For the procedure for settings in <PROGRAM1> mode, refer to Section 6.6.
Instructions for Use
Be careful when using the function as the following restrictions apply.
• The function works only in <MEAS.> mode. As soon as the mode is changed, the Hold or
Sampling timer is reset and the function stops working.
• The function does not work during automatic zero calibration or automatic cleaning.
If automatic zero calibration or automatic cleaning begins when the function is active (i.e.,
during a Hold Time or Sampling Time period), the function immediately stops running and
the timer is reset.
• During a Hold Time period, both turbidity readings (including communication data) and
analog outputs are held.
• The function does not run for approximately 5 seconds right after the turbidimeter is turned
on.
• If the turbidimeter is turned off then on again while the function is running, the timer is reset.
• Since the reference clock runs at a period of approximately 1.07 seconds, the actual time
are slightly greater than their setpoints, respectively. For example, if the time is set to 10
seconds, the actual time will be: 10 x 1.07 = approximately 11 seconds.
5-11
IM 12E04A02-02E 9th Edition : Mar. 16, 2018-00
Page 87

Blank Page
Page 88

<6. PROCEDURES FOR CONVERTER OPERATION>
6. PROCEDURES FOR CONVERTER OPERATION
The converter incorporates a microprocessor and has automatic cleaning, automatic
zerocalibration, and self-diagnostic functions as well as turbidity measuring functions.
The operator may use the control panel to enable display of various date, manual operation of
solenoid valves, etc., or entry of operation parameters.
This chapter describes key operation procedures, details of indications on the display, etc.
6.1 Components of Control Panel and Their
Functions and Actions
Access to all function in obtained through keys on the control panel. The panel includes display
areas for data, modes, function codes, etc. in which measured values and operating statuses are
displayed.
Figure 6.1 and Table 6.1 show the control panel components and their functions.
6-1
(5) <FAIL> indication
(3) Mode indication
area
(8) Status
indication area
(9) Mode key
(11) Data set
keys
Figure 6.1 Control Panel
(6) Operation
indication area 1
FAIL
MEAS.
MAINT
PROGRAM 1
PROGRAM 2
MODE
(1) Data display
(7) Operation indication area 2
LAMP AMG1 AMG2 AMG3 SV1 SV2 SV3 SV4
mg/l
FTU
nA mA
V %
FUNC
HOLD CAL WASH
DATA SET
<>
>
MANUAL OPERATION
SV 1
SV 2 SV 3 SV 4
(12) Valve operation keys
FUNCENT
(4) Unit indication
area
(2) Function code
display area
(10) Function key
F0601.ai
IM 12E04A02-02E 9th Edition : Mar. 16, 2018-00
Page 89

<6. PROCEDURES FOR CONVERTER OPERATION>
Table 6.1 Operation Keys/Display Indications and Functions
6-2
No. in
Fig. 6.1
(1) Data display (in red LED) Displays measured values, set data, messages, etc.
(2) Function code area (in red) Displays the function code selected.
(3) Mode indication area (active mode
is indicated by the green lamp)
(4) Unit indication area (green LED of
active unit is lit)
(5) <FAIL> indication (in red:
characters in relief)
(6) Operation indication area 1 (green
LED of active operation is lit)
(7) Operation indication area 2 (green
LED of active operation is lit)
(8) Status indication area (green LED
of active status is lit)
(9) Mode key Used when selecting an operation mode.
(10) Function key Used when selecting the function code.
(11) Data set keys Used when changing data settings or implementing calibration.
(12) Valve operation keys Used when turning solenoid valves on or off. Every time a key is
Name Function
Indicates the operation mode. The lamp relevant to the current
operation mode is lit.
Indicates the unit of the data. The unit of the data item currently
displayed in the data display.
Turns on when the processor fails or other failures are detected.
Turns on or off in response to the lamp turning on or off or the
selected range of the analog output.
Turns on or off in response to the solenoid valve being on or off.
Lights up, goes out, or ashes corresponding to the "output hold",
"calibration" and "cleaning" statuses.
pressed, the solenoid valve relevant to the key is turned on or off.
IM 12E04A02-02E 9th Edition : Mar. 16, 2018-00
Page 90

<6. PROCEDURES FOR CONVERTER OPERATION>
6.2 Operation Modes and Functions
Operation of the turbidimeter is divided principally into three operation modes (modes are
classied into four types).
(1) Measurement mode (<MEAS.> mode) (subsections 6.2.1)
(2) Maintenance mode (<MAINT.> mode) (subsections 6.2.2)
(3) Setting modes
• Data setting/operation setting mode (<PROGRAM1> mode) (subsections 6.2.3)
• Automatic cleaning and zero-calibration setting/failure detection function selection mode
(<PROGRAM2> mode) (subsections 6.2.4)
Display or setting items for data and command items, such as for calibration, are determined by
functions in each mode. Accordingly, various operations require designation of a mode and a
function code.
Table 6.2 outlines the modes and the function codes in each mode. For details on function codes,
see subsections 6.2.1 to 6.2.4.
Table 6.2 Outline of Modes and Function Codes
6-3
Mode
MEAS. to
MAINT. to
PROGRAM.1
PROGRAM.2
Function code
(FUNCTION)
Description
1
1
to
1
to
1.
to
1
to
1.
This is the mode for steady operation in which turbidity is measured. If
8
execution of automatic cleaning and zero calibration is selected, a sequence
operation is carried out. (Sufx code: A2 or A3)
This is the mode for performing maintenance in which calibration can be
done (implemented items are selected using the [FUNC] key). The data set
F
key and valve operation keys can be operated.
Data can be set such as output range setting. (The setting items are selected
using the [FUNC] key). The data set key and valve operation keys can be
F
operated.
Operating functions such as range switching (automatic, remote/local) and
execution/stopping of automatic cleaning can be selected (setting items are
F.
selected using the [FUNC] key). The data set key and valve setting keys can
be operated.
The cleaning and calibration sequence time can be set (setting items are
selected using the [FUNC] key). The data set key and valve operation keys
F
can be operated.
Execution/stopping of failure detection can be selected (setting items are
selected using the [FUNC] key). The data set key and valve operation keys
9.
can be operated.
IM 12E04A02-02E 9th Edition : Mar. 16, 2018-00
Page 91

<6. PROCEDURES FOR CONVERTER OPERATION>
6.2.1 Functions in <MEAS.> Mode
Table 6.3 gives details on the functions in the <MEAS.> mode.
Table 6.3 Function in <MEAS.> Mode
F Indication Display range
1 Turbidity -10.00 to 2200 150.0 mg/L Degree/FTU is also
2 Lamp voltage -0.100 to 6.000 3.600 V
3 Turbidity element
detection current
4 Reference element
detection current
5 Analog output in % -10.0 to 110.0 50.0 %
6 Analog output in mA 2.40 to 21.60 12.00 mA
7 Zero-point error -30.00 to 30.00 0.02 0.00 mg/L Degree/FTU is also
8 Slope -50.0 to 400.0 150.0 100.0 %
9
(Not to be selected)
|
F.
*1, *2: These are indicated by reversing the sign (+ or -) for the voltage values obtained by placing the AG terminal of the detector to the
negative side (-).
*3: "FTU" unit, a turbidity unit when formazin standard is used, is also available. Since the instrument uses kaolin standard,
reference sensitivity calibration using formazin standard is required for the FTU display.
Note 1: The values in the column for the initial value are those shown when the memory storing the data is initialized.
These are partially different from the values set upon shipment from the factory.
-99.99 to 5600 *1 1000 nA
-0.2000 to 2.4000 *2 1.6000 V
Exampleof
indication
Initial (default)
value
Unit Remarks
6-4
possible. *3
possible. *3
IM 12E04A02-02E 9th Edition : Mar. 16, 2018-00
Page 92

<6. PROCEDURES FOR CONVERTER OPERATION>
6.2.2 Functions in <MAINT.> Mode
Table 6.4 gives details on the functions in the <MAINT.> mode.
Table 6.4 Function in <MAINT.> Mode
F Operation
1 Zero calibration (zero water) -10 to 10 mV Measured
2 Zero calibration (lamp is off) -10 to 10 mV Measured
3 Zero-shift calibration (zero-point
correction)
4 Span calibration (standard
solution or calibration plate)
5 Span calibration (sensitivity
correction)
6 Manual start of automatic
cleaning
7 Manual start of automatic
calibration
8 Reference sensitivity calibration
*1
9 Converter check operation — C.CHEC
A Error code indication — E.CHEC
B Error reset — CL_Er
C Calibration of lamp control
reference value
D —
E Version number indication — — Example: 1.08
F Password setting for changing
the adjustment mode
1.
(Not to be selected)
|
F.
*1: Set the sensitivity after the reference sensitivity performed upon shipment from the factory to 100% and check the slope in
normal span calibration taking value as a reference.
Note 1: The values in the columnfor the initial value are those shown when the memory storing the data is initialized.
These are partially different from the values set upon shipment from the factory.
Note 2: If a function code which is not used is selected, "_ _ _ _ _" is displayed.
Permissible
calibration range
-9 to 9 mg/L (deg.) Measured
50 to 400% Measured
0.25 to 4 Measured
— JEt Effective for the model with
— A_CAL Effective for the model with
— Measured
0.2000 to 2.3000 V L_CAL The lamp voltage is set at 3.6 V
—
Initial
indication
turbidity value
turbidity value
turbidity value
turbidity value
turbidity value
turbidity value
_ _ _00
Remarks
Uses zero water.
Automatic turning off of light source
Zero-shift calibration (zero correction)
Selection of calibration plate/
standard solution
Sensitivity correction for the
standard solution (calibration plate)
reference
automatic cleaning (Sufx code:
-A2 or -A3)
automatic zero calibration (Sufx
code: -A3)
Criteria for slope failure
Checked by switching to dummy input.
Display --> 50.0 mg/L (deg.)
Output --> 12 mA
and the reference signal is stored
as the reference value.
6-5
IM 12E04A02-02E 9th Edition : Mar. 16, 2018-00
Page 93

<6. PROCEDURES FOR CONVERTER OPERATION>
6.2.3 Functions in <PROGRAM1> Mode
Table 6.5 gives details on the functions in the <PROGRAM1> mode.
Table 6.5 Functions in <PROGRAM1> Mode
F Operation
Setting range/
selection
1 Output range 1 setting 0.00 to 2000
mg/L (deg.)
2 Output range 2 setting 0.00 to 2000
mg/L (deg.)
3 Output range 3 setting 0.00 to 2000
mg/L (deg.)
4 Average coefcient setting (time constant
1 to 255 00030 The 30 to 90% response time is
setting)
5 Setting of output value in a failed condition -10 to 110% 00000
6 Output setting of line-segment approximation 0 to 100% 00050
7 Auto-range changeover point setting 70 to 100% 00080
8 High alarm setting -010.0 to 2200.0
mg/L (deg.)
9 Low alarm setting -010.0 to 2200.0
mg/L (deg.)
A Setting of turbidity value by calibration plate 0000.0 to 2000.0
mg/L (deg.)
B Setting of zero-correction factor -9.000 to 09.000
mg/L (deg.)
C Setting of sensitivity correction factor 0.2500 to 4.0000 1.0000
D
E
F
1. Auto-range selection *1 ON/OFF OFF ON: Execution
2. Remote range selection *1 ON/OFF OFF ON: Execution
3. Local range selection *1 _ _ 1/_ _ 2/_ _ 3 _ _ 1 1: Output range 1
4. Output hold setting in the <MAINT.>,
ON/OFF ON ON: Hold
<PROGRAM 1>, or <PROGRAM 2> mode
5. Output mode setting in failure occurrence _ _ 1/_ _ 2/_ _ 3 _ _ 1 1: No-hold
6. Setting to output hold for 4 mA or less ON/OFF OFF ON: Execution
7. Setting to hold negative turbidity display ON/OFF OFF ON: Execution
8. Setting to display hold in automatic cleaning
ON/OFF OFF ON: Execution
or automatic calibration
9. Basic code (sampling specications) setting _ _ 1/_ _ 2/_ _ 3 _ _ 3 1: -NN, -KC, -A1
A. Automatic cleaning function execution/stop ON/OFF ON ON: Execution
B. Automatic calibration function execution/stop ON/OFF ON ON: Execution
C. Selection of unit to indicate _ _ 1/_ _ 2/_ _ 3 _ _ 1 1: mg/L
D. Selection of calibration plate/standard
ON/OFF ON ON: Calibration plate
solution
E. Selection of AUX cotact output ON/OFF ON ON: Upper and lower limit alarm
F. Selecting execution/stop of spike detection
ON/OFF OFF ON: Execution
function
*1: The priority of these items are as follows (see subsection 5.2.1):
Auto-range > Remote range > Local range
*2: "FTU" unit, a turbidity unit when formazin standard is used, is also available. Since the instrument uses kaolin standard, reference
sensitivity calibration using formazin standard is required for the FTU display.
Note 1: The values in the initial value column are those given when the memory storing the data is initialized. These may be partially
different from the values set upon shipment from the factory.
Note 2: If an unused function code which is selected, "_ _ _ _ _" is displayed.
Note 3: If a value out of the set range is entered, "not" is displayed. Pressing the [>] key restores this indication to the data display.
Initial
indication
Remarks
L00.00
H02.00
L00.00
H020.0
L00.00
H0200
about 22 seconds.
2200.0
-010.0
0090.0 This varies with the calibration
plates.
00.000
OFF: Stop
OFF: Stop
2: Output range 2
3: Output range 3
OFF: No-hold
2: Hold
3: Preset
OFF: Stop
OFF: Stop
OFF: Stop
2: -A2
3: -A3
OFF: Stop
OFF: Stop
2: Degree
3: FTU *2
OFF: Standard solution
OFF: In automatic cleaning or
automatic calibration
OFF: Stop
6-6
IM 12E04A02-02E 9th Edition : Mar. 16, 2018-00
Page 94

<6. PROCEDURES FOR CONVERTER OPERATION>
6.2.4 Functions in <PROGRAM2> Mode
Table 6.6 gives details on the functions in the <PROGRAM2> mode.
Table 6.6 Functions in <PROGRAM2> Mode
F Operation
1 Setting of time range for automatic cleaning 0.1 to 24.0 hours 0002.0
2 Setting of cleaning calibration ratio 1 to 20 times 00001
3 Setting of number of cleaning 1 to 20 times 00005
4 Setting of cleaning time 1 *1 10 to 120 seconds 00030
5 Setting of cleaning time 2 *2 10 to 120 seconds 00030
6 Setting of drain time 1 *1 10 to 120 seconds 00010
7 Setting of drain time 2 *2 10 to 120 seconds 00010
8 Setting of lling time 1 *1 10 to 120 seconds 00100
9 Setting of lling time 2 *2 10 to 120 seconds 00100
A Setting of relaxation time 30 to 600 seconds 00150
B
C Setting of maintenance contact output
operation
D Setting of FAIL contact output operation _ _ 1/_ _ 2 _ _ 1/Open 1: Open in operation
E Setting of high and low alarm contact output
operation
F Setting of operation of contact output during
automatic cleaning and zero-calibration
1. Selection of execution/stopping of turbidity
rangeover detection function
2. Selection of execution/stopping of
disconnected-lamp detection function
3. Selection of execution/stopping of lamp failure
detection function
4. Selection of execution/stopping of A/D circuit
failure detection function
5. Selection of execution/stopping of failure-
inmemory-comparison detection function
6. Selection of execution/stopping of reference
voltage failure detection function
7. Selection of execution/stopping of end-of-
lamp-life detection function
8. Selection of execution/stopping of automatic
calibration failure detection function
9. Selection of execution/stopping of high and
low alarm detection function
A.
B.
C.
D.
E.
F.
*1: Effective with Sufx code "-A2" (with automatic cleaning)
*2: Effective with Sufx code "-A3" (with automatic cleaning and calibration)
Note 1: The values in the initial value column are those given when the memory storing the data is initialized. These may be partially
different from the values set upon shipment from the factory.
Note 2: If an unused function code which is selected, "_ _ _ _ _" is displayed.
Note 3: If a value out of the set range is entered, "not" is displayed. Pressing the [>] key restores this indication to the data display.
Setting range/
selection
_ _ 1/_ _ 2 _ _ 2/Closed 1: Open in operation
_ _ 1/_ _ 2 _ _ 1/Open 1: Open in operation
_ _ 1/_ _ 2 _ _ 2/Closed 1: Open in operation
ON/OFF ON ON: Execution
ON/OFF ON ON: Execution
ON/OFF ON ON: Execution
ON/OFF ON ON: Execution
ON/OFF ON ON: Execution
ON/OFF ON ON: Execution
ON/OFF ON ON: Execution
ON/OFF ON ON: Execution
ON/OFF ON ON: Execution
Initial
indication
2: Closed in operation
2: Closed in operation
2: Closed in operation
2: Closed in operation
OFF: Stop
OFF: Stop
OFF: Stop
OFF: Stop
OFF: Stop
OFF: Stop
OFF: Stop
OFF: Stop
OFF: Stop
6-7
Remarks
IM 12E04A02-02E 9th Edition : Mar. 16, 2018-00
Page 95

<6. PROCEDURES FOR CONVERTER OPERATION>
F0602.ai
6.3 Key Operation
6.3.1 Mode Switching
The current operation mode is indicated by the lit mode indicator lamp.
The operation modes are switched in turn as shown in Figure 6.2 every time [MODE] key is
pressed. However, if a function code other than "1" is selected in each mode, that made is not
changed by the rst key operation but the function code only returns to "1".
6-8
<MEAS.>
Figure 6.2 Mode Switching by [MODE] Key Operation
<MAINT.>
6.3.2 Function Switching
Pressing the [FUNC] key switches the function codes. The switched function code is displayed in
the function code display area. In addition, the function code contents are different in each mode
(see Section 6.2). The selectable number of the function codes also changes.
Figure 6.3 shows the switching sequence of function codes by the [FUNC] key operation.
· · ·
1 2
For <MEAS.>
For <MAINT.>
For <PROGRAM.1> or <PROGRAM.2>
Note: If the [MODE] key is pressed with the function code set to a code
other than "1", the function code returns to "1".
Figure 6.3 Function Code Switching by [FUNC] Key Operation
8
· · ·
9
<PROGRAM.1>
F 9. A.1. F.
· · ·
<PROGRAM.2>
· · ·
F0603.ai
6.3.3 Numerical Input
Numerical input is made with the data set keys. Operation of the data set keys becomes effective
in the modes other than the <MEAS.> mode. The data set keys include the following four keys.
(a)[>]Key(Digitselectionkey):
This is used select the digits of a value of displayed data in the data display that are to be
changed. Digits are selected in such a manner that a digit to be changed moves one place to the
right from the most signicant digit on the left every time this key is pressed and returns to the left
end from the right end.
When the display is on or off in each mode, pressing the [>] key indicates them alternately. Also,
when the display comprises _ _1, _ _2, and _ _3, pressing the [>] key indicates one of them in
this order.
(b) [^] Key (Numeral-up Key):
Every time this key is pressed, the numeric value of the selected digit increases in turn; when
it reaches 9, it returns to 0. In the most signicant digit, a "-" (minus sign) is inserted next to 9.
However, if the displayed data do not include negative values, the negative sign is not inserted.
IM 12E04A02-02E 9th Edition : Mar. 16, 2018-00
Page 96

<6. PROCEDURES FOR CONVERTER OPERATION>
(c)[v]Key(Numeral-downkey):
Every time this key is pressed, the numeric value in the selected digit decreases in turn; when
it reaches 0, it returns to 9. In the most signicant digit, a "-" (minus sign) is inserted next to 0.
However, if the displayed data do not include negative values, the negative sign is not inserted.
(d)[ENT]Key(Entrykey):
This key is used to enter displayed data. When data are entered, the entire displayed data ash
only once.
6.3.4 Opening/Closing Valves
The opening or closing of a solenoid valve is performed with the valve operation key in the
maintenance mode. When a solenoid valve operates, the relevant lamp is lit.
Regardless of a solenoid valve's open/close status in the maintenance mode, if the mode is
changed to the <MEAS.> mode, e.g., for the specication "with automatic cleaning and automatic
calibration", the predetermined sequential operation is performed and the solenoid valves
automatically open or close.
Table 6.7 shows the use of solenoid valves based on the sampling specications (Sufx code).
Table6.7 SamplingSpecications(SufxCode)andUseofSolenoidValves
6-9
Sufxcode SV1 SV2 SV3 SV4
-NN, -KC X X X X
-A1 X X X X
-A2
-A3
X: Used ○: Not used
Note: SV1 is a pinch valve, SV3 is a motor-operated valves and SV2 and SV4 are solenoid valves.
○ ○
○ ○ ○ ○
X X
6.4 Operation in <Meas.> Mode
Each data item in Table 6.3 is displayed by [FUNC] key operation. In this section, the functions
are described in the following order.
(1) Turbidity
(2) Lamp voltage
(3) Turbidity element detection current
(4) Reference element
(5) Analog output in %
(6) Analog output in mA
(7) Zero-point error
(8) Slope
(1) Turbidity (FUNCTION "1")
Turbidity is displayed in the range of -10.00 to 2200 mg/L.
The unit that is displayed can be selected from "mg/L", "degree", or "FTU" in the <PROGRAM1>
mode and with FUNCTION "C.".
IM 12E04A02-02E 9th Edition : Mar. 16, 2018-00
Page 97

<6. PROCEDURES FOR CONVERTER OPERATION>
(2) Lamp voltage indication (FUNCTION "2")
The output voltage of the converter to the lamp (across terminals P1 and P2) is displayed.
(3) Turbidity element detection current (FUNCTION "3")
The signal detected by the turbidity detecting light-receiving element in the detector is displayed
as the current value (converted value).
(4) Reference element detection voltage (FUNCTION "4")
The signal detected by the light-receiving element for the amount of light from the lamp is
displayed as the voltage.
(5) Analogoutputin%(FUNCTION"5")
The current output signal is displayed in a % of the selected output range span.
(Example) In the case of output range: 0 to 2 mg/L, and
Turbidity indication: 1.20 mg/L
6-10
% Indication = × 100 = 60.0 %
The analog output is sent out in the range of -10 to 110% of the output range span.
1.20
2 – 0
F6401.ai
(6) Analog output in mA (FUNCTION "6")
The current analog output value is displayed in a value converted to mA. The value is directly
displayed for a 4 to 20 mA output, but for a 1 to 5 V output, it is displayed by converting it into a 4
to 20 mA output.
(7) Zero-point error (FUNCTION "7")
The measuring voltage signal for zero water or with the light source turned off at zero calibration
is displayed in a value converted to turbidity. If the measuring signal at zero calibration exceeds
the range of -10 to 10 mV, "Err21" is displayed.
(8) Slope (FUNCTION "8")
When the sensitivity at the reference sensitivity calibration is taken as 100%, this indication
displays the ratio as a percentage of the sensitivity obtained at usual span calibration to 100%. If
the sensitivity exceeds the range of 50 to 400% at span calibration, "Err22" is displayed.
IM 12E04A02-02E 9th Edition : Mar. 16, 2018-00
Page 98

<6. PROCEDURES FOR CONVERTER OPERATION>
6.5 Operation in <MAINT.> Mode
This section describes key operations by specifying the functions in the <MAINT.> mode and
describes the operations in the following order.
(1) Zero calibration (with zero water)
(2) Zero calibration (with lamp turned off)
(3) Zero-shift calibration (Zero-point correction)
(4) Span calibration (with standard solution or calibration plate)
(5) Span calibration (sensitivity correction)
(6) Manual start of automatic cleaning
(7) Manual start of automatic calibration
(8) Reference sensitivity calibration
(9) Converter check operation
(10) Error code display
(11) Error resetting
(12) Reference lamp control value calibration
(13) Version number display
6-11
(14) Password entry to switch to the adjustment mode
(1) Zero Calibration (with "zero water") [FUNCTION "1"]
The zero-calibration operation using "zero water". For the value operating procedures, see
Section 7.6.
The following is a description of the key operations.
(Example of display)
(1) Select FUNCTION "1" in the <MAINT.> mode. => 000.04 mg/L
(2) Press the [ENT] key after the display becomes => The "CAL" lamp begins to ash.
stable.
(3) Press the [>] key. => 000.00 mg/L is displayed.
(4) Press the [ENT] key to terminate calibration. => 000.00 mg/L
The entire display ashes once and the "CAL" lamp goes out.
In addition, at operation 4, the measured signal at the zero point is checked and if the permissible
range (-10 to 10 mV) is exceeded, Err21 (zero calibration overrange) is displayed (see Section
5.3 *3). In this case, the "FAIL" lamp is not lit and a FAIL contact is not output.
An error message can be reset by pressing the [ENT] key and the display returns to the turbidity
indication. Wait until the display becomes stable and then begin from step 2 again.
At any stage of zero-calibration operation, pressing the [MODE] key or [FUNC] key allows
switching to another mode or function. Calibration computation is not performed unless the
operation of 4 is carried out.
Note: At this calibration, the turbidity not multiplied by the correction factor from the zero-shift calibration (zero correction) in (3) or span
calibration (sensitivity correction) in (5) is displayed.
(2) Zero Calibration (with lamp turned off) (FUNCTION "2")
The zero-calibration operation is done by automatically turning off the lamp. Only in a measured
turbidity exceeding 200 mg/L, can zero calibration be performed simply in the following
operations. A turbidity reading with the lamp turned off reads a value 1 mg/L smaller than a
reading using "zero water".
IM 12E04A02-02E 9th Edition : Mar. 16, 2018-00
Page 99

<6. PROCEDURES FOR CONVERTER OPERATION>
(Example of display)
(1) Select FUNCTION "2" in the <MAINT.> mode. => 002.00 mg/L
At this time, the lamp is still lit.
(2) Press the [ENT] key. => 000.50 mg/L
The lamp goes out and the displayed value The CAL lamp ashes.
becomes smaller.
(3) Wait one minute or more and after the display => 000.00 mg/L is displayed.
becomes stable, and press the [>] key.
(4) Press the [ENT] key to calibrate. => 000.00 mg/L
The entire display ashes once and
then the CAL lamp goes out.
In addition, at operation 4, the zero-calibration range is checked and the permissible range (-10
to 10 mV) is exceeded, Err21 (zero-calibration overrange) is displayed (see Section 5.3 *3). In
this case, the "FAIL" lamp is not lit and a FAIL contact is not output.
The error message can be reset by pressing the [ENT] key and the display returns to the turbidity
indication. Wait until the display becomes stable and then begin from step 2 again.
In any stage of zero-calibration operation, pressing the [MODE] key or [FUNC] key allows
switching to another mode or function. Calibration computation is not performed unless
operation of 4 is carried out. Also, since the lamp voltage returns to the control voltage when
the turbidimeter resets from the function for calibration with the lamp turned off, a little time is
necessary until the turbidity reading becomes stable. When the mode is to be changed to the
<MEAS.> mode, change the mode after waiting for ve minutes or more.
Note: At this calibration, the turbidity not multiplied by the correction factor from the zero-shift calibration (zero correction) in (3) or span
calibration (sensitivity correction) in (5) is displayed.
6-12
(3) Zero-shift Calibration (FUNCTION "3")
At any turbidity value, this is an operation to zero-shift a turbidity reading within the permissible
range (±9 mg/L).
For details on the function, see Section 5.3 (*3). The zero-correction factor obtained in this
calibration can be displayed and directly changed in FUNCTION "B" in the <PROGRAM1>
mode.
The operation procedures are as follows.
(Example of display)
(1) Select FUNCTION "3" in the <MAINT.> mode. => 000.13 mg/L
(2) Wait until the display becomes stable, and => 000.13 mg/L
then press the [ENT] key. The CAL lamp ashes.
(3) Press the [>] key. => 00000. mg/L
The display is now ready for
determination of the decimal point
position.
(4) Press the [>] key to determine the position => 000.00 mg/L
of decimal point.
Every time the key is pressed, the decimal
point moves to the right and when the least
signicant digit is reached, the decimal point
then moves to the second digit from the left.
(5) Press the [ENT] key. => 000.00 mg/L
The second digit from the left ashes
and waits for the turbidity setting.
IM 12E04A02-02E 9th Edition : Mar. 16, 2018-00
Page 100

<6. PROCEDURES FOR CONVERTER OPERATION>
(6) Select a digit with the [>] key and set the => 000.22 mg/L
turbidity value using the [^] or [v] key.
Every time [>] key is pressed, the ashing digit
moves to the right and when the least
signicant digit is reached, it moves to the
second digit from the left.
(7) Press the [ENT] key to terminate calibration. => 000.22 mg/L
The entire display ashes once and
the CAL lamp goes out.
In addition, if the turbidity value set in operation 7 exceeds the permissible setting range (0
to 2200 mg/L), "not" is displayed. As this setpoint is out of range, reset the error message by
pressing the [>] key and continue the operation from step 2.
Also, check the zero-correction factor; if it exceeds the permissible range (±9 mg/L), "Err23" is
displayed. In this case, the "FAIL" lamp is not lit and a FAIL contact is not output. Reset the error
message by pressing the [ENT] key and continue operations from step 2.
At any stage of zero-shift calibration operation, pressing the [MODE] key or [FUNC] key allows
switching to another mode or function. Calibration computation is not performed unless operation
7 is carried out.
(4) Span Calibration (by standard solution or calibration plate)
(FUNCTION "4")
6-13
This is the operation for normal span calibration (by the calibration plate or standard solution). For
details on value operation and others, see Sections 7.6 and 7.7. Select whether the calibration
plate or standard solution is used in span calibration in FUNCTION "D" in the <PROGRAM1>
mode.
The following is the key operation procedure.
(a) Span calibration with calibration plate
(Example of display)
(1) Select FUNCTION "4" in the <MAINT.> mode. => 0090.5 mg/L
(2) Wait until the display becomes stable, and => 0090.5 mg/L
then press the [ENT] key. The CAL lamp ashes.
(3) Press the [>] key. => 0090.0 mg/L
The preset turbidity value of the
calibration plate is displayed.
(4) Press the [ENT] key to terminate calibration. => 0090.0 mg/L
The display ashes once and the CAL
lamp goes out.
In operation 4 check the difference between the current turbidity value and the calibration plate
turbidity value. If it exceeds the permissible range (±50% of the preset calibration plate turbidity
value), "Err24" is displayed. In this case, the "FAIL" lamp is not lit and a FAIL contact is not output.
Reset the error message by pressing the [ENT] key, check that the calibration plate is set in place
and continue operation from step 2.
Also, check the ratio of the current sensitivity (slope) to the reference sensitivity. If the exceeds
the permissible range (50 to 400%), "Err22" is displayed (see Section 5.3 *3).
The error message is reset by pressing the [ENT] key. Perform operation from step 2 again.
At any stage of zero-shift calibration operation, pressing the [MODE] key or [FUNC] key allows
switching to another mode or function. Calibration computation is not performed unless operation
4 is carried out.
Note: At this calibration, the turbidity not multiplied by the correction factor from the zero-shift calibration (zero correction) in (3) or span
calibration (sensitivity correction) in (5) is displayed.
IM 12E04A02-02E 9th Edition : Mar. 16, 2018-00
 Loading...