

Page 1

Time Interval Analyzer
Yokogawa Electric Corporation
IM 704210-01E
1st Edition
Page 2

Foreword
Notices
Trademarks
Thank you for purchasing the YOKOGAWA TA320 Time Interval Analyzer.
This user’s manual contains useful information about the functions and operating methods of the
instrument. It also contains precautions that should be observed during use. To ensure correct use
of the instrument, please read this manual thoroughly before operating it.
Keep the manual in a safe place for quick reference whenever a question arises.
The following manual is provided with this instrument in addition to this manual.
Manual Name Manual No. Description
TA320 GP-IB Interface IM704210-12E Describes the communication functions for the GP-IB
User’s Manual interface.
• The contents of this manual are subject to change without prior notice as a result of
improvements in the instrument’s performance and functions. Display contents illustrated in
this manual may differ slightly from what actually appears on your screen.
• Every effort has been made in the preparation of this manual to ensure the accuracy of its
contents. However, should you have any questions or find any errors, please contact your
nearest YOKOGAWA representative as listed on the back cover of this manual.
• Copying or reproduction of all or any part of the contents of this manual without
YOKOGAWA’s permission is strictly prohibited.
• MS-DOS is a registered trademark of Microsoft Corporation.
• HP-GL is a registered trademark of Hewlett-Packard Company.
Revisions
• 1st Edition : December 1996
Disk No. HF07
1st Edition: December 1996 (YG)
All Rights Reserved, Copyright © 1996 Yokogawa Electric Corporation
IM 704210-01E
1
Page 3
Checking the Contents of the Package
Unpack the box and check the contents before operating the instrument. If the wrong instrument
or accessories have been delivered, if some accessories are missing or if they appear abnormal,
contact the dealer from which you purchased them.
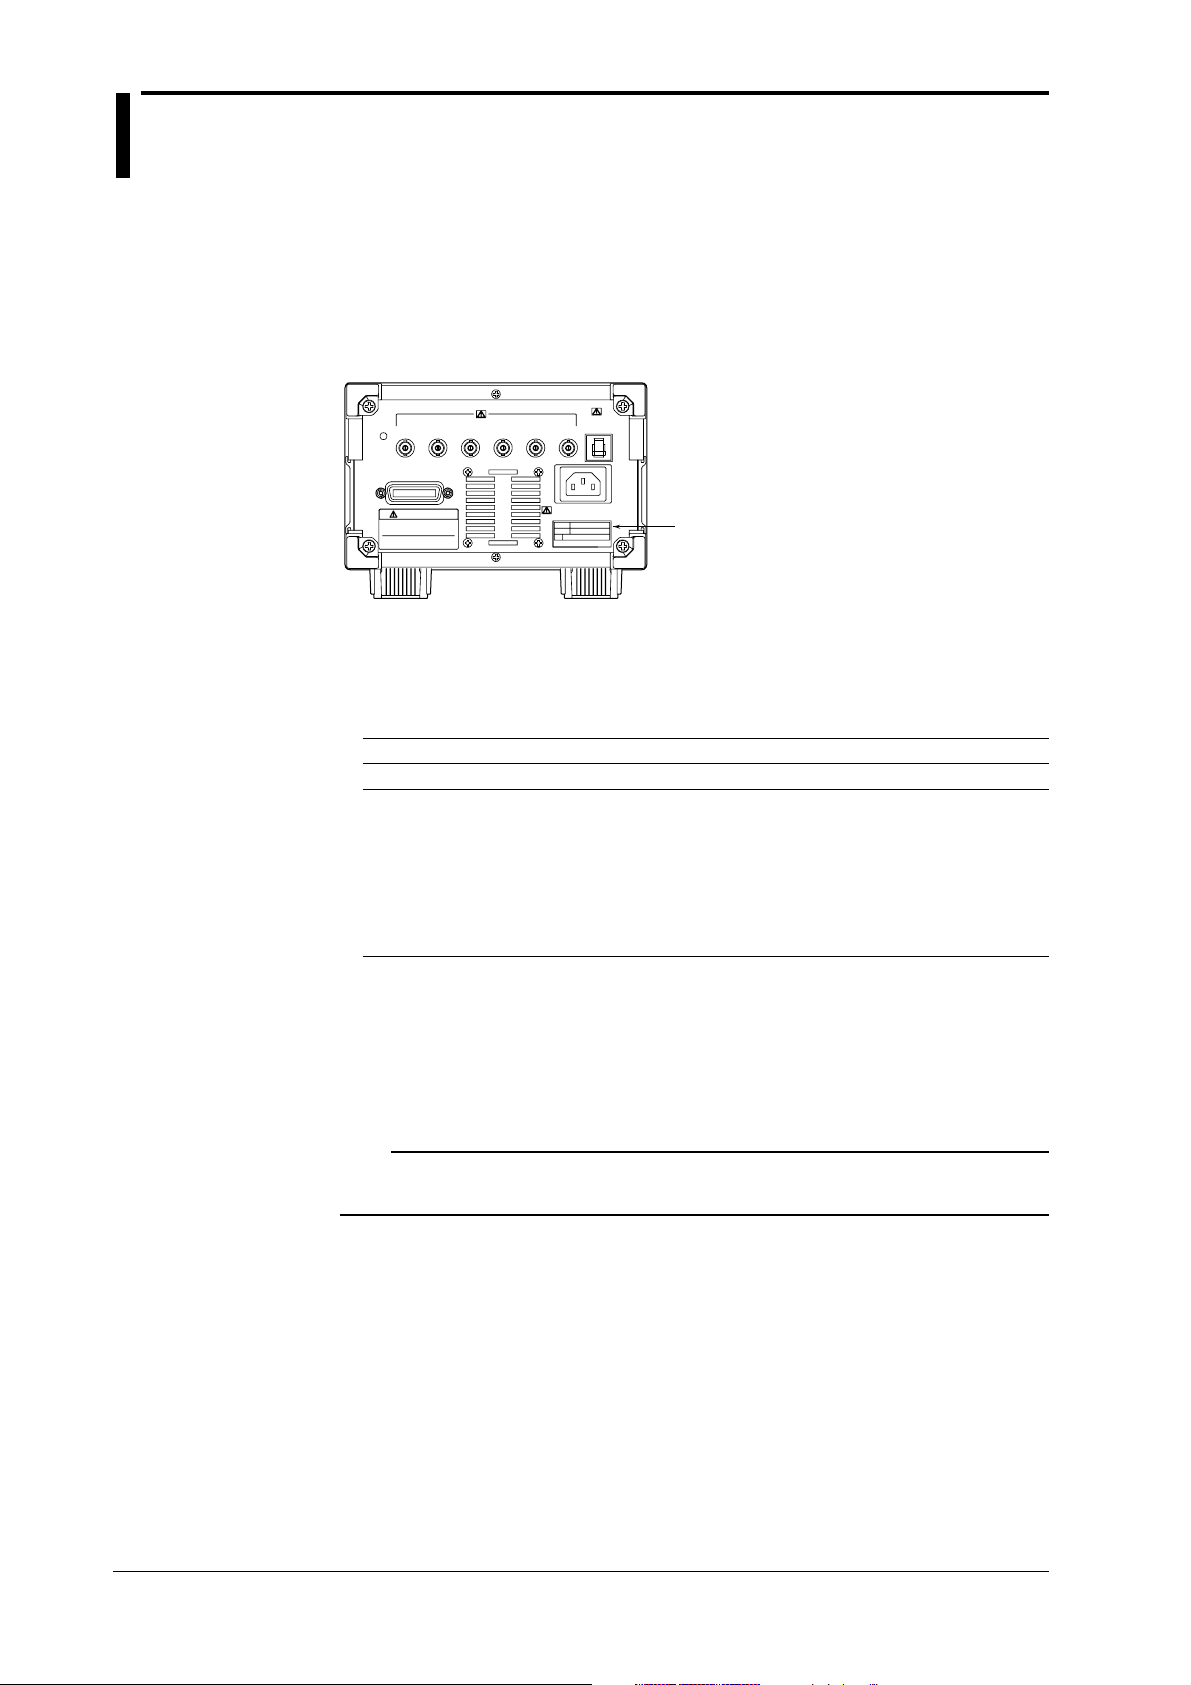
Main Body
Check that the model name and suffix code given on the name plate of the rear panel match those
on your order.
Nameplate
MODEL (Type Name)
704210
SUFFIX (Suffix Code)
Item Suffix Code Specifications
Power voltage •••••••••••••••••••• 100-240 VAC
Power cord -D UL/CSA Standards Power Cord (Part No.: A1006WD)
-F VDE Standard Power Cord (Part No.: A1009WD)
-Q BS Standard Power Cord (Part No.: A1054WD)
-R SAA Standard Power Cord (Part No.: A1024WD)
[Maximum Rated Voltage: 125 V, Maximum Rated Current: 7 A]
[Maximum Rated Voltage: 250 V, Maximum Rated Current: 10 A]
[Maximum Rated Voltage: 250 V, Maximum Rated Current: 10 A]
[Maximum Rated Voltage: 240 V, Maximum Rated Current: 10 A]
NO. (Instrument No.)
When contacting the dealer from which you purchased your instrument, please quote the
instrument No.
Note
It is recommended that the packing box be kept in a safe place. The box can be used when you need to
transport the instrument somewhere.
2
IM 704210-01E
Page 4

Standard Accessories
Checking the Contents of the Package
The following standard accessories are supplied with the instrument. Make sure that all items are
present and undamaged.
Power cord (one of the following power cords
is supplied according to the instrument's suffix codes)
Optional Accessories
UL/CSA standard
A1006WD
D
VDE standard
A1009WD
F Q R
Rubber feet(2pcs)
(A9088ZM(1pc))
BS standard
A1054WD
User's manual
Communication interface
manual
SAA standard
A1024WD
(1pc)
(1pc)
The following optional accessories are available. On receiving these optional accessories, make
sure that all the items that you ordered have been supplied and that they are undamaged.
If you have any questions regarding optional accessories, or if you wish to place an order, contact
the dealer from whom you purchased them.
Part Name Part No. Minimum Q’ty Remarks
150 MHz passive probe 700996 1 Input impedance: 10 MΩ, Length: 1.5 m
BNC cable (1m) 366924 1 BNC-BNC, Length: 1 m
BNC cable (2m) 366925 1 BNC-BNC, Length: 2 m
Rack-mount kit 751533-E3 1 For EIA single mount
Rack-mount kit 751534-E3 1 For EIA dual mount
Rack-mount kit 751533-J3 1 For JIS single mount
Rack-mount kit 751534-J3 1 For JIS dual mount
IM 704210-01E
3
Page 5
Safety Precautions
This instrument is an IEC safety class I instrument (provided with terminal for protective
grounding).
The following general safety precautions must be observed during all phases of operation, service
and repair of this instrument. If this instrument is used in a manner not sepecified in this manual,
the protection provided by this instrument may be impaired. Also, YOKOGAWA Electric
Corporation assumes no liability for the customer’s failure to comply with these requirements.
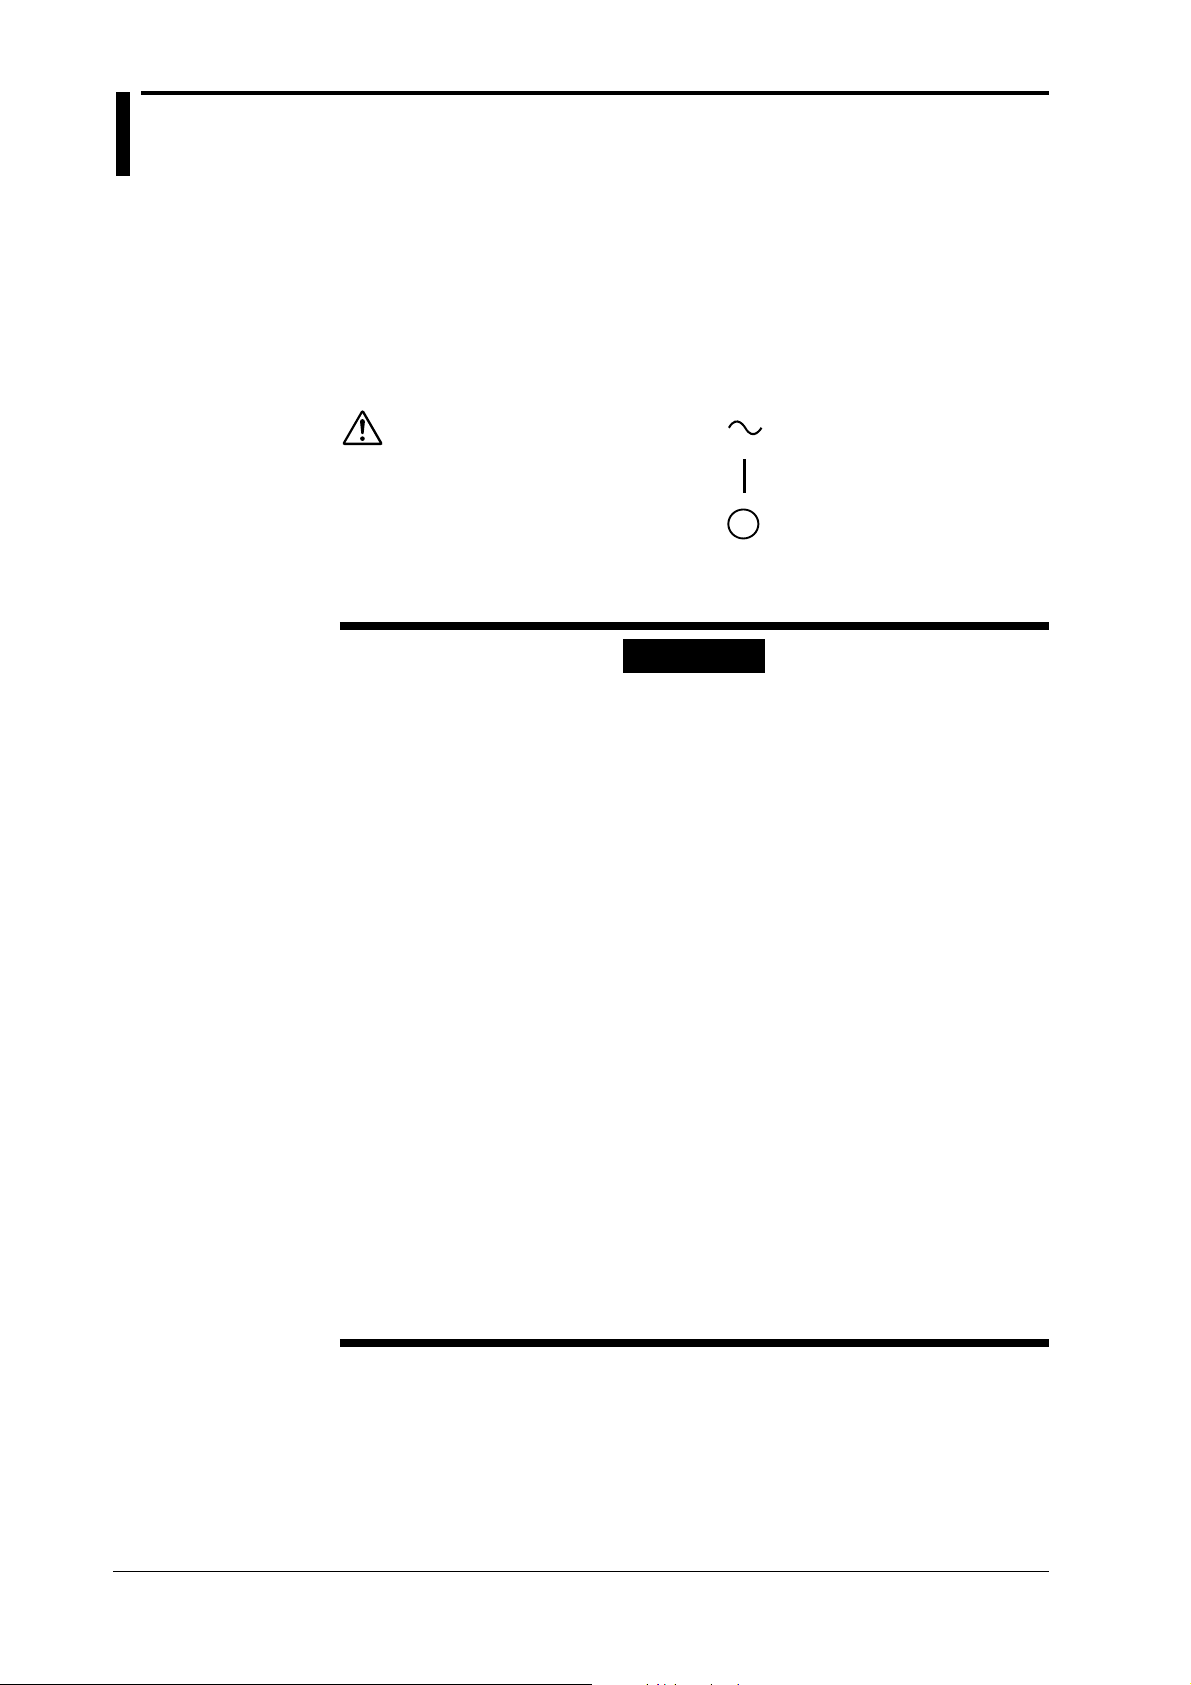
The following symbols are used on this instrument.
To avoid injury, death of personnel
or damage to the instrument, the
operator must refer to an explanation
in the User’s Manual or Service
Manual.
Make sure to comply with the following safety precautions. Not complying might
result in injury, death of personnel or damage to the instrument.
Alternating current.
ON(power).
OFF(power).
WARNING
Power Supply
Ensure the source voltage matches the voltage of the power supply before turning ON the
power.
Power Cable and Plug
To prevent an electric shock or fire, be sure to use the power cord supplied by
YOKOGAWA. The main power plug must be plugged in an outlet with protective
grounding terminal. Do not invalidate protection by using an extension cord without
protective grounding.
Protective Grounding
Make sure to connect the protective grounding to prevent an electric shock before
turning ON the power.
Necessity of Protective Grounding
Never cut off the internal or external protective grounding wire or disconnect the wiring
of protective grounding terminal. Doing so poses a potential shock hazard.
Defect of Protective Grounding and Fuse
Do not operate the instrument when protective grounding or fuse might be defective.
Do not Operate in an Explosive Atmosphere
Do not operate the instrument in the presence of flammable liquids or vapors. Operation
of any electrical instrument in such an environment constitutes a safety hazard.
Do not Remove any Covers
There are some areas with high voltages. Do not remove any cover if the power supply is
connected. The cover should be removed by qualified personnel only.
External Connection
To ground securely, connect the protective grounding before connecting to measurement
or control unit.
4
IM 704210-01E
Page 6

Structure of the Manual
This User’s Manual consists of 12 chapters and an Index as described below.
Chapter1 Functions
Describes the measuring principles and functions of the instrument. No description is given for
operating methods, however it is recommended that this chapter be read before operating the
instrument to gain a basic understanding of what the instrument can do.
Chapter2 Name and Use of Each Part
Describes the name and function of each part of the instrument. For keys and rotary knob,
reference sections (or page numbers) are also given.
Chapter3 Before Starting Measurement
Describes usage precautions, how to install the instrument, connect the power cord, turn the
power switch ON/OFF, connect a probe and set the date and time.
Chapter4 Common Operations
Describes how to start and stop acquisition of a measuring input signal and set a numerical value
using the ten-key.
Chapter5 Setting the Sampling Mode and Measurement Function (Item)
Describes how to set the sampling mode and measurement function (item).
Chapter6 Setting the Acquisition Conditions for Input Signal to be Measured
Describes how to set the acquisition conditions for the input signal to be measured, including
input coupling, input impedance, trigger mode and trigger level, gate type, sample size and
sampling interval, arming source, slope, delay types, and inhibit.
Chapter7 Displaying the Measured/Computed Data
Describes how to display a histogram, time variation, list of measured data and statistic values,
and how to set multi-window, panorama display and histogram data addition functions.
Chapter8 Storing and Recalling the Set-up Information from the Internal Memory
Describes how to store the set-up information to the internal memory and how to recall the stored
set-up information and change it.
Chapter9 Saving and Loading the Data from a Floppy Disk
Describes how to save data such as set-up information, measured/computed results and screen
image to a floppy disk, load the saved data, format a floppy disk and delete data.
Chapter10 Using Other Functions
Describes how to output measured data to a plotter, input/output the reference signal, output
monitor signals, initialize the set-up information, calibrate the instrument, set the screen contrast
and set the touch key sound.
Chapter11 Troubleshooting and Maintenance
Describes corrective actions to be taken in case of problems and their causes, describes error
messages, how to use the error logging and self-test functions, adjust the time base, carry out the
performance test and reset the circuit breaker.
Chapter12 Specifications
Describes the specifications of the instrument.
Index
Describes important terms.
IM 704210-01E
5
Page 7
Notations and Symbols Used in this Manual
Procedure
Explanation
Unit
k :1000 (e.g. 100 kHz)
K :1024 (e.g. 640 KB (floppy disk memory capacity))
Symbols Used
The following symbols are used in this User’s Manual.
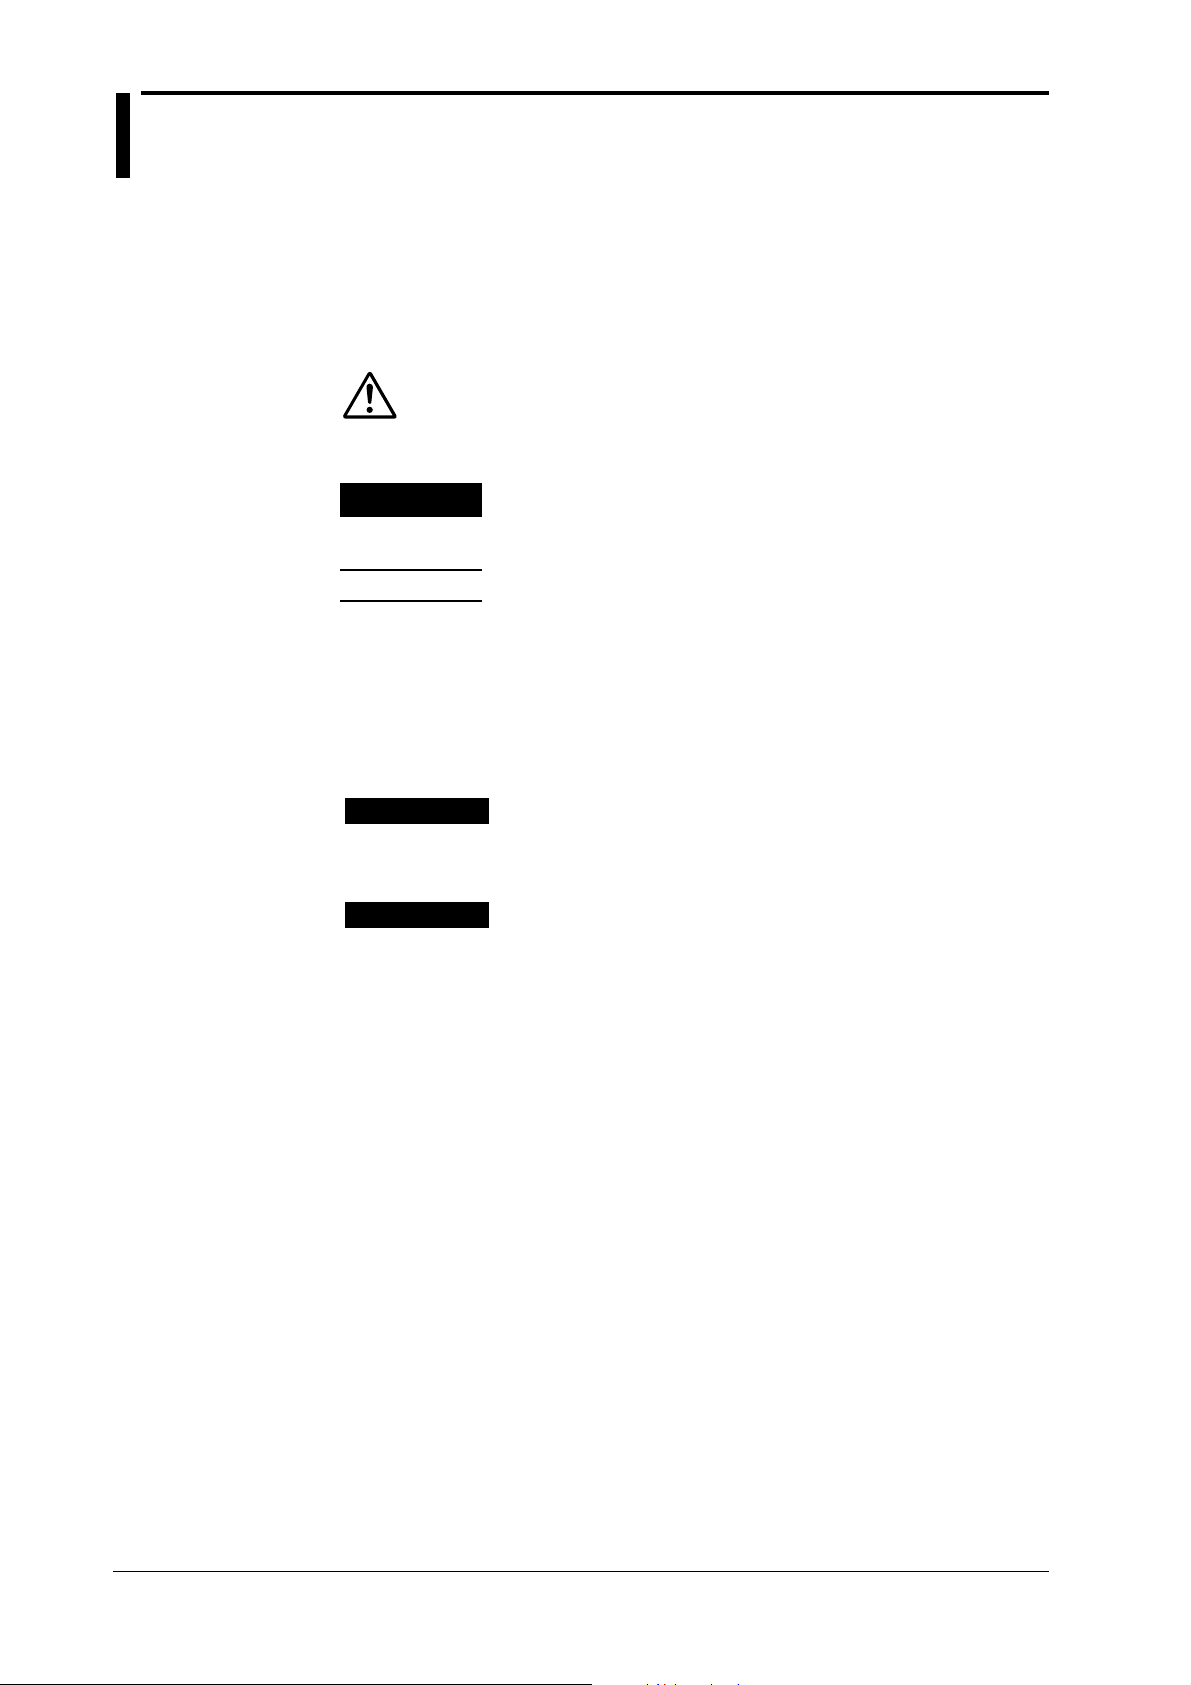
To avoid injury or death of personnel, or damage to the instrument, the
operator must refer to the User’s Manual. In the User’s Manual, these
symbols appear on the pages to which the operator must refer.
WARNING
CAUTION
Note
Symbols used on pages where description of operation is given
The following symbols are used in chapters 3 to 11, to classify descriptions.
Procedure
Explanation
Describes precautions that should be observed to prevent the danger of
serious injury or death to the user.
Describes precautions that should be observed to prevent the danger of
minor or moderate injury to the user, or the damage to the property.
Provides information that is important for proper operation of the
instrument.
Describes keys to be used and operating procedure. With some operating
procedures, it is not necessary to carry out the steps according to the order
in which they are described.
Gives a detailed description of settings and restrictions regarding
operations. No detailed description is given for the function. For a
detailed description of the function, refer to Chapter 1.
6
IM 704210-01E
Page 8

Contents
Foreword ........................................................................................................................................................................................ 1
Checking the Contents of the Package .......................................................................................................................... 2
Safety Precautions ................................................................................................................................................................... 4
Structure of the Manual .......................................................................................................................................................... 5
Notations and Symbols Used in this Manual ............................................................................................................... 6
Chapter 1 Functions
1.1 System Configuration and Block Diagram.........................................................................................................1-1
1.2 Measuring Principles and Sampling Mode......................................................................................................... 1-2
1.3 Measurement Functions (Measurement Items) .................................................................................................. 1-3
Period, Time Interval ............................................................................................................................................................... 1-3
Pulse Width, Phase Difference, Duty Ratio ............................................................................................................................. 1-4
1.4 Computation ....................................................................................................................................................... 1-5
Readout Function ..................................................................................................................................................................... 1-5
Calculation, Statistical Computation Items ............................................................................................................................. 1-6
1.5 Setting the Acquisition Conditions for Input Signal to be Measured .................................................................1-8
Input Coupling, Input Impedance, Measurement Block .......................................................................................................... 1-8
Trigger Mode/Trigger Level, Gate .......................................................................................................................................... 1-9
Sample Size (Number of Events), Sampling Interval, Arming, Arming Delay ..................................................................... 1-10
Inhibit ......................................................................................................................................................................................1-11
1.6 Displaying the Measured/Computed Data........................................................................................................ 1-12
Histogram Display, Multi-window .........................................................................................................................................1-12
Panorama Display, Histogram Data Addition, Time Variation Display ................................................................................ 1-13
List Display, Statistics Display ...............................................................................................................................................1-14
1.7 Other Functions
External Signal Input/Output (Rear Panel), Communications, Storing and Recalling of Set-up Information, Saving and
Loading Data from a Floppy Disk, Auto Loading of Set-up Information, Plotter Output, Initialization of Set-up
Information, Calibration .................................................................................................................................................. 1-16
Numeric Value Setting, Contrast, Touch-key Sound, Error Logging, Self-test ..................................................................... 1-17
1
2
3
4
5
6
7
8
9
Chapter 2 Name and Use of Each Part
2.1 Front Panel.......................................................................................................................................................... 2-1
2.2 Rear Panel ........................................................................................................................................................... 2-2
Chapter 3 Before Starting Measurement
3.1 Usage Precautions .............................................................................................................................................. 3-1
3.2 Installing the Instrument .....................................................................................................................................3-2
3.3 Connecting the Power Cord................................................................................................................................ 3-4
3.4 Turning the Power Switch ON/OFF ...................................................................................................................3-5
3.5 Connecting the Cables/Probes ............................................................................................................................3-6
3-6 Compensating a Probe (Carrying Out Phase Correction)................................................................................... 3-7
3.7 Setting the Date and Time .................................................................................................................................. 3-9
10
11
12
Index
IM 704210-01E
7
Page 9

Contents
Chapter 4 Common Operations
4.1 Starting/Stopping Acquisition of a Measuring Input Signal .............................................................................. 4-1
4.2 Setting Numerical Values ...................................................................................................................................4-2
Chapter 5 Setting the Sampling Mode and Measurement Function (Item)
5.1 Selecting the Sampling Mode .............................................................................................................................5-1
5.2 Setting Period Measurement............................................................................................................................... 5-2
5.3 Setting Time Interval Measurement ................................................................................................................... 5-4
5.4 Setting Pulse Width Measurement .....................................................................................................................5-6
5.5 Setting Phase Difference Measurement.............................................................................................................. 5-8
5.6 Setting Duty Ratio Measurement .....................................................................................................................5-10
Chapter 6 Setting the Acquisition Conditions for Input Signal to be Measured
6.1 Setting the Input Coupling, Input Impedance, Trigger Mode and Trigger Level .............................................. 6-1
6.2 Setting the Gate Type, Sample Size and Sampling Interval ...............................................................................6-3
6.3 Setting the Arming Source, Slope and Delay Types .......................................................................................... 6-6
6.4 Setting the Inhibit Function ................................................................................................................................6-9
Chapter 7 Displaying the Measured/Computed Data
7.1 Setting the Histogram Display Function and Reading the Data (Readout) ........................................................7-1
7.2 Using the Multi-window Function ..................................................................................................................... 7-5
7.3 Using the Panorama Display Function ...............................................................................................................7-9
7.4 Carrying out Histogram Data Addition ............................................................................................................ 7-11
7.5 Setting the Time Variation Display Function and Reading the Data (Readout) .............................................. 7-13
7.6 Selecting the List Display Function and Displaying the Data ..........................................................................7-17
7.7 Selecting the Statistics Display Function and Reading the Statistic Data ........................................................7-19
7.8 Selecting the Histogram Display Function and Displaying the Statistic Data ................................................. 7-21
Chapter 8 Storing and Recalling the Set-up Information from the Internal Memory
8.1 Storing the Set-up Information in the Internal Memory .....................................................................................8-1
8.2 Recalling the Set-up Information from the Internal Memory ............................................................................ 8-2
Chapter 9 Saving and Loading the Data from a Floppy Disk
9.1 Points to Note during Use of the Floppy Disk Drive .........................................................................................9-1
9.2 Formatting a Floppy Disk ...................................................................................................................................9-2
9.3 Saving, Loading and Auto Loading the Set-up Information .............................................................................. 9-4
9.4 Saving and Loading the Measured and Computed Data .................................................................................... 9-7
9.5 Saving the Screen Image Data ..........................................................................................................................9-10
9.6 Auto Saving the Screen Image Data .................................................................................................................9-12
9.7 Deleting Saved Data .........................................................................................................................................9-13
Chapter 10 Using Other Functions
10.1 Outputting Data to a Plotter .............................................................................................................................. 10-1
10.2 Inputting and Outputting the Reference Signal ................................................................................................10-5
10.3 Outputting the Monitor Signal.......................................................................................................................... 10-7
10.4 Initializing the Set-up Information ...................................................................................................................10-8
10.5 Calibrating the Instrument ..............................................................................................................................10-10
10.6 Setting the Screen Contrast ............................................................................................................................ 10-11
10.7 Turning the Touch-key Sound ON/OFF......................................................................................................... 10-12
8
IM 704210-01E
Page 10

Chapter 11 Troubleshooting and Maintenance
11.1 Troubleshooting................................................................................................................................................11-1
11.2 Messages...........................................................................................................................................................11-2
11.3 Using the Error Logging Function ................................................................................................................... 11-4
11.4 Executing the Self-test ...................................................................................................................................... 11-5
11.5 Adjusting the Time Base .................................................................................................................................. 11-8
11.6 Carrying out the Performance Test................................................................................................................... 11-9
11.7 Circuit Breaker ............................................................................................................................................... 11-19
Chapter 12 Specifications
12.1 Measuring Inputs and Trigger .......................................................................................................................... 12-1
12.2 Measurement Functions (Measurement Items) ................................................................................................ 12-2
12.3 Gate, Arming, Inhibit ....................................................................................................................................... 12-4
12.4 Display .............................................................................................................................................................. 12-5
12.5 Inputs/Outputs (Rear Panel) ............................................................................................................................. 12-7
12.6 GP-IB Interface ................................................................................................................................................ 12-8
12.7 Time Base .........................................................................................................................................................12-8
12.8 Internal Memory Function ................................................................................................................................ 12-8
12.9 Built-in Floppy Disk Drive............................................................................................................................... 12-8
12.10 General Specifications ......................................................................................................................................12-9
12.11 External Dimensions ...................................................................................................................................... 12-10
Index
Contents
1
2
3
4
5
6
7
8
9
10
11
12
Index
IM 704210-01E
9
Page 11
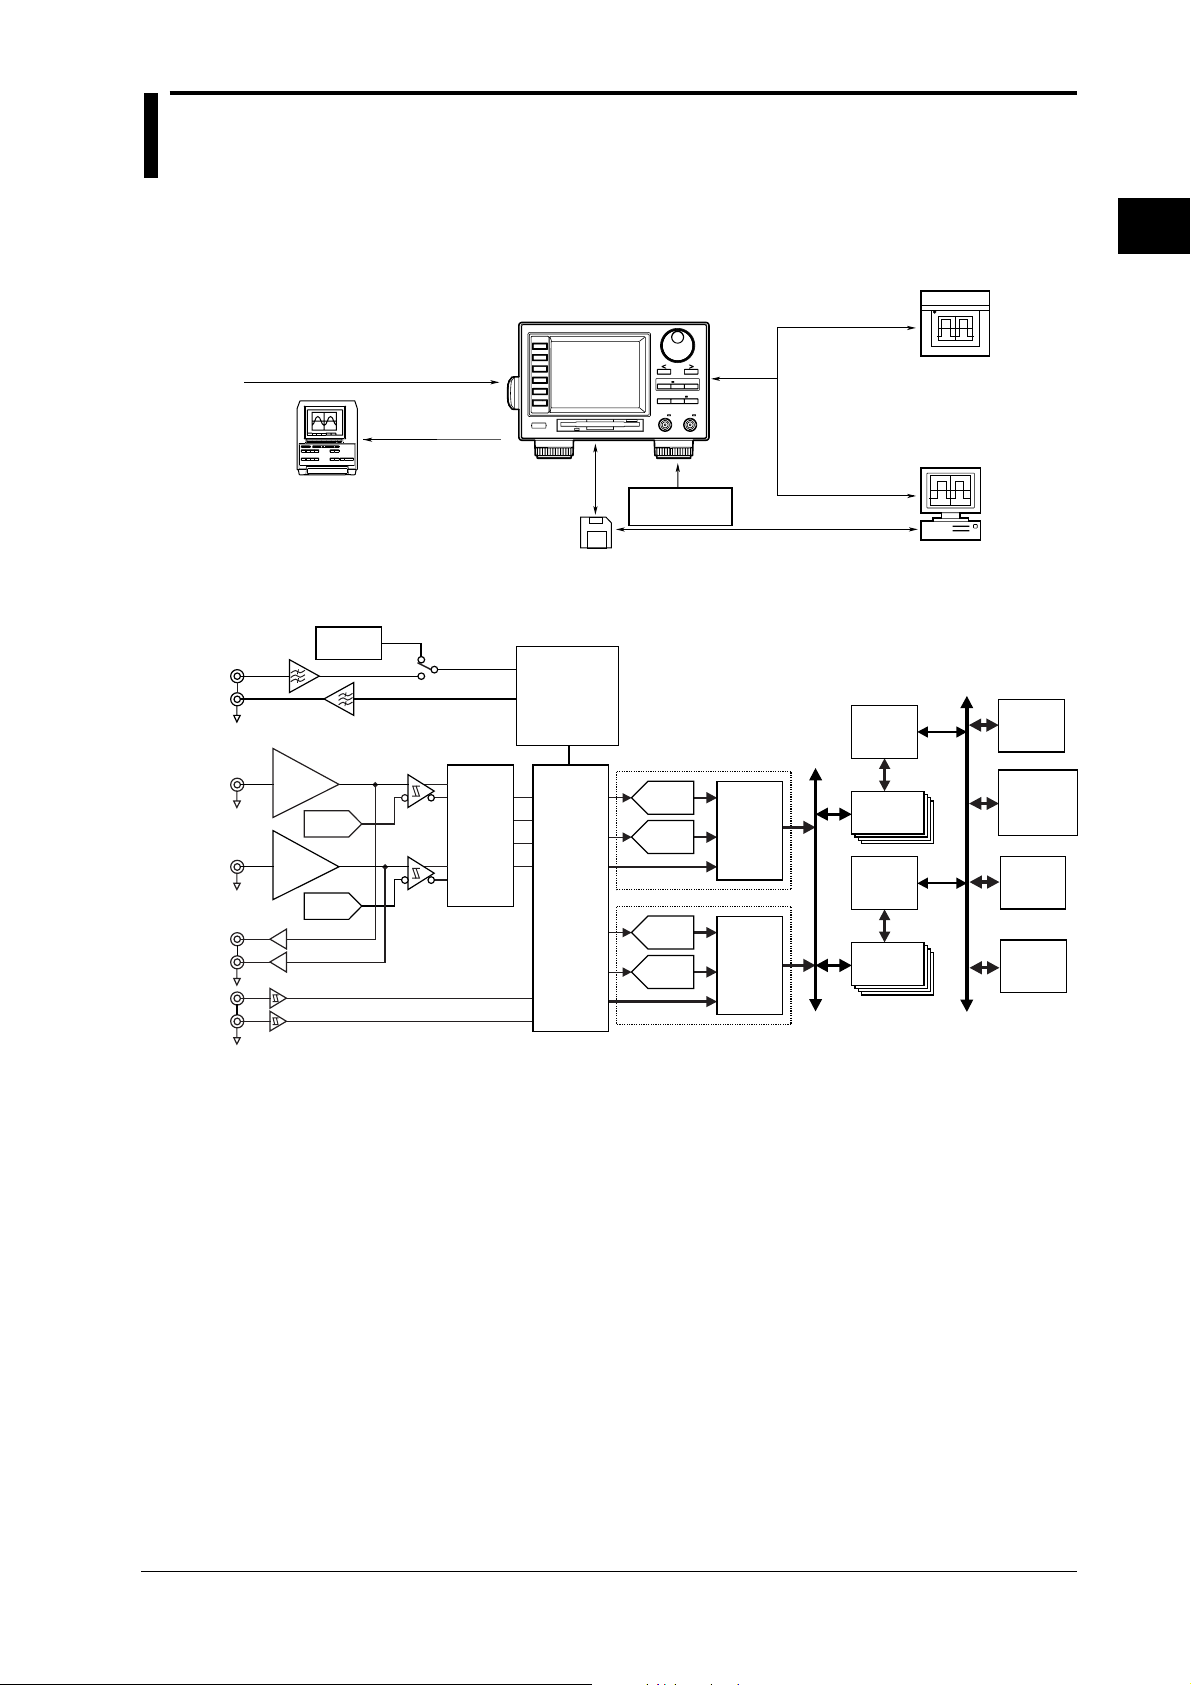
1.1 System Configuration and Block Diagram
System Configuration
HP-GL compatible plotter
• Hard copy
• Set-up information list
Inhibit input
External arming input (the terminal
is shared with external gate input)
Reference input
Block Diagram
IN
Ach IN
Bch IN
10MHz
10MHz
Amplifier
Amplifier
Reference
Reference
OUT
Ach Monitor
OUT
Bch Monitor
OUT
EXT ARM IN
INHIBIT IN
10MHz-TCXO
Reference
Clock
Input
Trigger
DAC
Input
Trigger
DAC
External Arming Signal
Inhibit Signal
Monitor output
Reference output
Comparator
Signal
Comparator
Multiplexer
PLL
Clock
Generator
Clock
Measuring
Controller
&
Fractional
Pulse
Generator
Input signal
Object to be
measured
Saving and loading of
data from a floppy disk
Time Measuring Unit 1
T/V
Converter
T/V
Converter
Time Measuring Unit 2
T/V
Converter
T/V
Converter
Counter
Generator
Counter
Generator
Personal computer
• Remote control
• Data collection/analysis
Communication
Contoroller
&
Data
Contoroller
Acquisition BUS
&
Data
Memory
Acquisition
Memory 1
Memory
Acquisition
Memory 2
CPU BUS
CPU
LCD
&
Touch Panel
GP-IB
FDD
1
Functions
IM 704210-01E
Signal Flow
The signal input to the input terminal (Ach IN, Bch IN) is converted into a low-impedance signal
by the input amplifier. It is then sent to the comparator, where it is converted to a binary signal.
At the same time, the signal from the input amplifier is output as a monitor signal via the output
terminal (Ach Monitor OUT, Bch Monitor OUT).
The signal multiplexer selects the binary signal according to the selected measurement function
(item), then the signal is input to the measuring controller. The measuring controller controls
measurement and creates fractional pulse according to the external arming signal and inhibit
signal. The width of the fractional pulse is measured, with a resolution of 100 ps, by the T/V
converter of the time measuring unit (1, 2), and then compared with the value on the digital
counter, to provide measured data. With continuous measurement, two time measuring units (1,
2) are activated alternately.
In time stamp mode (see the following page), both measured value and time stamp data (elapsed
time) are acquired in each acquisition memory (1, 2). In hardware histogram mode (see the
following page), the frequency of each measured value (i.e. number of the same measured values)
is acquired in each acquisition memory. The acquired data is then sent via the memory controller
to a CPU, where it is used for statistical computation or displayed on the LCD.
Either the signal from the internal crystal oscillator (compensated against temperature drift) or an
external reference signal (input to the Reference IN terminal) can be used as the reference clock.
In either case, the reference clock is output through the 10-MHz band pass filter to the Reference
OUT terminal.
1-1
Page 12
1.2 Measuring Principles and Sampling Mode
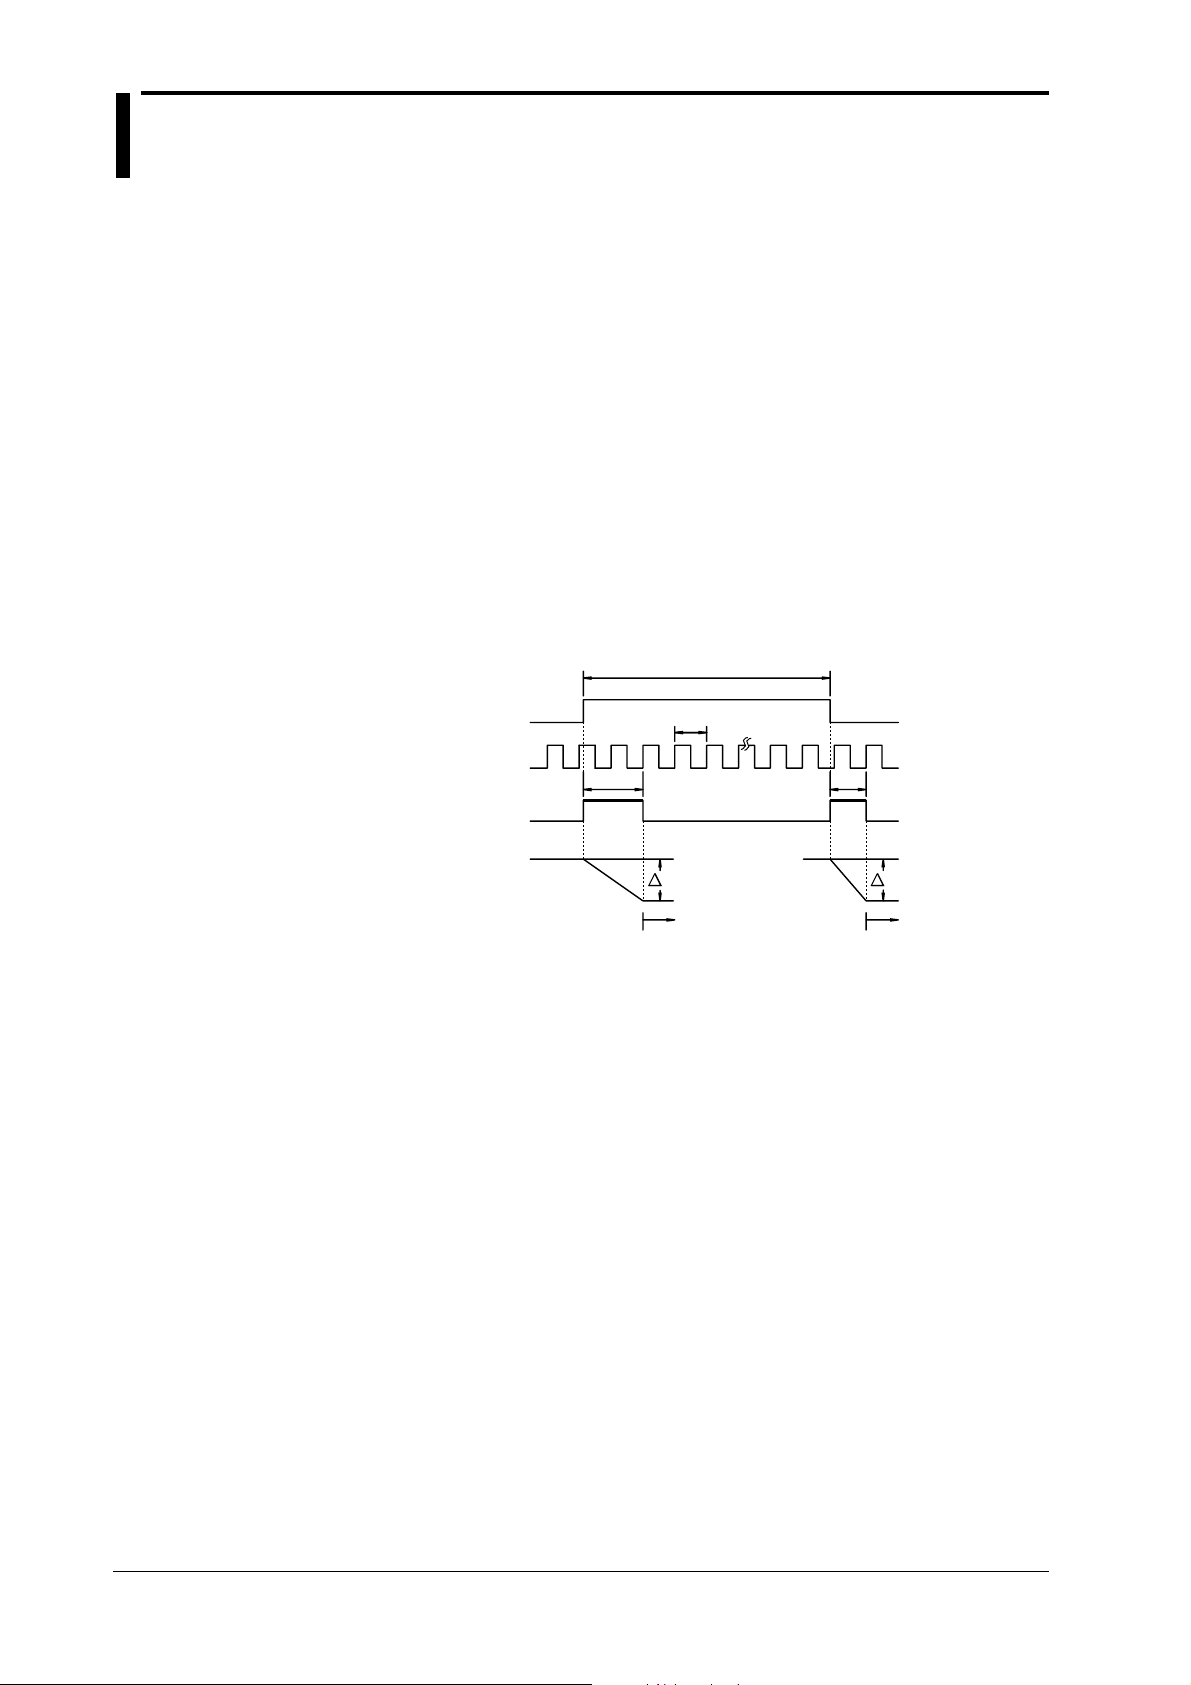
Measuring Principles
Time shorter than the period of the reference clock is called fractional time. In general, since the
signal to be measured is not synchronized with the reference clock, fractional time exists at both
beginning and end of measurement. This instrument generates a fractional pulse comprised of the
fractional time and the time equivalent to one cycle of the reference clock.
With the pulse width of the signal to be measured, period of the reference clock and time span of
each fractional pulse assumed to be T, t
multiplication of the period of the reference clock (N • t
and Tb) as shown below.
, Ta and Tb respectively, T can be separated into
0
) and period of each fractional pulse (T
0
a
T = N • t
With this instrument, T
+ (Ta – Tb)
0
and Tb, the time of fractional pulses generated at the beginning and end
a
of measurement, are converted into a voltage value, which is then converted into a digital value
by a 8-bit A/D converter. This enables measurement of the time of fractional pulse, with time
resolution of 100 ps per 1 LSB. T is calculated by substituting the measured time of each
fractional pulse for T
Signal to be measured
Reference clock
Fractional pulse
Time-voltage conversion
and Tb of the above formula.
a
12
T
a
V =k·T
aa
A/D conversion A/D conversion
T =N·t + (T –T )
k: A/D conversion factor
T
t
0
0
Sampling Mode ≡For operating procedure, refer to 5.1≡
Two sampling modes are available: time stamp mode and hardware histogram mode. The
sampling method (acquisition method of measured data) and display format (display method)
differ depending on the sampling mode. For a detailed description of display format, refer to 1.6,
“Displaying the Measured/Computed Data”.
N
T
b
V =k·T
b b
b
a
1-2
Time stamp mode
Measured values and their time stamps (i.e. the time on which measurement is taken) are acquired
into the acquisition memory, and used as time-series data. The maximum sample size (i.e. the
maximum allowable number of data items to be acquired) is 32,000, though it varies depending
on the measurement function (refer to section 1.3). The measured values can be displayed in four
formats (histogram, list (measured values and time stamp), time variation and statistic values.
* Time stamp is expressed as the elapsed time between that when arming is activated (refer to
section 1.5) and when measurement for one sample is completed.
Hardware histogram mode
The measured value and its occurrence frequency are acquired into the acquisition memory. The
maximum sample size (i.e. the maximum allowable number of data items to be acquired) is
99,999,999. The measured values can be displayed in three formats (histogram, list (measured
values and frequency) and statistic values.).
IM 704210-01E
Page 13
1.3 Measurement Functions (Measurement Items)
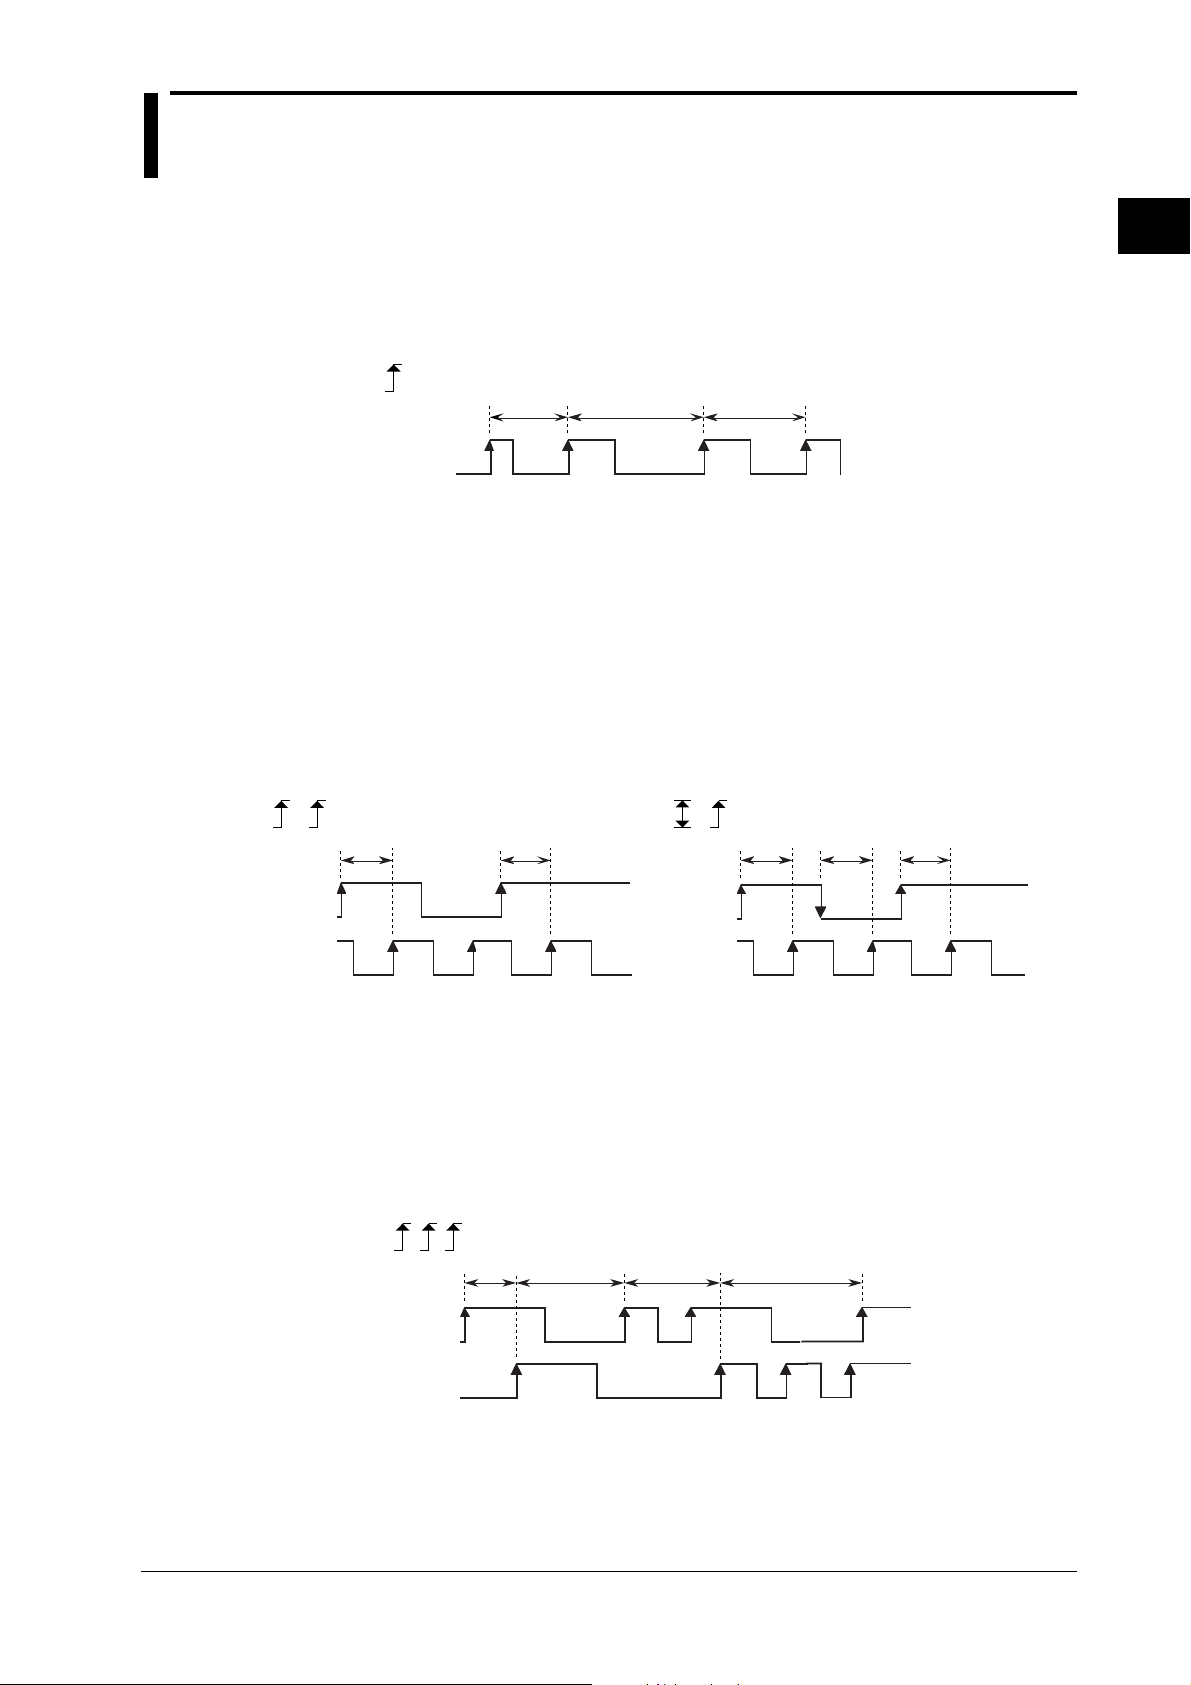
Period ≡For operating procedure, refer to 5.2≡
The time from a rising (or falling) edge to the next rising (or falling) edge of the input signal is
measured. Either rising or falling edge can be selected, and channel A or B can be selected for
measurement.
Example (rising slope is selected)
Measured Measured Measured
CH A/
CH B
Time Interval ≡For operating procedure, refer to 5.3≡
The time interval between the signal input to channel A and that input to channel B is measured.
The following two types of time interval can be measured.
A-to-B interval
The time interval between an edge of the signal input to channel A and the first edge of the signal
input to channel B is measured. Various combinations of edges can be selected as follows. For a
description of combinations of slopes, refer to 5.3, “Setting Time Interval Measurement”.
1
Functions
Example (Both channels A and B: rise)
AB
Measured
Measured
CH A
CH B
A-to-B-to-A interval
The time interval between an edge of the signal input to channel A and the first edge of the signal
input to channel B, and the time interval between an edge of the signal input to channel B and the
subsequent edge of the signal input to channel A are measured. For a description of combinations
of slopes, refer to 5.3, “Setting Time Interval Measurement”.
Example (All three edges: rise)
ABA
Measured
CH A
Example (Channel A: both rise and fall, channel B: rise)
A
B
Measured Measured Measured
CH A
CH B
MeasuredMeasured Measured
IM 704210-01E
CH B
1-3
Page 14
1.3 Measurement Functions (Measurement Items)
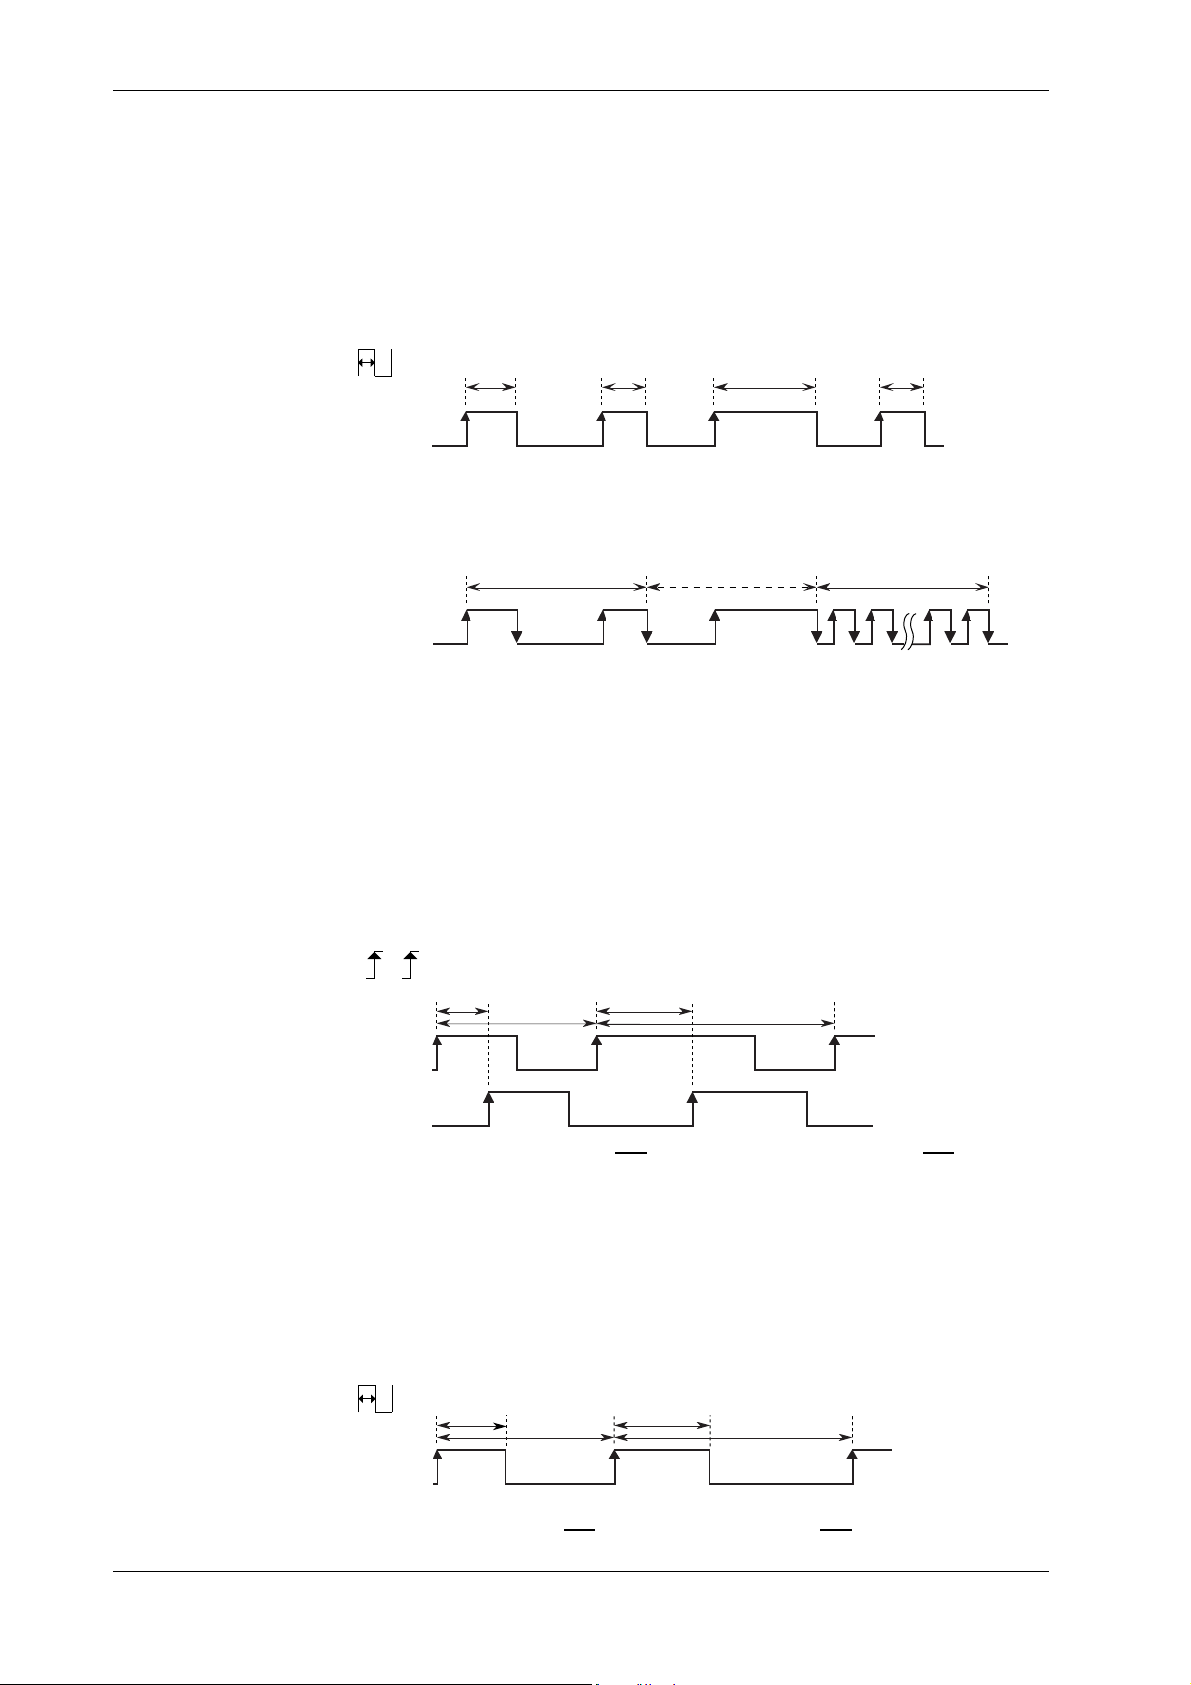
Pulse Width ≡For operating procedure, refer to 5.4≡
The time between a rising (or falling) edge and the next falling (or rising) edge of the input signal
is measured. For selection of combinations of polarity, refer to 5.4, “Setting Pulse Width
Measurement”. A special combination of polarity, in which a time constant T (see section 1.4) is
specified to carry out measurement only when the period of the pulse is within the specified time
range (22T±0.5T). This combination is called “22T”. For measurement of pulse width, channel
A or B can be selected.
Example (positive: rising to falling)
Measured Measured Measured Measured
CH A/
CH B
Example (22T)
22T
Measured when
within 22T ±0.5T
CH A/
CH B
Not measured when
not within 22T ±0.5T
Measured when
within 22T ±0.5T
Phase Difference ≡For operating procedure, refer to 5.5≡
The time between an edge of the signal input to channel A and an edge of the signal input to
channel B is measured, and the measured value is then expressed in phase difference (deg) in
relation to the period of the signal input to channel A which is set as 360 degrees. This
measurement is available only when time stamp mode is selected as the sampling mode. For a
description of combinations of slopes, refer to 5.5, “Setting Phase Difference Measurement”.
Example (Both channels A and B: rise)
AB
Duty Ratio
Measuredtp1
Measuredt1 Measuredt2
Measuredt
CH A
CH B
1[deg]=
≡≡
≡For operating procedure, refer to 5.6
≡≡
The ratio of the time between a rising (or falling) edge and the next falling (or rising) edge in
relation to one period of the input signal is measured. This measurement is available only when
time stamp mode is selected as the sampling mode. For measurement of duty ratio, channel A or
B can be selected.
t
t
p2
p1
× 360 2[deg]=
1
Phase difference
t
p2
× 360Phase difference
t
2
≡≡
≡
≡≡
1-4
Example (rising to falling)
CH A/
CH B
Measuredt
Duty ratio
p1
Measuredt
1
[
%
]=
t
p1
t
1
Measuredt
1
× 100
p2
Duty ratio
Measuredt
2[ ]=
%
2
t
p2
t
× 100
2
IM 704210-01E
Page 15
1.4 Computation
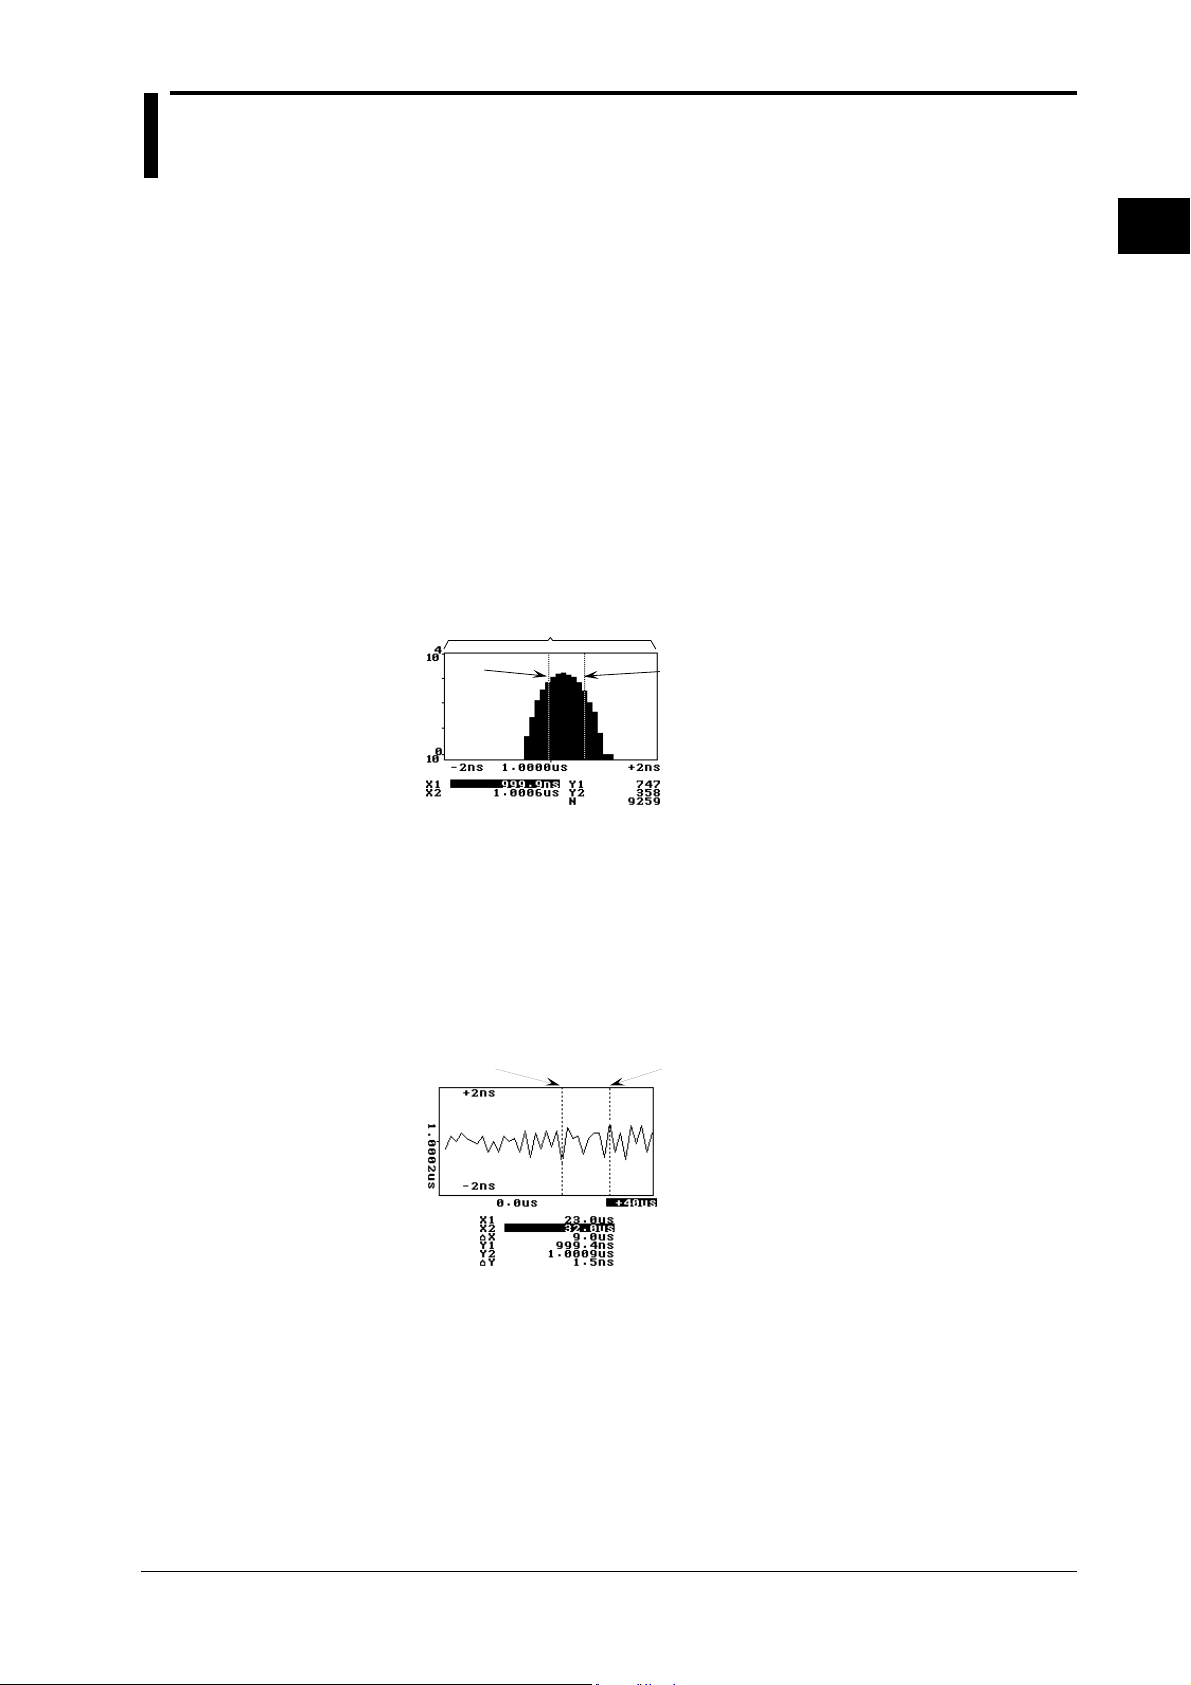
Readout Function ≡For operating procedure, refer to 7.1 and 7.5≡
If histogram or time variation display format is selected (see 1.6), two markers (X1 and X2) will
be displayed. This enables reading out of the coordinates of each cross-point of the markers and
the histogram (or time variation). In addition, selecting a calculation area (see the following
page) enables statistical computation for the area enclosed by the markers.
Histogram display format
The meaning of each value displayed at the bottom of the screen is given below.
X1: X-axis coordinate of X1 marker (measured value)
Y1: Y-axis coordinate of X1 marker (frequency of X1)
X2: X-axis coordinate of X2 marker (measured value)
Y2: Y-axis coordinate of X2 marker (frequency of X2)
N:
• WINDOW selected as calculation area: Total number of samples within the window
• MARKER selected as calculation area: Number of samples present within the area enclosed
by X1 and X2 markers
Window
X1 marker
X2 Marker
1
Functions
Time variation display format
The meaning of each value displayed at the bottom of the screen is given below.
X1: X-axis coordinate of X1 marker (time stamp)
X2: X-axis coordinate of X2 marker (time stamp)
∆X: X2 - X1
Y1: Y-axis coordinate of X1 marker (measured value)
Y2: Y-axis coordinate of X2 marker (measured value)
∆Y: |Y2 – Y1|
X1 marker
X2 Marker
IM 704210-01E
1-5
Page 16

1.4 Computation
Calculation ≡For operating procedure, refer to 7.1 and 7.7≡
The following functions are available to select/set parameters required for statistical computation.
Selecting the calculation area
This function allows the user to select whether to carry out statistical computation using the
measured values present in the entire window of a histogram or using those present within the
area enclosed by the markers.
Setting the constant
This function allows the user to set the constant T to be used for calculation of jitter 1 (σ/T) or
jitter 2 (|AVE - X
| / T) or the one to be used for measurement of pulse width (22T).
center
Statistical Computation Items ≡For operating procedure, refer to 7.1 and 7.8≡
Statistical computation can be carried out using measured values. Computation results can be
displayed if histogram or statistic display format is selected (see 1.6). The entire area of a
histogram (i.e. entire window area) or the area enclosed by the X1 and X2 markers can be used as
the calculation area. The formula may differ depending on the sampling mode.
Time stamp mode
In the following formulas, “n” indicates the number of samples and X
value for each sample.
indicates the measured
i
• Maximum value (MAX)
Indicates the largest value among the measured values.
MAX=[Xi]
max
• Minimum value (MIN)
Indicates the smallest value among the measured values.
MIN= [Xi]
min
• Average value (AVE)
Calculates the average of the measured values.
n
AVE =
• Standard deviation (
1
X
Σ
i
n
i=1
σσ
σ)
σσ
Calculates the standard deviation of the measured values. Standard deviation indicates degree of
dispersion.
n
σ =
1
n
Σ (
i=1
Xi– AVE)
2
• Peak to peak (P-P)
Calculates the difference between the maximum and minimum values.
1-6
P–P= MAX– MIN
•Flutter (
σσ
σ/AVE)
σσ
Calculates flutter. Flutter indicates degree of dispersion in percentage in relation to the average
value.
σ / AVE =
σ
AVE
× 100(%)
IM 704210-01E
Page 17

1.4 Computation
Hardware histogram mode
In the following formulas, “n” indicates the number of bins of a histogram. “Bin” refers to each
bar of the histogram and indicates frequency of the same measured data. X
indicates the class
i
value of each bin. The width of bins varies depending on the specified span of X-axis, and may
be as small as 100 ps. In this case, X
indicates the measured value. For details, refer to 1.6.
i
• Maximum value (MAX)
Indicates the largest value among the class values.
1
Functions
MAX=[Xi]
max
• Minimum value (MIN)
Indicates the smallest value among the class values.
MIN= [Xi]
min
• Average value (AVE)
Calculates the average value of the histogram. Pi indicates relative frequency (*).
n
Σ
i=1
Xi× P
i
AVE =
*Pi can be calculated using the formula “Pi = Ni / N” when the total number of samples to be
used for statistical computation is N and frequency (number of samples) of a bin is N
• Standard deviation (
σσ
σ)
σσ
Calculates the standard deviation of the histogram. Standard deviation indicates degree of
dispersion. P
indicates relative frequency.
i
n
1
=
σ
Xi– AVE)2× P
Σ (
n
i=1
i
• Peak to peak (P-P)
Calculates the difference between the maximum and minimum values.
.
i
P–P= MAX– MIN
• Flutter (
σσ
σ/AVE)
σσ
Calculates flutter of the histogram. Flutter indicates degree of dispersion in percentage in relation
to the average value.
σ
AVE
× 100(%)
• Jitter 1 (
σ / AVE =
σσ
σ/T)
σσ
Constant T is used to calculate jitter 1 of the histogram. Jitter 1 indicates degree of dispersion in
percentage in relation to constant T.
σ /T=
σ
T
× 100(%)
• Jitter 2 (MELE, Maximum Effect Length Error)
Constant T is used to calculate jitter 2 of the histogram. X
X-axis in the window. For details, refer to 1.6. X
means the value around which measured
center
values are distributed. Jitter 2 indicates deviation of the average value from X
indicates the center value of
center
center
in percentage
in relation with constant T.
ME LE=
| AVE–X
T
CENTER
|
× 100(%)
IM 704210-01E
1-7
Page 18

1.5 Setting the Acquisition Conditions for Input Signal to be Measured
Input Coupling ≡For operating procedure, refer to 6.1≡
When you want to measure only (AC components) of the input signal or only the signal
overlapping with the specified DC voltage, measurement can be facilitated if DC components are
removed from the signal. In other cases, you may want to measure all the AC and DC
components of the input signal. In these cases, an appropriate input coupling can be selected.
The following input coupling methods are available.
AC coupling
The signal is input to the amplifier through a capacitor. AC coupling is used to measure only the
amplitude of the input signal by removing DC components or measure only the signal which
overlaps the specified DC voltage.
Input terminal
DC coupling
The signal is input directly to the amplifier. DC coupling is used to measure all the AC and DC
components of the input signal
Input terminal
Input
amplifier
Input
amplifier
Input Impedance ≡For operating procedure, refer to 6.1≡
To reduce attenuation or distortion of the signal to be measured, an input impedance can be
selected from 50 Ω and 1 MΩ to match the output impedance of the source of the signal.
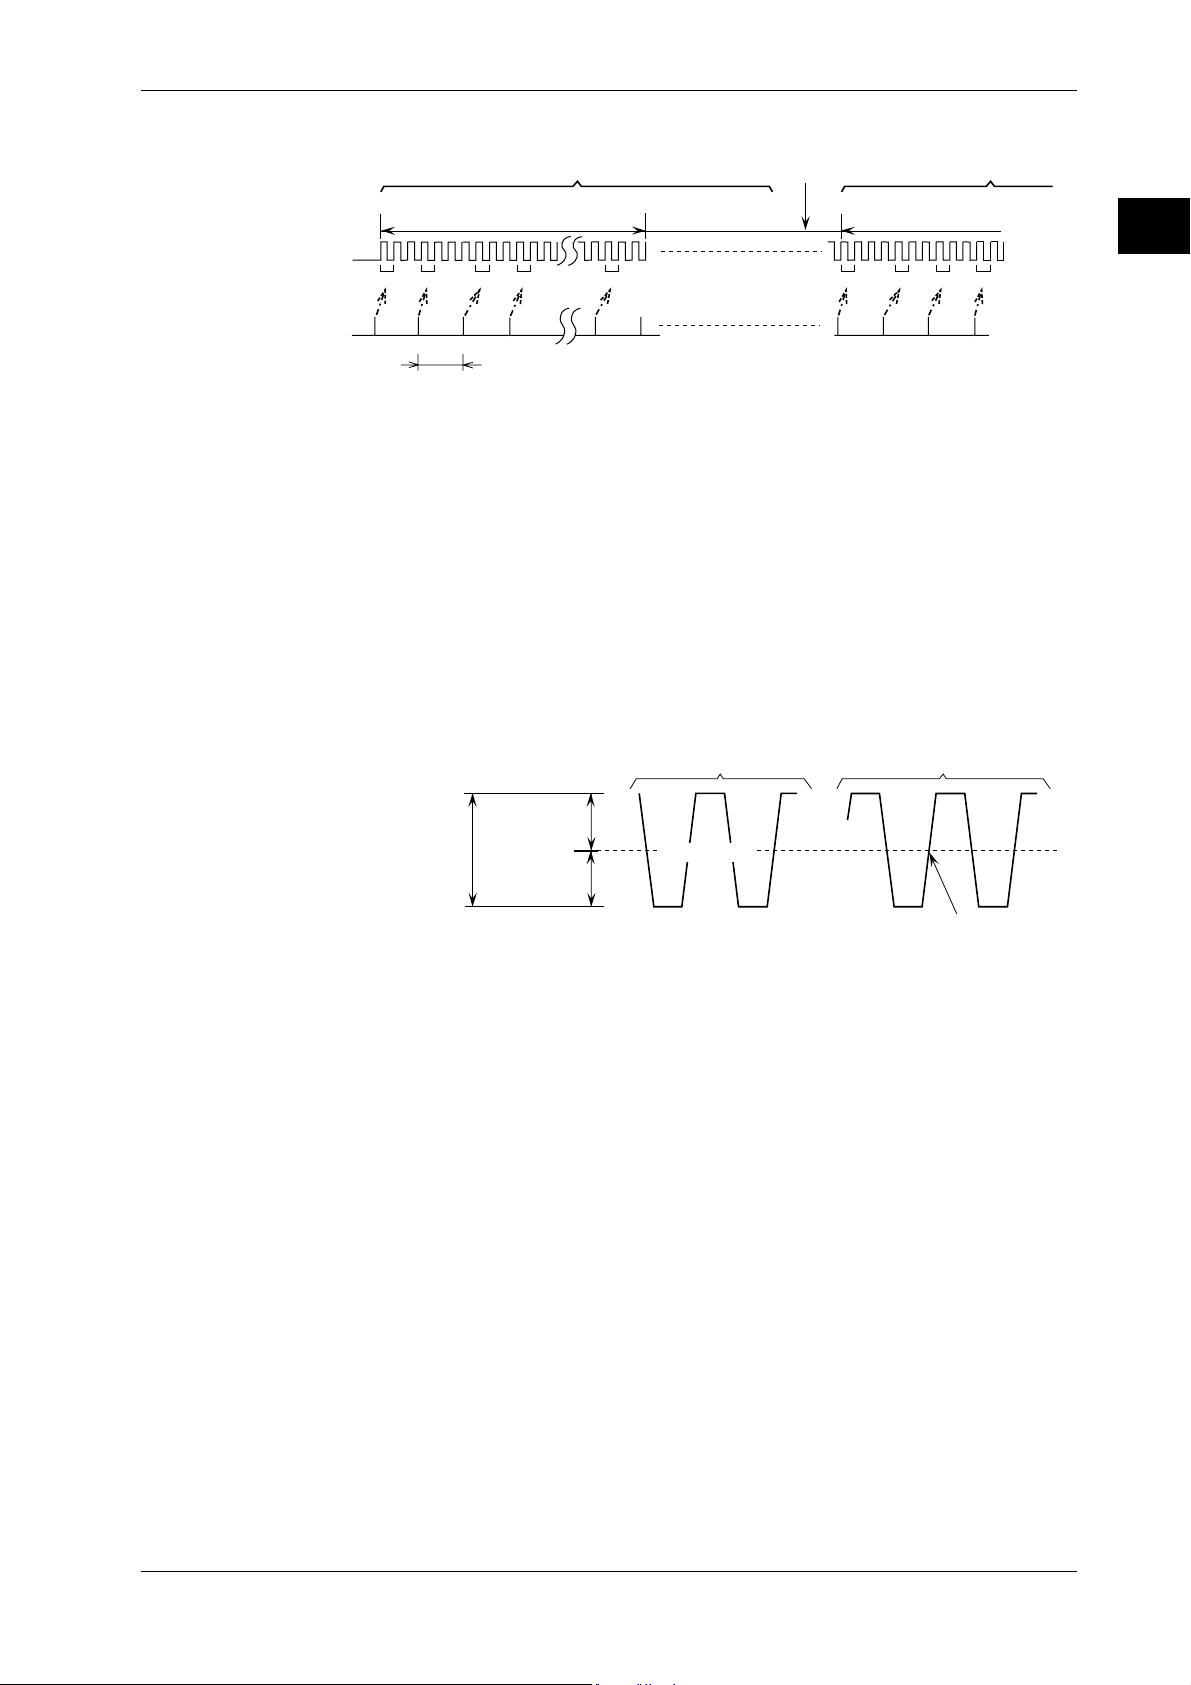
Measurement Block
The instrument carries out a series of processes, from measurement to data processing and
display, repeatedly. The minimum block of each series of processes is called “measurement
block”. When the number of samples (number of data items) for each series is assumed to be N,
each series of processes (measurement, processing and display of N samples) is called “one-block
measurement”.
Samples S1, S2, S3 to SN within the measurement block are measured as shown below by
sampling pulses P1, P2, P3 to PN generated at the specified sampling intervals. (For setting the
sampling intervals, refer to page 1-10.)
1-8
Input signal
Sampling
pulse
When the period of the input signal is longer than the sampling interval
1 block 1 block
Measurement block Measurement block
S1 S2 S3 SN
P1 P2 P3 P4 P2 P3 P4
Sampling interval
Data processing,
display
Preparation
for measurement
S1 S2 S3
IM 704210-01E
Page 19
Half of
the amplitude
Half of
the amplitude
Amplitude
(Input signal)
Trigger level is set
Measurement block
A trigger is caused.
Trigger level
1.5 Setting the Acquisition Conditions for Input Signal to be Measured
When the period of the input signal is shorter than the sampling interval
Preparation
for measurement
Input signal
Sampling
pulse
1 block
Measurement block
S1
S2 S3 S4 SN S1 S2 S3 S4
P1 P2 P3 P4 P2 P3 P4
Sampling interval
Data processing,
display
Trigger Mode/Trigger Level ≡For operating procedure, refer to 6.1≡
The instrument allows the user to specify the level at which measurement is to be carried out.
This level is called trigger level.
Single auto trigger
The center level of the amplitude of the input signal is set as the trigger level automatically during
the cycle just before the first measurement block. This trigger level will be used for all the
subsequent measurement blocks.
Repeat auto trigger
The center level of the amplitude of the input signal is set as the trigger level automatically during
the cycle just before each measurement block. Unlike the single auto trigger, the trigger level is
set for each measurement block.
1 block
Measurement block
1
Functions
P1PN
Manual trigger
The level set using the rotary knob or front panel keys is set as the trigger level.
Gate ≡For operating procedure, refer to 6.2≡
The instrument allows the user to specify the size of measurement block. Measurement can be
carried out as many as the specified number of events or during the specified gating time (i.e.
while the gate is open). Three types of gate are available.
Event gate
Each sampling is called an event. For instance, one measurement of the period of the input signal
is counted as one event. Up to 32,000 events (16,000 events for duty ratio/phase difference
measurement) can be set in the case of time stamp mode and up to 99,999,999 events can be set in
the case of hardware histogram mode, within 320 seconds following the arming (see the following
page).
Time gate
Gating time of up to 10 seconds can be set. However, the maximum number of events allowed
for the sampling mode must not be exceeded.
External gate
The external arming input terminal (EXT ARM IN) is used to open/close the gate(See the
IM 704210-01E
following page). The gate can be opened for up to 320 seconds, as long as the maximum number
of events allowed for the sampling mode is not exceeded. In addition, it is possible to select
whether to open the gate using the positive or negative edge of the external arming signal.
1-9
Page 20

1.5 Setting the Acquisition Conditions for Input Signal to be Measured
Sample Size (Number of Events)≡For operating procedure, refer to 6.2≡
The allowable number of measured data items to be acquired into the acquisition memory is
called sample size. This setting is required if event gate is selected. Up to 32,000 events (16,000
events for duty ratio/phase difference measurement) can be set in the case of time stamp mode
and up to 99,999,999 events can be set in the case of hardware histogram mode.
Sampling Interval ≡For operating procedure, refer to 6.2≡
The sampling interval is the interval at which a sample is acquired. A sampling pulse (see
“Measurement Block”) is generated at sampling intervals, and measurement is carried out when
the input signal satisfies the trigger conditions (trigger level, slope etc.) after the sampling pulse.
The sampling interval can be set between approximately 71 ns (reciprocal of the maximum
sampling rate 14 MS/s) and 4 ms in the case of time stamp mode. For hardware histogram mode,
the sampling interval is fixed at approximately 71 ns.
Arming ≡For operating procedure, refer to 6.3≡
Measurement of a measurement block is started when arming is activated. Two arming methods
are available: auto arming in which measurement starts immediately when the START key is
pressed or START communication command is issued, and external arming in which
measurement starts when the external arming signal is input.
Auto arming
Arming is activated automatically after the START key is pressed or START communication
command is issued. For auto arming, the internal arming signal is used.
External arming
Arming is activated when the external arming signal is input to the EXT ARM IN terminal
following start of measurement. It is possible to select whether to activate arming using the rising
or falling edge of the external arming signal.
ArmingStart of measurement
Measurement
block
Arming Delay ≡For operating procedure, refer to 6.3≡
With the external arming method, it is possible to delay measurement until a certain time elapses
or the specified number of events occur following activation of arming. The following two
arming delay methods are available.
Time delay
Measurement starts after the specified time (up to 1 second) has elapsed.
Event delay
Measurement starts after the specified number of events (up to 30,000) have occurred.
1-10
IM 704210-01E
Page 21
1.5 Setting the Acquisition Conditions for Input Signal to be Measured
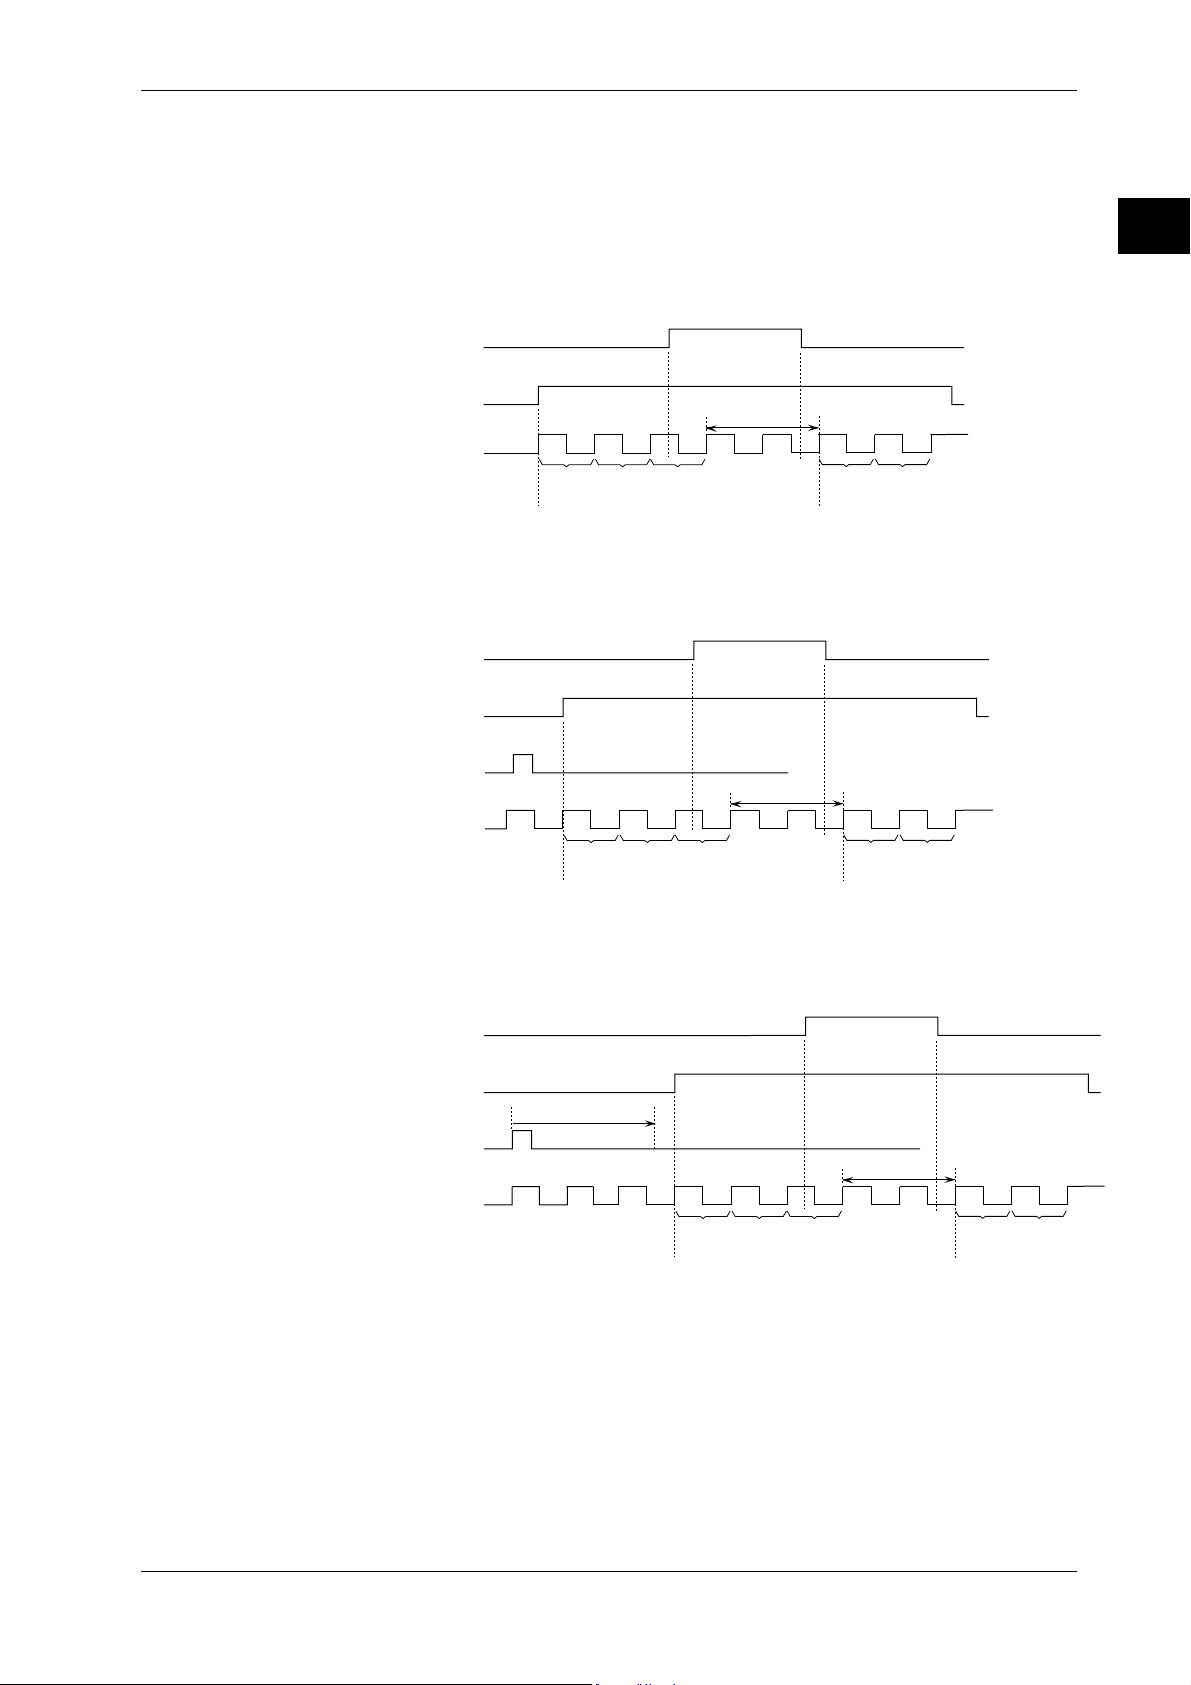
Inhibit ≡For operating procedure, refer to 6.4≡
Measurement can be inhibited by inputting the inhibit signal to the INHIBIT IN terminal. This is
also possible while the gate is open or during measurement following the arming delay.
Measurement can be inhibited for up to 320 seconds. In addition, it is possible to select whether
to inhibit measurement using the positive or negative edge of the inhibit signal.
Relation between the inhibit signal and gating
Mesurement is inhibited.
Inhibit signal
1
Functions
Gate
Input signal
Gate is open.
S1 S2 S3
Start of measurement
Not counted as an
event during inhibition
of measurement.
Not measured.
S4 S5
Measurement is resumed.
Relation between the inhibit signal and gating/external arming
Inhibit signal
Gate is open.
Gate
External arming
Input signal
S1 S2 S3
Start of measurement
Mesurement is inhibited.
Not measured.
S4 S5
Measurement is resumed.
Not counted as an
event during inhibition
of measurement.
Relation between the inhibit signal and gating/external arming/arming delay
Mesurement is inhibited.
Inhibit signal
Gate is open.
Gate
Arming delay
External arming
Not measured.
Input signal
S1 S2 S3
Start of measurement
Not counted as an
event during inhibition
of measurement.
S4 S5
Measurement
is resumed.
IM 704210-01E
1-11
Page 22
1.6 Displaying the Measured/Computed Data
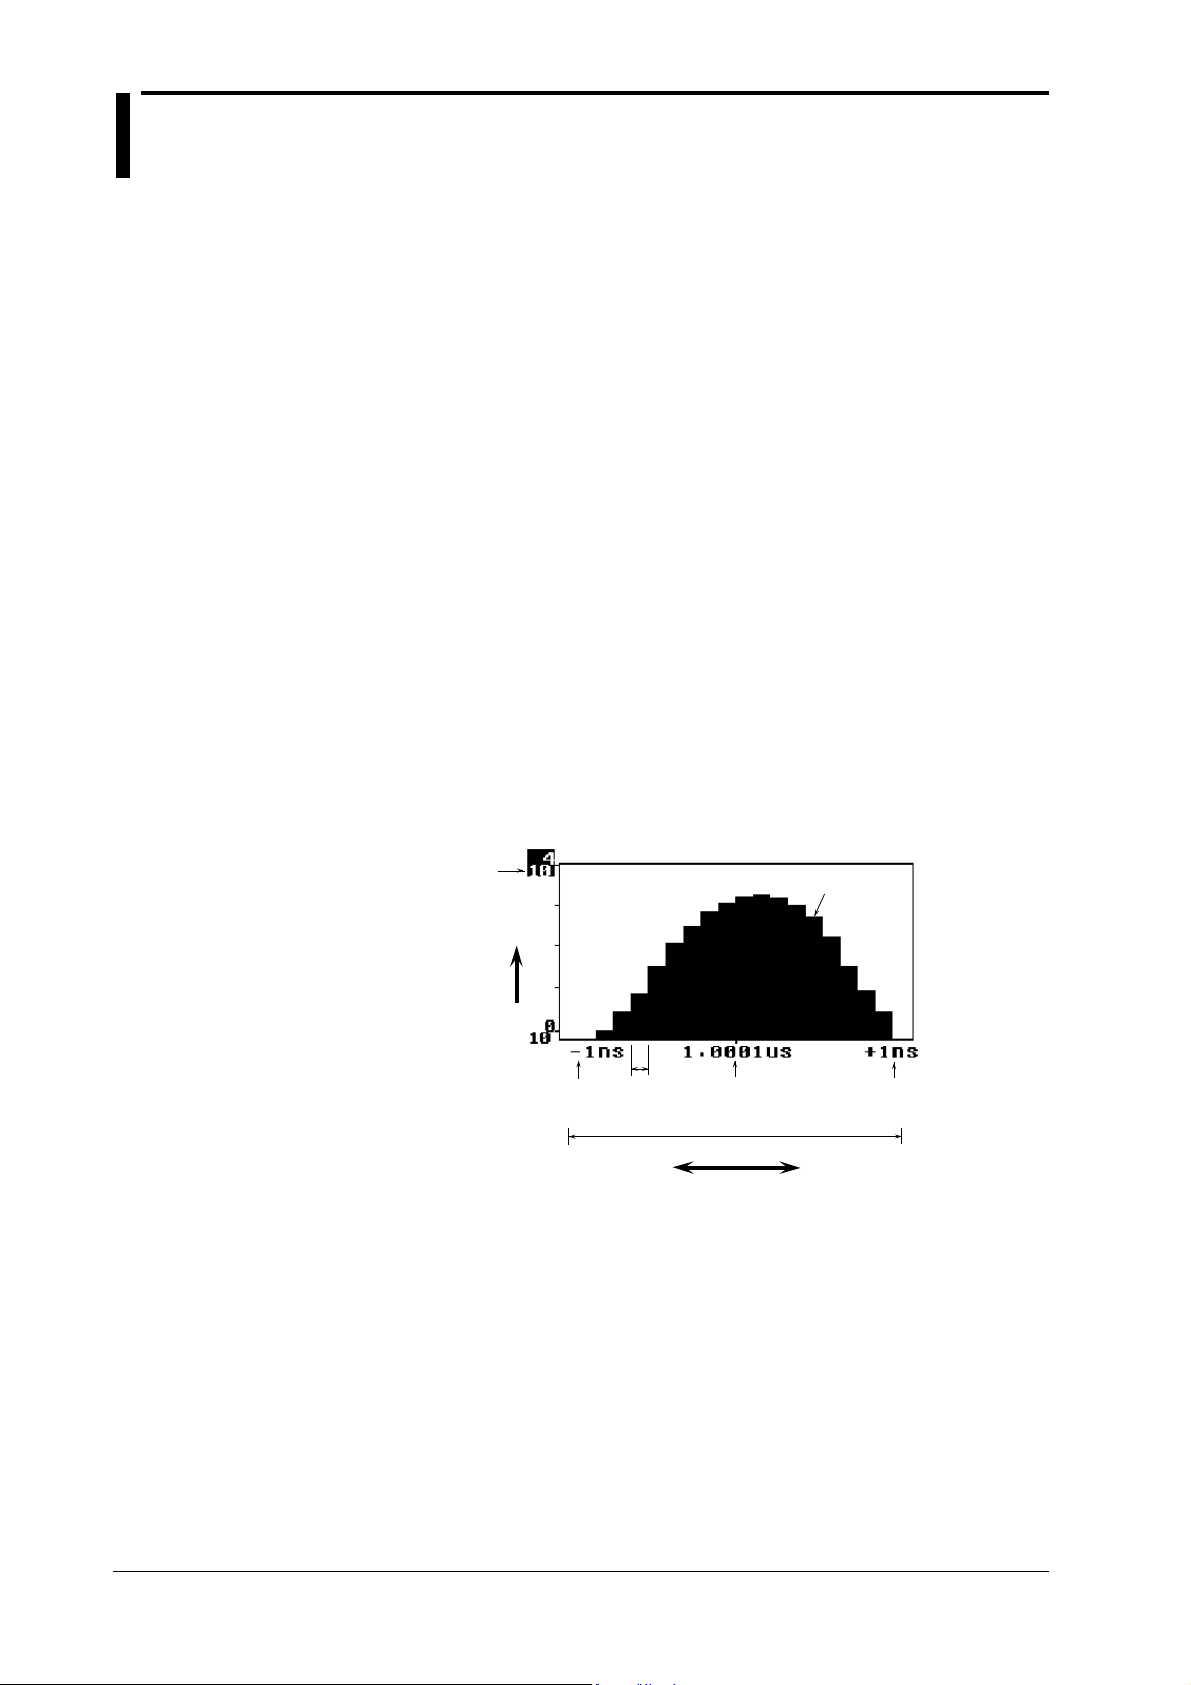
Histogram Display ≡For operating procedure, refer to 7.1≡
A histogram of measured data is displayed for each measurement block to allow the user to
observe data distribution. Although period, phase difference or duty ratio can be set for the
X-axis and frequency for the Y-axis manually, they can be set automatically using the auto
scaling function. The following items can be set manually.
•Center value of X-axis
• Span of X-axis
• Y-axis scale (linear or logarithmic scale)
• Maximum value of Y-axis
• Space between the center values of X-axis (This setting is required when you are using the
multi-window function in hardware histogram mode.) For a description of the multi-window
function, refer to “Multi-window” on this page.
Histogram displayed when time stamp mode is selected or when hardware
histogram mode is selected and only one window is used (i.e. multi-window function
is OFF)
A histogram is displayed according to the settings made for the above items.
If a class has a time span, for instance, if the minimum and maximum values in the class are
505 ns and 515 ns, respectively, 510 ns will be treated as the class value, and samples in this class
are all considered as 510 ns. If the measured values in this class are all the same, they will be
treated as the class value. Each value given along the X-axis as shown below indicates either the
class value or displacement. A histogram is created as the number of samples in each class are
accumulated.
Y-axis scale (logarithmic scale is used in this example)
Maximum value of Y-axis
Y-axis
(frequency)
Class
Left-end value of X-axis
(negative displacement from
the center value of X-axis)
Span of X-axis (2 ns in this example)
Center value of X-axis
(Class value of
the center class)
X-axis (time)
Histogram displayed when hardware histogram mode is selected and more than two
windows are used (i.e. multi-window function is ON)
Refer to “Multi-window” and “Panorama Display” given in this section.
Multi-window ≡For operating procedure, refer to 7.2≡
If data for a measurement block is distributed along more than two center values of X-axis, more
than two histograms will be created. Although all the histograms can be displayed within one
window, it is possible to set more than two windows to allow each histogram to be displayed in its
own window. This function is called the multi-window function. Up to 16 windows can be set.
An example of a window is shown in “Panorama Display” on the following page.
Using the multi-window function in conjunction with the panorama display function enables the
user to recognize easily which histogram is currently displayed.
Each bar is called a bin.
Right-end value of X-axis
(positive displacement from
the center value of X-axis)
1-12
IM 704210-01E
Page 23
1.6 Displaying the Measured/Computed Data
Panorama Display ≡For operating procedure, refer to 7.3≡
A panorama bar is displayed at the top of the screen during hardware histogram mode. The
panorama bar shows all the histograms of measured data. The histogram currently displayed in
the window is enclosed by “ marks,” so that the user can easily understand which histogram
is currently displayed.
Window 1 Window 2 Window 3 Window 4
Panorama bar
1
Functions
Maximum value of Y-axis
(frequency)
Left-end value of X-axis
(negative displacement from
the center value of X-axis)
Y-axis
Left-end value of
the panorama bar
Center value of X-axis
mark
Right-end value of
the panorama bar
(Class value of
the center class)
Span of X-axis
(40 ns in this example)
X-axis (time)
Right-end value of X-axis
from the center value of X-axis)
Histogram Data Addition ≡For operating procedure, refer to 7.4≡
It is possible to add the histogram of each window specified using the SIZE touch key during
multi-window setting, and display the resulting histogram in a single window. The frequency of
the bin located at the center value of X-axis of each histogram is added, and then the frequency of
each bin located on the left and right of that bin is similarly added. This enables comparison of
data distribution between histograms and global statistical computation of all the histograms.
Histogram for
window 1
Histogram for
window 2
Resulting histogram
Window
(Window 1 is displayed
in this example)
(positive displacement
+
=
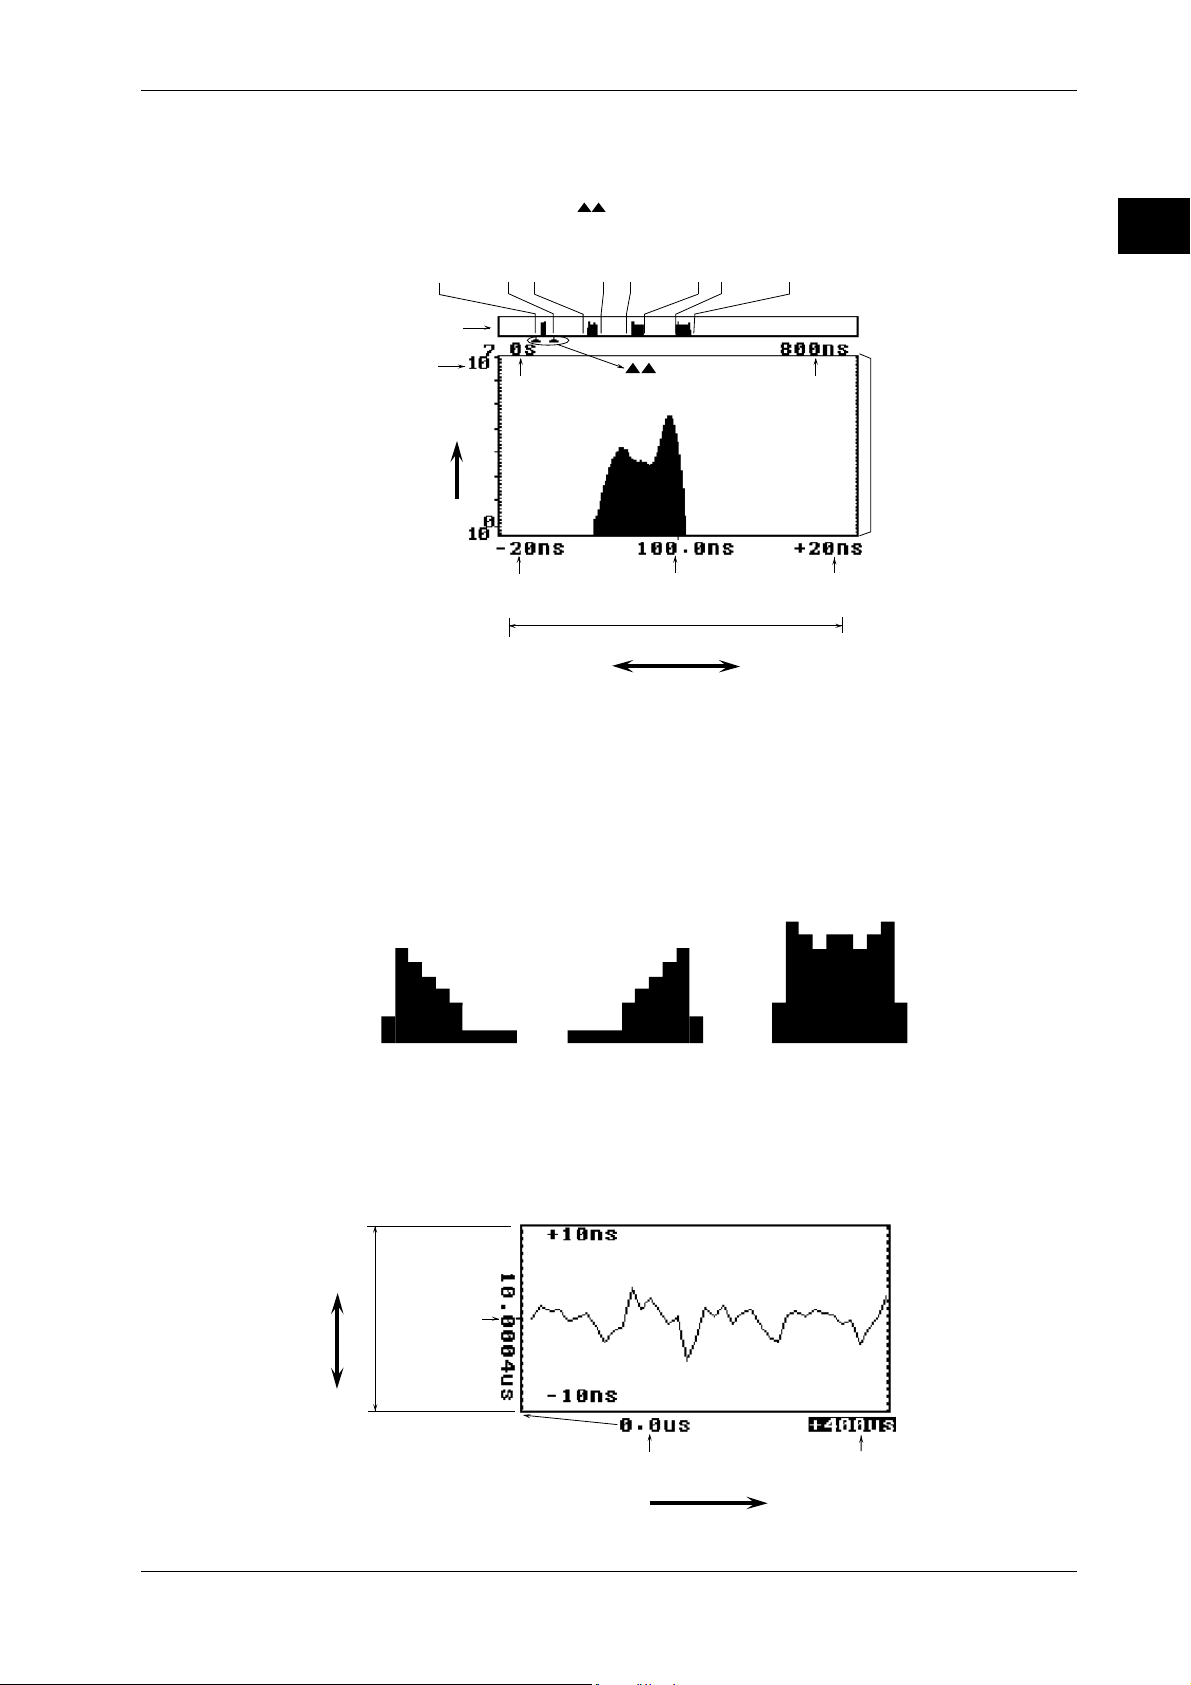
Time Variation Display ≡For operating procedure, refer to 7.5≡
During time stamp mode, measured values and time stamps are treated as data and acquired in the
acquisition memory. The time variation display function uses this time-series data to display
variation of measured values in relation to the elapsed time following the arming.
Span of Y-axis
(20 ns in this example)
(positive displacement from the
(measured value)
Y-axis
Center value
of Y-axis
IM 704210-01E
center value of Y-axis)
(negative displacement from the
center value of Y-axis)
Minimum value
of X-axis
X-axis (elapsed time)
Maximum value of X-axis
(positive displacement from
the minimum value of X-axis)
(Span: 400 µs in this example)
1-13
Page 24
1.6 Displaying the Measured/Computed Data
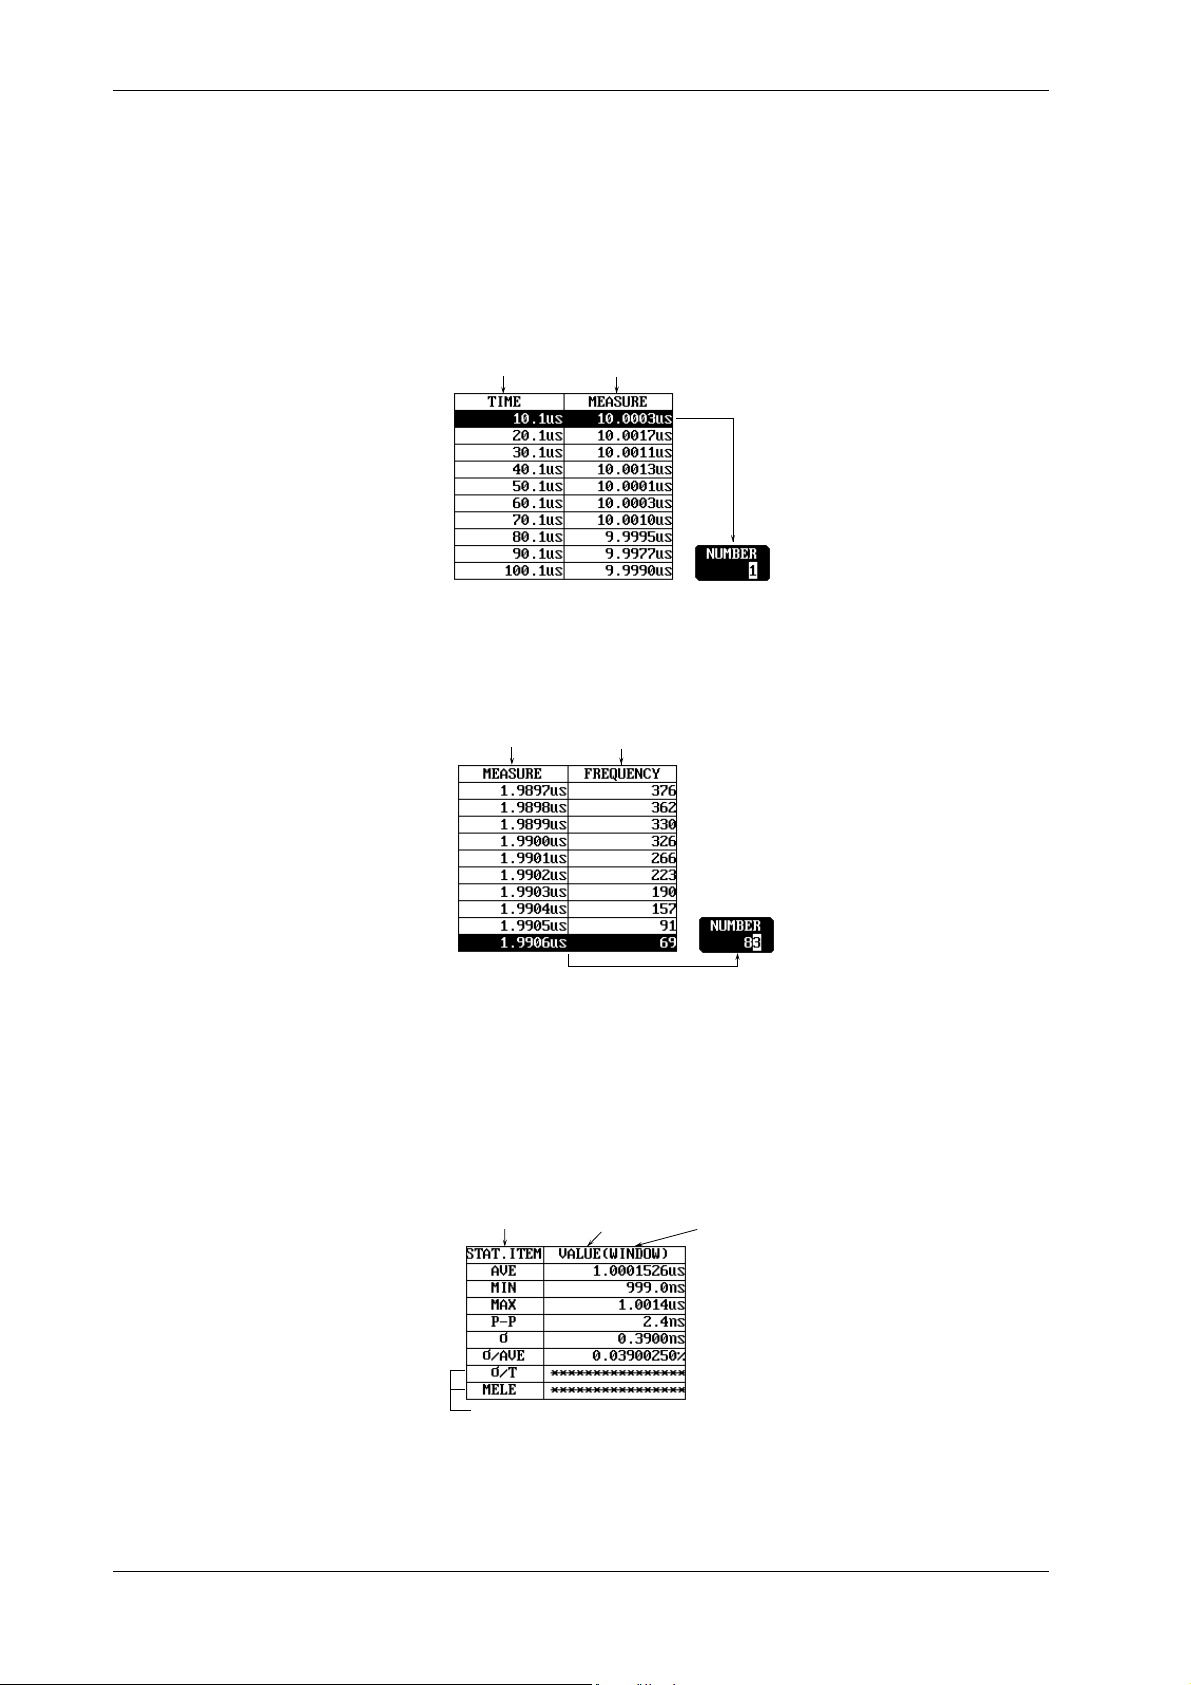
List Display ≡For operating procedure, refer to 7.6≡
A list of measured values is displayed. This function enables the user to jump to the top or
bottom data in the list, and set data numbers to locate/display the measured value of the desired
data number. The contents of the list vary according to the selected sampling mode.
Time stamp mode
A list of time stamps and their measured values for the number of events/time range specified in
gating setting (see 1.5) is displayed.
Time stamp Measured value
Data number
1
2
3
4
5
6
7
8
9
10
Hardware histogram mode
A list of measured values (class values of histogram) and their frequency within the span of Xaxis specified in histogram display setting is displayed.
The data number of the
highlighted data is displayed.
Class value Frequency
Data number
74
75
76
77
78
79
80
81
82
83
The data number of the
highlighted data is displayed.
Statistics Display ≡For operating procedure, refer to 7.7 and 7.8≡
A list of statistic values is displayed. For statistical computation items, computation and
computation area, refer to 1.4, “Computation”. The contents of the list vary according to the
selected sampling mode.
Time stamp mode
No computation is carried out for jitter 1 (σ/T) and jitter 2 (MELE), so no results are displayed.
Statistical computation item Statistic value Statistical computation area
(The entire window is used for statistical
computation in this example. “MARKER”
will be displayed if the area enclosed by
the markers is used for statistical computation.)
1-14
No computation is carried out for jitter 1 and jitter 2.
IM 704210-01E
Page 25
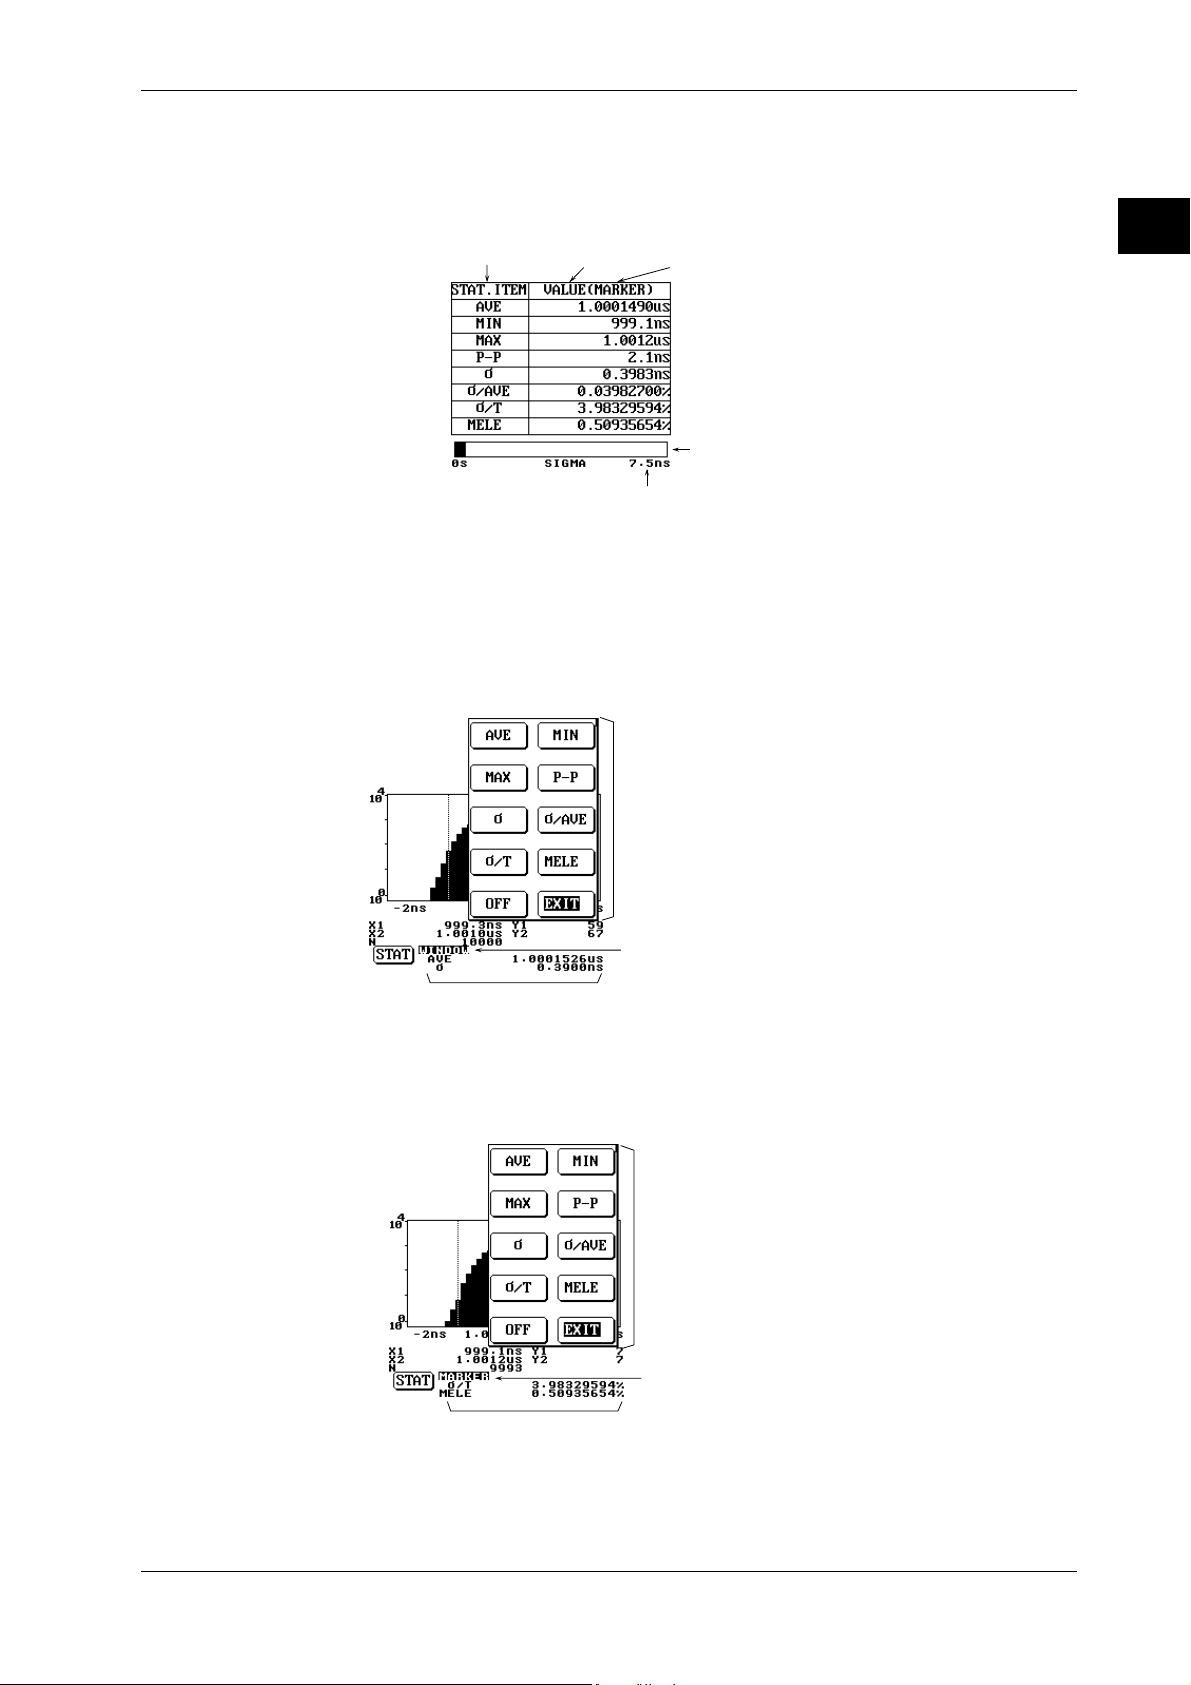
Hardware histogram mode
A bar graph indicating the standard deviation (σ) is displayed below the list. The bar graph range
(maximum value) can be selected (see below).
Statistical computation item Statistic value
Bar graph range (maximum value)
Statistics values during histogram display
The statistical computation area and items (two items) are displayed while a histogram is
displayed. It is possible to select statistical computation items to be displayed.
1.6 Displaying the Measured/Computed Data
Statistical computation area
(The area enclosed by the markers
is used for statistical computation
in this example. “WINDOW” will be
displayed if the entire window is
used for statistical computation.)
Standard deviation (σ) is displayed in bar graph.
1
Functions
• Time stamp mode
Selected statistical
computation items
• Hardware histogram mode
Selects statistical computation items to be displayed.
(This menu is displayed when the STAT touch key
located at the bottom of the screen is pressed.)
Statistical computation area (The entire window is used
for statistical computation in this example. “MARKER”
will be displayed if the area enclosed by the markers is
used for statistical computation.)
Selects statistical computation items to be displayed.
(This menu is displayed when the STAT touch key located at
the bottom of the screen is pressed.)
IM 704210-01E
Selected statistical computation items
Statistical computation area
markers is used for statistical computation in this example.
“WINDOW” will be displayed if the entire window is used for
statistical computation.)
(The area enclosed by the
* “Touch key” is a key displayed on the LCD. Touching it with your finger will execute a certain
operation.
1-15
Page 26

1.7 Other Functions
External Signal Input/Output (Rear Panel)
The following input and output terminals (BNC) are provided on the rear panel, to communicate
with external devices. For location of each terminal, refer to 2.2, “Rear Panel”.
Reference input terminal (REFERENCE IN)
Although the instrument has an internal reference clock to be used for measurements, it is
possible to input an external signal (10 MHz) to this terminal and use it as the reference clock.
Reference output terminal (REFERENCE OUT)
The internal reference clock or external reference clock can be sent through a 10-MHz band pass
filter and then output from this terminal.
Monitor output terminals (MONITOR OUT CHA, CHB)
Signals input to the input terminals can be output directly from these terminals. They can be used
for observation of a waveform during phase correction of a probe.
External arming input/inhibit input terminals (EXT ARM IN, INHIBIT IN)
These signals are used to control measurement functions of the instrument. For the function of
external arming or inhibit signal, refer to 1.5, “Setting the Acquisition Conditions for Input Signal
to be Measured”.
≡For operating procedure, refer to 10.2 and 10.3≡
Communications ≡Refer to the GP-IB Interface User’s Manual (IM704210-12E)≡
The instrument is equipped with a GP-IB interface as a standard feature. Use of this interface
enables transmission of measured data to a personal computer to analyze it, and enables control of
this instrument using an external controller.
Storing and Recalling of Set-up Information
Up to 10 sets of set-up information can be stored in the internal non-volatile memory. It is also
possible to recall the stored set-up information to set up the instrument. This function is useful
when you want to use the set-up information repeatedly.
Saving and Loading Data from a Floppy Disk
The instrument is equipped with a floppy disk drive. This enables the user to save set-up
information and measured data to a floppy disk or load from it, whenever it is required. In
addition, it is also possible to save the screen image data in TIFF format. This enables the user to
import the saved screen image data to a document created by a DTP software application, to
create a report.
≡For operating procedure, refer to Chapter 8≡
≡For operating procedure, refer to Chapter 9≡
Auto Loading of Set-up Information ≡For operating procedure, refer to 9.3≡
Turning ON the power after a floppy disk containing the set-up information is inserted into the
floppy disk drive will load the set-up information to the instrument automatically. This is useful
to restore the set-up information in the instrument.
Plotter Output ≡For operating procedure, refer to 10.1≡
Measured data can be output to an external plotter via the GP-IB interface.
Initialization of Set-up Information ≡For operating procedure, refer to 10.4≡
The set-up information can be reset to the factory settings (default settings).
Calibration ≡For operating procedure, refer to 10.5≡
Calibration of the offset voltage of each input amplifier and conversion factor of each T/V
converter can be carried out using the internal calibration signal.
1-16
IM 704210-01E
Page 27

Numeric Value Setting ≡For operating procedure, refer to 4.2≡
A numerical value can be entered using the ten-key (displayed when the KEYBOARD key is
pressed) while a small ten-key icon is displayed on the left of the currently highlighted touch key.
This is useful when you need to set a value consisting of several digits. If a small icon is
displayed, a numerical value can be entered using the rotary knob.
Small rotary knob icon
Small ten-key icon
Contrast ≡For operating procedure, refer to 10.6≡
The contrast of the LCD display can be adjusted. Adjust it so that it suits the environment in
which the instrument is used.
Touch-key Sound ≡For operating procedure, refer to 10.7≡
A beeping sound is heard when a touch key is pressed (touched) or an error occurs. It is possible
to disable this beep.
1.7 Other Functions
1
Functions
Error Logging ≡For operating procedure, refer to 11.3≡
“!” mark appears in the upper right corner of the screen if a data error such as overflow of
measured data occurs or a communication error occurs. Error messages are recorded in the error
logging window, to enable the user to observe them later.
Self-test ≡For operating procedure, refer to 11.4≡
In case of a problem, a self-test can be carried out to enable the user to check the problem before
contacting YOKOGAWA. This function enables inspection of the memory, PC board and
display.
IM 704210-01E
1-17
Page 28
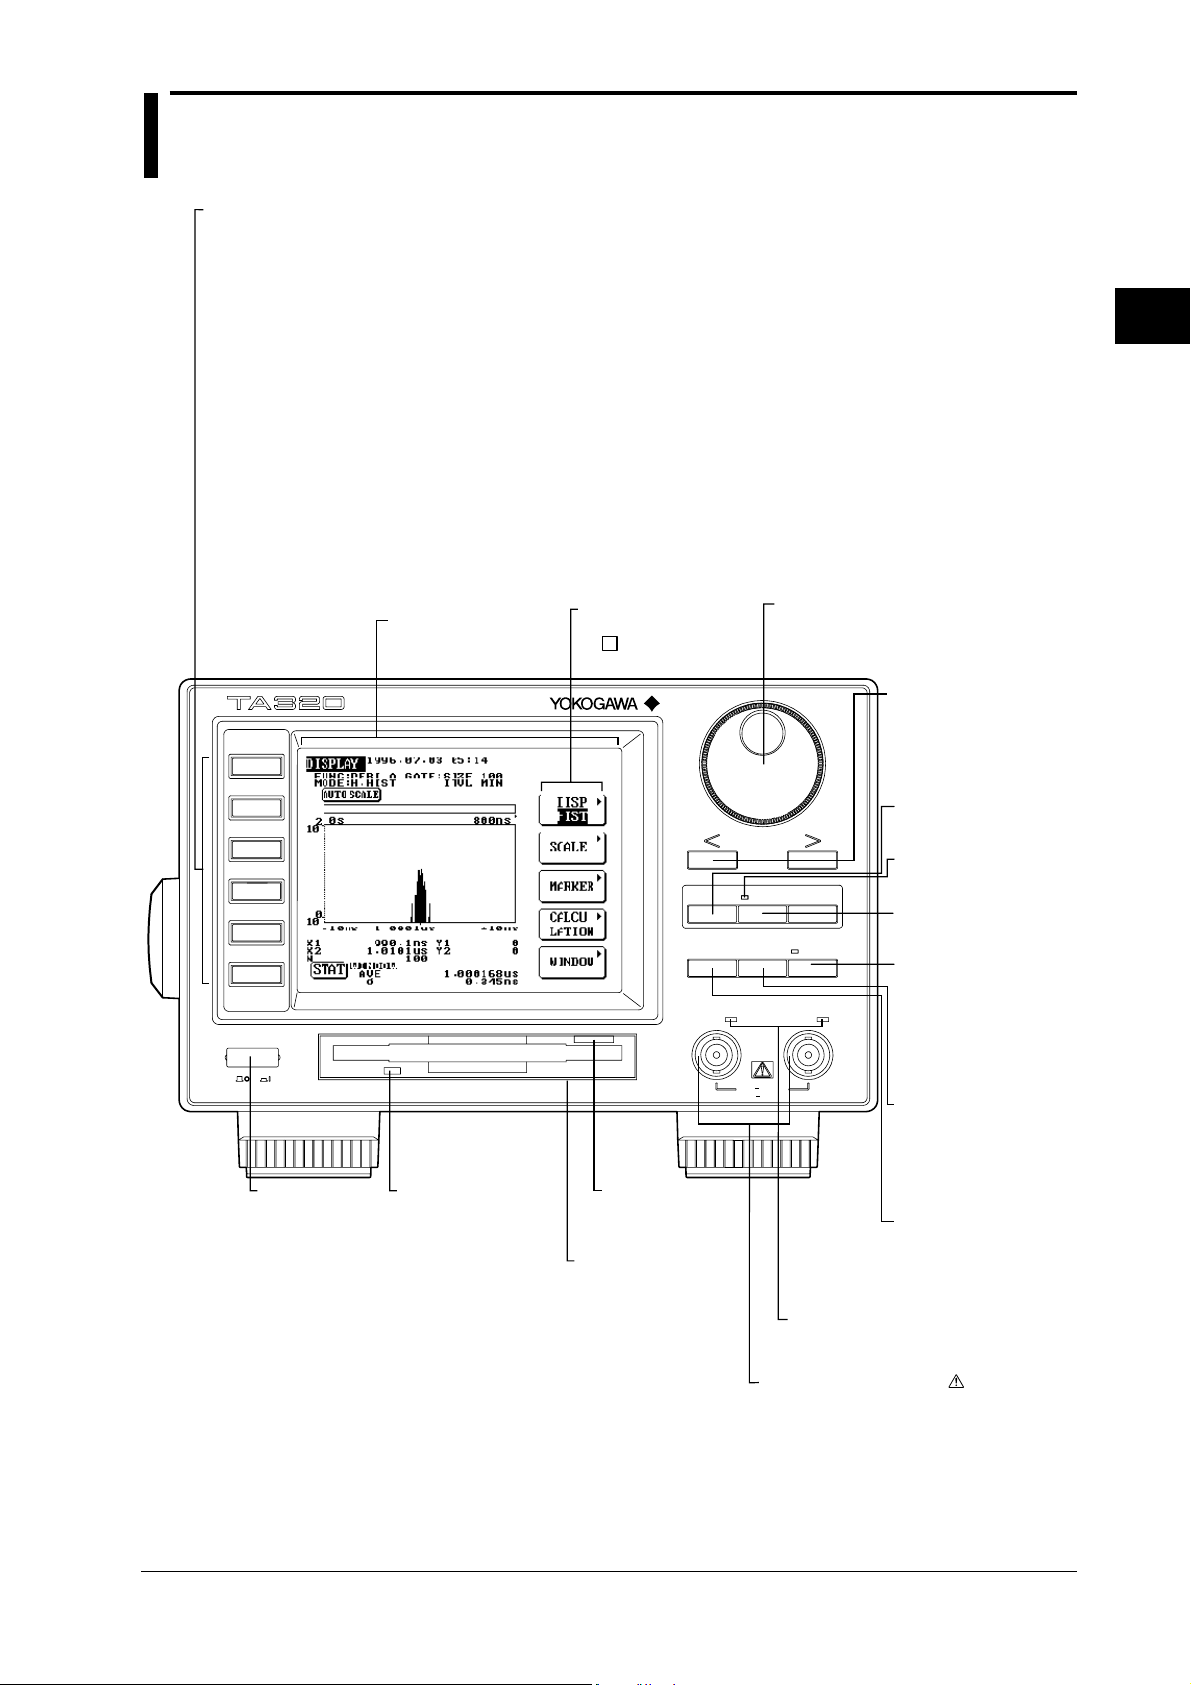
2.1 Front Panel
Top menu keys
Displays the corresponding top menu.
• MODE key
Displays the sampling mode selection screen. (See 5.1.)
• FUNCTION key
Displays menus for setting/selecting the measurement function, input channel and slope. (See chapter 5.)
2
• DISPLAY key
Displays menus for setting/selecting the display format, window axis, markers, calculation. (See chapter 7.)
• SAMPLE key
Displays menus for setting/selecting the gate, sample size, sampling interval, arming and inhibit. (See chapters 6.2, 6.3 and 6.4.)
• INPUT key
Displays menus for setting/selecting the input coupling, input impedance, trigger mode and trigger level. (See chapter 6.1.)
• UTILITY key
Displays menus for setting/selecting initialization of set-up information, storing and recalling of data in the internal memory,
configuration (communication, contrast, date/time, touch key sound), self-test, saving and loading of data from a floppy disk, reference
clock, calibration and initialization of a floppy disk. Also displays the error logging window and version No. (ROM version). (See 3.7,
chapters 8,9, and 10, and 11.3 to 11.5.)
LCD display
(Touch screen)
Touch key
Press the area enclosed
by to make various
Rotary knob
Sets a numerical value, moves markers and
selects a file. (See 4.2, chapters 7 and 9.)
settings and selections.
100ps resolution 14MS/s
TIME INTERVAL ANALYZER
Arrow keys
Moves from one digit to
another digit during setting
of a numerical value. Also
MODE
used as a back space key
(<). (See 4.2.)
FUNCTION
SINGLE key
Carries out measurement
DISPLAY
SAMPLE
INPUT
UTILITY
POWER
SINGLE START STOP
COPY LOCAL
50 5Vrms
1M 40Vpk
REMOTE
CH
B
KEY
BOARD
CH
A
only once. (See 4.1.)
Measurement indicator
Lights up during acquisition
of measured data.
START/STOP key
Starts/stops continuous
measurement. (See 4.1.)
LOCAL key
Cancels remote control
(REMOTE indicator lights
up during remote control
mode). Refer to the GP-IB
Interface User’s Manual
(IM704210-12E).
COPY key
Saves the screen image data
to a floppy disk/outputs the
screen image data to an
external plotter.
Power switch
(See 3.4.)
Access indicator
Blinks while the floppy
disk drive is in use.
Eject button
Used to remove the
floppy disk.(See 9.1.)
Floppy disk drive
(See 9.6 and 10.1.)
KEYBOARD key
Displays a ten-key (only
when a ten-key icon is
displayed on the left of a
touch key).(See 4.2.)
CHA/CHB input indicator
Blinks while the signal is input and a trigger
is caused.
CHA/CHB input terminal
Connect the input signal cables to these terminals.
(See 3.5.)
Name and Use of Each Part
IM 704210-01E
2-1
Page 29
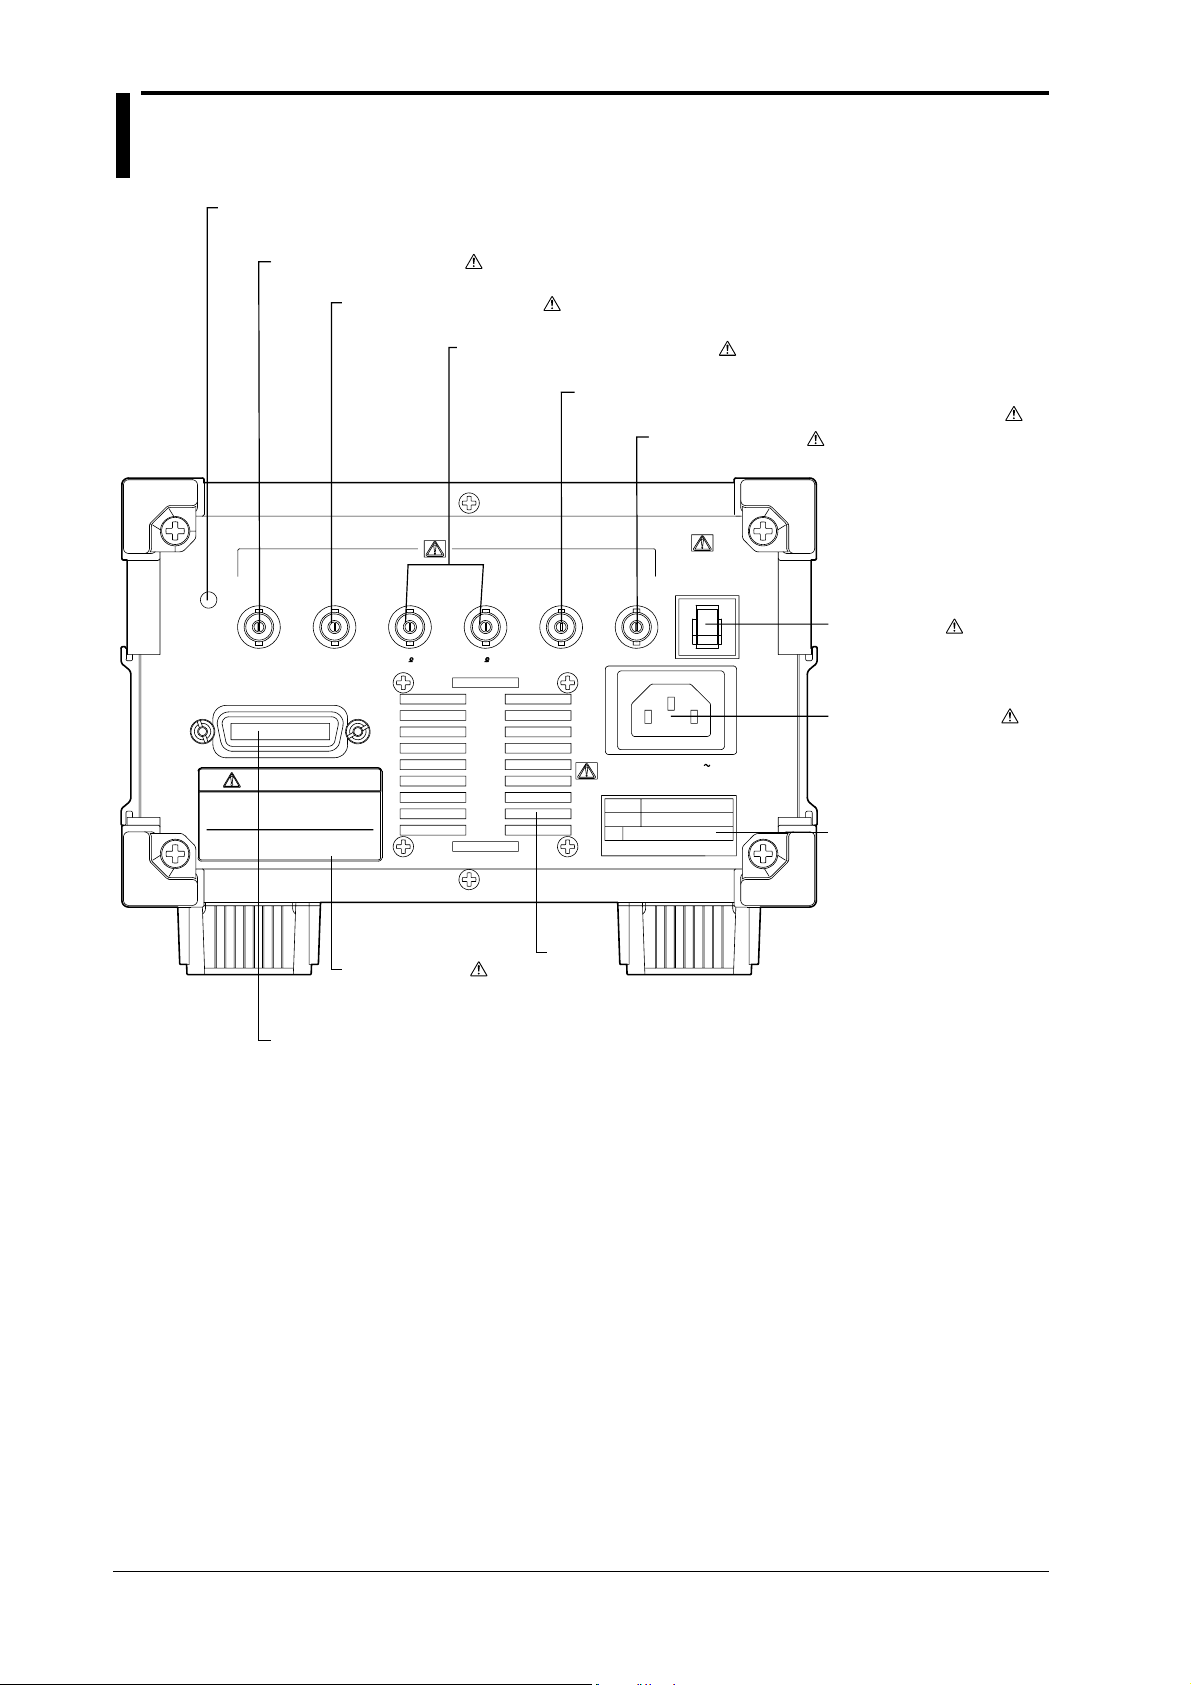
2.2 Rear Panel
Adjustment hole for reference clock frequency
Used to adjust the time base. (See 11.5.)
Reference input terminal
The external reference clock is input to this terminal. (See 10.2.)
Reference output terminal
The reference clock is output from this terminal. (See 10.2.)
REF
ADJUST
REFERENCE
IN OUT
GP-IB ( IEEE488 )
WARNING
It is dangerous to operate this instrum
ent outside its environmental specificati
ons. Refer to manual.
(50 )10MHz 1Vp-p 10MHz 1Vp-p
CHA/CHB monitor output terminal
Input signals are output from these terminals. (See 10.3.)
MONITOR OUT
CH A CH B
(50 )
External arming input terminal (shared with the external
gating input)
(See 6.2 and 6.3.)
Inhibit input terminal
(See 6.4.)
CIRCUIT
EXT ARM INHIBIT
IN IN
BREAKER
250V AC 3A
Circuit breaker
( TTL ) ( TTL )
(See 11.7 for the
resetting method.)
Power cord connector
The power cord is connected
100 - 240V AC
125VA MAX 50/60Hz
to this connector. (See 3.3.)
Name plate
Refer to this name plate when
checking the contents of the
package. (See page 2.)
Vent
WARNING plate
holes
Safety Precautions. (See page 4.)
Usage Precautions. (See 3.1.)
GP-IB connector
Used to connect the instrument to an external device (e.g. personal computer).
Refer to the GP-IB Interface User’s Manual (IM704210-12E).
2-2
IM 704210-01E
Page 30

3.1 Usage Precautions
Safety precautions
• Be sure to read through the safety precautions given on page 4 of this manual before starting to
use the instrument.
• Never remove the instrument’s casing. The unit contains extremely hazardous high-voltage
components. Consult your nearest Yokogawa representative (see listing on rear cover) if the
instrument requires maintenance or adjustment.
• If the instrument emits smoke or unusual odors, or in any way behaves abnormally immediately
turn OFF the power switch and unplug the power cord from the outlet. Then consult your
nearest Yokogawa representative for assistance.
• If the cooling fan stops during operation, the instrument will display the error message shown
below. When you see this message, turn OFF the power immediately. The fan (on the rear
panel) may be jammed; check for and remove any obstructions, then restart. If the same error
recurs, turn OFF the power and contact your nearest Yokogawa representative.
• Never rest any objects on the power cord. Keep the cord clear of hot objects at all times. When
unplugging the power cord, pull on the plug area - never pull on the cord itself. If the cord is
damaged, contact your dealer and obtain a replacement. (Quote the part number indicated on
page 2 of this manual.)
3
Before Starting Measurement
Handling Precautions
• Never place liquid-filled containers or other potentially damaging objects on top of the
instrument.
• Avoid subjecting the instrument to vibration and strong impacts, as these can cause hardware
damage. Be especially careful if the instrument is equipped with a floppy disk drive. Also note
that any impact to terminals or connecting cables may cause electrical noise to the output
signal.
• Always keep terminals clear of electrically charged objects. Electrostatic at the terminals may
cause internal damage.
• If you do not plan to use the instrument for an extended period, unplug the power cord.
• If you need to lift and move the instrument, first disconnect the power cord and connecting
cables. Lift and carry by the handle, as shown. The instrument weighs approximately 5kg.
IM 704210-01E
• Never touch the LCD (touch screen) with pointed objects. Contact with sharp objects may
cause damage.
• Never clean plastic parts with benzene or other such solvents, as these may cause discoloration.
To clean the case or panel, wipe lightly with a soft dry cloth.
3-1
Page 31
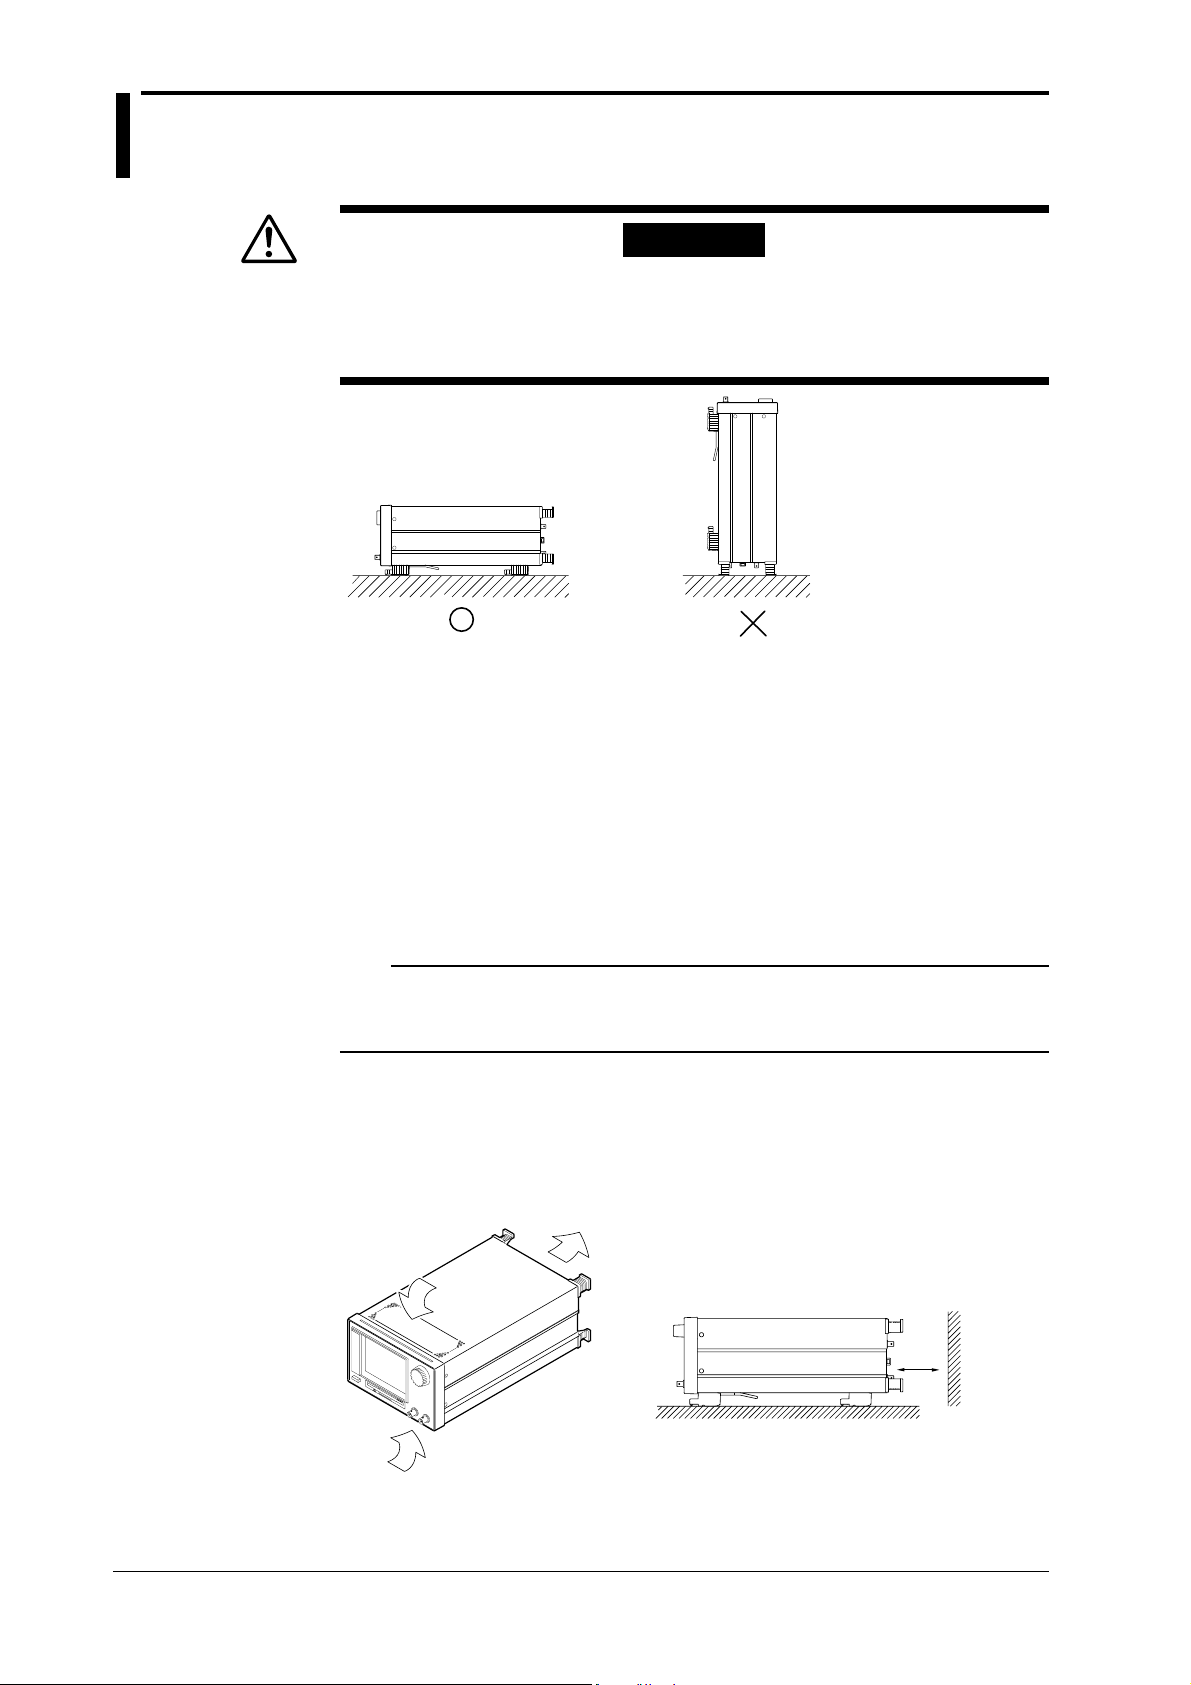
3.2 Installing the Instrument
You should never run the instrument in an upright position, with the fan vent facing
downward. If the instrument malfunctions while in this position, heat escaping from the
vent may cause a fire. If you really need to operate the instrument in this position, place
a metal plate or flame-retardant barrier (grade UL94-1 or higher) beneath it.
Installation Conditions
Be sure to install the instrument in a location that meets the environmental conditions described
below.
WARNING
Ambient temperature and humidity
Ambient temperature and humidity during operation should be within the following limits.
• Temperature: 5°C to 40°C
For high accurate measurement: 23±2ºC
• Humidity: 20% to 80% RH; no condensation
For high accurate measurement: 50±10% RH
Note
Condensation may occur when the instrument is moved from a cold, dry location to a warm, humid one or
when there is a rapid change in ambient temperature. If liquid condenses on the instrument, allow the
instrument to stand for at least one hour under stable ambient conditions before using.
Well-ventilated location
Vent holes are situated on the top and bottom of the instrument. In addition, vent holes for the
cooling fans are also situated in the rear panel. To prevent a rise in the internal temperature, the
vent holes should not be blocked and sufficient clearance should be maintained around them.
10cm
or more
3-2
IM 704210-01E
Page 32

Installation Position
3.2 Installing the Instrument
Install the instrument in a location that is:
• Away from direct sunlight and other heat sources.
• Away from oily smoke, steam, dust, corrosive gas, and other such contaminants.
• Away from strong magnetic fields.
• Away from high-voltage equipment and power lines.
• Away from mechanical vibrations.
• Stable surface.
Place the instrument in a horizontal position or tilted using the stand, as shown below. To install
in the tilted position, pull the instrument’s stand forward until it locks into place at right angles
with the bottom panel. If the surface is slippery, you should also attach rubber feet (standard
accessory) to the instrument’s rear legs. To retract the stand, push it inwards at both ends while
moving it back to its original position.
3
Before Starting Measurement
Rack Mounting
It is possible to mount the instrument on an optional rack.
For mounting instructions, refer to the user’s manual supplied with the kit.
The following rack mount kits are available.
Name Model Specification
Rack Mount Kit 751533-E3 EIA Single Mount
Rack Mount Kit 751534-E3 EIA Dual Mount
Rack Mount Kit 751533-J3 JIS Single Mount
Rack Mount Kit 751534-J3 JIS Dual Mount
IM 704210-01E
3-3
Page 33

3.3 Connecting the Power Cord
Before Connecting the Power
Make sure that you observe the following points before connecting the power. Failure to do so
may cause electric shock or damage to the instrument.
• Make certain that the power voltage of your outlet matches the instrument’s rated power
voltage.
• Be sure that the instrument’s power switch is OFF.
• Be sure that your power cord has been supplied by Yokogawa specifically for use with
this instrument. Use of an inappropriate cord may present a shock or fire hazard.
• Always use protective ground to prevent electric shock. Connect the instrument’s power
cord to a 3-pin AC outlet with grounding terminal.
• Never use an extension cord that does not have a protective grounding, otherwise the
protection feature will be invalidated.
Connecting the Power Cord
1. Make sure that the POWER switch located on the front panel is turned OFF.
2. Plug the power cord into the power connector socket on the rear panel of the instrument.
3. Plug the other end of the power cord into a 3-pin AC outlet that meets the following
conditions.
WARNING
Rated supply voltage: 100 to 240 VAC
Permitted voltage range: 90 to 264 VAC
Rated power frequency: 50/60 Hz
Permitted power frequency range: 48 to 63 Hz
Maximum power consumption: 125 VA
3-pin AC outlet
Power cord
(supplied with
the instrument)
3-4
IM 704210-01E
Page 34

3.4 Turning the Power Switch ON/OFF
Items to be Checked Before Turning ON the Power
• Check that the instrument is installed correctly as instructed in 3.2 “Installing the Instrument”.
• Check that the power cord is connected correctly as shown in 3.3 “Connecting the Power
Cord”.
Location of the Power Switch and Turning it ON/OFF.
The power switch is located at the lower left of the front panel. To turn the power ON, press the
switch once. To turn the power OFF, press it again.
OFF ON
Power-ON Initialization
When the power is turned ON, the instrument executes the following initialization checks. Panel
keys remain disabled during these checks. When initialization is completed, the display format
screen (the screen which is displayed when the DISPLAY key is pressed) will be displayed.
• ROM Check: Checks the ROM.
• DRAM Check: Checks the DRAM.
• Backup Check: Checks the calibration data.
3
Before Starting Measurement
Note
If the instrument fails to start up as described, turn the power switch OFF and then check the following
points.
• Check whether the power cord is plugged in properly.
• Check whether the correct voltage is being supplied from the AC outlet. (Refer to 3.3)
• Check whether the circuit breaker is ON. (Refer to 11.7.)
If the above checks do not resolve the problem, contact your nearest YOKOGAWA representative listed on
the rear cover of this manual.
For Accurate Measurement
Turn the power switches ON and allow the unit to warm up for at least 30 minutes. Make sure
that the installation conditions given in 3.2 are met.
Power-OFF Operation
The set-up information made prior to turning OFF the power will be retained even if the power is
turned OFF. However, measured data will not be retained, so make sure that necessary data is
saved to a floppy disk before turning the power OFF.
Note
The set-up information is backed up by a lithium battery. The battery lasts for approximately 10 years if it is
used at an ambient temperature of 23ºC. When the battery approaches the end of its life, the instrument begins
to display incorrect dates or times, or may fail to save or recall measured data correctly. If any such problem
is noticed, execute a self-test as described in 11.4, “Executing the Self-test”. If “LOW BATTERY” warning
message is displayed during the self-test, the battery needs to be replaced immediately. The battery cannot be
replaced by the user, so contact the nearest YOKOGAWA representative listed on the rear cover of this
manual.
IM 704210-01E
3-5
Page 35

3.5 Connecting the Cables/Probes
Location of Input Terminals
The input terminals are located at the lower right of the front panel. Use cables with a BNC
connector or use probes.
Input Specifications
CH
A
CH
B
Connector type : BNC
Number of channels : 2
Input impedance : 50 Ω/1 MΩ, 20 pF (Typical *)
Maximum input voltage:
• When input impedance is 50 Ω : 5 V
rms
• When input impedance is 1 MΩ:
• 40 V (DC+AC
• {3.5/f + 5}V (DC + AC
) when DC ≤ input frequency ≤ 100 kHz
peak
) when 100 kHz ≤ input frequency ≤ 100 MHz, “ f ” indicates
peak
frequency in MHz.
Ground: Connected to the case’s ground.
* Typical values are described in terms of typical of average performance. However, they cannot
be guaranteed.
CAUTION
Never apply a voltage exceeding the maximum input voltage to the input terminals.
Damage to the input terminals may result.
Note
When you use a probe with this instrument for the first time, its phase must be corrected before use as
described in 3.6, “Compensating a Probe (Carrying Out Phase Correction)”. If the phase is not corrected,
the gain will not be constant across different frequencies. Phase correction must be carried out for each
channel.
3-6
IM 704210-01E
Page 36

3.6 Compensating a Probe (Carrying Out Phase Correction)
Items Required
The following items are required.
Calibration signal
• Frequency: 1 kHz
• Voltage: 1 V
• Waveform type: Square waveform
• Output impedance: 1 MΩ
• Recommended signal: CAL signal of the DL1540 digital oscilloscope (by YOKOGAWA)
Waveform monitor
• Frequency characteristic: DC to 100 MHz (attenuation point: -3 dB)
• Input coupling: DC
• Input impedance: Connect a 50 Ω terminator to the input terminal of the waveform monitor.
• Recommended monitor: DL1540 digital oscilloscope (by YOKOGAWA) + 50 Ω terminator
(type: 700976, by YOKOGAWA)
The connecting and operating procedure for the recommended calibration signal
and waveform monitor is described below.
Connecting the Calibration Signal and Waveform Monitor
p-p
3
Before Starting Measurement
CAUTION
• Never apply a voltage exceeding the maximum input voltage to the input terminals.
Damage to the input terminals may result.
• Never short-circuit the CAL signal output terminal of the DL1540 or the monitor output
terminals (MONITOR OUT) of this instrument. Never apply an external voltage to these
terminals. Damage to the internal circuits may result.
Make sure that the power to both this instrument and DL1540 is turned OFF, then connect them
as shown below.
1. Use a BNC cable to connect the MONITOR OUT (CHA/CHB) terminal to an input terminal
of the DL1540.
2. Connect the BNC connector of the probe to be calibrated to an input terminal of this
instrument.
3. Connect the other end of probe to the CAL signal output terminal of the DL1540, and the
grounding wire of the probe to the function grounding terminal of this instrument.
MONITOR OUT terminal
This instrument
BNC cable
DL1540
50Ω terminator
Input terminal
IM 704210-01E
Phase correction hole
CAL signal output terminal
Function grounding terminal
3-7
Page 37
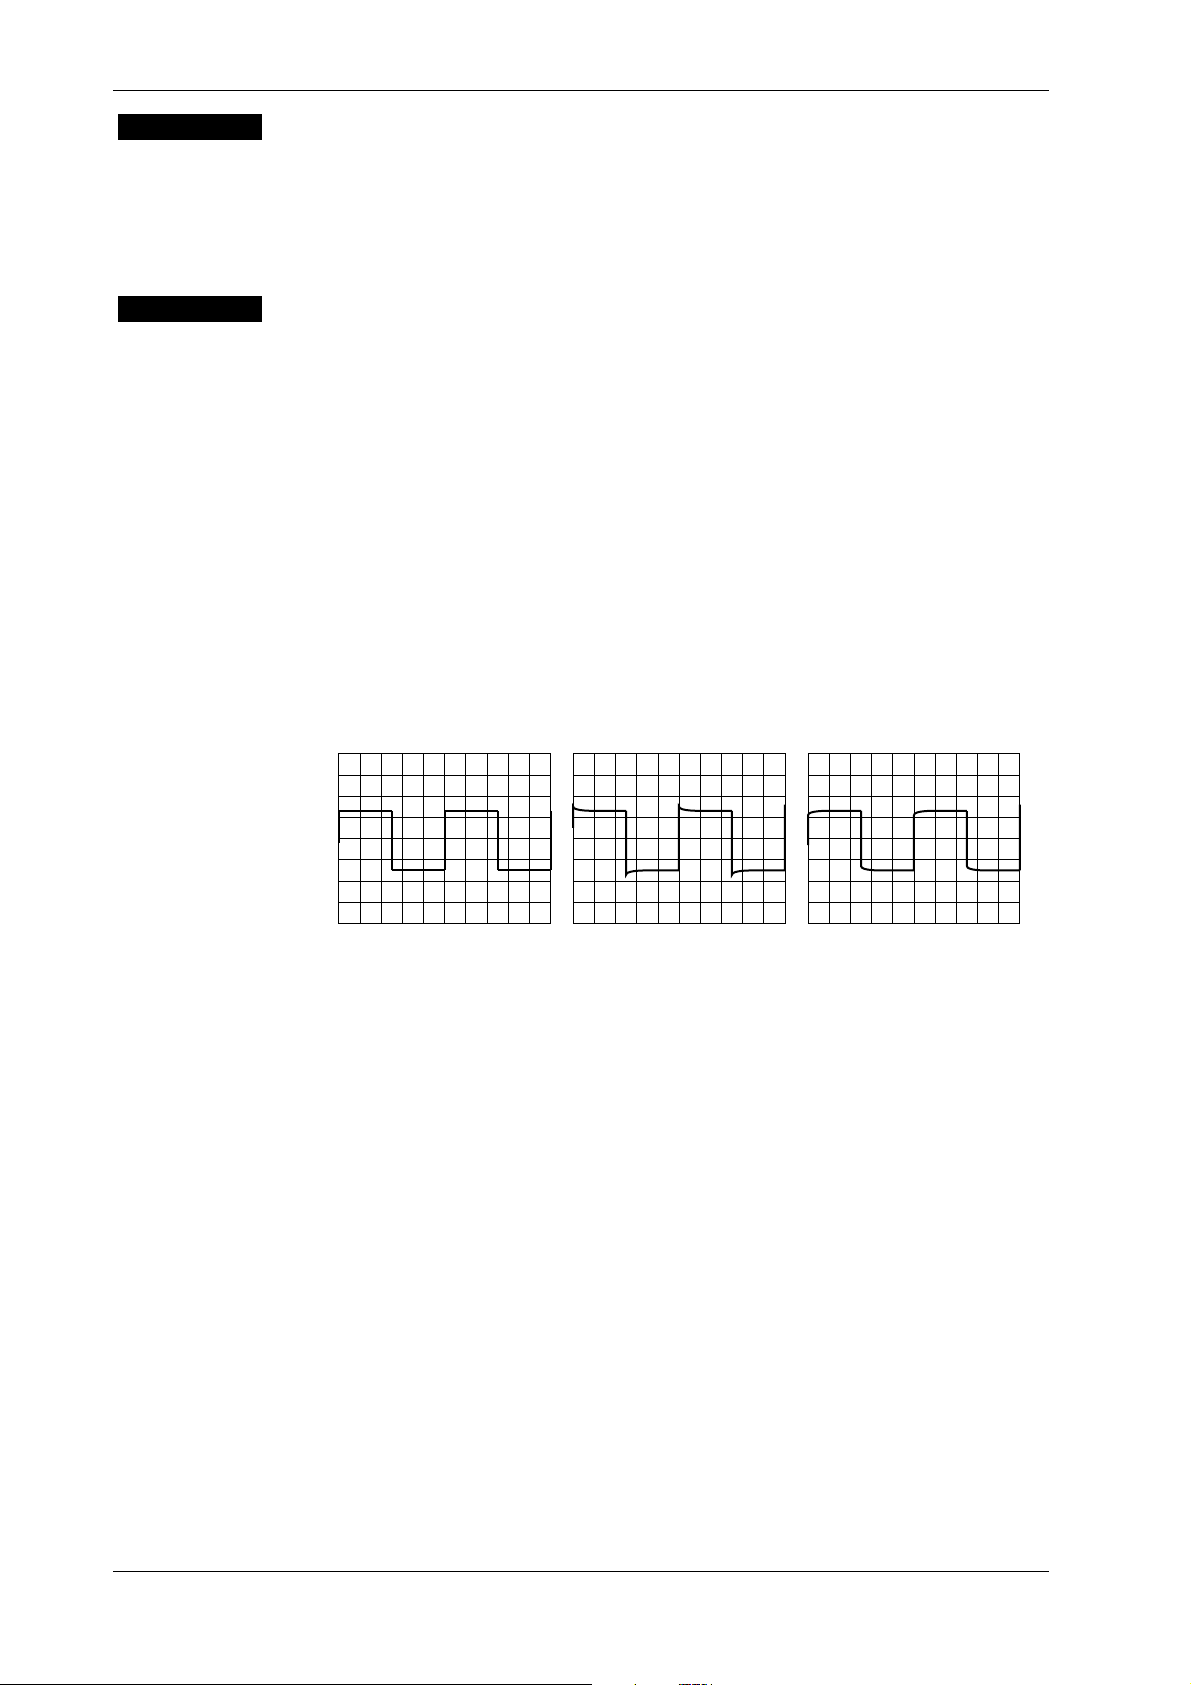
3.6 Compensating a Probe (Carrying Out Phase Correction)
Procedure
Explanation
1. Turn ON the power to both this instrument and DL1540.
2. Set the waveform acquisition conditions of the DL1540 so that the waveform of
approximately two periods is observed clearly. For setting method, refer to the User’s
Manual of the DL1540.
3. Insert a screwdriver into the probe’s phase correction hole, and turn the variable capacitor to
produce correct square waves on the waveform monitor.
Necessity of probe phase correction
If the probe’s input capacitance is out of the appropriate range, the gain will not be constant
across different frequencies, preventing input of the correct waveforms. The input capacitance
varies depending on the probe used, so the variable capacitor (trimmer) provided on the probe
must be adjusted. This is called phase correction. Phase correction must be performed when the
probe is to be used for the first time. Moreover, the appropriate input capacitance varies
depending on which channel is used, so phase correction is required when the probe is switched
from one channel to another.
Calibration signal
Waveform type: Square waveform
Frequency: 1 kHz
Voltage: 1 V
p-p
Waveform differences
Correct waveform Over-compensated (gain is
too high at high frequency)
Under-compensated (gain is
too low at high frequency)
3-8
IM 704210-01E
Page 38

3.7 Setting the Date and Time
Procedure
MODE
FUNCTION
DISPLAY
SAMPLE
INPUT
UTILITY
• To exit from the current menu, press any of the top menu keys or press the ESC touch key
displayed on the screen.
UTILITY Top menu
3
Before Starting Measurement
Used to display the CONFIG menu.
1. Press the UTILITY key to display the UTILITY top menu.
2. Press the CONFIG touch key to display the CONFIG menu.
Selecting the DATE/TIME menu
3. Press the DATE/TIME touch key to display the DATE/TIME menu.
Setting the date
4. Press the DATE touch key to highlight the key.
5. Use the rotary knob and arrow keys to set the desired date.
Setting the time
6. Press the TIME touch key to highlight the key.
7. Use the rotary knob and arrow keys to set the desired time.
Confirming the date/time
8. Press the EXEC touch key to confirm the date and time.
CONFIG menu DATE/TIME menu
Used to set the date.
Used to set the time.
Used to display
the DATE/TIME menu.
Used to confirm
the settings (date/time)
IM 704210-01E
3-9
Page 39

3.7 Setting the Date and Time
Explanation
Setting the date
Set the date in order of year, month and day.
• Year
Set the last two digits of the year. For instance, set “99” for 1999, “00” for 2000, “01” for 2001
and so on.
• Month
Setting range: 01 to 12
• Day
Setting range: 01 to 31
Setting the time
Set the time in order of hour and minute.
• Hour
Setting range: 00 to 23
• Minute
Setting range: 00 to 59
It is not possible to set or display seconds by the same method. However, “00” second is set
when the EXEC touch key is pressed.
Display location of date/time
The date and time are displayed at the top of the screen.
Date and time are displayed.
(This example shows July 4, 1996, 4.31 a.m.)
MODE
3-10
IM 704210-01E
Page 40

4.1 Starting/Stopping Acquisition of a Measuring Input Signal
Procedure
MODE
FUNCTION
DISPLAY
Explanation
SAMPLE
INPUT
UTILITY
SINGLE START STOP
KEY
BOARD
Measurement indicator
COPY LOCAL
When carrying out measurement continuously
•Starting measurement
Press the START key to start measurement. The measurement indicator will light up.
• Stopping measurement
Press the STOP key to stop measurement. The measurement indicator will go out.
When carrying out measurement only once
Press the SINGLE key. Measurement will stop automatically when measurement has been
carried out once. The measurement indicator will light up while measurement is in progress, and
will go out when measurement is complete.
Continuous measurement
Once measurement is started, measurement will be carried out repeatedly until the STOP key is
pressed.
4
Common Operations
IM 704210-01E
Single measurement
Measurement is carried out each time the SINGLE key is pressed.
Note
• Each series of processes (measurement, data processing and display) is called a block (see 1.5).
• If the START (or SINGLE) key is pressed while the current one-block measurement is in progress,
measured data acquired after the START (or SINGLE) key is pressed will be processed (i.e. displayed/
computed).
• If the STOP key is pressed while the current one-block measurement is in progress, the data measured
until the STOP key is pressed will be acquired and measurement will be stopped.
• An indicator is provided above each input terminal (CHA, CHB). The indicator should blink while a
signal is input to the corresponding input terminal. If the indicator does not blink, check whether the
trigger level is correct(see 6.1), whether the input cable is connected properly, or whether the signal is
present. If the indicator does not blink even if a correct signal is input to the terminal, the instrument
may be faulty. Contact your nearest YOKOGAWA representative listed on the rear cover of this manual.
4-1
Page 41

4.2 Setting Numerical Values
Procedure
MODE
FUNCTION
DISPLAY
SAMPLE
INPUT
UTILITY
≡≡
≡For a description of the function, refer to 1.7
≡≡
• To exit from the current menu, press any of the top menu keys or press the ESC touch key
displayed on the screen.
Numerical Input Menu
SINGLE START STOP
KEY
BOARD
COPY LOCAL
Setting a numerical value using the ten-key
A numerical value can be entered using the ten-key while a small ten-key icon is displayed on the
left of the currently highlighted touch key.
1. Press the KEYBOARD key to display the ten-key.
2. Press the ten-key to enter the desired numerical value.
3. To correct the entered numerical value, press the < key. Each time the < key is pressed, the
value located on the left of the cursor will be deleted and the cursor moves to the left one
digit.
4. After the unwanted value is deleted, use the ten-key to enter the correct value.
5. After the desired value has been entered, press the desired unit key then return touch key (see
below). The ten-key will disappear, indicating the value has been confirmed.
≡≡
≡
≡≡
4-2
Setting a numerical value using the rotary knob
A numerical value can be entered using the rotary knob if the highlighted touch key indicates a
numerical item and a small rotary knob icon is displayed on the left of that highlighted touch key.
6. Press the arrow keys to move the cursor to the desired digit.
7. Turn the rotary knob to select the desired value. The selection of the value will be
confirmed.
8. To correct the entered value, carry out steps 6 and 7.
The following example shows how to set the center value of X-axis.
The cursor can be moved to the right and left using
the > and < arrow keys respectively.
The value located at the cursor is not highlighted.
IM 704210-01E
Page 42
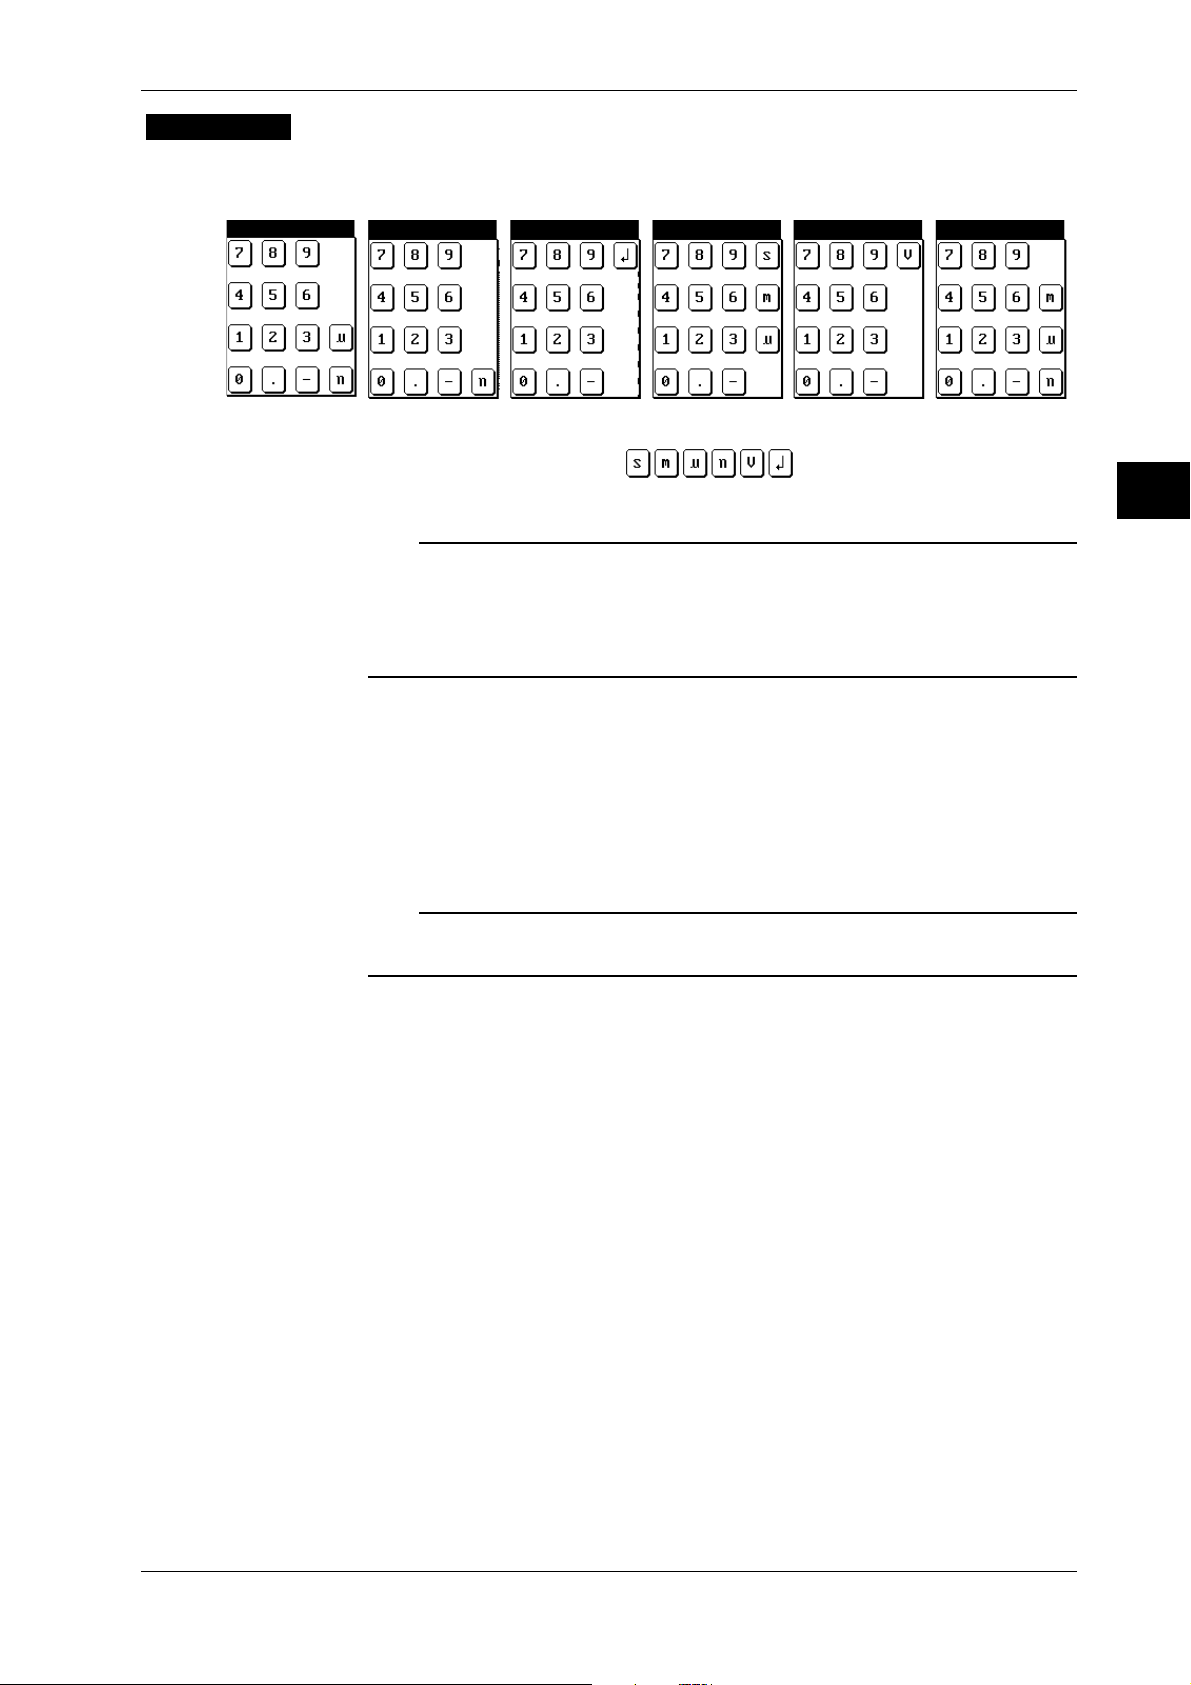
4.2 Setting Numerical Values
Explanation
Setting a numerical value using the ten-key.
• The following six types of ten-key are available. The displayed ten-key varies according to the
setting item.
• If a key (touch key, KEYBOARD key, > arrow key) is pressed or the rotary knob is turned
before any of the following keys is pressed, the entered value will not
be confirmed, but it will be canceled.
Note
• If an attempt is made to set a value higher than the allowed resolution for the item, the value will be
rounded off.
• If an attempt is made to set a value exceeding the maximum value for the item, the maximum value will
be set. Similarly, if an attempt is made to set a value below the minimum value for the item, the
minimum value will be set.
4
Common Operations
Setting a numerical value using the rotary knob
• Only numerical values can be set using the rotary knob, whilst numerical values and unit can be
set using the ten-key.
• The cursor will move to the next higher digit when the value at the cursor increases from 9 to 0.
Similarly, the cursor will move to the next lower digit when the value at the cursor decreases
from 0 to 9.
Note
It is possible to reset the set value to the default setting (factory setting). For details, refer to 10.4 Note that
this will reset all the set values to the default settings.
IM 704210-01E
4-3
Page 43
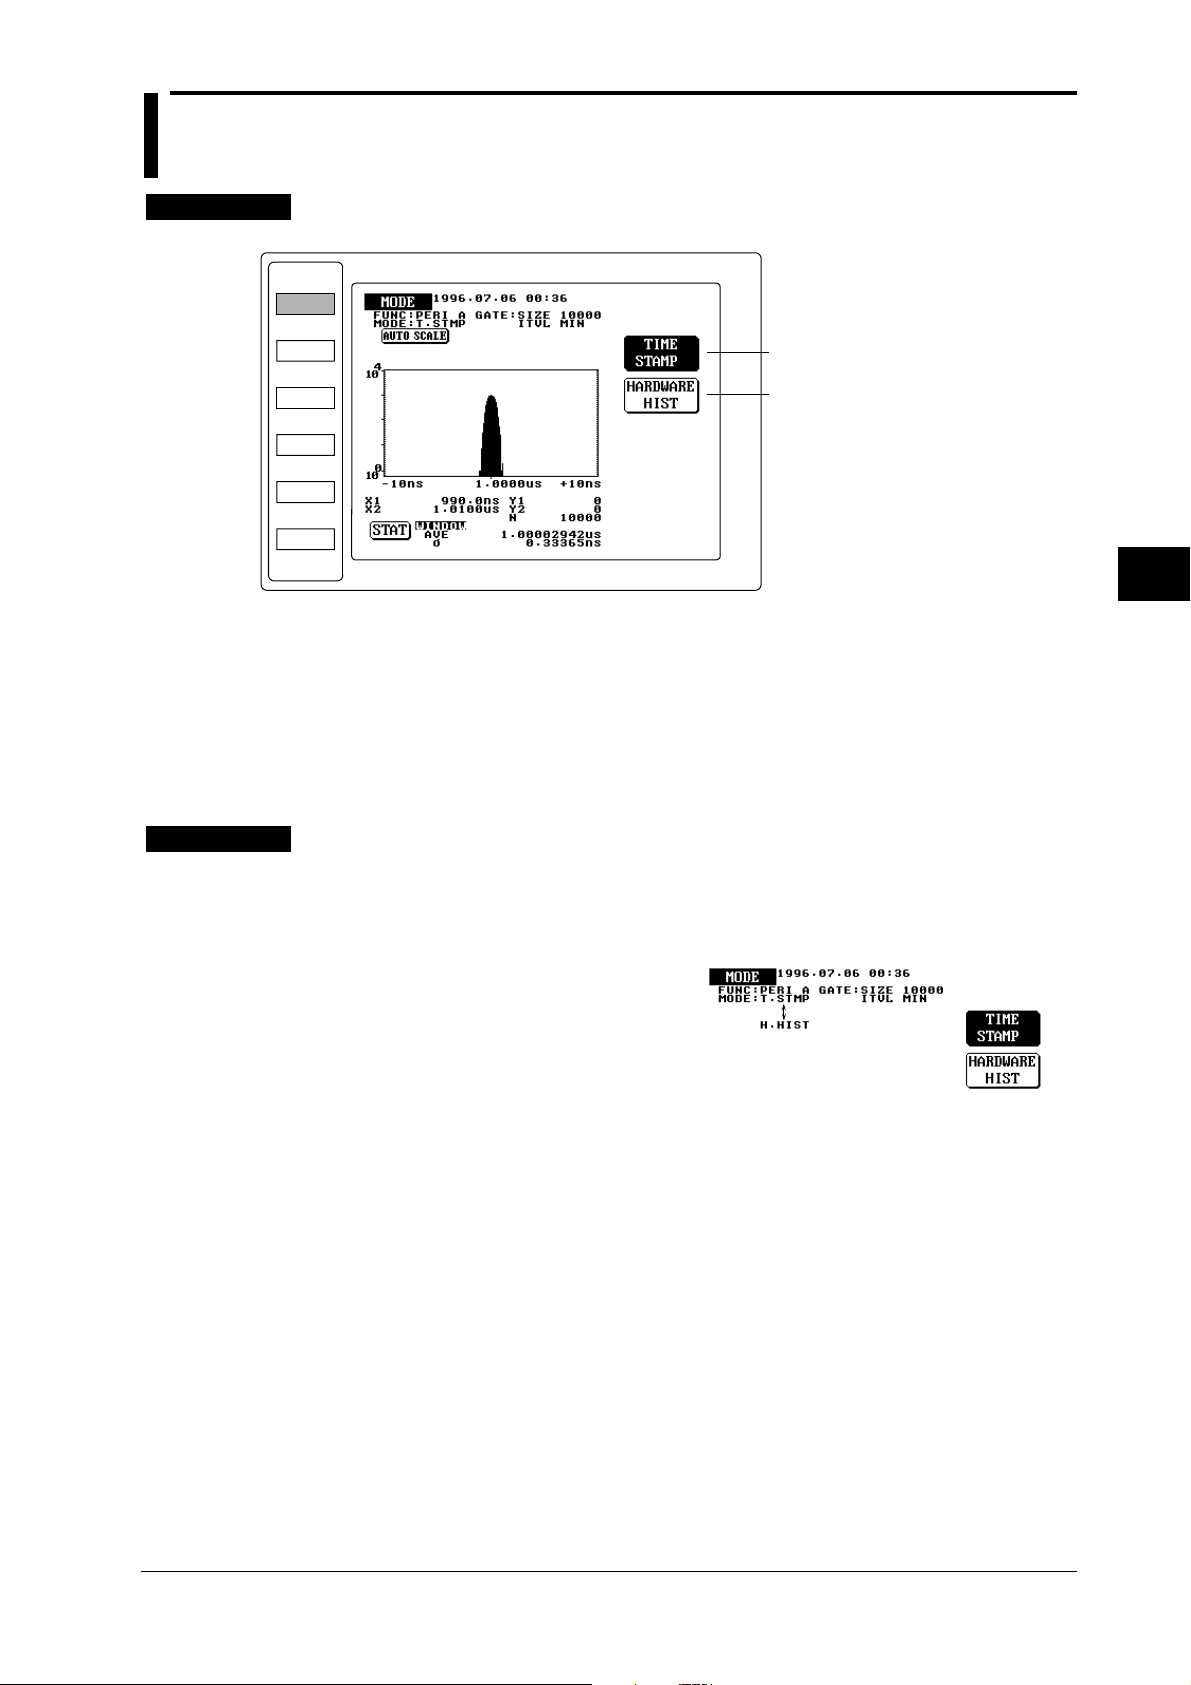
5.1 Selecting the Sampling Mode
Procedure
MODE
FUNCTION
DISPLAY
SAMPLE
INPUT
UTILITY
≡≡
≡For a description of the function, refer to 1.2
≡≡
MODE Top Menu
Selects the time stamp mode.
Selects the hardware histogram mode.
1. Press the MODE key to display the MODE top menu.
Selecting the time stamp mode
2. Press the TIME STAMP touch key to highlight TIME STAMP.
Selecting the hardware histogram mode
3. After step 1, Press the HARDWARE HIST touch key to highlight HARDWARE HIST.
≡≡
≡
≡≡
5
Setting the Sampling Mode and Measurement Function (Item)
Explanation
Selecting the sampling mode
Either time stamp mode or hardware histogram mode can be selected.
• Time stamp mode: The measured value and time stamp are acquired.
• Hardware histogram mode: The measured value and its occurrence frequency are acquired.
T.STMP is displayed during time stamp mode,
and H.HIST is displayed during hardware
histogram mode.
IM 704210-01E
5-1
Page 44

5.2 Setting Period Measurement
Procedure
FUNCTION
MODE
DISPLAY
SAMPLE
INPUT
UTILITY
≡≡
≡For a description of the function, refer to 1.3
≡≡
• To exit from the current menu, press any of the top menu keys or press the ESC touch key
displayed on the screen.
FUNCTION Top Menu
Displays the measurement function menu.
Selects the channel to be used for measurement.
Selects the slope (edge).
1. Press the FUNCTION key to display the FUNCTION top menu.
Selecting period measurement
2. Press the FUNC touch key to display the measurement function menu.
3. Press the PERIOD touch key to select period measurement. The screen will return to the
FUNCTION top menu when the PERIOD touch key is pressed.
≡≡
≡
≡≡
Selecting the channel to be used for measurement
4. Press the CHA/CHB touch key to select the desired channel (CHA or CHB). The
highlighted channel (CHA or CHB) will be selected.
Selecting the slope (edge)
5. Press the SLOPE touch key to highlight SLOPE.
6. Turn the rotary knob to select the desired slope type.
Measurement function menu
Selects period measurement.
These keys are displayed for time stamp mode only.
5-2
IM 704210-01E
Page 45

5.2 Setting Period Measurement
Explanation
Measurement range
Measurement range varies according to the selected sampling mode.
• Time stamp mode: 30 ns to 100 ms
• Hardware histogram mode: 30 ns to 3.2 µs
Selecting the channel to be used for measurement
Select either CHA or CHB.
Selecting the slope (edge)
Select the desired slope from the following.
: Measures the time from a rising edge to the next rising edge of the input signal.
•
• : Measures the time from a falling edge to the next falling edge of the input signal.
5
Setting the Sampling Mode and Measurement Function (Item)
IM 704210-01E
5-3
Page 46
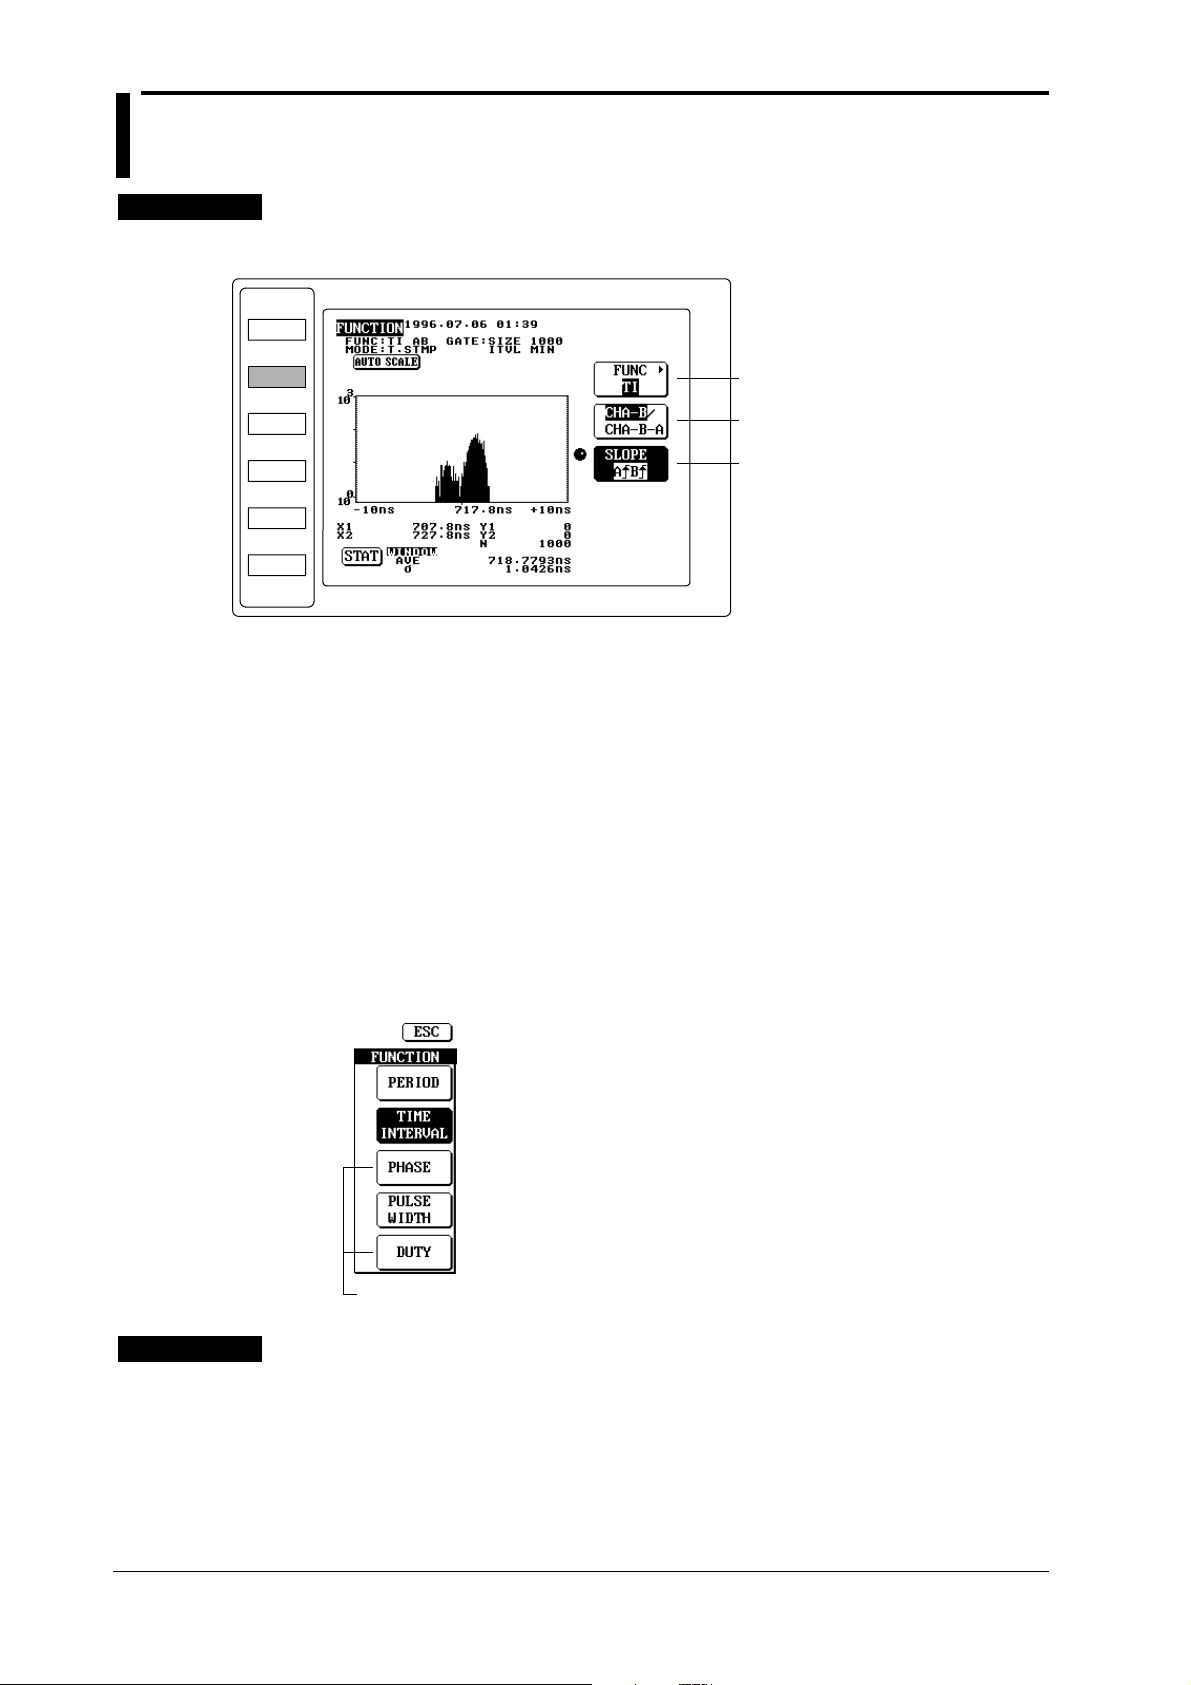
5.3 Setting Time Interval Measurement
Procedure
MODE
FUNCTION
DISPLAY
SAMPLE
INPUT
UTILITY
≡≡
≡For a description of the function, refer to 1.3
≡≡
• To exit from the current menu, press any of the top menu keys or press the ESC touch key
displayed on the screen.
FUNCTION Top Menu
Displays the measurement function menu.
Selects the pattern.
Selects the slope (edge).
1. Press the FUNCTION key to display the FUNCTION top menu.
Selecting time interval measurement
2. Press the FUNC touch key to display the measurement function menu.
3. Press the TIME INTERVAL touch key to select time interval measurement. The screen will
return to the FUNCTION top menu when the TIME INTERVAL touch key is pressed.
≡≡
≡
≡≡
Explanation
Selecting the pattern
4. Press the CHA/CHB touch key to select the desired pattern (CHA-B or CHA-B-A). The
highlighted pattern (CHA-B or CHA-B-A) will be selected.
Selecting the slope (edge)
5. Press the SLOPE touch key to highlight SLOPE.
6. Turn the rotary knob to select the desired slope type.
Measurement function menu
Selects period measurement.
These keys are displayed for time stamp mode only.
Measurement range
Measurement range varies according to the selected sampling mode and pattern.
• Time stamp mode:
• CHA-B pattern : 5 ns to 100 ms
• CHA-B-A pattern : 30 ns to 100 ms (for both A to B and B to A)
• Hardware histogram mode:
• CHA-B pattern : 5 ns to 3.2 µs
• CHA-B-A pattern : 30 ns to 3.2 µs (for both A to B and B to A)
5-4
IM 704210-01E
Page 47
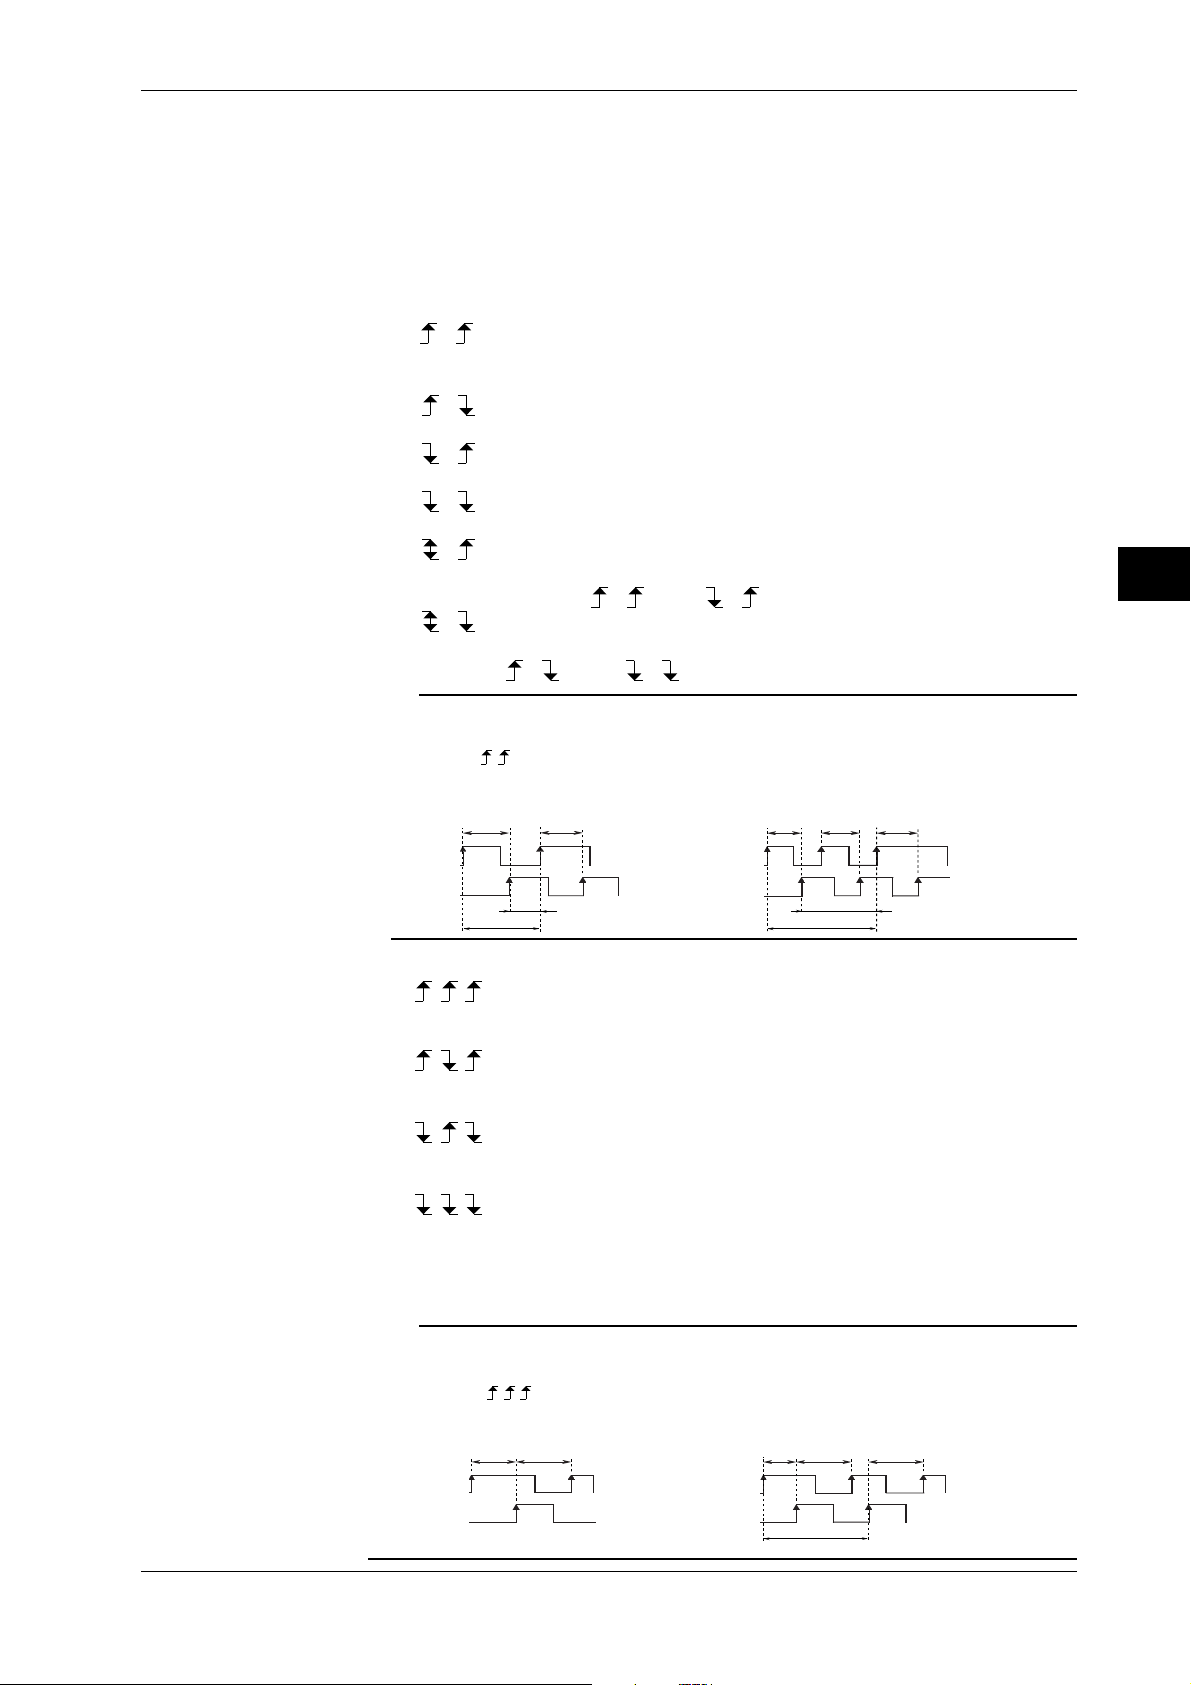
5.3 Setting Time Interval Measurement
Selecting the pattern
Select CHA-B or CHA-B-A.
• CHA-B: Measures A-to-B interval.
• CHA-B-A: Measures A-to-B-to-A interval. It is not possible to distinguish the measured data
of A-to-B from that of B-to-A.
Selecting the slope (edge)
Slope (edge) types which can be selected vary according to the selected pattern.
• CHA-B: Select the desired slope from the following.
AB
•
: Measures the interval from a rising edge of the CHA signal (i.e. the signal which
is input to the CHA) to the first rising edge of the CHB signal (i.e. the signal
which is input to the CHB).
AB
•
: Measures the interval from a rising edge of the CHA signal to the first falling
edge of the CHB signal.
AB
•
: Measures the interval from a falling edge of the CHA signal to the first rising
edge of the CHB signal.
AB
•
: Measures the interval from a falling edge of the CHA signal to the first falling
edge of the CHB signal.
AB
•
: Measures the interval from a rising or falling edge of the CHA signal to the first
rising edge of the CHB signal. It is not possible to
AB
•
distinguish
AB
: Measures the interval from a rising or falling edge of the CHA signal to the to
from
AB
.
the first falling edge of the CHB signal. It is not possible to distinguish
AB
from
AB
.
Note
Measurement can be carried out continuously if the period of the CHA signal is 71 ns or more and the
interval between an edge of the CHB signal and subsequent edge of the CHA signal is 30 ns or more.
Example
AB
Measurement (t2) is carried out if the
period of the CHA signal is 71 ns or more.
CHA
CHB
Measured
71 ns or more
Measured
t
1
t
2
30 ns or more
Measurement (t2) is not carried out but
measurement (t3) is carried out if the
period of the CHA signal is below 71 ns.
CHA
CHB
Measured
t
1
71 ns or more
t
2
Measured
t
3
30 ns or more
5
Setting the Sampling Mode and Measurement Function (Item)
• CHA-B-A: Select the desired slope from the following.
•
ABA
: Measures the interval from a rising edge of the CHA signal to the first rising
edge of the CHB signal, and the time interval from a rising edge of the CHB
signal to the first subsequent rising edge of the CHA signal.
•
ABA
: Measures the interval from a rising edge of the CHA signal to the first falling
edge of the CHB signal, and the time interval from a falling edge of the CHB
signal to the first subsequent rising edge of the CHA signal.
•
ABA
: Measures the interval from a falling edge of the CHA signal to the first rising
edge of the CHB signal, and the time interval from a rising edge of the CHB
signal to the first subsequent falling edge of the CHA signal.
•
ABA
:A down B down A down: Measures the interval from a falling edge of the CHA
signal to the first rising edge of the CHB signal, and the time interval from a
rising edge of the CHB signal to the first subsequent falling edge of the CHA
signal.
Note
Measurement can be carried out continuously if the time interval (t1) from the CHA signal to the CHB
signal is 71 ns or more.
ABA
Example
Measurement (t2) is carried out
if t1 is 71 ns or more.
Measured
CHA
CHB
t
1
Measured
t
2
Measurement (t2) is not carried out but measurement
(t3) is carried out if t1 is below 71 ns.
CHA
CHB
Measured
t
1
71 ns or more
Measured
3
t
2
t
IM 704210-01E
5-5
Page 48

5.4 Setting Pulse Width Measurement
Procedure
MODE
FUNCTION
DISPLAY
SAMPLE
INPUT
UTILITY
≡≡
≡For a description of the function, refer to 1.3
≡≡
• To exit from the current menu, press any of the top menu keys or press the ESC touch key
displayed on the screen.
FUNCTION Top Menu
Displays the measurement function menu.
Selects the channel to be used for measurement.
Selects a polarity.
1. Press the FUNCTION key to display the FUNCTION top menu.
Selecting pulse width measurement
2. Press the FUNC touch key to display the measurement function menu.
3. Press the PULSEWIDTH touch key to select pulse width measurement. The screen will
return to the FUNCTION top menu when the PULSEWIDTH touch key is pressed.
≡≡
≡
≡≡
Selecting the channel to be used for measurement
4. Press the CHA/CHB touch key to select the desired channel (CHA or CHB). The
highlighted channel (CHA or CHB) will be selected.
Selecting the polarity
5. Press the POLARITY touch key to highlight POLARITY.
6. Turn the rotary knob to select the desired polarity.
Measurement function menu
Selects pulse width measurement.
These keys are displayed for time stamp mode only.
5-6
IM 704210-01E
Page 49
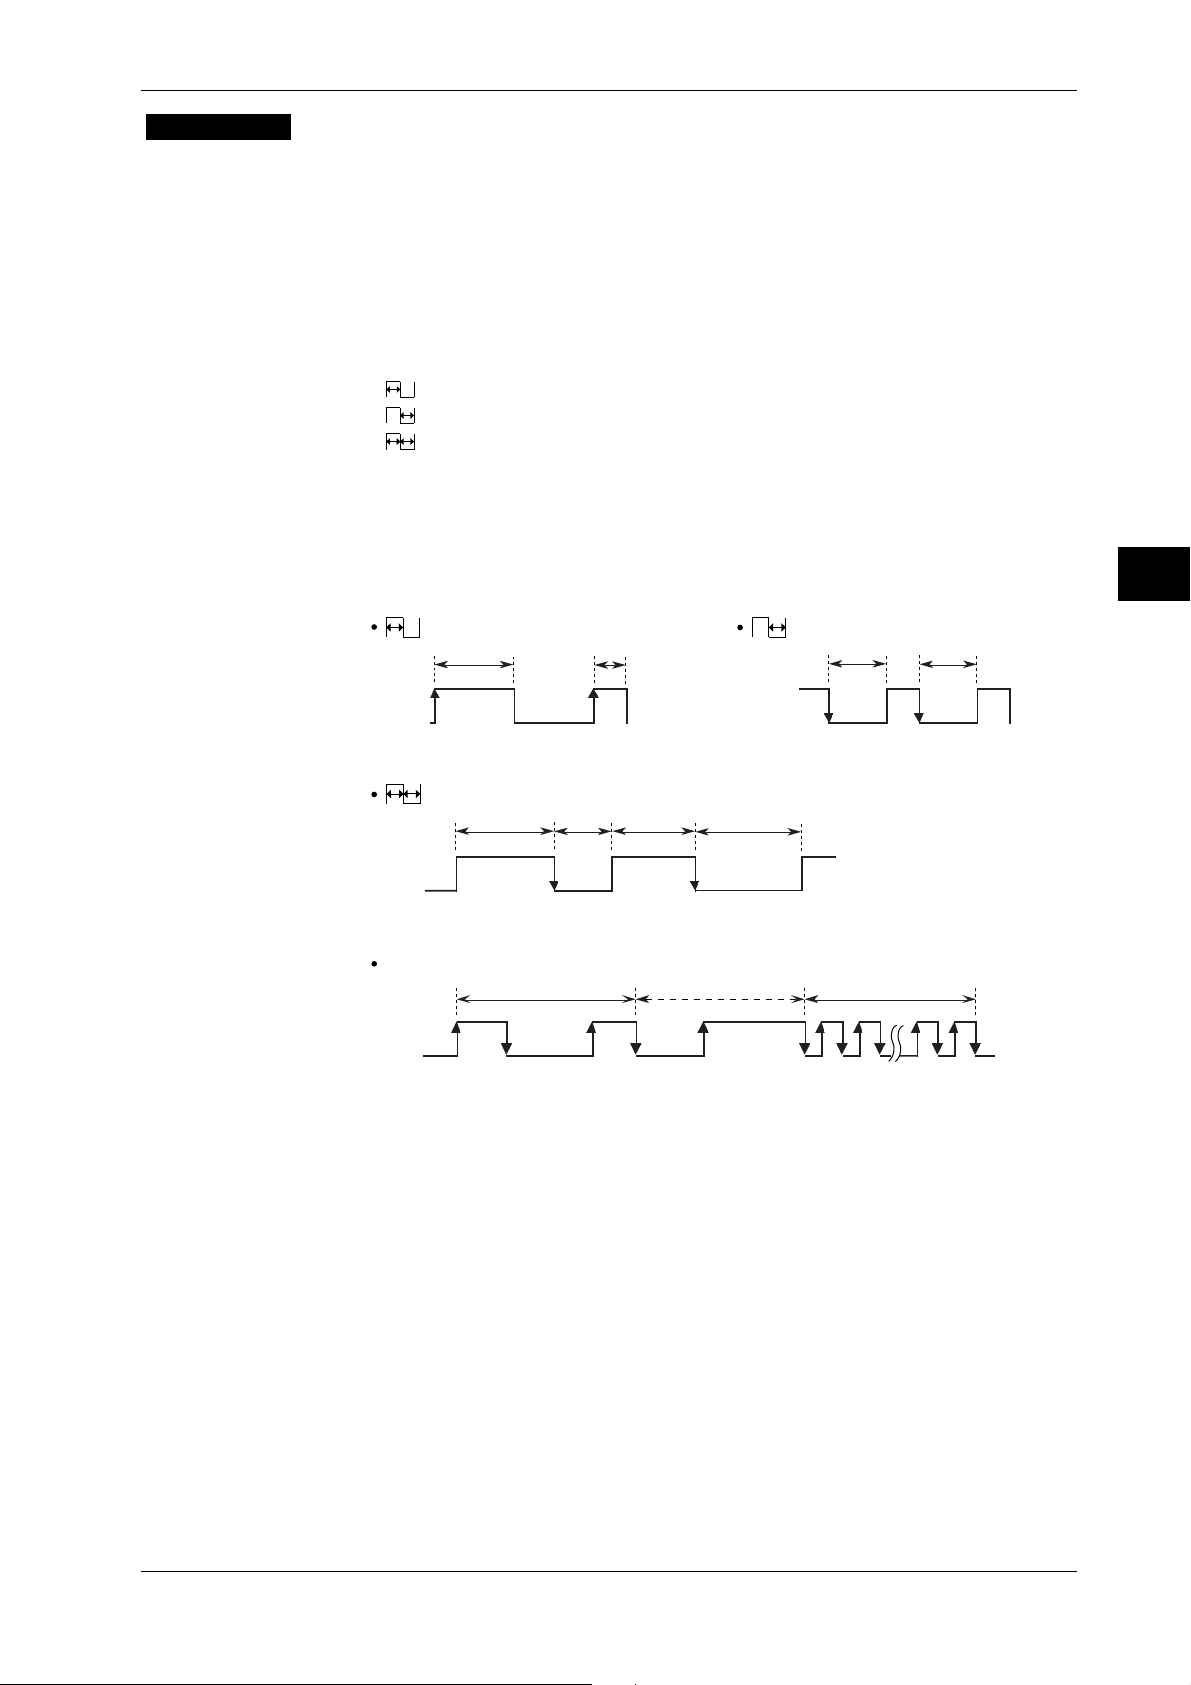
5.4 Setting Pulse Width Measurement
Explanation
Measurement range
Measurement range varies according to the selected sampling mode.
• Time stamp mode: 30 ns to 100 ms
• Hardware histogram mode: 30 ns to 3.2 µs
Selecting the channel to be used for measurement
Select either CHA or CHB.
Selecting the polarity
Select the desired polarity from the following.
: Measures the positive pulse width (i.e. time from a rising edge to the next falling edge).
•
• : Measures the negative pulse width (i.e. time from a falling edge to the next rising edge).
: Measures both positive and negative pulse widths. The positive and negative measured
•
data can be displayed individually using the calculation menu of histogram display
mode.
• 22T : If PW (the total time of a few continuous periods) is within a range of 22T ± 0.5T, PW
will be measured. This measurement can be selected only when time stamp mode has
been selected. Constant T specified in 7.7 will be used as T.
Measured
Measured
Measured
Measured
5
Setting the Sampling Mode and Measurement Function (Item)
22T
Measured
Measured when
within 22T 0.5T
Measured
Measured
Not measured when
not within 22T ± 0.5T
Measured
Measured when
within 22T ± 0.5T
IM 704210-01E
5-7
Page 50

5.5 Setting Phase Difference Measurement
Procedure
MODE
FUNCTION
DISPLAY
SAMPLE
INPUT
UTILITY
≡≡
≡For a description of the function, refer to 1.3
≡≡
• To exit from the current menu, press any of the top menu keys or press the ESC touch key
displayed on the screen.
FUNCTION Top Menu
Displays the measurement function menu.
CHA-B is always used as the pattern.
Selects the slope (edge).
1. Press the FUNCTION key to display the FUNCTION top menu.
Selecting phase difference measurement
2. Press the FUNC touch key to display the measurement function menu.
3. Press the PHASE touch key to select phase difference measurement. The screen will return
to the FUNCTION top menu when the PHASE touch key is pressed.
≡≡
≡
≡≡
Selecting the slope (edge)
4. Press the SLOPE touch key to highlight SLOPE.
5. Turn the rotary knob to select the desired slope type.
Measurement function menu
Selects phase difference measurement.
These keys are displayed for time stamp mode only.
5-8
IM 704210-01E
Page 51
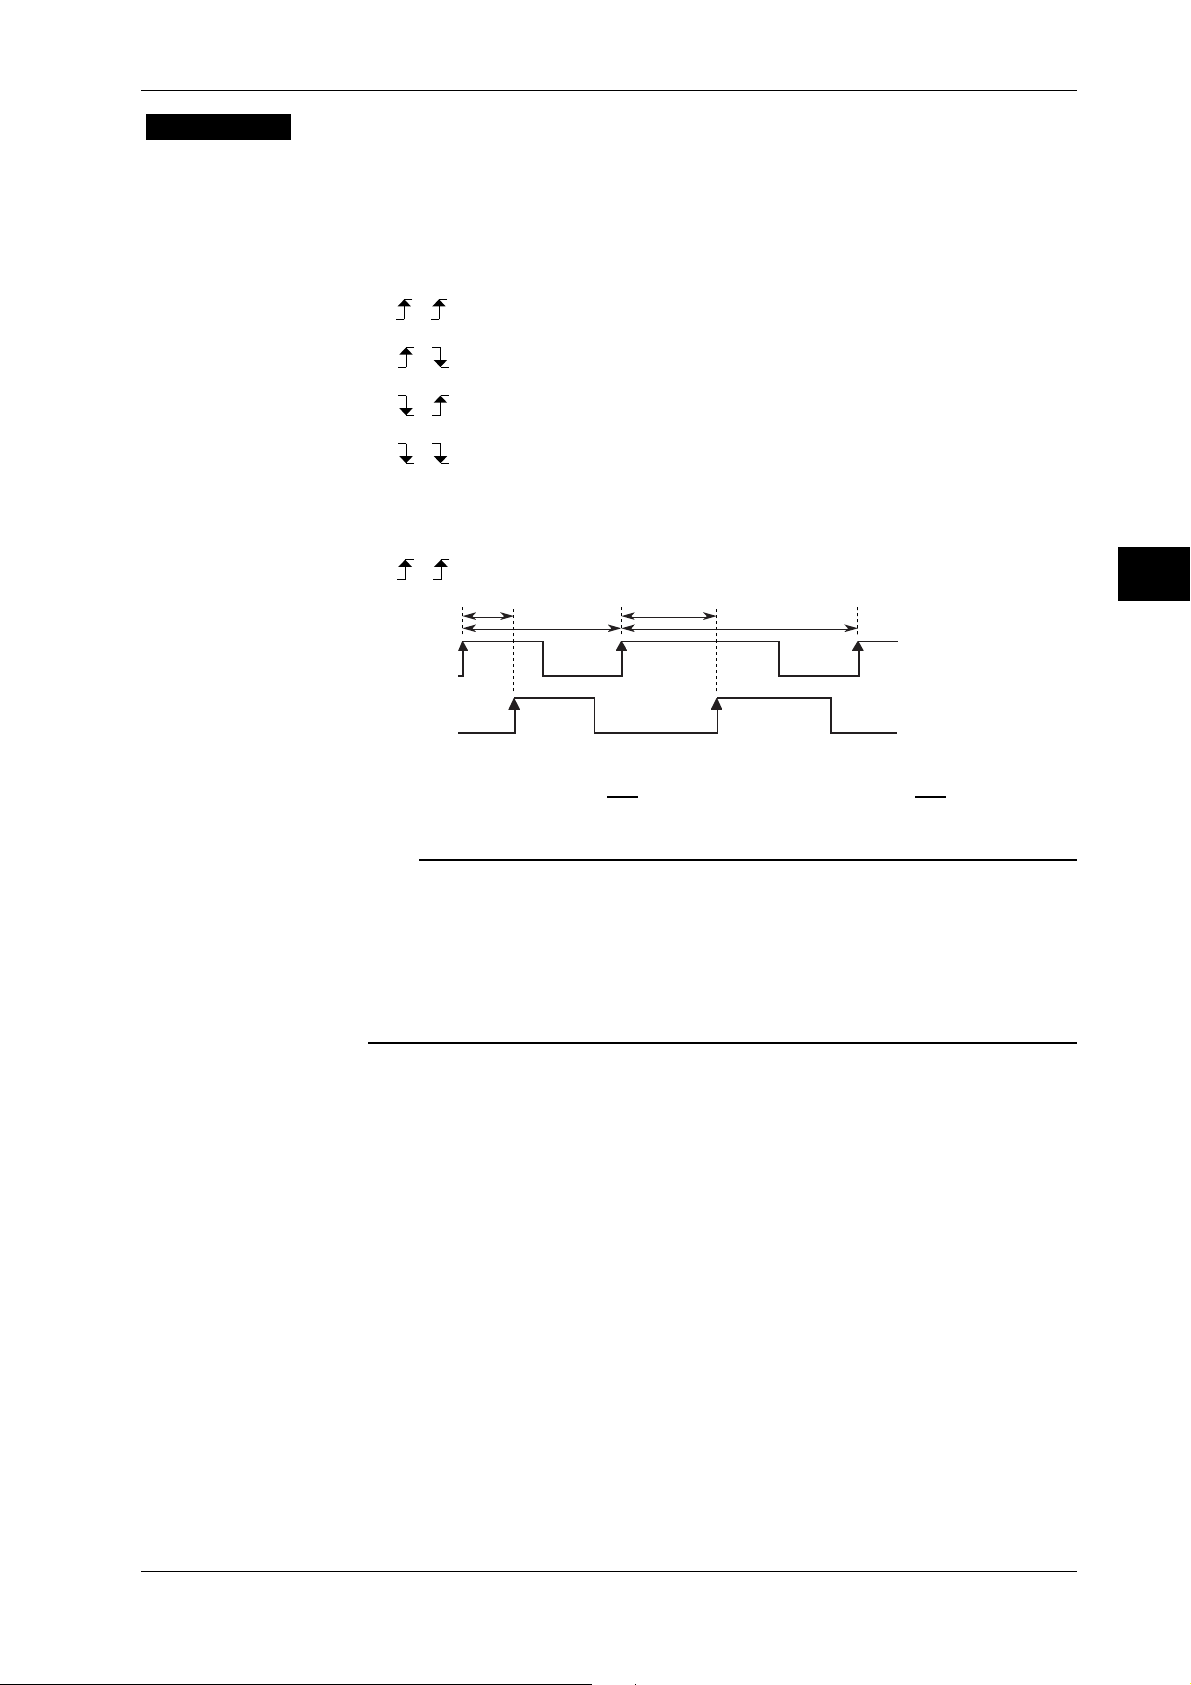
5.5 Setting Phase Difference Measurement
Explanation
Measurement range
Measurement range is shown below. This measurement is available only when time stamp mode
has been selected.
0 to 360 deg
Selecting the slope (edge)
Select the desired slope from the following.
•
AB
: Measures the time from a rising edge of the CHA signal to the first subsequent
rising edge of the CHB signal.
AB
•
: Measures the time from a rising edge of the CHA signal to the first subsequent
falling edge of the CHB signal.
AB
•
: Measures the time from a falling edge of the CHA signal to the first subsequent
rising edge of the CHB signal.
AB
•
: Measures the time from a falling edge of the CHA signal to the first subsequent
falling edge of the CHB signal.
Example (Both channels A and B: rise)
AB
CH A
Measuredt
p1
Measuredt
Measuredt
1
p2
Measuredt
2
5
Setting the Sampling Mode and Measurement Function (Item)
CH B
1[deg]=
t
p1
× 360 2[deg]=
t
1
Phase difference
t
p2
× 360Phase difference
t
2
Note
• Phase difference measurement is not available if hardware histogram mode has been selected.
• The time from a rising or falling edge of the CHA signal to the first subsequent edge of the CHB signal
must be 71 ns or more, otherwise incorrect measurement will result.
• The time from a rising or falling edge of the CHB signal to the first subsequent edge of the CHA signal
must be 30 ns or more, otherwise incorrect measurement will result.
•tp (phase difference) must be equal or smaller than t (period of the CHA signal), otherwise incorrect
measurement will result.
IM 704210-01E
5-9
Page 52

5.6 Setting Duty Ratio Measurement
Procedure
FUNCTION
MODE
DISPLAY
SAMPLE
INPUT
UTILITY
≡≡
≡For a description of the function, refer to 1.3
≡≡
• To exit from the current menu, press any of the top menu keys or press the ESC touch key
displayed on the screen.
FUNCTION Top Menu
Displays the measurement function menu.
Selects the channel to be used for measurement.
Selects a polarity
1. Press the FUNCTION key to display the FUNCTION top menu.
Selecting duty ratio measurement
2. Press the FUNC touch key to display the measurement function menu.
3. Press the DUTY touch key to select duty ratio measurement. The screen will return to the
FUNCTION top menu when the DUTY touch key is pressed.
≡≡
≡
≡≡
Selecting the channel to be used for measurement
4. Press the CHA/CHB touch key to select the desired channel (CHA or CHB). The
highlighted channel (CHA or CHB) will be selected.
Selecting the polarity
5. Press the POLARITY touch key to highlight POLARITY.
6. Turn the rotary knob to select the desired polarity.
Measurement function menu
Selects duty ratio measurement.
These keys are displayed for time stamp mode only.
5-10
IM 704210-01E
Page 53

5.6 Setting Duty Ratio Measurement
Explanation
Measurement range
Measurement range is shown below. This measurement is available only when time stamp mode
has been selected.
0 to 99.999%
Selecting the channel to be used for measurement
Select either CHA or CHB.
Selecting the polarity
Select the desired polarity from the following.
: Measures the positive duty ratio (i.e. from a rising edge to the next falling edge).
•
• : Measures the negative duty ratio (i.e. from a falling edge to the next rising edge).
Example
Measurement t
CH A/
CH B
Duty ratio
p1
Measurement t
1
]=
[
%
t
p1
t
× 100
1
Measurement t
1
Duty ratio
p2
Measurement t
t
2[ ]=
%
t
p2
2
2
× 100
5
Setting the Sampling Mode and Measurement Function (Item)
Note
• Duty ratio measurement is not available if hardware histogram mode has been selected.
•tp1 must be 71 ns or more in the above example, otherwise incorrect measurement will result. In addition,
incorrect measurement may also result if “t1 – tp1” is below 30 ns. This also applies when negative
polarity is selected.
IM 704210-01E
5-11
Page 54

6.1 Setting the Input Coupling, Input Impedance,
Procedure
Trigger Mode and Trigger Level
≡≡
≡For a description of the function, refer to 1.5
Procedure
• To exit from the current menu, press any of the top menu keys or press the ESC touch key
displayed on the screen.
INPUT Top Menu
MODE
≡≡
≡≡
≡
≡≡
FUNCTION
DISPLAY
SAMPLE
INPUT
UTILITY
Displays the CHA input condition menu.
Displays the CHB input condition menu.
1. Press the INPUT key to display the INPUT top menu.
Selecting the channel to be set
2. Press the CHA or CHB touch key to select the desired channel. The input condition menu
for the selected channel will be displayed.
Selecting the input impedance
3. Press the IMPD touch key to select the desired input impedance (50Ω or 1 MΩ). The
highlighted input impedance (50Ω or 1 MΩ) will be selected.
Selecting the input coupling method
4. Press the COUPLING touch key to select the desired input coupling method (AC or DC).
The highlighted input coupling method (AC or DC) will be selected.
6
Setting the Acquisition Conditions for Input Signal to be Measured
IM 704210-01E
Selecting the trigger mode
5. Press the TRIGGER touch key to highlight TRIGGER.
6. Turn the rotary knob to select the desired trigger mode.
Setting the trigger level (required only when MANUAL trigger mode is selected)
7. Turn the rotary knob or press the ten-key to select the desired trigger level.
Input condition menu
(The same items are also displayed when CHB is selected.)
Selects the input impedance.
Selects the input coupling method.
Selects the trigger mode.
Selects the trigger level.
6-1
Page 55

6.1 Setting the Input Coupling, Input Impedance, Trigger Mode and Trigger Level
Explanation
Selecting the channel to be set
Select the input conditions individually for channels A and B.
Selecting the input impedance
Select 50Ωor 1 MΩ. If AC coupling is selected, frequency characteristic will vary depending on
the selected input impedance. For details, refer to 12.1.
Selecting the input coupling method
Select AC or DC. Frequency characteristic will vary depending on the selected input coupling
method. For details, refer to 12.1.
Selecting the trigger mode
Select the desired trigger mode from the following.
• SGL.AUTO : Single auto trigger mode.
• REP.AUTO : Repeat auto trigger mode.
• MANUAL : Manual trigger mode.
Setting the trigger level (required only when MANUAL trigger mode is selected)
Setting range : –5 V to +5 V
6-2
IM 704210-01E
Page 56

6.2 Setting the Gate Type, Sample Size and
External gate menu
Selects the polarity.
Selects the sampling interval.
(Display for time stamp
mode only.)
Selects the gate type.
Sampling Interval
≡≡
≡For a description of the function, refer to 1.5
Procedure
• To exit from the current menu, press any of the top menu keys or press the ESC touch key
displayed on the screen.
SAMPLE Top Menu
MODE
FUNCTION
DISPLAY
≡≡
≡≡
≡
≡≡
SAMPLE
INPUT
UTILITY
Displayed only when time stamp mode is selected.
1. Press the SAMPLE key to display the SAMPLE top menu.
Selecting the gate type
2. Press the GATE touch key to highlight GATE.
3. Turn the rotary knob to select the desired gate type.
• Setting the sample size (number of events) (required if EVENT gate type is
selected at step 3)
4. Press the SIZE touch key to highlight SIZE.
5. Turn the rotary knob or press the ten-key to set the desired number of events. Proceed to
step 9.
• Setting the gate time (required if TIME gate type is selected at step 3)
6. After step 3, press the GATETIME touch key to highlight GATETIME.
7. Use the ten-key to set the desired gate time. After the desired gate time has been set, proceed
to step 9.
6
Setting the Acquisition Conditions for Input Signal to be Measured
IM 704210-01E
Event gate menu
Selects the gate type.
Sets the sample size.
Selects the sampling interval.
(Display for time stamp
mode only.)
• Selecting the polarity (required if EXTERNAL gate type is selected at step 3)
8. After step 3, press the POLARITY touch key to highlight
or . The highlighted
polarity will be selected. After the desired polarity has been set, proceed to step 9.
Selecting the sampling interval
9. Press the INTERVAL touch key to highlight INTERVAL.
10. Turn the rotary knob to set the desired sampling interval.
Time gate menu
Selects the gate type.
Sets the gate time.
Selects the sampling interval.
(Display for time stamp
mode only.)
6-3
Page 57

6.2 Setting the Gate Type, Sample Size and Sampling Interval
Explanation
Selecting the gate type
Select the desired gate type from the following.
• EVENT : Event gate
• TIME : Time gate
• EXTERNAL : External gate. It is not possible to set the arming function or use the external
arming signal if EXTERNAL is selected, since the external arming input terminal is shared
with the external gate input signal.
Points to note when selecting EXTERNAL
Input the external gating signal to the EXT ARM terminal on the rear panel.
• Input impedance : 10 kΩ (Typical *)
• Input coupling : DC
• Trigger level : TTL level
• Maximum input voltage : –8 V to 13 V (DC + AC
peak
)
• Minimum pulse width : 30 ns
• Setup time : 70 ns (in order for the gating signal to be valid, it must precede the measurement
signal by no less than 70 ns)
* Typical value is described in terms of typical of average performance. However, they cannot
be guaranteed.
External gate input circuit (shared with the external arming signal)
+5V
EXT ARM
IN
(External arming
input terminal)
(TTL)
74LS14 or
equivalent
500 Ω
10k Ω
CAUTION
Never apply a voltage exceeding the maximum input voltage to the external arming input
terminal (EXT ARM IN). Damage to the terminal may result.
Setting range for the number of events
The setting range varies according to the selected sampling mode. This setting is available only
when EVENT gate is selected.
• For time stamp mode
• Period, time interval or pulse width measurement : 1 to 32,000
• Phase difference or duty ratio measurement :1 to 16,000
• For hardware histogram mode: 1 to 99,999,999
Note
Measurement of one block will be forced to end when 320 seconds (maximum sampling time) elapse
following the arming, even if the number of events specified in sampling mode has not been reached.
6-4
Setting range for gate time
The gate time can be set within the following range. This setting is available only when TIME
gate is selected.
1 µs to 10 s
Note
• Setting resolution varies depending on the value to be set. For details, refer to 12.2.
• Measurement of one block will be forced to end if the number of events for the block reaches the
maximum number of events for the selected sampling mode even if the preset gate time has not been
reached.
IM 704210-01E
Page 58
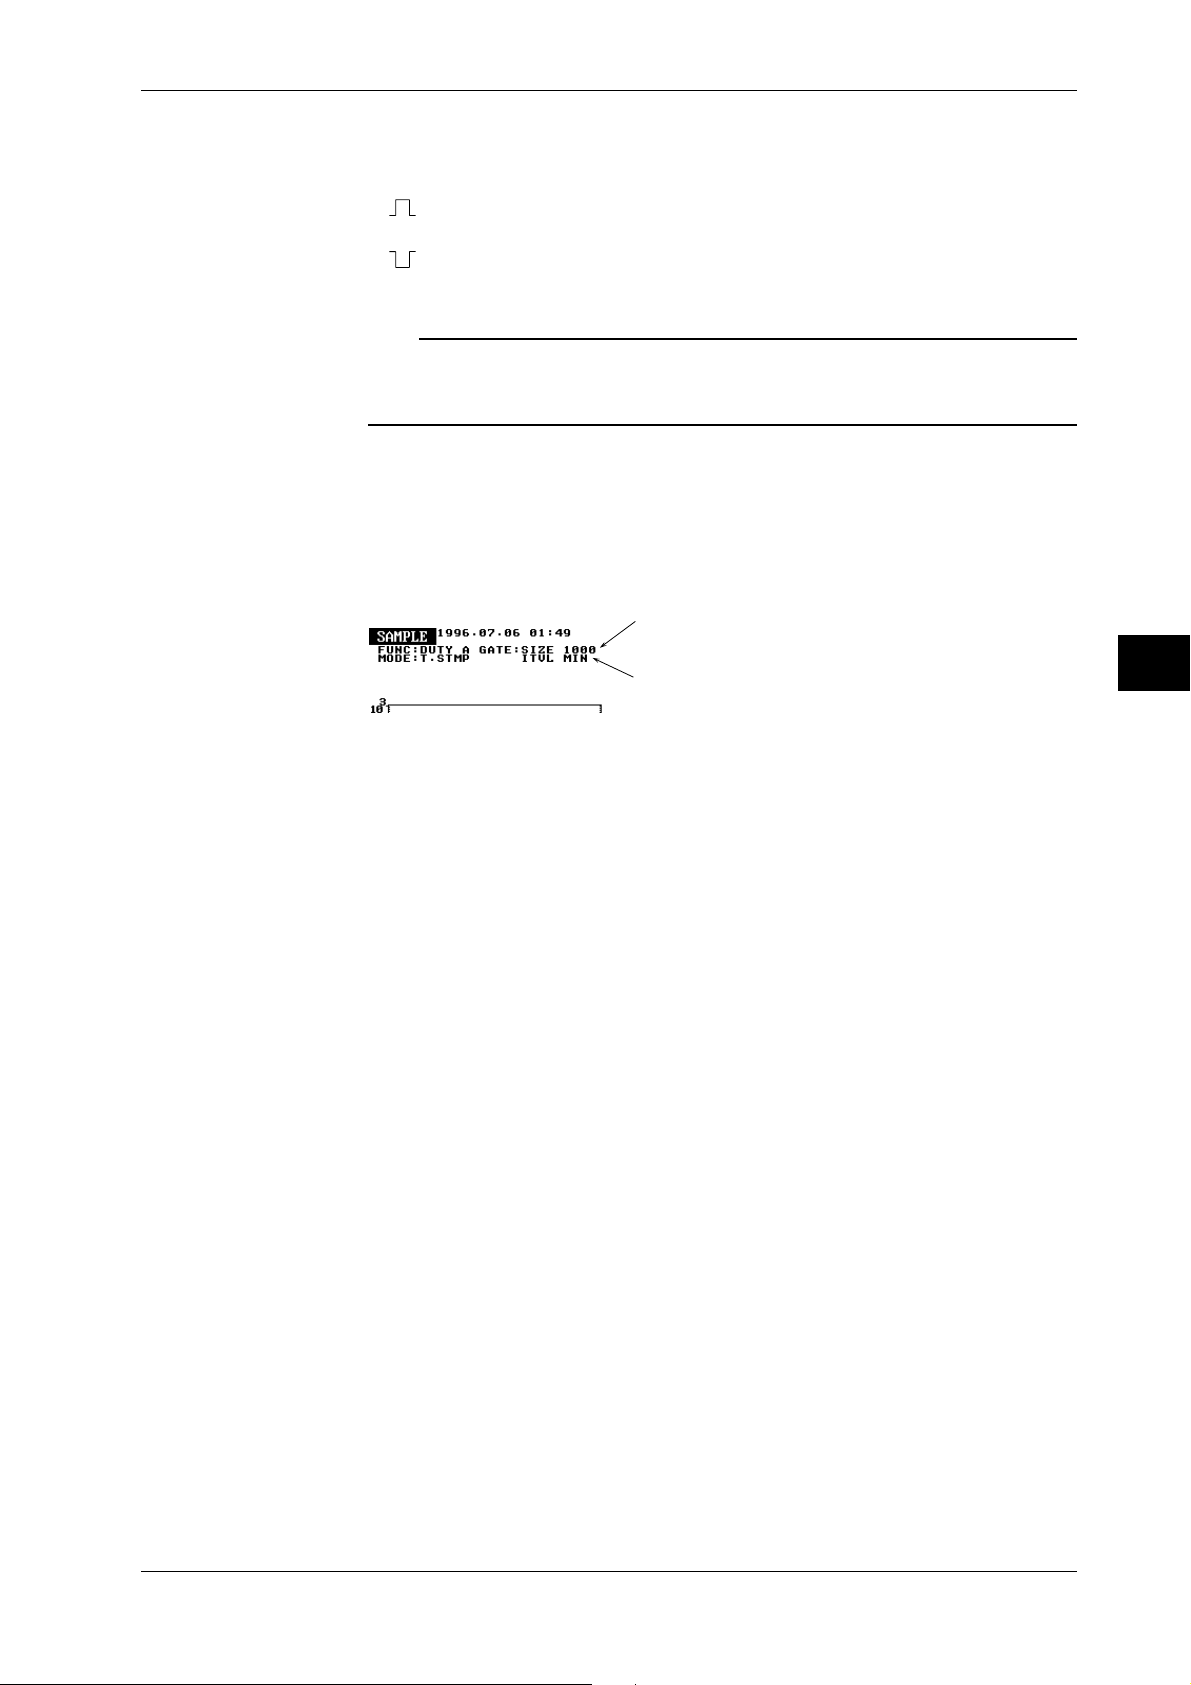
6.2 Setting the Gate Type, Sample Size and Sampling Interval
Selecting the polarity
Select the desired polarity from the following. This setting is available only when EXTERNAL
gate is selected.
: Carries out measurement only when a positive signal is being input to the EXT ARM
•
IN terminal.
: Carries out measurement only when a negative signal is being input to the EXT ARM
•
IN terminal.
Note
Measurement of one block will be forced to end when the maximum number of events for the selected
sampling mode is reached or when the maximum sampling time is exceeded, even if the external gate is
still open.
Selecting the sampling interval
Select the desired sampling interval from the following. For hardware histogram mode, the
sampling interval is fixed at MIN and cannot be set to another option.
MIN/1 µs/2 µs/4 µs/10 µs/20 µs/40 µs/100 µs/200 µs/400 µs/1 ms/2 ms/4 ms
MIN equals to 71 ns.
Currently set number of events
Selected sampling interval
6
Setting the Acquisition Conditions for Input Signal to be Measured
IM 704210-01E
6-5
Page 59

6.3 Setting the Arming Source, Slope and Delay
Procedure
Types
≡≡
≡For a description of the function, refer to 1.5
Procedure
• To exit from the current menu, press any of the top menu keys or press the ESC touch key
displayed on the screen.
SAMPLE Top Menu
MODE
FUNCTION
DISPLAY
SAMPLE
≡≡
≡≡
≡
≡≡
INPUT
UTILITY
Displays the arming menu.
(This touch key is not
displayed if EXTERNAL
gate is selected)
1. Press the SAMPLE key to display the SAMPLE top menu.
Displaying the arming menu
2. Press the ARMING touch key to display the arming menu. This setting is not available (the
ARMING touch key is not displayed) if EXTERNAL gate is selected.
Selecting the arming source
3. Press the SOURCE touch key to highlight SOURCE.
4. Turn the rotary knob to select the desired arming source.
If EXT (external arming) is selected at step 4, proceed to the following steps. If AUTO (auto
arming) is selected, the following steps will not be available.
Selecting the slope (edge) (required only when EXT arming is selected)
5. Press the SLOPE touch key to highlight
or . The highlighted slope will be selected.
Selecting the arming delay type (required only when EXT arming is selected)
6. Press the DELAY touch key to highlight DELAY.
7. Turn the rotary knob to select the desired delay type.
6-6
Setting the delay time (required only when TIME is selected at step 7)
8. Press the D.TIME touch key to highlight D.TIME.
9. Use the ten-key to set the desired delay time.
IM 704210-01E
Page 60

6.3 Setting the Arming Source, Slope and Delay Types
• Setting the number of events (required only when EVENT is selected at step 7)
10. After step 7, press the D.EVENT touch key to highlight D.EVENT.
11. Turn the rotary knob to select the desired number of events.
Explanation
Auto arming menu
Selects the arming source.
External arming menu
Selects the arming source.
Selects the slope.
Selects the arming delay type.
Sets the delay time/number of events.
No touch key is displayed if OFF is selected
as the arming delay type, and D.EVENT
touch key is displayed if EVENT is selected.
Selecting the arming source
Selects the desired arming source from the following.
• AUTO : Auto arming
• EXT : External arming
Points to note when selecting EXTERNAL
Input the external arming signal to the EXT ARM terminal on the rear panel.
• Input impedance : 10 kΩ (Typical *)
• Input coupling : DC
• Trigger level : TTL level
• Maximum input voltage : –8 V to 13 V (DC + AC
peak
)
• Minimum pulse width : 30 ns
• Setup time : 70 ns (in order for the arming signal to be valid, it must precede the measurement
signal by no less than 70 ns)
* Typical value is described in terms of typical of average performance. However, they cannot
be guaranteed.
6
Setting the Acquisition Conditions for Input Signal to be Measured
IM 704210-01E
External arming input circuit (shared with the external gating signal)
+5V
EXT ARM
IN
(External arming
input terminal)
(TTL)
74LS14 or
equivalent
500 Ω
10kΩ
CAUTION
Never apply a voltage exceeding the maximum input voltage to the external arming input
terminal (EXT ARM IN). Damage to the terminal may result.
6-7
Page 61

6.3 Setting the Arming Source, Slope and Delay Types
Selecting the slope (edge)
Select the desired slope from the following. This is required only if EXT has been selected as the
arming source.
: Causes arming at a rising edge of the external arming signal.
•
: Causes arming at a falling edge of the external arming signal.
•
Selecting the arming delay type
Select the desired arming delay type from the following. This setting is available only when EXT
arming is selected.
• OFF : Selection/setting of arming delay is disabled. Arming delay will not be performed.
• TIME : Time delay
• EVENT : Event delay
• Setting the delay time
The delay time can be set within the following range. This setting is available only when TIME
arming delay is selected.
1 µs to 1 s
Note
Setting resolution varies depending on the value to be set. For details, refer to 12.2.
• Selecting the number of events to be delayed
Select from the following. This setting is available only when EVENT arming delay is selected.
1/2/3/4/5/6/7/8/9/10/20/30/40/50/60/70/80/90/100/200/300/400/500/600/700/800/900/1000/2000/
3000/4000/5000/6000/7000/8000/9000/10000/20000/30000
Note
The number of events to be delayed for the signal which is input to the measuring channel must be selected.
However, for time interval measurement, the number of events to be delayed for the signal input to the
channel A (CHA) must be selected.
6-8
IM 704210-01E
Page 62

6.4 Setting the Inhibit Function
Explanation
Procedure
Explanation
MODE
FUNCTION
DISPLAY
SAMPLE
INPUT
UTILITY
≡≡
≡For a description of the function, refer to 1.5
≡≡
• To exit from the current menu, press any of the top menu keys.
SAMPLE Top Menu
Sets the inhibit function.
1. Press the SAMPLE key to display the SAMPLE top menu.
2. Press the INHIBIT touch key to highlight INHIBIT.
3. Turn the rotary knob to select the desired polarity.
Selecting the polarity
Select the desired polarity from the following. The inhibit function is disabled if OFF is selected.
•
: Inhibits measurement while a positive signal is input to the INHIBIT IN terminal.
• : Inhibits measurement while a negative signal is input to the INHIBIT IN terminal.
Note
The inhibit signal is valid only if it is input within just 320 seconds following the arming. It will not be
valid if it is input after 320 seconds have elapsed following the arming.
≡≡
≡
≡≡
6
Setting the Acquisition Conditions for Input Signal to be Measured
Points to note when inputting the inhibit signal
Input the inhibit signal to the INHIBIT IN terminal on the rear panel.
• Input impedance : 10 kΩ (Typical *)
• Input coupling : DC
• Trigger level : TTL level
• Maximum input voltage : –8 V to 13 V (DC + AC
peak
)
• Minimum pulse width : 30 ns
• Setup time : 70 ns (in order for the inhibit signal to be valid, it must precede the measurement
signal by no less than 70 ns)
* Typical value is described in terms of typical of average performance. However, they cannot
be guaranteed.
Inhibit input circuit
+5V
INHIBIT
IN
(TTL)
(Inhibit input
terminal)
74LS14 or
equivalent
500Ω
10kΩ
CAUTION
Never apply a voltage exceeding the maximum input voltage to the inhibit input terminal
(INHIBIT IN). Damage to the terminal may result.
IM 704210-01E
6-9
Page 63
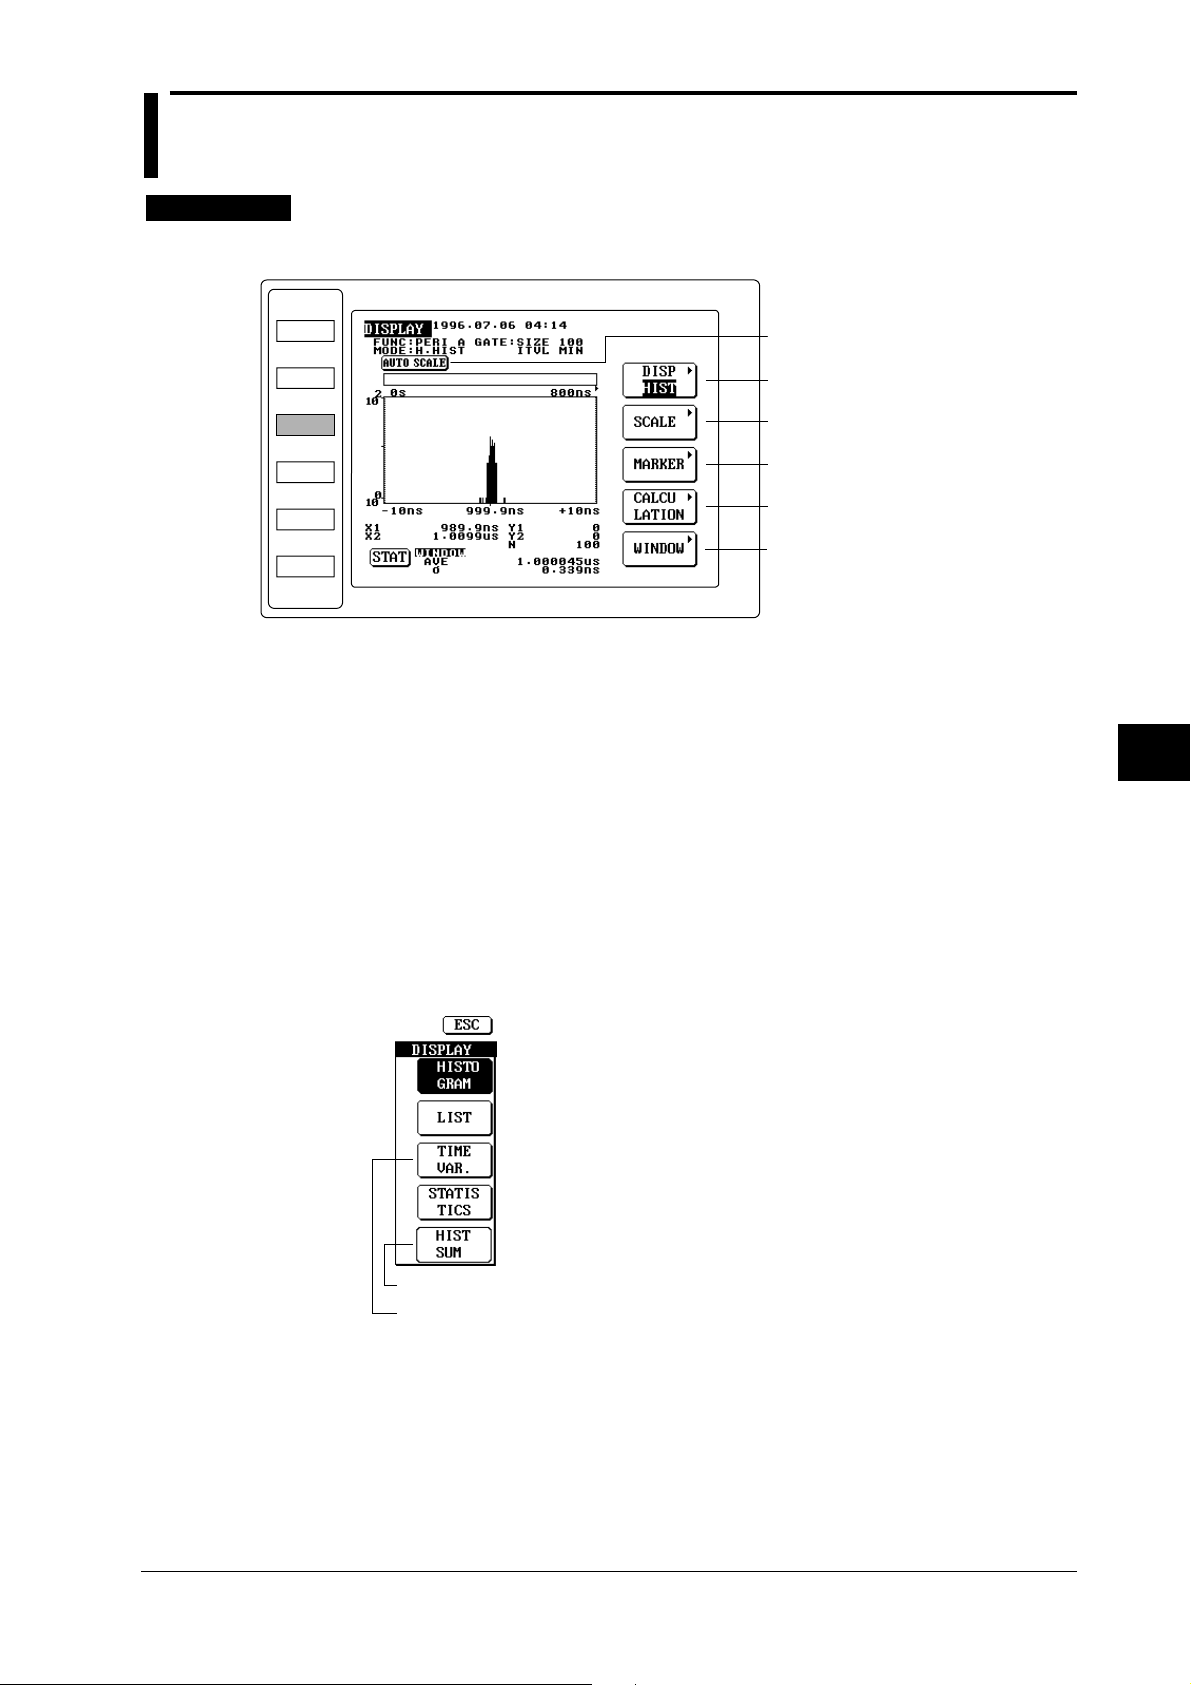
7.1 Setting the Histogram Display Function and Reading the Data (Readout)
≡≡
≡For a description of the function, refer to 1.4 and 1.6
Procedure
• To exit from the current menu, press any of the top menu keys or press the ESC touch key
displayed on the screen.
DISPLAY Top Menu
≡≡
≡≡
≡
≡≡
MODE
FUNCTION
DISPLAY
SAMPLE
INPUT
UTILITY
Performs auto scaling.
Displays the display format menu.
Displays the X-axis/Y-axis menu.
Displays the marker menu.
Displays the calculation menu.
Displays the multi-window menu.
(displayed for hardware histogram
mode only. Refer to 7.2.)
1. Press the DISPLAY key to display the DISPLAY top menu.
Selecting the histogram display function
2. Press the DISP touch key to display the display format menu.
3. Press the HISTOGRAM touch key to select the histogram display function. The screen will
return to the DISPLAY top menu when the HISTOGRAM touch key is pressed.
Performing auto scaling
4. Press the AUTO SCALE touch key to perform auto scaling. The X-axis and Y-axis suitable
for the input signal will be set automatically to display a histogram. The X-axis and Y-axis
can be changed by carrying out steps 5 to 13. If it is not necessary to change the X-axis and
Y-axis scaling, proceed to step 14.
7
Displaying the Measured/Computed Data
IM 704210-01E
Display format menu
Selects the histogram display function.
Displayed only when the multi-window function is active (see 7.2).
Displayed during time stamp mode only.
7-1
Page 64

7.1 Setting the Histogram Display Function and Reading the Data (Readout)
X-axis/Y-axis menu
Sets the center
value of X-axis.
Sets the span
of X-axis.
Sets the maximum
value of Y-axis.
Sets the
Y-axis scale.
Displayed only when the
multi-window function is
active (see 7.2).
Marker menu
Turns marker
display ON/OFF.
Moves the
X1 marker.
Moves the
X2 marker.
Selects the
marker speed.
Setting the X-axis and Y-axis
5. Press the SCALE touch key to display the X-axis/Y-axis menu.
• Setting the center value of X-axis
6. Press the X CENTER touch key to highlight X CENTER.
7. Turn the rotary key or use the ten-key to set the desired center value of X-axis.
• Selecting the span of X-axis
8. Press the X SPAN touch key to highlight X SPAN.
9. Turn the rotary key to select the desired span of X-axis.
• Selecting the Y-axis scale
10. Press the Y AXIS touch key to highlight LIN or LOG. The highlighted scale will be
selected.
• Selecting the maximum value of Y-axis
11. Press the Y HIGH touch key to highlight Y HIGH.
12. Turn the rotary knob to select the desired maximum value of Y-axis.
• Returning to the DISPLAY top menu
13. Press the ESC touch key.
Setting readout parameters
14. From the DISPLAY top menu, press the MARKER touch key to display the marker menu.
• Turning marker display ON/OFF
15. Press the MARKER touch key of the marker menu, to highlight OFF or ON. The
highlighted option (OFF or ON) will be selected. If OFF is selected, skip to step 23.
• Moving the X1 marker
16. Press the X1 MARKER touch key to highlight X1 MARKER.
17. Turn the rotary knob to move the X1 marker to the desired position.
• Moving the X2 marker
18. Press the X2 MARKER touch key to highlight X2 MARKER.
19. Turn the rotary knob to move the X2 marker to the desired position.
• Selecting the marker speed
20. Press the MOVEMENT touch key to highlight
. This will cause the marker to move
faster.
21. Press the MOVEMENT touch key to highlight . This will cause the marker to move at the
original speed.
• Returning to the DISPLAY top menu
22. Press the ESC touch key.
Calculation menu
Selects
the area.
Sets the
constant T.
Selects the
polarity to be
used for
display/statistical
computation.
Displayed only when
is selected for pulse width
measurement.
Also used for statistical
computation (see 7.7 and 7.8).
7-2
Setting the calculation function
23. From the DISPLAY top menu, press the CALCULATION touch key to display the
calculation menu.
• Selecting the area
24. Press the AREA touch key to highlight AREA.
25. Turn the rotary knob to select the desired area.
• Setting constant T
26. Press the CONST T touch key to highlight CONST T.
27. Turn the rotary knob or use the ten-key to set the desired constant.
• Selecting the polarity to be used for display/statistical computation (Required only
has been selected for pulse width measurement)
if
28. Press the POLARITY touch key to highlight , or . The highlighted polarity
will be selected.
IM 704210-01E
Page 65

7.1 Setting the Histogram Display Function and Reading the Data (Readout)
Explanation
Selecting the histogram display function
From the display format menu, select HISTOGRAM.
Performing auto scaling
The X-axis and Y-axis will be set automatically so that the entire distribution of measured data
can be displayed.
The X-axis and Y-axis scaling can be changed as described below.
Setting the X-axis and Y-axis
• Setting range for center value of X-axis.
The setting range varies according to the selected measurement function.
• Period, time interval or pulse width measurement: 10 ns to 99.9999900 ms (up to 3.19 µs in
the case of hardware histogram mode)
• Phase difference measurement: 15.00 to 345.00 deg
• Duty ratio measurement: 0.500 to 99.500%
• Selecting the span of X-axis
The span varies according to the selected measurement function.
• Period, time interval or pulse width measurement: 2/4/10/20/40/100/200/400 ns, 1/2/4/10/20/
40/100/200/400 µs, 1/2/4/10/20/40/100 ms (up to 3.2 µs in the case of hardware histogram
mode)
• Phase difference measurement: 30/60/90/180/360 deg
• Duty ratio measurement: 1/5/10/50/100%
• Selecting the Y-axis scale.
• LIN: Linear scale
•LOG: Logarithmic scale
• Selecting the maximum value of Y-axis
The maximum value of Y-axis varies according to the selected Y-axis scale.
• LIN: 10/20/40/100/200/400/1000/2000/4000/10000/20000/40000/1e5/1e6/1e7/1e8 (up to
32000 in the case of time stamp mode)
• LOG: 1e1/1e2/1e3/1e4/1e5/1e6/1e7/1e8 (e.g. 1e2 indicates 10
stamp mode)
2
.) (up to 1e5 in the case of time
7
Displaying the Measured/Computed Data
IM 704210-01E
7-3
Page 66

7.1 Setting the Histogram Display Function and Reading the Data (Readout)
Setting readout parameters
• Turning marker display ON/OFF
•ON : Displays the markers.
• OFF : Displays no markers. X1 MARKER, X2 MARKER and MOVEMENT touch keys are
also not displayed.
• Movable range of X1 marker
The X1 marker can move about within the window, as long as it is located on the left of X2
marker. (They can be located in the same position.)
• Movable range of X2 marker
The X2 marker can move about within the window, as long as it is located on the right of X1
marker. (They can be located in the same position.)
• Selecting the marker speed
: Causes the markers to move within the window every dot.
•
: Causes the markers to move within the window every 5 dots.
•
X1 marker
Window
X2 marker
X1: X-axis coordinate of X1 marker
Y1: Y-axis coordinate of X1 marker (frequency of X1)
X2: X-axis coordinate of X2 marker
Y2: Y-axis coordinate of X2 marker (frequency of X2)
N:
• WINDOW calculation area: Total number of samples
present within the window.
• MARKER calculation area: Number of samples present
between X1 and X2 markers.
Note
With a certain center value and span of X-axis, markers may be located in an area which does not actually
exist. For instance, if the center value of X-axis is set to 10 ns and span of X-axis is set to 3.2 µs, the
window will contain minus measurement data area. If the markers are located in this area, asterisks “*”
will be displayed instead of the X-axis coordinates.
Setting the calculation function
• Selecting the area
Select WINDOW or MARKER. The item indicated by “N” at the bottom of the screen varies
according to the selected calculation area.
• Setting constant T
Setting range: 10 to 999.9 ns
7-4
• Selecting the polarity to be used for display/statistical computation
This menu is displayed only if
is selected for pulse width measurement. Select the desired
polarity from the following to be used for display (histogram, time variation) or statistical
computation.
: Displays or performs statistical computation for the positive side only.
•
• : Displays or performs statistical computation for the negative side only.
: Displays or performs statistical computation for the both positive and negative sides.
•
However, computation will be performed for the standard deviation and jitter1 only. For
details, refer to 7-7.
IM 704210-01E
Page 67

7.2 Using the Multi-window Function
X-axis coordinate of the X1 marker
X-axis coordinate of the X2 marker
Procedure
MODE
FUNCTION
DISPLAY
SAMPLE
INPUT
UTILITY
≡≡
≡For a description of the function, refer to 1.6
≡≡
• To exit from the current menu, press any of the top menu keys or press the ESC touch key
displayed on the screen.
DISPLAY Top Menu
DISPLAY Top Menu
Performs auto scaling.
Displays the display format menu.
Displays the X-axis/Y-axis menu.
Displays the marker menu.
Displays the calculation menu.
Displays the multi-window menu.
(displayed for hardware histogram mode only)
1. Press the DISPLAY key to display the DISPLAY top menu.
Selecting the histogram display function
2. Select the histogram display function as described in 7.1.
Performing auto scaling
3. Perform auto scaling as described in 7.1.
≡≡
≡
≡≡
7
Displaying the Measured/Computed Data
Preparation before using the multi-window function
4. Press the MARKER touch key of the DISPLAY top menu to display the marker menu.
5. Press the MARKER touch key of the marker menu to highlight ON.
6. Some histograms will be displayed on the screen. Move the X1 marker to the highest
frequency position of the left most histogram by turning the rotary knob, and read and record
the X-axis coordinate of the X1 marker.
7. Next, move the X2 marker to the highest frequency position of the second histogram from
the left by turning the rotary knob, read the X-axis coordinate of the X2 marker, then read
and record the displacement from the X1 marker.
8. Press the ESC touch key to return to the DISPLAY top menu.
IM 704210-01E
7-5
Page 68

7.2 Using the Multi-window Function
Setting the multi-window function
9. Press the WINDOW touch key of the DISPLAY top menu to display the multi-window menu.
• Selecting multi-window
10. Press the SINGLE/MULTI touch key to highlight MULTI. The MODE and SIZE touch keys
will appear.
• Selecting the multi-window mode
11. Press the MODE touch key to highlight AUTO or MAN. The highlighted mode (AUTO or
MAN) will be selected.
• Selecting the window size (number of windows)
12. Press the SIZE touch key to highlight SIZE.
13. Turn the rotary knob to set the desired window size.
• Returning to the DISPLAY top menu
14. Press the ESC touch key to return to the DISPLAY top menu.
Multi-window menu
Selects the multi-window function.
Selects the multi-window mode.
Selects the window size.
Panorama display menu (see 7.3)
Setting the X-axis and Y-axis
15. Press the SCALE touch key to display the X-axis/Y-axis menu.
• Setting the center value of X-axis
16. Press the X CENTER touch key to highlight X CENTER.
17. Turn the rotary key or use the ten-key to set the desired center value of X-axis for window 1.
The value recorded at step 6 (the X-axis coordinate of the X1 marker) must be set.
• Selecting the span of X-axis
18. Press the X SPAN touch key to highlight X SPAN.
19. Turn the rotary key to select the desired span of X-axis. By referring to the value recorded at
step 7 (the displacement of the X2 marker from X1 marker), set the span so that the entire
histogram to be analyzed is positioned inside the window.
• Setting the space between the center values of X-axis (required only when AUTO
multi-window mode is selected)
20. Press the W.SPACE touch key to highlight W.SPACE.
21. Turn the rotary key or use the ten-key to set the space between the center value of X-axis for
a window and that for other windows. The value recorded at step 7 (the displacement of the
X2 marker from X1 marker) must be set.
• Selecting the scale and maximum value of Y-axis
22.
Select the scale and maximum value of Y-axis, if necessary. For the selection method, refer to 7.1.
• Re-setting the X-axis and Y-axis
23. Repeat steps from 15 until the histogram can be observed clearly and easily.
7-6
X-axis/Y-axis menu
Sets the center value of X-axis.
Selects the span of X-axis.
Sets the space between the center values of X-axis.
(This setting is required only when AUTO
multi-window mode is selected.)
Selects the maximum value of Y-axis.
Selects the scale of Y-axis.
IM 704210-01E
Page 69

Explanation
7.2 Using the Multi-window Function
Observing other windows
24. Press the WINDOW selection touch key (WINDOW 1 in the example given on page 7-6)
displayed at the upper left corner to highlight WINDOW.
25. Turn the rotary knob to select the desired window. Up to the window size (i.e. number of
windows) specified at steps 12 and 13 can be selected. The X-axis/Y-axis menu varies
according to the multi-window mode selected at step 11. For details, refer to “Explanation”
given on this page.
Preparation before using the multi-window function
If more than two histograms exist and the distribution range of each histogram is not known, turn
OFF the multi-window function and perform auto scaling. The multi-window function can be
turned OFF as described below.
• Turning OFF the multi-window function
Press the SINGLE/MULTI touch key to highlight SINGLE. The MODE and SIZE touch keys
will disappear, indicating that the multi-window function has been turned OFF.
• Marker positions (X1 and X2 markers) were recorded at steps 6 and 7. They are referred to
when determining the X-axis for multi-window. Turn ON the multi-window function, and resets the X-axis and Y-axis as described at step 23 so that the histogram can be observed clearly
and easily.
Setting the multi-window function
The multi-window function can be set only when hardware histogram mode is selected as the
sampling mode.
• Selecting multi-window
• SINGLE: Turns OFF the multi-window function. The MODE and SIZE touch keys will not be
displayed.
•
MULTI: Turns ON the multi-window function. The MODE and SIZE touch keys will be displayed.
• Selecting the multi-window mode
This setting is available when MULTI is selected. Select the method of setting the X-axis for
each window.
• AUTO: Applies the span of X-axis set for window 1 using the X-axis/Y-axis menu to window
2 and other windows. A menu for setting the space between center values of X-axis will
appear, as shown below.
• MAN: Allows the user to set the center value and span of X-axis for each window individually
using the X-axis/Y-axis menu. The menu for setting the space between center values of X-axis
will not appear.
7
Displaying the Measured/Computed Data
When AUTO multi-window mode is selected
• X-axis/Y-axis menu for window 1
Indicates that a total of
9 windows are available
and window 1 is currently
displayed.
Sets the space between center
values of X-axis.
When MANU multi-window mode is selected
• X-axis/Y-axis menu for window 1
Indicates that a total of 9
windows are available and
window 1 is currently displayed.
• X-axis/Y-axis menu for window 2 and others
Indicates that a total of 9 windows
are available and window 9 is
currently displayed.
• X-axis/Y-axis menu for window 2 and others
Indicates that a total of 9 windows
are available and window 2 is
currently displayed.
IM 704210-01E
7-7
Page 70

7.2 Using the Multi-window Function
• Selecting the window size (number of windows)
Up to 16 windows can be set if the multi-window function is ON.
Setting range: 1 to 16
Setting the X-axis and Y-axis
For the setting method for center value of X-axis, span of X-axis, Y-axis scale, maximum value of
Y-axis and area, refer to 7.1.
If MULTI is selected, use the W.SPACE touch key of the X-axis/Y-axis menu to set the space
between the center value of X-axis for a window and that for other windows. The W.SPACE
touch key is displayed if AUTO is selected as the multi-window mode.
Setting range for the space between the center values of X-axis: 0 to 250 ns
Note
If AUTO is selected as the multi-window mode, the histogram containing the smallest measured data must
be used to set the X-axis and Y-axis for window 1. For the space between the center values of X-axis, only
a positive displacement is set. Thus, if a histogram contains measured data smaller than that contained in
the histogram used for window 1, no window will be assigned to that histogram. As a result, this histogram
will not be displayed even if the window is switched to another at steps 24 and 25.
7-8
IM 704210-01E
Page 71

7.3 Using the Panorama Display Function
Procedure
≡≡
≡For a description of the function, refer to 1.6
≡≡
• To exit from the current menu, press any of the top menu keys or press the ESC touch key
displayed on the screen.
DISPLAY Top Menu
MODE
FUNCTION
DISPLAY
SAMPLE
INPUT
UTILITY
Performs auto scaling.
Displays the display format menu.
Displays the multi-window menu.
(displayed for hardware histogram
mode only)
1. Press the DISPLAY key to display the DISPLAY top menu.
Selecting the histogram display function
2. Select the histogram display function as described in 7.1.
Performing auto scaling
3. Perform auto scaling as described in 7.1.
≡≡
≡
≡≡
7
Displaying the Measured/Computed Data
Setting the panorama display function
4. Press the WINDOW touch key to display the multi-window menu.
• Turning the panorama display function ON/OFF
5. Press the PANORAMA touch key to highlight OFF or ON. The highlighted option (OFF or
ON) will be selected. In this example, highlight ON to select it.
• Selecting the panorama area
6. Press the P.AREA touch key to highlight P.AREA.
7. Turn the rotary knob to select the desired panorama area.
Multi-window menu
Turns the panorama display
function ON/OFF.
Selects the panorama area.
Displayed only when the panorama display function is ON.
Displayed during multi-window mode only .
IM 704210-01E
7-9
Page 72

7.3 Using the Panorama Display Function
Explanation
The panorama display function is available only when hardware histogram mode is selected as the
sampling mode.
Turning the panorama display function ON/OFF
• OFF: Does not display the panorama bar. The P.AREA touch key will not be displayed.
• ON: Displays the panorama bar. The P.AREA touch key will be displayed.
Selecting the panorama area
•0 to 3.2 µs is divided into four panorama areas, to allows the user to select a panorama area
from a total of 10 area combinations.
Panorama bar
This area
is displayed.
800ns 1.6µs 2.4µs
3.2µs
• Turning the rotary knob while P.AREA is highlighted will switch the panorama area from one
to another as shown below.
7-10
IM 704210-01E
Page 73

7.4 Carrying out Histogram Data Addition
Procedure
≡≡
≡For a description of the function, refer to 1.6
≡≡
• To exit from the current menu, press any of the top menu keys or press the ESC touch key
displayed on the screen.
DISPLAY Top Menu
MODE
FUNCTION
DISPLAY
SAMPLE
INPUT
UTILITY
Displays the display format menu.
Displays the X-axis/Y-axis menu.
1. Press the DISPLAY key to display the DISPLAY top menu.
Selecting multi-window
2. Select the multi-window as described in 7.2. Select AUTO as the multi-window mode.
Selecting the histogram data addition function
3. Press the DISP touch key to display the display format menu.
4. Press the HIST SUM touch key to select the histogram data addition function. The screen
will return to the DISPLAY top menu when the HIST SUM touch key is pressed.
≡≡
≡
≡≡
7
Displaying the Measured/Computed Data
Display format menu
Selects the histogram data addition function.
(displayed only when the multi-window function is ON).
IM 704210-01E
7-11
Page 74

7.4 Carrying out Histogram Data Addition
Setting the Y-axis
5. Press the SCALE touch key to display the Y-axis menu.
• Selecting the Y-axis scale
6. Press the Y AXIS touch key to highlight LIN or LOG. The highlighted scale will be
selected.
• Selecting the maximum value of Y-axis
7. Press the Y HIGH touch key to highlight Y HIGH.
8. Turn the rotary knob to select the desired maximum value of Y-axis.
Histogram data addition
X-axis coordinate of
each marker
(Asterisks “*” are displayed
instead of the X-axis coordinates
in the case of histogram data
addition.)
Center value of X-axis
(No numerical value is displayed
in the case of histogram data addition.)
Y-axis menu
Selects the maximum
value of Y-axis.
Selects the Y-axis scale.
Explanation
The histogram data addition is available only when the multi-window function is ON and AUTO
is selected as the multi-window mode.
Histogram data addition
• The frequency of all the windows (i.e. windows set using the SIZE touch key during multi-
window setting) is added.
• The frequency of the bin located within the span of X-axis and at the relatively same position to
the center value of X-axis is added.
• The center value and marker’s X-axis coordinate are not displayed since they exist for each
window, thus displaying them is meaningless.
• Y1 and Y2 (frequency of each marker) indicates the frequency obtained after addition is carried
out.
•N indicates the number of samples obtained after addition is carried out. Whether N indicates
the number of samples present in the entire window or within the area enclosed by the markers
is determined by the calculation area set in 7.1.
Setting the Y-axis
Refer to “Explanation” given in 7.1.
7-12
IM 704210-01E
Page 75

7.5 Setting the Time Variation Display Function and Reading the Data (Readout)
≡≡
≡For a description of the function, refer to 1.4 and 1.6
Procedure
• To exit from the current menu, press any of the top menu keys or press the ESC touch key
displayed on the screen.
DISPLAY Top Menu
≡≡
≡≡
≡
≡≡
MODE
FUNCTION
DISPLAY
SAMPLE
INPUT
UTILITY
Performs auto scaling.
Displays the display format menu.
Displays the X-axis/Y-axis menu.
Displays the marker menu.
Displays the display parameter menu.
1. Press the DISPLAY key to display the DISPLAY top menu.
Selecting the time variation display function
2. Press the DISP touch key to display the display format menu.
3. Press the TIMEVAR. touch key to select the time variation display function.
The screen will return to the DISPLAY top menu when the TIMEVAR. touch key is pressed.
Performing auto scaling
4. Press the AUTO SCALE touch key to perform auto scaling. The X-axis and Y-axis suitable
for the input signal will be set automatically to display time variation. The X-axis and Y-axis
can be changed by carrying out steps 5 to 14. If it is not necessary to change the X-axis and
Y-axis scaling, proceed to step 15.
7
Displaying the Measured/Computed Data
IM 704210-01E
Display format menu
Selects the time variation display function.
(display for time stamp mode only).
7-13
Page 76

7.5 Setting the Time Variation Display Function and Reading the Data (Readout)
Setting the X-axis and Y-axis
5. Press the SCALE touch key to display the X-axis/Y-axis menu.
• Setting the minimum value of X-axis
6. Press the X MIN touch key to highlight X MIN.
7. Turn the rotary key or use the ten-key to set the desired minimum value of X-axis.
• Selecting the span of X-axis
8. Press the X SPAN touch key to highlight X SPAN.
9. Turn the rotary key to select the desired span of X-axis.
• Setting the center value of Y-axis
10. Press the Y CENTER touch key to highlight Y CENTER.
11. Turn the rotary key or use the ten-key to set the desired center value of Y-axis.
• Selecting the span of Y-axis
12. Press the Y SPAN touch key to highlight Y SPAN.
13. Turn the rotary key to select the desired span of Y-axis.
• Returning to the DISPLAY top menu
14. Press the ESC touch key.
X-axis/Y-axis menu
Setting readout parameters
15. Set readout parameters using the marker menu as described in 7.1.
Selecting the display parameters (from the DISPLAY top menu)
16. Press the DISP PARAM. touch key to display the display parameter menu.
• Turning grid display ON/OFF
17. Press the GRID touch key to highlight OFF or ON. The highlighted option (OFF or ON) will
be selected.
• Turning interpolation display ON/OFF
18. Press the CONNECT touch key to highlight OFF or ON. The highlighted option (OFF or
ON) will be selected.
Sets the minimum
value of X-axis
Selects the span of X-axis
Sets the center value of
Y-axis
Selects the span of Y-axis
Marker menu
Turns marker display
ON/OFF
Moves the X1 marker
Moves the X2 marker
Selects the marker speed
Display parameter menu
Turns grid display
ON/OFF
Turns interpolation display
ON/OFF
7-14
IM 704210-01E
Page 77
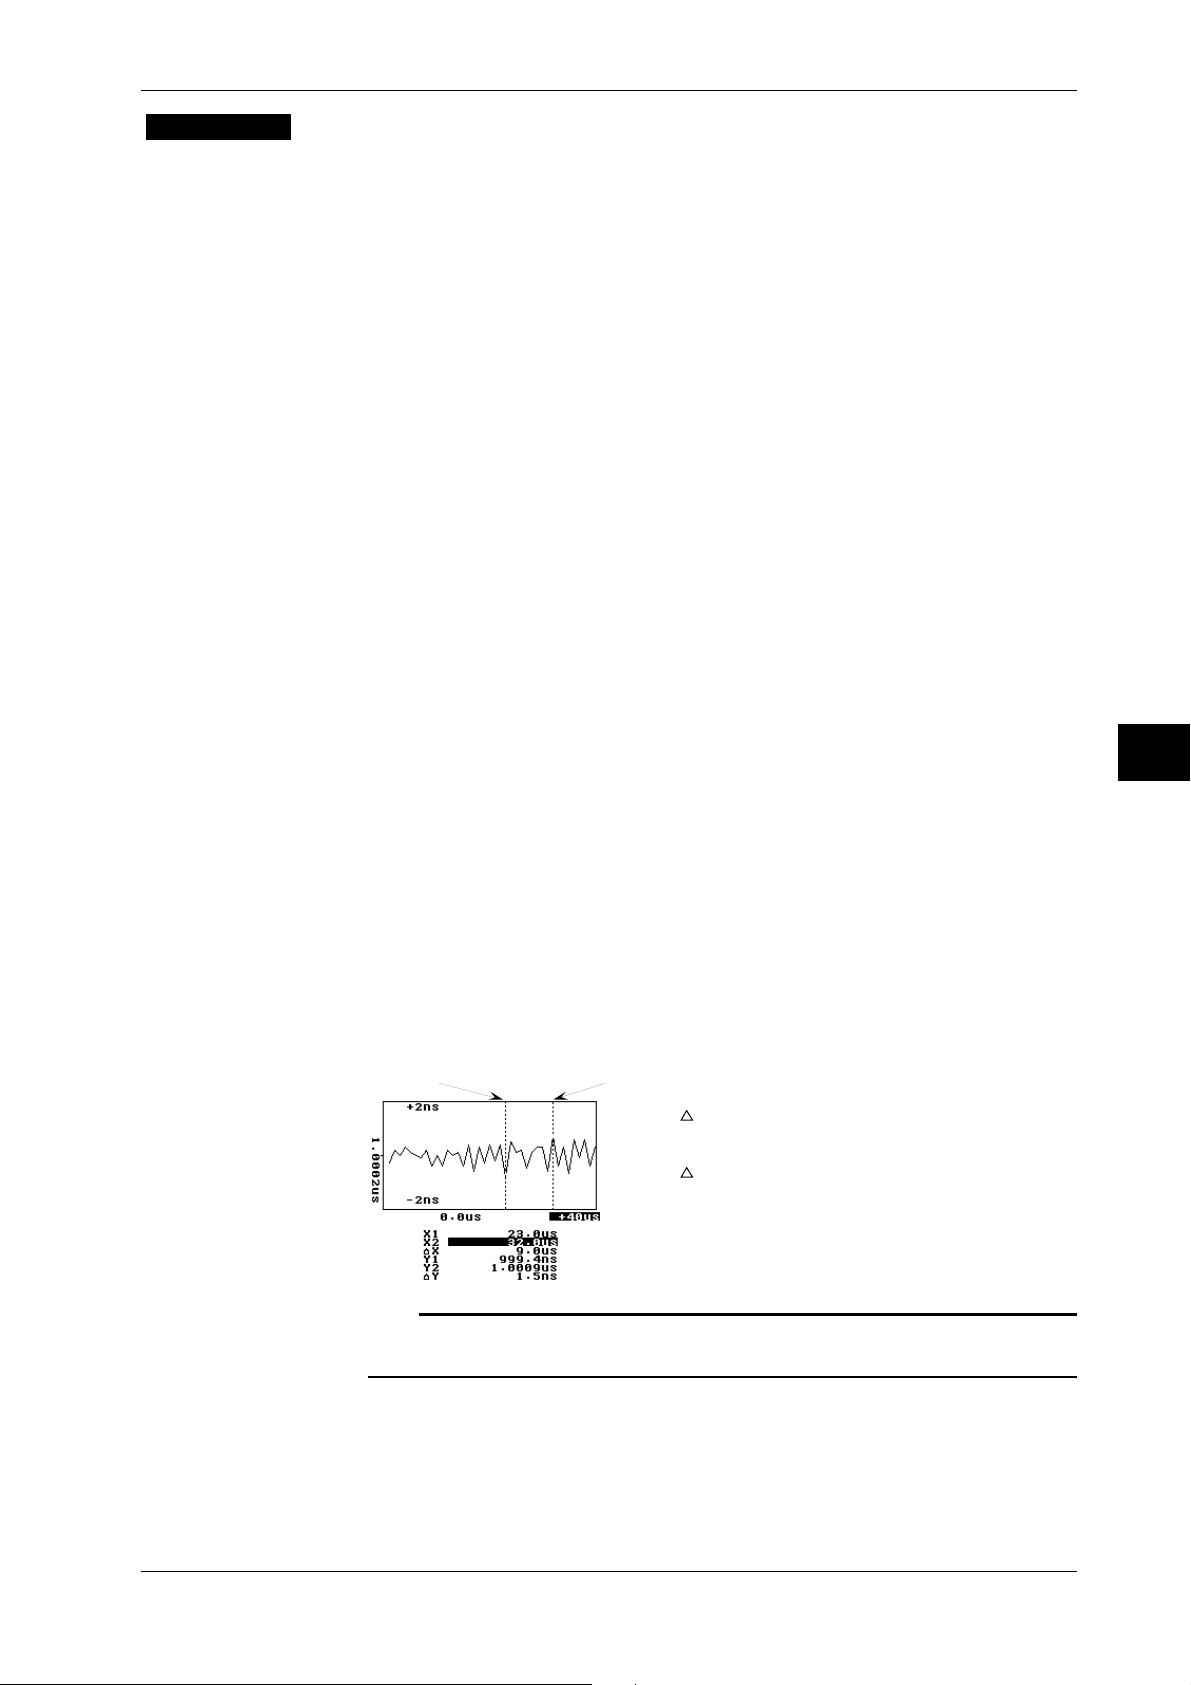
Explanation
7.5 Setting the Time Variation Display Function and Reading the Data (Readout)
The time variation display function is available only when time stamp mode is selected as the
sampling mode.
Selecting the time variation display function
From the display format menu, select TIME VAR. The time stamp resolution (X-axis) is 100 ns.
Performing auto scaling
Refer to 7.1.
Setting the X-axis and Y-axis
• Setting range for the minimum value of X-axis
The minimum value of X-axis can be set within the following range.
0 to 199.9999800 sec.
• Selecting the span of X-axis
Select from the following.
20/40/100/200/400 µs, 1/2/4/10/20/40/100/200/400 ms, 1/2/4/10/20/40/100/200 sec.
• Setting range for the center value of Y-axis
The setting range varies according to the selected measurement function.
• Period, time interval or pulse width measurement: 10 ns to 99.9999900 ms
• Phase difference measurement: 15.00 to 345.00 deg
• Duty ratio measurement: 0.500 to 99.500%
• Selecting the span of Y-axis
The span varies according to the selected measurement function.
• Period, time interval or pulse width measurement: 2/4/10/20/40/100/200/400 ns, 1/2/4/10/20/
40/100/200/400 µs, 1/2/4/10/20/40/100 ms
• Phase difference measurement: 30/60/90/180/360 deg
• Duty ratio measurement: 1/5/10/50/100%
7
Displaying the Measured/Computed Data
Setting readout parameters
For the setting method for maker display, movable range and speed, refer to 7.1.
The meaning of each value displayed is given below.
X1 marker
X2 marker
X1: X-axis coordinate of X1 marker (time stamp)
X2: X-axis coordinate of X2 marker (time stamp)
X: X2 – X1
Y1: Y-axis coordinate of X1 marker (measured data)
Y2: Y-axis coordinate of X2 marker (measured data)
Y: |Y2 – Y1|
Note
• If more than two data exist in the marker position, the average value of those data will be displayed.
• If no data exists in the marker position, asterisks “*” will be displayed.
IM 704210-01E
7-15
Page 78
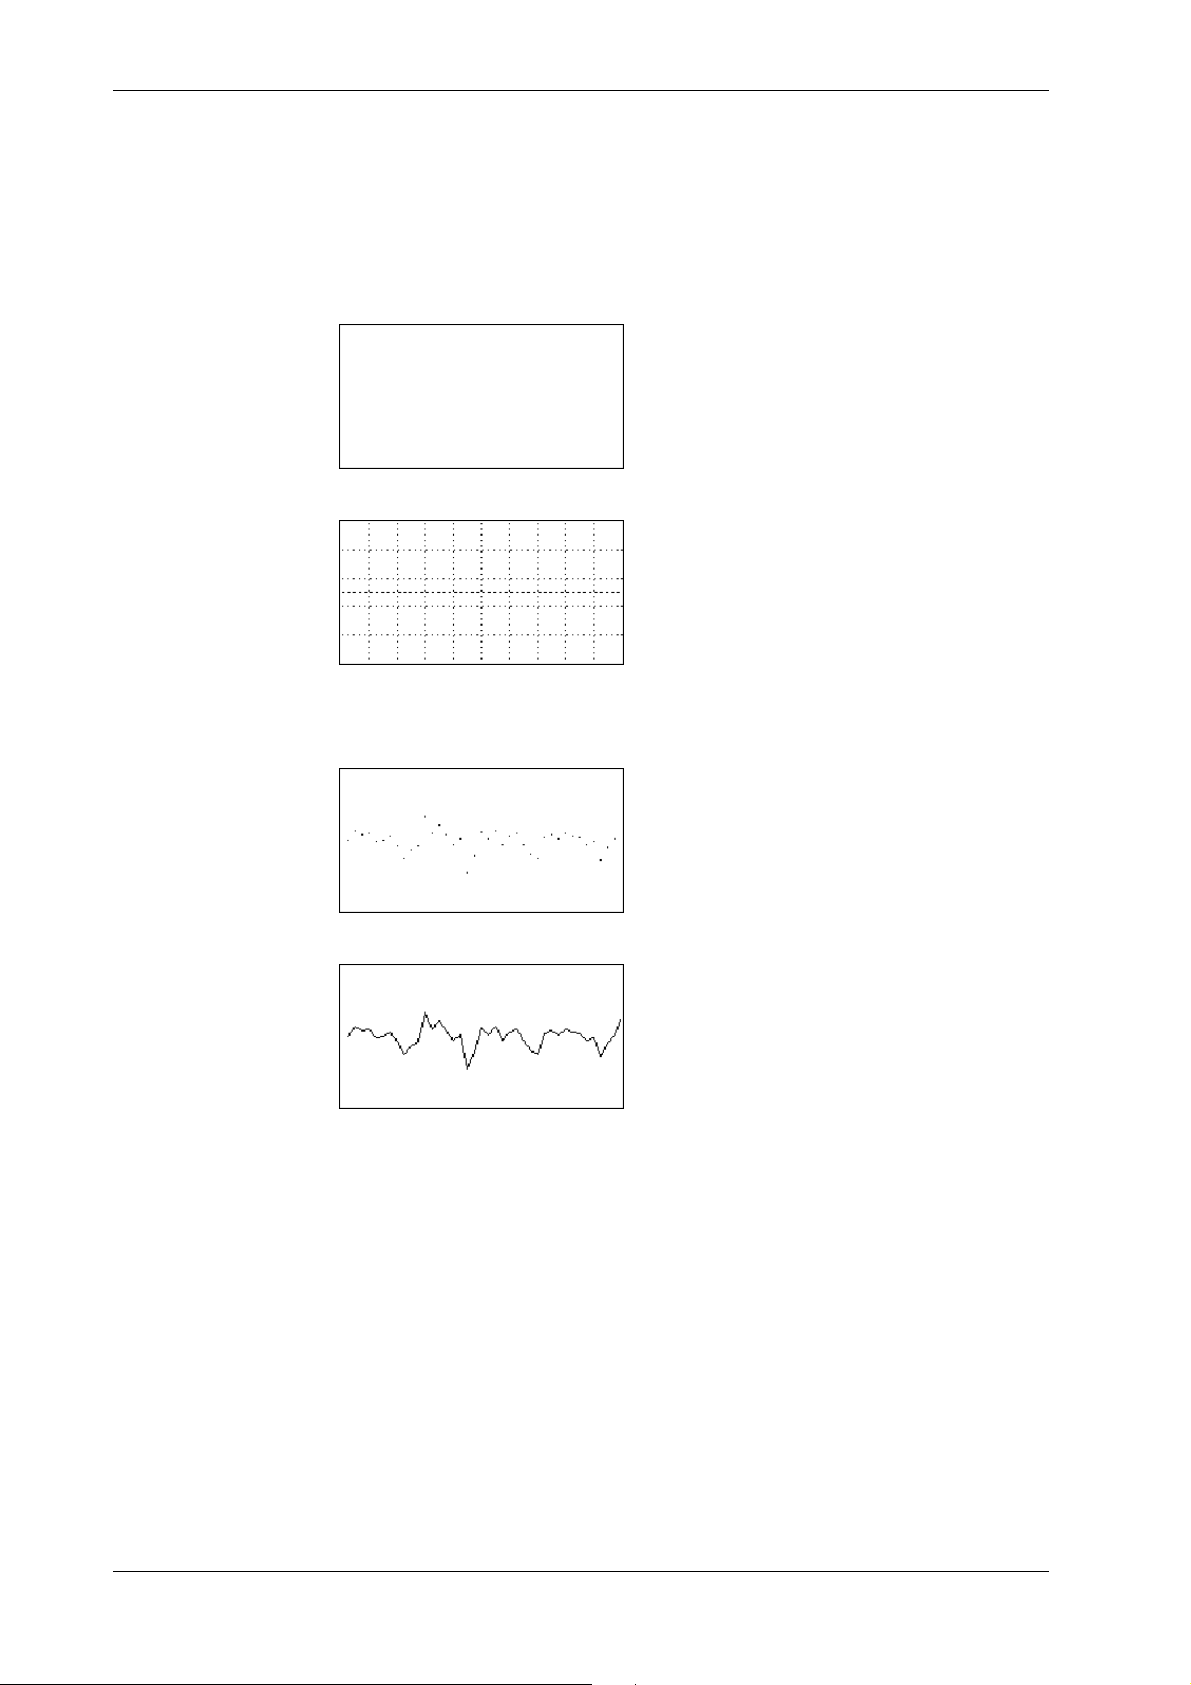
7.5 Setting the Time Variation Display Function and Reading the Data (Readout)
Selecting the display parameters
When the time variation display function is ON, it is possible to select whether or not to display
the grid in the window. In addition, it is also possible to select whether or not to interpolate (i.e.
connect) measurement points.
• Turning grid display ON/OFF
Select ON or OFF.
• OFF: Does not display the grid.
• ON: Displays the grid.
• Turning interpolation display ON/OFF
Select ON or OFF.
• OFF: Does not interpolate measurement points.
• ON: Interpolates measurement points.
7-16
IM 704210-01E
Page 79
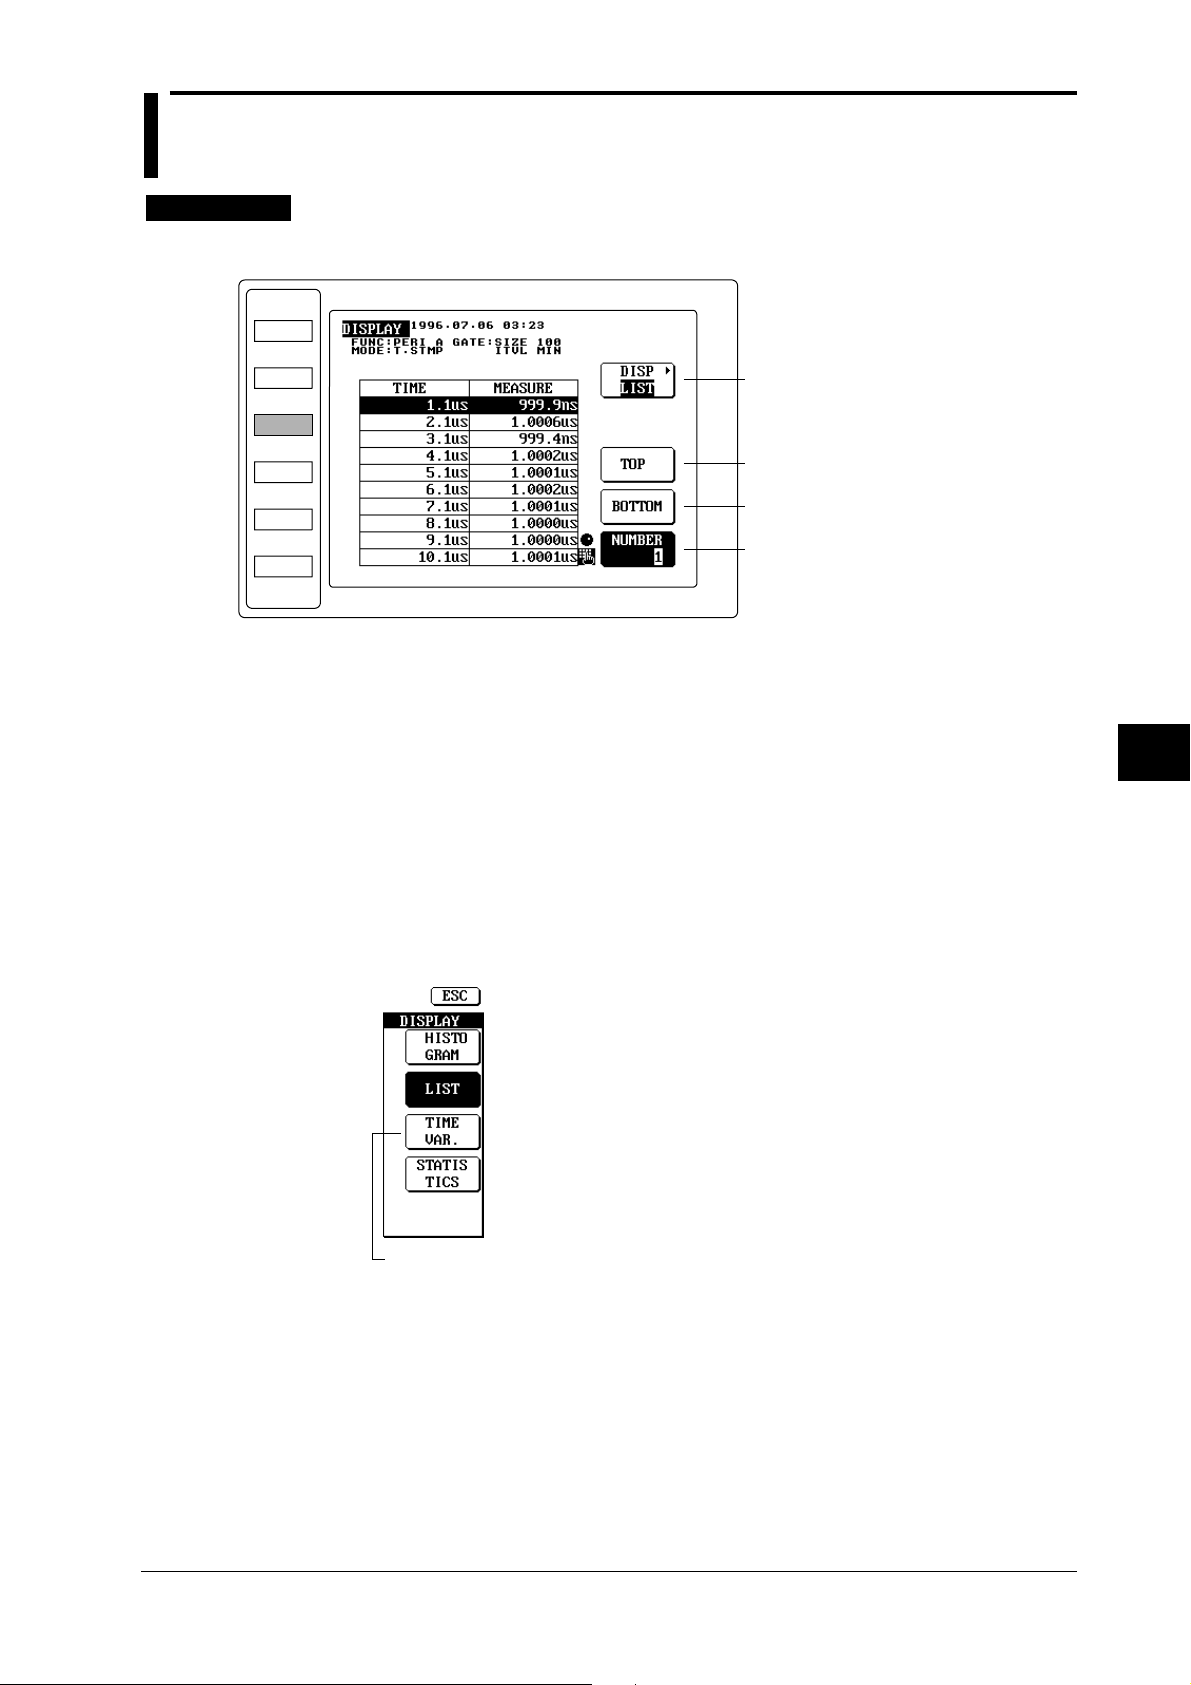
7.6 Selecting the List Display Function and Displaying the Data
≡≡
≡For a description of the function, refer to 1.6
Procedure
• To exit from the current menu, press any of the top menu keys or press the ESC touch key
displayed on the screen.
DISPLAY Top Menu
MODE
≡≡
≡≡
≡
≡≡
FUNCTION
DISPLAY
SAMPLE
INPUT
UTILITY
Displays the display format menu
Selects the top data
Selects the bottom data
Displays the data number of the highlighted data
1. Press the DISPLAY key to display the DISPLAY top menu.
Selecting the list display function.
2. Press the DISP touch key to display the display format menu.
3. Press the LIST touch key to select the list display function.
The screen will return to the DISPLAY top menu when the LIST touch key is pressed.
Setting the data to be displayed in a list
4. Turn the rotary knob or use the ten-key to select the data to be displayed in a list. The value
displayed on the NUMBER touch key indicates the data number of the highlighted data in
the list.
7
Displaying the Measured/Computed Data
Display format menu
Selects the list display function.
Displayed for time stamp mode only.
IM 704210-01E
7-17
Page 80
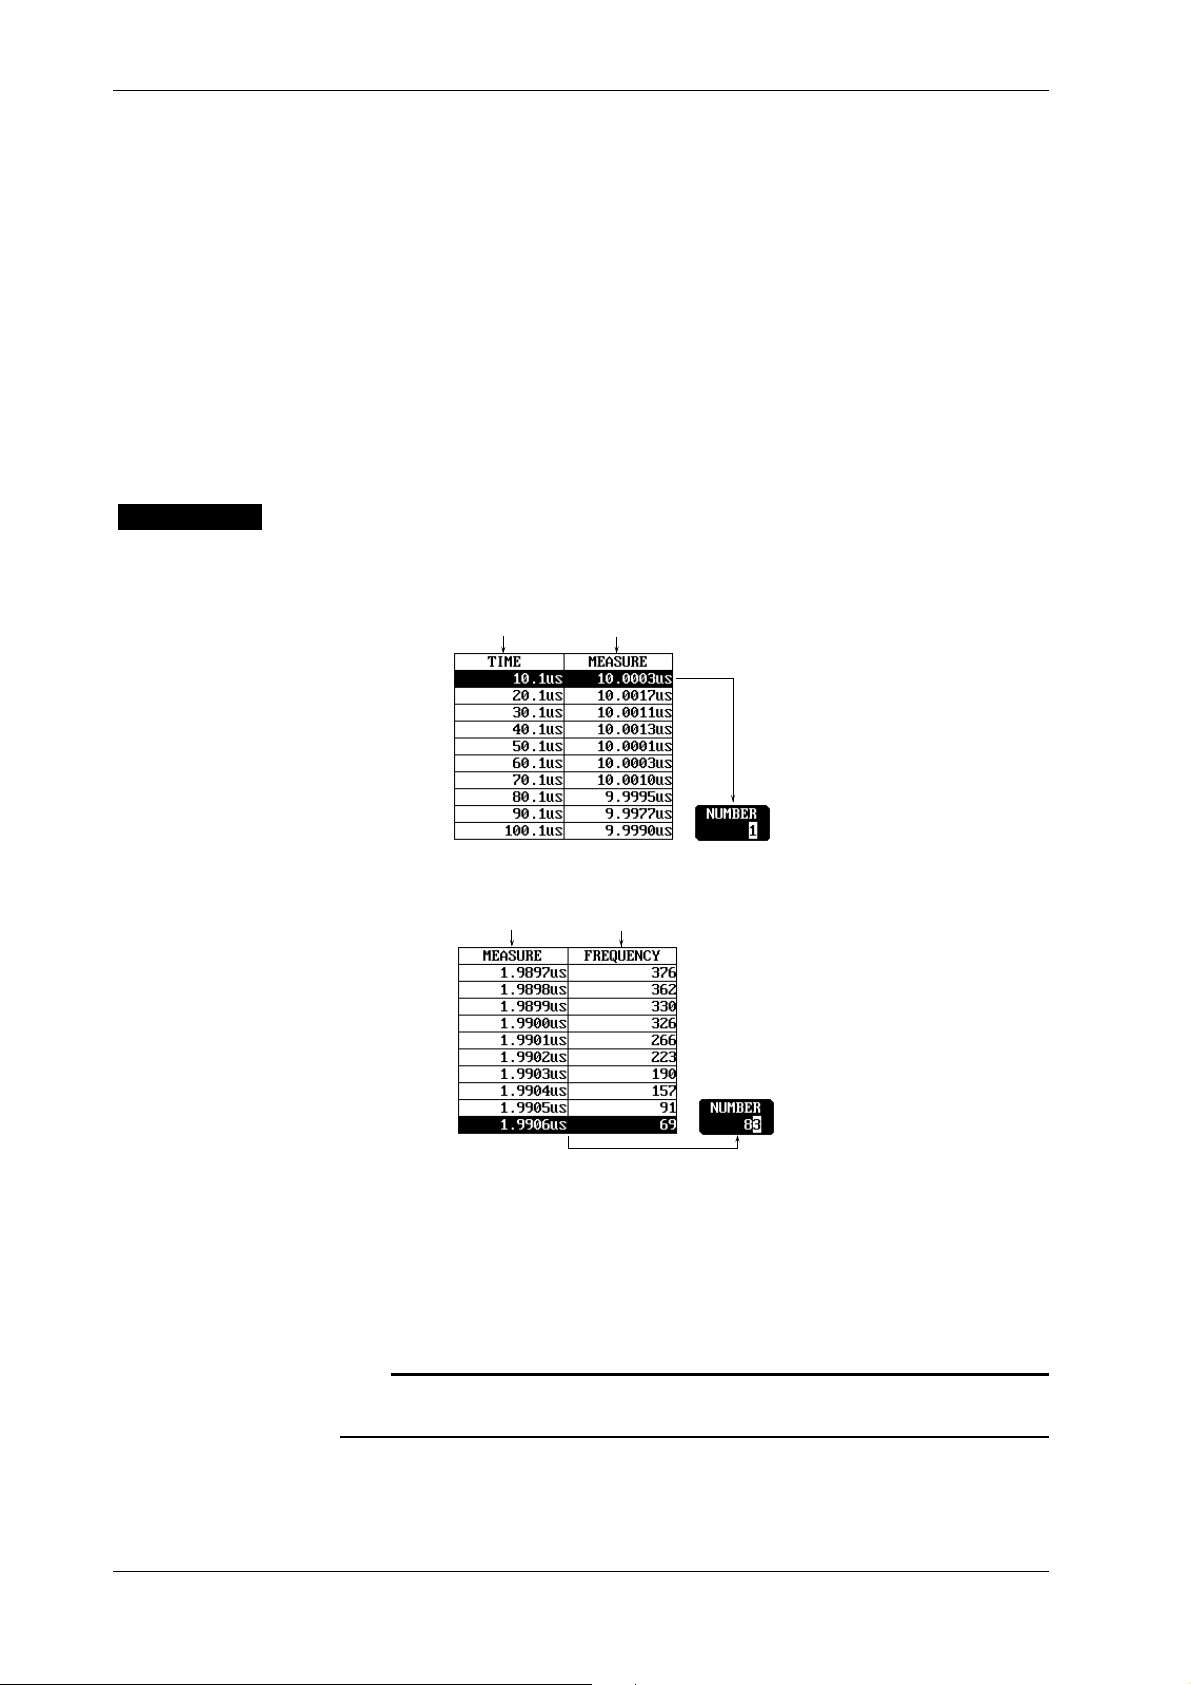
7.6 Selecting the List Display Function and Displaying the Data
Jumping to the top data
6. Press the TOP touch key. “1” will be displayed on the NUMBER touch key. In the case of
time stamp mode, the first measured value of the measurement block will be displayed at the
top of the list.
In the case of hardware histogram mode, the smallest value (representative value) inside the
window will be displayed at the top of the list.
Jumping to the bottom data
7. Press the BOTTOM touch key. In the case of time stamp mode, the last measured value of
the measurement block will be displayed at the bottom of the list. The value displayed on the
NUMBER touch key indicates the data number of the last measured value.
In the case of hardware histogram mode, the largest value (class value) inside the window
will be displayed at the bottom of the list. The value displayed on the NUMBER touch key
indicates the data number of the largest value (class value).
Explanation
Selecting the list display function.
The list contains 10 data items. The contents of the list vary according to the selected sampling
mode. The time stamp resolution is 100 ns.
• Time stamp mode
Time stamp Measured value
Data number
1
2
3
4
5
6
7
8
9
10
The data number of the
highlighted data is displayed.
• Hardware histogram mode
Class value Frequency
Data number
74
75
76
77
78
79
80
81
82
83
The data number of the
highlighted data is displayed.
7-18
Setting range for data number
The setting range varies according to the selected according to the selected sampling mode.
• Time stamp mode: From the first measured value (NUMBER 1) to the last measured value of a
measurement block.
• Hardware histogram mode: From the smallest measured value (class value) (NUMBER 1) to
the largest value (class value) within the window
Note
The cursor is located at data number 1 during measurement. It is not possible to set data number during
measurement.
IM 704210-01E
Page 81

7.7 Selecting the Statistics Display Function and Reading the Statistic Data
≡≡
≡For a description of the function, refer to 1.4 and 1.6
Procedure
• To exit from the current menu, press any of the top menu keys or press the ESC touch key
displayed on the screen.
DISPLAY Top Menu
MODE
≡≡
≡≡
≡
≡≡
FUNCTION
DISPLAY
SAMPLE
INPUT
UTILITY
Displays the display format menu.
Displays the calculation menu.
Range touch key.
(displayed for hardware histogram mode only)
1. Press the DISPLAY key to display the DISPLAY top menu.
Selecting the statistics display function
2. Press the DISP touch key to display the display format menu.
3. Press the STATISTICS touch key to the statistics display function.
The screen will return to the DISPLAY top menu when the STATISTICS touch key is
pressed.
Setting constant T (required for hardware histogram mode only)
4. Press the CALCULATION touch key to display the calculation menu.
5. Turn the rotary knob or use the ten-key to set the desired constant T.
6. Press the ESC touch key to return to the DISPLAY top menu.
7
Displaying the Measured/Computed Data
Selecting the polarity to be used for display/statistical computation (Required only if
has been selected for pulse width measurement)
7. Press the POLARITY touch key to highlight
Selecting the bar graph range (required for hardware histogram mode only)
8. Turn the rotary knob to select the desired bar graph range.
Display format menu
Selects the statistics display function.
Displayed for time stamp mode only.
, or . The highlighted polarity
will be selected.
Calculation menu
Sets the constant T.
Selects the polarity to be used
for display/statistical computation.
Displayed only when is selected for pulse width measurement.
IM 704210-01E
7-19
Page 82

7.7 Selecting the Statistics Display Function and Reading the Statistic Data
Explanation
Displaying the statistic values
The window displaying a histogram or the area enclosed by the markers can be set as the area to
be used for statistical computation. For details, refer to 7.1.
• Time stamp mode
• No computation is carried out for jitter 1 (σ/T) and jitter 2 (MELE), so asterisks “*” will be
displayed.
Statistical computation item Statistic value
No computation is carried out for jitter 1 and jitter 2.
Statistical computation area
(The entire window is used for
statistical computation in this
example. “MARKER” will be
displayed if the area enclosed
by the markers is used for statistical
computation.)
• Hardware histogram mode
A bar graph indicating the standard deviation s is displayed below the list. The bar graph range
(maximum value) can be selected (see below).
Statistical computation item Statistic value Statistical computation area
(The area enclosed by the markers
is used for statistical computation
in this example. “WINDOW” will be
displayed if the entire window is
used for statistical computation.)
Standard deviation σ is displayed
in bar graph.
Bar graph range (maximum value)
Note
Statistic values are obtained as a result of computation of data present inside the window or the area
enclosed by the markers. Asterisks “*” will be displayed instead of static values if no histogram exists
inside the window or the area enclosed by the markers.
Setting constant T
Constant T is used for computation of jitter 1 and jitter 2 in the case of hardware histogram mode.
Setting range: 10 to 999.9 ns
Note
The same constant T is used for both histogram display function (see 7.1) and this statistics display
function. In addition, it is also used for pulse width measurement (see 5.4).
• Selecting the polarity to be used for display/statistical computation
The same menu as the one displayed when
measurement is displayed. (It is also the same menu as the calculation menu displayed in 7.1).
Select the desired polarity from the following to be used for statistical computation.
•
: Performs statistical computation for the positive side only.
•
: Performs statistical computation for the negative side only.
•
: Performs statistical computation for the both positive and negative sides. However,
computation results will be as follows.
• Maximum, minimum, average, peak to peak, flutter, jitter 2: Not computed and asterisks “*”
are displayed instead of the statistic values.
• Standard deviation, jitter 1: Standard deviation (σ) and jitter 1 (σ/T) are computed,
individually for positive and negative sides, then the sum of computed standard deviation and
that of computed jitter 1 are divided by 2.
is selected as the polarity for pulse width
7-20
Selecting the bar graph range
The standard deviation (σ) is displayed in a bar graph only when the statistic display function is
ON in hardware histogram mode. The maximum bar graph range can be selected from the
following.
7.5/15/30/60 ns
IM 704210-01E
Page 83

7.8 Selecting the Histogram Display Function and
Statistical computation items menu
Returns to the DISPLAY top menu.
Turns OFF display of the selected items.
Selects the statistical computation items.
Displaying the Statistic Data
≡≡
≡For a description of the function, refer to 1.4 and 1.6
Procedure
• To exit from the current menu, press any of the top menu keys or press the ESC touch key
displayed on the screen.
DISPLAY Top Menu
MODE
≡≡
≡≡
≡
≡≡
FUNCTION
DISPLAY
SAMPLE
INPUT
UTILITY
Displays the display format menu.
(Displayed for hardware histogram mode only.)
Displays the statistical computation item menu.
1. Press the DISPLAY key to display the DISPLAY top menu.
Selecting the statistics display function
2. Select the statistics display function as described in 7.1.
Selecting the statistical computation items
3. Press the STAT touch key located at the bottom of the screen to display the statistical
computation item menu.
4. Press the touch keys corresponding to the desired items. The selected items will be displayed
on the right of the STAT touch key. Only two items can be selected at a time. If the STAT
touch key is pressed again to select other items, the previously selected and displayed two
items will be replaced by newly selected items.
7
Displaying the Measured/Computed Data
Turning OFF display of the selected items
5. Press the OFF touch menu of the statistical computation item menu. The currently displayed
two items will disappear.
Returning to the DISPLAY top menu
6. Press the STAT touch key again or press the EXIT touch key to return to the DISPLAY top
menu.
IM 704210-01E
7-21
Page 84

7.8 Selecting the Histogram Display Function and Displaying the Statistic Data
Explanation
Statistical computation items
The same statistical computation items as for 7.7 are available. Thus, no computation will be
carried out for jitter 1 (σ/T) and jitter 2 (MELE) and therefore asterisks “*” are displayed, even if
they are selected.
Allowable number of items selected
Up to two items can be displayed. If a third item is selected by pressing the corresponding touch
key, the first item (displayed at the upper section of the statistic data area) will disappear, the
second item will move up, and the newly selected item will be displayed at the lower section.
Indicates the currently selected computation area.
Upper section
Lower section
7-22
IM 704210-01E
Page 85

8.1 Storing the Set-up Information in the Internal Memory
≡≡
≡For a description of the function, refer to 1.7
Procedure
• To exit from the current menu, press any of the top menu keys or press the ESC touch key
displayed on the screen.
UTILITY Top Menu
MODE
FUNCTION
≡≡
≡≡
≡
≡≡
DISPLAY
SAMPLE
INPUT
UTILITY
Displays the store/recall menu.
1. Press the UTILITY key to display the UTILITY top menu.
2. Press the STORE/RECALL touch key to display the store/recall menu.
Selecting the memory number
3. Turn the rotary knob to select the desired memory number.
Storing the set-up information
4. Press the STORE touch key to store the set-up information into the selected memory.
Store/recall menu
Selects the memory number.
8
Storing and Recalling the Set-up Information from the Internal Memory
Explanation
IM 704210-01E
Stores the set-up information..
Set-up information to be stored
Settings made and selected using touch keys, rotary knob and ten-key are stored.
Selecting the memory number
Select the desired memory number from the following 10 numbers. If set-up information already
exists in the selected memory, it will be overwritten by the new set-up information.
#0 to #9
Note
The stored set-up information will not be deleted even if initialization is carried out.
8-1
Page 86

8.2 Recalling the Set-up Information from the Internal Memory
≡≡
≡For a description of the function, refer to 1.7
Procedure
• To exit from the current menu, press any of the top menu keys or press the ESC touch key
displayed on the screen.
UTILITY Top Menu
MODE
FUNCTION
≡≡
≡≡
≡
≡≡
DISPLAY
SAMPLE
INPUT
UTILITY
Displays the store/recall menu.
1. Press the UTILITY key to display the UTILITY top menu.
2. Press the STORE/RECALL touch key to display the store/recall menu.
Selecting the memory number
3. Turn the rotary knob to select the desired memory number.
Recalling the set-up information
4. Press the RECALL touch key to recall the set-up information from the selected memory.
Store/recall menu
Selects the memory number.
Explanation
8-2
Recalls the set-up information.
Set-up information to be recalled
The set-up information stored in the desired memory is recalled. The current set-up information
of the instrument will be replaced by the recalled one.
Selecting the memory number
Select the desired memory number from the following 10 numbers. Only the memory numbers
where set-up information exists can be selected.
#0 to #9
IM 704210-01E
Page 87

9.1 Points to Note during Use of the Floppy Disk Drive
Applicable Floppy Disks
The following type of 3.5-inch floppy disk can be used. Floppy disks can be formatted using this
instrument.
• 2HD type : 1.2 MB or 1.44 MB (MS-DOS format)
• 2DD type : 640 KB or 720 KB (MS-DOS format)
Inserting a Floppy Disk into the Floppy Disk Drive
Place the floppy disk with the label facing upward and insert it into the floppy disk drive. Insert it
until the eject button pops up.
Removing the Floppy Disk from the Floppy Disk Drive
Make sure that the access indicator is OFF, then press the eject button to remove the floppy disk.
Access
indicator
Eject button
CAUTION
Never remove the floppy disk while the access indicator is blinking. Failure to do so
may damage the magnetic head of the floppy disk drive or destroy the data saved on the
floppy disk.
General Points to Note during Use of the Floppy Disk
For general precautions regarding use of the floppy disk, refer to the instruction sheets supplied
with the floppy disk.
9
Saving and Loading the Data from a Floppy Disk
IM 704210-01E
9-1
Page 88
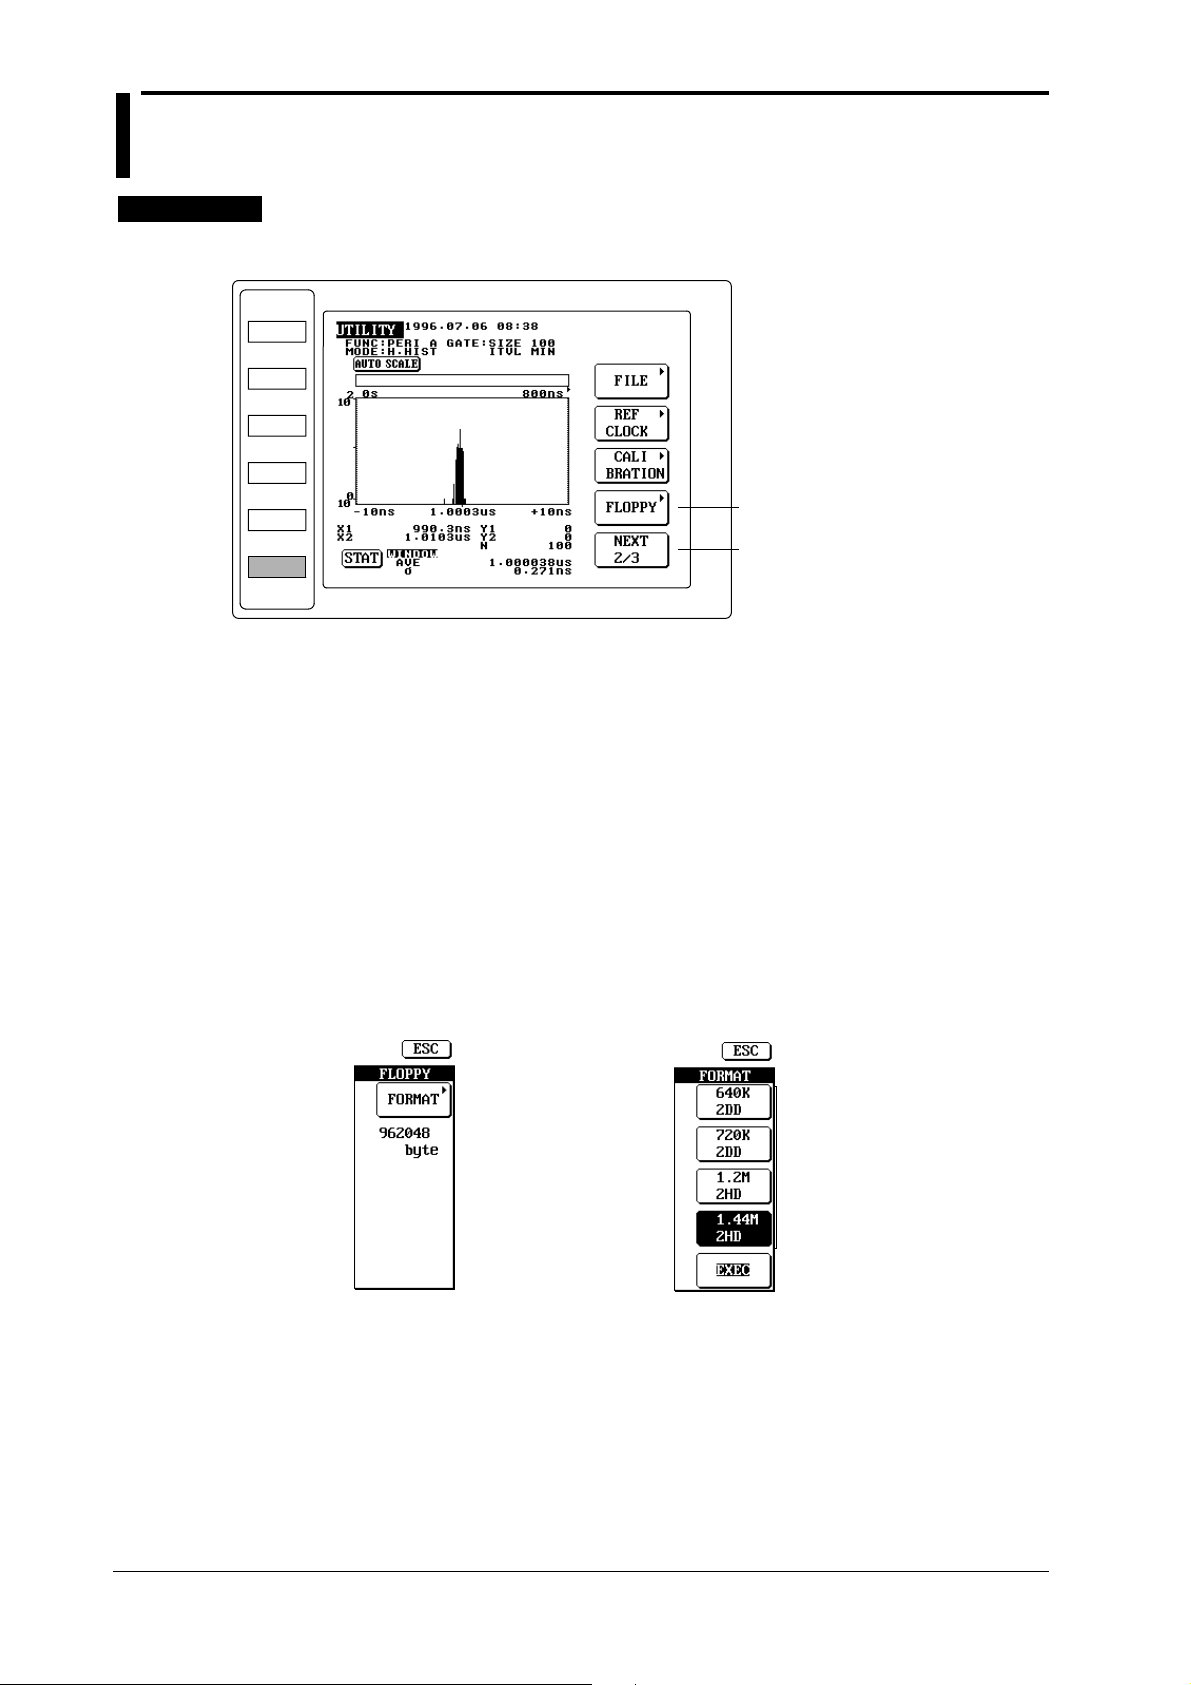
9.2 Formatting a Floppy Disk
Procedure
MODE
FUNCTION
DISPLAY
SAMPLE
INPUT
UTILITY
• To exit from the current menu, press any of the top menu keys or press the ESC touch key
displayed on the screen.
UTILITY Top Menu
Displays the floppy disk menu.
Selects the UTILITY menu.
1. Insert a floppy disk to be formatted into the floppy disk drive.
2. Press the UTILITY key to display the UTILITY top menu.
3. Press the NEXT touch key to display NEXT 2/3 on the key.
Displaying the floppy disk menu
4. Press the FLOPPY touch key to display the floppy disk menu.
Selecting the format type
5. Press the FORMAT touch key to display the format menu.
6. Press the touch key corresponding to the desired format type.
Formatting the floppy disk
7. Press the EXEC touch key to format the floppy disk.
Floppy menu
Displays the format menu.
(Free space available on the
floppy disk is displayed if
the floppy disk has already
been formatted.)
Format menu
Selects the format type.
Performs formatting.
9-2
IM 704210-01E
Page 89

9.2 Formatting a Floppy Disk
Explanation
Displaying the free space available on the floppy disk
If the floppy disk menu is displayed with a MS-DOS formatted floppy disk inserted into the
floppy disk unit, the free space available on the floppy disk will be displayed.
Selecting the format type
Select the desired format type from the following.
• 640K2DD: Used to format a 2DD type floppy disk for 640 KB/8 sectors.
• 720K2DD: Used to format a 2DD type floppy disk for 720 KB/9 sectors.
• 1.2M2HD: Used to format a 2HD type floppy disk for 1.2 MB/8 sectors.
• 1.44M2HD: Used to format a 2HD type floppy disk for 1.44 MB/18 sectors.
Creating directories during formatting
The following directories will be created on the floppy disk automatically when the floppy disk is
formatted.
• TA_WAVE: Directory for measured binary data (BIN)
• TA_SETUP: Directory for set-up information
• TA_TEXT: Directory for measured text data (TEXT)
• TA_MISC: Directory for screen image data including set-up information (IMAGE)/statistical
computation text data (STAT)
Note
• Floppy disks formatted in a format type other than those specified above cannot be used with this
instrument.
• If an error message is displayed after formatting, the floppy disk may be faulty.
• All the data stored on the floppy disk will be deleted when the floppy disk is formatted.
CAUTION
Never remove the floppy disk while the access indicator is blinking. Failure to do so
may damage the magnetic head of the floppy disk drive or destroy the data saved on the
floppy disk.
9
Saving and Loading the Data from a Floppy Disk
IM 704210-01E
9-3
Page 90
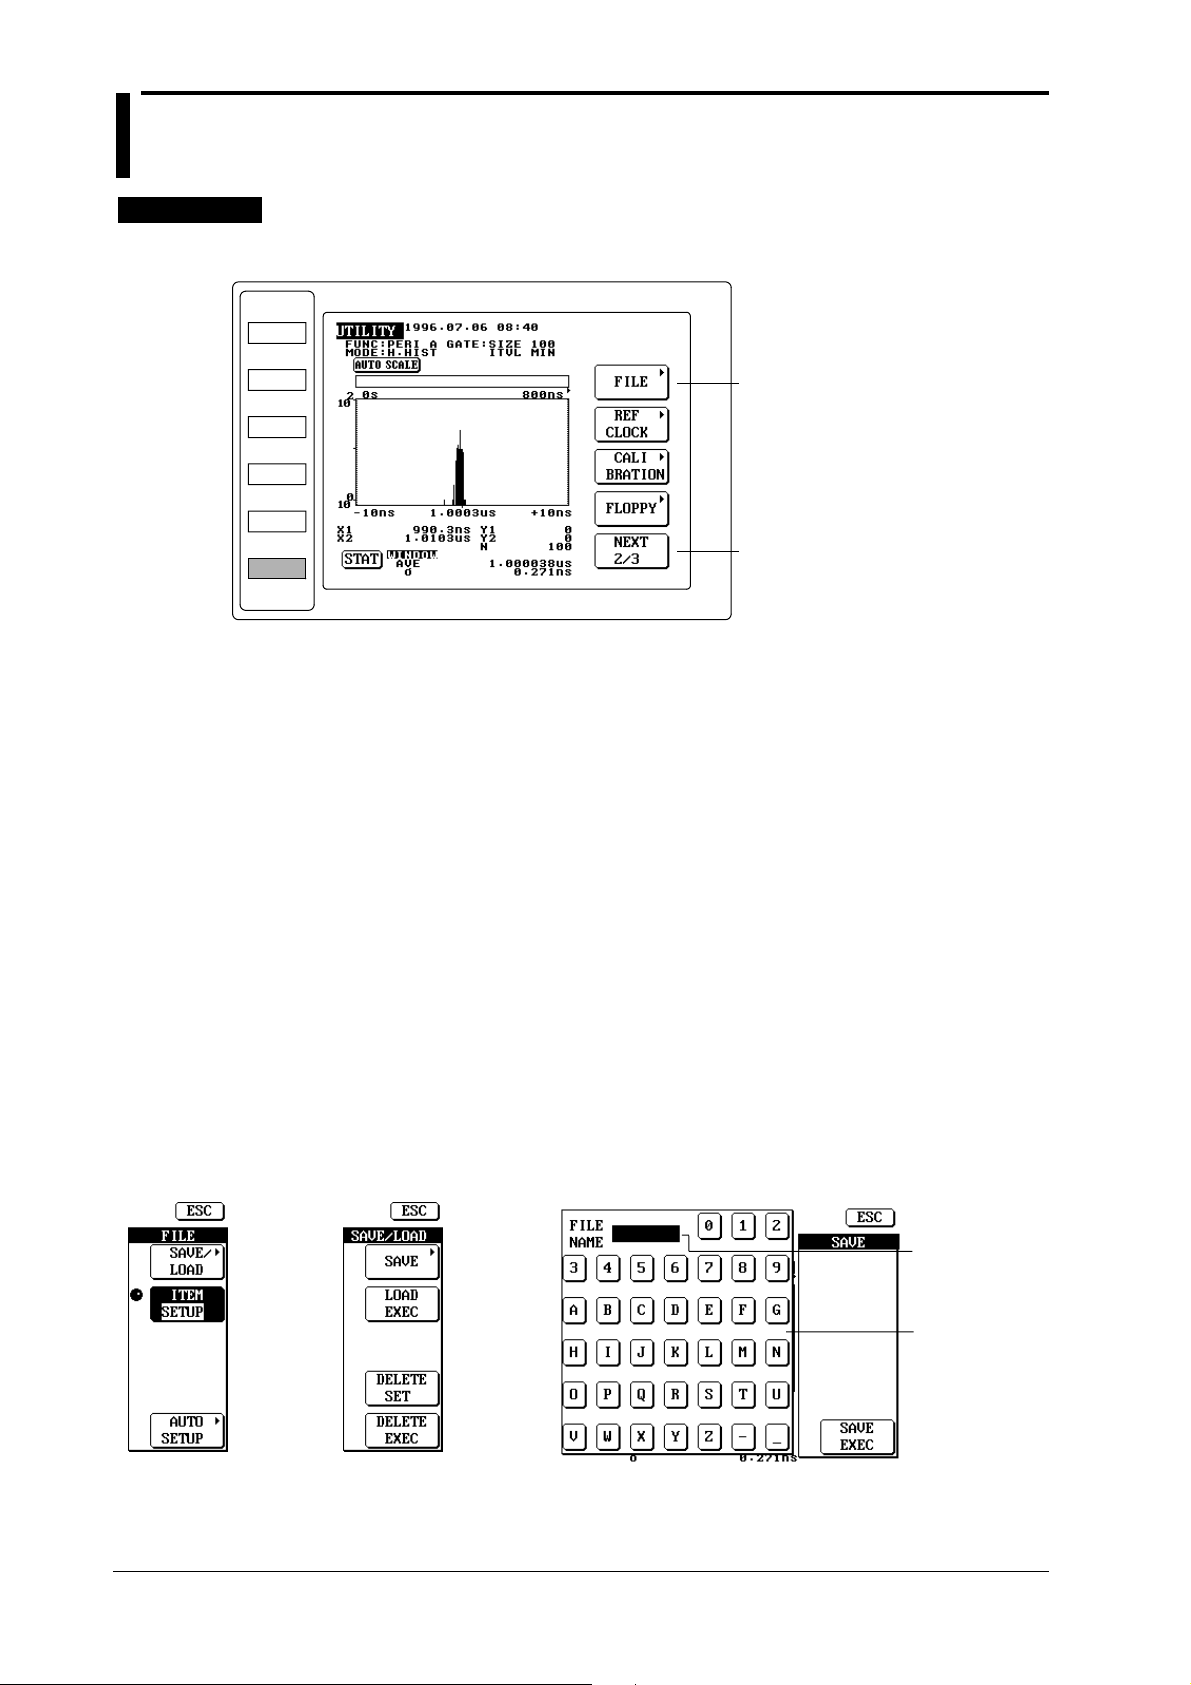
9.3 Saving, Loading and Auto Loading the Set-up Information
Procedure
MODE
FUNCTION
DISPLAY
SAMPLE
INPUT
UTILITY
• To exit from the current menu, press any of the top menu keys or press the ESC touch key
displayed on the screen.
UTILITY Top Menu
Displays the file menu.
Selects the UTILITY menu.
1. Insert a formatted floppy disk into the floppy disk drive.
2. Press the UTILITY key to display the UTILITY top menu.
3. Press the NEXT touch key to display NEXT 2/3 on the key.
Saving the set-up information
4. Press the FILE touch key to display the file menu.
• Selecting the item to be saved
5. Turn the rotary knob to highlight ITEM SETUP on the ITEM touch key to select the set-up
information.
• Setting the file name
6. Press the SAVE/LOAD touch key to display the save/load menu.
7. Press the SAVE touch key to display the save menu. A keyboard will be displayed.
8. Enter the desired file name using the keyboard. The file name will be displayed on the upper
left corner of the keyboard.
9. To correct the file name, press the < arrow key. Each time the < arrow key is pressed, the
cursor moves to the left one character, thus the characters of the file name are deleted one by
one.
• Performing saving
10. After the file name is set, press the SAVE EXEC touch key to save the set-up information.
File menu
9-4
Displays the
save/load
menu.
Selects the
set-up
information.
Save/load menu
Displays the
save menu.
Save menu
Displays the file name.
Keyboard
Performs saving.
IM 704210-01E
Page 91

9.3 Saving, Loading and Auto Loading the Set-up Information
Loading the setup information
11. After step 6, turn the rotary knob to select the file name to be loaded.
12. Press the LOAD EXEC touch key.
Performs loading.
Selects the file name.
Loading the setup information automatically
• Saving the setup information to be loaded automatically
13. After step 4, press the AUTO SETUP touch key to display the auto setup menu.
14. Press the UPDATE touch key to highlight UPDATE.
15. Press the EXEC touch key to save the set-up information into the auto load file (i.e. the file
from which the set-up information is to be loaded automatically). If set-up information
already exists in the file, it will be updated.
• Loading the setup information automatically
16. Before turning ON the power switch of the instrument, insert the floppy disk containing the
auto load file into the floppy disk drive.
17. Turn ON the power switch. An access will be made to the floppy disk automatically, and the
set-up information saved in the auto load file will be loaded to the instrument.
• Loading the setup information when the instrument is already ON
18. After step 13, press the AUTOLOAD touch key to highlight AUTOLOAD.
19. Press the EXEC touch key to load the set-up information from the auto load file.
File menu
Displays the auto setup menu.
Auto setup menu
Loads the setup information when
the instrument is already ON.
Loads the setup information at
power-on or selects updating
of the set-up information.
Performs saving or updating.
9
Saving and Loading the Data from a Floppy Disk
IM 704210-01E
9-5
Page 92

9.3 Saving, Loading and Auto Loading the Set-up Information
Explanation
Set-up information to be saved
Settings made and selected using touch keys, rotary knob and ten-key are saved. In addition, the
set-up information stored in the internal memory is also saved in the auto load file.
File name extension and directory
An extension (.SET) is attached to the file name automatically, and the file is saved in the
directory TA_SETUP. The auto load file is called AUTOLOAD.SET and saved in the root
directory.
Data size
Each set-up information requires approximately 8 KB. The auto load file can contain data of
approximately 50 KB in total.
Checking the free space available on a floppy disk
Refer to 9.2.
Entering the file name
• The file name must consist of 8 or less characters.
• The following characters can be used for file name.
Alphabets (capital letter), numerical values, – (minus), _ (under-bar)
• The following file names cannot be used due to restrictions on MS-DOS.
AUX, CON, PRN, NUL, CLOCK
• Saving under a file name already existing in the same directory is not allowed. (Overwriting is
not allowed.)
Note
• Loading is not possible during measurement (i.e. while the START indicator is ON).
• If the extension of a file name is changed using a personal computer etc., it will be impossible to load that
file.
CAUTION
Never remove the floppy disk while the access indicator is blinking. Failure to do so
may damage the magnetic head of the floppy disk drive or destroy the data saved on the
floppy disk.
9-6
IM 704210-01E
Page 93
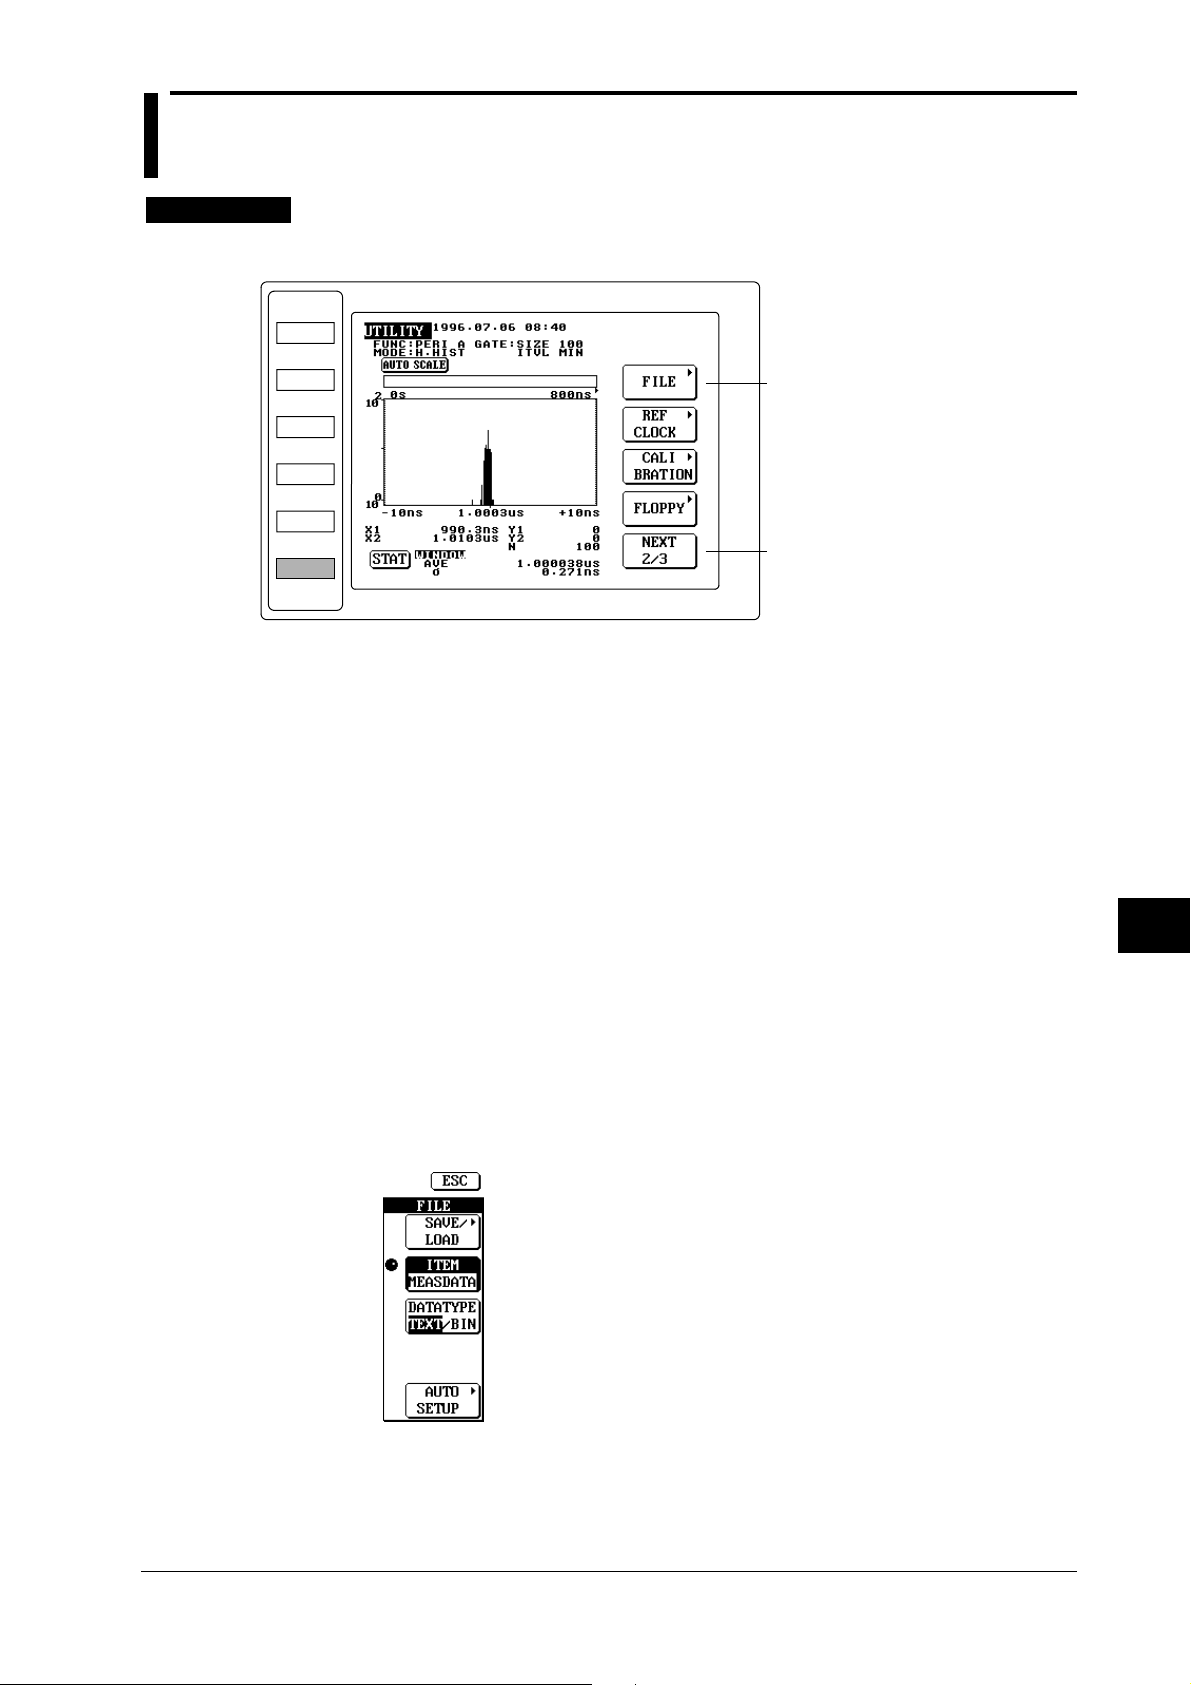
9.4 Saving and Loading the Measured and Computed Data
Procedure
MODE
FUNCTION
DISPLAY
SAMPLE
INPUT
UTILITY
• To exit from the current menu, press any of the top menu keys or press the ESC touch key
displayed on the screen.
UTILITY Top Menu
Displays the file menu.
Selects the UTILITY menu.
1. Insert a formatted floppy disk into the floppy disk drive.
2. Press the UTILITY key to display the UTILITY top menu.
3. Press the NEXT touch key to display NEXT 2/3 on the key.
Saving the measurement results
4. Press the FILE touch key to display the file menu.
• Selecting the item to be saved
5. Turn the rotary knob to highlight ITEM MEASDATA on the ITEM touch key. The
DATATYPE touch key will appear.
6. Press the DATATYPE touch key to highlight TEXT or BIN on the key. The highlighted data
type will be selected.
• Setting the file name
7. Refer to “Setting the file name” in 9.3.
• Performing saving
8. Refer to “Performing saving” in 9.3.
File menu
Displays the save/load menu.
Selects the measurement results.
Selects the data type.
9
Saving and Loading the Data from a Floppy Disk
IM 704210-01E
9-7
Page 94

9.4 Saving and Loading the Measured and Computed Data
Loading the measurement results
9. After step 6, press the SAVE/LOAD touch key to display the save/load menu.
10. Refer to “Loading the setup information” in 9.3.
Saving the statistical computation results
• Selecting the item to be saved
11. After step 4, turn the rotary knob to highlight ITEM STAT on the ITEM touch key.
• Setting the file name
12. Refer to “Setting the file name” in 9.3.
• Performing saving
13. Refer to “Performing saving” in 9.3.
File menu
Displays the save/load menu.
Selects the statistical computation results.
9-8
IM 704210-01E
Page 95

9.4 Saving and Loading the Measured and Computed Data
Explanation
Saving the measurement results
• Selecting the data type
Select the desired data type from the following.
• BIN: The measurement results are saved in binary format. Once they are saved, they can be
loaded to the instrument.
• TEXT:
• Hardware histogram mode: Values (representative values) in the histogram window and their
frequency are saved in text format. They cannot be loaded to the instrument after they are
saved.
• Time stamp mode: All the data (time stamps and measured values) of a measurement block
are saved in text format. They cannot be loaded to the instrument after they are saved.
• File name extension and directory
File name extension and directory vary depending on the data type. An appropriate extension is
attached to the file name before the file is saved in its corresponding directory.
• BIN: “.WVF” is attached to the file name, and the file is saved in the directory TA_WAVE.
The header file (ASCII format) is also saved at the same time. The header file contains the
information to be used for analysis of the saved data. The extension for the header file is
“.HDR”.
• TEXT: “.CSV” is attached to the file name, and the file is saved in the directory TA_TEXT.
• Data size
The data size varies depending on the number of samples (S) and data type. (Unit: bytes)
• BIN:
• Measured data obtained in hardware histogram mode: Approx. 133 K bytes (approx. 384 K
bytes for simultaneous positive/negative measurement of pulse width measurement)
• Measured data obtained in time stamp mode: Approx. 8 bytes × S + approx. 8 K bytes
• TEXT: The data size varies considerably depending on the selected sampling mode, sample
size and histogram display etc. However, the maximum data size is approx. 1 M bytes.
Saving the statistical computation results
• File name extension and directory
“.CSV” is attached to the file name, and the file is saved in the directory TA_MISC.
• Data size
Each computation data requires approx. 500 bytes.
Checking the free space available on a floppy disk
Refer to 9.2.
Entering the file name
Refer to 9.3.
Note
• Loading and saving are not possible during measurement (i.e. while the START indicator is ON).
• Loading of measurement results (text format) and statistical computation results to this instrument is not
possible.
• If measurement results are loaded, the set-up information accompanying the loaded measurement results
will be used as the set-up information.
• If the extension of a file name is changed using a personal computer etc., it will be impossible to load that
file.
CAUTION
Never remove the floppy disk while the access indicator is blinking. Failure to do so
may damage the magnetic head of the floppy disk drive or destroy the data saved on the
floppy disk.
9
Saving and Loading the Data from a Floppy Disk
IM 704210-01E
9-9
Page 96
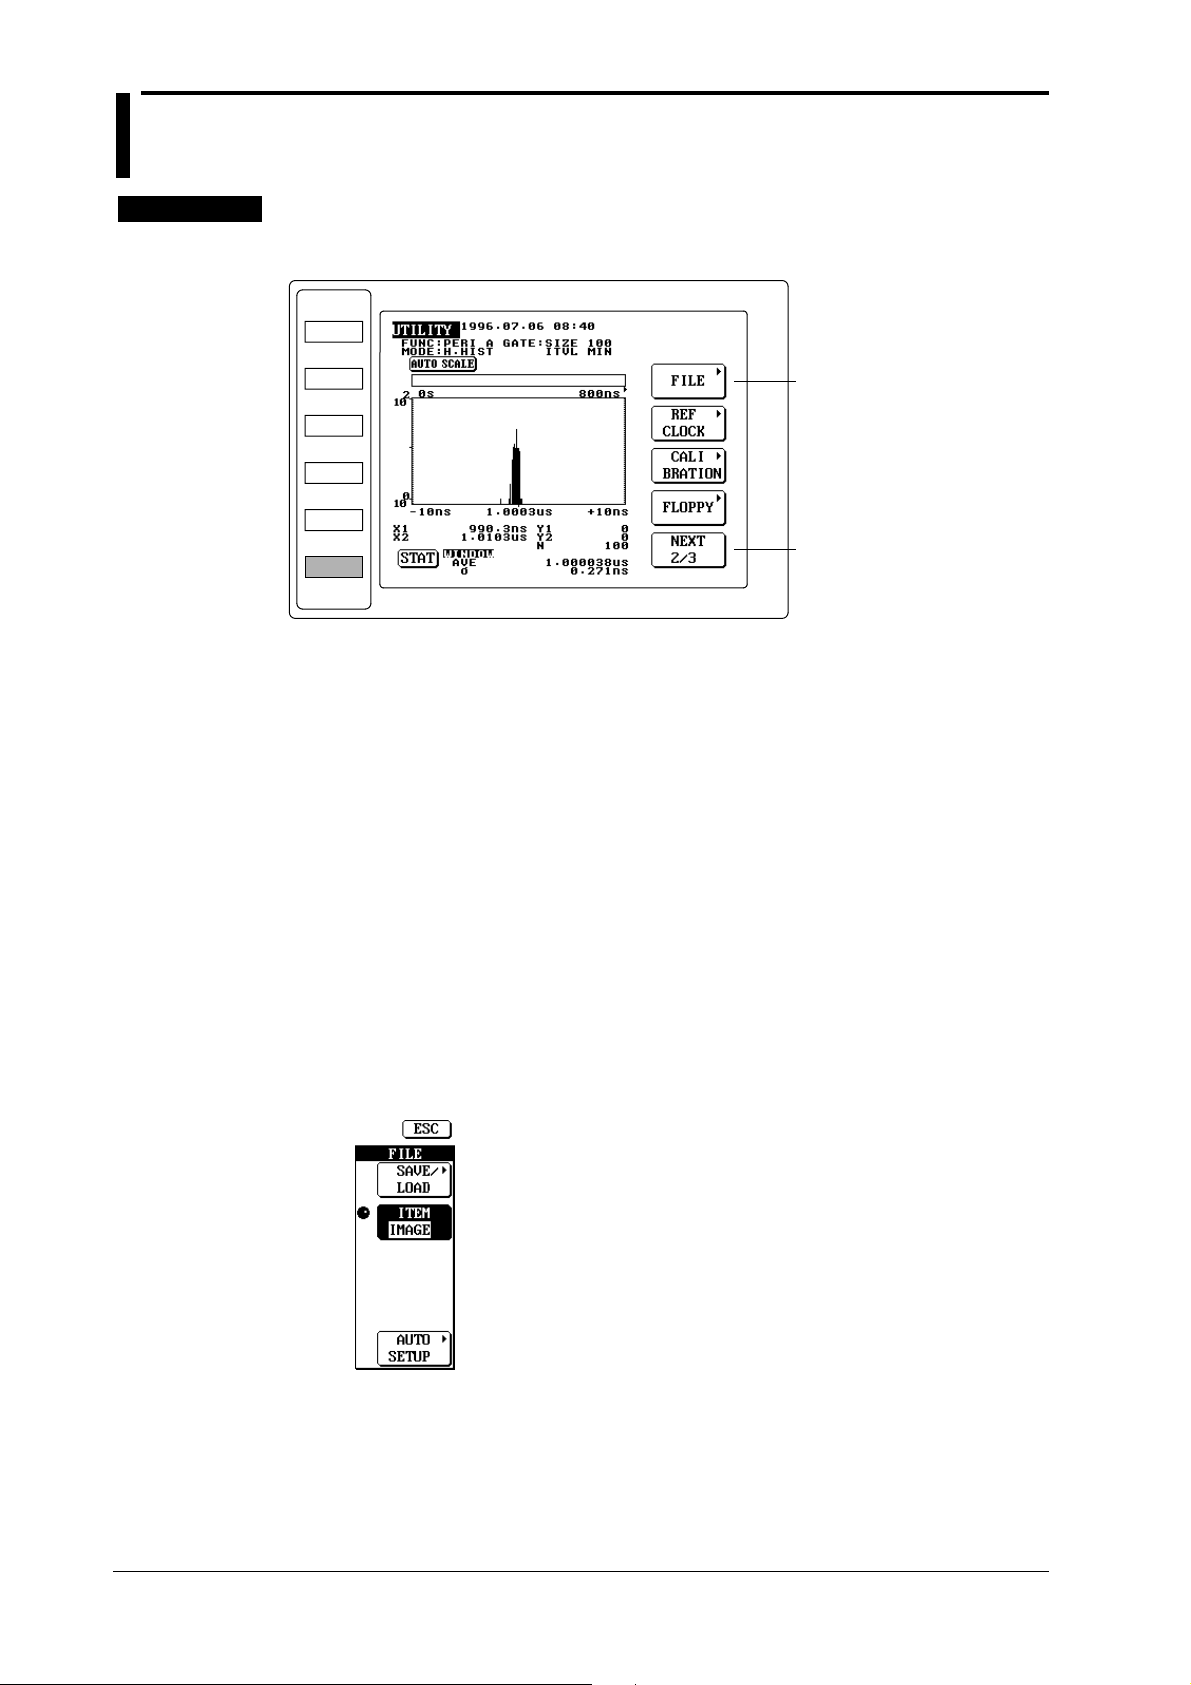
9.5 Saving the Screen Image Data
Procedure
• To exit from the current menu, press any of the top menu keys or press the ESC touch key
displayed on the screen.
UTILITY Top Menu
MODE
FUNCTION
DISPLAY
SAMPLE
INPUT
UTILITY
Displays the file menu.
Selects the UTILITY menu.
1. Insert a formatted floppy disk into the floppy disk drive.
2. Press the UTILITY key to display the UTILITY top menu.
3. Press the NEXT touch key to display NEXT 2/3 on the key.
Saving the screen image data
4. Press the FILE touch key to display the file menu.
• Selecting the item to be saved
5. Turn the rotary knob to highlight ITEM IMAGE on the ITEM touch key, to select the screen
image data.
• Setting the file name
6. Refer to “Setting the file name” in 9.3.
• Performing saving
7. Refer to “Performing saving” in 9.3.
File menu
Displays the save/load menu.
Selects the screen image data.
9-10
IM 704210-01E
Page 97
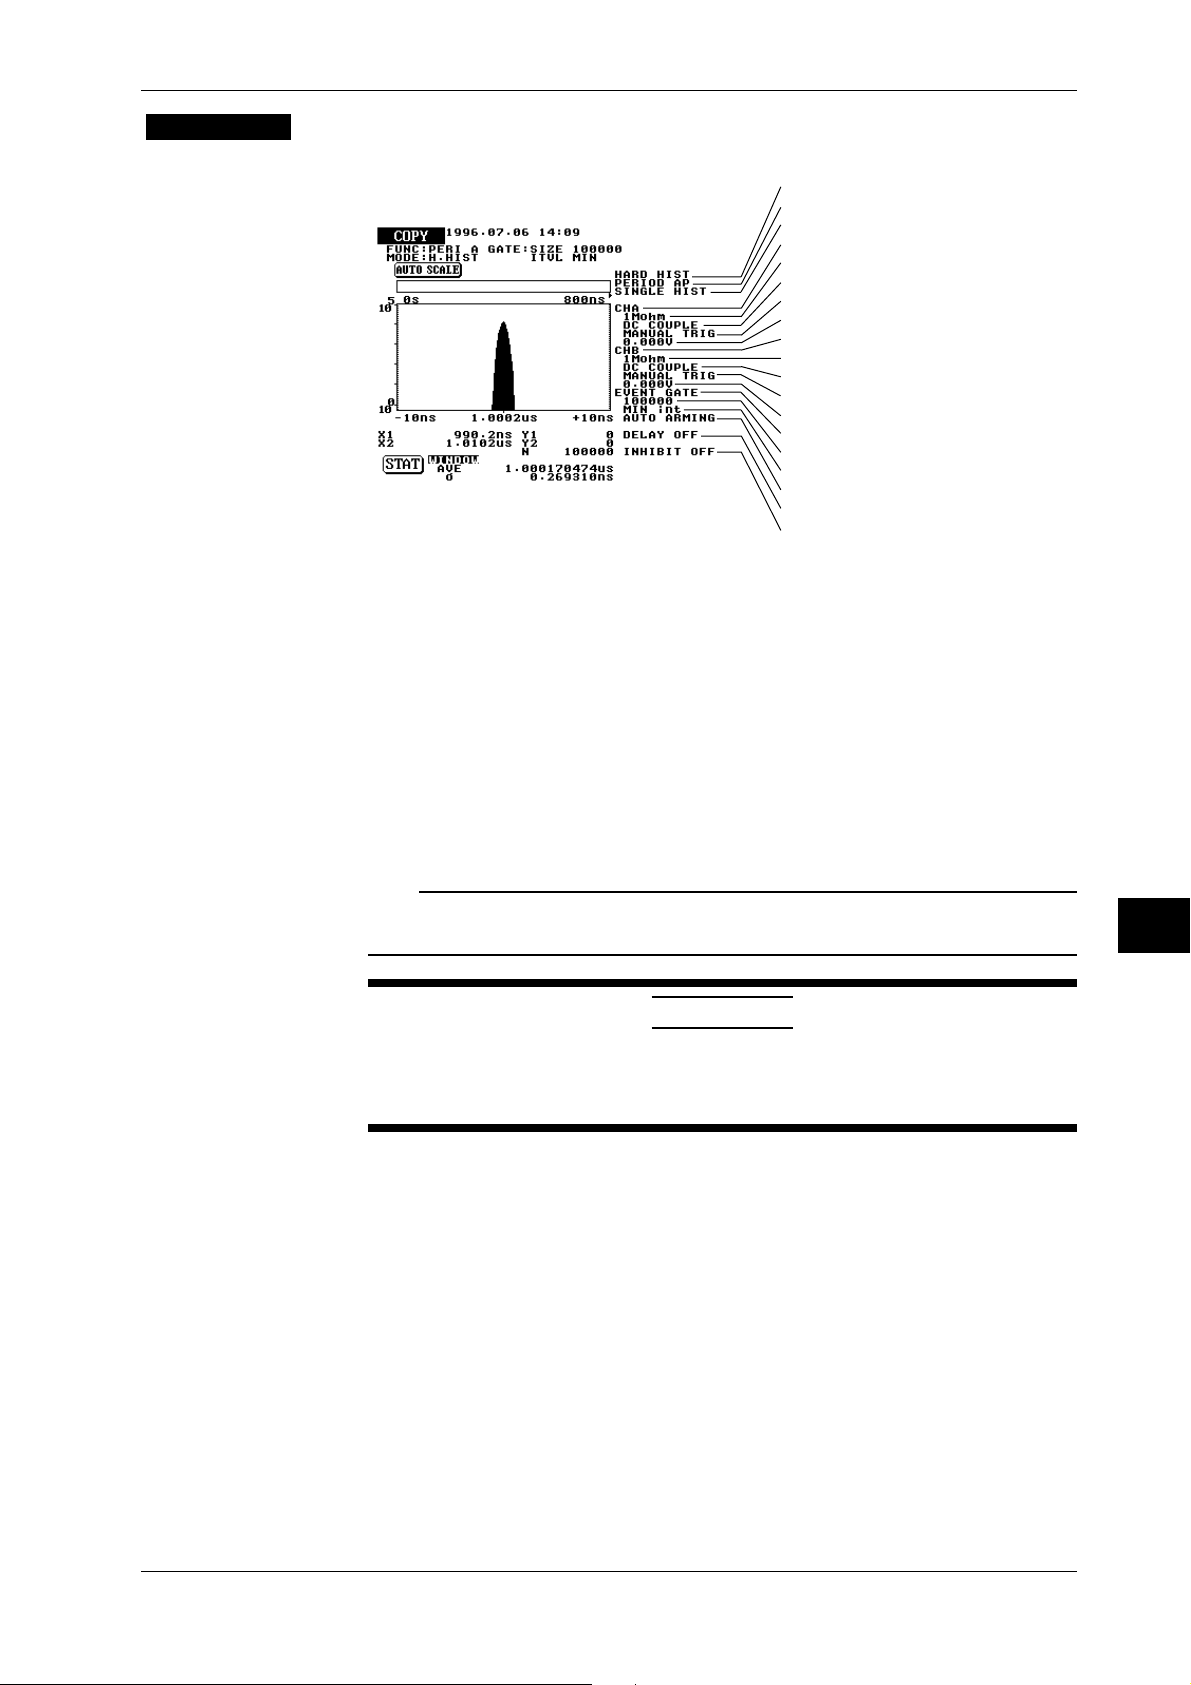
9.5 Saving the Screen Image Data
Explanation
Saving the screen image data
The screen image data will be saved in TIFF format.
Sampling mode
Measurement function
Multi-window ON/OFF
Channel A
Input impedance (channel A)
Input coupling (channel A)
Trigger mode (channel A)
Trigger level (channel A)
Channel B
Input impedance (channel B)
Input coupling (channel B)
Trigger mode (channel B)
Trigger level (channel B)
Gate type
Sample size
Sampling interval
Arming source
Arming delay type
Inhibit ON/OFF
File name extension and directory
“.TIF” is attached to the file name, and the file is saved in the directory TA_MISC.
Data size
Each screen image data requires approx. 11 K bytes.
Checking the free space available on a floppy disk
Refer to 9.2.
Entering the file name
Refer to 9.3.
Note
• Saving is not possible during measurement (i.e. while the START indicator is ON).
• Loading of the screen image data to this instrument is not possible.
CAUTION
Never remove the floppy disk while the access indicator is blinking. Failure to do so
may damage the magnetic head of the floppy disk drive or destroy the data saved on the
floppy disk.
9
Saving and Loading the Data from a Floppy Disk
IM 704210-01E
9-11
Page 98

9.6 Auto Saving the Screen Image Data
Procedure
• To exit from the current menu, press any of the top menu keys.
COPY menu
Selects the copy destination
(floppy).
Performs copying.
1. Insert a formatted floppy disk into the floppy disk drive.
Selecting the floppy disk as copy destination.
2. Press the COPY key to display the COPY menu.
3. Press the FLOPPY/PLOTTER touch key to highlight FLOPPY.
Performing copying
4. Press the EXEC touch key.
Explanation
Saving the screen image data automatically
The screen image data will be saved in TIFF format. For items to be saved, refer to 9.5.
File name
A file name is assigned to each screen image data automatically, starting with TA000 up to
TA1000 sequentially. When TA1000 is reached, auto saving will be disabled.
File name extension, directory, data size and checking the free space available on a
floppy disk
Refer to 9.5.
Note
• Saving is not possible during measurement (i.e. while the START indicator is ON).
• Loading of the screen image data to this instrument is not possible.
CAUTION
Never remove the floppy disk while the access indicator is blinking. Failure to do so
may damage the magnetic head of the floppy disk drive or destroy the data saved on the
floppy disk.
9-12
IM 704210-01E
Page 99
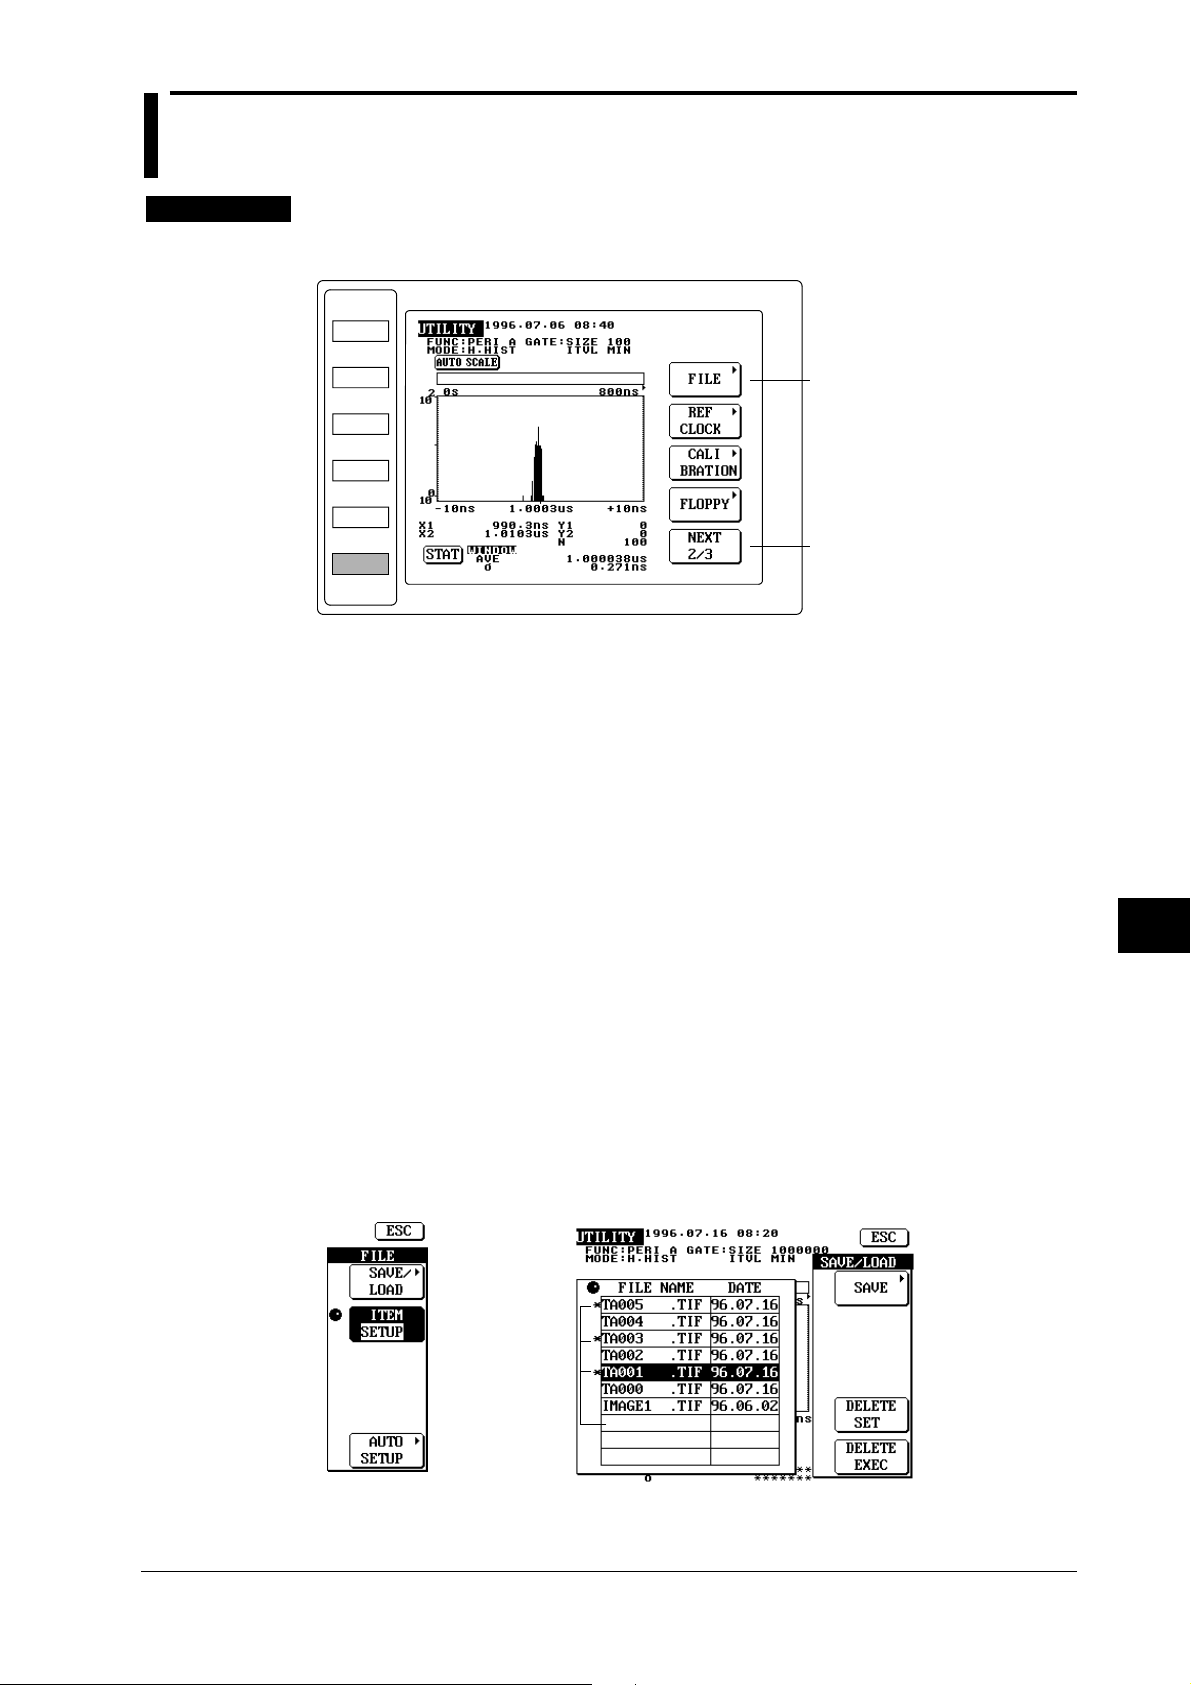
9.7 Deleting Saved Data
Procedure
• To exit from the current menu, press any of the top menu keys or press the ESC touch key
displayed on the screen.
UTILITY Top Menu
MODE
FUNCTION
DISPLAY
SAMPLE
INPUT
UTILITY
Displays the file menu.
Selects the UTILITY menu.
1. Insert a formatted floppy disk into the floppy disk drive.
2. Press the UTILITY key to display the UTILITY top menu.
3. Press the NEXT touch key to display NEXT 2/3 on the key.
Selecting the item to be deleted
4. Press the FILE touch key to display the file menu.
5. Turn the rotary knob to highlight the desired item on the ITEM touch key. The highlighted
item to be deleted will be selected.
Selecting the name of the file to be deleted
6. Press the SAVE/LOAD touch key to display the save/load menu.
7. Turn the rotary knob to highlight the file to be deleted.
8. Press the DELETE SET touch key. An asterisk “ * ” will be displayed on the left of the
selected file name, indicating the file to be deleted has been selected. Pressing the DELETE
SET touch key again causes the asterisk to disappear, indicating that selection of the file has
been canceled.
Performing deletion
9. After the file to be deleted has been selected, press the DELETE EXEC touch key to delete
the file.
File menu
Displays the
save/load menu.
Selects the item
to be deleted.
Save/load menu
Asterisk
Selects the file
to be deleted.
Performs deletion.
9
Saving and Loading the Data from a Floppy Disk
IM 704210-01E
9-13
Page 100

9.7 Deleting Saved Data
Explanation
To delete data (file), select the file type (item) according to steps 4 and 5, then select the name of
the file to be deleted.
Note
Once data is deleted, it will not be possible to recover the data again. So take special care not to delete the
wrong file by mistake.
CAUTION
Never remove the floppy disk while the access indicator is blinking. Failure to do so
may damage the magnetic head of the floppy disk drive or destroy the data saved on the
floppy disk.
9-14
IM 704210-01E
 Loading...