

Page 1

/
Digital Oscilloscope
IM 701530-01E
2nd Edition
Page 2

Introduction
Notes
Thank you for purchasing the YOKOGAWA DL1540C/DL1540CL Digital
Oscilloscope.
This User’s Manual contains useful infor mation about the functions and operating
procedures of the instrument, mainly DL1540C. It also contains precautions that
should be observed during use. Main differences in the specifications between
DL1540C and DL1540CL is that DL1540CL allows record length of up to 2M words.
Due to these differences, functions and operations differ slightly among these
models. For a detailed description, refer to the relevant sections of this manual. To
ensure correct use of the instrument, please read this manual thoroughly before
operating it.
Keep the manual in a safe place for quick reference whenever a question arises.
Two manuals are provided with the instrument in addition to this manual.
Manual Name Manual No. Description
DL1540C/1540CL IM701530-02E Describes basic operations only.
Operation Guide
DL1540C/1540CL IM701530-11E Describes the communications functions
Communication Interface for the GP-IB/RS-232-C interface.
User’s Manual
• The contents of this manual are subject to change without prior notice as a result
of improvements in the instrument’s performance and functions. Display contents
illustrated in this manual may differ slightly from what actually appears on your
screen.
• Every effort has been made in the preparation of this manual to ensure the
accuracy of its contents. However, should you have any questions or find any
errors, please contact your nearest YOKOGAWA representative as listed on the
back cover of this manual.
• Copying or reproduction of all or any part of the contents of this manual without
YOKOGAWA’s permission is strictly prohibited.
Trademarks
MS-DOS is a registered trademark of Microsoft Corporation.
HP-GL is a registered trademark of Hewlett-Packard Company.
PostScript is a registered trademark of Adobe Systems Incorporated.
Revisions
1st Edition: December 1998
2nd Edition: May 2000
Disk No. DL26
2nd Edition: May 2000 (YK)
All Rights Reserved, Copyright © 1998 Yokogawa Electric Corporation
IM 701530-01E
1
Page 3
Checking the Contents of the Package
Unpack the box and check the contents before operating the instrument. If the
wrong instrument or accessories have been delivered, if some accessories are
missing or if they appear abnormal, contact the dealer from which you purchased
them.
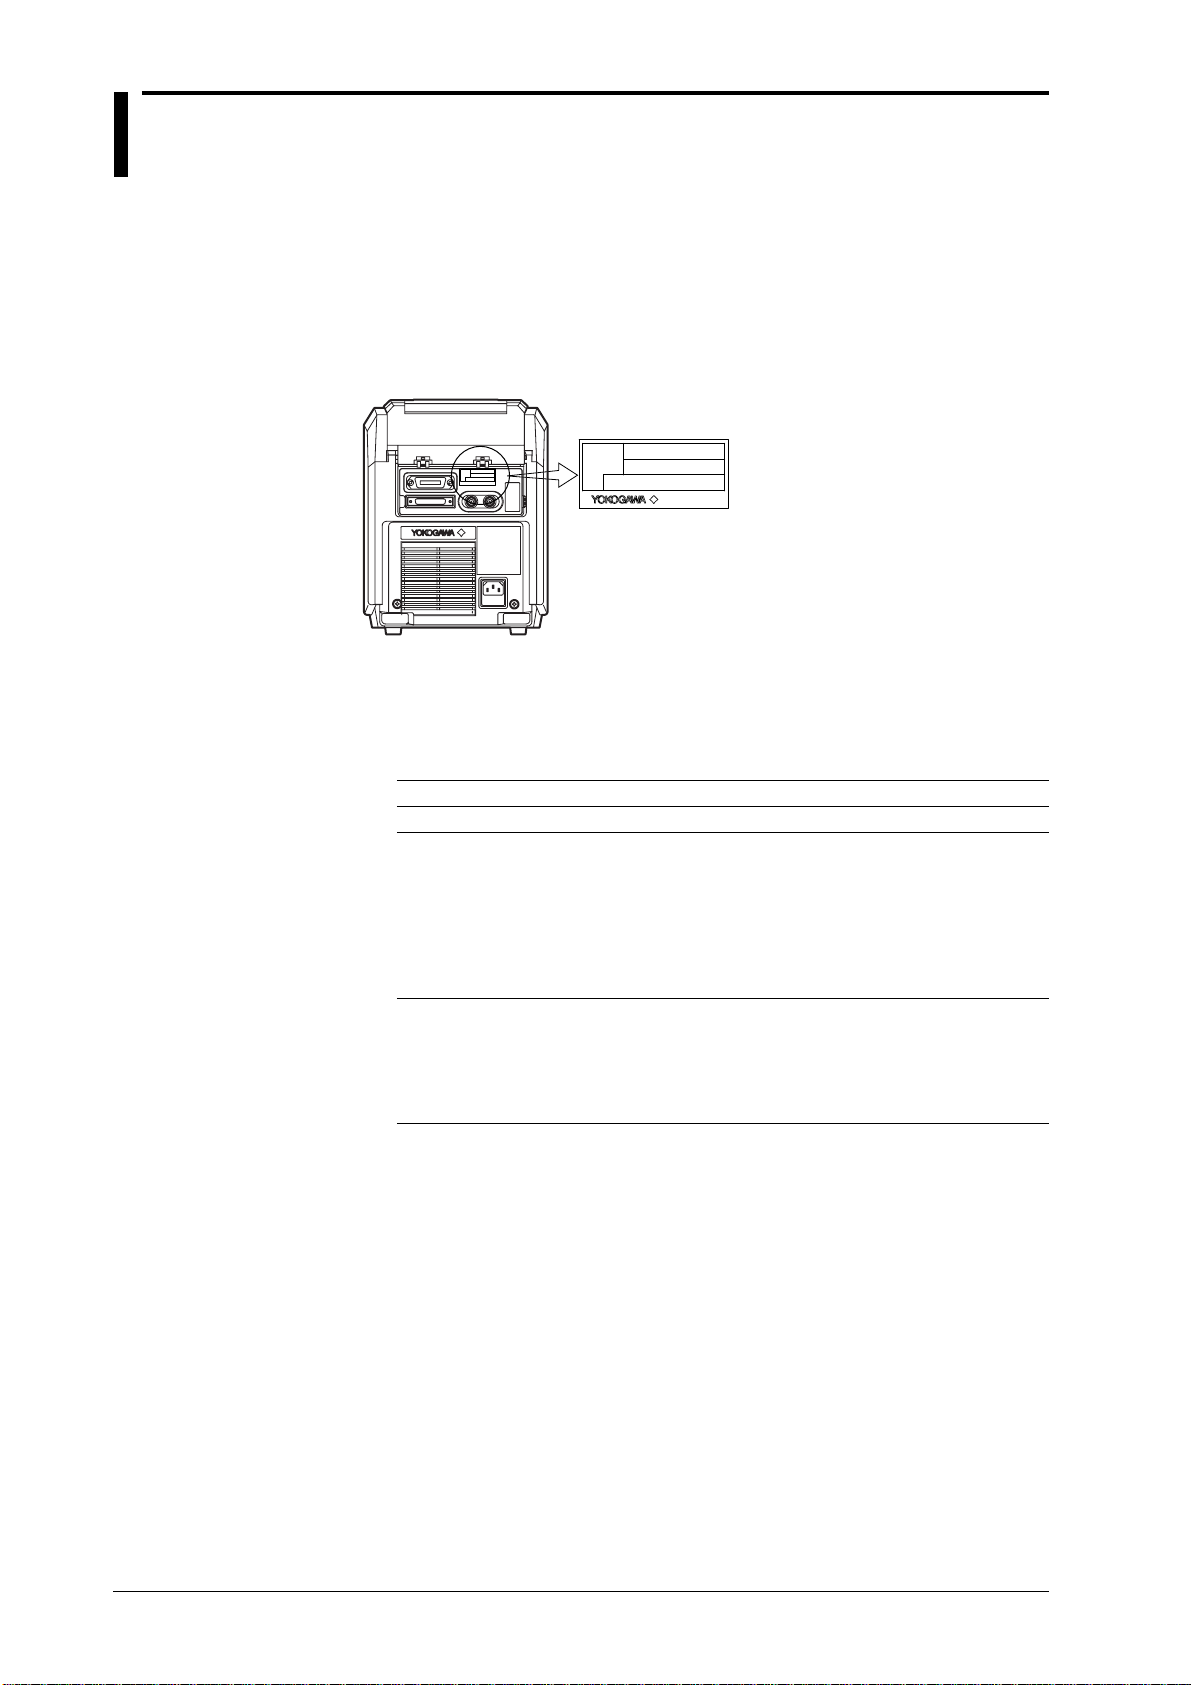
Main Body
Check that the model name and suffix code given on the name plate of the rear
panel match those on your order.
MODEL
SUFFIX
NO.
MODEL (Type Name)
701530 : DL1540C, 701540 : DL1540CL
Made in Japan
SUFFIX (Suffix Code)
Suffix Code Specifications
Power voltage 100-120 VAC/200-240 VAC
Power cord -D UL/CSA Standards Power Cord (Part No.: A1006WD)
-F VDE Standard Power Cord (Part No.: A1009WD)
-Q BS Standard Power Cord (Part No.: A1054WD)
-R SAA Standard Power Cord (Part No.: A1024WD)
Options /B5 Built-in printer (real-time printing function)
*1 /F5 includes the enhanced trigger function for the DL1540CL.
*2 /V1 and /C8 cannot be specified simultaneously.
Example : DL1540C, UL/CSA standard power cord and full options → 701530-D/B5/E1/
F1/V1
[Maximum Rated Voltage: 125 V, Maximum Rated Current: 7 A]
[Maximum Rated Voltage: 250 V, Maximum Rated Current: 10 A]
[Maximum Rated Voltage: 250 V, Maximum Rated Current: 10 A]
[Maximum Rated Voltage: 240 V, Maximum Rated Current: 10 A]
/E1 With two additional 150 MHz probes (700998)
/F1 Additional trigger (OR, Pattern, Width)
/F5*1I2C-bus analysis function
/C8*22.1-GB internal HDD
/V1*2VGA output
NO. (Instrument No.)
When contacting the dealer from which you purchased your instrument, please
quote the instrument No.
2
IM 701530-01E
Page 4

Standard Accessories
Checking the Contents of the Package
The following standard accessories are supplied with the instrument. Make sure
that all items are present and undamaged.
Power cord (one of the following power cords
is supplied according to the instrument's suffix codes)
UL/CSA standard
A1006WD
D
150MHz probe
(10:1, 1:1 selectable)(x2)
700998
Power supply fuse
(in fuse holder)
A1351EF
VDE standard
A1009WD
Printer roll
∗
1
chart
B9850NX
Front cover
B9957DG
BS standard
A1054WD
F
∗
2
User's manual (this manual)
Communication interface manual
Operation guide
Q
Rubber feet(x4)
A9088ZMx2
SAA standard
A1024WD
R
Soft case
B9918EZ
(x1)
(x1)
(x1)
IM 701530-01E
*1 For DL1540C/DL1540CL, a total of four passive probes are supplied (if the two
optional probes are included).
*2 A roll chart will be supplied only when the instrument is equipped with a built-in printer.
3
Page 5
Checking the Contents of the Package
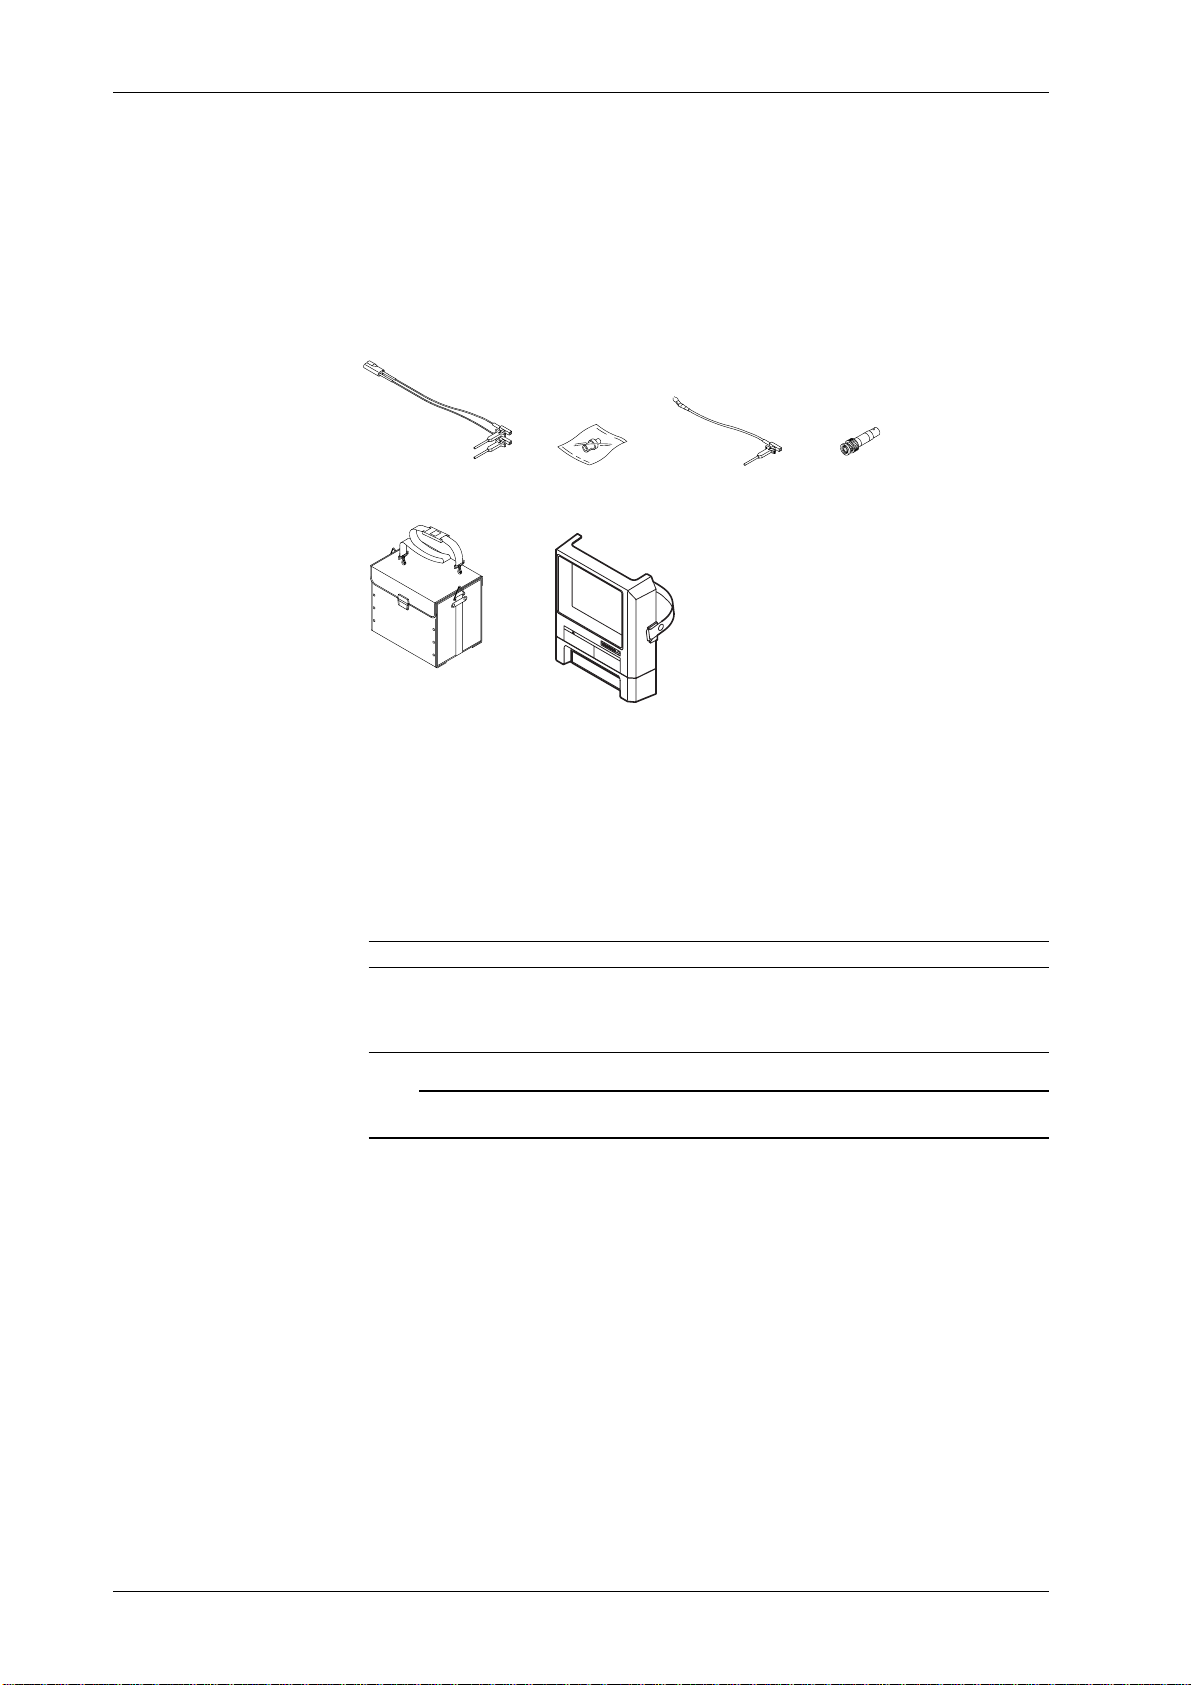
Optional Accessories
The following optional accessories are available. On receiving these optional
accessories, make sure that all the items that you ordered have been supplied and
that they are undamaged.
If you have any questions regarding optional accessories, or if you wish to place an
order, contact the dealer from whom you purchased the instrument.
Optional Spare Parts
Mini-clip convertor
B9852CR
Carrying case
700915
BNC adapter
B9852CS
Front cover (clear type)
700917
Ground lead
B9852CT
50 Ω Through
terminator
700976
The following optional spare parts are available. On receiving these optional spare
parts, make sure that all the items that you ordered have been supplied and that
they are undamaged.
If you have any questions regarding optional spare parts, or if you wish to place an
order, contact the dealer from whom you purchased the instrument.
Part Name Part No. Minimum Q’ty Remarks
150 MHz probe 700998 1 Input impedance: 10 MΩ, Length: 1.5 m
(10:1, 1:1 selectable)
Roll chart B9850NX 5 Thermo-sensible paper, Total length: 30 m
Power supply fuse A1351EF 2 Time lag, 3.15 A, 250 V
Note
It is recommended that the packing box be kept in a safe place. The box can be used when you
need to transport the instrument somewhere.
4
IM 701530-01E
Page 6

Safety Precautions
This instrument is an IEC safety class I instrument (provided with terminal for
protective grounding). The following general safety precautions must be observed
during all phases of operation, service, and repair of this instrument. If this
instrument is used in a manner not specified in this manual, the protection provided
by this instrument may be impaired. Also, YOKOGAWA Electric Corporation
assumes no liability for the customer’s failure to comply with these requirements.
The following symbols are used on this instrument.
To avoid injury, death of personnel or damage to the instrument, the operator must
refer to an explanation in the User’s Manual or Service manual.
Function Grounding Terminal (This terminals shold not be used as a “Protective
grounding terminal”.)
Alternating current
ON(power)
OFF(power)
In-position of a bistable push control
Out-position of a bistable push control
IM 701530-01E
5
Page 7

Safety Precaustions
WARNING
Power Supply
Ensure the source voltage matches the voltage of the power supply before turning
on the power.
Power Cord and Plug
To prevent an electric shock or fire, be sure to use the power supply cord supplied
by YOKOGAWA. The main power plug must be plugged in an outlet with protective
grounding terminal. Do not invalidate protection by using an extension cord without
protective grounding.
Protective Grounding
Make sure to connect the protective grounding to prevent an electric shock before
turning on the power.
Necessity of Protective Grounding
Never cut off the internal or external protective grounding wire or disconnect the
wiring of protective grounding terminal. Doing so poses a potential shock hazard.
Defect of Protective Grounding and Fuse
Do not operate the instrument when protective grounding or fuse might be
defective.
Fuse
To prevent a fire, make sure to use fuses with specified standard (current, voltage,
type). Before replacing the fuses, turn off the power and disconnect the power
source. Do not use a different fuse or short-circuit the fuse holder.
Do not Operate in an Explosive Atmosphere
Do not operate the instrument in the presence of flammable liquids or vapors.
Operation of any electrical instrument in such an environment constitutes a safety
hazard.
Do not Remove any Covers
There are some areas with high voltage. Do not remove any cover if the power
supply is connected. The cover should be removed by qualified personnel only.
External Connection
To ground securely, connect the protective grounding before connecting to
measurement or control unit.
6
IM 701530-01E
Page 8

How to Use this Manual
Structure of the Manual
This User’s Manual consists of 16 chapters, an Appendix and an Index as described
below.
Chapter Title Description
1 Functions Describes measurement principles and functions. Although
2 Name and Use of Gives the name of each part and describes how to use it.
Each Part The corresponding reference pages for panel keys and the
3 Before Starting Describes points to watch during use and describes how to
Observation and install the instrument, connect the power cord, turn the
Measurement of power switch ON/OFF and connect probes as well as how to
Waveforms set the date and time.
4 Common Describes the operations used to make settings, such as
Operations start/stop acquisition, auto set-up and initialization of each
5 Setting the Vertical Describes how to turn channels ON/OFF, how to make
and Horizontal settings, such as input coupling, probe attenuation and
Axes vertical sensitivity, that are related to the ver tical axis
6 Activating a Trigger Describes trigger setting operations, such as those for
7 Changing Describes how to make acquisition condition settings, such
Acquisition as acquisition mode, sampling mode, input filter and
and Display hysteresis, as well as how to make display condition
Conditions settings, such as waveform expansion, interpolation,
8 Analyzing Describes how to measure waveforms using cursors,
Waveforms performautomatic measurement of waveform parameters
9 Performing a Describes how to perform a GO/NO-GO action by setting the
GO/NO-GO Action waveform zone or setting limits for waveform parameters,
10 Outputting Displayed Describes how to output displayed waveforms (screen
Waveforms and hardcopy) and set-up information to the built-in printer or
Setting Parameters plotter connected to the GP-IB interface.
to the Printer/Plotter
11 Storing and Recalling Describes how to store displayed waveforms or settings in the
Data from the internal memory, ho w to recall stored wa v eform data and display
Internal Memory the waveforms, and how to recall settings and change them.
12 Saving and Describes how to save waveform data or set-up data to a
Loading Data floppy disk, how to load saved data, how to initialize a floppy
from a Floppy Disk disk and how to delete data.
13 Saving and Describes how to save the waveform data or set-up data to
Loading Data from the SCSI device or the internal hard disk. Describes how to
a SCSI Device or load the saved data, initialize the disk, delete the data, and
the Internal Hard Disk other operations.
14 Other Operations Describes operations such as those required for trigger output.
15 Troubleshooting, Describes how to diagnose the cause of trouble and how to
Maintenance and correct it, as well as describing each message that may
Inspection appear on the screen and how to perform a self test.
16 Specifications Describes the specifications.
Appendix
Index Important terms used in this manual with corresponding
this section does not give a description of the operating
methods, it will help you to understand the basic operations.
rotary knobs are also given.
setting as well as operations, such as snapshot, clear trace
and calibration, that are used frequently during operation.
(voltage axis), as well as how to make settings related to the
horizontal axis (time axis).
setting trigger mode, trigger type, trigger source and trigger
level, that enable you to determine acquisition timing.
accumulation, X-Y display and graticule.
and waveform math, and how to display the power spectrum
obtained by FFT computation.
then detecting whether the input signal waveform is within
the specified range (zone or limits).
Shows a menu map, describes the relationship between the time
axis, sample rate and record length, and describes the data
format which must be specified when waveform data is saved.
reference page numbers are given.
IM 701530-01E
7
Page 9
Conventions Used in this Manual
Unit
k ........... Denotes “1000”. Example: 100kS/s
K ........... Denotes “1024” or “1002”.
• Example of when K indicates “1024” : 640 KB (storage capacity of a
floppy disk)
• Example of when K indicates “1002” : 100 KW (record length for
acquisition memory)
Used Characters
Alphanumerics enclosed in double quotation marks usually refer to characters and
set values that appear on the screen and panel.
The SHIFT + xxx key refers to first pressing the SHIFT key (the indicator above the
SHIFT key lights), and then pressing the xxx key to obtain another, specified,
function.
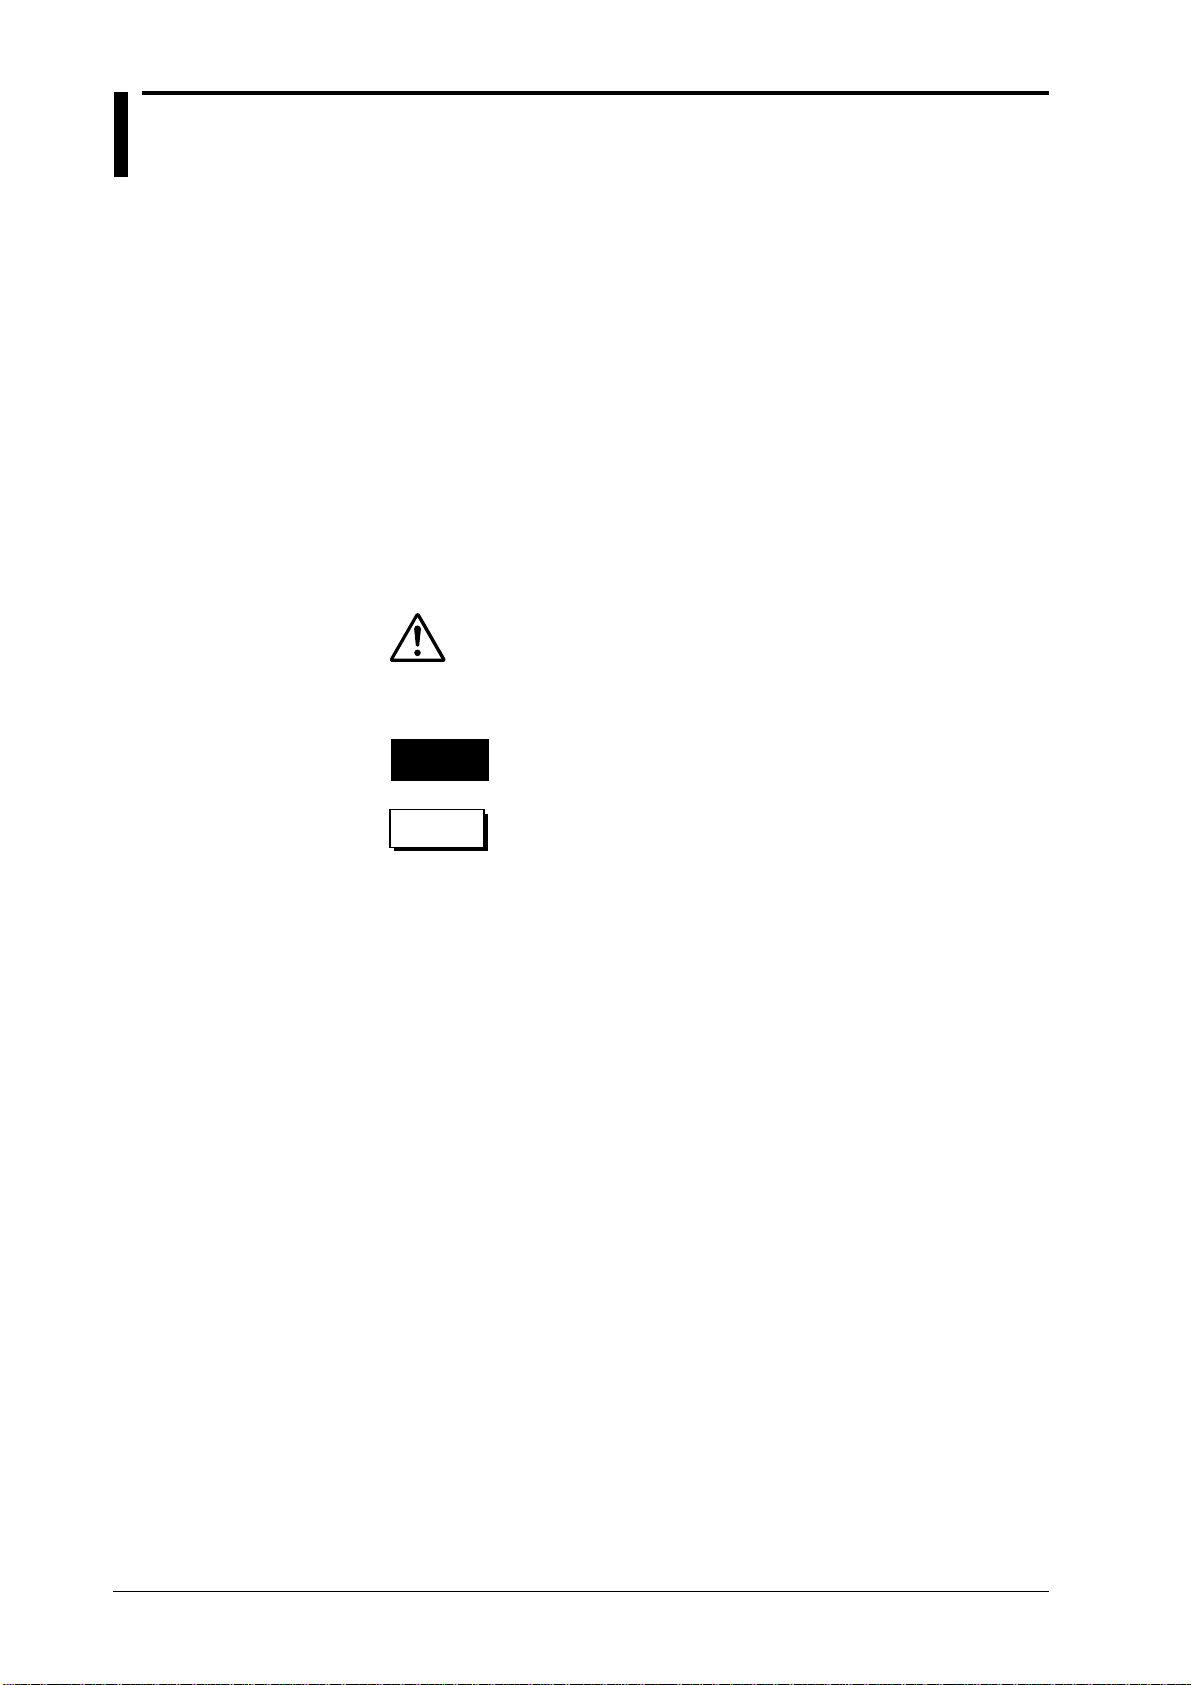
Symbols Used
The following symbol marks are used in this User's Manual.
To avoid injury or death of personnel, or damage to the
instrument, the operator must refer to the User's Manual. In
the User's Manual, these symbols appear on the pages to
which the operator must refer.
WARNING
CAUTION
Note Provides information that is important for proper operation
Symbol Marks Used for Descriptions of Operations
The following symbol marks are used in Chapters 3 to 14 to distinguish certain
feg|ures in descriptions.
Describes precautions that should be observed to prevent
the danger of serious injury or death to the user.
Describes precautions that should be observed to prevent
the danger of minor or moderate injury to the user, or the
damage to the property.
of the instrument.
Relevant Keys Indicates the relevant panel key which are
necessary to carry out the operation.
Operating Procedure Carr y out steps in the order shown. The
operating procedures are given with the
assumption that you are not familiar with the
operation. Thus, it may not be necessary to carry
out all the steps when changing settings.
Keys and Procedure Shows the above mentioned relevant keys and
the operating procedure in one block.
Explanation Describes settings and restrictions relating to the
operation. A detailed description of the function
is not provided. For a detailed description of the
function, refer to Chapter 1.
8
IM 701530-01E
Page 10

Contents
Introduction .......................................................................................................................................... 1
Checking the Contents of the Package .............................................................................................. 2
Safety Precautions............................................................................................................................... 5
How to Use this Manual....................................................................................................................... 7
Conventions Used in this Manual....................................................................................................... 8
Chapter 1 Functions
1.1 System Configuration and Block Diagram ............................................................................ 1-1
1.2 Setting the Vertical and Horizontal Axes...............................................................................1-2
1.3 Setting a Trigger.................................................................................................................... 1-8
1.4 Setting the Acquisition and Display Conditions ..................................................................1-12
1.5 Analyzing the Waveform .....................................................................................................1-18
1.6 Other Useful Functions ....................................................................................................... 1-20
1
2
3
4
5
Chapter 2 Name and Use of Each Part
2.1 Front Panel / Rear Panel / Top View ..................................................................................... 2-1
2.2 Operation Keys / Rotary Knob .............................................................................................. 2-3
2.3 Display ..................................................................................................................................2-6
Chapter 3 Before Starting Observation and Measurement of Waveforms
3.1 Precautions During Use ....................................................................................................... 3-1
3.2 Installing the Main Unit .........................................................................................................3-2
3.3 Connecting the Power Cord.................................................................................................. 3-3
3.4 Turning the Power Switch ON/OFF....................................................................................... 3-4
3.5 Connecting a Probe ..............................................................................................................3-5
3.6 Compensating the Probe (Phase Correction)....................................................................... 3-6
3.7 Setting the Date and Time ....................................................................................................3-7
Chapter4 Common Operations
4.1 Starting and Stopping Acquisition ........................................................................................4-1
4.2 Displaying Waveforms using the Auto Set-up Function ........................................................ 4-2
4.3 Initializing Settings ................................................................................................................ 4-4
4.4 Halting a Waveform and Erasing the Halted Waveform (Snapshot and Clear Trace) ...........4-5
4.5 Performing Calibration .......................................................................................................... 4-6
4.6 Setting Values....................................................................................................................... 4-7
4.7 Entering Characters using the Keyboard.............................................................................. 4-8
6
7
8
9
10
11
12
13
Chapter 5 Setting the Vertical and Horizontal Axes
5.1 Turning Display of Input Signal Waveforms ON/OFF ............................................................ 5-1
5.2 Setting the Input Coupling ....................................................................................................5-2
5.3 Setting the Probe Attenuation............................................................................................... 5-4
5.4 Inverting a Waveform ............................................................................................................ 5-5
5.5 Setting the Vertical Sensitivity .............................................................................................. 5-6
5.6 Changing the Waveform’s Vertical Position........................................................................... 5-7
5.7 Selecting the Timebase ........................................................................................................ 5-8
5.8 Setting the Time Axis..........................................................................................................5-10
5.9 Changing the Waveform’s Horizontal Position....................................................................5-12
IM 701530-01E
14
15
16
App
Index
9
Page 11

Contents
Chapter 6 Activating a Trigger
6.1 Relationship between Trigger Type and Trigger Source/Slope/Level ....................................6-1
6.2 Setting the Edge Trigger .......................................................................................................6-2
6.3 Setting the Window Trigger...................................................................................................6-4
6.4 Setting the TV Trigger ........................................................................................................... 6-5
6.5 Setting the OR Trigger (Optional) ......................................................................................... 6-8
6.6 Setting the Pattern Trigger (Optional) ...................................................................................6-9
6.7 Setting the Width Trigger (Optional).................................................................................... 6-11
6.8 Setting the Trigger Mode..................................................................................................... 6-13
6.9 Setting the Action-On Trigger ............................................................................................. 6-15
6.10 Setting the Trigger Coupling and HF Rejection................................................................... 6-17
6.11 Changing the Trigger Position............................................................................................. 6-18
6.12 Setting the Trigger Delay ....................................................................................................6-19
6.13 Setting the Hold-off Time .................................................................................................... 6-20
Chapter 7 Changing Acquisition and Display Conditions
7.1 Selecting Acquisition Mode, Sampling Mode, and Record Length for DL1540CL................ 7-1
7.2 Setting the Input Filter .......................................................................................................... 7-3
7.3 Zooming the Waveform.........................................................................................................7-4
7.4 Acquiring Waveforms using the Sequential Store Function.................................................. 7-7
7.5 Using the History Memory Function ..................................................................................... 7-9
7.6 Changing the area for displaying the waveform..................................................................7-11
7.7 Changing the Interpolation Settings ................................................................................... 7-12
7.8 Displaying an Accumulated Waveform ............................................................................... 7-13
7.9 Displaying an X-Y Waveform ..............................................................................................7-15
7.10 Changing the Graticule, Scale and % Marker Settings ...................................................... 7-16
7.11 Turning the Waveform Information Display ON/OFF........................................................... 7-17
7.12 Changing the Screen Intensity ........................................................................................... 7-18
Chapter 8 Analyzing Waveforms
8.1 Measuring a V-T Waveform using Cursors ........................................................................... 8-1
8.2 Measuring an X-Y Waveform using Cursors......................................................................... 8-6
8.3 Measuring Waveform Parameters Automatically .................................................................. 8-8
8.4 Using the Linear Scaling Function ...................................................................................... 8-16
8.5 Performing Waveform Math (Addition, Subtraction and Multiplication)...............................8-18
8.6 Displaying the Power Spectrum (Performing FFT Computation) ........................................ 8-20
8.7 Measuring the Power Spectrum using Cursors .................................................................. 8-21
Chapter 9 Performing a GO/NO-GO Action
9.1 Judging using a Waveform Zone .......................................................................................... 9-1
9.2 Judging using Measured Values of Waveform Parameters................................................... 9-8
9.3 Using the GO/NO-GO Signal Output Function ................................................................... 9-13
Chapter 10 Outputting Displayed Waveforms and Setting Parameters to the Printer/Plotter
10.1 Loading a Chart in the Optional Built-in Printer .................................................................. 10-1
10.2 Printing Waveforms and Additional Information using the Optional Built-in Printer ............ 10-3
10.3 Real-time Printing using the Optional Built-in Printer ......................................................... 10-6
10.4 Connecting an External Plotter ........................................................................................... 10-7
10.5 Printing Displayed Waveforms and Additional Information using an External Plotter ......... 10-8
10.6 Entering a Comment ........................................................................................................ 10-10
10.7 Printing the Screen Image to an External Printer ............................................................. 10-11
10
IM 701530-01E
Page 12

Chapter 11 Storing and Recalling Data from the Internal Memory
11.1 Storing and Recalling Displayed Waveforms ...................................................................... 11-1
11.2 Storing and Recalling Setting Parameters.......................................................................... 11-3
Chapter 12 Saving and Loading Data from a Flopply Disk
12.1 Floppy Disks ....................................................................................................................... 12-1
12.2 Formatting a Floppy Disk.................................................................................................... 12-2
12.3 Saving and Loading Waveform Data ..................................................................................12-4
12.4 Saving and Loading Setting Parameters ............................................................................ 12-9
12.5 Saving Screen Image Data............................................................................................... 12-11
12.6 Deleting and Protecting Saved Data ................................................................................ 12-14
Chapter 13 Saving and Loading Data from the SCSI Device or the Internal Hard Disk
13.1 Connecting a SCSI Device ................................................................................................. 13-1
13.2 About the Internal Hard Disk (for /C8 option only).............................................................. 13-2
13.3 Selecting the SCSI Device or the Internal Hard Disk ......................................................... 13-3
13.4 Formatting the Media.......................................................................................................... 13-4
13.5 Saving and Loading Waveform Data ..................................................................................13-6
13.6 Saving and Loading Setting Parameters .......................................................................... 13-11
13.7 Saving Screen Image Data............................................................................................... 13-13
13.8 Deleting and Protecting Saved Data ................................................................................ 13-17
13.9 Changing the SCSI ID Number (on Models with the Internal Hard Disk) .........................13-19
13.10Copying the Data Saved on the Internal Hard Disk (option) to the Floppy Disk ...............13-20
13.11Connecting a PC to the DL1540CL /C8............................................................................ 13-21
Contents
1
2
3
4
5
6
7
8
Chapter 14 Other Operations
14.1 Using a Trigger Output Signal.............................................................................................14-1
14.2 Downloading Waveform Data to an AG Arbitrary Waveform Generator ............................. 14-2
14.3 Checking the System Condition ......................................................................................... 14-3
14.4 Adjusting the Printer Density ..............................................................................................14-4
14.5 Using a Video Signal Output (VIDEO OUT) .......................................................................14-5
14.6 Setting the Brightness of the LCD ......................................................................................14-6
Chapter 15 Troubleshooting, Maintenance and Inspection
15.1 Troubleshooting ..................................................................................................................15-1
15.2 Error Messages and Corrective Actions ............................................................................. 15-2
15.3 Self Test.............................................................................................................................. 15-6
15.4 Replacing the Power Supply Fuse...................................................................................... 15-7
15.5 Recommended Parts for Replacement .............................................................................. 15-8
Chapter 16 Specifications
16.1 Input Section....................................................................................................................... 16-1
16.2 Trigger Section....................................................................................................................16-2
16.3 Time Axis ............................................................................................................................16-3
16.4 Display ................................................................................................................................16-3
16.5 Functions ............................................................................................................................ 16-4
16.6 Rear Panel Input/Output Section ........................................................................................16-5
16.7 Communication Interface.................................................................................................... 16-6
16.8 Built-in Printer (optional) ..................................................................................................... 16-7
16.9 Built-in Floppy Disk Drive ................................................................................................... 16-7
16.10Internal Hard Disk (for /C8 option)......................................................................................16-7
16.11General Specifications........................................................................................................ 16-8
16.12External Dimensions ........................................................................................................ 16-10
9
10
11
12
13
14
15
16
App
Index
IM 701530-01E
11
Page 13

Contents
Appendix
Index
Appendix 1 Menu Map...............................................................................................................App-1
Appendix 2 Relationship between the Time Axis Setting, Sample Rate and Record Length (for
DL1540C) ..................................................................................................................................App-2
Appendix 3 Relationship between the Time Axis Setting, Sample Rate and Record Length (for
DL1540CL) ................................................................................................................................App-5
Appendix 4 How to Calculate the Area of a Waveform ............................................................App-11
Appendix 5 Output Data Format used when Saving Waveform Data (Example DL1540CL) ..App-12
12
IM 701530-01E
Page 14

Chapter 1 Functions
1.1 System Configuration and Block Diagram
System Configuration
1
Functions
Block Diagram
CH1
CH2
CH3
CH4
External trigger input/
External clock input
HP-GL plotter
Hard copy
Set-up information list
YOKOGAWA AG series
arbitrary waveform generator
Arbitrary waveform output
Personal computer
Remote control
Data analysis
Vertical control circuit
Input coupling
circuit
Data transfer
Pre-
ATT
amplifier
Front end
control circuit
External printer
Hard copy
Communication
SCSI device
Saving / loading data
Multiplex circuit
A/D
Timebase
Trigger
circuit
Object to be measured
Data
processing circuit
Acquisition
control circuit
Built-in printer
Hard copy
Set-up information list
GO/NO-GO judgement output
Trigger output
RGB video signal output
External clock input
/ trigger input
Signal input
Acquisition memory
Display
buffer
Display
control
circuit
CPU
Floppy disk
Saving / loading data
Color LCD display
Keyboard
Printer
GP-IB
FDD
Half pitch interface
connector
(included the output
for GO/NO-GO
judgement)
Trigger output
(Optional)
IM 701530-01E
Signal Flow
A signal input via the input terminal is sent to the vertical control circuit. The vertical
control circuit consists of an input coupling circuit, attenuator (ATT) and preamplifier, and it adjusts the voltage and amplitude of the signal according to the
input coupling, probe attenuation, vertical sensitivity and
offset voltage settings, before sending the signal to the multiplex circuit. The signal
will then be sent to the A/D converter matching settings such as time axis and so
on. The A/D converter samples the signal at a sample rate of 100 MS/s to convert it
to digital data. The digital data is then stored in the acquisition memory by the data
processing circuit at a sample rate which matches the time axis setting.
The data sent out from the acquisition memory by the data processing circuit is then
processed according to the invert waveform and averaging settings, then subjected
to interpolation and P-P compression (to obtain the maximum/minimum values
within each specified intervals), then converted into display data by the display
control circuit and finally memorized in the wavefor m display buffer.
The data read from the waveform display buffer and non-waveform display data
read from the graphic display buffer are combined, and the combined image is
displayed on the color LCD display.
1-1
Page 15
1.2 Setting the Vertical and Horizontal Axes
Vertical
control
circuit
Input terminal
Input coupling ≡ page 5-2. ≡
When you only want to observe the amplitude of an alternating current signal, or
when you just want to observe the signal relative to a given reference voltage,
eliminating the direct current components from the input signal makes observation
easier. You may also want to check the ground level or observe the input signal
waveform with the offset voltage removed. In this case, you can change the input
coupling setting. This will switch the coupling method, which determines how the
input signal is input to the vertical control circuit (voltage axis).
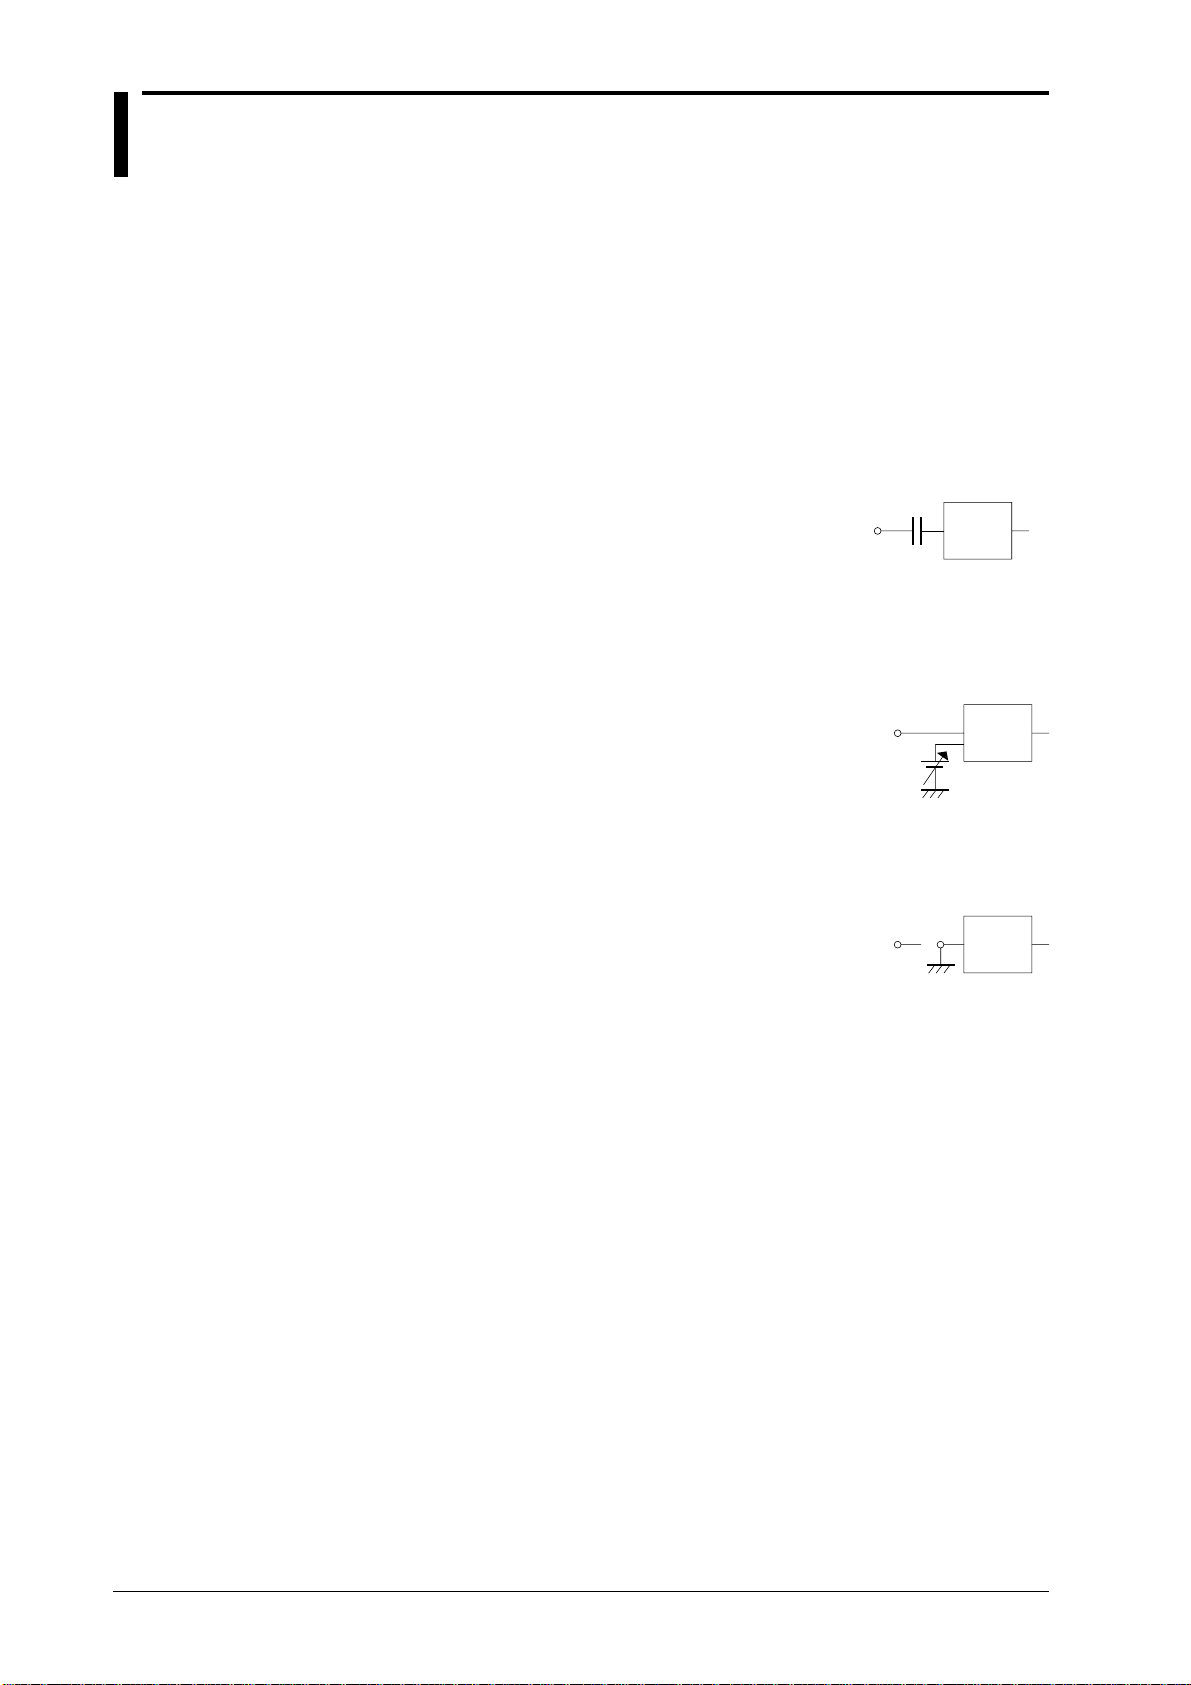
The input coupling method can be chosen from the following.
AC
The input signal is sent through a capacitor to the
attenuator in the vertical control circuit. This method
can be used when you just want to observe the
amplitude of the alternating current signal,
eliminating the DC components from the input
signal, or when you want to observe the signal
relative to a given reference voltage.
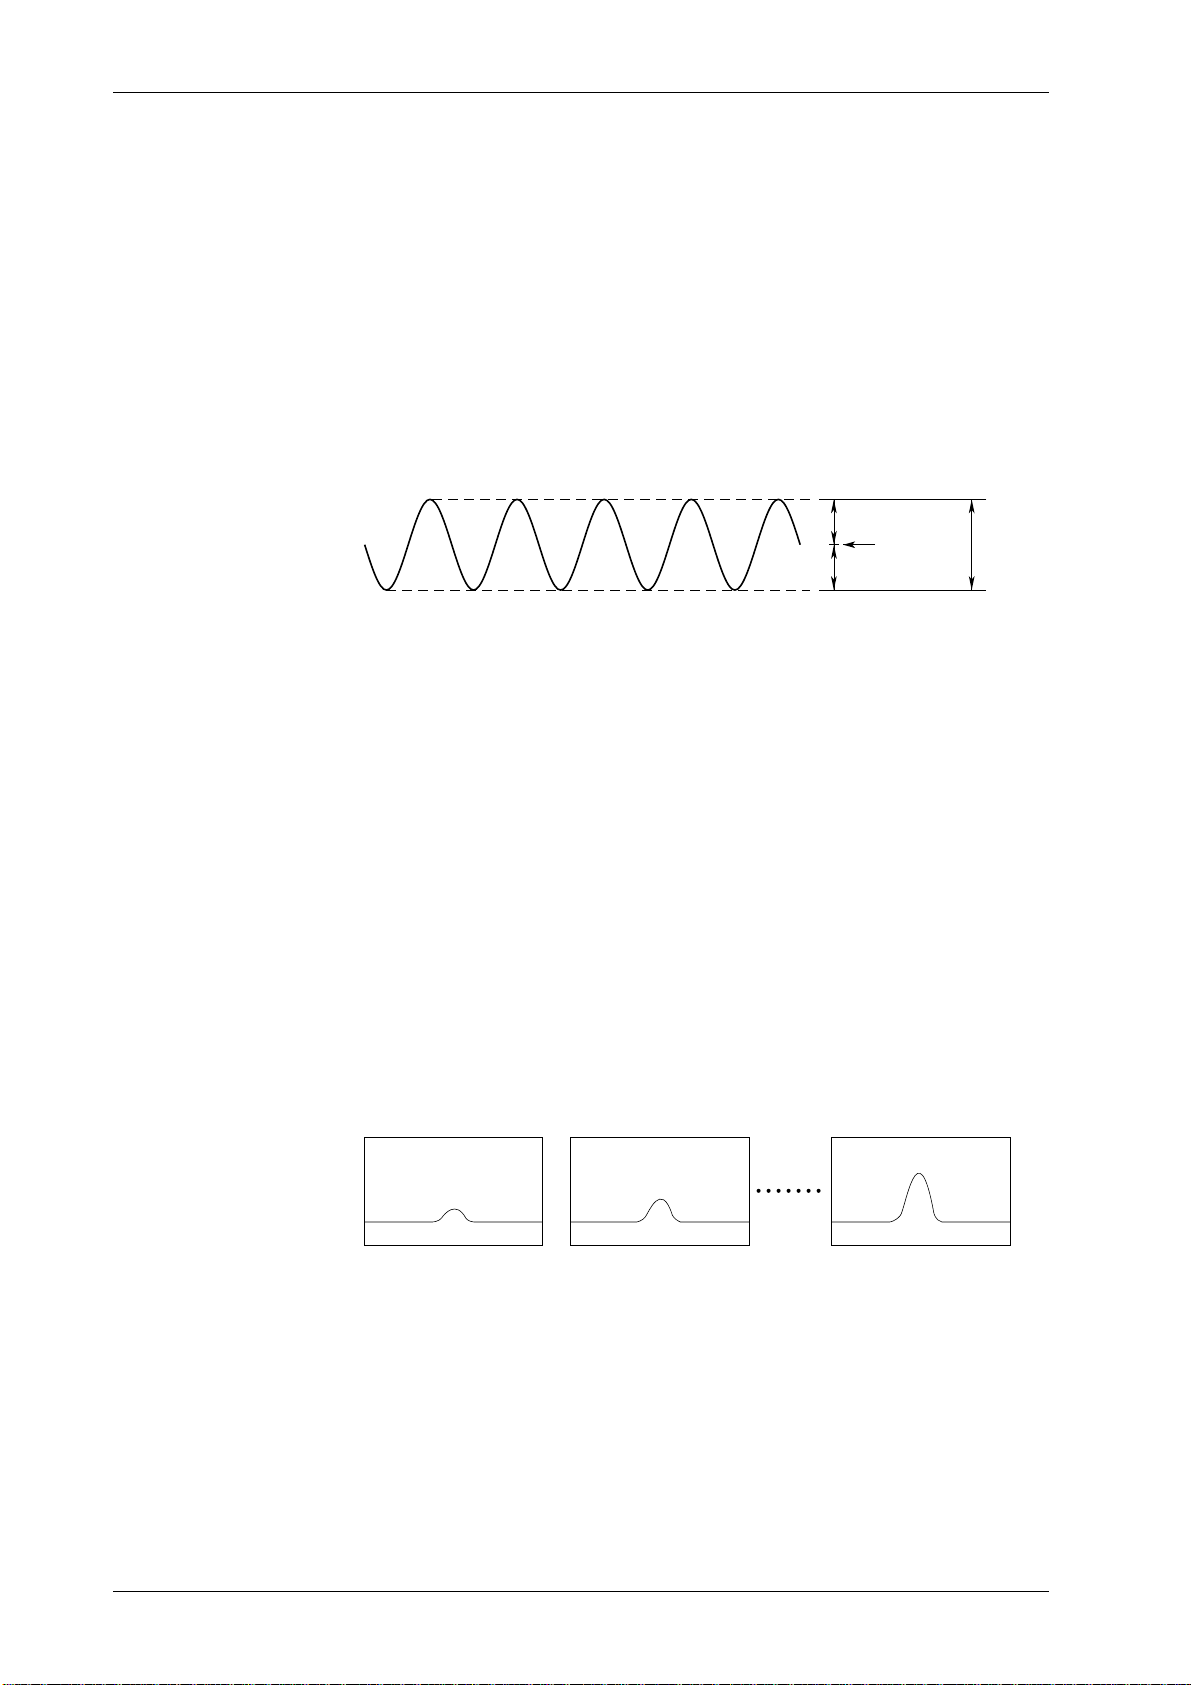
DC
The input signal is sent directly to the attenuator in
the vertical control circuit.
This method can be used when you want to observe
both the DC and AC components of the vertical
input signal. This method also enables observation
of the input signal with the offset voltage (DC
voltage) eliminated. This function is useful when you
want to observe ripples in a DC output signal.
Input terminal
Vertical
control
circuit
GND
The ground signal, not the input signal, is connected
to the attenuator in the vertical control circuit. This
method enables observation of the ground level on
the screen.
Probe Attenuation ≡ page 5-4. ≡
A probe is usually used to connect the circuit to be measured to an input terminal.
Use of a probe provides the following advantages.
• the voltage and current of the circuit to be measured are not disturbed;
• a signal can be input without distortion;
• the measurement voltage range of the oscilloscope can be widened.
A 150 MHz passive probe is supplied with the instrument. The probe attenuates the
input signal by 1/10. When a probe is used, the probe attenuation must match the
instrument’s attenuation setting so that the input voltage can be measured directly.
Set the instrument’s attenuation to 10:1 if the supplied probe is to be used.
In addition to 10:1, attenuations of 1:1, 100:1 and 1000:1 are provided. When you
use a probe other than the one supplied with the instrument, set the instrument’s
attenuation so that it matches the probe’s attenuation.
Input terminal
Vertical
control
circuit
1-2
IM 701530-01E
Page 16
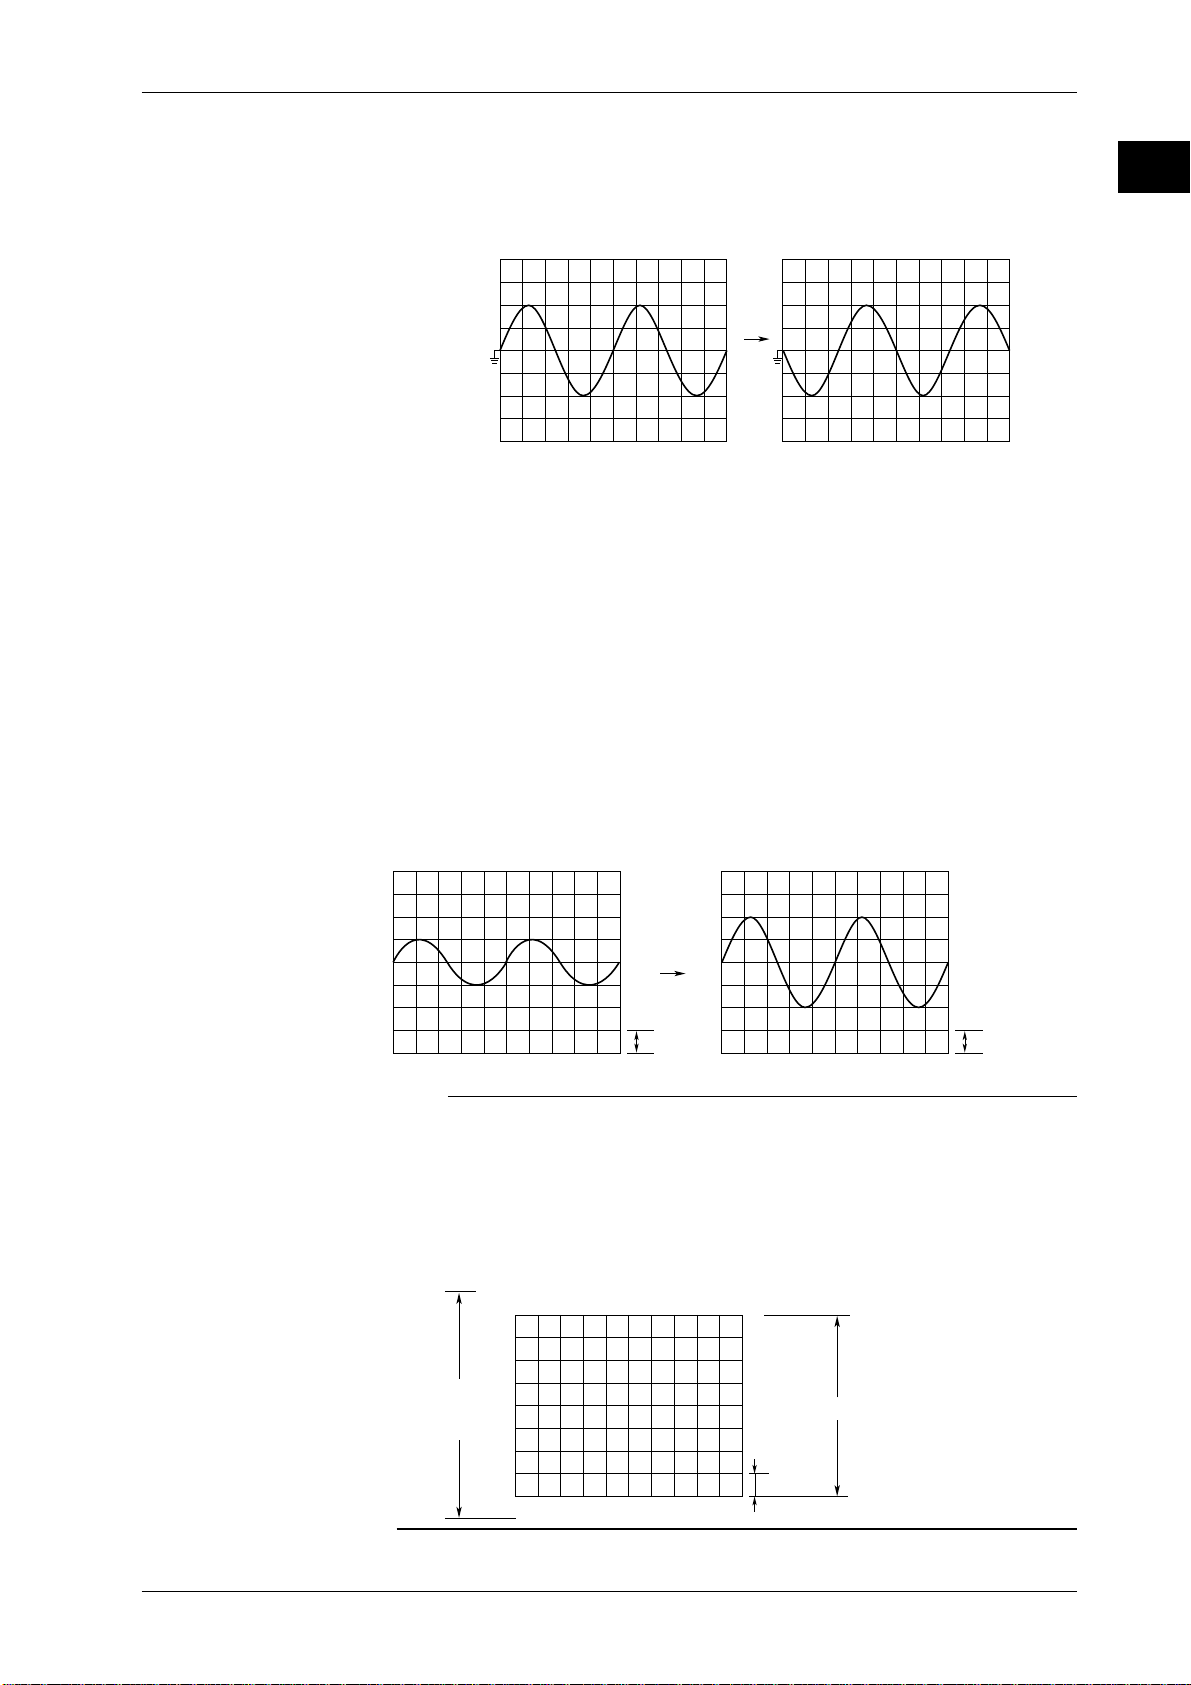
Inverted Wa veform Display ≡ page 5-5. ≡
1div=1V 1div=500mV
When V/div is switched from 1 V/div to 500 mV/div
The voltage axis is inverted about the ground as shown below, and the wavefor m is
displayed. In other words, + voltage is converted to – voltage and – voltage to +
voltage.
Original waveform (not inverted)
Ground level
Vertical sensitivity ≡ page 5-6. ≡
The V/div (vertical sensitivity) setting is used to adjust the amplitude of the
displayed waveform so that the waveform can be observed easily.
The V/div setting is made by setting the voltage value per division on the screen
grid. The set-up value for the vertical sensitivity is displayed according to the
probe’s attenuation setting.
The V/div setting can be either “VAR” or “CAL”. In case of the “CAL” setting,
attenuators with different attenuation rates are used to change the ver tical
sensitivity, which then changes in steps of 1 V/div → 2 V/div → 5 V/div.
In case of the “VAR” setting, fine adjustment of the sensitivity set under the “CAL”
setting can be performed. The setting range is approximately 0.4 to 2.5 times the
value of the “CAL” setting. Digital data are taken from the “CAL” setting and after
calculating they will be displayed at the “VAR” setting. The measurement accuracy
of the voltage axis using the “VAR” setting however, is the same as the
measurement accuracy set at the “CAL” setting.
1.2 Setting the Vertical and Horizontal Axes
1
Functions
Inverted waveform
Note
Vertical sensitivity setting and measurement resolution
For accurate voltage measurement, set the V/div so that the maximum amplitude of the displayed
waveform is displayed using the full height of the screen (8 divisions).
The instrument uses an 8-bit A/D converter to sample the input signal with a resolution of 255
levels. When displaying a waveform, 25 levels are used for each division of the grid. Thus, in
normal display mode (not expansion display mode), the full range (255 levels) of the A/D converter
is equivalent to 10.24 div.
From this, it can be understood that increasing the V/div setting decreases the voltage per div
(25 levels), thereby increasing the display (measurement) resolution.
A/D converter
full range:
255 levels
IM 701530-01E
Display range: 200 levels
25 levels
1-3
Page 17

1.2 Setting the Vertical and Horizontal Axes
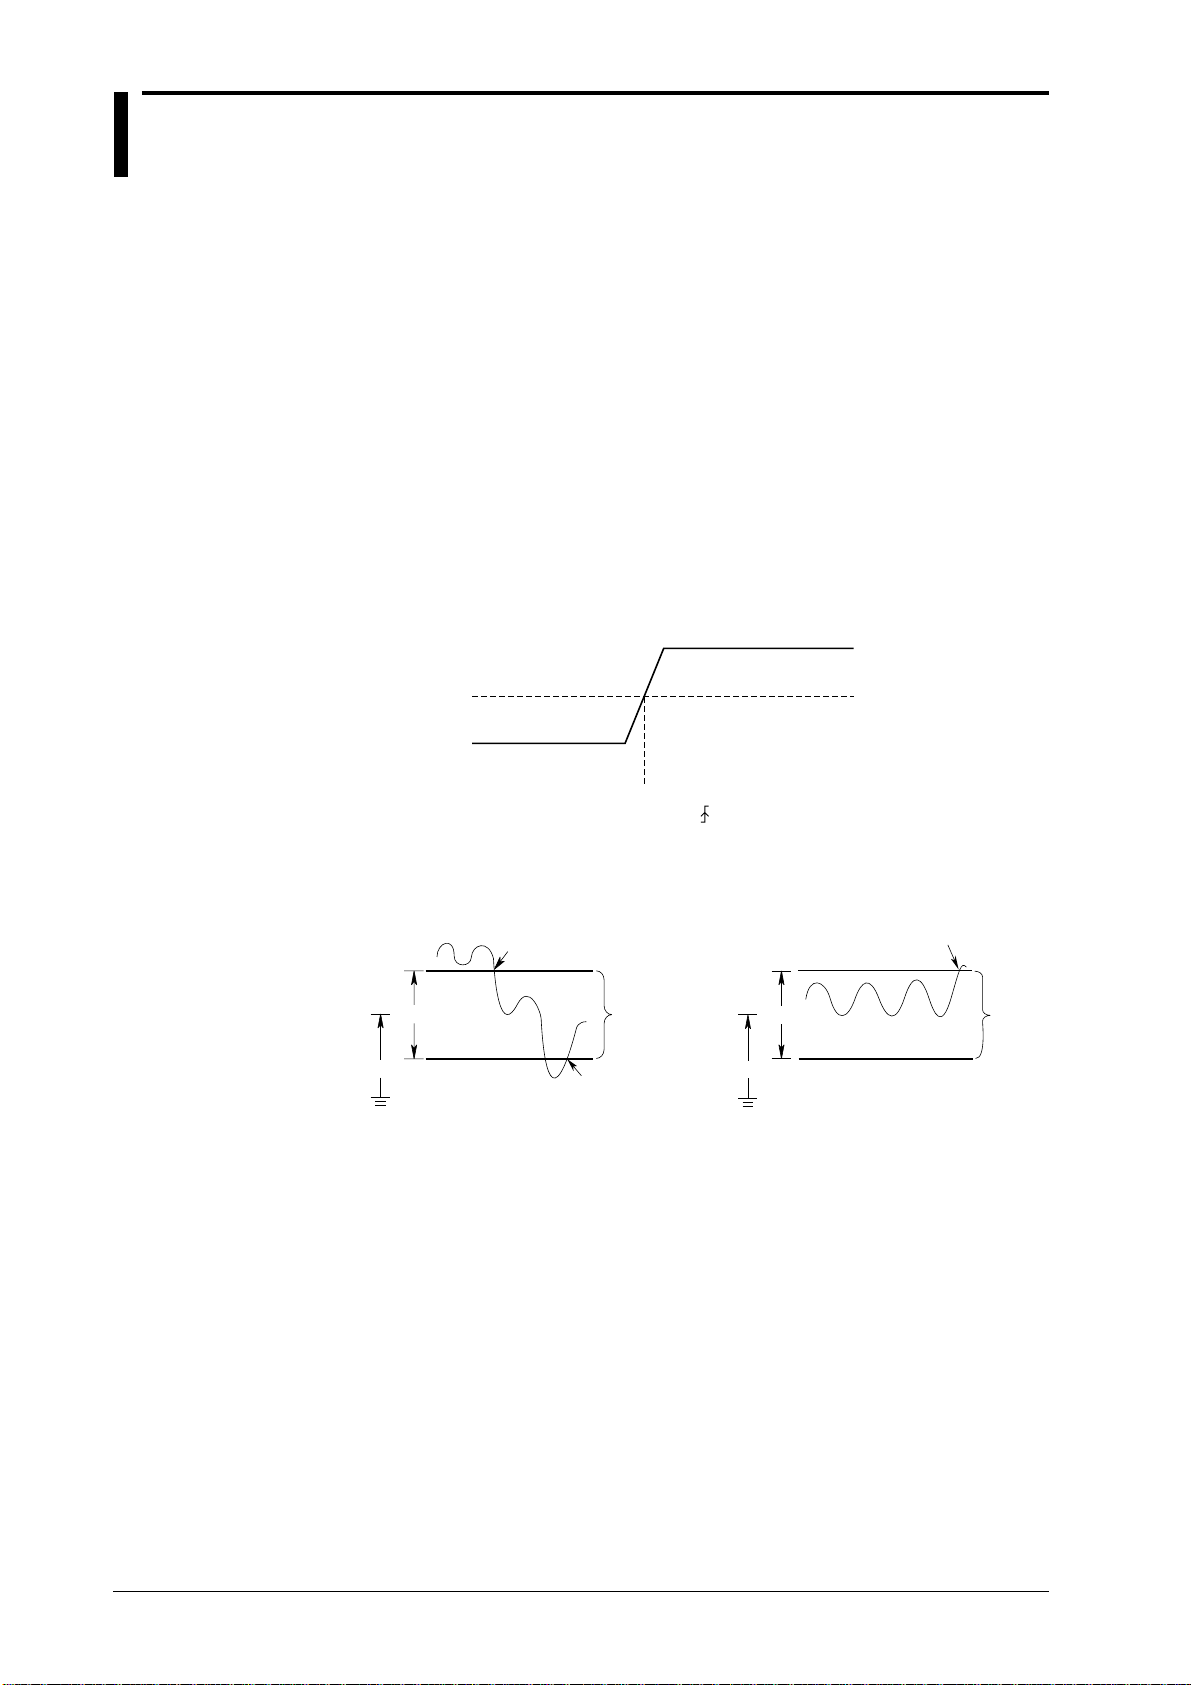
Vertical Position of the Waveform ≡ page 5-7. ≡
Since a total of four input waveforms can be displayed, they may overlap each
other, making observation difficult. In this case, the wavefor ms can be moved in the
vertical direction so that they can be observed more easily.
Furthermore, full scale in the vertical direction is eight divisions of the grid as
mentioned earlier, and the voltage display range is eight times the vertical
sensitivity setting (voltage value per division). Thus, increasing the vertical
sensitivity results in a narrower voltage display range. However, this function allows
the ground level (0 V level) to be shifted up and down up to four divisions from the
center of the waveform frame, so that observation of waveforms is possible over the
entire voltage display range (V/div value x 16 divisions). This is because the input
voltage range of the A/D converter shifts due to the change in the frame position.
However, when acquisition is stopped and displayed waveforms are not updated,
the input voltage range does not shift even if the frame position is moved. As a
result, acquisition within a voltage display range exceeding 10.24 divisions (that is,
equivalent to the full range of the A/D converter) becomes impossible, thereby
resulting in a discontinuous waveform
as shown on the right.
Position range
= 16 divisions
Time Axis ≡ pages 5-8 and 5-10. ≡
Selection of the timebase
With the default settings, sampling timing is controlled by the clock signal output
from the timebase circuit of the instrument (refer to the Block Diagram, page 1-1).
The sampling timing can be controlled by an external clock signal instead of the
clock signal from the timebase circuit.
For DL1540C/DL1540CL, an external clock signal can be input to the CLOCK IN
terminal on the rear panel or to the CH4 input terminal. When an external clock is
input to the CLOCK IN terminal, the clock must be of TTL level, however up to four
waveforms can be observed at the same time. On the other hand, if an external
clock is input to the input terminal, the clock can be of the same signal level normal
input signals. This also allows you to check the clock signal waveform before
observing the desired waveform.
This external clock function is useful when you are observing a signal whose period varies or
when you are observing a waveform by synchronizing it with the clock signal to be
measured.
CH1
Display area
= 8 divisions
A/D
1-4
CH4
EXT CLOCK IN
Internal timebase
IM 701530-01E
Page 18
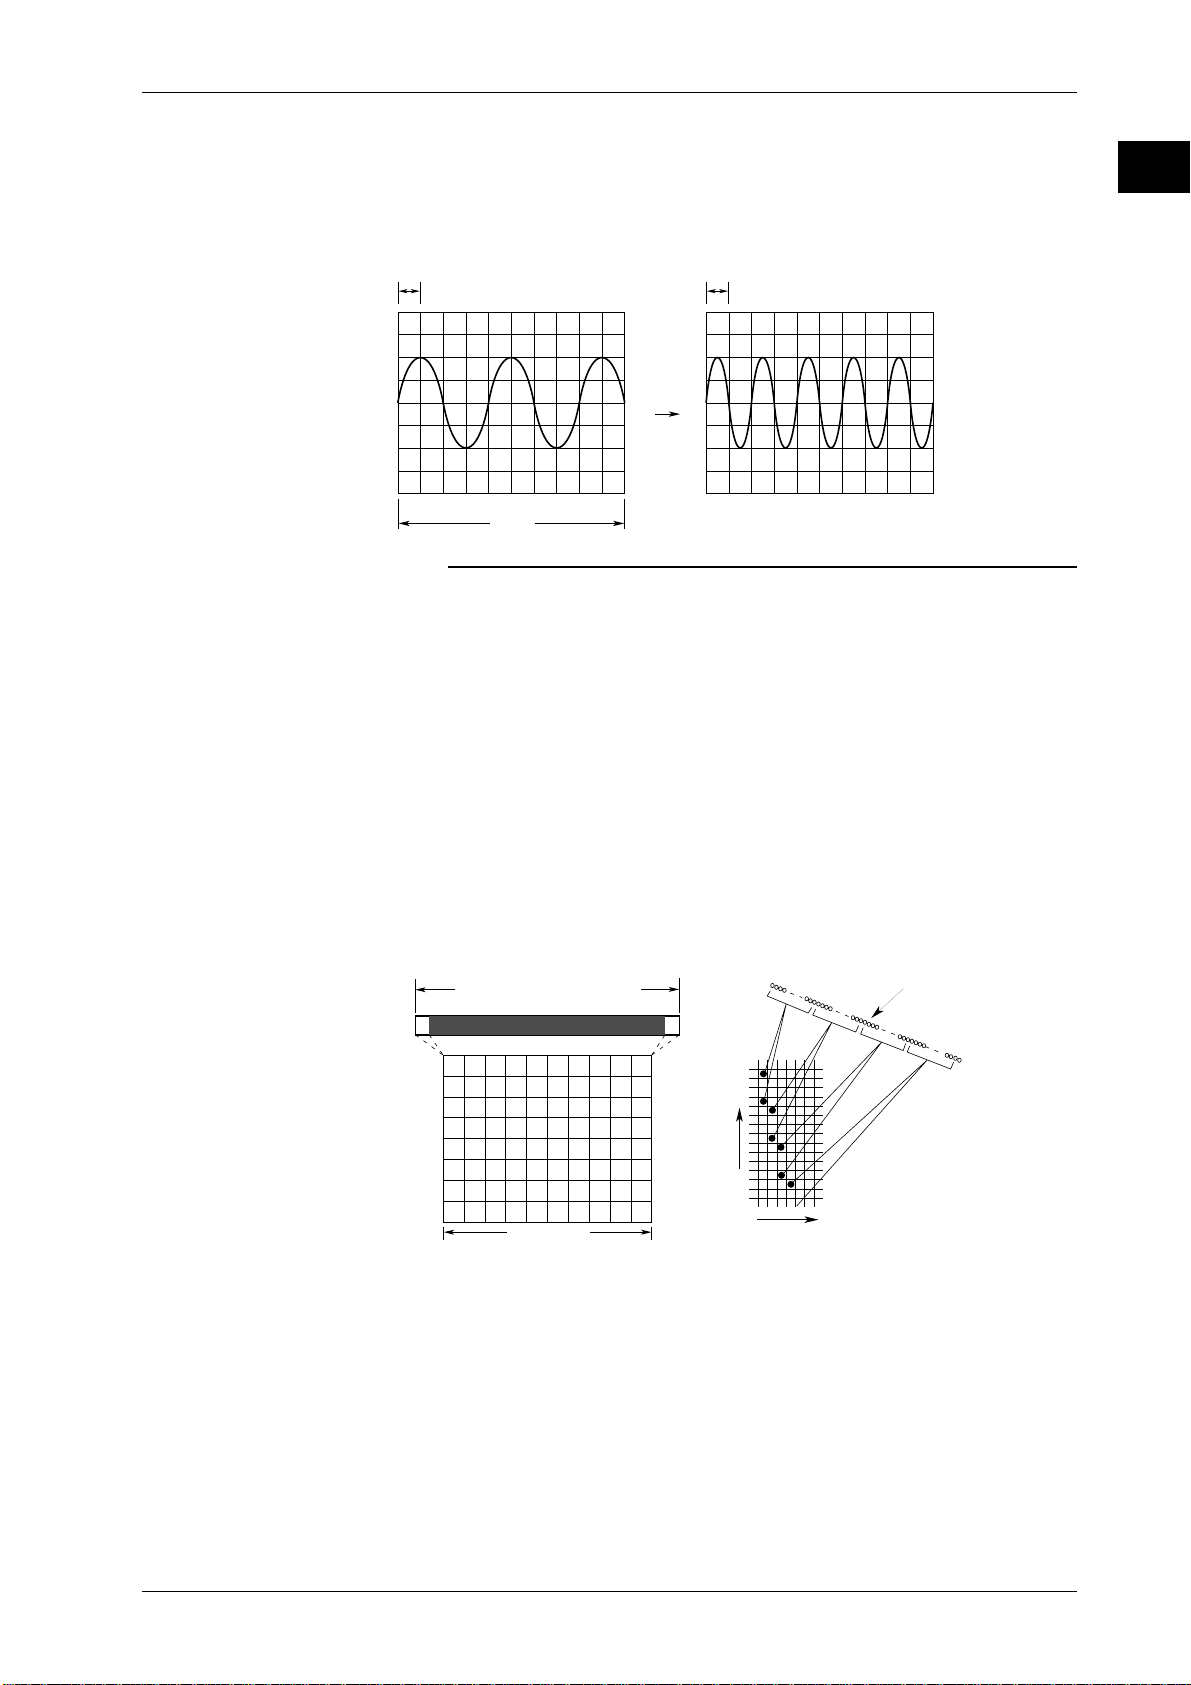
1div=500µs
10div
1div=1ms
501points
0 500
Sampling data
Time axis
Display record length
Display record length
Record length of
acquisition memory
P-P
compression
Voltage axis
1.2 Setting the Vertical and Horizontal Axes
Setting the time axis
When using the internal clock, set the time axis scale as a time duration per division
of the grid (T/div). The setting range is 2 ns/div to 50 s/div. The time range in which
waveform is displayed is “time axis setting x 10”, as the display range along the
horizontal axis is 10 divisions.
Note
Display of time axis direction
The sampled data is read into the acquisition memory, and a waveform is displayed based on
this data. The number of data stored into the acquisition memory differs depending on settings
such as time axis settings, trigger mode, and acquisition mode.
The number of display points in the time axis direction on a 10-div screen is 501 points (i.e. 50
points per division). Thus, the number of displayed points and record length might slightly differ
and this will be treated as follows (for more details on the relation between time axis, trigger
mode, acquisition mode, record length of acquisition memory and displayed record length,
refer to Appendix 2).
• When the record length is too long
The data is displayed in the time axis direction after first being compressed per one division.
Depending on the time axis settings, there will be times when all data of full record length of the
acquisition memory can be displayed, and times when the data can only be displayed partially.
The part which does not appear on your screen, can be viewed by moving the horizontal position
of the waveform (refer to page 1-7).
• When the record length is too short
The missing data will be interpolated (refer to page 1-15).
* Record length is expressed in units of words. One word refers to one point of sampled data.
For example, 10 KW means 10020 points. (K represents 1002.)
1
Functions
IM 701530-01E
Relationship between the time axis setting, sample rate and record length
If you change the time axis setting, the sample rate and the record length of the acquisition
memory changes too. This is because a linear relation exists between “record length of the
acquisition memory” and “time required for acquisition of all data x sample rate”. For more
detailed information, refer to Appendix 2/Appendix 3.
1-5
Page 19

1.2 Setting the Vertical and Horizontal Axes
Relationship between time axis setting and sampling mode
The sampling method (sampling mode) for an input signal changes according to the time axis
setting as described hereafter.
For T/div settings in the range between 5 µs/div and 100 ns/div, it is possible to switch real-time
sampling area to repetitive sampling area. But, for DL1540CL, note that the time axis range
over which this feature is actually available will vary according to the maximum displayable
record length, as shown in Appendix 3.
• “50s/div to 100 ns/div” → Real-time sampling mode
When changing the time axis settings, the sample rate will change and sampling can be performed
at a sample rate of maximum 200 MS/s (or 100 MS/s when ch. 3 and 4 are also used). The input
signal is sampled sequentially, and data is stored in the acquisition memory.
In this mode, the waveform can only be displayed correctly at frequencies up to half the sample
rate, due to Nyquist’s theorem*. Sample rate is expressed in S/s (number of samples per second).
Thus, this mode is suitable for observation of a waveform which fluctuates more slowly than the
sample rate.
* If the sample rate is later than the frequency of the input signal, high frequency components
will be lost. In this case, a phenomenon in which high frequency components change to lower
frequency components occurs, due to Nyquist’s theorem. This phenomenon is called aliasing.
Aliasing signal Input signal Sampling point
• 50 ns/div to 5 ns/div → Repetitive sampling mode
If T/div is set so that the sample rate exceeds 200 MS/s (or 100 MS/s), the sampling mode is
switched to the repetitive sampling mode automatically. In this mode, sampling is performed
only once for each cycle of a repetitive signal and several cycles are needed to form a waveform.
It appears as if the signal is sampled at a sample rate higher than the actual rate. An apparent
sample rate of up to 20 GS/s can be used. However, the maximum observable frequency is 150
MHz due to the instrument’s frequency characteristics. With DL1540CL, it is not possible to set
T/div if the maximum display record length is 400 KW or more.
There are two repetitive sampling methods: sequential sampling, in which a signal is sampled
sequentially at a fixed interval, and random sampling, in which a signal is sampled at random to
produce a waveform. This instrument uses a random sampling method which also enables
observation of the waveform up to the trigger point.
Time axis setting and roll mode display
If trigger mode (described on page 1-10) is set to auto-mode or auto-level mode, and T/div is
set between 50 ms/div and 50 s/div, the display will not be updated by trigger anymore (update
mode), but the mode will switch to roll mode when new data is acquired. In roll mode, the oldest
data is deleted, and the waveform shifts from right to left on the screen. A waveform can be
observed in the same way as it is recorded on a pen recorder. This mode is useful when you are
observing a signal which repeats or which fluctuates slowly. This mode is also useful when you
want to detect glitches (fast spikes on a waveform) which occur intermittently. With DL1540CL,
the time axis range for roll mode varies depending on the maximum display record length.
Refer to Appendix 3.
* Roll mode is also turned on when trigger mode is switched to single (short/long) mode, but
the displayed waveform stops when a trigger is activated since trigger setting is effective in
single (short/ long) mode.
1-6
IM 701530-01E
Page 20
Displayed range before
moving (+5 div)
Displayed range
after moving to –5 div
Displayed range
after moving to 0 div
Center of the
waveform display
moves to 0 div
Center of the
waveform display
moves to –5 div
Display record length
Record length of acquisition memory
1.2 Setting the Vertical and Horizontal Axes
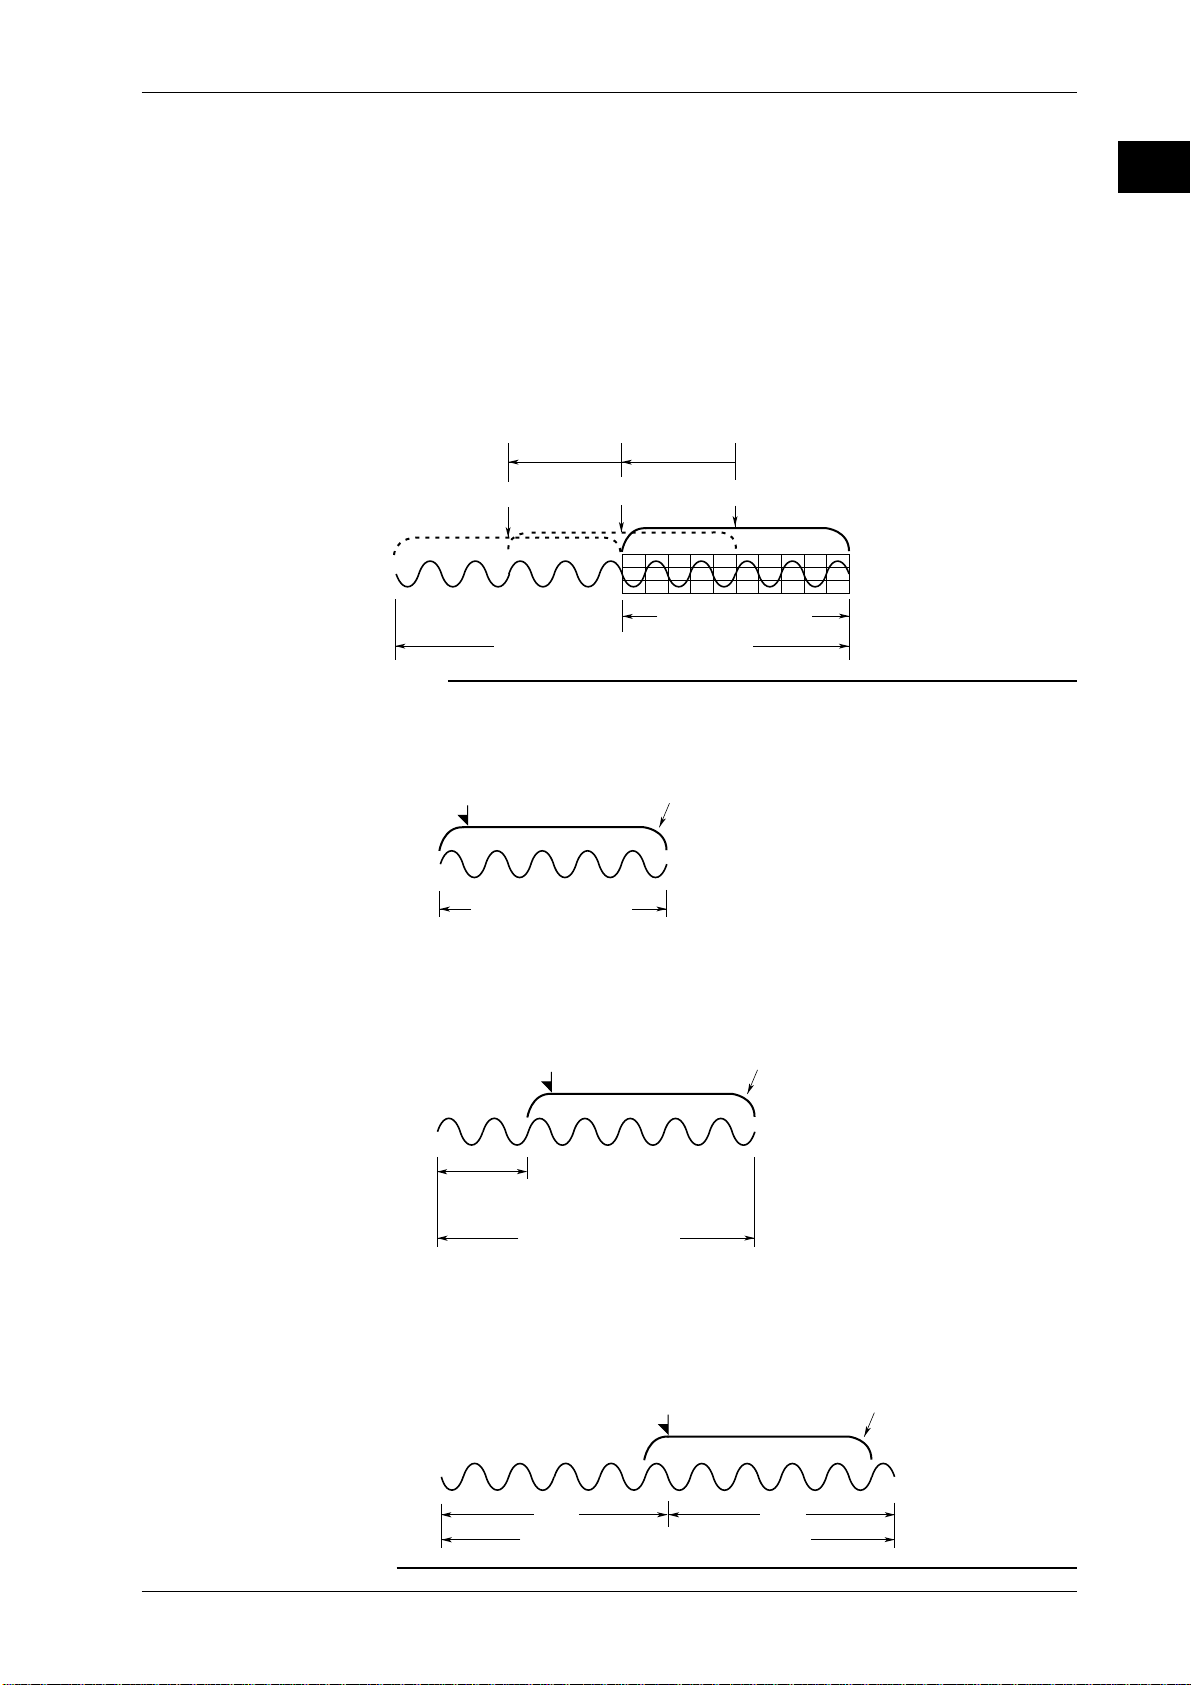
Horizontal Position of the Waveform ≡ page 5-12 ≡
In case you acquired more data than can be displayed on one (10 div) screen (i.e.
the record length* of the acquisition memory is longer than the record length of one
screen), then you can view the data by moving the display position in the time axis
direction. This might be the case when using the roll mode display or when the
trigger mode is set to single long mode (for DL1540C). The displayed waveform can
be moved over a span of +/- 5 div from the center of the screen.
* For more details on the relation between record length of acquisition memory and
displayed record length, refer to page 1-5, Appendix 2 and Appendix 3.
Moving the horizontal position
In roll mode, the display position can be moved after data acquisition is stopped. If
the instrument is in a mode other than roll mode, the display position can be moved
even during data acquisition. The following example shows how the display
position is moved in roll mode.
Note
Relationship between the display range on the screen and the display record length,
acquisition memory’s record length and trigger position (see page 1-11) is given below.
• Display range on the screen = Acquisition memory’s record length
The entire waveform data saved in the acquisition memory can be displayed without the
need for moving the horizontal position of the waveform.
Trigger position
1
Functions
Displayed range:10 div
(Displayed record length)
Record length of
acquisition memory
• Display range on the screen x 2 > Acquisition memory’s record length > Display range on the
screen
Waveform datas which are out of the display range on the screen are acquired in the
acquisition memory (up to 10 div) located before (on the left of) the trigger position. The
part which is out of the display range on the screen can be displayed by adjusting the
horizontal position of the waveform as described earlier.
Trigger position
Waveform data exceeding
the screen display range
Record length of
acquisition memory
Displayed range:10 div
(Displayed record length)
• Display range on the screen x 2 = Acquisition memory’s record length > Display range on the
screen
When the length of the waveform data acquired in the acquisition memory located before (on the left of) the
trigger position exceeds 10 div, waveform data will be acquired in the acquisition memory located after (on
the right of) the trigger position. Waveform data of up to 20 div is acquired. The part which is out of the
display range on the screen can be displayed by adjusting the horizontal position of the waveform as
described earlier.
Trigger position
Displayed range:10 div
(Displayed record length)
IM 701530-01E
10 div
10 div
Record length of acquisition memory
1-7
Page 21
1.3 Setting a Trigger
Trigger level
A trigger is activated at this point if
"Rise" ( ) is selected.
Trigger source
WIDTH
trigger is activated
[OUT]
trigger is activated
[IN]
Window
Window
trigger is activated
CENTER
WIDTH
CENTER
Trigger Type / Trigger Source / Trigg er Level ≡ pages 6-1 to 6-11. ≡
Trigger type : Selects the type of trigger. The following types are available as
described below: Edge trigger, TV trigger and window trigger.
Furthermore, the OR trigger, pattern trigger and width trigger are
available as an option.
Trigger source : Selects the signal for the selected trigger type.
Trigger level : Sets the voltage level used to judge trigger conditions such as
trigger slope (rise/fall of a signal) and trigger state (high/low
level).
Edge trigger → page 6-2.
The edge trigger is the simplest type of trigger and uses a single trigger source to
activate a trigger. A trigger is activated when the trigger source exceeds (rises
above) or drops (falls) below the preset trigger level*.
In addition to input signals (CH1 to CH4), the external trigger input signal and the
commercial power supply signal can be used as a trigger source.
* “A trigger is activated” refers to the condition in which trigger conditions are satisfied and a
waveform is displayed.
Window T rigger → page 6-4.
A certain voltage range (window) is set and a trigger is activated when the trigger
source level enters this voltage range (IN) or exits from this voltage range (OUT).
TV Trig ger → page 6-5.
The TV trigger is used when you are observing a video signal, and is compatible
with NTSC, PAL and HDTV broadcasting systems.
1-8
IM 701530-01E
Page 22

1.3 Setting a Trigger
OR T rigger (option) → page 6-8.
Multiple trigger sources are selected, and a trigger is activated when one of the
trigger conditions set for each trigger source becomes true. Trigger conditions are
established by setting the trigger slope.
When CH1 = , CH2 =
CH1
CH2
1
Functions
Trigger
TriggerTrigger
Pattern trigger (option) → page 6-9.
Multiple trigger sources are selected, and a trigger is activated when all of the
trigger conditions set for each trigger source become true or false. Trigger
conditions are established by setting combinations of the state (High or Low) of
each trigger source.
Furthermore, one of the trigger sources can be used as the clock signal, and
triggering is synchronized with this clock signal.
Example: a trigger is activated
when CH1:L, CH2:L, CH3:L and CH4:L
CH1
CH2
CH3
CH4
CH1
LH L L L
CH2
CH3
CH4
L: Low level, H: High level
HHHHLLLL
H
HLL
Trigger is activated.
H
L
HLLH
IM 701530-01E
Width trigger (option) → page 6-11.
If the pulse width of a trigger source is narrower or wider than some specified time,
then a trigger is activated accordingly.
A trigger can also be activated by a single trigger source.
TW TW TW
Trigger is activated.
TW: Specified
pulse width
1-9
Page 23
Half the amplitude
Half the amplitude
Trigger level Amplitude
1.3 Setting a Trigger
Trigger Mode ≡ page 6-13. ≡
Conditions for updating displayed waveforms are set. The following six types of
trigger mode are available.
Auto-mode
Displayed waveforms are updated each time a trigger is activated within a specified
time (approximately 100 ms, referred to as the time-out period) and are updated
automatically after each time-out period.
Auto-level mode
Waveforms are displayed in the same way as in Auto-mode if a trigger is activated
within the time-out period. If no trigger is activated, the center value of the
amplitude of the trigger source (page 1-7) is detected and the trigger level is
changed automatically to this center value, then a (edge) trigger is activated to
update the displayed waveforms.
Normal mode
Displayed waveforms are updated only when a trigger is activated. Displayed
waveforms will not be updated if no trigger is activated.
Single (short) mode
When a trigger is activated, displayed waveforms are updated only once, then
acquisition stops. This mode is useful when you are observing a single-shot signal.
(Called single-shot mode for DL1540C, and single mode for DL1540CL)
Single long mode
As with the single (short) mode, when a trigger is activated, displayed waveforms are
updated only once, then acquisition stops. However, the length of acquired data is
longer in this mode (up to 120 K words). This mode is available only with DL1540C.
Single (N) mode
This mode is useful when using the sequential store function (refer to page 1-14).
Waveforms are acquired and stored in different memory areas each time a trigger is
activated, then acquisition stops, and the waveforms are displayed. Acquisition is
performed the specified number of times. Acquired waveforms can be displayed
together, or they can be displayed individually. This mode is useful when you want
to detect a sudden abnormality in a waveform.
1st acquisition 2nd acquisition Nth acquisition
Action-On T rigger ≡ page 6-15. ≡
The displayed waveform can be output to the optional built-in printer or saved to a
floppy disk each time a trigger is activated.
Trigger Coupling ≡ page 6-17. ≡
1-10
Input coupling can also be switched for trigger sources as it is for input signals.
Select the type of input coupling which is most suitable for the trigger source signal.
The following two types of input coupling are available for trigger source signals.
• DC : The trigger source signal is used as the trigger source without any process.
• AC : The trigger source signal is used as the trigger source after DC the content
has been removed from it. A trigger can always be activated if the trigger
level is set to 0 V as long as the signal’s amplitude is one division or more.
IM 701530-01E
Page 24

HF Rejection ≡ page 6-17. ≡
Input signal
Repetitive period: T
Trigger level
Trigger source
signal
t
Trigger signal restricted by hold-off time "t" (when "Rise" is selected as the trigger slope)
Set HF rejection to ON when you want to remove high frequencies exceeding 15
kHz from the trigger source. This prevents a trigger from being activated
unexpectedly due to high frequency noise.
Trigger Position ≡ page 6-18. ≡
The trigger position indicates which position of the waveform in the acquisition memory
will actually be displayed on the screen. The trigger position can be moved on the
display from the center (0 div) to +/-4 div, which enables observation of the waveform up
to the trigger point (the pre-trigger section). You can also set the trigger position in the
range of +/-5div in steps of 1/50 div. The trigger point refers to the point at which a
trigger is activated. In case the trigger delay (to be explained here after) is set to 0s, the
trigger point and the trigger position refer to the same location.
Observation of the waveform up to the trigger position is made possible by
constantly storing sampled data in the acquisition memory (i.e. removing the oldest
data each time new data is acquired), retaining data in the memory and displaying it
on the screen each time a trigger is activated.
Trigger position
setting range
1.3 Setting a Trigger
1
Functions
Pre-trigger range Post-trigger range
0 % 100 %
Trigger Delay ≡ page 6-19. ≡
Normally, the waveform around the trigger point is displayed. However the trigger
delay function enables display of a waveform which has been acquired after a
specified time (called the delay time) has elapsed following activation of a trigger.
Trigger point
Trigger Hold-off ≡ page 6-20. ≡
The trigger hold-off function temporarily stops detection of the next trigger once a
trigger has been activated. For example, when observing a pulse train signal, such
as a PCM code, display of the waveform can be synchronized with repetitive cycles;
or when using the history memory function, you may want to change the repetitive
period, as shown below.
Trigger position
Acquisition memory record length
T (trigger position)
Delay time
IM 701530-01E
1-11
Page 25

1.4 Setting the Acquisition and Display Conditions
Acquisition Modes ≡ page 7-1. ≡
When storing sampled data in the acquisition memory, it is possible to perform
processing on specified data and display the resultant waveform. The following data
processing methods are available.
Normal mode
In this mode, sampled data is stored in the acquisition memory without processing.
Envelope mode
In normal mode and averaging mode, the sample rate (the number of times data is
acquired per second in the acquisition memory) drops if T/div is increased (refer to
Appendix 2/Appendix 3). In envelope mode, the maximum and minimum values are
obtained at each acquisition of the data (sampled at 100 MS/s), then the maximum
and minimum values are stored as a pair in the acquisition memory (one pair takes
up 2 words of memory).
Envelope mode is useful when you want to avoid aliasing (page 1-6), since the
sample rate is kept high irrespective of the time axis setting (T/div). Furthermore,
envelope mode is also useful when you want to detect glitches (pulsing signals
which rise very fast) or display an envelope of a modulating signal.
Averaging mode
Averaging is a process in which waveforms are acquired repeatedly to obtain the
average of waveform data of the same timing (the same time in relation to the
trigger point).
When the trigger mode is not single mode, exponential averaging is performed on
the waveform data using the following equation, then the resultant waveform is
stored in the acquisition memory and displayed on screen. The attenuation constant
can be set between 2 and 256 (in steps of 2
Exponential averaging
An = {(N–1)An–1+Xn}
An
Xn
N
This averaging process is useful when you want to eliminate random noise.
Sampling Mode ≡ page 7-1. ≡
As explained earlier in “Relationship between the time axis setting and sampling
mode” (page 1-6), data sampling can be performed either in real-time or in
repetitive sampling mode depending on the T/div setting (for DL1540CL, the T/div
and maximum displayable record length). If T/div is set between 50 ns/div and 5 ns/
div, data sampling will be performed in the repetitive sampling mode. (But, for
DL1540CL, note that these T/div settings are not available if maximum displayable
record length is set to a high value.) And, if T/div is set between 5 µs/div and 100
ns/div, data sampling can be performed both in real-time or repetitive sampling
mode and schould be selected beforehand. But, for DL1540CL, the range over
which this feature is actually available will again vary according to the maximum
displayable record length. For details, refer to Appendix 2/Appendix 3.
1
N
: Value obtained after nth averaging
: nth measured value
: Attenuation constant
Envelope
n
).
1-12
IM 701530-01E
Page 26
Voltage Voltage
Time
Time
A
B
C
D
E
F
a
b
c
G
Input signal
Smoothing
data
1.4 Setting the Acquisition and Display Conditions
Record Length (Maximum Displayable Record Length) ≡ page 7-1. ≡ , (for DL1540CL)
The term “record length” refers to the number of data points (per channel) read into
acquisition memory. “Displayed record length” refers to the number of these data
points that actually appear on the screen. (Note that sampling rate and record
length will vary according to the T/div setting; see page 1-5). The term “maximum
displayable record length” refers to the maximum number of points that can be
displayed on the screen. This value can be selected by the user: the available
selections are 1 KW, 10 KW, 100 KW, 400 KW, 1 MW, and 2 MW.
In general, the acquisition-memory record length and the displayed record length
are equivalent. But if the maximum displayable record length is set to 1 KW, 10 KW,
or 100 KW and operation is in roll mode, then the acquisition acquisition -memory
record length will be double the maximum displayable record length. As an
example: if maximum displayable record length is set to 100 KW and the T/div is 50
ms/div, then the record length within acquisition memory will be 200 KW (200, 400
points). Only 100 KW of this length can appear on the screen at any given time. But
the waveform’s horizontal position can be shifted as necessary to enable viewing
over the entire 200 KW record (see page 1-7). High record-length settings are
useful for monitoring repetitive long-period signals and rapid sustained single-pulse
signals. But note that the three highest settings (400 KW, 1 MW, and 2 MW) involve
various operational restrictions. For details about these restrictions, refer to Section
7.1.
For details of the record length, refer to Appendix 2/Appendix 3.
1
Functions
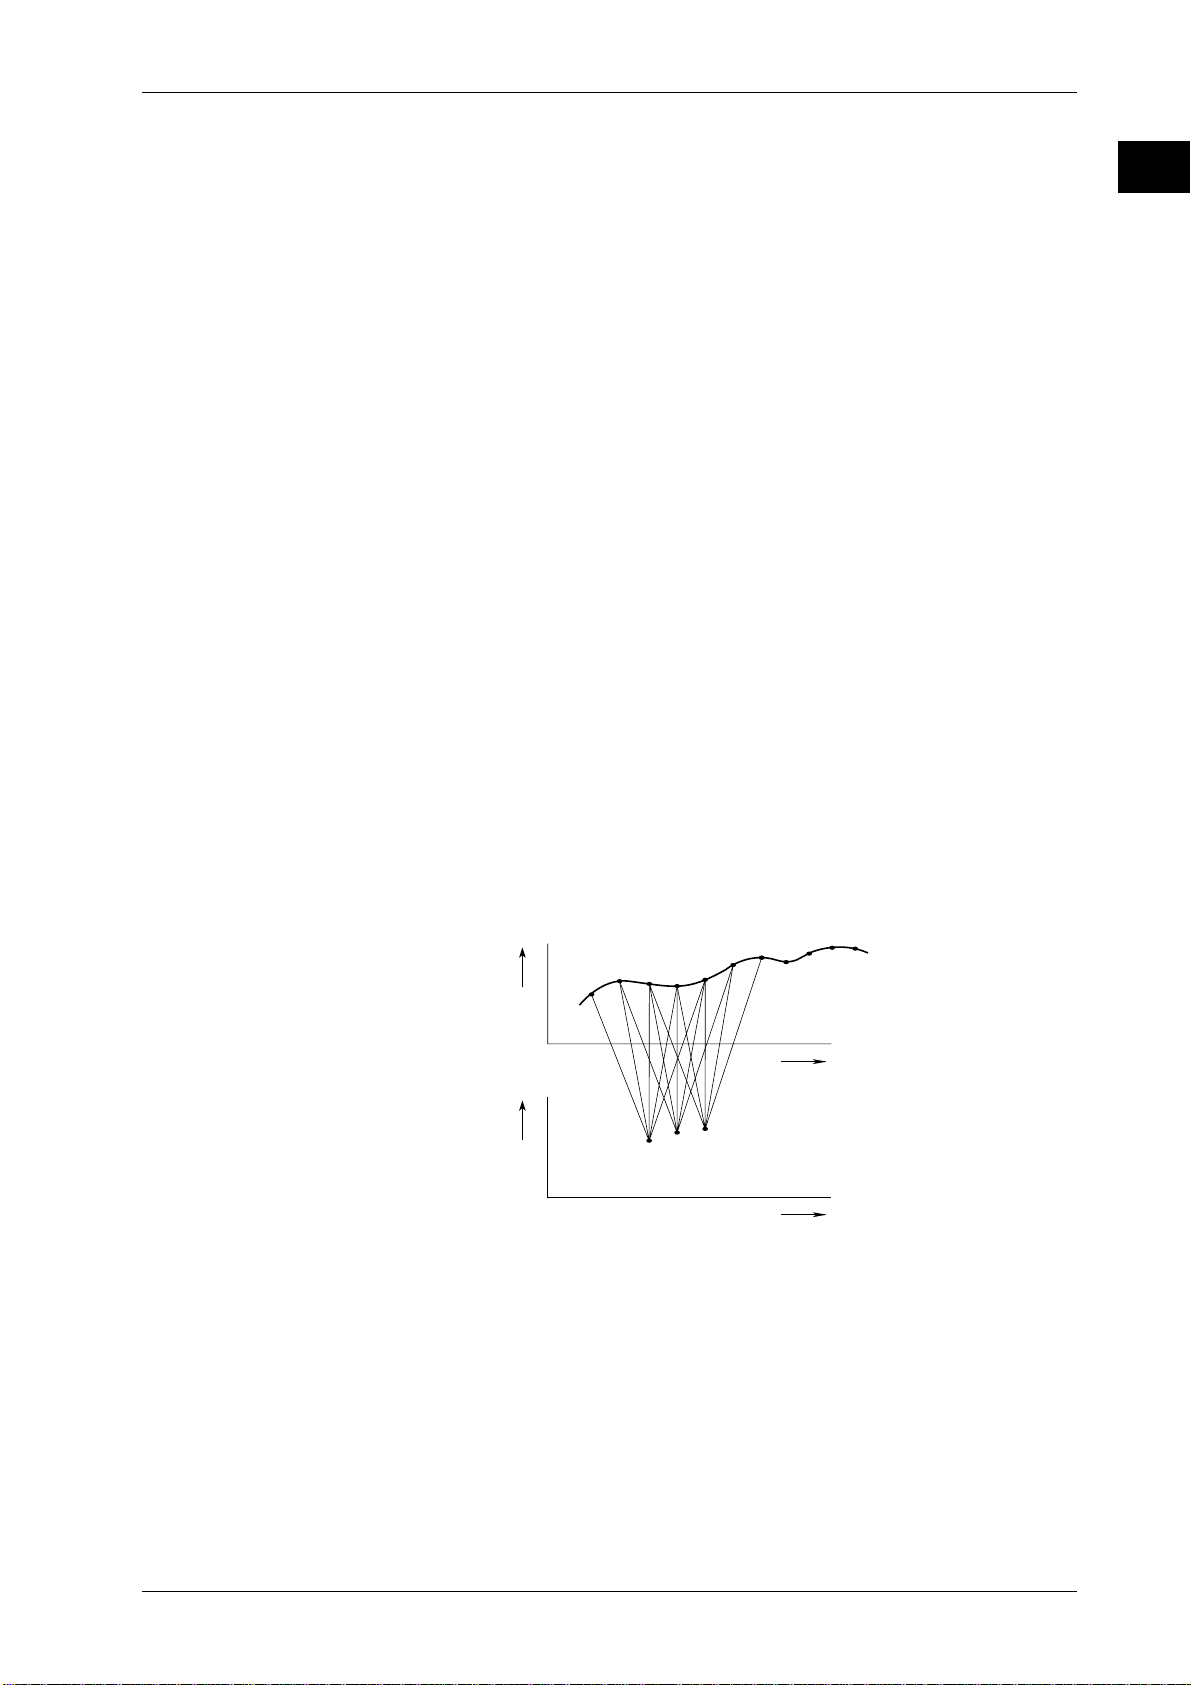
Input Filter ≡ page 7-3. ≡
Smoothing
The smoothing function enables the instrument to ignore small fluctuations in
rapidly changing waveform data so that the overall characteristic of the data can be
understood. The function acts as a low-pass filter. A weighted moving average value
is obtained for each set of five points of sampled data, then the result is displayed
as a wavefor m. This process is useful when you want to eliminate low levels of
noise on input signals. Furthermore, smoothing is performed on the data stored in
the acquisition memory, thus it can still be performed after acquisition has stopped,
allowing the elimination of noise on single-shot signals.
Bandwidth limit
High frequency noise of 20 MHz or higher can be eliminated from the input signal.
Expanded Wavef orm ≡ page 7-4. ≡
IM 701530-01E
Waveforms can be expanded in the time axis direction. This function is useful when
you want to change the T/div setting after the waveform has been displayed in
single mode or when you want to extend the acquisition time to observe a particular
part of the waveform thoroughly.
As explained in “Display of the time axis direction” on page 1-5, the number of data
points stored in the acquisition memory in normal display mode is greater than the
number of display points (501 points) stored in the time axis direction. Hence, the
displayed waveform is P-P compressed in the time axis direction. In other words,
more than one waveform data value is displayed at same individual points.
1-13
Page 27
expansion
(zoom) box
Pre-zoom waveform
expanded waveform
Display example in case N=100 times
Displaying all waveforms
(ALL)
Displaying newest waveform
(Display Number=0)
Displaying oldest waveform
(Display Number=–99)
1.4 Setting the Acquisition and Display Conditions
The zoom function described here reduces the compression ratio so as to enable
observation of individual data points from acquisition memory. The maximum
selectable magnification rate depends on the displayed record length: 10x zoom at
1 KW length; 100x at 10 KW; 1000x at 100 KW, 5000x at 400 KW; 10,000x at 1
MW; and 25,000x at 2 MW. Specifically, the waveform can be zoomed until the
number of displayed samples per division falls to 10 (until the displayed record
length for the full screen falls to 100 points). If you zoom in such that the number of
points per division is less than 50, an interpolation function will automatically supply
interpolation over the time axis direction, as described on the next page. Zoom
position is specified in units of grid division.
* Display record length of 400 KW, 1 MW and 2 MW is available on DL1540CL.
Display in zooming mode
As shown below, it is possible to select to display a pre-zoom waveform (MAIN) and
its expanded waveform (ZOOM) simultaneously, or to display the expanded
waveform only.
In the MainZoom display, a box is displayed in the display frame for the pre-zoom
waveform to indicate the position of the expanded waveform.
MainZoom display ZOOM display
Sequential Store ≡ page 7-7. ≡
In the real-time sampling mode, waveform data will be stored to the acquisition
memory only a set number of times, and all waveforms can be displayed. This stops
automatically after acquisition. This function is operable when the trigger mode is
set to single(N) mode. The maximum number of waveforms that can be stored into
acqsuisition memory under this mode varies according to model and the maximum
displayable record length in the range from 5 to 100 waveforms. The acquisitionmemory record length (the number of data points per waveform for a given channel)
is equivalent to the maximum displayable record length. Sequential-store operation
is not available at maximum displayable record lengths of 400KW or above.
Once the specified number of waveforms have been stored, you can display any of
the waveforms individually or all of them together, so that it is possible to derive a
time series of the wavefor m variation. The drawings below illustrate how stored data
can be displayed (assuming sequential storage of 100 waveforms).
1-14
IM 701530-01E
Page 28

History Memory ≡ page 7-9. ≡
The oscilloscope automatically retains the last N waveforms recorded by real-time
sampling, where N is equivalent to the maximum number of waveforms that can be
stored by sequential-store. (The record-length for history storage is the same as
that for sequential-store.) The oscilloscope retains all waveforms for the first N
triggers; then, for each subsequent trigger, the oscilloscope deletes the oldest
stored wavefor m. You are free to switch the display from the current (newest)
waveform to any of other N-1 waveforms in the history. The illustration below shows
how data can be displayed, assuming N=100.
Saved waveform data of previous 100 triggers
1.4 Setting the Acquisition and Display Conditions
1
Functions
Current waveform display
(Display Number = 0)
Display Number 0
Any former waveform display
(display number is selectable in the range –1 to –99)
Display Number –25
Wide Screen ≡ page 7-11. ≡
The area for displaying the waveform can be switched from normal mode at 501
dots (horizontal) X 401 dots (vertical) to wide mode at 601 dots (horizontal) X 401
dots (vertical).
Display Interpolation ≡ page 7-12. ≡
This instrument displays waveforms at 50 dots* per division in both the vertical and
horizontal axis directions, as shown below. However, if the dots corresponding to
the sampled data are not contiguous, the instrument will interpolate between them.
The interpolation method can be selected from the following.
* Dots are also called pixels, and are the smallest units used to construct waveforms and
characters on the screen.
Line interpolation
Interpolates between two dots using a straight line.
Sine interpolation
Generates interpolation data using the function sin(X)/X then interpolates between
two dots using resulting sine curve. Sine interpolation is suitable for observation of
sine waves.
IM 701530-01E
1-15
Page 29
1.4 Setting the Acquisition and Display Conditions
Pulse interpolation
Draws a horizontal line to the time axis position of the next data point, then interpolates
between the two dots by drawing a vertical line from the next data point.
No interpolation
Draws only a horizontal line to the time axis position of the next dat point.
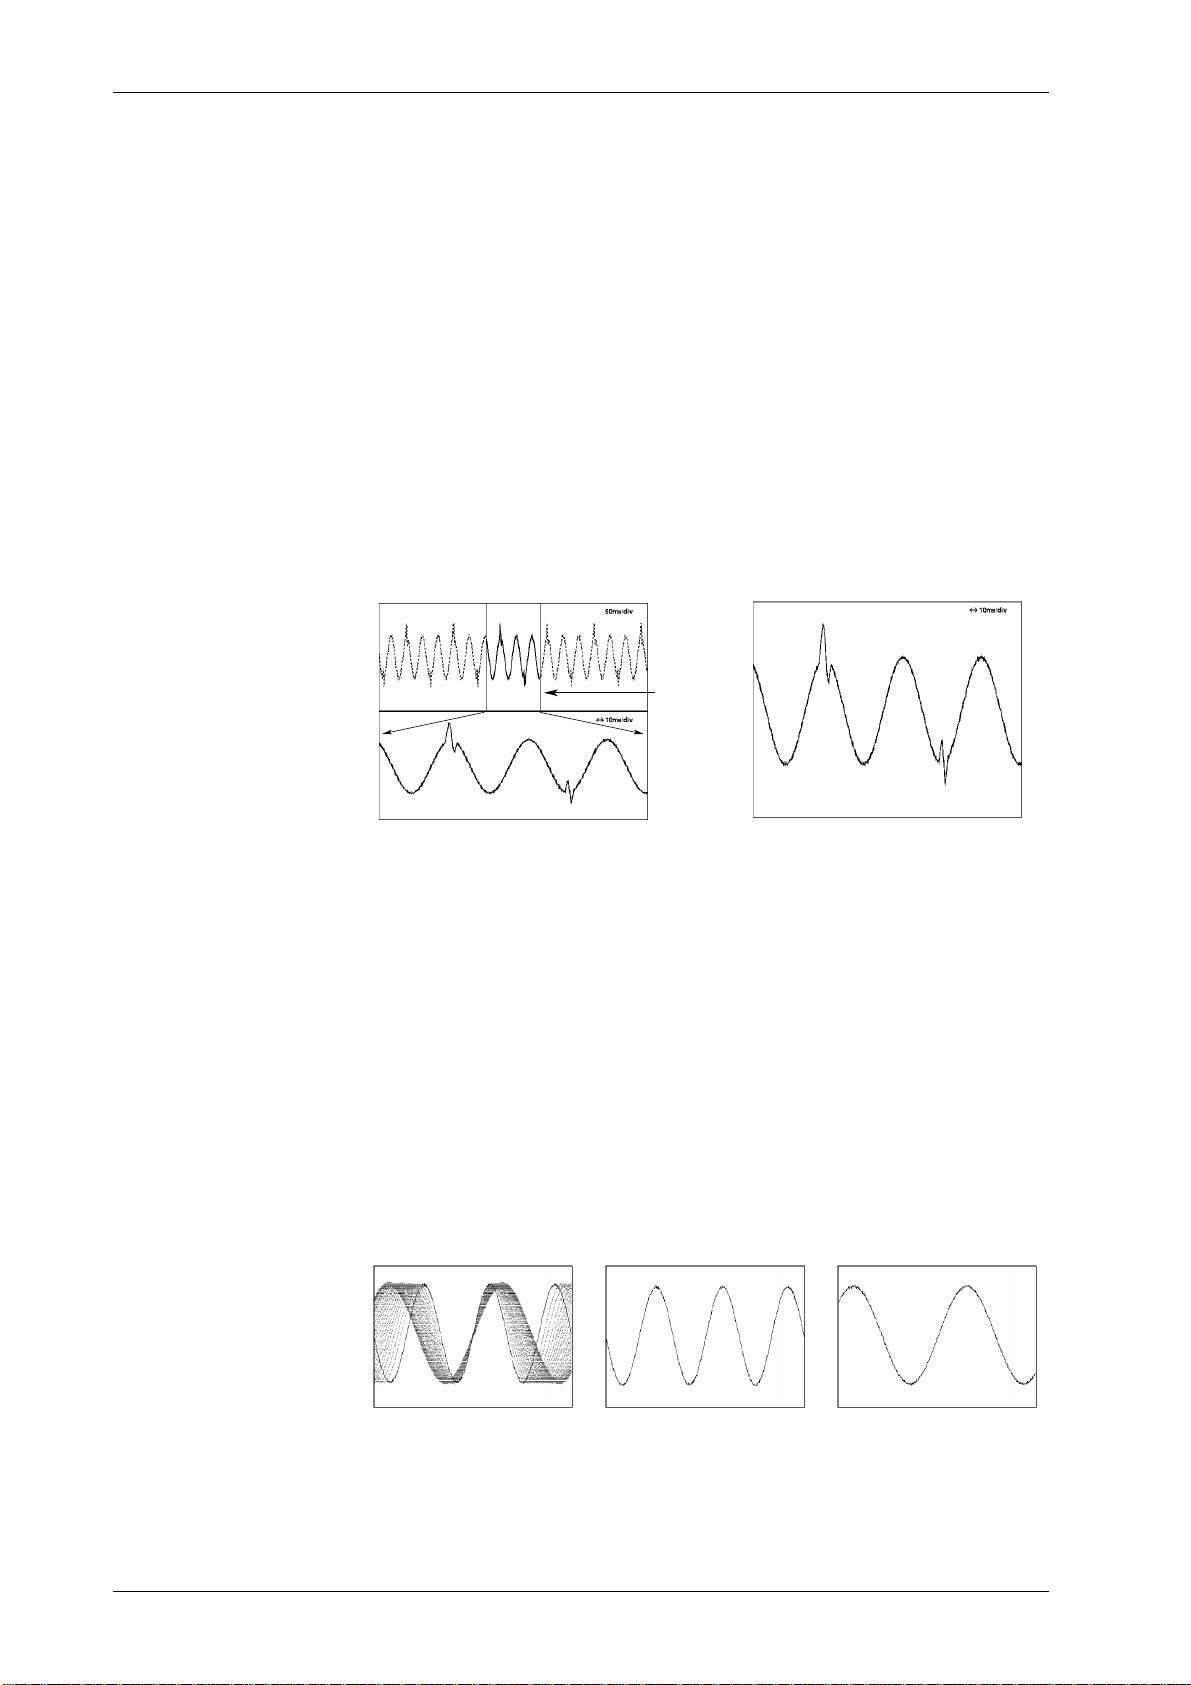
Accumulated W aveform Display ≡ page 7-13. ≡
The time that old waveforms remain on the screen is made longer than the
waveform update interval so that new waveforms can be accumulated on top of old
waveforms. In addition, waveforms can be displayed in different colors depending
on the frequency of occurrence of the waveforms.
This function is useful when you want to observe jitters and temporary turbulence in
waveforms.
X-Y Wavef orm Display ≡ page 7-15. ≡
The horizontal axis (X-axis) is used as the voltage axis for the input signal to CH1
and the vertical axis (Y-axis) is used as the voltage axis for the input signal to CH2
for observing the relationship between the voltages between the two signals. The XY waveforms for CH1 and CH2 can be displayed simultaneously. In addition, they
can also be displayed simultaneously with a normal V-T waveform (a waveform
displayed using voltage and time axes).
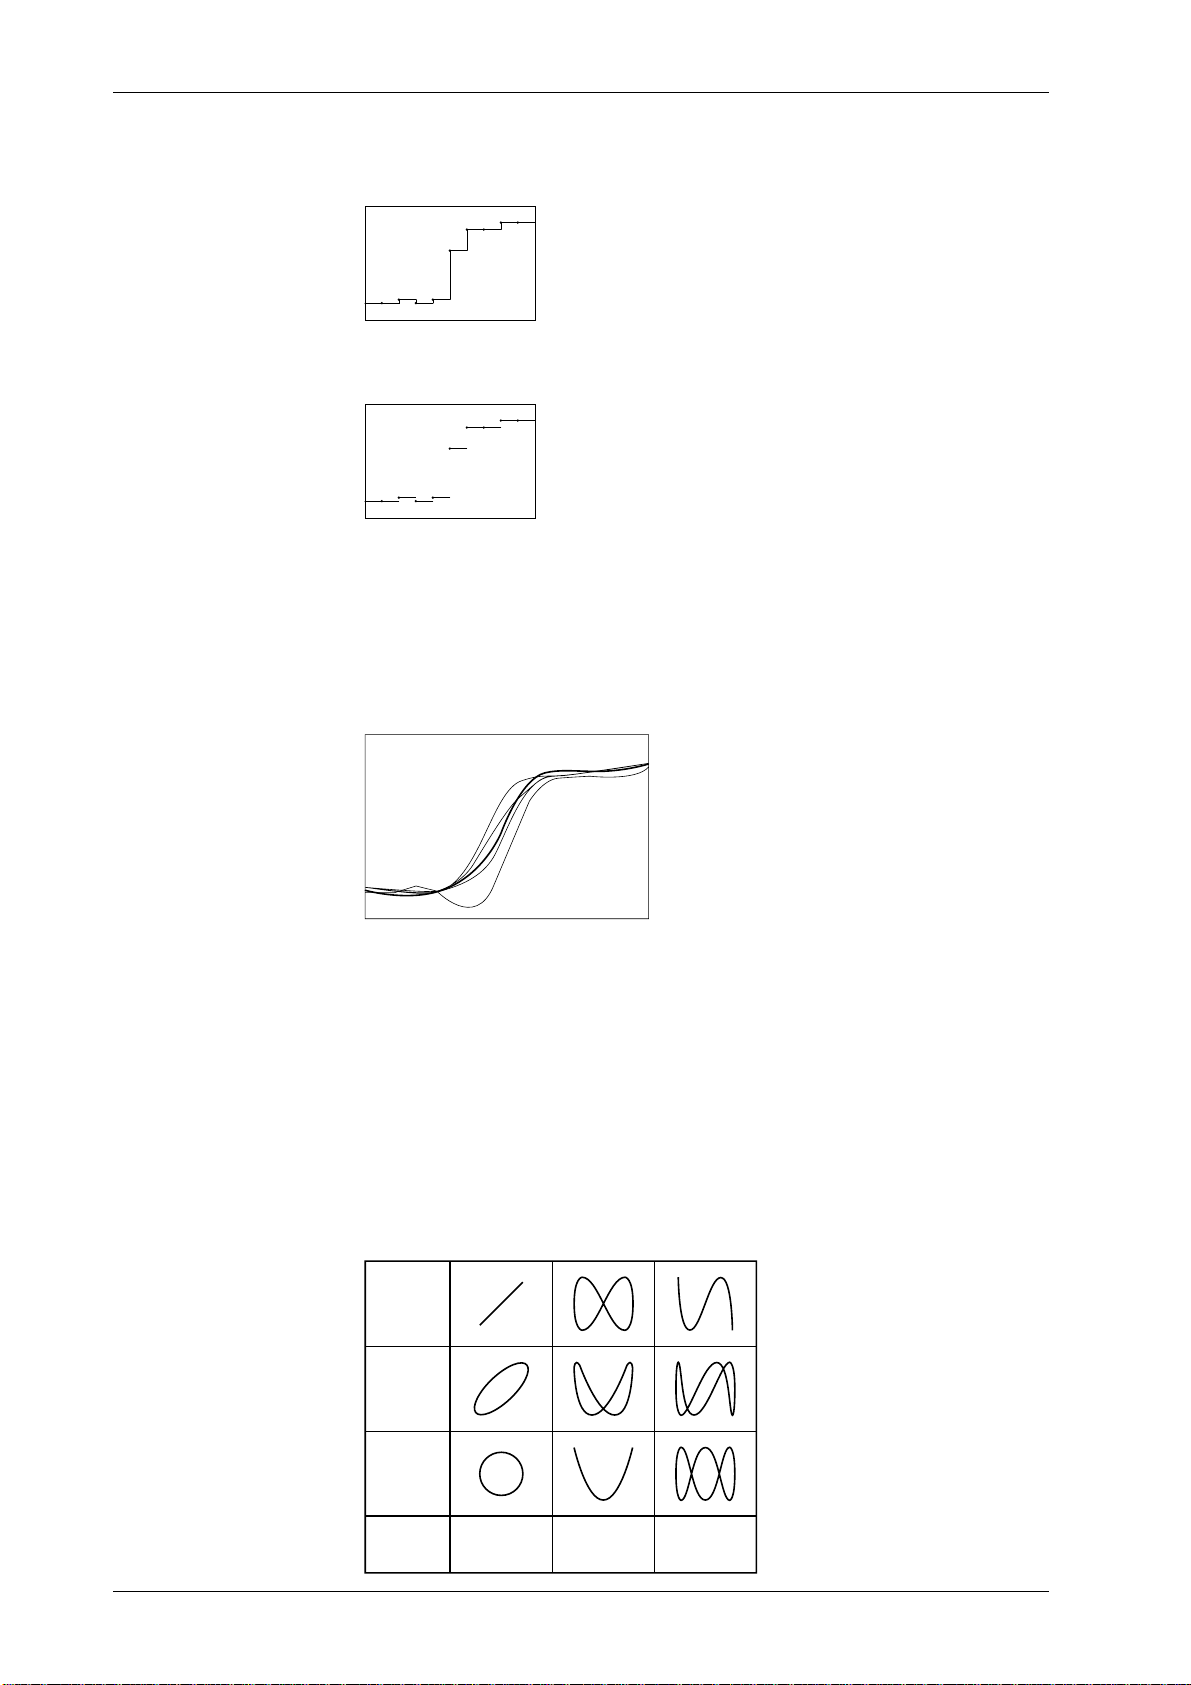
Use of this X-Y waveform display function enables measurement of the phase angle
between two sine wave signals. For example, two X-Y sine waveforms are
displayed to obtain an X-Y waveform (called a Lissajous waveform), from which the
phase angle can be obtained.
Phase
angle 0°
Phase
angle 45°
Phase
angle 90°
Frequency
ratio
(X:Y)
Lissajous waveform
1:1 1:2 1:3
1-16
IM 701530-01E
Page 30

1.4 Setting the Acquisition and Display Conditions
Other Display Modes Settings ≡ pages 7-16 to 7-18. ≡
Graticule/scale/% marker
Under the default settings, the graticule (including the grid and frame), scale or %
marker is displayed on the display, as shown below, enabling the easy observation
of wavefor ms. The type of graticule can be changed and scale display and %
marker can be turned ON/OFF.
Graticule: Grid, Scale: ON, % Marker: ON
Graticule: Frame, Scale: OFF, % Marker: OFF
1
Functions
Intensity
The intensity for items displayed on the LCD display such as characters, graticule
and so on can be adjusted. Adjust the intensity according to your needs.
IM 701530-01E
1-17
Page 31

1.5 Analyzing the Waveform
Cursor Measurements ≡ pages 8-1, 8-5 and 8-19. ≡
The vertical dotted lines shown in the figure below are called cursors. Moving the cursors
enables measurement of the voltage at various points on the waveform, the voltage
difference between two points, the time interv al from the trigger point (or delay point), and the
time difference between two displa y ed points . They also enable the frequency to be
calculated. The measured values are displayed in the waveform display frame, as shown
below .
The following types of cursor are available.
In case of V-T display : Vertical and horizontal cursors
When using the V-T wavef orm display, use the V-T cursor, to measure thedata on screen.
Using the V-T ACQ cursor , it is possible to mak e measurements with the actual data
acquired in the acquisition memory .
In case of X-Y display : Vertical, horizontal and X-Y cursors are availab le
In case of FFT (power spectrum) display : Vertical cursors
V-T waveform display X-Y waveform display
vertical cursor
Measurement
values
Automated Measurements ≡ page 8-7. ≡
This instrument can automatically measure 22 items of a displayed waveform, such as rise
time and pulse width. Also the dela y betw een channels can be measured. An y of the
parameters can be selected for any displayed waveform.
Maximum 24 measurement values can be displa y ed. However, if measurement values are
displayed simultaneously with the corresponding waveforms, the number of measurement
values which can be displayed for one channel depends on the number of to be measured
waveforms. For example, in case there are four waveforms to be measured, only six
measurement values can be displayed for each waveform.
Under normal settings, the oscilloscope calculates measurement values based on the
displayed data(P-P-compressed data or interpolated data). But you can also opt to perform
calculations directly on the data values within the acquisition memory.
Furthermore, use of the MISC Information menu or communications function enables output
of all the selected measured values, though the measured values cannot be updated by the
Information menu.
Vertical cursor
Measurement
values
X-Y cursor
FFTdisplay
Measurement
values
X-Y cursor
Linear Scaling ≡ page 8-14. ≡
1-18
Measurement
values
It is possible to append a scaling constant A, an offset value B and a unit to the measurement
value X of cursor or automated measurements. Linear scaling is useful for example, when
applying a voltage divider ratio to the measurement values, or in case of automatically
calculating the current value from the voltage measurement results.
Y(UNIT) = AX + B Y = result of linear scaling
IM 701530-01E
Page 32

Waveform Math ≡ page 8-16. ≡
Waveforms obtained by adding the waveform data of CH1 and CH2 (addition),
waveforms obtained by subtracting waveform data CH2 from CH1 (subtraction), and
waveforms obtained by multiplying waveform data CH1 by CH2 (ĥltiplication) can be
displayed on CH3. Waveform math can be performed while the phase of CH2 is shifted.
Addition and subtraction computations are useful when you want to compare data with
a reference signal, to check the logic of a signal and to make a phase comparison.
Multiplication computation is useful when you want to input a voltage signal and a
current signal to check the power waveform.
Addition-
computed waveform
Power Spectrum Display ≡ page 8-18. ≡
FFT (Fast Fourier Transform) computation can be performed on the input signal to
display its power spectrum. This is useful when you want to check the frequency
distribution of the input signal.
Subtraction-
computed waveform
1.5 Analyzing the Waveform
1
Functions
Multiplication-
computed waveform
Power spectrum
waveform
Two time windows are available: a rectangular window and a Hanning window.
The rectangular window is effective for transient signals, such as an impulse wave,
which attenuate completely within the time window. The Hanning window allows
continuity of the signal by gradually attenuating the parts of the signal located near
the ends of the time window down to the “0” level. Hence, it is effective for
continuous signals.
FFT computation generates 1000 measurement data points, but only 500 points are
displayed on the screen.
Window Integral Power spectrum
Sine wave
Rectangular
window
T
t
Rectangular window
Hanning window
Hanning window
T
: W(t) = u(t) - u(t - T) U(t) : Step function
: W(t) = (0.5 - 0.5 cos2π )
T
T
t
T
[FFT function]
When the complex result of FFT computation is G = R + jI, the power spectrum can
be expressed as follows.
2
Power spectrum = 10 log (
R2 + I
2
)
R : Real Part, I : Imaginary Part
Reference value (0 dB) of log mag: 1 Vrms
IM 701530-01E
1-19
Page 33

1.6 Other Useful Functions
Auto Set-up ≡ page 4-2. ≡
This function makes settings automatically such as vertical sensitivity, time axis and
trigger settings, to suit the signal to be measured. This is useful when the signal to
be measured is unknown. However, there might be particular signals for which the
auto set-up function may not work properly.
Initialization ≡ page 4-4. ≡
This function resets the key settings to the factory settings (default settings), and is useful
when complex settings have been made and you want to cancel all of them at once.
Snapshot ≡ page 4-5. ≡
If single mode is not selected as the trigger mode, a waveform is updated at the
specified intervals or is displayed in roll mode. Thus, to retain the currently
displayed waveform, acquisition must be stopped. Use of the snapshot function
allows the currently displayed waveforms to remain temporarily on the screen
without acquisition being stopped. To activate this function, just press the SNAP
SHOT key without stopping acquisition. The currently displayed waveform will be
retained. This waveform is called a snapshot waveform. The snapshot waveform is
displayed with a different intensity from that used for the updated wavefor m, making
comparison between the two easier.
Snapshot waveforms are screen image waveforms, so they cannot be used for
cursor measurement, automated measurement or be stored.
Clear T race ≡ page 4-5. ≡
This function enables you to clear snapshot waveforms and accumulated waveforms,
and restart the averaging process or repetitive sampling in a single operation.
GO/NO-GO Determination ≡ Chapter 9. ≡
The GO/NO-GO function is useful when you want to inspect signals and track down
abnormal symptoms on a production line making electronic equipment. It performs
pass/fail determinations on whether waveforms are within a specified range or not, and
takes preset actions in the case of failure (NO-GO). There are two determination
methods. In the first one a waveform zone is specified on the screen, and in the second
a range for each waveform parameter is specified.
Determination can be performed on up to four input signals using “AND” or “OR” logic.
In the case of NO-GO, various actions can be performed, for example, waveform data
can be saved and screen hardcopy can be output to the built-in printer (optional). In
addition, the determination results can be output by an external signal.
Zone waveform
Snapshot waveform
1-20
Saving the waveform data
Outputting hard copy
IM 701530-01E
Page 34

1.6 Other Useful Functions
Making Hardcopy Print-outs of the Screen and Printing Set-up Information ≡ Chapter 10. ≡
Screen hardcopy and setting parameters (measurement conditions) can be printed on
the built-in printer (optional), on an external HP-GL plotter or an external color printer.
Compatible
plotter
Note
• Entering a comment
The instrument provides a function which enables you to use the keyboard displayed on the
screen to enter and display a comment. If you enter a comment which indicates the contents
of the displayed waveforms before printing a hard-copy, it will help you to distinguish between
different print-outs.
• The GP-IB/Centronics adapter is necessary, when printing to an external color printer.
Real-time Printing ≡ page 10-6. ≡
It is possible to print waveforms continuously as a recorder using the built-in printer.
Real-time printing can be done when the setting range of the time axis lies within
500 ms/div to 50 s/div. The chart speed is fixed at 16.7 mm/s.
Print Example (DL1540C)
1
Functions
Time corresponding to the point where
Vertical axis sensitivity
Voltage values corresponding to the
point where 10 div have elapsed
since start of printing
10 div have elapsed since start of printing
Ground level mark
Storing/Recalling Displayed Waveforms and Setting Parameters ≡ page 11-1, 11-3. ≡
Displayed waveforms (P-P compressed data, not acquisition data) and setting
parameters can be stored in the internal memories.
It is also possible to recall and display stored waveforms, and to recall and modify
stored set-up data.
This function is useful when you want to compare the previously acquired waveform
with a newly acquired waveform.
Recalled waveform
IM 701530-01E
1-21
Page 35

1.6 Other Useful Functions
Saving/Loading Data from a Floppy Disk ≡ Chapter 12. ≡
The instrument is equipped with a floppy disk drive as standard. This enables you to
save setting parameters on a floppy disk, and load it when you need it.
Furthermore, it is also possible to save screen image data in HP-GL, PostScript,
TIFF or BMP format and import these into documents created by DTP application
software.
Saving/Loading Data from the SCSI Device ≡ Chapter 13. ≡
DL1540C/DL1540CL can save/load data from the SCSI device through the
separately sold SCSI interface unit in the same way as saving /loading from the
floppy disk as described above.
Personal computer
SCSI device
DL1540C/1540CL needs a SCSI
interface unit (700930).
GP-IB/RS-232-C ≡ Communications Interface User’s Manual (IM 701530-11E). ≡
The instrument is equipped with a GP-IB interface as standard, whereas a RS-232C interface unit is optional. Either interface enables you to send waveform data to a
personal computer for analysis, as well as to perform waveform measurement while
controlling the instrument using an external controller.
GP-IB/RS-232-C
interface
Personal computer
1-22
IM 701530-01E
Page 36

Chapter 2 Name and Use of Each Part
2.1 Front Panel / Rear Panel / Top View
Front Panel
Time axis setting knob
→Page 5-10
Floppy disk drive
Saving and loading of data from the
Colored LCD display
Description of display contents
→Page 2-6
floppy disk
→Chapter 12
Rotary knob
Used to enter setting values and selections
2
Name and Use of Each Part
Rear Panel
Front panel keys
Description of each key
→Pages 2-3 to 2-5
Power switch
Description of ON/OFF operation
→Page 3-4
Connector for half
pitch interface*
!
Vent holes
COMP signal output terminal
!
Outputs a phase correction signal for a probe.
→Page 3-6
Function grounding terminal
Used to connect the ground line to
phase correct a probe.
Input terminals
!
Used to connect a probe.
→Page 3-5
GP-IB connector
Used to connect an external plotter.
Connection method →Page 10-7
For a description of communications functions,
refer to the Communication Interface User's
Manual (IM 701530-11E).
Trigger output terminal
!
How to use the trigger output signal
→Page 14-1
External trigger/clock input terminal
Description of external trigger →Page 6-2
!
Description of external clock →Page 5-8
Vent holes
Power connector
!
Connection method →Page 3-3
IM 701530-01E
Power supply fuse
For fuse replacement →Page 15-7
Support
Use the support to use this instrument with
the display facing upwards.
* The following sections of the rear panel on DL1540CL models with the /C8 option
differ from those of the standard model.
(IEEE488)
GP-IB
MODEL
SUFFIX
NO.
Made in Japan
TRIG OUT EXT CLOCK IN/EXT TRIG IN
(TTL )
±6V MAX 1M
GO/NO-GO
GO/NO-GO determination
output connector
SCSI
SCSI interface
connector
2-1
Page 37

2.1 Front Panel / Rear Panel / Top View
T op View
Vent holes
Rear panel
Built-in printer (optional)
How to output data to the printer
→Chapter 10
Handle
Hold the instrument by these handles
when you carry it.
Front panel
2-2
IM 701530-01E
Page 38

2.2 Operation Keys / Rotary Knob
Keys and Rotary Knob used for Various Functions
CLEAR TRACE key (Page 4-5)
Deletes the snapshot waveform or accumulated
waveform. Also used to re-start averaging and
repetitive time sampling.
Soft keys
CLEAR
TRACE
AUTO-SETUP
VERTICAL
7
4
1
0
Used to make settings corresponding to the soft key
menu displayed above the keys.
CURSOR
MEASURE
ON/OFF
V/DIV
INPUT
FILTER
CH
3
9
32
HORIZONTAL
CH
4
POSITION
REMOTE
+/-
INITIALIZE
CH
CH
2
1
8
56
POSITION
INITIALIZE key (Page 4-4)
Displays the initialization menu which
can be used to reset the settings to
their default values.
AUTO-SETUP key (Page 4-2)
Displays the auto setup menu which
can be used to execute auto setup.
TIME/DIV
LOCAL
ESC key
Deletes the currently displayed menu.
ESC
TRIG'D
MODE
ACTION
RESET
SELECT
ACQ
STORE/RECALL
GO/NO-GO
ZOOM
DISPLAY FORM
FFT
MATH
TRIGGER
CAL
DISPLAY
TYPE
POSITION/
LEVEL/
DELAY
SOURCE
COUPLING
HOLD OFF
MISC
HISTORY
KEYBOARD MENU
SHIFT+MISC (KEYBOARD key)
(Page 4-7)
Displays a keyboard which enables you
to enter values directly.
CAL key (Page 4-6)
Displays the calibration execution menu.
2
Name and Use of Each Part
RESET key
Resets the settings made using the
SNAP SHOT
START/STOP
SHIFT
COPY
FILE
rotary knob to their default settings.
SNAP SHOT key (Page 4-5)
Retains the waveform which is displayed
when this key is pressed, even if updating
is performed.
SELECT key
Confirms the items and characters
selected.
Rotary knob
Used to set values, move the cursor,
and select the desired items.
<> key
Used to shift from one digit to the next
of the value you are setting using the
rotary knob.
START/STOP key (Page 4-1)
Starts or stops acquisition.
The indicator on this key is lit during
acquisition.
SHIFT key
Used to operate functions written in blue
over/under the operation keys.
Keys and Rotary Knob used for Setting the Vertical/Horizontal Axis
V/DIV key (Page 5-6)
Displays the voltage axis sensitivity setting
menu for each channel.
CH key (Page 5-1)
Turns ON/OFF display of the waveform for each channel.
The indicator above the key is lit when the display is ON.
CLEAR
TRACE
AUTO-SETUP
INITIALIZE
VERTICAL
CH
1
7
4
1
0
ON/OFF
CH
2
CH
8
V/DIV
56
POSITION
INPUT
MEASURE
FILTER
CH
3
4
9
32
+/-
POSITION key (Page 5-12)
Displays the horizontal position setting menu.
GO/NO-GO
CURSOR
HORIZONTAL
ZOOM
POSITION
TIME/DIV
REMOTE
LOCAL
CAL
Time axis setting knob (TIME/DIV)
INPUT key (Pages 5-2 to 5-5)
Sets the input coupling, probe attenuation,
(Page 5-10)
Used to change the time axis scale.
inverted display, and acquisition hold.
POSITION key (Page 5-7)
Displays the vertical position setting menu
for each displayed waveform.
ESC
TRIG'D
MODE
ACTION
RESET
SELECT
ACQ
STORE/RECALL
FILE
DISPLAY FORM
FFT
MATH
TRIGGER
DISPLAY
TYPE
POSITION/
LEVEL/
DELAY
SOURCE
COUPLING
HOLD OFF
MISC
HISTORY
KEYBOARD MENU
SNAP SHOT
START/STOP
COPY
SHIFT
Rotary knob
Used to make vertical axis sensitivity
(V/div), waveform vertical/horizontal
position and offset voltage settings.
IM 701530-01E
2-3
Page 39

2.2 Operation Keys / Rotary Knob
Keys and Rotary Knob used for Making Trigger Settings
TRIG’D indicator
Lights up when a trigger is activated.
TYPE key
Displays the trigger type selection
menu.
CLEAR
TRACE
AUTO-SETUP
INITIALIZE
VERTICAL
CH
7
4
1
0
ON/OFF
CH
2
1
8
56
CH
V/DIV
POSITION
INPUT
FILTER
3
9
32
+/-
HORIZONTAL
CH
4
POSITION
REMOTE
TIME/DIV
LOCAL
ZOOM
CAL
GO/NO-GO
CURSOR
MEASURE
LEVER/SOURCE key
Displays the trigger source selection
menu.
COUPLING key (Page 6-16)
Displays the trigger coupling setting
menu.
FFT
MATH
TRIGGER
TYPE
LEVEL/
SOURCE
COUPLING
MISC
KEYBOARD MENU
ESC
TRIG'D
MODE
ACTION
RESET
SELECT
STORE/RECALL
DISPLAY FORM
DISPLAY
POSITION/
DELAY
HOLD OFF
HISTORY
POSITION/DELAY key (Pages 6-17, 6-18)
Displays the trigger position/trigger delay setting menu.
HOLD OFF key (Page 6-19)
Displays the holdoff time setting menu.
ACQ
MODE key (Page 6-12)
Displays the trigger mode selection menu.
SHIFT+MODE(ACTION) key (Page 6-14)
Displays the action-on-trigger selection menu.
SNAP SHOT
RESET key
Resets the settings made using the
rotary knob to their default settings.
Rotary knob
Used to set the trigger level, trigger
position and trigger delay.
<> key
START/STOP
SHIFT
COPY
FILE
Used to shift from one digit to the
next of the value you are setting using
the rotary knob.
Keys and Rotary Knob used for Setting Acquisition and Display Conditions
DISPLAY key (Pages 7-7 to 7-13)
Displays the waveforms for the sequential store and history
memory, and the setting menu for interpolation, X-Y and
accumulate settings.
SHIFT+DISPLAY(DISPLAY FORM) key (Pages 7-14 to 7-16)
Displays the display condition setting menu to make display
interpolation, graticule/scale % marker and intensity settings.
SNAP SHOT
RESET key
Resets the settings made using the rotary
knob to their default settings.
Rotary knob
Used to set the number of execution times
for averaging, expansion rate and position,
accumulate time and brightness of the screen.
<> key
START/STOP
COPY
SHIFT
Used to shift from one digit to the next of the
value you are setting using the rotary knob.
ACQ key (Page 7-1)
Displays the menu used to make acquisition
mode and sampling mode settings.
SHIFT+ACQ(HISTORY) key (Page 7-9)
For DL1520L, displays the history memory setting menu.
For DL1520L, "HISTORY" character indicated over ACQ key
CLEAR
TRACE
AUTO-SETUP
INITIALIZE
VERTICAL
CH
7
4
1
0
ON/OFF
CH
2
1
8
56
CH
V/DIV
POSITION
INPUT
FILTER key (Page 7-3)
Displays the input filter setting menu.
The indicator above the key is lit when
a band limit is set.
FILTER
3
9
32
+/-
HORIZONTAL
CH
4
POSITION
REMOTE
TIME/DIV
LOCAL
ZOOM
CAL
GO/NO-GO
CURSOR
MEASURE
ZOOM key (Page 7-4)
Displays the expansion setting menu.
ESC
TRIG'D
MODE
ACTION
RESET
SELECT
HISTORY
ACQ
STORE/RECALL
FILE
DISPLAY FORM
FFT
MATH
DISPLAY
TRIGGER
TYPE
POSITION/
LEVEL/
DELAY
SOURCE
COUPLING
HOLD OFF
MISC
HISTORY
KEYBOARD MENU
HISTORY key (Page 7-9)
Displays the history memory setting menu.
(Not provided with DL1520/DL1520L.)
2-4
IM 701530-01E
Page 40

Keys and Rotary Knob used for Analysis of Waveforms
MEASURE key (Page 8-6)
Displays the setting menu for automated
measurement of waveform parameters.
CURSOR key (Pages 8-1, 8-5 and 8-19)
Displays the setting menu for cursor measurement.
CLEAR
TRACE
ESC
SNAP SHOT
2.2 Operation Keys / Rotary Knob
RESET key
Resets the settings made using the
rotary knob to their default values.
2
Name and Use of Each Part
DISPLAY FORM
AUTO-SETUP
INITIALIZE
VERTICAL
CH
1
7
4
1
0
ON/OFF
CH
2
CH
8
V/DIV
56
POSITION
INPUT
FILTER
3
9
32
+/-
HORIZONTAL
CH
4
POSITION
REMOTE
ZOOM
TIME/DIV
LOCAL
GO/NO-GO
CURSOR
MEASURE
FFT
MATH
TRIGGER
CAL
DISPLAY
TRIG'D
TYPE
MODE
ACTION
SELECT
POSITION/
LEVEL/
SOURCE
COUPLING
KEYBOARD MENU
MISC
DELAY
HOLD OFF
HISTORY
MATH key (Page 8-16)
GO/NO-GO key (Pages 9-1 and 9-8)
Displays the GO/NO-GO setting menu.
Displays the waveform computation menu.
SHIFT + MATH(FFT) key (Page 8-18)
Displays the FFT computation menu.
MISC key (Page 8-14)
Used to set the linear scaling function.
Keys and Rotary Knob used for Other Operations
LOCAL key
Clears the remote state. The REMOTE indicator
is lit while remote mode is active.
Refer to the Communication Interface User's
Manual (IM 701510-11E).
CLEAR
TRACE
ESC
RESET
ACQ
STORE/RECALL
FILE
START/STOP
COPY
SNAP SHOT
SHIFT
SELECT key
Confirms the items and characters
selected.
Rotary knob
Used to select cursor position, waveform
parameters, linear scaling, phase shift,
FFT computation, etc.
<> key
Used to shift from one digit to the next of
the value you are setting using the rotary
knob.
RESET key
Resets the settings made using the
rotary knob to their default values.
AUTO-SETUP
INITIALIZE
VERTICAL
CH
1
7
4
1
0
ON/OFF
CH
2
CH
8
V/DIV
56
POSITION
INPUT
FILTER
CH
3
4
9
32
+/-
MEASURE
CURSOR
HORIZONTAL
POSITION
TIME/DIV
REMOTE
LOCAL
ZOOM
CAL
GO/NO-GO
MISC key (Pages 14-2 to 14-4, 15-7)
Displays the MISC menu used to make communications, date
and time settings, confirm system condition, perform a self
test, LCD brightness and make system configuration setting.
IM 701530-01E
TRIG'D
MODE
ACTION
RESET
SELECT
ACQ
STORE/RECALL
FILE
DISPLAY FORM
FFT
MATH
TRIGGER
DISPLAY
TYPE
POSITION/
LEVEL/
DELAY
SOURCE
COUPLING
HOLD OFF
MISC
HISTORY
KEYBOARD MENU
SELECT key
Used to input the file name, for selection
and confirmation.
Rotary knob
Used to select the desired setting items
or values.
START/STOP
COPY
SHIFT
COPY key (Chapter 10, Page 12-11)
Used for outputting to internal printer,
external plotter, hard copy of screen image
data, etc.
SHIFT + COPY(MENU)
(Chapter 10, Page 12-11)
Displays the setting menu for outputting to
the internal printer, external plotter, and for
hard copy of screen image data, etc.
STORE/RECALL key (Chapter 11)
Displays the store/recall menu used to store or recall displayed
waveforms and setting parameters from the internal memory.
SHIFT + STORE/RECALL(FILE) key (Chapter 12 and 13)
Displays the setting menu used to save/load data to/from the
floppy disk or the SCSI device.
2-5
Page 41

2.3 Display
Normal Waveform Display
Information concerning waveform acquisiton
No display
Stopped
Waiting for trigger
Trigger level mark
Trace No.
Ground level mark
. . . . . .
acquisition in progress
Date and time →Page 3-7
Trigger position
Acquisition mode → Page 7-1
NORM
ENV
AVG
. . .
Normal mode
. . .
Envelope mode
. . .
Averaging mode
Sample rate → App.2/App.3
In case of the repetitive sampling mode,
[REP] is added
Time axis setting →Page 5-10
Information concerning waveforms →Page 7-15
. . .
CH2
Signal waveform of channel 2
. .
20.0V
Voltage axis sensitivity is 20.0V/div
. . .
DC
Input coupling
. . .
10:1
Probe attenuation
Graticule → Page 7-14
Rotary knob menu
Shows values and settings which can
be adjusted by rotary knob
Automated Measurements → Refer to page 8-7.
T2 cursorT1 cursor
Trace No.
Soft key menu
Press the corresponding key below
when you want to change any setting
Measurement
values
Measurement items or delay
between channels
2-6
IM 701530-01E
Page 42

Expanded Display → Refer to page 7-4.
2.3 Display
Expansion (zoom) box
Pre-zoom waveform
2
Name and Use of Each Part
Time axis setting of the
expanded waveform
Expanded waveform
Expansion rate
Expansion setting menu
Recalled Wavef orm → Refer to page 11-1.
Channel No. switches to "MEM" when a recalled
waveform is displayed.
The voltage axis sensitivity of the recalled waveform
is displayed as well.
Input signal
waveform
Recalled waveform
Destination
selection menu
Recall menu
IM 701530-01E
2-7
Page 43

Chapter 3 Before Starting Observation and Measurement of Waveforms
3.1 Precautions During Use
Safety Precautions
When using this instrument, thoroughly read the “Safety Precautions” given on page
5 and 6. In addition, pay attention to the following points:
Do not remove the cover from the instrument
Some parts of the instrument use high voltages, which are extremely dangerous.
When the instrument needs internal inspection or adjustment, contact your dealer or
nearest YOKOGAWA representative as listed on the back cover of this manual.
Unusual occurrences
If you notice smoke or unusual odors coming from the instrument, turn OFF the
power and unplug the power cord immediately. Contact your dealer or the nearest
YOKOGAWA representative as listed on the back cover of this manual.
Power cord
Nothing should be placed on the power cord; also, it should be kept away from any
heat sources. When unplugging the power cord from the AC outlet, never pull the
cord itself. Always hold the plug and pull it. If the power cord is damaged, contact
your dealer. Refer to page 3 for the part number to quote when placing an order.
General Handling Precautions
Never place anything on top of the instrument
Never place another instrument or any objects containing water on top of the
instrument, otherwise a breakdown may occur.
Do not subject the input terminals or connecting cables to shock
Shock to the input terminals or connecting cables may turn into electrical noise and
enter the instrument via the signal lines.
3
Before Starting Observation and Measurement of Waveforms
When the instrument is not going to be used for a long period
Unplug the power cord from the AC outlet.
Do not scratch the LCD
The LCD is very susceptible to scratches. Make sure not to scratch the surface with
pointed objects. In addition, never apply vibration or shock to the LCD.
When moving the instrument
Disconnect the power cord and connecting
cables. Always carry the instrument by the
handles or carry it with both hands as shown on
the right.
Note that the chart paper might show some
discoloration due to friction after the instrument
is moved with the roll paper installed. In such a
case, we recommend to remove and re-install
the chart paper again. For details on the
procedure, refer to page 10-1.
Cleaning
For cleaning the case and the operation panel, unplug the power cord first, then
gently wipe with a dry, soft and clean cloth. Do not use chemicals such as benzene
or thinner, since these may cause discoloration or damage.
IM 701530-01E
3-1
Page 44

3.2 Installing the Main Unit
Installation Position
Place the instrument in a flat, horizontal position as shown in the figure below. To tilt
the screen slightly forwards, use the support, as shown below also.
When using the support, pull it forwards until it is at right angles to the bottom of the
instrument, and lock it. If you are installing the instrument in a slippery place, attach
the rubber stoppers to all feet to prevent the instrument from sliding.
Installation Conditions
The instrument must be installed in a place where the following conditions are met.
Ambient temperature and humidity
Ambient temperature: 5 to 40 °C
To ensure high measurement accuracy, ambient temperature should be 23 ±2 °C.
Ambient humidity: 20 to 80% RH
No condensation should be present. To ensure high measurement accuracy,
ambient humidity should be 55 ±10% RH.
Support
Flat, horizontal locations
Place the instrument in a stable location, which is horizontal in each direction.
Operating the instrument in an unstable location may hinder recording of the printer
and accurate measurement.
Well-ventilated location
Vent holes are situated on the left side of the instrument. In addition, vent holes for
the cooling fan are also situated in the rear panel. To prevent a rise in the internal
temperature, the vent holes should not be blocked and sufficient clearance should
be maintained around them.
5 cm or more
5 cm
or
more
5 cm
or
more
2 cm
or
more
If the instrument is equipped with a built-in printer or when the GP-IB cable is
connected, make sure to allow sufficient space for operations in addition to the
space for the vent holes.
Never install the instrument in any of the following places.
• In direct sunlight or near heat sources
• Where an excessive amount of soot, steam, dust or corrosive gases are present.
• Near strong magnetic field sources
• Near high voltage equipment or power lines
• Where the level of mechanical vibration is high
• In an unstable place
3-2
Note
Internal condensation may occur if the instrument is moved to another place where both the
ambient temperature and humidity are higher, or if the temperature changes rapidly. In such
cases allow the instrument to acclimatize to its new environment for at least one hour before
starting operation.
IM 701530-01E
Page 45

3.3 Connecting the Power Cord
Before Connecting the Power
Make sure that you perform the following steps before connecting the power.
Failure to do so may cause electric shock or damage to the instrument.
WARNING
• Connect the power cord after confirming that the voltage of the power
supply complies to the rated electric power voltage for this instrument.
• Connect the power cord after confirming that the power switch is OFF.
• Always use protective ground to prevent electric shock. Connect the
accessory power cord to a power outlet with grounding terminal.
• Do not use non-grounding extension cords or other measures that defect
the protective grounding.
• Never use an extension cord that does not have protective grounding,
otherwise the protection feature will be negated.
Connecting the Power Cord
1. Make sure that the main power switch is OFF.
2. Plug the power cord into the power connector socket on the rear panel of the
instrument.
3. Plug the other end of the power cord into an AC outlet that meets the following
specifications. The AC outlet must be of 3-pin type with a protective grounding
terminal.
Rated supply voltage 100 to 120 VAC/220 to 240 VAC
Permitted supply voltage range 90 to 132 VAC/180 to 264 VAC
Rated supply voltage frequency 50/60 Hz
Permitted supply voltage frequency range 48 to 63 Hz
Maximum power consumption 240 VA/300 VA
(when the built-in printer is used)
Typical power consumption 150 VA (at 100 VAC)
(when the built-in printer is not used) /190 VA (at 200 VAC)
3
Before Starting Observation and Measurement of Waveforms
3-pin AC outlet
Power cord
(supplied with instrument)
IM 701530-01E
3-3
Page 46

3.4 Turning the Power Switch ON/OFF
Points to be Checked before Turning ON the Power
Check that the instrument is correctly installed as described in Section 3.2
“Installing the Main Unit” (page 3-2).
Check that the power cord is correctly connected as shown in Section 3.3
“Connecting the Power Cord” (page 3-3).
Location of the Power Switch
The power switch is located on the front panel in the lower left corner.
Turning the Power Switch ON/OFF
The power switch is a push-button type switch, and the power is turned ON and
OFF alternately as the switch is pressed.
OFF ON
The Order in Turning the Power Switches ON/OFF
When peripheral devices are connected to the half pitch interface connector of the
this instrument, turn ON the power switches on all peripheral devices first, then turn
ON the power switch of this instrument. When turning OFF the power, reverse the
order.
Action When Power is Switched ON
Calibration (correction of the ground level and gain etc.) starts automatically when
the power switch is turned ON. Front panel keys are not operative during calibration
(which lasts approximately seven seconds). When calibration has been completed,
the normal waveform display screen will appear.
Note
If calibration does not start when the power switch is turned ON, or if the normal waveform
display screen does not appear, check the following points.
• Check that the power cord is plugged in properly.
• Check that the correct voltage is being supplied from the AC outlet. (Refer to page 3-3.)
• Check that the fuse is not blown. (Refer to page 15-7.)
• If the power switch is turned ON while the INITIALIZE key is pressed, all settings will be reset
to the factory settings. For details, refer to Section 4.3 “Initializing Settings” (page 4-4).
If there is still no power even after the above points have been checked, contact your nearest
YOKOGAWA representative as listed on the back cover of this manual.
For Accurate Observation and Measurement
Turn the power switches ON and allow the unit to warm up for approximately 30
minutes.
Just before starting observation/measurement, perform calibration. The ground
level and gain etc. will be corrected. For a description of the calibration method,
refer to Section 4.5 “Performing Calibration” (page 4-6).
Action When Power is Switched OFF
Settings made prior to turning OFF the power switch are retained. This allows
display of waveforms using these saved settings the next time the power switch is
turned ON.
3-4
Note
The settings are backed up by a lithium battery. The battery lasts for approximately five years if
it is used at an ambient temperature of 23 °C. When the battery runs out, an icon Li appears
in the top left of the screen. In this case, the battery needs to be replaced immediately. The
battery cannot be replaced by the user. Contact your nearest YOKOGAWA representative as
listed on the back cover of this manual.
IM 701530-01E
Page 47

3.5 Connecting a Probe
Input Terminals
A probe (or an input cable such as a BNC cable) must be connected to one of the
input terminals (CH1 to CH4) located on the lower section of the front panel.
The input impedance is 1 MΩ ±1.5% and approximately 25 pF.
CAUTION
The maximum input voltage is 250 V (DC + ACpeak) or 177 Vrms when the
frequency is 1 kHz or less. Never input a voltage exceeding this level, as it
could damage the input section of the instrument. If the frequency exceeds 1
kHz, the input section may be damaged even when the voltage is below 250 V.
1
Points to Note when Connecting a Probe
• When connecting a probe to the instrument for the first time, perform phase
correction of the probe as described in the next section on page 3-7. Failure to do
so may result in unstable gain across different frequencies, thereby preventing
correct measurement. Calibration must be performed for each channel.
• If the object to be measured is connected to the instrument directly, without using
a probe, correct measurement cannot be performed due to the load effect.
Probe
Specifications for the probe (700998) supplied with the instrument (after
calibration)
Item Specifications Conditions
Input impedance/capacitance 10 MΩ ±2%/approx. 14 pF 1 MΩ ±1.5%/approx. 100 pF When used with this
Attenuation ratio 10:1 ±2.5% — When used with this
Frequency band DC to 150 MHz DC to 6 MHz When used with this
Rise time 2.4 ns or less 58 ns or less When used with this
Maximum input voltage 600 V (DC + ACpeak) *1 —
Connector type BNC BNC —
Total length 1.5 m 1.5 m —
*1 When the probe's attenuation ratio is “1:1,” never input voltage exceeding the maximum input voltage of this
instrument.
Setting 10:1 Setting 1:1
or 424 Vrms, Frequency
is 100 kHz or lower
3
Before Starting Observation and Measurement of Waveforms
2
CH
3
1MΩ/25pF ≤ 250Vpk
CHCHCH
4
instrument
instrument
instrument
instrument
IM 701530-01E
When using a probe other than the one supplied with the instrument
To measure a signal which contains harmonics of approximately 150 MHz, use a
probe with a frequency band of 150 MHz or higher.
Correct measured values cannot be displayed if the probe’s attenuation ratio is not
“1:1”, “10:1”, “100:1” or “1000:1”.
When a probe other than 1 MΩ probe (for example a 50 Ω probe) is to be used,
connect a through-type 50 Ω terminator
*2 When placing an order for the 50 Ω terminator as the one supplied with the instrument,
quote the number “700976”.
*2
for impedance matching.
Setting the probe attenuation
Follow the operating procedure given in Section 5.3 “Setting the Probe Attenuation”
(page 5-4) so that the probe’s attenuation matches the one displayed below “Probe”
in the soft key menu which appears when the INPUT key is pressed. If they do not
match, measured values cannot be read correctly.
3-5
Page 48

3.6 Compensating the Probe (Phase Correction)
CAUTION
Never apply an external voltage to the COMP terminal, as damage to the
instrument may result.
Operating Procedure
1. Turn ON the power switch.
2. Connect the probe to the input terminal to which the signal is to be applied.
3. Touch the probe’s tip against the CAL output terminal and connect the grounding
4. Press the A UTO-SETUP key.
5. Press the “AUTOSET EXEC” soft key. The phase correction signal is displayed
6. Insert a screwdriver into the trimmer adjusting hole in the probe and turn the
Explanation
Reason for probe compensation
If the probe’s input capacitance is outside the specified range, the gain will not be
constant across different frequencies, preventing display of the correct waveforms.
The input capacitance varies depending on the probe used, so the variable
capacitor (trimmer) provided on the probe must be adjusted.
Probe compensation must be performed when the probe is to be used for the first
time.
Moreover, the appropriate input capacitance varies according to which channel is
used, so probe compensation is required when the probe is switched from one
channel to another.
wire to the grounding function terminal.
on the screen.
trimmer so that the displayed waveform becomes square.
Phase adjusting hole
CAL signal output terminal
Grounding function terminal
3-6
Phase correction signal
A phase correction signal (square waveform) of the following characteristics is
output from the COMP terminal on the front panel.
Frequency : Approx. 1 kHz
Amplitude: Approx. 1 V
Waveform differences
Correct waveform Over-compensated
(gain is too high at high
frequency)
Under-compensated
(gain is too low at high
frequency)
IM 701530-01E
Page 49

3.7 Setting the Date and Time
Keys and Procedure
Rotary knob
SELECT key
ESC key
Soft keys
MISC key
1. Press the MISC key to display the MISC menu.
2. Press the “Date/Time” soft key to display the DATE/TIME
setting menu.
Turning the Date/Time ON/OFF
3. Turn the rotary knob to select “Mode”, and select “ON” or “OFF”
using the SELECT key.
Setting the Date/Time
4. Turn the rotary knob to select “Year”, “Month”, “Day”, “Hour”,
“Minute” or “Second”. Press the SELECT key to display the
setting screen.
5. Set the required value using the rotary knob.
6. Press the SELECT key or the ESC key to close the setting
screen.
7. Repeat steps 4 to 6 until all necessary items are set.
8. Turn the rotary knob to select “SET” and press the SELECT key
to confirm the settings.
9. Press the ESC key to close the menu.
3
Before Starting Observation and Measurement of Waveforms
Explanation
Setting the Date/Time ON or OFF
When you set the mode to ON, the date and time will appear in the upper left corner
of the screen. And when making a hard copy of the screen (to the built-in printer or
external plotter) the date and time will be printed together with the waveform.
The current date and time are saved together with the waveform data or set-up data
when the data is saved to a floppy disk.
Setting values of Date/Time
DATE TIME
Year : 1980 to 2079 Hour : 00 to 23
Month : 1 to 12 Minute : 00 to 59
Day : 1 to 31 Second : 00 to 59
Note
• The date and time are backed up by the built-in lithium battery.
• Leap years are provided. Turn the rotary knob to select “SET” and press the SELECT key to
judge.
IM 701530-01E
3-7
Page 50

Chapter4 Common Operations
4.1 Starting and Stopping Acquisition
Keys and Procedure
START/STOP key
Explanation
1. Press the START/STOP key to start/stop waveform
acquisitioning.
2. In case the indicator located at the upper left of the START/
STOP key is lit, waveform acquisition is in progress.
3. In case the indicator located at the upper left of the START/
STOP key is not lit, waveform acquisition is not in progress. In
the upper left corner of the screen, “Stopped” appears.
4
Common Operations
Operation when averaging mode is selected as the acquisition mode
Averaging stops when acquisition is stopped, and resumes when acquisition is
restarted.
Operation during display of accumulated waveforms
Accumulated display stops temporarily when acquisition is stopped. When
measurement is restarted, the accumulated display is reset and accumulation
starts.
The START/STOP key is not operative in the following cases
• When remote state is active (i.e. the REMOTE indicator is lit);
• When a short or long copy is being output to the built-in printer;
• When the floppy disk is being accessed (e.g. when data is being saved to it). (If
acquisition is in progress, access to the floppy disk starts after acquisition is
stopped.);
• When calibration, auto set-up or initialization is in progress.
Operation in combination with external clock
When the external clock is being used and you start acquisition, the error messages
“Ext clock too slow” or “Ext clock too fast” might appear.
Note
• If the START/STOP key is pressed to start acquisition while acquisition data (ACQ data)
loaded from a floppy are being displayed, the acquisition data will disappear from the screen.
It is possible to retain the waveform on screen by stopping acquisition only for the channel
corresponding to the trace No. of the waveform. For a description of this operation, refer to
page 12-6.
• For details regarding the external clock settings, refer to page 5-8.
IM 701530-01E
4-1
Page 51

4.2 Displaying Waveforms using the Auto Set-up Function
Keys and Procedure
AUTO-SETUP key
Soft keys
Explanation
1. Press the AUTO-SETUP key to display the auto set-up
execution menu.
Executing auto set-up
2. Press the “AUTOSET EXEC” soft key to perform auto set-up.
Channels will be turned ON/OFF automatically depending on
whether input is applied or not.
Canceling auto set-up
3. Press the “UNDO” soft key to restore the previous settings
which were in effect before the auto set-up. Note however that,
if you have performed any other settings, it might be necessary
to press the AUTO-SETUP key once again.
Waveforms for which auto set-up is effective
Frequency : Approx. 40 Hz to 150 MHz
Amplitude : Approx. 50 mV or higher (when probe attenuation is 1:1)
Type : Repetitive (but not complex) waveform
Auto set-up settings related to the vertical axis
CH1 to 4 Depending on whether input is applied or not, the channels are
automatically turned ON or OFF. (In case of an amplitude of at least
approx. 50 mV (and probe attenuation is 1:1), the channel will be
turned ON).
V/DIV when one waveform is displayed : Set to a value so that the
peak voltage is between 1.6
div p-p and 4 div p-p.
when two waveforms are displayed : Set to a value so that the
peak voltage is between 0.8
div p-p and 2 div p-p.
when three waveforms are displayed : Set to a value so that the
peak voltage is between 0.4
div p-p and 1 div p-p.
when four waveforms are displayed : Set to a value so that the
peak voltage is between 0.4
div p-p and 1 div p-p.
POSITION Set as follows depending on the number of channels which are ON.
4-2
Single channel Two channels Three channels Four channels
INPUT • Input coupling: DC; Offset: 0V
• Inversion: Unchanged
• Probe attenuation : Unchanged
Probe attenuation must be set before starting auto set-up.
• Acquisition hold : Unchanged
IM 701530-01E
Page 52

4.2 Displaying Waveforms using the Auto Set-up Function
Auto set-up settings related to the horizontal axis
TIME/DIV Time axis is set so that the waveform with the longest cycle
shows 2 to 4 cycles on the screen.
If this is not possible for any of the channel input signals, set to
1ms/div.
TIMEBASE Set to “INT”.
Auto set-up settings related to triggers
MODE Set to “AUTO”.
TYPE Set to “EDGE”.
LEVEL/SOURCE The trigger level is set to half the amplitude of the trigger source.
The Channel having the waveform with the longest cycle is
selected as the trigger source. The slope setting is set to “
COUPLING Set to “DC”, HF rejection remains unchanged.
POSITION Set to 0div.
DELAY Set to “0s”.
HOLD OFF Set to “OFF”.
Auto set-up settings related to acquisition/display conditions
START/STOP Acquisition is started.
ACQUISITION Set to “NORMAL”.
LENGTH (for DL1540CL)
Unchanged.
FILTER Smoothing is set to “OFF”, Band to “FULL”.
ZOOM Mode is set to “OFF”, and other settings remain unchanged.
DISPLAY Settings related to interpolation, the X-Y display, and accumulate
display remain unchanged.
DISPLAY FORM Settings related to graticule, scale, %marker and Waveform
information remain unchanged.
”.
4
Common Operations
Auto set-up settings related to waveform analysis
MEASURE Settings related to automated measurements remain
unchanged.
CURSOR Settings related to cursor measurements remain unchanged.
MATH Waveform computation and phase shift are set to “OFF”.
Other Auto set-up related settings
STORE/RECALL Display of recalled waveforms is set to “OFF”.
SAVE/LOAD Display of loaded waveforms is set to “OFF”.
UNDO : Cancellation of auto set-up
After auto set-up has been completed, this function allows you to restore the
settings which were in effect before the auto set-up was performed.
However, if the power is turned OFF, the settings which were in effect before the
auto set-up will be lost. Thus, it is not possible to perform an UNDO before an auto
set-up.
Note
• It is not possible to perform auto set-up while GO/NO-GO determination is in progress.
• The snapshot waveform will be deleted if auto set-up is performed.
• The auto set-up function may not operate correctly in certain cases such as when the waveform
contains DC components or high frequency components.
IM 701530-01E
4-3
Page 53

4.3 Initializing Settings
Keys and Procedure
INITIALIZE key
Soft keys
Explanation
1. Press the INITIALIZE key to display the initialization execution
menu.
2. Press the “INITIAL EXEC” soft key to execute initialization.
Default settings related to the vertical and horizontal axes
CH1 to CH4 All channels ON
V/DIV 50 V/div
POSITION The horizontal position is set to 0div. For the vertical position,
refer to the figures (Two channels, Four channels) given under
title “POSITION” in section 4.2.
INPUT Input coupling: DC, Probe attenuation: 10:1, Inversion: OFF
TIME/DIV 1 ms/div
TIMEBASE INT
Default settings related to trigger
MODE AUTO
FUNCTION EDGE
LEVEL/SOURCE Trigger source: CH1, Trigger slope: “
COUPLING Trigger coupling: AC, HF rejection: OFF
POSITION Center of the waveform display frame
DELAY Delay time: 0 s
HOLD OFF Mode: OFF, Hold-off time: MIN (0.2µs)
”,Trigger level: 0 V
Default settings related to other settings
ACQUISITION Mode: NORMAL
LENGTH (for DL1540CL)
Record length: 10K
FILTER Smoothing: OFF, Band limit: FULL
DISPLAY Interpolation: SINE, X-Y display: OFF, Accumulate: OFF, Wide
screen:OFF
DISPLAY FORM Graticule: GRID, Scale: ON, % Marker: OFF, Waveform
information: ON, Intensity: TEXT (9)
SHIFT OFF (LED is not lit)
Settings which cannot be initialized
In the following cases, the settings which were in effect before initialization will be
retained even if initialization is performed.
• Date and time
• Displayed waveforms/setting parameters stored in the internal memory
• GO/NO-GO zone waveforms
• Communications addresses
Points to note when initializing
• Snapshot waveforms will be deleted when initialization is performed.
• Operations such as measurements, computations, etc. will be halted.
• Initialization cannot be performed during GO/NO-GO.
4-4
IM 701530-01E
Page 54

4.4 Halting a Waveform and Erasing the Halted Waveform (Snapshot and Clear Trace)
Keys and Procedure
SNAP SHOT key
CLEAR TRACE key
Explanation
1. Press the SNAP SHOT key to halt the waveform.
2. Press the CLEAR TRACE key to erase the halting waveform.
4
Common Operations
Snap Shot Function
A snapshot waveform is displayed each time the SNAP SHOT key is pressed and
will be deleted when you switch between MAIN/ZOOM or MainZoom display, or
when initialization of settings is performed.
A snapshot cannot be performed during X-Y wavefor m display.
In order to view snapshot waveforms only, you can either turn off the input signal
(by pressing the CH key), or move the vertical position of the displayed channel.
Snapshot waveforms will remain on the screen even if calibration is performed.
The following operations are not possible on snapshot waveforms.
• Position movement
• Cursor measurement
• Automated measurement
• Expansion
• Waveform computation
• Storage in the internal memory
• Outputting to an external plotter
• Saving on a floppy disk in case of the HP-GL and PS format
Functions of the CLEAR TRACE key
Deletes the following waveforms.
• Snapshot waveform
• Accumulated waveform (refer to page 7-13)
Restarts the following operations.
• Averaging (refer to page 7-1)
• Equivalent time sampling
IM 701530-01E
4-5
Page 55

4.5 Performing Calibration
Keys and Procedure
Soft keys
CAL key
Explanation
1. Press the CAL key to display the calibration execution menu.
Executing manual calibration
2. Press the “EXEC” soft key to execute calibration.
Turning automatic calibration ON
3. Press the “Auto CAL” soft key to select “ON”.
About the calibration function
The following parameters are calibrated.
• Ground level offset
• A/D converter gain
• Trigger threshold level
• Time axis for equivalent time sampling
Calibration takes approximately five seconds. No keys are operative during
calibration.
Automatic calibration function
When the automatic calibration function is ON, calibration is performed
automatically after the following time periods has elapsed in case T/div has been
changed.
After the power is turned ON
3 minutes;
10 minutes;
30 minutes, then ever y half hour.
4-6
IM 701530-01E
Page 56

4.6 Setting V alues
Keys and Procedure
Rotary knob
SELECT key
ESC key
Keys
corresponding
to keyboard
MISC(KEYBOARD) key
SHIFT key
<, > key
Entry using the keyboard
1. Press the SHIFT + MISC(KEYBOARD) key to display the
keyboard.
Setting by rotary knob and SELECT key
2. Use the rotary knob to select the desired value and press the
SELECT key. This allows setting one by one.
3. Select the “SET” key and press the SELECT key. The keyboard
screen will be closed.
Setting by corresponding panel keys
2. After having performed step 1, press the corresponding panel
keys directly.
3. After having entered the new value, select the “SET” key and
press the SELECT key. The keyboard screen will be closed.
Entry by rotary knob
1. Change the value (displayed in the lower right side of the
screen) by turning the rotary knob.
2. When the new value has been selected using the rotary knob,
use the <, > keys to move to the next position to be changed.
Ex.
4
Common Operations
Explanation
Entry using the keyboard
The operation described in step 1 will only result in displaying the corresponding
keyboard when the setting allows numerical input.
Depending on the setting, there are cases when units such as k, m, u (symbolizing
µ), EXP and NAN (Ignore) appear. To change such a setting, select the correct one
using the rotary knob, and press the SELECT key.
Pressing the RESET key will clear the keyboard display.
Decimal enterings will be rounded as necessary to comply with the step size.
Entry using the rotary knob
Pressing the RESET key will reset the value displayed in the rotary knob menu to
the default value (factory setting).
IM 701530-01E
4-7
Page 57

4.7 Entering Characters using the Keyboard
Keys and Procedure
Rotary knob
SELECT key
ESC key
<, > key
Explanation
1. Display the keyboard used for entering a file name or comment
(displayed when your are prompted a character input).
2. Use the rotary knob to select the desired character or symbol
and press the SELECT key. The entered character will appear
on the displayed keyboard.
3. Repeat step 2 until all characters and symbols are entered.
4. Move the rotary knob to the “ENT” setting and press the
SELECT key. The file name, comment and such will be set and
the keyboard screen will be closed.
Displaying the keyboard to enter characters/symbols
For entry of a file name, refer to
6.9 Setting the Action-On Trigger (page 6-15)
9.1 Judging using a Waveform Zone (page 9-1)
9.2 Judging using Measured Values of Waveform Parameters (page 9-8)
12.3 Saving and Loading Waveform Data (page 12-4)
13.5 Saving and Loading Waveform Data (page 13-6)
For entry of a comment, refer to
10.6 Entering a Comment (page 10-10)
Function keys on the soft keyboard
DEL ........ Deletes the character or symbol left of the cursor in the character string.
INS ......... Switches between insert and overwrite modes.
CAPS ..... Switches between upper and lower case letters.
CLR........ Deletes all entered characters and symbols. Has thus the same function
as the RESET key on the front panel.
SPACE... Enters one space.
ENT ........ Confirms the entered characters and symbols.
* Pressing the < or > key shifts the entry position (cursor) to the left or right.
ESC key. Abor ts entering file name or comments during setting. The keyboard
screen will be closed and setting will be ignored.
Points to note
• The following number of characters can be entered.
File name : 1 to 8
Comment : 0 to 25
• The following character types are available.
File name : Digits, letters (not case sensitive), _(underline), – (minus), %, (, )
Comment : All characters and symbols on the keyboard (case sensitive), and
space
• The following five file names are not available due to MS-DOS restrictions.
AUX, CON, PRN, NUL, CLOCK
4-8
IM 701530-01E
Page 58

Chapter 5 Setting the Vertical and Horizontal Axes
5.1 Turning Display of Input Signal Waveforms ON/ OFF
Keys and Procedure
CH key
Explanation
Maximum display record length and limits on waveform acquisition (when 2
MW for DL1540CL is selected)
The channels which acquire/display the waveform are limited to channel 1 and 2 on
DL1540CL. Channel 3 and 4 on DL1540CL do not acquire/display the waveform.
When the time axis setting is set to 50 ns to 5 ns range; when the trigger mode is
not single mode; or when one of the two, channel 2 or one of the two, channel 3 or
4 in the case of DL1540CL is ON, maximum display record length of 2 MW for
DL1540CL can not be selected.
For information about selection of maximum displayable record length, refer to
Section 7.1 (page 7-1).
CH key operation during waveform math
The math waveform will be displayed at trace 3 (location where the input signal of
channel 3 is usually displayed). Even if you press the CH3 key, and the indicator is
lit, the math waveform will be displayed.
The math waveform consists of data of channel 1 and channel 2. Even when you
turn off the display of channel 1 or 2, the math waveform will remain.
To display the input signal waveform of channel 3, you have to turn OFF waveform
math. Refer to page 8-18.
CH key operation during display of a recalled waveform
When you recall waveform data from the inter nal memor y, that waveform will
appear on the screen.
To turn the display of the recalled wavefor m off, press the CH key corresponding to
the number of the recalled waveform (displayed as “MEM”), and select OFF at the
appeared menu. Refer to page 11-2, step 13 and 14.
CH key operation during display of a loaded waveform
When you load P-P waveform data or acquisition waveform data from a floppy disk,
that waveform will appear on the screen.
To turn the display of the P-P waveform off, press the CH key corresponding to the
number of the P-P waveform (displayed as “MEM”), and select OFF at the appeared
menu. Refer to page 12-5, step 19 and 20.
To turn the display of the acquisition wavefor m off, press the CH key corresponding
to the number of the acquisition waveform.
CH key operation during display of a GO/NO-GO zone waveform
Pressing a CH key turns display of both the corresponding input signal waveform
and the zone waveform ON/OFF.
Note
• If the START/STOP key is pressed to start acquisition while loaded waveforms are displayed,
the displayed waveforms will be cleared from the screen. It is possible to retain a desired
waveform on screen by stopping acquisition of the corresponding channel. For a description
of this operation, refer to page 12-6.
• For DL1540CL, if you have saved ACQ data to multiple floppy disks, you can opt to load all of
this data or only part of it (for example, data from one disk only). If you do a partial load, the
waveform display will not appear over the entire time axis, but only over a portion of it. Refer
to the procedures for saving and loading of ACQ waveform data, beginning on page 12-5.
• Pressing the SNAP SHOT key also keeps the waveform on the screen. To clear the snapshot
waveform, press the CLEAR TRACE key.
• In the following cases erroneous waveforms might appear on channel 3 or 4. Acquiring the
waveform once again will result in a correct display.
• For DL1540C, when the record length is 120KW, the trigger mode is SGL (L) and waveform
acquisitioning has ended and you turn CH3 or CH4 ON, while they had been OFF until
then.
• After acquiring waveforms at 200 MS/s and you stop acquisition, and then you switch CH3 or
CH4 ON.
1. The waveform will appear on the display after you have pressed
the CH key. The indicator above the CH key will light up.
2. If you want to display all waveforms, press all the CH keys, and
verify that all the indicators light up.
3. In order to turn the display of a waveform off, press the
corresponding CH key once more.
5
Setting the Vertical and Horizontal Axes
IM 701530-01E
5-1
Page 59

5.2 Setting the Input Coupling
Keys and Procedure
Rotary knob
Soft keys
INPUT key
Explanation
1. Press the INPUT key corresponding to the channel for which
input coupling is to be selected. The input setting menu will be
displayed.
2. Press the soft key corresponding to the desired coupling type.
3. When DC is selected, turn the rotary knob to set the desired
offset voltage.
Input coupling
The following three types of input coupling are available. The default is “DC”.
AC Displays only the AC content of the input signal.
DC Displays both the DC and AC content of the input signal. Only in this case an
offset value can be set. This setting can also be done pressing the
KEYBOARD key (refer to page 4-7).
GND Used to check the ground level.
Input coupling and frequency characteristic
The frequency characteristic when “AC” or “DC” is selected is shown below.
Note that low-frequency signals and low-frequency contents are not acquired if “AC”
is selected.
When "AC" is selected When "DC" is selected
Attenuation
0 dB
– 3 dB
less than 10 Hz when using 1:1 probe
less than 1 Hz when using 10:1 probe
Input frequency
150 MHz
Attenuation
0 dB
– 3 dB
150 MHz
Input frequency
Offset voltage and vertical sensitivity
If “DC” is selected, it is possible to cancel the offset voltage for the input signal.
The allowable setting range varies depending on the vertical sensitivity as shown in
the table below.
Vertical sensitivity* Allowable setting range* Setting step
10 mV to 500 mV/div –10 V to ±10 V 500 µV
1 V to 5 V/div –100 V to ±100 V 5 mV
10 V to 50 V/div –1000 V to ±1000 V 50 mV
* The above values are given for a probe attenuation of 10:1. They will be 1/10 the value
shown when the attenuation is 1:1, 10 times the value shown when it is 100:1, and 100
times the value shown when it is 1000:1.
5-2
IM 701530-01E
Page 60

5.2 Setting the Input Coupling
Offset voltage and displayed value (measured value)
The offset function eliminates unnecessary DC voltage from an input signal voltage.
If the offset voltage is set to a positive value, the input signal is displayed with the
offset voltage subtracted from it, as shown below. The offset voltage is also
subtracted from the measured voltages obtained during automated measurements.
offset : aV
Decreases by "a" V.
CAUTION
Points to note when setting the offset voltage
• Once the offset voltage has been set, it will not change unless initialization is
performed. For instance, if the input coupling is set to “AC” after the offset voltage
has been set, the offset voltage will remain unchanged even if the input coupling
is later switched to “DC”.
• When the probe attenuation is changed, the offset voltage also changes
accordingly.
• The offset voltage remains unchanged irrespective of the vertical sensitivity.
However, if the offset voltage exceeds the allowable setting range, it will be set to
the maximum or minimum vertical sensitivity value.
• When the offset voltage is set, it will also be subtracted from the acquired
waveform data in acquisition memor y. Thus, care must be taken when saving
acquisition data.
When using AC coupling with a 10 MΩ, 10:1 probe, keep in mind that the
voltage at the input connector will not be attenuated to 1/10 at the probe tip
for input signal components below 1 Hz. Be careful not to let the input voltage
at the probe tip exceed 250 V (DC+ACpeak) or 177 Vrms for signal
components below 1 Hz.
5
Setting the Vertical and Horizontal Axes
IM 701530-01E
5-3
Page 61

5.3 Setting the Probe Attenuation
Keys and Procedure
Soft keys
INPUT key
Explanation
1. Press the INPUT key corresponding to the channel for which
the probe attenuation is to be selected. The input setting menu
will be displayed.
2. Press the “Probe” soft key to display the probe selection menu.
3. Press the soft key corresponding to the desired attenuation.
Probe attenuation
Probe attenuation can be selected from “1:1”, “10:1”, “100:1” and “1000:1”. The
default is “10:1”.
Set to “10:1” when using the probe supplied with the instrument.
Set to “1:1” when using a BNC cable.
Note
The selected probe attenuation will remain unchanged even if auto set-up is performed.
When the probe attenuation is changed, the offset voltage also changes accordingly.
5-4
IM 701530-01E
Page 62

5.4 Inverting a Waveform
Keys and Procedure
Soft keys
INPUT key
Explanation
1. Press the INPUT key corresponding to the channel whose
waveform is to be inverted. The input setting menu will be
displayed.
2. Press the “Invert” soft key to select “ON”.
5
Setting the Vertical and Horizontal Axes
Relevant channels
The input signals for channels CH1 to CH4 can be inverted independently of one
another. Each time the soft key is pressed, “ON” or “OFF” are displayed alternately,
and the waveform will be inverted accordingly.
Indication of an inverted signal
When a waveform is inverted, the corresponding trace number is highlighted as
shown below.
Points to note
• Cursor measurement, automated measurement, waveform math and GO/NO-GO
determination are performed on the inverted waveforms, not on the original ones.
• The waveform data that will be saved in the acquisition memory will not be
inverted, so care must be taken when saving the acquisition data.
IM 701530-01E
5-5
Page 63

5.5 Setting the Vertical Sensitivity
Keys and Procedure
Rotary knob
soft keys
V/DIV key
Explanation
1. Press the V/DIV key of the desired channel to display the
vertical sensitivity setting menu. Verify that the “CAL” setting is
highlighted.
2. Turn the rotary knob to set the desired sensitivity (V/div).
3. In case you want to adjust the setting in smaller steps, press the
“Variable” soft key.
4. Turn the rotary knob to set the desired sensitivity.
Setting the range and probe attenuation
The V/div setting range varies depending on the attenuation of the probe used, as
shown below.
Probe attenuation Setting range*
1:1 1 mV to 5 V/div
10:1 10 mV to 50 V/div
100:1 100 mV to 500 V/div
1000:1 1 V to 5000 V/div
* V/div can be set in multiples of 1, 2 and 5, e.g. 1 V/div → 2 V/div → 5 V/div.
Variable mode
When “Variable” is highlighted, V/div can be set in fine steps as shown below.
CAL Setting value Variable Setting range* Setting step*
10 mV 5.0 mV to 20.0 mV 0.1 mV
20 mV 10.0 mV to 50.0 mV 0.1 mV
50 mV 20.0 mV to 100.0 mV 0.1 mV
100 mV 50 mV to 200 mV 1 mV
200 mV 100 mV to 500 mV 1 mV
500 mV 200 mV to 1000 mV 1 mV
1 V 0.5 V to 2.00 V 0.01 V
2 V 1.00 V to 5.00 V 0.01 V
5 V 2.00 V to 10.00 V 0.01 V
10 V 5.0 V to 20.0 V 0.1 V
20 V 10.0 V to 50.0 V 0.1 V
50 V 20.0 V to 100.0 V 0.1 V
* The above values are given for a probe attenuation of 10:1. They will be 1/10 of the
value shown when the attenuation is 1:1, 10 times the value shown when it is 100:1, and
100 times the value shown when it is 1000:1.
Note
• If the RESET key is pressed to reset V/div setting, V/div will be set to the maximum possible
level.
• For a description of how to set the probe attenuation, refer to page 5-4.
5-6
IM 701530-01E
Page 64

5.6 Changing the Waveform’s Vertical Position
Keys and Procedure
Rotary knob
Soft keys
1. Press the POSITION key of the channel whose waveform you
want to move.
2. Select the position of the screen where you want the waveform
to be displayed by pressing the corresponding soft key.
3. Turn the rotary knob to fine adjust the position.
Explanation
POSITION key
5
Setting the Vertical and Horizontal Axes
Moving range
The ground level can be moved up to ±4.000 div from the center of the waveform
display frame. This range can be travelled using the rotary knob. The soft keys
allow you to move the waveform quickly to either of the positions “–3div/–1div/0div/
+1div/+3div”.
Setting resolution
The ground level can be moved in steps of 0.02 divisions irrespective of the vertical
sensitivity.
Waveforms which cannot be moved
Snapshot waveforms
Indication of the vertical position
For an input signal waveform or computed waveform, the corresponding trace No.
and ground level mark are displayed on the left edge of the waveform display
frame. The trace No. and ground level mark also move with the waveform when the
waveform is moved.
For a recalled or loaded waveform, the trace No. (preceded by “L”) also moves with
the waveform when the waveform is moved.
IM 701530-01E
Ground level
mark
Trace No.
Note
• Waveforms can still be moved vertically if acquisition is in progress. However, if some parts of
the waveform exceed 10.24 divisions before acquisition is stopped, those parts will remain at
the end of the display frame even if the waveform is moved.
• If a waveform is moved vertically out of the waveform display frame, measured values obtained
during automated measurement or cursor measurement may not be accurate.
5-7
Page 65

5.7 Selecting the Timebase
Keys and Procedure
Rotary knob
Soft keys
MISC key
Explanation
1. Press the MISC key to display the MISC menu.
2. Press the “Time Base...” soft key to display the timebase setting
menu.
3. Select the required timebase by pressing the corresponding soft
key.
4. In case you selected “EXT IN” or “EXT CH4”, use the rotary
knob to set the required threshold level.
Selectable Timebases
Timebase can be selected from the following three types.
INT Internal clock signal
EXT IN Clock signal input to the EXT TRIG IN/EXT CLOCK IN terminal
EXT CH4 Clock signal input to the CH4 input terminal
When “EXT IN” is selected
Input a clock signal to the EXT TRIG IN/EXT CLOCK IN ter minal on the rear panel,
EXT TRIG terminal on the front panel). The clock signal must conform to the
specifications given below.
Item Specifications
Connector type BNC
Maximum input voltage ±6 V
Frequency range 40 Hz to 15 MHz
Input level TTL/CMOS level recommended
0.3 Vp-p or greater when measured
at the end of the connector
±0.15 V or greater relative to the
threshold level
Input impedance Approx. 1 MΩ
Threshold level 1.5 V or 0.15 V
Minimum pulse width 25 ns or more for both
High and Low levels
Input terminal
Example
(DL1540/DL1540L)
EXT CLOCK IN
EXT TRIG IN
±6V MAX 1MΩ
!
5-8
CAUTION
If a clock signal exceeding the maximum input voltage is input to the each
terminal, damage to the internal circuits of the instrument may result.
When “EXT CH4” is selected
Input a clock signal to the CH4 input terminal on the front panel. The clock signal
must conform to the specifications given below.
Item Specifications
Frequency range 40 Hz to 80 MHz
Input level 2 div p-p or higher
Input impedance 1 MΩ
Minimum pulse width 5 ns or more for both High and Low levels
Threshold level setting range for detection of edge : Voltage equivalent to ±5 div
IM 701530-01E
Page 66

5.7 Selecting the Timebase
Points to note when sampling using an external clock
• The clock signal must be continuous. No burst signal is allowed.
• If the frequency of the clock signal is out of specification, a warning message
“External Clock too slow” or “External Clock too fast” will be displayed at the top
of the screen. When the internal clock is switched to the external clock, no
waveforms will be displayed until the clock conforms to the specifications.
• Only real-time sampling mode is available.
• Envelope mode cannot be set.
• Display of waveforms is not possible in roll mode.
• No function to divide the clock signal is available.
• Since the time axis setting cannot be changed, expand the time axis if you want
to change the display range. For a description of expanding waveforms, refer to
page 7-4.
• Trigger delay setting is invalidated.
• The time measured by the cursor measurement or automated measurement
function is expressed in the number of pulses of the clock signal. No unit is
displayed.
5
Setting the Vertical and Horizontal Axes
IM 701530-01E
5-9
Page 67

5.8 Setting the Time Axis
Keys and Procedure
Time axis setting knob
Explanation
Turn the time axis setting knob to adjust the time axis setting.
The time axis setting value, displayed in the lower right corner
of the screen, will change accordingly.
Time axis setting range
T/div can be set within the range of 5 ns/div to 50 s/div (in multiples of 1, 2 and 5)
The relationship between sampling mode and display mode
Sampling mode and display mode change as follows according to the T/div setting.
For a detailed description of sampling mode and display mode, refer to page 1-5
and 1-6.
• If maximum displayable record length is set to 1 K (DL1540CL)
Time-axis setting Sampling mode Display mode *1
50 s to 50 ms/div Real-time Roll mode
20 ms to 1 µ s/div Real-time Update mode
500 ns to 100 ns/div Real-time/repetitive *2 Update mode
50 ns to 5 ns/div Repetitive Update mode
• If maximum displayable record length is set to 10 K or 100 K (DL1540CL), or
when DL1540C is used
Time-axis setting Sampling mode Display mode *1
50 s to 50 ms/div Real-time Roll mode
20 ms to 10 µ s/div Real-time Update mode
5 µ s to 100 ns/div Real-time/repetitive *2 Update mode
50 ns to 5 ns/div Repetitive Update mode
• If maximum displayable record length is set to 400 K (available only if trigger
mode is “single”, DL1540CL)
Time-axis setting Sampling mode Display mode *1
50 s to 200 ms/div Real-time Roll mode
100 ms to 100 ns/div Real-time Update mode
• If maximum displayable record length is set to 1 M (available only if trigger mode
is “single”, DL1540CL)
Time-axis setting Sampling mode Display mode *1
50 s to 500 ms/div Real-time Roll mode
200 ms to 100 ns/div Real-time Update mode
• If maximum displayable record length is set to 2 M (available if trigger mode is
“single” and display channel is 1 or 2, DL1540CL)
Time-axis setting Sampling mode Display mode *1
50 s to 1 s/div Real-time Roll mode
500 ms to 100 ns/div Real-time Update mode
*1 Indicates the display mode which is in effect when the tr igger mode is auto mode or
auto level mode and hyster isis is set off. For a description of how to set the trigger
mode, refer to 6.8 “Setting the Trigger Mode” (page 6-13).
*2 Either real-time or repetitive mode is possible. For a description of how to switch
modes, refer to 7.1 “Selecting Acquisition Mode, Sampling Mode and Record Length”
(page 7-1).
5-10
IM 701530-01E
Page 68

5.8 Setting the Time Axis
Relationship between sampling rate and record length
Reducing the time-per-division setting (“T/div” time axis setting) increases the
sampling rate. If T/div is set below some specific level, the displayed record length
will be shorter than the maximum displayable record length. For details, refer to
Appendix 2/Appendix 3.
Changing T/div while acquisition is in progress
T/div can still be changed when acquisition has been stopped with the START/
STOP key. The newly set T/div will come into effect when acquisition is restarted.
When T/div is changed while acquisition is in progress, the new T/div value will be
displayed below the T/div for the displayed waveform, as shown below.
T/div for the currently displayed waveform
T/div just after acquisition has started
Points to note
• T/div can be changed irrespective of the displayed menu, since a T/div setting
knob is available. But, for DL1540CL, note that it is not possible to select a short
time axis (50ns/div or less) if maximum displayable record length has been set to
400 KW, 1 MW, or 2 MW (for DL1540CL only). (See page 7-1.)
• The T/div setting has no effect if the external clock signal is selected as the
timebase.
• During expansion mode, the T/div obtained by dividing the normal display T/div
by the expansion ratio is displayed.
• If T/div is set so that roll mode is activated, averaging will not be performed on
the waveform data, even if the acquisition mode has been set to averaging mode
(“NORM” will be displayed instead of “AVG”).
• Even if the trigger mode is single mode, if T/div is set to a value within a certain
range, roll mode will still be activated. However, when a trigger is activated and
acquisition of data of the specified record length ends, waveform display will be
stopped.
• Pressing the CLEAR TRACE key while waveforms are displayed in repetitive
sampling mode will restart sampling.
5
Setting the Vertical and Horizontal Axes
IM 701530-01E
5-11
Page 69

5.9 Changing the Waveform’s Horizontal Position
Keys and Procedure
Rotary knob
Soft keys
POSITION key
Explanation
1. Press the POSITION key to display the menu for horizontal
positioning.
2. Select the position to where you want to move the viewing
frame by pressing the corresponding soft key.
3. Turn the rotary knob to fine adjust the position.
Moving range
The viewing frame can be moved up to ±5.00 div from the center of the waveform
display frame. This range can be travelled using the rotary knob. The soft keys
allow you to move the viewing frame quickly to either of the positions “–4div/0div/
+4div”.
Setting resolution
The frame can be moved in steps of 0.02 divisions irrespective of the horizontal
sensitivity.
Waveforms which cannot be moved
The viewing frame cannot be moved when snapshot waveforms are displayed.
Indication of the horizontal position
The trigger position marker will show the new position. In roll mode, a bargraph will
appear in the upper side of the screen and will show which part of the waveform is
shown on the screen.
Other modes than roll mode
Horizontal position is 0 div
Horizontal position is moved to +4 div
Horizontal position is moved to –4 div
Points to note
• The horizontal position cannot be changed while acquisition is in progress in the
roll mode. In order to move the horizontal position, first stop the acquisition.
• In all modes except the roll mode, changing the horizontal position might result in
cases where the displayed range exceeds the record length of the acquisition
memory. No wavefor m will be shown at that part of the displayed range.
• Even when the horizontal position has been changed, the zoom box will not
change its position on the display. Refer to page 7-4.
Roll mode
When the display is in roll mode and data acquisition has
been started, the horizontal position will automatically
be moved to +5 div.
Horizontal position is +5 div
Horizontal position is moved to 0 div
Horizontal position is moved to –4 div
+5 div
displayed range
0 div
displayed range
–4 div
displayed range
5-12
IM 701530-01E
Page 70

Chapter 6 Activating a Trigger
6.1 Relationship between Trigger Type and Trigger Source/Slope/Level
Settings which can be made with the LEVEL/SOURCE soft key or rotary knob
menu vary as shown below according to the selected trigger type. The setting
procedure for each trigger type is described on the page indicated below.
TYPE
Selects the trigger type
page 6-2
page 6-4
page 6-5
Selection of broadcasting type
page 6-7
Selection of field No./Line No.
LEVEL/
SOURCE
Selects trigger condition
Polarity selection
Selection of trigger source/slope/state
Sets the trigger source/slope
(state)/level
Selection of trigger source/slope
Trigger level
Center level
Width
Trigger level
6
Activating a Trigger
page 6-8
page 6-10
Selection of trigger conditions
Trigger level
When activating a trigger by state pattern only
Selection of trigger source/state
Selection of trigger condition
When activating a trigger in synchronization with the clock signal
Selection of the trigger slope of
the clock channel
Selection of trigger source/state
Selection of trigger condition
Selection of trigger source/state
Trigger level of clock channel
Select "X"
Trigger level
Selection of clock channel
Trigger level
IM 701530-01E
Pulse width
Trigger level
6-1
Page 71

6.2 Setting the Edge Trigger
Keys and Procedure
Rotary knob
Soft keys
TYPE key
LEVEL/SOURCE key
1. Press the TYPE key to display the trigger type selection menu.
2. Press the “EDGE” soft key.
(“OR”, “PATTERN” and “WIDTH” menus are optional.)
Selecting the trigger source and slope and setting the trigger level
3. Press the LEVEL/SOURCE key to display the trigger source
selection menu.
4. Press the soft key corresponding to the desired trigger source.
The trigger slope selection menu appears. When “LINE” is
selected, this menu will not be displayed and thus steps 5 to 11
are not necessary.
5. Keep pressing the soft key corresponding to the selected trigger
source until the desired slope is selected.
6. Turn the rotary knob to set the desired trigger level.
Types of Trigger sources and setting the trigger slope/level
CH1/CH2/CH3/CH4
Select one of these to select one of the input signals CH1 to CH4 as the trigger
source.
The trigger slope can be selected from the following three slope types.
Activates a trigger when the trigger source changes from a level below the
trigger level to one above the trigger level.
Activates a trigger when the trigger source changes from the level above the
trigger level to the one below the trigger level.
Activates a trigger in either of the above cases.
The setting range for the trigger level is within ±10 div of the vertical sensitivity, but
is however limited by the waveform display frame. For example, when the voltage
sensitivity is set to 50 mV/div, the trigger level to +300 mV and the ground level of
the trigger source is positioned at 0div, the trigger level becomes +250 mV. In case
the ground level of the trigger source is positioned at –3 div, the trigger level
becomes +300 mV. The setting step for the trigger level is 1/50 of the vertical
sensitivity.
6-2
CAUTION
EXT (external Trigger)
Select this when connecting the trigger signal source to the “EXT TRIG IN/EXT
CLOCK IN” terminal on the rear panel (also used as the terminal for an external
clock) and selecting the signal as the trigger source.
For the specifications of the terminal, refer to “When “EXT IN” is selected” in section 5.7
If a clock signal exceeding the above permissible maximum input voltage is
input to the each terminal, damage to the internal circuits of the instrument
may result.
The trigger slope must be selected from “
one of the channels CH1 to CH4 is selected. The trigger level must be either “0.15
V” or “1.5 V”.
• EXT range is ±1 V: –1 V to +1 V in steps of 4 mV
• EXT range is ±10 V: –10 V to +10 V in steps of 40 mV
”, “ ” and “ ” in the same way when
IM 701530-01E
Page 72

6.2 Setting the Edge Trigger
LINE (Line trigger)
Select this when the signal to be displayed is synchronized with the frequency of
the commercial power source (50 Hz /60 Hz) and you want to select the commercial
power source voltage signal as the trigger source signal.
Points to note when setting the edge trigger
• If the trigger type setting is changed, the edge trigger setting will be invalidated.
However, selecting the edge trigger will restore the previous edge trigger setting.
• If the trigger mode is not auto-level mode, the trigger level will not change once it
has been set. Thus, changing the amplitude of the trigger signal or changing the
offset may invalidate the tr igger level, thereby hindering activation of a trigger.
Conversely, if the trigger mode is auto-level mode, the median of the amplitude of
the trigger signal is detected and the trigger level is set to the median value
automatically if the trigger level is invalidated. For a detailed description, refer to
6.8 “Setting the Trigger Mode” (page 6-13).
Note
If the trigger slope is set to “up/down ”, no trigger can be activated either at “rise ” or “fall ”.
In this case, try to set an appropriate hold-off time. This may cause a trigger to be activated. For
a description of how to set the hold-off time, refer to page 6-20.
6
Activating a Trigger
IM 701530-01E
6-3
Page 73

6.3 Setting the Window Trigger
Keys and Procedure
Rotary knob
Soft keys
TYPE key
LEVEL/SOURCE key
Explanation
1. Press the TYPE key to display the trigger type selection menu.
2. Press the “WINDOW” soft key.
(“OR”, “PATTERN” and “WIDTH” menus are optional .)
Selecting the trigger condition and setting the window
3. Press the LEVEL/SOURCE key to display the trigger condition
selection menu.
4. Press either soft key “IN” or “OUT”.
5. Press the “CENTER” soft key and set the center level of the
window using the rotary knob.
6. Press the “WIDTH” soft key and set the width of the window
using the rotary knob.
Selecting the trigger condition and setting the window
The window trigger will only be applied to the input signal of channel 1.
Trigger conditions can be selected from the following types.
IN Trigger will be activated when the trigger source level enters a preset voltage
range.
OUT Trigger will be activated when the trigger source level exits from a preset
voltage range.
The center level of the window and the corresponding width can be set. The setting
limit and resolution for the trigger level is the same as for the edge trigger. Refer to
page 6-2. The smallest width of the window is the CAL setting of the vertical
sensitivity.
6-4
[IN]
CENTER
WIDTH
Trigger is activated
Window
Trigger is activated
[OUT]
CENTER
WIDTH
Trigger is activated
Window
Points to note when setting the window trigger
• If the trigger type setting is changed, the window trigger setting will be
invalidated. However, selecting the window trigger again will restore the previous
settings.
• Auto-mode operations are carried out even if the trigger mode is set to auto-level
mode.
IM 701530-01E
Page 74

6.4 Setting the TV Trigger
Keys and Procedure
Rotary knob
Soft keys
TYPE key
LEVEL/SOURCE key
1. Connect the video signal to the CH1 terminal.
2. Press the TYPE key to display the trigger type selection menu.
3. Press the “TV” soft key.
(“OR”, “PATTERN” and “WIDTH” menus are optional.)
Selecting the broadcasting system for the video signal
If OR, PATTERN and WIDTH menus are not provided, the select
menu will be displayed next to the trigger type selection menu.
4. Press any of the “NTSC”, “PAL” or “HDTV” soft key to select the
desired broadcasting system.
Selecting the field and line number
If OR, PATTERN and WIDTH menus are not provided, the select
menu will be displayed next to the trigger type selection menu.
5. Press the “Field” soft key to select the desired field number.
6. Turn the rotary knob to select the desired line number.
Selecting the polarity and setting the trigger level
7. Press the LEVEL/SOURCE key to display the polarity/trigger
level setting menu.
8. Press the soft key corresponding to the desired polarity.
9. Turn the rotary knob to set the desired trigger level.
6
Activating a Trigger
Explanation
Selecting the polarity and setting the frame skip
7. After step 6, press the “Frame” soft key to display the frame
skip selection menu.
8. Press the desired frame skip soft key.
Broadcasting systems with which the TV trigger can be used
NTSC, PAL, HDTV
Selecting the field No. : Field
1 Detects a field in which the vertical synchronizing pulse and the line start at the
same time.
2 Detects a field in which the vertical synchronizing pulse starts 1/2H (H: horizontal
scan time) after the line starts.
X Detects both of the above types of field.
IM 701530-01E
6-5
Page 75

621 622 623 624 625
234567(1)
Field 1
308 309 310 311 312 313 315314 316 318317 320319
Field 2
Line No.
1246 1250
632626
1251
Line No.
933 945
Line Nos. in ( ) cannot be set.
6.4 Setting the TV Trigger
Line No.
Line No.
Selecting the line No. : Line
A trigger is activated at the beginning of the selected line.
• NTSC : 5 to 1054
Field 1 starts at line No. “5”. (Field 2 starts at line No. “268”.)
Line Nos. in ( ) cannot be set.
Field 1
(1)(2)(3)(4)567891011121314151617181920212223
524525
Line No.
526 548
1049 1050
1051 1052
Field 2
262263264 265 266267268269 270 271 272273274 275 276 277278279280 281 282283284285
Line No.
261
786 810
• PAL : 2 to 1251
Field 1 starts at line No. “2”. Field 2 starts at line No. “315”.
• HDTV : 2 to 2251 (available on DL1540C/DL1540CL)
Field 1 starts at line No. “2”. Field 2 starts at line No. “565”.
5H 5H 35H
5H 5H 34H
1/2H 1/2H
2251
1126 1127 1128 1129 1130 1131 1132 1166
(1)234567 41
Field 1
Field 2
2245 2250
1120 1125
1682 1687 1688 1169 1170 1171 1172 1173 1174 1728
557 562 563 564 565 566 567 568 569 603
Line Nos. in ( ) cannot be set.
517H45H
518H45H
Selecting the polarity: Polarity
NTSC /PAL
HDTV
Setting the trigger level : Level
Set the difference between the beginning of the synchronization pulse and the level
at which the trigger level is judged.
The setting range is from 0.10 div to 2.00 div. The setting resolution is 0.05 div.
The default settings are given below.
NTSC/PAL 0.50 div
HDTV 1.00 div
Trigger level
Trigger point
Trigger level
POSITIVE
Trigger point
NEGATIVE
Trigger point
Trigger level
Synchronization pulse
Trigger level
Trigger point
6-6
IM 701530-01E
Page 76

6.4 Setting the TV Trigger
Setting frame skip: Frame
This is a function for skipping frames when the color burst is inverted on every
frame. You can select how many frames to skip from the following choices.
Frame1 : Trigger every frame at the specified field.
Frame2 : Tr igger every two frames at the specified field.
Frame4 : Trigger every four frames at the specified field.
Frame8 : Tr igger every eight frames at the specified field.
However, the frame skip function can be used only for the following cases. For all
other frame periods, set “HoldOff.”
• NTSC with 60-Hz frame period
• PAL with 50-Hz frame period
• HDTV with 60-Hz frame period
Note
• Frames will not be skipped, if you change the “HoldOff” setting after setting the frame skip
function. If you wish to trigger using the frame skip function, make the Frame selection again.
• If you select Frame4 or Frame8, the trigger mode is automatically changed to normal mode.
However, if the “ACQ Hold” of the INPUT key is ON, the trigger mode is not changed
automatically. In this case, change the trigger mode to normal mode before using the frame
skip function.
Points to note when activating a TV trigger
• If the trigger type setting is changed, the TV trigger setting will be invalidated.
However, selecting the TV trigger again will restore the previous settings.
• Only channel 1 can be used for the video signal. Other channels cannot be used.
• For a TV trigger, the trigger coupling, HF rejection and trigger hysteresis settings
are ignored.
6
Activating a Trigger
IM 701530-01E
6-7
Page 77

6.5 Setting the OR Trigger (Optional)
Keys and Procedure
Rotary knob
Soft keys
TYPE key
LEVEL/SOURCE key
Explanation
1. Press the TYPE key to display the trigger type selection menu.
2. Press the “OR” soft key.
Selecting the trigger source, trigger slope and state and setting
the trigger level
3. Press the LEVEL/SOURCE key to display the trigger source
selection menu.
4. Press the soft key corresponding to the desired signal source,
and press the corresponding soft key to select the desired
trigger slope/state selection.
5. In case you selected “
desired trigger level.
Repeat steps 4 and 5 to set the trigger slope, state and level for
each trigger source.
Types of trigger sources and setting the trigger slope, state and level
CH1/CH2/CH3/CH4
Selects which of the input signals CH1 to CH4 will be used as the trigger source.
Select the trigger slope/state from the following.
Activates a trigger when the trigger source changes from a level below the
trigger level to one above the trigger level.
Activates a trigger when the trigger source changes from the level above the
trigger level to the one below the trigger level.
X This channel will be skipped as a trigger source.
The setting limit and resolution for the trigger level is the same as for the edge
trigger. Refer to page 6-2.
” or “ ”, use the rotary knob to set the
Points to note when setting the OR trigger
• If the trigger type setting is changed, the OR trigger setting will be invalidated.
However, selecting the OR trigger again will restore the previous settings.
• Auto-mode operations are carried out even if the trigger mode is set auto-level
mode.
6-8
IM 701530-01E
Page 78

6.6 Setting the Pattern Trigger (Optional)
Keys and Procedure
Rotary knob
Soft keys
TYPE key
LEVEL/SOURCE key
1. Press the TYPE key to display the trigger type selection menu
and press the “PATTERN” soft key.
2. Press the LEVEL/SOURCE key to display the trigger source/
state selection menu.
3. Press the “ClkCH” soft key to display the clock channel
selection menu. The default value is “X”.
Activating a trigger by state pattern only
4. Press the “X” soft key.
5. Press the trigger source soft key and select the state. Do this for
all trigger sources. In case “H” or “L” has been selected, use the
rotary knob to set the trigger level as well. Skip to step 7.
Activating a trigger in synchronization with the clock signal
4. Continuing from step 3, select the desired clock channel and
press the corresponding soft key.
5. Select the trigger slope of the clock channel using the soft keys,
and then use the rotary knob to set the trigger level.
6
Activating a Trigger
6. Press the trigger source soft key for the channels which are not
clock channel, and select the trigger state. In case “H” or “L”
has been selected, use the rotary knob to set the trigger level as
well.
7. Press the “Condtn” soft key and select the desired conditions
using the corresponding soft keys.
• menu in case of activating a trigger by state pattern only
• menu in case of activating a trigger in synchronization with the
clock signal
IM 701530-01E
6-9
Page 79

6.6 Setting the Pattern Trigger (Optional)
Explanation
Setting the trigger source and trigger state/level
The trigger state can be selected from the following.
L The trigger source level is above the preset trigger level.
H The trigger source level is below the preset trigger level.
X Not used as the trigger source.
The setting limit and resolution for the trigger level is the same as for the edge
trigger. Refer to page 6-2.
Selecting the clock channel (ClkCH)
Set the clock channel to “X” when no trigger in synchronization with the signal is
activated, and select from “CH1 - CH4” when a trigger in synchronization with the
signal is activated.
The following trigger slopes can be selected.
Slope rising edge (changes from a level below the trigger level to one above the
trigger level)
Slope falling edge (changes from a level above the trigger level to one below the
trigger level)
Selecting the trigger condition: Condtn
• Activating a trigger using only the state pattern
Select the trigger condition from the following.
ENTER Activates a trigger when the combination (pattern) becomes true.
EXIT Activates a trigger when the pattern becomes false.
[Setting example]
CH1 : H
CH2 : L
CH3 : X
CH4 : X
CH1 input
CH2 input
Pattern
becomes false.
Pattern
becomes true.
Trigger conditions are met
Condition: ENTER
• Activating a trigger in synchronization with the clock signal
Select the trigger condition from the following.
TRUE Activates a trigger on the slope edge (riseor fall) of the clock channel
when the state pattern becomes true.
FALSE Activates a trigger on the slope edge of the clock channel when the
state pattern becomes false.
[Setting example]
CH1 : H
CH2 : L
CH4 : X
Clock CH: CH3
Condition: TRUE
CH1 input
CH2 input
CH3 input
Pattern
becomes false
Pattern
becomes true
Trigger conditions are met
Pattern
becomes
false
Pattern
becomes
true
Points to note when setting the pattern trigger
• If the trigger type setting is changed, the pattern trigger setting will be invalidated.
However, selecting the pattern trigger again will restore the previous settings.
• Auto-mode operations are carried out even if the trigger mode is set to auto-level
mode.
• Select the trigger states for all trigger sources. Make sure to select the trigger
slope for the selected clock channel.
• If you want to activate a trigger in synchronization with the clock signal, make
sure that the pattern set-up time is 2 ns or more relative to the clock and that the
hold-time is 0 ns or less.
6-10
IM 701530-01E
Page 80

6.7 Setting the Width Trigger (Optional)
Keys and Procedure
Rotary knob
Soft keys
TYPE key
LEVEL/SOURCE key
Selecting the width trigger
1. Press the TYPE key to display the trigger type selection menu.
2. Press the “Width” soft key to display the width condition menu.
3. Select the width condition by pressing any of the “PULSE<T”,
“PULSE>T” or “TIMEOUT” soft keys.
4. Turn the rotary knob to set the desired pulse time.
Selecting the trigger source/state and setting the trigger level
5. Press the LEVEL/SOURCE key to display the trigger source
selection menu.
6. Press the soft key corresponding to the channel to be used as a
trigger source and set the trigger state.
7. Turn the rotary knob to set the desired trigger level.
6
Activating a Trigger
Explanation
Selecting the width condition
PULSE<T Trigger will be activated when the pulse width of the trigger source
becomes narrower than the preset pulse width.
PULSE>T Trigger will be activated when the pulse width of the trigger source is
wider than the preset pulse width and the state changes.
TIMEOUT Trigger will be activated when the pulse width of the trigger source
becomes wider than the preset pulse width.
[PULSE<T]
Trigger point
W
[PULSE>T]
[TIMEOUT]
WW
W W
Trigger point
(TIMEOUT)
Trigger point
(PULSE>T)
IM 701530-01E
6-11
Page 81

6.7 Setting the Width Trigger (Optional)
Width setting range and setting steps
Width setting range and setting steps are given below. The setting accuracy of the
width is within ± (2 ns + set value x 0.01), approximately.
Setting range Setting steps
5 ns to 9.99 µs
10 µs to 99.9 µs 100 ns
1 ms to 9.999 ms 1 µs
10 ms to 99.99 ms 10 µs
100 ms to 999.9 ms 100 µs
1 s to 9.999 s 1 ms
*1 The next pulse width after 5 ns is 10 ns.
*2 When the width condition is set to PULSE<T, the smallest setting range is 5 ns; when
the width condition is set to PULSE>T or TIMEOUT, the smallest setting range is 30
ns.
*1, 2
10 ns
Selecting the trigger source/state and setting the trigger level
The trigger source should be selected from CH1 to CH4
Select the trigger state from the following.
H The trigger source level is above the preset trigger level.
L The trigger source level is below the preset trigger level.
The setting limit and resolution for the trigger level is the same as for the edge
trigger. Refer to page 6-2.
Points to note when setting the width trigger
• A malfunction may occur if pulse intervals are less than 20 ns or more.
20 ns or more
• If the trigger type setting is changed, the width trigger setting will be invalidated.
However, selecting the width trigger again will restore the previous settings.
• Auto-mode operations are carried out even if the trigger mode is set to auto-level
mode.
6-12
IM 701530-01E
Page 82

6.8 Setting the Trigger Mode
Keys and Procedure
Soft keys
MODE key
Explanation
1. Press the MODE key to display the trigger mode selection
menu.
2. Press the soft key corresponding to the desired trigger mode.
• Menu (DL1540C)
• Menu (DL1540CL)
Selecting the trigger mode
The following six trigger modes are available. The default is “AUTO”.
AUTO (Auto-mode)
Updates the displayed waveform each time a trigger is activated if the trigger
condition has become true within the time-out period of approximately 100 ms.
Updates the displayed waveform automatically if the trigger condition becomes
false within the time-out period.
The roll mode will be activated irrespective of the trigger condition if T/div is set to a
value greater than 50 ms. However, the roll mode will not be displayed when the
history memory function is “ON”.
6
Activating a Trigger
AT-LVL (Auto-level mode)
Updates the displayed waveform in the same way as auto-mode if the trigger
condition has become true within the time-out period. If the trigger condition
becomes false, the trigger level is automatically set to the median of the amplitude
of the trigger source, and then the waveform is displayed.
Auto-level mode is only valid, however, if the edge trigger has been selected as the
trigger type. Auto-mode operations are carried out even if auto-level mode has been
selected for a trigger other than an edge trigger. Furthermore, roll mode will be
activated irrespective of the trigger type if T/div is set to a value greater than 50 ms.
However, the roll mode will not be displayed when the history memory function is
“ON”.
NORMAL (normal transmission mode)
Updates the displayed waveform only when the trigger condition becomes true. The
displayed waveform will not be updated if the trigger condition does not become
true.
In this mode, it is not possible to judge whether the signal is input or the trigger level
is correct unless a trigger is activated. Furthermore, the ground level is not
displayed even if the input coupling is set to “GND”.
Furthermore, in this mode, roll mode display is never activated, whatever the T/div
setting, and waveforms are displayed only when a trigger is activated.
SGL(S) (Single short mode) : for DL1540C, SINGLE (Single mode) : f or DL1540CL
When the START/STOP key is pressed and the trigger condition becomes true, the
waveform is updated once only and acquisition stops.
If the time-axis setting corresponds to roll mode, the oscilloscope generates a rollmode display. When the trigger occurs, the oscilloscope obtains data for the set
record length and then stops the displayed waveform.
For details about record length, refer to Appendix 2/Appendix 3.
IM 701530-01E
6-13
Page 83

6.8 Setting the Trigger Mode
SGL(L) (Single long mode) : for DL1540C
This mode is the same as the aboved mentioned SGL(S) mode, except that the
record length here is longer. The maximum record length is 120 K words.
For more details about the relation between time axis setting, sample rate and
record length, refer to Appendix 2.
N-SGL (Single (N) mode)
Each time the trigger condition becomes true after the START/STOP key has been
pressed, acquisition is performed the specified number of times. The waveforms will
be displayed after acquisition stops.
If the START/STOP key is pressed again before acquisition has been completed the
specified number of times, acquisition stops immediately. In this case, all the
waveform data which has been acquired thus far is valid and can be displayed.
This trigger mode can only be used in real time sampling mode.
For setting the number of repetitions, refer to page 7-7.
Points to note when setting the trigger mode
• If single short mode or single mode is selected with a T/div setting which enables
repetitive time sampling mode, acquisition will stop after it has been repeated the
specified number times.
• If trigger mode is changed while acquisition is stopped (i.e. while the START
indicator is not lit), acquisition starts automatically.
• If acquisition is interrupted in single (N) mode, only the waveforms which have
been acquired completely are displayed.
• If the history memory function is set ON or if the acquisition mode is set to
averaging, all single mode triggering cannot be done.
• If single long mode or single (N) mode is selected, repetitive sampling cannot be
done.
• When the record length (maximum displayable record length) is 400 K/1 MW/2
MW for DL1540CL, single mode is the only mode available.
6-14
IM 701530-01E
Page 84

6.9 Setting the Action-On Trigger
Keys and Procedure
Soft keys
MODE(ACTION) key
START/STOP key
SHIFT key
1. Press the SHIFT + MODE (ACTION) key to display the trigger
on action selection menu.
2. Press the soft key corresponding to the desired action. Data
acquisition will stop.
3. In case you selected “FD(P-P)” or “FD(ACQ)”, pressing the
“FileName” soft key will display the keyboard. In case you
selected “PRINTER”, skip step 4.
4. Use the keyboard to enter the filename. For details on entering
characters using the keyboard, refer to page 4-8.
Starting the action on trigger
5. Press the “EXEC” soft key to restart acquisition. The selected
action will be validated when a trigger is activated.
or
Stopping the action on trigger
6. Press the “ABORT” soft key to stop acquisition.
or
6
Activating a Trigger
Explanation
Selecting the action-on trigger
The action can be selected from the following.
PRINTER Outputs hardcopy to the built-in printer.
FD(P-P) Saves all the displayed waveforms (as P-P compressed data) on a
floppy disk when a trigger is activated.
FD(ACQ) Saves all the displayed acquisition data (binary data) on a floppy disk
when a trigger is activated.
FD(IMG) Saves the current screen image data to the floppy disk.
SCSI(IMG)*
SCSI(P-P)*
1
Saves the current screen image data to the SCSI device.
1
Saves the entire displayed waveform (P-P compressed data) to the
SCSI device.
SCSI(ACQ)*
1
Saves the acquisition data (binary data) of the entire displayed
waveform to the SCSI device.
HD(IMG)*
HD(P-P)*
2
Saves the current screen image data to the internal hard disk.
2
Saves all the displayed waveforms (as P-P compressed data) to the
internal hard disk.
HD(ACQ)*
2
Saves all the displayed acquisition data (binary data) to the internal
hard disk.
*1You need to be using a model with the internal hard disk (DL1540CL /C8 option)
or the SCSI interface unit 700930 (sold separately).
*2Selectable only on models with the internal hard disk (DL1540CL /C8 option).
When the action on trigger starts, the trigger mode will change automatically to the
single short mode or single mode.
IM 701530-01E
6-15
Page 85

6.9 Setting the Action-On Trigger
Specifying a file name when “FD(P-P)”, “FD(ACQ)”, “FD(IMG)”, “SCSI(P-P)”,
“SCSI(ACQ)”, “SCSI(IMG)”, “HD(P-P),” “HD(A CQ), ” or “HD(IMG)” has been selected
as the trigger action
A file No. (starting from “0001”) is assigned to each waveform data automatically
when the data is saved on a floppy disk, a SCSI device, or the internal hard disk.
When saving the screen image data, set the image data format. You can set the
format at the hard copy selection menu that appears by pressing the
SHIFT+COPY(MENU) key (see page 12-11).
It is possible to insert a common file name (character string consisting of up to four
characters) before the assigned file No. (for instance, “TRGO0001”).
The entered file name is reset when “ABORT” is selected.
Points to note when using the action on trigger
• When you change the trigger mode to any other than the single short mode or
single mode, the trigger on action will be aborted.
• It is not possible to perform auto set-up or GO/NO-GO determination while the
action on trigger is in progress.
• When the action on trigger starts, the trigger mode will change automatically to
the single short mode or single mode. Even after canceling the action on trigger,
the previous trigger mode will not be restored.
• When the action on trigger is restarted (“EXEC”) after first being aborted
(“ABORT”), the automatically assigned file No. will start from 0001. Previous
saved data will therefore be overwritten.
• For DL1540CL, note that under “FD(ACQ)” action, ACQ-data record length may
in some cases be too long to be saved onto a single floppy disk. In this case the
screen will display an error message after saving data to the initial floppy disk.
6-16
IM 701530-01E
Page 86

6.10 Setting the Trigger Coupling and HF Rejection
Keys and Procedure
Soft keys
COUPLING key
Explanation
1. Press the COUPLING key to display the trigger coupling
selection menu.
2. Press the soft key corresponding to the desired trigger coupling.
3. In case you want to set HF rejection, press the “ON” soft key at
the “HF-Rej” field.
Selecting the Trigger coupling
The following types are available.
AC The trigger source signal is used as the trigger source after the DC content
has been removed. The trigger level becomes 0 V.
DC The trigger source signal is used as the trigger source without any processing.
The trigger level becomes the center of the amplitude of the trigger source.
The default value is “AC”.
The trigger coupling setting applies to all channels simultaneously.
Turning HF rejection ON/OFF
Set to “ON” if you want to use the trigger source signal as the trigger source after
the high frequency content (frequency contents exceeding approximately 15 kHz)
has been removed.
6
Activating a Trigger
Points to note when setting the trigger coupling and HF rejection
These settings will be ignored if “EXT” or “LINE” is selected as the trigger source or
“TV” is selected as the trigger type.
IM 701530-01E
6-17
Page 87

6.11 Changing the Trigger Position
Keys and Procedure
Soft keys
POSITION/DELAY key
Explanation
1. Press the POSITION/DELAY key to display the trigger position/
delay setting menu.
2. Press the soft key to set the desired trigger position. The trigger
position can also be set using the rotary knob.
Selecting the trigger position
• The trigger position can be selected from the following.
+4div +4 divisions from the center of the waveform display frame
0div the center of the waveform display frame
–4div –4 divisions from the center of the waveform display frame
–4div 0div
+4div
• The trigger position can be set with in steps of 1/50 div using the rotary knob.
Setting the trigger delay and trigger position
The trigger position indicates which position of the waveform in the acquisition
memory will actually be displayed on the screen. The trigger point refers to the point
at which a trigger is activated. If no delay time has been set (i.e. delay time: 0 s),
the trigger position and the trigger point refer to the same location.
However, if a delay time is set using the trigger delay, the trigger position must be
moved using the above operations, since the delay point will not match the trigger
point.
For more details on delays, refer to the next page.
Move the trigger position to the right
T (Trigger position) T(Trigger position)
Delay time Delay time
Trigger point Trigger point
Points to note when setting the trigger position
• If the trigger position is changed while acquisition is not in progress (i.e. while the
START indicator is not lit), the setting will not be valid until acquisition starts and
the waveforms are updated.
• The time measured by cursor measurement will change if the trigger position is
changed, because the trigger position is used as the reference position (except
when the roll mode is being displayed).
6-18
IM 701530-01E
Page 88

6.12 Setting the Trigger Delay
Keys and Procedure
Rotary knob
POSITION/DELAY key
Explanation
1. Press the POSITION/DELAY key to display the delay time
setting menu.
2. Turn the rotary knob to set the desired delay time. You can also
use the < or > keys.
Setting the delay time
The trigger delay time is the duration between the point at which a trigger is
activated, and the point at which data acquisition starts.
T(Trigger position)
Delay time
Trigger point
6
Activating a Trigger
The setting range is 0 to 9.999 s. The setting step is as follows.
Setting time Setting step
0 to 999.9 ns 0.1 ns
1 µs to 9.999 µs1 ns
10 µs to 99.99 µs 10 ns
100 µs to 999.9 µs 100 ns
1 ms to 9.999 ms 1 µs
10 ms to 99.99 ms 10 µs
100 ms to 999.9 ms 100 µs
1 s to 9.999 s 1 ms
Points to note when setting the delay time
A delay time cannot be set if the external clock has been selected as the timebase.
The setting will be invalid if sampling is performed using the external clock.
IM 701530-01E
6-19
Page 89

6.13 Setting the Hold-off Time
Keys and Procedure
Rotary knob
Soft keys
HOLD OFF key
<, > keys
Explanation
1. Press the HOLD OFF key to display the hold-off time setting
menu.
2. Turn the rotary knob to set the desired hold-off time. You can
also use the < or > keys. Turning the rotary knob switches the
“Mode” ON automatically.
3. To deactivate the hold-off function, press the “Mode” soft key
and select “OFF”.
Hold-off time setting
The hold-off time setting range is 0.2 µs to 9.999 s.
The hold-off time will be 0.2 µs (minimum) if initialization is performed or if hold-off
mode has been turned “OFF”.
Turning the hold-off function ON/OFF
The hold-off time which has been set will be retained even if the hold-off function is
set to OFF. If the hold-off function is switched ON again, the hold-off time which was
in effect before the hold-off function was switched OFF will be restored.
Points to note when setting the hold-off time
• If the hold-off time has been set to 100 ms or more, do not switch the trigger
mode to auto-mode or auto-level mode. No trigger can be activated properly, as
this conflicts with the time-out period (100 ms).
• The wavefor m updating inter val may get longer depending on the hold-off time. In
this case, switch the hold-off function OFF or change the hold-off time.
6-20
IM 701530-01E
Page 90

Chapter 7 Changing Acquisition and Display Conditions
7.1 Selecting Acquisition Mode, Sampling Mode, and Record Length for DL1540CL
Keys and Procedure
Rotary knob
Soft keys
ACQ key
1. Press the ACQ key to display the acquisition mode/sampling
mode setting menu. “Length” menu is provided with DL1540CL.
2. Press the soft key corresponding to the desired acquisition
mode.
When averaging mode is selected
3. Turn the rotary knob to set the desired averaging count
(attenuation constant).
Selecting sampling mode
2. After step 1 has been completed, press the “Rep” soft key and
select “ON” for real-time sampling mode or “OFF” for repetitive
sampling mode.
7
Changing Acquisition and Display Conditions
Selecting the record length (maximum displayable record length),
(for DL1540CL)
2. After step 1 has been completed, press the “Length” soft key.
The screen returns the length selection menu.
3. Press the soft key corresponding to the maximum displayable
record length that you want to use.
Explanation
Selecting acquisition mode
Acquisition mode can be selected from the following modes. The default setting is
“NORMAL”.
• NORMAL (Normal mode)
Sampled data is stored in the acquisition memory without specific data
processing.
• ENVELOPE (Envelope mode)
The data is sampled at 100 MS/s. Each time data is stored in the acquisition
memory, the maximum and minimum values are extracted. These are then stored
in the acquisition memory and used to display the envelope waveform.
• AVERAGE (Averaging mode)
The averaging count can be set to values between “1” and “256” in steps of 2
1
An = {(N - 1)An - 1 + Xn}
N
An
: Value obtained after nth averaging
Xn
: nth measured value
N
: Attenuation constant
n
.
IM 701530-01E
7-1
Page 91

7.1 Selecting Acquisition Mode, Sampling Mode, and Record Length for DL1540CL
Selecting sampling mode: Repetitive
A sampling mode can be selected provided that the selected T/div setting allows
sampling both in real-time and repetitive modes.
However, the repetitive sampling mode is not effective when the trigger mode is set
to single long mode. Furhermore, the repetitive sampling mode cannot be set in
case of the single (N) trigger mode, when the history memory function is used, or in
case FFT is used.
T/div settings which enable the selection of the sampling mode are from 5 µs to 100
ns/div.
Selecting the (maximum displayable) record length, for DL1540CL
You can set the maximum displayable record length to 1 KW, 10 KW, 100 KW, 400
KW, 1 MW, or 2 MW. The default selection is 10 KW. The following restr ictions
apply.
• Time-axis settings from 50 ns to 5 ns cannot be used in combination with 400
KW, 1 MW, and 2 MW record lengths. If the time-axis value is already set within
this range, the 400 KW, 1 MW, and 2 MW selections will not be available.
• If the selected record length is 400 KW or 2 MW, certain time-axis settings will
produce waveform display over eight divisions only, with no waveform appearing
over the two rightmost time-axis divisions.
• Selection of 400 KW, 1 MW, and 2 MW record lengths is available only if trigger
mode is “single.”
• It is not possible to switch on Channel 3 or Channel 4 while record length is set to
2 MW. It is not possible to select 2 MW as the record length while Channel 3 or
Channel 4 is on.
• Refer to Appendix 3 for information about the relationship between time axes,
sampling rates, and record lengths.
Points to note when making acquisition mode and sampling mode settings
• Normal mode operations are carried out, even if envelope mode has been
selected.
• It is not possible to select envelope mode if waveforms are sampled by the
external clock.
• If each single mode has been selected as the trigger mode or if the history
memory function has been set to ON, averaging mode cannot be selected.
• If auto-mode or auto-level mode has been selected as the trigger mode and T/div
has been set such that the display is in roll mode, averaging will not be
performed, even if averaging mode is selected. In this case, waveforms are
displayed in roll mode.
• It is not possible to select envelope mode if input smoothing or FFT has been set
to ON.
7-2
IM 701530-01E
Page 92

7.2 Setting the Input Filter
f0.5f0.13f
Frequency
0 dB
-3 dB
f : Sample frequency
Attenuation
Keys and Procedure
Rotary knob
Soft keys
FILTER key
Explanation
1. Press the FILTER key to display the input filter setting menu.
Applying the bandwidth limit
2. Press the “20 MHz” soft key to apply the bandwidth limit. To
cancel the bandwidth limit, select “FULL”.
Applying the smoothing function
2. After step 1 has been completed, press the “Smoothing” soft
key and select “ON”. To stop smoothing, select “OFF”.
Bandwidth limit
The bandwidth frequency limit can be “20MHz”. The frequency characteristic when
the bandwidth limit is applied is shown below. When “FULL” is selected, the
frequency bandwidth is 150 MHz.
-3 dB
20 MHz
Smoothing process
A moving average value is obtained for each five points of sampling data and the
data obtained is used when displaying the waveform. This process is performed on
the data in the acquisition memory, so it can still continue even if acquisition is
stopped.
The following frequency characteristic of the smoothing process is dependent on
the sample rate. The attenuation rate will be –3 dB when the frequency is
approximately 13% of the sample rate. When the acquisition mode is envelope
mode, this process cannot be carried out.
FULL(150 MHz)
7
Changing Acquisition and Display Conditions
IM 701530-01E
7-3
Page 93

7.3 Zooming the Waveform
Keys and Procedure
Rotary knob
Soft keys
ZOOM key
1. Press the ZOOM key to display the zoom setting menu.
Displaying the pre-zoom and expanded waveform
2. Press the “MainZoom” soft key of the “ZOOM Mode” setting.
The expansion rate and position selection menu appears.
Setting the expansion rate and position
3. After having pressed the “ZOOM” soft key of the “ZOOM Knob”
setting, use the rotary knob to adjust the expansion rate.
4. After having pressed the “POS” soft key of the “ZOOM Knob”
setting, use the rotary knob to adjust the position.
Displaying the expanded waveform only
2. After step 1 has been completed, press the “ZOOM” soft key of
the “ZOOM Mode” setting. The expansion rate and position are
as described in step 3 and 4.
Explanation
Displaying the pre-zoom waveform only
2. After step 1 has been completed, press the “MAIN” soft key of
the “ZOOM Mode” setting. The expansion rate and position are
as described in step 3 and 4.
Expansion Rate
• Expansion rate limits
The expansion rate which can be set varies according to the specified record
length of the pre-zoom waveform. The specified record length depends on the
model, time axis setting, sampling mode and trigger mode. For more details, refer
to Appendix 2/Appendix 3.
The following table shows the maximum expansion rates for some record lengths.
Displayed record length 2M(8div)2M 1M 800K(8div) 500K 400K(8div)
Maximum expansion rate 25000 20000 10000 10000 5000 5000
Setting position step (div) 0.00002 0.00001 0.00001 0.00001 0.00002 0.00002
Displayed record length 400K 200K 160K(8div) 100K 50K 40K
Maximum expansion rate 4000 2000 2000 1000 500 400
Setting position step (div) 0.00005 0.00005 0.00005 0.0001 0.0002 0.0005
7-4
Displayed record length 20K 10K 5K 4K 2K 1K
Maximum expansion rate 200 100 50 40 20 10
Setting position step (div) 0.0005 0.001 0.002 0.005 0.005 0.01
Displayed record length 500 400 200 100
Maximum expansion rate 5 4 2 1
Setting position step (div) 0.02 0.05 0.05 0.1
IM 701530-01E
Page 94

7.3 Zooming the Waveform
• Expansion rate steps
Depending on the T/div value, the expansion rate steps are as follows.
In case of 50 s, 5 s, 500 ms, 50 ms, 5 ms, 500 µs, 50 µs and 5 µs/div
x1, x2.5, x5, x10, x25, x50, x100, x250, x500, x1000, x2500, x5000, x10000,
x25000
In case of 20 s, 2 s, 200 ms, 20 ms, 2 ms, 200 µs and 20 µs/div
x1, x2, x4, x10, x20, x40, x100, x200, x400, x1000, x2000, x4000, x10000,
x20000
In case of 10 s, 1 s, 100 ms, 10 ms, 1 ms, 100 µs and 10 µs/div
x1, x2, x5, x10, x20, x50, x100, x200, x500, x1000, x2000, x5000, x10000,
x20000
• Zooming range position
The center of the zooming position box can be set within ±5 div of the waveform
display frame. The setting step depends on the displayed record length.
Selecting the display type when displaying an expanded waveform
The type of display can be selected from the following.
OFF Only the original display will be displayed;
MAIN The pre-zoom waveform together with the zoom box will be displayed;
ZOOM Only the expanded waveform will be displayed. The part of the pre-
zoom waveform selected in the zoom box will be expanded.
MainZoom Both the original and the expanded waveform will be displayed on the
screen, which is divided in two.
7
Changing Acquisition and Display Conditions
Selecting the display type when displaying an X-Y waveform
The type of display depends on the settings in the expansion menu. For X-Y mode,
refer to page 7-15.
ZOOM mode X-Y Mode
OFF V-T pre-zoom X-Y pre-zoom V-T pre-zoom waveform (upper)
MAIN V-T pre-zoom X-Y pre-zoom V-T pre-zoom waveform
ZOOM V-T expanded X-Y expanded V-T expanded waveform (upper)
MainZoom V-T pre-zoom X-Y expanded V-T pre-zoom waveform
OFF X-Y T-Y & X-Y
waveform waveform X-Y pre-zoom waveform (lower)
waveform waveform + zoom box (upper)
+ zoom box X-Y pre-zoom waveform (lower)
waveform waveform X-Y expanded waveform (lower)
waveform waveform + zoom box (upper)
+ zoom box (upper) X-Y expanded waveform (lower)
V-T expanded waveform (lower)
Selecting the display type in case of FFT mode (power spectrum)
The type of display depends on the settings in the expansion menu. For more
details on the power spectrum, refer to page 8-20.
ZOOM mode FFT Mode
OFF V-T pre-zoom FFT pre-zoom V-T pre-zoom waveform (upper)
MAIN V-T pre-zoom FFT pre-zoom V-T pre-zoom waveform
ZOOM V-T expanded FFT expanded V-T expanded waveform (upper)
MainZoom V-T pre-zoom FFT expanded V-T pre-zoom waveform
FFT OFF FFT VT & FFT
waveform waveform FFT pre-zoom waveform (lower)
waveform waveform + zoom box (upper)
+ zoom box FFT pre-zoom waveform (lower)
waveform waveform FFT expanded waveform (lower)
waveform waveform + zoom box (upper)
+ zoom box (upper) FFT expanded waveform (lower)
V-T expanded waveform (lower)
IM 701530-01E
7-5
Page 95

7.3 Zooming the Waveform
Points to note when displaying an expanded waveform
• The waveform zone cannot be edited during GO/NO-GO if both pre-zoom
waveform and its expanded waveform are displayed at the same time.
• If you press the ZOOM Mode soft key while accumulated waveform display is in
progress, accumulated waveform display will be reset.
• If you press the ZOOM Mode soft key while a snapshot waveform display is being
displayed, the snapshot waveform will disappear.
7-6
IM 701530-01E
Page 96

7.4 Acquiring Waveforms using the Sequential Store Function
Keys and Procedure
Rotary knob
CLEAR TRACE key
Soft keys
MODE key
START/STOP key
Acquiring the waveform data only a specified number of times
1. Press the MODE key to display the trigger mode setting menu.
2. Press the “N-SGL” soft key. When a trigger is activated at the
time the “N-SGL” soft key is pressed, waveform acquisition
starts.
For DL1540CL, “SINGLE” menu will be displayed instead of
“SGL(S)” and “SGL(L)” menus.
3. Turn the rotary knob to set the number of acquisitions at
“Acquisition Count (N)”. When waveform acquisition is already
in progress and you change the number of acquisitions, make
sure to restart to get the specified number of acquisitions.
4. If no trigger has been activated already, press the START/STOP
key or once more the “N-SGL” soft key to start data acquisition.
Displaying a specific acquired data by selecting its number
5. Press the CLEAR TRACE key to clear the displayed
waveforms.
6. Press the DISPLAY key to display the display selection menu.
7. Use the rotary knob to set the number of the data you want to
see. The corresponding wavefor m will appear at the same time.
7
Changing Acquisition and Display Conditions
Displaying a specific acquired data by selecting its time of
acquisition
8. Continuing from step 6, press the “Time Stamp” soft key to
display the list of acquired data with their acquisition times.
9. Use the rotary knob to highlight the data you want to see.
10.Press the SELECT key. The list will disappear and the selected
waveform will appear on the screen.
IM 701530-01E
7-7
Page 97

7.4 Acquiring Waveforms using the Sequential Store Function
Displaying all waveforms
11. Continuing from step 6, 7 or 10, press the “ALL disp EXEC”
soft key to display all waveforms.
Explanation
Number of acquisitions: Acquisition Count (N)
• For DL1540C, this setting specifies the number of times that data acquisitions will
be stored in memory, and ranges from 1 to 100. 100 is default setting.
• For DL1540CL, the record length per iteration (for a given channel) and the
number of allowable iterations are determined by the selected maximum
displayable record length (see page 7-2), as indicated below. Under default
settings the record length is 10 KW, and 100 iterations are stored.
Maximum Displayable Supported Iteration Record Length per
Record Length Settings Waveform Iteration (per channel)
DL1540CL
1 KW 1 to 100 Same as “displayed record length”
10 KW 1 to 100 Same as “displayed record length”
100 KW 1 to 10 Same as “displayed record length”
• For DL1540CL, 400 KW or above: Function is not supported.
• The number of acquired data can be viewed in the upper side of the screen,
where the indication such as “Count=9” appears.
in App. 3 (page App-5)
in App. 3 (page App-6)
in App. 3 (page App-7)
Displaying acquired data: Display Trace
The way of displaying the acquired data can be selected from the following.
• Displaying the selected waveform only
Selecting the waveform can be done by setting the Display Number or by
highlighting data from the Time Stamp list.
• Displaying all waveforms
When all waveforms are displayed, you can easily spot the waveform which is
selected by the Display Number since it is displayed more brightly.
Selecting the waveform to be displayed: Display Number
The setting ranges from 0 to –(the acquisition count number –1). The maximum
value is 0. The latest data being 0, previous data are labeled –1, –2, –3, etc..
Points to note when using the sequential store function
• For more details on trigger modes, refer to page 6-13.
• After the data is acquired the specified number of times, all the waveforms will
appear on the screen at once.
• Data will not be acquired in case of the repetitive sampling mode.
• If data acquisition is aborted while in progress, only the waveforms which have
been acquired so far will appear on the display. Only the acquired waveforms can
be selected at the Display Number setting.
• The all single modes will be deacivated when the history memory function is
turned ON.
• Trigger mode cannot be set to “single (N) mode” if the selected record length is
400 KW, 1 MW, or 2 MW (for DL1540CL only).
7-8
IM 701530-01E
Page 98

7.5 Using the History Memory Function
Keys and Procedure
Rotary knob
CLEAR TRACE key
Soft keys
HISTORY key
ACQ(HISTORY) key
SHIFT key
1. Press the HISTORY key to display the history memory ON/OFF
setting menu.
2. Press the “History” soft key and select “ON”. To select “OFF”,
press the “History” soft key again.
Displaying a waveform from the memory
3. Stop data acquisition by pressing the START/STOP key.
Displaying a specific data by selecting its number
4. Use the rotary knob to set the number of the data you want to
see (display number). The corresponding waveform will appear
on the screen.
Displaying a specific acquired data by selecting its time of
acquisition
5. Continuing from step 3, press the “Time Stamp” soft key to
display the list of acquired data with their acquisition times.
6. Use the rotary knob to highlight the data you want to see.
7
Changing Acquisition and Display Conditions
IM 701530-01E
7. Press the SELECT key. The list will disappear and the selected
waveform will appear on the screen.
Displaying all waveforms
8. Continuing from step 3, 4 or 7, press the “ALL Disp EXEC” soft
key.
7-9
Page 99

7.5 Using the History Memory Function
Explanation
Number of waveforms in the history memory
• Acquisition memory retains waveforms for the last N triggers, where N is
equivalent to the maximum number of iterations that can be stored under
sequential-store operation.The record length per waveform (on a given channel)
is the same as that for sequential-store mode. For details, refer to page 7-8.
• Once the history has become full (the number of triggers has exceeded N), each
new waveform acquisition deletes the oldest waveform in the history.
Displaying acquired data
Refer to page 7-8.
Selecting the waveform to be displayed: Display Number
The setting ranges from 0 to 99. The latest data being 0, previous data are being
labeled –1, –2, –3, etc..
Acquisition period
You can extend the acquisition period by setting the hold-off time, which temporarily
halts the trigger detection. This feature makes it possible to obtain a history of a
periodically occurring waveform.
Points to note when using the history memory function
• Data will not be acquired in case of the repetitive sampling mode.
• If data acquisition is aborted while in progress, only the waveforms which have
been acquired so far will appear on the display. Only the acquired waveforms can
be selected at the Display Number setting.
• The history memory function cannot be turned ON when the acquisition mode is
set to average, or when the trigger mode is set to SINGLE, SGL(S), SGL(L), or
N-SGL.
• When the history memory function is set to ON, the display cannot be in the roll
mode.
• The previously acquired waveforms will not appear on the screen while
acquisition is in progress.
• Waveforms will be acquired in the memor y even if the display of the input signals
has been turned OFF. To display the acquired waveforms however, the display of
the input signals should be set to ON. Refer to page 5-1.
• When the conditions of waveform acquisition are changed, the history memory
function will be reset and previous waveform data will be lost.
• The history-memory function cannot be switched on if the selected record length
is 400 KW, 1 MW, or 2 MW (for DL1540CL only).
7-10
IM 701530-01E
Page 100

7.6 Changing the area for displaying the waveform
Keys and Procedure
Soft keys
DISPLAY key
Explanation
1. Press the DISPLAY key to display the setting menu.
2. Press the “Wide Scrn” soft key and select either “ON” or “OFF”
The information display can be selected “ON” or “OFF”. The default is “OFF”.
OFF The area for displaying the waveform becomes normal mode at 501 dots
(horizontal) X 401 dots (vertical).
ON The area for displaying the waveform becomes wide mode at 601 dots
(horizontal) X 401 dots (vertical).
Display, when the “Wide screen mode” is set to ON
7
Changing Acquisition and Display Conditions
IM 701530-01E
Note
When the wide screen mode is turned ON, the area for displaying the waveform changes
from the normal size of 501 dots (horizontal) X 401 dots (vertical) to 601 dots (horizontal) X
401 dots (vertical).
In the wide screen mode, one point out of every six points in the horizontal direction is displayed
using interpolation. As a result, the interpolated points may look discontinuous or distorted
depending on the waveform being observed. In such case, check the waveform in the normal
screen mode.
7-11
 Loading...