

Page 1

ARRL Laboratory
Expanded Test-Result Report
Yaesu FT-100
Prepared by:
American Radio Relay League, Inc.
Technical Department Laboratory
225 Main St.
Newington, CT 06111
Telephone: (860) 594-0214
Internet: mtracy@arrl.org
Order From:
American Radio Relay League, Inc.
Technical Department Secretary
225 Main St.
Newington, CT 06111
Telephone: (860) 594-0278
Internet: reprints@arrl.org
Price:
$7.50 for ARRL Members, $12.50 for non-Members, postpaid.
Model Information:
FT-100 Serial #: 9D021081
"Product Review" June, 1999
QST
Manufacturer:
Yaesu U.S.A.
17210 Edwards Rd
Cerritos, CA 90703
Telephone: 562-404-2700
http://www.yaesu.com/
ARRL Laboratory Expanded Test-Result Report Model: Yaesu FT-100 Serial: 9D021081
Copyright 1999, American Radio Relay League, Inc. All Rights Reserved.
Page 1
Page 2

List of Tests:
(Page numbers are omitted because the length of the report varies from unit to unit.)
Introduction
Transmitter Tests:
Transmit Output Power
Current Consumption
Transmit Frequenc y Range
Spectral Purity
Transmit Two-Tone IMD
Carrier and Sideband Suppression
CW Keying Waveform
Transmit Keyer Speed
SSB/FM Transmit Delay
Transmit/Receive Turnaround
Transmit Composite Noise
Receiver Tests:
Noise Floor (Minimum Discernible Signal)
Receive Frequency Range
AM Sensitivity
FM Sensitivity
Blocking Dynamic Range
Two-Tone, Third-Order Dynamic Range and Intercept Point
Two-Tone, Second-Order Intercept Point
In-Band Receiver IMD
FM Adjacent Channel Selectivity
FM Two-Tone, Third-Order IMD Dynamic Range
Image Rejection
IF Rejection
Audio Output Power
IF + Audio Frequency Response
Squelch Sensitivity
S-Meter Accuracy and Linearity
In-Band Receiver IMD
Notch Filter
Audio Filter
Receiver bandpass
Follow-up Tests:
Temperature Chamber Test Description
Duty Cycle Test Description
Appendix
Comparative Table
ARRL Laboratory Expanded Test-Result Report Model: Yaesu FT-100 Serial: 9D021081
Copyright 1999, American Radio Relay League, Inc. All Rights Reserved.
Page 2
Page 3

Introduction:
This document summarizes the extensive battery of tests performed by the ARRL Laboratory for each unit that is featured in
QST "Product Review." For all tests, there is a discussion of the test and test method used in ARRL Laboratory testing. For
most tests, critical conditions are listed to enable other engineers to duplicate our methods. For some of the tests, a block
diagram of the test setup is included. The ARRL Laboratory has a document, the ARRL Laboratory Test Procedures Manual,
that explains our specific test methods in detail. This manual includes test descriptions similar to the ones in this report, block
diagrams showing the specific equipment currently in use for each test, along with all equipment settings and specific step by
step procedures used in the ARRL Laboratory. While this is not available as a regular ARRL publication, the ARRL Technical
Department Secretary can supply a copy at a cost of $20.00 for ARRL Members, $25.00 for non-Members, postpaid.
Most of the tests used in ARRL product testing are derived from recognized standards and test methods. Other tests have been
developed by the ARRL Lab. The ARRL Laboratory test equipment is calibrated annually, with traceability to National
Institute of Standards and Technology (NIST). Most of the equipment is calibrated by a contracted calibration laboratory.
Other equipment, especially the custom test fixtures, is calibrated by the ARRL Laboratory Engineers, using calibrated
equipment and standard techniques.
The units being tested are operated as specified by the equipment manufacturer. The ARRL screen room has an ac supply that
is regulated to 117 or 234 volts. If possible, the equipment under test is operated from the ac supply. Mobile and portable
equipment is operated at the voltage specified by the manufacturer, at 13.8 volts if not specified, or from a fully charged
internal battery. Equipment that can be operated from 13.8 volts (nominal) is also tested for function, output power and
frequency accuracy at the minimum specified voltage, or 11.5 volts if not specified. Units are tested at room temperature and
humidity as determined by the ARRL HVAC system. Also, units that are capable of mobile or portable operation are tested at
their rated temperature range, or at –10 to +60 degrees Celsius in a commercial temperature chamber.
ARRL Product Review testing typically represents a sample of only one unit (although we sometimes obtain an extra unit or
two for comparison purposes). This is not necessarily representative of all units of the same model number. It is not
uncommon that some parameters will vary significantly from unit to unit. The ARRL Laboratory and Product Review editor
work with manufacturers to resolve any deviation from specifications or other problems encountered in the review process.
These problems are documented in the Product Review.
Units used in Product Review testing are purchased off the shelf from major distributors. We take all necessary steps to ensure
that we do not use units that have been specially selected by the manufacturer. When the review is complete, the unit is offered
for sale in an open mail bid, announced regularly in QST .
Related ARRL Publications and Products:
The 1999 ARRL Handbook for Radio Amateurs has a chapter on test equipment and measurements. The book is available for
$32.00 plus $6 shipping and handling. The Handbook is also now available in a convenient, easy to use CD-ROM format. In
addition to the complete Handbook text and graphics, the CD-ROM includes a search engine, audio clips, zooming controls,
bookmarks and clipboard support. The cost is $49.95 plus $4.00 shipping and handling. You can order both versions of the
Handbook from our web p age at http://www.arrl.org, or contact t he ARRL Publications Sales Department at 888-277-289 (toll
free). It is also widely stocked by radio and electronic dealers and a few large bookstores.
The ARRL Technical Information Service has prepared an information package that discusses Product Review testing and the
features of various types of equipment. Request the "What is the Best Rig To Buy" package from the ARRL Technical
Department Secretary. The cost is $2.00 for ARRL Members, $4.00 for non-Members, postpaid.
Many QST "Product Reviews" have been reprinted in three ARRL publications: The ARRL Radio Buyers Sourcebook (order
#3452) covers selected Product Reviews from 1970 to 1990. The cost is $15.00 plus $4.00 shipping and handling. The ARRL
Radio Buyers Sourcebook Volume II (order #4211) contains reprints of all of the Product Reviews from 1991 and 1992. The
cost is $15.00 plus $4.00 shipping and handling. The VHF/UHF Radio Buyer’s Sourcebook (order #6184) contains nearly 100
reviews of transceivers, antennas, amplifiers and accessories for VHF and above. You can order these books from our Web
page or contact the ARRL Publications Sales Department to order a copy.
ARRL Laboratory Expanded Test-Result Report Model: Yaesu FT-100 Serial: 9D021081
Copyright 1999, American Radio Relay League, Inc. All Rights Reserved.
Page 3
Page 4
QST is also available on CD ROM! The ARRL Periodicals CD ROMs (1998, order #7377; 1997, order #6729; 1996, order
#6109 and 1995, order #5579) each contain a complete copy of all articles from a year’s worth of QST, the National Contest
Journal and QEX (ARRL's experimenter's magazine). Each CD is available for $19.95 plus $4.00 for shipping and handling.
Contact the ARRL Publications Sales Department to order a copy.
Older issues of QST are also available: QST View CD-ROMs come in sets covering either five years each (1960-1964 through
1990-1994), ten years each (1930-1939, 1940-1949 and 1950-59) or more (1915-1929). The price for each set is $39.95.
Shipping and handling for all ARRL CD ROM products is $4.00 for the first one ordered, $1.00 for each additional set ordered
at the same time.
Additional test result reports are available for:
Manufacturer Model Issue
Alpha Power 91ß Sep 97
Ameritron AL-800H Sep 97
ICOM IC-706 Mar 96
IC-706 MkII Jan 98
IC-756 May 97
IC-775DSP Jan 96
IC-821H Mar 97
JRC NRD-535 May 97
Kenwood TS-570D Jan 97
TS-870S Feb96
QRO HF-2500DX Sep 97
Ten-Tec Centaur Jun 97
Omni VI + Nov 97
Yaesu FT-100 Jun 99
FT-847 Jul 98
FT-920 Oct 97
FT-1000MP Apr 96
The cost is $7.50 for ARRL Members, $12.50 for non-Members for each report, postpaid. ARRL Members
can obtain any three reports for $20.00, postpaid.
ARRL Laboratory Expanded Test-Result Report Model: Yaesu FT-100 Serial: 9D021081
Copyright 1999, American Radio Relay League, Inc. All Rights Reserved.
Page 4
Page 5

Transmitter Output Power:
Test description:
One of the first things an amateur wants to know about a transmitter or transceiver is its RF output power.
The ARRL Lab measures the CW output power for every band on which a transmitter can operate. The unit is tested across the
entire amateur band and the worst-case number for each band is reported. The equipment is also tested on one or more bands
for any other mode of operation for which the transmitter is capable. Typically, the most popular band of operation for each
mode is selected. Thus, on an HF transmitter, the SSB tests are done on 75 meters for lower sideband, 20 meters for upper
sideband, and AM tests are done on 75 meters, FM tests are done on 10 meters, etc. This test also compares the accuracy of the
unit's internal output-power metering against the ARRL Laboratory's calibrated test equipment.
The purpose of the Transmitter Output-Power Test is to measure the dc current consumption at the manufacturer's specified
dc-supply voltage, if applicable, an d th e RF ou tpu t power of the unit under test across each ban d in each of its av ailable modes. A
two-tone audio input, at a level with in th e manufacturer's microphone-input specifications, is u s ed for the SSB m ode. No
modulation is used in the AM and FM modes.
Many transmitters are de-rated from maximum output power on full-carrier AM and FM modes. In most cases, a 100-watt
CW/SSB transmitter may be rated at 25 watts carrier power on AM. The radio may actually deliver 100 watts PEP in AM or
FM but is not specified to deliver that power level for any period of time. In these cases, the published test-result table will list
the AM or FM power as being "as specified."
In almost all cases, the linearity of a transmitter decreases as output power increases. A transmitter rated at 100 watts PEP on
single sideband may actually be able to deliver more power, but as the power is increased beyond the rated RF output power,
adjacent channel splatter (IMD) usually increases dramatically. If the ARRL Lab determines that a transmitter is capable of
delivering its rated PEP SSB output, the test-result table lists the power as being "as specified."
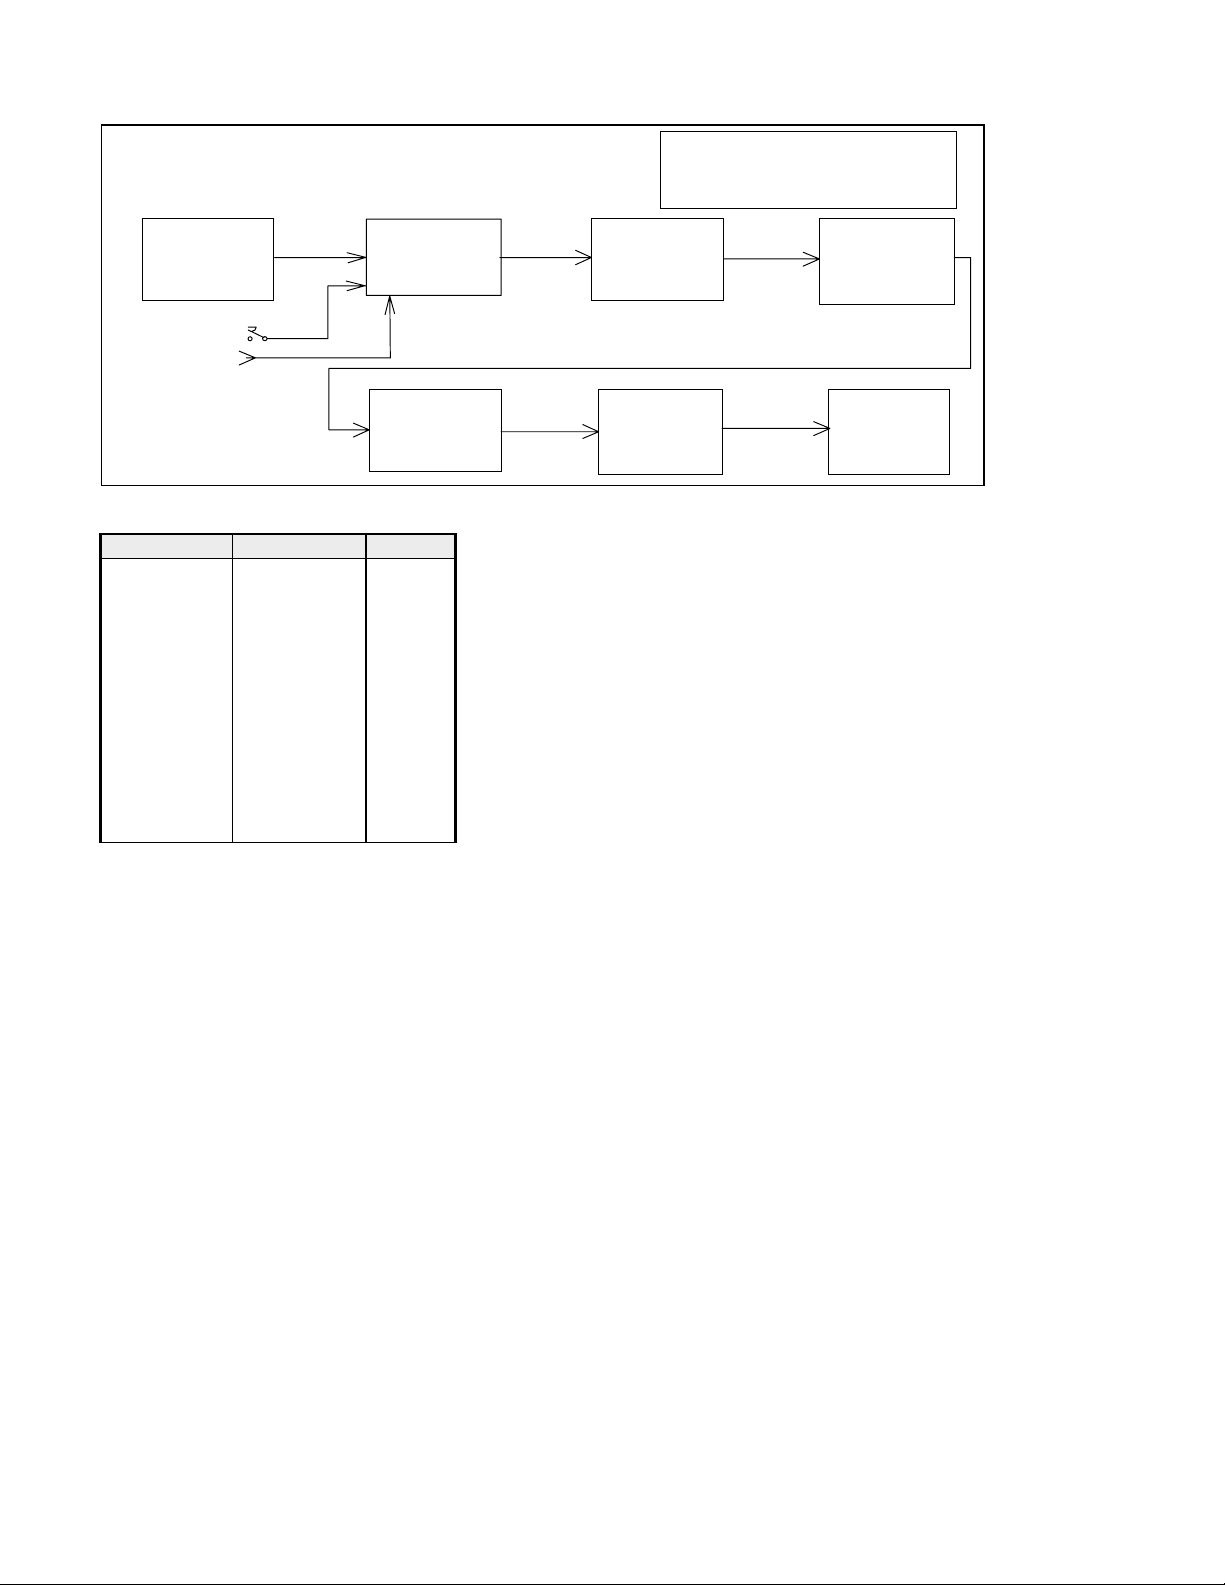
Key Test Conditions:
Termination: 50 ohms resistive, or as specified by the manufacturer.
Block Diagram:
PTT S
ELEGRAPH KEY
T
TWO-T
UDIO
A
ENERATOR
G
WITCH
OWER
P
UPPLY
S
ONE
AC ONLY
T
DC ONLY
DUT
RANSMITTER
100 W
T
YPICAL
ATTS
CAUTION!: Power must only be applied to the
attenuator input! Do not reverse input and output
terminals of the Bird 8329.
RF W
B
ATTMETER
4381
IRD
100 W
T
YPICAL
ATTS
RF Power
Attenuator &
Dummy Load
Bird 8329
ARRL Laboratory Expanded Test-Result Report Model: Yaesu FT-100 Serial: 9D021081
Copyright 1999, American Radio Relay League, Inc. All Rights Reserved.
Page 5
Page 6
Transmitter Output Power Test Results:
Frequency
Band
1.8 MHz CW 0 0.3 W “100” 88.5 W 1, 2
3.5 MHz CW 0 N/A – 93.3
3.5 MHz AM 0 N/A – N/A 3
7.0 MHz CW 0 N/A – 94.9
10.1 MHz CW 0 N/A – 95.3
14 MHz CW 0 N/A – 95.9
14 MHz USB 0 N/A – 97.0
14 MHz CW 0 N/A – 22.6 4, 10, 99
14 MHz CW 0 N/A – 94.3 11, 99
14 MHz CW 0 N/A – 95.7 12, 99
18 MHz CW 0 N/A – 95.6
21 MHz CW 0 N/A – 95.6
24 MHz CW 0 N/A – 95.1
28 MHz CW 0 N/A – 96.0
28 MHz FM 0 N/A – 96.7
50 MHz CW 0 N/A – 98.9
50 MHz FM 0 N/A – 99.5
50 MHz AM 0 N/A – N/A 3
50 MHz SSB 0 N/A – 98.5
144 MHz CW 0 N/A “50” 53.4
144 MHz FM 0 N/A – 52.7
144 MHz AM 0 N/A – N/A 3
144 MHz SSB 0 N/A – 53.3
432 MHz CW 0 N/A “20” 19.9
432 MHz FM 0 N/A – 20.2
432 MHz AM 0 N/A – N/A 3
432 MHz SSB 0 N/A – 20.0
Mode Unit
Minimum
Power (W)
Measured
Minimum
Power (W)
Unit
Maximum
Power (W)
Measured
Maximum
Power (W)
Notes
Notes:
1. Unit's power meter consists of LED segments; minimum power showed 0 segments lit.
2. The unit showed LED segments reaching a fixed display label reading 100 at full power.
3. Due to a problem with this unit, AM carrier power could not be measured in a meaningful way. See text of
QST’s Product Review for details.
4. Initial power output upon applying power after “soaking” at -10 deg for an hour. After each subsequent
transmission, the power output increased with rise in rig’s internal temperature (three very short
transmissions brought the output up to about 50W).
10. Temperature chamber test at -10 degrees Celsius.
11. Temperature chamber test at +60 degrees Celsius.
12. Output power test at 11.5 volts dc power supply (if applicable).
99. Temperature chamber tests and 11.5 volt tests are performed only for portable and mobile equipment.
ARRL Laboratory Expanded Test-Result Report Model: Yaesu FT-100 Serial: 9D021081
Copyright 1999, American Radio Relay League, Inc. All Rights Reserved.
Page 6
Page 7
Current Consumption Test: (DC-powered units only)
Test Description:
important for QRP rigs, the ARRL Lab tests the current consumption of all equipment that can be operated from a battery or
12-14 Vdc source. The equipment is tested in transmit at maximum output power. On receive, it is tested at maximum
volume, with no input signal, using the receiver's broadband noise. Any display lights are turned on to maximum brightness, if
applicable. This test is not performed on equipment that can be powered only from the ac mains.
Current Consumption:
Voltage Transmit
13.8 V 17 A 97.0 W 1.3 A ON
Current consumption can be a important to the success of mobile and portable operation. While it is most
Output Power Receive Current Lights? Notes
Current
Transmit Frequency Range Test:
Test Description:
operation, for example, or unintentionally as the result of the design and internal software. The ARRL Lab tests the transmit
frequency range inside the screen room. The purpose of the Transmit Frequency R an ge Test is to determine th e range of
frequencies, including those outside amateur bands, for w hich th e transmitter may be used. The key test conditions are to test it at
rated power, using nominal supply voltages. Frequencies are as indicated on the transmitter frequency indicator or display.
Most modern synthesized transmitters are capable of operation outside the ham bands. However, spectral purity is not always
legal outside the hams bands, so caution must be used. In addition, most other radio services require that transmitting
equipment be type accepted for that service. Amateur equipment is not legal for use on other than amateur and MARS
frequencies.
Test Results:
Frequency Low-Frequency Limit High-Frequency Limit Notes
160 M 1.800 00 MHz 2.000 00 MHz
80 M 3.500 00 MHz 4.000 00 MHz
40 M 7.000 00 MHz 7.300 00 MHz
30 M 10.100 00 MHz 10.150 00 MHz
20 M 14.000 00 MHz 14.350 00 MHz
17 M 18.068 00 MHz 18.168 00 MHz
15 M 21.000 00 MHz 21.450 00 MHz
12 M 24.890 00 MHz 25.990 00 MHz
10 M 28.000 00 MHz 29.700 00 MHz
6 M 50.000 00 MHz 54.000 00 MHz
2 M 144.000 00 MHz 148.000 00 MHz
70 CM 420.000 00 MHz 450.000 00 MHz
Many transmitters can transmit outside the amateur bands, either intentionally, to accommodate MARS
ARRL Laboratory Expanded Test-Result Report Model: Yaesu FT-100 Serial: 9D021081
Copyright 1999, American Radio Relay League, Inc. All Rights Reserved.
Page 7
Page 8
CW Transmit Frequency Accuracy Test:
Test Description:
equipment operating within a few Hz of the frequency indicated on the frequency display. However, some units, notably
"analog" units, not using a phase-lock loop in the VFO design, can be off by a considerable amount. This test measures the
output frequency. Unit is operated into a 50-ohm resistive load at nominal temperature and supply voltage. Frequency is also
measured at minimum output power, low supply voltage (12 volt units only) and over the operating temperature range (mobile
and portable units only). Non-portable equipment is not tested in the temperature chamber.
Test Results:
Unit Frequency Supply
14.000 00 MHz 13.8 V 25 C 14.000 011 MHz
14.000 00 MHz 12.5 V 25C 14.000 011 MHz
14.000 00 MHz 13.8 V -10C 13.999 949 MHz
14.000 00 MHz 13.8 V +60C 14.000 043 MHz
50.000 00 MHz 13.8 V 25 C 50.000 037 MHz
144.000 00 MHz 13.8 V 25 C 144.000 106 MHz
430.000 00 MHz 13.8 V 25 C 430.000 315 MHz
430.000 00 MHz 13.8 V -10C 429.998 297 MHz
430.000 00 MHz 13.8 V +60C 430.001 271 MHz
Most modern amateur equipment is surprisingly accurate in frequency. It is not uncommon to find
Voltage
Temperature Measured Frequency
Full Output Power
Notes
Spectral Purity Test:
Test Description:
known as spurious emissions or "spurs." Part 97 of the FCC rules and regulations specify the amount of spurious emissions that
can be emitted by a transmitter operating in the Amateur Radio Service. The ARRL Laboratory uses a spectrum analyzer to
measure the spurious emission on each band on which a transmitter can operate. The transmitter is tested across the band and
the worst-case spectral purity on each band is captured from the spectrum analyzer and stored on disk. Spectral purity is
reported in dBc, meaning dB relative to the transmitted carrier.
The graphs and tables indicate the relative level of any spurious emissions from the transmitter. The lower that level, expressed
in dB relative to the output carrier, the better the transmitter is. So a transmitter whose spurious emissions are -60 dBc is
spectrally cleaner than is one whose spurious emissions are -30 dBc. FCC Part 97 regulations governing spectral purity are
contained in 97.307 of the FCC rules. Information about all amateur rules and regulations is found in the ARRL FCC Rule
Book. Additional information about the decibel is found in the ARRL Handbook.
Key Test Conditions:
Unit is operated at nominal supply voltage and temperature.
Output power is adjusted to full power on each amateur band.
A second measurement is taken at minimum power to ensure that the spectral output is still legal at low power.
The level to the spectrum analyzer is –10 dBm maximum.
The resolution bandwidth of the spectrum analyzer is 10 kHz on HF, 100 kHz on VHF, 1 MHz on UHF.
All transmitters emit some signals outside their assigned frequency or frequency range. These signals are
ARRL Laboratory Expanded Test-Result Report Model: Yaesu FT-100 Serial: 9D021081
Copyright 1999, American Radio Relay League, Inc. All Rights Reserved.
Page 8
Page 9
Block Diagram:
CAUTION!: Power must only be applied to
the attenuator input! Do not reverse input
and o utput te rminals of the Bi rd 8329.
ONE
TWO-T
UDIO
A
ENERATOR
G
ELEGRAPH KEY
T
OWER SOURCE
P
Test Results - summary:
Frequency Spurs ( dBc) Notes
1.8 MHz –68 dBc
3.5 MHz –40 1
7 MHz –55
10.1 MHz –54
14 MHz –55
18 MHz –59
21 MHz –53
24 MHz –60
28 MHz –50
50 MHz –60
144 MHz –60
430 MHz –68
DUT
RANSMITTER
T
10 dB S
TTENUATOR
A
HP 355D
TEP
100 W
T
YPICAL
ATTS
RF W
ATTMETER
B
4381
IRD
1 dB S
TTENUATOR
A
HP 3555C
TEP
100 W
T
YPICAL
DO NOT
EXCEED
0 dBm
ATTS
RF Power
Attenuator &
Dummy Load
Bird 8329
PECTRUM
S
NALYZER
A
HP 8563E
Notes:
1. A second unit tested showed a spur of –50 dBc on this band.
ARRL Laboratory Expanded Test-Result Report Model: Yaesu FT-100 Serial: 9D021081
Copyright 1999, American Radio Relay League, Inc. All Rights Reserved.
Page 9
Page 10
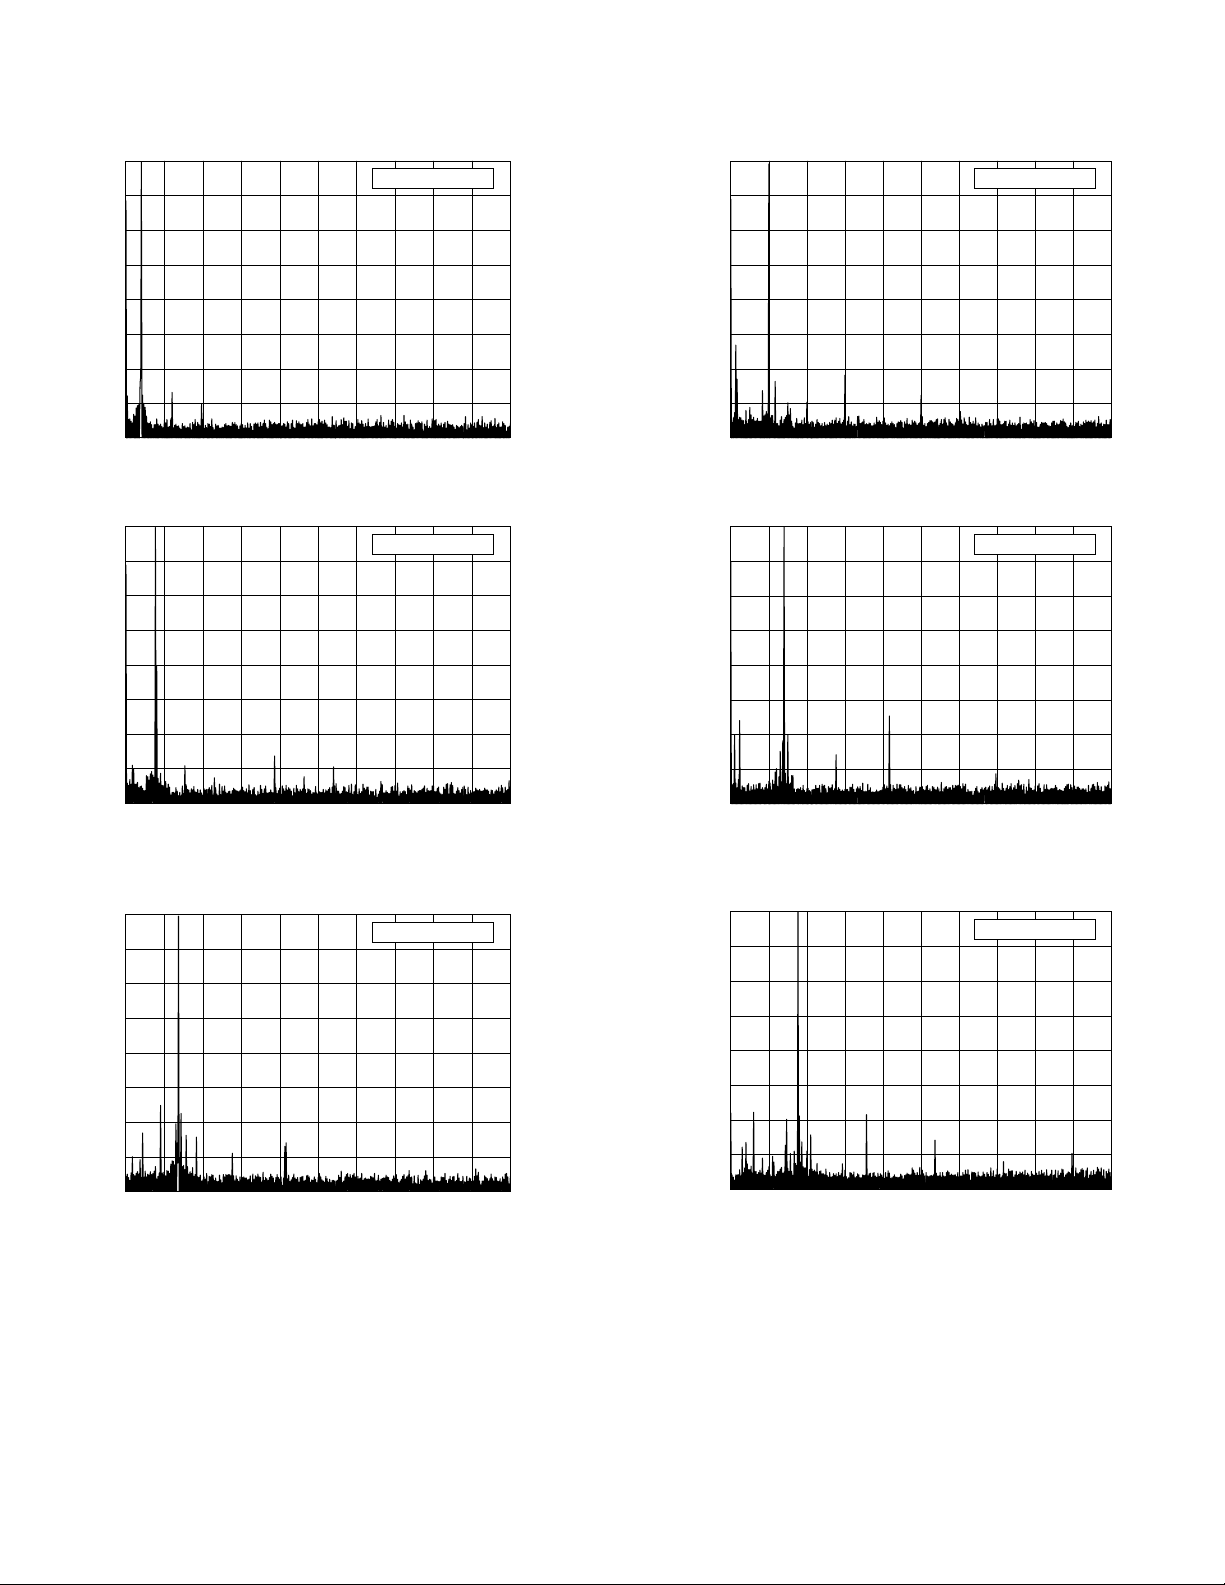
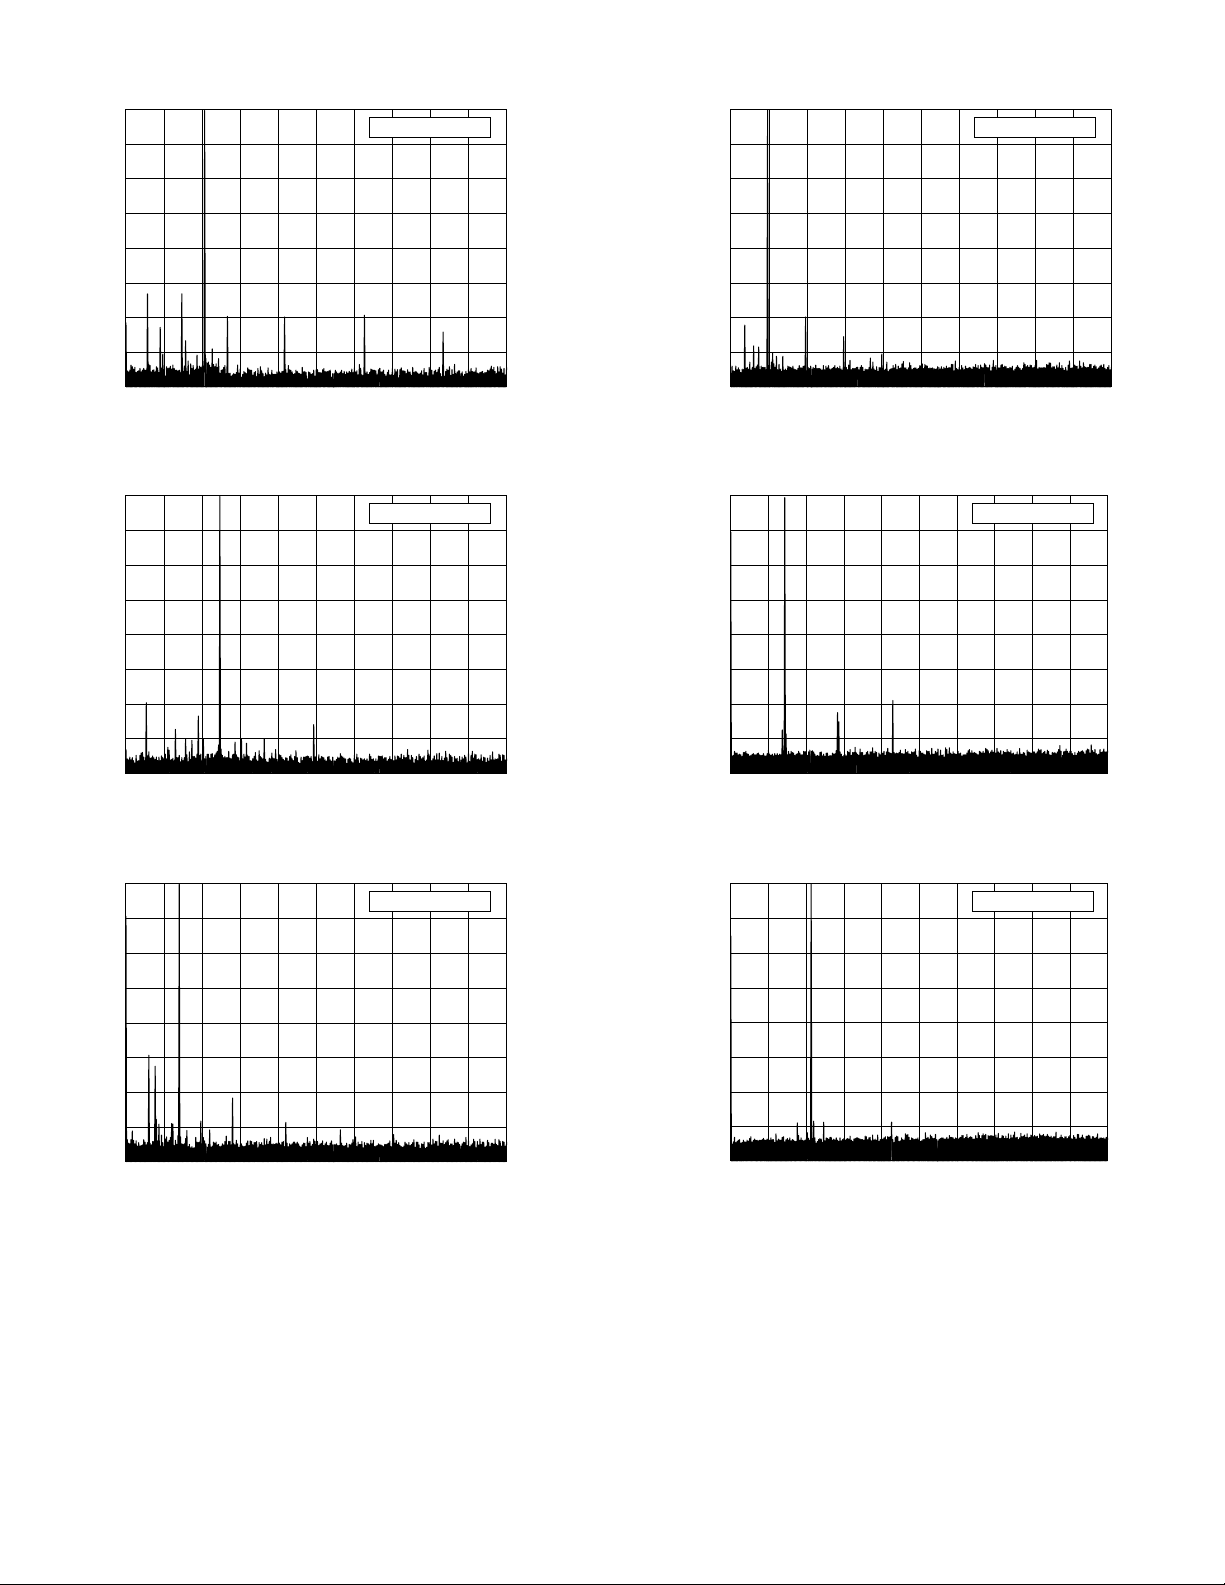
Spectral-Purity Graphs:
0
–10
Reference Level: 0 dBc
–20
–30
–40
–50
–60
–70
–80
0 5 10 15 20 25 30 35 40 45 50
Yaesu FT-100 9D021081
1.8 MHz Band, Spectral Purity, 100 W
F:\SHARED\PROD_REV\TESTS\FT100.2ND\FT100SLO.TXT
Frequency (MHz)
0
–10
Reference Level: 0 dBc
–20
–30
–40
–50
–60
0
–10
Reference Level: 0 dBc
–20
–30
–40
–50
–60
–70
–80
0 10 20 30 40 50 60 70 80 90 100
Yaesu FT-100 9D021081
10.1 MHz Band, Spectral Purity, 100 W
F:\SHARED\PROD_REV\TESTS\FT100.2ND\FT100S30.TXT
Frequency (MHz)
0
–10
Reference Level: 0 dBc
–20
–30
–40
–50
–60
–70
–80
0 5 10 15 20 25 30 35 40 45 50
Yaesu FT-100 9D021081
3.5 MHz Band, Spectral Purity, 100 W
F:\SHARED\PROD_REV\TESTS\FT100.2ND\FT100S80.TXT
Frequency (MHz)
0
–10
Reference Level: 0 dBc
–20
–30
–40
–50
–60
–70
–80
0 5 10 15 20 25 30 35 40 45 50
Yaesu FT-100 9D021081
7.0 MHz Band, Spectral Purity, 100 W
F:\SHARED\PROD_REV\TESTS\FT100.2ND\FT100S40.TXT
Frequency (MHz)
–70
–80
0 10 20 30 40 50 60 70 80 90 100
Yaesu FT-100 9D021081
14.0 MHz Band, Spectral Purity, 100 W
F:\SHARED\PROD_REV\TESTS\FT100.2ND\FT100S20.TXT
Frequency (MHz)
0
–10
Reference Level: 0 dBc
–20
–30
–40
–50
–60
–70
–80
0 10 20 30 40 50 60 70 80 90 100
Yaesu FT-100 9D021081
18.1 MHz Band, Spectral Purity, 100 W
F:\SHARED\PROD_REV\TESTS\FT100.2ND\FT100S17.TXT
Frequency (MHz)
ARRL Laboratory Expanded Test-Result Report Model: Yaesu FT-100 Serial: 9D021081
Copyright 1999, American Radio Relay League, Inc. All Rights Reserved.
Page 10
Page 11
–10
0
Reference Level: 0 dBc
0
Reference Level: 0 dBc
–10
–20
–30
–40
–50
–60
–70
–80
0 10 20 30 40 50 60 70 80 90 100
Yaesu FT-100 9D021081
21.0 MHz Band, Spectral Purity, 100 W
F:\SHARED\PROD_REV\TESTS\FT100.2ND\FT100S15.TXT
Frequency (MHz)
0
–10
Reference Level: 0 dBc
–20
–30
–40
–50
–60
–70
–20
–30
–40
–50
–60
–70
–80
0 50 100 150 200 250 300 350 400 450 500
Yaesu FT-100 9D021081
50.0 MHz Band, Spectral Purity, 100 W
F:\SHARED\PROD_REV\TESTS\FT100.2ND\FT100S6M.TXT
Frequency (MHz)
0
–10
Reference Level: 0 dBc
–20
–30
–40
–50
–60
–70
–80
0 10 20 30 40 50 60 70 80 90 100
Yaesu FT-100 9D021081
24.9 MHz Band, Spectral Purity, 100 W
F:\SHARED\PROD_REV\TESTS\FT100.2ND\FT100S12.TXT
Frequency (MHz)
0
–10
Reference Level: 0 dBc
–20
–30
–40
–50
–60
–70
–80
0 20 40 60 80 100 120 140 160 180 200
Yaesu FT-100 9D021081
28.0 MHz Band, Spectral Purity, 100 W
F:\SHARED\PROD_REV\TESTS\FT100.2ND\FT100S10.TXT
Frequency (MHz)
–80
0 100 200 300 400 500 600 700 800 900 1000
Yaesu FT-100 9D021081
144.0 MHz Band, Spectral Purity, 50 W
F:\SHARED\PROD_REV\TESTS\FT100.2ND\FT100S2M.TXT
Frequency (MHz)
0
–10
Reference Level: 0 dBc
–20
–30
–40
–50
–60
–70
–80
0 200 400 600 800 1000 1200 1400 1600 1800 2000
Yaesu FT-100 9D021081
420.0 MHz Band, Spectral Purity, 20 W
F:\SHARED\PROD_REV\TESTS\FT100.2ND\FT100S70.TXT
Frequency (MHz)
ARRL Laboratory Expanded Test-Result Report Model: Yaesu FT-100 Serial: 9D021081
Copyright 1999, American Radio Relay League, Inc. All Rights Reserved.
Page 11
Page 12

Transmit Two-Tone IMD Test:
Test Description:
Investigating the sidebands from a modulated transmitter requires a narrow-band spectrum analysis. In this
test, a two-tone test signal is used to modulate the transmitter. The display shows the two test tones plus some of the IMD
products produced by the SSB transmitter. In the ARRL Lab, a two-tone test signal with frequencies of 700 and 1900 Hz is
used to modulate the transmitter. These frequencies were selected to be within the audio passband of the typical transmitter,
resulting in a meaningful display of transmitter IMD. The intermodulation products appear on the spectral plot above and below
the two tones. The lower the intermodulation products, the better the transmitter. In general, it is the products that are farthest
removed from the two tones (typically > 3 kHz away) that cause the most problems. These can cause splatter up and down the
band from strong si gnals.
Key Test Conditions:
Transmitter operated at rated output power. Audio tones and drive level adjusted for best performance. Audio tones 700 and
1900 Hz. Both audio tones adjusted for equal RF output. Level to spectrum analyzer, - 10 dBm nominal, -10 dBm maximum.
Resolution bandwidth, 10 Hz
Block Diagram:
CAUTION!: Power must only be applied to
the attenuator input! Do not reverse input
and o utput te rminals of the Bi rd 8329.
TWO-T
A
ENERATOR
G
ELEGRAPH KEY
T
OWER SOURCE
P
UDIO
ONE
DUT
RANSMITTER
T
10 dB S
TTENUATOR
A
HP 355D
TEP
100 W
T
YPICAL
ATTS
RF W
ATTMETER
B
4381
IRD
1 dB S
TTENUATOR
A
HP 3555C
TEP
100 W
T
YPICAL
DO NOT
EXCEED
0 dBm
ATTS
RF Power
Attenuator &
Dummy Load
Bird 8329
PECTRUM
S
NALYZER
A
HP 8563E
Test Result Summary:
Frequency Worst-case
3rd-order
dB PEP
Worst-case
5th-order
dB PEP
Notes
1.85 MHz –35 –39
3.9 MHz –30 –48
7.25 MHz –29 –47
10.12 MHz –32 –36
14.25 MHz –30 –53
18.12 MHz –30 –43
21.25 MHz –30 –37 1
24.95 MHz –30 –40
28.35 MHz –32 –39 1
50.2 MHz –25 –40 1
144.2 MHz –22 –43
432.2 MHz –26 –42
Notes:
1. Tested at 80W; at higher power levels, additional spurious mixing products obscured the IMD products.
This did not occur with a single tone input, however.
ARRL Laboratory Expanded Test-Result Report Model: Yaesu FT-100 Serial: 9D021081
Copyright 1999, American Radio Relay League, Inc. All Rights Reserved.
Page 12
Page 13

Transmit IMD Graphs
0
Reference Level: 0 dB PEP
–10
–20
–30
–40
–50
–60
–70
–80
–10 –8 –6 –4 –2 0 2 4 6 8 10
Yaesu FT-100 9D021081
1.850 MHz, Transmit IMD, 100 W
F:\SHARED\PROD_REV\TESTS\FT100.2ND\FT100ILO.TXT
Frequency Offset (kHz)
0
Reference Level: 0 dB PEP
–10
–20
–30
–40
–50
–60
–70
–80
–10 –8 –6 –4 –2 0 2 4 6 8 10
Yaesu FT-100 9D021081
3.900 MHz, Transmit IMD, 100 W
F:\SHARED\PROD_REV\TESTS\FT100.2ND\FT100I80.TXT
Frequency Offset (kHz)
0
Reference Level: 0 dB PEP
–10
–20
–30
–40
–50
–60
–70
–80
–10 –8 –6 –4 –2 0 2 4 6 8 10
Yaesu FT-100 9D021081
10.120 MHz, Transmit IMD, 100 W
F:\SHARED\PROD_REV\TESTS\FT100.2ND\FT100I30.TXT
Frequency Offset (kHz)
0
Reference Level: 0 dB PEP
–10
–20
–30
–40
–50
–60
–70
–80
–10 –8 –6 –4 –2 0 2 4 6 8 10
Yaesu FT-100 9D021081
14.250 MHz, Transmit IMD, 100 W
F:\SHARED\PROD_REV\TESTS\FT100.2ND\FT100I20.TXT
Frequency Offset (kHz)
0
Reference Level: 0 dB PEP
–10
–20
–30
–40
–50
–60
–70
–80
–10 –8 –6 –4 –2 0 2 4 6 8 10
Yaesu FT-100 9D021081
7.250 MHz, Transmit IMD, 100 W
F:\SHARED\PROD_REV\TESTS\FT100.2ND\FT100I40.TXT
Frequency Offset (kHz)
ARRL Laboratory Expanded Test-Result Report Model: Yaesu FT-100 Serial: 9D021081
Copyright 1999, American Radio Relay League, Inc. All Rights Reserved.
Page 13
0
Reference Level: 0 dB PEP
–10
–20
–30
–40
–50
–60
–70
–80
–10 –8 –6 –4 –2 0 2 4 6 8 10
Yaesu FT-100 9D021081
18.120 MHz, Transmit IMD, 100 W
F:\SHARED\PROD_REV\TESTS\FT100.2ND\FT100I17.TXT
Frequency Offset (kHz)
Page 14

0
Reference Level: 0 dB PEP
–10
0
Reference Level: 0 dB PEP
–10
–20
–30
–40
–50
–60
–70
–80
–10 –8 –6 –4 –2 0 2 4 6 8 10
Yaesu FT-100 9D021081
21.250 MHz, Transmit IMD, 100 W
F:\SHARED\PROD_REV\TESTS\FT100.2ND\FT100I15.TXT
Frequency Offset (kHz)
0
Reference Level: 0 dB PEP
–10
–20
–30
–40
–50
–60
–70
–80
–10 –8 –6 –4 –2 0 2 4 6 8 10
Yaesu FT-100 9D021081
24.950 MHz, Transmit IMD, 100 W
F:\SHARED\PROD_REV\TESTS\FT100.2ND\FT100I12.TXT
Frequency Offset (kHz)
–20
–30
–40
–50
–60
–70
–80
–10 –8 –6 –4 –2 0 2 4 6 8 10
Yaesu FT-100 9D021081
50.200 MHz, Transmit IMD, 100 W
F:\SHARED\PROD_REV\TESTS\FT100.2ND\FT100I6M.TXT
Frequency Offset (kHz)
0
Reference Level: 0 dB PEP
–10
–20
–30
–40
–50
–60
–70
–80
–10 –8 –6 –4 –2 0 2 4 6 8 10
Yaesu FT-100 9D021081
144.200 MHz, Transmit IMD, 50 W
F:\SHARED\PROD_REV\TESTS\FT100.2ND\FT100I2M.TXT
Frequency Offset (kHz)
0
Reference Level: 0 dB PEP
–10
–20
–30
–40
–50
–60
–70
–80
–10 –8 –6 –4 –2 0 2 4 6 8 10
Yaesu FT-100 9D021081
28.350 MHz, Transmit IMD, 100 W
F:\SHARED\PROD_REV\TESTS\FT100.2ND\FT100I10.TXT
Frequency Offset (kHz)
0
Reference Level: 0 dB PEP
–10
–20
–30
–40
–50
–60
–70
–80
–10 –8 –6 –4 –2 0 2 4 6 8 10
Yaesu FT-100 9D021081
432.200 MHz, Transmit IMD, 20 W
F:\SHARED\PROD_REV\TESTS\FT100.2ND\FT100I70.TXT
Frequency Offset (kHz)
ARRL Laboratory Expanded Test-Result Report Model: Yaesu FT-100 Serial: 9D021081
Copyright 1999, American Radio Relay League, Inc. All Rights Reserved.
Page 14
Page 15

SSB Carrier and Unwanted Sideband Suppression Test:
Test Description
and unwanted sideband suppression relative to Peak Envelope Power (PEP). The transmitter output is observed on the
spectrum analyzer and the unwanted components are compared to the desired sideband. The level to the spectrum analyzer is 10 dBm nominal. The measurement bandwidth is 100 Hz. The greater the amount of suppression, the better the transmitter.
For example, opposite sideband suppression of 60 dB is better than suppression of 50 dB.
Test Results:
Frequency Carrier Suppression
14.2 MHz < –52/–53 dB < –68/–67 dB
50.2 MHz < –53/–53 dB < –66/–66 dB
144.2 MHz < –54/–53 dB < –67/–69 dB
432.2 MHz < –51/–52 dB < –64/–63 dB
: The purpose of the SSB Carrier and opposite-sideband Suppression test is to determine the level of carrier
USB/LSB (PEP)
Opposite Sideband
Suppression
USB/LSB (PEP)
Notes
CW Keying Waveform Test:
Test Description:
point of the device u n der tes t's RF output envelope i n t h e C W mode. The on and off delay times from key cl os u re to R F ou t pu t are
also measured. If the transmitter un der test has several CW modes, (i.e. VOX, QSK) these measurements is made at rated output
power for each mode. A picture of the oscilloscope screen is taken of the resu lts with the QSK off, and in the VOX mode show ing
the first dit, and any other test conditions that result in a w avesh ape that is sig ni fi cantly different from the others (more than 10%
difference, spikes, etc.). The first an d secon d dits are s h own in all modes.
The purpose of the CW Keying Waveform Test is to determine the rise and fall times for the 10% to the 90%
If the risetime or falltime become too short, the transmitter will generate key clicks. Most click-free transmitters have a rise and
fall time between 1 ms and 5 ms. The absolute value of the on delay and off delay are not critical, but it is important that they
be approximately the same so that CW weighting will not be affected.
Some transmitters used in the VOX mode exhibit a first dit that is shorter than subsequent dits. Other transmitters can show
significant shortening of all dits when used in the QSK mode. The latter will cause keying to sound choppy.
The first di t foreshorteni ng i s expressed as a "weighting" number. In perfect keying, the weighting is 50%, meaning tha t the
carrier is ON for 50% of the time.
Key Test Conditions:
The transmitter is operated at room temperature at rated output power into a 50-ohm resi stive lo ad. Th e power supply vol tage is
nominal. Attenuators are adjusted to obtain 3 volts RMS to the oscilloscope.
Test Result Summary:
Captions (Figures on next pages): All Figures a re 10 ms/division., unless otherwise noted.
Figure 1. This shows the first and second dits in Full QSK mode.
Figure 2. This shows the first and second dits in Semi QSK mode.
Figure 3. This shows the first and second dits in Full QSK mode, 35 watts output.
ARRL Laboratory Expanded Test-Result Report Model: Yaesu FT-100 Serial: 9D021081
Copyright 1999, American Radio Relay League, Inc. All Rights Reserved.
Page 15
Page 16

CW Keying Waveforms:
Figure 1
Figure 2
ARRL Laboratory Expanded Test-Result Report Model: Yaesu FT-100 Serial: 9D021081
Copyright 1999, American Radio Relay League, Inc. All Rights Reserved.
Page 16
Page 17

Figure 3
ARRL Laboratory Expanded Test-Result Report Model: Yaesu FT-100 Serial: 9D021081
Copyright 1999, American Radio Relay League, Inc. All Rights Reserved.
Page 17
Page 18

ransmit Keyer Speed Test:
T
Test Description:
minimum, midrange and maximum speeds and the time from dit to dit is measured using an oscilloscope and used to calculate
the speed using the "Paris" method of code speed calculation. (In the Paris method, the word "Paris" is used as the standard
word to calculate words per minute.)
Test Results:
Min WPM Max WPM Mid WPM Notes
5.6 wpm 57 wpm N/A
Notes:
This test measures the speed of the internal keyer on transmitters so equipped. The keyer is tests at
Keying sidetone test:
Test Description:
Test Result:
Default pitch Minimum Maximum Notes
676 Hz 385 Hz 806 Hz
Notes:
This test measures the audio frequency of the keyer sidetone.
Transmit/Receive Turnaround Test:
Test Description:
transmit to the receive mode of a transceiver.
Test Results:
Frequency Conditions T/R Delay AGC Fast T/R Delay AGC Slow Notes
14.2 MHz 50% audio 15 ms 15 ms 1
Notes:
1. T/R delay less than or equal to 35 ms is suitable for use on AMTOR.
The purpose of the Transmit/Receive turnaround test is to measure the delay required to switch from the
Transmit Delay Test
Test Description:
is measured on SSB, modulated with a single tone and on FM, unmodulated.
Test Result
Frequency Mode On delay Notes
14.2 MHz SSB 11 ms
29 MHz FM 13 ms
52 MHz FM 13 ms
146 MHz FM 13 ms
440 MHz FM 12 ms
Notes:
The purpose of the Transmit Delay test is to measure the time between PTT closure and 50% RF output. It
ARRL Laboratory Expanded Test-Result Report Model: Yaesu FT-100 Serial: 9D021081
Copyright 1999, American Radio Relay League, Inc. All Rights Reserved.
Page 18
Page 19

Transmit Composite Noise Test:
Test Description:
The purpose of the Composite-Noise Test is to observe and measure the phase and amplitude noise, as well as
any spurious signals generated by the device under test transmitter. Since phase noise is the primary noise component in any
well-designed transmitter, it can be assum ed, therefore, that alm ost all the n oise observed during this test is phase noise. This
measurement is accomplished by conv ertin g the outpu t of th e tran smitter down to a frequency about 10 or 20 Hz above baseband.
A mixer and a signal generator used as a local oscillator are used to perform this conversion. Filters rem ove th e 0 Hz com ponent as
well as the unwanted heterodyne compon en ts . The rem ain in g n oise an d s puriou s si g n als are th en obs erv ed on th e spectru m
analyzer.
The lower the noise as seen on the plot, the better the transmitter.
Key Test Conditions:
Transmitter operated at rated output power into a 50-ohm resistive load.
Transmitter operated at room temperature.
Frequencies from 2 to 22 kHz from the carrier are measured.
Ten sweeps are averaged on the spectrum analyzer to reduce noise.
Block Diagram:
OWER MUST ONLY BE
DUT
RANSMITTER
T
HE BIRD
T
W
8329.
RF
ATTMETER
IRD
B
4381
!
OWER
RF P
TTENUATOR
A
IRD
B
8329
10 dB S
TTENUATOR
A
HP 355D
TEP
TEP
1 dB S
TTENUATOR
A
HP 355C
RF S
ENERATOR
G
ARCONI
M
CAUTION!: P
PPLIED TO THE ATTENUATO R INPUT
A
O NOT REVERSE THE INPUT AND
D
UTPUT TERMINALS OF
O
IGNAL
4031
R
L
IXER
M
PHASE LOCK SIGNAL
A
IF IN
I
COMPOSITE NOISE MIX E R
6 dB
TTENUATOR
Test Result Summary:
Frequency 2 kHz offset
(dBc/Hz)
20 kHz offset
(dBc/Hz)
3.520 MHz –112 –130
14.02 MHz –115 –132
50.2 MHz –110 –128
144.2 MHz –109 –127
432.2 MHz –107 –123
Notes:
1.25 MH
OW PASS
L
ILTER
F
Z
Notes
1 KH
IGH PASS
H
ILTER
F
LOW-NOISE
AMPLIFIER
IF OUT
Z
PECTRUM
S
NALYZER
A
HP 8563E
ARRL Laboratory Expanded Test-Result Report Model: Yaesu FT-100 Serial: 9D021081
Copyright 1999, American Radio Relay League, Inc. All Rights Reserved.
Page 19
Page 20

Transmit Composite Noise Graphs:
–60
Reference Level: - 60 dBc/Hz
–70
Vertical Scale: dBc/Hz
–80
–60
Reference Level: - 60 dBc/Hz
–70
Vertical Scale: dBc/Hz
–80
–90
–100
–110
–120
–130
–140
2 4 6 8 10 12 14 16 18 20 22
Yaesu FT-100 9D021081
3.520 MHz, Phase Noise, 100 W
F:\SHARED\PROD_REV\TESTS\FT100.2ND\FT100P80.TXT
Frequency Sweep: 2 to 22 kHz from Carrier
–60
Reference Level: - 60 dBc/Hz
–70
Vertical Scale: dBc/Hz
–80
–90
–100
–110
–120
–130
–140
2 4 6 8 10 12 14 16 18 20 22
Yaesu FT-100 9D021081
14.020 MHz, Phase Noise, 100 W
F:\SHARED\PROD_REV\TESTS\FT100.2ND\FT100P20.TXT
Frequency Sweep: 2 to 22 kHz from Carrier
–90
–100
–110
–120
–130
–140
2 4 6 8 10 12 14 16 18 20 22
Yaesu FT-100 9D021081
50.020 MHz, Phase Noise, 100 W
F:\SHARED\PROD_REV\TESTS\FT100.2ND\FT100P6M.TXT
Frequency Sweep: 2 to 22 kHz from Carrier
–60
Reference Level: - 60 dBc/Hz
–70
Vertical Scale: dBc/Hz
–80
–90
–100
–110
–120
–130
–140
2 4 6 8 10 12 14 16 18 20 22
Yaesu FT-100 9D021081
144.020 MHz, Phase Noise, 100 W
F:\SHARED\PROD_REV\TESTS\FT100.2ND\FT100P2M.TXT
Frequency Sweep: 2 to 22 kHz from Carrier
–60
Reference Level: - 60 dBc/Hz
–70
Vertical Scale: dBc/Hz
–80
–90
–100
–110
–120
–130
–140
2 4 6 8 10 12 14 16 18 20 22
Yaesu FT-100 9D021081
432.020 MHz, Phase Noise, 100 W
F:\SHARED\PROD_REV\TESTS\FT100.2ND\FT100P70.TXT
Frequency Sweep: 2 to 22 kHz from Carrier
ARRL Laboratory Expanded Test-Result Report Model: Yaesu FT-100 Serial: 9D021081
Copyright 1999, American Radio Relay League, Inc. All Rights Reserved.
Page 20
Page 21

Receiver Noise Floor (Minimum Discernible Signal) Test:
:
Test Description
to the noise output level. This is sometimes called "minimum discernible signal " (MDS), although a skilled operator c an
detect a signal up to 10 dB or so below the noise floor. Most modern receivers have a noise floor within a few dB of "perfect."
A perfect receiver would hear only the noise of a resistor at room temperature. However, especially for HF receiving systems,
the system noise is rarely determined by the receiver. In most cases, external noise is many dB higher than the receiver's
internal noise. In this case, it is the external factors that determine the system noise performance. Making the receiver more
sensitive will only allow it to hear more noise. It will also be more prone to overload. In many cases, especially in the lower
HF bands, receiver performance can be improved by sacrificing unneeded sensitivity by placing an attenuator in front of the
receiver. The more negative the sensitivity number expressed in dBm, or the smaller the number expressed in voltage, the
better the receiver.
Key Test Conditions:
50-ohm source impedance for generators.; Receiver audio output to be terminated with specified impedance.
Receiver is tested using 500 Hz bandwidth, or closest available bandwidth to 500 Hz.
Block Diagram:
The noise floor of a receiver is the level of input signal that gives a desired audio output level that is equal
HI-Z
ONITOR AMP
M
RF S
ENERATOR
G
ARCONI
M
IGNAL
2041
10 dB S
TTENUATOR
A
HP 355D
TEP
TEP
1 dB S
TTENUATOR
A
HP 355C
DUT
ECEIVER
R
UDIO/
A
ISTORTION
D
ETER
M
HP 339A
Noise Floor:
Frequency Preamp OFF
(dBm)
Preamp ON
(dBm)
Notes
1.82 MHz –132.6 –136.6
3.52 MHz –132.9 –137.5
7.02 MHz –136.4 –139.9
10.12 MHz –135.3 –139.3
14.02 MHz –132.6 –137.3
14.02 MHz –136.1 N/A 1
14.02 MHz –138.6 N/A 2
14.02 MHz –135.1 N/A 3
18.1 MHz –133.3 –135.9
21.02 MHz –132.4 –138.8
24.91 MHz –132.7 –140.6
28.02 MHz –131.8 –140.4
50.02 MHz –129.8 –134.7
144.02 MHz N/A –142.3
430.02 MHz N/A –143.3
Notes:
1. Unit operated at 12.5 V dc. (Only performed on units that are specified to operate from 12-14 V dc source.
2. Unit operated at -10C. (Only performed on mobile or portable units)
3. Unit operated at +60C. (Only performed on mobile or portable units)
ARRL Laboratory Expanded Test-Result Report Model: Yaesu FT-100 Serial: 9D021081
Copyright 1999, American Radio Relay League, Inc. All Rights Reserved.
Page 21
Page 22

Receive Frequency Range:
Test Description:
receiver can be tuned. Most receivers exhibit some degradation of sensitivity near the limits of their tuning range. In cases
where this degradation renders the receiver unusable, we report both the actual and useful tuning range.
Test Results:
Minimum Frequency Minimum
65 kHz –67.0 dBm 960.999 99 MHz –97.2 dBm
Additional Test Results
Frequency Sensitivity
65 kHz –67.0 dBm
500 kHz –125.8
1.0 MHz –131.5
100 MHz
162 MHz
222 MHz
Notes:
This test measures the tuning range of the receiver. The range expressed is the range over which the
Frequency
Noise Floor
Preamp ON
8.4 µV
0.19 µV
0.44 µV
Maximum
Frequency
Notes
WFM
NFM
NFM
Maximum
Frequency
Noise Floor
Notes
AM Sensitivity Test:
Test Description:
kHz, that results in a tone 10 dB above the noise level (MDS) of the receiver. Two frequencies, 1.020 MHz and 3.800 MHz are
used for this test. The more negative the number, expressed in dBm, or the smaller the number expressed in voltage, the better the
sensitivity.
Test Results:
Frequency Preamplifier
1.02 MHz OFF 1.90
1.02 MHz ON 1.12
3.8 MHz OFF 1.70
3.8 MHz ON 0.965
53 MHz OFF 2.75
53 MHz ON 1.19
120 MHz (aircraft) ON 0.976
146 MHz ON 0.420
440 MHz ON 0.426
Notes:
The purpose of the AM receive Sensitivity Test is to determine the level of an AM signal, 30% modulated at 1
µ
V
Notes
ARRL Laboratory Expanded Test-Result Report Model: Yaesu FT-100 Serial: 9D021081
Copyright 1999, American Radio Relay League, Inc. All Rights Reserved.
Page 22
Page 23

FM SINAD and Quieting Test:
The purpose of the FM SINAD and Quieting Test is to determine the following at a test frequen cy of 29.000
Test Description
MHz:
1) The 12 dB SINAD value.
SINAD is an acronym for "SIgnal plus Noise And Distortion" and is a measure of sig nal quality. The exact expression for
SINAD is the following:
SINAD = Signal + Noise + Distortion (expressed in dB)
Noise + Distortion
If we consider distortion to be merely another form of noise, (distortion, like noise, is something u n wanted added to the signal), we
can further reduce the equation f or SINA D to:
If we now con sider a practical circu it in which the signal is mu ch g reater than th e n oise, th e valu e of th e SIGNA L +
NOISE can be approximated by the lev el of th e SIGNAL alone. The SINAD equation then becom es th e s ig n al to n oise
ratio. The approximation now becomes:
SINAD = Signal (expressed in dB)
Noise
:
SINAD = Signal + Noise (expressed in dB)
Noise
For the 25% level of distortion used in this test, the SINAD value can be calculated as follows:
1
SINAD = 20 log (1/25%) = 20 log 4 = 12 dB
2) The level of unmodulated input sig n al th at produ ces 10 dB of qu i et in g if specified by th e manufacturer.
3) The level of unmodulated i n pu t s i g n al t h at produ ces 20 dB of quieting if specified by the manufacturer.
The more negative the number, expressed in dBm, or the smaller the number, expressed as voltage, the better the sensitivity.
Test
Results
Frequency Preamplifier Bandwidth
:
µ
V
Notes
29.0 MHz OFF NARROW 0.616 1, 2
29.0 MHz ON NARROW 0.226
52.0 MHz OFF NARROW 0.660
52.0 MHz ON NARROW 0.398
100.0 MHz ON WIDE 8.41 3
100.0 MHz ON NARROW 0.275 3
146.0 MHz ON WIDE 2.80
146.0 MHz ON NARROW 0.148
440.0 MHz ON WIDE 0.767
440.0 MHz ON NARROW 0.157
Notes:
1. Level for 12 dB SINAD. The FM quieting test is performed only if needed to verify a manufacturer's specification.
2. SINAD not within normal range for WFM on 29 and 52 MHz (WFM SINAD is not specified by Yaesu).
3. FM broadcast band.
ARRL Laboratory Expanded Test-Result Report Model: Yaesu FT-100 Serial: 9D021081
Copyright 1999, American Radio Relay League, Inc. All Rights Reserved.
Page 23
Page 24

Blocking Dynamic Range Test:
Test Description:
one or more unwanted signals on other frequency. It is essentially a measurement of the difference between a receiver's noise
floor and the loudest off-channel signal that can be accommodated without measurable degradation of the receiver's response to
a relatively weak signal to which it is tuned. This difference is usually expressed in dB. Thus, a receiver with a dynamic range
of 100 dB would be able to tolerate an off-channel signal 100 dB stronger than the receiver's noise floor.
In the case of blocking dynamic range, the degradation criterion is receiver desense. Blocking dynamic range (BDR) is the
difference, in dB, between the noise floor and a off-channel signal that causes 1 dB of gain compression in the receiver. It
indicates the signal level, above the noise floor, that begins to cause desensitization. BDR is calculated by subtracting the
noise floor from the level of undesired signal that produces a 1-dB decrease in a weak desired signal. It is expressed in dB.
The greater the dynamic range, expressed in dB, the better the receiver performance. It is usual for the dynamic range to vary
with frequency spacing.
Key Test Conditions:
AGC is normally turned off; the receiver is operated in its linear region. Desired signal set to 10 dB below the 1-dB
compression point, or 20 dB above the noise floor in receivers whose AGC cannot be disabled. The receiver bandwidth is set
as close as possible to 500 Hz.
Block Diagram:
Dynamic range is a measurement of a receiver's ability to function well on one frequency in the presence of
IGNAL
RF S
ENERATOR
G
ARCONI
M
MCL ZSFC 2-6
G
PORT
2-
OUPLER
C
IGNAL
RF S
ENERATOR
HP 8640B
2041
10 dB S
TTENUATOR
A
HP 355D
TEP
1 dB S
TTENUATOR
A
HP 355C
TEP
DUT
ECEIVER
R
HI-Z
ONITOR AMP
M
UDIO/
A
ISTORTION
D
ETER
M
HP 339A
ARRL Laboratory Expanded Test-Result Report Model: Yaesu FT-100 Serial: 9D021081
Copyright 1999, American Radio Relay League, Inc. All Rights Reserved.
Page 24
Page 25

Test Result Summary:
Band P reamp Spacing BDR (dB) Notes
1.82 MHz ON 50 kHz 121.6 1
3.52 MHz OFF 20 kHz 127.9
3.52 MHz ON 20 kHz 121.5
3.52 MHz ON 50 kHz 123.5
14.02 MHz OFF 20 kHz 129.6
14.02 MHz ON 20 kHz 125.3
14.02 MHz ON 50 kHz 129.3
14.02 MHz OFF 100 kHz 131.6
14.02 MHz ON 100 kHz 127.3
21.02 MHz ON 50 kHz 127.8
28.02 MHz ON 50 kHz 127.4
50.02 MHz OFF 20 kHz 115.8*
50.02 MHz ON 20 kHz 106.7*
50.02 MHz ON 50 kHz 113.7*
144.02 MHz ON 20 kHz 113.3*
144.02 MHz ON 50 kHz 121.3
432.02 MHz ON 20 kHz 113.3*
432.02 MHz ON 50 kHz 113.3
Notes:
1. 500 Hz receiver bandwidth for all tests.
* Indicates that measurement was noise limited at values shown
Two-Tone 3rd-Order Dynamic Range Test:
Test Description: Intermodulation distortion dynamic range (IMD DR) measures the impact of two-tone IMD on a receiver.
IMD is the production of spurious responses resulting from the mixing of desired and undesired signals in a receiver. IMD
occurs in any receiver when signals of sufficient magnitude are present. IMD DR is the difference, in dB, between the noise
floor and the strength of two equa l off-channel signals that produce a third-order product equal to the noise floor.
In the case of two-tone, third-order dynamic range, the degradation criterion is a receiver spurious response. If the receiver
generates a third-order response equal to the receiver's noise floor to two off-channel signals, the differe nce between the noise
floor and the level of one of the off-channel signals is the blocking dynamic range.
This test determines the range of signals that can be tolerated by the device under test w hile producing essen tially no undesired
spurious responses. To perform the 3
input of the receiver. If w e call thes e f requ encies f
The greater the dynamic range, expressed in dB, or the higher the intercept point, the better the performance.
Key Test Conditions:
Sufficient attenuation and isolation must exist between the two signal generators. The two-port coupler must be terminated in a
20-dB return loss load. The receiver is set as close as possible to 500 Hz bandwidth.
rd
Order test, two signals of equal amplitude and spaced 20 kHz apart, are injected into the
and f2, the third-order products will appear at frequencies of (2f1-f2) and (2f2-f1).
1
ARRL Laboratory Expanded Test-Result Report Model: Yaesu FT-100 Serial: 9D021081
Copyright 1999, American Radio Relay League, Inc. All Rights Reserved.
Page 25
Page 26

Block Diagram:
IGNAL
RF S
ENERATOR
G
ARCONI
M
MCL ZSFC 2-6
G
PORT
2-
OUPLER
C
IGNAL
RF S
ENERATOR
HP 8640B
2041
10 dB S
TTENUATOR
A
HP 355D
TEP
TEP
1 dB S
TTENUATOR
A
HP 355C
DUT
ECEIVER
R
HI-Z
ONITOR AMP
M
UDIO/
A
ISTORTION
D
ETER
M
HP 339A
Two-Tone Receiver IMD Dynamic Range Test Result Summary:
Band Spacing Preamp OFF
IMD DR (dB)
1.82 MHz 50 kHz N/A 84.6 1
3.52 MHz 20 kHz 91.9 87.5
3.52 MHz 50 kHz N/A 88.5
14.02 MHz 20 kHz 93.6 91.3
14.02 MHz 50 kHz N/A 91.3
14.02 MHz 100 kHz 94.6 91.3
21.02 MHz 50 kHz N/A 89.8
28.02 MHz 50 kHz N/A 88.4
50.02 MHz 20 kHz 93.8* 89.7
50.02 MHz 50 kHz N/A 90.7
144.02 MHz 20 kHz N/A 84.3
144.02 MHz 50 kHz N/A 85.3
144.02 MHz 10 MHz N/A 97.3
432.02 MHz 20 kHz N/A 82.3
432.02 MHz 50 kHz N/A 83.3
432.02 MHz 10 MHz N/A 85.3
Preamp ON
IMD DR (dB)
Notes
Notes: 1. Unit tested at 500 Hz bandwidth.
* Indicates that the measurement was noise limited at values shown.
ARRL Laboratory Expanded Test-Result Report Model: Yaesu FT-100 Serial: 9D021081
Copyright 1999, American Radio Relay League, Inc. All Rights Reserved.
Page 26
Page 27

Dynamic Range Graphs:
The following page shows one of the highlights of ARRL test result reports -- swept graphs on receiver
two-tone, third-order IMD dynamic range and blocking dynamic range. These graphs are taken using
National Instruments LabWindows CVI automated test software, with a custom program written by the
ARRL Laboratory.
Dynamic range measures the difference between a receiver's noise floor and the receiver's degradation in
the presence of strong signals. In some cases, the receiver's noise performance causes receiver
degradation before blocking or a spurious response is seen. In either case, if the noise floor is degraded by
1 dB due to the presence of receiver noise during the test, the dynamic range is said to be noise limited by
the level of signal that caused the receiver noise response. A noise-limited condition is indicated in the
"Product Review" test-result tables. The Laboratory is working on software changes that will show
QST
on the test-result graphs which specific frequencies were noise limited. These will be incorporated into
future test-result reports.
Being "noise limited" is not necessarily a bad thing. A receiver noise limited at a high level is better than
a receiver whose dynamic range is lower than the noise-limited level. In essence, a receiver that is noise
limited has a dynamic range that is better than its local-oscillator noise. Most of the best receivers are
noise limited at rather high levels.
The ARRL Laboratory has traditionally used off-channel signals spaced 20 kHz from the desired signal.
This does allow easy comparisons between different receivers. There is nothing magical about the 20-kHz
spacing, however. In nearly all receivers, the dynamic range varies with signal spacing, due to the specific
design of the receiver. Most receivers have filter combinations that do some coarse filtering at RF and in
the first IF, with additional filtering taking place in later IF or AF stages. As the signals get "inside"
different filters in the receiver, the dynamic range decreases as the attenuation of the filter is no longer
applied to the signal. Interestingly, the different filter shapes can sometimes be seen in the graphs of
dynamic range of different receivers. In the case of the ARRL graphs, one can often see that the 20-kHz
spacing falls on the slope of the curve. Many manufacturers specify dynamic range at 50 or 100 kHz.
The computer is not as skilled (yet) at interpreting noisy readings as a good test engineer, so in some cases
there are a few dB of difference between the computer-generated data and those in the "Product Review"
tables. Our test engineer takes those number manually, carefully measuring levels and interpreting noise
and other phenomena that can effect the test data. (We are still taking the two-tone IMD data manually.)
The graphs that follow show swept blocking and two-tone dynamic range. In the blocking test, the
receiver is tuned to a signal on 14.020 MHz, the center of the graph. The X axis is the frequency (MHz)
of the undesired, off-channel signal. In the two-tone test, the receiver is tuned to a signal on 14.020 MHz,
the center of the graph. The X axis is the frequency of the closer of the two tones that are creating
intermodulation.
ARRL Laboratory Expanded Test-Result Report Model: Yaesu FT-100 Serial: 9D021081
Copyright 1999, American Radio Relay League, Inc. All Rights Reserved.
Page 27
Page 28

Dynamic-Range Graphs:
150.0
140.0
130.0
120.0
B
110.0
D
R
100.0
d
90.0
B
Swept Blocking Dynamic Range
Receiver Frequency = 14.02 MHz
80.0
70.0
60.0
50.0
13.820 13.920 14.020 14.120 14.220
FT-100 9D021081
ARRL Laboratory Expanded Test-Result Report Model: Yaesu FT-100 Serial: 9D021081
Copyright 1999, American Radio Relay League, Inc. All Rights Reserved.
Page 28
Page 29

150.0
140.0
130.0
I
120.0
M
D
110.0
100.0
D
R
d
B
Swept IMD Dynamic Range
Receiver Frequency = 14.02 MHz
90.0
80.0
70.0
60.0
50.0
13.820 13.920 14.020 14.120 14.220
FT-100 9D021081
ARRL Laboratory Expanded Test-Result Report Model: Yaesu FT-100 Serial: 9D021081
Copyright 1999, American Radio Relay League, Inc. All Rights Reserved.
Page 29
Page 30

Second-Order IMD Test:
Test Description:
This test measures the amount of 2nd-order mixing that takes place in the receiver. Signals at 6 and 8 MHz
are presented to the receiver and the resultant output at 14 MHz is measured.
Test Results:
Frequency Preamplifier Mode Dynamic
IP2 No tes
Range (dB)
14.02 MHz OFF CW 91.6 dB +51.7 dBm
14.02 MHz ON CW 94.3 dB +52.8 dBm
In-Band Receiver IMD Test:
Test Description:
the passband of a receiver. Two signals, at levels of 50 µV (nominally S9), spaced 100 Hz are used. The receiver AGC is set
to FAST. The receiver is tuned so the two signals appear at 900 Hz and 1100 Hz in the receiver audio. The output of the
receiver is viewed on a spectrum analyzer and the 3rd- and 5th order products are measured directly from the screen. The
smaller the products as seen on the graph, the better the receiver. Generally, products that are less than 30 dB below the desired
tones will not be cause objectionable receiver intermodulation distortion.
Key Test Conditions:
S9 or S9 + 40 dB signals
Receiver set to SSB normal mode, nominal 2 - 3 kHz bandwidth
Block Diagram:
This test measures the intermodulation that occurs between two signals that are simultaneously present in
IGNAL
RF S
ENERATOR
G
ARCONI
M
MCL ZSFC 2-6
G
PORT
2-
OUPLER
C
IGNAL
RF S
ENERATOR
HP 8640B
2041
10 dB S
TTENUATOR
A
HP 355D
TEP
TEP
1 dB S
TTENUATOR
A
HP 355C
Test Result Summary:
Frequency Preamplifier AGC 3rd-order
dB (PEP)
5th-order
dB (PEP)
14.02 MHz ON FAST N/A N/A 1
14.02 MHz ON SLOW N/A N/A
Notes:
1. Test not performed on this unit.
DUT
ECEIVER
R
Notes
HI-Z
ONITOR AMP
M
UDIO/
A
ISTORTION
D
ETER
M
HP 339A
ARRL Laboratory Expanded Test-Result Report Model: Yaesu FT-100 Serial: 9D021081
Copyright 1999, American Radio Relay League, Inc. All Rights Reserved.
Page 30
Page 31

FM Adjacent Channel Selectivity Test:
Test Description:
receiver to reject interference from indiv i dual u n des ired si g nals while receiving various lev els of desired signal. The desired carrier
signal will be at 29.000 MHz, m odu lated at 1000 Hz, an d th e of f en din g si g n al will be located at adjacent nearby frequencies with
400 Hz modulation. (NO TE: The SINA D Test in 5.3 must be performed bef ore th i s t es t can be completed.) The greater the
number in dB, the better the rejection.
Test Results:
Frequency Preamplifier Frequency
29.0 MHz ON 20 kHz 76.9 dB
52 MHz ON 20 kHz 72.0 dB
146 MHz ON 20 kHz 72.3 dB
440 MHz ON 20 kHz 69.1 dB
Notes:
The purpose of the FM Adjacent Channel Selectivity Test is to measure the ability of th e device u nder test
Spacing
Adjacent-channel
rejection
Notes
FM Two-Tone 3rd-Order Dynamic Range Test:
Test Description:
be tolerated by the device under testing the FM mode while producing no spurious responses greater than th e 12-dB SINAD level.
To perform this test, two signals, f
The signal located 40 kHz f rom the distortion product bein g measured is modula ted at 1,000 Hz with a deviation of 3 k Hz. The
receiver is tuned to the Third Order IMD frequencies as determined by (2f
simultaneously by equal amounts until 25 % distortion, or the 12 dB SINAD point, is obtained. Frequencies 10 MHz outside the
amateur band are used to test th e wide-band dynami c ran g e. The greater th e dynamic range, the better the receiv er perf ormance.
The purpose of the FM Two- Tone 3
and f2, of equal amplitude and spaced 20 kHz apart, are injected into the input of the receiver.
1
rd
Order Dynamic Range Test is to determine the range of signals th at can
) and (2f2-f1). The input signals are then raised
1-f2
Test Results:
Frequency Preamplifier Frequency
Spacing
29 MHz ON 20 kHz 71.9 dB 1
52 MHz ON 20 kHz 72.0 dB 2
146 MHz ON 20 kHz 72.3 dB 2
146 MHz ON 10 MHz 85.8 dB
440 MHz ON 20 kHz 67.1 dB
440 MHz ON 10 MHz 75.1 dB
Notes:
1. FM Narrow for all tests in this table.
2. Test is noise limited. In FM, this results in a reading that is somewhat inaccurate. The actual dynamic range is probably a
few dB worse than the figures indicated. While this may sound opposite of what is expected, the presence of noise means that a
stronger signal is required to have a product equal to the measured SINAD and the result is a number that appears better than it
would be if there wer e no noise.
Dynamic Range Notes
ARRL Laboratory Expanded Test-Result Report Model: Yaesu FT-100 Serial: 9D021081
Copyright 1999, American Radio Relay League, Inc. All Rights Reserved.
Page 31
Page 32

Image Rejection Test:
Test Description:
signal input to the receiver at the first IF imag e f requencies th at will produce an audio output equal to the MDS level. The test is
conducted with the receiver in th e CW mode using the 500 Hz, or closest available, IF filters. Any audio filtering is disabled an d
AGC is turned OFF, if pos s ible. The test is perf ormed with the receiver tun ed to 14.020 MHz f or receiv ers th at h av e 20- meter
capability, or to a frequency 20 kHz up from the lower band edge for single-band receivers. The greater the number in dB, the
better the image rejection.
Test Results:
Frequency Preamplifier Mode Calculated
14.250 MHz ON CW 151.9902 MHz 113.2 dB
50.2 MHz ON CW 187.9902 MHz 104.1 dB
144.2 MHz ON CW 281.9902 MHz 79.6 dB
432.2 MHz ON CW 292.0502 MHz 82.0 dB
Notes:
This test measures the amount of image rejection for superheterodyne receivers by determining the level of
Image
Frequency
Image
Rejection
Notes
IF Rejection Test:
Test Description:
signal input to the receiver at the first IF that w ill produce an audio output equal to the MDS level. The test is conducted with the
receiver in the CW mode usin g th e 500 Hz, or closes t av ailable, IF f ilters. Any audio filtering is disabled an d AGC is turned OFF,
if possible. The test is perform ed with the receiver tuned to 14.020 MHz for receivers th at h av e 20- meter capability, or to a
frequency 20 kHz up f rom the lower band edge for sin g le- ban d receiv ers . The greater th e n u mber in dB, the better the IF rejection.
This test measures the amount of first IF rejection for superheterodyne receivers by determining the level of
Test Results:
Frequency Pr eamplifier Mode 1st IF
Rejection
14.250 MHz ON CW 100.8 dB
50.2 MHz ON CW 67.7 dB
144.2 MHz ON CW 94.6 dB
432.2 MHz ON CW 115.4 dB
Notes:
Notes
ARRL Laboratory Expanded Test-Result Report Model: Yaesu FT-100 Serial: 9D021081
Copyright 1999, American Radio Relay League, Inc. All Rights Reserved.
Page 32
Page 33

Audio Output Power Test:
Test Description:
distortion are used. For units not specified, an 8-ohm load and 10% harmonic distortion are used.
Test Results:
Specified Distortion Specified Load
10% T.H.D. 8 ohms 1.71 W
Notes:
This test measures the audio power delivered by the receiver. The manufacturer's specification for load and
Impedance
Audio Output
Power
Notes
IF + Audio Frequency Response Test:
Test Description:
receiver audio drops 6 dB from the peak signal response. The frequency-response bandwidth is then calculated by taking the
difference between the lower and upper frequency.
Test Results:
IF Filter
Use/Unit Mode
CW 500 419 Hz 953 Hz 534 Hz
CW WIDE 305 Hz 2242 Hz 1937 Hz
USB WIDE 223 Hz 2180 Hz 1957 Hz
LSB WIDE 304 Hz 2329 Hz 2025 Hz
AM NARROW 547 Hz 3409 Hz 3355 Hz
The purpose of the IF + Audio Frequency Response Test is to measure the audio frequencies at which the
Nominal
Bandwidth
Hz
Low Freq
(Hz)
High Freq
(Hz)
Difference
(bandwidth)
Notes
Notes:
Squelch Sensitivity Test:
Test Description:
squelch at the threshold and at the point of maximum squelch. This number is not usually critical. A result anywhere between
0.05 and 0.5 µV is usually useful. The maximum can range to infinity.
Test Results:
Frequency Preamplifier Mode Threshold Notes
29.0 MHz ON FM
52 MHz ON FM
146 MHz ON FM
440 MHz ON FM
14.2 MHz ON SSB
Notes:
The purpose of the Squelch Sensitivity Test is to determine the level of the input signal required to break
0.06 µV
0.09 µV
0.05 µV
0.04 µV
1.80 µV
ARRL Laboratory Expanded Test-Result Report Model: Yaesu FT-100 Serial: 9D021081
Copyright 1999, American Radio Relay League, Inc. All Rights Reserved.
Page 33
Page 34

S-Meter Test:
Test Description:
S9+20 dB indication on the receiver S meter. This test is performed with the receiver in the CW mode at a frequency of 14.200
MHz. The IF filter is set to 500 Hz, nominal. A traditional S9 signal is a level of 50 uV (an old Collins receiver standard).
The Collins standard S unit was 6 dB. This is , however, not a hard and fast rule, especially for LED or bar-graph type S
meters.
Test Results:
Frequency Preamplifier S Units
14.2 MHz OFF S9 31.7
14.2 MHz ON S9 14.7
52 MHz OFF S9 28.3
52 MHz ON S9 6.47
146 MHz ON S9 5.77
440 MHz ON S9 4.33
Notes:
The purpose of the S-Meter Test is to determine the level of RF input signal required to produce an S9 and
µ
V
Notes
Notch Filter Test:
Test Description:
detect and notch a signal.
The more negative the notch depth number, the better the performance.
This test measures the notch filter depth at 1 kHz audio and the time required for auto-notch DSP filters to
Test Results:
Frequency Notch Depth Notes
14.2 MHz 20 dB
Notes:
Other Tests:
Temperature Chamber Test Description:
All equipment that would normally be used outdoors are subjected to a function, output power and frequency accuracy test
over its specified temperature range. For those units not specified, the unit is operated at -10 and +60 degrees Celsius. These
temperatures were chosen to represent typical specifications and typical outdoor use over most of the country.
Duty Cycle Test Description:
Most equipment does not specify a duty cycle. For this reason, most Product Review equipment is not subject to a specific duty
cycle test. It is assumed that equipment without a duty-cycle specification is intended for conversational use on CW or SSB.
The equipment sees considerable such use during the review process. If equipment does have a duty-cycle specification, such
as "continuous," "continuous commercial" or a specific time parameter, the equipment is tested against that specification. If
the unit does not pass, this will be treated as a defect that occurred during the review.
ARRL Laboratory Expanded Test-Result Report Model: Yaesu FT-100 Serial: 9D021081
Copyright 1999, American Radio Relay League, Inc. All Rights Reserved.
Page 34
 Loading...