

Page 1

GE
Inspection Technologies
Mobile Hardness Testing
Application Guide for
Hardness Testers
Dr. Stefan Frank
Page 2

GE Inspection Technologies
2
Page 3

Ultrasonics
Mobile Hardness Testing –
Application Guide
Dr. Stefan Frank
1. Introduction ............................................................................................................................................................ 4
1.1 What is hardness? .................................................................................................................................................... 4
1.2 Why hardness testing? .............................................................................................................................................. 5
1.3 On-site mobile hardness testing? ............................................................................................................................... 5
2. The UCI method (MIC 10, MIC 20) ........................................................................................................................... 5
2.1 The method ........................................................................................................................................................... 5
2.2 Selecting the suitable UCI probe ................................................................................................................................6
3. The Rebound method
(DynaPOCKET, DynaMIC, MIC 20) ............................................................................................................................. 8
3.1 The method ............................................................................................................................................................ 8
3.2 Selection of the suitable impact device ....................................................................................................................... 9
4. The optical Through-Indenter-Viewing method (TIV).................................................................................................... 10
4.1 The method .......................................................................................................................................................... 10
4.2 Selection of the suitable probe ................................................................................................................................12
5. The Hardness Testers – an Overlook ......................................................................................................................... 13
5.1 The DynaPOCKET .................................................................................................................................................. 13
5.2 The DynaMIC ........................................................................................................................................................ 13
5.3 The MIC 10 .......................................................................................................................................................... 13
5.4 The MIC 20 .......................................................................................................................................................... 14
5.5 The TIV ................................................................................................................................................................ 14
6. The different methods in the field ............................................................................................................................ 14
6.1 Selecting the test method ....................................................................................................................................... 14
6.2 Significance of indentation size ............................................................................................................................... 15
6.3 Relation between penetration depth and minimum thickness for coatings ...................................................................... 16
6.4 Hardness testing on welds (HAZ) ............................................................................................................................. 16
6.5 Test piece mass requirements .................................................................................................................................. 17
6.6 Wall thickness requirements .................................................................................................................................... 17
6.7 Surface quality ...................................................................................................................................................... 18
6.8 Handling, alignment, and fixing ............................................................................................................................... 18
6.9 Calibration ............................................................................................................................................................ 18
6.10 Verifying instrument performance............................................................................................................................. 20
7. Summary and help in choosing
the suitable test method ......................................................................................................................................... 20
7.1 The UCI method (MIC 20 / MIC 10) ......................................................................................................................... 21
7.2 Rebound method (MIC 20 / DynaMIC / DynaPOCKET) ................................................................................................ 21
7.3 Optical method – Through-Indenter-Viewing (TIV) ....................................................................................................... 21
7.4 Fundamental questions to the user .......................................................................................................................... 22
3
Page 4

GE Inspection Technologies
1. Introduction
Mobile hardness testing is on the ad-
vance: in these times of cost pressure
and higher quality requirements, it repre-
sents not only a quick but most of all an
economical supplement to stationary
hardness testing in the modern produc-
tion process. The application possibilities
are far ranging - this refers to both large
and smaller components, especially at
positions which are difficult to access.
There are three different physical methods
which are particularly recognized in the
field: the static UCI (Ultrasonic Contact
Impedance) method and the dynamic
rebound hardness testing method, as well
as the optical TIV (Through-Indenter-
Viewing) method. The decision as to which
method is to be used depends on the test
problem. Krautkramer offers five instru-
ment series for mobile hardness testing,
operating according to the UCI, the re-
bound or the TIV methods: DynaPOCKET,
DynaMIC, MIC 10, MIC 20, and TIV.
This Application Guide explains the basic
principles of these test methods and
compares them, using examples from the
field, e.g. hardness testing in the heat-
affected zone (HAZ) of welds.
In addition to this, the subjects critically
discussed are the factors liable to influ-
ence the measured values, such as sur-
face preparation at the test location or
the mass of parts to be tested as well as
their thickness.
1.1 What is hardness?
With regard to metallic materials, hard-
ness has always been (and still is) a sub-
ject of much discussion among metallur-
Fig. 1:
Hardness testing using the MIC 20 in combination with the test support
MIC 227 and a UCI probe in the heat-affected zone (HAZ) of a weld.
Fig. 3:
Hardness testing using the DynaPOCKET on the chain of an open-pit mining
excavator.
4
Fig. 2:
Hardness testing with a rebound hardness tester (DynaMIC) on the drive wheel
of a large hydraulic excavator.
Fig. 4:
Optical hardness testing using the TIV tester. Checking before final assembly.
Page 5

Ultrasonics
gists, engineers, and material scientists.
It is no wonder therefore that there is a
wide range of definitions for the term
hardness. Attributes like wear resistance,
deformation behavior, tensile strength, as
well as modulus of elasticity or Young’s
modulus are connected with the term
hardness.
An exact description of the method must
be made if one wishes to compare the
obtained readings with each other in
order to achieve a usable hardness value.
However, if the reading depends on the
method, then the conclusion may quite
clearly be drawn that hardness is no
physical quantity but that it must be a
parameter.
Hardness testing is almost nondestructive
and in many cases used for determining
parameters to differentiate and describe
materials. For example, hardness values
can easily provide data on the strength
properties of a material.
The term hardness is generally understood
as being the resistance of a material
against the penetration of a body made of
a stronger material.
Hardness is therefore not a fundamental
quantity of a material but always a re-
sponse of the material to a certain load or
test method. A hardness value is calculat-
ed on the basis of the response of the
material to this load.
Depending on the test method, other
numerical values are then determined
which are due to and characterized by
• the shape and material of the indenter
• the type and size of the load,
e.g. test load.
The different test methods can be roughly
divided into two groups:
a) Static test method:
With this method of testing, the load is
applied statically or quasi-statically. After
removing the test load, the hardness
value is defined as a ratio of test load and
the surface or projected area of the per-
manent test indentation (Brinell, Vickers,
or Knoop). In tests according to Rockwell,
the hardness is determined by means of
the permanent penetration depth of a
body due to the test load.
b) Dynamic test method
As opposed to the static method, the load
is applied in the impact mode in this
case, and the hardness is determined on
the basis of the indenter’s ”loss of energy”.
It is normal practice – and often neces-
sary – to indicate the hardness values
using another scale than the one used for
measuring them. The following should
always be taken into account regarding
this:
• There are no generally applicable relati-
onships for the conversion of hardness
values from one to another
• Conversions are possible whenever the
conversion relationship has been deter-
mined by statistically backed compari-
son measurements
• Conversion relationships from national
and international standards apply to
certain material groups to a limited
extent.
The various conversion relationships, as
specified in standards DIN 50 150 and
ASTM E 140, are stored and can be
selected in the instruments of the
MICRODUR series (MIC 10 and MIC 20)
and in the rebound hardness testers
(DynaPOCKET, DynaMIC, MIC 20), as
well as in the optical TIV hardness
tester.
1.2 Why hardness testing?
Within the production and assembly
lines, the hardness of materials or com-
ponents is mainly tested for two reasons:
firstly, to determine the characteristics of
new materials, and secondly, for the
purpose of quality assurance by meeting
the required specifications.
1.3 On-site mobile hardness testing?
Conventional hardness testers according
to Rockwell, Brinell, or Vickers always
require the test piece be brought to the
tester. As this is not always possible for
practical reasons and, most of all, for
reasons of geometry, small and portable
hardness testers were developed that
enable quick on-site testing on the
component.
Different methods are applied here.
Most of all the portable hardness testers
according to the UCI, rebound, and TIV
method are successfully used in practical
operations in the field.
2. The UCI method (MIC 10, MIC 20)
Standardized according to ASTM A 1038
2.1 The method
As in Vickers or Brinell hardness testing,
the question as to the size of the test
indentation left in the material by a
Vickers diamond after applying a fixed
test load also arises in Vickers hardness
testing according to the Ultrasonic Contact
Impedance method (UCI for short).
However, the diagonals of the test inden-
tation are not determined optically for
the hardness value as usual, but the
indentation area is electronically detected
5
Page 6
GE Inspection Technologies
by measuring the shift of an ultrasonic
frequency. The UCI method can be illus-
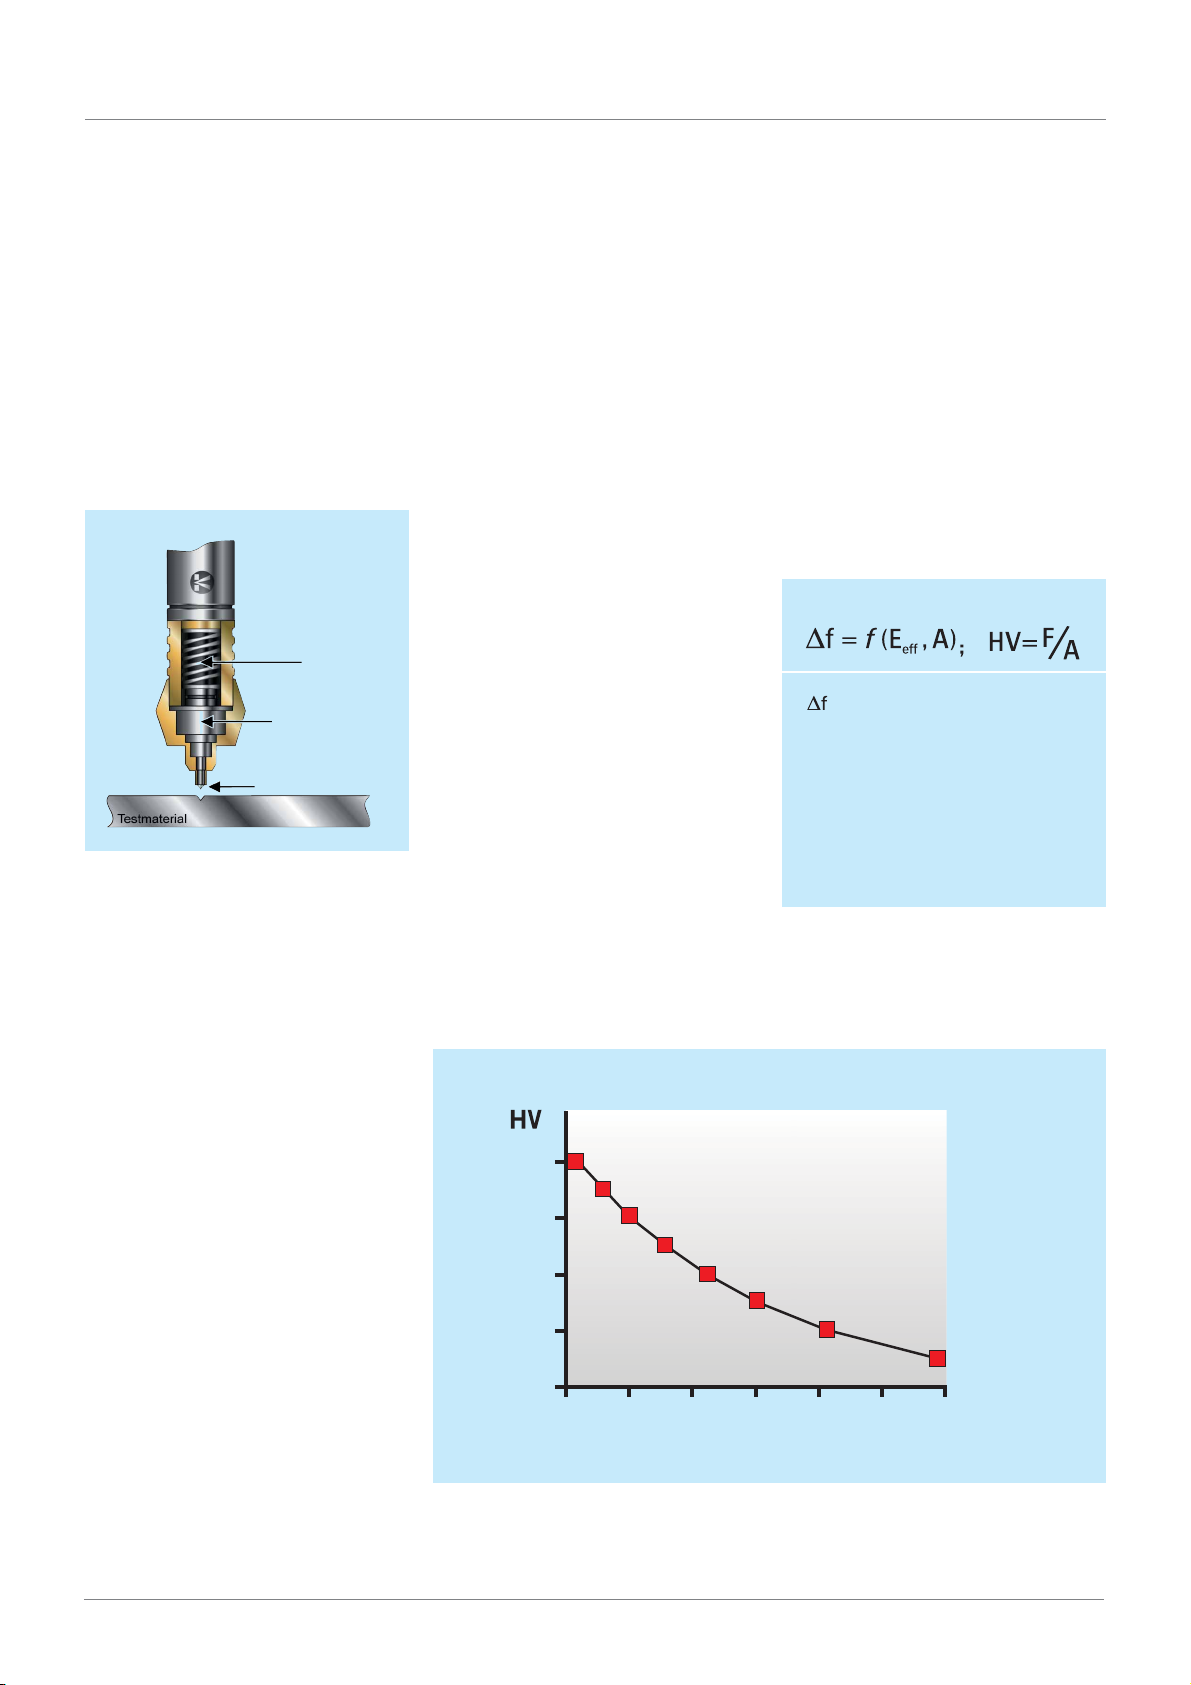
trated by a small imaginary experiment. A
UCI probe essentially consists of a Vickers
diamond attached to the end of a metal
rod (Fig. 5). This rod is excited into longi-
tudinal oscillation by piezoelectric trans-
ducers. Imagine instead of the metal rod
(we refer to it as oscillation rod) a large
spiral spring held at one end and oscillat-
Piezo
Transducer
Piezo
Receiver
Oscillating
Rod
Vickers Diamond
Fig. 5:
Schematic description of the UCI method
(Test load / Oscillation rod / Vickers diamond /
Material to be tested).
ing at a resonant frequency of 70 kHz at
the free end. At the very top of this spring,
there is a contact plate, the Vickers dia-
mond. The test material, with which the
Vickers diamond comes into contact, can
also be imagined as being a system of
smaller spiral springs positioned vertically
to the surface - an atomic bond, two
atoms inter-linked via a “spring“. If only
one of these “atomic springs“ is touched
by the Vickers diamond - with very hard
material in which the diamond can only
slightly penetrate and consequently pro-
duce a small indentation – then an addi-
tional spring, i.e. mass, is coupled to the
large spiral spring. This produces a shift
in resonant frequency.
larger. Analogously, the largest frequency
shift is produced on soft test materials;
the diamond penetrates deeper into the
material leaving a large indentation.
The frequency shift is proportional to the
size of the test indentation produced by
the Vickers diamond. Therefore, the
diagonals of the test indentation are not
optically determined for the hardness
value, as is usually done, but the inden-
tation area is electronically detected by
measuring the frequency shift – taking
just a few seconds.
This is the whole secret of UCI hardness
testing: the frequency shift is proportional
to the size of the Vickers test indentation.
Equation 1 describes this basic relation in
comparison to the definition of the Vickers
hardness value.
Naturally, such a frequency shift likewise
depends on the spring constant of our
small ”atomic springs”.
When applied to the material to be tested,
this is known as the modulus of elasticity
or Young’s modulus. After completing the
calibration, the UCI method can be used
900
700
500
300
100
2 2.5 3 3.5 4 4.5 5
for all materials showing this modulus of
elasticity. The probes are factory-calibrated
on low-alloy or unalloyed steels; however,
modern test instruments can also be
quickly calibrated to other materials, such
as titanium or copper, at the test location.
2.2 Selecting the suitable UCI probe
To carry out a test according to the UCI
principle, a probe containing a rod with a
Vickers diamond attached to the contact
end is oscillated by piezoelectric ceramic
transducers at an ultrasonic frequency.
= frequency shift
A = area of indentation
E
= effective Young´s modulus
eff
HV = Vickers hardness value
F = Test Load
Equation 1:
The frequency shift is proportional to the indentation size of a Vickers indenter.
This frequency shift will become greater
when additional “springs“ are touched,
that means if the diamond penetrates
deeper into a material of medium hard-
ness, and the test indentation becomes
6
Frequency shift (kHz)
Fig. 6:
Frequency shift of the oscillation rod as a function of hardness (HV).
Page 7

Ultrasonics
A spring applies the load, and the fre-
quency of the rod changes in proportion
to the contact area of the indentation
produced by the Vickers diamond. There-
The instrument constantly monitors the
frequency, calculates the value, and
instantaneously displays the hardness
value.
fore, the hardness value is not optically
determined by the diagonals of the in-
dentation, as would normally be the case
with a hardness tester measuring statically,
but by an electronic measurement of the
frequency shift within seconds.
The UCI method is best suited for testing
homogeneous materials. Six test loads are
employed by the various models of UCI
probes (table 1).
Fig. 7:
UCI-probes – different models.
Testload Available Probe Models Advantage or Benefit Typical Applications
98 N MIC 2010 Largest indentation; requires Small forgings, weld testing, HAZ
(10 kgf) Standard Length minimal surface preparation
Handheld Style
50 N MIC 205 Solves most general Induction or carburized
(5 kgf) Standard Length application problems mechanical parts, e.g. camshafts,
Handheld Style turbines, welds, HAZ.
MIC 205L 30 mm extended length Measurement in grooves, gear
Extended Length tooth flanks and roots
Handheld Style
10 N MIC 201 Load easy to apply; enables Ion-nitrided stamping dies and
(1 kgf) Standard Length controlled testing on a sharp molds, forms, presses, thin walled
Handheld Style radius parts
MIC 201L Measurement on complicated Bearings, tooth flanks
Extended Length geometries
Handheld Style
8 N MIC 211 Automatic load application Finished precision parts, gears,
(0.9 kgf) Motor Probe Style bearing raceways
3 N MIC 2103 Automatic load application Layers, e.g. copper or chromium
(0.3 kgf) Motor Probe Style layers on steel cylinders
(≥ 40 µm),
rotogravure cylinders, coatings,
hardened layers
(≥ 20µm)
1 N MIC 2101 The shallowest indentation These layers with a polished surface
(0.1 kgf) Motor Probe Style
Table 1:
UCI probe models, benefits, and typical applications.
7
Page 8
GE Inspection Technologies
3. The Rebound method (DynaPOCKET, DynaMIC and MIC 20)
standardized according ASTM A 956
3.1 The method
Even with hardness testers operating
according to the Leeb’s or rebound
method, the size of the test indentation
generated is depended on the hardness
of material. However, it is in this case
indirectly measured via the loss of
Impact
m
▲
h
I
▲
m
▲
V
I
E
pot
= mgh
E
I
= mv
kin
2
/2
I
energy of a so-called impact body.
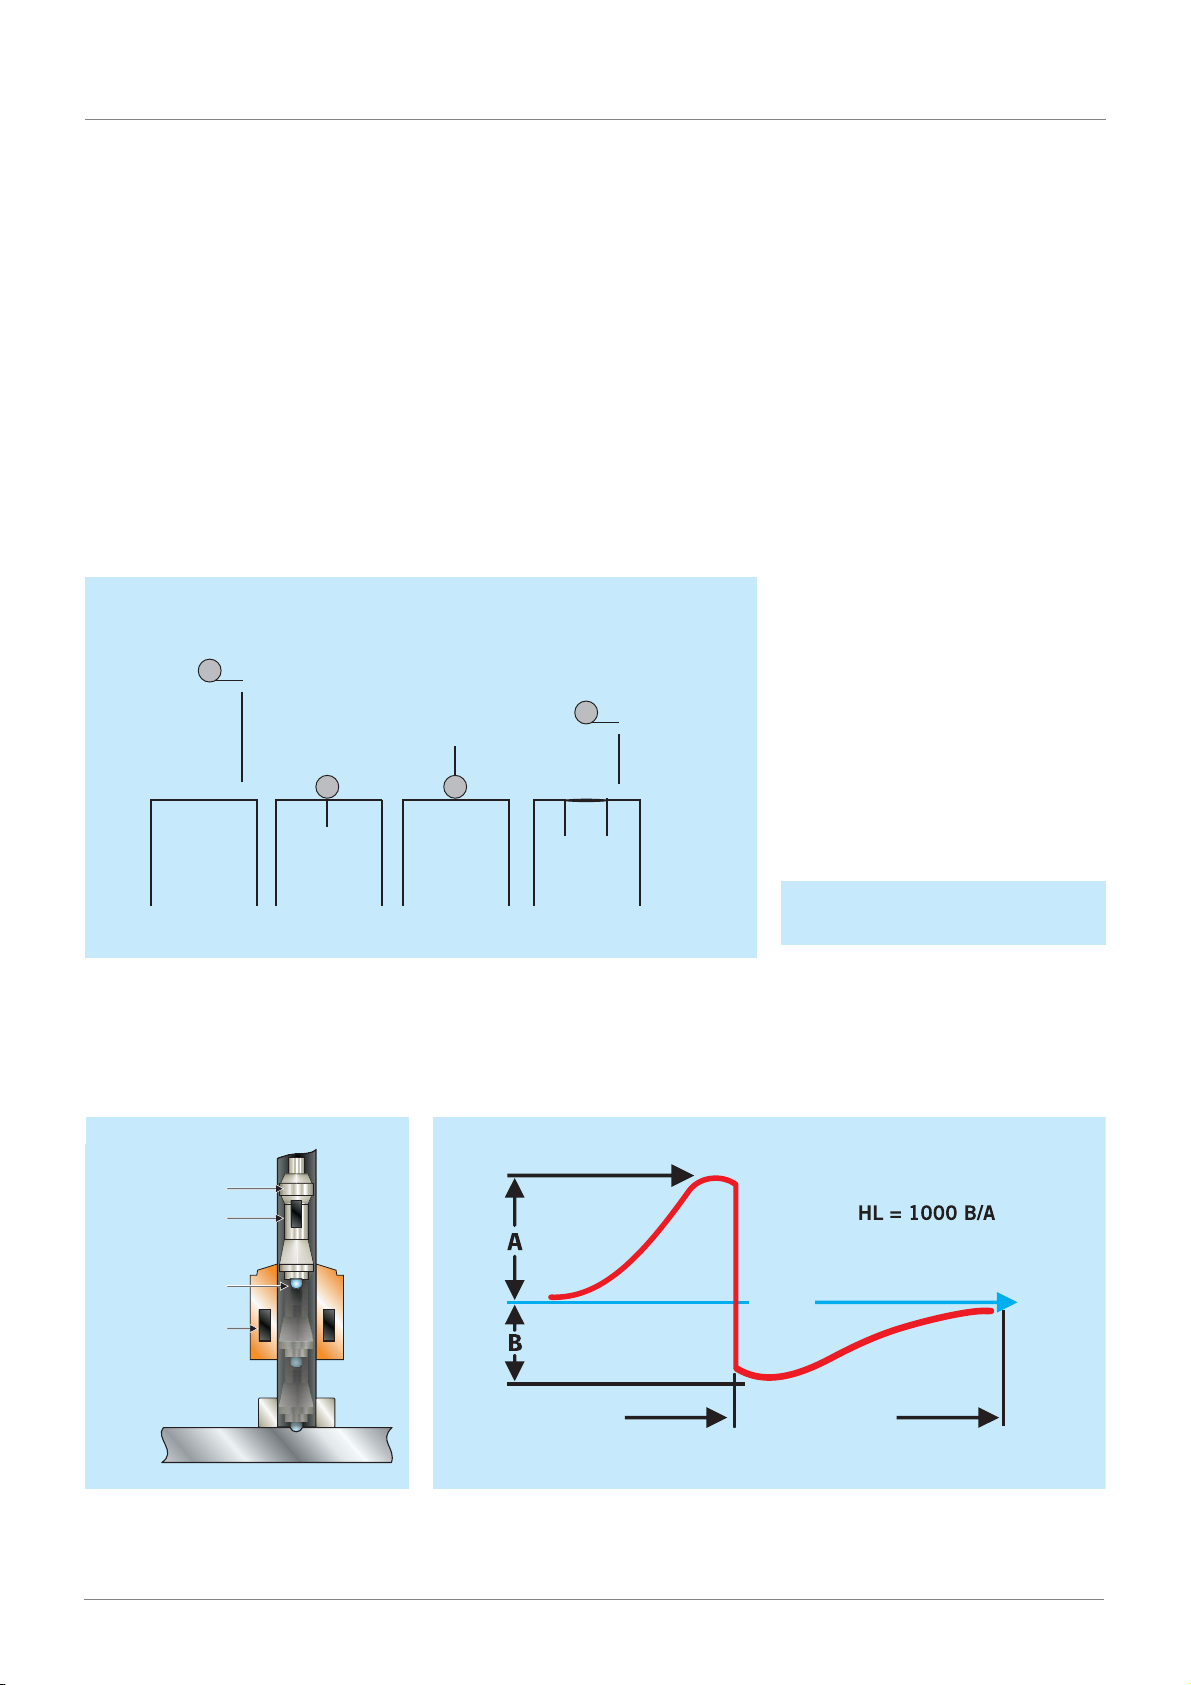
Figure 8 illustrates the physical principle
of rebound hardness testing.
A mass, in this case the impact body with
a tungsten carbide ball attached to its
tip, is fired against the test surface at a
Rebound
V
▲
m
R
m
▲
h
R
▲
d
= mv
2
/2 E
R
= mgh
pot
R
E
kin
defined speed by spring force. The im-
pact creates a plastic deformation of the
surface due to which the impact body
loses part of its original velocity, viz. i.e.
the softer the material, the greater the
loss in velocity. The velocity before and
after the impact is measured in a non-
contact mode. This is done by a small
permanent magnet within the impact
body (Fig. 9) generating an induction
voltage during its passage through a coil,
this voltage being proportional to the
velocity (refer to Fig. 10).
The Leeb’s hardness value HL, named
after the inventor of the rebound method
D. Leeb, is calculated from the ratio of
the impact and rebound velocities. Leeb
defined the hardness value as follows:
HL = VR / V1 · 1000
Fig 8:
The basic principle of rebound hardness testing:
d = diameter of indentation
E
= potential energy
pot
E
= kinetic ennergy.
kin
Impact body
Magnet
Tungsten
carbid ball
Coil
Fig 9:
Cross-section of an impact device.
Equation 2:
Hardness according to Leeb
m = mass
h
, hR = height before/after the impact
I
V
, VR = speed before/after the impact
I
Hardness Leeb
Time
Before Impact After impact
Fig 10:
Schematic course of the voltage signal generated by the impact body traveling through the coil. The signal
shows the voltage before and after the impact. (VDI Report No. 208, 1978).
8
Page 9

Ultrasonics
With respect to this relatively young hard-
ness testing method, the question never-
theless arises as to the extent to which
the Leeb’s scale is accepted or applied by
the user. Up until now, it has only been
used in a few cases for specifications and
test certificates. The measured speed
ratio has mostly been converted into one
of the conventional hardness scales (HV,
HB, HS, HRB, HRC, or N/mm2). It was
only this conversion possibility which
increased acceptance of rebound hard-
ness testers in the field.
If one wishes to convert a measured hard-
ness value into another scale (i.e. possibly
into the result of a completely different
hardness test method), there is no mathe-
matical formula for this purpose. So-
called conversion tables are therefore
empirically determined by carrying out a
corresponding number of experiments. To
do this, the hardness of a certain material
is measured using the different test meth-
ods, and the relationship between the
individual scales is determined (Fig. 10).
A correct and reliable conversion requires
the application of a conversion table
produced from the results of a sufficiently
large number of hardness measurements
using both scales and carried out on the
corresponding material of interest.
The main cause for the necessity to have
different material groups is the influence
of elastic properties (Young’s modulus) on
the hardness test using the rebound
method. Two materials having the same
”real hardness” indicate, under certain
conditions, different Leeb’s hardness
values owing to different values of Young’s
modulus. That is the reason why no uni-
versal conversion relationship exists from
the rebound hardness HL into the con-
ventional hardness scales. In order to do
justice to these facts, several material
groups, beneath which the corresponding
conversion tables are hidden, can be
selected in modern rebound hardness
testers (refer to Table 2).
Material group
Low-alloy/unalloyed steel
and cast steel
Tool steel
Corrosion-resistant steel
Gray cast iron
Nodular graphite iron
Aluminum cast alloys
Brass / CuZn
Bronze / CuAl, CuSn
Wrought copper alloys
Table 2:
Stored material groups in the hardness testers
DynaPOCKET, DynaMIC, and MIC 20.
3.2 Selection of the suitable
impact device
The rebound hardness tester variants
include the instruments MIC 20 TFT and
DynaMIC / DynaMIC DL with three impact
device versions, and the compact
DynaPOCKET. The operation of these
instruments is based on Leeb’s method.
80.0
70.0
60.0
50.0
HRC
40.0
30.0
20.0
10.0
500 600 700 800 900
HL
D
Fig 11:
Conversion of Leeb’s hardness HL into Rockwell C (HRC) as a typical example of conversion curves as they
are stored in rebound hardness testers. These curves are experimentally determined by measuring different
test objects having varying hardness values in HL and HRC.
To apply this principle, an impact device
uses a spring to propel an impact body
through a guide tube towards the test
piece. As it travels towards the test piece,
a magnet contained within the impact
body generates a signal in a coil encir-
cling the guide tube. After the impact, it
rebounds from the surface inducing a
second signal into the coil. The instru-
ment calculates the hardness value using
the ratio of the voltages and analyzes their
phases to automatically compensate for
changes in orientation.
The Krautkramer hardness testers MIC 20,
DynaMIC, and DynaPOCKET are the only
rebound hardness testers to have this
patented signal processing feature enab-
ling an automatic direction correction.
9
Page 10

GE Inspection Technologies
The question as to which instrument and
which impact device is suitable for the
corresponding application depends on the
required impact energy and on the type
or size of the indenter. Apart from Dyna-
POCKET, with integrated impact device D,
there is a choice between three impact
devices: Dyna D, Dyna E, and Dyna G for
MIC 20 and DynaMIC (refer to table 3).
Model Indenter Impact Energy Typical Application
(Nmm)
Dyna D 3 mm Tungsten 12 General-purpose testing of homogeneous materials
Carbide Ball
Dyna E 3 mm Diamand 12 > 50 HRC, e.g. forged and hardened steel mill rolls
Dyna G 5 mm Tungsten 90 < 650 HB, e.g. large castings and forgings,
require
Carbid Ball lower surface requirements (as opposed to Dyna D)
DynaPOCKET 3 mm Tungsten 12 Compact rebound hardness tester
Carbid Ball
Table 3:
Impact devices for rebound hardness testing, benefits, and typical applications.
4. The optical Through-Indenter-Viewing
method (TIV)
4.1 The method
TIV is a portable test instrument for opti-
cal hardness testing according to Vickers
under test load (Fig. 11). An optical
system including a CCD camera enables
viewing “through the diamond” (Through-
Indenter-Viewing). For the first time this
new method makes it possible to directly
watch the process of the Vickers diamond
penetrating the test material on the display.
The TIV technique can be used to carry
out a hardness test without any additional
calibration on different materials thanks
to the optical method of measurement.
Moreover, the static test load application
also makes it possible to carry out mea-
surements on both thin and small objects,
as well as on coatings.
As soon as the test load is reached, the
diagonal lengths of the indentation are
determined and converted into a hardness
value according to the Vickers definition.
This evaluation can be done both manually
and automatically. The TIV hardness tester
contains stored tables according to
DIN 50150 and ASTM E 140 that can be
selected to convert the measured hardness
value into other scales.
The picture of the indentation or Vickers
diamond on the display does not only allow
an immediate verification and assessment
of the quality of the measured value but
also enables direct checking of the
indenter’s (Vickers diamond) condition.
TIV can be used to open up new fields of
application for mobile hardness testing in
which conventional instruments could not
produce any reliable results up to date,
owing to the optical hardness testing
method.
Fig.12:
The TIV hardness tester in field use.
10
Page 11

Ultrasonics
“Through-Indenter-Viewing” enables a
hardness test:
• independent of measurement direction,
• on different materials without any cali-
bration (independent of the material),
• on thin and light components,
• on elastic materials.
TIV is the first portable hardness tester
that does not determine the indentation
size of the Vickers diamond and conse-
quently the hardness of the material
indirectly but directly: “Through-Indenter-
Viewing” means that one can simulta-
neously see the indentation of the Vickers
diamond “grow” on the test object’s
surface while the test load is being ap-
plied. This is ensured by a special optical
lens combination including a CCD camera
to digitize the indentation picture. As
soon as the test load is attained, the
picture of the indentation or of the dia-
mond is stored in the instrument and
automatically evaluated.
A special software is used in a first step to
determine the edges of the indentation.
The intersection points with the edges of
the Vickers diamond (roof angle 136°)
displayed on the screen are finally taken
as a basis to determine the lengths of the
two diagonals. The average of the two
diagonals is then used for calculating the
hardness value according to the Vickers
definition. The automatic evaluation is
not only fast compared to the use of a
conventional measuring micro-scope but
subjective effects due to the user are also
excluded which become noticeable, espe-
cially in manual evaluation of the Vickers
indentation.
Figure 12 shows the result of a hardness
test using the Through-Indenter-Viewing
method. The optical verification of the
shape of the indentation is the only method
to allow reliable conclusions to be drawn
with regard to the quality of the measure-
ment. One look on the display is enough
to recognize whether the measurement
has been influenced by the surface quality,
Fig. 13:
Measurement of hardness using the TIV. The
indentation of the Vickers
diamond is displayed on
the screen and automatically evaluated.
the material’s micro-structure or by other
effects.
In addition to the automatic evaluation,
the instrument also makes it possible to
evaluate the Vickers indentation manually.
The edges of the indentation are adjusted
by hand in an enlargement of the picture
on the display. The length of the diago-
nals is automatically updated, and the
corresponding hardness value is dis-
played.
The display of the Vickers diamond pre-
sents the additional possibility of directly
checking the condition of the indenter.
Any defects on the indenter, such as
edge breaks, are identified at once,
Fig. 14:
Graphic display of the measurement results as a curve.
Fig. 15:
Display of the measurements results in tabular form, including statistical data
such as e.g. range, standard deviation, and minimum or maximum.
11
Page 12

GE Inspection Technologies
therefore avoiding any incorrect measure-
ments from the very start.
The results of a test series can be graphi-
cally represented as a curve, or even in
tabular form, including statistical data
(see Figures 13 and 14). All the necessary
data such as average, single value, or
statistical data are displayed or updated
during the measurement.
The essential benefits of the Through-
Indenter-Viewing method are achieved by
the static application of the test load and
to the direct as well as automatic determi-
nation of the diagonal lengths of the in-
dentation made by the Vickers diamond:
a) The TIV enables mobile and on-site
measurement of hardness on different
materials without having to carry out any
additional adjustments and calibration
procedures (see Figure 15).
b) Due to the static test load application,
TIV also enables measurements on both
thin and small parts, such as coils, sheet
metal, etc.
c) The “live” picture of the indentation on
the display enables immediate analysis of
measurement quality.
d) The TIV is provided with an automatic
evaluation of the Vickers indentation, i.e.
the diagonal lengths are directly and
automatically determined.
e) The display of the diamond edges on
the screen enable condition checks to be
made on the indenter.
Steel
Brass Glass
Sheet steel
The TIV opens up a large variety of new
application fields which were previously
not accessible to mobile hardness testers.
Hardness tests are not only independent
of test positions and directions but now
also of the test object’s material and mass
or geometry.
4.2 Selection of the suitable probe
Two different handheld probes, having
test loads of 10 N / 1 kgf and 50 N / 5 kgf
respectively, are available for the optical
TIV hardness tester. Table 4 shows the
corresponding ranges of measurement for
the two probes. The measuring range of
the two TIV probes is essentially limited
by the optical system used. The size of
the CCD sensor only allows a certain
maximum size of indentation so that a
minimum value of the measuring range
is predefined by the optics in this case.
Fig.16:
Hardness testing on different
materials using the ThroughIndenter Viewing method.
In the case of larger hardness values,
i.e. with smaller test indentations, the
resolution of the CCD camera limits the
range of measurement. Although reliable
and reproducible measurements have
been carried out on ceramic materials
within the hardness range of 1500 HV
using the TIV105 probe; an upper limit
value of 1000 HV is nevertheless generally
specified because a clear effect of the
test object’s surface quality and of the
test load application on the measurement
result is to be expected at higher hardness
values.
Probe Test Load Hardness range Typical application
TIV 101 10 N / 1kgf approx. 30 – 500 HV Optical hardness testing on thin components
made of aluminum, copper, or brass.
Hardness testing on thin layers
TIV 105 50 N / 5 kgf approx. 100 – 1000 HV Hardened surfaces, mechanical parts, semi-finished products
Table 4:
Probes for TIV hardness testing, benefits, and typical applications.
12
Page 13

5. The Hardness Testers – an Overlook
5.1 The DynaPOCKET
Method: Rebound hardness testing
Typical application
• solid, coarse-grained test objects
• forgings having an inhomogeneous
surface structure
• cast materials
Accessories: e.g.
• test attachments for curved surfaces
• hardness reference blocks
Fig. 17:
The DynaPOCKET.
Ultrasonics
5.2 The DynaMIC
Method: Rebound hardness testing
Typical application
• mechanical parts or motor units made
of steel and aluminium cast alloys
• solid components with surface as rolled
• large serial products during production
Accessories: e.g.
• impact devices D, G, and E
• test attachments for curved surfaces
• hardness reference blocks
• software UltraHARD
5.3 The MIC 10
Method: UCI hardness testing
Typical application
• fine-grained material
• hardened materials
• thin layers
• hardness progress: on curve on
welds, etc.
Fig. 18:
The DynaMIC.
Accessories: e.g.
• supports
• guides (probe attachment)
• hardness reference plates
• software UltraHARD
Fig. 19:
The MIC 10.
13
Page 14

GE Inspection Technologies
5.4 The MIC 20
Method: UCI and rebound hardness testing
Typical application
• all UCI applications
• all rebound applications
Accessories: e.g.
• all UCI probes
• all rebound impact devices
• supports
• guides (probe attachment)
• hardness reference plates
• software UltraDAT
5.5 The TIV
Method: Optical hardness testing
Typical application
• hardness testing on different materials
without calibration
• hardness testing on thin components
(e.g. sheet metal, coils)
• hardened surfaces
Fig. 20:
The MIC20.
Accessories: e.g.
• supports
• guides (probe attachment)
• hardness reference plates
• software UltraDAT
Fig. 21:
The TIV.
6. The different Methods in the Field
6.1 Selecting the test method
The UCI method is recommended for
testing fine-grained material having almost
any shape and size. It is especially used
where material properties are to be deter-
mined within narrow tolerances, e.g. for
determination of the strain-hardening
process on drop forgings.
The TIV method is almost independent of
test material and geometry. It, therefore,
can be used everywhere, where conven-
tional portable hardness testing failed so
far: different materials without calibration,
thin lightweight parts, sheet metal and
coils, etc.
Rebound hardness testing is mainly carried
out on large, coarse-grained materials,
forgings, and all types of cast materials
because the spherical tungsten carbide
tip of the impact device produces a larger
indentation than the Vickers diamond
and therefore reveals the characteristics
of the cast structure better.
On the other hand, the relatively small
test indentations of UCI probes enable
hardness testing on welds, and especially
in the critical area of the heat-affected
zone, viz. HAZ.
A large number of UCI probes and re-
bound impact devices having different
test loads or indenter diameters enable
an application-oriented selection of a
suitable method and of a suitable probe /
impact device. The following applies to
the use of impact devices available for
DynaMIC and MIC 20: in addition to the
Dyna D, which is suitable for most fields
of application, the Dyna G – provided
14
Page 15

Ultrasonics
Application UCI hardness testing Rebound hardness testing
MIC 10, MIC 20 DynaPOCKET, DynaMIC, MIC 20 TIV
Solid parts + ++ ++
Coarse-grained materials – ++ o
Steel and aluminum cast alloys o ++ o
HAZ with welds ++ – ++
Tubes: wall thickness > 20 mm ++ ++ ++
Tubes: wall thickness < 20 mm ++ – ++
Sheet metal, coils o – ++
Inhomogeneous surfaces – + –
Thin layers ++ – +
Hard-to-get-at-positions ++ + –
++ especially well-suited / + well-suited / o sometimes suitable / - not recommended
Table 5:
Applications for UCI and rebound hardness testing.
with an impact energy which is nine times
higher and with a larger spherical tungsten
carbide tip as indenter - can be used,
especially on relatively inhomogeneous
surfaces, e.g. on cast materials or forgings.
Fig. 22:
Comparison of indentation areas for DynaD impact
device and UCI probes MIC 2010, MIC 205, MIC 201.
For hard materials (650 HV/56 HRC),
causing the spherical tungsten carbide
tip to wear faster, we recommend the
impact device Dyna E provided with a
diamond tip as indenter.
6.2 Significance of indentation size
In general, the larger the area of indenta-
tion the more consistent the test results.
The variations in microstructure of inho-
mogeneous materials or in coarse-grained
materials are averaged out so that consis-
tent hardness values can be achieved.
A larger indentation area also sets less
demands on the surface finish and
requires less surface preparation.
In comparison, the resulting indentation
areas yielded by the various impact devices
are much larger than those created by
any UCI or TIV probe. The rebound tester
is recommended when testing large cast-
ings and forgings. Testing small areas of
homogenous materials that are surface-
hardened requires the shallower indenta-
tions produced by UCI or TIV probes.
Tables 6 a + b are provided to compare
the indentation size of rebound impact
devices, UCI and TIV probes at three
levels of hardness.
Dyna G Dyna D HV 10 HV 5 HV 1 HV 0,3
5 mm 3 mm MIC 2010 MIC 205 MIC 201 MIC 2103
90 Nmm 12 Nmm TIV 105 TIV 101
64 HRC 350 152 107 48 25
55 HRC 898 449 175 124 56 28
30 HRC 1030 541 249 175 79 41
Table 6 a:
Approximate indentation area (in mm).
15
Page 16

GE Inspection Technologies
Dyna G Dyna D HV 10 HV 5 HV 1 HV 0,3
5 mm 3 mm MIC 2010 MIC 205 MIC 201 MIC 2103
90 Nmm 12 Nmm TIV 105 TIV 101
800 HV 16 22 16 7 4
600 HV 63 28 25 20 9 5
300 HV 83 35 35 25 11 6
Table 6 b:
Approximate indentation depth (in mm).
6.3 Relation between penetration
depth and minimum thickness for
coatings
For Vickers hardness testing, the thick-
ness or depth of hardened layer or coat-
ing, e.g. chromium on steel rolls, must
be substantial enough to support the
indentation. As a rule, the thickness
should be a minimum of ten times the
indentation depth.
Hardness (HV)
You can easily calculate the penetration
depth of the Vickers diamond if you know
the force of the probe and approximately
the hardness by using equation 3. This
formula is based on the geometry of
the Vickers diamond. Therefore, it only
applies to a Vickers hardness test.
Remember: 10 N ≈ 1 kgf.
d = 0,062 · F / HV
HV = Vickers hardness in HV
F = Test Load in N
d = Penetration depth in mm
Minimum thickness s = 10 · d
Equation 3:
Penetration depth of a Vickers diamond.
6.4 Hardness testing on welds (HAZ)
With the small test indentations made by
Microdur-UCI probes, it is possible for
example to determine the hardness of a
welded component, above all in the criti-
cal area of the weld, viz. the heat-affected
zone (HAZ). The result of the hardness
test gives information about the proper
welding of a material. For example, if
there is an excessive martensite content
in the heat-affected zone (HAZ), a very
hard zone will be formed there often
causing cracks.
Penetration (µm)
Fig. 23:
Penetration depth of the Vickers diamond vs. the hardness of material (for different test loads).
16
Naturally, only hardness testing methods
can be used which reliably cover the
critical area of the weld, viz. the HAZ,
with indentations which are not too large.
Only low test loads (HV5 or HV10) pro-
duce a Vickers indentation which is still
situated in the critical area of the HAZ.
HV30, HB, and test indentations from the
rebound hardness test, as well as measure-
ments using the Poldi hammer go beyond
this zone. Only an average value over the
Page 17

Ultrasonics
Dyna D & E Dyna G UCI-Probes TIV
No holder / support required > 5 kg > 15 kg > 0.3 kg no
Requires holder / support 2 bis 5 kg 5 bis 15 kg 0.1 bis 0.3 kg restrictions
Requires holder / support & coupling 0.05 bis 2 kg 0.5 bis 5 kg 0.01 bis 0.1 kg
paste
Table 7:
Mass requirements for test piece
whole weld area is determined in these
cases. This leads to lower hardness values
due to the fact that the adjacent areas are
also detected with lower hardness. Today,
Poldi hammers can still be encountered in
weld testing. It is evident that a low hard-
ness value results from this test indentation,
which, for the operator means, that further
heat treatment of the HAZ is no longer
necessary. Whether this is a wise decision,
must be left to the opinion of the reader.
Fig. 24:
Hardness testing in the heat-affected zone (HAZ).
6.5 Test piece mass requirements
Consideration must be given to the mass
of the test piece. Although the mass
criteria for Leeb’s method are higher than
those for the UCI method, the results of
both methods can be influenced by the
mass and thickness of the test piece.
contour of the back surface of the part.
The support reinforces the part to make it
rigid and stable. Extremely thin materials
may also require the use of a slight film of
grease or paste to couple the test object
to the support.
The UCI method is based on measuring
a frequency shift. Test objects weighing
less than about 0.3 kg can go into self-
oscillation causing erroneous or erratic
readings. The support plate and coupling
technique described above are also an
effective method to avoid oscillations with
small components. If the use of a support
plate is not feasible, select a probe with
a lower test load to reduce the effects of
self-oscillation.
Table 7 is provided as a guideline for
determining holder or support require-
ments. The effectiveness of the holder or
support is determined by how precisely it
matches the contour of the test piece.
There are – in principle – no limitations
regarding the test piece mass for the TIV,
as long as the probe can be positioned
properly and the load can be applied
without any movements of the test piece.
6.6 Wall thickness requirements
The wall thickness of tubes, pipelines,
or valves is critical for mobile hardness
testing, especially for the rebound method.
For example, a thin wall will start to oscillate
like the skin of a drum when it’s hit by the
impact body in a rebound test.
In addition to the mass (Section 6.5), it’s
mainly the wall thickness which also plays
an important part when choosing the test
methods. It can influence the hardness
value even when the test object is solid
and weighs a few tons.
Despite the small mass of the impact
device Dyna D and the low impact energy,
there is a large force of about 900 N
(90 kgf) produced at the time of impact
(compared to that, the maximum force of
a UCI probe is 98 N / 10 kgf). That is
sufficient to produce vibrations with a
wall thickness of under 20 mm. This can
Hardness testing method Wall thickness Wall thickness
in mm in inch
Rebound 20 mm 0.79
Leeb’s method creates a large force of
short duration during the impact. Thin
and lightweight materials yield causing
erroneous values. A solution for testing
small components having a simple geometry
is a machined support that matches the
UCI 2 – 3 mm 0.08 – 0.12
TIV 10 x penetration depth of diamond
Table 8:
Recommended minimum wall thickness. By coupling to a support plate, small test pieces can be made rigid
and stable to enable measurement of small wall thicknesses.
17
Page 18

GE Inspection Technologies
cause incorrect hardness values and large
amounts of scatter. In such cases, the
UCI method should be preferred to the
rebound method.
Figure 25 shows the hardness values
measured by a standard Vickers test with
a 10 kgf (98N) force in relation to those
measured by a Dyna D impact device.
For a wall thickness beyond 20 mm, both
tests show the same results. Below 20 mm,
the Vickers value measured using the
rebound test method is lower than the
true value resulting in a deviation from
the horizontal line.
6.7 Surface quality
All hardness testing methods require
smooth surfaces free of oxide scale, paint,
lubricants, oil, plastic coating due to
corrosion protection, or metal coating for
better conductivity. The indentation depth
should be large in comparison to the sur-
face roughness.
If surface preparation is necessary, care must
be taken not to alter the surface hardness
by overheating or strain-hardening.
More practical results can be achieved by
using a battery-driven, high-speed
(>12000 rpm) handheld grinder, e.g. the
1.6
1.4
1.2
1.0
MIC 1060. Use 180 grain to get a smooth
surface. It takes just 10 seconds.
6.8 Handling, alignment, and fixing
Move the MIC probe at a slow and steady
speed. The probe should be rectangular
with respect to the surface. Maximum
angular deviation from the straight axis
should be less than 5 degrees. Avoid
turning, don’t drill. There should be no
lateral forces on the diamond.
The rebound impact device must be
within one or two degrees of being
perpendicular to the surface.
Test attachments in the form of support
rings for the impact devices and probe
shoes for the UCI probe ensure proper
alignment.
The standard support rings provided with
each Dyna D and Dyna E are used to test
convex or concave radii greater than 30 mm.
The larger diameter of the Dyna G standard
support ring requires the radius to be greater
than 50 mm. Support rings for the Dyna D
and Dyna E impact devices are available to
cover the range of r = 10-30 mm for
testing the ID’s or OD’s of cylindrical and
spherical shaped parts (see Dyna 41 and
Dyna 42). Customized support rings are
available on request.
For standard length UCI probes, the
MIC 270 and MIC 271 probe shoes are
offered as accessories. The MIC-271
probe shoe is recommended for testing
cylindrical parts with radii from 3 to 75 mm.
The flat probe shoe is designed to test
flat surfaces but is also useful in testing
radii greater than 75 mm.
Position the TIV probe perpendicular to
the test piece. Probe attachements for flat
and curved surfaces are available. Apply
the load at a slow and steady speed. On
the screen the “growing” indentation can
be observed. The indentation is evaluated
automatically when the load is applied.
6.9 Calibration
The modulus of elasticity (or Young’s
Modulus) is a material property that can
influence instrument calibration. Proper
calibration is required to ensure the
accuracy of the test results.
To calibrate the DynaMIC or the MIC 20
for rebound hardness testing, the operator
must first select one of nine material
groups (refer to Table 9). Selecting the
appropriate material provides a rough
calibration, and the type of impact device
connected to the instrument determines
the available conversions. A more precise
calibration is possible for a specific material
if samples of known hardness are used to
calibrate the instrument. To perform the
calibration, several readings are taken on
the sample and the displayed average
value is adjusted to the actual hardness.
This enables to achieve precise calibration
and a calibration offset value for that
specific material that can be used to
recalibrate the instrument.
0.8
0.5
020406080
Wall thickness (mm)
Fig. 25:
Standard Vickers values (HV10) compared with rebound Vickers values (HVR)
for different wall thicknesses of tubes.
18
UCI probes compatible with the MIC10
and MIC20 series are calibrated on steel
reference blocks having a modulus of
elasticity or Young’s modulus of 210,000
MPa. Because unalloyed or low-alloy
steels have a similar Young’s modulus,
accurate results are obtained with the
standard calibration. In many cases, the
Page 19

difference in Young’s modulus of medium-
alloy and high-alloy steels is so insignifi-
cant that the error created falls within the
allowable tolerances of the part.
However, the Young’s modulus for non-
ferrous materials require special calibra-
tions. Several readings are taken on a test
piece sample of known hardness to per-
form the calibration. The displayed aver-
age value is then adjusted to the actual
hardness. This calibrates the instrument
and also establishes a calibration offset
value for that specific material that can
be used to recalibrate the instrument.
Calibration offset values are referenced
from a factory-set value for steel. Please
note that they can be either a positive or
negative value. Table 10 contains a list of
approximate calibration values that can be
referenced for some common materials.
Ultrasonics
Sand- rough
blasted
Fig. 26:
Range of measured hardness values versus surface preparation. HVR indicates converted Vickers hardness
values measured by rebound hardness testing.
grain size
Because of the principle of the TIV based
on the Vickers test, there is no calibration
necessary when measuring on different
materials. For details see chapter 4.
Material Group HV HB HRB HRC HS N/mm
1 Steel - unalloyed, D, E, G D, E, G D, E, G D, E, G D, E, G
low-alloy or cast
2Tool steel D, E D, E
3 Stainless steel D D D D
4 Gray cast iron D, G
5 Nodular graphite iron D, G
6 Cast aluminum D D
7Brass D D
2
8 Bronze D
9 Copper D
Table 9:
Material groups and available conversions.
19
Page 20

GE Inspection Technologies
6.10 Verifying instrument
performance
The performance of a hardness tester is
periodically verified using standardized
reference blocks.
The perfect functioning of the rebound
hardness testers (DynaPOCKET, DynaMIC,
and MIC 20) is based on 5 single mea-
surements on a certified Leeb’s hardness
reference block. The average of these
5 measurements should be within ± 5 HL
of the reference block’s certified value.
The MICD62 hardness reference block
has a nominal value of about 765 HL.
If these values are converted into a HRC
value, the result is a hardness value of
55 HRC with a tolerance of ±0.5 HRC.
The accuracy of the UCI and TIV hard-
ness testers (MIC 10, MIC 20 and TIV) is
based on measurements using Vickers
hardness reference blocks. The average of
5 readings should be within ± 3.6% of
Material Calibration Offset Value
Aluminium – 8800
Chromium + 0250
Copper – 5800
Cast iron – 4800
Titanium – 6500
300-series stainless steel – 1500
400-series stainless steel – 0900
Table 10:
Approximate UCI calibration offset values.
the certified value of the reference block
when using a rigid/stable support or
holder such as the MIC222 test support.
When testing freehand, a minimum of
10 readings should be averaged with the
tolerance being ± 5%. The above toler-
ances for the dfferent test principles are
summarized in table 11.
Principle Measuring tolerances
Rebound ± 5 HL deviation of average from the value of the hardness
reference block with 3 to 5 readings.
UCI ± 3,6 % deviation of average from the value of the hardness
reference block with 3 to 5 readings using the test support
MIC 222-A.
Larger deviations are possible with freehand measurements.
TIV ± 3,6 % deviation of average from the value of the hardness
reference block with 3 to 5 readings.
Table 11:
Measuring tolerances for the different test methods.
7. Summary and help with the choice
of the suitable test method
The Krautkramer product range of portable
hardness testers includes the instrument
families DynaPOCKET, DynaMIC, MIC 10,
MIC 20, and TIV. Three different physical
methods of measurement are used in
these instruments – the UCI, the rebound,
and the optical TIV method. It is neces-
sary to choose the suitable equipment for
the present application in each case, i.e.
the test method and the corresponding
instrument.
The following chapter gives you a brief
survey of the different test methods and
of the typical applications, at the same
time helping you with the choice of the
correct equipment for your hardness
test task.
20
Page 21

Ultrasonics
7.1 The UCI method (MIC 20 /
MIC 10)
With the UCI method, the size of the
hardness test indentation is not measured
optically but the indentation area is de-
tected electronically by determining the
shift of ultrasonic frequency under load.
With ”soft” materials, the Vickers dia-
mond penetrates deeper into the material
leaving a relatively large indentation area
in the material, which leads to a high
frequency shift.
This is the secret of UCI hardness testing:
the frequency shift is proportional to the
size of the indentation produced by the
Vickers diamond in the material.
UCI instruments can be easily calibrated
to different test materials.
Typical applications:
Heat-treated or case-hardened mechani-
cal parts (e.g. camshafts), weld testing
(HAZ), finished precision parts, gears,
raceways of ball bearings, tooth flanks,
turbine blades, thin layers, e.g. copper or
chromium on steel cylinders, rotogravure
cylinders, coatings.
Instruments:
MIC 10, MIC 10 DL, MIC 20,
MIC 20 TFT
7.2 Rebound method (MIC 20 /
DynaMIC / DynaPOCKET)
With the rebound method, an impact
body is accelerated at a defined speed
against the surface of the test object. Due
to the plastic deformation of the surface
produced at the moment of impact, the
impact body loses some of its original
energy or velocity.
With a soft material, the test indentation
produced by the impact body is relatively
large, i.e. the impact body loses most of
its original energy and rebounds at a corres-
pondingly lower velocity. The velocities
before and after the impact are measured
in non-contact mode. A permanent magnet
in the impact body generates an induction
voltage when passing through the coil,
with this voltage being proportional to the
velocity. The rebound velocity, on the
other hand, is a measure for the hardness
of test material.
Only Krautkramer instruments can be used
in any direction without any additional
adjustments (patented non-directional
function).
Nine different material groups are already
stored in hardness testers using the rebound
method. In addition to this, the DynaMIC
and the MIC 20 can be easily calibrated to
other test materials.
Impact devices:
• Dyna D dia. 3 mm
tungsten carbide ball
• Dyna G dia. 5 mm
tungsten carbide ball
• Dyna E
diamond test tip
7.3 Optical method –
Through-Indenter-Viewing (TIV)
With the TIV method (Through-Indenter-
Viewing), the indentation size of the Vickers
diamond, i.e. the diagonal lengths, is
automatically measured under load by
viewing through the diamond by means
of an optical system using a CCD camera.
The TIV measurement of diagonal length
immediately results in a Vickers hardness
value for the test load applied.
The ”live” picture of the indentation on
the instrument’s LCD also allows an im-
mediate opinion about the reliability of
the measurement, i.e. a verification of the
quality of the displayed indentation pro-
duced by the Vickers diamond.
By viewing through the indenter, the TIV
method enables hardness tests on all
materials without any additional calibra-
tion. Even tests on thin materials, e.g.
coils and thin metal sheets, are no longer
a problem for this portable instrument.
Probes:
Handheld probes
• 10 N / 1 kgf (MIC 201-A,
MIC 201-AL)
• 50 N / 5 kgf (MIC 205-A,
MIC 205-AL)
• 98 N / 10 kgf (MIC 2010-A)
Motor probes
• 8.6 N / 0.9 kgf (MIC 211-A)
•3 N / 0.3 kgf (MIC 2103-A)
•1 N / 0.1 kgf (MIC 2101-A)
Typical applications:
Large, coarse-grained components with
surface as rolled, motor units, or mechani-
cal parts made of cast steel and cast
aluminum alloys, forgings having an inho-
mogeneous surface structure, material
differentiation in material stores and
wrought copper alloys.
Instruments:
DynaPOCKET, DynMIC, DynaMIC DL,
MIC 20, MIC 20 TFT
Typical applications:
Hardening shops and heat-treatment
companies (different materials without
calibration), aviation industry (thin-walled
components, different alloys) sheet metal
(coils),…
Instruments:
TIV
Probes:
TIV 101 (10 N / 1 kgf)
TIV 105 (50 N / 5 kgf)
21
Page 22

GE Inspection Technologies
7.4 Fundamental questions to the user
1. What do you want to measure?
DynaPOCKET DynaMIC MIC 10 MIC 20 TIV
Coatings No No Yes Yes Yes
Hardened surfaces No No Yes Yes Yes
Weld (HAZ) No No Yes Yes Yes
Diffrent materials Yes* Yes* Yes* Yes* Yes
(*with calibration)
Castings/forgings Yes Yes Partly Yes Partly
Tubes Partly Partly Yes Yes Partly
Sheet metal, coils No No Partly Partly Yes
2. What is the material
DynaPOCKET DynaMIC MIC 10 MIC 20 TIV
Steel (alloy, stainless,...) Yes Yes Yes Yes Yes
Other metals (Al, Cu,...) Yes Yes Yes Yes Yes
Cast steel Yes Yes Partly Yes Partly
Cast Aluminum Partly Yes Partly Yes Partly
Ceramics No No Partly Partly Yes
Glass No No No No Yes
Plastics Partly Partly Partly Partly Yes
3. Are there any other requirements?
DynaPOCKET DynaMIC MIC 10 MIC 20 TIV
Data memory/ No Only DL Only DL Yes Yes
PC interfacing
Statistical evaluation No Yes Yes Yes Yes
Scale conversions Yes Yes Yes Yes Yes
Non-directional Yes Yes Yes* Yes* Yes
(*except motor probe)
Wall thickness <20 mm Partly* Partly* Partly Partly Yes
(*with coupling)
Mass <2 kg Partly* Partly* Partly Partly Yes
(*with coupling)
Depending on the test task, either the
UCI method, the rebound method, or
the optical TIV method is used for the
hardness test.
22
A suitable method cannot always be clear-
ly defined right away. An experienced
engineer is therefore the best person to
give the right answer about the test object
itself directly on site.
Page 23

Ultrasonics
23
Page 24

www.geinspectiontechnologies.com © 2005 General Electric Company. All Rights Reserved. We reserve the right to technical modifications without prior notice. GEIT-21001-sd299EN (01/06)
 Loading...