

Page 1

TM
AnaWin
User’s Guide
Watlow Controls
1241 Bundy Blvd.
Winona, MN 55987
Customer Service
Phone: (800) 414-4299
Fax: (800) 445-8992
Technical Support
Phone: (507) 494-5656
Fax: (507) 452-4507
Email: wintechsupport@watlow.com
Part No. 22852-00. Revision 2.1
June 1997
Page 2

Copyright © 1997
Watlow Anafaze
Information in this manual is sub ject to ch ange wi t hou t noti ce. No part of thi s publ i cation may be reproduced, stored
in a retrieval system, or transmitted in any form without written permissio n from Watlow Anafaze.
License Agreement and Disclaimer of Warranty:
Read before opening diskette package. By breaking the seal on the disk package, you accept the terms of this license
agreement. This software is provided as is and without warranties as to performance. This program is provided without any expressed or implied warranties whatsoever. Because of the diversities of conditions and hardware under
which this program may be used, no warranty of fitness for any particular use is offered. The user is advised to test
the program thoroughly before relying on it. The user must assume the entire risk of using the program. In no event
will W atlow Electric Manufacturing Company or Anafaze, Inc. be held liable for incidental or consequential damages
arising out of use of this program.
Warning
This computer program is protected by copyright law and international treaties. Unauthorized reproduction or distri-
bution of this program, or any portion of it, may result in severe civil and criminal penalties, and will be prosecuted to
the maximum extent possible under the law.
Page 3

CONTENTS
Overview
Using this Guide .................................................................... 1
Online Help............................................................................ 2
Watlow Anafaze Technical Support...................................... 2
1 Installation and Setup
System Requirements ...........................................................1-1
Hardware Requirements .................................................1-1
Software Requirements ...................................................1-1
Parts List .........................................................................1-2
System Block Diagram .........................................................1-2
Safety ....................................................................................1-2
Installation ............................................................................1-3
System Setup .........................................................................1-3
Setting the Controller to ModBus Protocol ....................1-4
Configuring your Controllers ..........................................1-4
Channel Grouping ...........................................................1-6
Other Configuration Options ..........................................1-7
Monitoring the Configured Controllers ................................1-10
2 AnaWin Screen Displays
Screen Conventions ..............................................................2-1
Main Menu ............................................................................2-3
3 Exporting Data
Export Database ....................................................................3-1
Data Log Setup .....................................................................3-4
4 Setting System Parameters
Login .....................................................................................4-2
Logout ...................................................................................4-2
Preferences ............................................................................4-2
Normal Startup.................................................................4-3
i
Page 4

Power Fail Recovery .......................................................4-3
Miscellaneous System Parameters ..................................4-4
Setup Passwords .............................................................4-5
Default Recipe Comment ................................................4-8
Disable Recipe Download ..............................................4-9
Gauge Display Editable Parameters ...............................4-9
Communications ...................................................................4-9
Com Diags ............................................................................4-10
Configure ..............................................................................4-10
5 Setting Channel Parameters
Channel Parameters ..............................................................5-1
Channel Summary ..........................................................5-2
Real-time Trend Plot .......................................................5-3
Channel Setup Tabs ........................................................5-4
Ramp Soak Setup ..................................................................5-7
Assigning Profiles to Loops ............................................5-8
Using Special Ramp-Soak Functions .............................5-9
Editing Profiles ...............................................................5-12
6 Managing Recipes
New .......................................................................................6-2
Open ......................................................................................6-3
Save .......................................................................................6-3
Save As .................................................................................6-3
Remove .................................................................................6-4
Download ..............................................................................6-4
Calendar ................................................................................6-4
Recipe Start .....................................................................6-5
Monthly Calendar ...........................................................6-6
Scheduled Recipes ..........................................................6-6
Suspend Calendar Events ................................................6-6
7 Using the Trend Plot Screen
Trend Plot .............................................................................7-1
Trend Plot Screen Features .............................................7-2
Toolbar ............................................................................7-8
Trend Plot Settings ................................................................7-20
Data Sets .........................................................................7-20
Graphing Limits ..............................................................7-21
ii
Page 5

Time Range .....................................................................7-21
Trend Plot Storage ................................................................7-21
Disk Space Analysis .......................................................7-22
Recording Rate ...............................................................7-22
Maximum Days Stored on Disk.......................................7-22
8 Viewing Channels
Spreadsheet ...........................................................................8-1
Bar Graph Display ................................................................8-2
Gauge Display .................................................................8-2
Digital I/O .............................................................................8-4
Inputs ..............................................................................8-4
Outputs ............................................................................8-4
Overview Thumbnails ...........................................................8-5
Custom Overview Screens ....................................................8-6
9 Working with Log Files
View (Logs) ..........................................................................9-1
Log File ...........................................................................9-2
Time of Event .................................................................9-2
Event Numbers ...............................................................9-2
Event Description ...........................................................9-3
Search ..............................................................................9-4
Print .......................................................................................9-4
Copy to A: .............................................................................9-4
Remove (Logs) .....................................................................9-4
Closing a Log ........................................................................9-4
10 Using the Developer
Using the Developer Program ...............................................10-1
Design Custom Overview ...............................................10-3
User Variables .................................................................10-20
11 Working with System Alarms
Interpreting the Alarm Screen ...............................................11-1
Date/Time .......................................................................11-2
Group Name ....................................................................11-2
Channel Name .................................................................11-2
Alarm Message ...............................................................11-2
iii
Page 6

Alarm Type .....................................................................11-2
Alarm Symbol .................................................................11-3
Clear View ......................................................................11-3
Print (Alarms) .................................................................11-3
Acknowledging Alarms ........................................................11-4
A Using AnaMator
AnaMator Overview .............................................................A-1
B User Variable Operators and Functions
Available Operators ..............................................................B-1
Available Functions ..............................................................B-2
C AnaWin OLE Server
AnaWin OLE Server Features ..............................................C-1
OLE Server Exposed Methods .............................................C-1
Getting Data ....................................................................C-2
Setting Data .....................................................................C-2
Getting Parameter Names ...............................................C-3
Getting Recipe Names ....................................................C-3
Downloading Recipes .....................................................C-3
Getting Download Status ................................................C-3
Registering as a Client ....................................................C-4
OLE Server Constant Values ................................................C-5
CLS/MLS Channel Parameters .............................................C-6
CLS/MLS Global Parameters ...............................................C-8
Glossary
Index
iv
Page 7

Overview
Using this Guide
This guide describes how to install, set up, and operate AnaWin.
AnaWin32 is Windows
monitor one or more controllers from a single PC. AnaWin allows you
to log data to disk, graph data, schedule automatic recipe changes,
manage alarms, manage recipes, configure control parameters, create
custom overview screens, and use the advanced control features of your
Watlow Anafaze controller through a graphical user interface.
This guide is intended for both experienced and inexperienced users. If
you are an experienced user , you ma y want to skim par ts of this guide. If
you are an inexperienced user, you should read the entire guide
carefully. We assume that AnaWin users have a basic knowledge of
Windows95.
The information in this guide is organized into the following chapters.
•
Chapter 1, Installation and Setup: Describes how to install
AnaWin and how to use the Configuration program to connect to
one or more controllers, create loop/channel groups, and customize
channel, parameter, and I/O names.
•
Chapter 2, AnaWin Screen Displays: Describes basic screen con-
ventions and how to navigate the main menu.
•
Chapter 3, Exporting Data: Describes how to export data from
AnaWin to other applications, including how to specify when data is
logged and which channels are included in the log file.
®
95 software that allows you to program and
AnaWin User’s Guide 1
Page 8

Overview
•
Chapter 4, Setting System Parameters: Describes how to use the
system menu, to set preferences and configure AnaWin to operate
with your controller.
•
Chapter 5, Setting Channel Parameters: Describes how to use t he
Channel Setup screen to configure a controller.
•
Chapter 6, Managing Recipes: Describes the Recipe menu, and
how to create, store and use recipes through AnaWin.
•
Chapter 7, Using the Trend Plot Screen: Des c ribes AnaWin’s
trend plotting features.
•
Chapter 8, Viewing Channels: Describes different ways of viewing
system data in AnaWin.
•
Chapter 9, Working with Log Files: Describes event logs and how
to view them.
•
Chapter 10, Using the Developer: Describes how to design and use
custom overview screens and how to define user
variables.
•
Chapter 11, Working with System Alarms: Describes the AnaWin
Alarm screen and how to acknowledge alarms.
•
Appendix A, Using AnaMator: Describes how to use the AnaMator
application to create animations w hich y ou can add t o you r AnaWin
custom overview screens.
•
Appendix B, User Variable Operators and Functions: Lists the
operators and functions that may be used in the user variables
spreadsheet.
•
Appendix C, AnaWin OLE Server: Describes OLE (Object Link-
ing and Embedding), which is used in the interchange of data with
other Windows95 applications.
Online Help
Watlow Anafaze Technical Support
2 AnaWin User’s Guide
AnaWin provides a comprehensive Help system which you can access
from the Help menu, or by pressing F1. Pressing F1 provides contextsensitive help related to the part of the software that is displayed at the
time.
We have made every effort to ensure that you will be able to install, set
up and maintain AnaWin using the information in this guide and in the
online help. Should you need further assistance, call Watlow technical
support.
Page 9

Installation and
Setup
This chapter describes how to install AnaWin on your computer and
how to use the Configuration program to set up AnaWin to
communicate with your controller(s).
System Requirements
The following components are required to operate AnaWin.
Hardware Requirements
Pentium 100MHz or greater with a minimum of 16MB of RAM
•
(Pentium 133 with 32 MB recommended for animation)
Hard drive with 20MB of free space (500 MB is recommended for
•
logging and trending)
3.5 inch HD floppy drive
•
SVGA display (high-color recommended)
•
Communications port capable of 19.2 Kbaud (with 16550 UART)
•
1
Software Requirements
Microsoft®-compatible sound card (recommended for voice-annun-
•
ciated and customized alarm sounds, but not required)
Microsoft-compatible pointing device (mouse or trackball)
•
Windows95 or WindowsNT 4.0
•
AnaWin User’s Guide 1-1
Page 10
Installation and Setup
Parts List
The following parts are included with AnaWin:
•
AnaWin on 3.5 inch disket te s .
•
AnaWin User’s Guide
System Block Diagram
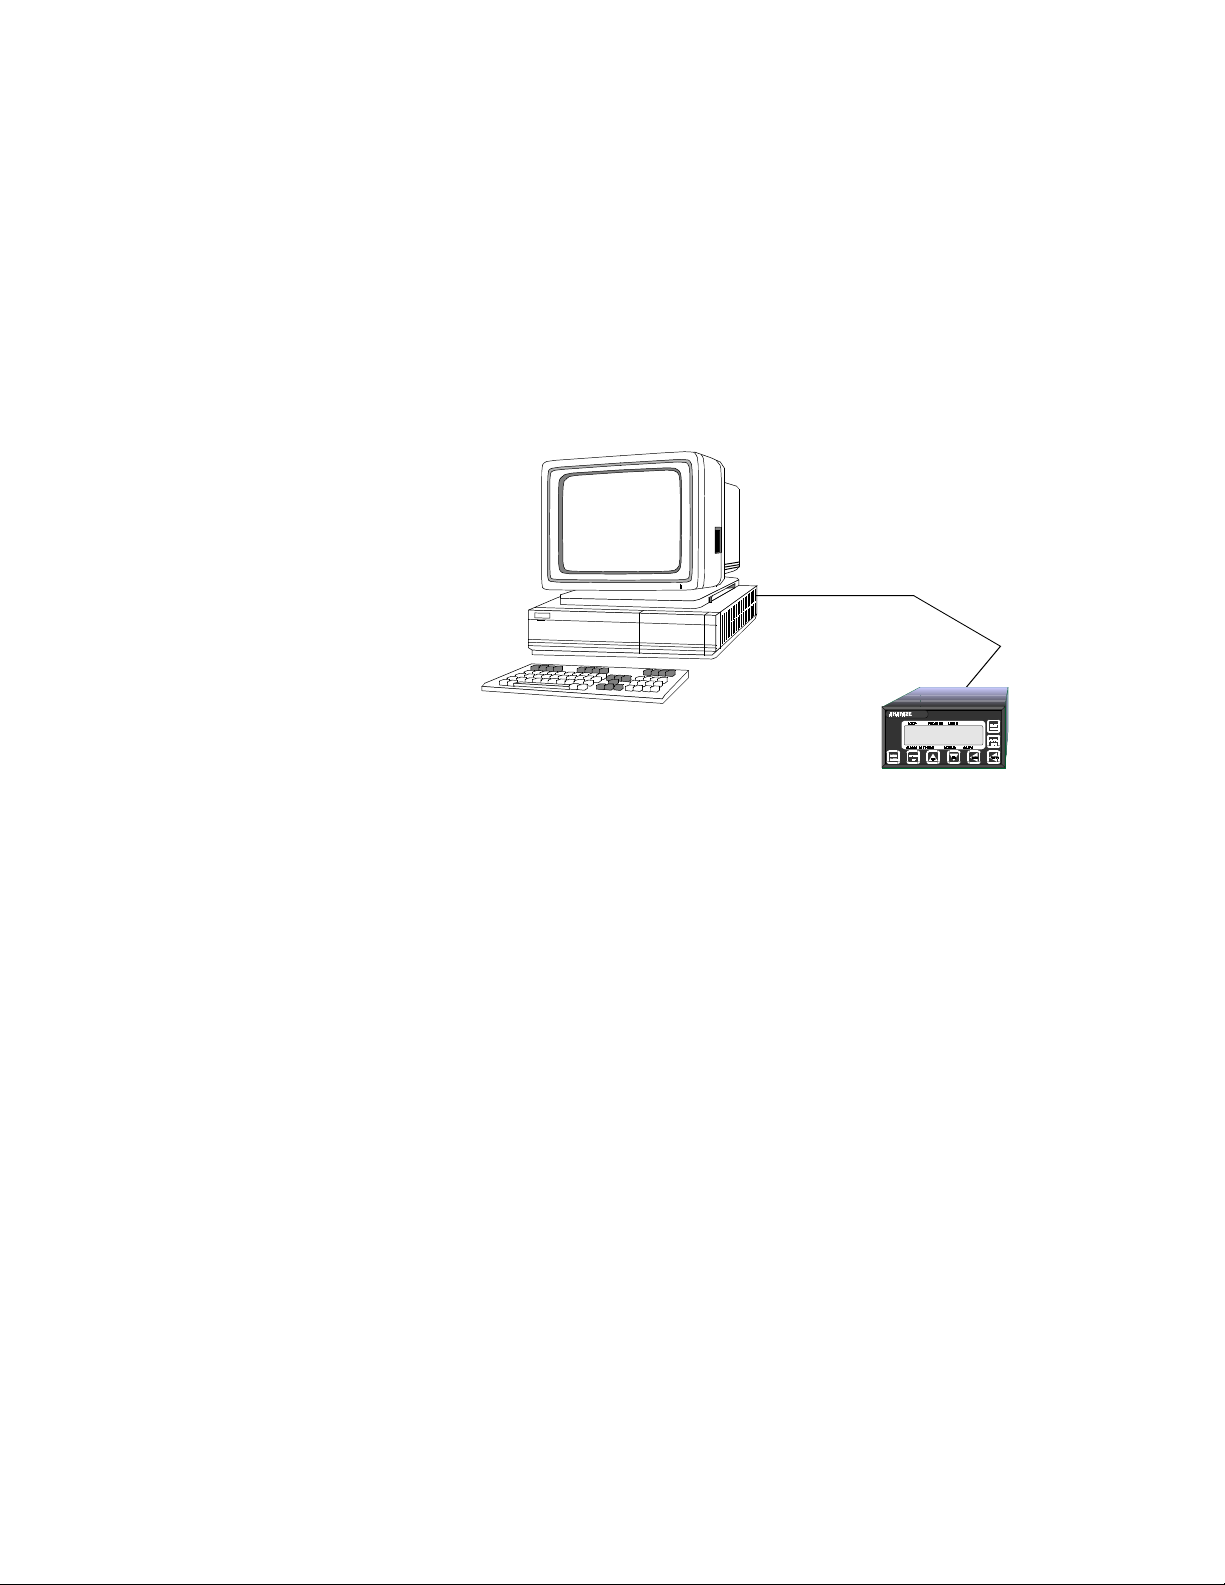
Figure 1-1 shows how a PC (using AnaWin) interfaces with one, or
more, controllers.
FIGURE 1-1
Communications
Cable (to any serial port)
one or more controllers
System Block Diagram
Communication to a single controller can be made using an RS-232
connection to one of the PC’s serial ports.
The serial communication link required to communicate with more than
one Watlow Anafaze controller or with a communication cable longer
than 50 feet is RS-485. We recommend using the standard serial
interface of RS-232 with an external RS-485 converter.
We recommend using a B&B Electronics RS-232/RS-485 optically
isolated converter P/N 485OIC. This converter has screw terminals for
connecting the RS-485 wires and a DB-25 Male connector for the RS232 side. You can reach B&B Electronics at (815) 434-0846.
Safety
1-2 AnaWin User’s Guide
Contact the factory for other available converters.
While Watlow Anafaze has made every effort to ensure the reliability
and safety of its controllers and AnaWin, AnaWin—like any other
application—can fail, and other unexpected conditions can occur.
Page 11

Installation
Installation and Setup
Good engineering practices, electrical codes, and insurance regulations
require you to use independent external safety devices to prevent
potentially dangerous or unsafe conditions. Use of AnaWin does not
eliminate the need for appropriate external, independent safety devices.
For additional process safety, use AnaWin to automatically reload your
desired operating parameters after a power failure.
Please contact Watlow Anafaze immediately if you have questions
about system safety.
To install AnaWin, follow these steps:
1. Click on the Windows95 Task Bar with the right mouse button,
then choose Properties, then Autohide.
2. Insert the disk labeled AnaWin Disk 1 in the floppy drive.
3. Click on Start and Run at the bottom of the screen.
4. Type a:\setup or b:\setup.
5. The Setup program prompts you through the installation process.
Follow the instructions on the screen.
The first time you run AnaWin, you are prompted to enter your
serial number. You must enter the serial number printed on
AnaWin disk 1. You will also need this serial number any time you
request technical support.
System Setup
AnaWin loads the Configuration program and displays the controller
setup screen. Ref er to “Syst em Setup,” below, for instructions on using
the controller setup screen.
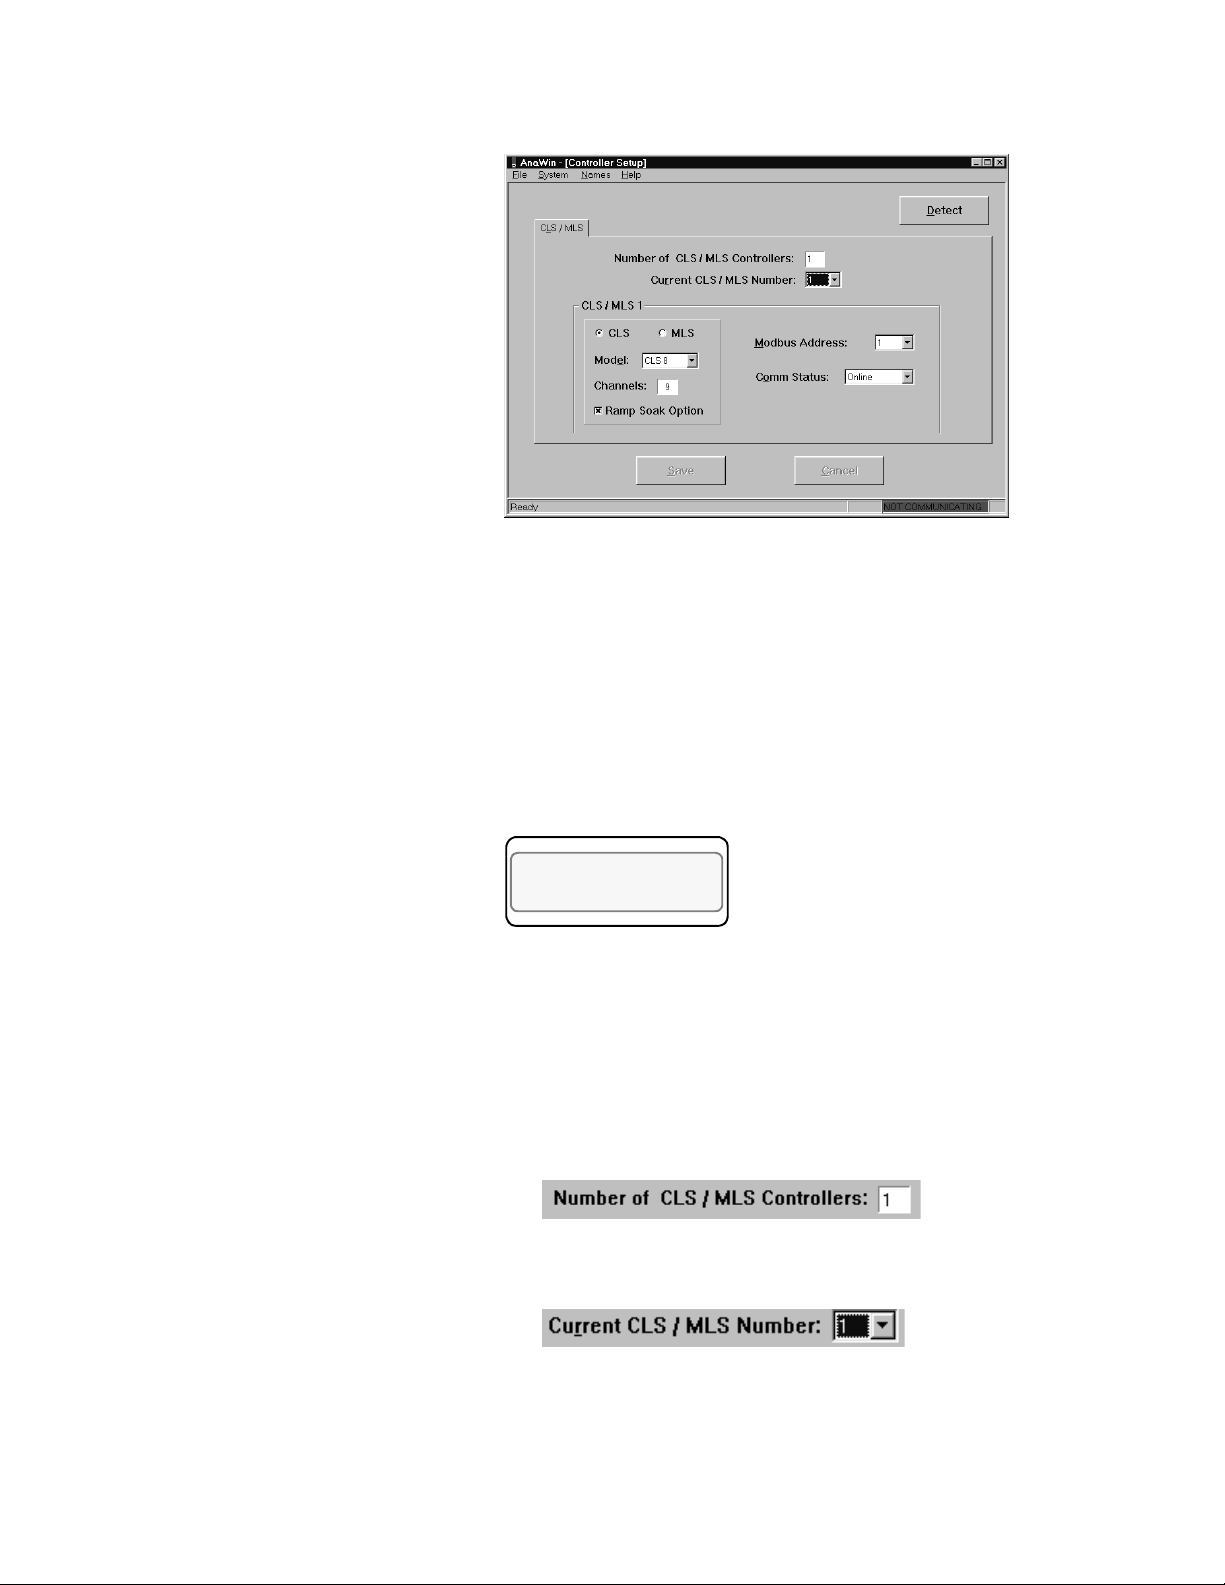
The controller setup screen, shown in Figure 1-2, allows you to set the
software parameters to match t he controller(s). When you first install
AnaWin, this screen appears automatically after a successful install. If
AnaWin has been previously installed, you can access the controller
setup screen by selecting Configure from the System menu.
AnaWin User’s Guide 1-3
Page 12
Installation and Setup
FIGURE 1-2
Controller Setup Screen
Setting the Controller to ModBus Protocol
Before configuring the software, set your controller(s) to ModBus
Protocol. Do this using the controller keypad and display shown in
Figure 1-3. Select the Global Parameters menu and set the
Communication Protocol screen to MOD, as show in the figure. Set a
unique address in each controller. Refer to your controller manual for
more detailed instructions.
LOOP PROCESS UNITS
COMMUNICATIONS
PROTOCOL? MOD
ALARM SETPOINT STATUS OUT%
FIGURE 1-3
Setting a Controller to ModBus Protocol
Configuring your Controllers
To configure AnaWin to communicate with your controller(s), follow
these steps:
1. On the Controller Setup screen set the total number of controllers,
with which Anawin must communicate.
1-4 AnaWin User’s Guide
2. Set the series number of the first controller you wish to
configure.
Page 13
Installation and Setup
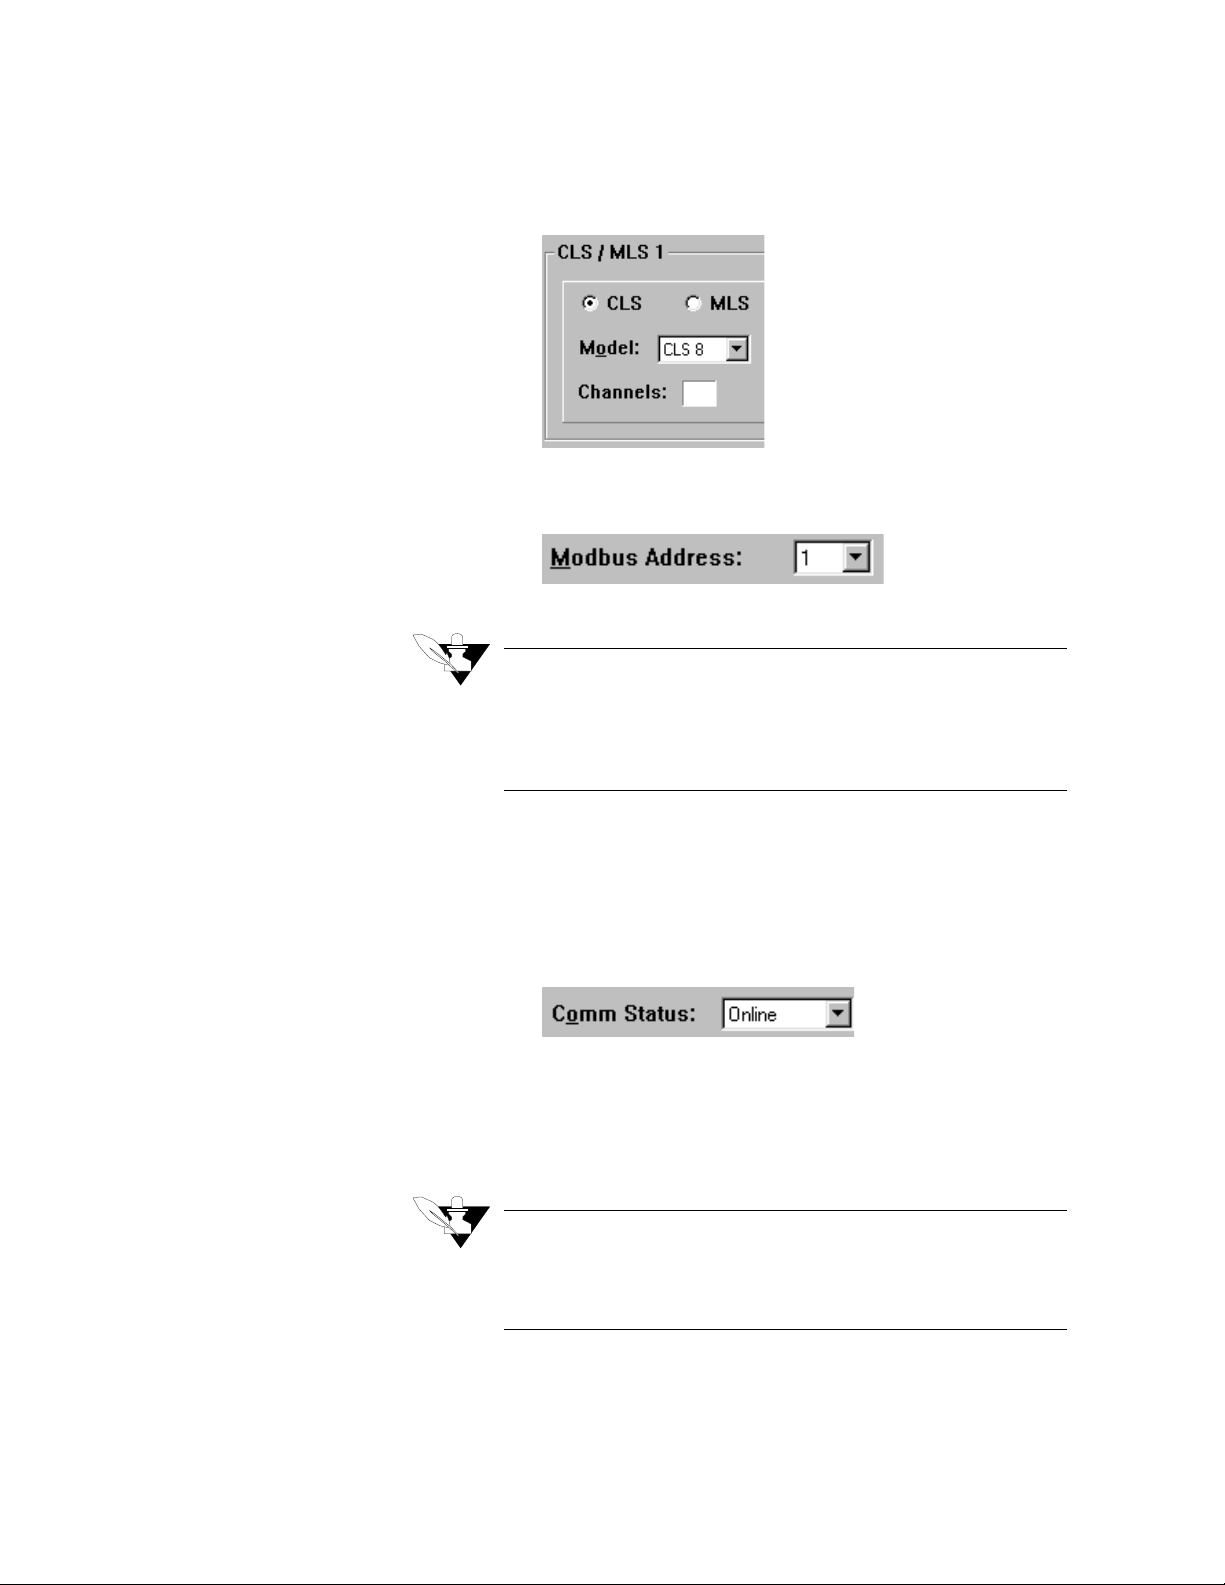
3. Choose the controller type and model. AnaWin automatically sets
the number of channels based on this data.
9
4. Set the ModBus address for the controller. Note that each controller
must have a unique ModBus address.
NOTE
You can use the Detect button to automatically set up each ModBus
address, but this operation takes considerable time to complete.
Refer to “Other Configuration Options” later in this chapter for
details about the Detect button.
5. If the controller is equipped for ramp/soak, select the Ramp Soak
Option check box.
6. Ensure the Comm Status of the controller has been set to Online.
Set a controller Off-line to speed up communications when you
remove the controller from the system or at other times when it cannot communicate.
7. If necessary, repeat steps 2-5 to configure other controllers.
8. If desired, set up channel grouping or other configuration options,
as described in the following subsections.
9. Click Save to save the configuration.
NOTE
When changing the number of controllers or controller type,
AnaWin will automatically restart itself when the information is
saved.
AnaWin User’s Guide 1-5
Page 14

Installation and Setup
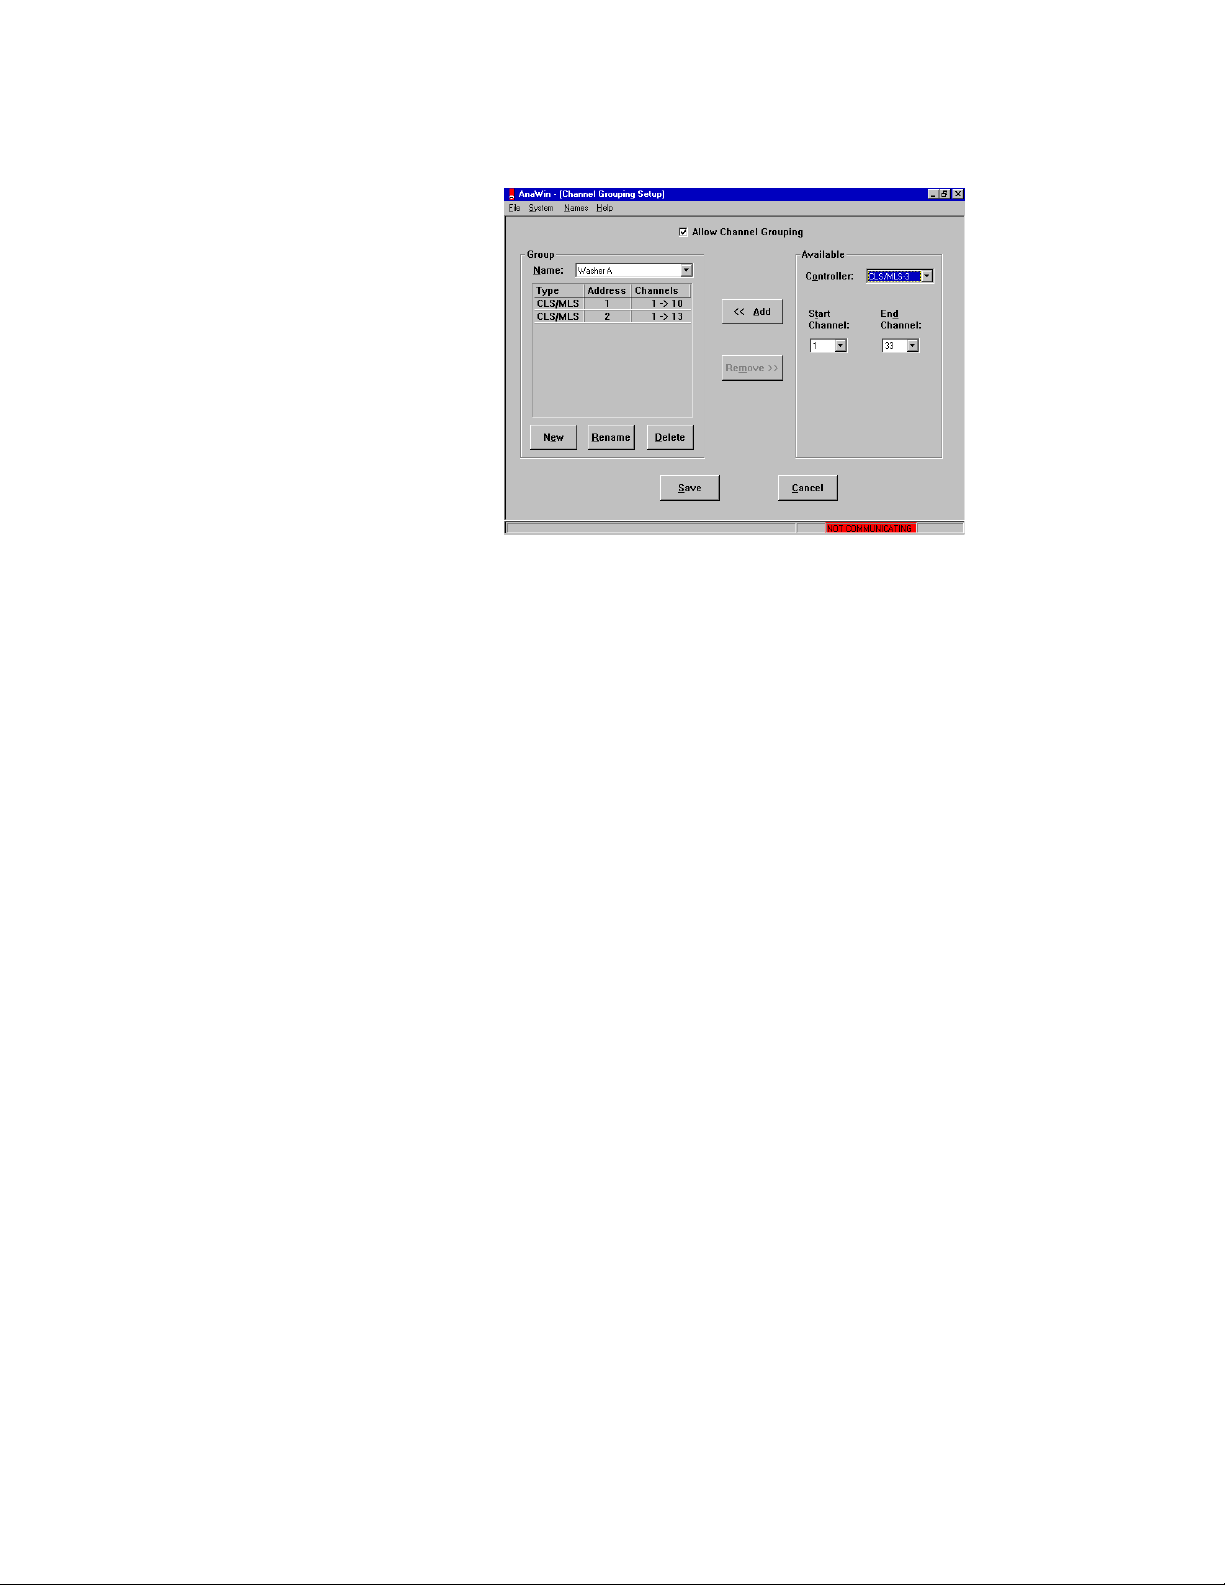
Channel Grouping
Select Channel Grouping from the System menu to display the Channel
Grouping setup screen, shown in Figure 1-4. This screen allows you to
set up channel groups. Select Allow Channel Grouping in order to allow
channel grouping.
When channels are grouped, the spreadsheet v iew show s only o ne gr oup
of channels at a time. Recipes and recipe management are also groupspecific—each group has its own set of recipes.
NOTE
Setting up channel groups deletes pre-existing recipes and logged
data. Group channels only if you want separate recipe control for
certain channels.
By default, AnaWin creates one group with all the controllers’ loops. To
separate channels into defined groups, follow these steps:
1. Select Allow Channel Grouping.
2. Select the Default group in the Group Name field.
3. Click Delete to delete the Default group.
4. Click New and enter a Name for the new group.
5. Select a Controller in the Available panel.
6. Use the Start channel and End Channel fields to define a sequence
of channels to be included in the group.
7. Click Add to add the specified channels for the selected controller to
the group. The channels you add are listed in the group panel.
8. Repeat steps 4-7 to create additional groups until you have put all
the channels into a group. Any channels that you do not put in a
group will not be available in AnaWin.
1-6 AnaWin User’s Guide
NOTE
A group must consist of contiguous sets of loops from within any
one controller, though it may contain sets of contiguous sets of
loops from several controllers
Allow Channel Grouping
You must select the Allow Channel Grouping option in order to be able
to group channels. With channel grouping, you can establish related
blocks of channels for display and editing purposes. These groups can
cross more than one controller, but must be in sequence. For instance,
one group might include channels 1 to 10, and another, channels 11 to
16 etc. But you would not be able to have a group that included channels
2, 5, 6, 7, and 9, because they are not all in sequence.
Page 15
Installation and Setup
FIGURE 1-4
Channel Grouping Setup Screen
Group Parameters
•
Name: Displays the name of the group currently selected in the list.
•
New: Lets you create a new group to add to the list.
•
Rename: Lets you rename a group.
•
Delete: Lets you delete a group.
Add and Remove Buttons
These buttons allow you to add channels to and remove channels from a
group.
Add: Lets you add the sequence of channels defined by the Start
Channel and End Channel fields to the current group.
Remove: Lets you remove the channels selected in the list in the Group
panel from the current group.
Available Controllers and Channels
The Available panel allows you to select a controller and block of
channels for grouping. The Start Channel and End Channel fields
define the sequence of channels to add to the group. Click Add to add
these channels to the group. When you add a sequence of channels, the
channel names are listed in the Group panel.
Other Configuration Options
You can perform the following optional configuration options.
•
Automatically set up each ModBus address.
•
Configure communications options.
•
Customize displayed parameter, channel, and/or digital I/O names.
AnaWin User’s Guide 1-7
Page 16
Installation and Setup
The following subsections describe these options.
Automatic ModBus Address Setup
Click Detect to direct AnaWin to automatically attempt to communicate
to each ModBus address. AnaWin checks each address and sets up any
controllers it finds.
Configuring Communications Options
Use the Communications option on the System menu to select the port to
which you have connected your controller(s) and the baud rate for
which you have configured your controller(s).
•
From the System menu, select Communications, then Port to select
the port to which you have connected the controller(s).
•
From the System menu, select Communications, then Baud Rate to
select the baud rate for which you have configured your controller(s).
Customizing Displayed Names
Use the options on the Names menu to customize displayed names of
specific global and channel parameters or names of channels and digital
inputs and outputs.
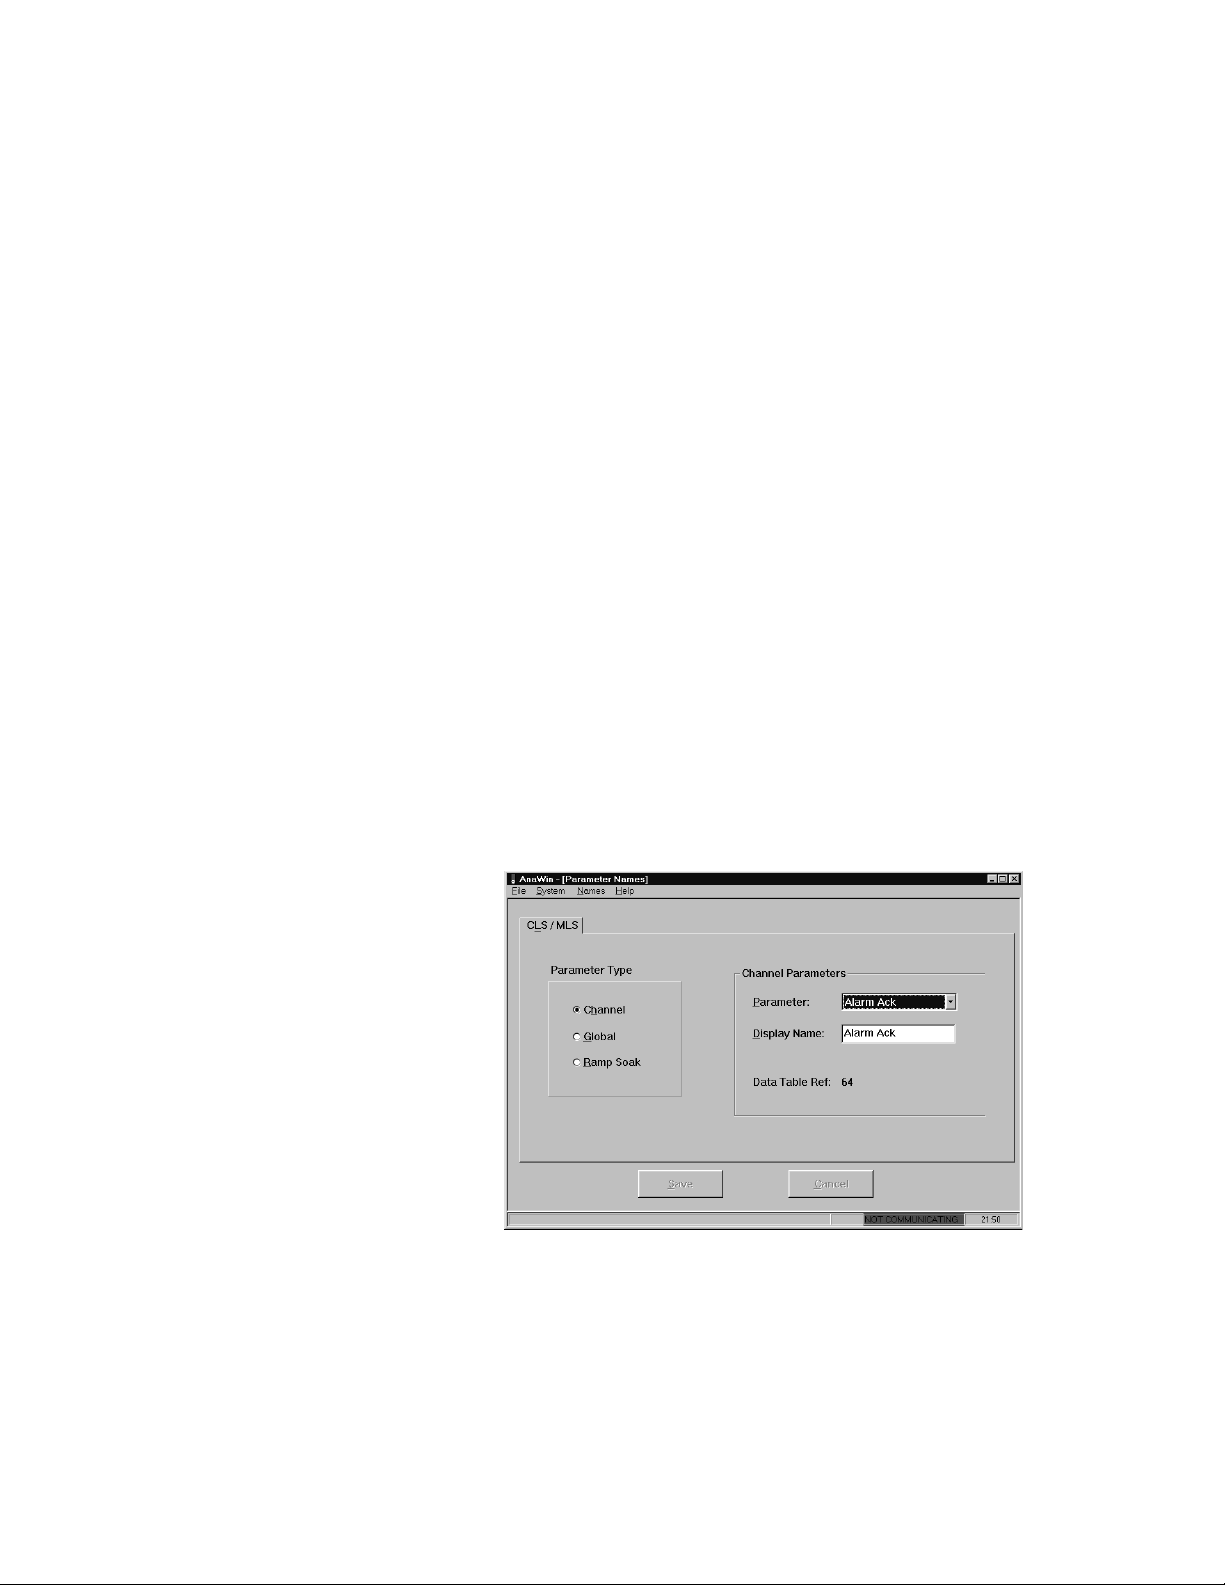
From the Names menu, select Parameter Names to display the
Parameter Names screen, shown in Figure 1-5. Use this screen to
customize channel, global, and ramp/soak parameter names.
1-8 AnaWin User’s Guide
FIGURE 1-5
Parameter Names Screen
Page 17
Installation and Setup
To customize parameter names follow these steps:
1. Use the Parameter Type radio buttons to select a group of parameters to rename (Channel, Global, or Ramp Soak).
2. Use the Parameter pull-down list box to choose the first parameter
of the selected type that you want to rename.
3. Enter your custom name in the Display Name field.
4. Repeat steps 2 and 3 for the other parameters of the selected type
that you want to rename.
5. If desired, repeat steps 1- 5 to ren ame param e ters o f a di fferent type.
NOTE
The Data Table Ref field on the Parameter Names screen is a read-
only field that refers to the CLS Data Table. Refer to the Communications Specifications manual for details.
•
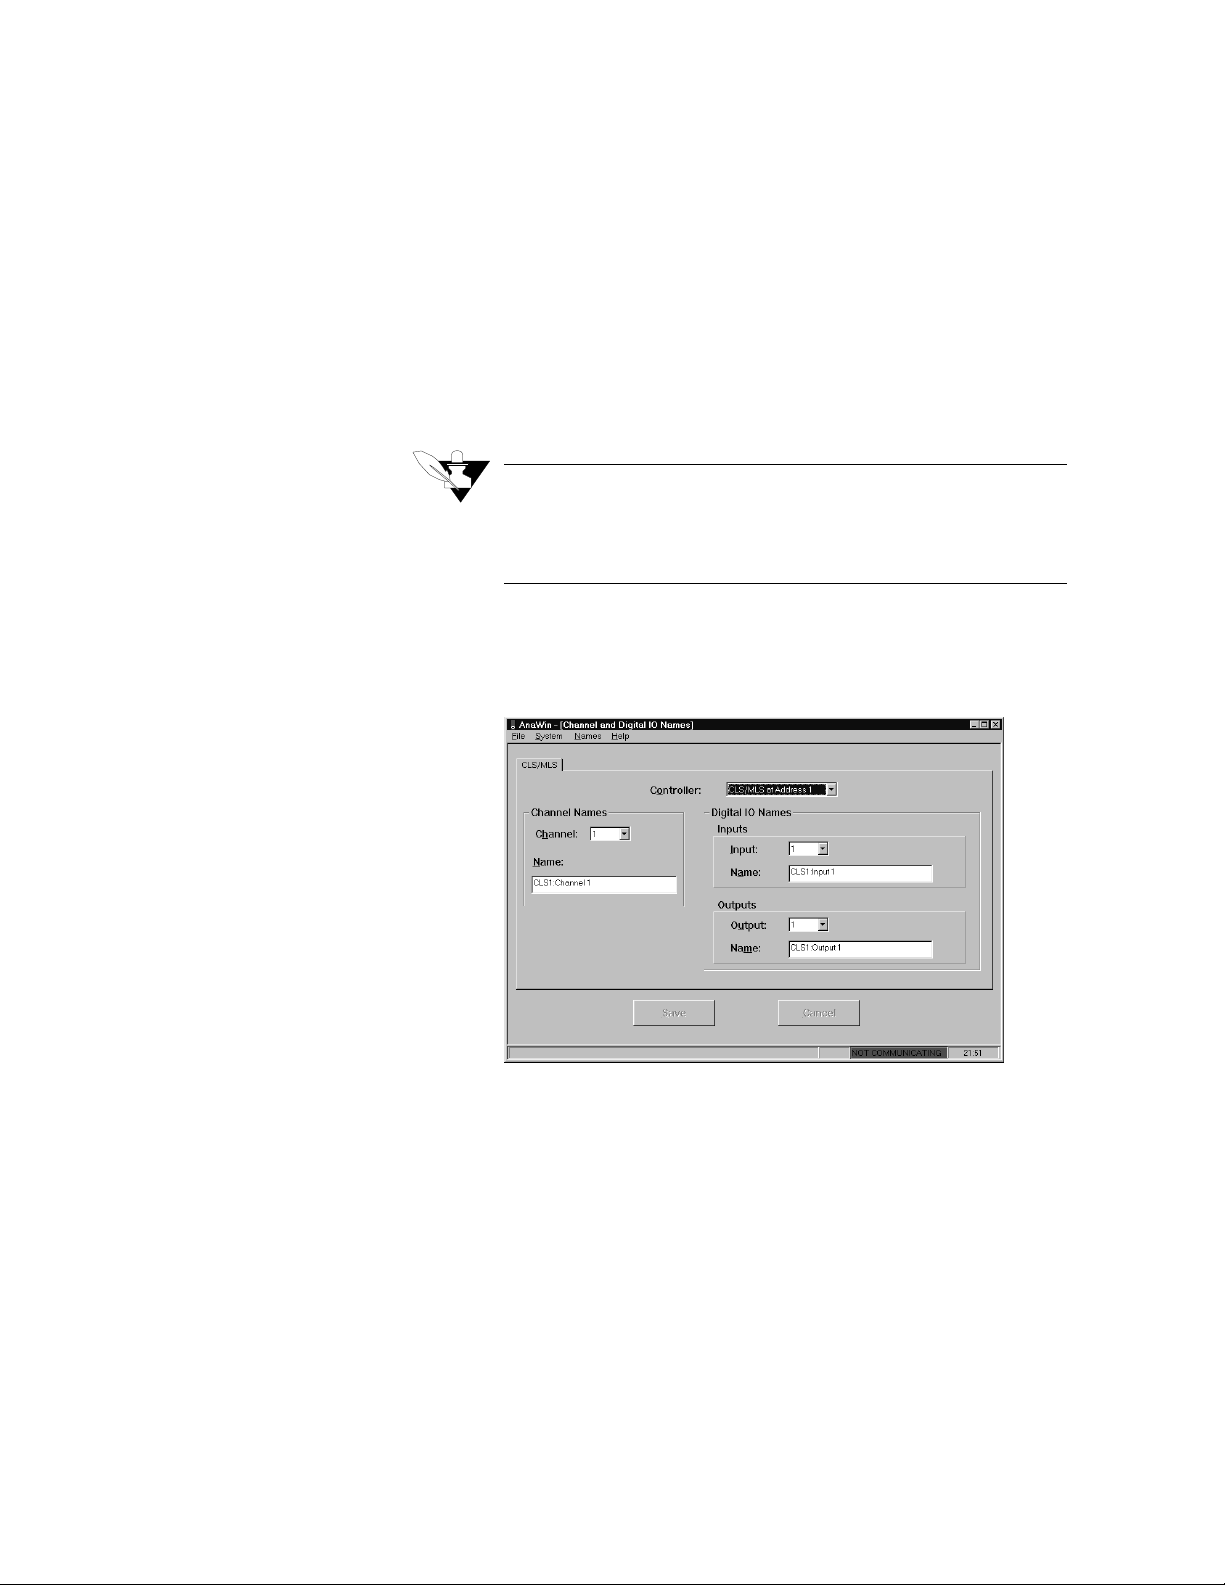
From the Names menu, select Channels & DIO, to display the Chan-
nel and Digital IO Names screen, shown in Figure 1-6. Use this
screen to customize channel and digital input and output names.
FIGURE 1-6
Channel and Digital IO Names Screen
Use the Channel Names panel to customize channel names. One by one,
select the channels you want to rename from the Channel pull-down list
box, then enter your custom name in the Name field.
Use the Digital IO Names panel to customize digital input and o utput
names. One by one, select the input or output you want to rename from
the Input or Output pull-down list box, then enter your custom name in
the Name field.
AnaWin User’s Guide 1-9
Page 18

Installation and Setup
Monitoring the Configured Controllers
Once you have used the Configure program to configure your
controllers, select Return from the File menu to return to AnaWin and
begin monitoring the controllers you have configured, as described in
the remaining chapters of this guide.
1-10 AnaWin User’s Guide
Page 19
AnaWin Screen
Displays
This chapter describes the features common to most AnaWin screens
and lists the options available from the AnaWin main menu bar.
Screen Conventions
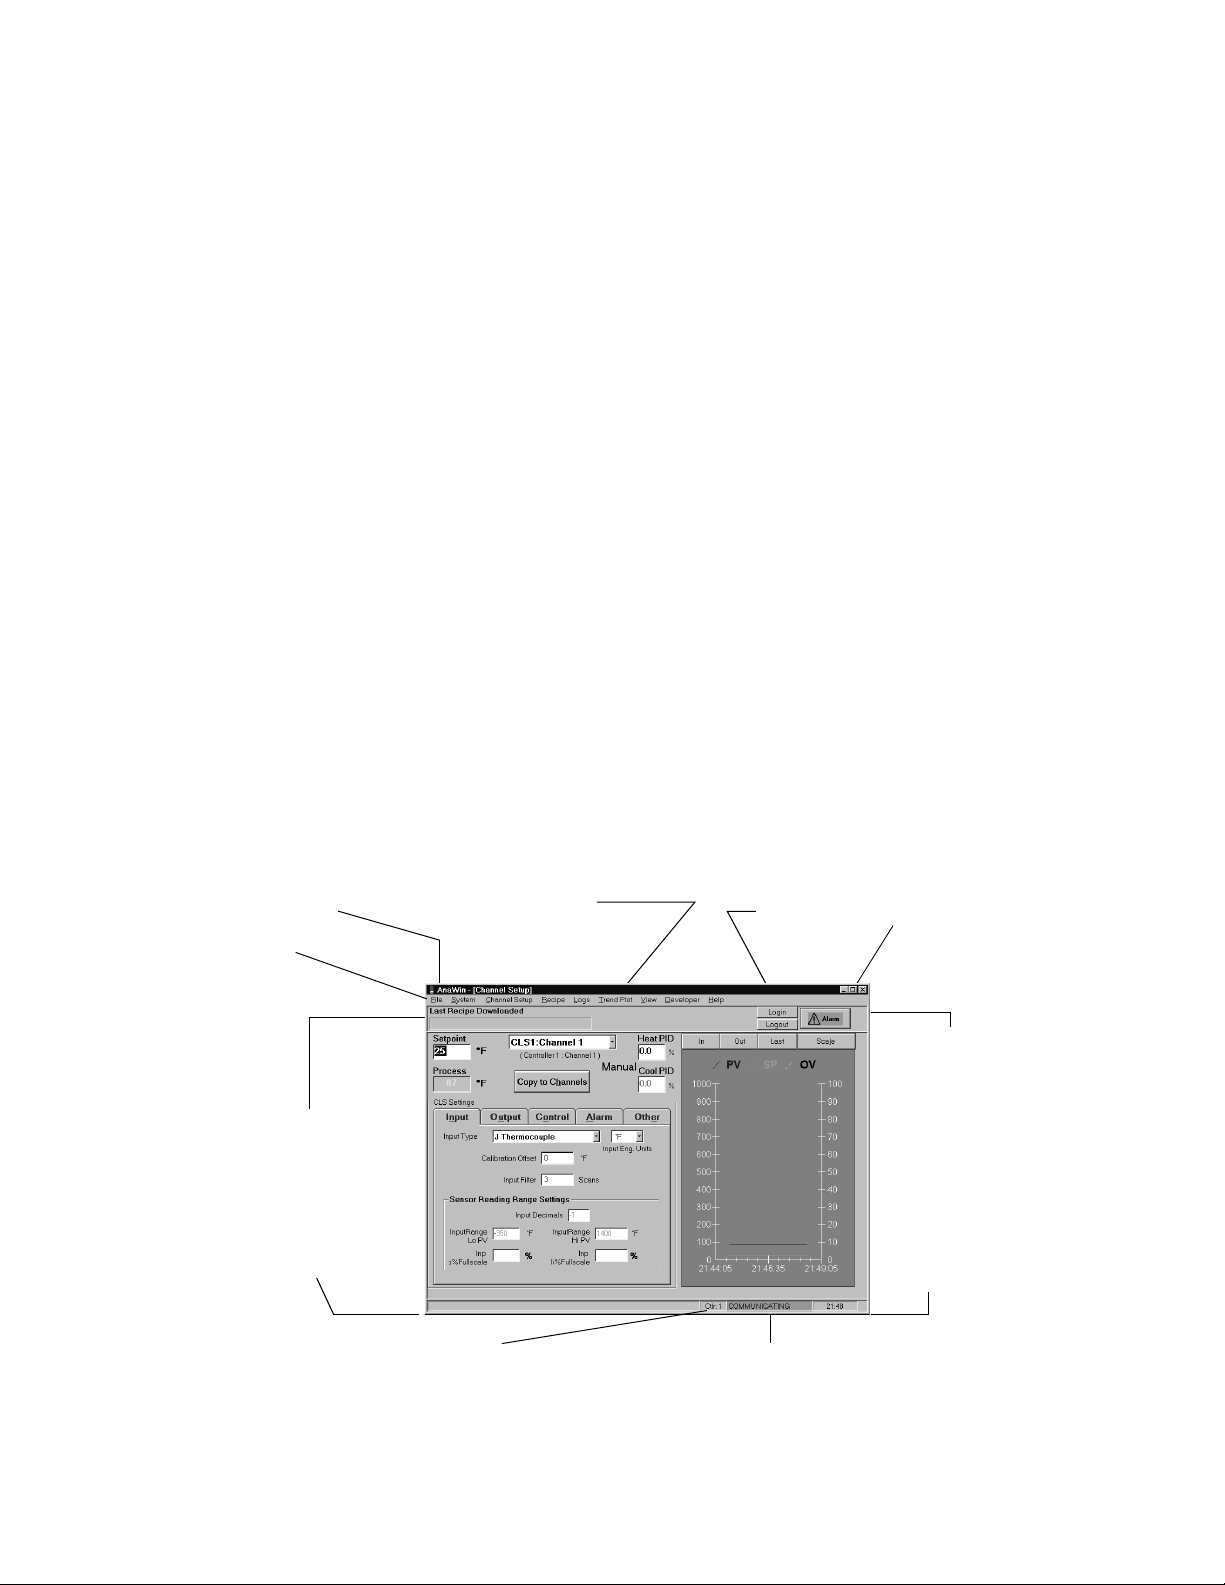
Figure 2-1 shows a typical AnaWi n screen.
Caption
Main Menu
Name of Last
Recipe Downloaded
Current Group
(if enabled)
Login/Logout
Buttons
2
Minimize/Maximize
Screen
Alarm Button/
Indicator
Message box (description of cursor locatio n or
current operation)
Communicating Controller
FIGURE 2-1
Current Time
Communication Status
AnaWin Screen Conventions
AnaWin User’s Guide 2-1
Page 20

AnaWin Screen Displays
The following standard features appear on most AnaWin screens:
Caption: The name of the current screen.
Main Menu: Displays the AnaW in menus. Refer to “Main Menu,” later
in this chapter for a diagram of the menu options on the main menu.
Last Recipe Downloaded: Displays the name of the last recipe
downloaded to the controller.
Current Group: The name of the group currently selected for display.
Refer to “Channel Grouping,” in Chapter 1 for details about creating
channel groups.
Login Button: Click Login to identify yourself to AnaWin. Refer to
“Login,” in Chapter 4, for details.
Logout Button: Click Logout to ensure unauthorized personnel are not
able to access AnaWin features without logging in. Refer to “Logout,”
in Chapter 4, for details.
Alarm Button: Click Alarm to display the Alarm screen. The color of
the Alarm button also serves as an alarm indicator:
Green = No alarms
Yellow = Ch annel in deviation
Red = Channel in alarm
Refer to Chapter 11 for details about viewing and acknowledging
alarms.
Cursor/Location Description: Displays a description of the current
cursor location or current operation.
Communicating Controller: Indicates the controller with which
AnaWin is currently communicating.
Communication Status Indicator: Displays the current
communication status. The communication status is indicated both by
the text on this bar and the color of the bar:
Green = Communicating
Red = Not communicating
2-2 AnaWin User’s Guide
Yellow = Incomplete communication: AnaWin is communicating with
some, but not all, of the cont rollers for which is has been configured.
This status occurs if one or more controllers is set offline or a
communication has failed with one or more controllers.
Page 21
Main Menu
AnaWin Screen Displays
Time: Displays the current time.
Maximize/Minimize: Click the Minimize and Maximize buttons to
minimize and maximize the screen.
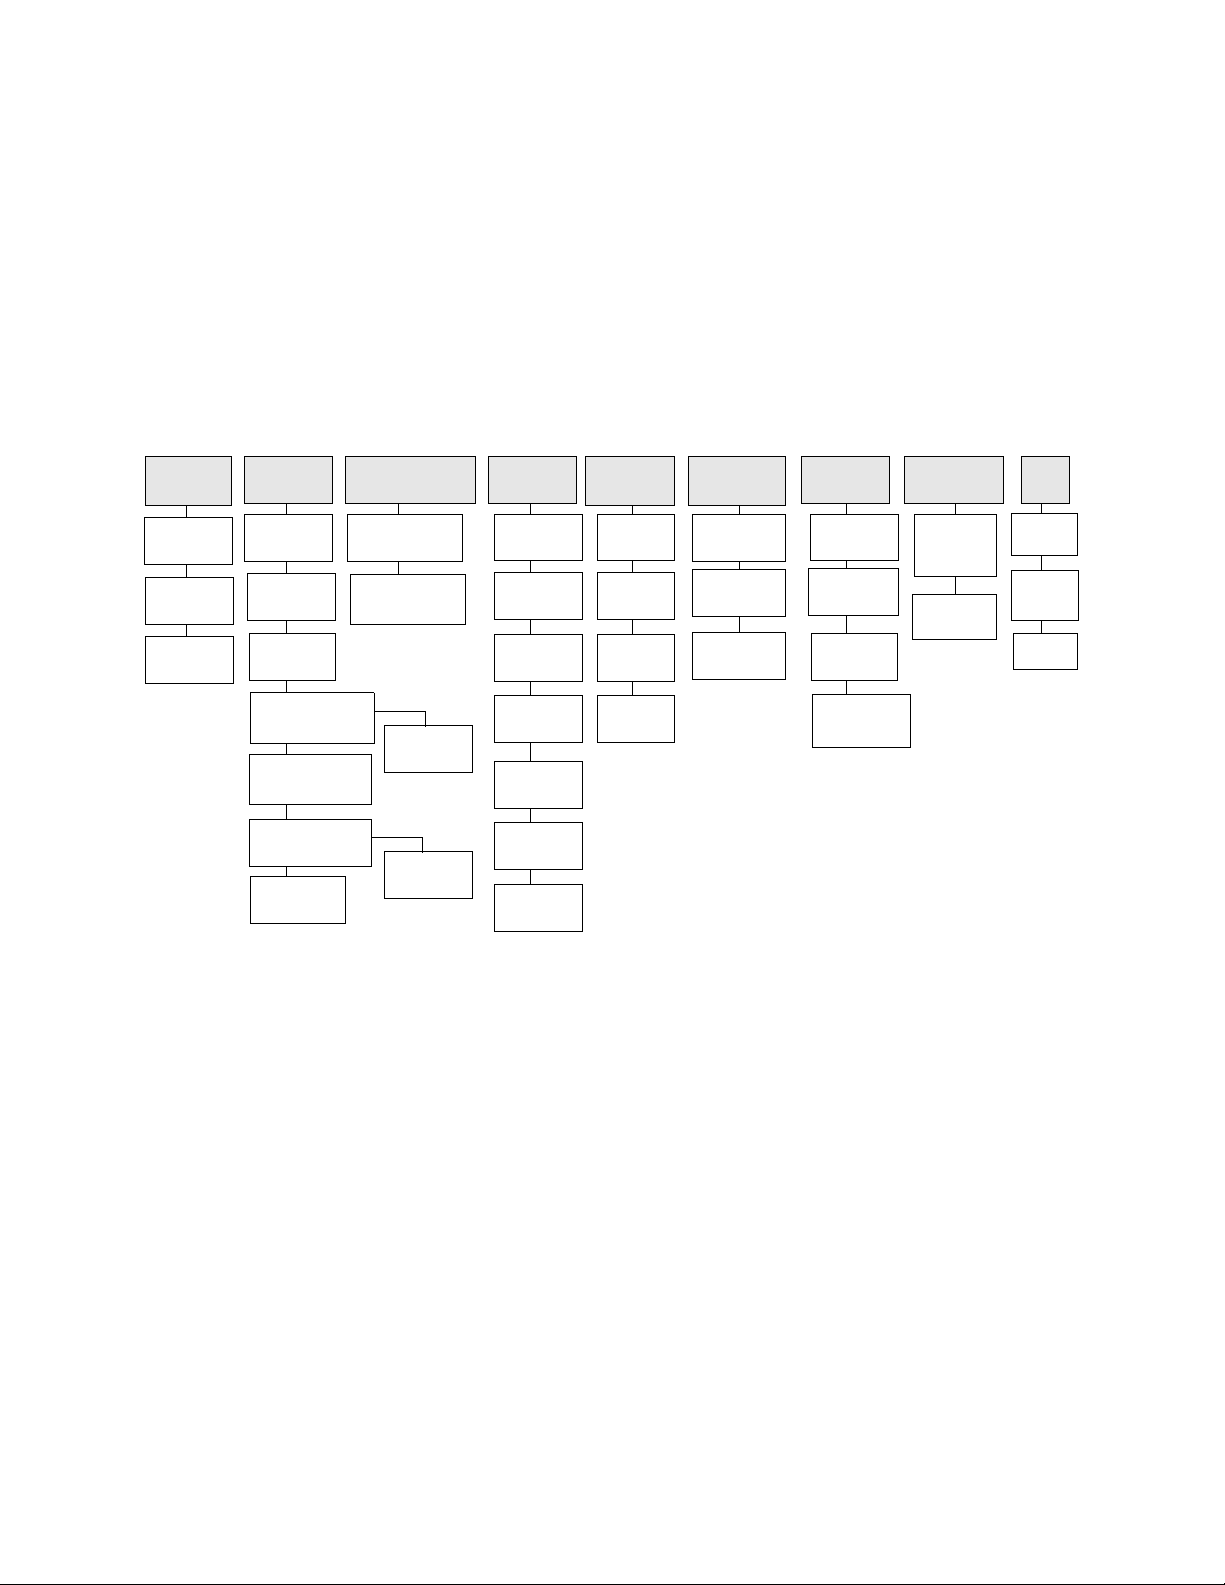
You use the main menu to access AnaWin screens and to perform basic
operations with the controller. Figure 2-2 shows the options available
from the main menu. The following chapters describe the features
available from the menus.
File System Channel Setup Recipe Logs Trend Plot View Developer
Export
Database
Data Log
Setup
Exit
Login
Logout
Preferences
Communications
Com Diags
Snapshot
Configure
Channel
Parameters
Ramp/Soak
Setup
Enable
Disable
Save
Restore
FIGURE 2-2
New
Open
Save
Save As
Remove
Download
Calendar
View
Print
Copy to A:
Remove
AnaWin Main Menu Options
Trend Plot
Settings
Trend Plot
Storage
Trend Plot
Spread
Sheet
Bar Graph
Digital I/ O
(Custom
Overviews)
Design
Custom
Overview
User
Variables
Help
Contents
Search
Help On...
About
AnaWin User’s Guide 2-3
Page 22

AnaWin Screen Displays
2-4 AnaWin User’s Guide
Page 23

Exporting Data
This chapter explains how to use the data export features on AnaWin’s
menu. While AnaWin provides comprehensive trend plotting
File
capabilities, you may need to export data to other applications. Two
options are available for exporting:
.
Setup
Export Database
and
3
Data Log
Export Database
Using the
customize when data is logged and which channels are included in the
log file. You can then use these data logs with programs other than
AnaWin to report or analyze your process performance or history. You
might, for example, import data into a spreadsheet app lication and graph
it for a report.
Select
Figure 3-1. From this screen, you can export a block of process data int o
a text file. This option is a one-time export of data, based on a block of
time and channels you set from data accumulated for trend plotting.
Export Database
Export Database
and
Data Log Setup
to display the Export Settings screen, shown in
options, you can
AnaWin User’s Guide 3-1
Page 24
Exporting Data
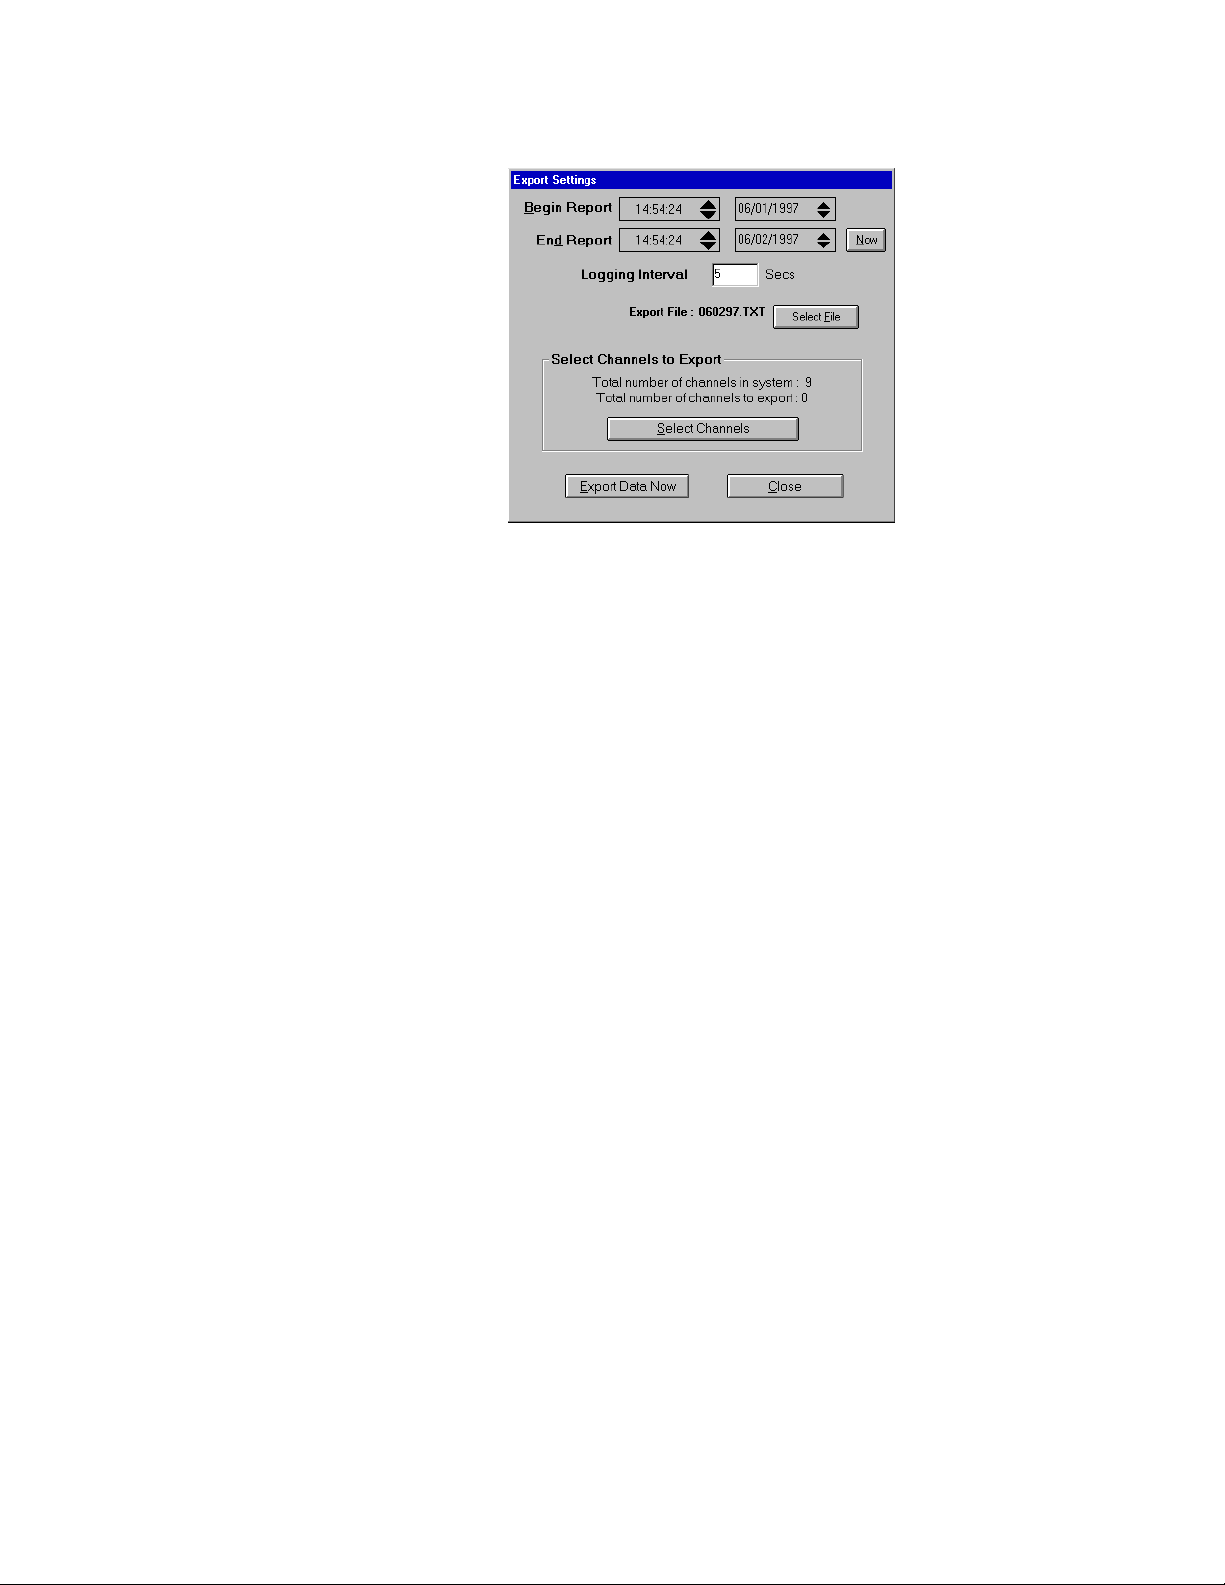
FIGURE 3-1
Export Settings Screen
Setpoint, process variable, and heat and cool output power are logged
whenever AnaWin communicates with one or more controllers. The
maximum sampling frequency is determined by the parameters set
through the Trend Plot menu. Refer to “Trend Plot Settings.” in Chapter
7, for information on how to set the frequency for data collection.
Set the following parameters on the Export Settings screen to set up
export to a database file.
Begin Report
Use the Begin Report fields to define the time (Hou rs, minutes, seconds)
and the day (day, month, year) serving as the starting point of your data
log file. The time is in 24-hour format.
T o ch ang e a value, either over type the ex isting value u sing the key boar d
or move the cursor to the left of the value you want to change and click
on the up/down arrows to increase or decrease the values.
End Report
Use the End Report fields to define the time (Hours, minutes, seconds)
and the day (day, month, year) serving as the ending point of your data
log file.
3-2 AnaWin User’s Guide
Click on the up/down arrows to the right of the value you want to
change, and to increase or decrease the values.
Now
If you want your data logging file to end at the current moment, click
Now instead of using the up/down arrows.
Page 25
Exporting Data
Logging interval
The logging interval is the span of time (in seconds) for the data points
to be exported. The default value is 5, meaning that exported data
represents the state of the process variables every five seconds between
the starting and ending points. Increase or decrease the Logging Interval
by entering a new value and pressing Enter. If you do not press Enter,
the old value will re-appear.
Export file
The Export File field lists the file name for the default text file. The
default file name consists of the date, expressed in 6 figures, and th e
suffix TXT.
Select File
Click the Select button to set the name and location of th e file to be
created when data is exported. The data you have selected is saved in
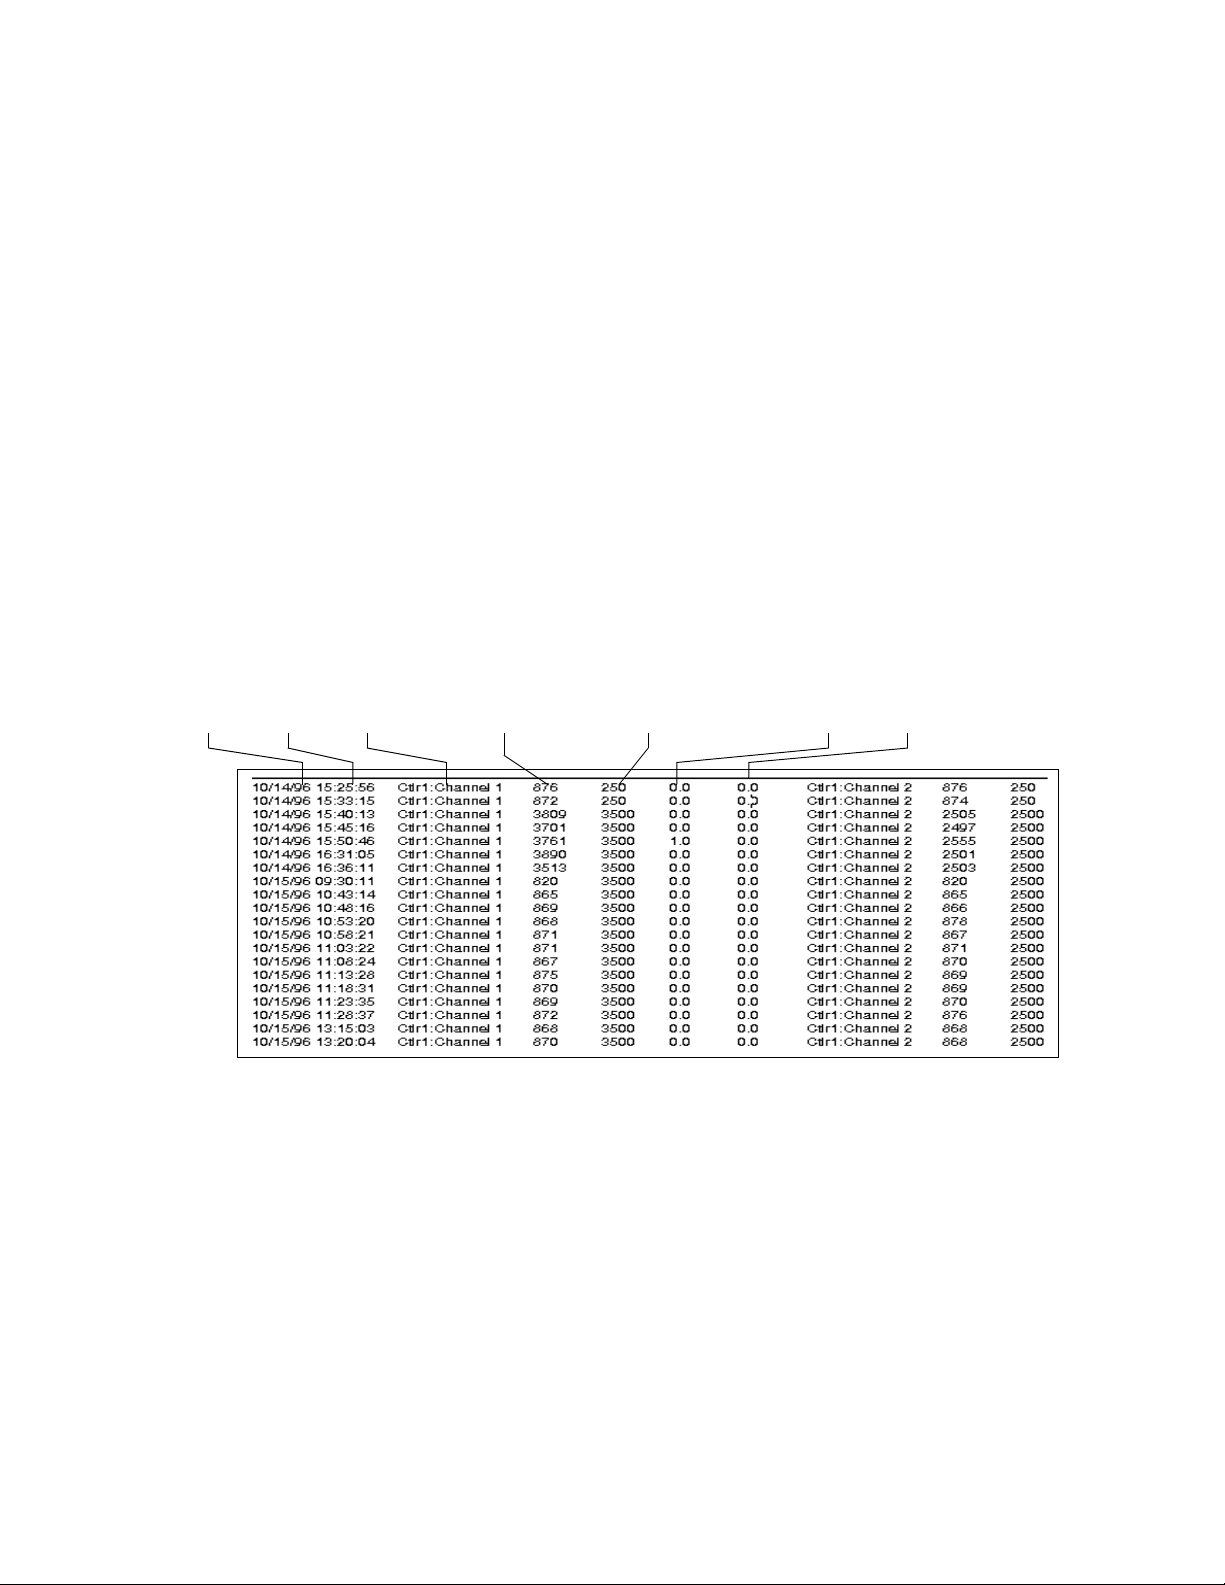
the file you indicate. Figure 3-2 shows a sample exported data file.
Date Time Setpoint Process Variable Output1 Output2Channel Name
FIGURE 3-2
Exported Data File Sample
Select Channels to Export
The data export file can include all the channels in the system, or only
some of them, according to your needs. Use the Select Channels button
in the Select Channels to Export panel, to select the channels you wish
to export.
Press the Select Channels button to select the channels you wish to
export.
AnaWin User’s Guide 3-3
Page 26
Exporting Data
The Select Channels to Export panel lists the total num ber of channels
in the system and the total number of channels currently selected for
export. Click Select Channels to select specific channels from the total.
Select the channels you wish to export, then click OK.
Export Data Now
Click Export Data Now to expor t data to the selected text f ile using the
specified export settings.
Data Log Setup
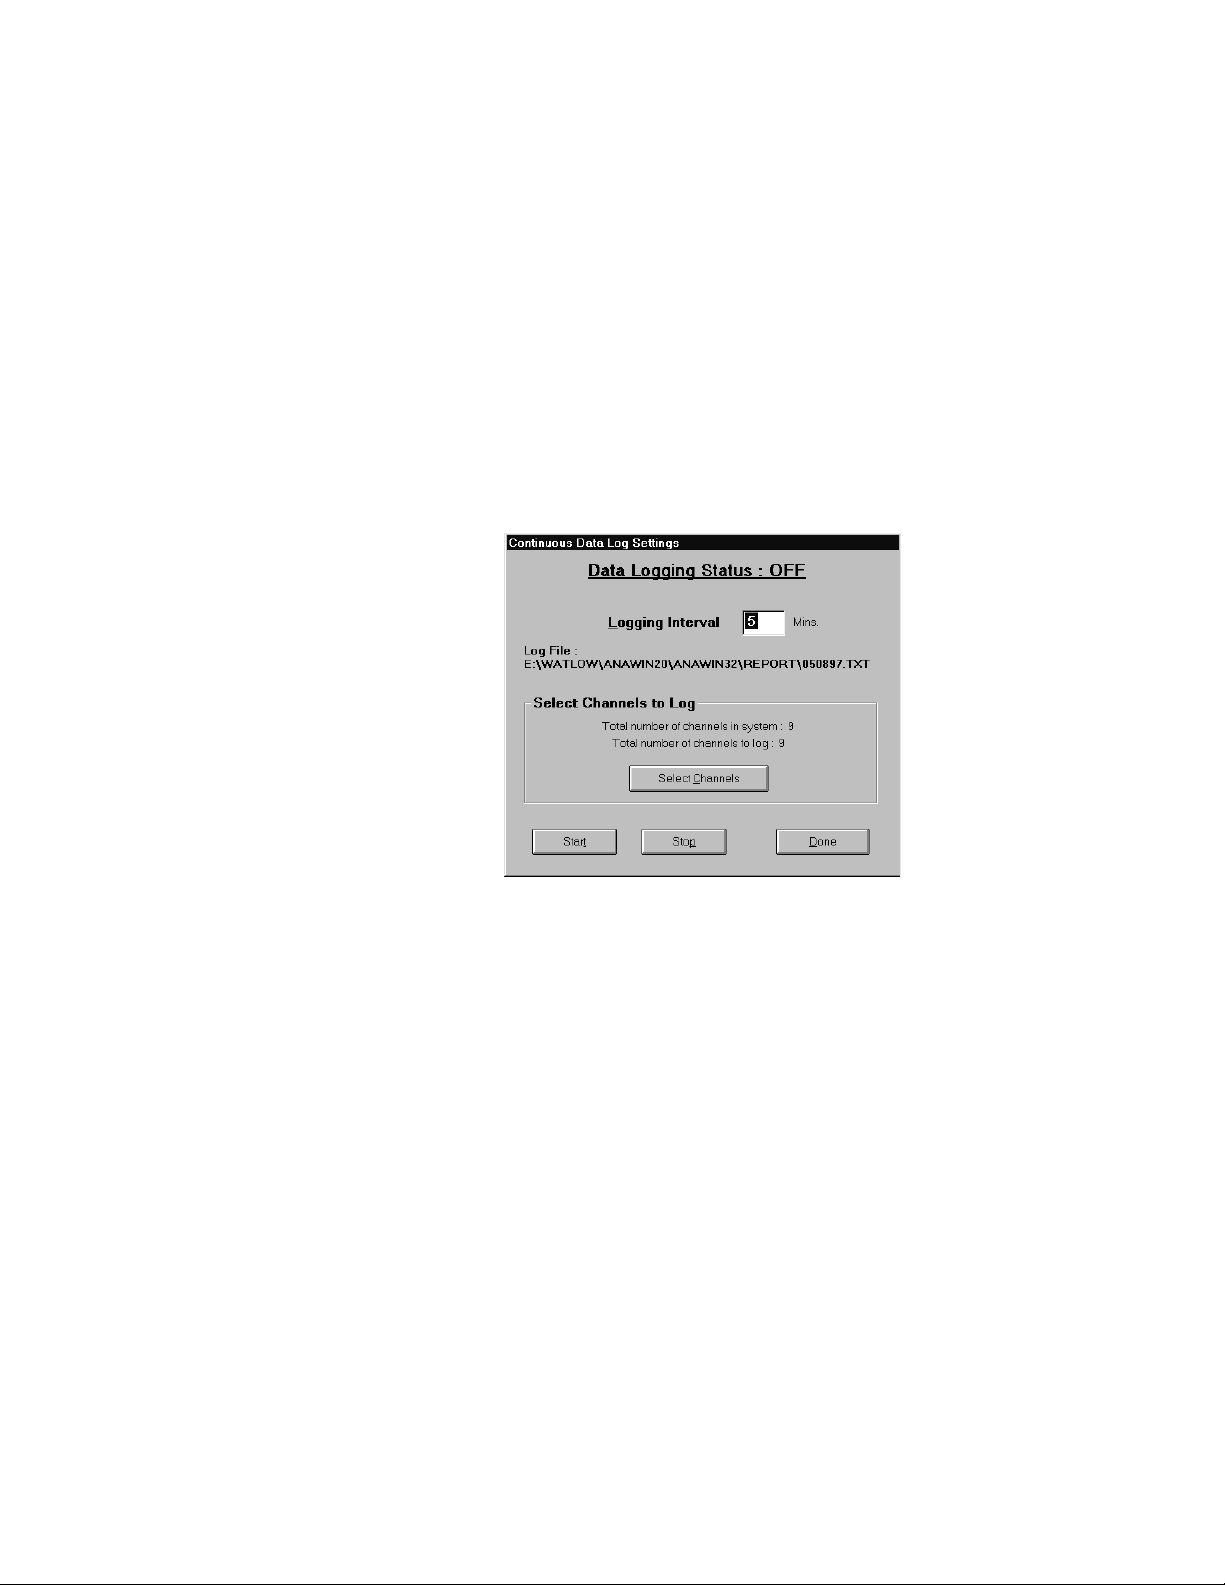
Select Data Log Setup to display the Data Log Settings screen, shown in
Figure 3-3. From this screen, you can set AnaWin to regularly log data
to a database file.
FIGURE 3-3
Data Log Settings Screen
Data Logging Status
The data logging status (ON or OFF) appears at the top of the screen. If
the data log ging status is OFF, no continuou s data logging will occur.
Set the data logging status to ON, to begin continuous logging.
Logging Interval
Set the frequency of data logging. Setpoint, process variable, and two
output variables for each selected channel are logged according to the
period defined in this field.
Select Channels to Log
The data logging file can include all the channels in the system, or only
some of them, according to your needs. Use this field to select the
channels you want to log.
3-4 AnaWin User’s Guide
Page 27

Start
Click Start to begin data logging.
Stop
Click Stop to end data logging.
Done
Click Done to leave the screen with no changes.
Exporting Data
AnaWin User’s Guide 3-5
Page 28

Exporting Data
3-6 AnaWin User’s Guide
Page 29

Setting System
Parameters
4
This chapter explains how to use the options on the
preferences and configure AnaWin to operate controller(s). If password
protection has been enabled, you can also access login and logout
screens.
The
Login
•
Logout
•
Preferences
•
Com Enabled
•
Com Diags
•
Configure
•
AnaWin provides numerous customizable features which can help you
adapt the program to work in a way that fits your needs. You can
establish intelligent connections between your process and your
AnaWin interface by:
Enabling and configuring password protection to help ensure each
•
user is only presented with the screens and commands he or she has
been trained to use.
Setting startup preferences that allow AnaWin to bring up your pro-
•
cess appropriately after a normal shutdown and differently after a
power failure.
Customizing how the interface reacts when an alarm occurs.
•
Customizing the comment prompt displayed when a recipe is saved.
•
Configuring a digital input or output to prevent recipe downloading.
•
menu includes the following options:
System
System
menu to set
AnaWin User’s Guide 4-1
Page 30
Setting System Parameters
Login
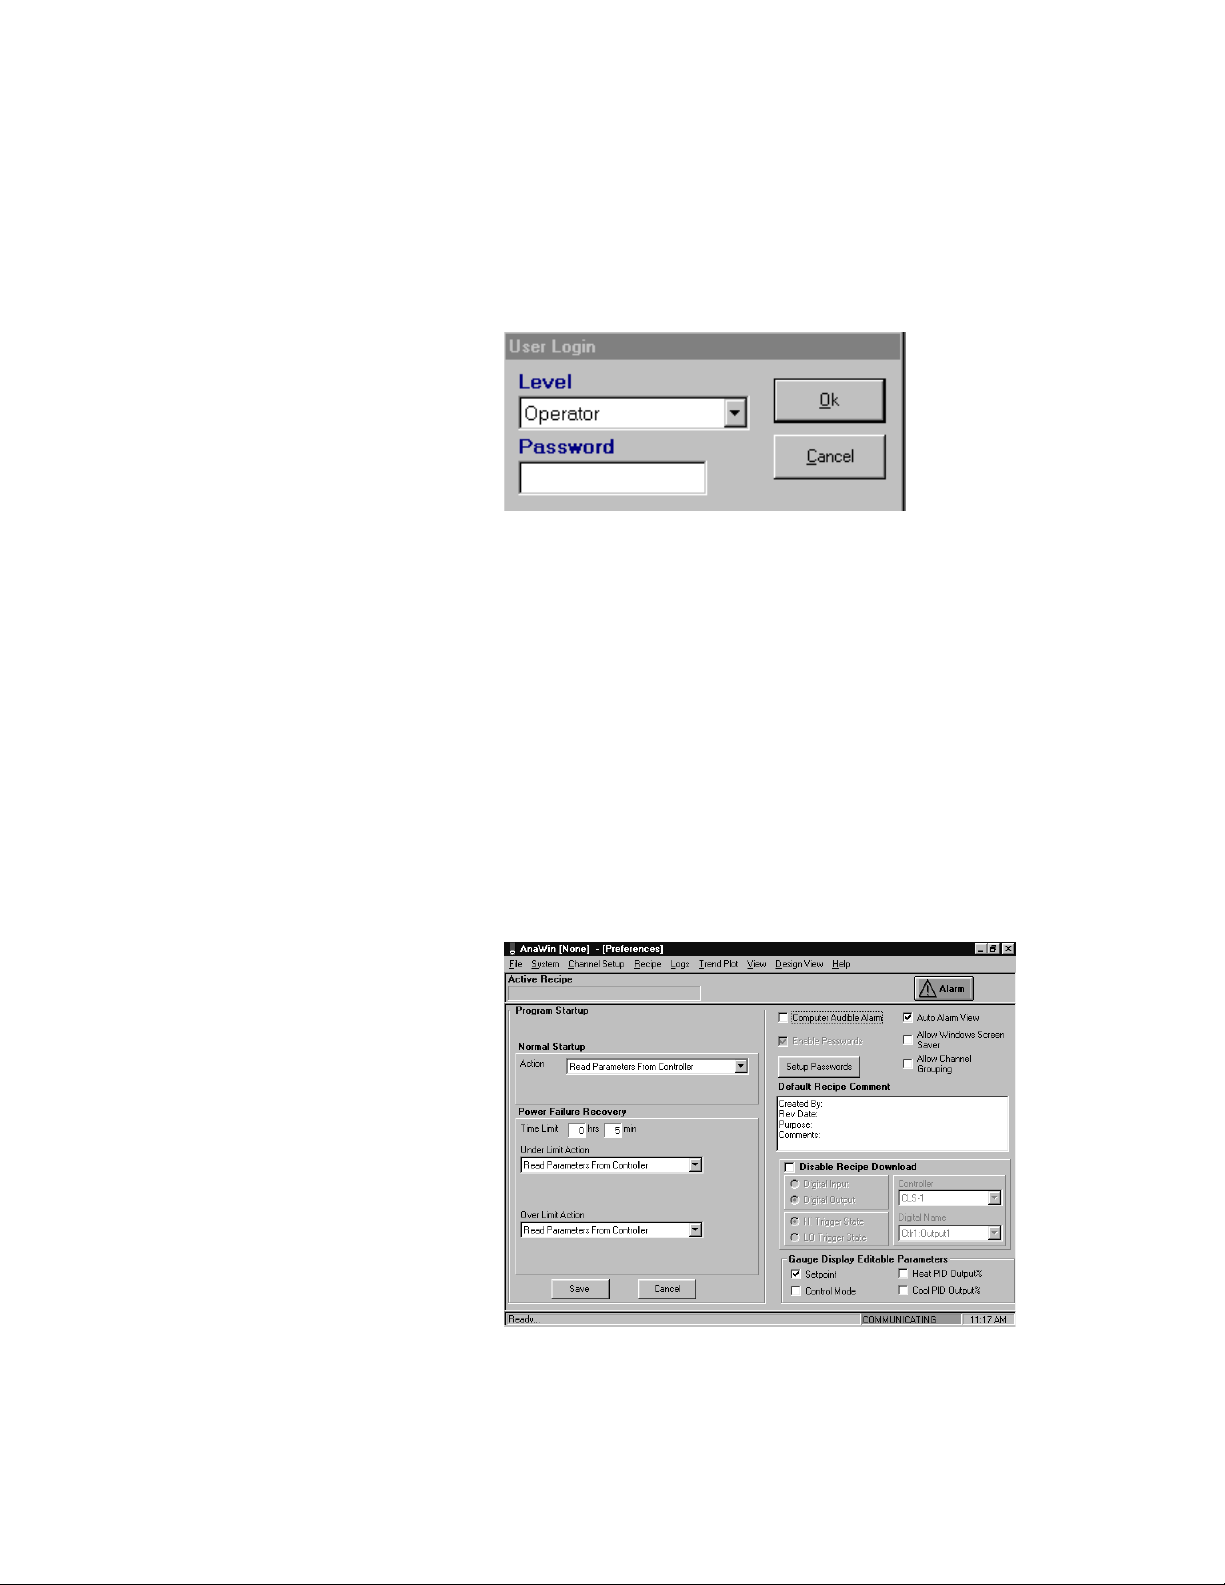
Select Login to display the User Login screen, shown in Figure 4-1. This
screen allows you to log in to the system or identify yourself to
AnaWin. Note that the User Login screen appears only if Enable
Passwords is selected on the Preferences screen. Refer to
“Preferences,“later in this chapter, for details.
Logout
Preferences
FIGURE 4-1
User Login Screen
Select your Level and type your Password. Refer to “Setup Passwords,”
later in this chapter, for details.
Select Logout to log out of the system.
Select Preferences to displ ay t he Preferences s creen , sh own i n Figu re4-2.
This screen allows you to set startup options and other AnaWin
operational parameters. These settings allow you to customize
AnaWin’s features.
4-2 AnaWin User’s Guide
FIGURE 4-2
Preferences Screen
Page 31

Normal Startup
Setting System Parameters
The Normal Startup panel, shown in Figure 4-3, allows you to specify
what actions will occur when you launch AnaWin.
FIGURE 4-3
Power Fail Recovery
Normal Startup Panel on Preferences Screen
You can set one of these three Actions:
•
Read Parameters From Controller: Reads the operational parame-
ters from the controller on bootup.
•
Send Parameters to Controller: Downloads parameters from
AnaWin to the controller(s). If you select this option, you can either
have AnaWin load the last recipe which was downloaded or any of
the recipes saved on the PC’s hard disk.
•
Operator Select on Startup: Prompts the opera tor to choos e to read
parameters from the controller or download a recipe when AnaWin
is launched.
The Power Failure Recovery panel, shown in Figure 4-4, allows you to
specify how AnaWin will respond after a sudden loss of power. Set a
time limit and appropriate startup actions. If AnaWin is launched within
the time limit, it executes the Under Limit Action. If AnaWin is
launched after the time limit elapses, it executes the Over Limit Action.
FIGURE 4-4
Power Failure Recovery Panel on Preferences Screen
AnaWin User’s Guide 4-3
Page 32

Setting System Parameters
Under Limit Action: Sets a startup operation if the amount of time
AnaWin is powered down is less than the specified time limit.
Over Limit Action: Sets a startup operation if the amount of time
AnaWin is powered down is greater than the specified time limit.
You can choose from three options for the under and over limit actions:
•
Read Parameters From Controller: Reads the operational parame-
ters from the controller on bootup.
•
Send Parameters to Controller: Downloads parameters from
AnaWin to the controller(s). If you select this option, you can either
have AnaWin load the last recipe which was downloaded or any of
the recipes saved on the PC’s hard disk.
•
Operator Select on Startup: Prompts the opera tor to choos e to read
parameters from the controller or download a recipe when AnaWin
is launched.
Save
Click Save to save the Program Startup options you have set. Changes
made to other portions of the Preferences screen are saved immediately
when you make the changes.
Cancel
Click Cancel to cancel changes in the Program Startup panel.
NOTE
When using channe l groupin g, set opti ons in the Progr am Startup
panel for each group.
Miscellaneous System Parameters
Figure 4-5 shows the miscellaneous system parameters available on the
Preferences screen. The following subsections describe these
parameters.
4-4 AnaWin User’s Guide
FIGURE 4-5
Miscellaneous Parameters on the Preferences Screen
Page 33

Setting System Parameters
Computer Audible Alarm
Sets the computer’s audible alarm to respond when an alarm condition
occurs.
Auto Alarm View
Sets the alarm screen to appear automatically any time an alarm occurs.
Enable Passwords
Turns on password protection and enables the Setup Passwords button.
Refer to “Setup Passwords” later in this chapter for details about setting
up password s.
Allow Windows Screen Saver
Normally, AnaWin disables the Windows screen saver. Select this
option to allow a Windows screen saver to run.
Setup Passwords
Use password protection to limit access to certain menus and screens.
To enable password protection, select the Enable Passwords check box
on the Preferences screen (AnaWin is shipped with passwords
disabled.) Click Setup Passwords to display the Password Setup screen,
shown in Figure 4-6. Note that you must have Supervisor rights to
access the Password Setup screen. A default password has been
assigned to each password level.
NOTE
The default password is control (all lower-case letters).
FIGURE 4-6
Password Setup Screen
AnaWin User’s Guide 4-5
Page 34

Setting System Parameters
You can set password protection by user Level (operator, supervisor,
engineer, or none), or by specific User.
•
Level: Select Level to divide password protection bet ween Operator,
Engineer, Supervisor, or None user levels.
•
User: Select User to set up passwords for users by name. If you
select the User option, you mu st as si gn a us er l evel and pas swor d t o
each user. Do this in the User Information section of the screen as
described under “Setting Passwords by Level,” later in this chapter.
NOTE
If you misplace or forget the Supervisor password, call Technical
Support for a one-day only master password.
Setting Passwords by Level
If you select the Level option, you can set three passwords: Operator,
Engineer, or Supervisor. You can set access for each level in the
Password Le vel Required panel, as described below.
FIGURE 4-7
Password Level Required: The Password Level Required panel,
shown in Figure 4-7, allows you to assi gn acces s ri ghts fo r u ser levels to
portions of AnaWin.
Password Level Required Panel
When you double-click All Menus, the AnaWin menu tree appears as
shown in Figure 4-8. Select the portions of the menu tree to password
protect. To enable password protection, highlight a menu item and click
the button corresponding to the user level. The None designat or changes
to the selected user level.
4-6 AnaWin User’s Guide
Page 35

Setting System Parameters
FIGURE 4-8
FIGURE 4-9
AnaWin Menu Tree with Assigned User Levels
Level Passwords: The Level Passwords panel, shown in Figure 4-9
allows you to set the passwords for the three user levels.
Level Passwords Panel
Setting Passwords by User
If you select the User option, the user information panel, shown in
Figure 4-10, appears on the Password Setup screen, and you can assign
a password and security level to each user. User security mode allows
you to assign each user a unique password. In user security mode, the
Administrator user is always present. Change the default password to
prevent unauthorized access.
FIGURE 4-10
User Information Panel
AnaWin User’s Guide 4-7
Page 36

Setting System Parameters
T o add a user, follow these steps:
1. Enter the user’s name in the User Name field.
2. Enter a password for that user in the Password field.
3. Use the Level pull-down list box to select a security level for that
user.
4. Click Add User. The user’s name now appears in the list under the
User Name field.
To delete a user, follow these steps:
1. Select the user’s name from the list under the User Name field.
2. Click Delete User.
To change a user’s password or security level, follow these steps:
1. Select the user’s name from the list under the User Name field.
2. Enter a new Password and/or select a new security Level.
3. Click Modify User.
Default Recipe Comment
The Default Recipe Comment field allows yo u to edit the default recip e
comment text. To change the text of the default comment, shown in
Figure 4-11, use the keyboard to delete and add text. Note that any
changes you make will appear in the comment section when a new
recipe is saved.
FIGURE 4-11
T e xt for Def a ult Recipe Comment
4-8 AnaWin User’s Guide
Page 37

Disable Recipe Download
Select Disable Recipe Download and set the as sociated options, shown
in Figure 4-12, to set the software to prevent recipe downloads under the
specified conditions.
Setting System Parameters
FIGURE 4-12
Disable Recipe Download Options
Select a digital input or output and state (high or low), as the condition
that will prevent recipe downloads.
Gauge Display Editable Parameters
Use the Gauge Display Editable Parameters panel, shown in Figure 4-13,
to specify which parameters on the Gauge Display screen are editable.
Place a check mark in the box corresponding to each parameter you
want to be editable.
FIGURE 4-13
Gauge Display Editable Parameters Panel
Communications
From the System menu, select Communications, then Enabled or
Disabled to enable or disable communications with one or more of the
controllers.
When you select Enabled or Disabled, a selection window appears.
From this window, select the controller for which you want to enable or
disable communications, then click OK.
When communication is enabled, the indicator shown in Figure 4-14
appears in the bottom right-hand portion of the screen. This indicates
that AnaWin is communicating with the controller(s).
FIGURE 4-14
Communication Enabled Indicator
AnaWin User’s Guide 4-9
Page 38

Setting System Parameters
When communication is disabled or communication with all controllers
has failed, the indicator shown in Figure 4-15 appears on the bottom
right-hand portion of the screen. This indicates that AnaWin is not
communicating with the controller(s).
Com Diags
FIGURE 4-15
When AnaWin is set up to communicate with multip le controllers, and
some controllers are not communicating, the indicator displays
“INCOMPLETE COMM”.
Select Com Diags to display the Communication Diagnostics screen,
shown in Figure 4-16. This screen displays the cumulative
communications errors encountered within the specified time limit. Use
the Evaluation Time Window field to set the time limit.
Communication Disabled Indicator
Configure
4-10 AnaWin User’s Guide
FIGURE 4-16
Select Configure to leave AnaWin and launch the Configure program.
Refer to the Chapter 1 for details about using the Configur e pro gram.
Snapshot
Select Snapshot to save or restore a snapshot of a selected controller’s
settings. A snapshot is a backup of the controller’s data table. When
snapshot save is selected, the entire data table is read and stored on the
computer’s hard disk. Restoring a snapshot puts a controller back to a
previously saved state which is especially useful after a controller
firmware update or when a controller is replaced.
Communication Diagnostic s Scre en
Page 39

Setting System Parameters
Save
Select Snapshot, then Save to select the controller for which you want to
save a snapshot. You can save one snapshot for each controller. Select
the desired controller, then click OK to save a snapshot of the
controller’s current settings—including any changes you have made in
the current session.
Restore
Select Snapshot, then Restore to restore a snapshot. Select the desired
controller, then click OK to restore the snapshot of the controller’s
settings before you made any changes.
AnaWin User’s Guide 4-11
Page 40

Setting System Parameters
4-12 AnaWin User’s Guide
Page 41

Setting Channel
Parameters
This chapter explains how to use the options on the Chann el Setup men u
to configure channel parameters and set up ramp soak options. The
Channel Setup menu includes the following options:
Channel Parameters
•
Ramp Soak Setup
•
The channel parameter and ramp/soak screens simplify and streamline
the task of setting up your controllers. The channel copy feature, for
example, can save you literally hours of tedious data entry. Graphical
displays group related parameters and present them more clearly than is
possible on the controller front panel interface.
Channel Parameters
Select Channel Parameters to display the Channel Setup screen, shown
in Figure 5-1. Use this screen to set the input, output, control, and alarm
parameters for each channel. The Channel Setup screen also includes a
real-time plot screen that displays the process variable and output
variable as you make changes.
5
AnaWin User’s Guide 5-1
Page 42

Setting Channel Parameters
Channel Summary
Channel Setup
Tabs
Channel Summary
FIGURE 5-1
Real-time Trend
Plot
Channel Setup Screen
The top portion of the Channel Setup screen, shown in Figure 5-2,
allows you to choose a channel to set up and provides some basic
information about the channel being edited.
FIGURE 5-2
Top Portion of Channel Setup Screen
Channel Number
Use the channel number pull-down list box to choose the channel you
want to edit or view.
Setpoint
Use the Setpoint field to enter a setpoint for the selected loop. The
setpoint range appears at the bottom of the screen when you p os ition the
cursor over the field. If you enter a setpoint that is out of the defined
range, the controller will assign the closest number within the range.
Press the Enter key to send your new setpoint to the controller.
Process
The Process field displays the process variable in real time. It is a read
only field.
5-2 AnaWin User’s Guide
Page 43

Setting Channel Parameters
NOTE
If Allow Channel Grouping is selected on the Controller Setup
screen, only the channels assigned to the curre nt group will be
available for selection.
Copy to channels
Click Copy to Channels to copy the displayed channel’s setup to another
channel. This feature enables fast and easy channel setup. You cannot
copy the setup of a pulse channel to a non-pulse channel, and vice versa.
When you click Copy to Channels, the chann el list sh own in Figure 5 -3
appears. Highlight the desired channel(s), then click OK. The
parameters from the current channel are copied to each of the selected
channels.
FIGURE 5-3
Real-time Trend Plot
Selecting Channels to which to Copy Parameters
Control Mode and Ramp/Soak Status
The right side of the Channel Setup screen’s channel summary area
displays the control modes Manual, Auto, or Tune. Use the Control tab
in the Channel Setup Tabs panel to change the control made. Refer to
“Control,” under “Channel Setup Tabs,” for details. If Manual mode is
selected, you can use the Heat PID and Cool PID fields to change the
power percentages; otherwise, if a ramp/soak profile is assigned to the
channel, the ramp/soak status —Start, Run, or Hold—is displayed. Refer
to “Control,“under “Channel Setup Tabs,” for details about how to set
the ramp/soak status.
The real-time trend plot on the right of the Channel Setup screen
provides real-time graphic trending.
AnaWin User’s Guide 5-3
Page 44

Setting Channel Parameters
The trend plot displays the last five minutes of the process for the
current channel. Three parameters are plotted: Process Variable (PV),
Output Value (OV), and Setpoint (SP).
The real-time trend plot screen is not editable. You cannot change the
parameters being plotted (PV, OV, SP) or change the time frame of the
graph. Use the plot for a quick view of your process, and as an aid when
tuning your control process.
In: Increases the plot’s vertical axis resolution.
Out: Decreases the plot’s vertical axis resolution.
Last: Returns the plot to the last vertical axis scal ing val ues .
Scale: Scales the trend plot to fit into the size of the plot window.
Channel Setup Tabs
The Channel Setup screen contains five tabs, shown in Figure 5-4, that
allow you to set the parameters for the channels. Refer to your controller
manual for setup information.
FIGURE 5-4
FIGURE 5-5
Channel Setup Tabs
Input
Use the Inpu t tab, shown in Figure 5-5, t o choose the se nsor type and
other input parameters.
Channel Setup Input Tab
When you choose Skip, you cannot edit any of the parameters.
When you choose Linear or Pulse as the input type, the four Sensor
Reading Range Settings fields become available.
5-4 AnaWin User’s Guide
Page 45

Setting Channel Parameters
Output
Use the Output tab, shown in Figure 5-6, to enable or disable outputs
and to choose the output signal type.
FIGURE 5-6
FIGURE 5-7
Channel Setup Output Tab
The Output tab includes two panels: one for output #1 (generally for
heat) and one for output #2 (generally for cool). When you select Time
Proportioning output, another field appears in which you can enter the
cycle time for the TP output. If you select SDAC output, the SDAC
Settings panel, shown in Figure 5- 7, appears.
SDAC Settings Panel
Control
Use the Control tab, shown in Figure 5-8, to select a control mode
(Auto, Manual, or Tune) or the ramp/soak status (Start, Run, or Hold).
The mode or status you select here appears in the upper part of the
Channel Setup screen, in the channel summary area, as described in this
chapter.
AnaWin User’s Guide 5-5
Page 46

Setting Channel Parameters
FIGURE 5-8
Channel Setup Control Tab
In addition, the Control tab also includes the following fields that allow
you to set control parameters for output #1 and output #2:
Prop Band: The range in which the proportioning function of the
control is active.
Integral: A control action that automatically eliminates offset, or droop,
between setpoint and actual process temperature.
Derivative: A control action that anticipates the rate of change of the
process and compensates to minimize overshoot and undershoot. This
value is measured in seconds.
PID Filter: The time constant for the output filter. The heat or cool
output filter prevents oscillations by dampening the output’s response.
The output responds to a step change by going approximately 2/3 of its
final value within the number of scans that are set.
For loops with a ramp/soak profile assigned, the following information
is displayed:
Tim Rem: Time remaining for the profile.
5-6 AnaWin User’s Guide
Total T i m e: Time the profile has been running.
Seg Time: Time remaining in the current segment.
Cycle: Cycle number; the cycle’s number out of the total cycles. Refer
to “Ramp Soak Setup,” later in this chapter, for further details about the
ramp/soak feature.
Alarm
Use the Alarm tab, shown in Figure 5-9, to enable alarms, set alarm
limits and alarm delays, customize alarm messages, and assign digital
outputs to alarms.
Page 47

Setting Channel Parameters
FIGURE 5-9
FIGURE 5-10
Ramp Soak Setup
Channel Setup Alarm Tab
Other
Use the Other tab, shown in Figure 5-10, to edit additional output
parameters.
Channel Setup Other Tab
AnaWin’s ramp/soak feature turns your controller into a powerful and
flexible batch controller, which you can program to change a process’
setpoint in a preset pattern over time. This pattern, or temperature
profile, consists of up to twenty segments. During a segment, the
temperature goes from the previous segment’s setpoint to the current
segment’s setpoint.
•
If the current segment’s setpoint is larger or smaller than the previ-
ous segment’s setpoint, the segment is called a ramp.
•
If the current segment’s setpoint is the same as the previous seg-
ment’s setpoint, the segment is called a soak.
AnaWin User’s Guide 5-7
Page 48

Setting Channel Parameters
Each segment can have up to two triggers (digital inputs). If enabled,
these triggers must be tru e b efor e the segment can start. When n eithe r o f
the triggers is true, the profile is in the trigger wait state. Y ou can use the
same trigger for more than one loop or one profile.
Using AnaWin’s ramp/soak feature, you can:
•
Assign new ramp/soak profiles.
•
Synchronize l oops.
•
Modify segment times.
•
View and modify profiles.
•
Save profiles to disk.
Your controllers must include the ramp/soak option in order to use
AnaWin’s ramp/soak feature. In addition, you must enable ramp/soak in
the Configuration program—by selecting the Ramp Soak Option check
box on the Controller Setup screen—in order to activate the ramp/soak
screens. If you do not select this op tion, the ramp/soak screens will not
be available.
Assigning Profiles to Loops
Select Ramp Soak Setup from the Channel Setup menu to display the
Ramp Soak Assignment s creen, shown in Figure 5-11. From this screen,
you assign profiles to loops.
NOTE
If you do not have any ramp/so ak cont rollers connected t o your sys tem, you will get an error message when you select Ramp Soak
Setup.
5-8 AnaWin User’s Guide
FIGURE 5-11
The Ramp Soak Assignment screen consists of a table in which each
row corresponds to a channel.
Ramp Soak Assignment Screen
Page 49

Setting Channel Parameters
Location
Use the Location column to select a memory location in the controller to
which to download a profile.
Profile Name
The Profile Name column indicates whether or not a profile has been
assigned to the corresponding channel.
If the Profile Name button is blank, clicking the column displays the
Select File window, shown in Figure 5-12. Use this window to assign a
profile to the loop.
FIGURE 5-12
Select File Window
•
T o assign a an existing p rofile to the loop, select a file name f rom the
list of valid profiles, then click OK to return to the Ramp Soak
Assignment screen.
•
To create a new profile with default values, type in a non-existent
profile name in the File Name field, then click OK to return to the
Ramp Soak Assignment screen.
If a valid profile is Assigned, clicking the Profile Name button displays
the Special Ramp-Soak Functions screen, shown in Figure 5-13.
Refer to “Using Special Ramp/Soak Functions,” below for details about
the menu options and screens you can access from the Special RampSoak Functions screen.
Using Special Ramp-Soak Functions
To display the Special Ramp-Soak Functions window, shown in
Figure 5-13, click the Profile Name column on the Ramp Soak
Assignment screen for a channel to which a profile has been assigned.
AnaWin User’s Guide 5-9
Page 50

Setting Channel Parameters
p
y
y
p
y
y
y
play
y
y
p
y
p
.
FIGURE 5-13
The menus on the S
s
When
Ram
Synchronize
Select
S
Special Ramp-Soak Funct i ons Window
ecial Ramp-Soak Functions window allow you to
nchronize loops, modify segment times, and jump to other segments.
ou are done using these menus, click
Done
from the Special
-Soak Functions window to return.
Loops
from the
Synchronize
menu to display the Channel
nchronization Setup window, shown in Figure 5-14, which allows
ou to synchronize loops.
5-10 AnaWin User’s Guide
FIGURE 5-14
To s
1. Click
2. From the list box, select the desired channels, then click OK to
3. Use the
4. Click
Channel Synchronization Setup Window
nchronize loops, follow these steps:
Select Channels
to dis
a pull-down list box from which
ou can select the channels you want to synchronize.
return to the Channel S
Ramp-Soak mode to be downloaded
select the mode
Download
to download the selected mode for the selected
channels and return to the S
nchronization Setup window.
ull-down list box to
ou want to download for the selected channels.
ecial Ramp-Soak Functions window.
Page 51

Setting Channel Parameters
Jump
Select Jump from the menu bar to display the Jump to Ramp-Soak
Functions window, shown in Figure 5-15. From this screen, you can
jump to a different segment or modify the time remaining in the current
segment.
FIGURE 5-15
To jump to a different segment, follow these steps:
1. Click Select Channels to display a pull-down list box from which
2. From the list box, select the desired channels, then click OK to
3. Enter the segment number for the segment to which you want to
4. Click Download to jump to the specified segment and return to the
To modify the time remaining for the segment that is currently runni ng
on the selected loop, follow these steps:
1. Use the Time remaining in segment fields to modify the time
2. Enter current segment number in the Advance to segment field.
3. Click Download to download your modification and return to the
Status
Jump to Ramp-Soak Functions Window
you can select the channels you want to jump to a different segment.
return to the Jump to Ramp-Soak Segment window.
jump in the Advance to segment field.
Special Ramp-Soak Functions window.
remaining.
Special Ramp-Soak Functions window.
Use the Status column to specify whether a profile is Assigned or Not
Assigned to the loop. An Assigned loop operates as a ramp/soak loop. A
Not Assigned loop operates as a standard control loop. Refer to “Profile
Name,” earlier in this section, for details about how to associate a
profile with a loop.
AnaWin User’s Guide 5-11
Page 52

Setting Channel Parameters
Edit/View Profile
The Edit/View Profile button allows you to access the Ramp Soak Edit
screen, on which you can view and modify a selected profile.
To display the Ramp Soak Edit screen, follow these steps:
1. Click Edit/View Profile to display the Select File window, shown
earlier in Figure 5-12, from which you can select a profile to edit or
view.
2. Select the file name for the profile you want to edit or view, or type
in a non-existent file name to create a new profile with default values.
3. Click OK to display the Ramp Soak Edit screen for that profile.
The following section tells you how to use the Ramp Soak Edit screen to
edit profiles.
Editing Profiles
Figure 5-16 shows the Ramp Soak Edit screen. Using this screen—and
other screens and windows that you access from it, you can modify the
profile view displayed on the screen; define segment information—
including triggers and events—for the segments in a profile; and define
a profile’s ready state. When you are done using the Ramp Soak Edit
screen, click Save to save your changes and return to the Ramp Soak
Assignment screen.
5-12 AnaWin User’s Guide
FIGURE 5-16
The top portion of the Ramp Soak Edit screen displays the profile
view—a graphical view of the selected profile, showing time on the
horizontal axis and process setpoint on the vertical axis. Use the
following controls to modify the profile view:
Spin: Use the buttons in the Spin panel to r otate the profile gro up Left
or Right. These buttons do not work if Show Segs is selected.
Ramp Soak Edit Screen
Page 53

Setting Channel Parameters
Show Segs: Select Show Segs to display the segment boundaries of the
profile. You can display up to 20 segments.
Segs Displayed: Use the First and Last fields in the Segs Displayed
panel to specify which segments you want to view.
The bottom portion of the Ramp Soak Edit screen displays a table of
information and editable parameters for the running segments in the
profile. Use the scroll bar at the bo ttom of the screen to scroll through
the segments. Refer to “Defining Segment Information,” below, for
details about using the segment table.
Defining Segment Information
Each column in the table at the bottom of the Ramp Soak Edit screen
represents a segment. The rows display the following:
Segment #: The Segment # row displays th e segment numb er. This is a
read-only field.
Name: Use the Name row to enter a name for the segment.
Seg Time: Use the Seg Time row to enter a time (duration) for the
segment. Segment time is unitless —it depends on how the ramp/soak
time base field is set in the controller at the time the profile is run. The
time base is either hours:minutes or minutes:seconds.
Total T i m e : The Total Time ro w displays the cumulative time for all
the segments up to the edited segment. This is a read-only field.
Setpoint: Use the Setpoint row to enter the setpoint you want at the end
of the segment.
Tolerance: Use the To le r an c e row to enter the segment setpoint’s
tolerance. If the difference between the PV and the setpoint is greater
than the tolerance, the loop goes into tolerance wait state until the PV is
back within setpoint tolerance. If you do not want to set a tolerance for
the segment, enter 0 in this field.
AnaWin User’s Guide 5-13
Page 54

Setting Channel Parameters
Trigger (#1 and #2): You can define up to two triggers per segment.
Click Trigger #1 or Trigger #2 to display the Trigger window for that
trigger. Figure 5-17 shows a sample Trigger window.
FIGURE 5-17
To define a trigger, follow these steps:
1. Use the options in the State panel to specify whether the trigger is
2. Use the Input Number pull-down list box to select the input number
3. Click Save to sav e the trig ger and return to the Ramp Soak Edit
Event (#1, #2, #3, and #4): You can define up to four events per
segment. An event is a digital output. Click Event #1, Event #2, Event
#3 or Event #2 to display the Event window for that event. Figure 5-18
shows a sample Event window.
Trigger Window
latched or unlatched and whether or not the trigger must be on.
•
Select Latched to define a latched trigger. Deselect Latched
to define an unlatched trigger. A latched trigger, once it
becomes active, is not checked again for the duration of the
segment. An unlatched trigger is checked continuously during the segment.
•
Select Must be ON if you want to requir e a di g ital input to be
on. Deselect Must be ON to require a digital input to be off.
for which you want to set the trigger. Select NONE for no trigger
condition.
screen. A notation repr esenting the trigger you de fined now app ears
in the Trigger row. For example, the notation
1-ON-U
indicates a
trigger for input number 1 that is on and unlatched.
5-14 AnaWin User’s Guide
FIGURE 5-18
Event Window
Page 55

Setting Channel Parameters
To define an event, follow these steps:
1. Use the Output ON check box—in the State panel—to specify
whether the digital output is on or off. Select Output ON to set the
digital output to On. Deselect Output ON to set the digital output to
Off.
2. Use the Output Number pull-down list box to select the output
number you wish to toggle at the end of the segment you are editing.
3. Click Save to save the even t and return to the Ramp Soak Edit
screen. A notation representing the event you defined now appears
in the Event row. For example, the notation
an event will turn output 16 on.
16-ON
indicates that
Defining Profile Ready States
Click the Ready button in the upper left corner of the Ramp Soak
Edit screen to display the Ramp Soak Ready State screen, shown in
Figure 5-19. From this screen you can define the profile’s ready state—
the setpoint and event outputs you want before the profile starts (i.e.
before the timer starts ticking). When you are done defining the ready
state, click the Segment Editor button to return to the Ramp Soak Edit
screen.
FIGURE 5-19
The Ramp Soak Ready State screen includes a three-dimensional profile
view and the following controls that allow you to define the profile’s
ready state:
Ready Setpoint: Use the Ready Setpoint field to enter the setpoint you
want before the profile starts.
Number of repeat cycles: Use the Number of Repeat Cycles field to
enter the number of cycles (1 to 99) that you want the profile to repeat
automatically. For continuous cycling, enter 0.
Ramp Soak Ready State Screen
AnaWin User’s Guide 5-15
Page 56

Setting Channel Parameters
Displayed Precision: Use the Displayed Precision field to set the
number of decimal places for setpoints in a profile that will be run on a
channel with input type set to linear. Channels with TC inputs always
use a precision of -1.
Last Segment: Use the Last Segment field to enter th e number of the
last segment that will be executed in the profile.
Tolerance Time-Out Period: Use the Tolerance Time-Out Period field
to enter the length of the tolerance time-out. If the PV is out of tolerance
for longer than the amount of time you specify, an alarm occurs.
Digital Output States: Use the Digital Output States pull-down list
boxes to set the event output (ON or OFF) that you want for each dig ital
output before the profile starts.
5-16 AnaWin User’s Guide
Page 57

Managing Recipes
6
This chapter explains how to use the options on the
manage all recipes. A recipe is a set of operating conditions for a
process that can be stored on the co mputer hard disk and tr ansmitted to
the controller.
Recipe management allows you to create and store complete sets of
operating parameters appropriate for each of the processes you run or
tasks you perform. Comments saved with each recipe help you ensure
the correct recipe is used each time. You can also schedule recipes to
download automatically according to a schedule to set up using the
calendar download feature.
Using the options on the
rename and delete existing recipes; download a recipe to the controller;
and set up the program to do wnload recipes automatically o n a daily or
hourly basis.
The
New
•
Open
•
Save
•
Save As
•
Remove
•
Download
•
menu includes the following options:
Recipe
menu, you can create new recipes; save,
Recipe
Recipe
menu to
Calendar
•
AnaWin User’s Guide 6-1
Page 58

Managing Recipes
NOTE
If you have enable d channe l groupi ng, you will c hoose a group to
work with immediately after selecting
Download
tained for each group.
from the
Recipe
menu. Separate sets of recipes are m ain-
New, Open, Remove
New
New
Select
this screen, you can create new recipes based on an existing recipe.
When you select
the current controller values.
to display the Recipe Editor screen, shown in Figu re 6-1. From
New
, the grid on the Recipe Editor screen is filled with
, or
FIGURE 6-1
Recipe Editor Screen
Recipe Spread Sheet
The Recipe Editor screen includes a spread sheet that allows you to
create a recipe. The parameters in the spreadsheet vary, depending on
the controller. Refer to your controller manual for information about the
various parameters.
To create a recipe using the spreadsheet, enter the desired operating
parameters by double-clicking a cell with a numeric value and typing a
new value or by using the pull-down selection boxes. Use the scroll bars
to access parameters (columns) and channels (rows) beyond the borders
of the Recipe Editor screen. You can also use the normal Windows
editing keys: cut (Ctrl-X), copy (Ctrl-C), and paste (Ctrl-V).
NOTE
Editing recipe parameters has no effect on the controller(s) until the
recipe is downloaded.
6-2 AnaWin User’s Guide
Page 59

Open
Managing Recipes
Print
Click Print to print the Recipe Editor screen to the current printer or to a
file.
Enable Floppy Backup
Select Enable Floppy Backup to save a copy of the recipe files to drive
a: when the recipe is saved.
When you select Open, the Select Recipe screen, shown in Figure 6-2
appears. The File Name field contains recipe names, and the Comment
field displays the comment or note associated with the recipe you
highlight by clicking the file name.
Save
Save As
FIGURE 6-2
Select Recipe Screen
Click on the file name of the recipe you want to open, then click OK to
open it.
Select Save to save changes to the open recipe. Note that saving a recipe
does not download the parameters to t he controller; rather, it saves the
recipe to the hard drive. Select Download from the Recipe menu to
download a recipe to the controller.
Select Save As to save the parameters of the open recipe under a
different name.
Use this command to create new recipes based on existing ones.
AnaWin User’s Guide 6-3
Page 60

Managing Recipes
When you select Save As, the Save Recipe As screen, shown in Figure 6-3,
appears. Enter the new recipe name in the File Name field and your
comments in the Comment field.
Remove
Download
Calendar
FIGURE 6-3
Save Recipe As Screen
Select Remove to display the Select Recipe screen, shown earlier in
Figure 6-2.
Click on the file name of the recipe you w ant to remove, then click OK
to delete the recipe from your computer’s hard disk.
Select Download to send a recipe to the controller(s).
When you select Download, the Select Recipe screen, shown earlier in
Figure 6-2, appears.
Select the file name of the recipe you wish to download, then click OK
to download the recipe to the controller.
Select Calendar to set up a calendar start. When you select Calendar,
the Calendar Events screen, shown in Figure 6-4, appears.
6-4 AnaWin User’s Guide
Page 61

Managing Recipes
Recipe Start
Monthly Calendar
Scheduled Recipes
FIGURE 6-4
Recipe
Start
Calendar Events Screen
The Calendar Events screen allows you to schedule the computer to
download recipes to the controller(s) automatically. Use this feature to
download different recipes for different shifts or products. The
following subsections describe the major features of this screen.
The Recipe start section is the heart of the Calendar Events screen. It is
here that you will set up the calendar start.
Recipe Start Time
Use the Recipe Start Time panel to define the start time, either by
entering a certain time in the field or by clicking the Now button. Set the
recipe start time to be the time you want the computer to automatically
download a recipe to the controller(s). You should schedule the
download enough in advance to ensure that your processes can stabilize
at the new setpoints.
Recipe Start Date
Use the Recipe Start Date panel to select the date(s) on which you want
the recipe to be downloaded. You can set the recipe to load once, or
every day, every weekend day, every weekday, or on specific days of
the month.
Recipe Name
Select a recipe in the Recipe Name field, then use the Add, Delete, and
Modify buttons to add/delete download events to/from the schedule and to
change the time, date, or recipe to be downloaded for a scheduled event.
AnaWin User’s Guide 6-5
Page 62

Managing Recipes
Add. Click Add to add the selected event to the schedule.
Delete. Click Delete to remove the selected event from the schedule.
Modify. Click Modify to change or edit the selected event.
Monthly Calendar
Use the Monthly Calendar together with t he Sche duled Recipes panel to
show what recipes are scheduled to download for the selected calendar
day.
Scheduled Recipes
The Scheduled Recipes panel displays a list of all the scheduled recipe
downloads for the day selected on the Monthly Calendar.
For each event, you see the time it is scheduled to download, the group,
the recipe name, and the date of the last attempt to download it.
Select a day on the Monthly Calendar to display the scheduled
downloads for that date.
The following symbols apply to scheduled recipes.
*: Indicates that the recipe in the row is scheduled to download next.
S: Indicates that a recipe downloaded successfully.
U: Indicates that a recipe was not downloaded successfully. An
unsuccessful download can be caused by a number of reasons; see the
event log to find the specific cause.
Suspend Calendar Events
If you need to suspend all calendar events—to perform maintenance, for
example—select the Suspend Calendar Events check box. AnaWin will
not perform any scheduled downloads if this option is selected.
Downloads scheduled for a time during which calendar events are
suspended are skipped. AnaWin does not make any attempt to
download, and the Last Attempt field remains blan k. When yo u clear the
Suspend Calendar Events check box, skipped downloads are not
performed, but future downloading resumes .
6-6 AnaWin User’s Guide
Page 63

Using the Trend
Plot Screen
7
Trend Plot
This chapter explains how to use the options on the
display and customize the Trend Plot screen—a graphical rep resentation
of process data. You can view both historical and real-time data on the
Trend Plot screen.
The Trend Plot menu includes the following options:
Trend Plot
•
Trend Plot Settings
•
Trend Plot Storage
•
Select
Trend Plot
screen. Figure 7-1 shows a sample Tr end Plot screen.
from the
Trend Plot
menu to display the Trend Plot
Tren d P lot
menu to
AnaWin User’s Guide 7-1
Page 64

Using the Trend Plot Screen
Trend Plot
Plot Legend
Trend Plot
Adjust
Buttons
Time and Process Variable Values
at Pointer (Mouse) position
FIGURE 7-1
Trend Plot Screen
Trend Plot Screen Features
The following subsections describe the major features of the Trend Plot
screen.
Plot Legend
The plot legend provides a key relating the colors and symbols used on
the trend plots to the data sets they represent. AnaWin allows you to
plot—and display legends for—up to nine data sets on the Trend Plot
screen. You set up the data sets on the Plot Setup screen. Refer to
“Trend Plot Settings,” later in this chapter, for details.
Trend Plot
The trend plot consists of a curve depicting each data set. Each curve
represents the process variable, setpoint, or output variable for a
channel. You select the data to be graphed on the Plot Setup screen. You
can display up to nine data sets. Refer to “Trend Plot Settings,” later in
this chapter, for details.
Trend Plot Adjust
Scroll Bars
7-2 AnaWin User’s Guide
Trend Plot Adjust Buttons
The buttons in the upper right corner of the Trend Plot screen allow you
to adjust the vertical axis of the trend plot. Controls along the bottom of
the screen allow you to adjust the horizontal axis of the trend plot.
Page 65

Using the Trend Plot Screen
Last
Click Last to return to the last scaling values for either the vertical or
horizontal axis.
Scale
Click Scale to automatically scale the vertical axis of the plot so it
displays the full range of data on the screen. Set the maximum attainable
resolution that enables all data to appear on the graph.
Now
Click Now to display current data on the trend plot.
Trend Plot Adjust Scroll Bars
Use the scroll bars on the horizontal and vertical axes to move the trend
plot and adjust its resolution.
Move
The Trend Plot screen includes two Move scroll bars: one on the
horizontal axis and one on the vertical axis.
•
Use the Move scroll bar on the horizontal axis to move the trend plot
window . The Left arrow moves t he window backward in time. The
Right arrow moves the window forward in time.
•
Use the Move scroll bar on the vertical axis to move the trend plot
through the range of input, in engineering units. The Up arrow shifts
the data up. The Down arrow shifts the data down.
Res (resolution)
The Trend Plot screen includes two Res (resolution) scroll bars: one on
the horizontal axis and one on the vertical axis.
•
Use the Res scroll bar on the horizontal axis to adjust the time frame
displayed in the trend plot. The Left (-) arrow zooms out to show a
longer length of time on the trend plot. The Right (+) arrow zooms in
to show a shorter amount of time on the plot, thereby provi di ng
greater detail.
•
Use the Res scroll bar on the vertical axis to increase or decrease the
resolution of the trend plot. The Up (+) arrow increases the resolution
of the plot and decreases the width of the plot’s scale. The Down (-)
arrow decreases the resolution of the plot and increases the width of
the plot’s scale.
AnaWin User’s Guide 7-3
Page 66

Using the Trend Plot Screen
Extra Button
Click Extra to display the Trend Extras window, shown in Figure 7-2.
FIGURE 7-2
Trend Extras Window
Use the fields and buttons in the Trend Extras window to set slope,
threshold, profile recording, and profile recall controls. When you are
done, click OK to save your changes and ret ur n to the Trend Plot screen.
Slope Controls
The following slope controls allow you to set a time window for
determining the slope and specify whether or not you want to display
the boundaries used for the slope calculation on the graph. You define
the slope boundaries in one of two ways:
•
Define the centerpoint of the slope boundaries by clic king a poi nt on
the point on the trend plot with the left mouse button.
•
Define the actual left and right boundaries by holding down the Shift
key and clicking the left mouse button and then the right mouse bu tton.
Slope time window: Use the Slope time window field to set a time
window (in seconds) for determini ng t he slop e. Thi s op tio n appli es only
if you define the centerpoint of the slope boundaries by left-clicking on
the trend plot.
Units list box: Use the Units pull-down list box to select the tim e units
for the slope calculation: engineering units/second or engineering units/
minute.
7-4 AnaWin User’s Guide
Bars: Select Bars to display the slope boundaries on the graph. De select
Bars to not display the slope boundaries on the graph.
Page 67

Using the Trend Plot Screen
Threshold Controls
Use the following threshold controls to set up to three thresho ld levels.
Compute Now: Click Compute Now to compute the duration (in
seconds) above the threshold values and the peak temperature. Both
calculations apply only to data displayed on the graph.
Display on Graph: Select Display on Graph to display the threshold
levels on the trend plot. Deselect Display on Graph for n o display of
threshold levels.
Threshold (#1, #2, #3): Use the Threshold fields to enter up to three
threshold values.
Profile Recording Controls
Use the following profile recording controls to define a profile—a
subset of plot data defined by when you start and stop recording.
Profiles are useful for oven performance comparisons.
Start: Click Start to start the profile recording.
Stop: Click Stop to stop the profile recording.
Offsets: Click Offsets to display the Reference Loop Setup window,
shown in Figure 7-3. Use this window to set up the offsets of reference
loops to be used for profile recording.
For example, consider a case in which T/C sensors are attached to a
board moving through a reflow oven. Offsets refer to the sensor
locations on a PCB relative to an arbitrary zero position.
When you are done setting reference loops, click OK to save your
settings and return to the Trend Extras window.
FIGURE 7-3
Reference Loop Setup Window
AnaWin User’s Guide 7-5
Page 68

Using the Trend Plot Screen
The top portion of the Reference Loop Setup screen displays a table of
sensor location offsets for each of the channels. Use the scroll bars to
scroll through the table. To change an offset value, type over the value
listed and press Enter. To select a channel, click on its name in the left
column of the table. You can then use the Special Loop and Velocity
Units pull-down list boxes, as described below, to set up a reference
loop for that channel.
Special Loop: Use the Special Loop pull-down list box to select the
reference loop. In the example earlier in this section, the Special Loop
would be the loop controlling the belt speed.
Velocity Units: Use the Velocity Units pull-down list box to select the
velocity units for the reference loop. In the example earlier in this
section, the Velocity Units would refer to the velocity of the belt.
Profile Recall Controls
Use the following profile recall controls to recall selected channels for
up to two profiles.
FIGURE 7-4
Start: Click Start to display recorded profiles on the graph.
Stop: Click Stop to remove profiles from the graph.
Use distance for horizontal axis: Select Use distance for horizontal
axis to convert the time scaling of the horizontal axis.
Display Real Time Data: Select Display Real Time Data to display
current data along with reference profile data.
Chans: Click Chans to display the Select Profile Channels to View
window, shown in Figure 7-4.
Profile Channels to View Window
Use the Profile Channels to View window to select the profile channels
to be displayed. When you are done selecting channels, click OK to
return to the Trend Extras window.
7-6 AnaWin User’s Guide
Number of channels: Use the Number of channels field to enter to
number of profile channels you want to be displayed.
Page 69

Using the Trend Plot Screen
Profile data sets: Use the Profile data sets field to set the channel name
for each data set.
Channel selection: Use the Channel selection pull-down list box to
select the profile channels you want to be displayed. The channels you
select are listed in the Profile Channels to be displayed list.
Profile Channels to be displayed: The Profile Channels to be
displayed field lists the profile channels that have been selected for
display.
Select Prof 1: Click Select Prof 1 to display the Select File screen, from
which you can select the first profile file you want to recall.
Select Prof 2: Click Select Prof 2 to display the Select File screen, from
which you can select the second profile file you want to recall.
Slope Spreadsheet
Toolbar
FIGURE 7-5
To display the slope spreadsheet, click with the right mouse button
anywhere on the trend plot (graph). Figure 7-5 shows a representative
Trend Plot screen displaying the slope spreadsheet.
Slope Spreadsheet
Trend Plot Screen with Slope Spreadsheet Displayed
The slope spreadsheet provides a table of slope information for each
channel. Slopes are computed and displayed only for data sets depicting
process variables (not setpoints or output variables). Each column in the
table corresponds to a channel. Use the scroll bar to scroll through the
following rows of data.
AnaWin User’s Guide 7-7
Page 70

Using the Trend Plot Screen
Slope: The Slope row lists the slope at the point where you clicked on
the trend plot on the Trend Plot screen.
Left Value: The Left Value row lists the time and process variable value
of the left hand point used for the slope calculation.
Right Value: The Right Value row lists the time and process variable
value of the right hand point used for the slope calculation.
Keep slopes displayed: Click Keep slopes displayed to keep the slope
spreadsheet displayed on the Trend Plot screen when you use the scroll
bars.
Toolbar
The Trend Plot screen toolbar, shown in Figure 7-6, allows you to
access property pages from which you can specify setup parameters for
trend plots. The toolbar appears above the trend plot graph when the
Display Tool Bar option is selected on the Trend Plot Settings screen.
Titles
FIGURE 7-6
Axis
Fonts
Markers
Trends
System
Background
Help
Trend Plot Screen Toolbar
Some icons in the toolbar are not used by AnaWin and are grayed-out.
The following subsections describe the available icons. To return to the
Trend Plot screen from a property page, click OK.
Titles
Click the Titles icon to display the Titles property page, shown in
Figure 7-7, on this page you can enter text titles for y our graph. You can
place titles at the top, bottom, left or right of the graph.
7-8 AnaWin User’s Guide
FIGURE 7-7
Titles Property Page
Page 71

Using the Trend Plot Screen
Titles can be up to 80 characters long. When you enter text for a title,
the Graph Control adjusts the rest of the trend plot to provide space—
either by redrawing the graph and its associated objects at a smaller size
or by decreasing the space between objects. When you delete the text
from a title field, you disable the title and provide more space for the
rest of the graph. If you enter a title that is too long to appear in a single
line, the Graph Control automatically wraps it to appear on two lines.
NOTE
In some cases, a title may not display at all—even though it does
not exceed the 80 character limit. This is because the Graph Control
cannot make the font small enough to fit all t he text in the space
provided. In these cases, simply enter a shorter title.
Graph Title: Use the Graph Title field to enter text for the top title.
This title appears centered at the top of the trend plot.
Bottom Title: Use the Bottom Title field to enter text for the bottom
title. This title appears centered at the bottom of the graphing wind ow.
A bottom title frequently explains the X-axis.
Left Title: Use the Left Title field to enter text for the left title. The left
title frequently explains the Y axis.
Right Title: Use the Right Title field to enter text for the right title. The
right title frequently explains the right-hand Y axis when you have an
overlay graph.
Axis
Click the Axis icon to display the Axis property page, shown in Figure 7-8.
This page allows you to customize the X and Y-axes of a graph. You
can also enable grid lines for the graph.
AnaWin User’s Guide 7-9
Page 72

Using the Trend Plot Screen
FIGURE 7-8
Axis Property Page
Apply to Axis: Select an option from the Apply to Axis panel to specify
the axis to which you want your settings to apply: X, Y Primary, or
Y Overlay. The Y Overlay axis is used for the o utput variables, which
are read on the right-hand vertical axis.
Position: The options in the position panel vary according to the axis
selected in the Apply to Axis panel. You cannot set the position options
for the Y overlay axis because that axis is always drawn at the right and
bottom right respectively.
•
Variable (default): When X is selected in the Apply to Axis panel,
select Variable to draw the X-axis intersecting the Y origin, either at
the top, bottom, or middle of the graph. When Y Primary is selec ted in
the Apply to Axis panel, select Va r ia b l e to draw the primary Y axis
intersecting the X origin, either at the left, right, or middle of the
graph.
•
Top or Left: When X is selected in the Apply to Axis panel, select To p
to draw the X-axis at the top of the gr aph, regardless o f the location of
the Y origin. When Y Primary is selected in the Apply to Axis panel,
select left to draw the primary Y axis at the left edge of the graph,
regardless of the location of the X origin.
•
Bottom or Right: When X is selected in the Apply to Axis panel,
select Bottom to draw the X axis at the bottom of the graph, regardless
of the location of the Y origin. When Y Primary is selected in the
Apply to Axis panel, select Right to draw the primary Y axis at the
right edge of the graph, regardless of the location of the X origin.
7-10 AnaWin User’s Guide
Color of Axes (default is automatic black or white): Use the Color of
Axes pull-down list box, to choose a color for axes from the current
color palette. The same color is applied to all axes. The default color is
automatically black or white, whichever provides more contr ast. Use the
System property page, as described under “System” later in this chapter,
to choose a new color palette.
Page 73

Using the Trend Plot Screen
Scale: The options in the Scale panel are always the same for X and Y
graphs, though the default setting and the effects of each option vary.
•
Zero Origin (default for all X and Y graphs except time series):
Select Zero Origin to draw the axis including the origin (zero) and
extending far enough in the positive and negative directions to include
all of the graph's values.
•
Variable Origin: Select Variable Origin to have the axis “zoom in” on
the range of the graph's actual values, whether or not that range
includes zero. For the X axis, this option diff ers from Auto only if you
specify X values for data points.
•
User-Defined (default for time series graphs): Select User-Defined
to set your own values for the minimum, maximum, and number of
ticks for the axis. When you select User-Defined, the settings in the
Range panel are enabled.
Range: The options in the Range panel are enabled only if you select
User-Defined in the Scale panel. The effect of each setting depends on
the nature of the data.
•
Max: The Max setting is generally the maximum point of the axis,
with the following exceptions:
•
If you have a positive Max with a negative Min, the Graph
Control may adjust the maximum or minimum point so that
it lies on a tick.
•
For X axes without specific X values, the Max setting is
ignored. The maximum point of the axis is equal to the number of points or sets you are graphing.
•
Min: The Min setting is generally the minimum point of the axis, with
the following exceptions:
•
If you have a positive Max with a negative Min, the Graph
Control may adjust the maximum or minimum point so that
it lies on a tick.
•
For X axes without specific X values, the Min setting is
ignored. The minimum point of the axis is always 0.
•
Ticks: The Ticks setting determines the number of ticks along the
selected axis. (Note that ticks are distinct from tick marks, see “Tick
Marks,” later in this section for details about tick marks.) The effect
depends on the axis and the nature of your data.
•
For Y axes and X axes with specific X values the Ticks set-
ting specifies the number of ticks from the origin to the setting of either Max or Min, whichever has the higher
magnitude (distance from 0). For example, if you set Min to 50 and Max to 20, Ticks applies to the axis segment between
0 and -50.
•
To determine the Ticks value you want to set, divide the
length of the axis (or axis segment) by the desired interval
AnaWin User’s Guide 7-11
Page 74

Using the Trend Plot Screen
between ticks. For the axis segment 0 to -50 we've just
described (whose length is 50 units), if you want to place
ticks 25 units apart, set Ticks to 2. Both the maximum and
minimum points of an axis must fall on a tick. If you have a
negative Min with a positive Max, the Graph Control may
have to move the minimum or maximum point to make this
happen. In our example axis, ticks would be placed at -50,
-25, 0, and 25, overriding the Max setting of 20.
Labels: The options in the Labels panel allow you to enable labels for
axes, choose the orientation (horizontal or vertical) for labels, and set
the interval at which labels appear.
•
Show (default is on): Select Show to show l abels along t he axis. Dese-
lect Show for no labels. The Graph Control allows both t ext labels and
numeric labels. If you do not use text labels, the Graph Cont rol automatically generates numeric labels.
•
Vertical (available for X axis only; default is off): Select Ve r tical to
display X labels vertically (rotated 90 degrees counterclockwise).
Deselect Ve r ti c a l for horizontal labels. The Vertical option is normally
used with text labels. It lets you use a larger font for labels because
you do not need as much space horizontally .
•
Every (available for X axis only; default is 1): Use the Every field to
determine the frequency with which labels are displayed. A setting of
1 places a label at every tick along the X axis, a setting of 2 places a
label at every other tick (beginning with the origin), and so on. If you
have defined text labels for the X axis, these labels are displayed in the
order of the X Labels. The Graph Control doesn't “skip” any o f th e
label strings.
Tick Marks: The options in the Tick Marks panel allow you to enable
or disable tick marks, set the frequency with which those marks are
displayed, and enable or disable minor tick marks.
•
Show (available for X and Y Primary axes only; default is on):
Select Show to draw tick marks along the axis. Deselect Show for no
tick marks. If you have a Y Overlay axis, your Show setting for Y Primary also applies to Y Overlay. Either both axes have tick marks or
both do not.
•
Minor (available for X, Y Primary, and Y Overlay axes; default is
off): Select Minor to draw five “minor” tick marks between s tan dard
tick marks.
Every (available for X axis with zero or variable origin only;
•
default is 1)
: If you select Zero Origin or Variable Origin in
the Scale group, you can use the Every setting to specify the
frequency with which tick marks are displayed along the X
axis. An Every setting of 1 places a mark at each tick, a setting
of 2 places a mark at every other tick, and so on. The X axis
must end with a tick mark. If you set an Every value that does
not include the last value on the axis, the Graph Control will
7-12 AnaWin User’s Guide
Page 75

Using the Trend Plot Screen
extend the axis so that it ends on a tick mark. This setting does
not apply when you have set independent positional values.
The options in the grids panel allow you to enable g rid lines for
Grids:
the X or Y axis and set their style and color.
•
Show (available for X and Y Primary axes only; default is off)
Select
each tick mark. Deselect
•
Line Style (default is solid
choose a style for grid lines. The same style i s applied t o both X and Y
grids.
•
Color (default is automatic black or white)
down list box to choose a color for grids from the current palette. The
same color is applied to both X and Y grids. The default color is automatically black or white, whichever provides more contrast. Use the
System property page, as described under “System,” la ter in this chapter, to choose a dif ferent col or palette.
to draw grid lines perpendicular to the axis, intersecting
Show
for no grid lines.
Show
): Use the
Line Style
pull-down list box to
: Use the
Color
:
pull-
FIGURE 7-9
Fonts
Click the
Figure 7-9 . This page lets you set the typeface and its style and size for
your graphs titles, labels, and legend.
Fonts Propert y Page
Apply To (Fonts
text to which you want to apply a font, style, and size.
Type fa ce
and the style in which to display it.
icon to display the Fonts property page shown in
Fonts
): Select an option in the Apply To panel to specify the
: Use the Options in the Typeface panel to select a typeface
: Use the options in the Size panel to select a size for the text.
Size
AnaWin User’s Guide 7-13
Page 76

Using the Trend Plot Screen
Markers
Click the Markers icon to display the Markers property page, shown in
Figure 7-10. From this page, you can customize the markers bars, and
high-low-close symbols, on your graph. The various options let you set
the color of markers, choose patterns for fills and lines, and select
symbols and their size. Some options are only available for certain
graph types.
FIGURE 7-10
Click to Select a Point or Set: When you move the mouse pointer over
the graph drawing at the upper left of the Markers page, the pointer
becomes a large arrow. Point and click on the graph marker to which
you want to apply settings.
Apply to: The Apply to panel lists the set or point number of the graph
object you have selected in the graph drawing, as described above.
•
•
Reset All: Click Reset All to return all settings in the Markers pro perty
page to their default values.
Color (default is automatic color selection): Use the Color pull-down
list box to choose a color for the selected marker from the current
palette. Use the System property page to choose a palette, as described
under “System,” later in this chapter.
Markers Property Page
Set: For all graph types except pie, bubble, and bar graphs having one
data set, a Set number is shown. Your settings apply to a particular
data set.
Point: For pie charts, bubble graphs, and bar graphs having one data
set, a Point number is shown. Your settings apply to a particular data
point.
7-14 AnaWin User’s Guide
By default, the Graph Control assigns an automatic series of colors to
markers, chosen for variety. If you override this default by setting your
own color for one marker, you have to set colors for the remaining
markers as well; otherwise, they will be shown in black.
Page 77

Using the Trend Plot Screen
Pattern (default is solid): Use the Pattern p ull-dow n list box to choo se
a pattern for the selected marker. If you do not choose one, the marker
appears in a solid color.
Symbol (default is automatic symbol): Use the Symbol pull-down list
box to choose one of 14 symbol options.
By default, the Graph Control assigns an automatic series of symbols to
data sets, chosen for variety. If you override this default by setting your
own symbol for one set, you have to set symbols for any remaining sets
as well; otherwise, they will all default to the first available symbol (+).
Size: Use the Size scroll bar to set the size for symbols, based on a
default of 100 arbitrary units. Each click to the left decreases the symbol
size by 5 units (to a minimum of 10), and each click to the right
increases it by 5 units (to a maximum of 1000).
Lines: Use the options in the lines panel to specify the pattern and
thickness for the lines on the trend plot.
•
Thick (default is on): Select Thick to enable thick lines, which are
three pixels thick by default. Deselect Thick for thin lin e s, which are
one pixel thick.
•
You can use the pull-down list box to choose a line thickness
of one to five pixels (overriding the default three pixels).
This setting applies to all lines in the graph. You cannot set
your own thickness for high-low-close or open-high-lowclose markers, which are always three pixels thick when
Thick is on.
Patterned (default is off): Select Patterned to enable patterned lines,
then, use the pull-down list box to choose a pattern for each line.
Trends
Click the Trends icon to display the Trends property page, shown in
Figure 7-11. This page allows you to enable statistical lines and curve
fitting for the graph types that support these options.
AnaWin User’s Guide 7-15
Page 78

Using the Trend Plot Screen
FIGURE 7-11
Statistical Lines: Use the options in the Statistical Lines panel to enable
one or more types of statistical lines. You can also set the color of
statistical lines.
If you have enabled an overlay graph, your settings for statistical lines
are applied to it. This may p roduce two sets of statistical lines on the
same axis, depending on your primary graph type.
•
•
•
•
•
Trends Property Page
Mean (default is off): Select Mean to enable a mean line, which is
drawn horizontally through the average value of all data points. Deselect Mean for no mean line. The Mean option applies to scatter, line,
high-low-close and open-high-low-close, candlestick, and box-whisker (parametric data only) graphs. If you have enabled an overlay
graph, your settings for statistical lines are applied to it.
Min/Max (default is off): Select Min/Max to enable min and max
lines, which are drawn horizontally through the lowe st and hi ghes t
data points in a set. Deselect Min/Max for no mi n and max li nes. The
Min/Max option applies to scatter , l ine, high -low-clos e and openhigh-low-close, candlestick, and box-whisker (parametric data only)
graphs. If you have enabled an overl ay graph, yo ur setti ngs for statistical lines are applied to it.
Std Deviation (default is off): Select Std Deviation to enable a pair of
standard deviation lines, which are drawn horizontally through the
standard deviation from the mean (in both the positive and negative
directions). Deselect StD Deviation for no standard deviation lines. If
you have enabled an overlay graph, your settings for statisti cal lines
are applied to it.
Best Fit (default is off): Select Best Fit to enable a best fit line, which
is a straight line indicating the trend of data points (a first-order polynomial curve). Deselect Best Fit for no best fit line.
Color (default): Use the Color pull-down list boxes to choose colors
for statistical lines from the selected color palette. By default, statistical lines are drawn in the same color as the data sets they apply to. If
you choose a color, it is appli ed to th at type of li ne (mean, min/max,
standard deviation, or best fit) for all data sets. Use the System property page to choose a color palette, as described under “System,” later
in this chapter.
7-16 AnaWin User’s Guide
Page 79

Using the Trend Plot Screen
Curve Fit: Use the options in the Curve Fit panel to enable curve
fitting. Yo u can also set color, type, order, and granularity of curves.
If you have enabled an overlay graph, your curve settings are applied to
it.
•
On (default is off): Select On if you want to fit a curve through your
data points. Deselect On for no curve. If you have enabled an overlay
graph, your curve settings are applied to it.
•
Color (default is same color as data set): Use the Color pull-down
list box, to choose a color for the curve from the selected color pal ette.
By default, curves are drawn in the same color as the data sets they
apply to. If you choose a color, it is app lied to t he curves for all data
sets. Use the System property page to choose a color palette, as
described under “System,” later in this chapter.
•
Curve Type (default is Variable-Order Polynomial): Use the Curve
Type pull-down list box to choos e a curve type f rom the Graph Con-
trol's 13 available options:
•
Variable-Order Polynomial Polynomi al curve o f
variable order
•
Logarithmic y = a + b * log(x)
•
Exponential 1 y = a * exp(b * x)
•
Exponential 2 y = a * x * exp(b * x)
•
Power y = a * (x ^ b)
•
Inverse 1 y = a + b / x
•
Inverse 2 y = a / (b + x)
•
Inverse 3 y = 1 / (a + b * x)
•
Inverse 4 y = x / (a * x + b)
•
Inverse 5 y = 1 / (a + b * x) ^ 2
•
Spline fit through all points
•
Moving Average Mid moving average plotted at midpoint
of averaged group
•
Moving Average End moving average plotted at end
point of averaged group
•
Order (default is 2): The Order field applies only to three curve types:
For variable-order polynomial curves, Order is the order of the
polynomial used in curve fitting. A setting of 1 produces a straight line
(the same as a best-fit line); a setting one less than the number of points
produces a curve that passes through every point.
AnaWin User’s Guide 7-17
Page 80

Using the Trend Plot Screen
For moving-average mid and moving-average end curves, Order is the
range of data points over which moving averages are averaged,
beginning with the first point.
•
Granularity: Use the Granularity scroll bar to set th e granul arity of
all curve types except moving-average. The granularity is the number
of “steps,” or straight line segments, making up the curve. Higher values create smoother curves, but require more drawing time.
•
The default Granularity setting is 50 curve steps, which generally creates a smooth-looking curve at a high drawing
speed. Each click to the left decr eases th e nu mber o f st eps b y
2 (to a minimum of 10), and each click to the right increases
the number of steps by 2 (to a maximum of 1000). With
spline curves, you generally need higher granularity than
normal--up to 10 times the number of points in the graph.
Background
Click the Background icon to display the Background property page,
shown in Figure 7-12. This page handles a variety of tasks. You can use
it to set the background color of the graphing window, apply styles and
colors to different graph objects, set the position of a graphs legend, and
add a bitmap background to the graphing window.
7-18 AnaWin User’s Guide
FIGURE 7-12
Apply To: Use the options in the Apply To panel to select the graph
object to which you want to apply styles and colors: Graph Title
(default), Bottom Title, Left Title, Right Title, Legend, or Graph
(including the graph itself and its axes).
Style: Use the options in the panel to set the text color, background
color, and styling options for the selected graph object.
Legend: Use the options in the Legend panel to set the parameters for
the graphs legend.
Graph Window: Use the options in the Graph Window panel to assign
a color or backdrop file to the graph window.
Background Property Page
Page 81

Using the Trend Plot Screen
•
Background Color (default is light gray): Use the Background
Color pull-down list box to choose a background color for the graph-
ing window from the current color palette. Use the System property
page to choose a color palette, as described under “System, ” later in
this Chapter.
•
Backdrop (default is None): Use the Backdrop pull-down list box to
choose a type of graphic image (bitmap, metafile or none) to use for
the backdrop of the graphing window. You can also choose how the
image is displayed—centered, tiled, or stretched.
•
File: Use the File field to enter the filename for the graph's backdrop
image. If you do not include a p ath to t he file as part of this string, the
Graph Control searches the current directory. The appro priate file
extension (.BMP or.WMF) is added automatically, according to your
selection in the Backdrop list box.
•
Browse: Click Browse if you want to call up a standard Win dows
Open dialog to locate a backdrop file.
System
Click the System icon to display the System property page, shown in
Figure 7-13. This page allows you to set printing parameters, export a
copy of the trend plot, and choose a color palette.
FIGURE 7-13
Printing: Use the options in the Printing panel to set print parameters
and print a plot. To plot data other than the defaults, configure each data
set individually, as described below.
•
•
•
System Property Page
Border (default is off): Select Border to include a border around the
graphing window when you print it. Deselect Border for no border .
Mono (default): Select Mono to print in monochrome, with a white
background and black objects. The Graph Control supplies varyi ng
patterns, symbols, and line thicknesses to dif ferenti ate data se ts and
points from each other.
Color: Select Color to print in color or grayscale. The graphing win-
dow is printed as it appears on the screen.
AnaWin User’s Guide 7-19
Page 82

Using the Trend Plot Screen
Print Trend Plot: Click Print Trend Plot to print the trend plot
(graphing window) on the current printer.
Color Palette: Use the Palette pull-down list box in t he Color Palette
panel to choose a color palette.
Export: Use the op tions in the Export panel to copy an image of the
trend plot to disk or the clipboard.
Trend Plot Settings
Select Trend Plot Settings to display the Plot Setup screen, shown in
Figure 7-14. This screen allows you to set up the parameters to be
plotted. You can display up to nine trends or data sets.
Data Sets
FIGURE 7-14
The data sets parameters, shown in Figure 7-15, refer to a specific plot
entry. For instance, a data set could be the Process Variable (PV) for
Controller 1, Channel 3. Up to nine data sets can be displayed on the
plot at one time. You must set up each data set individually.
FIGURE 7-15
Plot Setup Screen
Data Sets Parameters
7-20 AnaWin User’s Guide
Page 83

Graphing Limits
Using the Trend Plot Screen
Number of Data Sets Displayed
Use the Number of Data Sets Displayed field to define the number of
data sets that appear on the plot. Once you enter a number in this field,
the defaults for those data sets appear in th e pull -down list box es belo w
the Data Set to View field. To plot data other than the defaults, configu re
each data set individually, as described below.
Data Set to View
Use the Data Set to View field and the associated list boxes to configure
each of the data sets. For each data set specify a controller, a channel,
and a variable to plot: Process Variable (PV), Setpoint (SP), Output 1
Percent (OV1), or Output 2 Percent (OV2).
Use the graphing limits parameters, shown in Figure 7-16, to set the
high and low graph limits for the trend plot. These limits provide a
window through which to view the plot. Set the limits with all the p lot
variables in mind. If data is outside the high or low graph limits, it will
not be visible on the screen, although you can use the Scale button to
automatically scale the vertical axis when viewing the plot.
FIGURE 7-16
Time Range
FIGURE 7-17
Trend Plot Storage
Graphing Limits Parameters
Use the time range parameters, shown in Figure 7-17, to set a beginning
and end time frame for trend plotting. All references are in 24-hour
time.
Time Range Parameters
Select Trend Plot Storage to display the Data Storage settings s creen,
shown in Figure 7-18. This screen provides information and parameters
related to storing plot data files.
AnaWin User’s Guide 7-21
Page 84

Using the Trend Plot Screen
FIGURE 7-18
Data Storage Settings Screen
Disk Space Analysis
AnaWin examines your hard drive and displays the amount of disk
space available for data storage and how many days of data can be
collected based on current hard disk space for current recording rate.
Recording Rate
Use the Recording Rate field to specify how frequently data is collected
for defining data points on the plot screen. The number of seconds you
enter here will directly affect how much disk space is required. For
instance, one day of data saved at a recording rate of 5 seconds requires
twice as much disk space as it would at a recording rate of 10 seconds.
Maximum Days Stored on Disk
Use the Maximum Days Stored on Disk field to set the number of days
of historical data collected for plotting. AnaWin does not maintain trend
plot data indefinitely, but you can save data for any number of days
allowed (as determined by available disk space). The available disk
space will also be impacted by the recording rate, as described above.
7-22 AnaWin User’s Guide
NOTE
If you wish to preserve data indefinitely, you can export the data
using the Export Database option from the File menu. If you anticipate the need to store data for a long period of time, you can enable
the Data Logging feature by selecting Data Log Setup from the File
menu.
Page 85

Viewing Channels
8
Spreadsheet
This chapter explains how to use the options on the
different ways to mo ni tor s ys tem dat a. You can view data in sp reads heet
format or as a bar graph and view the digital I/O in real time or on
custom overview screens. The
options:
Spreadsheet
•
Bar Graph
•
Digital I/O
•
Custom Overview Screens
•
Overview Thumbnails
•
Select
Spreadsheet
Figure 8-1. This screen displays all channels in rows and columns. The
spreadsheet format allows you to easily view all channels at the same
time.
NOTE
If channel groups have been established, only the channels assi gned
to the selected group are displayed.
to view the Spreadsheet Overview screen, shown in
menu includes the following
View
menu to select
View
AnaWin User’s Guide 8-1
Page 86

Viewing Channels
FIGURE 8-1
Bar Graph Display
SpreadSheet Overview Screen
The Process Variable (PV) column displays system status, by color, for
each channel. The color designators are as follows:
Red = The process variable is outside the high process or low process
limits.
Yellow = The process va r iabl e is outs ide the hi gh or low deviatio n.
Green = The process variable is within deviation band.
Select Bar Graph Display to view channels as a series of small bar
graphs, as shown in Figure 8-2. The bar graphs are updated in real time
and indicate deviation from setpoi nt w it h color. If your system has more
than 96 loops, press the Page-Up and Page-Down keys to scroll through
all the loops.
To view the gauge display, double-click the six-channel group you wish
to view or press the associated hotkey letter on your keyboard.
Hotkeys
Controller Number
Gauge Display
8-2 AnaWin User’s Guide
FIGURE 8-2
Channel
Number
Bar Graph Display
The gauge display, shown in Figure 8-3, provides a more detailed view
of the bar graph. Up to six channels are displayed at a time. Press the
Page-Up and Page-Down keys t o see other channels.
Page 87

Channel Setup
Jump
Bar Graph
Control
Mode
Previous
Screen
Viewing Channels
Percent of Full Scale
FIGURE 8-3
Gauge Display
Channel Setup Jump
Click the Channel Setup Jump button to jump to the channel parameters
screen for the selected channel.
Bar Graph
Each gauge’s bar graph is centered on the setpoint of the corresponding
loop. The setpoint is indicated by the triangular symbol and highlighted
in blue. The level of the colored bar indicates the process variable value
graphically. The color of the bar indicates the value of the process
variable relative to the process alarm and deviation settings.
Control Mode
The Control Mode field displays the control mode for each loop: Auto,
Manual, or Tune .
Percent of Full Scale
Use the Percent of Full Scale field to set the scale displayed on the
gauges. Larger percentages produce gauges with less detail or
resolution. Smaller percentages produce gaug es with greater res olution.
Previous Screen
Click Previous Screen to return to the bar graph display.
AnaWin User’s Guide 8-3
Page 88

Viewing Channels
Editable Parameters
If you have enabled the Gauge Display Editable Parameters on the
Preferences screen, you can edit the following fields by double-clicking
them, typing the change, and pressing the Enter key.
•
Setpoint
•
Control Mode
•
Heat PID Output %
•
Cool PID Output %
You can set the Heat PID Output % and Cool PID Output % only when
the channel is in manual control mode.
Digital I/O
Select Digital I/O to display the Digital I/O screen, shown in Figure 8-4.
This screen allows you to view the controller’s digital inputs and
outputs.
Inputs
Outputs
8-4 AnaWin User’s Guide
FIGURE 8-4
Digital I/O Screen
Simulated LEDs show the status of the inputs. If an input is High
(green), it is at 5 volts. If the input is Low (red), it is at 0 Volts. Inputs
are read-only. You can test an input by shorting it to controller common
and watching the LED change on the screen. Inputs will read high when
not connected to anything and low when grounded to the controller
common.
You can set outputs manually to high or low. Any output that has been
previously assigned as a control output will not be selectable. For
instance, in the example shown in Figure 8-4, outputs 1 through 9 are
used as control outputs for the channels and cannot be toggled on the
screen.
Page 89

NOTE
To view output assignment, right-click on the output name on the
Digital I/O screen. A popup displays the assignment for the selected
output.
Overview Thumbnails
Viewing Channels
FIGURE 8-5
Select
screen shown in Figure 8-5.
The Overview Thumbnail screen displays small versions of saved
custom overview screens. Up to eight Thumbnails appear on the screen
at a time. Use the scroll bar to bring additional thumbnails into view.
T o go to th e as sociated cus tom overview screen from a thumbnail on the
Overview Thumbnail screen, click the thumbnail for the custom
overview you want to view, then click OK—or double-click the
thumbnail. Refer to “Using the View Manager,” in Chapter 10, for
details about assigning shortcuts to custom overview screens. A
thumbnail is created for every custom overview when the custom
overview is saved.
Overview Thumbnails
Overview Thumbnails Screen
to display the Overview Thumbnails
AnaWin User’s Guide 8-5
Page 90

Viewing Channels
Custom Overview Screens
Custom overviews appear on the View menu only if they have a shortcut
associated with them. Refer to the Chapter 10 for details about assigning
shortcuts to custom overvie w screens and informati on on how to create
custom overview screens. Figure 8-6 shows a sample custo m overview
screen.
FIGURE 8-6
Sample Custom Overview Screen
8-6 AnaWin User’s Guide
Page 91

Working with
Log Files
9
View (Logs)
This chapter explains how to use the options on the
print, copy, and remove log files related to system events. You can view
all events for a single day pertaining to User, Alarm, or System events.
Log files can be useful when you are troubleshoo ting a p rocess o r try ing
to determine what tasks have been accomplished after a shift change.
The
•
•
•
•
Files are listed sequentially by date. The log file name format is as
follows:
menu includes the following options:
Logs
View
Print
Copy to A:
Remove
menu to view,
Logs
AnaWin User’s Guide 9-1
Page 92

Working with Log Files
Select Vi ew to display the Log File Sel ection s creen, show n in Fi gu re 9- 1.
From this screen, you select the log file you want to view. Click on the
file you wish to view, then click OK to open the log file.
Log File
Time of Event Event Number Event Description
Log File
Time of Event
FIGURE 9-1
FIGURE 9-2
Log File Selection Screen
AnaWin displays all events that occurred on the selected date, as shown
in Figure 9-2.
Open Log File
Displays the file name for the selected log file.
Displays the time each event occurred.
Event Numbers
9-2 AnaWin User’s Guide
Event numbers are used in the log file to designate the type of event that
occurred. There are three event types: User Events, Alarm Events, and
System Events. Table 9-1 shows the number sequences for these events
Page 93

Working with Log Files
TABLE 9-1
Event Number Sequences
User Events (1000 to 1999) Events performed by the
user.
Alarm Events (2000 to 2999) Events causing an alarm.
System Events (0000 to 0999) Events performed by
system softwa re.
Tables 9-2, 9-3, and 9-4 list the events that are currently logged by
AnaWin:
TABLE 9-2
User Events
1000 Menu action
1001 Message box
TABLE 9-3
Alarm Events
2000 Channel alarm
2500 System alarm message box
TABLE 9-4
System Events
Event Description
0002 Program startup
0003 Program exit
0004 Recipe download attempt disabled by
I/O status
0005 Recipe download attempt has been
disabled by digital I/O
0006 Communications retry
0007 Communication has failed with con-
troller at address
0008 Calendar recipe download
0009 Error reading recipe: file
0010 Communications error—failure down-
loading
0011 Communication has been re-estab-
lished with controller at address
0012 OLE recipe downloaded
Gives a brief description of the event.
AnaWin User’s Guide 9-3
Page 94

Working with Log Files
Search
Click Search to perform a search in the selected AnaWin log file. You
can search for any key word or event number. Type in the word or
number for which you want to search in the Find What? field, then click
Find Next.
The search tool will immediately move to the first matching entry it
finds and highlight it. Continue searching by pressing Find Next. If no
entries are found, nothing is highlighted.
Select Print to print an open log file. Before the print feature is
available, you must first load a log file using the Vie w option as
described above. When you have opened a file Print becomes available
on the Logs menu. When you select Print, a print screen appears,
allowing you to send the print job to a designated printer.
Copy to A:
Remove (Logs)
Closing a Log
Select Copy to A: to display the Log File Selection screen shown earlier ,
in Figure 9-1. From this screen, you can select a log file, or several log
files to copy to a floppy disk.
From the log file list, click on the file(s) you wish to copy, then click
OK. AnaWin saves the selected log files to the floppy disk.
Select Remove to display the Log File Selection screen shown earlier, in
Figure 9-1. From this screen, you can select a log file, or several log
files, to remove from your hard drive.
From the log file list, click on the file(s) you wish to re move, then click
OK. AnaWin deletes the selected log files from the hard drive.
To close a log file, simply select another screen to view. For example, if
you select Spreadsheet from the Vi ew menu, the currently-displayed log
file is closed.
9-4 AnaWin User’s Guide
Page 95

Using the
Developer
10
This chapter explains how to use the options on the
create custom overview screens as a real-time interface to your system
and how to define user variables for use with your custom overview
screens.
Using the Developer Program
The Developer program allow s you t o tailor cu sto m overview s creens s o
data is laid out on the screen in a way that is most relevant fo r your
product or application. You can also add bitmap images and
backgrounds to make it clear to the operator how the displayed data
relates to the physical process being controlled. Figure 10-1 shows a
sample custom overview screen.
Developer
menu to
AnaWin User’s Guide 10-1
Page 96

Using the Developer
FIGURE 10-1
After you create a custom overview screen, you can select it from the
View menu or designate is as the primary user interface (the first custom
overview screen in the queue that loads when you start up AnaWin).
The Developer menu includes the following options:
•
•
Sample Custom Overview Screen
Design Custom Overview
User Variables
10-2 AnaWin User’s Guide
Page 97

Design Custom Overview
Select Design Custom Overview from the Developer menu to enter
design mode. A dialog box appears, informing you that alarms will be
received but not displayed in design mod e. Click Yes to co nti nue. A new
Custom View screen appears, as shown in Figure 10-2.
Using the Developer
FIGURE 10-2
Use the New View or Open View option from the File menu to create a
new custom overview screen or open an existing custom overview
screen for modification.
•
•
NOTE
You can save only up to 32 custom overviews. If you have 32
saved, you will need to delete one before you can save anot her cu stom overview.
Custom View Screen
Select New View from the File menu to open a blank Custom View
screen on which you can create a new custom overview screen.
Select Open View from the File menu to display the Overv iew
Thumbnails screen, shown in Figure 10-3, from which you can
select an existing custom overview screen to modify. Select the
desired custom overview screen by double-clicking its thumbnail or
by clicking its thumbnail, then clicking OK to open the corresponding Custom View screen.
AnaWin User’s Guide 10-3
Page 98

Using the Developer
FIGURE 10-3
When you are done creating your custom overview screen, as described
in the following sections, select Save from the File menu to save the
current file. AnaWin prompts you if you are overwriting another file of
the same name.
Select Delete from the File menu to display the Overview Thumbnails
screen, shown above in Figure 10-3, from which you can select a
custom overview screen to delete. Select the custom overview you want
to delete by double-clicking its thumbnail or by click ing its thumbnail,
then clicking OK to delete that file.
To exit design mode and return to normal operation, select Exit to
Normal Operation from the File menu.
Working with Screen Objects
Your custom overview screens can include any of the objects listed
below, which appear in the layers indicated. Anything contained in a
layer closer to the front covers anything in the layer(s) behind it.
Animations do destructive writes to the screen, so they are always in
front at runtime but not during design mode.
•
Selecting a Custom Overview
Form (back)
10-4 AnaWin User’s Guide
•
Label (front)
•
Field (front)
•
Digital I/O Text (front)
•
Digital I/O Image (middle)
•
Graphic (middle)
•
User Variable (front)
•
Animation (special)
•
Zoom (middle)
For objects in the same layer, the stacking order is first added on
bottom, last added on top.
Page 99

Using the Developer
Adding an Object
To add an object, click the corresponding add button at the top of the
screen, shown below in Figure 10-4. Then set the properties for that object
as described below under “Setting Object Properties.”
Add Label Add GraphicAdd Digital I/O Text Add Animation
Add Field Add User Vari ableAdd Digital I/O Ima ge Add Zoom
FIGURE 10-4
Deleting an Object
To delete an object, select the object by clicking on it, then press the
backspace key.
Copying an Object
To copy an object, select the object by clicking on it, then click the
corresponding add button. Note that some properties—such as
position—do not copy.
NOTE
Whenever you select an object, its type is displayed in the message
box at the bottom left of the screen.
Modifying an Object
To modify an object, select the object by clicking on it, then edit the
parameters as described below under “Setting Object Properties.”
Add Toolbar Buttons
Moving an Object
To move an object, hold the Shift key while clicking and dragging the
object.
•
If you are moving a single object, release the mouse button first, then
the Shift key when the object is in the desired position. This takes
you out of move mode.
•
If you are moving multiple objects, release the Shift key first, then
the mouse button. This keeps you in move mode, and you can then
click and drag additional objects. To get out of move mode, press
and release the Shift key.
AnaWin User’s Guide 10-5
Page 100

Using the Developer
NOTE
Whenever you select an object, its position, in pixels, is indicated in
the message box at the bottom left of the screen. Left [x] an d top [y]
indicate the position of the object’s top left corner relative to the top
left corner of the screen.
Sizing Objects
You can size all text objects (label, digital I/O text, field, and user
variable) directly by using the mouse and sizing handles which appear
on the selected object when it is in move mode. Click and drag the
handle corresponding to the dimension in which you want to increase or
decrease size.
NOTE
Whenever you select an object and keep the pointer (mouse) on i t,
the object’s size is indicated in the message box at the bottom left
of the screen. Width[x] and height [y] are the object’s width a nd
height, in pixels.
Setting Object Properties
When you add or select an object on the Custom View screen, a
Properties table for that type of object appears. Modify the settings to
specify properties for the selected object. To refresh the Properties
tables, select
subsections describe the Properties tables for each of the available
object types.
Refresh Toolbars
from the
Tools
menu. The following
Form Properties
To display the Form Properties table, shown in Figure 10-5, click
anywhere on the workspace. Use the Form Properties table to set
properties that pertain to the custom overview screen as a whole.
10-6 AnaWin User’s Guide
FIGURE 10-5
Form Properties Table
 Loading...