

Funktionen der CM2016 Logger Software V2.10:
Anzeige des gewählten Programms, des aktuellen Programmabschnitts, der Akkuchemie,
Zeit und die Ladeparameter wie z.B. Spannung und Ladestrom.
Aufzeichnung des Verlaufs von Spannung, Strom, Lade- und Entladekapazität, usw.
Grafische Darstellung der Verläufe von Spannung und Strom in Diagrammform
Druckfunktion für Messprotokolle
Speichern, Laden, Pausieren und Fortsetzen von Aufzeichnungen.
Export der aufgezeichneten Daten nach Excel inklusive der Erstellung von Spannungs- und
Stromdiagrammen (getestet mit Excel 2010).
Export der aufgezeichneten Daten als CSV-Datei (Comma Separated Values) zum Einlesen in
alle gängigen Tabellenkalkulationsprogramme.
Installation der CM2016-Logger-Software und des Treibers
Starten Sie die „CM2016_Setup.exe“ und folgen den Anweisungen des Installationsprogramms.
Die Setup-Software schlägt das Verzeichnis "CM2016 Datalogger" zur Installation vor und kopiert die
benötigten Dateien in das gewählte Verzeichnis. Das Installationsprogramm legt außerdem eine Programmgruppe "CM2016 Datalogger" unter "Programme" und eine Verknüpfung auf dem Desktop an.
Bevor Sie den Charge Manager 2016 mit dem Computer verbinden, installieren Sie unbedingt
zuerst die Treibersoftware ("Silicon Labs CP210x USB-UART Bridge") entsprechend den Anweisungen des Installationsprogramms.
Die aktuellste Treiberversion finden Sie unter
http://www.silabs.com/products/mcu/Pages/USBtoUARTBridgeVCPDrivers.aspx.
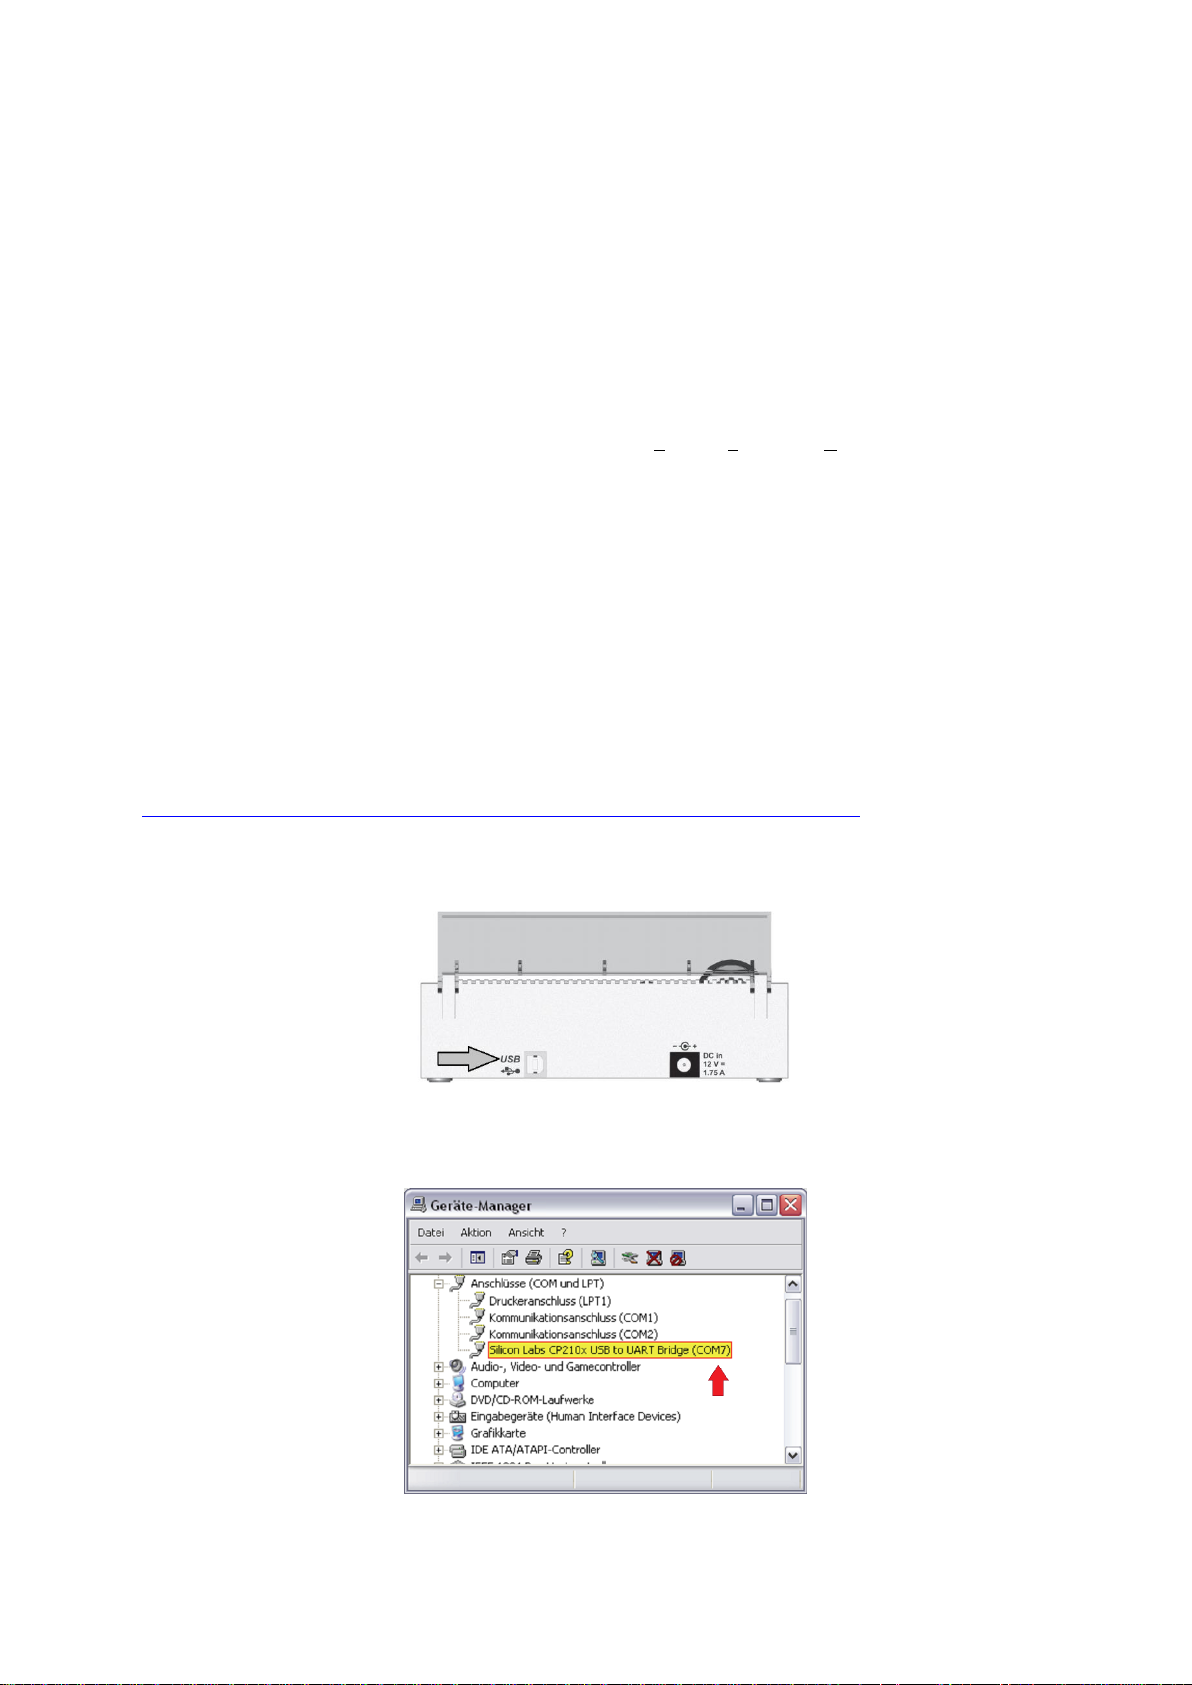
Anschließend verbinden Sie den CM2016 (geeignetes Anschlusskabel: USB-A auf USB-B, z.B. Conrad
Best.-Nr.: 972030) mit einem freien USB-Port Ihres Computers. Hierfür besitzt das Ladegerät eine
USB-Schnittstelle (USB-B-Buchse an der Rückseite des Geräts).
Beim ersten Anschluss an den Computer erkennt Windows die neue Hardware und schließt die
Treiberinstallation ab. In der Systemsteuerung von Windows unter Gerätemanager können Sie
kontrollieren, welcher COM-Port für den "CM2016" vergeben wurde. (z.B. "COM7", siehe folgende
Abbildung).
Nun ist die Installation der Software abgeschlossen.
Erste Schritte
Start bzw. Stop der
Daten-Aufzeichnung
Speichern und Laden von
und Programm beenden.
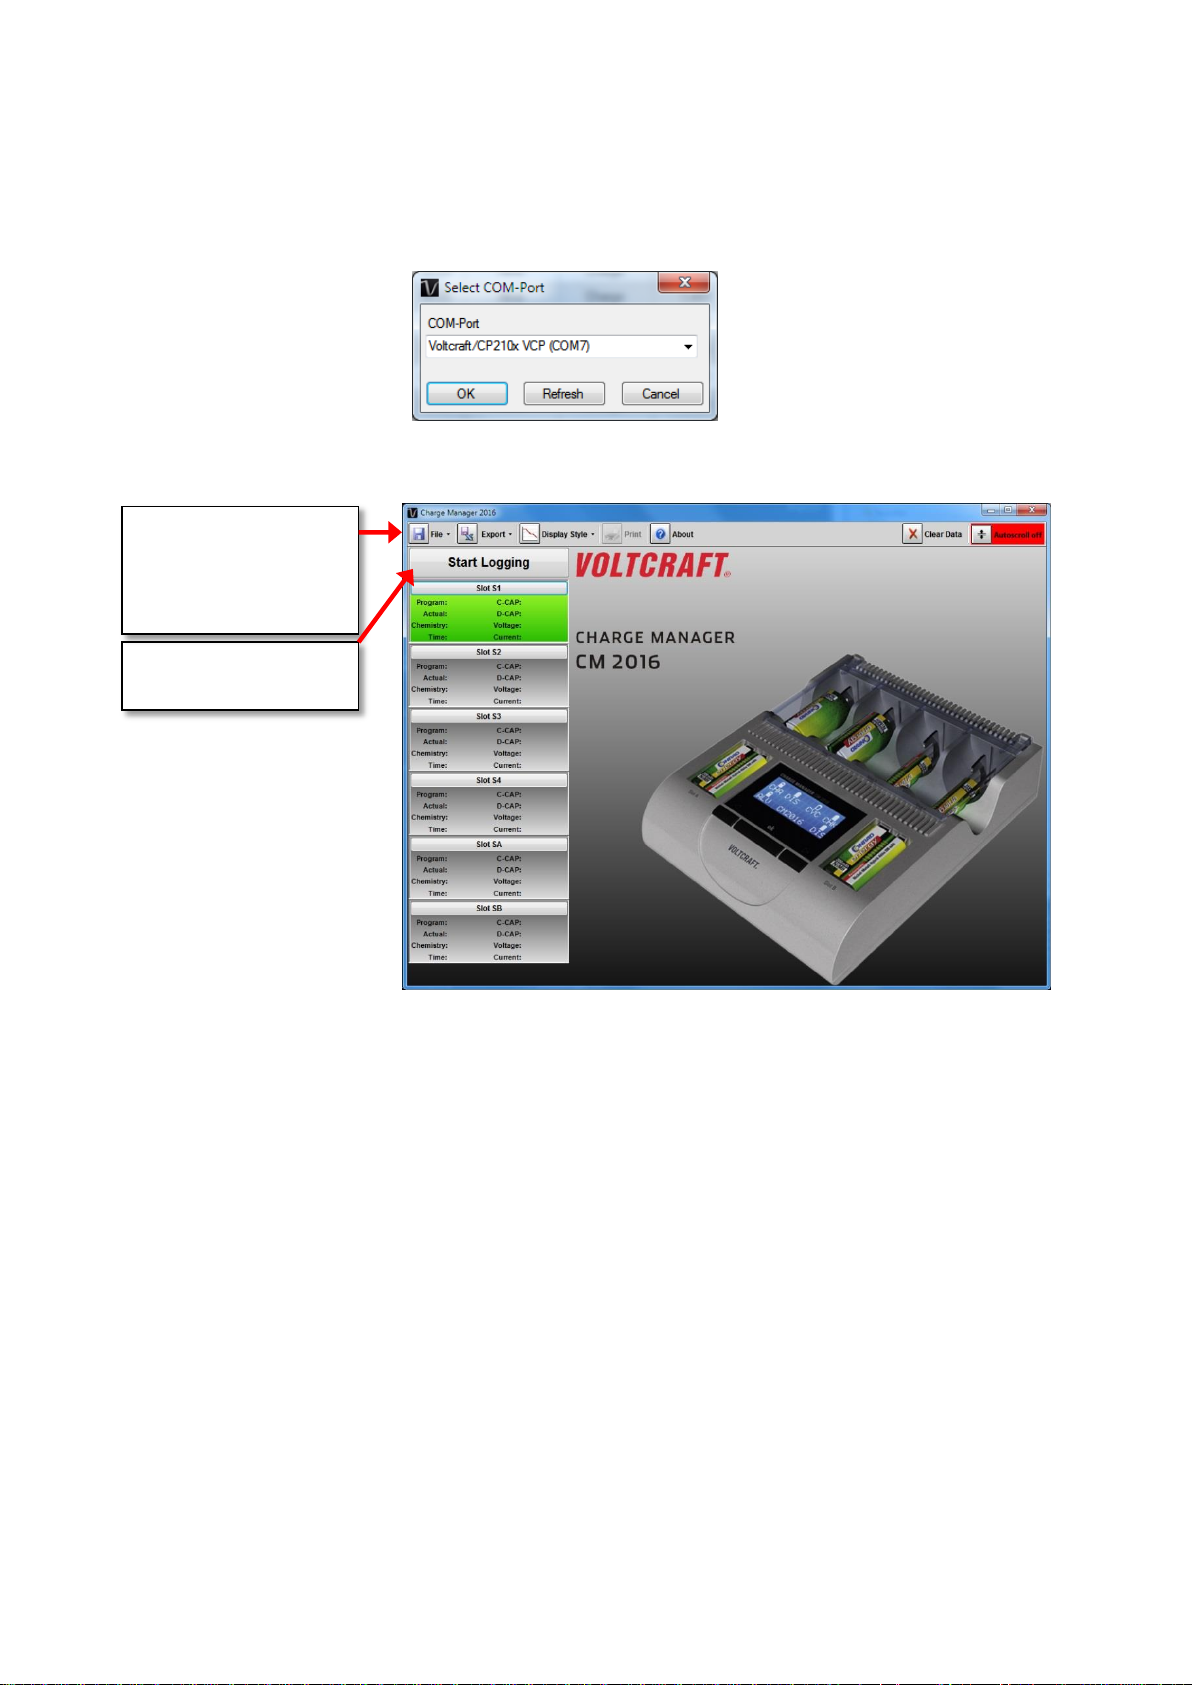
Beim ersten Start der Software ist die Auswahl des COM-Ports des CM2016 entsprechend dem
Eintrag im Gerätemanager (im vorliegenden Beispiel „COM7“) erforderlich.
Nach Bestätigen der Auswahl mit „OK“ erscheint das Hauptfenster der CM2016 Software.
Aufzeichnungen,
Auswahl des COM-Ports
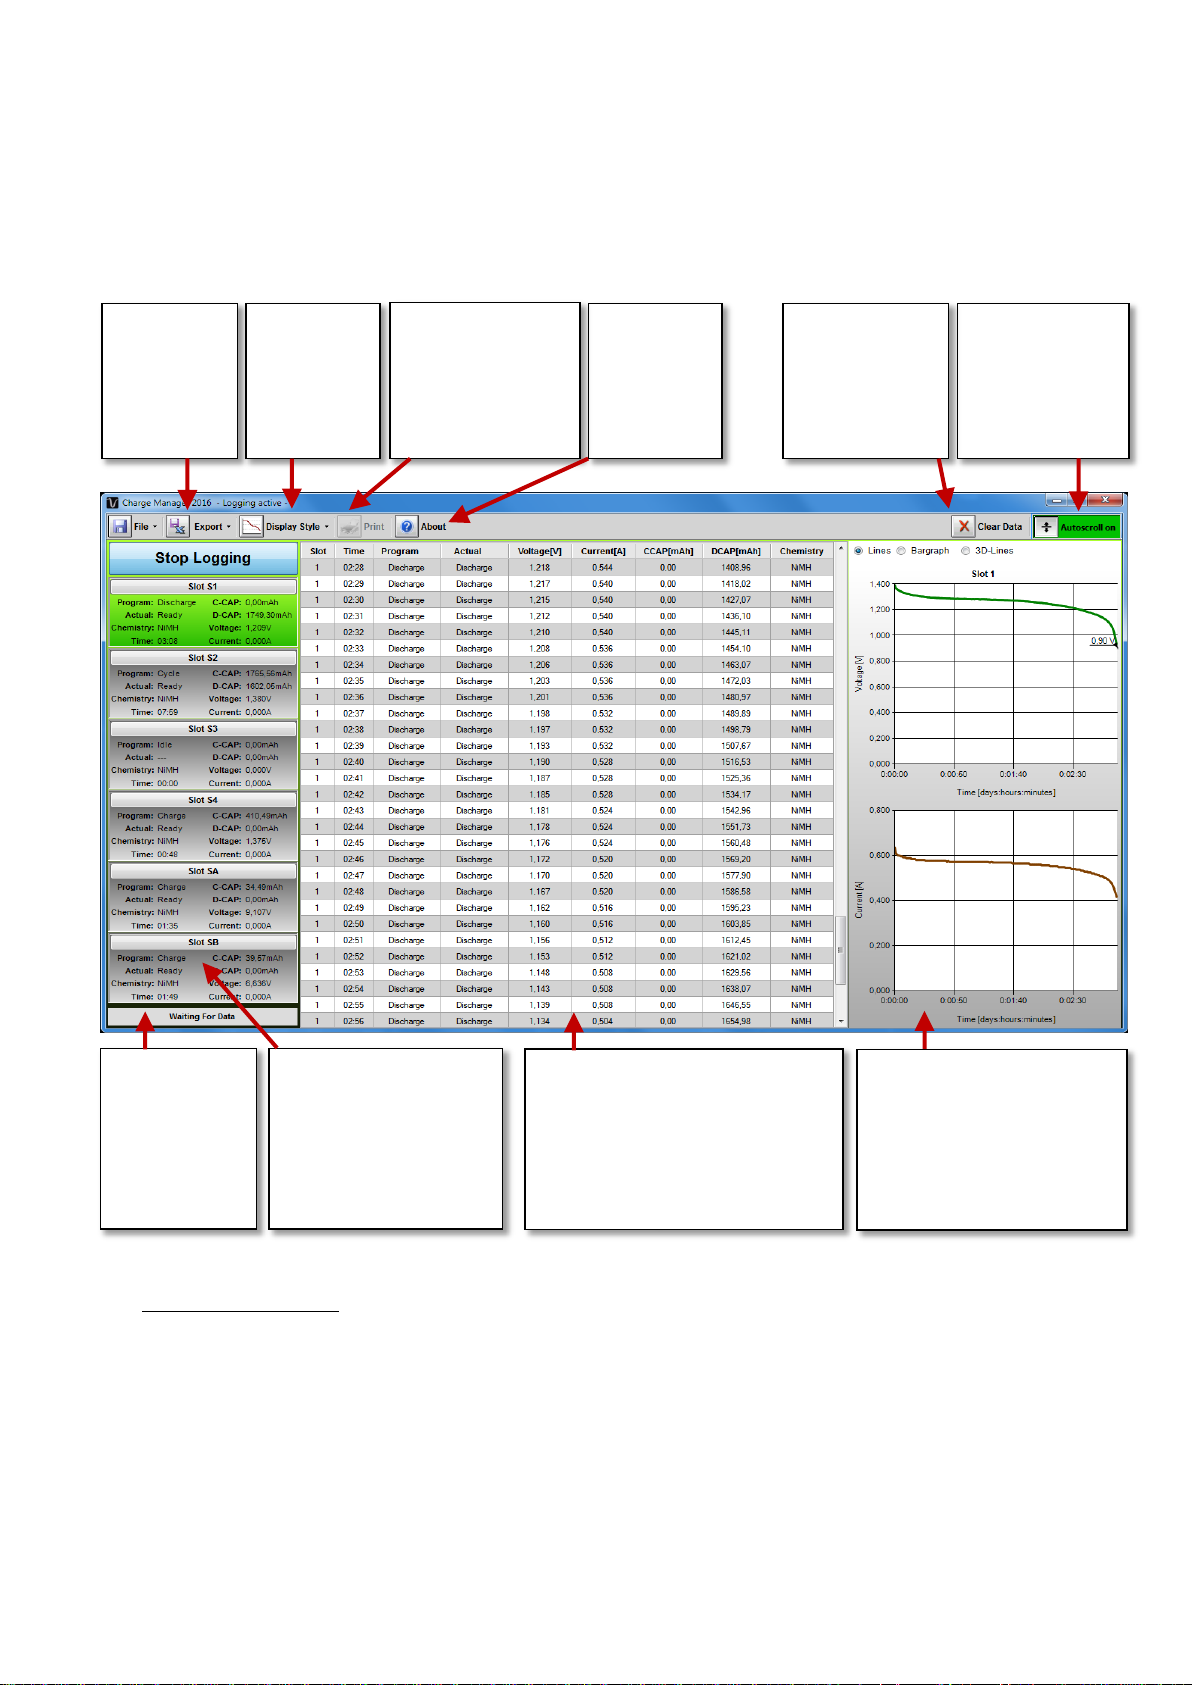
Durch Anklicken von „Start-Logging“ wird die Erfassung der Daten gestartet. Dabei muss das
Ladegerät in Betrieb sein, d.h. die Displaybeleuchtung des CM2016 ist eingeschaltet. Während der
Datenaufzeichnung wechselt die Hintergrundfarbe des gewählten Programmfensters von grau auf
grün.
Werden länger als zwei Sekunden keine Daten vom Ladegerät erfasst, weil z.B. die Verbindung zum
Gerät getrennt wurde, bricht das Programm automatisch die Datenaufzeichnung ab. Ein Fortsetzen
der Aufzeichnung ist möglich.
Anzeige der Parameter
ansicht ausgewählt.
Ist Autoscroll
angezeigt.
Löschen der
alle Schächte!)
Anzeige der
formationen
Anzeige der aufgezeichneten
Zwischenablage wird unterstützt.
Daten -
„CSV -Datei“
Anzeige für
Verläufe von Spannung und
Druckfunktion für
nicht möglich)
Wahl der
Ansicht
(Diagramme,
Tabelle oder
Beides)
Bedienung der Software
Ansicht während der Datenaufzeichnung:
Export nach
Excel bzw.
Messprotokoll.
(Währen der
Datenaufzeichnung
Programmversion und
weiterer In-
bisher aufgezeichneten
Werte (betrifft
aktiv, wird
automatisch der
letzte Messwert
den Datenempfang vom
Ladegerät
Allgemeine Hinweise:
Die aufgezeichneten Daten werden stets parallel zur Anzeige auch in temporären Dateien
zwischengespeichert. Sind bei Programmstart temporäre Daten vorhanden, bietet das
Programm an, die Aufzeichnung fortzusetzen.
Bei Entnahme einer Zelle während der Aufzeichnung werden die zugehörigen Werte
automatisch gelöscht. Dadurch wird die Integrität der Daten sichergestellt.
Die Exportfunktionen für „Excel“ und „.CSV“ beziehen sich nur auf den gerade gewählten
Ladeschacht.
der Ladeschächte. Durch
Anklicken der Ladeschachtanzeige wird die
zugehörige Tabellen-
Daten in Tabellenform. Das
Markieren von Zeilen und Übertragung der Daten in andere
Programme über die
Strom. Als Darstellungsmöglichkeiten sind Linienbzw. Balkendiagramm oder
3D-Linien wählbar.
Während der Datenaufzeichnung ist die Druckfunktion nicht verfügbar.
Die Diagramme werden ausgedruckt wie dargestellt. D.h. wurde ein Ausschnitt vergrößert, so
erfolgt die Ausgabe in dieser Ansicht. Das Einfügen einer Titelzeile mit Angabe der
Schachtnummer, Zeitdauer, Lade- und Entladekapazität erfolgt automatisch. Als Druckformat
empfiehlt sich DIN A4/A3, quer.
Das Abspeichern und Laden von Daten über „File“ -> „Load Logged Data“ bzw. „Save Logged
Data“ bezieht sich auf die Daten aller Schächte. Die temporären Dateien werden bei „Load“
überschrieben.
Das Programm stellt eine unterbrechungsfreie Datenerfassung sicher, indem es den
Energiesparmodus des Rechners während der Aufzeichnung deaktiviert.
Verwendung der Windows Zwischenablage
Neben den Export-Funktionen besteht des Weiteren die Möglichkeit die aufgezeichneten Daten über
die Windows Zwischenablage in beliebige Tabellenkalkulationsprogramme wie z.B. „LibreOffice /
OpenOffice“ zu exportieren.
Vorgehensweise:
1. Gewünschte Zeilen in der Tabelle markieren
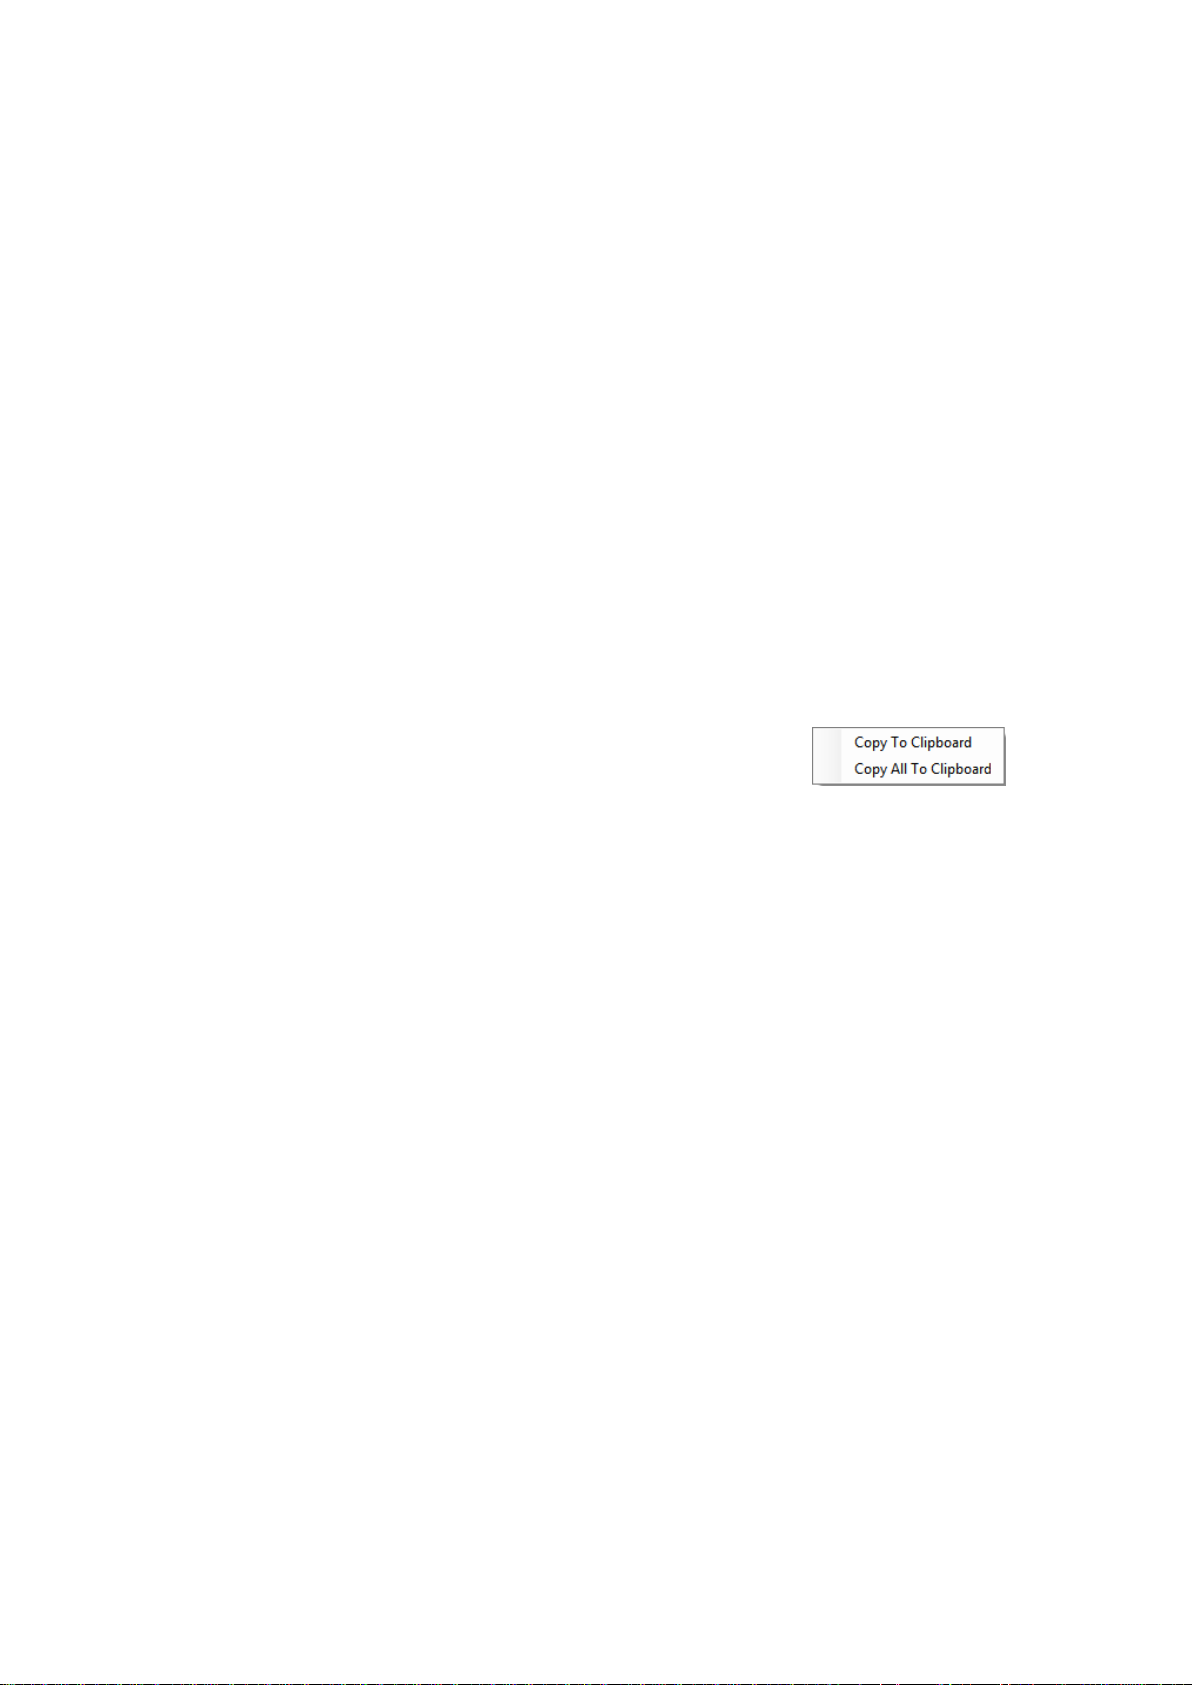
2. Bei Recktsklick in die Tabelle erscheint folgender Dialog:
Es wird mit „Copy To Clipboard“ der markierte Bereich, mit „Copy All...“ die gesamte aktive
Tabelle in die Zwischenablage kopiert.
Alternativ besteht auch die Möglichkeit markierte Daten per „STRG+C“ (Kopie) zu speichern.
3. Diese Daten können direkt mit „STRG+V“ (Einfügen) in die Zieltabelle übertragen werden.
Darstellungsmöglichkeiten
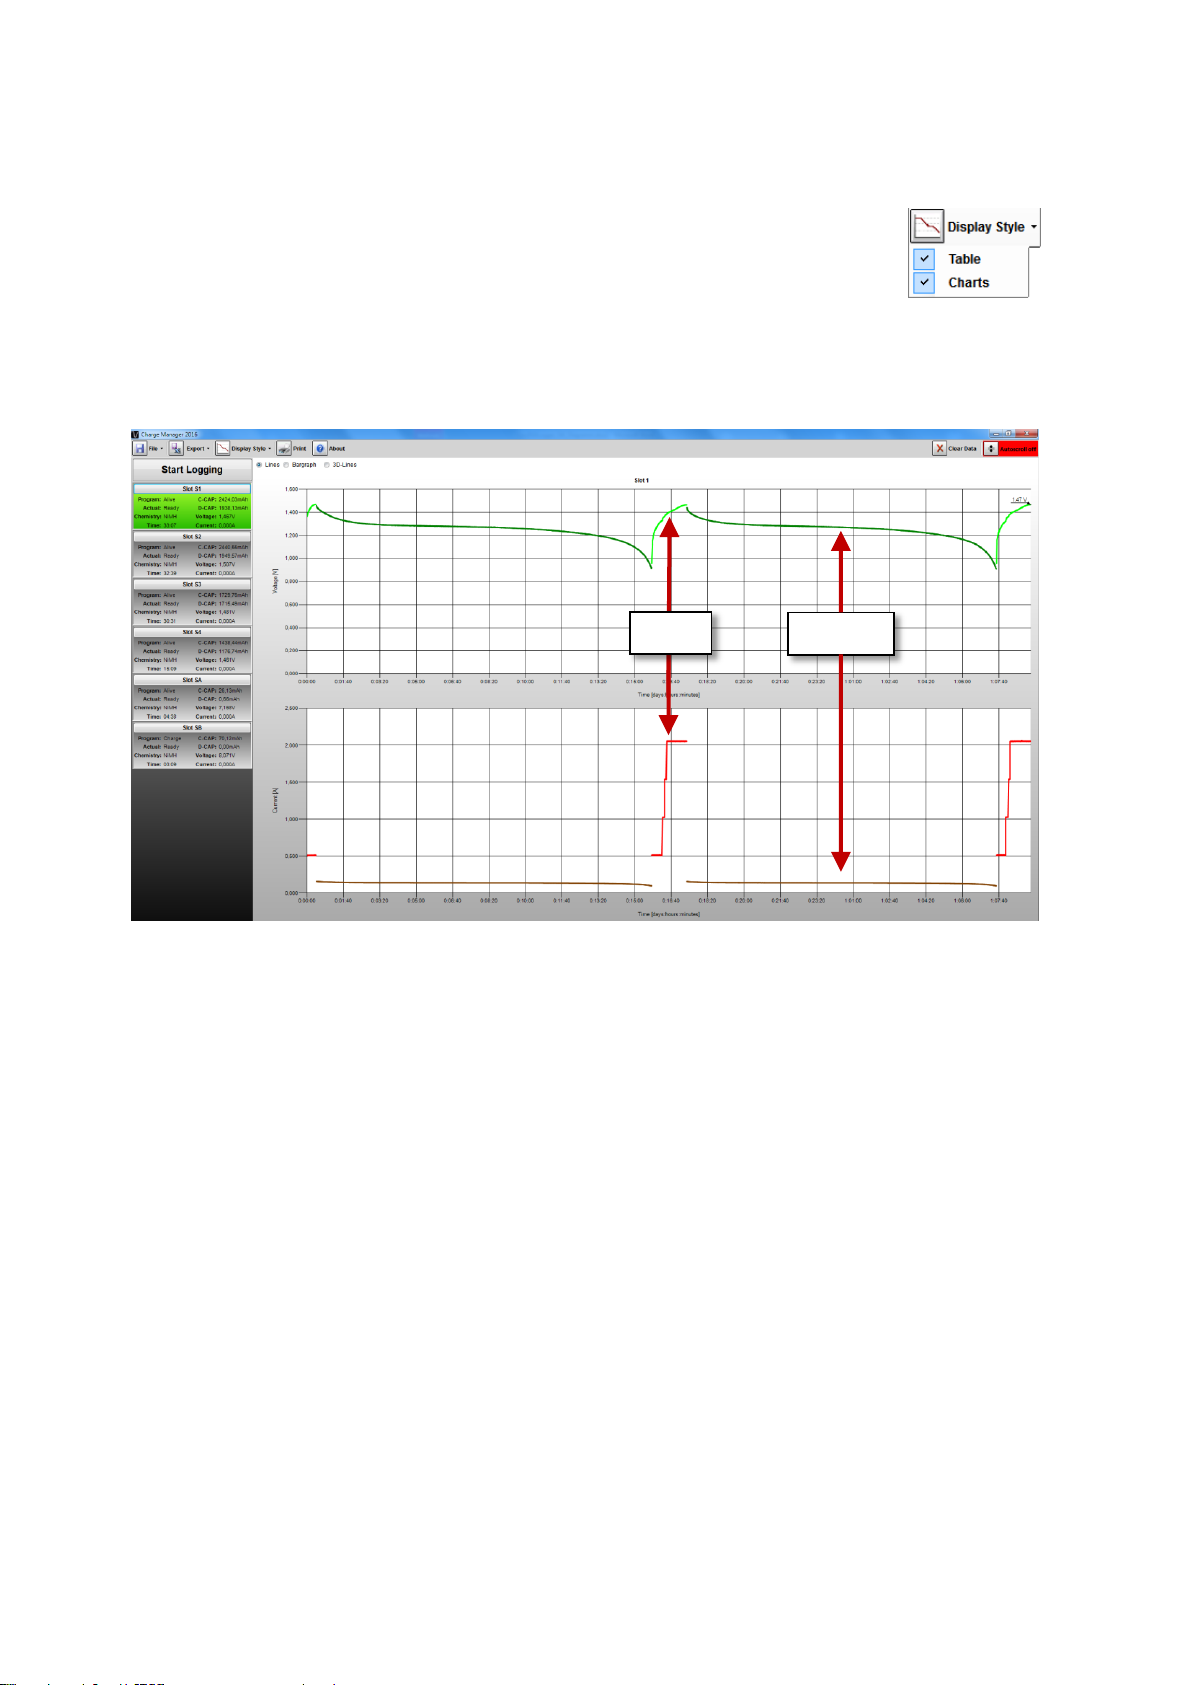
Entladen
Laden
Unter „Display Style“ trifft man die Auswahl der gewünschten Darstellung. Ist
„Table“ selektiert werden nur die Daten in Tabellenform angezeigt, bei der Wahl
von „Charts“ ist die Darstellung der Verläufe von Spannung und Strom in grafischer
Form aktiv. Es besteht die Möglichkeit der gleichzeitigen Darstellung beider
Varianten.
Beispiel: Darstellungsvariante „Charts“
Die Unterscheidung ob gerade geladen oder entladen erfolgt anhand der Farben. Grün und Rot
während den Ladephasen, Dunkelgrün und Dunkelrot während den Entladephasen. Fehlende
Datenpunkte (z.B. aufgrund von Aufzeichnungspausen) werden durch graue Punkte gekennzeichnet.
Am Ende des Programms wird zusätzlich im Diagramm die Schlussspannung angegeben.

Bedienung der Diagrammfunktion
Funktionen:
Drei Ansichten sind möglich: Linien-, Balkendiagramm und Linien in 3D-Perspektive
(Neigung „Tilt“ und Drehung „Rotation“ einstellbar).
Balkendiagramm 3D-Linien
Vergrößern auf bestimmte Bereiche „Zoom“ per Maus:
Linke Maustaste in der grafischen Anzeige gedrückt halten und einen Rahmen über den gewünschten
Bereich „aufziehen“. Nach Loslassen der Taste ist der ausgewählte Bereich vergrößert.
Alternativ:
- Rechtsklick im Bereich des Diagramms. Es erscheint folgendes Eingabefeld:
Mit „Zoom In“ vergrößert man jeweils um die Hälfte der Aufzeichnung.
„Reset Zoom“ führt zur Gesamtansicht.
- Abhängig von der Zeigerposition der Maus kann auch das Scrollrad zum „Zoomen“ genutzt
werden.

Verschieben der dargestellten Bereiche
Dies ist über die Cursortasten, oder den Bildlaufleisten an den Diagrammen möglich.
Weitere Steuerungsmöglichkeiten über die Tastatur sind:
„Pos1“ („Home“) Gesamtansicht wiederherstellen (wie „Reset Zoom“)
„Entf“ („Del“) Sprung zum Anfang der Aufzeichnung
„Ende“ („End“) Sprung zum Ende der Aufzeichnung
„Backspace“ Vergrößerung um eine Stufe rücksetzen
„Bild↑“ X-Achse in großen Schritten Richtung Ende
„Bild↓“ X-Achse in großen Schritten Richtung Anfang
Anzeige der Daten an der Mauszeiger-Position
Befindet sich der Mauszeiger auf einer der dargestellten Kurven, so erhält man durch Drücken der
rechten Maustaste die aktuellen Werte zu diesem Zeitpunkt.

Unterbrechen und Fortsetzen von Aufzeichnungen
1. Netzteil des Ladegerätes abstecken. Es erscheint folgende Meldung:
2. Die Software ist zu beenden.
3. Beim nächsten Programmstart bietet die Software an die Aufzeichnung fortzusetzen.
4. Sie können nun das Ladegerät wieder in Betrieb nehmen und anschließend mit „Ja“
bestätigen. Nun werden die zuletzt aufgezeichneten Daten geladen und die Aufzeichnung
automatisch fortgesetzt. Bei der Wahl von „Nein“ werden die Daten gelöscht.
Hinweis:
Sofern die Software nicht beendet wurde, ist nach Inbetriebnahme des CM2016 „Start Logging“
zu betätigen. Auch hierbei wird die Aufzeichnung fortgesetzt.
Systemvoraussetzungen
Windows ab XP
Ab .Net Framework V4.0 (Client Profile)
Auflösung min. 1024*768
Impressum
Diese Anleitung ist eine Publikation der Conrad Electronic SE, Klaus-Conrad-Str. 1, D-92240 Hirschau
(www.conrad.com). Alle Rechte einschließlich Übersetzung vorbehalten.
Reproduktion jeder Art, z. B. Fotokopie, Microverfilmung oder die Erfassung in elektronischen
Datenverarbeitungsanlagen, bedürfen der schriftlichen Genehmigung des Herausgebers. Nachdruck,
auch auszugsweise, verboten. Diese Anleitung entspricht dem technischen Stand bei Drucklegung.
Änderungen vorbehalten.
© Copyright 2013 by Voltcraft ®

Functions of the CM2016 Logging Software:
Display of the selected program, the actual program-step, chemistry of the battery, time and
actual charge parameters like voltage and current.
Recording of the progression of voltage, current, charge- and discharge capacity, etc.
Graphical display of voltage- and current-charts
Printing of measurement reports
Save, load, suspend and continue recordings.
Export recorded data to Excel including the creation of voltage and current-charts (tested
with Excel 2010).
Export of recorded data to CSV-Files (Comma Separated Values) to exchange with all
common spreadsheet applications.
Installation of the CM2016 Logging Software and driver
Start the „CM2016_Setup.exe“, and proceed according to the instructions of the installer.
The setup-software proposes "CM2016 Datalogger" as installation directory and copies all necessary
files into the selected directory. It will also create a folder "CM2016 Datalogger" within the startmenu and a shortcut at the desktop.
Before connecting the Charge Manager 2016 to your PC you have to install the driver ("Silicon Labs
CP210x USB-UART Bridge") according to the instructions of its installation software. You will be
also asked for installing the driver during the installation of the software.
The most recent driver version is available at
http://www.silabs.com/products/mcu/Pages/USBtoUARTBridgeVCPDrivers.aspx.
After completing the setup, connect the CM2016 to an available USB-Port of your computer (suitable
cable: USB-A to USB-B, e.g. Conrad Order.-No.: 972030). Therefore the charger provides an USB-Port
(USB-B-port at the backside of the device).
Connecting the device the first time, your system will detect the new hardware and complete the
driver installation. This may take several minutes. Then you may control the assigned COM-Port of
the CM2016 within the device-manager located inside the system-control of windows (e.g. “COM7”
as shown below).
The installation is completed now.

First steps
Start / Stop recording
data
Save and load
Quit Application
At first start of the software, please select the COM-Port of the CM2016 according to the entry within
the device-manager. (e.g. „COM7“)
After confirming with “OK” the main form of the program will be displayed
recordings.
COM-Port selection.
Recording data starts after clicking at “Start-Logging“. The charger must be in operation therefore.
The display illumination of the CM2016 is active in this case.
During data recording, the background color of the software changes from gray to green.
If no data from the charger is received for a longer period than two seconds, the program will stop
the data logging. A reason for that may be that the cable was disconnected. It is possible to continue
the recording later.

Display for charger-
view.
Display for
If “Autoscroll” is
received values.
Clear recorded
slots!!
Show
Information.
Data export
Print function for
Change view
(charts, table
or both)
Recorded
Voltage and current
Control elements of the software
View during data recording:
to Excel or
“CSV–File”
test-charts.
(Disabled during
recording data)
program
version and
further
data. This
affects the
data of all
enabled, the table
automatically
scrolls to the last
datareception
from the
charger
General remarks:
slot parameters.
Clicking at the display
selects the slot shown
in table and chart
data
displayed
as table
view.
charts. Line-, Bargraph and 3D-line
views are selectable
Parallel to the display recorded data is also buffered within temporary files. If temporary
data is available at program start, the software provides the possibility to continue these
recordings.
If a battery is removed during recording, the data for this slot will be deleted automatically.
This ensures the integrity of the data.
The export functions for “Excel” and “CSV” just affect the actual selected slot.
During recording the printing function is disabled

The graphs will be printed as displayed. If a section is scaled up, the printed output will be
according to this view. A title with slot number, time, charged and discharged capacity will be
added automatically. The recommended printing size is DIN A4/A3, landscape-format.
Saving and loading data via “File” -> „Load Logged Data“/ „Save Logged Data“, affects the
data of all slots. The actual temporary files will be overwritten by the „load“-function.
By disabling the energy-save mode during recording the program ensures that no data is lost.
It is possible to select rows with „Copy & Paste” and transfer them to other software as
table.
Usage of the Windows clipboard
In addition to the export functions it is also possible to export the logged data to any spreadsheet
calculation program like e.g. „LibreOffice / OpenOffice“ using the clipboard functionality.
Procedure:
4. Select rows within the table
5. At right-click into the table the following dialog appears:
Using “Copy To Clipboard“ only the selected range, with “Copy All...“ the whole table will be
copied into the clipboard.
Alternatively it is possible to store selected data via “STRG+C” (copy).
6. Now the data can be inserted by “STRG+V“ (paste) into the target table.

Display styles
Discharge
Charge
Below “Display Style” the desired view will be selected. If “Table” is checked, the
data will be displayed as table. If “Charts” is selected, the progression of voltage and
current will be displayed as chart. It is possible to combine both views.
Example: „Charts“
Different line colors are used to differentiate between charging and discharging. Green and red show
charge phases, dark-green and dark-red are used for discharge-phases.
Missing data points (may result from e.g. recording pauses) are indicated by gray dots.
At the end of the program the final voltage will be displayed in addition.

Usage of the chart function
Functions:
Three views are available: Lines, bar graph and 3D-lines (tilt and rotation can be modified).
Bar-graph 3D-lines
Zoom to ranges using the mouse:
Press left mouse button within the display and pull a box over the desired range. After releasing the
button the selected range will be magnified
Alternative:
- Right-click into the chart. Now the following control-box will be displayed:
„Zoom In“ magnifies the view by factor two.
„Reset Zoom“ resets to the view of the whole chart.
- Depending on the mouse pointer position it is also possible to use the mouse wheel to zoom
in and out.

Moving the displayed range
This is possible by using the cursor keys, or the scrollbars of the charts
Additional control possibilities using the keyboard:
„Home“ restore full view (like „Reset Zoom“)
„Del“ jump to the start of the recording
„End“ jump to the end of the recording
„Backspace“ reset magnification by one step.
„Page↑“ move X-axis in direction end of recording (large step)
„Page↓“ move X-axis in direction start of recording (large step)
Display data at mouse pointer position
If the mouse pointer is placed over a graph you will get the according data displayed after pressing
the right mouse-button.

Suspend and continue recordings
1. Disconnect the power-supply of the charger. The following message appears now:
2. The software must be closed now.
3. When the program is started next time, you have the possibility to continue the recording.
4. Take the charger back in operation and confirm with "yes". Now the last recording will be
restored and the recording continues automatically. If you choose “No” the last recording
will be deleted.
Please note:
If the software was not closed you have to click „Start Logging“ after switching on the CM2016.
The recording will be continued in this case too.
System requirements
Windows XP or newer
.Net Framework V4 (Client Profile) or higher
Resolution min. 1024*768
Imprint
This instruction manual is published by Conrad Electronic SE, Klaus-Conrad-Strasse 1, D-92240
Hirschau (www.conrad.com). All rights, including translation, reserved.
Reproduction of any type, e. g. photocopy, micro-filming or storage in computer systems, requires
the written permission of the publisher.
Reproduction, even in extracts, is not permitted. This instruction manual reflects the technical
specifications current at the time of printing. We reserve the right to change the specifications.
© Copyright 2013 by Voltcraft ®
 Loading...