

Page 1
CP Series™
CP7000™, CP8000™
USER’S GUIDE
M210557EN-A
April 2004
Page 2

PUBLISHED BY
Vaisala Oyj Tel. +358 9 8949 1
P.O. Box 26 Fax +358 9 8949 2227
FIN-00421 Helsinki
Finland
Visit our Internet pages at http://www.vaisala.com/
FOR TECHNICAL INFORMATION
Vaisala Inc. Tel. +011 520 806 7300
Tucson Operations Fax: +011 520 741 2848
2705 E. Medina Rd. Toll free (US) 1 888 424 9899
Tucson, AZ 85706-7155
USA
© Vaisala 2004
No part of this manual may be reproduced in any form or by any means, electronic
or mechanical (including photocopying), nor may its contents be communicated to
a third party without prior written permission of the copyright holder.
The contents are subject to change without prior notice.
Please observe that this manual does not create any legally binding obligations for
Vaisala towards the customer or end user. All legally binding commitments and
agreements are included exclusively in the applicable supply contract or
Conditions of Sale.
Page 3

________________________________________________________________________________
Table of Contents
Chapter 1
GENERAL INFORMATION.................. ... ... ... .... ... ... ... .... ... ... ... ... ....................1
About This Manual...................................................................1
Contents of This Manual.......................................................1
Document Conventions..................... .... ... ... ... ... .... ... ... ... .... ...2
Safety ........................................................................................3
Trademarks...............................................................................3
Copyrights................................................................................4
License Agreement.............. ... .... ... ... ... .... ... ... ..........................4
Warranty ...................................................................................4
Technical Support...... .... ... ... ... .... ... ... .......................................5
Chapter 2
INTRODUCTION............................................................................................7
Manuals for the CP Series.......................................................7
Models in the CP Series ..........................................................7
Thunderstorm Information Systems......................................8
LF Thunderstorm Information System ................................10
LF/VHF TIS.........................................................................11
Functional Overview............... .............................................. .12
CP7000 Functions ..............................................................14
CP8000 Functions ..............................................................15
CP Software Operation..... ... ... .... ... ... .....................................16
Calculation of Lightning Locations......................................16
LF Locations ..................................................................16
VHF Locations ...............................................................17
LF/VHF (Total Lightning) Locations...............................18
LF Cloud Lightning Reporting........................................19
Process Interconnections....................................................19
CP7000 Processes...................................... .... ... ... ... .... .20
CP8000 Processes...................................... .... ... ... ... .... .22
Operating Specifications.......................................................26
Optional Modules...................................................................28
Processing Modules............................................................28
Software Modules...............................................................28
Chapter 3
OPERATING CP.................................. .......................................... ... ... ... .... .29
Overview.................................................................................29
Core Processes ..................................................................29
VAISALA________________________________________________________________________ iii
Page 4

User’s Guide______________________________________________________________________
Utility Processes..................................................................30
GUI Processes....................................................................30
Starting and Stopping the CP...............................................30
Logging In ......... ... ... ... ... .......................................... .... ... .....30
Starting Core Processes.....................................................31
Starting Utility Processes....................................................32
Starting GUI Processes.......................................................32
Starting All CP Processes...................................................33
Stopping the CP............ .... ... ... ... .... ... ... ... .... ... .....................33
Using the ApaControl GUI................ ... ... ...............................34
Using the Processes Panel.................. ... .... ... ... ... ... .... ... ... ..34
Using the Sensors Panel.....................................................35
Selecting Label Formats and Sort Sequence ................36
Determining Sensor Status............................................37
Displaying Additional Information about Sensors ..........40
Setting Audible Condition Alarms........................................43
Using the Archive File System Panel..................................45
Using the Overflow File System Panel........................ ... ... ..46
Using the LpaControl GUI .....................................................47
Chapter 4
CONFIGURING CP DATABASES...............................................................51
Overview .................................................................................51
Defining a URL .......................................................................52
Using the ApaConfig GUI ............. .... ... ... ... .... ... ... ... ... .... ... ... ..54
Changing a Device or Process Configuration.....................55
Adding a New Device Configuration Table .........................56
Saving Configuration Settings.............................................56
Reversing Changes to a Database.....................................58
Configuring the realtime Database.......................................58
Assigning Transport IDs......................................................59
Configuring an External Network ........................................60
Configuring Sensors............................. ... .... ... .....................61
Configuring Lightning Displays............................. ... .... ... ... ..66
Configuring the pdad Process.............................................69
Configuring the pandad Process .... .....................................69
Configuring the located Process.................................... ... ..71
Chapter 5
MANAGING SENSORS...............................................................................73
Overview .................................................................................73
Attaching to LPATS or SAFIR Sensors................................74
Using the Attach GUI ................. ... .... ... ... ... .... ... ... ... ... .... ........74
Setting Attach Options ...... ... ... ............................................74
Attaching to an IMPACT Sensor.........................................75
Attaching a VHF-ITF Sensor with AttachIt ..........................78
Attaching to LS LF Modules Using Telnet...........................79
iv ____________________________________________________________________M210557EN-A
Page 5

________________________________________________________________________________
Chapter 6
ARCHIVING SENSOR DATA ......................................................................81
Overview.................................................................................81
Archive Operation..................................................................82
Normal Archive Operation...................................................83
Troubleshooting Archive Operations...................................83
Archiving to Recordable CD ...... ... ... ... .... ... ... ... ... .... ... ... ... .... .84
Normal Operation with a CD Writer ....................................85
Troubleshooting CD-R Archive Operations.........................86
Hold File Is Full..............................................................86
Spool Area Is Full ........................................ .... ... ... ... .... .86
Blank CD Is Required ....................................................87
CD Needs to Be Mounted..............................................87
Image File Failure........................................ .... ... ... ... .... .88
CD Creation Failure.......................................................88
CD Did Not Verify...........................................................88
Archiving to Tape.... .......................................... ... .... ... ... ... .... .89
Normal Operation with a Tape Drive...................................89
Troubleshooting Tape Archive Operations .........................90
Archiving to Removable Magneto-Optical Media................90
Normal Operation with Removable Media ..........................90
Changing Removable Media...............................................91
Changing Media after Switch to Overflow......................92
Changing Media before Switch to Overflow...................92
Recovering when Archive and Overflow are Full...........92
Formatting Media and Creating a UNIX File System..........93
Troubleshooting Removable Media....................................95
Chapter 7
REPROCESSING HISTORICAL DATA......................................................97
Overview.................................................................................97
Reprocessing Archived Raw Data........................................98
Reprocessing LF Lightning Data.........................................98
Reprocessing VHF Lightning Data......................................98
Chapter 8
MONITORING SENSOR PERFORMANCE.................................................99
Overview ................................................................................ 99
Starting sensorqa Utilities...................................................100
Starting sensorqa for LF Sensors............................... ... ...100
Starting sensorqa for VHF Sensors..................................100
Commands for sensorqa.....................................................101
Statistics Measured by sensorqa.......................................101
Accumulating Sensor Statistics for located... ... .... ... ... ... ...103
Log Files for sensorqa.........................................................103
Resetting Sensor Statistics.................................................104
Configuring sensorqa..........................................................105
VAISALA_________________________________________________________________________v
Page 6

User’s Guide______________________________________________________________________
Using the sensorqa Process......................... ... ... ... ... .... ... ...105
Real-Time Viewing of Position and Sensor Data..............105
Displaying Current Stroke Rates.......................................107
Interpreting the sensorqa Report ......................................107
Detection Efficiency .....................................................107
Gain Calibration...........................................................108
Percent Uncorrelated...................................................109
Percent Recycled.........................................................109
Angle Deviations..........................................................109
GPS Time Deviations...................................................110
Signal Deviations.........................................................110
Viewing Real-Time Position and Sensor Data...................111
Correlated Sensor Data ....... ... ... .... ... ... ... .... ... ... ... ... .... ... ...112
Uncorrelated or Rejected Sensor Data.............................113
Reprocessing with sensorqa ..............................................114
Reprocessing LF Data ......................................................114
Reprocessing VHF Data ...................................................115
Chapter 9
ANALYZING DETECTION ACCURACY ... ... ... ... .... ... ... ... .... ... ... ... ... .... ... ...117
Overview ...............................................................................117
Using intersect ..................... ... ... ... .......................................118
Starting intersect Using the GUI Icon................................118
Using the Mouse...............................................................120
Configuring intersect................................... ... ... ... ... .... ... ...121
Setting the Data Mode ...... .......................................... ... ...123
Saving Data to a File.........................................................123
Loading Data from a File...................................................124
Selecting Sensor Labels ...................................................125
Monitoring a Sensor............. ... ... .... ... ... ... .... ... ... ... ... .... ... ...125
Displaying Timing Information...........................................127
Using Sensor Time Circles ..........................................127
Using Time Deviation Crosses.....................................128
Controls for the Map Area.................................................129
Viewing the Base Map.................................................130
Zooming on the Map....................................................130
Displaying the Previous Map View......................... ... ...132
Displaying the Next Map View .....................................132
Replotting the Map.......................................................132
Configuring the intersect Maps ....................................133
Using the Range Finder...............................................133
Setting up the Map Display .................................................135
Defining a New Base Map.................................................135
Configuring the Base Map................................. ... .............136
Setting Units of Measure ... ... ... ... .... ... ... ... .... ......................137
Configuring Map Layers.......... ... .... ... ... ... .... ... ... ... ... .... ... ...138
Displaying Map Layers......................................................140
Resetting the Base Map.... ... ... ... .... ... ... ... .... ... ... ... ... .... ... ...141
Displaying ASCII Lightning and Sensor Data....................142
Using the Lightning Viewer ...............................................143
Understanding the Data....................................................143
vi ____________________________________________________________________M210557EN-A
Page 7

________________________________________________________________________________
Creating Maps for intersect.................................................144
Restrictions on Converting MIF to MDB............................144
Example of Converting MIF to MDB .................................145
Chapter 10
ANALYZING NETWORK REGIONAL QUALITY ......................................147
Overview...............................................................................147
Configuring regionqc...........................................................147
Setting the Region Boundaries of regionqc ......................148
Setting the Frequency of regionqc....................................149
Running regionqc Manually................................................149
Interpreting the regionqc Report............... ... ... ... .... ... ... ... ...150
Average Chi-Square .........................................................151
Percent Optimized ............................................................151
Stroke Count.....................................................................151
Median Semi-major Axis...................................................151
Average Number of Sensors.............................................152
Chapter 11
ADVANCED CP CONFIGURATION..........................................................153
Overview...............................................................................153
Classifying Cloud Lightning for LF Sensors.....................154
Changing the Startup Configuration..................................155
Opening the startup.cfg File..............................................156
Configuring a Core Process..............................................157
Adding a New Core Process.............................................159
Removing a Core Process................................................159
Reverting to the Previous Configuration File ....................160
Saving a Configuration File to Disk....................... ... ... ... ...161
Exiting the StartupConfig GUI...........................................162
Using Automatic Disk Management...................................162
Managing Space Used by a Directory ..............................163
Managing the Number of Directory Files ..........................164
Remotely Accessing CP......................................................164
Using the ApaControl GUI ................................................164
Running sensorqa Remotely.............................................165
Starting sensorqa for LF Sensors................................165
Starting sensorqa for VHF Sensors.............................166
Configuring the CP Remotely ...........................................166
The Configuration Database Editor..............................166
The Configuration Database Command Shell .............167
The Configuration Database Replicator.......................167
The Configuration Database Sanity Checker...............167
Using Universal ASCII Lightning Format...........................167
Multicasting..........................................................................169
Multicasting on a Local Workstation .................................169
Multicasting across Multiple Workstations ........................170
Using TCP/IP ........................................................................171
VAISALA________________________________________________________________________ vii
Page 8

User’s Guide______________________________________________________________________
Using TCP/IP to Communicate with Sensors....................171
Setting Up a TCP/IP Socket Server for a Display .............172
Sharing CP Data...................................................................172
Chapter 12
UNIX SYSTEM ADMINISTRATION...........................................................175
Overview ...............................................................................175
User Accounts......................................................................175
System Environment ...........................................................176
System Host Name Aliases.................................................176
System Backup ....................................................................177
Root Privileges.....................................................................177
Setuid Root Processes......................................................178
Sysadmin Privileges..........................................................178
Shutting Down the Workstation..........................................178
Shutdown Command to Power Off....................................179
Rebooting the Workstation................................................179
Automatic CP Startup and Shutdown ................................179
Chapter 13
TROUBLESHOOTING...............................................................................181
Overview ...............................................................................181
Monitoring the CP System Functions ................................181
Monitoring GPS Time Synchronization.............................181
Monitoring System Error Messages........ .... ... ... ... ... ....... ...183
Troubleshooting Sensors with sensorqa ..........................183
Troubleshooting located Configuration.............................183
Troubleshooting with lpterm...............................................184
Troubleshooting GPS Clocks .............................................185
Arbiter GPS Clock............. ... ... ... .... ... ................................185
Network GPS Clock ..........................................................186
Troubleshooting Common Problems.................................186
Appendix A
CLOUD DETECTION EFFICIENCY...........................................................193
Appendix B
INTRODUCTION TO LIGHTNING DETECTION .......................................197
Lightning Phenomena ................................................... ... ...197
Anatomy of a CG Lightning Flash.....................................197
Radio Frequency Characteristics of Lightning ..................198
Uses of Lightning Data...... ... ... ... .... ... ... ... .... ... ... ... ... .... ......200
LF/VLF Lightning Location Methods..................................201
A Brief History...................................................................201
Basic Direction Finding .....................................................202
Basic Time-of-Arrival.........................................................203
viii ___________________________________________________________________M210557EN-A
Page 9

________________________________________________________________________________
Improved Accuracy from Combined Technology..............205
Stroke Peak Current .........................................................207
VHF Detection.......................................................................208
Direction Finding Based on VHF Interferometry...............208
Wide Baseline TOA Methods Operating at VHF...............209
VHF Signal Strength......................... .... ... ... ... ... .... ... ... ... ...210
Lightning Location System Performance..........................210
Measurement of Location Accuracy..................................210
Data Consistency..............................................................212
Detection Efficiency ..........................................................213
Use of Location Quality Indicators.....................................213
References............................................................................214
Appendix C
GLOSSARY ...............................................................................................217
INDEX ........................................................................................................229
VAISALA________________________________________________________________________ ix
Page 10

User’s Guide______________________________________________________________________
This page intentionally left blank.
x ____________________________________________________________________M210557EN-A
Page 11

________________________________________________________________________________
List of Figures
Figure 1 Lightning Sensors and Radiation Frequency Detection...........9
Figure 2 Example of an LF TIS ............................................................10
Figure 3 Example of an LF/VHF TIS....................................................11
Figure 4 Flow Chart of Total Lightning Location Processing................18
Figure 5 CP7000 Process Interconnections.............. ... ... ... .... ... ... ... .... .20
Figure 6 CP8000 Process Interconnections.........................................23
Figure 7 Terminal Icon .........................................................................31
Figure 8 Typical Window for Accessing the GUIs................................33
Figure 9 APA Control Window .............................................................35
Figure 10 Managing Sensors with the ApaControl GUI .........................36
Figure 11 Sensors Menu........................................................................37
Figure 12 APA Control Window .............................................................38
Figure 13 Color Indicators for State of Sensor.......................................39
Figure 14 Sensor Information Button .....................................................41
Figure 15 Setting Thresholds.................................................................43
Figure 16 Data Archive Change Button .................................................46
Figure 17 Opening LP Archive Control ..................................................47
Figure 18 Opening the Devices Dialog Box ...........................................48
Figure 19 Storage Device Types for LpaControl....................................48
Figure 20 APA Config Window...............................................................55
Figure 21 Adding a New Device Configuration Table ............................57
Figure 22 Verification to Commit Database Changes to Disk................58
Figure 23 Transport Configuration Table Edit Panel..............................59
Figure 24 Network Configuration Table Edit Panel................................60
Figure 25 Sensor Configuration Table Edit Panel..................................61
Figure 26 Sensor Configuration Table Edit Panel..................................65
Figure 27 Display Configuration Table Edit Panel .................................67
Figure 28 Edit Panel for pdad Table ......................................................69
Figure 29 Edit Panel for pandad Table ..................................................70
Figure 30 Edit Panel for located Table...................................................71
Figure 31 Attach Options Dialog Box.....................................................75
Figure 32 Accessing the Attach GUI......................................................76
Figure 33 AttachImpact Window ............................................................77
Figure 34 AttachIt Window.....................................................................79
Figure 35 LpaControl Functional Diagram .............................................82
Figure 36 LP Archive Control Window ...................................................85
Figure 37 APA Control Window .............................................................91
Figure 38 Viewing of Sensor, Position, and ASCII Data ......................106
Figure 39 Fields for Position Data........................................................111
Figure 40 Sample of Correlated Sensor Data......................................112
Figure 41 Fields for Correlated Sensor Data .................................... ...113
Figure 42 Fields for Uncorrelated or Rejected Data.............................114
Figure 43 Typical intersect Window .....................................................119
Figure 44 Icon for intersect GUI...........................................................120
Figure 45 Opening the Intersect Configuration Dialog Box..................121
Figure 46 Intersect Configuration Dialog Box ......................................121
VAISALA________________________________________________________________________ xi
Page 12

User’s Guide______________________________________________________________________
Figure 47 Save Dialog Box for History Buffer.......................................124
Figure 48 Load File Into Dialog Box for History Buffer.........................124
Figure 49 Selecting a Sensor Label Format.........................................125
Figure 50 APA Control Window............................................................126
Figure 51 Selecting an Active Sensor..................................................126
Figure 52 Monitor Options....................................................................127
Figure 53 Displaying the Default Base Map.........................................130
Figure 54 Zooming to Area of Interest..................................................131
Figure 55 Range Finder Dialog Box.....................................................133
Figure 56 Map Configuration Dialog Box .............................................136
Figure 57 Layer Configuration Dialog Box ...........................................138
Figure 58 Lightning Viewer Dialog Box................................................142
Figure 59 Sample regionqc Report ......................................................150
Figure 60 Startup Configuration Editor Window...................................156
Figure 61 Opening a File......................................................................157
Figure 62 Opening the startup.cfg File.................................................157
Figure 63 Startup Configuration Editor Window...................................158
Figure 64 Adding a New Process.........................................................159
Figure 65 StartupConfig Message Dialog Box.....................................160
Figure 66 Confirm Revert Dialog Box...................................................161
Figure 67 File Changes Message .... .... ................................................161
Figure 68 Confirm Exit Dialog Box .......................................................162
Figure 69 Data Sharing from One CP to Another.................................173
Figure 70 CG and Cloud Flashes at Various Frequency Ranges........198
Figure 71 Relationship, Frequency and Lightning Detection Method...199
Figure 72 Optimal Location Algorithm for Magnetic Direction Finding .202
Figure 73 Hyperbolic Intersection.........................................................203
Figure 74 Ambiguous Location, 3-Sensor Hyperbolic Intersection ......204
Figure 75 Circular Intersection Using Three Sensors ..........................205
Figure 76 Circular Intersection Step Using Four Sensors....................205
Figure 77 IMPACT Method on a Baseline Between Two Sensors.......206
Figure 78 IMPACT Method: 3 LPATS TOA, 2 IMPACT Sensors.........207
Figure 79 Triangulation for Interferometric Location ............................209
Figure 80 Confidence Ellipse: Unfavorable Sensor Geometry.............211
Figure 81 Confidence Ellipse: Favorable Sensor Geometry ................211
Figure 82 Using Confidence Ellipse to Identify Most Likely Stroke ......214
xii____________________________________________________________________M210557EN-A
Page 13

________________________________________________________________________________
List of Tables
Table 1 Document Conventions............................................................2
Table 2 Guide to Information by CP Model...........................................8
Table 3 Supported TIS Modules .........................................................12
Table 4 Supported Sensors ................................................................13
Table 5 Supported Display Programs.................................................14
Table 6 Processes Used by CP7000..................................................21
Table 7 GUIs Used by CP7000...........................................................22
Table 8 Processes Used by CP8000..................................................24
Table 9 GUIs Used by CP8000...........................................................25
Table 10 Physical Specifications ..........................................................26
Table 11 Data Processing Capabilities.................................................26
Table 12 CP to Sensors Communication Interfaces.............................27
Table 13 Output Protocols ....................................................................27
Table 14 Storage Capacity for Lightning Data......................................27
Table 15 GUIs.......................................................................................30
Table 16 Sensor Display Options in APA Control.................................36
Table 17 Status Characters and Their Meanings .................................38
Table 18 Sensor State Indicators............... ... ... ... .... ... ... ... ... .... ... ... ... .... .40
Table 19 Thresholds Dialog Box, Default Settings ...............................44
Table 20 Sensor Configuration .............................................................63
Table 21 Display Formats Supported ...................................................67
Table 22 Angles and Times for located Process ..................................72
Table 23 Data Archive Terms and Definitions ......................................83
Table 24 Commands for sensorqa......................................................101
Table 25 Statistics Measured by sensorqa.........................................102
Table 26 Possible Output Displayed by sensorqa ..............................105
Table 27 Optimal Detection Efficiency by Sensor...............................108
Table 28 Functions of Mouse Buttons in intersect Window ................120
Table 29 Options Used to Configure intersect....................................122
Table 30 Attributes to Configure Base Map........................................137
Table 31 Default Map Layers..............................................................138
Table 32 Options to Configure Map Layers ........................................140
Table 33 NLDN Use of regionqc.ksh Values ......................................148
Table 34 Cloud Classification Methods for LF Sensors......................154
Table 35 UALF Record Fields.............................................................168
Table 36 User Accounts......................................................................175
Table 37 Required Files......................................................................176
Table 38 Host Name Aliases ..............................................................176
Table 39 Common Problems and Their Solutions ..............................186
Table 40 The Scaling Constant and Probability Relationship.............211
VAISALA_______________________________________________________________________ xiii
Page 14

User’s Guide______________________________________________________________________
This page intentionally left blank.
xiv ___________________________________________________________________M210557EN-A
Page 15

Chapter 1 _________________________________________________________General Information
CHAPTER 1
GENERAL INFORMATION
About This Manual
This manual provides information for configuring, operating, and
maintaining the CP7000™, and CP8000™ models of the CP Series™
central analyzers. The CP (Central Processor) controls, manages, and
monitors a lightning location system.
Contents of This Manual
This manual consists of the following chapters:
- Chapter 1, General Information, provides important safety, contact,
and warranty information for the product.
- Chapter 2, Introduction, provides an overview of the CP Series
central processors and Vaisala thunderstorm information systems.
- Chapter 3, Operating CP, describes how to operate the CP Series
software.
- Chapter 4, Configuring CP Databases, describes how to configure
the CP database parameters.
- Chapter 5, Managing Sensors, describes how to attach to a sensor
for control and diagnostic operations.
- Chapter 6, Archiving Sensor Data, describes procedures for
archiving sensor data to storage media.
- Chapter 7, Reprocessing Historical Data, describes how to
reprocess lightning stroke and event data after storage.
VAISALA________________________________________________________________________ 1
Page 16

User’s Guide______________________________________________________________________
- Chapter 8, Monitoring Sensor Performance, describes how to use
the sensorqa utility to monitor sensor performance.
- Chapter 9, Analyzing Detection Accuracy, describes how to use the
intersect process to analyze lightning data.
- Chapter 10, Analyzing Network Regional Quality, describes how to
use the regionqc utility to evaluate the quality of LF stroke data
within the nominal operating area of the lightning location system.
- Chapter 11, Advanced CP Configuration, provides information
regarding CP Series software modification to accommodate specific
system configurations.
- Chapter 12, UNIX System Administration, gives an overview of
system administration tasks.
- Chapter 13, Troubleshooting, provides guidelines for diagnosing
trouble with the CP Series.
- Appendix A, Cloud Detection Efficiency, provides brief definitions
of the adjustable parameters used in cloud lighting detection.
- Appendix B, Introduction to Lightning Detection, provides a basic
introduction to lightning detection and measurement.
- Appendix C, Glossary, defines terms used in this manual.
Document Conventions
Different typefaces, type styles, and phraseology indicate specific user
interactions with the system as illustrated in Table 1 below.
Table 1 Document Conventions
Item Example
System prompts, source code, and program
output are in a mono-spaced typeface.
User input is a bold, mono-spaced typeface. volcheck
Optional entry is enclosed in square brackets
(for example, /v).
Descriptive term used in place of user-specific
name is in italics and enclosed in angle
brackets (for example, table).
Key names are all capital letters. ENTER
Use of ENTER key at the end of a command <ENTER>
Key combinations that are held down
simultaneously are all capital letters and
separated by a plus symbol.
c:\temp>
format a: [/v]
the <table>.map file
CTRL+X
2 ____________________________________________________________________M210557EN-A
Page 17

Chapter 1 _________________________________________________________General Information
Table 1 Document Conventions (Continued)
Item Example
ASCII values are enclosed in angle brackets. <CR><LF>
User interface items and command words are
in bold.
Click Cancel or use the
quit command.
Safety
Throughout the manual, important safety considerations are
highlighted as follows:
WARNING
CAUTION
NOTE
Trademarks
Warning alerts you to a serious hazard. If you do not read and follow
instructions very carefully at this point, there is a risk of injury or even
death.
Caution warns you of a potential hazard. If you do not read and follow
instructions carefully at this point, the product could be damaged or
important data could be lost.
Note highlights important information on using the product.
Vaisala and the Vaisala logo are registered trademarks of Vaisala Oyj in
the United States and/or other countries.
CP Series, CP7000, CP8000, AP5000, IMPACT ESP, TED, PLWS,
VIS, LPATS IV, FALLS, LTraX, NLDN, and National Lightning
Detection Network are trademarks or registered trademarks of Vaisala
Inc.
MapInfo, MapInfo Professional, MapBasic, and the MapInfo logo are
registered trademarks of MapInfo Corporation.
Sybase, the Sybase logo, Sybase SQL, Open Client, and Open
Client/Server are trademarks of Sybase Incorporated.
VAISALA________________________________________________________________________ 3
Page 18

User’s Guide______________________________________________________________________
Sun, Sun Microsystems, the Sun logo, Sun Blade, Sun Ultra, Sun
SPARCstation, and Solaris are trademarks, registered trademarks or
service marks of Sun Microsystems, Incorporated in the United States
and other countries.
UNIX is a registered trademark in the United States and other
countries, exclusively licensed through X/Open Company Limited.
Linux is trademarked in the United States and other countries by Linus
Torvald.
Storm TraX is a registered trademark of Sonalysts, Incorporated in the
United States and/or other countries.
All other company, product names, and brands used herein may be the
trademarks or registered trademarks of their respective companies.
Copyrights
getline.c is Copyright © 1991, 1992, 1993 by Chris Thewalt
(thewalt@ce.berkeley.edu)
Permission to use, copy, modify, and distribute this software for any
purpose and without fee is hereby granted. This software is provided
“as is” without express or implied warranty.
License Agreement
All rights to any software are held by Vaisala or third parties. The
customer is allowed to use the software only to the extent that is
provided by the applicable supply contract or Software License
Agreement.
Warranty
For certain products Vaisala normally gives a limited one year
warranty. Please observe that any such warranty may not be valid in
case of damage due to normal wear and tear, exceptional operating
conditions, negligent handling or installation, or unauthorized
modifications. Please see the applicable supply contract or conditions
of sale for details of the warranty for each product.
4 ____________________________________________________________________M210557EN-A
Page 19

Chapter 1 _________________________________________________________General Information
Technical Support
For technical support, return authorization (RMA), repair status, and
spare parts, contact the Customer Response Center.
Tel: 1 888 424 9899 (within USA & Canada)
+011 520 294 2145 (international)
E-mail: thunderstorm.support@vaisala.com
thunderstorm.netsupport@vaisala.com
VAISALA________________________________________________________________________ 5
Page 20

User’s Guide______________________________________________________________________
This page intentionally left blank.
6 ____________________________________________________________________M210557EN-A
Page 21

Chapter 2 _______________________________________________________________ Introduction
CHAPTER 2
INTRODUCTION
Manuals for the CP Series
This manual provides instructions for operating the CP Series and
interpreting sensor data. Use this manual to follow step-by-step
procedures for both graphical user interface (GUI) and command line
operation of the CP Series.
The CP Series™ Reference Guide provides concise information
regarding all screens, panels, menus, options, and buttons related to the
CP GUIs. Consult this manual to find information regarding a
particular function or option of the CP graphical user interfaces.
Models in the CP Series
The CP Series consists of two models, CP7000 and CP8000. These
models provide specific functions related to the type of lightning
sensor providing data input—low frequency (LF) or very high
frequency (VHF).
This manual is organized so that information about the two CP models
is easy to access. At the beginning of each chapter, a table indicates the
location of information specific to each CP model. Information not
VAISALA________________________________________________________________________ 7
Page 22

User’s Guide______________________________________________________________________
listed in the table is common to all CP models. In this chapter, look for
information specific to CP7000 and CP8000 in the following sections:
Table 2 Guide to Information by CP Model
For
Information on:
Lightning location
systems
CP functions Table 3 on page 12,
Lightning location
calculations
Process
interconnections
Reference Specific to
CP7000 CP8000
Section LF Thunderstorm
Information System on page 10
Section CP7000 Functions on
page 14
Section LF Locations on page 16Section LF Locations on page 16,
Section CP7000 Processes on
page 20
Section LF Thunderstorm
Information System on page 10,
Section LF/VHF TIS on page 11
Table 3 on page 12,
Section CP8000 Functions on
page 15
Section VHF Locations on page
17,
Section LF/VHF (Total Lightning)
Locations on page 18
Section CP8000 Processes on
page 22
Thunderstorm Information Systems
A Vaisala Thunderstorm Information System (TIS) detects the
existence of lightning discharges: cloud-to-ground lightning, cloud
lightning, and breakdown events (see Appendix C, Glossary, for
definitions). The TIS then determines the locations where cloud-toground lightning has struck the earth or where breakdown events have
occurred.
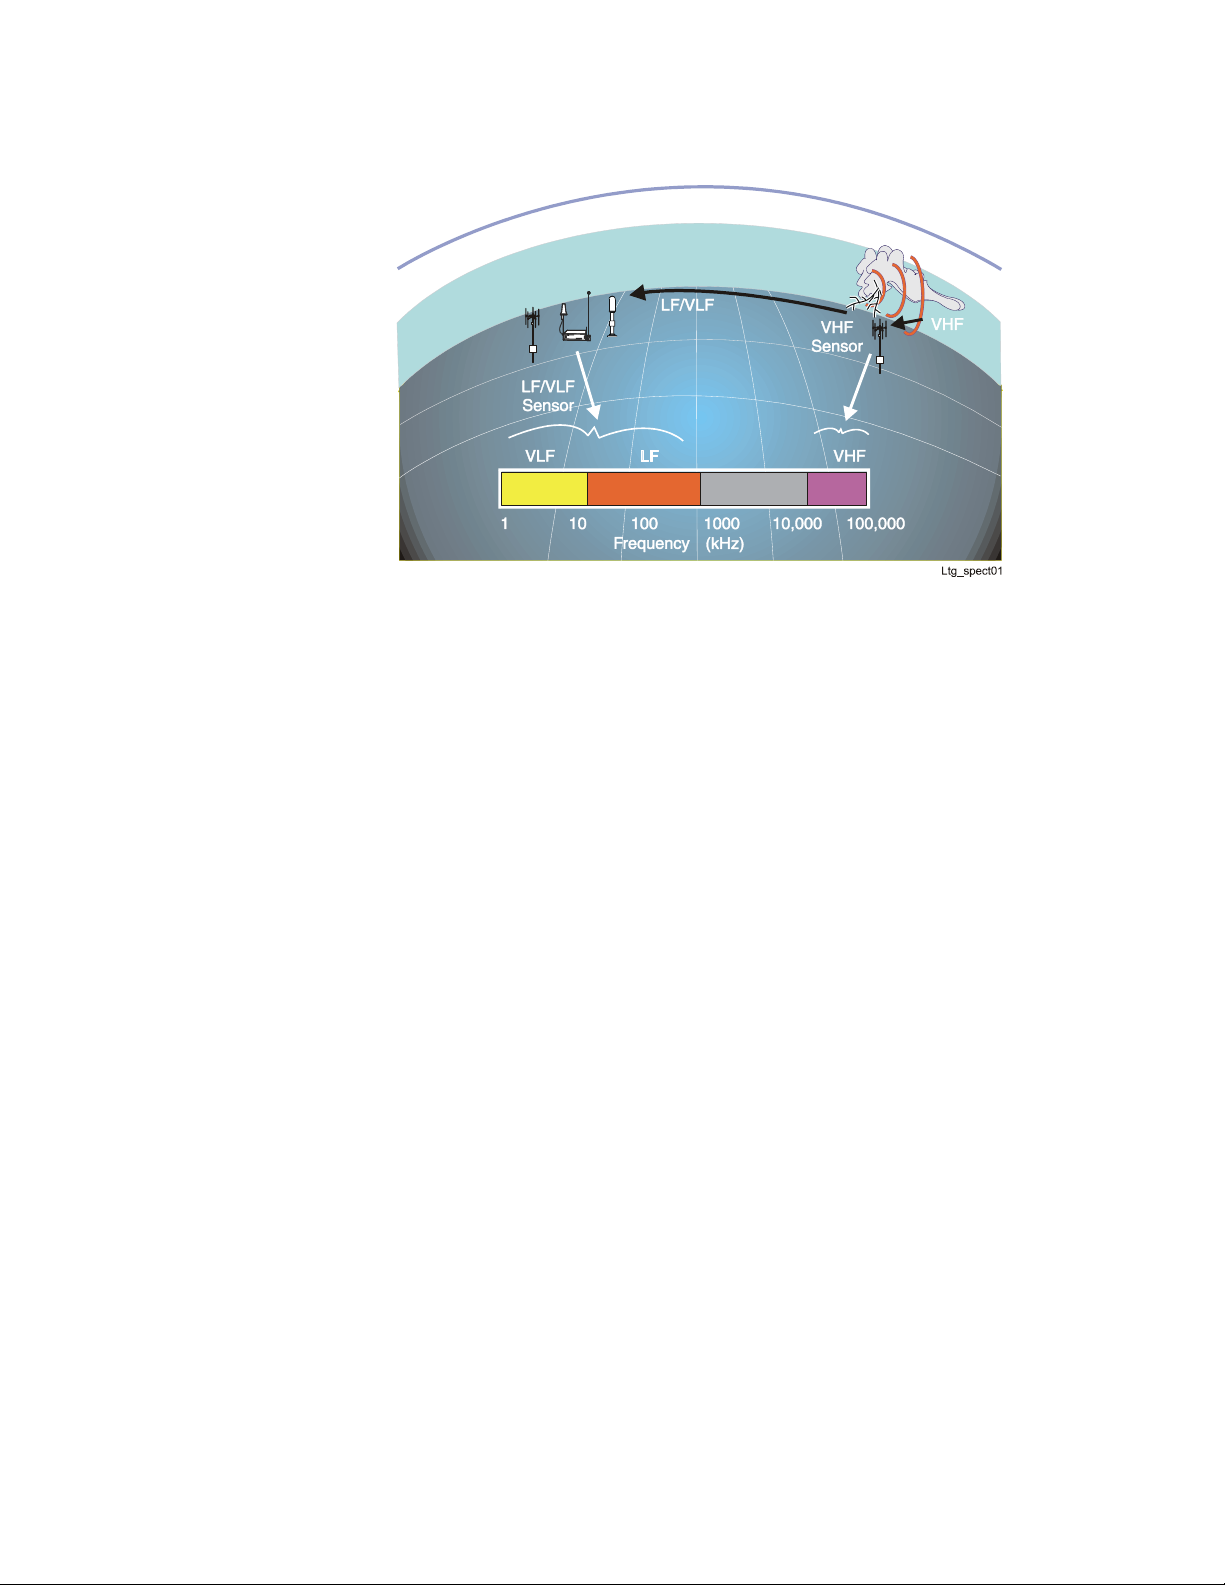
Detection is accomplished through the use of multiple, remote sensors
that detect the signals emitted by lightning discharges and filter out the
signals from nonlightning sources (see Figure 1 on page 9). Each
sensor detecting a lightning event sends data about that event to a
Central Processor (CP) that determines event locations.
To ensure that the data set applies to the same event, CP collects
lightning data from each sensor, compares the time at which the event
was recorded by each sensor , then mathematically computes the
precise location of the lightning event. CP also records several other
descriptive characteristics of each lightning event. The CP processes
the data to determine lightning locations and monitors sensor status.
Output from CP can be sent to printers, lightning display programs,
terminals, and/or archival databases. CP stores the data and
disseminates the results to other TIS modules and users in a variety of
formats.
8 ____________________________________________________________________M210557EN-A
Page 23
Chapter 2 _______________________________________________________________ Introduction
Figure 1 Lightning Sensors and Radiation Frequency
Detection
The information provided by a TIS is useful in tracking the movement
of electrified storms, in mobilizing the crews and equipment used to
repair the damage that is caused by these storms, and in analyzing the
effect of lightning on various systems and types of equipment.
Thunderstorm information systems help industries reduce the risks
associated with the destructive effects of one of nature’ s most powerful
forces. These industries include: communications, electric power
utilities, industrial facilities that rely on stable electric power, airports
and aviation companies, forestry organizations, and the meteorological
industry. The TIS is designed to enhance the user’s understanding of
lightning and to benefit those organizations affected by its occurrence.
Dependant upon the type of sensors employed (see Figure 1 above),
three types of thunderstorm information systems are supported by the
CP models:
- Low frequency (LF) lightning location, supported by CP7000 or
CP8000
- Very high frequency (VHF) lightning location, supported by
CP8000
- LF/VHF lightning location, supported by CP8000
VAISALA________________________________________________________________________ 9
Page 24
User’s Guide______________________________________________________________________
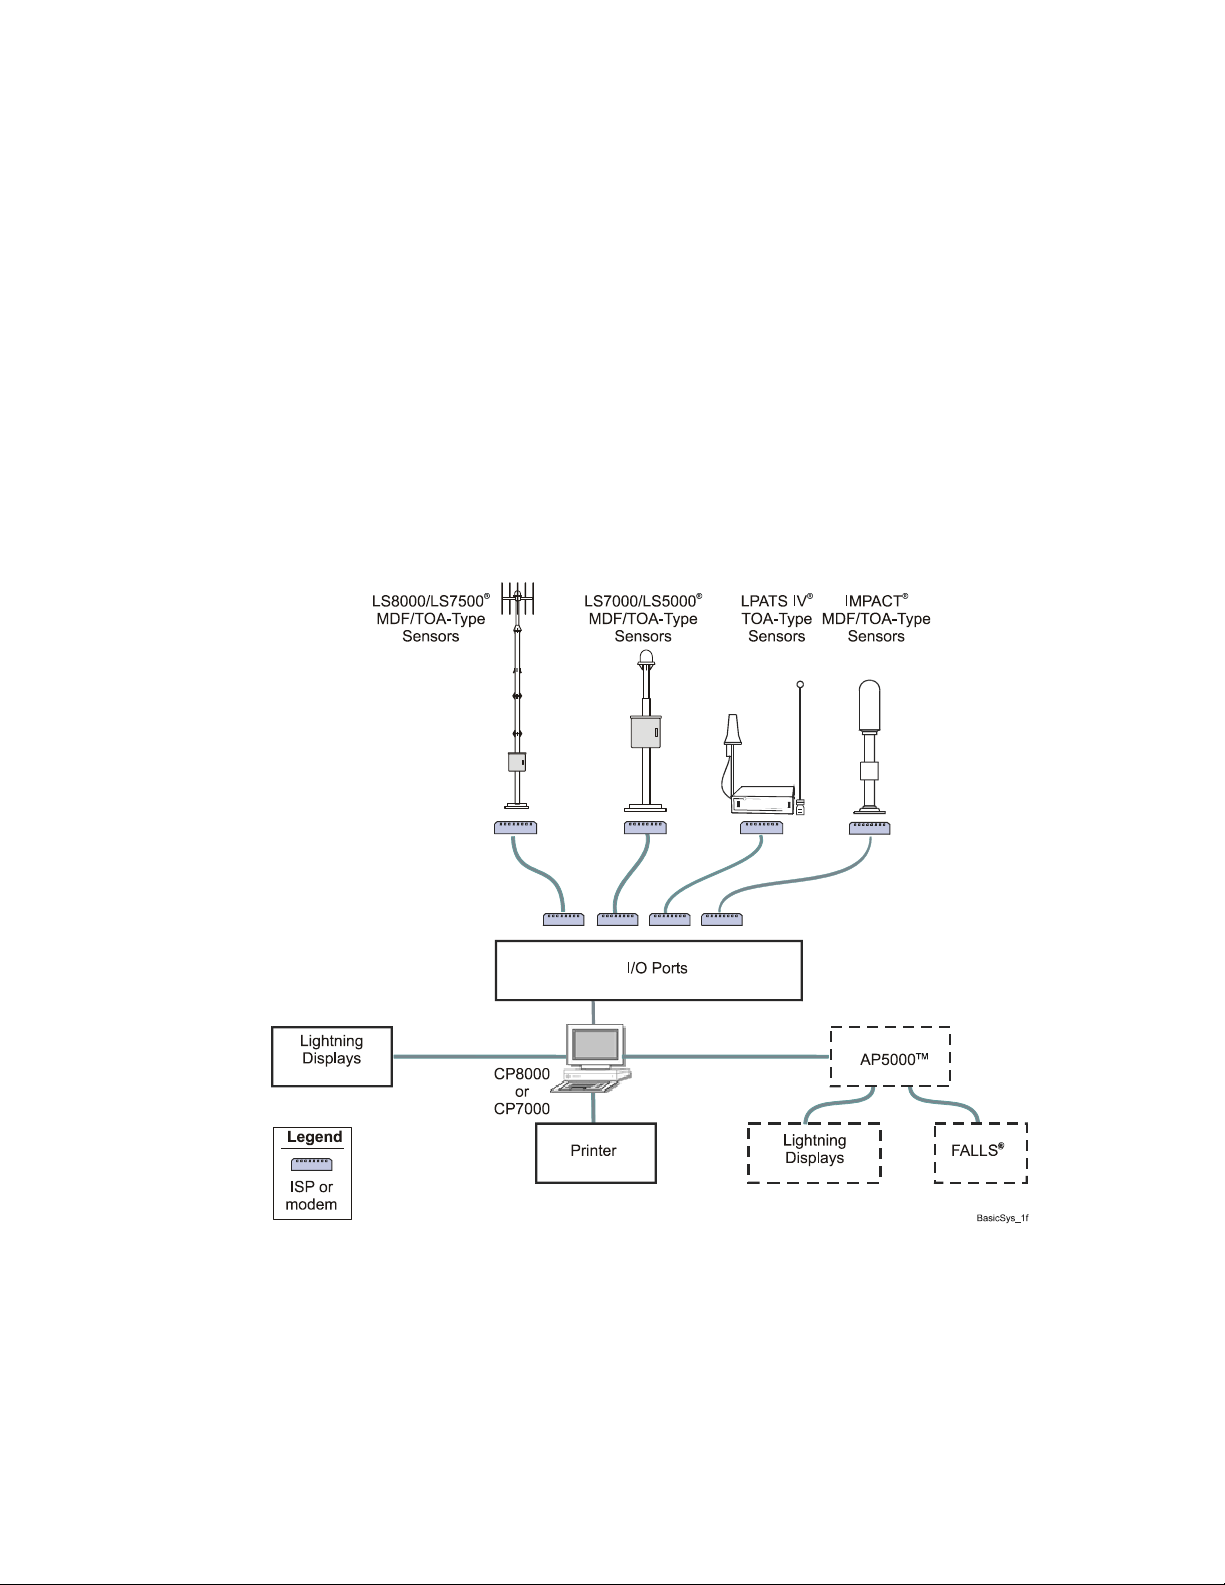
LF Thunderstorm Information System
A typical LF TIS provides stroke and flash locations (latitude and
longitude) from CP7000 or CP8000. The sensor network detects
lightning in the LF/VLF range using either magnetic direction finding,
time-of-arrival, or a combination of the two location methods. All the
sensors detect LF lightning return strokes, and some sensor models
detect cloud flashes.
Figure 2 below illustrates a configuration for a lightning location
system that uses several LF sensors, the CP7000 or CP8000 central
processor, and an output device to display LF lightning location data.
Figure 2 Example of an LF TIS
10 ___________________________________________________________________M210557EN-A
Page 25
Chapter 2 _______________________________________________________________ Introduction
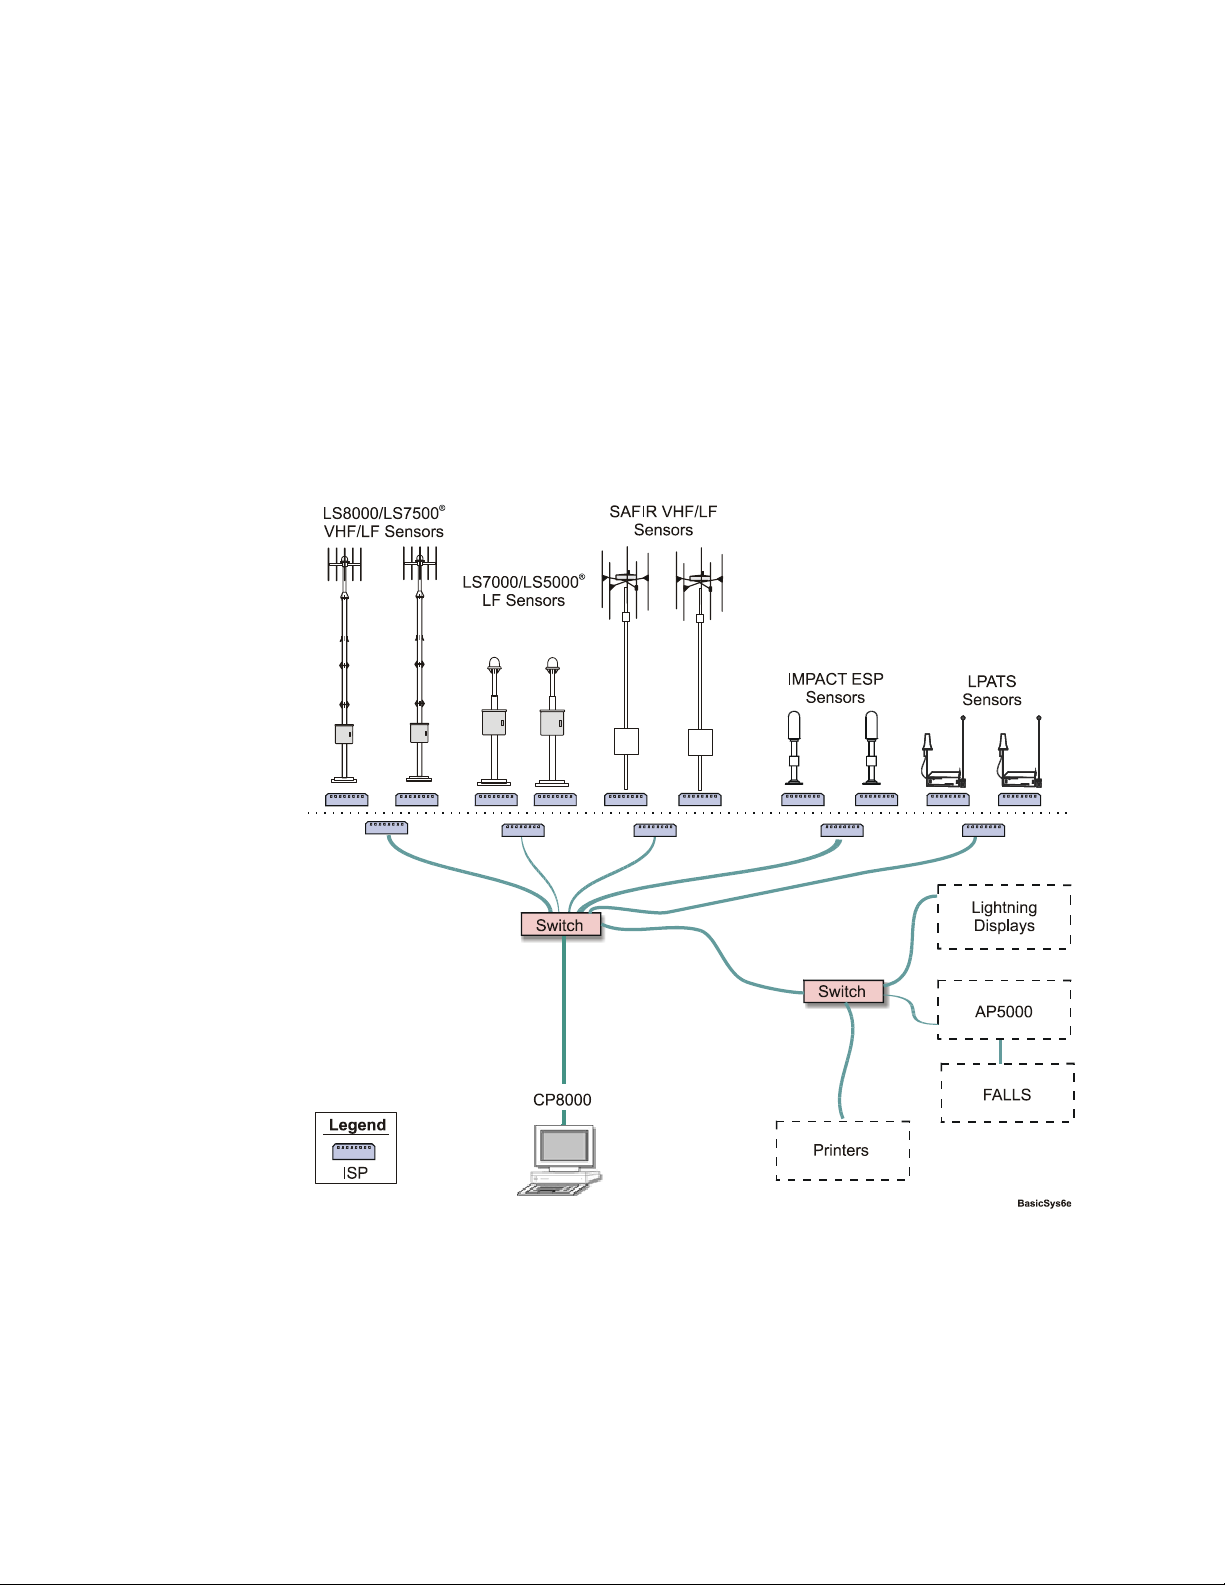
LF/VHF TIS
A typical LF/VHF TIS provides stroke and flash locations (latitude,
longitude, and altitude) from CP8000. The sensor network detects
lightning in the LF and VHF ranges. The LF lightning information for
a flash combines all aspects of the event: ground strike points of the
return strokes, cloud activity, and the radiation sources in between.
Figure 3 below illustrates a configuration for an LF/VHF TIS that uses
VHF/LF sensors, VHF interferometry sensors, LF sensors, and
network communication. This system supports a variety of displays.
Figure 3 Example of an LF/VHF TIS
VAISALA________________________________________________________________________11
Page 26

User’s Guide______________________________________________________________________
Functional Overview
In a TIS, CP provides the following functions:
- Collection of sensor data and calculation of lightning locations (see
section Calculation of Lightning Locations on page 16)
- Configuration of TIS modules (see Chapter 4, Configuring CP
Databases, on page 51)
- Command and control of sensors (see Chapter 5, Managing
Sensors, on page 73)
- Storage and archiving of raw data (see Chapter 6, Archiving Sensor
Data, on page 81)
- Simultaneous reprocessing of lightning locations from raw data (see
Chapter 7, Reprocessing Historical Data, on page 97)
- Access to stored lightning location information (see Chapter 8,
Monitoring Sensor Performance, on page 99)
- Accumulation of sensor and network performance statistics with the
information available either from real-time or periodic log files (see
Chapter 8, Monitoring Sensor Performance, on page 99 through
Chapter 10, Analyzing Network Regional Quality, on page 147)
The functional differences of the CP models are described in the
following sections. Table 3 below provides an overview of the TIS
modules supported by the CP models. See Table 4 on page 13 for
additional details about the supported sensors. See Table 5 on page 14
for supported display programs.
Table 3 Supported TIS Modules
CP Model
CP7000 LF
CP8000 LF/VHF CP IMPACT family
TIS
Type
External
Networks
2)
CP
Sensors
IMPACT family
LPATS family
SAFIR 3000-2 LF
LS7000 family
LS5000
LPATS family
SAFIR 3000-2 VHF/LF
LS8000 family
Displays
®
LTraX
™ 3)
PLWS
4)
PDM
3)
LTraX
4)
PLWS
4)
PDM
3)
1)
Options
AP2000
DAM
AP2000
DAM
1) Other displays supported: TED, TWXS, 24-Byte TIS, NDS, Storm TraX®, THUNDER, VIS™.
2) CP workstations can be connected using the share function and lpbridged process.
3) Displays real-time 2-D stroke and/or flash data.
4) Displays real-time 3-D VHF event data and 2-D flash data.
12 ___________________________________________________________________M210557EN-A
Page 27

Chapter 2 _______________________________________________________________ Introduction
Table 4 Supported Sensors
Sensors
1)
LS8000 LF TOA and LF MDF:
LS7500 LF TOA:
LS7200 LF TOA:
LS7000 LF TOA and LF MDF:
LS5000 LF TOA:
IMPACT family
141-T
141-TES
LPATS family
Series III (with GPS)
LPATS IV
Measured Parameters CP Model
CP8000
Bearing angle to strike point
Peak signal strength
Sensor signal arrival time
Signal rise time
Signal peak-to-zero time
VHF-ITF:
Azimuth
Event signal arrival time
Signal amplitude
Signal density
CP8000
Sensor peak signal arrival time
Peak field value
Signal rise time
Signal decay time
VHF-ITF:
Azimuth
Event signal arrival time
Signal amplitude
Signal density
CP8000
Azimuth
Event signal arrival time
Signal amplitude
Signal density
CP7000
Bearing angle to strike point
CP8000
Peak signal strength
Sensor signal arrival time
Signal rise time
Signal peak-to-zero time
CP8000
Sensor peak signal arrival time
Peak field value
Signal rise time
Signal decay time
LF TOA and LF MDF:
Bearing angle to strike point
CP7000,
CP8000
Peak signal strength
Sensor signal arrival time
Signal rise time
Signal peak-to-zero time
LF TOA:
Peak signal strength
CP7000,
CP8000
Sensor signal arrival time
Signal rise time
Signal peak-to-zero time
VAISALA_______________________________________________________________________ 13
Page 28

User’s Guide______________________________________________________________________
Table 4 Supported Sensors (Continued)
Sensors
SAFIR 3000-2 LF TOA:
SAFIR 3000-2 VHF-ITF:
SAFIR 3000-2 (VHF/LF) LF TOA:
1)
Measured Parameters CP Model
CP7000,
Sensor peak signal arrival time
Peak field value
Signal rise time
Signal decay time
Azimuth
Event signal arrival time
Signal amplitude
Signal density
Sensor peak signal arrival time
Peak field value
Signal rise time
Signal decay time
VHF-ITF:
Azimuth
Event signal arrival time
Signal amplitude
Signal density
CP8000
CP8000
CP8000
1) The maximum numbers for a TIS are 512 sensors and 1024 transports. In networks with both
IMPACT and LPATS sensors, the minimum configuration is one IMPACT and three LPATS
sensors.
Table 5 Supported Display Programs
Display
LTraX Latitude, Longitude Latitude, Longitude,
PLWS Latitude, Longitude Latitude, Longitude,
PDM Latitude, Longitude Latitude, Longitude,
1) Other displays supported: TED,TWXS, 24-Byte TIS, NDS, Storm TraX, THUNDER, VIS.
1)
Type of Lightning Data Displayed
CP7000 CP8000
Total Lightning
Total Lightning
Altitude, Total LIghtning
CP7000 Functions
CP7000 processes lightning data from sensors that detect lightning in
the LF range. CP7000 calculates lightning location; providing latitude,
longitude, and time-of-arrival for each lightning event. The real-time
locations are for cloud-to-ground (CG) return strokes and/or flash data.
When configured for cloud lightning location, CP7000 calculates
locations for cloud lightning detected by some sensor models (see
section LF Cloud Lightning Reporting on page 19). Location
14 ___________________________________________________________________M210557EN-A
Page 29

Chapter 2 _______________________________________________________________ Introduction
information is displayed as latitude and longitude. CP7000 also
provides remote diagnostics of sensor functions.
The operational state of the CP processes and related sensors can be
determined, and network performance statistics gathered, logged, and
analyzed. Over time, the log files can be analyzed and changes in the
performance of the lightning network can be detected.
CP8000 Functions
CP8000 processes lightning signal data from sensors that detect
lightning events in both LF and VHF ranges. CP8000 calculates the
lightning location and time-of-arrival for each lightning event. CP8000
derives latitude and longitude from the raw data of LF sensors and
latitude, longitude, altitude from the data of VHF sensors. CP8000 also
provides remote diagnostics of sensor functions.
CP8000 supports all CP-compatible network displays; and can merge
the LF flash data with VHF flash data to produce a total lightning
output composed of cloud and cloud-to-ground data.
The operational state of the CP processes and related sensors can be
determined, and network performance statistics gathered, logged, and
analyzed. Over time, the log files can be analyzed and changes in the
performance of the lightning network can be detected.
VAISALA_______________________________________________________________________ 15
Page 30

User’s Guide______________________________________________________________________
CP Software Operation
CP uses Common Desktop Environment (CDE) for the graphical user
interface (GUI). CDE eliminates the requirement for always using a
command line interface, and allows use of the graphical interface over
a network.
The CP software runs on a Sun workstation with a UNIX-based
operating system that supports a single or multiprocessor
configuration. All software in the CP models is based on the same code
nucleus. CP functions as a single unit without software of other TIS
modules running on the same workstation. Vaisala configures all
workstations it ships for operating the appropriate CP software.
Calculation of Lightning Locations
CP receives raw sensor data through the input-output daemon. Sensor
daemons take the raw sensor data, decode the lightning data contained,
and create well-defined sensor data messages. Data collected from
sensors can be processed as LF locations, VHF locations, and/or
LF/VHF total lightning locations.
LF Locations
Data collected by LF sensors is used to calculate stroke location data.
The location data can be used to calculate flash locations. The realtime lightning stroke and flash locations can be distributed to displays
or collected for further processing as total lightning.
The processed data includes:
- Date, time to 100-nanosecond resolution with local time zone
support (sensor clock accuracy varies by sensor type)
- Latitude, longitude (WGS-84)
- Signal strength and polarity, as either the average range normalized
signal or estimated peak current in kiloamperes
- Multiplicity for flash data, or zero for stroke data
- Number of sensors participating in the lightning location
- Degrees of freedom when optimizing the location
- Semi-major axis of the 50% positional confidence ellipse in
kilometers
16 ___________________________________________________________________M210557EN-A
Page 31

Chapter 2 _______________________________________________________________ Introduction
- Semi-minor axis of the 50% positional confidence ellipse in
kilometers
- Eccentricity of the positional confidence ellipse
- Angle of orientation of the positional confidence ellipse
- Positional confidence (chi-square)
- Rise time of the waveform in microseconds
- Peak-to-zero time of the waveform in microseconds
- Maximum rate of rise of the waveform in kA/µsec
- Cloud-to-ground and cloud discharge classification
VHF Locations
Data collected by VHF-ITF sensors is used to calculate VHF lightning
event locations. The VHF location data can be used to calculate VHF
flash locations.The real-time VHF lightning stroke and flash locations
can be distributed to displays or collected for further processing as total
lightning.
The processed VHF-ITF data includes:
- Date, time to 100-microsecond resolution with local time zone
support (sensor clock accuracy varies by sensor type)
- Latitude, longitude, and altitude (WGS-84, meters above/below sea
level)
- Degrees of freedom when optimizing the location
- Semi-major axis of the 50% positional confidence ellipse in
kilometers
- Semi-minor axis of the 50% positional confidence ellipse in
kilometers
- Eccentricity of the positional confidence ellipse
- Angle of orientation of the positional confidence ellipse
- Number of sensors participating in the lightning location
- Positional confidence (reduced chi-square)
VAISALA_______________________________________________________________________ 17
Page 32

User’s Guide______________________________________________________________________
LF/VHF (Total Lightning) Locations
The total lightning locations of CP8000 combine both LF and VHF
data to develop lightning location information from preliminary
breakdown to ground strokes. The addition of the higher-frequency
components of the lightning discharge (VHF) makes it possible to
reconstruct the path (map) of the cloud discharge. In VHF lightning
mapping, the detailed structure of the lightning event is shown clearly ,
but broad-area coverage and information about polarity, charge, and
current magnitudes are minimal. The LF sensors provide the
information about polarity, charge, and current magnitudes.
LF/VHF total lightning processes combine flash data from LF and
VHF sensors (see Figure 4 below) into a time-sorted total lightning
data stream for distribution to displays and other peripheral devices.
Figure 4 Flow Chart of Total Lightning Location Processing
18 ___________________________________________________________________M210557EN-A
Page 33

Chapter 2 _______________________________________________________________ Introduction
Benefits to combining LF and VHF sensing and display:
- View of total lightning activity
- Early warning of cloud-to-ground lightning
- Determination of storm stage and intensity
- Identification of unique lightning characteristics associated with
severe weather:
- Extreme precipitation or hail
- Damaging gust fronts, turbulence, or wind shear conditions
- Tornado activity
- Greater understanding of cloud electrification processes
LF Cloud Lightning Reporting
Some LF sensor models report cloud lightning, in addition to cloud-toground lightning. An LF TIS mainly provides information on cloud-toground (CG) lightning flashes and strokes, however, CP7000 and
CP8000 can classify lightning messages as cloud lightning
independent of an LF sensor’s classification. This allows CP to support
cloud lightning for the LS7200, IMPACT CT, IMPACT ES, and
IMPACT ESP sensors, and the advanced digital signal processing
capabilities of the LPATS IV sensor. See section Classifying Cloud
Lightning for LF Sensors on page 154 for details on configuring your
software for cloud lightning.
Process Interconnections
CP operates in a network that includes sensors and other functional
units. The following sections describe the processes that function
within CP and interconnect CP with the network modules.
VAISALA_______________________________________________________________________ 19
Page 34

User’s Guide______________________________________________________________________
CP7000 Processes
Figure 5 below illustrates the process interconnections for CP7000.
T able 6 on page 21 and Table 7 on page 22 define the type and purpose
of the processes and the graphical user interfaces. Table 11 on page 26
defines the shared memory queues used by CP7000.
Figure 5 CP7000 Process Interconnections
20 ___________________________________________________________________M210557EN-A
Page 35

Chapter 2 _______________________________________________________________ Introduction
Table 6 Processes Used by CP7000
Type Name Function
Startup lpstart Starts and stops all processes configured in the
$APAHOME/etc/startup.cfg file
Core cdbd Manages database tables for:
- multiple, independent sensors
-displays
- processes
- transport configurations
fcalcd Correlates strokes to a flash
fhosed Generates the data formats used by Vaisala lightning displays
impactd Manages LF MDF and LF TOA information received from LS7000,
LS5000, LS8000, and IMP ACT sensors. It extract s the raw data from the
Raw Queue to form IMPACT data objects used by processes such as
located to compute locations. In addition, impactd posts the real-time
status of the sensors in the lightning network.
located Computes LF stroke locations. Processing real-time LF data and
reprocessing historical LF data uses located.
pandad Stores all sensor data to removable archive media
pdad Stores position data to disk
rawiod Manages all input and output between sensors and the CP
safird Manages VHF-ITF and LF TOA information received from LS7500,
LS7200, LS8000, and SAFIR 3000-2 LF sensors. It extracts the raw
data from the Raw Queue to form LF data objects used by processes
such as located to compute locations. In addition, safird posts the realtime status of the sensors in the lightning network.
sdd Creates, stores, and transmits binary secondary data based upon LF
cloud-ground location and VHF interferometry burst locations.
Secondary data is stored in daily files with a naming convention of
T$yyyymmdd.lp2 in the default $HOME/secondary directory.
series3d Manages data received from GPS-equipped LPATS Series III sensors. It
extracts the raw data from the Raw Queue to form LPATS Series III data
objects used by processes such as located to compute locations. In
addition, series3d posts the real-time status of the LPATS Series III
sensors in the lightning network.
series4d Manages data received from GPS-equipped LPATS IV sensors. It
extracts the raw data from the Raw Queue to form LPATS IV data
objects used by processes such as located to compute locations. In
addition, series4d posts the real-t ime status of the LPATS IV sensors in
the lightning network.
Database cdbe Configures the CP configuration database by command line entry
VAISALA_______________________________________________________________________ 21
Page 36

User’s Guide______________________________________________________________________
Table 6 Processes Used by CP7000 (Continued)
Type Name Function
Utility amond Programmable lightning and status ASCII formatter
attach Connects to IMPACT, LPATS or SAFIR sensors to send sensor
diagnostic and configuration commands
bridged Replicates data flowing through shared memory to other network
workstations
lnstatd Determines lightning network status by monitoring the state of the CP
core processes, configured sensors, and their associated transports.
After status information is gathered, it is consolidated and posted as a
combined status message for other processes to act upon.
lpbridged Bridges sensor data between two or more CPs
lpmon Acts as a diagnostic interface to the Message Queue and is used by
ApaControl to monitor processes
regionqc Accumulates network performance statistics for a specified region on a
daily basis and stores the results in a log file. The statistics computed
include: the average chi-square, the median semi-major axis of the
confidence ellipse, the percentage of lightning with optimized positions,
a lightning count, and the average number of sensors reporting each
lightning event.
sensorqa Accumulates statistics related to sensor performance within the network
Table 7 GUIs Used by CP7000
Name Function
ApaConfig Provides a graphical user interface to the CP configuration database. The
ApaConfig GUI uses cdbe to communicate with a remote CP workstation.
ApaControl Provides a graphical user interface for monitoring and controlling the CP7000.
The ApaControl GUI uses lpmon as an interface into the Message Queue.
Attach Provides a graphical user interface for attaching to a selected sensor to perform
diagnostics
intersect Map-based GUI that graphically plots real-time 2-D lightning data. The intersect
process provides zoom capability , map layer and color configur ation, and det ailed
information on each lightning event. Historical (archive) lightning may be loaded
for analysis without interfering with the real-time lightning.
LpaControl Controls spooling of archive files to off-line storage
StartupConfig Provides a graphical user interface for configuring the startup.cfg file
CP8000 Processes
CP8000 supports LF and VHF sensors and includes all CP7000
functions. Figure 6 on page 23 illustrates the process interconnections
for CP8000.
T able 8 on page 24 and Table 9 on page 25 define the type and purpose
of the processes and graphical user interfaces. Table 11 on page 26
defines the shared memory queues used by CP8000.
22 ___________________________________________________________________M210557EN-A
Page 37

Chapter 2 _______________________________________________________________ Introduction
Figure 6 CP8000 Process Interconnections
VAISALA_______________________________________________________________________ 23
Page 38

User’s Guide______________________________________________________________________
Table 8 Processes Used by CP8000
Type Name Function
Startup lpstart Starts and stops all processes configured in the
$APAHOME/etc/startup.cfg file
Core cdbd Manages database tables for:
- multiple, independent sensors
-displays
- processes
- transport configurations
fcalcvd Groups VHF event positions into flashes. The fcalcvd process receives
VHF event data from locatevid, and writes VHF flash data to the VHF
Flash Data Queue using a standard interprocess connection method.
The output is in time order, based on the time of the event nearest the
center of the flash, and is used by the ldmerged process to create total
lightning flashes.
fcalcd Correlates strokes to flash
fhosed Generates the data formats used by Vaisala lightning displays
impactd Manages LF MDF and LF TOA information received from LS70 00,
LS5000, LS8000, and IMPACT sensors. It extracts the ra w data from th e
Raw Queue to form IMPACT data objects used by processes such as
located to compute locations. In addition, impactd posts the real-time
status of the sensors in the lightning network.
located Computes LF stroke locations. Processing real-time LF data and
reprocessing historical LF data uses located.
locatevid Computes VHF event locations in space, based on the VHF data sent by
VHF sensors. Processing real-time VHF data and reprocessing
historical VHF data uses locatevid.
ldmerged Merges LF and VHF lightning data streams into one time-sorted,
lightning data stream. The ldmerged daemon processes and
reprocesses LF and VHF lightning into total lightning flashes.
pandad Stores all sensor data to removable archive media
pdad Stores position data to disk
rawiod Manages all input and output between sensors and the CP
safird Manages VHF-ITF and LF TOA information received from LS7500,
LS7200, LS8000, and SAFIR 3000-2 LF sensors. It extracts the raw
data from the Raw Queue to form LF data objects used by processes
such as located to compute locations. In addition, safird posts the realtime status of the sensors in the lightning network.
sandad Logs daily files of VHF-ITF sensor data. These files are compatible with
the DAM analysis tool set. Primary dat a files cont ain sensor dat a from all
sensors and the data is not in time order.
sdd Creates, stores, and transmits binary secondary data based upon LF
cloud-ground location and VHF interferometry burst locations.
Secondary data is stored in daily files with a naming convention of
T$yyyymmdd.lp2 in the default $HOME/secondary directory.
24 ___________________________________________________________________M210557EN-A
Page 39

Chapter 2 _______________________________________________________________ Introduction
Table 8 Processes Used by CP8000 (Continued)
Type Name Function
Core series3d Manages data received from GPS-equipped LP ATS Series III sensors. It
extracts the raw data from the Raw Queue to form LPATS Series III data
objects used by processes such as located to compute locations. In
addition, series3d posts the real-time status of the LPATS Series III
sensors in the lightning network.
series4d Manages data received from GPS-equipped LPATS IV sensors. It
extracts the raw data from the Raw Queue to form LPATS IV data
objects used by processes such as located to compute locations. In
addition, series4d posts the real-t ime status of the LPATS IV sensors in
the lightning network.
Database cdbe Configures the CP configuration database by command line entry
Utility amond Programmable lightning and status ASCII formatter
attach Connects to IMPACT, LPATS, or SAFIR sensors to send sensor
diagnostic and configuration commands
bridged Replicates data flowing through shared memory to other network
workstations
lnstatd Determines lightning network status by monitoring the state of the CP
core processes, configured sensors, and their associated transports.
After status information is gathered, it is consolidated and posted as a
combined status message for other processes to act upon.
lpbridged B rid ge s sen so r da ta betwee n two or mo r e CPs
lpmon Acts as a diagnostic interface to the Message Queue and is used by
ApaControl to monitor processes
regionqc Accumulates network performance statistics for a specified region on a
daily basis and stores the results in a log file. The statistics computed
include: the average chi-square, the median semi-major axis of the
confidence ellipse, the percentage of lightning with optimized positions,
a lightning count, and the average number of sensors reporting each
lightning event.
sensorqa Accumulates statistics related to sensor network performance
Table 9 GUIs Used by CP8000
Name Function
ApaConfig Provides a graphical user interface to the CP configuration database. The
ApaConfig GUI uses cdbe to communicate with a remote CP workstation.
ApaControl Provides a graphical user interface for monitoring and controlling the CP. The
ApaControl GUI uses lpmon as an interface into the Message Queue.
Attach Provides a graphical user interface for attaching to a selected sensor to
perform diagnostics
intersect Map-based GUI that graphically plots real-time 2-D lightning data. The
intersect process provides zoom capability , map layer and color configuration,
and detailed information on each lightning event. Historical (archive) lightning
may be loaded for analysis without interfering with the real-time lightning.
LpaControl Controls spooling of archive files to off-line storage
StartupConfig Provides a graphical user interface for configuring the startup.cfg file
VAISALA_______________________________________________________________________ 25
Page 40

User’s Guide______________________________________________________________________
Operating Specifications
The following tables provide the operating specifications for the CP
models.
Table 10 Physical Specifications
Requirement Specification
Environment Operating
temperature
Non-operating
temperature
Relative humidity 40% to 80%, noncondensing
Power 100 to 240 VAC, 47 to 63 Hz, 400 VA
Table 11 Data Processing Capabilities
Specification CP7000 CP8000
Sensor reports for input Up to 100 LF reports per
sensor per second
50 ºF to 95 ºF (10 ºC to 35 ºC)
–4 ºF to 158 ºF (–20 ºC to 70 ºC)
Up to 100 LF reports per
sensor per second
Lightning locations
processed
Up to 100 LF stroke
locations per second
Up to 100 LF flash
locations per second
Up to 10 000 VHF
reports per sensor per
second
Up to 100 LF stroke
locations per second
Up to 100 LF flash
locations per second
Up to 1000 VHF event
locations per second
Up to 1000 VHF flash
locations per second
Up to 1100 total
lightning flash locations
per second
26 ___________________________________________________________________M210557EN-A
Page 41

Chapter 2 _______________________________________________________________ Introduction
Table 12 CP to Sensors Communication Interfaces
Type Communication Interface
Serial Asynchronous serial:
16 or 32 ports
25-pin D-connectors
Full modem control
115 200 bps
Network Ethernet or Fast Ethernet
10Base-T or 100Base-T
Table 13 Output Protocols
Type Output Protocol
Serial Asynchronous serial
Network TCP/IP
Socket
UDP (User Datagram Protocol)
Multicast
PPP (Point-to-Point Protocol)
Table 14 Storage Capacity for Lightning Data
CP Model
CP7000 LF lightning strokes at rate of
CP8000 VHF lightning events 180 days
1) Raw sensor data is stored to disk then spooled to off-line storage as needed.
Lightning Data
100/sec
LF flash 180 days
VHF flash 180 days
Primary data 180 days
Secondary data 180 days
1)
Minimum
180 days (about 45 million
strokes)
VAISALA_______________________________________________________________________ 27
Page 42

User’s Guide______________________________________________________________________
Optional Modules
Optional modules provide for archival processing, real-time display of
data, and analysis of historic lightning information.
Processing Modules
The optional Archival Processor AP5000 network module and FALLS
server.
AP5000 Provides enhanced distribution of data to TIS users on a
real-time or archived basis. AP5000 supports FALLS
Servers.
FALLS
Server
Server version for running multiple FALLS user
terminals
Software Modules
The optional software modules let you display and analyze sensor data.
PDM Real-time total lightning display software
DAM Analyzes data from VHF/LF sensors. Analyzes historic
lightning densities and trends.
FALLS
Client
Analyzes historic lightning densities and trends,
correlates lightning strokes to suspected lightning
damage.
28 ___________________________________________________________________M210557EN-A
Page 43

Chapter 3 ______________________________________________________________Operating CP
CHAPTER 3
OPERATING CP
This chapter applies to all CP models.
Overview
This chapter addresses the operating procedures for the CP software.
Training is recommended for users who are not familiar with the UNIX
operating system, the X-Windows environment, or a Vaisala lightning
location system. It is assumed that the CP hardware is installed and
configured, the software is installed, the user account is established,
and the CP system is waiting for the user to log in.
Before beginning the login procedure, it is useful to understand the
three types of processes that are used in the CP:
- Core (daemon) processes
- Utility processes
- Graphical user interface (GUI) processes
Core Processes
Core processes are required to run the basic CP system and run as
daemon processes that are automatically started when the workstation
is booted. Except for status messages, daemon processes run in the
background after the login procedure is completed, and stop
automatically when the workstation is shut down. The daemon
processes provide the base CP functionality which includes processing
lightning, supporting displays, and logging raw data to disk. All core
VAISALA_______________________________________________________________________ 29
Page 44

User’s Guide______________________________________________________________________
process names end with the letter d. For example, the d at the end of
pandad indicates it is the panda (position analyzer network data
archive) process running as a daemon process.
Utility Processes
Utility processes are applications that provide additional information
about the operation of the CP or extend its functionality. The utility
processes are not crucial to the operation of the CP. Unlike core
processes, the utility processes require manual starting after logging in.
One example of a utility process is sensorqa, which monitors the
lightning location data produced by the CP and accumulates statistics
that help determine how well the lightning network is performing.
GUI Processes
The GUI processes require the user to be logged in and require manual
starting. GUIs appear as windows that allow the user to configure and
monitor the CP functions. Table 15 below lists the window title
displayed for each GUI.
Table 15 GUIs
GUI Window Title
ApaConfig APA Config
ApaControl APA Control
Attach AttachImpact
AttachIt
intersect Intersect
LpaControl LP Archive Control
StartupConfig Startup Configuration Editor
Starting and Stopping the CP
The following sections describe procedures for logging in, starting CP
processes, and stopping CP processes.
Logging In
The Common Desktop Environment (CDE) login banner will be
displayed on the console when the workstation is started.
30 ___________________________________________________________________M210557EN-A
Page 45

Chapter 3 ______________________________________________________________Operating CP
To log in to the CP Series workstation:
1. Enter the user name apa and the password 1996apa.
Both the user name and password are case sensitive and must be
entered with the correct capitalization for the system to accept
them. The apa user account is the account that is used for
configuring and monitoring the CP.
2. Open a Terminal window, if one is not already open, by clicking
the Terminal icon (see Figure 7 below) on the CDE control
panel.
Figure 7 Terminal Icon
NOTE
Starting Core Processes
Defined core processes automatically start when the workstation boots
up (system start); however, they may be shut down manually. After the
system starts, check which processes are running, if any. The status of
some core processes will need to be changed for some CP8000
functions; and may be changed for CP7000 functions. Changes are
made to core processes using the StartupConfig GUI (see Chapter 11,
Advanced CP Configuration, for more information).
The prompt character(s) displayed by the system are not typed by the
user when entering commands. Therefore, the following examples of
command line entry show only the text typed by the user.
To determine which core processes are running:
-In a Terminal window, enter the following command after the
apa:{~}> prompt:
lpstart -core status
This command displays the name, tag, state, and ID of each
configured core process.
VAISALA_______________________________________________________________________ 31
Page 46

User’s Guide______________________________________________________________________
To start core processes:
-In a Terminal window, enter the following command after the
apa:{~}> prompt:
lpstart -core start
Starting Utility Processes
Once the core processes are running, the utility processes can be
started.
To start the utility processes:
-In a Terminal window, enter the following command after the
apa:{~}> prompt:
lpstart -util start
By default, the sensorqa window opens. This window represents
the process used for quality assurance. Refer to Chapter 8,
Monitoring Sensor Performance, for more information on sensorqa.
Starting GUI Processes
Once the core processes and utility processes are running, the GUI
processes can be started.
To start the GUI processes:
1. In a Terminal window, enter the following command after the
apa:{~}> prompt:
lpstart -gui start
To start the LpaControl GUI for CP8000, enter the following
command after the apa:{~}> prompt:
lpstart -gui start LpaControl
2. If the GUI windows are minimized, open them by doubleclicking their icons.
3. If the GUI icons are not visible, open the Apa Apps pop-up
menu and click the icon next to the desired GUI (see Figure 8 on
page 33). To open the Apa Apps pop-up menu, click the up
32 ___________________________________________________________________M210557EN-A
Page 47

Chapter 3 ______________________________________________________________Operating CP
arrow above the Apa Control icon on the CDE control panel at
the bottom of the display.
CP_apa_apps_01
Figure 8 Typical Window for Accessing the GUIs
Starting All CP Processes
For convenience, all of the processes can be started at the same time
with one command.
To start all the core, utility, and GUI processes:
- After the apa:{~}> prompt, type:
lpstart -all start
Refer to the lpstart man page for all the options available.
Stopping the CP
When the workstation is shut down, the core processes are stopped as
part of the normal shutdown procedure.
To stop the core processes manually:
- After the apa:{~}> prompt, type:
lpstart stop
VAISALA_______________________________________________________________________ 33
Page 48

User’s Guide______________________________________________________________________
To stop the GUI processes:
- After the apa:{~}> prompt, type:
lpstart -gui stop
To stop the utility processes:
- After the apa:{~}> prompt, type:
lpstart -util stop
To stop all the core, utility, and GUI processes:
- After the apa:{~}> prompt, type:
lpstart -all stop
Refer to the lpstart man page for all the options available.
Using the ApaControl GUI
The ApaControl GUI monitors and displays the current state of the CP:
the status of the processes, the status of archiving raw data to disk, and
the status of the sensors. Figure 9 on page 35 shows the APA Control
window, its menus, panels, and buttons.
Using the Processes Panel
The Processes panel displays the name of each core and utility process
in an indicator box. An outline surrounds the indicator box to show the
selected process. At the bottom left of the APA Control window (see
Figure 9 on page 35) are four buttons that allow the user to control and
get information about a process. The buttons start, stop, reset, and
provide information about the selected process. The button names and
icons follow:
Start button Reset button
Stop button Information
button
34 ___________________________________________________________________M210557EN-A
Page 49

Chapter 3 ______________________________________________________________Operating CP
Menu Bar
Processes Panel
Selected Process
Status Panel
Figure 9 APA Control Window
To start a process:
Archive File
System Panel
Sensors Panel
Overflow File
System Panel
- Select the process, then click the Start button.
To stop a process:
- Select the process, then click the Stop button.
To reset (restart) a process:
- Select the process, then click the Reset button. Resetting a process
combines the stop and start operations.
To gather additional information about a process:
- Select the process, then click the Information button. The Process
Info window opens, displaying information about the process. The
Dismiss button closes the window.
Using the Sensors Panel
The Sensors panel, located on the right side of the APA Control
window, displays an indicator box for each sensor listed in the sensor
VAISALA_______________________________________________________________________ 35
Page 50

User’s Guide______________________________________________________________________
folder tables. An outline surrounds the indicator box to show a selected
sensor (see Figure 10 below).
Sensors Menu
Indicator Box
Selected Sensor
Sensors Panel
Sensor Information
Button
Figure 10 Managing Sensors with the ApaControl GUI
Selecting Label Formats and Sort Sequence
Use the Sensors menu (see Figure 11 on page 37) to select how the
Sensors panel displays the sensors. Table 16 on page 36 describes
what each option in the Sensors menu does. The sequence for listing
the sensors is in ascending order based on the sort criterion selected.
Table 16 Sensor Display Options in APA Control
Label with Sort by Uses the...
Decimal ID ID Decimal value of the sensor ID number
Hex ID --- Hexadecimal value of the sensor ID number
Abbreviation Abbreviation Abbreviation entered in the sensor configuration table
Full Name Full Name Full name entered in the sensor configuration table
--- Type Type of sensor
--- Tag Tag for the process controlling the sensor
Sort #1 Sort #1 Sort1 value entered in the sensor configuration table
Sort #2 Sort #2 Sort2 value entered in the sensor configuration table
Sort #3 Sort #3 Sort3 value entered in the sensor configuration table
36 ___________________________________________________________________M210557EN-A
Page 51

Chapter 3 ______________________________________________________________Operating CP
apactrl4
Figure 11 Sensors Menu
It is common to sort the sensors according to the label; however, other
criteria may be used.
To select a sensor label format and a sort criterion:
-From the Sensors menu in the APA Control window, select the
desired label format and sort criteria options.
For example: To display the decimal ID for each sensor in the
indicator box, select Label w/Decimal ID. Suppose you used the
Sort1 field in the sensor configuration tables to show the county in
which each sensor is installed. To list the sensors in ascending
alphabetical order by county name, select Sort By Sort #1.
The Fixed-Width Labels option in the Sensors menu limits the
number of characters for the label to four. This is useful for networks
with a large number of sensors as illustrated by Figure 12 below.
To use a fixed width for the sensor labels:
-From the Sensors menu in the APA Control window, select FixedWidth Labels.
Determining Sensor Status
The ApaControl GUI uses two items to display the status of a sensor:
- Status character after the sensor label (see Figure 12 on page 38).
VAISALA_______________________________________________________________________ 37
Page 52

User’s Guide______________________________________________________________________
A slash character ( / ) separates the sensor label from the status
character.
- Status color for the sensor indicator box (see Figure 13 on page 39)
Figure 12 APA Control Window
To display a status character at the end of the sensor label:
-From the Sensors menu in the APA Control window, select Show
Status Character (see Figure 11 on page 37).
Status information also displays in the Sensor/Transport Info dialog
box (see section Displaying Additional Information about Sensors on
page 40). The Sensor Info portion displays status characters for the
sensor and GPS synchronization in the Status Character and Clock
Sync fields, respectively.
Table 17 below describes each character that indicates sensor, GPS
synchronization, and transport status. While some characters are used
for all three types of status, the meanings vary. The character (_) is an
underscore character. The abbreviation sync refers to the
synchronization of the GPS clock.
Table 17 Status Characters and Their Meanings
Status
Character
_ Status unknown No sync information
? Status unknown Possibly out of sync Status unknown
Sensor Status GPS Status Transport Status
No associated transport
received
ApaCntrl5c
38 ___________________________________________________________________M210557EN-A
Page 53

Chapter 3 ______________________________________________________________Operating CP
Table 17 Status Characters and Their Meanings (Continued)
Status
Character
0 Timed out (no status from
D Down (no message from
1)
U
B Buffer reset
NNoisy
P Software load
R No valid message from sensor
S Sensor is out of sync
T Sensor time inaccurate
W Sensor is waiting for initial sync
1) Character appears in Sensor/Transport Info dialog box only.
Sensor Status GPS Status Transport Status
Timed out waiting for sync
sensor daemon)
sensor)
Up In sync Up
for 10 minutes
status
Out of sync Down
Timed out waiting for
transport status
The remaining method for determining sensor status is by the color of
the sensor indicator box (see Figure 13 below). The color depends on
the status conditions that apply to the sensor, its GPS synchronization,
and its transport. Most of the status conditions cause a yellow
indicator, several cause a red indicator, and only one combination
causes a green indicator.
Label color = green, no status character = sensor appears to be up
Label color = yellow, /W = waiting for initial sync to GPS clock
Label color = yellow, /? = sensor status is unknown
Label color = red, /R = no valid message from sensor for 10 minutes
Label color = red, /D = sensor is down (no message from sensor)
Label color = yellow, /S = sensor clock is out of sync
Figure 13 Color Indicators for State of Sensor
VAISALA_______________________________________________________________________ 39
Page 54

User’s Guide______________________________________________________________________
Table 18 below shows the conditions that determine the color of the
sensor indicator boxes. To determine the specific reason for a red or
yellow indicator box, open the Sensor/T ransport Info dialog box. See
section Displaying Additional Information about Sensors on page 40.
In the Sensor Info portion, observe the Reason, Clock Sync, and
Status Character fields. The Reason field in the Sensor Info portion
displays the conditions that affect the sensor status (see Table 18
below). The text, Data below is last received, refers to additional
fields included in the Sensor Info portion. The Status Character and
Clock Sync fields display the status codes for the sensor and GPS
synchronization, respectively.
Table 18 Sensor State Indicators
Color Character Reason Field Status of: Meaning
Background _
_
Red 0 No Status From Transport. Data
Red 0 No Status From Daemon. Data
Red D Transport Down Transport Down
Red D Sensor Has Down Status Sensor Down
Red R Sensor Has Not Reported Valid
Green U
U
Yellow Various
Various
No Sensor Status Info Available Sensor
Transport
Transport Timed out waiting for
below is last received.
Sensor Timed out
below is last received.
Sensor No valid message for
Msgs for >10 Min
Sensor Appears to be Up Sensor
GPS
Sensor Has (sensor status
character) Status
and
(GPS status character) Clock Sync
Sensor
GPS
No status available
No associated
transport
transport status
10 minutes
Up
In sync
See Table 17 on
page 38
See Table 17 on
page 38
Displaying Additional Information about Sensors
Use the sensor Information button at the bottom of the Sensors panel
to access additional information about a selected sensor, its GPS
synchronization, and its transport, along with access to the Attach GUI.
Clicking a sensor indicator box selects that sensor, and makes the
Information button active (see Figure 14 on page 41).
To display additional information about a selected sensor and its
transport:
- Click the Information button to open the Sensor/Transport Info
dialog box.
40 ___________________________________________________________________M210557EN-A
Page 55

Chapter 3 ______________________________________________________________Operating CP
Selected Sensor
Opens Sensor/Transport
Info Dialog Box for
Selected Sensor
Figure 14 Sensor Information Button
The Sensor Info and the Transport Info buttons toggle between the
display of sensor and transport information. The selected button is
highlighted to indicate the information displayed.
To display sensor information fields:
-Click Sensor Info.
To display transport information fields:
-Click Transport Info.
To attach to a selected LF sensor:
-Click Attach.
The Zero Sensor Stats button and the Zero Transport Stats button
cause fields containing accumulated statistics to be reset to zero.
To zero accumulated statistics for the selected sensor:
-Click Zero Sensor Stats.
VAISALA_______________________________________________________________________ 41
Page 56

User’s Guide______________________________________________________________________
To zero accumulated statistics for the selected sensor’s transport:
-Click Zero Transport Stats.
The Reset Transport button sends a message that requests the sensor’s
transport be reset. Resetting the transport is usually done by closing
and reopening it.
To reset the selected sensor’s transport:
-Click Reset Transport.
Selecting a different sensor and clicking the Information button while
the Sensor/Transport Info dialog box is active displays the
information associated with the newly selected sensor.
To close the Sensor/Transport Info dialog box:
-Click Dismiss.
The information in the Sensor/Transport Info dialog box is useful for
diagnosing error conditions indicated by a yellow or red sensor
indicator box. The fields displayed depend on the type of sensor
selected. For details about the LS7000, LS75000, IMPACT, LPATS
Series III, and LPATS IV information fields, refer to the CP Series™
Reference Guide.
42 ___________________________________________________________________M210557EN-A
Page 57

Chapter 3 ______________________________________________________________Operating CP
Setting Audible Condition Alarms
Audible alarms may be used to warn when the condition of processes,
data file systems, or sensors reaches a user-defined threshold. You set
the threshold value, select the audio file to produce the alarm, and set
the alarm volume in the Thresholds dialog box (see Figure 15 below).
NOTE
Figure 15 Setting Thresholds
To open the Thresholds dialog box:
-From the File menu in the APA Control window, select Set
Threshold Values.
The value entered in each threshold field determines when the alarm
will sound. A drop-down list next to each threshold field contains
the available audio files that create the alarm sounds. The value
entered in the Vol field controls the volume of the alarm. The values
for the Vol field range from 1 through 100 and represent a
percentage of the available speaker volume.
For changes in the Thresholds dialog box to take effect, you must
restart the ApaControl GUI.
VAISALA_______________________________________________________________________ 43
Page 58

User’s Guide______________________________________________________________________
The Process Thresholds panel controls the alarm conditions for the
core and utility processes. The threshold fields set the number of
processes of each type that must not be functioning for an alarm to
sound.
The Data Archive Thr esholds panel controls the alarm conditions for
the Archive and Overflow file systems. The thresholds set in this panel
control the audible alarms and when the analog gauge in the APA
Control window changes color. See section Using the Archive File
System Panel on page 45 and section Using the Overflow File System
Panel on page 46 for more information about the file system alarms.
The Sensor Thresholds panel controls the alarm conditions for sensor
status. A sensor is in a Down State when its indicator box is red. A
sensor is in a Warning State when its indicator box is yellow. A
combination of factors related to the sensor’s status, its transport status,
and its GPS synchronization status determine the sensor state. See
section Determining Sensor Status on page 37 for more details.
To set an alarm condition:
1. From the Sensors menu in the APA Control window, select Set
Threshold Values.
2. Enter an appropriate value in the threshold field.
3. Select the audio file by clicking the list button next to the
threshold field.
4. Set the volume level by entering a value in the Vol field.
5. Click Save to save the settings, or click Dismiss to close the
dialog box without making any changes.
6. For any changes to take effect, restart the ApaControl GUI.
To prevent the system from monitoring a condition:
- Set the condition threshold to zero.
Table 19 below shows the default values for the fields in the
Thresholds dialog box.
Table 19 Thresholds Dialog Box, Default Settings
Condition
Core Processes Down 1 (no sound) 0
Utility Processes Down 1 (no sound) 0
Archive Warning %
Default
Threshold
75 (no sound) 0
Default Audio
File
Default
Volume
44 ___________________________________________________________________M210557EN-A
Page 59

Chapter 3 ______________________________________________________________Operating CP
Table 19 Thresholds Dialog Box, Default Settings (Continued)
Condition
Archive Bad %
Overflow Warning %
Overflow Bad %
Sensors In Down State 1 (no sound) 0
Sensors In Warning State 1 (no sound) 0
Default
Threshold
90 (no sound) 0
50 (no sound) 0
75 (no sound) 0
Default Audio
File
Default
Volume
Using the Archive File System Panel
The APA Control window displays the current state of the Archive
and Overflow file systems. Raw sensor data is stored by the pandad
process in these file systems. The Archive file system, the primary
storage location for the raw data, is a UNIX file system located on
removable media.
The Archive File System panel (see Figure 9 on page 35) shows the
amount of space used on the media and if data is being written to the
file system. A raised panel border indicates pandad is writing to the
file system. The status of the file system is indicated visually by the
color of the analog gauge (green, yellow, or red) and audibly by an
alarm tone.
Set the thresholds for visual and audible alarms in the Thresholds
dialog box (see Figure 15 on page 43). Values in the Archive
Warning % and Archive Bad % fields determine when the analog
guage changes color and when the alarm sounds. The audio files
selected and the levels set in the Vol fields define the alarm sounds.
When the usage of the Archive file system is less than the Archive
Warning % value, the gauge is green. The gauge is red when the
usage is greater than or equal to the Archive Bad % value. The gauge
is yellow when the usage is between the two threshold values. See
Table 19 on page 44 for the default values.
The pandad process automatically switches to the Overflow file
system when the Archive file system becomes 100% full. Change the
removable media while the CP is writing to the Overflow file system.
VAISALA_______________________________________________________________________ 45
Page 60

User’s Guide______________________________________________________________________
To manually switch file systems:
-Click Data Archive Change (see Figure 16 below) on the APA
Control window.
arcvchng
Figure 16 Data Archive Change Button
Using the Overflow File System Panel
The Overflow File System panel (see Figure 9 on page 35) shows the
amount of space used on the media and if data is being written to the
file system. A raised panel border indicates pandad is writing to the
file system. The status of the file system is indicated visually by the
color of the analog gauge (green, yellow, or red) and audibly by an
alarm tone.
Set the thresholds for the visual and audible alarms in the Thresholds
dialog box (see Figure 15 on page 43). Values in the Overflow
Warning % and Overflow Bad % fields determine when the analog
gauge changes color and when the alarm sounds. The audio files
selected and the levels set in the Vol fields define the alarm sounds.
When the usage of the Overflow file system is less than the Overflow
Warning % value, the gauge is green. The gauge is red when the
usage is greater than or equal to the Overflow Bad % value. The
gauge is yellow when the usage is between the two threshold values.
See Table 19 on page 44 for the default values.
When the Overflow file system becomes 100% full, storage of data
must be switched to the Archive file system or lightning data will be
lost.
To switch from the Overflow file system to the Archive file system:
-Click Data Archive Change (see Figure 16 above) in the APA
Control window.
46 ___________________________________________________________________M210557EN-A
Page 61

Chapter 3 ______________________________________________________________Operating CP
Using the LpaControl GUI
The LpaControl GUI controls the spooling of data from the Archive
file system, and writing of the spooled data to an optional data storage
device such as a CD writer or tape. CP writes lightning data to the
Archive file system until it is full. Then, the pandad process switches
additional incoming data to the Overflow file system, and, if so
configured, LpaControl automatically transfers the Archive file
system data to the Spool location. When the Archive file system
empties, LpaControl commands pandad to transfer the Overflow data
to the Archive file system and starts writing new data there as well.
The data storage device receives the spooled data either automatically
or manually. Manual control of the spool and storage device allows
transfer of the archive file data at any time.
Starting the LpaControl GUI opens the LP Archive Control window
(see Figure 17 below). The window uses the analog Spool Device
gauge to graphically display the percentage of spooling space (/spool)
currently in use. Text beneath the gauge indicates the amount of used
spooling space in two formats: a percent and a ratio of used space to
total storage space in megabytes.
LpaCtrol_01
Figure 17 Opening LP Archive Control
To configure the spool and storage devices using the LpaControl
GUI:
1. Start the LpaControl GUI by doing one of the following:
- Double click the LpaControl icon (see Figure 17 above).
-In a Terminal window, enter the following command after the
apa:{~}> prompt:
lpstart -gui start LpaControl
VAISALA_______________________________________________________________________ 47
Page 62

User’s Guide______________________________________________________________________
2. Select Setup Devices from the File menu to open the Devices
dialog box (see Figure 18 below).
LpaCtrol_02
Figure 18 Opening the Devices Dialog Box
3. Configure the spool device:
a. Enter the location for the spool device in the Location
field (see Figure 18 above).
b. To compress files as they move from the spool area to
archive, select Compress files on move to spool?.
4. Configure the storage device:
a. Select the type of storage device from the Device Type list
(see Figure 19 below).
The script for moving the data to the storage device
displays in the Device Type field.
Storage
Device
List
Lpa_control_04
Figure 19 Storage Device Types for LpaControl
48 ___________________________________________________________________M210557EN-A
Page 63

Chapter 3 ______________________________________________________________Operating CP
b. For automatic storage of the spooled data, enter a non-zero
percentage for how full the spool device must be to move
the data to the storage device. For manual storage of the
spooled data, enter 0 (zero) in the percentage field.
c. Select the audio file that will sound when automatic
storage starts, and set the volume level.
5. To save the configuration, click Save, or click Dismiss to ignore
changes.
6. To quit the LpaControl GUI, select Exit from the File menu.
VAISALA_______________________________________________________________________ 49
Page 64

User’s Guide______________________________________________________________________
This page intentionally left blank.
50 ___________________________________________________________________M210557EN-A
Page 65

Chapter 4 ___________________________________________________ Configuring CP Databases
CHAPTER 4
CONFIGURING CP DAT ABASES
This chapter applies to all CP models.
Overview
Vaisala provides the initial system configuration of CP. Databases
composed of multiple tables store the system configuration parameters.
The ApaConfig GUI provides the interface for creating and modifying
databases. Once the system is operating, you rarely need to access the
configuration tables (files). After an evaluation of network
performance, you may need to change sensor configuration parameters
to enhance detection efficiency. Adding additional sensors, lightning
displays, or access to other lightning detection networks are other
reasons for accessing the configuration tables.
Changing the configuration involves selected tasks that depend on the
nature of the change. Configuring a system involves all of the
following tasks:
- Define Universal Resource Locators (URLs) for physical
connections to TIS modules.
- Create a Mapping Table for the lightning detection network. If the
configuration changes, add to or update the Mapping Table.
- Use the ApaConfig GUI to configure the realtime database (the
database all processes access by default):
- Assign transport IDs
- Configure an external network and associate IDs to network
components
VAISALA_______________________________________________________________________ 51
Page 66

User’s Guide______________________________________________________________________
- Configure the sensors and associate sensor IDs
- Configure the lightning displays and associate display IDs
- If required, configure the position data archive daemon process
(pdad)
- If required, configure the network data archive daemon process
(pandad)
- For LF sensor processes used by the CP7000 and CP8000,
configure how the located process determines lightning positions.
Defining a URL
CP uses Universal Resource Locators (URLs) to describe physical
connections. The most commonly used URLs are for serial devices.
The URL defines the connections of sensors and other associated
hardware to the CP.
All URL names have a communications protocol identifier and a colon
followed by two forward slashes. For example, serial:// indicates that a
serial port will be used. Further configuration parameters are specified
after this identifier (tag field).
Not all processes support all URLs. For example, rawiod, which is
responsible for reading and writing sensor data, does not support the
ifile:// device because it is read-only and rawiod needs to write data.
To determine what URLs a process supports, enter the process name
followed by either the -raw_ipc_list or -data_ipc_list command
option. The following list explains the names of devices, and their
associated URLs.
52 ___________________________________________________________________M210557EN-A
Page 67

Chapter 4 ___________________________________________________ Configuring CP Databases
serial://[path],bps,p,d,s,f,c
path represents the path for the serial device. The path is
required.
bps represents the baud rate: enter appropriate rate value in the
range of 300 to 38400. The default baud rate is 19200.
p represents the parity: use n for no parity , e for even parity, or o
for odd parity. The default is n for no parity.
d represents data bits: use 7 or 8. The default value for data bits
is 8.
s represents stop bits: use 1 or 2. The default value for stop bits
is 1.
f represents hardware flow: use n for no flow control or f for
flow control. The default is n.
c represents the carrier detect: use y to honor carrier detect or n
to not honor carrier detect. The default is n to not honor carrier
detect.
tcp://[host:]port
Connect to the host at the TCP/IP port number. If host is not
specified, the application becomes a server for data at this
TCP/IP port number. Only one client may connect to this
TCP/IP port.
tcps://port
The application is a server for multiple clients connecting to
data at this TCP/IP port number.
udp://[port][,host:port[,host:port...]][,all]
This IPC method can be used for bidirectional communications
(read/write) between two different processes which may or may
not be running on the same machine. It supports both multicast
and broadcast capability across multiple machines (you can
connect two or more processes on one or more machines).
Using this method in true multicast requires special
considerations (refer to section Multicasting on page 169).
ifile://path
Read from the file specified by path. Path should start with a
leading forward slash (/).
ofile://path
Write to the file specified by path. Path should start with a
leading forward slash (/).
VAISALA_______________________________________________________________________ 53
Page 68

User’s Guide______________________________________________________________________
afile://path
Append to the file specified by path. Path should start with a
leading forward slash (/).
stdout://
Write to stdout.
stderr://
Write to stderr.
stdin://
Read from stdin.
smq://path
Read/write shared memory queue (SMQ) specified by path.
Path should start with a leading forward slash (/) as shown in
the following example:
smq:///opt/GAIapa/var/spool/queues/Messages
To search in the directories that are specified in the SMQPATH
environment variable, omit the leading slash as shown in the
following example:
smq://Messages
Using the ApaConfig GUI
The ApaConfig GUI lets you delete, create, save, revert, and edit
database tables (for example, Transport, Network, and Sensor folders).
The ApaConfig GUI lets you manage the configuration tables for
processes such as the position data archive (pdad) and network data
archive (pandad) daemons. Starting the ApaConfig GUI opens, the
APA Config window.
The APA Config window (see Figure 20 on page 55) is a database
editor and uses two panels to display the table names and entry fields.
The left panel displays the database as a hierarchical tree. The top level
of the tree displays the database name, and subsequent levels display
the configuration tables as files. Folders contain indexed configuration
tables of similar information.
The right panel (edit panel) of the APA Config window displays
instructions and database entry fields pertinent to each selected table.
You may need to use the scroll bar on the right edge of the panel to
view all the fields.
54 ___________________________________________________________________M210557EN-A
Page 69

Chapter 4 ___________________________________________________ Configuring CP Databases
With the exception of a few fields, CP will run and produce reasonable
data with the default settings provided in the APA Config window.
For detailed explanations of the objects in the APA Config window,
refer to the CP Series™ Reference Guide.
apaconfig_located1
Figure 20 APA Config Window
Changing a Device or Process Configuration
When the configuration parameters of a device change, such as a
sensor or process, use the ApaConfig GUI to edit the appropriate
configuration table.
To change data in an existing configuration table:
1. Select the indexed table file in the left panel of the APA Config
window.
2. In the edit panel of the APA Config window, make the changes
to the affected fields. You may need to use the edit panel scroll
bar to view all the fields in the table.
VAISALA_______________________________________________________________________ 55
Page 70

User’s Guide______________________________________________________________________
3. Click Save.
4. If there are no other changes to the database, select Commit
Databases from the File menu.
Adding a New Device Configuration Table
When new devices, such as sensors or lightning displays, are added to
the network configuration, you must add a new configuration table to
the device folder in the realtime database. Use the APA Config
window to add configuration tables to a database. Figure 21 on page 57
is an example of adding a new display configuration table to the
realtime database.
To add a new configuration table file to a device folder:
1. Select the appropriate folder name in the left panel of the APA
Config window.
2. Click New to open the Add New Indexed Table dialog box (see
Figure 21 on page 57).
3. Accept the value displayed in the New Index field, or change it
to an unused index between 1 and 256. Tables with the same
index number must be in different folders.
The New Index field automatically displays the lowest available
index between 1 and 256. For convenience, the index number
may be the same as the device ID.
4. Click Add to accept the value displayed.
5. When the new indexed table file appears in the device folder,
click Save and begin data entry.
Saving Configuration Settings
There are two ways to save changes to a configuration database:
- Temporarily storing changes to one configuration table before
opening another table
- Committing changes to the database to prevent their loss due to an
unplanned shutdown of the workstation
56 ___________________________________________________________________M210557EN-A
Page 71

Chapter 4 ___________________________________________________ Configuring CP Databases
1
3
4
2
5
CAUTION
NewDevice2
Figure 21 Adding a New Device Configuration Table
The Save button in the APA Config window temporarily stores
changes made to a configuration table. After making changes, click
Save before opening another configuration table.
Changes must be saved before opening another table file. Otherwise,
any changes that have been made to the table file that is currently open
will be lost.
To temporarily store changes to a database:
-Click Save in the APA Config window.
Selecting Commit Databases from the File menu in the APA Config
window makes changes to all open databases permanent. The system
overwrites the original database file with the copy that contains all
changes stored with the Save button. The Commit Databases function
notifies all processes of the changes. After making changes to a
database, select Commit Databases from the File menu before closing
the APA Config window. The only way to undo a Commit Databases
function is to restore the configuration from a backup disk.
VAISALA_______________________________________________________________________ 57
Page 72

User’s Guide______________________________________________________________________
To permanently store changes to an open database:
1. Select Commit Databases from the File menu in the APA
Config window (see Figure 20 on page 55).
The CDB Message dialog box opens (see Figure 22 below) and
displays the question, Commit All Open Databases to Disk?
CDBmessage
Figure 22 Verification to Commit Database Changes to
Disk
2. Click OK to continue, or click Cancel to close the CDB
Message dialog box and cancel the requested function (see
Figure 22 above).
Reversing Changes to a Database
Selecting Revert Databases from the File menu in the APA Config
window reverses temporary changes to a database. All temporary
changes made since the last Commit Databases function are lost. The
database reverts to its condition as of the last Commit Databases
operation.
To reverse changes to an open database:
1. Select Revert Databases from the File menu in the APA Config
window.
The CDB Message dialog box displays to verify the action.
2. Click OK to continue, or click Cancel to close the dialog box
and cancel the requested function.
Configuring the realtime Database
The database named realtime is used by all processes for their real-
time operation configuration. The realtime database cannot be deleted,
but new tables can be added and existing tables can be edited.
58 ___________________________________________________________________M210557EN-A
Page 73

Chapter 4 ___________________________________________________ Configuring CP Databases
Assigning Transport IDs
The transport folder contains configuration tables for the Transport
IDs of each used physical port of the CP (see Figure 23 below). It is
recommended that associating Transport IDs be the first task when
configuring a new database or adding new ports to the CP.
Selected
Transport
Table
apaconfig_transport3
Figure 23 Transport Configuration Table Edit Panel
For new systems, Vaisala associates and configures Transport IDs for
all the used CP ports. If you add ports to the system after the initial
configuration, use the following procedure.
To associate a Transport ID to a port in the realtime database:
1. Add a new indexed table to the transport folder (see section
Adding a New Device Configuration Table on page 56).
You are now ready to enter values in the configuration fields.
2. Enter the URL of the device in the URL entry field.
3. Specify the grouping parameters for the transport using the
default setting, rawiod, in the Tag entry field.
4. Click Save.
Clicking Save sends the transport information to the database
where it is available for all CP processes.
5. Continue adding new Transport IDs using the above steps until
all of the new physical ports have been defined.
VAISALA_______________________________________________________________________ 59
Page 74

User’s Guide______________________________________________________________________
Configuring an External Network
The network folder contains the configuration table for an external
network (see Figure 24 below).
Selected
Network
Table
network01
Figure 24 Network Configuration Table Edit Panel
For new systems, Vaisala configures an external network if you have
one. If you add an external network after the initial configuration, use
the following procedure.
To configure an external network in the realtime database:
1. Add a new indexed table to the network folder (see section
Adding a New Device Configuration Table on page 56).
2. Associate a name with this network:
a. In the Full field, enter the full name for the network.
(Maximum number of characters allowed is 256.)
b. In the Abbreviation field, enter the abbreviation for the
full name. (Maximum number of characters allowed is 2.)
3. Select the network type from the Model list.
4. Select the Transport ID for this network from the TID list.
5. Click Save.
60 ___________________________________________________________________M210557EN-A
Page 75

Chapter 4 ___________________________________________________ Configuring CP Databases
Configuring Sensors
The sensor folder (see Figure 25 below) contains the configuration
tables for each sensor in the network. Only the items requiring entry
are covered here. Refer to the CP Series™ Reference Manual for
information on all of the fields in a sensor configuration table.
Used to identify
sensors in AP A
Control sensor
panel
Used to organize
sensors into sort
groups
Selected sensor
table. Table index
is Sensor ID.
Used to set sensor
response time
apaconfig_sensor1
Figure 25 Sensor Configuration Table Edit Panel
For new systems, Vaisala configures each sensor in the network. If you
add a sensor to the network after the initial configuration, use the
following procedure.
To configure a sensor in the realtime database:
1. Add a new indexed table to the sensor folder (see section Adding
a New Device Configuration Table on page 56).
VAISALA_______________________________________________________________________ 61
Page 76

User’s Guide______________________________________________________________________
2. Specify the full and abbreviated name of this sensor:
a. In the Full field, enter the full name for the sensor.
(Maximum number of characters allowed is 256.)
b. In the Abbreviation field, enter the abbreviation for the
full name. (Maximum number of characters allowed is 2.)
c. Enter appropriate values for Sort1, Sort2, and Sort3 or
leave the fields empty.
The system allows for sorting sensors by full name,
abbreviated name, tag, type (model), and sensor ID in
either decimal or hexadecimal format. The Sort1, Sort2,
and Sort3 fields provide three additional user-defined sort
parameters. The sort parameters affect the sequence in
which the sensors are displayed in the APA Control
window. The default values for Sort1, Sort2, and Sort3
are suggested parameters. For example: If you want to sort
sensors by the country in which they are installed, enter a
country name for each sensor in the Sort1 field.
3. Select the sensor type from the Model list (see Ta ble 20 on page
63).
62 ___________________________________________________________________M210557EN-A
Page 77

Chapter 4 ___________________________________________________ Configuring CP Databases
Table 20 Sensor Configuration
LF/VHF Sensor Type
Select
Model:
LF LPATS Series III SeriesIII
LPATS IV SeriesIV
LS8000
3)
(LF Module
LS7000 (ast) none (...) none (...) N/A BField6_Nldn
Only, MDF/TOA)
LS7000 (MDF/TOA) LS7000 (ast) none (...) none (...) N/A BField6_Nldn
4)
LS5000
(TOA)
IMPACT ALDF Model
LS7000 (.st) none (...) none (...) N/A BField6_Nldn
141T (ast) none (...) none (...) Low BField1_Low
141-T
IMPACT ES ALDF
IMPACT ES (ast) none (...) none (...) Low BField1_Low
Model 141-TES
IMPACT ES ALDF
IMPACT ES (ast) none (...) none (...) Low BField1_Low
Model 141-TESCE
IMPACT ESP ALDF
IMPACT ES (ast) none (...) none (...) Low BField1_Low
Model 141-TESP
IMPACT ESP ALDF
IMPACT ES (ast) none (...) none (...) Low BField1_Low
Model 142-TESP
IMPACT ES ALDF
IMPACT CT (ast) none (...) none (...) Low BField1_Low
with Cloud Model 141CT
VHF
LS8000
3)
(VHF-ITF
LS7500 none (...) (a..) none (...) N/A N/A
Module Only)
LF +
VHF
5)
LS7200
(VHF-ITF)
SAFIR Model 3000-2
(VHF-ITF LF TOA)
LS7500 (VHF-ITF LF
LS7500 none (...) (a..) none (...) N/A N/A
SAFIR (.st)(a..) none (...) N/A EField6_Lpats
LS7500 (.st)(a..) none (...) N/A EField6_Lpats
TOA)
Usable Measurements
1)
LF VHF-ITF VHF TOA Gain Category
(.st)
(.st)
none (...) none (...)
none (...) none (...) N/A EField6_Lpats
Sensor Gain
N/A
2)
EField4_Lpats
Medium BField2_Med
High BField4_High
Medium BField2_Med
High BField4_High
Extra High BField6_Nldn
Medium BField2_Med
High BField4_High
Extra High BField6_Nldn
Medium BField2_Med
High BField4_High
Extra High BField6_Nldn
Medium BField2_Med
High BField4_High
Extra High BField6_Nldn
1) (ast) = angle, signal, time; (.st) = signal, time; (a..) = angle; (..t) = time; (...) = none
2) N/A = Not Applicable
3) LS800 provides two data streams, one for LF data, the other for VHF-ITF data. Configure the LS8000 sensor as two
separate, independent sensors with separate transports. Use CP Model LS7000 for the LF data and LS7500 for the VHF
data.
4) LS5000 provides only LF TOA information
5) LS7200 provides only VHF-ITF information
VAISALA_______________________________________________________________________ 63
Page 78

User’s Guide______________________________________________________________________
NOTE
NOTE
LS8000 VHF-ITF and LF modules are configured as separate sensors
with separate transport IDs.
4. Specify the Transport ID for this sensor:
a. For a sensor connected to an external network, select None
from the TID list.
b. For all other sensors, select the sensor’s assigned T ransport
ID from the TID list. It helps prevent confusion if the
Transport ID and Sensor ID match.
Enter values in the NID and Remote ID fields only if an external
network of sensors is connected to the CP. Refer to Chapter 11,
Advanced CP Configuration, on page 153.
5. Specify the Network ID for this Transport ID:
NOTE
a. Select the Network ID for the shared LP from the NID list.
b. In the Remote ID field, specify the Remote ID of the
sensor. This value is the Sensor ID of the sensor from its
shared LP.
6. To allow this sensor to participate in the lightning location
solutions, select Yes from the Allowed list.
For new sensors, allowing the sensor to be used in lightning location
solutions will help determine how well the sensor is performing. Later,
this field might be set to No if the sensor is not performing adequately .
Even if No is selected, the sensor data is archived and can be used later
during reprocessing.
7. Specify the geographical location of the sensor:
a. In the Latitude field, enter the latitude of the sensor with a
minimum of four decimal places. Southern latitudes are
negative.
64 ___________________________________________________________________M210557EN-A
Page 79

Chapter 4 ___________________________________________________ Configuring CP Databases
b. In the Longitude field, enter the longitude with a
minimum of four decimal places. Western longitudes are
negative.
c. In the Altitude field, enter the altitude in meters.
8. In the Response Time field, enter a number in seconds, or leave
the default value of zero.
Sensor daemons use the response time value to determine how
long to wait for a status message from a sensor before indicating
that the sensor is down (not operating). The range of values is 0
to 86 400 seconds with the default being zero. If the default value
of zero is kept, the sensor daemon uses the hard-coded response
time value for that sensor. Refer to the man page for the sensor
daemon for this default value.
Use the vertical scroll bar to view additional sensor entry fields
as shown in Figure 26 below.
Selected
Sensor
Table
Advanced
Options
Button
apaconfig_sensor3
Figure 26 Sensor Configuration Table Edit Panel
9. Select what sensor measurements are usable for sensors from the
Angle Signal Time list in the LF, VHF-ITF, and VHF-TOA
fields as shown in Table 20 on page 63.
VAISALA_______________________________________________________________________ 65
Page 80

User’s Guide______________________________________________________________________
10. Select the gain category for the sensor from the Category list
(see Table 20 on page 63).
The Advanced Options button (see Figure 26 on page 65) displays the
Advanced Options window. This window contains sensor
configuration settings that affect the detection efficiency of the sensor,
and potentially, the entire network.
CAUTION
Settings in the Advanced Options window can have a serious and
adverse effect on the quality of the sensor’s data. These settings should
not be changed without specific directions from Vaisala.
11. To save the configuration for this sensor, click Save.
12. Repeat the above procedure for each new sensor.
Configuring Lightning Displays
The display folder (see Figure 27 on page 67) contains a configuration
table file for each lightning display device connected to the CP.
For new systems, Vaisala configures each display in the network. If
you add a display to the network after the initial configuration, use the
following procedure.
To configure a new display in the realtime database:
1. Add a new indexed table to the display folder (see section
Adding a New Device Configuration Table on page 56).
2. Give a name to the display:
a. In the Full field, enter the full name for the display.
(Maximum number of characters allowed is 256.)
b. In the Abbreviation field, enter the abbreviation for the
full name. (Maximum number of characters allowed is 2.)
c. In the Tag field, enter the tag associated with this display.
The tag uniquely identifies the instance of the process that
will send data to this display . Refer to section Changing the
Startup Configuration on page 155 for details about
defining a process tag.
66 ___________________________________________________________________M210557EN-A
Page 81

Chapter 4 ___________________________________________________ Configuring CP Databases
Selected
Display
Table
apaconfig_display1
Figure 27 Display Configuration Table Edit Panel
For CP8000, configuring displays that support different
data formats, such as L TraX, involves creating a unique tag
of the fhosed process for each supported data format. Be
sure to use unique tags for each instance of the fhosed
process.
3. Select the data format supported by the lightning display from
the Type list (see Table 21 below).
Table 21 Display Formats Supported
Data Format Supported Display Example
GAI type 97 VIS 6.xxGx
LTraX
Storm TraX
PLWS
PDM
GAI type 96 THUNDER (U.S.A. only)
VIS (U.S.A. only)
PLWS
RD - ASCII NDS
Universal ASCII None, ASCII-formatted text
VAISALA_______________________________________________________________________ 67
Page 82

User’s Guide______________________________________________________________________
Table 21 Display Formats Supported (Continued)
Data Format Supported Display Example
Binary DFF TED (Total Electrification Display)
Binary 24-Byte TIS 24-byte binary
VIS 6.xxSx
4. Select the Transport ID of this display from the TID list.
5. From the Mode list, select the mode for displaying a lightning
region.
Usually, displays plot only the lightning that occurs within a
specified region (clipping region), exclusive of the region
boundaries.
6. If you selected either Inside Polygon or Outside Polygon, enter
the file name for the polygon definition in the Polygon File field.
The file is a text file that identifies the number of nodes in the
polygon and the latitude and longitude of each node. Polygon
files are stored in the $APAHOME/etc/polygon directory. By
default, fhosed looks in that directory for polygon files. The
polygon may be simple or complex.
7. If you selected Inside Rectangle, enter the latitude and longitude
boundaries that define the region. Latitudes in the Southern
Hemisphere and longitudes in the Western Hemisphere are
negative values.
a. In the Min Latitude field, enter the latitude for the
southern boundary.
b. In the Min Longitude field, enter the longitude for the
western boundary.
c. In the Max Latitude field, enter the latitude for the
northern boundary.
d. In the Max Longitude field, enter the longitude for the
eastern boundary.
Only lightning occurring within the boundaries will display.
8. To save the configuration for this display , click Save.
9. Repeat the above procedure for each new display.
68 ___________________________________________________________________M210557EN-A
Page 83

Chapter 4 ___________________________________________________ Configuring CP Databases
Configuring the pdad Process
The core process pdad stores daily files of binary lightning data to the
/position/dff file system. Each lightning position requires 44 bytes and
the binary records are a fixed length. A directory path and file system
must be assigned for storage of the lightning position data. The pdad
configuration table file determines the base directory to which the
pdad process writes lightning position data. As configured at Vaisala,
the base directory is afile://position/dff/lf (see Figure 28 below). The
pdad process will append the file for lightning as follows:
- For LF locations, it will append lf/stroke or lf/flash.
- For VHF locations, it will append vhf/event or vhf/flash.
The /position file system provides the archived data for displays. The
/position files are shared through the network file system.
Selected
Process
Table
apaconfig_pdad1
Figure 28 Edit Panel for pdad Table
Configuring the pandad Process
The network data archive daemon process, pandad, stores all
important CP data to removable media. The data include, but are not
limited to, all sensor reports, sensor status, and CP status.
VAISALA_______________________________________________________________________ 69
Page 84

User’s Guide______________________________________________________________________
To configure the Network Data Archive process (pandad):
1. Select the pandad process configuration table (see Figure 29
below).
Selected
Process
Table
NOTE
apaconfig_pandad1
Figure 29 Edit Panel for pandad Table
2. Fully specify the path to the Archive file system by entering
/archive in the File System field.
The Archive file system is where pandad writes data. It is the
directory where the removable archive media device resides.
For the Archive file system, use the default directory where the
removable archive media device is located. The Archive and Overflow
file systems are preset at Vaisala.
3. Fully specify the path to the Overflow file system by entering
/overflow in the File System field.
The Overflow file system is used to prevent the loss of data when
the Archive file system becomes full. While the removable
70 ___________________________________________________________________M210557EN-A
Page 85

Chapter 4 ___________________________________________________ Configuring CP Databases
archive media is being changed, Overflow is temporarily used by
pandad for the storage of CP data.
Configuring the located Process
The located process uses LF sensor data to determine lightning
locations. Most of the default settings in the located configuration
table (see Figure 30 below) are acceptable for normal operation. Some
default parameters should be changed, based on the type of sensors that
are used in the network.
Selected
Process
Table
apaconfig_located1
Figure 30 Edit Panel for located Table
To configure how the located process operates:
1. Select the located process configuration table (see Figure 30
above).
2. In the Times and Angles fields, enter how many of each
measurement are required to compute a position.
The Times and Angles fields set the minimum number of
sensors needed to verify the stroke location when computing a
position using only timing information. The value in each field
represents the minimum number of sensors that must provide
VAISALA_______________________________________________________________________ 71
Page 86

User’s Guide______________________________________________________________________
that type of information. For LPATS-only networks, there is no
angle information to help verify lightning positions, only timing
information. Refer to Table 22 below for appropriate entries.
Table 22 Angles and Times for located Process
Network Type Times Angles
LS8000, LS7000 (with MDF) 4 1
LS75000, LS5000 (without MDF) 4 0
LPATS only
IMPACT only
SAFIR only
Mixed LPATS and IMPACT
Mixed SAFIR and IMPACT 4
1) Angle and time information help verify lightning positions.
2) Enter 1 if the IMPACT sensor’s nominal operating range covers the entire area of interest.
Otherwise, enter 0.
1)
40
41
40
4
1 or 0
1 or 0
2)
2)
3. Accept the default values for the Chi Square, Ellipse, Distance,
and Ratio fields.
These four fields determine the validity of a strike location. If
any one of these threshold values is not met, the position is not
sent to displays or stored to disk. Although the ultimate quality
control is the responsibility of the network manager, during
initial installation and configuration, use the default values. See
Appendix B, Introduction to Lightning Detection, for more
information about quality measurements.
4. In the Time (seconds) field, accept the default setting to specify
how long located holds data before processing.
The default setting is 15 seconds and is adequate for all known
networks. If the transmission delay from a sensor to the CP is
longer than 15 seconds, this value can be adjusted. If all sensors
have shorter transmission delays, this number can be reduced,
resulting in smaller delays between lightning detection and
transmission to displays. It is not recommended that the time be
set above 25 seconds, or below one second.
5. In the Window (milliseconds) field, accept the default setting to
specify the sensor stroke coincidence window.
6. Accept the default setting a.t (angle and time) in the Angle
Signal Time field, or select an option from the list according to
the sensor information.
72 ___________________________________________________________________M210557EN-A
Page 87

Chapter 5 ___________________________________________________ ______ Managing Sensors
CHAPTER 5
MANAGING SENSORS
This chapter applies to all CP models.
Overview
To use CP7000 or CP8000 for managing sensors, a two-way
communication link between each sensor and the CP is necessary. The
attach process provides that link and a command line interface. The
Attach GUI provides that link, using the attach process, and a
graphical user interface. Attaching to a sensor is the process of taking
control of the URL where the sensor is connected. This lets you
perform sensor diagnostics at the CP.
The attach process and Attach GUI form the following:
- A terminal interface to an IMPACT sensor
- A virtual cable between the CP serial port connecting an LPATS,
SAFIR, LS7500 sensor and the CP serial port connecting a
computer with the sensor diagnostic application:
- RDM30 for Series III sensors
- RSD for LPATS IV sensors
- SAF_ZAP for LS7500 VHF-ITF, LS8000 (VHF-ITF), and
SAFIR sensors
VAISALA_______________________________________________________________________ 73
Page 88

User’s Guide______________________________________________________________________
Attaching to LPATS or SAFIR Sensors
The attach process can provide the virtual cable link between any
LPATS or SAFIR sensor and a computer running the appropriate
sensor diagnostic program. The computer must be physically
connected to a serial port of the CP.
LPATS Series III, LPATS IV, LS75000, LS8000 VHF-ITF or SAFIR
sensor communications are message oriented. Therefore, the sensor
can be kept online because the sensor daemons series3d (LPATS
Series III), series4d (LPATS IV), safird (SAFIR, LS75000, LS8000
VHF-ITF) respond only to messages that concern them.
It is important to match the computer’s serial port parameters with
those set by the URL. If you use the -debug option with the attach
command, the Terminal window displays the two-way communication
in hexadecimal and ASCII formats.
Using the Attach GUI
The Attach GUI lets you attach to an LF sensor using a graphical user
interface. For IMPACT sensors, the GUI provides the same sensor
connection and diagnostics capabilities as a command line interface.
For LPATS or SAFIR sensors, the GUI provides verification of
communication for the transport and serial connections. The RSD,
RDM30, or SAF_ZAP computer still handles the command interface
to the LPATS IV, LPATS Series III, LS7500, LS8000 (VHF-ITF), and
SAFIR sensors, respectively.
Setting Attach Options
Prior to attaching a sensor, the Attach GUI requires setting command
options for the attach process.
To set attach command options:
1. Open the APA Control window.
2. Select Set Attach Options from the File menu to open the
Attach Options dialog box (see Figure 31 on page 75).
74 ___________________________________________________________________M210557EN-A
Page 89

Chapter 5 ___________________________________________________ ______ Managing Sensors
apacontrl_attachoptns1
Figure 31 Attach Options Dialog Box
3. Select the appropriate command options for the attach session:
- Select -online to keep the sensor attached to the system and
permit data flow to the sensor daemon.
- Select -reconnect to reconnect when the serial connection is
lost.
- Select -echo to allow data flow to be echoed at the terminal.
- Select -hexterm to configure the input/output data in hex
format.
- Select -charterm to configure the input/output data in ASCII
format, then enter the appropriate value in the -charterm field
to determine how data is translated between hex and ASCII
formats (0A, 0X0A).
- For LPATS and SAFIR sensors only, use the -to (IPC) field to
define the URL of the RSD, RDM30, or SAF_ZAP computer
connected to the CP.
4. To save the configured options to disk, click Save, or click
Dismiss to close the Attach Options dialog box without saving
the changes.
Attaching to an IMPACT Sensor
When attached to an IMPACT sensor, the Attach GUI provides the
options of command line entry and buttons to send sensor commands.
One advantage of the Attach GUI is that it removes the need for
pressing the CTRL+A * key sequence before each command.
The command set available for an IMPACT sensor varies with the
sensor model. A sensor’s responses to the commands also vary with
VAISALA_______________________________________________________________________ 75
Page 90

User’s Guide______________________________________________________________________
the sensor model. For a list of available commands, the command
syntax, and descriptions of commands, refer to the appropriate sensor
manual.
To attach to an IMPACT sensor:
1. In the APA Control window, select (click) a specific IMPACT
sensor.
2. Click Information in the Sensors panel to open the
Sensor/Transport Info dialog box (see Figure 32 below).
Click to access the
Attach GUI for the
displayed sensor.
SensorInfo
Figure 32 Accessing the Attach GUI
3. Click Attach to display the AttachImpact window (see Figure
33 on page 77) and establish the attachment to the sensor.
There are several ways to enter an IMPACT sensor command:
- With the Command field
- With a command button only (no arguments are needed)
- With both the Command field and a command button (arguments
are needed)
To enter a command in the Command field:
1. T ype the command key word followed by needed arguments with
delimiters between.
The CTRL+A * key sequence is not used in the Attach GUI.
2. Press ENTER to send the command to the sensor. The terminal
panel echoes the command followed by the sensor’s response.
76 ___________________________________________________________________M210557EN-A
Page 91

Chapter 5 ___________________________________________________ ______ Managing Sensors
Status
Panel
Terminal
Panel
Command
Field
Command
Buttons
attach0
Figure 33 AttachImpact Window
To enter a command with no arguments using the command
buttons:
1. Click the tab for the group containing the command.
2. Click the appropriate command button.
3. The terminal panel echoes the command followed by the
sensor’s response.
To enter a command with arguments using the command buttons:
1. Type the command arguments in the Command field. Avoid
pressing ENTER after typing the arguments.
2. Click the tab for the group containing the command.
3. Click the appropriate command button.
4. The terminal panel echoes the command followed by the
sensor’s response.
VAISALA_______________________________________________________________________ 77
Page 92

User’s Guide______________________________________________________________________
Attaching a VHF-ITF Sensor with AttachIt
The AttachIt window monitors communication with the transport and
across the serial connection during attachment to an LPATS, LS7500,
or SAFIR sensor. The RSD and RDM30 computers provide the
command interface to an LPATS IV and LPATS Series III sensor,
respectively . The SAF_ZAP computer provides the command interface
for an LS7500, LS8000 (VHF-ITF) or SAFIR 3000-2 sensor. The
AttachIt window provides no command interface.
The command set available for an LPA TS or SAFIR sensor varies with
the sensor model. A sensor’s responses to the commands also vary
with the sensor model. For a list of available commands and
descriptions of the commands, refer to the appropriate sensor manual.
To attach to an LPATS, LS7500, or SAFIR sensor:
1. In the APA Control window, select (click) a specific LPATS,
LS7500, or SAFIR sensor.
2. Click Information in the Sensors panel to open the
Sensor/Transport Info dialog box.
3. Click Attach to display the AttachIt window (see Figure 34 on
page 79) and establish the attachment to the selected sensor.
The From Serial terminal panel will not display data until
something is entered with the RSD, RDM30, or SAF_ZAP
program.
78 ___________________________________________________________________M210557EN-A
Page 93

Chapter 5 ___________________________________________________ ______ Managing Sensors
Menu Bar
From Transp ort
Terminal Panel
From Serial
Terminal Panel
Status Panel
attit_a
Figure 34 AttachIt Window
Attaching to LS LF Modules Using Telnet
Attaching the LF modules of LS8000, LS7500, LS7000, and LS5000
sensors requires that you establish a Telnet connection to the sensor.
To attach an LS LF module:
- In a Terminal window, establish a Telnet connection to the sensor:
telnet <host name or IP address>
VAISALA_______________________________________________________________________ 79
Page 94

User’s Guide______________________________________________________________________
This page intentionally left blank.
80 ___________________________________________________________________M210557EN-A
Page 95

Chapter 6 _______________________________________________________Archiving Sensor Data
CHAPTER 6
ARCHIVING SENSOR DATA
This chapter applies to all CP models.
Overview
The archiving of sensor data is one of the most critical functions
performed by CP. When a sensor message is received by the core
process rawiod, the Transport ID is added to the message and it is
forwarded to the controlling sensor daemon. Sensor daemons interpret
and expand the information received from the sensor but preserve each
measurement unchanged.
It is this data that the core process pandad preserves. It is important to
preserve unmodified sensor measurements so that corrections, if
needed, can be applied at a later date. CP also records information such
as process, sensor, and transport status.
The LpaControl GUI opens the LP Archive Control window. This
controls the spooling of data from the Archive file system, and writing
VAISALA_______________________________________________________________________ 81
Page 96

User’s Guide______________________________________________________________________
the spooled data to a data storage device such as a recordable CD or
tape (see Figure 35 below).
Figure 35 LpaControl Functional Diagram
The LpaControl devices may be extended by writing new scripts and
adding them to the directory $APAHOME/bin. The script is associated
with a device name and made available to LpaControl by editing the
$APAHOME/etc/lcDevices.txt file.
Archive Operation
Archiving of sensor lightning and status data is the responsibility of the
pandad core process(es). The ApaControl and LpaControl GUIs
monitor storage and help manage data files and the movement of
archive data to long term storage.
CP currently supports three archive technologies:
- CD-Recordable (CD-R) or CD-Rewritable (CD-RW)
-Tape
- Removable media—Magneto-optical disk, or any device that
provides a UNIX file system and can be mounted by Solaris.
82 ___________________________________________________________________M210557EN-A
Page 97

Chapter 6 _______________________________________________________Archiving Sensor Data
The man page for LpaControl describes how to create a script that
adds a new device or function that moves data files to long term
storage.
Table 23 below provides definitions for terms related to archiving
sensor data files.
Table 23 Data Archive Terms and Definitions
Term Definition
Archive Primary file syste m fo r sen so r data files. This file system is
defined in ApaConfig and typically mounted as /archive.
Overflow Secondary file system where sensor data files are written
when the Archive file system becomes full. This file system
is defined in ApaConfig and typically mounted as /overflow.
Spool File system used as a staging area for sensor data files that
will be placed on long term archive media such as CD-R or
tape. Spool is typically sized to take advantage of moving
large blocks of data in one operation. This file system is
defined in LpaControl and is typically mounted as /spool.
Hold File system used by CD-R for creation of image files and
sensor data file verification and as a repository for sensor
data files in the event a CD was not properly created. This
file system is defined in LpaControl and is typically
mounted as /hold.
pandad Core process responsible for writing sensor and status data
to files in the Archive and Overflow file systems
Normal Archive Operation
All archive operations involve the pandad core process. At startup,
pandad opens a new file in Archive. When the Archive file becomes
full, or by command, pandad closes the file and begins writing to the
Overflow file. Only on command does pandad move the current file in
Overflow back to Archive and append new sensor data.
This operation ensures the continuous recording of sensor data and
provides a mechanism for exchanging media or otherwise restoring the
Archive file system to an empty state.
Troubleshooting Archive Operations
Sensor data archiving is a critical function. Problems should be
remedied quickly or sensor data that can never be recovered will be
VAISALA_______________________________________________________________________ 83
Page 98

User’s Guide______________________________________________________________________
lost. To prevent problems with data archiving, perform the following
preventive measures daily:
- Monitor the status of Archive, Overflow, and Spool at the
APA Control and LP Archive Control windows.
- Monitor the operation of the pandad, ApaControl, and
LpaControl processes.
- Ensure that formatted media, blank CDs and/or tapes are available.
Archiving to Recordable CD
The pandad and LpaControl processes support the CD-R script.
LpaControl defines the location of the Spool file system and the
action to be taken when Spool reaches a specified percentage of its
capacity (refer to section Using the LpaControl GUI on page 47).
ApaControl only monitors the status of the Archive and Overflow file
systems (refer to section Using the ApaControl GUI on page 34).
When the Archive file system becomes full, pandad switches to the
Overflow file system. LpaControl then copies, and optionally
compresses, the data files in Archive to Spool. When Spool reaches its
threshold capacity, LpaControl runs the configured script for moving
the data files from Spool to long term media (CD-R or CD-RW) and
deletes files from Spool if the CD is written successfully.
The CD-R script included with CP performs the following functions:
- Copies 650 MB (about 1 CD) of data files from Spool to Hold
- Computes a checksum on each file and saves the results to a file
- Creates a CD image file format that allows the CD to be accessed by
systems running Solaris, Linux, and/or Windows
- Records the image file to blank media (writes to the CD)
- Recomputes the checksum on each file on the CD and compares it
with the original checksum
- On success, retains the raw data files in Hold in a directory named
by the date and time the CD was created (format shows the year,
month, day, hour, and second without spaces) and deletes the image
file. For example:
/hold/200404051124/<data files>
84 ___________________________________________________________________M210557EN-A
Page 99

Chapter 6 _______________________________________________________Archiving Sensor Data
At startup, LpaControl moves all files in the Archive and Overflow
file systems, not currently in use by pandad, to the Spool area.
Normal Operation with a CD Writer
The Archive and Overflow file systems, indicated by the Archive and
Overflow gauges on the AP A Contr ol window, are sized to hold about
650 MB of data. This ensures that no one file will be larger than a CD.
The Spool area, indicated by the Spool Device gauge on the LP
Archive Control window (see Figure 36 below), is sized to hold
enough data to fill two 1.3 GB CDs of data and the default threshold
capacity is 50% or one CD of data. Regardless of the size of the Spool
area, the script only copies and records 650 MB of data.
Data Archive Change button manually
sends the contents of the Spool area to
the storage device using the specified
script.
Figure 36 LP Archive Control Window
To archive to CD:
1. Leave a blank CD in the CD writer.
a. When pandad fills the Archive file system and switches to
Overflow, LpaControl moves the files from Archive to the
Spool area.
b. When the Spool area reaches its threshold capacity, the
CD-R script creates a CD.
c. When the CD has been written, the CD automatically
ejects and a verification message displays.
2. To verify the CD, re-insert the newly created CD into the CD
writer, and click OK.
VAISALA_______________________________________________________________________ 85
Page 100

User’s Guide______________________________________________________________________
When the CD has been verified, an LpaControl status message
similar to the following displays.
CD-ROM creation successful
3. Eject and label the written CD.
4. Insert a blank CD in the CD writer.
If there is a problem writing the CD, refer to section
Troubleshooting CD-R Archive Operations on page 86.
Troubleshooting CD-R Archive Operations
The following sections describe problems that may occur when
archiving to CD, and how to correct them. Table 39 on page 186
provides general information regarding error messages and how to
troubleshoot them.
Hold File Is Full
The Hold file system becomes full as indicated by a message in the
console window. This is normal and can be expected. The Hold file
system is not actively managed and you are responsible for deleting
directories to make space for incoming data files.
To recover:
1. Delete files that have been written to CD and verified with the
following command:
rm -r /hold/<date/time>
2. Replace <date/time> with the name of the directory to be
deleted.
Spool Area Is Full
The Spool file becomes full because Hold does not have space or CDs
are not being created. If this happens the system backs up and the
Overflow and Archive file systems become full.
86 ___________________________________________________________________M210557EN-A
 Loading...