

Page 1

DLP®NIRscan™ Evaluation Module
User's Guide
Literature Number: DLPU016C
April 2014–Revised April 2019
Page 2

Contents
Preface ........................................................................................................................................ 5
1 DLP NIRscan Evaluation Module Overview.............................................................................. 8
1.1 Introduction ................................................................................................................... 8
1.2 What is in the DLP NIRscan EVM? ....................................................................................... 8
1.2.1 Optical Engine ..................................................................................................... 10
1.2.2 DLP NIRscan EVM Electronics.................................................................................. 12
1.3 Other Items Needed for Operation....................................................................................... 14
1.4 DLP NIRscan Connections................................................................................................ 14
1.5 DLP NIRscan EVM Jumpers.............................................................................................. 16
2 Quick Start ........................................................................................................................ 18
2.1 Power-Up the DLP NIRscan EVM ....................................................................................... 18
3 Operating the DLP NIRscan EVM.......................................................................................... 20
3.1 Quick Scan Mode .......................................................................................................... 21
3.2 Custom Scan Mode ........................................................................................................ 23
3.3 Slew Scan Mode ........................................................................................................... 28
3.4 File Download Icon ........................................................................................................ 32
3.5 System Information ........................................................................................................ 32
A Safety ............................................................................................................................... 34
A.1 Warnings and Cautions.................................................................................................... 34
B Power Supply Requirements................................................................................................ 35
B.1 External Power Supply Requirements................................................................................... 35
C NIRscan EVM Reprogramming Procedure ............................................................................. 36
C.1 Creating a bootable microSD Card ...................................................................................... 36
C.2 Reprogramming the DLP NIRscan EVM Application Software....................................................... 36
C.3 Upgrading the DLPC350 Firmware ...................................................................................... 39
Revision History.......................................................................................................................... 40
2
Contents
Copyright © 2014–2019, Texas Instruments Incorporated
DLPU016C–April 2014–Revised April 2019
Submit Documentation Feedback
Page 3

www.ti.com
1. DLP NIRscan Evaluation Module ......................................................................................... 6
1-1. DLP NIRscan EVM Block Diagram........................................................................................ 9
1-2. DLP NIRscan EVM Optical Engine ...................................................................................... 10
1-3. 0.45-Inch DMD Diamond Pixel Geometry............................................................................... 11
1-4. 0.45-Inch DMD Diamond Pixel Array Configuration ................................................................... 11
1-5. Diamond Pixel for Vertical, Horizontal, and Diagonal Lines.......................................................... 12
1-6. DLP NIRscan EVM......................................................................................................... 13
1-7. DLP NIRscan EVM Connectors (Backside View)...................................................................... 15
1-8. DLP NIRscan Connectors (Upside-Down Side View) ................................................................. 15
1-9. DLP NIRscan Jumper Locations ......................................................................................... 16
2-1. DLP NIRscan Homepage ................................................................................................. 19
3-1. Quick Scan Screen......................................................................................................... 21
3-2. Example Quick Scan....................................................................................................... 22
3-3. Example Quick Scan Spectrum Data.................................................................................... 23
3-4. Custom Scan Screen ...................................................................................................... 24
3-5. Example Custom Scan .................................................................................................... 26
3-6. Example Custom Scan Spectral Data................................................................................... 27
3-7. Example Custom Scan Raw Data ....................................................................................... 28
3-8. Slew Scan Screen.......................................................................................................... 29
3-9. Eample Slew Scan ......................................................................................................... 31
3-10. File Download Screen ..................................................................................................... 32
3-11. Information Screen......................................................................................................... 33
C-1. MicroSD Card Slot ......................................................................................................... 37
C-2. Boot Switch Location ...................................................................................................... 38
C-3. LED Location................................................................................................................ 39
List of Figures
DLPU016C–April 2014–Revised April 2019
Submit Documentation Feedback
Copyright © 2014–2019, Texas Instruments Incorporated
List of Figures
3
Page 4

www.ti.com
List of Tables
1-1. DLP NIRscan EVM Specifications ....................................................................................... 11
1-2. DLP NIRscan EVM Components......................................................................................... 14
1-3. DLP NIRscan Connections................................................................................................ 15
4
List of Tables
Copyright © 2014–2019, Texas Instruments Incorporated
DLPU016C–April 2014–Revised April 2019
Submit Documentation Feedback
Page 5

The DLP®NIRscan™ EVM is a third-party implementation of the next generation DLP reference design to
enable faster development cycles for spectrometer applications requiring small form factors.
Trademarks
NIRscan, Sitara are trademarks of Texas Instruments.
DLP is a registered trademark of Texas Instruments.
Safari is a registered trademark of Apple Inc.
Digi-Key is a registered trademark of Digi-Key Corporation.
Google is a trademark of Google Inc.
Internet Explorer is a registered trademark of Microsoft Corporation.
Mozilla Firefox is a registered trademark of Mozilla Corporation.
Sullins Connector Solutions is a registered trademark of Sullins Connector Solutions, Inc.
About This Guide
This guide is an introductory document for the DLP NIRscan EVM that provides an overview of the system
and the systems software. Other documents provide more in-depth information of the hardware and
software features of the components of the DLP NIRscan EVM.
This document covers DLP NIRscan Software version 2.0 - version 2.0 is an update to version 1.0 which
adds the Slew Scan mode and Custom Scan - Hadamard mode of operation. For instructions on how to
update the NIRscan software from version 1.0 to version 2.0, please see Appendix C of this document.
Preface
DLPU016C–April 2014–Revised April 2019
Read This First
DLPU016C–April 2014–Revised April 2019
Submit Documentation Feedback
Copyright © 2014–2019, Texas Instruments Incorporated
Read This First
5
Page 6
www.ti.com
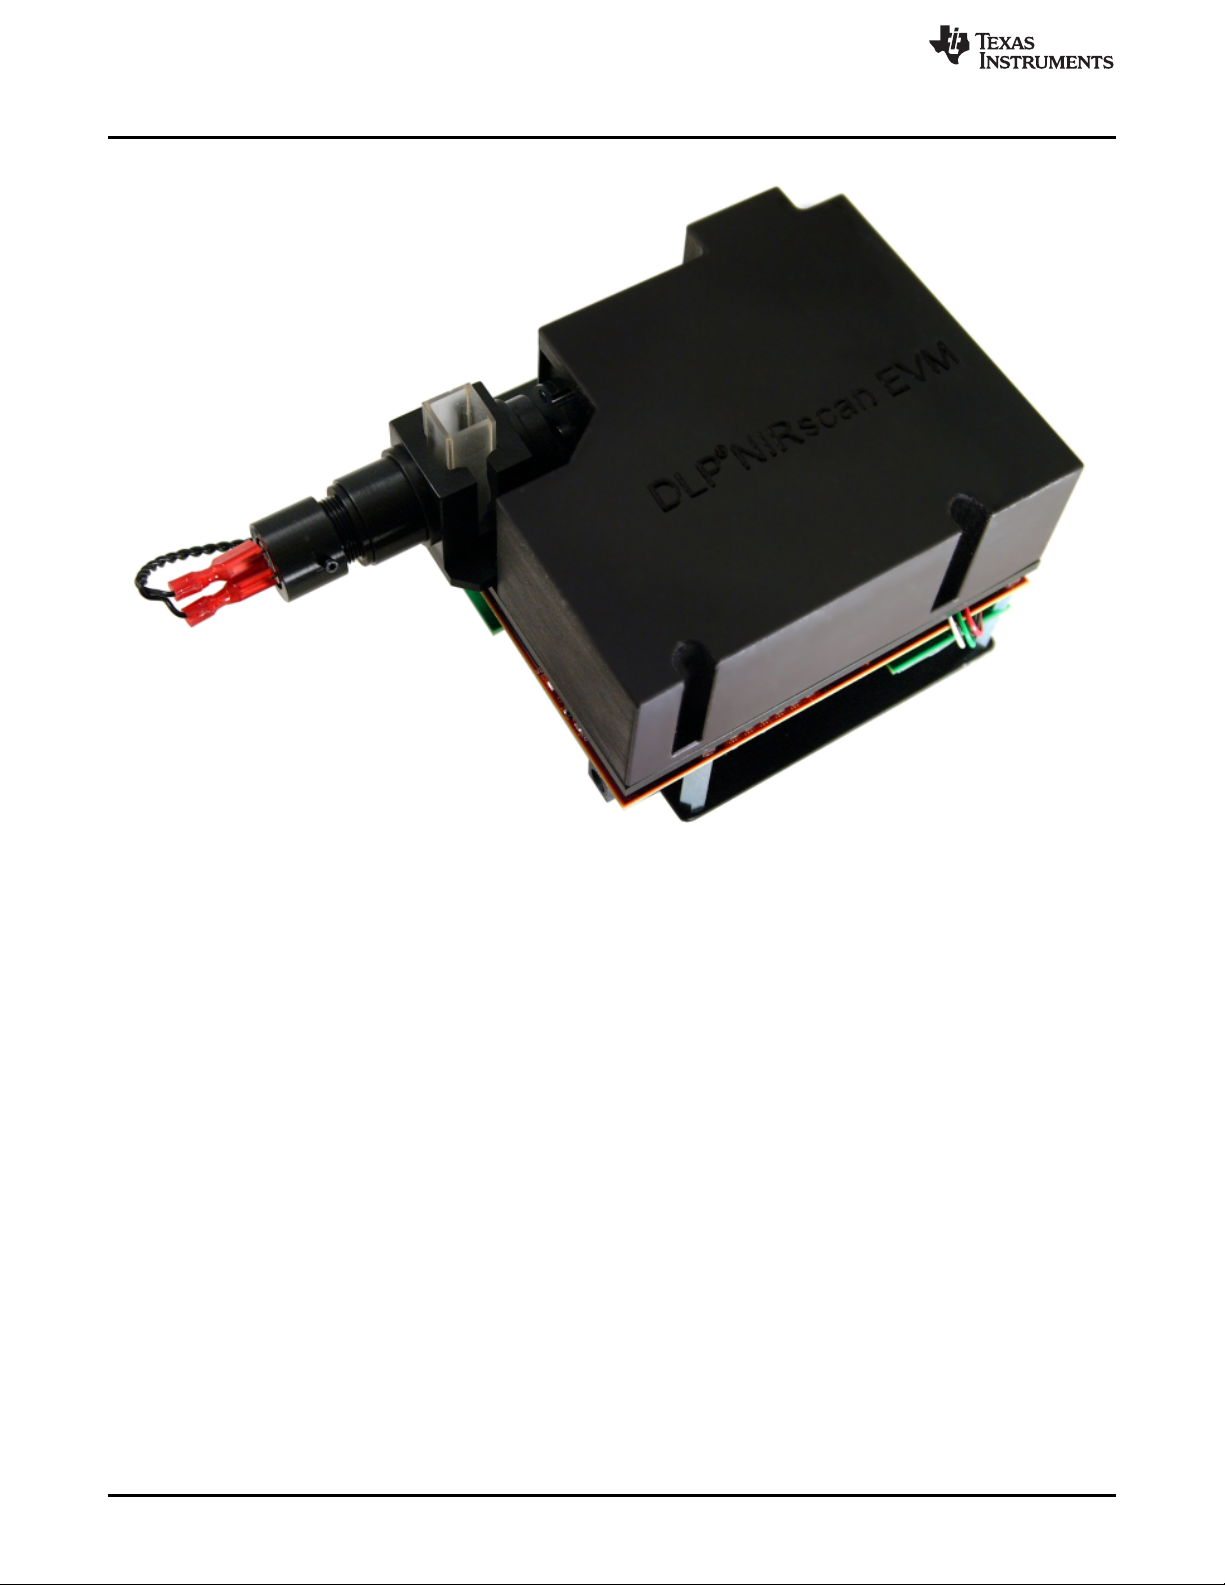
Figure 1. DLP NIRscan Evaluation Module
Use the most recent versions of either Firefox, Safari, Google Chrome, or Internet Explorer. There are
some compatibility issues noted with IE8 and IE9 so these versions are not recommended.
6
Read This First
Copyright © 2014–2019, Texas Instruments Incorporated
DLPU016C–April 2014–Revised April 2019
Submit Documentation Feedback
Page 7

www.ti.com
Related Documentation
DLPC350 data sheet: DLPC350 DLP Digital Controller for Portable Advanced Light Control, DLPS029
DLP4500NIR data sheet: DLP 0.45 WXGA NIR DMD, DLPS032
Programmer's guide: DLPC350 Programmer’s Guide, DLPU010
Design guide: DLP Spectrometer Design Considerations, DLPA049
Technical Support
Refer to the DLP and MEMS TI E2E community support forums.
DLPU016C–April 2014–Revised April 2019
Submit Documentation Feedback
Copyright © 2014–2019, Texas Instruments Incorporated
Read This First
7
Page 8

1.1 Introduction
The DLP®NIRscan™ EVM is a complete evaluation module (EVM) to design a high performance,
affordable near-infrared spectrometer. This flexible tool contains everything a designer needs to start
developing a DLP-based spectrometer right out of the box. The EVM features the DLP 0.45 WXGA NIR
chipset. It is the first DLP chipset optimized for use with near-infrared (NIR) light. With DLP technology,
spectrometers for use in the food, pharmaceutical, oil and gas and other emerging industries are able to
deliver lab performance levels in the factory and the field. This technology brings together a set of
components providing an efficient and compelling spectroscopy system solution for:
• Process analyzers
• Laboratory equipment
• Dedicated analyzers
The new DLP4500NIR DMD is optimized for operation at wavelengths between 700 nm and 2500 nm. The
DLP NIRscan EVM is one possible implementation of this new DLP technology, operating from 1350 nm
to 2450 nm.
Chapter 1
DLPU016C–April 2014–Revised April 2019
DLP NIRscan Evaluation Module Overview
1.2 What is in the DLP NIRscan EVM?
The DLP NIRscan EVM is a complete NIR spectrometer EVM using DLP technology. The EVM package
includes:
• Near infrared optomechanical spectrometer engine:
– Transmissive sample holder with broadband visible-to-infrared tungsten-halogen lamp
– 25-µm input slit
– Collimating lenses
– 1300 to 2500 nm bandpass filter
– Reflective diffraction grating
– Focusing lens
– DLP4500NIR DMD (.45-inch WXGA, 912 × 1140 diamond pixels, NIR optimized)
– Collection optics
– 2-mm single-pixel, cooled InGaAs detector
• Electronics subsystem with the electronics consisting of five boards:
– Spectro board
• DLPC350 controller ASIC
• Sitara™ processor (AM3358) for system control and analysis
• Power management circuits
• Connectivity through Ethernet and USB
• Non-volatile eMMC flash memory
• Micro SD card slot for external programming
• Open source Linux web-server application software
– Detector board
• 2-mm, single-pixel cooled InGaAs detector with TEC and thermistor
• Low-noise differential amplifier circuit
8
DLP NIRscan Evaluation Module Overview
Copyright © 2014–2019, Texas Instruments Incorporated
DLPU016C–April 2014–Revised April 2019
Submit Documentation Feedback
Page 9
www.ti.com
• Three disposable cuvettes, each 12.5 × 12.5 mm with 10-mm path length, for use during the
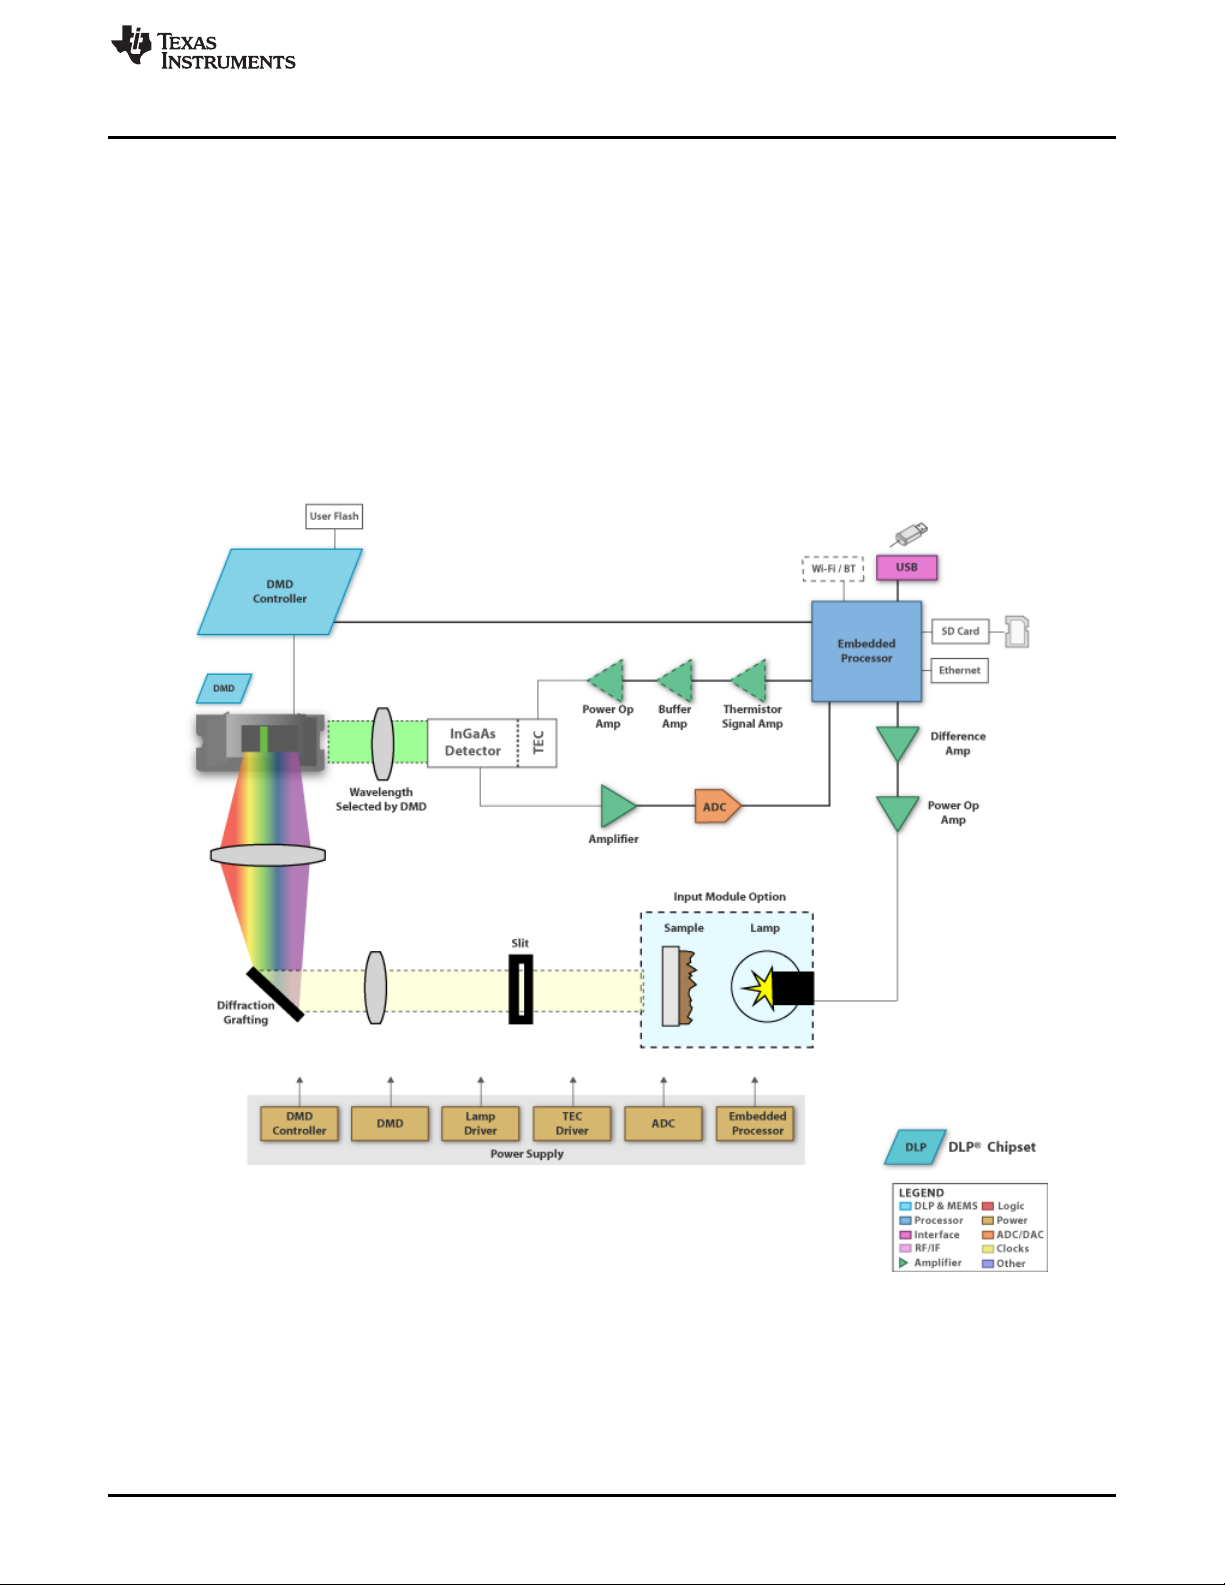
Figure 1-1 shows the major hardware components.
What is in the DLP NIRscan EVM?
• ADS1255 30 kSPS analog-to-digital converter (ADC) with SPI interface
– Lamp driver board
• Low noise, constant current supply for the broadband lamp
– TEC driver board
• Thermistor feedback signal amplifier for temperature measurement
• Closed loop TEC current control with high current driver
– DMD interconnect board
– Associated cable harnesses
spectrometer evaluation.
Figure 1-1. DLP NIRscan EVM Block Diagram
DLPU016C–April 2014–Revised April 2019
Submit Documentation Feedback
DLP NIRscan Evaluation Module Overview
Copyright © 2014–2019, Texas Instruments Incorporated
9
Page 10
What is in the DLP NIRscan EVM?
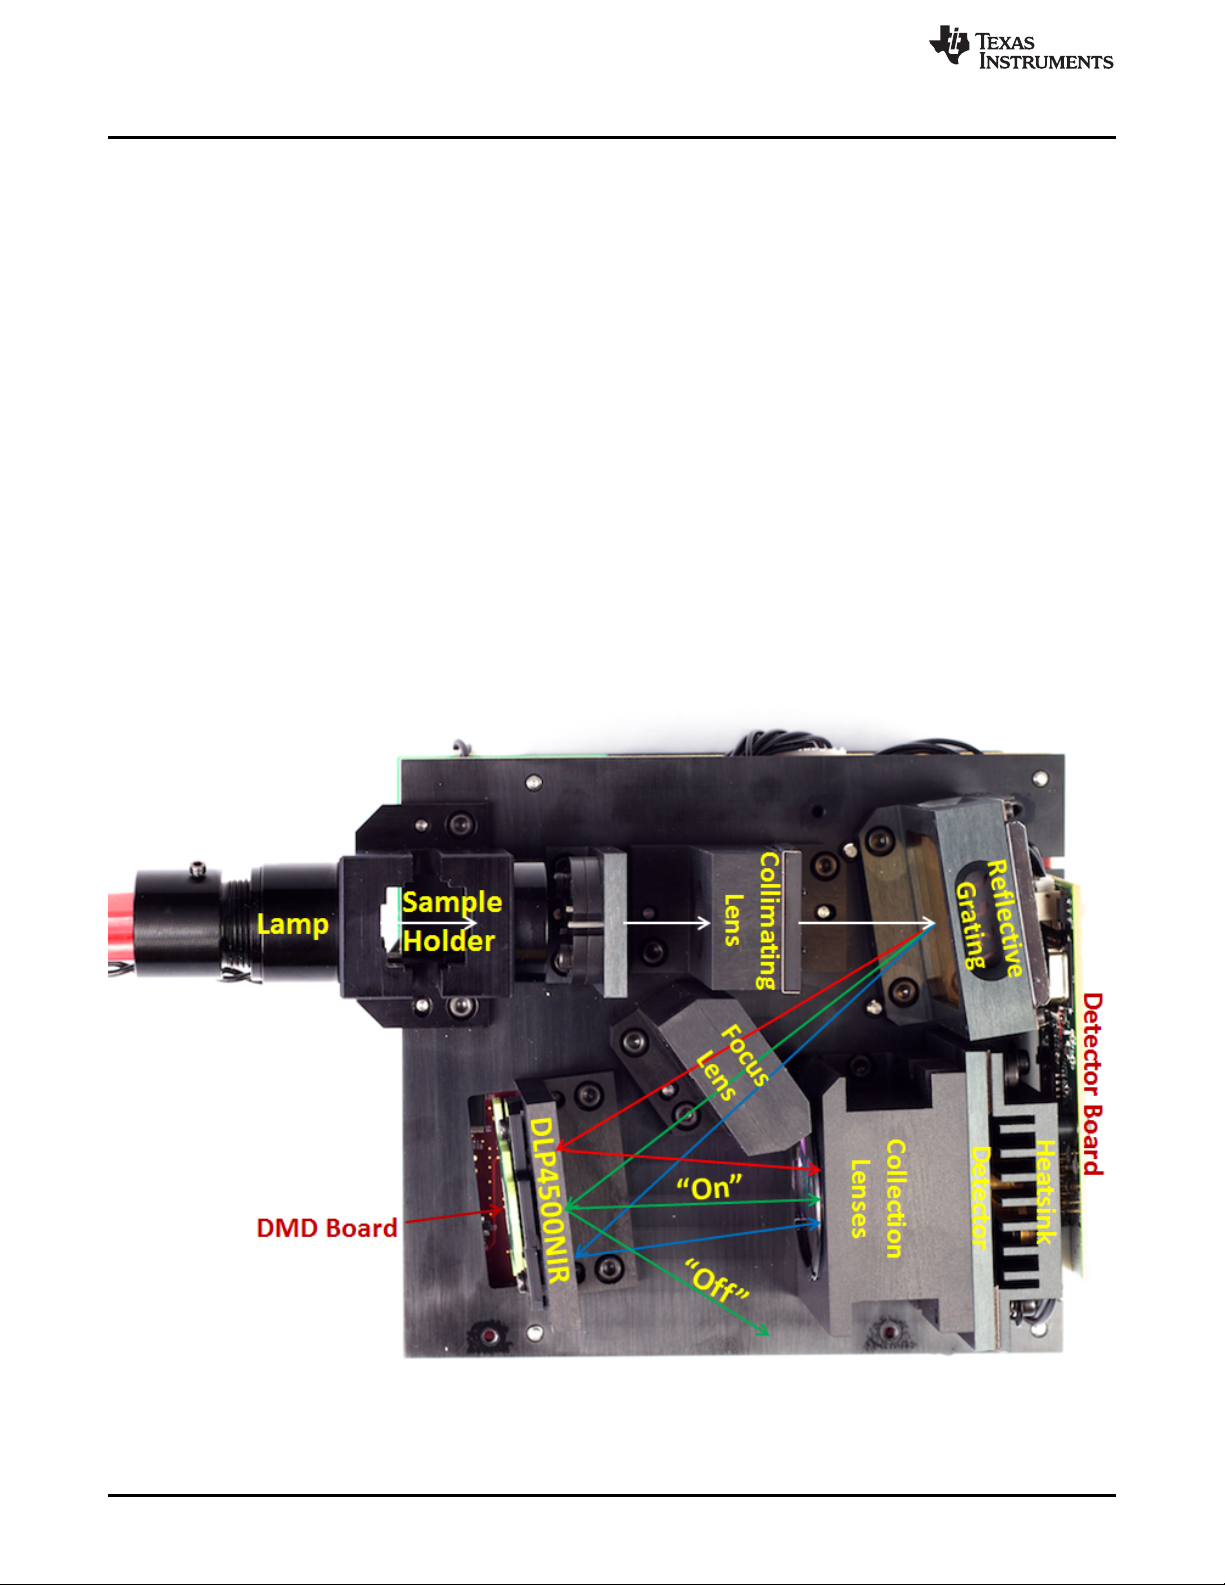
1.2.1 Optical Engine
The DLP NIRscan EVM spectrometer optical engine is mounted on top of a thermal plate which acts as a
stable platform for mounting the optics. The configuration is a post-dispersive architecture where the
broadband light from the tungsten lamp is directed through a transmissive sample. In this specific
implementation, the lamp or sample holder module allows insertion of standard cuvettes. These cuvettes
are designed to hold liquid samples. There is also a slit in the sample holder, which allows insertion of
various thickness NIR transmissive samples such as plastic sheets and coated glass.
Each sample passes (and absorb) a specific amount of NIR light through the sample. The amount passed
(and absorbed) depends on the molecular makeup of the material, and is specific to that material, similar
to a fingerprint. The light which passes through the sample enters the engine through the input slit. Slit
size is relative to the desired wavelength resolution of the spectrometer. This spectrometer uses a 25-µm
wide slit, which is approximately 4.2-mm tall. After light passes through the slit, the light then passes
through a collimating lens, through a 1350- to 2450-nm bandpass filter where the light then strikes a
reflective grating. This grating, in combination with the focusing lens, disperses the NIR wavelengths
across the DLP4500NIR DMD in a horizontal fashion, with 1350 nm projected to one side of the DMD,
2450 nm to the other end, and all wavelengths dispersed between. When specific DMD columns are
selected as 'on', or tilted to the +12º position, the energy reflected by the selected columns diverts through
the collection optics to the single pixel detector. All other DMD columns which are not selected as 'on' are
by default 'off' (tilted to the –12º position). 'Off' DMD pixels divert the unselected wavelengths away from
the detector optical path so as not to interfere with the selected wavelength measurement.
The DLP NIRscan EVM size is mostly driven by the size of the optical engine and measures
approximately 197-mm long, 112-mm wide, and 96-mm tall.
www.ti.com
10
Figure 1-2. DLP NIRscan EVM Optical Engine
DLP NIRscan Evaluation Module Overview
Copyright © 2014–2019, Texas Instruments Incorporated
DLPU016C–April 2014–Revised April 2019
Submit Documentation Feedback
Page 11

www.ti.com
Table 1-1 lists the specifications of the light engine.
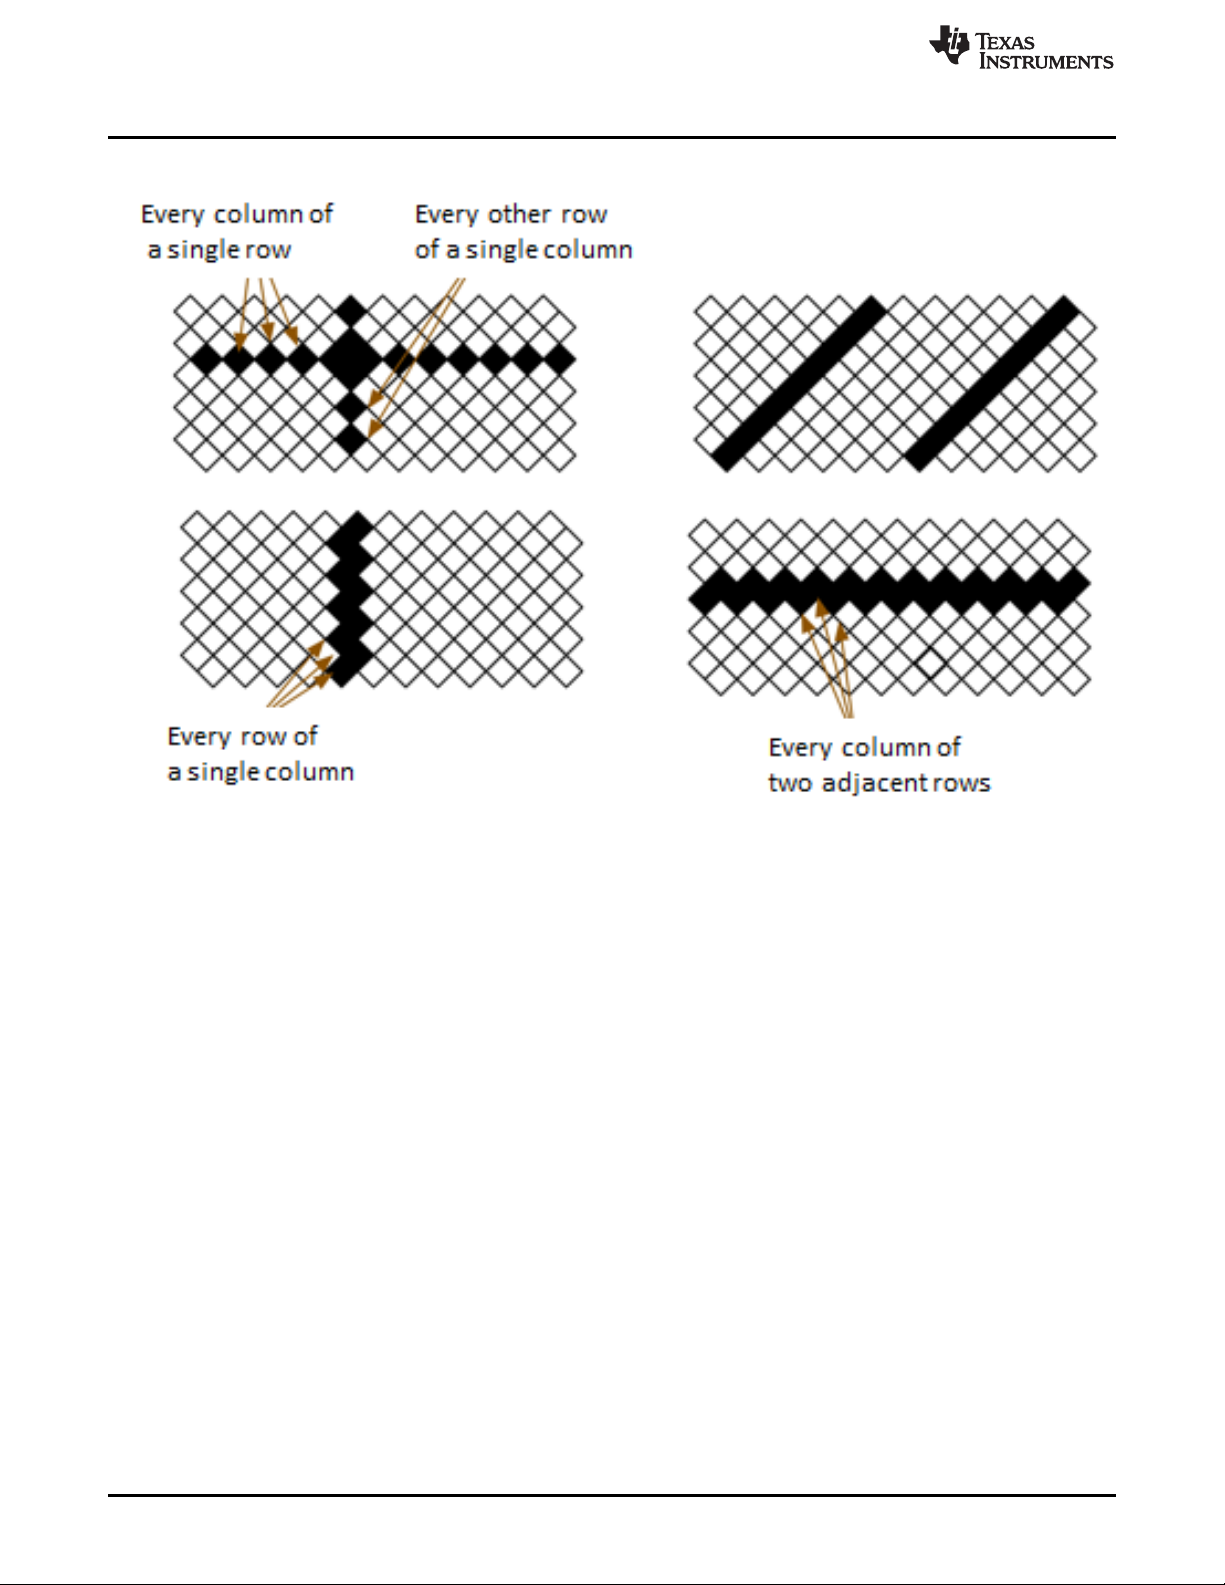
The optical engine includes the DLP4500NIR 0.45-inch DMD with 1039680 mirrors, arranged in 912
columns × 1140 rows with the diamond pixel array geometry and configuration shown in Figure 1-3 and
Figure 1-4. Due to the diamond pixel configuration, the array produces smooth diagonal lines, with jagged
vertical and horizontal lines, as shown in Figure 1-5. Conceptually, the spectroscopy application running
on the DLP NIRscan GUI uses vertical columns to select wavelengths. These vertical lines are
programmable in width as selected in the DLP NIRscan GUI software. Wider columns tend to provide
more light to the detector, but less digital resolution. Narrow columns provide higher digital resolution, but
less light to the detector.
What is in the DLP NIRscan EVM?
CAUTION
Do not disassemble the optical engine. The optical engine contains lenses,
gratings, and detectors that have been calibrated at the factory. Loosening or
tightening screws and optical components may move pieces out of alignment
and cause decreased system performance. Removal of the cover may allow
dust intrusion, which can also decrease system performance.
Table 1-1. DLP NIRscan EVM Specifications
PARAMETER MIN TYP MAX UNIT
Supported wavelengths 1350 2450 nm
Spectrometer typical power 12 W
Tungsten lamp typical power 4 W
Figure 1-3. 0.45-Inch DMD Diamond Pixel Geometry Figure 1-4. 0.45-Inch DMD Diamond Pixel Array
Configuration
DLPU016C–April 2014–Revised April 2019
Submit Documentation Feedback
Copyright © 2014–2019, Texas Instruments Incorporated
DLP NIRscan Evaluation Module Overview
11
Page 12
What is in the DLP NIRscan EVM?
www.ti.com
Figure 1-5. Diamond Pixel for Vertical, Horizontal, and Diagonal Lines
1.2.2 DLP NIRscan EVM Electronics
The DLP NIRscan EVM contains five boards which support all the electrical and software capabilities of
the spectrometer. The five boards are:
• Spectro board: The spectro board is the largest board in the DLP NIRscan EVM. The board provides
the following:
– Sitara processor: The Sitara processor (AM3358) runs a webserver which provides an HTML-based
method of controlling the spectrometer and displaying the results of sample scans. The Sitara
formulates and streams unique wavelength specific patterns to the DLPC350 for display on the
DMD while synchronizing the sampling of the spectrometer's ADC. The Sitara runs a Linux-based
spectrometer application on an open source Linux kernel. The user controls the web pages through
an RNDIS connection over USB, or by IP address over Ethernet connected to the local area
network.
– DLPC350 ASIC: The controller of the DLP4500NIR-based DLP system, the DLPC350 device
receives the pattern data from the Sitara over a 24-bit RGB bus. The DLPC350 decodes the pattern
information and converts the information into the correct format for the DMD. The device controls all
the DMD signals and synchronization, thereby directing each individual mirror to its desired state.
– External interfaces: The spectro boards provide multiple interfaces to the outside world. Standard
interfaces for communicating with the DLP NIRscan EVM are Ethernet-over-USB and a standard
RJ45 ethernet connection. To leverage the DLP NIRscan EVM platform for new product
development using the Sitara processor, the spectro board also contains a Sitara debug port, which
can be used with console software to control and debug the EVM software.
– Internal interfaces: The spectro board is at the center of the spectrometer electronics and software.
All boards plug into the spectro board though either a hard board connector or wiring harness.
12
DLP NIRscan Evaluation Module Overview
Copyright © 2014–2019, Texas Instruments Incorporated
DLPU016C–April 2014–Revised April 2019
Submit Documentation Feedback
Page 13
www.ti.com
• DMD board: The DLP4500NIR DMD is located in the optical engine portion of the system. The DMD
• Detector board: The detector board is located within the optical engine and connects the InGaAs
• TEC driver board: The TEC driver board uses the feedback from a thermistor located in the detector
• Lamp driver board: The lamp driver board provides an extremely-low noise, high-power source for the
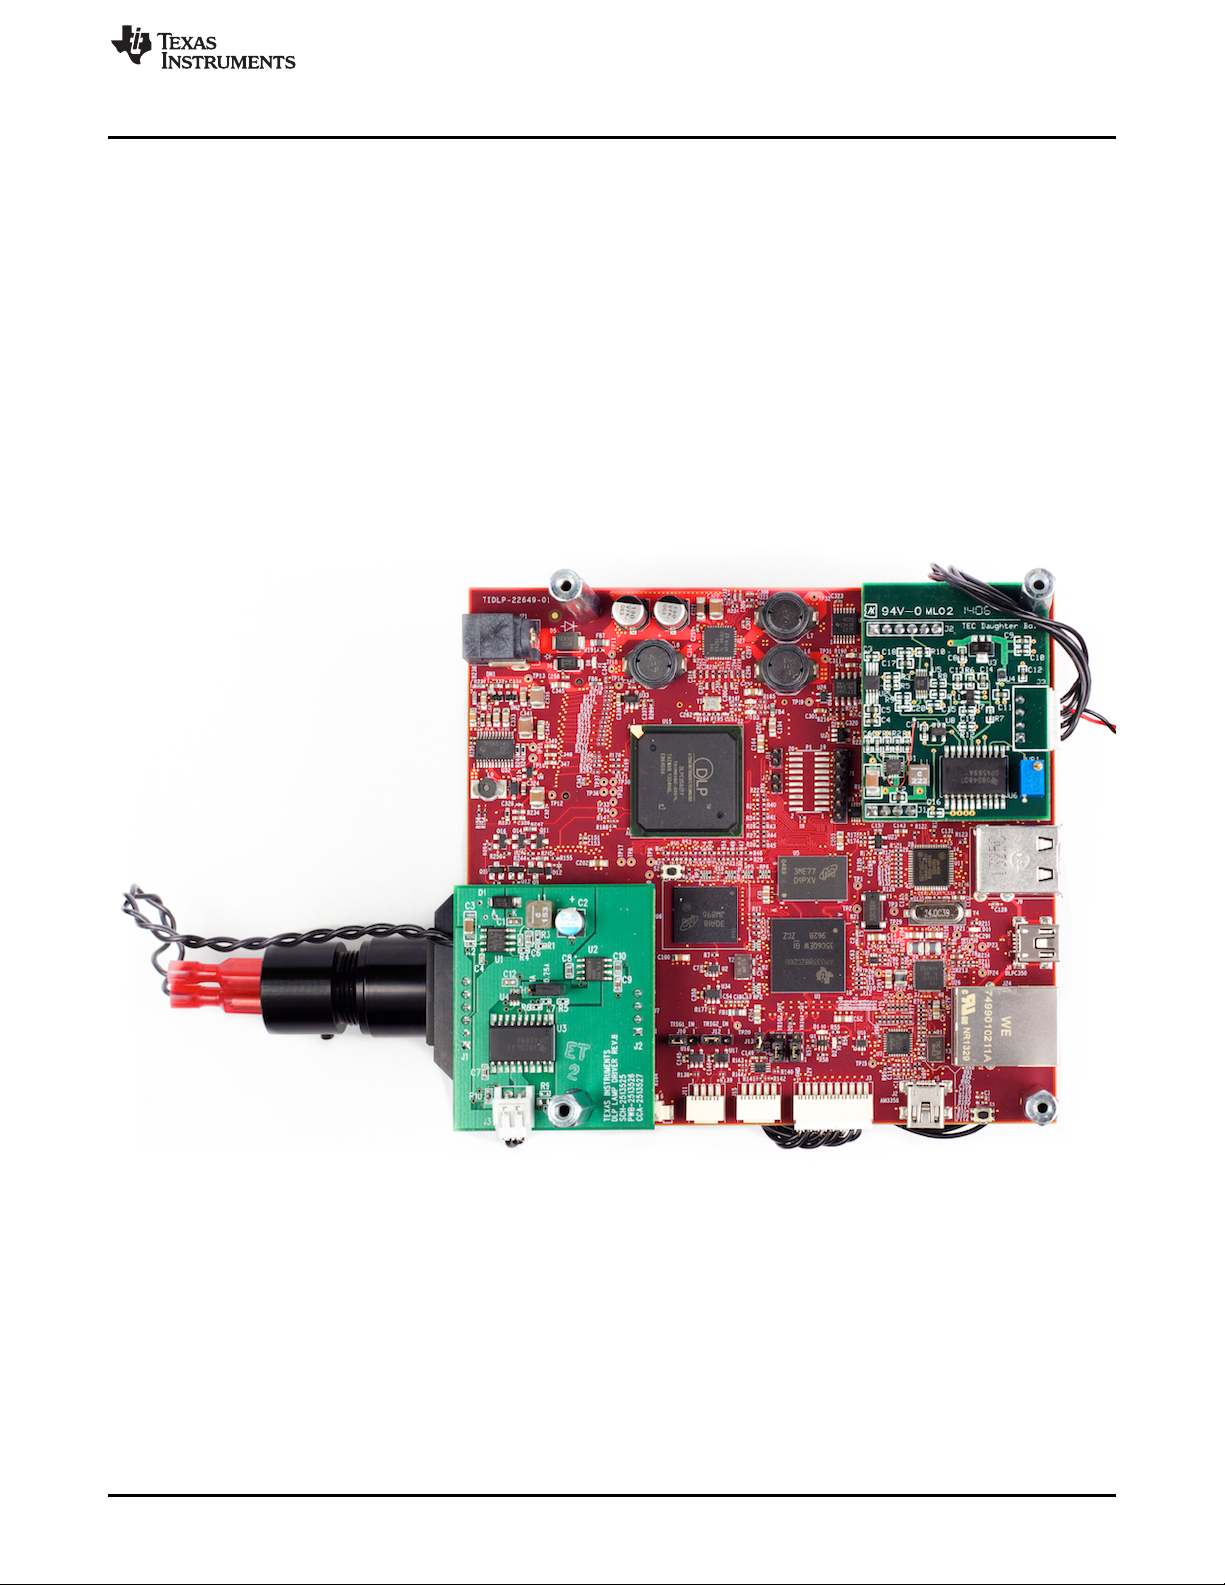
Figure 1-6 shows the spectro, TEC driver, and lamp driver boards. The detector board is located within the
optical engine. The DMD board plugs into the backside of the spectro board and connects it to the DMD
located inside the optical engine.
What is in the DLP NIRscan EVM?
board plugs into the spectro board and connects the DLPC350 to the DMD.
detector to the TEC driver board. The detector board also houses the differential amplifier circuits
which source the detector signal to the TI ADS1255 ADC. The ADS1255 ADC is used to over-sample
the resultant signals being routed from the detector for each wavelength-specific pattern being
displayed on the DMD.
to provide electrical current to the detector TEC in a closed-loop control circuit, thereby cooling the
detector to approximately –40°F and reducing detector noise.
tungsten-halogen lamp, which illuminates the sample. A low-noise source is important for a
spectrometer which has a high signal-to-noise ratio (SNR).
The DLP NIRscan EVM electronics contain many devices by TI, which are critical to the design and
performance of the DLP NIRscan EVM (see Table 1-2).
DLPU016C–April 2014–Revised April 2019
Submit Documentation Feedback
Figure 1-6. DLP NIRscan EVM
Copyright © 2014–2019, Texas Instruments Incorporated
DLP NIRscan Evaluation Module Overview
13
Page 14

Other Items Needed for Operation
Table 1-2. DLP NIRscan EVM Components
Electronics Device Number Description
DLP chipset
Embedded processor AM3358 Sitara processor
Analog chain for detector
Analog chain for TEC driver
and lamp driver
Power management
ESD protection TPD4S012 4-channel USB ESD solution with power clamp
DLPC350 Controller for the DLP4500 family of DMDs
DLPC4500NIR DMD
ADS1255 24-bit, 30 kSPS very-low noise delta-sigma ADC
OPA2376 Precision, low noise, low quiescent current operation amplifier
OPA569 Power operational amplifier, output signal swings within 200 mV of rails at 2-A output
INA330 Thermistor signal amplifier for temperature control
OPA340 Micro operational amplifier for PID control of TEC driver
TPS65217C Single-chip PMIC for battery-powered systems for AM3358, DDR3
TPS65145
TPS73025 Single output LDO, 200 mA, fixed (2.5 V), high PSRR, low noise for DLP4500NIR power
TPS65251 PMU with three DC-to-DC converters, up to 18-Vin for DLPC350 power
TPS79718
TLV61230 5-V supply for USB and input to TPS65217
TLV61230 3.3-V supply
REF5025 Low noise, very-low drift, precision voltage reference for TEC and ADC references
TPS71750 5-V analog supply for ADC and TEC
TPS71733 3.3-V analog supply for ADC
4-channel LCD bias with fully-integrated positive charge pump, 3.3-V LDO controller for
DLP4500NIR power
Single output LDO, 50 mA, fixed (1.8 V), low quiescent current, Powergood out for
DLPC350 power
www.ti.com
1.3 Other Items Needed for Operation
The DLP NIRscan EVM spectrometer is a flexible, ready-to-use EVM. However, the DLP NIRscan EVM
does not ship with cables, power supply, or additional hardware components. To use the EVM, the user
needs:
• Power supply:
– Nominal voltage: 12-V DC
– Typical current: 3 A
– Maximum current: 5 A
– DC connector size:
• Inner diameter: 2.5 mm
• Outer diameter: 5.5 mm
• Shaft: 9.5-mm female, center positive
– Efficiency level: V
– A recommended power supply is Digi-Key®part number 271-2718-ND, or equivalent
• USB cable: A-to-mini-B USB cable
• External laptop, desktop, or personal computer
1.4 DLP NIRscan Connections
Figure 1-7 and Figure 1-8 depict the connectors with their respective locations. No cables, nor power
supply are included with the unit. Only connection 8 and connection 14 or 7 are required for typical
operation. All of the connections are listed for completeness in Table 1-3.
14
DLP NIRscan Evaluation Module Overview
Copyright © 2014–2019, Texas Instruments Incorporated
DLPU016C–April 2014–Revised April 2019
Submit Documentation Feedback
Page 15

www.ti.com
Table 1-3. DLP NIRscan Connections
Connection Type Description
1 DLPC350 I2C bus Do not use while the Sitara processor is controlling the DLPC350.
2 Fan power Power output from the spectro board to power the fan.
3 TEC control cable
4 Micro-SD card slot Used for future DLP NIRscan software upgrades.
5 USB connectors
6
7 Ethernet RJ45
8 Power connector
9 Lamp power Connector from the lamp driver board to the tungsten-halogen lamp.
10
11
12
13 ADC converter SPI bus Data interface to the ADS1255 ADC
14 Mini-USB to Sitara
15 S1 Resets the DLP NIRscan to its power-up condition.
Mini-USB interface to
the DLPC350
JTAG interface for the
DLPC350
External trigger input
connector
External trigger output
connector
Connects the TEC driver board to the detector board to drive the detector TEC and read
the thermistor value from the detector.
There are two USB expansion connections in connector 5. These connections can be
used for most USB-compatible applications, such as USB memory storage, USB WLAN,
or Bluetooth applications. The software to support these expansion features is not
included in the DLP NIRscan EVM.
USB connection allows the DLP LightCrafter4500 GUI to access the DLPC350 or to
control the DLPC350 through an external USB-capable microcontroller.
Alternative to the Ethernet-over-USB connection 14. As of software release v1.0, to use
the ethernet connection requires knowledge of the IP address assigned to the DLP
NIRscan EVM at power-up. If a static IP address cannot be assigned, TI recommends
using connection 14.
Use a power supply with a 12-V DC output with 3- to 5-A current rating and a plug of
2.5-mm inner diameter × 5.5-mm outer diameter and 9.5-mm female center positive shaft.
Supports two trigger input signals for DMD pattern synchronization.
Supports two trigger output signals. These are jumper configurable:
• With jumper J13 installed, the output triggers are referenced to internal 3.3 V with up
to 100 mA available at the external connector.
• Without J13 installed, the triggers are reference to an externally supplied
1.8- to 5-V input.
Main method of connecting a laptop, desktop, or PC to the DLP NIRscan EVM. The
supported protocol is ethernet-over-USB and requires the RNDIS driver on the host PC.
DLP NIRscan Connections
Figure 1-7. DLP NIRscan EVM Connectors
(Backside View)
DLPU016C–April 2014–Revised April 2019
Submit Documentation Feedback
Figure 1-8. DLP NIRscan Connectors
(Upside-Down Side View)
DLP NIRscan Evaluation Module Overview
Copyright © 2014–2019, Texas Instruments Incorporated
15
Page 16

DLP NIRscan EVM Jumpers
1.5 DLP NIRscan EVM Jumpers
The DLP NIRscan EVM has jumpers and a variable resistor to provide flexible board control options. This
section lists the jumpers on the DLP NIRscan spectro board. Figure 1-9 depicts the locations of these
jumpers. These jumpers require a 2-mm jumper, such as Sullins Connector Solutions®SPN02SYBN-RC,
Digi-Key part number S3404-ND.
www.ti.com
16
Figure 1-9. DLP NIRscan Jumper Locations
TEC Driver Board
• VR1 – This variable resistor sets the maximum current provided to the TEC of the detector. This
current level determines the ambient temperatures at which the detector remains cooled to
approximately –40ºC. The factory establishes this amount of resistance. Do not change the
resitance unless the application requires a different detector or ambient temperature.
Lamp Driver Board
• H1 – sets the current to the lamp.
– Terminals 1 and 2 = 1 A
– Terminals 2 and 3 = 0.75 A (default)
Spectro Board
• J1 – Sitara UART0 port. Connect to this port for debug messages and Sitara debug control.
– Terminal 1 = GND
DLP NIRscan Evaluation Module Overview
Copyright © 2014–2019, Texas Instruments Incorporated
DLPU016C–April 2014–Revised April 2019
Submit Documentation Feedback
Page 17

www.ti.com
DLP NIRscan EVM Jumpers
– Terminal 2 = NC
– Terminal 3 = NC
– Terminal 4 = UART_RX
– Terminal 5 = UART_TX
– Terminal 6 = NC
• J10 – Trigger In 1
– Terminals 1 and 2 = External connector triggers the DLPC350
– Terminals 2 and 3 = Sitara triggers the DLPC350 (default)
• J12 – Trigger In 2
– Terminals 1 and 2 = External connector triggers the DLPC350
– Terminals 2 and 3 = Sitara triggers the DLPC350 (default)
• J14 – Trigger out 1
– Terminals 1 and 2 = DLPC350 generated trigger out 1 (default)
– Terminals 2 and 3 = Sitara generated trigger out 1
• J16 – Trigger out 2
– Terminals 1 and 2 = DLPC350 generated trigger out 2 (default)
– Terminals 2 and 3 = Sitara generated trigger out 2
• J13 – Power selector for trigger out voltage levels
– Jumper installed = Trigger outputs on J15 use internal 3.3-VDC levels (default)
– Jumper open = Trigger outputs on J15 use voltage levels supplied J15 terminal-1
– Note: Externally supplied voltage levels need to be 1.8, 3.3, or 5 V
• J18 – DLPC350 hold bootloader
– Jumper open = Normal operation (default)
– Jump across this header to hold the DLPC350 in bootloader mode. This hold is required only if
the DLPC350 firmware becomes corrupted and requires reprogramming through the JTAG
boundary scan or USB (atypical).
• J19 – DLPC350 I2C address select
– Jumper installed sets I2C address to 0×3A and USB device serial number to LCR3
– Jumper not installed sets I2C address to 0×34 and USB device serial number to LCR2 (default)
DLPU016C–April 2014–Revised April 2019
Submit Documentation Feedback
DLP NIRscan Evaluation Module Overview
Copyright © 2014–2019, Texas Instruments Incorporated
17
Page 18

This chapter details the steps to power-up and use the DLP NIRscan EVM spectrometer.
2.1 Power-Up the DLP NIRscan EVM
The DLP NIRscan is ready to use, out of the box. Follow these steps to power up, connect the EVM to a
computer, and access the home screen.
1. Connect a 12-V DC power supply to the input power supply connector.
2. An LED next to the power connector on the spectro board lights up green. The fan starts and the
DLPC350 and Sitara processor start booting. After 5 to 10 s, the DLPC350 is confirmed to be running
its firmware if green LED D3 (in the middle of the spectro board) starts flashing a heartbeat
(approximately one flash per second). A blue LED next to the Sitara Micro-USB connector also
illuminates to indicate that the Sitara power supplies are up.
3. The EVM Sitara processor runs a webserver, which provides display information to the user through an
HTML browser such as Mozilla Firefox®, Google™ browser, Safari®, or Internet Explorer®. Connect the
USB port of the computer with the browser to the EVM through the micro-USB connection at location
14.
4. Many computers ship with RNDIS drivers installed, which are required to use Ethernet-over-USB. After
plugging-in the micro-USB cable in step 3, if there is no RNDIS driver installed on the computer, the
software typically prompts the user before searching for the driver. After the RNDIS driver is installed,
start a browser session. The following steps install the RNDIS drivers on Windows 7 or Windows 10 in
case they are not installed.
• Download RNDIS drivers from this link:
http://www.catalog.update.microsoft.com/Search.aspx?q=USB%20RNDIS%20Gadget (5
entry from top/bottom).
• Extract the contents of .cab file to a folder.
• Connect the NIRScan EVM to PC, power it on and open Device Manager. The device displays as
COM device.
• Right Click the device and select Update Drivers.
• Select Browse My Computer For Device Software.
• Point to the folder that holds the extracted the contents of the .cab file in step 2.
• Click Next to install the new drivers.
After the drivers have been installed, the NIRScan EVM displays as USB Ethernet/RNDIS Device and
operates as expcted. Network Connections in the Control Panell displays a new ethernet connection
with description USB Ethernet/RNDIS Device. Wait until the network status changes from Identifying...
to Unidentified Network.
5. Enter http://192.168.0.10 in the URL window at the top of the browser screen: . The first time the cable
is connected on a PC, the DLP NIRscan enumerates. If the browser does not connect within 30
seconds, or the browser times out, the user may need to refresh the browser once or twice to provide
more time for the system to enumerate, load the RNDIS driver, and register its IP address with the
host PC.
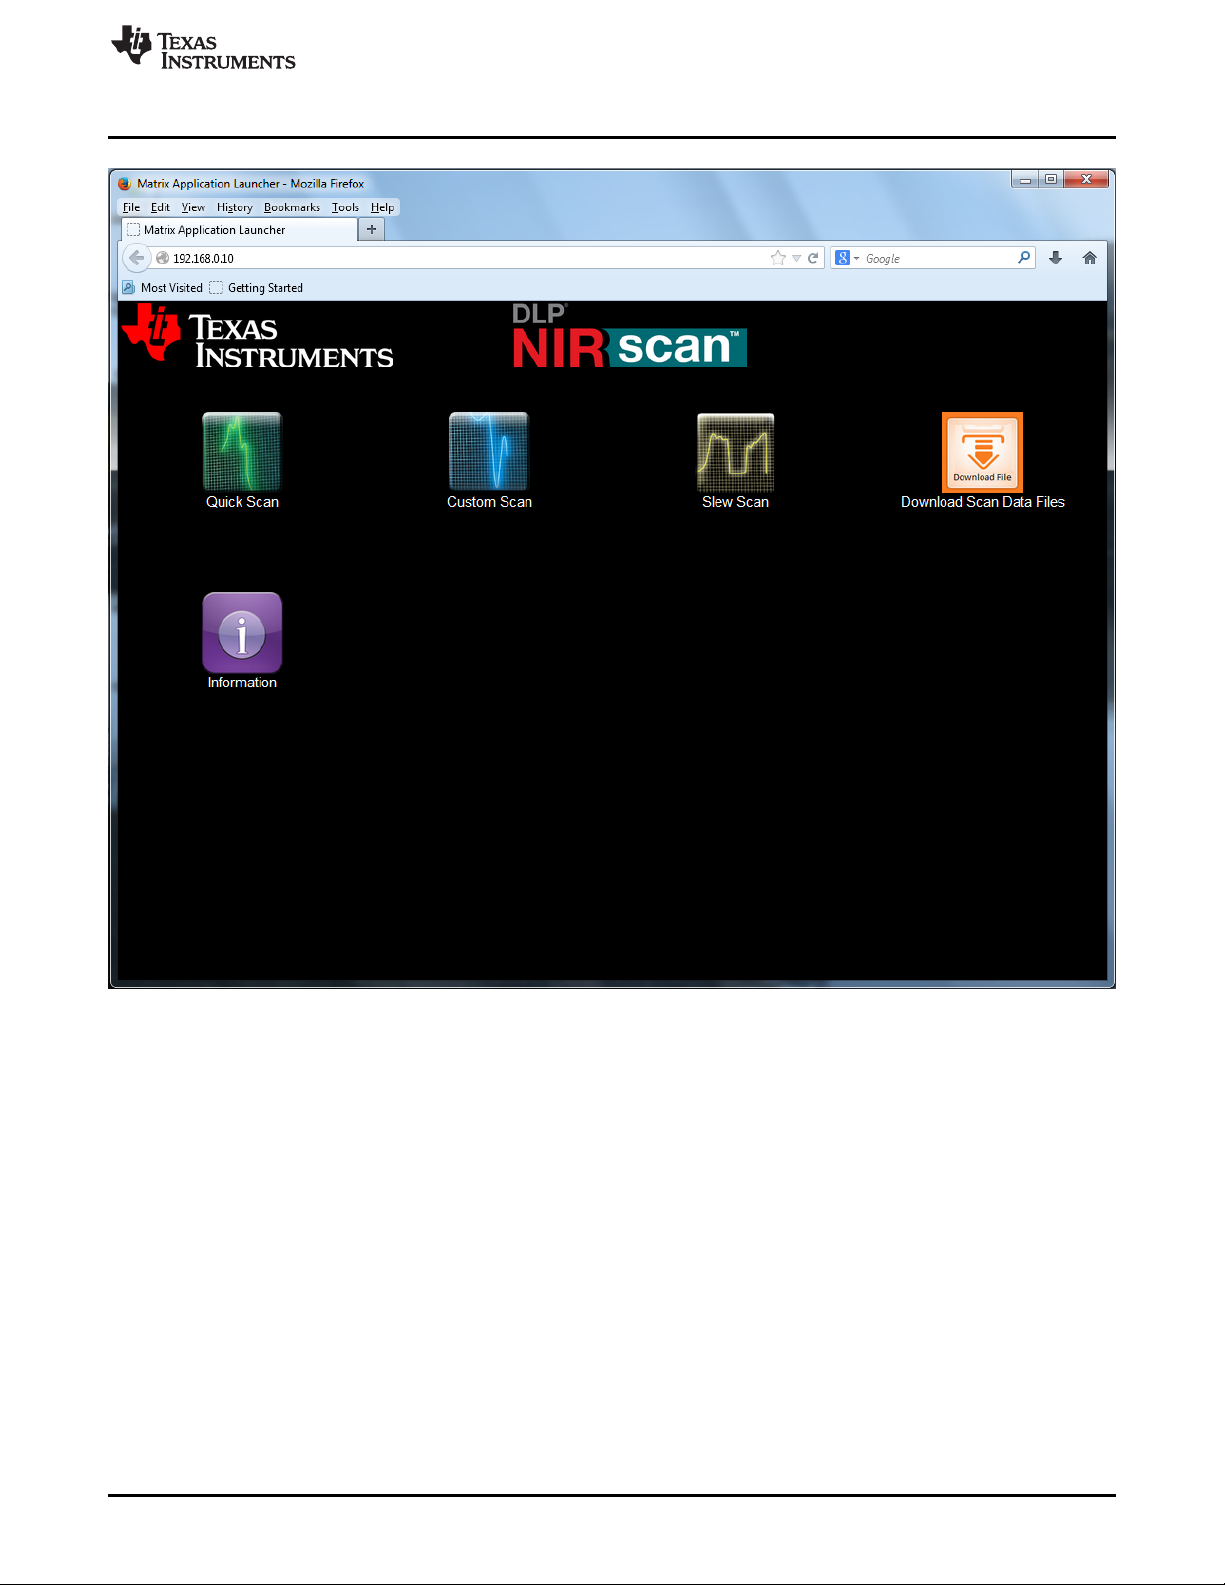
6. When connected to the DLP NIRscan, the NIRscan Home Screen displays in the browser window (see
Figure 2-1).
Chapter 2
DLPU016C–April 2014–Revised April 2019
Quick Start
th
18
Quick Start
Copyright © 2014–2019, Texas Instruments Incorporated
DLPU016C–April 2014–Revised April 2019
Submit Documentation Feedback
Page 19
www.ti.com
Power-Up the DLP NIRscan EVM
DLPU016C–April 2014–Revised April 2019
Submit Documentation Feedback
Figure 2-1. DLP NIRscan Homepage
Copyright © 2014–2019, Texas Instruments Incorporated
Quick Start
19
Page 20

Chapter 3
DLPU016C–April 2014–Revised April 2019
Operating the DLP NIRscan EVM
This chapter introduces the software executing within the DLP NIRscan EVM. The DLP NIRscan
Homepage has five icons:
• Quick Scan – Scans can be made quickly and effortlessly with fixed configuration parameters.
• Custom Scan – Users can interact with certain settings to customize scans and access raw scan data.
• Slew Scan – Users can customize the scan for distinct regions for select wavelengths, resolutions,
and integration times.
• Download Files – Users can download the spectral and/or raw data files for scans to their local
machine.
• Information – This icon provides the DLP NIRscan EVM software version information and links to DLP
NIRscan information located on www.ti.com
20
Operating the DLP NIRscan EVM
Copyright © 2014–2019, Texas Instruments Incorporated
DLPU016C–April 2014–Revised April 2019
Submit Documentation Feedback
Page 21

www.ti.com
3.1 Quick Scan Mode
From the NIRscan Home screen, clicking the Quick Scan icon takes the user to the Quick Scan screen
(see Figure 3-1).
Quick Scan Mode
The steps to take a Quick Scan are:
1. Set the reference by clicking either Run Reference Scan or Use Previous Reference.
• Run Reference Scan causes the spectrometer to scan the reference sample.
• Use Previous Reference does not re-scan the reference, but uses reference data from the last
Quick Scan reference.
• If measuring a liquid sample in a cuvette, then the reference scan is typically taken using an empty
cuvette in the sample holder. This reference scan allows the absorbance of the cuvette material to
be negated when the absorbance of the liquid sample material is calculated.
• For measurement of solid transmissive materials such as sheet plastic, the sample holder must
remain empty during the reference scan.
2. Users can change the scan name or use the default name. The scan name becomes part of the
resulting scans filenames. These filenames can be downloaded from the DLP NIRscan EVM once
scans are complete.
3. Load the cuvette with the liquid sample or insert the sheet plastic into the sample holder.
DLPU016C–April 2014–Revised April 2019
Submit Documentation Feedback
Figure 3-1. Quick Scan Screen
Copyright © 2014–2019, Texas Instruments Incorporated
Operating the DLP NIRscan EVM
21
Page 22

Quick Scan Mode
4. Click Perform Scan. The DLP NIRscan scans the sample, calculates the sample material absorbance,
and displays the absorbance in graphical format on the next screen. Figure 3-2 shows an example of
this screen.
www.ti.com
22
Figure 3-2. Example Quick Scan
The graphical representation shows the absorbance spectrum of the material, with absorbance units (AU)
on the y-axis and sampled wavelength on the x-axis.
1. To run another Quick Scan, insert a new sample in the sample holder and select the Run New Scan
button. The new scan is taken, the new absorbance spectrum is calculated (using the previous
reference), and the new spectrum re-plots to the screen all with a single click. This action can be
performed repeatedly. The filename provided on the previous Quick Scan screen is incremented with
each sample run so that sample data files can be distinguished from each other.
2. To save the spectrum data to a local machine, click the Download Spectrum Data button. This action
prompts the user to open the .csv file in excel (if available on the users machine) or to save the file
locally. The file format imports into excel as shown in Figure 3-3.
Operating the DLP NIRscan EVM
Copyright © 2014–2019, Texas Instruments Incorporated
DLPU016C–April 2014–Revised April 2019
Submit Documentation Feedback
Page 23
www.ti.com
Custom Scan Mode
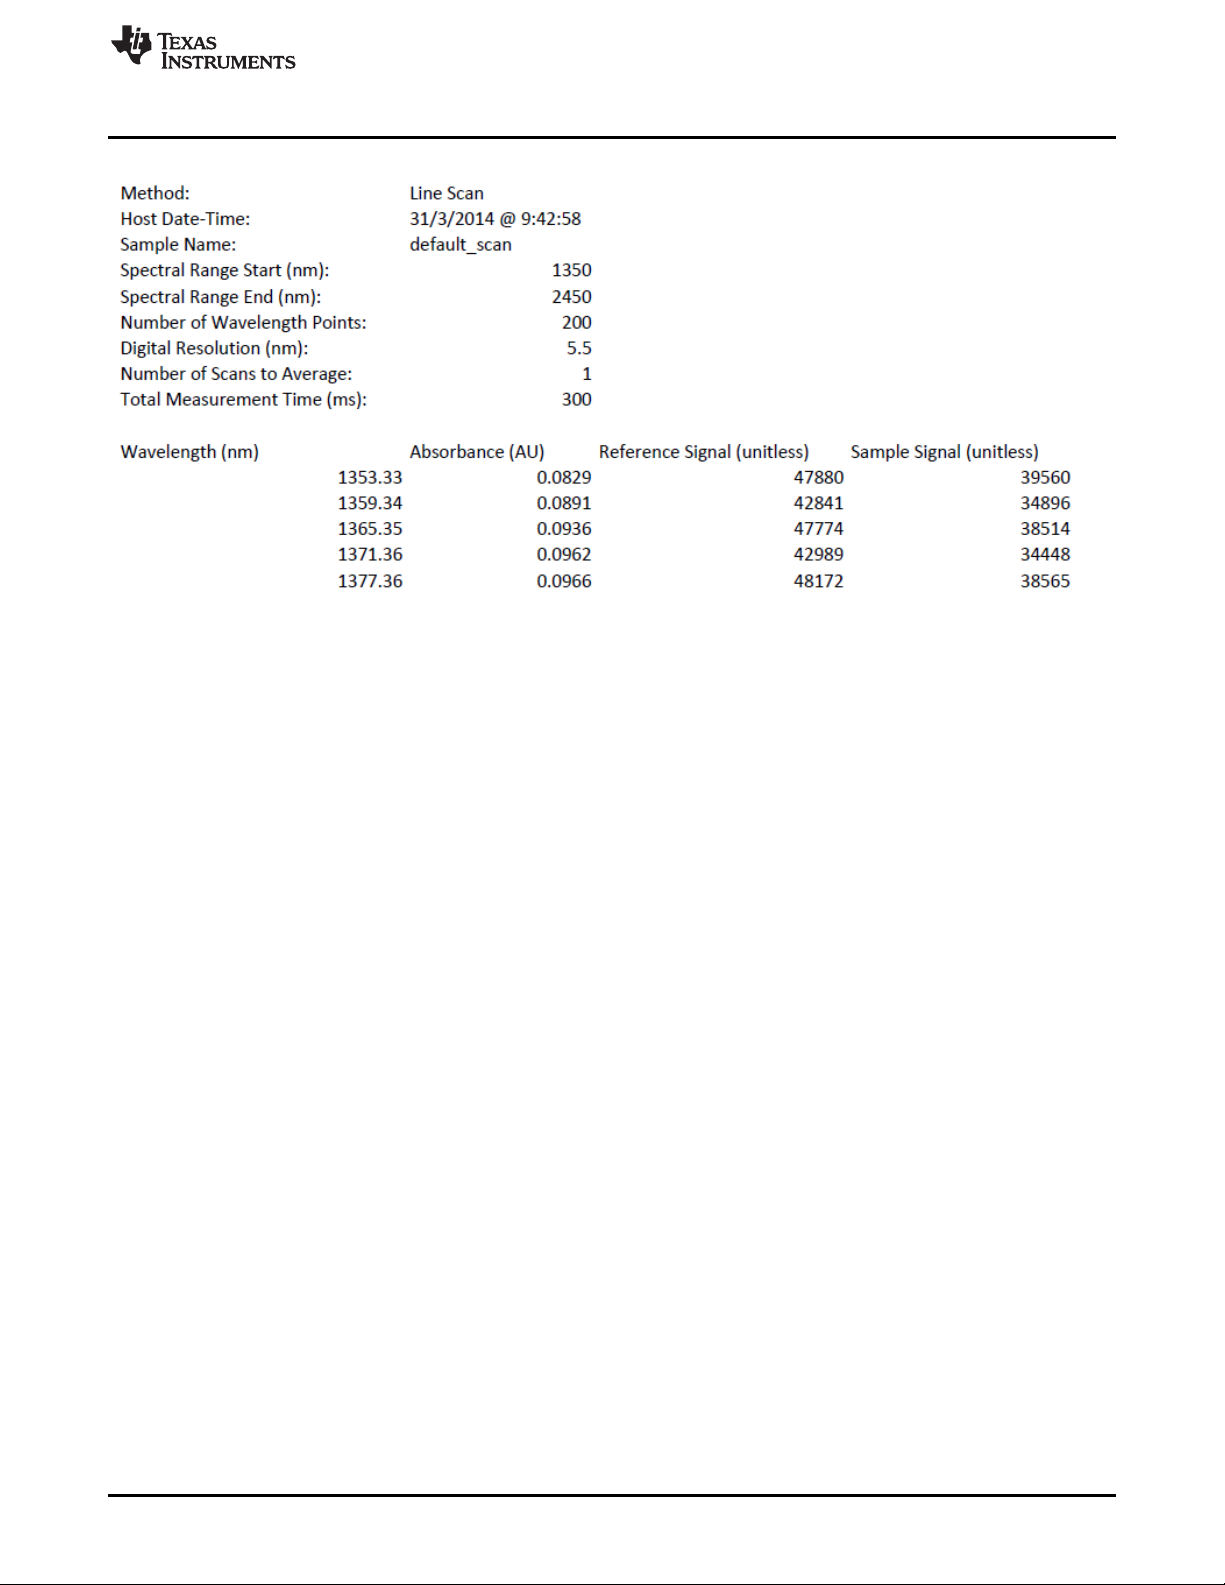
Figure 3-3. Example Quick Scan Spectrum Data
Note that the header in the download file contains many important aspects of the scan, including:
1. Method: This defaults to linescan mode at this time, referencing how the sample is taken by scanning
vertical lines across the DMD, each line representing a specific wavelength.
2. Host Date-Time: This is the date (browser date) and time the scan was taken.
3. Sample name: this is the scan name entered on the first Quick Scan screen. If the scan name has not
been changed, the sample name defaults to default_scan.
4. Spectral Range Start: always 1350 nm for Quick Scan mode
5. Spectral Range Stop: always 2450 nm for Quick Scan mode
6. Number of wavelength points: 200 for Quick Scan mode
7. Digital resolution: 5.5 nm for Quick Scan mode
8. Number of scans to average: 1 scan for Quick Scan mode
9. Total measurement time: The time taken to scan all wavelengths
10. The rest of the file is the actual data and includes:
• Wavelength
• Calculated spectrum value for each wavelength
• Average reference ADC value for each wavelength
• Average sample ADC value for each wavelength
After the data is saved locally on the machine running the browser, the user can return to the Quick Scan
screen.
3.2 Custom Scan Mode
From the NIRscan Home screen, clicking the Custom Scan icon takes the user to the Custom Scan
screen (see Figure 3-4).
DLPU016C–April 2014–Revised April 2019
Submit Documentation Feedback
Copyright © 2014–2019, Texas Instruments Incorporated
Operating the DLP NIRscan EVM
23
Page 24

Custom Scan Mode
www.ti.com
24
Figure 3-4. Custom Scan Screen
The Custom Scan mode allows more flexibility than the Quick Scan mode by allowing the user to
change the configuration parameters for the scan. The parameters for the Custom Scan mode are:
• Spectral range: for faster scan times, sub-ranges of the total 1350- to 2450-nm range can be used.
The smaller the spectral range entered, the faster the scan. For a custom wavelength range, the
smaller wavelength must be located on the left and the larger on the right. All values must be
between 1350 nm and 2450 nm.
• Number of wavelength points: This number defines into how many wavelengths the spectral
range is divided. The minimum is 3 and the maximum is 1100. The included optical system has an
optical resolution of ≤12 nm. Increasing the number of wavelength points such that the computed
digital resolution is much less than 12 nm reduces system throughput without much of an optical
resolution advantage.
• Digital resolution: This is an informational output field for the user. The calculated resolution is the
wavelength range divided by the number of wavelength points.
• Number of scans to average: This is the number of times the entire wavelength range is
repeatedly sampled. If the number in this field is 1, then the wavelength range entered is scanned
only one time. If the number 2 is entered, the wavelength range is scanned twice, one complete
scan after another. The average spectrum data for each wavelength is averaged with the data for
the same wavelength on subsequent scans.
Operating the DLP NIRscan EVM
Copyright © 2014–2019, Texas Instruments Incorporated
DLPU016C–April 2014–Revised April 2019
Submit Documentation Feedback
Page 25

www.ti.com
In the Custom Scan mode, the user must select actions which have green buttons. Clicking on graycolored buttons is ignored. To run the Custom Scan, perform the following tasks:
1. Accept the values in the custom parameter fields or enter custom parameters based on the previous
2. If the user accepts the default parameters, then the Generate Patterns button remains gray. If the
3. If the Generate Patterns button is green, click this button. When selected, the DLP NIRscan
4. Select the Set Reference button.
5. Insert the sample in the sample holder (with or without cuvette).
6. Click Perform Scan. The DLP NIRscan EVM scans the sample, calculates the sample material
Custom Scan Mode
• Total measurement time: The length of time needed to run the entire scan across all wavelengths
as entered.
• Scan name: This field allows changing the scan name to reflect something more specific to the
user, that is, like the material being scanned.
descriptions.
user changes the parameters, the Generate Patterns button turns green.
calculates the new DMD patterns for the user-selected inputs, generates the patterns, applies the
hardware-specific calibration, and saves the patterns in memory for the scan to commence. This step
is complete when the Set Reference button turns green and the message Patterns Generated - Set
New Reference! message appears.
• To measure a liquid sample in a cuvette, first run the reference scan with an empty cuvette in the
sample holder. This allows the absorbance of the cuvette material to be negated when the
absorbance of the material is calculated.
• When measuring a solid transmissive material such as a plastic by inserting the plastic into the
sample holder, ensure the sample holder is empty during the reference scan.
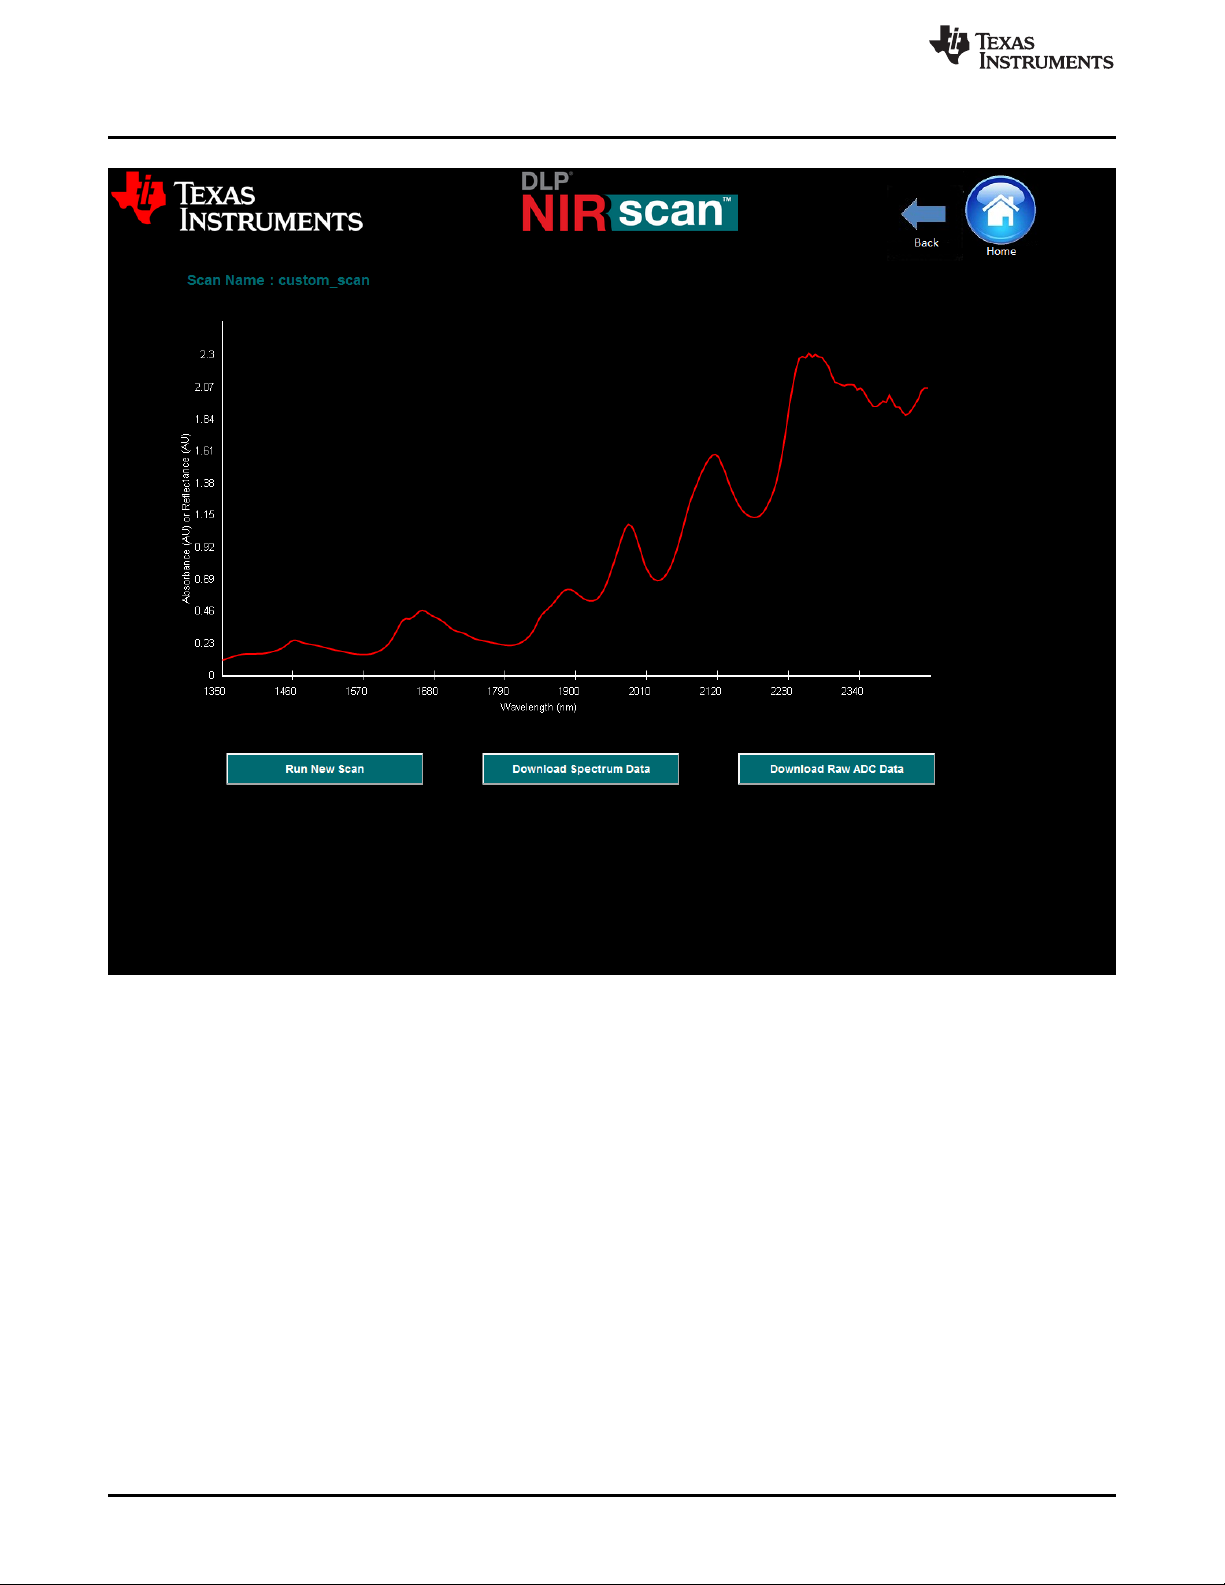
absorbance, and displays the absorbance in graphical format on the next screen. Figure 3-5 shows an
example of this screen.
DLPU016C–April 2014–Revised April 2019
Submit Documentation Feedback
Copyright © 2014–2019, Texas Instruments Incorporated
Operating the DLP NIRscan EVM
25
Page 26
Custom Scan Mode
www.ti.com
26
Figure 3-5. Example Custom Scan
The graphical representation shows the absorbance spectrum of the material, with absorbance units (AU)
on the y-axis and sampled wavelength on the x-axis.
1. To run another scan, insert a new sample (or use the same sample, to re-sample the same material),
and select the Run New Scan button. The new scan runs, the new absorbance spectrum calculates
(using the previous reference), and the new spectrum plots all with one button click. This action can be
performed repeatedly. Note that the scan name provided on the previous Custom Scan screen
increments with each sample run.
2. To save the spectrum data to a local machine, click the Download Spectrum Data button. This action
prompts the user to open the .csv file in excel (if available on the users machine) or to save the file
locally. The file format imports into excel as shown in Figure 3-6.
Operating the DLP NIRscan EVM
Copyright © 2014–2019, Texas Instruments Incorporated
DLPU016C–April 2014–Revised April 2019
Submit Documentation Feedback
Page 27

www.ti.com
Custom Scan Mode
Figure 3-6. Example Custom Scan Spectral Data
Note that the header in the download file contains many important aspects of the scan, including:
1. Method: This defaults to linescan mode at this time, referencing how the sample is taken by scanning
vertical lines across the DMD, each line representing a specific wavelength.
2. Host Date-Time: This is the date (browser date) and time the scan was taken.
3. Sample Name: This is the scan name entered on the first Custom Scan screen. If the scan name has
not been changed, the sample name defaults to default_scan.
4. Spectral Range Start: This reflects the lower scan limit entered on the Custom Scan screen.
5. Spectral Range End: This reflects the upper scan limit entered on the Custom Scan screen.
6. Number of Wavelength Points: This reflects the number entered on the Custom Scan screen.
7. Digital Resolution: This reflects the number calculated on the Custom Scan screen.
8. Number of Scans to Average: This reflects the number entered on the Custom Scan screen.
9. Total Measurement Time: This reflects the number calculated on the previous screen.
10. The rest of the file is the actual data and includes:
• Wavelength
• Calculated absorbance value for each wavelength
• Average reference ADC value for each wavelength
• Average sample ADC value for each wavelength
After the data is saved locally on the machine running the browser, the user can return to the Custom
Scan screen.
Download Raw ADC Data: In the Custom Scan mode, there is another button located beneath the plotted
absorbance spectrum labeled Download Raw ADC Data. Whereas the Download Spectrum button
provides averaged reference and sample data values, there are potentially cases where a user may want
to download all the data points sampled during the scan. To save the raw data to a local machine, click
the Download Raw ADC Data button. This action prompts the user to open the .csv file in excel (if
available on the users machine) or to save the file locally. The file format imports into excel as shown in
Figure 3-7.
DLPU016C–April 2014–Revised April 2019
Submit Documentation Feedback
Copyright © 2014–2019, Texas Instruments Incorporated
Operating the DLP NIRscan EVM
27
Page 28

Slew Scan Mode
www.ti.com
Note that the header in the download file contains many important aspects of the scan, including:
1. Method: This defaults to linescan mode at this time, referencing how the sample is taken by scanning
vertical lines across the DMD, each line representing a specific wavelength.
2. Host Date-Time: This is the date (browser date) and time the scan was taken.
3. Sample Name: This is the scan name entered on the first Custom Scan screen. If the scan name has
not been changed, the sample name defaults to default_scan.
4. Spectral Range Start: This reflects the lower scan limit entered on the previous screen
5. Spectral Range Stop: This reflects the upper scan limit entered on the previous screen
6. Number of Wavelength Points: This reflects the number entered on the previous screen
7. Digital Resolution: This reflects the number calculated on the previous screen
8. Number of Scans to Average: This reflects the number entered on the previous screen.
9. Total Measurement Time: This reflects the number calculated on the previous screen
10. The rest of the file is the actual raw data and includes:
• DMD pattern number
• Individual reference ADC data values for each pattern (wavelength)
• Individual sample ADC data values for each pattern (wavelength)
After the data is saved locally on the machine running the browser, the user can return to the Custom
Scan screen.
3.3 Slew Scan Mode
From the NIRscan Home screen, clicking the Slew Scan icon takes the user to the Slew Scan screen
(see Figure 3-1).
Figure 3-7. Example Custom Scan Raw Data
28
Operating the DLP NIRscan EVM
Copyright © 2014–2019, Texas Instruments Incorporated
DLPU016C–April 2014–Revised April 2019
Submit Documentation Feedback
Page 29
www.ti.com
Slew Scan Mode
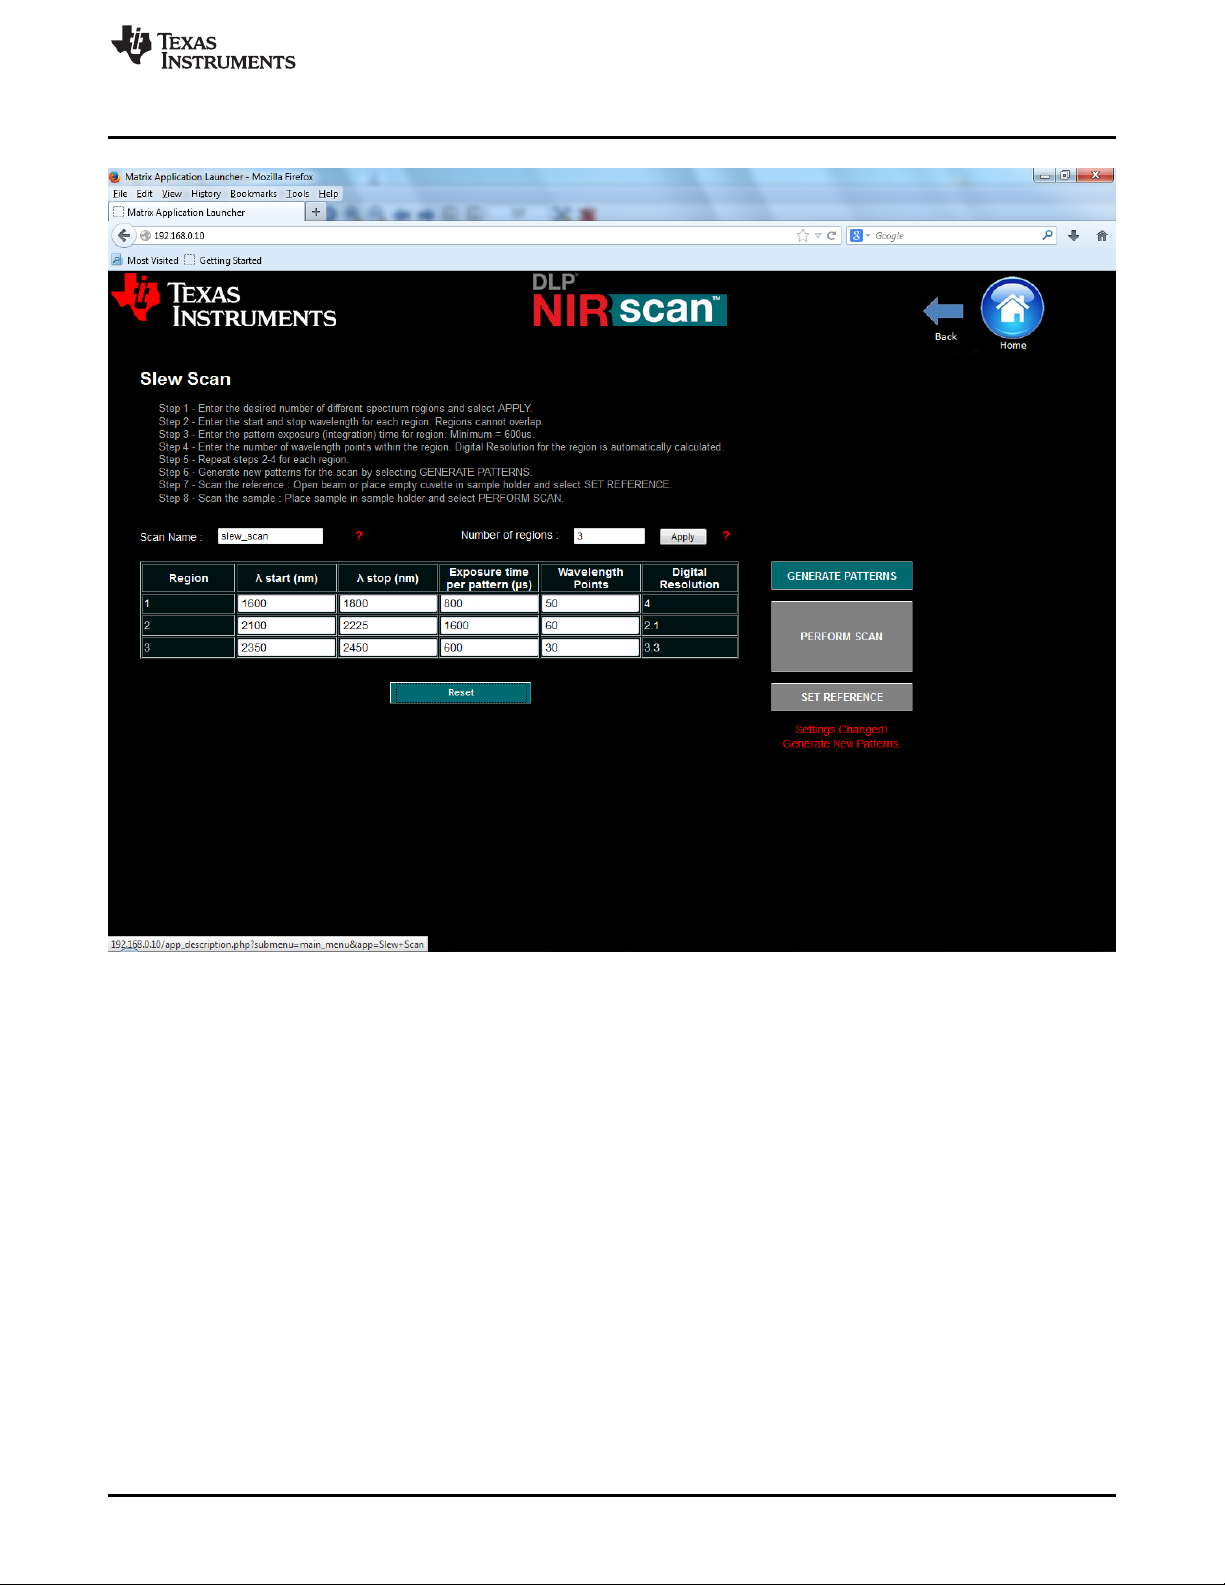
The Slew Scan screen provides users the ability to divide the 1350-2450nm spectral range into user
defined regions, each region with its own spectral range, exposure (integration) times, and spectral
resolutions. Non-overlapping regions from 1 to 10 can be defined. This provides unique scan methods
which enable the following use cases:
• Wavelength Skipping: Sometimes, the entire spectral range need not be scanned for users to identify
specific molecules within a sample. Scanning a subset of defined spectral regions of the spectral range
is all that is needed. In this case, uninteresting regions of the spectrum can be omitted in the scan by
specifying only the spectral regions of interest. Gaps between segments are allowed. Figure 3-8 shows
a Slew Scan configuration example showing how spectral regions of interest are entered in the table all other areas of the spectrum not entered are ignored, thereby making the scan much shorter yet still
capable of detecting the presence (or absence) of important molecules.
• Variable Resolution: Based on the spectrum expected for a given substance, there may be regions of
the spectrum where high digital resolution is needed, with less interesting areas requiring less
resolution. Each region in the configuration table can be configured to have different resolutions. Lower
resolutions for areas of little (expected) detail help speed up scan times.
• Variable Integration: Exposure (Integration) Times for each defined region can be increased or
decreased to meet user specific Signal-to-Noise Ratio (SNR) requirements. In regions which have high
absorbance, longer exposure times (averaging) may be needed to improve SNR, and in regions of low
absorbance and possibly little importance, shorter exposure times are more than adequate for
deterministic results. By decreasing exposure times for these uninteresting regions, it helps to speed
DLPU016C–April 2014–Revised April 2019
Submit Documentation Feedback
Figure 3-8. Slew Scan Screen
Copyright © 2014–2019, Texas Instruments Incorporated
Operating the DLP NIRscan EVM
29
Page 30

Slew Scan Mode
up overall scan times.
Below are the steps to setup and execute a Slew Scan. This example uses 3 regions which are not
contiguous, have different exposure times per pattern in each region, and different digital resolutions for
each region. The configuration is located above in Figure 3-8. Graphical output results are shown below in
Figure 3-9
1. Determine the number of distinct spectral segments required and enter that number in the Number of
Regions box. Now click the Apply button and the entry table expands or contracts to provide one row
for each Region. Now the user can enter the desired configuration settings for each of the desired
regions:
• Lambda Start (nm): is the starting wavelength for the region N. The starting wavelength must be
• Lambda Stop (nm): is the stopping wavelength for the region N. The stopping wavelength must
• Exposure time per pattern (µs): The minimum exposure time is 600 µs. Ensure that [maximum
• Wavelength Points: The number of wavelength points defines the number of the patterns being
• Digital Resolutions is only one of the contributors to the true spectral resolution of a DLP based
2. As in the other scan modes, the user can change the scan name, or leave the default name in place.
The sfotware embeds in the resulting filenames for imminent scans, which can be downloaded from
the DLP NIRscan after the scans are complete.
3. As in the Custom Scan mode, whenever new configuration data are entered, or existing settings are
modified, the NIRscan generates new patterns defined by the new configuration data. The Generate
Patterns button turns green when the configuration data changes to indicate new patterns are needed.
• Click Generate Patterns. This step is complete when the Set Reference button turns green and
4. Click Set Reference .
• If planning to measure a liquid sample in a cuvette, first run the reference scan with an empty
• When measuring a solid transmissive material such as sheet plastic by inserting the plastic into the
5. Insert the sample in the sample holder (with or without cuvette).
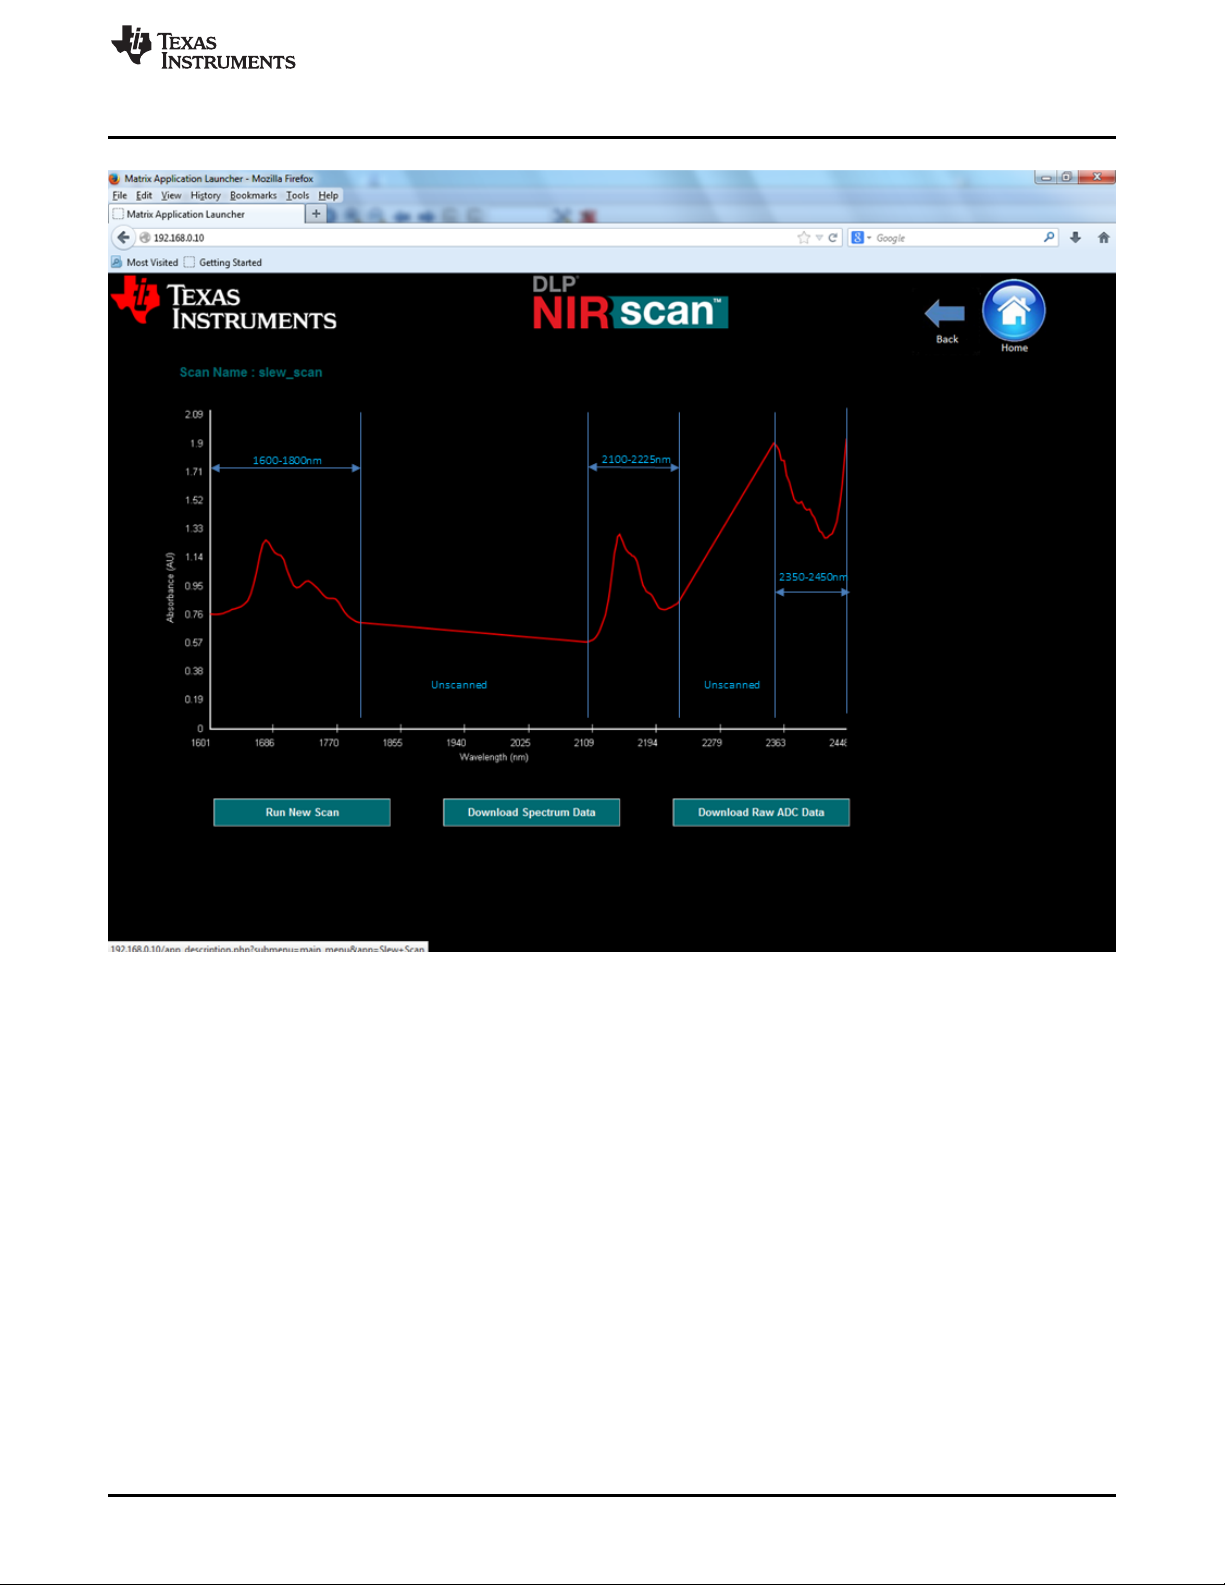
6. Click Perform Scan. The DLP NIRscan EVM scans the sample, calculates the sample material
absorbance, and displays the absorbance in graphical format on the next screen. Figure 3-5 shows an
example of this output.
www.ti.com
≥1350 and must be
> the Region (N-1)'s Lambda Stop value.
be > the region N Lambda start value, and must be ≤2450.
allowed exposure time (µs/pattern)] × [the number of wavelength points] is less than or equal to 1
second. The NIRscan EVM software design limits the exposure time constraints. Because the DLP
patterns applied to the DMD are inherently programmable, customer systems can implement much
longer integration times for applications which require them.
applied to the DMD within this region only. [Lambda stop – Lambda Start] / # wavelength points) =
the Digital Resolution for which the DMD is programmed
spectrometer. See DLP Spectrometer Design Considerations for more information regarding
spectrometer resolution as a function of DMD digital resolution, input slit width, and optical point
spread function.
the message Patterns Generated - Set New Reference! message displays.
cuvette in the sample holder. This scan allows the absorbance of the cuvette material to be
negated when the absorbance of the material is calculated.
sample holder, ensure the sample holder remains empty during the reference scan.
30
Operating the DLP NIRscan EVM
Copyright © 2014–2019, Texas Instruments Incorporated
DLPU016C–April 2014–Revised April 2019
Submit Documentation Feedback
Page 31
www.ti.com
Slew Scan Mode
The graphical representation in Figure 3-9 shows the absorbance spectrum of the sampled material, with
absorbance units (AU) on the y-axis and wavelength on the x-axis. The 3 regions of interest are
highlighted in blue and the two regions not of interest are identified with the word "unscanned". Each
scanned region is measured based on the configuration information supplied for that region. For
unscanned spectral regions not configured in the configuration table, the graphical output shows a straight
line from the last wavelength in region N to the first wavelength in region N+1.
1. To run another scan, insert the new sample and select the Run New Scan button. The new scan runs,
the new absorbance spectrum calculates (using the previous reference), and the new spectrum plots
all with one button click. This action can be performed repeatedly. The scan filename provided on the
previous Slew Scan configuration screen increments with each sample run. Data files for these scans
can then be downloaded to a local machine.
2. To save the spectrum data for the most recent scan to a local machine, click the Download Spectrum
Data button. This action prompts the user to open the .csv file in excel (if available on the users
machine) or to save the file locally. The file format provided for Slew Scan mode is very similar to the
previously defined Custom Scan file format, except that the system identifies the file format as a Slew
Scan and breaks in the wavelength data occur for undefined scan regions.
DLPU016C–April 2014–Revised April 2019
Submit Documentation Feedback
Figure 3-9. Eample Slew Scan
Copyright © 2014–2019, Texas Instruments Incorporated
Operating the DLP NIRscan EVM
31
Page 32

File Download Icon
3.4 File Download Icon
From the NIRscan Home screen, clicking on the File Download Icon on the DLP NIRscan Home screen
diaplays a screen where the user can select for download either spectrum data files or raw data files from
previous scans. The system cleares all scan files from the DLP NIRscan EVM memory when the unit is
powered off or reset. (see Figure 3-10).
www.ti.com
The File Download Screen shows the files for all scans which have been captured on the NIRscan. The
user must select the scan type for the data they are seeking to download by selecting either the Quick
Scan button, the Custom Scan button, or the Slew Scan button.
After the scan type is selected, the user can select one file name per instance, and download the
Spectrum data by selecting Download Spectrum Data, or the raw data by selecting Download Raw
Data. The sytem displays a browser specific window that requires the user to either save or open the file.
To download another file, the user must select a different file from the list and follow the same procedure.
3.5 System Information
From the NIRscan Home screen, clicking on the Information Icon on the DLP NIRscan Home screen
displays the Information screen shown in Figure 3-10).
32
Operating the DLP NIRscan EVM
Figure 3-10. File Download Screen
Copyright © 2014–2019, Texas Instruments Incorporated
DLPU016C–April 2014–Revised April 2019
Submit Documentation Feedback
Page 33

www.ti.com
System Information
The version displayed on the screen is the software version for the Sitara processor. The screen also
included hyperlinks to documents relevant to the DLP NIRscan and its components.
DLPU016C–April 2014–Revised April 2019
Submit Documentation Feedback
Figure 3-11. Information Screen
Copyright © 2014–2019, Texas Instruments Incorporated
Operating the DLP NIRscan EVM
33
Page 34

A.1 Warnings and Cautions
Possible hazardous optical radiation emitted from this product. Do
not stare at operating LEDs. May be harmful to eyes. Also, avoid
touching components during operation.
Appendix A
DLPU016C–April 2014–Revised April 2019
Safety
WARNING
CAUTION
To minimize the risk of fire or equipment damage, make sure that air is allowed
to circulate freely around the DLP NIRscan when operating.
CAUTION
The kit contains ESD-sensitive components. Handle with care to prevent
permanent damage.
34
Safety
Copyright © 2014–2019, Texas Instruments Incorporated
DLPU016C–April 2014–Revised April 2019
Submit Documentation Feedback
Page 35

B.1 External Power Supply Requirements
The DLP NIRscan EVM does not include a power supply. The external power supply requirements are:
• Nominal voltage: 12 V DC –5% / +10%
• Minimum current: 3 A
• Maximum current: 5 A
• DC connector size:
– Inner diameter: 2.5 mm
– Outer diameter: 5.5 mm
– Shaft: 9.5 mm female, center positive
• Efficiency level: V
• A recommended power supply is Digi-Key part number 271-2718-ND, or equivalent.
NOTE: External Power Supply Regulatory Compliance Certifications: Recommend selection and use
of an external power supply, which meets TI’s required minimum electrical ratings in addition
to complying with applicable regional product regulatory and safety certification requirements
such as (by example) UL, CSA, VDE, CCC, PSE, and so forth.
Appendix B
DLPU016C–April 2014–Revised April 2019
Power Supply Requirements
DLPU016C–April 2014–Revised April 2019
Submit Documentation Feedback
Copyright © 2014–2019, Texas Instruments Incorporated
Power Supply Requirements
35
Page 36

NIRscan EVM Reprogramming Procedure
C.1 Creating a bootable microSD Card
When a new version for the DLP NIRscan EVM is available, the NIRscan can be reprogrammed only by
creating and using a micro-SD flash card. A minimum flash card size of 4GB is required. This card must
be created using the new version binary located on ti.com and the following procedure.
1. Download the DLP NIRscan MicroSD Image for Windows for programming the NIRscan. Access this
file from the DLP NIRscan EVM website. After signing into TI and starting the download, Select RUN
(rather than SAVE). The file size is approximately 1 GB. Save this file to a directory which is easy to
locate. The default path is C:\Texas Instruments-DLP\NIRscan_2.0.0
2. Unzip the downloaded file into the same directory using Winzip, 7-zip, or another Windows compatible
zip/unzip utility. The file isused to create the micro-SD card used to flash the eMMC of the NIRscan
electronics.
3. Download and unzip the Win32DiskImager software into a folder on the PC. This software creates and
installs the flash image on the micro-SD card.
4. Run the Win32DiskImager application. A small window displays a Help link. Use this to find answer to
questions regarding program usage.
5. Place a blank micro-SD card into the PC SD card slot. Within the Win32DiskImager application, select
the drive letter that corresponds to the PC's SD card reader. by clicking on the Device box with a letter
in it. Make sure to select the correct drive letter.
6. Select the file from the directory that holds the unzipped new image by clicking on the folder icon next
to the Device box.
7. Select the write option to start the writing process. Image file is approximately 3GB in size.
8. When finished, remove the microSD card from the reader. The card is now ready to reprogram the
DLP NIRscan EVM.
Appendix C
DLPU016C–April 2014–Revised April 2019
C.2 Reprogramming the DLP NIRscan EVM Application Software
For steps on programming the DLPC350, please see section C.3 below.
1. Prepare the NIRscan by UNPLUGGING ALL CABLES from the unit to be programmed, including the
power cable.
2. Insert newly created microSD card into the microSD card slot on the NIRscan Spectral board with
contacts facing away from the board as shown in Figure C-1.
36
NIRscan EVM Reprogramming Procedure
Copyright © 2014–2019, Texas Instruments Incorporated
DLPU016C–April 2014–Revised April 2019
Submit Documentation Feedback
Page 37

www.ti.com
Reprogramming the DLP NIRscan EVM Application Software
Figure C-1. MicroSD Card Slot
3. Press and hold down switch S2 (shown in Figure C-2) while plugging in the power cable. Do not use
any metal tools or objects as these could short potentially damage the electronics if misplaced.
DLPU016C–April 2014–Revised April 2019
Submit Documentation Feedback
NIRscan EVM Reprogramming Procedure
Copyright © 2014–2019, Texas Instruments Incorporated
37
Page 38

Reprogramming the DLP NIRscan EVM Application Software
www.ti.com
38
Figure C-2. Boot Switch Location
4. Continue to hold down S2 until any on-board LED lights up (about 1 second) - then release S2.
5. One or both of two blue LEDs (D1 and D2) as shown in Figure C-3, flash on and off erratically. This
behavior indicates the eMMC is being programmed.
NIRscan EVM Reprogramming Procedure
Copyright © 2014–2019, Texas Instruments Incorporated
DLPU016C–April 2014–Revised April 2019
Submit Documentation Feedback
Page 39

www.ti.com
Upgrading the DLPC350 Firmware
Figure C-3. LED Location
6. Reprogramming typically occurs in fewer than 10 minutes. When programming completes successfully,
D1 and D2 stop flashing and stay illuminated.
7. After confirming that D1 and D2 have illuminated steadily for at least 20 seconds, remove power from
the board by removing the power cable.
8. Remove the microSD card from the board.
9. Reapply power to the board by plugging in the cable.
10. The NIRscan boots from the new software. For the first operation after reprogramming, the NIRscan
boot takes slightly longer to complete. When LED D1 illuminates, it indicates that the NIRscan is ready
to communicate. Plug in the USB cable, enter http://192.168.0.10 into the browser URL window, hit
enter, and the NIRscan menu appears.
C.3 Upgrading the DLPC350 Firmware
This section describes how to reprogram the DLP NIRscan EVM with its application software. Because the
NIRscan firmware version and the DLPC350 version have dependencies, when upgrading the DLP
NIRscan EVM software, the DLPC350 may also require an upgrade.
These are the two compatible versions:
• NIRscan version 1.0.0 operates with DLPC350 firmware version 1.1 only.
• NIRscan version 2.0.0 operates with DLPC350 firmware version 2.0 only
The steps to reprogram the DLPC350 are:
1. Download the latest DLPC350 firmware version select save rather than open to a directory and
remember the file location. For example, if reprogramming the NIRscan with Application software
version 2.0.0, select DLPR350PROM version 2.0
DLPU016C–April 2014–Revised April 2019
Submit Documentation Feedback
NIRscan EVM Reprogramming Procedure
Copyright © 2014–2019, Texas Instruments Incorporated
39
Page 40

Revision History
2. Download the LightCrafter4500 PC-based GUI. To install the QT GUI, just expand the
LightCrafter4500_GUI.zip file into a directory and double-click on the executable file.
3. Turn on the NIRscan and then connect a USB cable from the PC to the DLPC350 USB connector J8.
4. After running the LightCrafter4500.exe file, the system displays the GUI main window. The green light
to the left of the word Connected in the upper left corner of the GUI iindicates a connection to the
DLPC350 device.
5. Select the Image / Firmware tab.
6. Select the Firmware Upload subtab.
7. Click Browse to select the file to install.
8. Click Upload .
9. Wait for the upload process to complete. The system erases the flash memory first, then rewriites it
with the new firmware image selected.
10. Remove power from the NIRscan EVM, close the LightCrafter 4500 GUI, and unplug the USB cable.
11. Plug the USB back into the NIRscan. If the NIRscan application code has already been updated, then
the NIRscan is ready to go. If not, then follow the instructions in C.1 and C.2 to reprogram the NIRscan
application code.
12. After both are updated, the NIRscan is ready to operate.
.
Revision History
NOTE: Page numbers for previous revisions may differ from page numbers in the current version.
www.ti.com
Changes from B Revision (November 2014) to C Revision ........................................................................................... Page
• Added steps to install RNDIS drivers fo Windows OS in Section 2.1............................................................. 18
Changes from A Revision (August 2014) to B Revision ................................................................................................ Page
• Added DLP Spectrometer Design Considerations to Related Documentation.................................................... 7
• Changed from Design Guide to Design Considerations and added URL link................................................... 30
• Changed to http://192.168.0.10 from http://192.168.1.10 .......................................................................... 39
Changes from Original (April 2014) to A Revision .......................................................................................................... Page
• Added Browser Recommendations..................................................................................................... 6
• Home Screen updated for v2.0 ........................................................................................................ 19
• Added Slew Scan and Download Files Icons........................................................................................ 20
• Update v2.0 Custom Scan image to include instructions........................................................................... 24
• Added the Slew Scan Mode Instructions ............................................................................................. 28
• Added the File Download Section ..................................................................................................... 32
• Updated the System Information/Revision screen .................................................................................. 32
• Added NIRscan Reprogramming Procedure......................................................................................... 36
40
Revision History
Copyright © 2014–2019, Texas Instruments Incorporated
DLPU016C–April 2014–Revised April 2019
Submit Documentation Feedback
Page 41

IMPORTANT NOTICE AND DISCLAIMER
TI PROVIDES TECHNICAL AND RELIABILITY DATA (INCLUDING DATASHEETS), DESIGN RESOURCES (INCLUDING REFERENCE
DESIGNS), APPLICATION OR OTHER DESIGN ADVICE, WEB TOOLS, SAFETY INFORMATION, AND OTHER RESOURCES “AS IS”
AND WITH ALL FAULTS, AND DISCLAIMS ALL WARRANTIES, EXPRESS AND IMPLIED, INCLUDING WITHOUT LIMITATION ANY
IMPLIED WARRANTIES OF MERCHANTABILITY, FITNESS FOR A PARTICULAR PURPOSE OR NON-INFRINGEMENT OF THIRD
PARTY INTELLECTUAL PROPERTY RIGHTS.
These resources are intended for skilled developers designing with TI products. You are solely responsible for (1) selecting the appropriate
TI products for your application, (2) designing, validating and testing your application, and (3) ensuring your application meets applicable
standards, and any other safety, security, or other requirements. These resources are subject to change without notice. TI grants you
permission to use these resources only for development of an application that uses the TI products described in the resource. Other
reproduction and display of these resources is prohibited. No license is granted to any other TI intellectual property right or to any third
party intellectual property right. TI disclaims responsibility for, and you will fully indemnify TI and its representatives against, any claims,
damages, costs, losses, and liabilities arising out of your use of these resources.
TI’s products are provided subject to TI’s Terms of Sale (www.ti.com/legal/termsofsale.html) or other applicable terms available either on
ti.com or provided in conjunction with such TI products. TI’s provision of these resources does not expand or otherwise alter TI’s applicable
warranties or warranty disclaimers for TI products.
Mailing Address: Texas Instruments, Post Office Box 655303, Dallas, Texas 75265
Copyright © 2019, Texas Instruments Incorporated
 Loading...