

TA700/800 Series
PCI-X, PCI, CPCI, PMC
BUS Analyzer-Exerciser
User’s Manual
Compatible with software version 4.7 and higher
P/N 400-0020-012 072105 ©2005


Working Mode Configurations
State Analyzer maximum speed MHz
Exerciser maximum speed MHz
Timing Analyzer
Asynchronous Timing Analysis
Synchronous Timing Analysis
Easy Mode
Advanced Mode
Additional Features
Number of Sequencer States
Performance Analysis
Counters
Counter Size [Bits]
Pre-defined Projects
Simultaneous with Exerciser
Catalyst Enterprises, Inc.
TA700/800 Series Comparison
TA700 TA700C TA700PDC TA800/850 (1)
PCI-X PCI CPCI-X CPCI PCI-X PMC PCI-X PCI
100 70 100 70 66.66 66.66 133.33 70
66.66 66.66 66.66 66.66 66.66 66.66 133.33 70
YYYYNNNS*NS*
YYYYNNNS*NS*
TBI*YTBI*YNNNS*NS*
YYYYYYYY
YYYYYYYY
32 32 32 32 32 32 16 16
YYYYYYYY
88888888
32 32 32 32 32 32 32 32
YYYYYYYY
YYYYYYYY
Statistical Analysis
Min/Max/Avg
Latencies
Retry
Data Transfers
Command Utilization
Bus Utilization
Target Terminations [Various]
User Defined Events
Display - Graphical on Screen
Save result in File for subsequent review
Special Capabilities
Protocol Errors
Mnemonics
Compliance Testing
Interconnect to Host System
Parallel Port
USB Port
Simulation Mode - Data Analysis Without Hardware Y Y Y YYYYY
TBI* Y TBI* Y TBI* Y TBI* Y
Y
YYYYYYYY
YYYYYYYY
YYYYYYYY
YYYYYYYY
N/A Y N/A Y N/A Y N/A Y
YYYYYYYY
Y Rev. D+ Y Rev. D+ Y Y Y Rev. C+ Y Rev. C+ Y Y
YYYYYYY
Easy Mode
Pre-defined Capture and Trigger Projects
Voltage Check
TBI* To be implemented
NS* Not Supported
24 23 24 23 24 23 24 23
YYYYNNYY
iii

Catalyst Enterprises, Inc.
Memory Size
Standard
Optional
Timing
Minimum Clock Rate [MHz]
Maximum Clock Rate [MHz]
TA700/800 Series Comparison Cont.
TA700 TA700C TA700PDC TA800/850 (1)
PCI-X PCI CPCI-X CPCI PCI-X PMC PCI-X PCI
128K 128K 128K 128K 128K 128K 128K 128k
4M 4M 4M 4M None None NS* NS*
25 25 25 25 >1KHz >1KHz >1KHz >1KHz
100 70 100 70 66.66 66.66 133.33 66.66
Asynchronous Timing Clock MHz
Advanced Mode
User Defined Projects
Definable Event Patterns
Protocol Errors
Miscellaneous
PCI Signals sampled (Not JTAG)
External Input Signals
Status LEDs
664 664 664 664 None None NS* NS*
YYYYYYYY
88888888
58 51 58 51 58 51 58 51
ALL ALL ALL ALL ALL ALL ALL ALL
16 16 16 16 16 16 TBI* TBI*
55442255
TBI* To be Implemented
NS* Not Supported
(1) The TA850 is a functional equivalent of the TA800 built as a low profile PCI card operating on +3V only
and with the parallel port interface replaced by a 10/100 ethernet connection.
iv

Catalyst Enterprises, Inc.
Table of Contents
INTRODUCTION - - - - - - - - - - - - - - - - - - - - - - - - - - - - - - - - - - - - - - - - - - 1
WHAT’S IN THIS MANUAL - - - - - - - - - - - - - - - - - - - - - - - - - - - - - - - - - - - - - - - - - - - - 1
O
VERVIEW - - - - - - - - - - - - - - - - - - - - - - - - - - - - - - - - - - - - - - - - - - - - - - - - - - - - - - - 1
O
PTIONAL AUXILIARY PCI CONNECTOR - - - - - - - - - - - - - - - - - - - - - - - - - - - - - - - - 2
TA700 ANALYZER CARD - - - - - - - - - - - - - - - - - - - - - - - - - - - - - - - - - - - - - - - - 3
STATUS LED FUNCTION DESCRIPTION (TA700) - - - - - - - - - - - - - - - - - - - - - - - - - - 3
RECEIVING AND INSPECTING YOUR
NALYZER- - - - - - - - - - - - - - - - - - - - - - - - - - - - - - - - - - - - - - - - - - - - - - 4
A
UNPACKING YOUR ANALYZER - - - - - - - - - - - - - - - - - - - - - - - - - - - - - - - - - - - - - - - - - 4
H
OST SYSTEM REQUIREMENTS - - - - - - - - - - - - - - - - - - - - - - - - - - - - - - - - - - - - - - - - - 4
INSTALLING YOUR ANALYZER- - - - - - - - - - - - - - - - - - - - - - - - - - - - - - - - 5
SOFTWARE INSTALLATION - - - - - - - - - - - - - - - - - - - - - - - - - - - - - - - - - - - - - - - - - - - - 5
M
ANUAL USB DRIVER INSTALLATION - - - - - - - - - - - - - - - - - - - - - - - - - - - - - - - - - 6
M
ANUALLY UPDATING THE TA700/800 USB DRIVER - - - - - - - - - - - - - - - - - - - - - - 7
C
ONNECTING TO A NETWORK - - - - - - - - - - - - - - - - - - - - - - - - - - - - - - - - - - - - - - - 8
C
ONNECTING VIA HUB, SWITCH OR SIMILAR DEVICE - - - - - - - - - - - - - - - - - - - - - - - 9
TA700/800 OVERVIEW - - - - - - - - - - - - - - - - - - - - - - - - - - - - - - - - - - - - 10
TA700/800 WORKING MODE CONFIGURATIONS - - - - - - - - - - - - - - - - - - - - - - - - - - - - - -10
S
TATE ANALYZER ONLY (PCI - PCI-X) - - - - - - - - - - - - - - - - - - - - - - - - - - - - - - - -10
S
TATE & TIMING ANALYZER (PCI) - - - - - - - - - - - - - - - - - - - - - - - - - - - - - - - - - - -11
S
TATE ANALYZER & EXERCISER (PCI - PCI-X) - - - - - - - - - - - - - - - - - - - - - - - - - - -11
A
SYNCHRONOUS TIMING ANALYZER (PCI) - - - - - - - - - - - - - - - - - - - - - - - - - - - - - -11
A
DDITIONAL FEATURES - - - - - - - - - - - - - - - - - - - - - - - - - - - - - - - - - - - - - - - - - - - - - -11
P
ERFORMANCE ANALYSIS - - - - - - - - - - - - - - - - - - - - - - - - - - - - - - - - - - - - - - - - -11
S
TATISTICAL ANALYSIS - - - - - - - - - - - - - - - - - - - - - - - - - - - - - - - - - - - - - - - - - - -12
S
PECIAL CAPABILITIES - - - - - - - - - - - - - - - - - - - - - - - - - - - - - - - - - - - - - - - - - - - -12
LAUNCHING YOUR TA700/800- - - - - - - - - - - - - - - - - - - - - - - - - - - - - - - 13
OPERATING IN SIMULATION MODE- - - - - - - - - - - - - - - - - - - - - - - - - - - - - - - - - 15
LPT PORT SETTING - - - - - - - - - - - - - - - - - - - - - - - - - - - - - - - - - - - - - - - - - - - - - - - - -15
CONFIGURATION MENU - - - - - - - - - - - - - - - - - - - - - - - - - - - - - - - - - - - 16
v

Catalyst Enterprises
ENABLING VOLTAGE CHECK - - - - - - - - - - - - - - - - - - - - - - - - - - - - - - - - - - - - 17
HOST BUS - - - - - - - - - - - - - - - - - - - - - - - - - - - - - - - - - - - - - - - - - - - - - - - - - - - - - - - 18
A
NALYZER WINDOW COLORS - - - - - - - - - - - - - - - - - - - - - - - - - - - - - - - - - - - - - - - - - -20
GLOBAL SOFTWARE SETTINGS - - - - - - - - - - - - - - - - - - - - - - - - - - - - - - - - - - - 21
AUTHORIZATION - - - - - - - - - - - - - - - - - - - - - - - - - - - - - - - - - - - - - - - - - - - - - - - - - - - 22
SYSTEM FEATURE STATUS - - - - - - - - - - - - - - - - - - - - - - - - - - - - - - - - - - - - - - 23
C
ONFIGURATION SPACE INFORMATION- - - - - - - - - - - - - - - - - - - - - - - - - - - - - - 24
ROTOCOL ERRORS- - - - - - - - - - - - - - - - - - - - - - - - - - - - - - - - - - - - - - - - - - - 25
P
EXTERNAL SIGNAL NAMES - - - - - - - - - - - - - - - - - - - - - - - - - - - - - - - - - - - - - - - - - - - -25
E
XTERNAL TRIGGER SETTINGS - - - - - - - - - - - - - - - - - - - - - - - - - - - - - - - - - - - - - - - - - 25
EASY MODE - - - - - - - - - - - - - - - - - - - - - - - - - - - - - - - - - - - - - - - - - - - - 26
INSTANT DATA CAPTURE & TRIGGER - - - - - - - - - - - - - - - - - - - - - - - - - - - - - - - - - - - -26
SELECTIVE DATA CAPTURE (COMPLETE BUS) - - - - - - - - - - - - - - - - - - - - - - - 30
S
ELECTIVE DATA CAPTURE (CURRENT SLOT ONLY) - - - - - - - - - - - - - - - - - - 31
DATA CAPTURE & TRIGGER EXAMPLES - - - - - - - - - - - - - - - - - - - - - - - - - - - 32
D
ATA CAPTURE OPTIONS - - - - - - - - - - - - - - - - - - - - - - - - - - - - - - - - - - - - - 33
P
ERFORMANCE ANALYSIS - - - - - - - - - - - - - - - - - - - - - - - - - - - - - - - - - - - - - - 34
TRACE STATISTICS - - - - - - - - - - - - - - - - - - - - - - - - - - - - - - - - - - - - - - - - - - - 36
OBTAINING TRACE STATISTICS - - - - - - - - - - - - - - - - - - - - - - - - - - - - - - - - - - - - - -36
TRACE ANALYSIS OPTIONS - - - - - - - - - - - - - - - - - - - - - - - - - - - - - - - - - - - 39
E
XERCISE AND CAPTURE - - - - - - - - - - - - - - - - - - - - - - - - - - - - - - - - - - - - - - - 40
DEFINING AN EXERCISER PROGRAM - - - - - - - - - - - - - - - - - - - - - - - - - - - - - 41
SETTING EXERCISER OPTIONS - - - - - - - - - - - - - - - - - - - - - - - - - - - - - - - - - - - - - -42
CREATING A DATA BLOCK FILE - - - - - - - - - - - - - - - - - - - - - - - - - - - - - - - - 44
A
RCHIVING A PROJECT - - - - - - - - - - - - - - - - - - - - - - - - - - - - - - - - - - - - - - - - 47
RESTORING A PROJECT - - - - - - - - - - - - - - - - - - - - - - - - - - - - - - - - - - - - - - 48
E-MAIL ARCHIVED PROJECT - - - - - - - - - - - - - - - - - - - - - - - - - - - - - - - - - - - - - - - - 48
EXERCISER UTILITIES - - - - - - - - - - - - - - - - - - - - - - - - - - - - - - - - - - - - - - - - - 50
DUMP MEMORY - - - - - - - - - - - - - - - - - - - - - - - - - - - - - - - - - - - - - - - - - - - - - - - - 50
READ/MODIFY WRITE - - - - - - - - - - - - - - - - - - - - - - - - - - - - - - - - - - - - - - - 51
W
RITE/READ VERIFY - - - - - - - - - - - - - - - - - - - - - - - - - - - - - - - - - - - - - - - 52
ADDRESS TEST - - - - - - - - - - - - - - - - - - - - - - - - - - - - - - - - - - - - - - - - - - - - - - - - - 53
vi

Catalyst Enterprises, Inc.
SCAN CONFIGURATION REGISTERS - - - - - - - - - - - - - - - - - - - - - - - - - - - - - - 55
G
ENERATE TRAFFIC AND MEASURE PERFORMANCE - - - - - - - - - - - - - - - - - - - - - 57
ENERATE TRAFFIC AND MEASURE STATISTICS - - - - - - - - - - - - - - - - - - - - - - - - 58
G
T
IMING ANALYSIS - SYNCHRONOUS - - - - - - - - - - - - - - - - - - - - - - - - - - - - - - - - 59
TIMING VIOLATION CAPTURE - - - - - - - - - - - - - - - - - - - - - - - - - - - - - - - - - - - - - - -60
SEARCH FOR SETUP & HOLD LIMITS - - - - - - - - - - - - - - - - - - - - - - - - - - - - 61
T
IMING ANALYSIS - ASYNCHRONOUS - - - - - - - - - - - - - - - - - - - - - - - - - - - - - - - 62
ADVANCED MODE - - - - - - - - - - - - - - - - - - - - - - - - - - - - - - - - - - - - - - - 65
C
USTOM CAPTURE DATA PROJECT - - - - - - - - - - - - - - - - - - - - - - - - - - - 66
DEFINING EVENT PATTERNS - - - - - - - - - - - - - - - - - - - - - - - - - - - - - - - - - - - - - 67
CREATING AN EVENT PATTERN - - - - - - - - - - - - - - - - - - - - - - - - - - - - - - - - 68
PCI-X A
P
ROGRAMMING THE SEQUENCER - - - - - - - - - - - - - - - - - - - - - - - - - - - - - - - - - - 75
TTRIBUTES - - - - - - - - - - - - - - - - - - - - - - - - - - - - - - - - - - - - - - - - 73
PROGRAMMING THE SEQUENCER AS TEXT - - - - - - - - - - - - - - - - - - - - - - - - - 77
P
ROGRAMMING THE SEQUENCER WITH MENU FORM - - - - - - - - - - - - - - - - - 79
D
EFINING A BOOLEAN EXPRESSION - - - - - - - - - - - - - - - - - - - - - - - - - - - - - 80
SET TRIGGER - - - - - - - - - - - - - - - - - - - - - - - - - - - - - - - - - - - - - - - - - - - - - - - 81
E
XERCISE AND CAPTURE DATA PROJECT- - - - - - - - - - - - - - - - - - - - - - - - - - - - - 82
P
ROGRAMMING THE EXERCISER- - - - - - - - - - - - - - - - - - - - - - - - - - - - - - - - - - - 83
SET INTERRUPTS - - - - - - - - - - - - - - - - - - - - - - - - - - - - - - - - - - - - - - - - - - - - - - - -89
SETTING EXERCISER OPTIONS - - - - - - - - - - - - - - - - - - - - - - - - - - - - - - - - - 90
EASY MODE TRIGGER AND CAPTURE - - - - - - - - - - - - - - - - - - - - - - - - - - - - - - - 92
T
IMING ANALYSIS - SYNCHRONOUS - - - - - - - - - - - - - - - - - - - - - - - - - - - - - - - - 95
SEARCH FOR SETUP & HOLD LIMITS - - - - - - - - - - - - - - - - - - - - - - - - - - - - - - - - - -97
TIMING ANALYSIS - ASYNCHRONOUS - - - - - - - - - - - - - - - - - - - - - - - - - - - - - - - 98
TA700/TA800 AS TARGET - - - - - - - - - - - - - - - - - - - - - - - - - - - - - - - - - 99
TA700/TA800 ENUMERATION - - - - - - - - - - - - - - - - - - - - - - - - - - - - - - - - - - - - - - - - - -99
S
ETTING TARGET OPERATION - - - - - - - - - - - - - - - - - - - - - - - - - - - - - - - - - - - - - - - - - -99
D
EFINING TARGET RESPONSES IN EXERCISER PROGRAM - - - - - - - - - - - - - - - - - - - - -99
E
NABLE LOCAL MEMORY - - - - - - - - - - - - - - - - - - - - - - - - - - - - - - - - - - - - - - - -100
D
UMP MEMORY - - - - - - - - - - - - - - - - - - - - - - - - - - - - - - - - - - - - - - - - - - - - - - -102
PERFORMANCE ANALYSIS - - - - - - - - - - - - - - - - - - - - - - - - - - - - - - - - - 103
vii

Catalyst Enterprises
REAL-TIME ANALYSIS - - - - - - - - - - - - - - - - - - - - - - - - - - - - - - - - - - - - - - - - - - - - - - 103
PERFORMING A PRE-DEFINED ANALYSIS - - - - - - - - - - - - - - - - - - - - - - - - - - 104
C
REATING A NEW ANALYSIS PROJECT - - - - - - - - - - - - - - - - - - - - - - - - - - - 105
SETTING ANALYSIS OPTIONS: - - - - - - - - - - - - - - - - - - - - - - - - - - - - - - - - - - - 105
D
EFINING EVENT PATTERNS - - - - - - - - - - - - - - - - - - - - - - - - - - - - - - - - - - - - - - - 106
W
RITING AND EDITING ANALYSIS EQUATIONS - - - - - - - - - - - - - - - - - - - - - - - 106
ROGRAMMING THE EXERCISER - - - - - - - - - - - - - - - - - - - - - - - - - - - - - - - - - - - - 107
P
SAVED PERFORMANCE ANALYSIS REVIEW - - - - - - - - - - - - - - - - - - - - - 109
TRACE STATISTICS - - - - - - - - - - - - - - - - - - - - - - - - - - - - - - - - - - - - - - - - - - - - - - - - 110
CREATING A NEW TRACE PROJECT - - - - - - - - - - - - - - - - - - - - - - - - - - - - - 111
SETTING TRACE OPTIONS- - - - - - - - - - - - - - - - - - - - - - - - - - - - - - - - - - - - - - 111
DEFINING EVENT PATTERNS - - - - - - - - - - - - - - - - - - - - - - - - - - - - - - - - - - 112
PROGRAMMING THE EXERCISER - - - - - - - - - - - - - - - - - - - - - - - - - - - - - - - - - - - - 112
D
EFINING EQUATIONS - - - - - - - - - - - - - - - - - - - - - - - - - - - - - - - - - - - - - - - - - - - 112
R
UNNING THE TRACE PROJECT - - - - - - - - - - - - - - - - - - - - - - - - - - - - - - - - - - - - - 112
EXAMPLE FILES - - - - - - - - - - - - - - - - - - - - - - - - - - - - - - - - - - - - - - - - 113
PROGRAM DEVICE - - - - - - - - - - - - - - - - - - - - - - - - - - - - - - - - - - - - - - - - - - - 115
COMPLIANCE DEVICE TEST - - - - - - - - - - - - - - - - - - - - - - - - - - - - - - - - 116
EXECUTING A COMPLIANCE DEVICE TEST - - - - - - - - - - - - - - - - - - - - - - - - - - - 117
S
ETTING THE COMPLIANCE TEST OPTIONS - - - - - - - - - - - - - - - - - - - - - - - - 118
RUNNING COMPLIANCE AT AN OFFSET - - - - - - - - - - - - - - - - - - - - - - - - - - - - - - - - 119
EXECUTING A SAVED CONFIGURATION - - - - - - - - - - - - - - - - - - - - - - - - - - - - - 120
EXAMPLE TEST - - - - - - - - - - - - - - - - - - - - - - - - - - - - - - - - - - - - - - - - - - - - - - - - - - - 120
E-MAIL DEVICE COMPLIANCE RESULTS - - - - - - - - - - - - - - - - - - - - - - - - - - - - - 124
DISPLAY MANIPULATION- - - - - - - - - - - - - - - - - - - - - - - - - - - - - - - - - - 129
MULTIPLE RESULTS WINDOWS - - - - - - - - - - - - - - - - - - - - - - - - - - - - - - - - - - - - - - - - 131
ADDING AND REMOVING SIGNALS FOR DISPLAY - - - - - - - - - - - - - - - - - - - - - - - 132
LATENCY REPORT - - - - - - - - - - - - - - - - - - - - - - - - - - - - - - - - - - - - - - - - - - - - - - - - - 138
U
SING THE CURSORS - - - - - - - - - - - - - - - - - - - - - - - - - - - - - - - - - - - - - - - - - - - - - - - 138
J
UMP WITHIN DATA DISPLAY - - - - - - - - - - - - - - - - - - - - - - - - - - - - - - - - - - - - - - - - - 139
U
SING ZOOM IN THE WAVE WINDOW - - - - - - - - - - - - - - - - - - - - - - - - - - - - - - - - - - - 139
ZOOM OPTIONS - - - - - - - - - - - - - - - - - - - - - - - - - - - - - - - - - - - - - - - - - - 140
USER DEFINED DISPLAY CONFIGURATION - - - - - - - - - - - - - - - - - - - - - - - - - - - - - - - - - 140
viii

Catalyst Enterprises, Inc.
SEARCH - - - - - - - - - - - - - - - - - - - - - - - - - - - - - - - - - - - - - - - - - - - - - - - - - - - - - - - -141
CONVERTING CAPTURED DATA - - - - - - - - - - - - - - - - - - - - - - - - - - - - - 145
CONVERT TO TEXT - - - - - - - - - - - - - - - - - - - - - - - - - - - - - - - - - - - - - - - - - - - - - - - -145
CONVERT TO EXCEL™ - - - - - - - - - - - - - - - - - - - - - - - - - - - - - - - - - - - - - - - - 147
CAPTURE A SCREEN - - - - - - - - - - - - - - - - - - - - - - - - - - - - - - - - - - - - - - - - - - - - - - - -148
TOOLS TO ANALYZE CAPTURED DATA - - - - - - - - - - - - - - - - - - - - - - - - 150
COMPARE - - - - - - - - - - - - - - - - - - - - - - - - - - - - - - - - - - - - - - - - - - - - - - - - - - - - - - - 150
FILTERING CAPTURED DATA - - - - - - - - - - - - - - - - - - - - - - - - - - - - - - - - - - - - 152
SPECIAL SETUPS- - - - - - - - - - - - - - - - - - - - - - - - - - - - - - - - - - - - - - - - 155
PROTOCOL ERRORS - - - - - - - - - - - - - - - - - - - - - - - - - - - - - - - - - - - - - - - - - - - - - - - -155
PCI-X PROTOCOL ERRORS - - - - - - - - - - - - - - - - - - - - - - - - - - - - - - - - - - - - - 159
N
UMBER OF ERRORS - - - - - - - - - - - - - - - - - - - - - - - - - - - - - - - - - - - - - - -162
PROTOCOL ERROR TYPE - - - - - - - - - - - - - - - - - - - - - - - - - - - - - - - - - - - - - - - - -162
MNEMONICS - - - - - - - - - - - - - - - - - - - - - - - - - - - - - - - - - - - - - - - - - - - - - - - 164
DISPLAYING PATTERNS MATCHING MNEMONICS - - - - - - - - - - - - - - - - - - - - - - - - -165
EXTERNAL SIGNALS - - - - - - - - - - - - - - - - - - - - - - - - - - - - - - - - - - - - - - - -166
EXTERNAL INPUT SIGNALS - - - - - - - - - - - - - - - - - - - - - - - - - - - - - - - - - - - - - 166
XTERNAL OUTPUT TRIGGER- - - - - - - - - - - - - - - - - - - - - - - - - - - - - - - - - - - 170
E
MACROS - - - - - - - - - - - - - - - - - - - - - - - - - - - - - - - - - - - - - - - - - - - - - - - - - 171
ASSIGNING A MACRO TO A FUNCTION KEY: - - - - - - - - - - - - - - - - - - - - - - - - - - - -173
SYSTEM ADMINISTRATION - - - - - - - - - - - - - - - - - - - - - - - - - - - - - - - - 175
MULTIPLE USERS - - - - - - - - - - - - - - - - - - - - - - - - - - - - - - - - - - - - - - - - - - - - - - - - -175
TROUBLESHOOTING - - - - - - - - - - - - - - - - - - - - - - - - - - - - - - - - - - - - - 176
KNOWN ISSUES - - - - - - - - - - - - - - - - - - - - - - - - - - - - - - - - - - - - - - - - - - - - - - - - - - -178
TA700/800 SPECIFICATIONS - - - - - - - - - - - - - - - - - - - - - - - - - - - - 179
ANALYZER - - - - - - - - - - - - - - - - - - - - - - - - - - - - - - - - - - - - - - - - - - - - - - - - - - - -179
TIMING MEASUREMENT - - - - - - - - - - - - - - - - - - - - - - - - - - - - - - - - - - - - - - - - - -180
S
YNCHRONOUS - - - - - - - - - - - - - - - - - - - - - - - - - - - - - - - - - - - - - - - - - - - - - - - - 180
A
SYNCHRONOUS - - - - - - - - - - - - - - - - - - - - - - - - - - - - - - - - - - - - - - - - - - - - - - -180
TIME TAG - - - - - - - - - - - - - - - - - - - - - - - - - - - - - - - - - - - - - - - - - - - - - - - - - - - - -180
PERFORMANCE ANALYSIS - - - - - - - - - - - - - - - - - - - - - - - - - - - - - - - - - - 181
REAL-TIME, CONTINUOUS - - - - - - - - - - - - - - - - - - - - - - - - - - - - - - - - - - - - - - - -181
S
TATISTICAL (MEMORY CAPTURE) - - - - - - - - - - - - - - - - - - - - - - - - - - - - - - - - - -181
ix

Catalyst Enterprises
UTILITIES - - - - - - - - - - - - - - - - - - - - - - - - - - - - - - - - - - - - - - - - - - - - - - - - 183
MNEMONICS - - - - - - - - - - - - - - - - - - - - - - - - - - - - - - - - - - - - - - - - - - - - - - - - - - - 183
EXERCISER - - - - - - - - - - - - - - - - - - - - - - - - - - - - - - - - - - - - - - - - - - - - - - - - - - - - 183
D
ATA BLOCK GENERATION - - - - - - - - - - - - - - - - - - - - - - - - - - - - - - - - - - - - - - - - - - - 183
M
ASTER MODE - - - - - - - - - - - - - - - - - - - - - - - - - - - - - - - - - - - - - - - - - - - - - - - - - - - 184
T
ARGET MODE - - - - - - - - - - - - - - - - - - - - - - - - - - - - - - - - - - - - - - - - - - - - - - - - - - - 184
L
OCAL MEMORY - - - - - - - - - - - - - - - - - - - - - - - - - - - - - - - - - - - - - - - - - - - - - - - - - - 184
VOLTAGE CHECK - - - - - - - - - - - - - - - - - - - - - - - - - - - - - - - - - - - - - - - - - - - - 185
VOLTAGE REQUIREMENT - - - - - - - - - - - - - - - - - - - - - - - - - - - - - - - - - - - - - - - - - - - - 185
APPENDIX A- - - - - - - - - - - - - - - - - - - - - - - - - - - - - - - - - - - - - - - - - - - 187
TA700 COMAPI LIBRARY - - - - - - - - - - - - - - - - - - - - - - - - - - - - - - - - - - - - - - - - - - - 187
N
EW METHODS - - - - - - - - - - - - - - - - - - - - - - - - - - - - - - - - - - - - - - - - - - - - - - - 188
IR
UNPROJECTSERVER INTERFACE - - - - - - - - - - - - - - - - - - - - - - - - - - - - - - - 188
HANGEPROJECTSERVER INTERFACE - - - - - - - - - - - - - - - - - - - - - - - - - - - - - 188
IC
IR
UNPROJECTSERVER INTERFACE - - - - - - - - - - - - - - - - - - - - - - - - - - - - - - - - 188
TILITYSERVER INTERFACE - - - - - - - - - - - - - - - - - - - - - - - - - - - - - - - - - - - 188
IU
REMOVED/MOVED METHODS - - - - - - - - - - - - - - - - - - - - - - - - - - - - - - - - - 189
IUTILITYSERVER INTERFACE - - - - - - - - - - - - - - - - - - - - - - - - - - - - - - - - - - - 189
UNPROJECTSERVER INTERFACE - - - - - - - - - - - - - - - - - - - - - - - - - - - - - - - - 189
IR
TA-700 M
S
UPPORT OF MULTITHREADING - - - - - - - - - - - - - - - - - - - - - - - - - - - - - - - - - - - - 189
ODES SUPPORTED - - - - - - - - - - - - - - - - - - - - - - - - - - - - - - - - - - - - - - - 189
LIBRARY EXPORTED INTERFACES - - - - - - - - - - - - - - - - - - - - - - - - - - - 191
IRUNPROJECTSERVER - - - - - - - - - - - - - - - - - - - - - - - - - - - - - - - - - - - - - - - - - - - - - - 191
S
ETTRIGGEROPTION (NOUTTRIGPOLARITY) - - - - - - - - - - - - - - - - - - - - - - - - - - - - 191
R
UNTA700PROJECT (BSTR PROJECTNAME) - - - - - - - - - - - - - - - - - - - - - - - - - - - 191
S
ETFPGAFILESPATH (BSTROUTPUTFILENAME) - - - - - - - - - - - - - - - - - - - - - - - - - 191
S
ETPROTOCOLERRORMASK (NPROTOCOLERRORMASK) - - - - - - - - - - - - - - - - - - - 192
S
ETVOLTAGEMASKS (NVOLTAGEMASKS) - - - - - - - - - - - - - - - - - - - - - - - - - - - - - 192
S
ETINTERFACEMODE (NINTERFACEMODE) - - - - - - - - - - - - - - - - - - - - - - - - - - - - 192
S
ETPORTNUMBER (NPORTNUMBER) - - - - - - - - - - - - - - - - - - - - - - - - - - - - - - - - - 192
E
NABLECOMPILEROFEXERCISER (BENABLEDCOMPILER) - - - - - - - - - - - - - - - - - - - 193
S
ETFORCESTOPTIMERVALUE (NTIMERVALUE) - - - - - - - - - - - - - - - - - - - - - - - - - 193
G
ETTERMINATIONTYPE (NTERMINATIONTYPE) - - - - - - - - - - - - - - - - - - - - - - - - - 193
S
ETDEVICEID(NDEVICETYPE,LBOARDSERIALID) - - - - - - - - - - - - - - - - - - - - - - - - 194
F
ORMATRESULTMESSAGE(NMESSAGEID, PBSTRMESSAGE) - - - - - - - - - - - - - - - - - 194
x

Catalyst Enterprises, Inc.
SAVEASTEXT(BSTRSAMPLEFILENAME) - - - - - - - - - - - - - - - - - - - - - - - - - - - - - - -194
D
UMPLOCALMEMORY(BSTRPROJECTNAME) - - - - - - - - - - - - - - - - - - - - - - - - - - -194
IC
HANGEPROJECTSERVER - - - - - - - - - - - - - - - - - - - - - - - - - - - - - - - - - - - - - - - - - - -195
O
PEN (LPSZPROJECTNAME) - - - - - - - - - - - - - - - - - - - - - - - - - - - - - - - - - - - - - - -195
C
LOSE () - - - - - - - - - - - - - - - - - - - - - - - - - - - - - - - - - - - - - - - - - - - - - - - - - - - -195
S
ETSAMPLENO (NSAMPLENO) - - - - - - - - - - - - - - - - - - - - - - - - - - - - - - - - - - - - -196
G
ETSAMPLENO (PNSAMPLENO) - - - - - - - - - - - - - - - - - - - - - - - - - - - - - - - - - - - -196
S
ETWORKINGMODE (NWORKINGMODE) - - - - - - - - - - - - - - - - - - - - - - - - - - - - - -196
G
ETWORKINGMODE (PNWORKINGMODE) - - - - - - - - - - - - - - - - - - - - - - - - - - - - - 197
S
ETOUTPUTFILENAME (BSTROUTPUTFILENAME) - - - - - - - - - - - - - - - - - - - - - - - - 197
G
ETOUTPUTFILENAME (PBSTROUTPUTFILENAME) - - - - - - - - - - - - - - - - - - - - - - -197
S
ETTARGETDISCONNECTOPTION (BTARGETDISCONNECT) - - - - - - - - - - - - - - - - - -197
G
ETTARGETDISCONNECTOPTION (PBTARGETDISCONNECT) - - - - - - - - - - - - - - - - -198
S
ETCOMPLETETRANSACTIONOPTION (BCOMPLETETRANSACTION ) - - - - - - - - - - - -198
G
ETCOMPLETETRANSACTIONOPTION (PBCOMPLETETRANSACTION ) - - - - - - - - - - - 198
S
ETASSERTFRAMEOPTION(PBASSERTFRAME) - - - - - - - - - - - - - - - - - - - - - - - - - -198
G
ETASSERTFRAMEOPTION(PBASSERTFRAME) - - - - - - - - - - - - - - - - - - - - - - - - - -198
S
ETMASTERABORTOPTION (BMASTERABORT) - - - - - - - - - - - - - - - - - - - - - - - - - -198
G
ETMASTERABORTOPTION (PBMASTERABORT) - - - - - - - - - - - - - - - - - - - - - - - - -199
S
ETEVENTFIELD(NEVENTNO, NFIELDINDEX, LPSZNEWVALUE) - - - - - - - - - - - - - - - 199
G
ETEVENTFIELD (NEVENTNO, NFIELDINDEX, STRVALUE) - - - - - - - - - - - - - - - - - -199
S
ETPRETRIGGER (NPRETRIGGER) - - - - - - - - - - - - - - - - - - - - - - - - - - - - - - - - - - -199
G
ETPRETRIGGER (NPRETRIGGER) - - - - - - - - - - - - - - - - - - - - - - - - - - - - - - - - - - -199
S
ETSEQFILEDINT (NSTATENO, NFIELDINDEX, NNEWVALUE) - - - - - - - - - - - - - - - -199
G
ETSEQFILEDINT(NSTATENO, NFIELDINDEX, NVALUE) - - - - - - - - - - - - - - - - - - - -200
S
ETSEQFILEDSTR (NSTATENO, NFIELDINDEX, STREXPRESSION) - - - - - - - - - - - - - -200
G
ETSEQFILEDSTR (NSTATENO, NFIELDINDEX, STREXPRESSION) - - - - - - - - - - - - - - 200
S
ETELSESTATEMENTINT (NSTATENO, NELSENO, NFIELDINDEX, NNEWVALUE) - - - -200
G
ETELSESTATEMENTINT (NSTATENO, NELSENO, NFIELDINDEX, NVALUE) - - - - - - -200
S
ETELSESTATEMENTSTR(NSTATENO,NELSENO,NFIELDINDEX,STREXPRESSION) - - -201
G
ETELSESTATEMENTSTR(NSTATENO, NELSENO, NFIELDINDEX, STREXPRESSION) - -201
S
ETTIMINGENABLEVALUE(NTIMINGENABLEVALUE) - - - - - - - - - - - - - - - - - - - - - - 201
G
ETTIMINGENABLEVALUE(PNTIMINGENABLEVALUE) - - - - - - - - - - - - - - - - - - - - -201
S
ETTIMINGTCLOCKVALUE(NTIMINGTCLKVALUE) - - - - - - - - - - - - - - - - - - - - - - -201
G
ETTIMINGTCLOCKVALUE(PNTIMINGTCLKVALUE) - - - - - - - - - - - - - - - - - - - - - - 201
xi

Catalyst Enterprises
SETTIMINGMASKS(PTRTIMINGMASKS) - - - - - - - - - - - - - - - - - - - - - - - - - - - - - - - 202
G
ETTIMINGMASKS(PTRTIMINGMASKS) - - - - - - - - - - - - - - - - - - - - - - - - - - - - - - - 202
S
ETTIMINGMASKALL(BMASKVALUE) - - - - - - - - - - - - - - - - - - - - - - - - - - - - - - - 202
S
ETTIMINGMASKSADDRESS(BADD32, BMASKVALUE) - - - - - - - - - - - - - - - - - - - - 202
G
ETTIMINGMASKSADDRESS(PTRADDRESSMASK) - - - - - - - - - - - - - - - - - - - - - - - - 203
S
ETTIMINGMASKSCONTROL(BMASKVALUE) - - - - - - - - - - - - - - - - - - - - - - - - - - - 203
G
ETTIMINGMASKSCONTROL(PTRCONTROLMASK) - - - - - - - - - - - - - - - - - - - - - - - 203
IU
TILITYSERVER - - - - - - - - - - - - - - - - - - - - - - - - - - - - - - - - - - - - - - - - - - - - - - - - - - 203
A
UTODETECTSYSTEMFREQUENCY (NSYSTEMFREQUENCY) - - - - - - - - - - - - - - - - - 203
S
ETINTERFACEMODE (NINTERFACEMODE) - - - - - - - - - - - - - - - - - - - - - - - - - - - - 203
S
ETPORTNUMBER (NPORTNUMBER) - - - - - - - - - - - - - - - - - - - - - - - - - - - - - - - - - 204
S
ETFPGAFILESPATH (BSTROUTPUTFILENAME) - - - - - - - - - - - - - - - - - - - - - - - - - 204
EXAMPLES - - - - - - - - - - - - - - - - - - - - - - - - - - - - - - - - - - - - - - - - - - - - 205
IRUNPROJECTSERVERS INTERFACE EXAMPLES - - - - - - - - - - - - - - - - - - - - - - - - - - - - - 205
IC
HANGEPROJECTSERVER INTERFACE EXAMPLES - - - - - - - - - - - - - - - - - - - - - - - - - - - 206
E
VENT FIELD - - - - - - - - - - - - - - - - - - - - - - - - - - - - - - - - - - - - - - - - - - - - - - - - - - - - 207
SEQUENCER FIELDS- - - - - - - - - - - - - - - - - - - - - - - - - - - - - - - - - - - - - - - - - - - 210
ELSE FIELDS - - - - - - - - - - - - - - - - - - - - - - - - - - - - - - - - - - - - - - - - - - - - - - - - - - - - 211
IU
TILITYSERVER INTERFACE EXAMPLES - - - - - - - - - - - - - - - - - - - - - - - - - - - - - - - - - - 212
D
ATA FILE STRUCTURE - - - - - - - - - - - - - - - - - - - - - - - - - - - - - - - - - - - - - - - - - - - - - 213
APPENDIX B - - - - - - - - - - - - - - - - - - - - - - - - - - - - - - - - - - - - - - - - - 225
TA700 PCI CARD - - - - - - - - - - - - - - - - - - - - - - - - - - - - - - - - - - - - - - - - - - - - - - - - - 225
S
TATUS LED FUNCTION DESCRIPTION - - - - - - - - - - - - - - - - - - - - - - - - - - - - - - - - - - - 225
J
UMPER CONFIGURATION - - - - - - - - - - - - - - - - - - - - - - - - - - - - - - - - - - - - - - - - - - - 226
A
LTERNATE JUMPER CONFIGURATION - - - - - - - - - - - - - - - - - - - - - - - - - - - - - - - - - - - 229
TA700 POWER DRAW - - - - - - - - - - - - - - - - - - - - - - - - - - - - - - - - - - - - - - - - - 230
TA700 EXTENDED MEMORY CARD - - - - - - - - - - - - - - - - - - - - - - - - - - - - - - - - - - - - - 232
APPENDIX C - - - - - - - - - - - - - - - - - - - - - - - - - - - - - - - - - - - - - - - - - 233
TA700C COMPACTPCI CARD - - - - - - - - - - - - - - - - - - - - - - - - - - - - - - - - - - - - - - - - - 233
STATUS LED FUNCTION DESCRIPTION - - - - - - - - - - - - - - - - - - - - - - - - - - - - - - 234
JUMPER CONFIGURATION - - - - - - - - - - - - - - - - - - - - - - - - - - - - - - - - - - - - - - - - - - - - 234
TA700C E
XTENDED MEMORY - - - - - - - - - - - - - - - - - - - - - - - - - - - - - - - - - - - - - - - - 237
APPENDIX D - - - - - - - - - - - - - - - - - - - - - - - - - - - - - - - - - - - - - - - - - 239
xii

Catalyst Enterprises, Inc.
TA700PDC PMC MODULE ANALYZER EXERCISER - - - - - - - - - - - - - - - - - - - - - - - - - - 239
S
TATUS LED FUNCTION DESCRIPTION - - - - - - - - - - - - - - - - - - - - - - - - - - - - - - - - - - -240
J
UMPER CONFIGURATION - - - - - - - - - - - - - - - - - - - - - - - - - - - - - - - - - - - - - - - - - - - -240
APPENDIX E- - - - - - - - - - - - - - - - - - - - - - - - - - - - - - - - - - - - - - - - - 243
TA800 PCI CARD - - - - - - - - - - - - - - - - - - - - - - - - - - - - - - - - - - - - - - - - - - - - - - - - -243
S
TATUS LED FUNCTION DESCRIPTION - - - - - - - - - - - - - - - - - - - - - - - - - - - - - - - - - - -243
J
UMPER CONFIGURATION - - - - - - - - - - - - - - - - - - - - - - - - - - - - - - - - - - - - - - - - - - - -244
APPENDIX F - - - - - - - - - - - - - - - - - - - - - - - - - - - - - - - - - - - - - - - - - 247
TA850 PCI CARD - - - - - - - - - - - - - - - - - - - - - - - - - - - - - - - - - - - - - - - - - - - - - - - - -247
S
TATUS LED FUNCTION DESCRIPTION - - - - - - - - - - - - - - - - - - - - - - - - - - - - - - - - - - -247
J
UMPER CONFIGURATION - - - - - - - - - - - - - - - - - - - - - - - - - - - - - - - - - - - - - - - - - - - -248
INDEX - - - - - - - - - - - - - - - - - - - - - - - - - - - - - - - - - - - - - - - - - - - - - - - 250
xiii

Catalyst Enterprises
xiv

Introduction Catalyst Enterprises, Inc.
Introduction
What’s In This Manual
This manual describes the installation and operation of your Catalyst PCI/PCI-X Bus
Analyzer / Exerciser. Examples of some typical applications are included.
The terms TA700 and PCI analyzer thereafter are used for referring to PCI/PCI-X,
CompactPCI and PDC analyzers(See Appendix, B, C and/or D) and in cases where
applicable TA800. The designation TA800 is a reference to TA800/TA850 unless
otherwise stated. (For the TA800 see “APPENDIX E” on page 243 and for the TA850
see “APPENDIX F” on page 247).
Timing and External Memory Availability
Product Timing Analyzer Extended Memory
TA850/TA800 No No
Overview
Your TA700/800 PCI Bus Analyzer is a powerful and versatile analysis tool that will
permit you to debug and characterize PCI designs operating on any PCI system
architecture. To perform analysis you simply install the analyzer card in a PCI slot in
the target machine and connect it either, to the host system Bi-directional parallel port
or to the USB port using the appropriate cable provided with your analyzer. A typical
setup may include a Host and a Target systems interconnected via the parallel/USB
port with the analyzer card installed in the Target Machine and a Windows based host
running the analysis software.
If your target machine operates under Windows it may also act as the host. In this
case, the analyzer card and the analysis software reside in the same machine and
require you to connect the analyzer card to the Host high-speed parallel port or USB
port or ethernet using the appropriate cable provided. See Figure 1 and Note 1.
TA70 0 Yes Yes
TA700C Yes Yes
TA700PDC No No
Caution: Operating the analyzer in this mode, however, may impact
Performance Analysis measurement accuracy since the analyzer
software runs in the same system space as the application software.
For a precise Performance Analysis it is recommended that you use a
separate Host system.
Note 1.: Use only the parallel port or the USB port or ethernet to connect to the TA700/800,
do not connect more than one port at the same time.
1
Catalyst Enterprises, Inc. Introduction
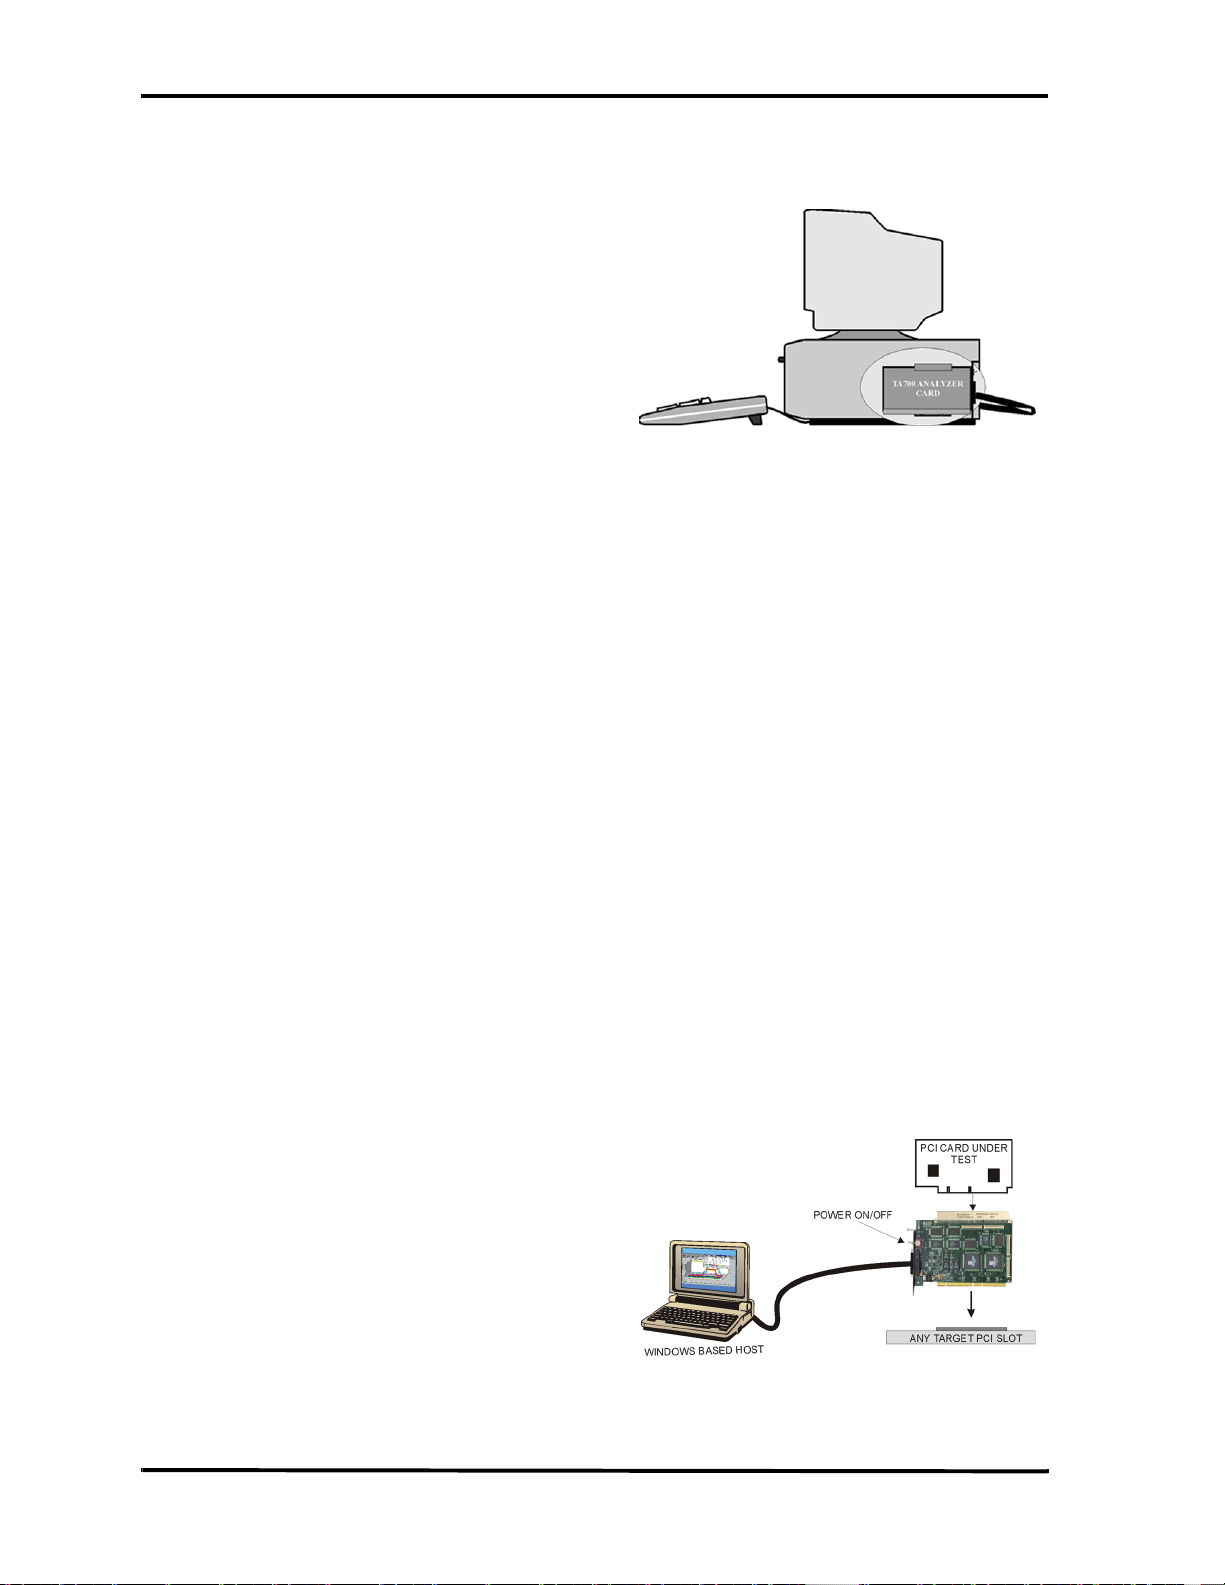
Figure 1 Target and Host Operating in the Same Machine
Optional Auxiliary PCI connector
The PCI Bus Analyzer Card incorporates a PCI connector on top which extends the
system PCI bus and allows other PCI cards to be plugged into the analyzer for
development or production testing. This feature allows the analyzer to monitor the
same point-to-point signals such as REQ# & GNT# on the card under test without
requiring any external connections. In this mode, both the analyzer and the card under
test require only one PCI slot. Special design methodology has been incorporated to
minimize any reflections, delay or cross-talk.
The top connector is intended for monitoring use as an analyzer only and could
interfere with the exerciser. The TA700 has an On-board arbiter that allows the TA700
to be a master regardless of the board type installed in the top connector. It is
recommended that there not be 2 masters in the same slot.
Note: This feature only exists on the TA700 and TA700PDC PCI analyzer and not on the
TA700C, TA800 or TA850 versions.
Figure 2 illustrates such a test setup. An On-Off switch on the analyzer card enables
and disables the power and signal connections between the system and the card under
test allowing rapid cycling of the test cards without shutting off the system power.
Caution: The TA700 will not work with the top connector when operated at 100 MHz bus
speed. It is not recommended to operate the TA700 with the extender at frequencies
above 66 MHz, the extender switch must be in the Off position.
Figure 2 Testing a PCI Bus Card
2
Introduction Catalyst Enterprises, Inc.
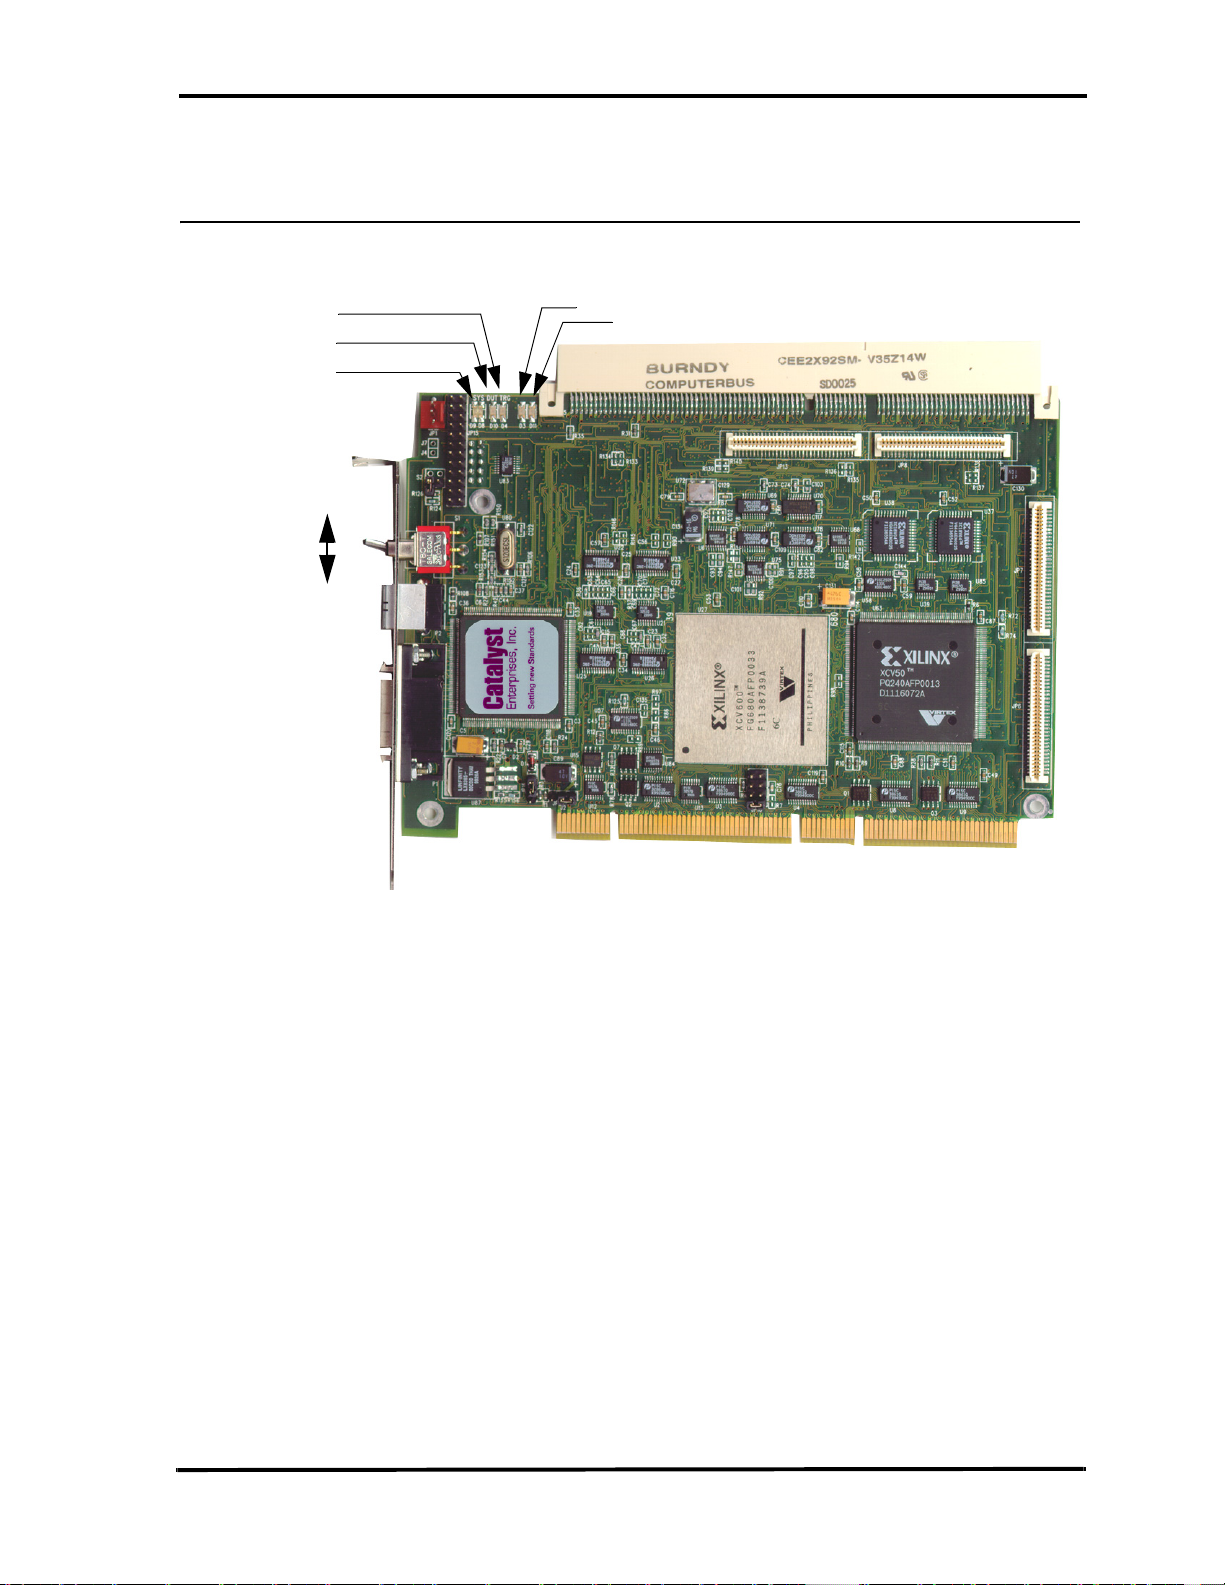
TA700 Analyzer Card
Figure 3 shows a TA700 PCI Analyzer card identifying Status LED locations, external
trigger input and output connections and the external signal input connector.
TRIG
DUT
SYS
ON
SWITCH
OFF
D3
D11
Figure 3 TA700 PCI Analyzer Card
Status LED Function Description (TA700)
For the TA700C analyzer/exerciser LED status information see APPENDIX C. For the TA700PDC
LED status information see APPENDIX D, for the TA800 LED status information see Appendix E and
for the TA850 LED status information see APPENDIX F.
SYS When green the system and DUT voltages are within 5% of their value. If any of
+5V, +3.3V, +12V drop more than 5% the SYS LED turns red. SYS LED also
comes up red as a test on power on and then if the voltages are okay it turns
green once the software is executed. To enable voltages for sensing see page 15.
DUT Indicates that the voltage to the DUT is on. In this case the user may not remove
or insert any card in to the top connector of the TA700
D3, D11 When illuminated, the TA700 has been configured.
TRIG Indicates that the analyzer has met the trigger condition and is awaiting for the
defined post-trigger data to be captured.
SWITCH Function In the ON position the TA700 is transparent and connects power and PCI bus
signals to the Test Connector. In the Off position the TA700 isolates the power
and signals to the PCI bus connector and designates the TA700 to act as a PCI
Agent if jumper S2 is not installed. For jumper location see APPENDIX B.
3

Catalyst Enterprises, Inc. Receiving and Inspecting Your Analyzer
Receiving and Inspecting Your Analyzer
Your analyzer includes the following components:
• Analyzer card identified in the packing list
• Software on CD-ROM
• 10’ DB-25 to SCSI II 26 pin cable
• User’s Manual
• Cable for external signals
•1 2M USB cable
• 3M Ethernet cable (TA850 only)
• 2 brackets for low profile or regular installation (TA850 only)
Unpacking Your Analyzer
Inspect the received shipping container for any visible damage. In the event of visible
damage, retain all shipping materials until all of the contents per the packing list have
been checked for completeness and absence of damage. Unpack the shipping
container and account for each item on the packing list. Visually inspect each item for
damage. In the event of damage notify the shipper and Catalyst Enterprises.
Host System Requirements
The following are requirements for the host system for proper operation of your
TA700/800:
• PC operating under Windows 2000 or XP
• Internet connection
• E-mail client such as Outlook or Outlook Express
• Bi Directional, ECP, EPP Parallel Port, USB 1.X or 2.0 interface or
10/100 ethernet connection.
• 100 MB free hard disk space on partition with TA700/800 software
• 10 MB free hard disk space on partition with Windows
• 800 x 600 or better resolution Monitor with 16 - bit or better video
card.
•CD drive
4

Installing Your Analyzer Catalyst Enterprises, Inc.
Installing Your Analyzer
Hardware Installation
1. Make sure that the Target Machine is powered down.
2. Remove the case from your machine in accordance with the instructions
supplied for it.
3. Install the Analyzer card in any available PCI slot and secure the mounting
bracket to the chassis with the mounting screw.
Warning: Make sure to take precautions to avoid static electricity discharge
damage to the Analyzer Card by using a grounding strap or touching
a grounded metal surface just prior to handling the analyzer card.
Avoid touching any components and handle card by the edges only.
4. Interconnect the Host system’s bi-directional parallel port, USB port or ethernet
using the cables provided.
Host and Target Same The Analyzer may be used in a configuration such that the Host and
Target are the same machine.
Bi-Directional Port The Analyzer requires that The Host parallel port support Bi-directional
data transfers. See LPT Port Setting for verifying that your parallel port
supports and/or is set to a Bi-directional mode. If the parallel port on your
Host system does not support Bi-directional data transfers you must then
install a parallel port card that supports bi-directional data transfers.
Port Configuration Make sure that the installed parallel port card address does not conflict
with an existing parallel port such as one for a printer.
Software Installation
On systems operating under Windows 2000 or XP:
1. Insert the CD-ROM.
2. The installation will automatically start the setup unless the auto Run is turned
off, in that case select the CD-ROM from “My Computer” and click on setup.
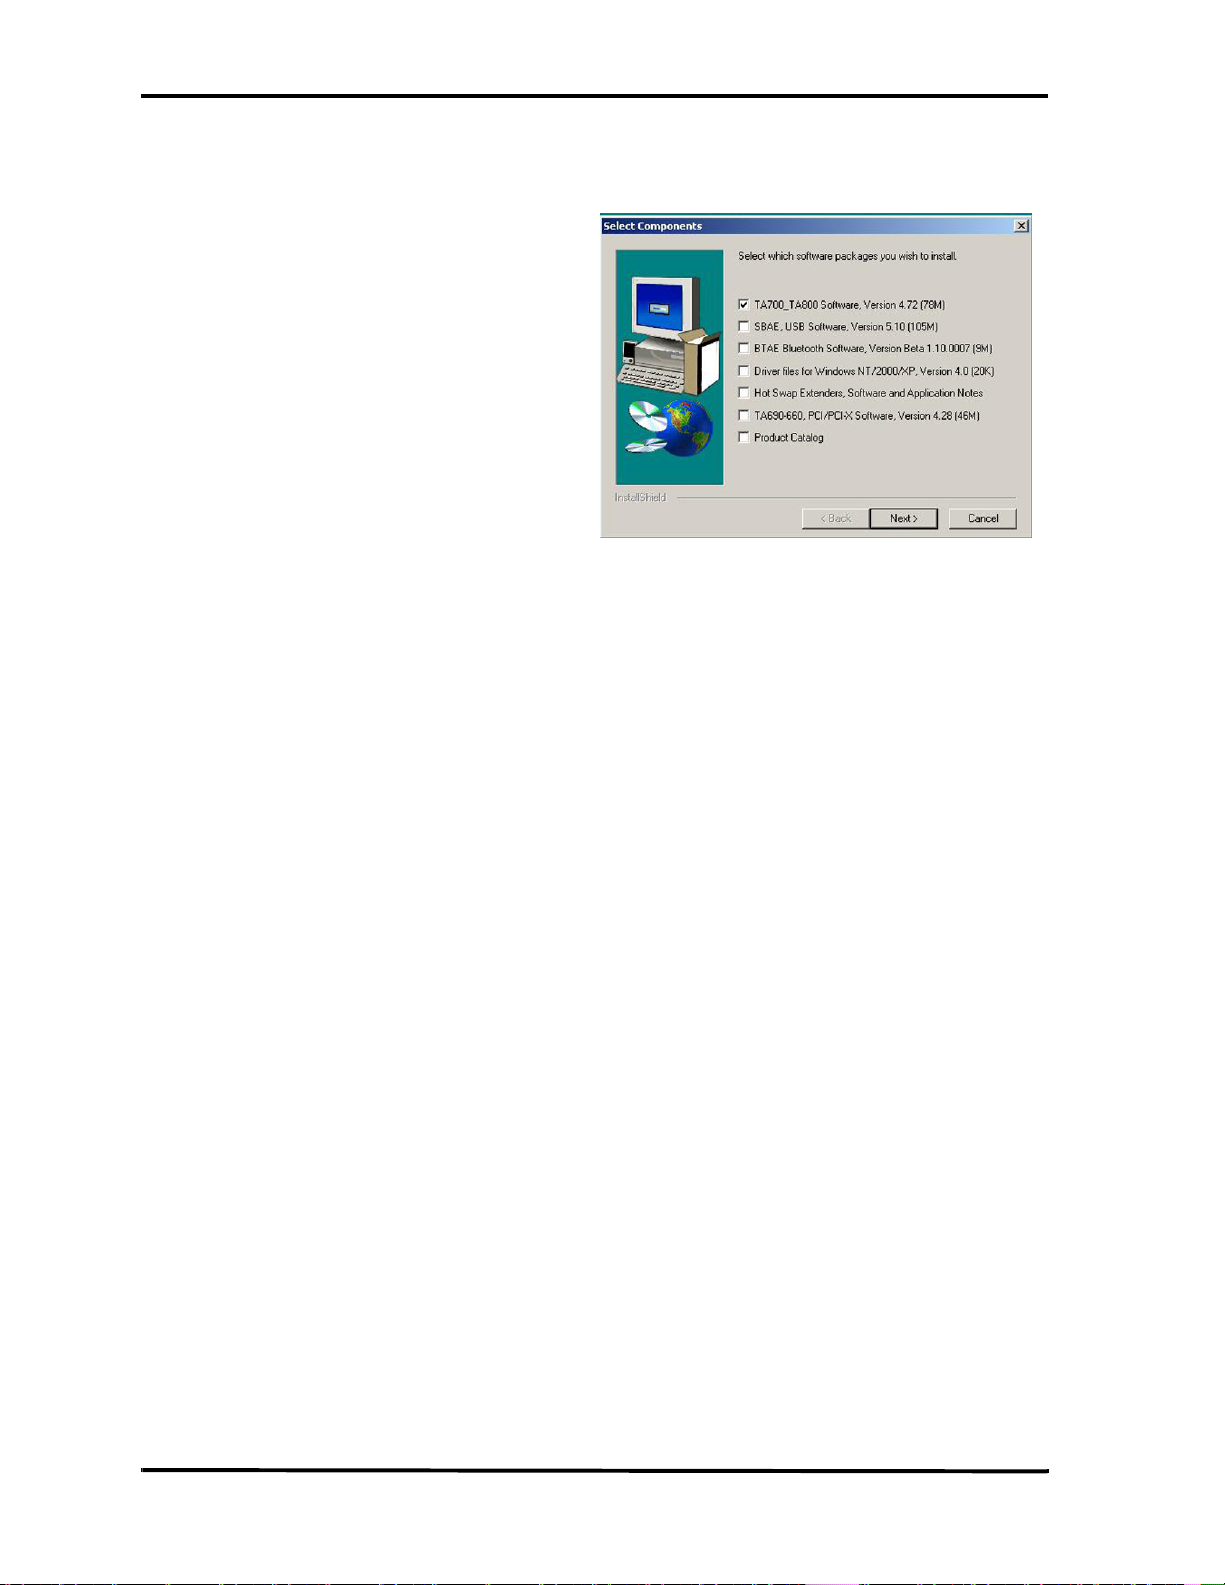
3. After the warning for closing all other programs and before starting the
installation, the Install Component selection window will open as shown in
Figure 4.
5
Catalyst Enterprises, Inc. Installing Your Analyzer
Figure 4 Install Component Selection
4. Select the desired components for installation.
5. Click Next to complete the installation.
System Restart After installing the TA700/800 software you must restart your computer
before you can use your analyzer software.
USB Driver During installation of the TA700_TA800 software automatically installs
the USB driver, which will require the system to be rebooted. When the
TA700/TA800 is attached to the system using the USB port, the system
will search for the correct driver for the TA700/TA800. This step may
require some user interaction, the user should only need to press next, and
the system should find the correct driver. If this step does not work, please
refer to the next section for details on how to manually install the USB
Driver.
PCI Driver If at the end of installation the operating System requests a PCI driver,
then you must manually point to the PCI driver folder.
Manual USB Driver Installation
To control the TA700/800 via the USB bus perform the following:
1. Power Up the TA700/800
2. Connect the USB cable between the TA700/800 USB Port interface and the
Host Computer USB port.
3. After Windows detects the new device, select the “Search For Best Driver for
Your Device” option button.
4. Click Next.
5. Choose the “Specific location” option button and deselect all other option
buttons.
• Click Next
6

Installing Your Analyzer Catalyst Enterprises, Inc.
• Using Browse go to:
“c:\Program Files\Catalyst\TA700_800\Predefined\USB Driver”
(Operating under Windows 2000 or Windows XP you need to enter
the ‘Win2k’ directory.)
6. Click Next and then Finish to complete the TA700/800 USB port driver
installation.
Manually Updating the TA700/800 USB Driver
1. Install the new TA700/800 software as described in the software installation
section.
2. Click Start: Settings: Control Panel: System and click the Device Manager tab.
3. Find the Catalyst Test Tools entry.
4. Select and right click the Catalyst TA700/800 board.
Note: If the TA700/800 board is not present, please connect the TA700/800 to the host
computer using the USB cable.
5. Select Properties and click the drivers tab.
6. Click “Update Driver”
7. Choose the “Specific location” option button and deselect all other option
buttons.
• Using Browse go to:
“c:\Program Files\Catalyst\TA700_800\Predefined\USB Driver”
(Operating under Windows 2000 or Windows XP you need to enter
the ‘Win2k’ directory.)
• Click OK.
8. Click Next and then Finish to complete the USB driver update.
7
Catalyst Enterprises, Inc. Installing Your Analyzer
Connecting via Ethernet
You may use the ethernet connection using any one of the following 3 supported
configurations:
1. The TA700/800 connected to a network via a hub, switch, or similar device.
2. The TA700/800 connected to the host computer (machine running the
application software), via a hub, switch or similar device.
3. The TA700/800 connected directly to the host computer using a crossover cable.
Connecting to a Network
When connected to a network the TA700/800 must communicate with the DHCP
server to establish a connection. The DHCP server will continually send the next
available IP address to the TA700/800 until the TA700/800 software is started.
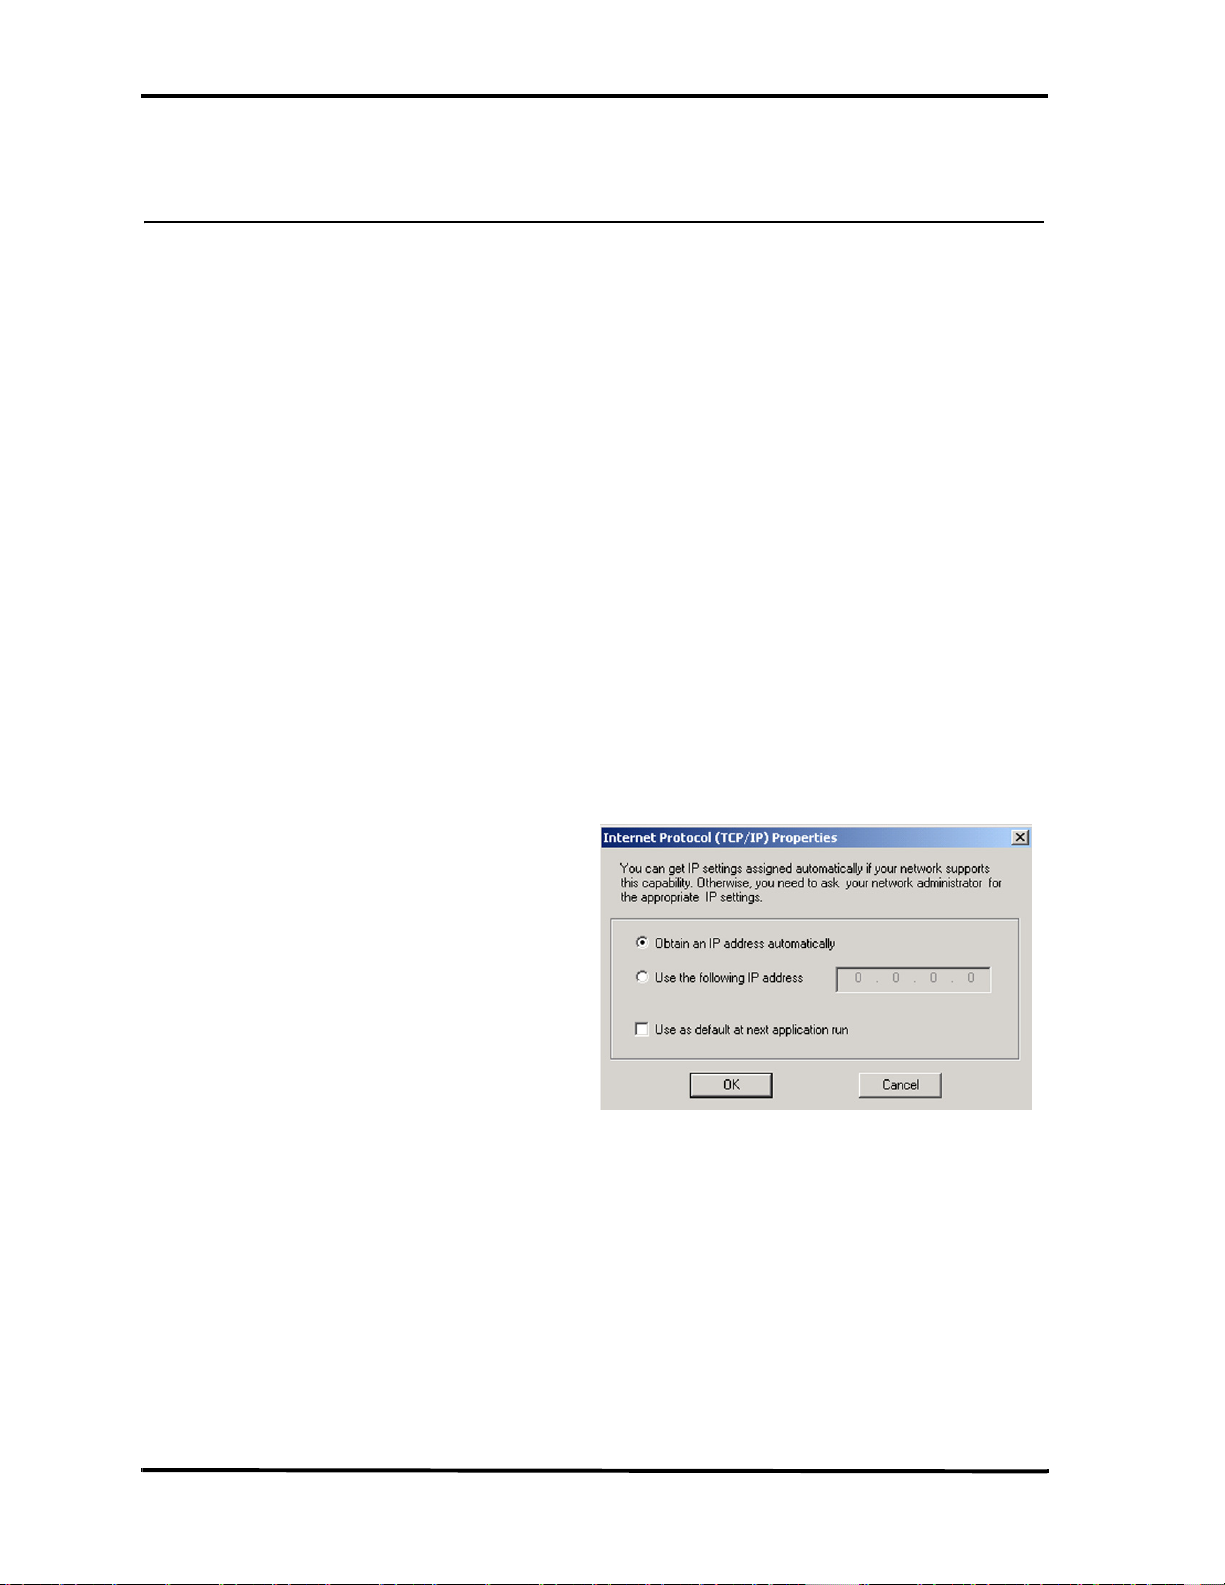
When the user starts the software, the user may be prompted if they wish the software
to automatically use the offered IP address or if they wish to assign a specific IP
address (the assigned IP address needs to be on the same network segment as the host
computer). The menu also allows the user to save the selected option (automatic or
specific address). If the assigned IP address is not available, the OS will notify the
user of an IP address conflict.
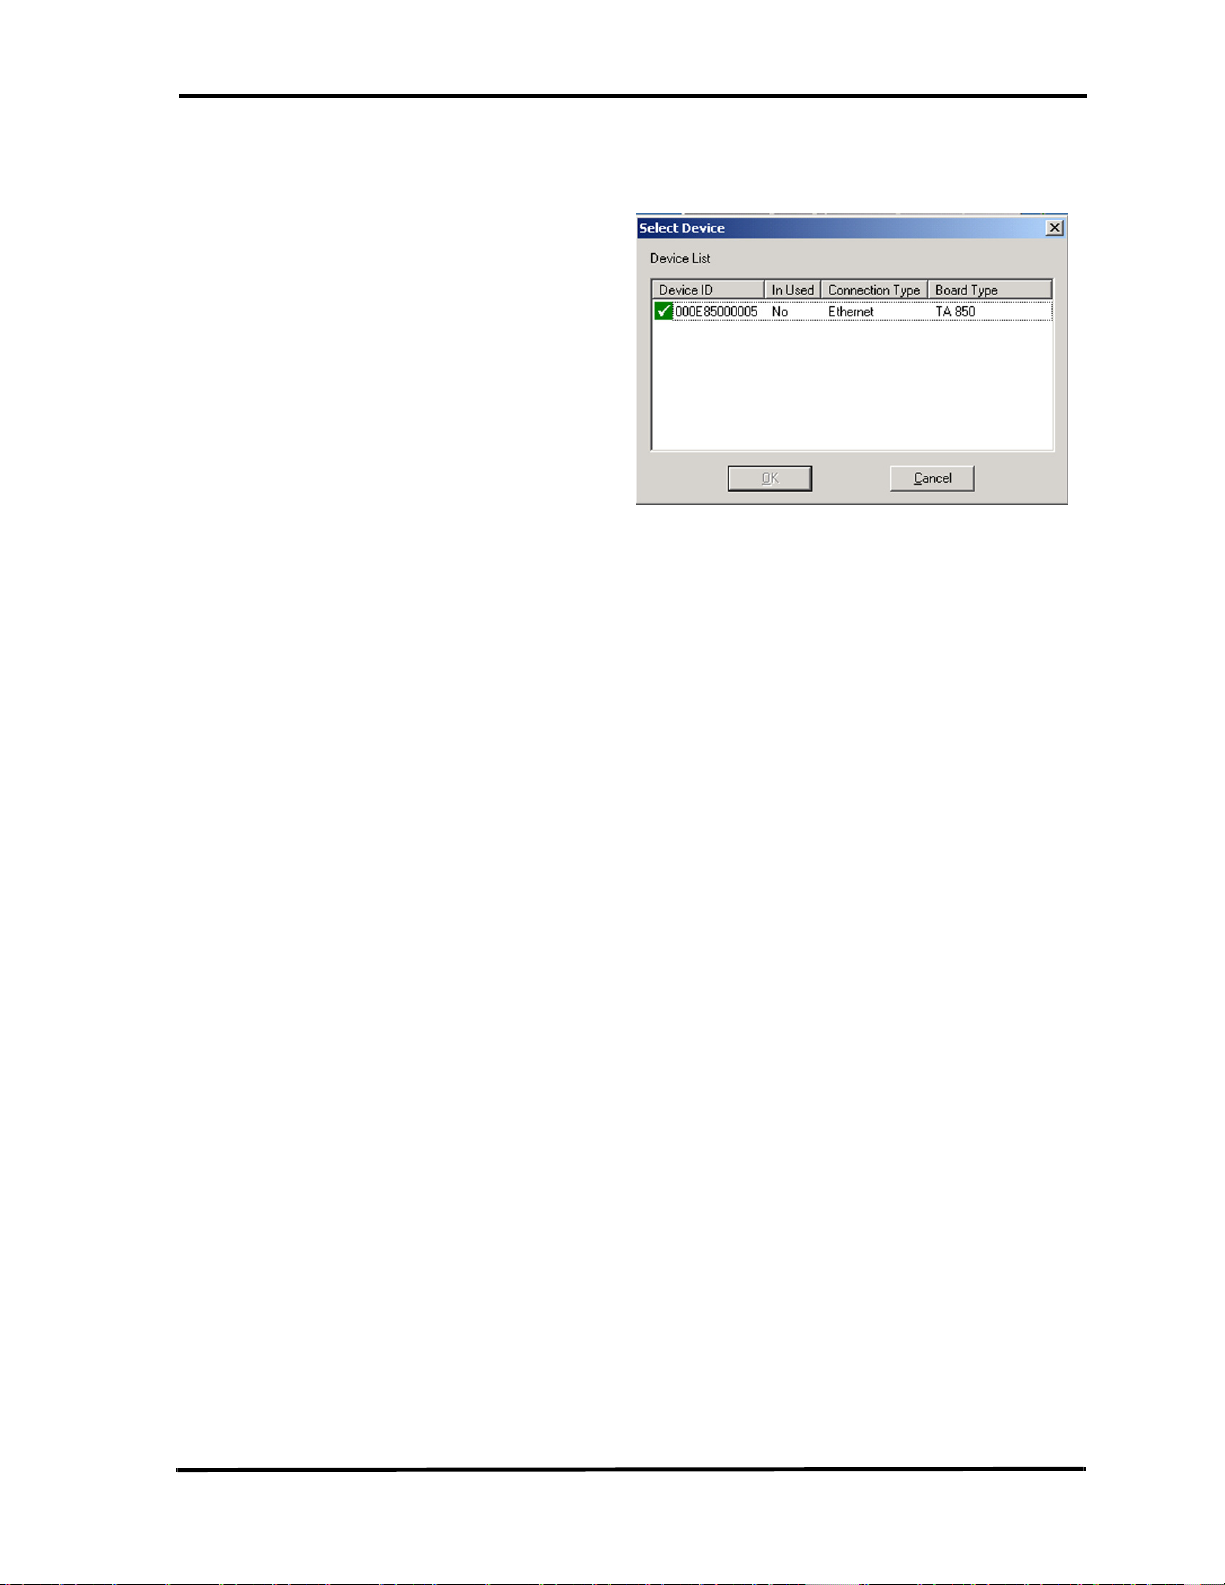
After the user clicks ‘OK’ the software will search for all TA700/800 units connected
to the network, and will display a list of available TA700/800 units. After the user
selects the desired TA700/800 unit, the software will assign the IP address to the
selected unit, completing the connection and will launch the software.
8
Installing Your Analyzer Catalyst Enterprises, Inc.
Connecting via Hub, Switch or Similar device
When connected to the host machine via a hub, switch or other similar device or
directly using a crossover cable the Catalyst board must communicate with the host
computer to establish a connection. The host computer will continually broadcast the
next available IP address to the Catalyst Board until the Catalyst software is started.
When the software starts, the user may be prompted if they wish the software to
automatically use the offered IP address or if they wish to assign a specific IP address
(the assigned IP address needs to be on the same network segment as the host
computer). The menu also allows the user to save the selected option (automatic or
specific address). If the assigned IP address is not available, the OS will notify the
user of an IP address conflict.
After the user clicks ‘OK’ the software will search for all Catalyst boards connected to
the network, and will display a list of available Catalyst boards, after the user selects
the desired Catalyst board, the software will assign the IP address to the selected
board, completing the connection and will launch the software.
9
Catalyst Enterprises, Inc. TA700/800 Overview
TA700/800 Overview
The TA700/800 PCI Bus Analyzer/Exerciser offers analysis/exerciser capability for
either PCI or PCI-X applications with the following capabilities:
• A convenient, easy to use Easy Mode that allows you to perform
95% of your PCI bus data capture & trigger without any
programming.
•An Advanced Mode offers you a powerful programming capability
for complex triggering.
•An Exerciser that generates bus transactions to exercise the bus as a
master or target while allowing you to monitor and capture the
resulting performance. An on board target memory allows testing
read/write operation of master agents.
•A Timing Analyzer capability is also included that allows the user to
capture bus timing violations. Not available for TA700P (PMC).
Not in current version for TA800.
Additionally, the TA700/800 includes Performance Analysis for real-time and
statistical measurement as well as comprehensive Device Compliance Test capability.
TA700/800 Working Mode Configurations
The TA700/800 may be operated in one of 6 working mode configurations, each
offering a convenient Easy Mode which requires no programming:
The working mode configuration is selectable on the Main Menu Bar.
State Analyzer Only (PCI - PCI-X)
The TA700/800 Capture and Trigger mode allows hardware or software oriented PCI/
PCI-X bus debug without any programming or setup in the convenient to use Easy
Mode. A comprehensive selection of Pre-defined setups allows a variety of data
capture on several available trigger conditions for PCI and PCI-X applications.
The Advanced Mode provides for comprehensive user definition of complex data
capture and triggering projects. Users may define up to eight events covering all PCI/
PCI-X signals and employ them in a 32 level Sequencer program for a custom data
capture and triggering project. Sequencer state changes in a program may be defined
in terms of events, Boolean expressions of events and Protocol Errors.
10

TA700/800 Overview Catalyst Enterprises, Inc.
State & Timing Analyzer (PCI)
This mode of operation is not supported by the TA700PDC, TA800 or PCI-X.
To perform timing analysis for possible violation and to characterize Setup & Hold
limits on all or selected signals.
State Analyzer & Exerciser (PCI - PCI-X)
To perform Device compliance testing, characterize a PCI device by emulating
various bus cycles & terminations, injecting errors and generating traffics to measure
the PCI bus response. The exerciser may be used as a bus master to test and debug
new designs.
In Easy Mode the Capture and Trigger operates identically to that as in the State
Analyzer Only, except that the bus signals are generated by an exerciser program that
you define.
The Advanced Mode offers the same capabilities for analysis as the State Analyzer
Only except that as in the Easy Mode the bus signals are generated by a user defined
exerciser program.
Asynchronous Timing Analyzer (PCI)
This mode of operation is not supported by the TA700PDC, TA800 or PCI-X.
This option is used to perform high resolution sampling of the PCI bus signals using a
664 MHz asynchronous clock.
Additional Features
Performance Analysis
The TA700/800 provides continuous Real-Time performance analysis that operates
with Pre-defined or User-defined analysis files. On-board dual ported FIFOs interface
between the counters and the host system for transferring the measured data in realtime without ever having to stop the counters. This feature provides a very complete
and accurate event count of up to 533 MB/Sec for TA700PCI (796 MB/Sec for TA700
PCI-X). 533 MB/Sec for TA800 PCI (1066 MB/Sec for TA800 PCI-X). An
implementation of eight counters with up to 32 bits allows a virtually unlimited count
of events.
11

Catalyst Enterprises, Inc. TA700/800 Overview
TA700/800 includes 8 counters which may be programmed to monitor the primary bus
activities and point-to-point signals or signals from the secondary bus.
Your TA700/800 includes complete setups to measure the most typical parameters as
well as giving you the ability to create your own setup. Real time Performance
Analysis allows you to count actual data transfers for any agent or agents matching
user specified address, measure and report bus utilization efficiencies, throughput,
latencies and retries, on-the-fly.
You may use real time Performance Analysis simultaneously with the exerciser to
generate traffic on the bus and measure performance of the target.
Performance Analysis results are presented in a Twelve-color display that you may
customize with your own color preferences and record in graphical format for later
review or demonstration.
Measurement intervals are selectable from 500 µsec to 10 minutes.
Statistical Analysis
Statistical Analysis is implemented by capturing data in memory and then performing
software post processing.
Statistical Analysis measures and reports on Min, Max and Average occurrences for
several different parameters such as Latencies, Retry, Data Transfers, Command
Utilization, Bus Utilization and various Target Terminations.
The PCI Analyzer (Allowing the Master card to be plugged into the expansion slot on
top) can also measure latencies from request to the 1st data transfer including all of the
retries in between.
The data capture & trigger for post processing may be initiated per user defined events
on the bus, therefore yielding a very repetitive and consistent result.
The parameters measured may be selected for graphical display on the screen and may
be saved as graphical or list files for later review.
In the exerciser mode the TA700/800 can initiate data transfer to a target while the
trace statistics measures the latency response of the target.
Special Capabilities
Several other features are included in the TA700/800 such as Protocol Errors,
Mnemonics, Device Compliance Testing. Please refer to the appropriate sections for
each of these features.
12
Launching Your TA700/800 Catalyst Enterprises, Inc.
Launching Your TA700/800
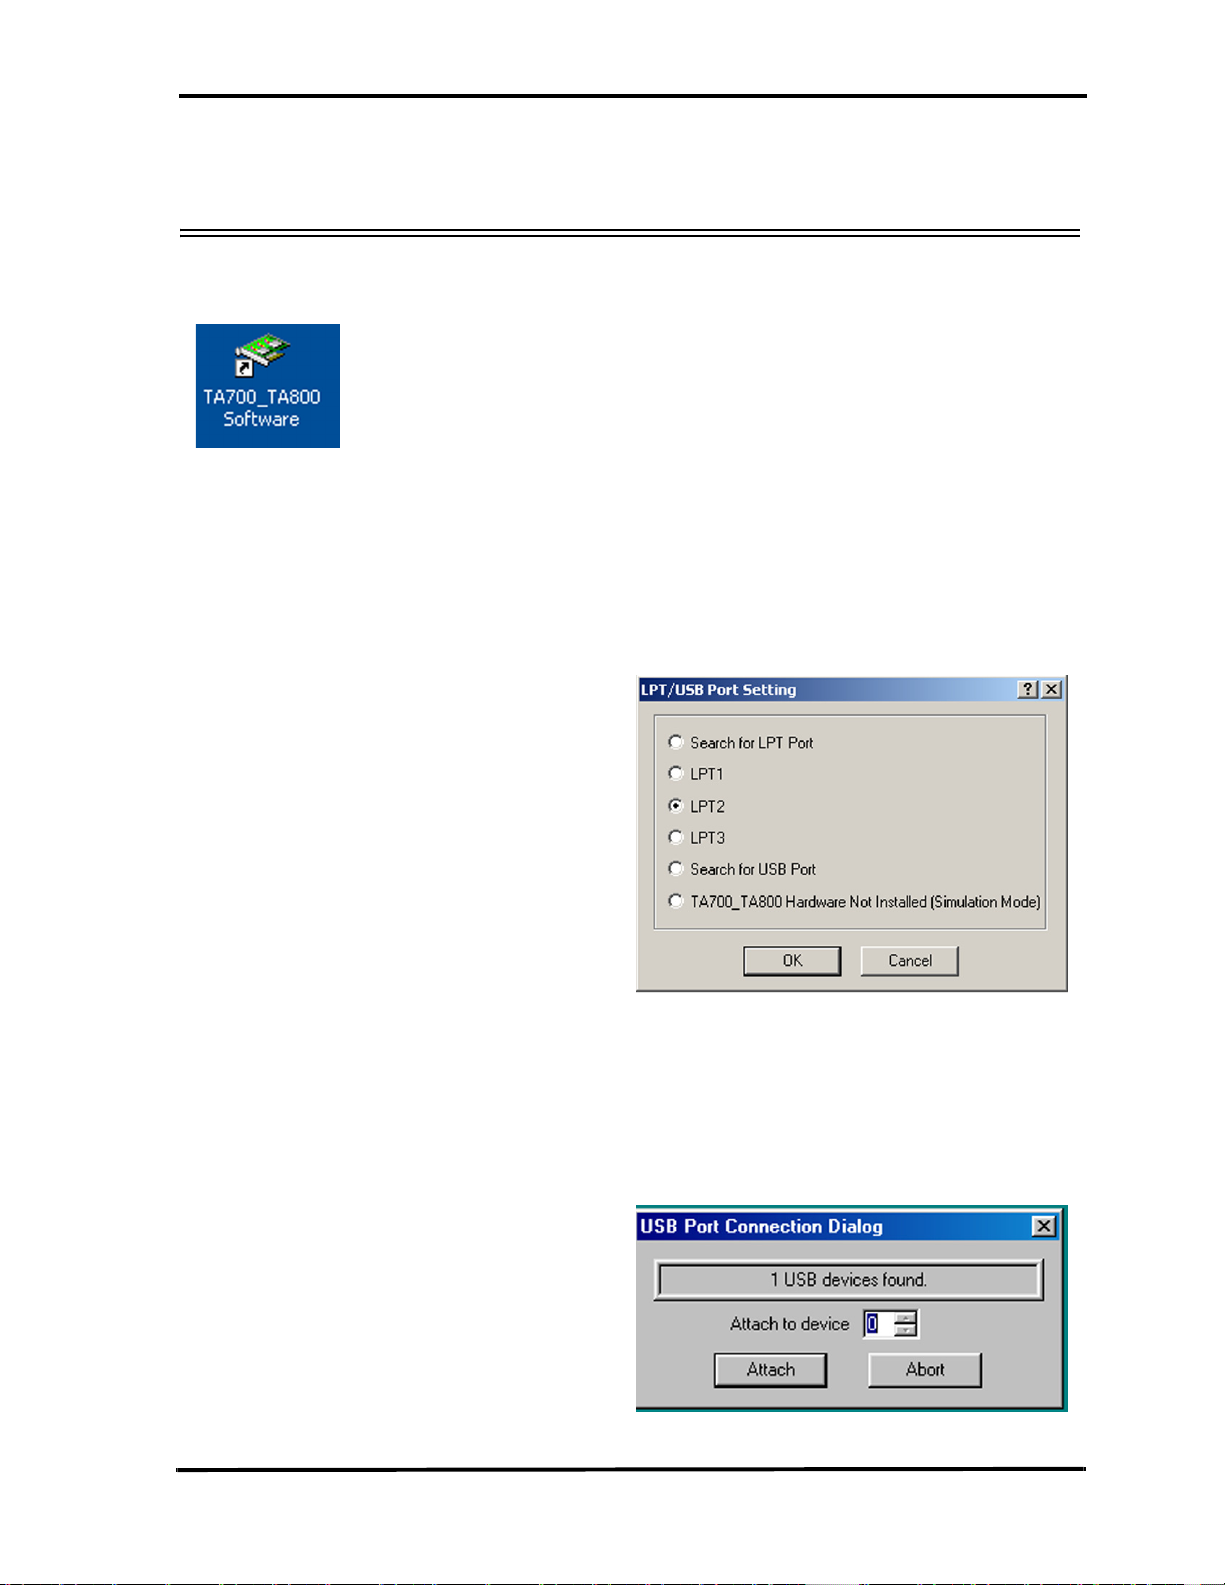
Double click the TA700/800 Icon in the Program Manager Window.
The TA700/800 software is pre-configured at the factory to look for LPT2 as the
selected port for the analyzer. If the software finds this port connected to the analyzer
program will launch immediately otherwise the software will ask you to specify which
LPT/USB port is connected to the hardware.
If you have connected your hardware to a different port e.g. LPT1, USB or Ethernet
(TA850 only), select the that port and click OK to launch the analyzer program.
Find LPT Port If you are not sure which LPT port your hardware is connected to, check
“Search For LPT Port” then OK and let the software automatically locate
the LPT port that is connected to the hardware.
Find USB Port If you would like to use a USB port to connect to your hardware, check
“Search for USB Port” then OK and let the software automatically locate
the available USB ports to connect to the hardware.
13
Catalyst Enterprises, Inc. Launching Your TA700/800
Note: More than one TA700/800 may be connected via the USB bus at a time.
In such cases please be sure to select the correct one using the “Attach to
device” combo box.
1. Click OK to launch the software.
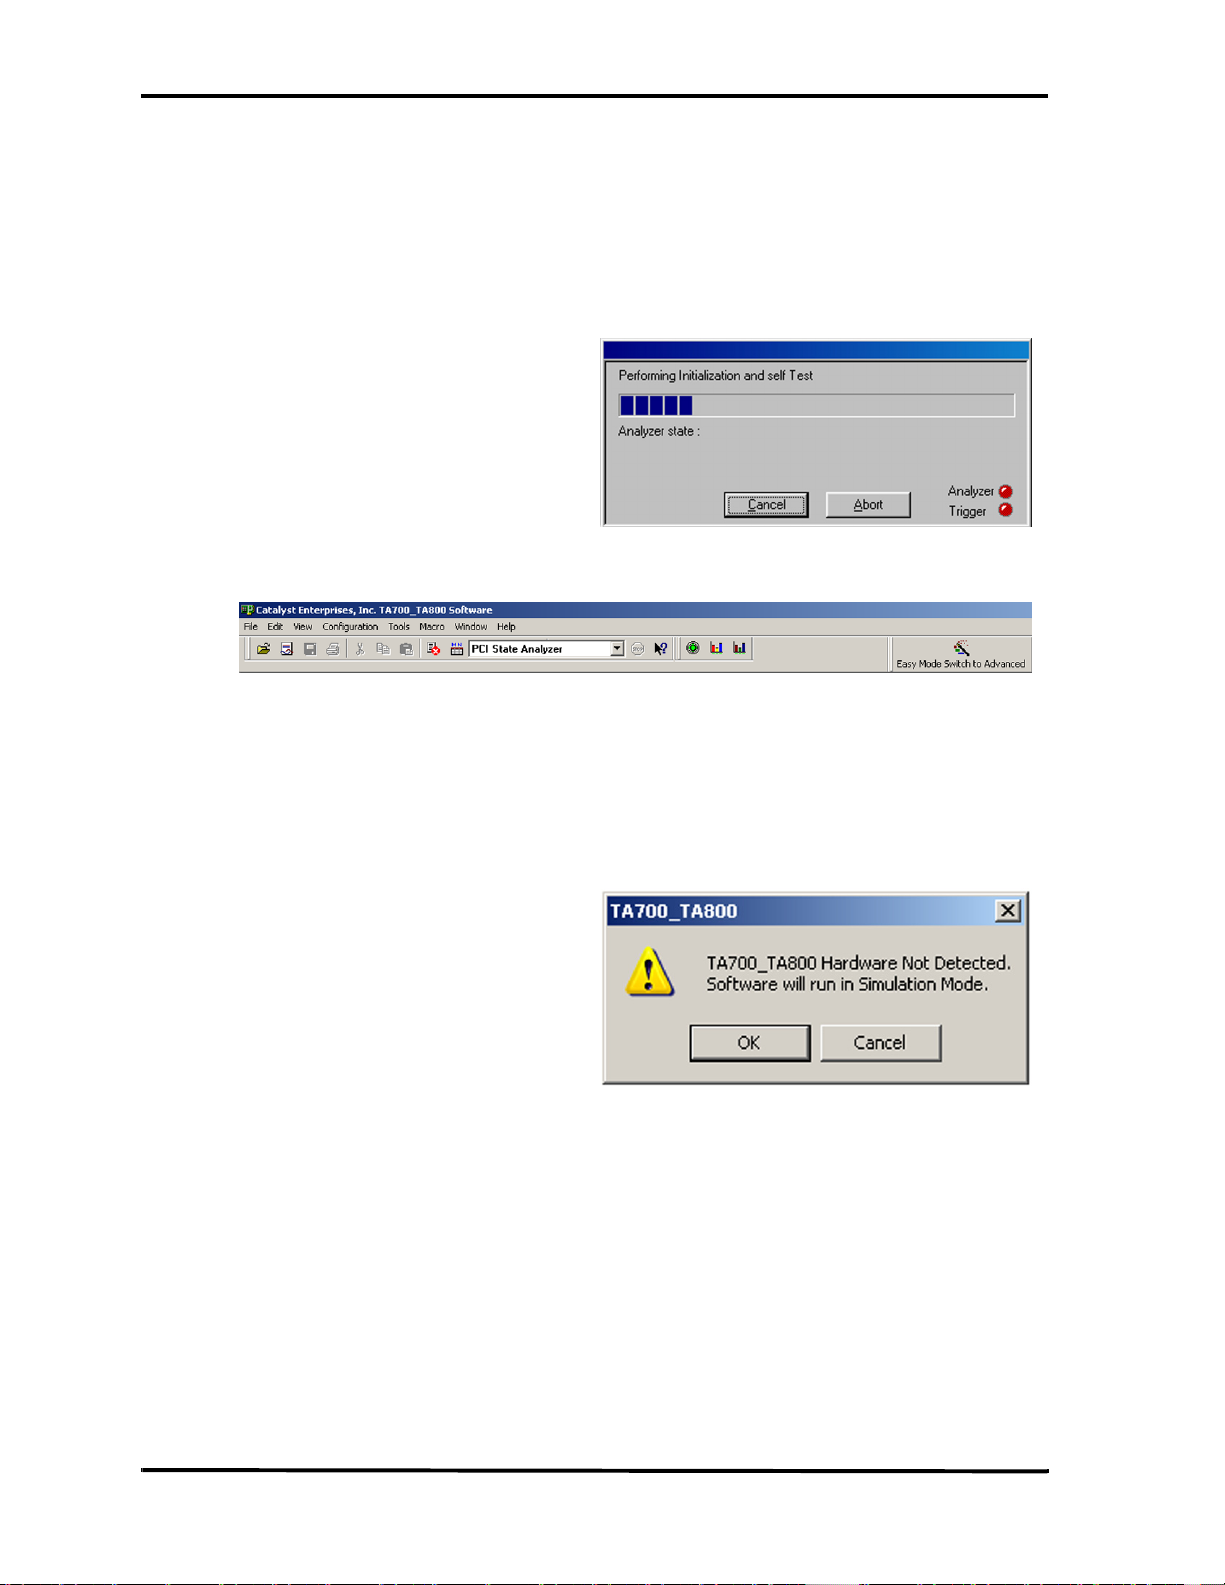
Figure 5 Analyzer Tool Bar
In the event that no LPT/USB port is found connected to the hardware, the software
will display the Hardware Not Detected message. To configure a LPT port see LPT
Port Setting on page 15.
Simulation Mode Clicking OK in this dialog box will launch the analyzer software to
operate in the simulation mode.
LPT Port Problems If your analyzer hardware is connected to an LPT port and there is power
to the analyzer, but you are still getting the message Hardware Not
Detected then see the section on LPT Port setting below.
Bi-directional Port The host system LPT port must be a Bi-directional port. See LPT Port
Setting on page 15.
Launch Problems In the event that you experience difficulties in launching your software,
please see section on LPT Port Setting.
14

Launching Your TA700/800 Catalyst Enterprises, Inc.
Operating in Simulation Mode
Your system will operate in the Simulation Mode as default if the hardware is not
detected, however, you may operate in Simulation Mode directly without installing
the analyzer hardware. To operate without hardware, select Hardware Not Installed
(Simulation Mode) in the LPT Port Setting dialog box and click OK.
The Analyzer program will launch and display the tool bar as shown in Figure 5, but
with the limitation that the analyzer will display previously captured bus data.
Limitations The Simulation mode lets you try all of the available functions, but keep
in mind that the system is not capturing any real data and is displaying
pre-captured results.
LPT Port Setting
Your system parallel port may not necessarily be set to a Bi-directional mode even if
your system supports this mode.
Port not Configured If you continue to get a Hardware Not Detected even if you have set the
required LPT port, please check your system setting for your parallel port.
To set the parallel port:
1. Restart your computer and during boot, press F1 key to enter Setup (some
systems may use a different key than F1, please consult your system manual).
2. Once in setup select the Advanced, then Peripheral Configuration and then
Parallel Port Mode.
3. Select the Parallel Port to be configured. If your system supports Bi-directional
mode you must have choices for at least one of the following:
Bi-directional, ECP or EPP, preferably Bi-directional first then ECP
and last EPP.
Note that Standard or Compatible modes are not a Bi-directional
mode.
4. When finished with the configuration press ESC to exit setup and save the new
configuration.
15

Catalyst Enterprises, Inc. Configuration Menu
Configuration Menu
Click Configuration on the main menu bar to display the various configuration
options.
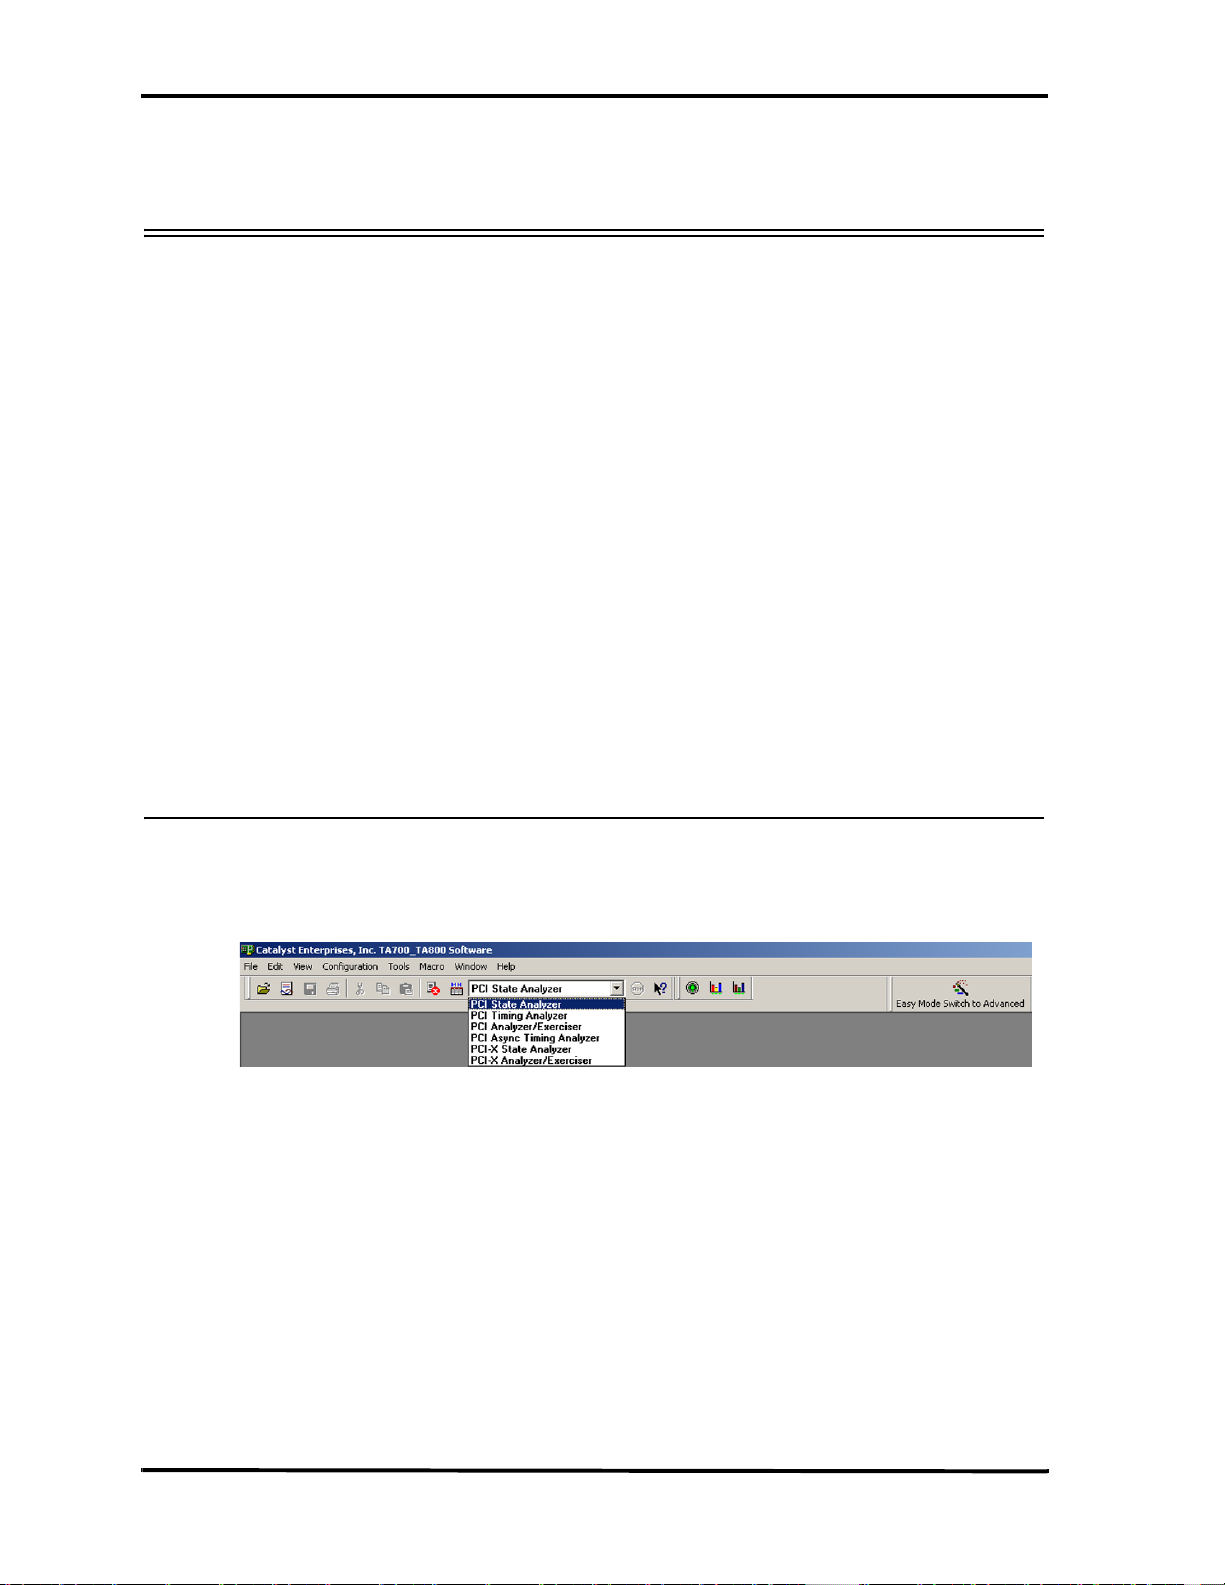
Working Mode Allows you to select the analyzer configuration. The choices are: PCI
State Analyzer, PCI Timing Analyzer, PCI Analyzer/Exerciser, PCI
Async Timing Analyzer, PCI-X State Analyzer and PCI-X Analyzer/
Exerciser.
Protocol Errors Used to configure a Protocol Errors mask for use in triggering on protocol
errors. See Protocol Errors on page 155.
Mnemonics Used to define Mnemonics. Mnemonics may be used to display user
assigned names to specific patterns, in search a pattern in the display or
filter data patterns from a display. See Mnemonics on page 164.
External Signal Names Allows you to assign specific names to external signals for display
purposes only. “External Signals” on page 166
External Signal/Trigger Settings Allows you to configure external input and output triggers. See
“External Signals” on page 166.
Voltage Check Used to select or deselect the voltages to be monitored for tolerance
compliance. See “Enabling Voltage Check” on page 17. Not available for
TA700P (PMC).
Host Bus Used to force the software to work with different bus characteristics than
the ones detected by the TA700/800.
Zoom Options Used to select zoom about X or Y cursor or between X and Y cursor or
Zoom Around when displaying a Wave data capture window. See Using
Zoom in the Wave Window on page 139
Color Setting Used to set custom color combinations for the Analyzer Performance
Analysis Window.
Software Settings Used to set global software user preferences. “Global Software Settings”
on page 21.
Authorization Enables purchased system configurations. See “Authorization” on
page 22
System Feature Status Displays enabled system features. See “System Feature Status” on
page 23
Configuration Space Information Displays the PCI characterization of the TA700/800 that is
presented to the System BIOS.
16

Configuration Menu Catalyst Enterprises, Inc.
Enabling Voltage Check
The TA700/800 is capable of monitoring the critical voltages on your PCI bus. TA700/
800 monitors a 5% drop in voltage for selected voltages and turns the SYS status LED
from green to red if any of the voltages drop by 5%.
Not available for TA700P (PMC).
To select voltages for monitoring:
Click Configuration on the main menu bar and then select Voltage Check. . . to
open the Voltage Check dialog box.
Figure 6 Voltage Check Dialog Box
Check the boxes in the Monitor column for voltages that you wish to be monitored
and click OK.
Note: Top connector voltages not available for CPCI or TA800.
When the TA700/800 is powered from the bus, the Check +3.3V supply to TA700/800
and Check Bus +3.3V both display the Bus status, however when an external power
supply is used the Check +3.3V supply to TA700/800 will display the external power
supply status.
17

Catalyst Enterprises, Inc. Configuration Menu
After clicking Verify Status, the status column will display green LED for monitored
voltages that are within tolerance. A red LED indication signifies an out of tolerance
or missing voltage.
Verify that the SYS LED turns green signifying that the checked voltages are within
5% of their required values.
Host Bus
The TA700 hardware identifies the host bus type automatically at the
occurrence of the rising edge of the host bus RST# and displays the result on
the Status Bar at the bottom of the display.
In the event that the automatic selection does not match the host bus type of
your system hit reset and restart the software. If this fails you may set it
manually as follows:
Click Configuration on the main menu bar and then select Host Bus to open the
Host bus type selection dialog box.
Figure 7 Host Bus Type Selection Dialog Box
18

Configuration Menu Catalyst Enterprises, Inc.
Click the down arrow next to the Host Bus Type list box and select the bus type of
your system.
If your protocol selection does not correspond to your Host Bus selection you will get
a bus mismatch warning message.
Change the protocol to match the detected systen bus by clicking the down arrow on
the Working Mode selection list box and choose the required protocol.
Figure 8 Protocol Selection
19

Catalyst Enterprises, Inc. Configuration Menu
Analyzer Window Colors
Click Configuration on the main menu bar and then select Color Setting . . . to
open the Analyzer Window colors setting dialog box.
This color setting is used for the graph display in Performance Analysis and Trace
Statistics Analysis.
20
Configuration Menu Catalyst Enterprises, Inc.
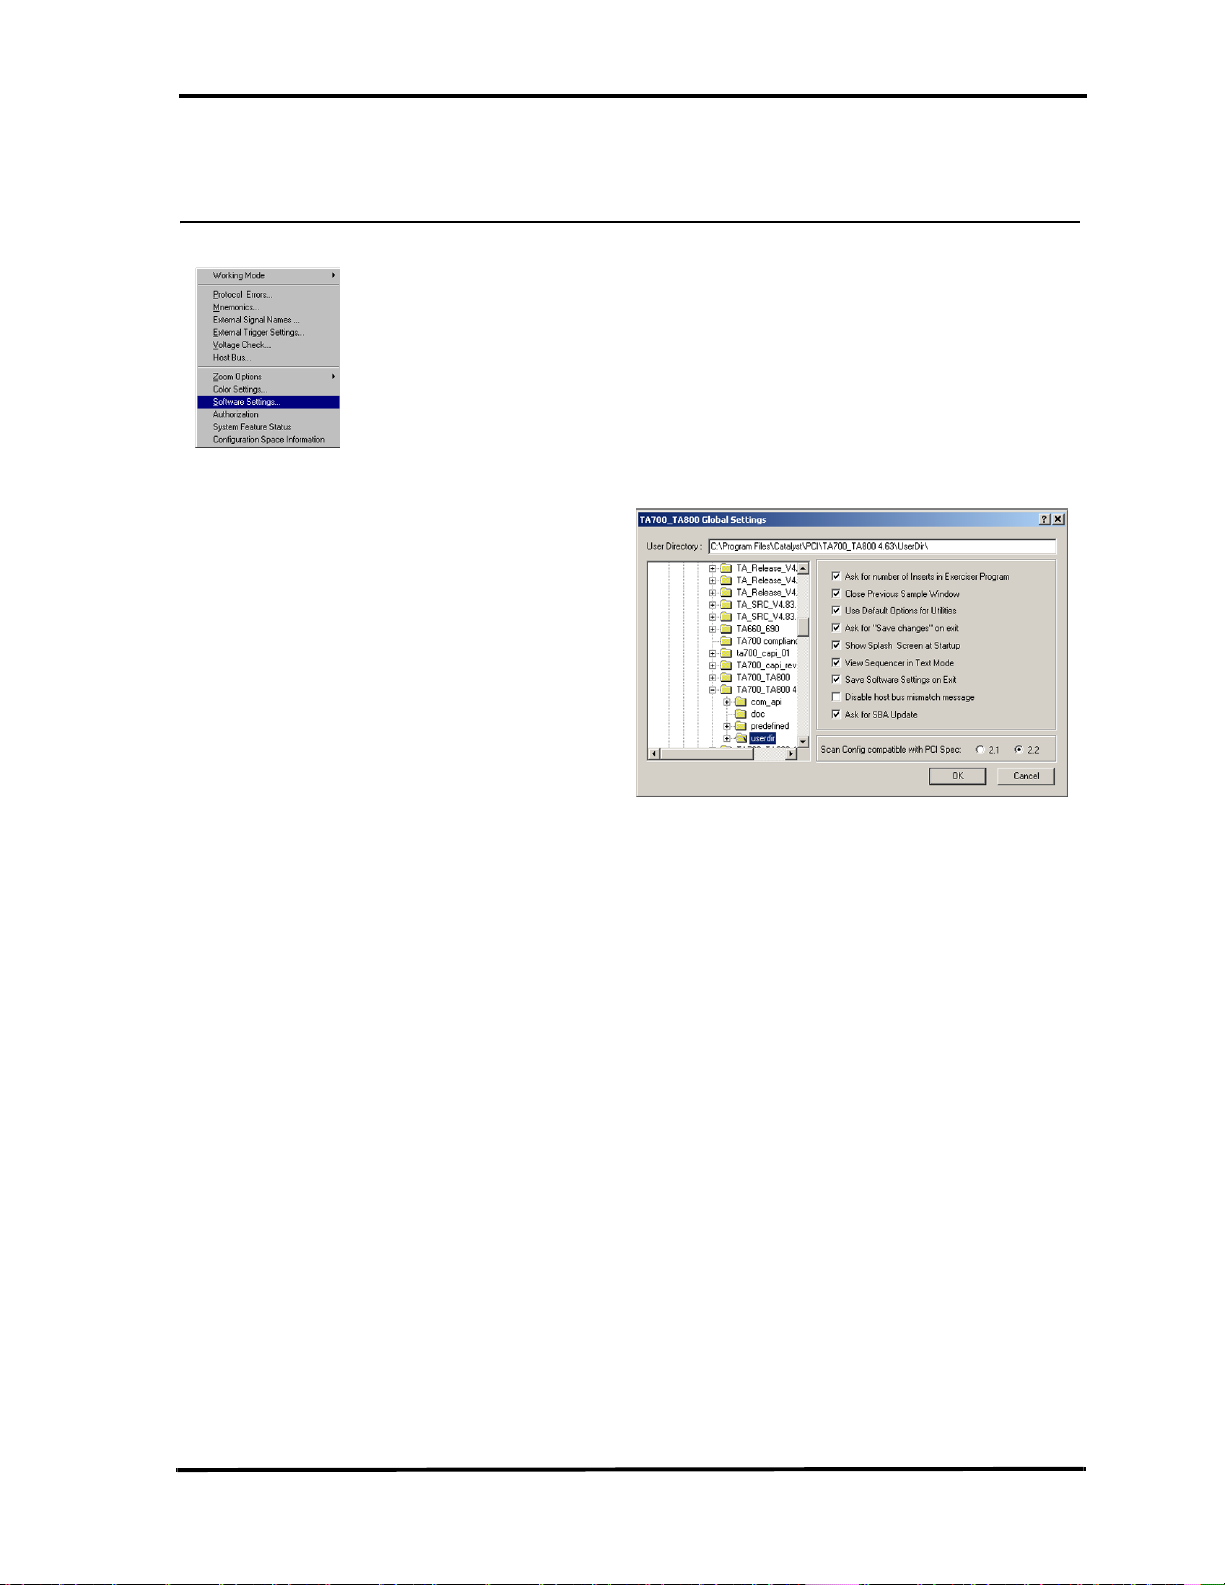
Global Software Settings
Click Configuration on the main menu bar and then select Software Settings to
open the Global Settings dialog box.
Figure 9 Global Software Settings Dialog Box
Check the options that suit your needs and click OK.
21

Catalyst Enterprises, Inc. Configuration Menu
Authorization
An authorization code is required to activate additionally purchased features to
upgrade the TA700/800 as shipped.
To enter the authorization code, click Configuration on the main menu bar and
then select Authorization to open the Authorization Code dialog box.
Figure 10 Authorization Code Dialog Box
Enter the factory provided Authorization Code and click OK. You may verify that the
new configuration has been enabled as described in “System Feature Status” on
page 23.
Note: The Authorization choice may be grayed out if your product includes all of the
available features.
22

Configuration Menu Catalyst Enterprises, Inc.
System Feature Status
Click Configuration on the main menu bar and then select System Feature
Status to open the Features Status Display.
Figure 11 System Features Status Display
The display shows all of the currently authorized system features.
23

Catalyst Enterprises, Inc. Configuration Menu
Configuration Space Information
At power up the TA700/800 is automatically configured as a PCI agent and is setup to
allow the system to see the configuration. However, once the Analyzer/Exerciser is
programmed, the configuration space is hidden from the BIOS or any other agent
trying to access the TA700/800 space configuration. The initial configuration space is
stored by the software as shown below.
Click Configuration on the main menu bar and then select Configuration
Space Information to open the Configuration Space Information Display.
Figure 12 Configuration Space Information Display
Note: Configuration space information from the TA700/800 board is available only at
power on time and is not available after the board has been configured.
24

Configuration Menu Catalyst Enterprises, Inc.
Protocol Errors
To trigger on protocol errors immediately in Easy Mode, see Protocol Errors on page
32 and for Advanced Mode operation see Protocol Errors on page 155.
External Signal Names
To assign unique names to displayed external signals see “External Signals” on
page 166
Not enabled for the TA800.
External Trigger Settings
To set external trigger parameters see External Signals/Trigger on page 166.
25

Catalyst Enterprises, Inc. Easy Mode
Easy Mode
The Easy Mode offers you the capability to perform 95% of your bus analysis tests
without the need for any programming. When operating in the Easy Mode your
analyzer can perform the following:
• Capture data and trigger on bus protocol immediately.
• Perform Timing Violation detection and a search for Setup/Hold
limits.
• Capture bus activity while exercising the bus.
• Do Performance analysis on PCI bus activity.
• Compute Statistics on selected parameters.
• Perform Compliance Device test. (In State Analyzer & Exerciser
only)
Instant Data Capture & Trigger
Make sure that the TA700/800 is in the State Analyzer Only configuration and is
operating in the Easy Mode as shown on the Main Menu bar below.
1. Click the Green button on the Main Menu bar to open the Capture Data and
Trigger dialog box shown in Figure 13.
Figure 13 Capture Data and Trigger Dialog Box
2. Select a Pre-Defined Trigger Point (See Table 1.) from the Trig ger O n
dropdown list and click R
and Figure 15 show a typical Wave and List result display.
un. Wait to capture data and to view result. Figure 14
26

Easy Mode Catalyst Enterprises, Inc.
Table 1. Pre-Defined PCI Trigger Points
1 Address Triggers on specified address
2 Any Interrupt Trigger when any interrupt occurs
3 Burst Longer Triggers when the burst is longer than nnn times
4 Burst Shorter Triggers when the burst is shorter than nnn times
5 DMA Transfers Triggers when data burst is transferred
6 Data at Address Triggers on specified data at address
7 GNT# Triggers when GNT# is asserted
8 Master Abort Triggers when a master abort occurs
Occurrence of SERR# or
9
PERR#
10 Protocol Error Triggers when any PCI protocol error is detected
11 REQ# Triggers when REQ# is asserted
Triggers when error SERR# or PERR# occurs
12 Reset De-asserted Triggers when reset is de-asserted, at rising edge of reset.
13 Assert - De-assert Signal xxx asserted and then de-asserted nnn times
14 Asserted Signal xxx asserted for more than nnn times
15 De-assert - Assert Signal xxx de-asserted and then asserted for more than nnn times
16 De-asserted Signal xxx de-asserted for more than nnn times.
17 Signal Shorter Triggers when signal xxx is shorter than nnn times
18 Target Abort Triggers when a target aborts
19 Target Disconnect Triggers when a target disconnects
20 Target Retry Triggers when a target Retry occurs
21 Target Retry nnn times
22 Target Termination Triggers on target termination, combination
23 Vendor & Device ID Triggers on Vendor & Device ID access.
Triggers when a consecutive target Retry occurs more than nnn
times
27

Catalyst Enterprises, Inc. Easy Mode
Table 2. Pre-Defined PCI-X Trigger Points
1 Address Triggers on specified address
2 Any Interrupt Trigger when any interrupt occurs
3 Attribute
4 Burst Longer Triggers when the burst is longer than nnn times
5 Burst Shorter Triggers when the burst is shorter than nnn times
6 DMA Transfers Triggers when data burst is transferred
7 Data at Address Triggers on specified data at address
8 GNT# Triggers when GNT# is asserted
9 Master Abort Triggers when a master abort occurs
Occurrence of SERR# or
10
PERR#
11 Protocol Error Triggers when any PCI-X protocol error is detected
12 REQ# Triggers when REQ# is asserted
13 Reset De-asserted Triggers when reset is deasserted
14 Asserted-Deasserted Signal xxx Asserted and then Deasserted for nnn times
15 Asserted Signal xxx Asserted for more than nnn times
16 Deasserted-Asserted Signal xxx Deasserted then Asserted for nnn times
Triggers on a specific attribute phase with user defined address and
command
Triggers when error SERR# or PERR# occurs
17 Deasserted Signal xxx Deasserted for more than nnn times
18 Signal Shorter Triggers when signal xxx is shorter than nnn times
19 Target Abort Triggers when a target aborts
Target Disconnect at Next
20
ADB
21 Target Retry Triggers when a target Retry occurs
Target Single Data Phase
22
Disconnect
23 Target Split Response Triggers on target Disconnects during burst.
24 Vendor & Device ID Triggers on Vendor & Device ID access
Triggers when a target disconnects
Triggers on target Disconnect termination.
28

Easy Mode Catalyst Enterprises, Inc.
Figure 14 Wave File Output Display
To view the result as a list file output display, click the List button.
Figure 15 List File Output Display
To return to the wave file output display, click the Wave button.
29

Catalyst Enterprises, Inc. Easy Mode
Selective Data Capture (Complete Bus)
You may refine your data capture by checking the Data Capture Selection as Specific
Address(es).
Figure 16 Capture Data At Specific Addresses Dialog Box
Selecting this option allows you to specify data capture at up to 3 address ranges with
a specific associated command that is selected from the CBE# dialog box. To open the
CBE Type dialog box click the ellipses button next to the Command edit box.
Figure 17 CBE Select Dialog Box
30

Easy Mode Catalyst Enterprises, Inc.
Selective Data Capture (Current Slot Only)
Choosing this option allows you to further refine your capture by limiting it to the bus
traffic originated at this slot only.
Figure 18 Capture Data for Current Slot Only.
Setup for this option is identical to the Selective Data Capture for the complete bus.
You may specify data capture at up to 3 address ranges with a specific associated
command that is selected from the CBE# dialog box. To open the CBE Type dialog
box click the ellipses button next to the Command edit box.
Figure 19 CBE Select Dialog Box
31

Catalyst Enterprises, Inc. Easy Mode
Data Capture & Trigger Examples
The capture data and trigger dialog box changes depending on the type of Trigg er On
chosen. The following are some examples.
Signal on shorter than nnn times. With this Trigger selection you must choose a signal from the xxx
dropdown list and specify the number of times in the nnn edit
box.
Figure 20 Specify Signal And Number of Times
Protocol Errors When this Trigger On selection is chosen, note the PE button next to the
Trigger On list box. Clicking this button opens the Protocol Error mask.
32
Figure 21 Trigger on Protocol Error

Easy Mode Catalyst Enterprises, Inc.
Data Capture Options
Memory Display You may limit the captured data display to a specific number of samples
by checking Partial Memory and entering the number of Samples to be
captured or, you may check entire memory to allow the capture for the
entire memory.
Extended Memory If your TA700/800 or TA700C has the optional extended memory, you
may limit the capture to 1MS, 2MS, 3MS or 4MS. The memory limit
flyout becomes active whenever the extended memory card is detected as
present.
Address/Data Size Choose 32 bit or 64 bit addressing and data size.
Pre-Trigger Pre-Trigger is set by default at 50% which defines the percentage of data
to be captured before and after the triggering event. You may change this
percentage by dragging the slider to the desired value.
Pre-Trigger Data The capture of the specified percentage of the data prior to the triggering
event cannot be guaranteed and may in some cases be 0. This can occur in
cases where the triggering event occurs before the required number
pre-trigger event data can be stored. In these cases the data display will
show fewer than the specified data points prior to the triggering event. For
more detail see Set Trigger on page 81.
Manual Trigger Select this option when you wish to manually interrupt the data capture
based on some external event. With this option selected, data will be
continually captured to memory and overwritten as required until you
stop the data capture.
Auto Run Continually captures data for the number of times specified. A separate
data file is generated each time that a capture is performed.
Exclude Cycles To simplify the captured data display you may check the options to
exclude: Idles, Wait States and Retries.
33

Catalyst Enterprises, Inc. Easy Mode
Performance Analysis
Click the Performance Analysis Icon on the menu bar to open the Performance
Analysis dialog box
Figure 22 Easy Mode Performance Analysis Dialog Box
To perform an immediate Performance Analysis:
1. Click the down arrow next to the Performance Analysis Group list box and
select one of the four available analysis groups.
2. Select the parameters for analysis from the Available Items list.
3. Select the counters mode, Reset or Accumulate and click Run.
Reset/Accumulate With Reset selected, the measurement counters are reset at the beginning
of each interval. With Accumulative selected, the measurement counters
will continue to add up.
Save Settings To save the measurement setup, first select Save to open the Save As
Dialog Box, enter a new file name to save as a *.pep file and click Save.
34

Easy Mode Catalyst Enterprises, Inc.
Figure 23 Performance Analysis Result
Save Results If you would like to save the analysis results, click Save to File enter the
number of samples you wish to save and the name of the output file.
Review Results For instructions on reviewing a saved performance analysis file, see
Saved Performance Analysis Review on page 81.
35

Catalyst Enterprises, Inc. Easy Mode
Trace Statistics
PCI-X not supported in current version.
Trace Statistics analysis is implemented by capturing data in memory and then post
processing it with software. The analysis software is capable of measuring important
parameters such as Minimum and Maximum latency occurrences for any target or user
defined specific target, command utilization such as how many times an I/O write
versus I/O read occurs or, how many times memory commands occur. Available Trace
Analysis parameters that may be selected for a report are listed on page 39.
Obtaining Trace Statistics
Click the Trace Statistics Icon on the menu bar to open the Trace Statistics
dialog box
Figure 24 Trigger Point Selection
1. Select a Trigger Point from the Trigger On dropdown list and then select the
Trace Statistics tab to set the trace statistics options. For a list of available
choices see Trace Analysis Options on page 39.
36

Easy Mode Catalyst Enterprises, Inc.
Figure 25 Easy Mode Trace Statistics Dialog Box
Selecting Parameters Select the parameters to be measured from the Analyze List Of shown in
Figure 25. Move the selected parameter to Trace List window for
software to perform interrogation on that parameter during post
processing by clicking the =>> button next to the Of edit box. Parameters
may be defined as minimum, average, maximum or count and or
percent depending on which unit applies. Parameters may also be
defined, if applicable, by address type.
Choose for Processing Highlight the parameters in the Trace List that you wish to have
processed.
Number of Samples Set the amount of data to be captured in the memory for post processing
for each interval. The larger the number of samples the more time is
required for downloading and processing, Therefore you should select an
optimum number of samples to be captured to memory such as 1000. This
takes about one second to process. If your application requires more data
then a larger number should be entered.
Update Interval If a small number of data samples is expected to be captured, say 1000,
and the application does not require repeated measurement, you may want
to sample data once every 5 or 10 seconds by changing the Update
Interval to 5 or 10 seconds as required. The larger of the two number of
data samples or faster update rate will be the dominating setup for data
capture time.
Address/Data Size Choose 32 bit or 64 bit addressing and data size.
Graph, Report Checking either or both the Graph or Report check boxes will produce a
corresponding graphical and or statistical report.
Pre-Trigger Pre-Trigger is set by default at 50% which defines the percentage of data
to be captured before and after the triggering event. You may change this
percentage by dragging the slider to the desired value.
37

Catalyst Enterprises, Inc. Easy Mode
Pre-Trigger Data The capture of the specified percentage of the data prior to the triggering
event cannot be guaranteed and may in some cases be 0. This can occur in
cases where the triggering event occurs before the required number
pre-trigger event data can be stored. In these cases the data display will
show fewer than the specified data points prior to the triggering event. For
more detail see Set Trigger on page 81.
2. When all the parameters have been specified, click Run to capture the specified
data and perform the trace statistics determination.
Figure 26 Trace Statistics Graphical Display
Figure 27 Trace Statistics Report
Save Measurements All measurements may also be saved and reviewed later, select SAVE and
specify the output file name. The results may be selected and reviewed
from the View option on the Main Menu bar.
38

Easy Mode Catalyst Enterprises, Inc.
Trace Analysis Options
Latency Target *Number of waits due to TRDY before first data phase
Latency Master *Number of waits due to IRDY not asserted
Latency Arbiter Number of clocks from REQ to GNT (master board must
be plugged on top of the TA700)
Efficiency Efficiency in percent for the duration of the captured data
Target Efficiency *Number of TRDY# asserted over DEVSEL# asserted
Master Efficiency *Number of IRDY# asserted over DEVSEL# asserted
Throughput Mb/Sec Number of data transferred over time
Bus Utilization Number of cycles DEVSEL# asserted over time
IDLE Number of IDLE cycles
No. of Data Transfer/Addr *Size of data burst
Wait Number waits or wait time in percent
Int Ack Number of INT ACK
I/O *Total number of I/O Commands
I/O RD *Number of I/O Read Commands
I/O WR *Number of I/O Write Commands
Memory *Number of Memory Commands
Mem RD *Number of Memory Read
Mem WR *Number of Memory Writes
Configuration *Number of Configuration Cycles
CFG RD *Number of Configuration Read
CFG WR *Number of Configuration Write
MEM RM *Number of Memory Read Multiple
DU ADD *Number of Dual Address Commands
MEM RL *Number of Memory Read Line Commands
MEM W&I *Number of Memory Write and Invalidate
Total No of Data *Number of Data Transferred during capture
RETRY *Number of Target Retry
TABORT *Number of Target Aborts
DIS+DATA *Number of Target Disconnect + data
DIS-DATA *Number of Target Disconnect - data
MABORT *Number of Master aborts
Latency, REQ# to Data Latency time from REQ# asserted until data transferred,
including retries
DEVSEL Speed Reports Target Decode speed
* Indicates a total or number at specified address or an address range
39

Catalyst Enterprises, Inc. Easy Mode
Exercise and Capture
Make sure that the TA700/800 is in the State Analyzer & Exerciser configuration
and is operating in the Easy Mode as shown on the Main Menu bar below.
Click the Green button on the Main Menu bar to open the Capture Data and
Trigger dialog box shown in Figure 28.
Figure 28 Capture Data and Trigger Dialog Box
The data capture and trigger operation behaves identically to that as in the State
Analyzer Only configuration, with the exception, that the bus signals are generated by
an exerciser program that you define.
For details of setting up a capture see “Instant Data Capture & Trigger” on page 26.
40

Easy Mode Catalyst Enterprises, Inc.
Defining an Exerciser Program
1. Click on the Exerciser Program tab to open the Exerciser Program definition
dialog box as shown in “Exerciser Program Definition Dialog Box” on page 41.
Figure 29 Exerciser Program Definition Dialog Box
2. Define up to 9 exerciser program lines by selecting a command type, data to be
written or a previously defined data block if applicable, target address, and data
size.
3. Set the exerciser options as described on page 42.
4. Click R
un to perform data capture and trigger with exerciser generated signals.
41
Figure 30 Wave File Output

Catalyst Enterprises, Inc. Easy Mode
Setting Exerciser Options
To set the exerciser options, click Ex
from the drop down list to open the exerciser dialog box as shown in Figure 31.
erciser on the menu bar and select Options
Figure 31 Exerciser Options Dialog Box
On Target Disconnect Retry
Use Same Transaction Completes from the disconnect point on,
Use Next Transaction The TA700/800 will bypass all of the
Master Abort on No DEVSEL#
Wait Extra Cycles FRAME# says asserted 10 additional clock
Per PCI Specification A Master About will be issued on the 5th click if
Master Assert FRAME#
Regardless of GNT# Once the TA700/800 is set to become a master, it
regardless of the number of times the target
issues a disconnect. The TA700/800 will take it
from where the target disconnect was issued and
try to complete the transaction from that point
on.
transactions in the current command and will
jump to the transaction for the next command.
before issuing a Master Abort.
no DEVSEL# is asserted.
asserts the frame and starts the transaction
regardless of the status of the GNT#.
42

Easy Mode Catalyst Enterprises, Inc.
After GNT# Asserted The TA700/800 will request the bus and start the
transaction only after the GNT# is asserted.
Master Completes Transaction at Time Out
Disabled The TA700/800 continues to complete the
transaction for however many clocks it takes
regardless of GNT# being deasserted.
Enabled The TA700/800 completes the current
transaction as soon as possible after GNT# is
deasserted.
43

Catalyst Enterprises, Inc. Easy Mode
Creating a Data Block File
To create an exerciser data file click the Data Block Icon on the Main Menu bar
to open the Data File dialog box shown in Figure 32.
Figure 32 Data File Definition Dialog Box
Click N
(“Data Block 0”) in the Data Blocks area. With the new data block highlighted you
may define a specific block pattern or create a walking bit type pattern.
Fixed Data Pattern Click the Define Pattern button to open the Define Data Pattern dialog
Enter a pattern and select the number of times that pattern is to be repeated and click
OK.
Multiple Line Pattern You may define a block of multiple lines that can be automatically
ew Data Block in the Data File Definition dialog box to enter a data block
box.
Figure 33 Define Data Pattern Dialog Box
repeated. Figure 34 shows the definition of a two line pattern to be
repeated 3 times. To add a new line, enter the data in the edit box and then
click on the down arrow to include it in the list.
44

Easy Mode Catalyst Enterprises, Inc.
Figure 34 Define Multiple Line Pattern
Figure 35 shows the resulting block pattern where the defined pattern is replicated 3
times.
Figure 35 Resulting Multiple Line Pattern
Walking Data Pattern Click the Fill With Walking Bits button to open the Fill With Walking
Bits dialog box as shown in Figure 36.
Figure 36 Fill With Walking Bits Dialog Box
Enter the walking bit options desired and the number of times the data pattern is to be
written and click OK.
Figure 37 is an example of a walking bit “1” set in a direction of left to right to be
written 4 times.
45

Catalyst Enterprises, Inc. Easy Mode
Figure 37 Walking Bit Data File Example
To save the newly created Data file click Close click Yes In the Save Changes to the
Data File Dialog box.
Enter a file name name.dat in the Save As dialog box and click Save.
The newly created data file is now available for use with the current exerciser
program.
46

Easy Mode Catalyst Enterprises, Inc.
Archiving a Project
Once you have completed a project and saved it under a unique project name you may
easily archive all of the project files in one operation.
To archive an open, but saved project, click File and choose A
The Archive Project Dialog opens displaying all of the applicable project files. As a
convenience, you may also add other relevant files to the archive by clicking Add file
and then choosing the file from the Add File to Archive dialog.
Note: Make sure that your sample file is included in the Archive Contents list.
rchive
To complete the archive click S
E-mail archive To e-mail the archived project click S
in the e-mail dialog. This feature is useful for obtaining product support
from the factory.
ave.
47
end and complete the e-mail address

Catalyst Enterprises, Inc. Easy Mode
Restoring a Project
To restore an archived project, click File and choose Restore Project to open the
Open Archived Project dialog
Choose an archived project and click Open.
E-mail Archived Project
To e-mail an archived or currently open project, click File and choose E-mail to
open the e-mail dialog.
48

Easy Mode Catalyst Enterprises, Inc.
Figure 38 E-mail Dialog box
Default E-mail Client The E-mail dialog box reflects the default E-mail client installed on your
system.
Default Recipient The default recipient of your E-mail is Catalyst Enterprises customer
support, but you may change that to any valid E-mail address.
49

Catalyst Enterprises, Inc. Easy Mode
Exerciser Utilities
Dump Memory
To perform a memory dump select D
list on the menu bar. This will open the Dump Memory dialog box.
Enter a Start address and an End address or Count and click OK to perform a memory
dump as selected.
The resulting memory dump will be displayed as shown in Figure 40.
ump Memory from the Exerciser dropdown
Figure 39 Dump Memory Dialog Box
50
Figure 40 Dump Memory Result

Easy Mode Catalyst Enterprises, Inc.
Read/Modify Write
To perform read/modify write select Read/Modify Write . . . from the Exerciser
dropdown list on the menu bar. This will open the Read/Modify Write dialog
box.
Figure 41 Read/Modify Write Dialog Box
1. Enter an address the contents of which you wish to modify in the Current
Address edit box.
2. Enter the value to be written to that address in the New Value edit box.
NOTE: This feature assigns the TA700/800 to be a bus master and may be used to read or
write to any register or memory address of a target device without having to use a
programming menu.
51

Catalyst Enterprises, Inc. Easy Mode
Write/Read Verify
To perform Write Read Verify select Write/Read Verify from the Exerciser
dropdown list on the menu bar. This will open the Write/Read verify dialog box.
Figure 42 Write/Read Verify Dialog Box
1. Select the command type from the Command dropdown list, enter the Target
address, BE and either the data to be written or a previously defined data block
and a DMA size.
2. Click Compile & Run to perform the Read/Write verification.
3. To view the executable code as shown in Figure 43 click C
perform the Read/Write verification click Run.
ompile and then to
Figure 43 Write/Read Verify Compiled Program
52

Easy Mode Catalyst Enterprises, Inc.
Figure 44 Write/Read Verification Result
Address Test
To perform an Address Test select A
list on the menu bar to open the Address Test Program dialog box.
1. Enter the starting address to be tested and the number of addresses (Length) to
be tested.
2. Click the ellipses button next to the Length edit box to set the Read/Write
properties, click OK and then Compile & Run. The test results are displayed as
in Figure 47.
ddress Test from the Exerciser dropdown
Figure 45 Address Test Program Dialog Box
53

Catalyst Enterprises, Inc. Easy Mode
Figure 46 Set Read Write Compile Mode Dialog Box
54
Figure 47 Address Test Result

Easy Mode Catalyst Enterprises, Inc.
Scan Configuration Registers
To perform a configuration scan select S
Exerciser dropdown list on the menu bar.
The system will search for PCI devices on the bus and display the configuration as
shown in Figure 48. All devices on the bus are reported. To see information on
additional devices click N
ext>.
can Configuration Registers from the
You may edit all of the parameters displayed in white, if your hardware allows it. Edit
the field and then click on the “Write PCI Configuration to this Device” button.
To save configuration read all devices, find your device and save it to a file.
PCI 2.1 or PCI 2.2 Specification
Scan check may be performed to either the PCI 2.1 or PCI 2.2
specification. The selection of which specification is made on the
Software Global Settings dialog box. To set these options click
onfiguration on the main menu bar and then choose Software Settings.
C
Figure 48 Configuration Header Display Dialog Box
55

Catalyst Enterprises, Inc. Easy Mode
Scan Direction Limitation The TA700/800 may be used in any bus location including downstream
from a bridge. Since the TA700/800 can only scan subsequent buses
through a bridge in a forward direction devices above the bridge will not
be found.
Device Compliance To perform an immediate device compliance on a device, see
Compliance Device Test on page 116.
56

Easy Mode Catalyst Enterprises, Inc.
Generate Traffic and Measure Performance
Make sure that the TA700/800 is in the State Analyzer & Exerciser configuration and
is operating in the Easy Mode as shown on the Main Menu bar below.
Performance Analysis with exerciser requires you to define an exerciser program as
described in Defining an Exerciser Program on page 41.
Click the Performance Analysis Icon on the menu bar to open the Performance
Analysis dialog box as shown in Figure 49.
Figure 49 Performance Analysis with Exerciser
To perform Performance Analysis with the exerciser:
1. Define the exerciser program, such as reading or writing to a known memory
location.
2. Click the Performance Analysis Tab and set up the Performance Analysis as
described in Performance Analysis on page 34.
3. Click R
un.
57

Catalyst Enterprises, Inc. Easy Mode
Generate Traffic and Measure Statistics
Make sure that the TA700/800 is in the State Analyzer & Exerciser configuration and
is operating in the Easy Mode as shown on the Main Menu bar below.
Click the Trace Statistics Icon on the menu bar to open the Trace Statistics dialog
box as shown in Figure 50.
Figure 50 Trace Statistics With Exerciser
To obtain Trace Statistics with the exerciser:
1. Set the trace statistics options and the Trigger Point as described in Obtaining
Trace Statistics on page 36.
2. Click the Exerciser Tab and define the Exerciser Program as described in
Defining an Exerciser Program on page 41.
3. When all the parameters have been specified, click Run to capture the specified
data and perform the statistics reporting.
58

Easy Mode Catalyst Enterprises, Inc.
Timing Analysis - Synchronous
Make sure that the TA700/800 is in the State & Timing Analyzer configuration and is
operating in the Easy Mode as shown on the Main Menu bar below.
This mode of operation is not supported by the TA700PDC, TA800 or PCI-X
In this mode you may immediately detect and capture timing violations on all bus
signals. Any bus “glitch” of 1.5 ns or greater is captured as a timing violation.
You may also perform a Setup/Hold Limits search on any or all PCI bus signals by
using a convenient signal mask.
Caution: When performing measurements at 66.6MHz, make sure extender switch
if OFF.
To perform an immediate timing analysis, click the Timing Violation
Icon to open the Timing Violation Analysis dialog box.
Figure 51 Timing Violation Analysis Dialog Box
59
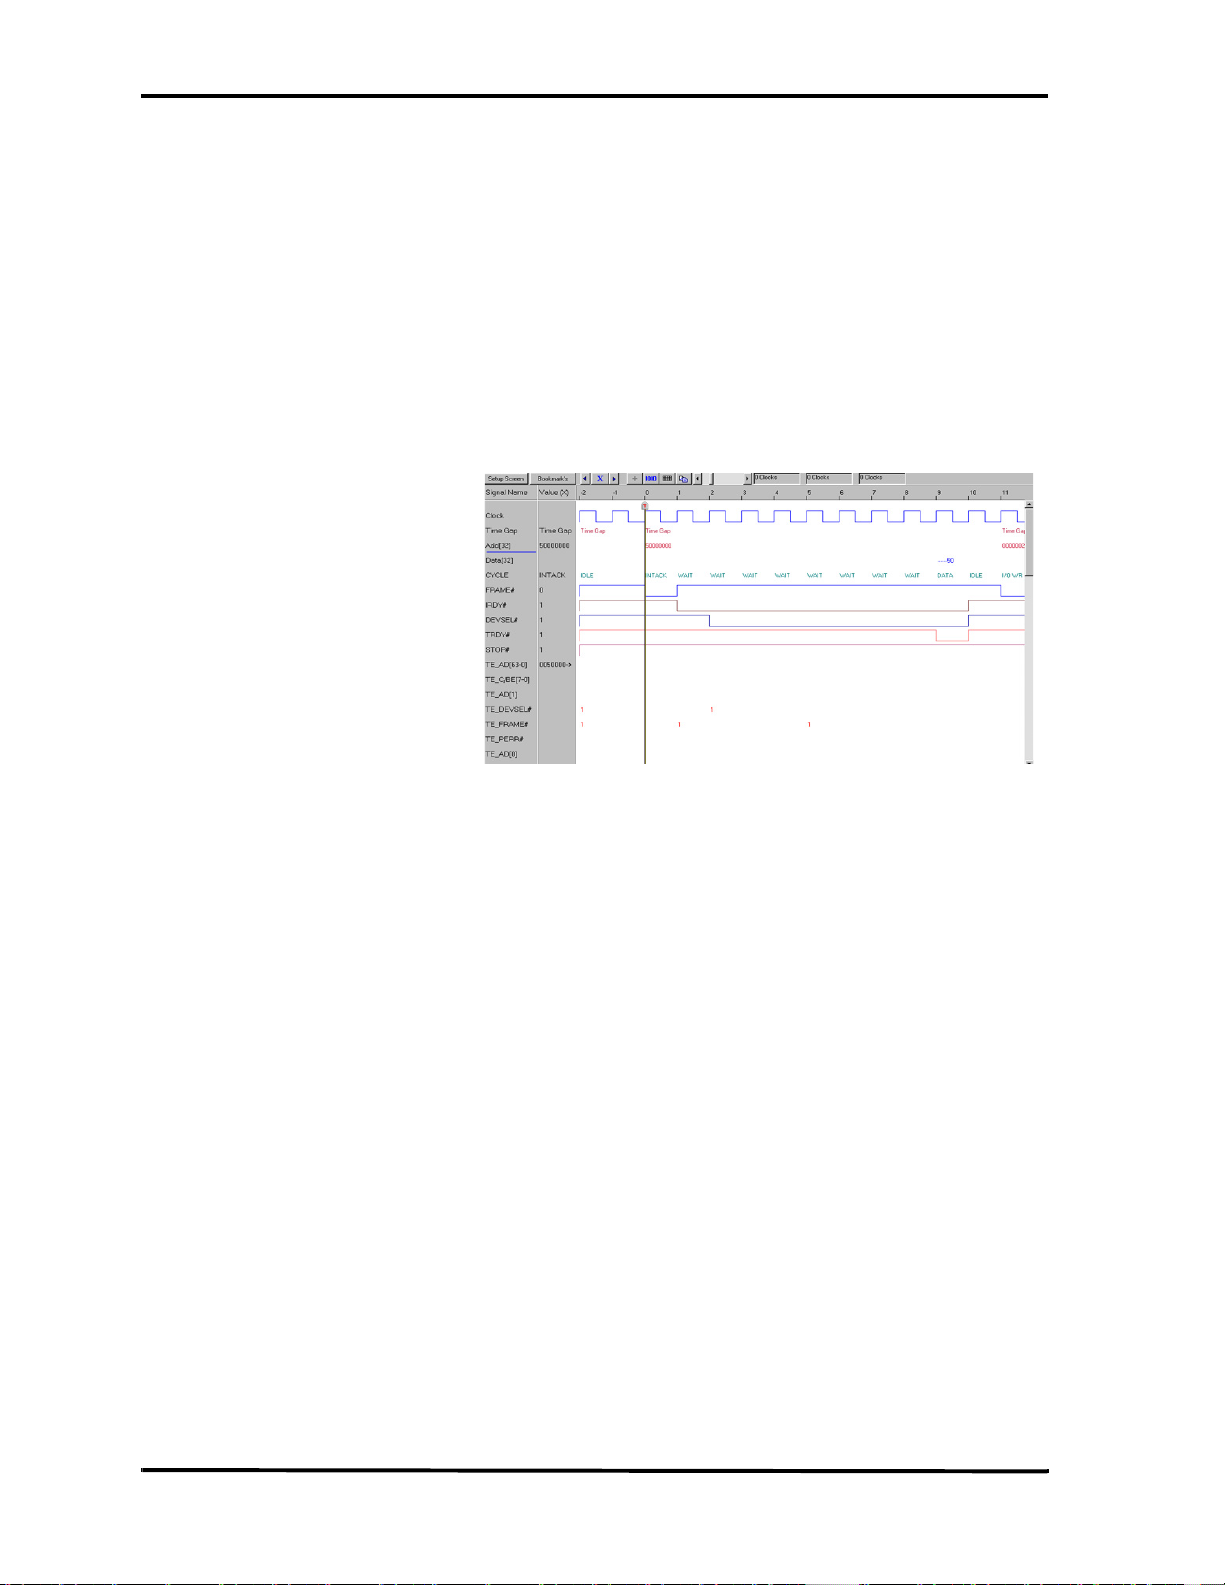
Catalyst Enterprises, Inc. Easy Mode
Timing Violation Capture
1. Set the desired data capture options such as Pre-Trigger percent, Display
Memory etc. and click Run.
The occurrence of the first timing violation will cause a trigger and open the Timing
Violation Results display as shown in Figure 52. The red signals represent a timing
violation. Bus signals are shown in a code. As an example 00000080 indicates that the
timing problem is for AD7, and 1000000C indicates the problem is for AD28, AD3 &
AD2 signals.
Figure 52 Timing Violation Results Display
60

Easy Mode Catalyst Enterprises, Inc.
Search for Setup & Hold Limits
To search for setup and hold limits click the Setup/Hold Limits search Icon to
open the Setup and Hold Limits Mask definition dialog box.
Figure 53 Setup and Hold Limits Mask Definition Dialog Box
Select the signals that you wish to ignore in the search and then click S
completion of the search the result is displayed as shown in Figure 54.
Figure 54 Setup and Hold Limits Search Result
earch. At the
61

Catalyst Enterprises, Inc. Easy Mode
Timing Analysis - Asynchronous
Not available for TA700PDC
PCI-X and TA800 asynchronous timing not supported.
Asynchronous timing analysis uses a 664 MHz independent clock to sample PCI bus
signals. This clock is asynchronous to the PCI bus clock and allows a very high
resolution sampling of the bus signals.
Caution: The TA700/800 may draw as much as 4.0 A during an asynchronous timing test, the
TA700/800 board must be configured to operate from the + 3.3V bus power. JP2
shunted between pins 2 - 3.
To perform an asynchronous timing analysis, make sure that the TA700/800 is in the PCI Async
Timing Analyzer working mode as shown on the Main Menu bar below.
Click the Green Icon on the Main Menu bar to open the Capture Data and
Trigger dialog box shown in Figure 55.
Figure 55 Asynchronous Timing Capture Data And Trigger Dialog
1. Select a Pre-Defined Trigger Point (See Table 1. on page 27) from the Trigger
On dropdown list, select the Asynchronous Option A or B and set the desired
62

Easy Mode Catalyst Enterprises, Inc.
data capture options as outlined on page 33 and click Run. Wait to capture data
and to view the result as shown in Figure 56.
Asynchronous Option A Samples PCI control signals and addresses AD[31 . . 0]
Asynchronous Option B Samples PCI control signals and addresses AD[63 . . 32]
Figure 56 Asynchronous Timing Data Capture Wave Display
63

Catalyst Enterprises, Inc. Easy Mode
64

Advanced Mode Catalyst Enterprises, Inc.
Advanced Mode
The Advanced Mode expands the analyzer capability by allowing you to program
special custom debugging projects and define complex triggering levels. Such projects
are programmed by defining event patterns for triggering and triggering sequences om
convenient Event Pattern definition and Sequencer programming menus.
The State & Timing analyzer configuration, in addition to the special programming
with event and sequencer files, also expands the Timing Violation Analysis by
allowing you to chose leading and trailing edge timing values.
With this expanded capability you may perform all of the same analysis functions as
in the Easy Mode but with much customizing.
• Setup complex triggering level to Capture data and trigger using
custom projects.
• Perform timing characterization timing violation detection.
• Capture bus activity and the device under test response under
different conditions using the exerciser.
• Do Performance Analysis on PCI bus activities.
• Measure and report Statistics on selected parameters.
Easy Mode Access As a convenience to allow you to get a quick snapshot of bus activity, the
Advanced Mode menu bar includes a Yellow button that gives you access
to an Enhanced Easy mode.
Enhanced Easy Mode Accessing the Easy mode from the Advanced mode expands the exerciser
programming capability to include program loops
65

Catalyst Enterprises, Inc. Custom Capture Data Project
Custom Capture Data Project
With the TA700/800 operating in the Advanced Mode as shown on the Main Menu
bar below, make sure that the Working Mode is PCI State Analyzer or PCI-X
Analyzer.
For a custom project you must define/program:
• A set of Events
• A sequencer Program
Example Files Your analyzer includes a set of pre-defined Project, Event and sequencer
files. You may load a complete Project or import Events and Sequencer
programs to perform pre-determined tasks. For more detail see Example
Files on page 113.
1. Click the Black button on the Main Menu bar to open the Custom Project dialog
box shown in Figure 57.
Figure 57 Custom Project Dialog Box
66

Custom Capture Data Project Catalyst Enterprises, Inc.
Defining Event Patterns
An Event pattern defines the PCI/PCI-X bus signals, including address, data and control signals to:
• Define the data capture manipulation.
• Define events that are used for Performance Analysis and Bus
Utilization measurement.
You may define up to 8 events identified as follows:
EV1 - EV8 8 Events with identical capability.
DEFAULT NAMES EV1 - EV8 are default event names that may be changed to a user defined
descriptive name for reference in the Sequencer and Performance analysis
displays.
PCI SIGNALS All PCI bus signals are included except JTAG which is used for boundary
scan testing.
EXTERNAL The TA700 & TA850 supports 16 external signals that are all sampled and
captured in memory in synch with the PCI bus signals. Not available on
the TA800.
67

Catalyst Enterprises, Inc. Custom Capture Data Project
Creating an Event Pattern
Click the Event Patterns tab to open the Event Pattern Definition dialog box.
Figure 58 PCI Event Pattern Definition Dialog Box
To enter a parameter or edit a previously entered parameter, double-click in the
appropriate data field to open a corresponding dialog box, enter the required data, and
click OK. The changes entered will be reflected in the edited data field.
Keyboard Edit You may also edit all of the data fields by using the keyboard by moving
through the available data fields using the arrow keys and pressing Enter
on the desired field to either open the associated dialog box or to change
the contents from X to 0 to 1.
Name an Event For example, to define EV1 as mem_addr, double click in the EV1 field
to open the New Event Setting dialog, enter the new event name and
click R
ename.
68
Figure 59 Naming an Event

Custom Capture Data Project Catalyst Enterprises, Inc.
Mnemonics as Events To use a pre-defined Mnemonic as an Event, double click in an Event
field, then select a Mnemonic from the Select Mnemonic window in the
New Event Setting dialog an click I
Mnemonics see “Mnemonics” on page 164.
External Signals External input signals are an extension of event definition. You may
include an external signal with an event definition by double clicking the
in the External Signal data field and entering an external signal number
between 0 and 0xFFFF.
mport. For a detailed description of
Figure 60 Invoking an External Signal
Set Default To set all of the PCI signals to the default value of don’t care, X, for any
given event EVx, position the highlighted cursor anywhere in that row
and hit the “del” key.
Set Transfer Type The transfer type selection dialog box shown in Figure 61 controls the
pre-determined signal settings and address limits based upon the XFER
type selected. For example, with A32 selected as shown, the address field
is automatically limited to 32 bits, a limited CBE dialog as shown in
Figure 62 is enabled, 64 bit settings in the PAR dialog and the R/G dialog
are grayed out. Additionally the IDSEL, FRAME#, IRDY#, DEVSEL#,
TRDY# and STOP# are pre-defined and unchangeable.
69
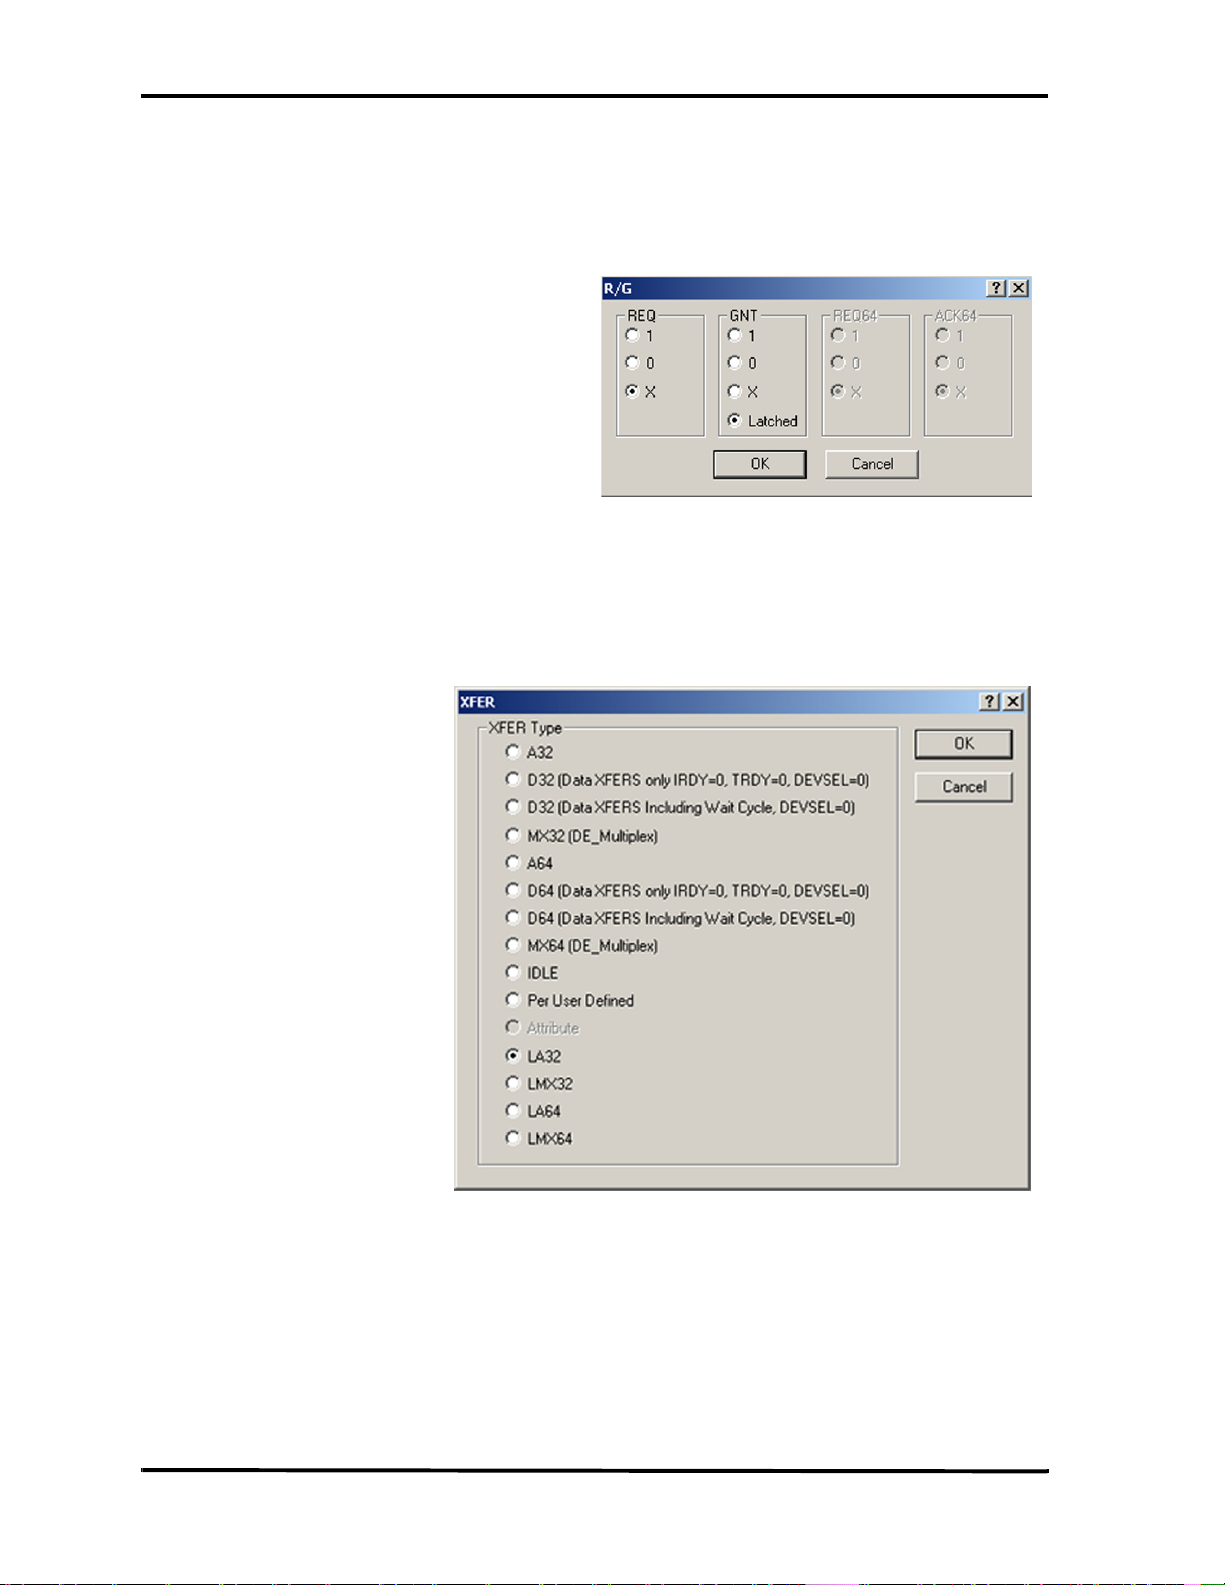
Catalyst Enterprises, Inc. Custom Capture Data Project
Limit to Current Slot You may qualify an event to be applicable to the transaction started at the
current slot only by setting the “Latched” option in the R/G dialog.
Alternate qualification A different way to qualify an event to the current slot is to double click
the XFER field and then select the desired latched transfer type LA32,
LMX32, LA64 or LMX64. These options are the same as A32, MX32
etc. except that they apply only to the slot that the TA700/800 is installed
in.
Figure 61 PCI Transfer Type Selection Dialog Box
PCI-X Attributes When operating as a PCI-X analyzer an additional transfer type choice,
Attributes, is enabled. See “PCI-X Attributes” on page 73 for
description.
70

Custom Capture Data Project Catalyst Enterprises, Inc.
Figure 62 Limited CBE Dialog Box
Figure 63 PCI Event File Setup for XFER Type A32
71

Catalyst Enterprises, Inc. Custom Capture Data Project
Set Address Range To set an address range for an event, select an address XFER type and
double click in the AD[] field to open the data entry dialog. Check the Set
Range box, enter the address range values and click OK.
Figure 64 Setting an Address Range
Figure 65 Address Range Set
72

Custom Capture Data Project Catalyst Enterprises, Inc.
PCI-X Attributes
To define an Event with Attributes double click the XFR field in the event pattern
definition dialog and choose Attributes in the PCI-X transfer type dialog box.
Figure 66 PCI-X Transfer Type Selection Dialog Box
Note that for the event chosen with Attributes as XFER, the AD[] and CBE[] fields are
merged.
Figure 67 PCI-X Event Pattern Definition Dialog Box
To Set Attributes Double click the merged AD[] and CBE[] fields to open the Set
Attributes dialog as shown in Figure 68.
73

Catalyst Enterprises, Inc. Custom Capture Data Project
Figure 68 Attribute Setting Dialog
Check the desired Attribute Type and enter the required parameters.
Abbreviations The following is a definition of the abbreviation designated fields:
With Burst or DWORD attribute type is selected:
R Reserved
NS No Snoop
RO Relaxed Ordering
When Configuration attribute type is selected:
R Reserved
When Split Completion attribute type is selected:
BCM Byte Count Modified
SCE Split Completion Error
SCM Split Completion Message
74

Custom Capture Data Project Catalyst Enterprises, Inc.
Programming the Sequencer
The sequencer is used for data capture manipulation, generating complex triggering
on bus events and starting the exerciser (if required).
The TA700/800 Sequencer includes 32 states, S0 to S31 (Limited to 16 states in
TA800). The Sequencer always starts at S0. Each state can be programmed to go to
any other state depending on the occurrences of specified patterns in that state. Jump
to any state is conditional. At any of the states S1-S30, the Sequencer may jump to
several other possible states depending on which of the specified conditions have been
met first.
A Trigger may be set in the Sequencer to occur:
1. Unconditionally at any state
2. On protocol error (PE).
3. On occurrences of Events or on Boolean expressions of Events.
4. On occurrence of a timing error. Not supported on TA700PDC (PMC) and
TA800.
5. On occurrence of an external signal input. TA800 does not support external
signals.
Unconditional trigger is mostly useful when data sampling requires more than one
Sequencer state. So the trigger may be set to occur at S1 and then continue to sample
data based on several sequences of events.
75

Catalyst Enterprises, Inc. Custom Capture Data Project
The data capture choices for every state are:
All Captures all data on every cycle
None Captures no data
EV1 - EV8 Captures data as specified for each events
!EV1-!EV8 Captures all data outside the specified address or
data range
Expression Captures data as defined by a Boolean
expression
The state transition events for every state are:
Any Unconditional
Protocol Error A Protocol Error
Timing Error Only in PCI Timing Analyzer. Not supported
on TA700PDC (PMC) and TA800.
EV1 - EV8 Predefined events
!EV1-!EV8 If not pre-defined
Expression A Boolean equation of events. e.g. EV1+!EV2
External External signals
76

Custom Capture Data Project Catalyst Enterprises, Inc.
Programming the Sequencer as Text
Figure 69 Prototype Text Programming Window
The text programming window opens with three default prototype states with all
programmable parameters displayed in blue.
Additional States You may add up to 30 additional states by clicking the Add S
Programmable parameters are displayed as blue.
Maximize Display You may maximize the programming window by clicking the F
button.
To Change Parameters
1. Position the display cursor over the parameter and double click the left mouse
button to open a list box with available choices for that parameter. See Figure
70.
2. Choose the desired parameter with the display cursor and double click the left
mouse button.
To Delete a Parameter Double click the parameter to be deleted and select delete.
Add Else If You may include Else If statements in your program by clicking the Add
E
lse If button. To remove the added Else If, double click on it and choose
<Delete> from the open list box.
Tag and Discard Tag and Discard allows the user to delete a portion of the capture memory.
Setting Tag places a marker in capture memory and setting Discard causes
the deletion of all captured data between Tag and Discard.
tate button.
ull Screen
Click the ellipses after If [Event_A occurs] ”...” and choose Tag_Event at
the point after which you expect a result. Then click the ellipses after
ElseIf [Event_B occurs] ”...” in the state where you expect the result and
choose Discard. Data will be discarded between the last Tag_Event set
and the Discard set.
77

Catalyst Enterprises, Inc. Custom Capture Data Project
Figure 70 Changing the Programmable Parameters
Optimum Workspace To avoid scrolling the display in long sequencer programs you may
minimize completed states by double clicking the symbol next to the state
to be minimized. To expand the minimized state, double click the state
name.
Figure 71 Minimized State Display
Deleting a State To delete a state, place the cursor in the text for that state and click the
D
elete button.
Pre-Trigger The Sequencer menu includes a Pre-trigger xx% function which lets you
set the percent of data to be captured before and after the triggering event.
This percentage is set by default to 50%. For more details see “Set
Trigger” on page 81
78

Custom Capture Data Project Catalyst Enterprises, Inc.
Programming the Sequencer With Menu Form
To program the sequencer with a menu form click the Form button in the
Sequencer programming window to open the form window as shown in Figure
72.
Figure 72 Sequencer Menu Form Style Programming Dialog Box
Unlimited Else If The menu form allows only 2 Else If statements but in the Te x t F orm the
user may add as many Else If statements as desired.
To View and Program As Text Click the Text button on the Sequencer Form menu.
Pre-Trigger The Sequencer menu includes a Pre-trigger xx% function which lets you
set the percent of data to be captured before and after the triggering event.
This percentage is set by default to 50%. For more details see “Set
Trigger” on page 81
The Sequencer definition dialog box shown Figure 72 displays the programmable
states as follows:
S0 The starting state, displayed always.
S1 - S31 These states can be viewed and programmed two
at a time by using the scroll bar on the right side
of the screen.
Tag and Discard Tag and Discard allows the user to delete a portion of the capture memory.
Setting Tag places a marker in capture memory and setting Discard causes
the deletion of all captured data between Tag and Discard.
Click the ellipses after If [Event_A occurs] ”...” and choose Tag _Event at the point
after which you expect a result. Then click the ellipses after ElseIf [Event_B occurs]
”...” in the state where you expect the result and choose Discard. Data will be
discarded between the last Tag_Event set and the Discard set.
79

Catalyst Enterprises, Inc. Custom Capture Data Project
Defining a Boolean Expression
To define an expression, scroll down the list of options in the dropdown list where you
wish to use an expression and click on Expression to open the Expression Editor
window as shown in Figure 73.
Figure 73 Expression Editor Window
Double click the Event Names and Operators as required to define the desired
Boolean expression and click OK.
The available Boolean operators available from left to right are: Logical Or, Logical
And, Negation, Parentheses, Backspace and Clear.
80

Custom Capture Data Project Catalyst Enterprises, Inc.
Set Trigger
Set trigger is available to be set by the user for states S1 - S31. When set trigger is
selected, a trigger is enabled, when the Sequencer enters that state for the first time.
The amount of data to be captured before and after the trigger may be set as a
percentage of pre-trigger, between 0% and 100%. This may be done by positioning the
pre-trigger slider to the desired percentage. This feature allows the evaluation of bus
activity leading up to and after the triggering event. The operation of the pre trigger in
the data memory is conceptually illustrated in Figure 74
Pre-Trigger Data: The capture of the specified percentage of the data prior to the triggering
event cannot be guaranteed and may in some cases be 0. This can occur in
cases where the triggering event occurs before the required number pretrigger event data can be stored. In these cases the data display will show
fewer than the specified data points prior to the triggering event.
Figure 74 Pre-Trigger Example, 20% Pre-Trigger
81

Catalyst Enterprises, Inc. Custom Capture Data Project
Exercise and Capture Data Project
With the TA700/800 operating in the Advanced Mode as shown on the Main Menu
bar below, make sure that the Working Mode is PCI Analyzer/Exerciser or PCI-X
Analyzer/Exerciser.
Click the Black button on the Main Menu bar to open the Exercise and Capture
dialog box shown in Figure 75.
Figure 75 Exercise and Capture Data Project Dialog Box
For an exercise and capture data project you must program/define:
• An exerciser program
• A set of Events (See “Defining Event Patterns” on page 67)
• A sequencer program (See “Programming the Sequencer” on
page 75)
The exerciser will run whenever a the sequencer enters a state for which it is set to
start the exerciser.
82

Custom Capture Data Project Catalyst Enterprises, Inc.
Programming the Exerciser
Make sure that the Exerciser Program Tab is selected on the Custom Project Dialog
box as shown in Figure 76.
Figure 76 PCI Exerciser Program Dialog Box
To program the Exerciser:
1. The Exerciser Program dialog box opens as default with one active program
line. You may add additional active program lines by clicking A
PCI-X Exerciser The PCI-X Exerciser operates similarly to that for PCI, but with some
notable differences.
dd.
See page 85 for PCI-X differences.
Figure 77 PCI-X Exerciser Program Dialog Box
83

Catalyst Enterprises, Inc. Custom Capture Data Project
2. Choose the number of lines to be added and the Line Type, Master or Target, in
the number of lines dialog.
Figure 78 Number of Lines Dialog Box
Insert Program Line To insert a new program line between previously added active program
lines, position the cursor below the line where you want to insert the new
line and click the Insert button.
3. Select a command such as MEM Write from the command dropdown list for
each active program line. Commands differ PCI vs. PCI-X.
Available PCI Exerciser Commands:
Interrupt ACK
Special Cycle
I/O Read
I/O Write
MEM Read
MEM Write
CONFIG Read
CONFIG Write
MEM Read Multiple
MEM Read Line
MW & Invalidate
Data Transfer
DAC : I/O Read
DAC : I/O Write
DAC : MEM Read
DAC : MEM Write
DAC : MEM Read Multi
DAC : MEM Read Line
DAC : MW & Invalidate
Data Transfer TA700/800 to Transfer data as Target without termination
and complete as expected.
84

Custom Capture Data Project Catalyst Enterprises, Inc.
Disconnect with data TA700/800 to Generate Disconnect as Target at the last
data phase.
Retry Generates Retry as Target.
Disconnect without data Generate disconnect after the last data phase.
Target Abort with data Generate Target Abort at the last data phase.
Target Abort without data Generate Target Abort after the last data phase.
Available PCI-X Exerciser Commands:
Interrupt ACK
Special Cycle
I/O Read
I/O Write
MEM Read DWORD
MEM Write
Memory Read Block (Alias)
Memory Write Block (Alias)
Configuration Read
Configuration Write
Split Completion
Memory Read Block
Memory Write Block
Dual Address I/O Read
Dual address I/O Write
Dual Address Mem Read DWORD
Dual Address Mem Write
Dual Address Mem Read Block (Alias)
Dual Address Mem Write Block (Alias)
Dual Address Mem Read Block
Dual Address Mem Write Block
Target
Target Single Data Phase
Target Disconnect at Next ADB
Target R etry
Target A bort
Target Split Response
NOP
4. Enter a TARGET ADDRESS that you would like to write to and enter the
DATA or select a Data Block to be written to that address.
32/64 bit Addressing To set 32 or 64 bit addressing mode click the enabled ellipses button at the
end of the active program line Base Address Setting dialog box shown in
Figure 80. Addressing selection applies on a line to line basis.
85

Catalyst Enterprises, Inc. Custom Capture Data Project
Figure 79 Setting 32/64 bit Addressing Mode
TA700/800 Address as Target When a Target command is chosen from the available COMMAND
list, clicking the ellipses button opens the Base Address Setting Dialog
Box.
Figure 80 Target Base Address Setting
DEVSEL# Speed Assertion Specifies DEVSEL# response speed when operating as a target.
Fast (Not supported at this time) target responds within 1 clock period.
Medium target responds within 2 clock periods. (Supported @ 33MHz
only)
Slow target responds within 3 clock periods.
86
 Loading...