

Page 1
TA660A / TA660CA
PCI / CPCI
BUS Analyzer-Exerciser
User’s Manual
Revision 4.0, Compatible with Software Revision 4.X
Catalyst
Enterprises, Inc.
1439 Torrington Court
San Jose, CA. 95120
Phone 408.268.4145
Fax 408.268.8280
http://www.catalyst-ent.com
©2000
Page 2

TA660 User's Manual Catalyst Enterprises, Inc
ii
Page 3

TA660 User's Manual Catalyst Enterprises, Inc
Table of Contents
INTRODUCTION .........................................................................................................................................1
WHAT'S IN THIS MANUAL.........................................................................................................................1
OVERVIEW....................................................................................................................................................1
OPTIONAL AUXILIARY PCI CONNECTOR............................................................................................2
TA660 ANALYZER CARD...........................................................................................................................3
STATUS LED FUNCTION DESCRIPTION...............................................................................................3
RECEIVING AND INSPECTING YOUR ANALYZER....................................................................4
UNPACKING YOUR ANALYZER.................................................................................................................4
INSTALLING YOUR ANALYZER .........................................................................................................5
HARDWARE INSTALLATION.......................................................................................................................5
SOFTWARE INSTALLATION.........................................................................................................................6
TA660 OVERVIEW......................................................................................................................................7
TA660 CONFIGURATIONS.......................................................................................................................... 7
STATE ANALYZER ONLY.......................................................................................................................7
STATE & TIMING ANALYZER................................................................................................................7
STATE ANALYZER & EXERCISER..........................................................................................................7
PERFORMANCE ANALYSIS.....................................................................................................................8
STATISTICAL ANALYSIS.........................................................................................................................8
SPECIAL CAPABILITIES........................................................................................................................... 9
LAUNCHING YOUR TA660 ...................................................................................................................11
OPERATING IN SIMULATION MODE ........................................................................................................12
LPT PORT SETTING...................................................................................................................................13
CONFIGURATION MENU......................................................................................................................14
SYSTEM CLOCK.........................................................................................................................................15
ENABLING V OLTAGE CHECK...................................................................................................................15
ANALYZER WINDOW COLORS.................................................................................................................16
G LOBAL SOFTWARE SETTINGS................................................................................................................17
PROTOCOL ERRORS...................................................................................................................................17
EXTERNAL SIGNAL NAMES...................................................................................................................... 17
EXTERNAL TRIGGER SETTINGS................................................................................................................17
EASY MODE................................................................................................................................................19
INSTANT DATA CAPTURE & TRIGGER ....................................................................................................19
iii
Page 4

TA660 User's Manual Catalyst Enterprises, Inc
SELECTIVE DATA CAPTURE................................................................................................................22
DATA CAPTURE & TRIGGER EXAMPLES...........................................................................................23
DATA CAPTURE OPTIONS....................................................................................................................24
PERFORMANCE ANALYSIS........................................................................................................................25
TRACE S TATISTICS....................................................................................................................................27
OBTAINING TRACE STATISTICS..........................................................................................................27
TRACE ANALYSIS OPTIONS.................................................................................................................31
EXERCISE AND CAPTURE..........................................................................................................................33
DEFINING AN EXERCISER PROGRAM..................................................................................................33
CREATING A DATA BLOCK FILE.........................................................................................................35
EDITING FILES IN ASCII...........................................................................................................................37
EXERCISER UTILITIES ............................................................................................................................... 38
DUMP MEMORY....................................................................................................................................38
READ/MODIFY WRITE .........................................................................................................................38
WRITE READ VERIFY...........................................................................................................................39
ADDRESS TEST ...................................................................................................................................... 40
TA660 AS MEMORY.............................................................................................................................42
SCAN CONFIGURATION REGISTERS....................................................................................................44
G ENERATE TRAFFIC AND MEASURE PERFORMANCE ........................................................................... 46
G ENERATE TRAFFIC AND MEASURE TRACE STATISTICS.....................................................................47
PERFORM TIMING ANALYSIS...................................................................................................................49
TIMING VIOLATION CAPTURE ............................................................................................................49
SEARCH FOR SETUP & HOLD LIMITS................................................................................................. 51
ADVANCED MODE...................................................................................................................................53
CAPTURE DATA PROJECT..................................................................................................................53
PROGRAMMING THE EXERCISER.............................................................................................................55
SETTING EXERCISER OPTIONS............................................................................................................58
SET INTERRUPTS................................................................................................................................... 60
DEFINING EVENT PATTERNS.................................................................................................................... 61
DEFINING AN EVENT PATTERN........................................................................................................... 62
PROGRAMMING THE SEQUENCER............................................................................................................ 64
DEFINING A BOOLEAN EXPRESSION................................................................................................... 66
PROGRAMMING THE SEQUENCER AS TEXT ....................................................................................... 67
SET TRIGGER.............................................................................................................................................. 69
V IRTUAL ADDRESS TRIGGER................................................................................................................... 70
STATE & TIMING ANALYZER..................................................................................................................71
iv
Page 5

TA660 User's Manual Catalyst Enterprises, Inc
SEARCH FOR SETUP & HOLD LIMITS................................................................................................. 73
PERFORMANCE ANALYSIS ................................................................................................................75
REAL-TIME ANALYSIS...............................................................................................................................75
PERFORMING A PRE-DEFINED ANALYSIS...........................................................................................76
CREATING A NEW ANALYSIS PROJECT .............................................................................................76
SETTING ANALYSIS OPTIONS:..............................................................................................................77
DEFINING EVENT PATTERNS ................................................................................................................78
WRITING AND EDITING ANALYSIS EQUATIONS....................................................................................79
PROGRAMMING THE EXERCISER........................................................................................................... 80
SAVED PERFORMANCE ANALYSIS REVIEW .............................................................................81
TRACE S TATISTICS....................................................................................................................................82
CREATING A NEW TRACE PROJECT ...................................................................................................82
SETTING TRACE OPTIONS.................................................................................................................... 83
DEFINING EVENT PATTERNS ................................................................................................................84
PROGRAMMING THE EXERCISER........................................................................................................... 84
DEFINING EQUATIONS .........................................................................................................................84
RUNNING THE TRACE PROJECT ............................................................................................................84
EXAMPLE FILES .......................................................................................................................................85
COMPLIANCE DEVICE TEST.............................................................................................................87
EXECUTING A COMPLIANCE DEVICE TEST ............................................................................................88
SETTING THE COMPLIANCE TEST O PTIONS.......................................................................................89
EXECUTING A SAVED CONFIGURATION.................................................................................................90
EXAMPLE TEST ..........................................................................................................................................90
PROGRAM DEVICE.....................................................................................................................................94
DISPLAY MANIPULATION...................................................................................................................95
ADDING AND REMOVING SIGNALS FOR DISPLAY.................................................................................97
LATENCY REPORT .....................................................................................................................................99
USING THE CURSORS.................................................................................................................................99
JUMP WITHIN DATA DISPLAY...............................................................................................................101
USING ZOOM IN THE WAVE WINDOW ..................................................................................................102
ZOOM O PTIONS...................................................................................................................................102
USER DEFINED DISPLAY CONFIGURATION..........................................................................................102
SEARCH......................................................................................................................................................103
CONVERTING CAPTURED DATA .................................................................................................. 109
CONVERT TO TEXT .................................................................................................................................109
v
Page 6

TA660 User's Manual Catalyst Enterprises, Inc
CONVERT TO EXCEL............................................................................................................................110
CAPTURE A SCREEN................................................................................................................................112
TOOLS TO ANALYZE CAPTURED DATA................................................................................... 113
COMPARE ..................................................................................................................................................113
FILTERING CAPTURED DATA.................................................................................................................115
SPECIAL SETUPS...................................................................................................................................118
PROTOCOL ERRORS.................................................................................................................................118
NUMBER OF ERRORS...........................................................................................................................121
PROTOCOL ERROR TYPE....................................................................................................................121
MNEMONICS.............................................................................................................................................123
DISPLAYING PATTERNS MATCHING MNEMONICS.........................................................................124
EXTERNAL SIGNALS/TRIGGER...............................................................................................................125
MACROS....................................................................................................................................................128
SYSTEM ADMINISTRATION............................................................................................................131
MULTIPLE USERS.....................................................................................................................................131
TROUBLESHOOTING.......................................................................................................................... 132
HARDWARE NOT FOUND....................................................................................................................132
NO TRIGGER .........................................................................................................................................132
APPENDIX A TA660 C-API............................................................................................................... 133
APPENDIX B ............................................................................................................................................ 145
TA660CA COMPACTPCI CARD...................................................................................................145
STATUS LED FUNCTION DESCRIPTION................................................................................................146
POWER JUMPER CONFIGURATION.........................................................................................................146
vi
Page 7

TA660 User's Manual Catalyst Enterprises, Inc
Caution:
Introduction
What's In This Manual
This manual describes the installation and operation of your Catalyst
PCI Bus Analyzer / Exerciser. Examples of some typical applications
are included.
The terms TA660 and PCI analyzer thereafter are used for referring to
both PCI and CompactPCI analyzers (see Appendix B).
Overview
Your TA660 PCI Bus Analyzer is a powerful and versatile analysis
tool that will permit you to debug and characterize PCI designs
operating on any PCI system architecture . To perform analysis you
simply install the analyzer card in a PCI slot in the target machine and
connect it to the host computers Bi-directional parallel port using the
25 pin parallel cable, provided with your analyzer. A typical setup
may include a Host and a Target systems interconnected via the
parallel port with the analyzer card installed in the Target Machine
and a Windows based host running the analysis software.
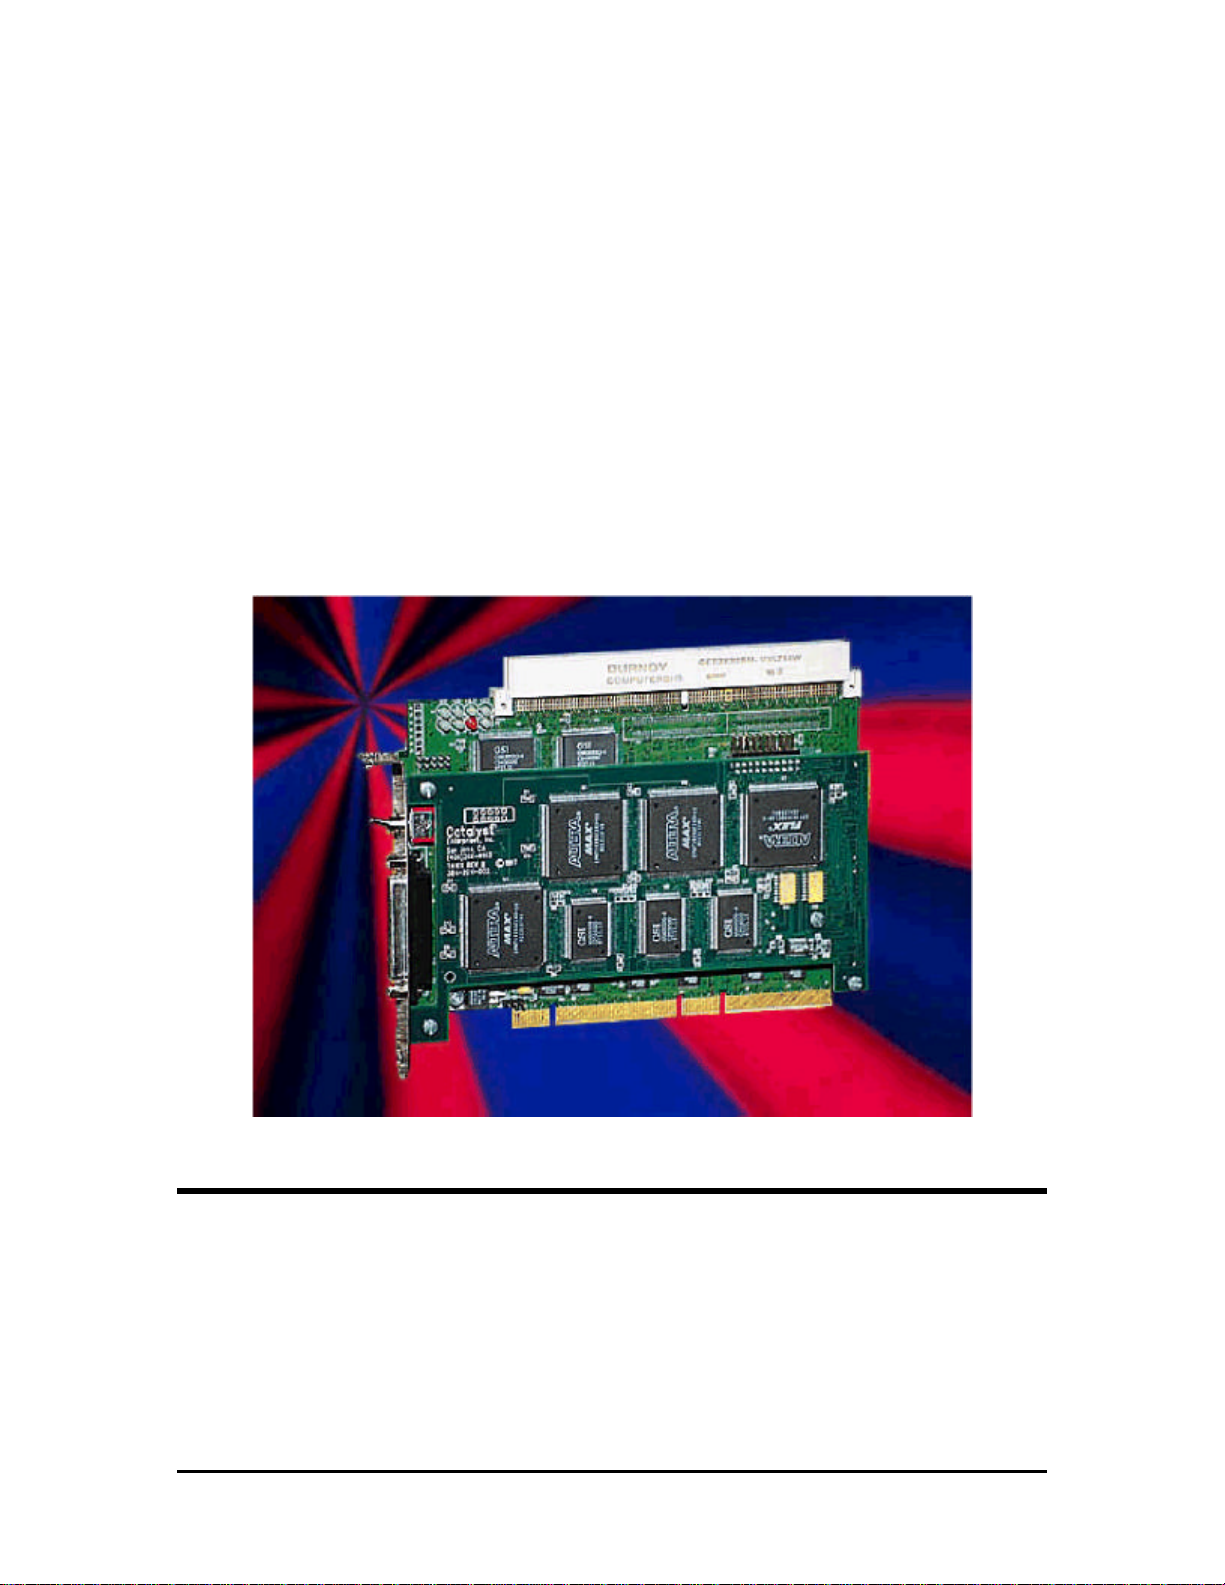
If your target machine operates under Windows it may also act as the
host. In this case, the analyzer card and the analysis software reside in
the same machine and require you to connect the analyzer card to the
Host high-speed parallel port using the 25 pin parallel cable. See
Figure 1.
Operating the analyzer in this mode, however, may impact
Performance Analysis measurement accuracy since the
analyzer software runs in the same system space as the
application software. For a precise Performance Analysis it
is recommended that you use a separate Host system.
1
Page 8
TA660 User's Manual Catalyst Enterprises, Inc
Figure 1 Target and Host Operating in the Same Machine
Optional Auxiliary PCI connector
The PCI Bus Analyzer Card incorporates a PCI connector on top
which extends the system PCI bus and allows other PCI cards to be
plugged into the analyzer for development or production testing. This
feature allows the analyzer to monitor the same point-to-point signals
such as REQ# & GNT# on the card under test without requiring any
external connections. In this mode, both the analyzer and the card
under test require only one PCI slot. Special design methodology has
been incorporated to minimize any reflections, delay or cross-talk.
This feature only exists on the TA660A PCI analyzer and not on the
Compact PCI version.
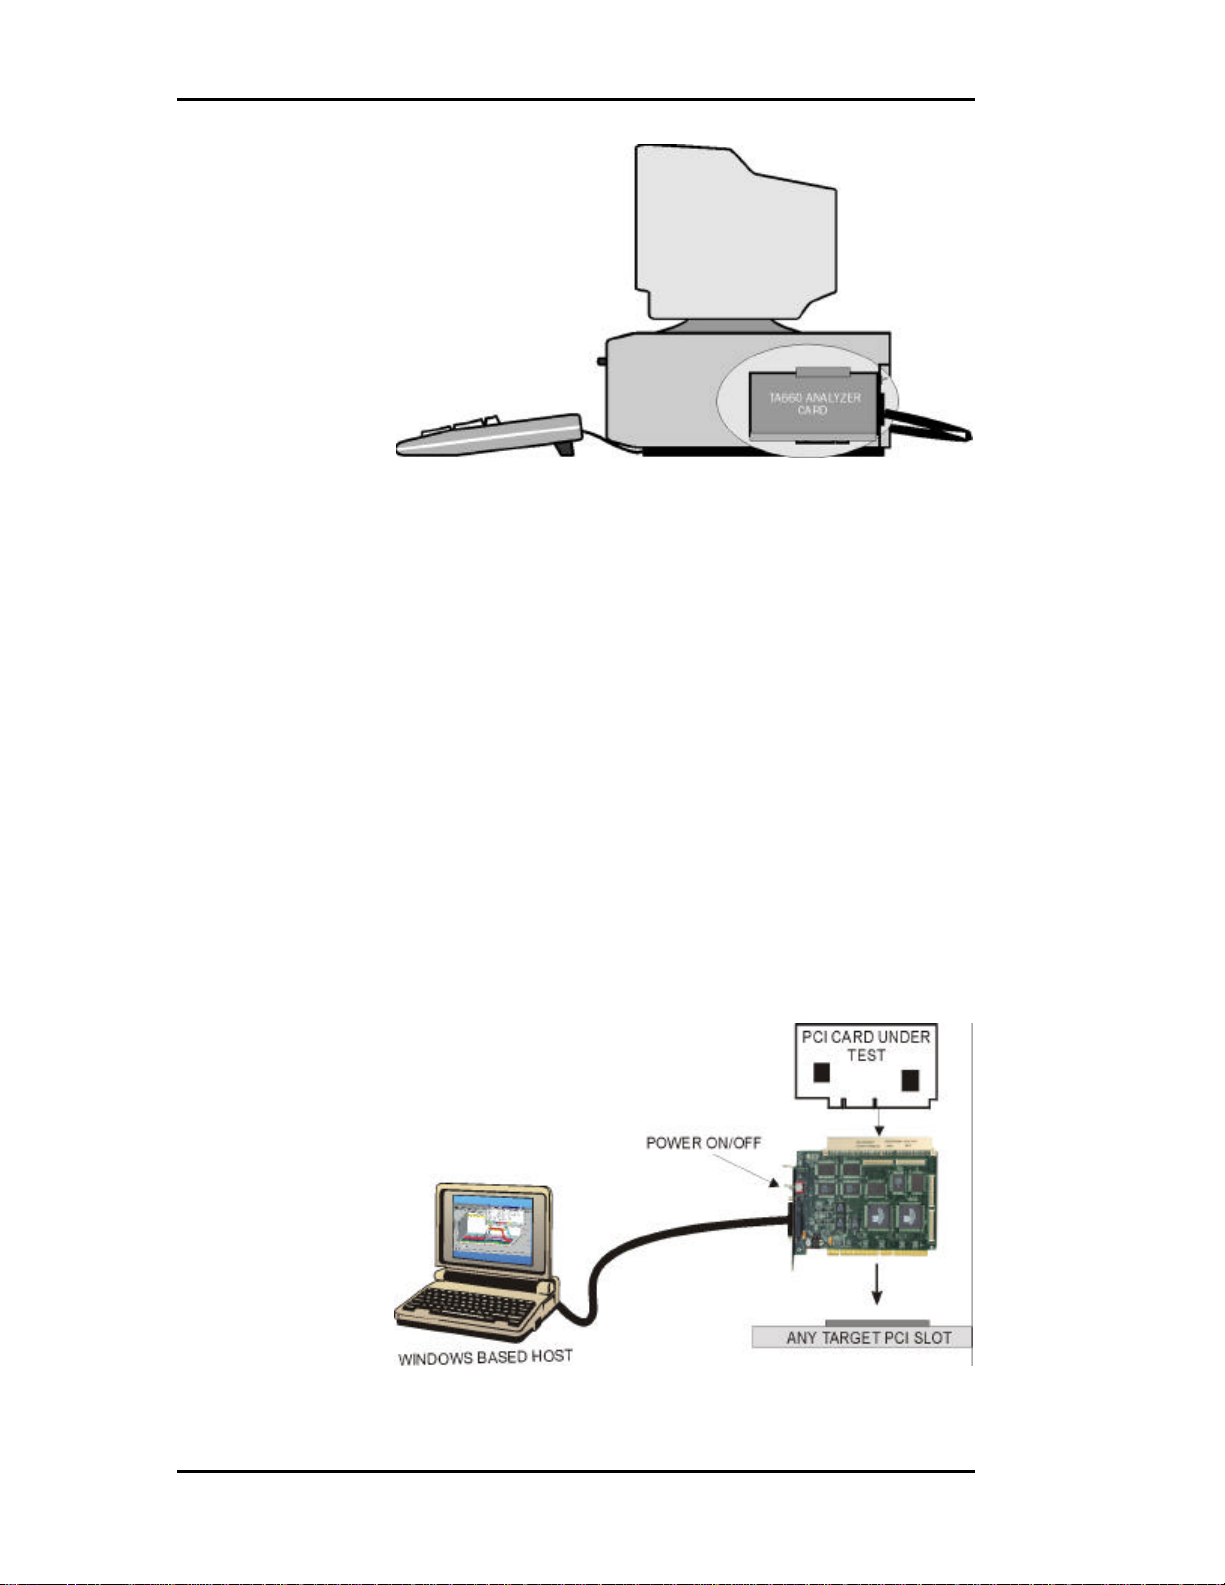
Figure 2 illustrates such a test setup. An On-Off switch on the
analyzer card enables and disables the power and signal connections
between the system and the card under test allowing rapid cycling of
the test cards without shutting off the system power.
Figure 2 Testing a PCI Bus Card
2
Page 9
TA660 User's Manual Catalyst Enterprises, Inc
TA660 Analyzer Card
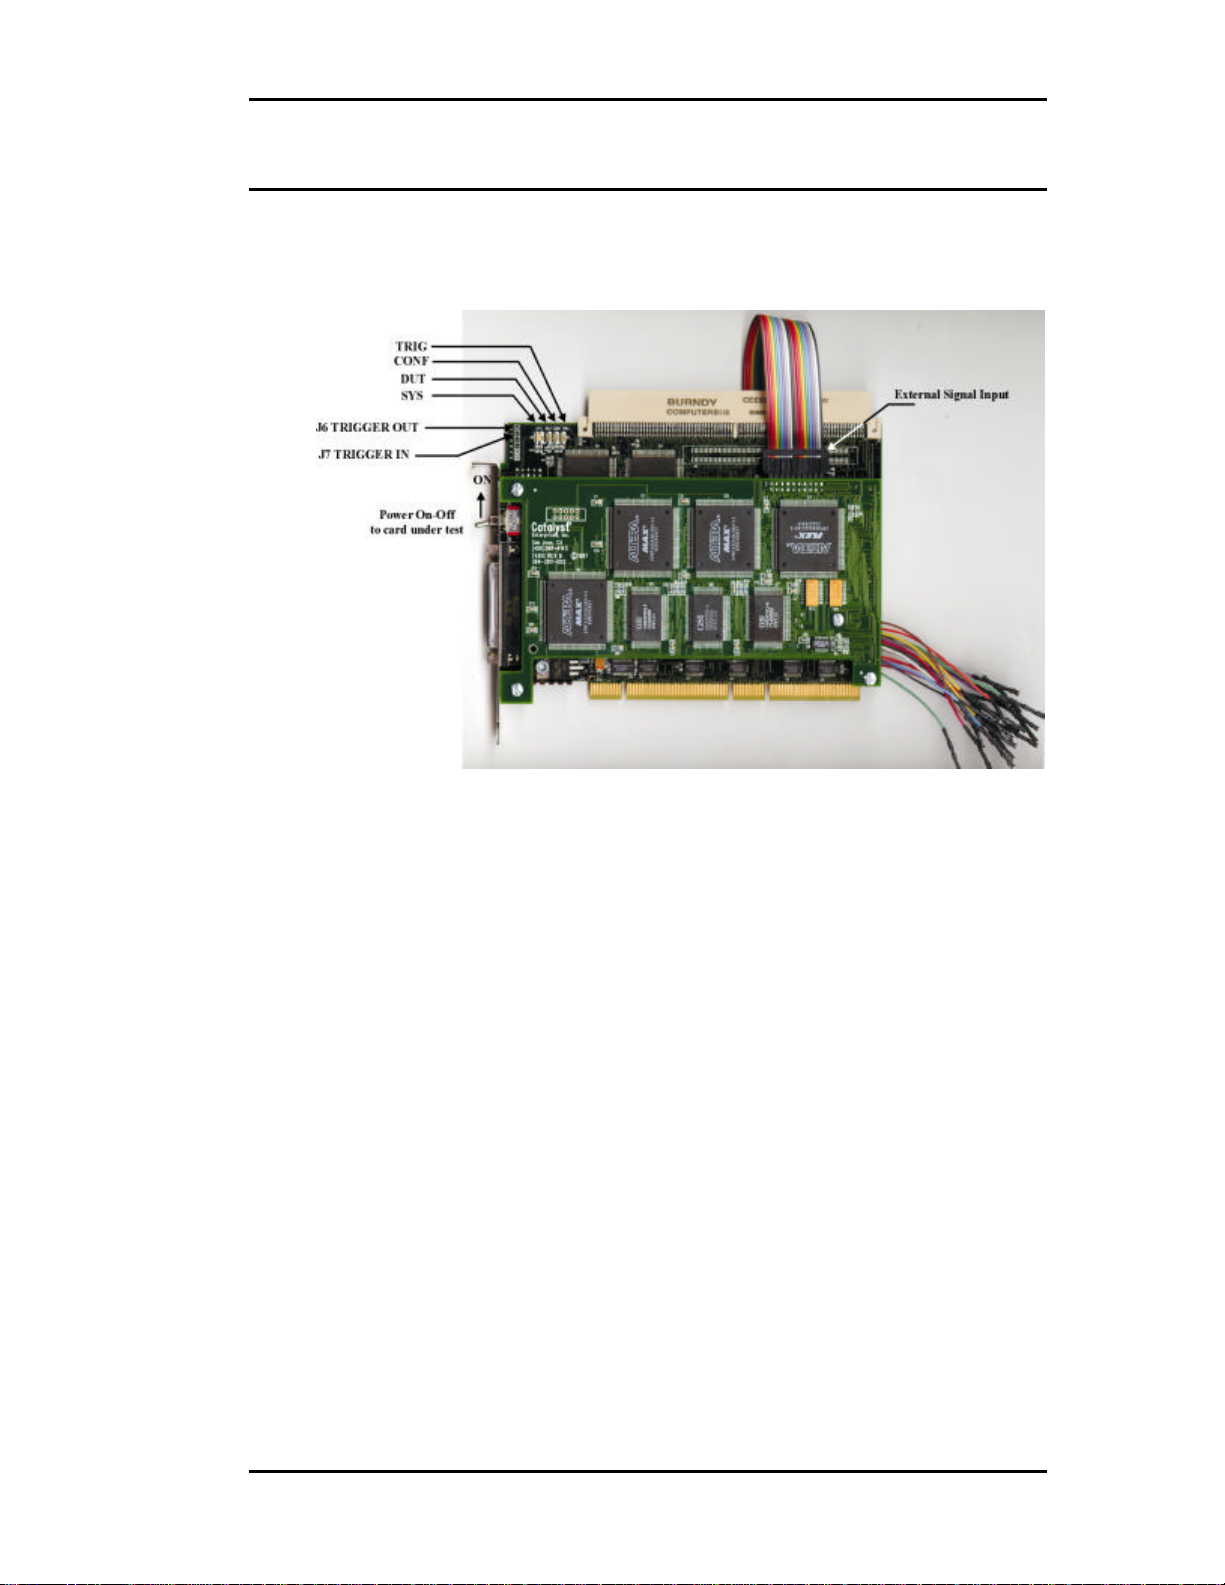
Figure 3 shows a TA660 PCI Analyzer card identifying Status LED
locations, external trigger input and output connections and the
external signal input connector with the supplied cable attached.
Figure 3 TA660 PCI Analyzer Card
Status LED Function Description
SYS When green Indicates if the system voltages are within 5%
of their value. If any of +5V, +3.3V, +12V drop more than
5% the SYS LED turns red. SYS LED also comes up red as
a test on power on and then if the voltages are okay it turns
green once the software is executed. To enable voltages for
sensing see on page 15.
DUT Indicates that the voltage to the DUT is on. In this case the
user may not remove or insert any card in to the top
connector of the TA660.
CONF Indicates that TA660 has been recognized and configured
by the software, therefore the parallel port link is working.
TRIG Indicates that the analyzer has met the trigger condition and
is awaiting for the defined post-trigger data to be captured.
For TA660CA Compact PCI analyzer/exerciser LED status information see APPENDIX
B TA660CA CompactPCI Card.
3
Page 10

TA660 User's Manual Catalyst Enterprises, Inc
Receiving and Inspecting Your
Analyzer
Your analyzer includes the following components:
Analyzer card identified in the packing list
Software on CDROM
Bi-directional parallel port host interface card
DB-25 Cable, parallel port connection
User’s Manual
Cable for external signals
Unpacking Your Analyzer
Inspect the received shipping container for any visible damage. In the
event of visible damage, retain all shipping materials until all of the
contents per the packing list have been checked for completeness and
absence of damage. Unpack the shipping container and account for
each item on the packing list. Visually inspect each item for damage.
In the event of damage notify the shipper and Catalyst Enterprises.
4
Page 11

TA660 User's Manual Catalyst Enterprises, Inc
Installing Your Analyzer
Hardware Installation
1. Make sure that the Target Machine is powered down.
2. Remove the case from your machine in accordance with the
instructions supplied for it.
3. Install the Analyzer card in any available PCI slot and secure the
mounting bracket to the chassis with the mounting screw.
Warning: Make sure to take precautions to avoid static electricity
discharge damage to the Analyzer Card by using a
grounding strap or touching a grounded metal surface just
prior to handling the analyzer card. Avoid touching any
components and handle card by the edges only.
4. Interconnect the Analyzer DB-25 connector to the Host system Bi-
directional parallel port using the provided DB-25 pin cable.
Host and Target Same The Analyzer may be used in a configuration such that the
Host and Target are the same machine.
Bi-Directional Port The Analyzer requires that The Host parallel port support
Bi-directional data transfers. See LPT Port Setting for
verifying that your parallel port supports and/or is set to a
Bi-directional mode. If the parallel port on your Host
system does not support Bi-directional data transfers you
must then install the parallel port card supplied with your
analyzer in a spare ISA slot and connect to it.
Port Configuration The parallel port card supplied with your analyzer is pre
configured for LPT2 (H278). If the Host system is using this
address for its printer port, you must then change the jumper
configuration on the ISA parallel card to H378 (LPT1).
5
Page 12
TA660 User's Manual Catalyst Enterprises, Inc
Software Installation
On systems operating under Windows 95, 98, NT or 2000:
1. Insert the CD ROM.
2. The installation will automatically start the setup unless the auto Run
is turned off, in that case select the CDROM from “My Computer”
and click on setup.
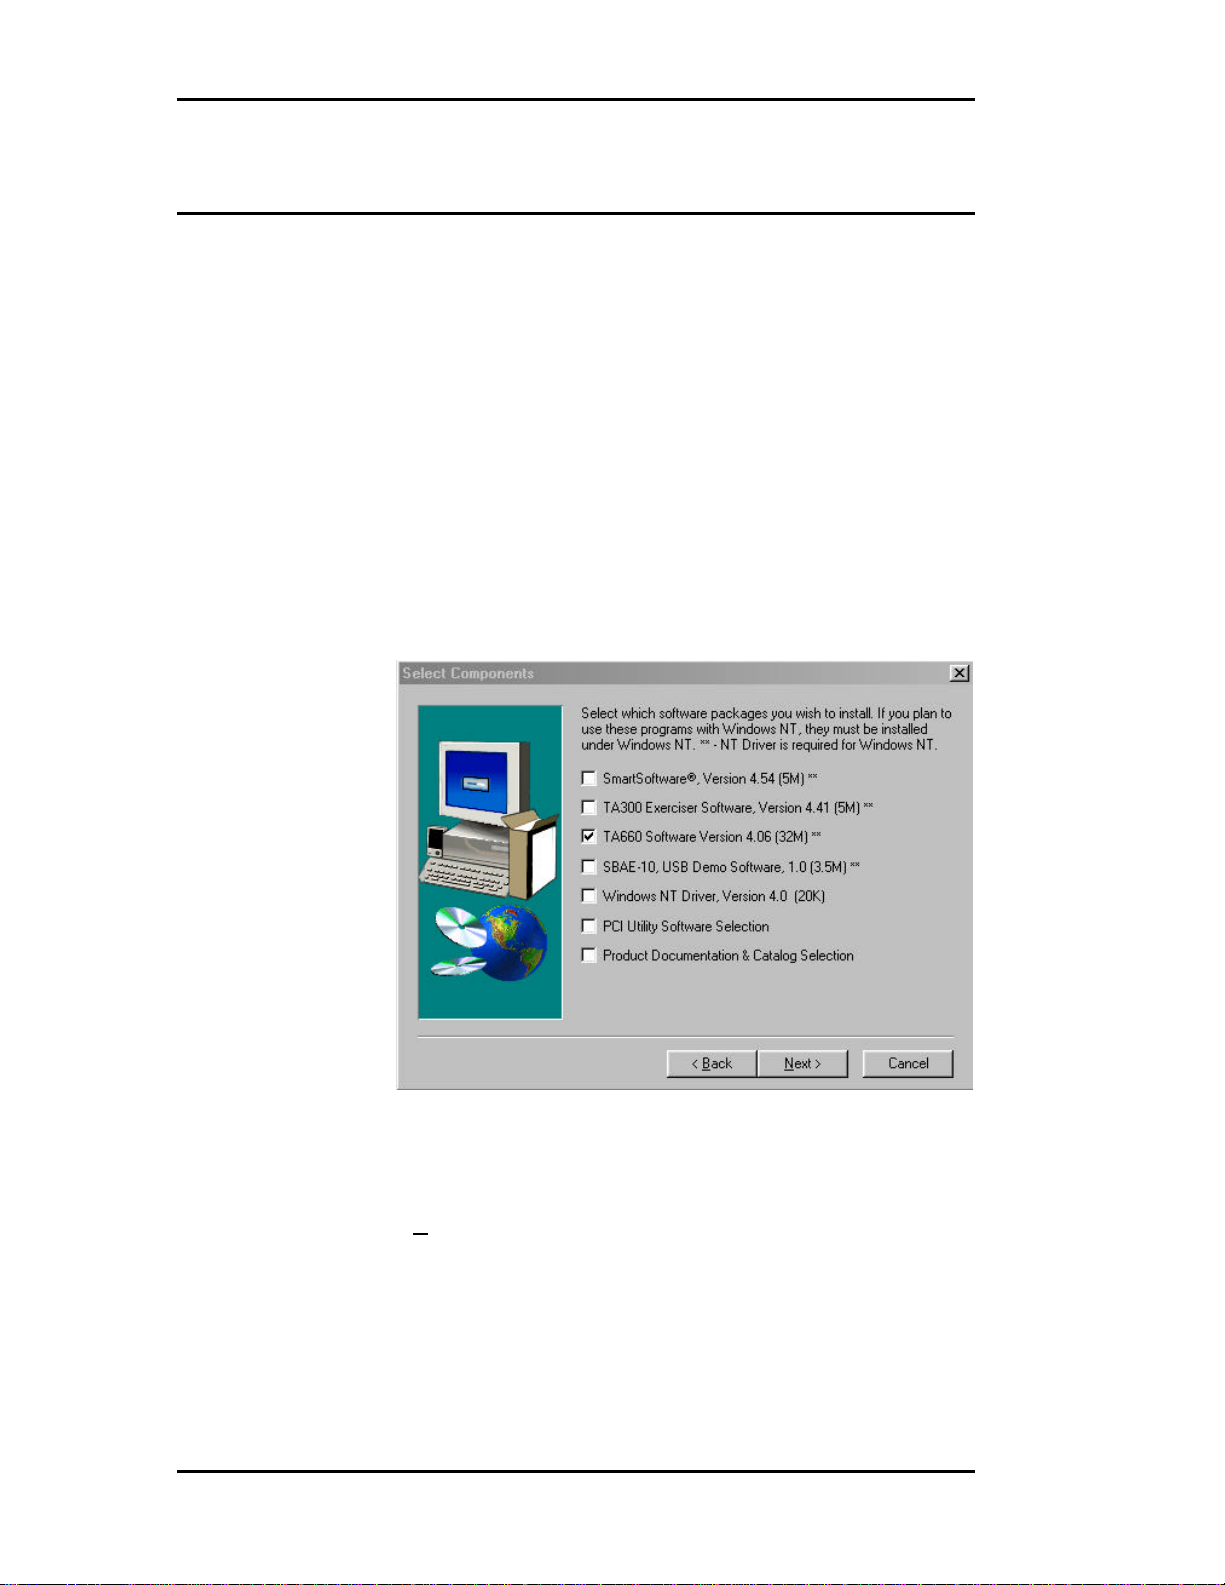
3. After the warning for closing all other programs and before starting
the installation, the Install Component selection window will open as
shown in Figure 4.
Windows NT If you are operating under Windows NT, be sure to select
the NT driver for installation. If the host system operating
software is not Windows NT, this selection will be
automatically Deselected.
Figure 4 Install Component Selection
4. Select the desired components for installation.
5. Click Next to complete the installation.
NT driver Restart If you installed the NT driver you must restart your
computer before you can use your analyzer software.
Error Message If you get an error message during installation of the NT
driver consult your system administrator. Your system may
6
Page 13

TA660 User's Manual Catalyst Enterprises, Inc
be setup to only allow an administrator level to copy such
driver files.
TA660 Overview
The TA660 PCI Bus Analyzer/Exerciser has a convenient, easy to use
Easy Mode that allows you to perform 95% of your PCI bus data
capture & trigger without any programming.
An Advanced Mode offers you a powerful programming capability
for complex triggering.
The TA660 incorporates an Exerciser that generates bus transactions
to exercise the bus as a master or target while allowing you to monitor
and capture the resulting performance.
A Timing Analyzer capability is also included that allows the user to
capture bus timing violations.
Additionally, the TA660 includes Performance Analysis for realtime and statistical measurement as well as comprehensive Device
Compliance Test capabilities.
TA660 Configurations
The TA660 may be operated in one of 3 configurations, each offering
a convenient Easy Mode which requires no programming:
State Analyzer Only
To perform a variety of data capture and trigger and bus analysis.
State & Timing Analyzer
To perform timing analysis for possible violation and to characterize
Setup & Hold limits on all or selected signals.
State Analyzer & Exerciser
To perform Device compliance testing, characterize a PCI device by
emulating various bus cycles & terminations, injecting errors and
generating traffics to measure the PCI bus response. The exerciser
may be used as a bus master to test and debug new designs.
The operating configuration is selectable on the Main Menu Bar.
7
Page 14

TA660 User's Manual Catalyst Enterprises, Inc
Performance Analysis
The TA660 provides continuous Real-Time performance analysis that
operates with Pre-defined or User-defined analysis files. On-board
dual ported FIFOs interface between the counters and the host system
for transferring the measured data in real-time without ever having to
stop the counters. This feature provides a very complete and accurate
event count of up to 533 MB/Sec. An implementation of twelve
counters with up to 32 bits allows a virtually unlimited count of
events.
TA660A includes 12 counters, 8 of which may be programmed to
monitor the primary bus activities and the other 4 may used for
connection to point-to-point signals or the secondary bus.
Your TA660 includes complete setups to measure the most typical
parameters as well as giving you the ability to create your own setup.
Real time Performance Analysis allows you to count actual data
transfers for any agent or agents matching user specified address,
measure and report bus utilization efficiencies, throughput, latencies
and retries, on-the-fly.
You may use real time Performance Analysis simultaneously with the
exerciser to generate traffic on the bus and measure performance of
the target.
Performance Analysis results are presented in a Twelve-color display
that you may customize with your own color preferences and may be
recorded in graphical format for later review or demonstration.
Measurement intervals are selectable from 500 µsec to 10 minutes.
Statistical Analysis
Statistical Analysis is implemented by capturing data in memory and
then performing software post processing.
Statistical Analysis measures and reports on Min, Max and Average
occurrences for several different parameters such as Latencies, Retry,
Data Transfers, Command Utilization, Bus Utilization and various
Target Terminations.
The PCI Analyzer (Allowing the Master card to be plugged into
the expansion slot on top) can also measure latencies from request
to the 1st data transfer including all of the retries in between.
The data capture & trigger for post processing may be initiated per
user defined events on the bus, therefore yielding a very repetitive and
consistent result.
8
Page 15

TA660 User's Manual Catalyst Enterprises, Inc
The parameters measured may be selected for graphical display on the
screen and may be saved as graphical or list files for later review.
In the exerciser mode the TA660 can initiate data transfer to a target
while the trace statistics measures the latency response of the target.
Special Capabilities
Several other features are included in the TA660 such as Protocol
Errors, Mnemonics, Device Compliance Testing. Please refer to the
appropriate sections for each of these features.
9
Page 16

TA660 User's Manual Catalyst Enterprises, Inc
10
Page 17
TA660 User's Manual Catalyst Enterprises, Inc
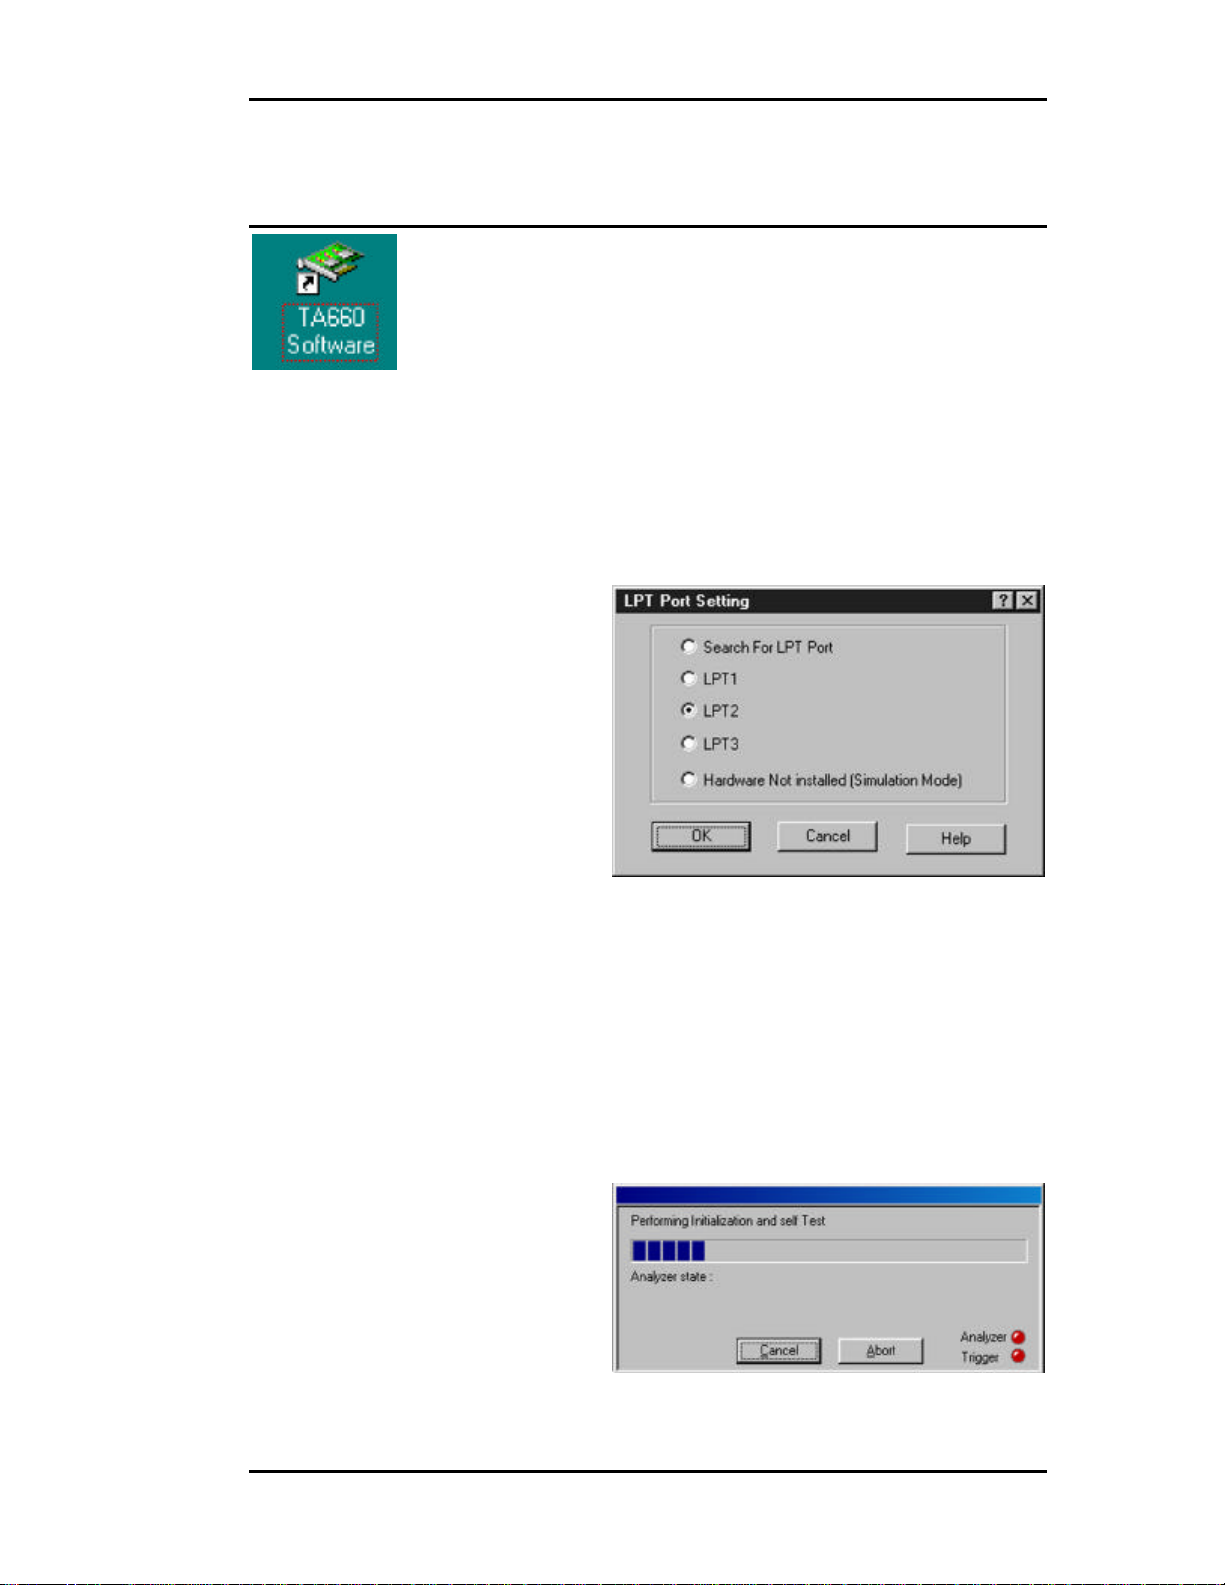
Launching Your TA660
Double click the TA660 Icon in the Program Manager Window.
The TA660 software is pre-configured at the factory to look for LPT2
as the selected port for the analyzer. If the software finds this port
connected to the analyzer program will launch immediately otherwise
the software will ask you to specify which LPT port is connected to
the hardware.
If you have connected your hardware to a different port, select the
that port and click OK to launch the analyzer program.
Find LPT Port If you are not sure which LPT port your hardware is
connected to, click “Search For LPT Port” and let the
software automatically locate the LPT port that is connected
to the hardware. Once the correct LPT port is detected the
analyzer program will launch, perform initialization,
perform a self test and display the analyzer tool bar as
shown in Figure 5
11
Page 18
TA660 User's Manual Catalyst Enterprises, Inc
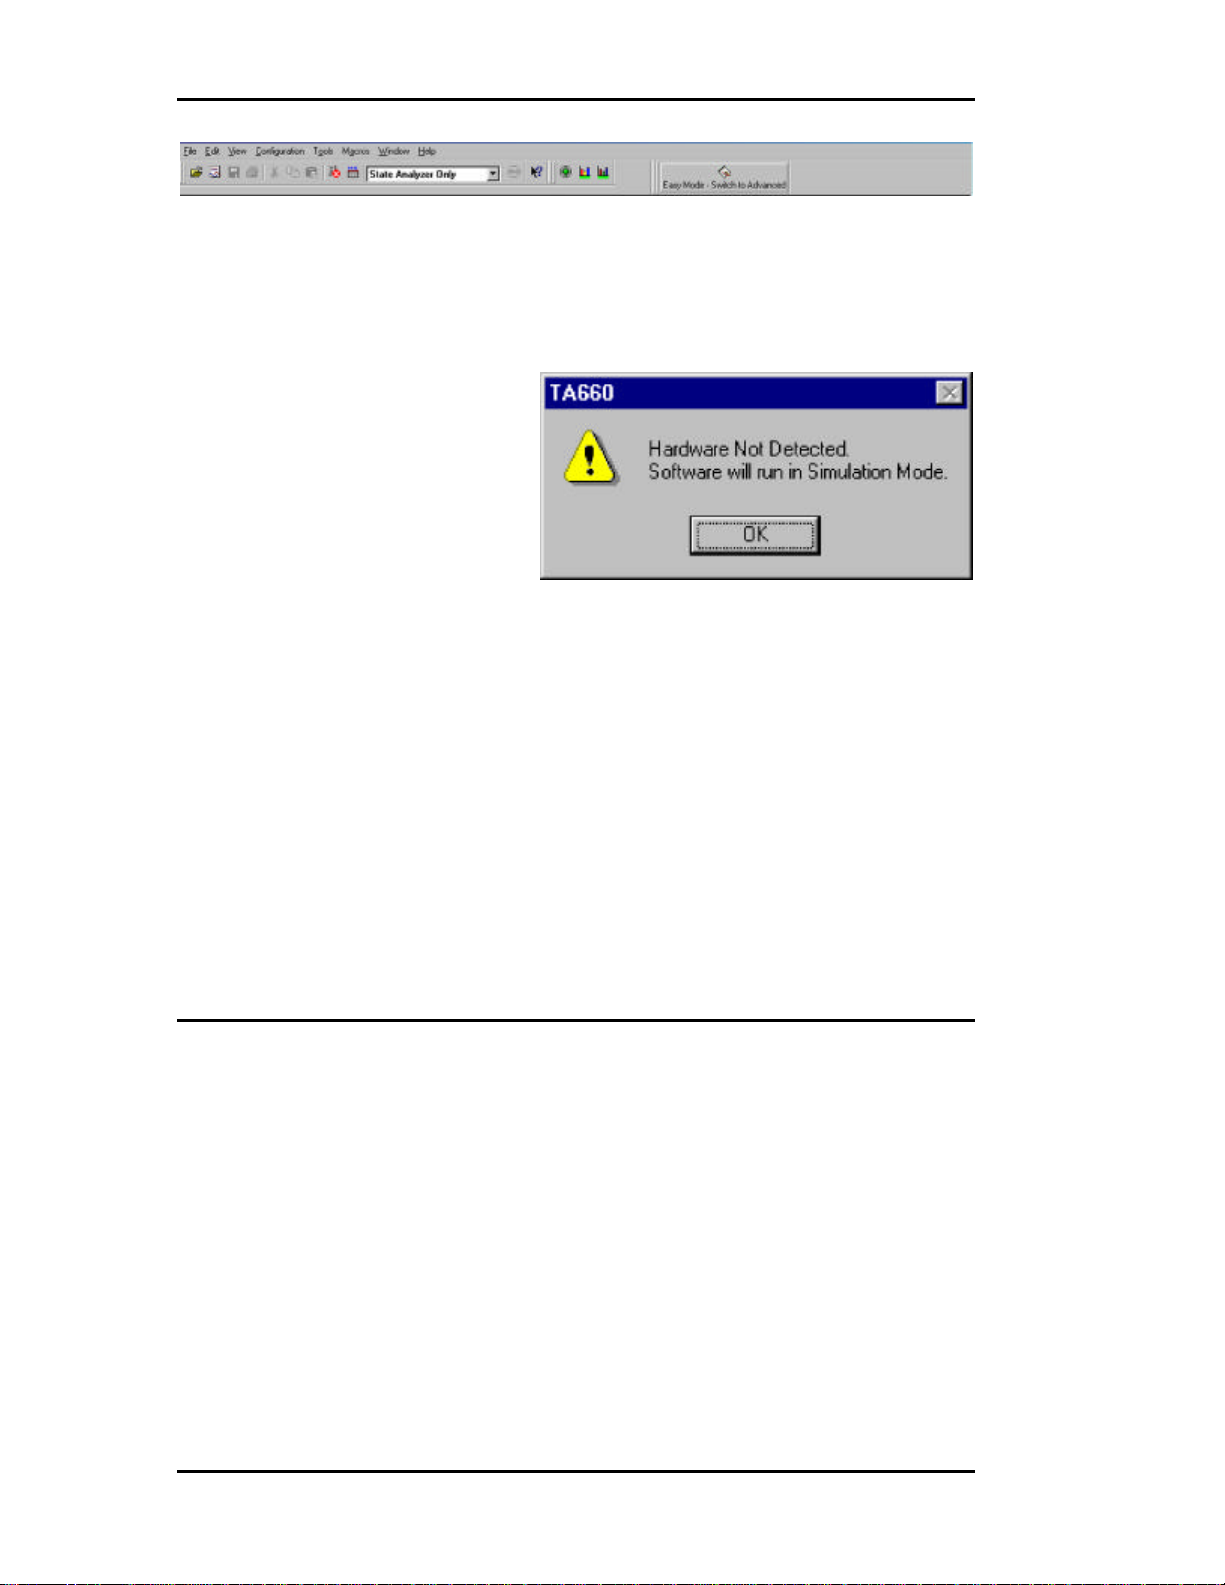
Figure 5 Analyzer Tool Bar
In the event that no LPT port connected to the hardware is found, the
software will display the Hardware Not Detected message. To
configure an LPT port see LPT Port Setting on page 13
Simulation Mode Clicking OK in this dialog box will launch the analyzer
software to operate in the simulation mode.
LPT Port Problems If your analyzer hardware is connected to an LPT port and
there is power to the analyzer, but you are still getting the
message Hardware Not Detected then see the section on
LPT Port setting below.
Bi-directional Port The host system LPT port must be a Bi-directional port. See
LPT Port Setting below.
Launch Problems In the event that you experience difficulties in launching
your software, please see section on LPT Port Setting.
Operating in Simulation Mode
Your system will operate in the Simulation Mode as default if the
hardware is not detected, however, you may operate in Simulation
Mode directly without installing the analyzer hardware. To operate
without hardware, select Hardware Not Installed (Simulation
Mode) in the LPT Port Setting dialog box and click OK.
The Analyzer program will launch and display the tool bar as shown
in Figure 5, but with the limitation that the analyzer will display
previously captured bus data.
Limitations The Simulation mode lets you try all of the available
functions, but keep in mind that the system is not
capturing any real data and is displaying pre-captured
results.
12
Page 19

TA660 User's Manual Catalyst Enterprises, Inc
LPT Port Setting
Your system parallel port may not necessarily be set to a Bidirectional mode even if your system supports this mode.
Port not Configured If you continue to get a Hardware Not Detected even if
you have set the required LPT port, please check your
system setting for your parallel port.
To set the parallel port :
1. Restart your computer and during boot, press F1 key to enter Setup
(some systems may use a different key than F1, please consult your
system manual).
2. Once in setup select the Advanced, then Peripheral Configuration
and then Parallel Port Mode.
3. Select the Parallel Port to be configured. If your system supports Bi-
directional mode you must have choices for at least one of the
following:
Bi-directional, ECP or EPP, preferably Bi-directional first
then ECP and last EPP.
Note that Standard or Compatible modes are not a Bidirectional mode.
4. When finished with the configuration press ESC to exit setup and
save the new configuration.
Supplied Card If your system does not support a Bi-directional mode of
operation or if you like to keep the system port for printer
then you may use the Bi-directional parallel card provided
with your analyzer.
13
Page 20
TA660 User's Manual Catalyst Enterprises, Inc
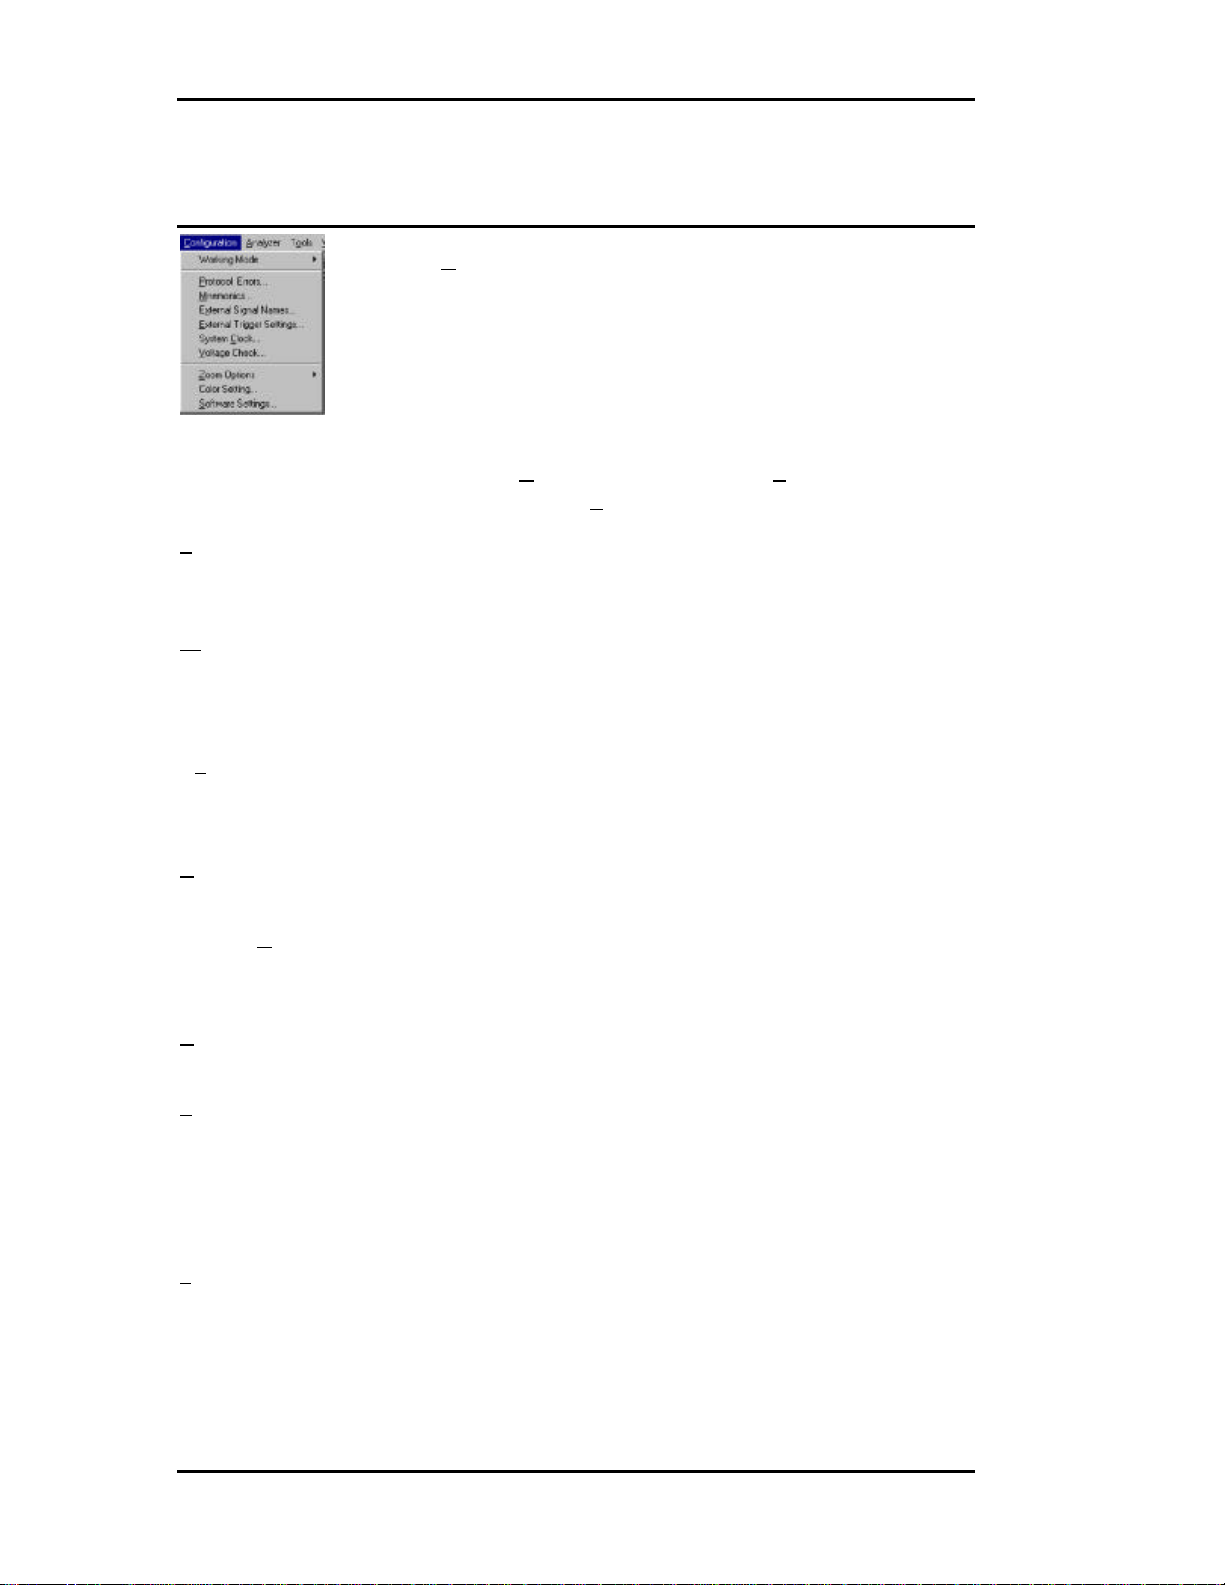
Configuration Menu
Click Configuration on the main menu bar to display the
various configuration options.
Working Mode Allows you to select the analyzer configuration. The choices
are, State Analyzer Only, State & Timing Analyzer or
State Analyzer & Exerciser.
Protocol Errors Used to configure a Protocol Errors mask for use in
triggering on protocol errors. See Protocol Errors on page
118
Mnemonics Used to define Mnemonics. Mnemonics may be used to
display user assigned names to specific patterns, in search a
pattern in the display or filter data patterns from a display.
See Mnemonics on page 123.
External Signal Names Allows users to assign specific names to external signals for
display for display purposes. See External Signals on
page 126.
External Signal/Trigger Settings Allows you to configure external input and
output triggers. See External Signals/Trigger on page 125.
System Clock Only used to set the system frequency for TA660 boards.
TA660A and TA660CA boards automatically detects the
system frequency. See System Clock on page 15.
Voltage Check Used to select or deselect the voltages to be monitored for
tolerance compliance. See on page 15.
Zoom Options Used to select zoom about X or Y cursor or between X and
Y cursor when displaying a Wave data capture window. See
Using Zoom in the Wave Window on page 102
Color Setting Used to set custom color combinations for the Analyzer
Performance Analysis Window.
Software Settings Used to set global software user preferences. See Global
Software Settings on page 17.
14
Page 21
TA660 User's Manual Catalyst Enterprises, Inc
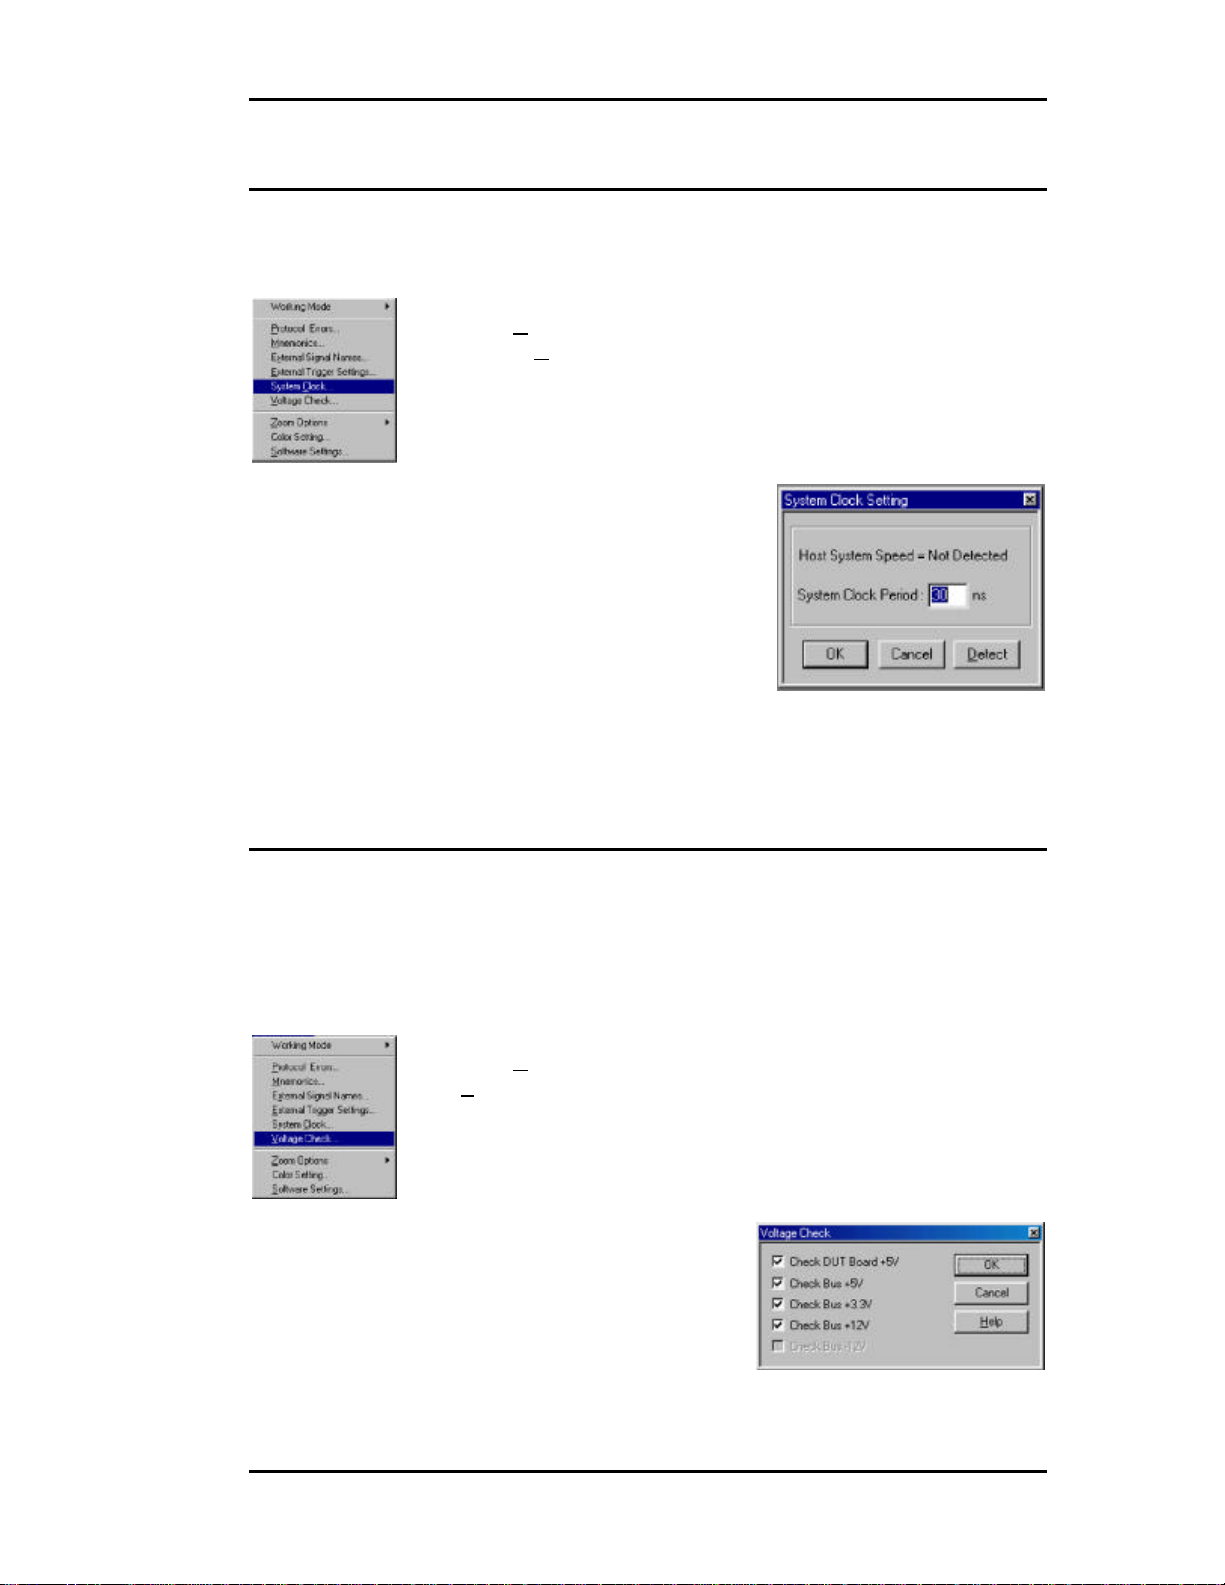
System Clock
When the TA660A software is first executed it automatically detects
the system clock frequency and updates the screen. For earlier
models, TA660 boards, you must set the frequency as follows:
Click Configuration on the main menu bar and then select
System Clock . . . to open the System Clock Setting dialog box
and type in the frequency.
Display Function Only The system clock setting only set the time tag resolution in
the captured data display windows.
Enabling Voltage Check
The TA660 is capable of monitoring the critical voltages on your PCI
bus. TA660 monitors a 5% drop in voltage for selected voltages and
turns the SYS status LED from green to red if any of the voltages
drop by 5%.
To select voltages for monitoring:
Click Configuration on the main menu bar and then select
Voltage Check . . . to open the Voltage Check dialog box.
15
Figure 6 Voltage Check Dialog Box
Page 22
TA660 User's Manual Catalyst Enterprises, Inc
Check the boxes next to the voltages that you wish to be monitored
and click OK.
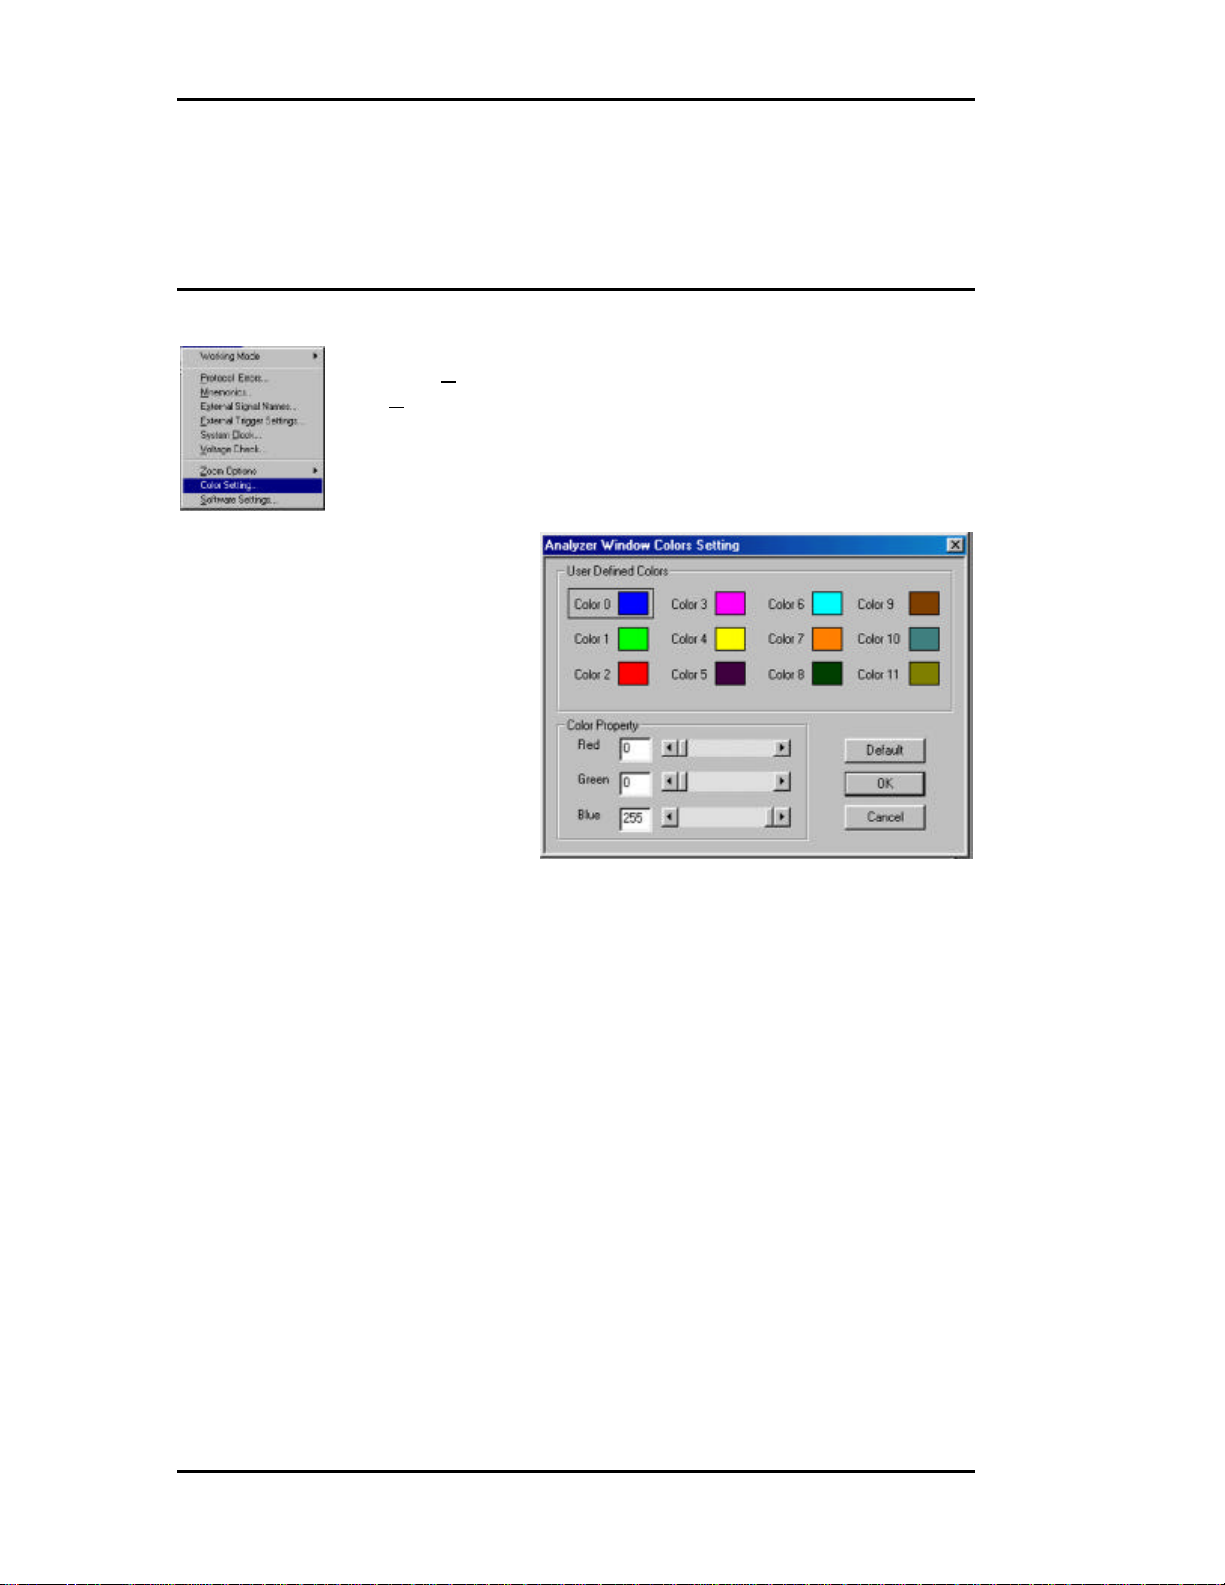
Analyzer Window Colors
Click Configuration on the main menu bar and then select
Color Setting . . . to open the Analyzer Window colors setting
dialog box.
This color setting is used for the graph display in Performance
Analysis and Trace Statistics Analysis.
16
Page 23
TA660 User's Manual Catalyst Enterprises, Inc
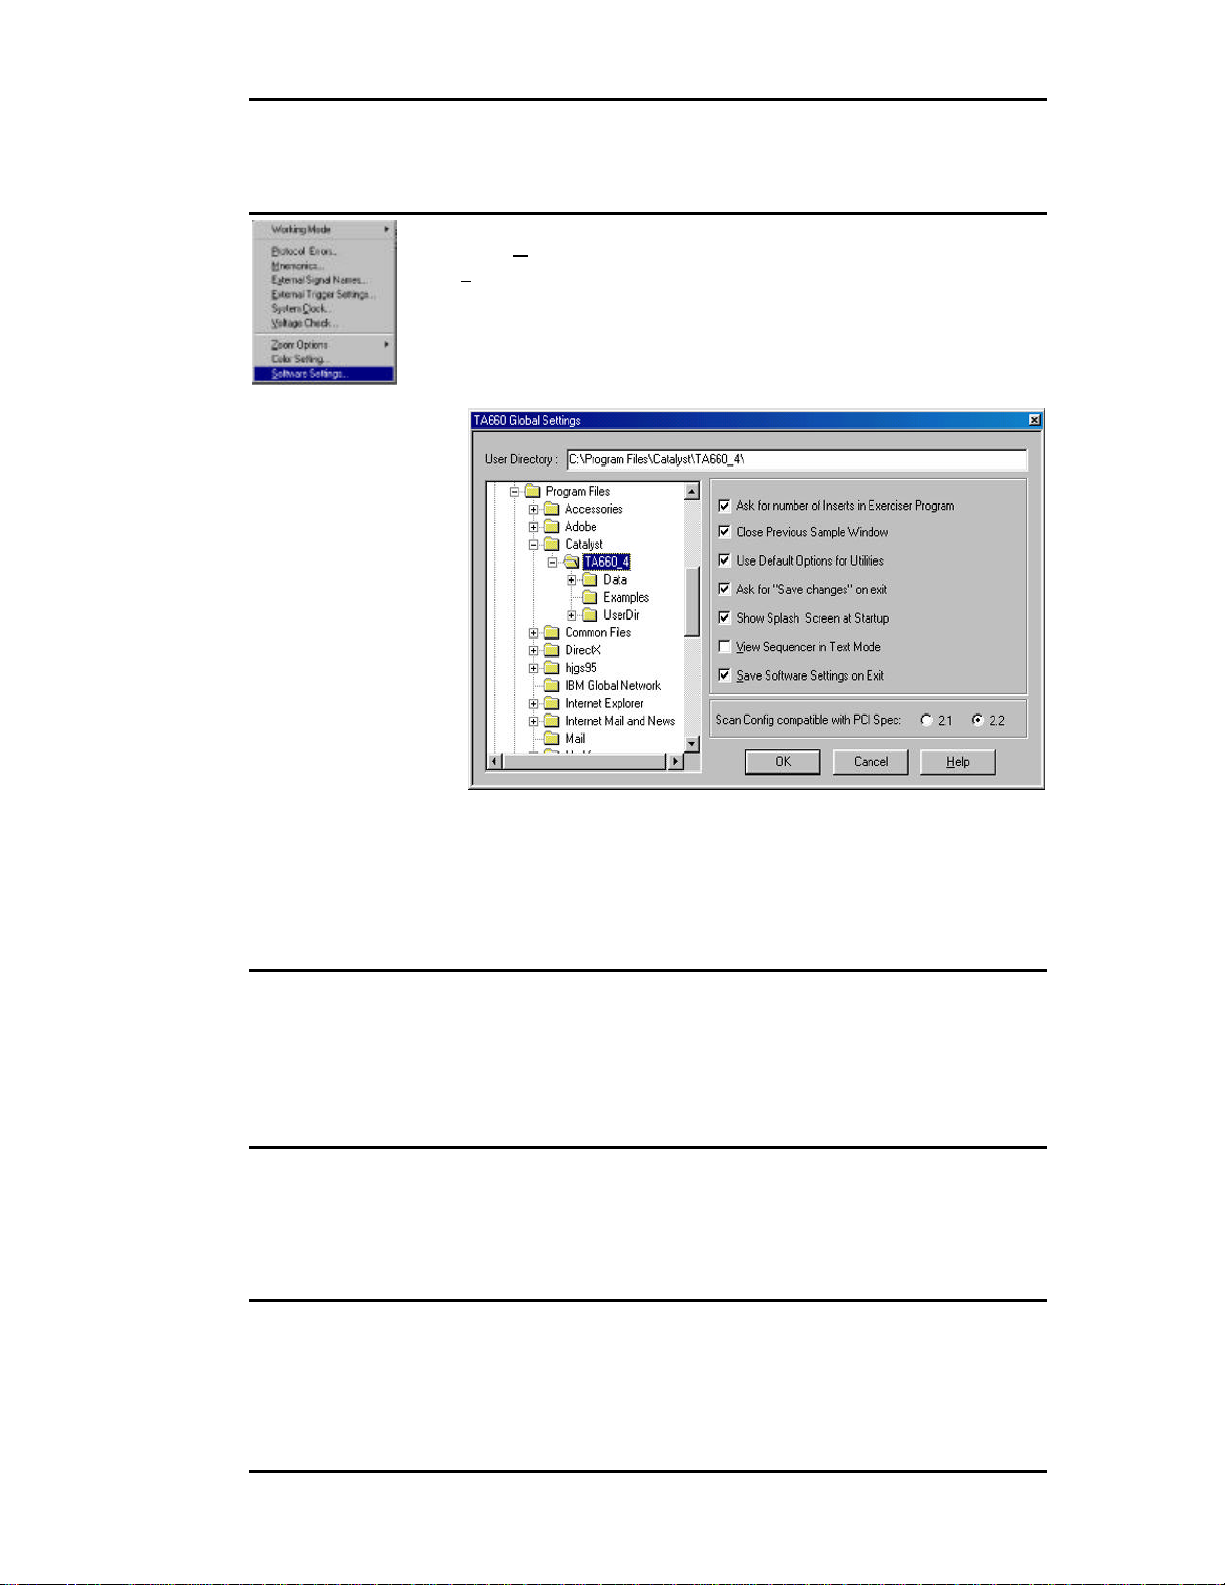
Global Software Settings
Click Configuration on the main menu bar and then select
Software Settings . . . to open the Global Settings dialog box.
Figure 7 Global Software Settings Dialog Box
Check the options that suit your needs and click OK.
Protocol Errors
To trigger on protocol errors immediately in Easy Mode, see Protocol
Errors on page 23 and for Advanced Mode operation see Protocol
Errors on page 118
External Signal Names
To assign unique names to external signals see External Signals
on page 126
External Trigger Settings
To set external trigger parameters see External Signals/Trigger on
page 125
17
Page 24

TA660 User's Manual Catalyst Enterprises, Inc
18
Page 25
TA660 User's Manual Catalyst Enterprises, Inc
Easy Mode
The Easy Mode offers you the capability to perform 95% of your bus analysis tests
without the need for any programming. When operating in the Easy Mode your analyzer
can perform the following:
• Capture data and trigger on bus protocol immediately.
• Perform Timing Violation detection and a search for Setup/Hold
limits.
• Capture bus activity while exercising the bus.
• Do Performance analysis on PCI bus activity.
• Compute Statistics on selected parameters.
• Perform Compliance Device test.
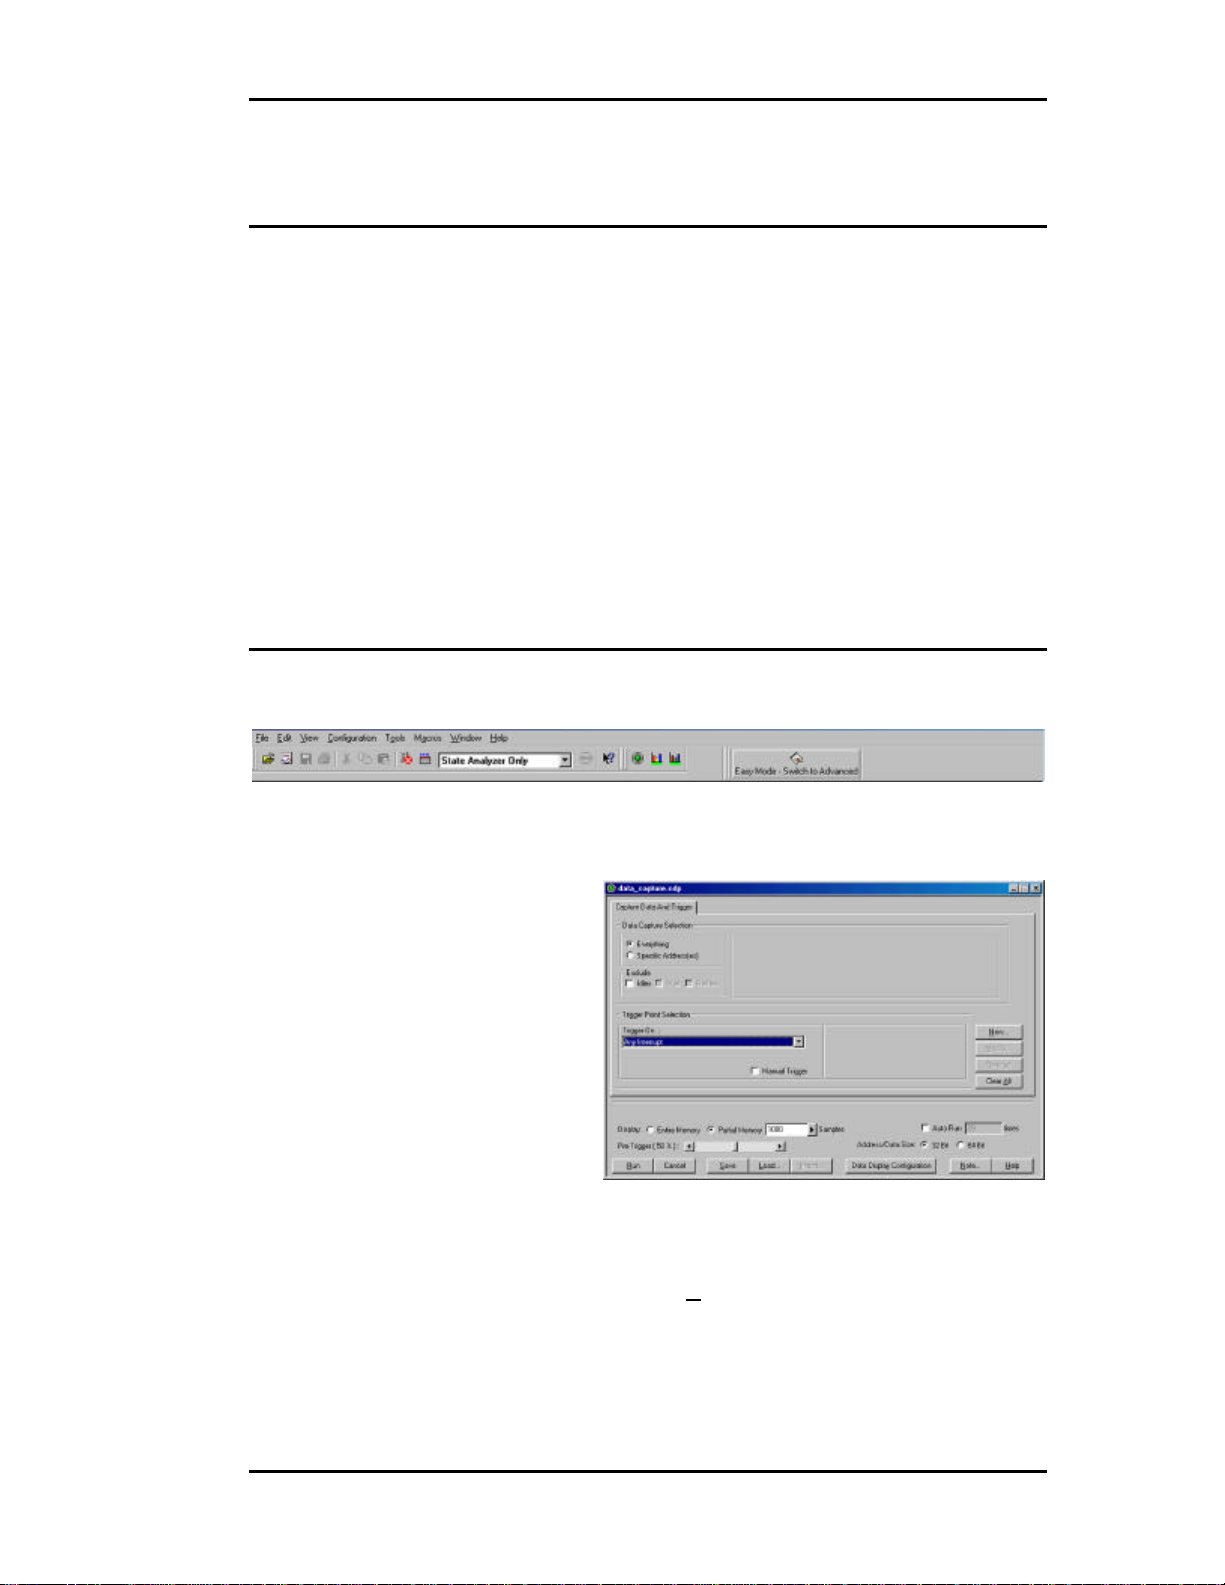
Instant Data Capture & Trigger
Make sure that the TA660 is in the State Analyzer Only configuration and is operating
in the Easy Mode as shown on the Main Menu bar below.
1. Click the Green button on the Main Menu bar to open the Capture
Data and Trigger dialog box shown in Figure 8.
Figure 8 Capture Data and Trigger Dialog Box
2. Select a Pre-Defined Trigger Point (See Table 1) from the Trigger
On dropdown list and click Run. Wait to capture data and to view
result. Figure 9 and Figure 10 show a typical Wave and List result
display.
19
Page 26

TA660 User's Manual Catalyst Enterprises, Inc
Table 1 Pre-Defined Trigger Points
0 Address Triggers on specified address
1 Any Interrupt Trigger when any interrupt occurs
2 Burst Longer Triggers when the burst is longer than nnn times
3 Burst Shorter Triggers when the burst is shorter than nnn times
4 DMA Transfers Triggers when data burst is transferred
5 Data at Address Triggers on specified data at address
6 External Input Trg. Triggers on external input trigger
7 GNT# Triggers when GNT# is asserted
8 Master Abort Triggers when a master abort occurs
Occurrence of SERR#
9
or PERR#
Triggers when error SERR# or PERR# occurs
10 Protocol Error Triggers when any PCI protocol error is detected
11 REQ# Triggers when REQ# is asserted
12 Reset De-asserted Triggers when reset is de-asserted
13 Assert – De-assert Signal xxx asserted and then de-asserted nnn times
14 Asserted Signal xxx asserted for more than nnn times
15 De-assert – Assert
16 De-asserted Signal xxx de-asserted for more than nnn times.
17 Signal Shorter Triggers when signal xxx is shorter than nnn times
18 Target Abort Triggers when a target aborts
19 Target Disconnect Triggers when a target disconnects
20 Target Retry Triggers when a target Retry occurs
21 Target Retry nnn times
Signal xxx de-asserted and then asserted for more than nnn
times
Triggers when a consecutive target Retry occurs more than
nnn times
22 Target Termination Triggers on target termination, combination
23 Vendor & Device ID Triggers on Vendor & Device ID access.
20
Page 27
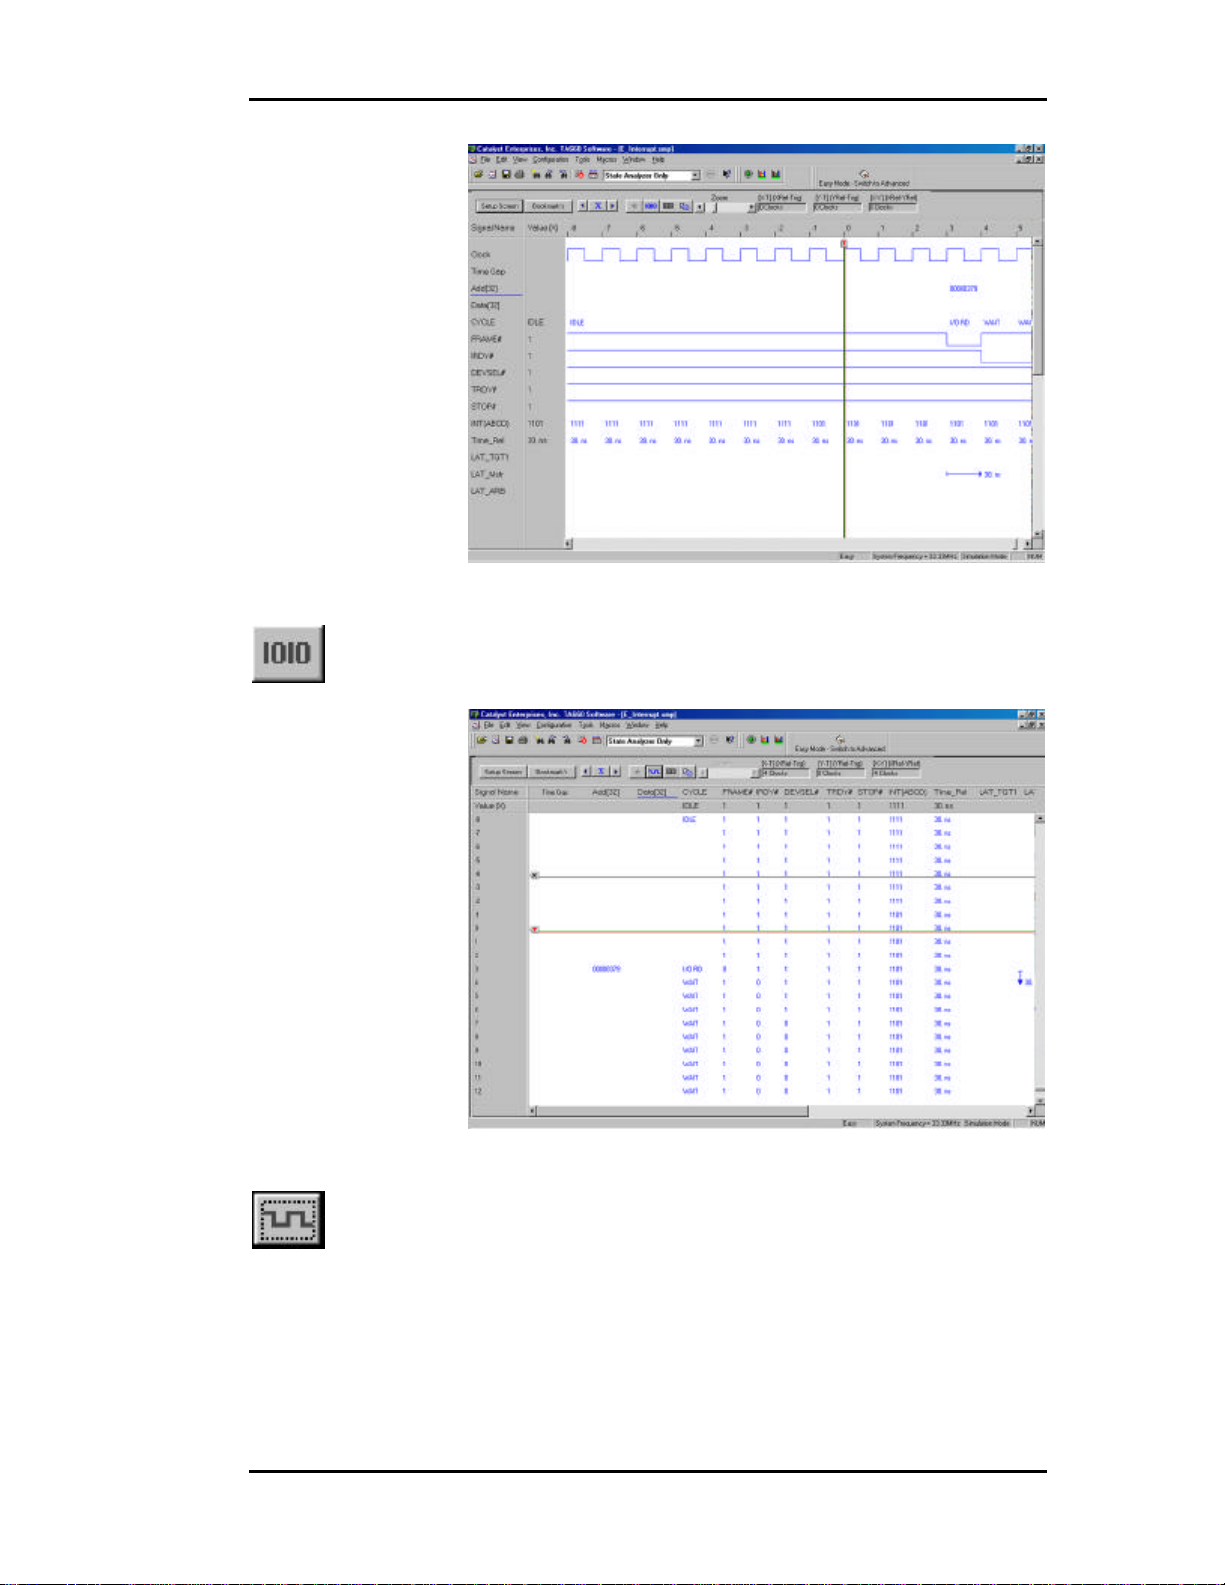
TA660 User's Manual Catalyst Enterprises, Inc
Figure 9 Wave File Output Display
To view the result as a list file output display, click the List
button.
Figure 10 List File Output Display
To return to the wave file output display, click the Wave button.
21
Page 28
TA660 User's Manual Catalyst Enterprises, Inc
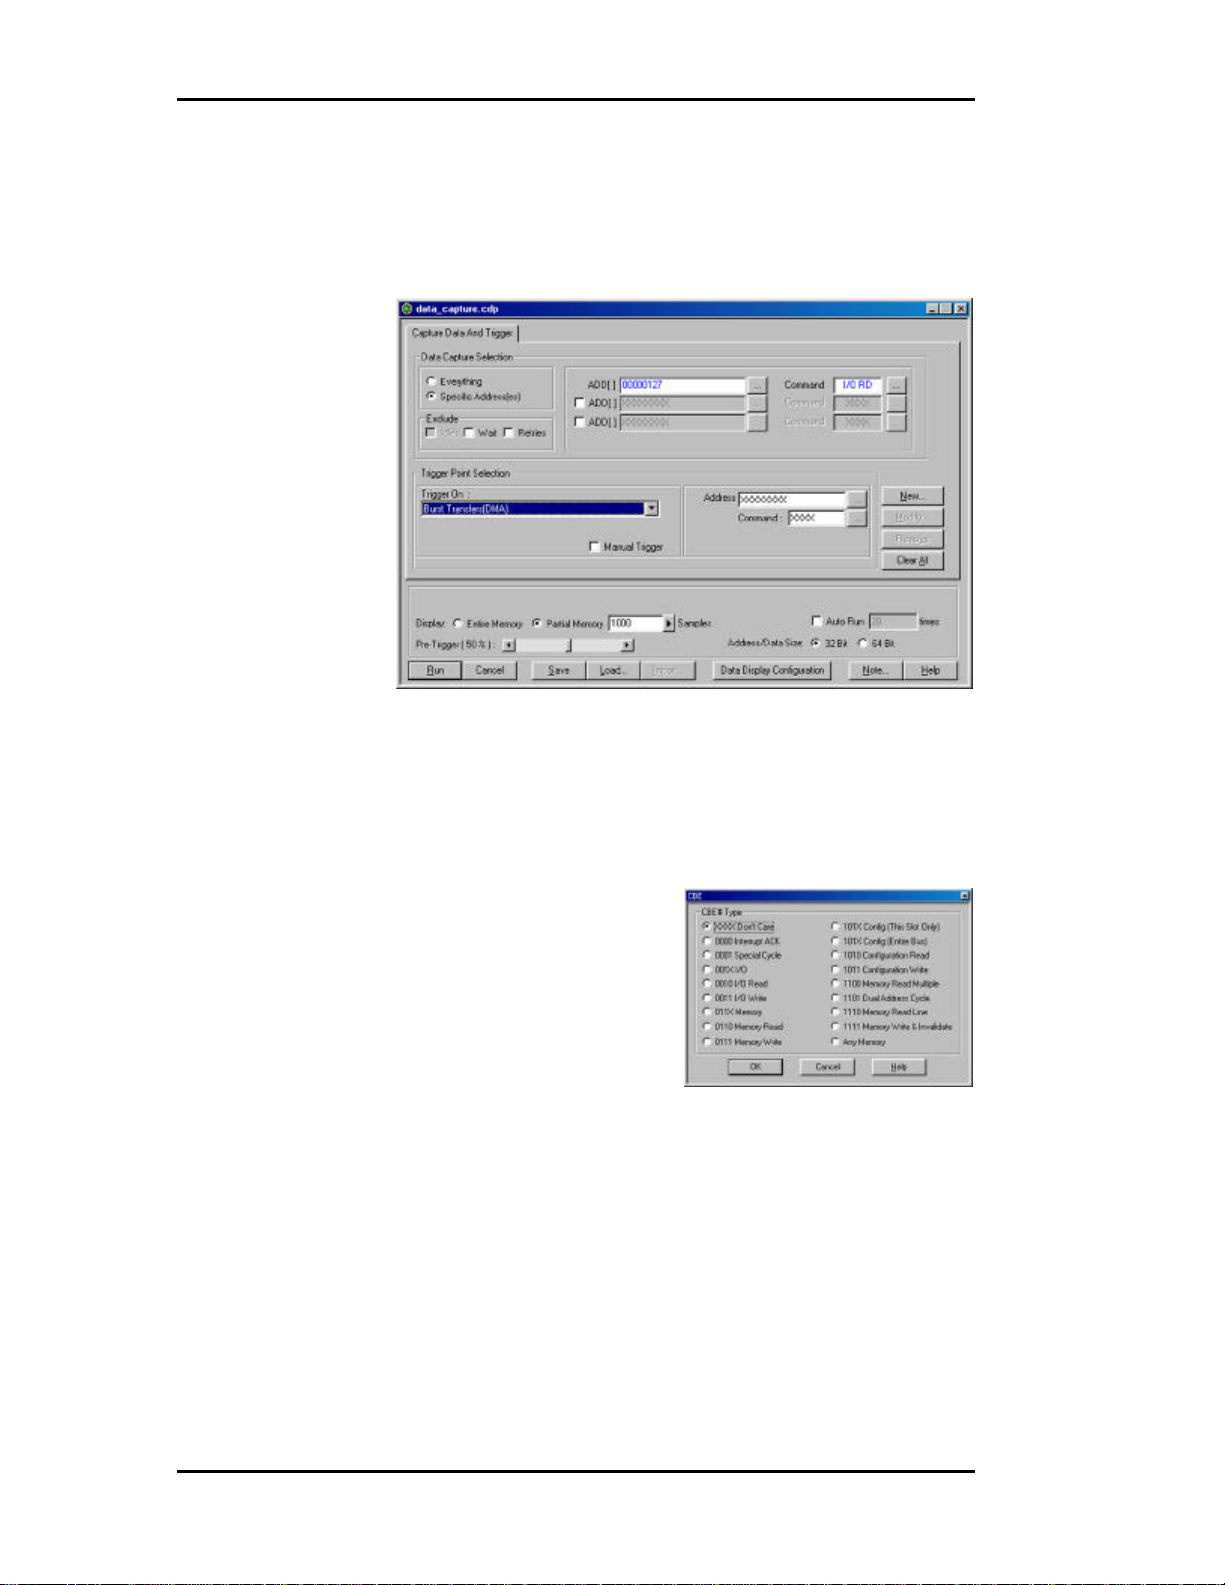
Selective Data Capture
You may refine your data capture by checking the Data Capture
Selection as Specific Addresses .
Figure 11 Capture Data At Specific Addresses Dialog Box
Selecting this option allows you to specify data capture at up to 3
address ranges with a specific associated command that is selected
from the CBE# dialog box. To open the CBE Type dialog box click
the ellipses button next to the Command edit box.
Figure 12 CBE Select Dialog Box
22
Page 29
TA660 User's Manual Catalyst Enterprises, Inc
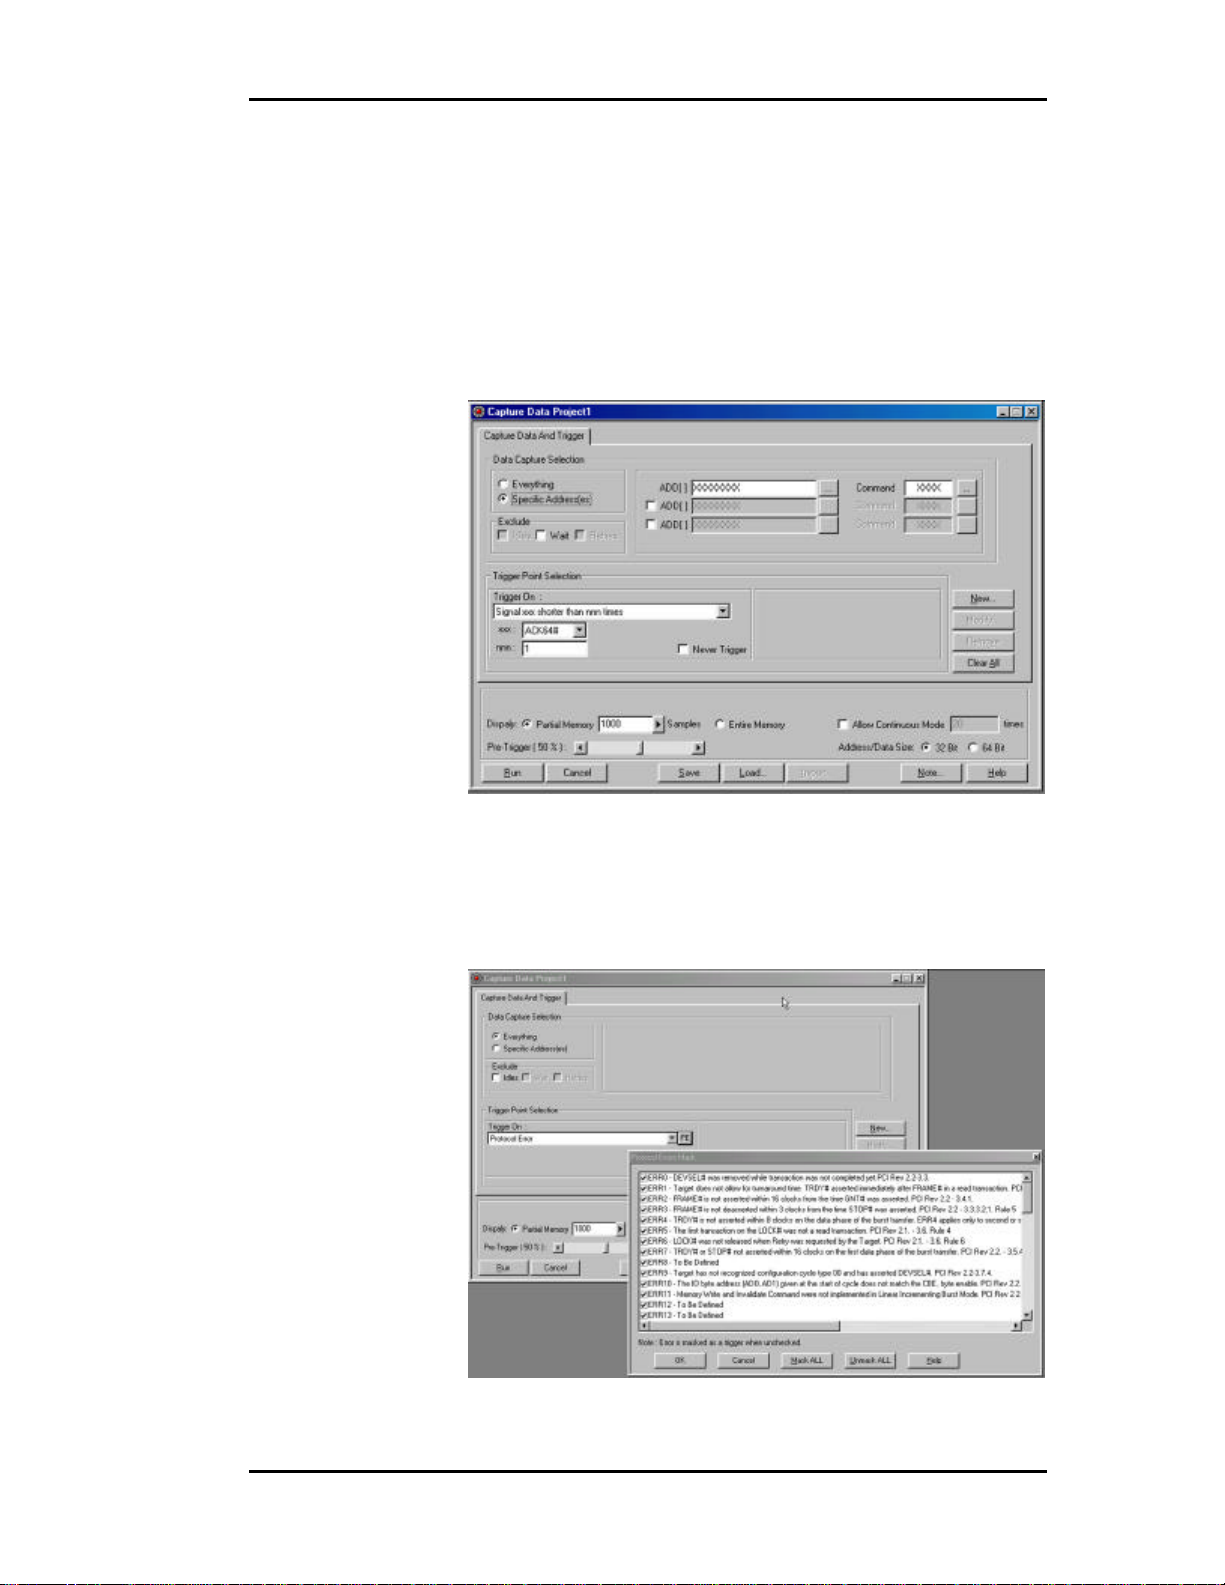
Data Capture & Trigger Examples
The capture data and trigger dialog box changes depending on the
type of Trigger On chosen. The following are some examples.
Signal on shorter than nnn times. When this Trigger On selection is chosen,
note the additional List Box for selecting a signal and the
Edit Box for specifying the number of times.
Figure 13 Specify Signal And Number of Times
Protocol Errors When this Trigger On selection is chosen, note the PE
button next to the Trigger On list box. Clicking this button
opens the Protocol Error mask.
Figure 14 Trigger on Protocol Error
23
Page 30

TA660 User's Manual Catalyst Enterprises, Inc
Data Capture Options
Memory Display You may limit the captured data display to a specific
number of samples by checking Partial Memory and
entering the number of Samples to be captured or, you may
check entire memory to allow the capture for the entire
memory.
Pre-Trigger Pre-Trigger is set by default at 50% which defines the
percentage of data to be captured before and after the
triggering event. You may change this percentage by
dragging the slider to the desired value.
Pre-Trigger Data: The capture of the specified percentage of the data prior to
the triggering event cannot be guaranteed and may in some
cases be 0. This can occur in cases where the triggering
event occurs before the required number pre-trigger event
data can be stored. In these cases the data display will show
fewer than the specified data points prior to the triggering
event. For more detail see Set Trigger on page 69.
Manual Trigger Select this option when you wish to manually interrupt the
data capture based on some external event. With this option
selected, data will be continually captured to memory and
overwritten as required until you stop the data capture.
Continuous Mode Continually captures data for the number of times specified.
A separate data file is generated each time that a capture is
performed.
Exclude Cycles To simplify the captured data display you may check the
options to exclude, Idles, Wait States and Retries.
24
Page 31

TA660 User's Manual Catalyst Enterprises, Inc
Performance Analysis
Click the Performance Analysis Icon on the menu bar to open
the Performance Analysis dialog box.
Figure 15 Easy Mode Performance Analysis Dialog Box
To perform an immediate Performance Analysis:
1. Click the down arrow next to the Performance Analysis Group list
box and select one of the four available analysis groups.
2. Select the parameters for analysis from the Available Items list.
3. Select the counters mode, Reset or Accumulate and click Run.
Reset/Accumulate With Reset selected, the measurement
counters are reset at the beginning of
each interval. With Accumulative
selected, the measurement counters
will continue to add up.
Save Settings To save the measurement setup, first select Save to open the
Save As Dialog Box, enter a new file name to save as a
*.pep file and click Save.
25
Page 32

TA660 User's Manual Catalyst Enterprises, Inc
Figure 16 Performance Analysis Result
Save Results If you would like to save the analysis results, click Save to
File enter the number of samples you wish to save and the
name of the output file.
Review Results For instructions on reviewing a saved performance analysis
file, see Saved Performance Analysis Review on page 81.
26
Page 33

TA660 User's Manual Catalyst Enterprises, Inc
Trace Statistics
Trace Statistics analysis is implemented by capturing data in memory
and then post processing it with software. The analysis software is
capable of measuring important parameters such as Minimum and
Maximum latency occurrences for any target or user defined specific
target, command utilization such as how many times an I/O write
versus I/O read occurs or, how many times memory commands occur.
Available Trace Analysis parameters that may be selected for a report
are listed on page 31.
Obtaining Trace Statistics
Click the Trace Statistics Icon on the menu bar to open the
Trace Statistics dialog box.
1. Select a Trigger Point from the Trigger On dropdown list and then
select the Trace Statistics tab to set the trace statistics options. For a
list of available choices see Trace Analysis Options on page 31.
27
Page 34

TA660 User's Manual Catalyst Enterprises, Inc
Figure 17 Easy Mode Trace Statistics Dialog Box
Selecting Parameters Select the parameters to be measured from the Analyze List
Of shown in Figure 17. Move the selected parameter to the
right window for software to perform interrogation on that
parameter during post processing by clicking the =>> button
next to the Of edit box. Parameters may be defined as
minimum, average, maximum or count and or percent
depending on which unit applies. Parameters may also be
defined, if applicable, by address type.
Number of Samples Set the amount of data to be captured in the memory for
post processing for each interval. The larger the number of
samples the more time is required for downloading and
processing, Therefore you should select an optimum
number of samples to be captured to memory such as 1000.
This takes about one second to process. If your application
requires more data then a larger number should be entered.
Update Interval If a small number of data samples is expected to be
captured, say 1000, and the application does not require
repeated measurement, you may want to sample data once
every 5 or 10 seconds by changing the Update Interval to 5
or 10 seconds as required. The larger of the two number of
data samples or faster update rate will be the dominating
setup for data capture time.
2. When all the parameters have been specified, click Run to capture
the specified data and perform the trace statistics determination.
28
Page 35

TA660 User's Manual Catalyst Enterprises, Inc
29
Figure 18 Trace Statistics Result
Figure 19 Trace Statistics Report
Page 36

TA660 User's Manual Catalyst Enterprises, Inc
Save Measurements All measurements may also be saved and reviewed later,
select SAVE and specify the output file name. The results
may be selected and reviewed from the View option on the
Main Menu bar.
30
Page 37

TA660 User's Manual Catalyst Enterprises, Inc
Trace Analysis Options
Latency Target *Number of waits due to TRDY before first data
phase
Latency Master *Number of waits due to IRDY not asserted
Latency Arbiter Number of clocks from REQ to GNT (master
board must be plugged on top of the TA660)
Efficiency Efficiency in percent for the duration of the
captured data
Target Efficiency *Number of TRDY# asserted over DEVSEL#
asserted
Master Efficiency * Number of IRDY# asserted over DEVSEL#
asserted
Throughput Mb/Sec Number of data transferred over time
Bus Utilization Number of cycles DEVSEL# asserted over time
IDLE Number of IDLE cycles
No of Data Transfer/Address *Size of data burst
Wait Number waits or wait time in percent
Int Ack Number of INT ACK
I/O *Total number of I/O Commands
I/O RD *Number of I/O Read Commands
I/O WR *Number of I/O Write Commands
Memory *Number of Memory Commands
Mem RD *Number of Memory Read
Mem WR *Number of Memory Writes
Configuration *Number of Configuration Cycles
CFG RD *Number of Configuration Read
CFG WR *Number of Configuration Write
MEM RM *Number of Memory Read Multiple
DU ADD *Number of Dual Address Commands
MEM RL *Number of Memory Read Line Commands
MEM W&I *Number of Memory Write and Invalidate
Total No of Data *Number of Data Transferred during capture
RETRY *Number of Target Retry
TABORT *Number of Target Aborts
DIS+DATA *Number of target disconnect + data
DIS-DATA *Number of target disconnect - data
MABORT *Number of Master aborts
Latency, REQ# to Data Latency time from REQ# asserted until data
transferred, including retries
DEVSEL Speed Reports Target Decode speed
* Indicates a total or number at specified address or an address range
31
Page 38

TA660 User's Manual Catalyst Enterprises, Inc
32
Page 39

TA660 User's Manual Catalyst Enterprises, Inc
Exercise and Capture
Make sure that the TA660 is in the State Analyzer & Exerciser configuration and is
operating in the Easy Mode as shown on the Main Menu bar below.
Click the Green Icon on the Main Menu bar to open the Capture
Data and Trigger dialog box shown in Figure 20.
Figure 20 Capture Data and Trigger Dialog Box
The data capture and trigger operation behaves identically to that in
the State Analyzer Only configuration with the exception that bus
signals are generated by an exerciser program that you define.
Defining an Exerciser Program
1. Click on the Exerciser Program tab to open the Exerciser Program
definition dialog box as shown in Figure 21.
33
Page 40

TA660 User's Manual Catalyst Enterprises, Inc
Figure 21 Exerciser Program Definition Dialog Box
2. Define up to 10 exerciser program lines by selecting a command
type, data to be written or a previously defined data block if
applicable, target address, and data size.
3. Click Run to perform data capture and trigger with exerciser
generated signals.
Figure 22 Wave File Output
34
Page 41

TA660 User's Manual Catalyst Enterprises, Inc
Creating a Data Block File
To create an exerciser data file click the Data Block Icon on the
Main Menu bar to open the Data File dialog box shown in Figure
23.
Figure 23 Data File Definition Dialog Box
Click New Data Block in the Data File Definition dialog box to enter
a data block (“Data Block 0”) in the Data Blocks area. With the new
data block highlighted you may define a specific block pattern or
create a walking bit type pattern.
Fixed Data Pattern Click the Define Pattern button to open the Define Data
Pattern dialog box.
Figure 24 Define Data Pattern Dialog Box
Enter a pattern and select the number of times that that pattern is to be
repeated and click OK.
Multiple Line Pattern You may define a block of multiple lines that can be
automatically repeated. Figure 25 shows the definition of a
two line pattern to be repeated 3 times. To add a new line,
enter the data in the edit box and then click on the down
arrow to include it in the list.
35
Page 42

TA660 User's Manual Catalyst Enterprises, Inc
Figure 25 Define Multiple Line Pattern
Figure 26 shows the resulting block pattern where the defined pattern
is replicated 3 times.
Figure 26 Resulting Multiple Line Pattern
Walking Data Pattern Click the Fill With Walking Bits button to open the Fill
With Walking Bits dialog box as shown in Figure 27.
Figure 27 Fill With Walking Bits Dialog Box
Enter the walking bit options desired and the number of times the data
pattern is to be written and click OK.
Figure 28 is an example of a walking bit “1” set in a direction of left
to right to be written 4 times.
36
Page 43

TA660 User's Manual Catalyst Enterprises, Inc
Figure 28 Walking Bit Data File Example
To save the newly created Data file click Close click Yes In the Save
Changes to the Data File? Dialog box.
Enter a file name name.dat in the Save As dialog box and click Save .
The newly created data file is now available for use with the current
exerciser program.
Editing Files in ASCII
You may view and edit all exerciser program files as ASCII by using
a text editor such as Notepad or Wordpad. The following figures
show examples of exerciser program files opened using Wordpad.
Figure 29 Sample Data File
37
Figure 30 Sample Exerciser File
Page 44

TA660 User's Manual Catalyst Enterprises, Inc
Exerciser Utilities
Dump Memory
To perform a memory dump select Dump Memory from the
Exerciser dropdown list on the menu bar. This will open the
Dump Memory dialog box.
Enter a Start address and an End address or Count and click OK to
perform a memory dump as selected.
The resulting memory dump will be displayed as shown in Figure 32.
Read/Modify Write
To perform read/modify write select Read/Modify Write . . .
from the Exerciser dropdown list on the menu bar. This will open
the Read/Modify Write dialog box.
Figure 31 Dump Memory Dialog Box
Figure 32 Dump Memory Result
38
Page 45

TA660 User's Manual Catalyst Enterprises, Inc
Figure 33 Read/Modify Write Dialog Box
1. Enter an address the contents of which you wish to modify in the
Current Address edit box.
2. Enter the value to be written to that address in the New Value edit
box.
NOTE: This feature makes the TA660 to be a bus master and
may be used to read or write any registers or memory contents
of a target device without having to set the programming menu.
Write Read Verify
To perform write read verify select Write/Read Verify . . .from
the Exerciser dropdown list on the menu bar. This will open the
Write/Read verify dialog box.
Figure 34 Write/Read Verify Dialog Box
1. Select the command type from the Command dropdown list, enter
the Target address, BE and either the data to be written or a
previously defined data block and a DMA size.
39
Page 46

TA660 User's Manual Catalyst Enterprises, Inc
2. Click Compile to generate the executable code as shown in Figure
35.
Figure 35 Write/Read Verify Compiled Program
3. To perform Read/Write verification click Run.
Address Test
1. Enter the starting address to be tested and the number of addresses
(Length) to be tested.
Figure 36 Write/Read Verification Result
To perform an Address Test select Address Test from the
Exerciser dropdown list on the menu bar to open the Address Test
Program dialog box..
40
Page 47

TA660 User's Manual Catalyst Enterprises, Inc
Figure 37 Address Test Program Dialog Box
2. Click the ellipses button next to the Length edit box to set the
Read/Write properties, click OK and then Compile & Run. The test
results are displayed as in Figure 39.
Figure 38 Set Read Write Compile Mode Dialog Box
Figure 39 Address Test Result
41
Page 48

TA660 User's Manual Catalyst Enterprises, Inc
TA660 as Memory
TA660 can be used as a target memory so that a master device can write and read to and
from it to see if the master can perform write and read operation properly.
To perform this test, select TA660 as Memory, identify an address to
the TA660 that us not used by the system memory or any agent in the
system, and identify the last address or the number of bytes to write
and read.
Figure 40 TA660 As Memory Dialog Box
Once "OK" is entered another message informs the user to perform
the write instruction by the master. TA660 stays in running mode
until the master writes data.
Once the data has been transferred, the TA660 captures the data as
target memory and displays it on the screen for verification of write.
At this time the user may execute the "Run" from this menu to put the
42
Page 49

TA660 User's Manual Catalyst Enterprises, Inc
TA660 in write mode so the master device can read the data from it to
verify the read operation.
43
Page 50

TA660 User's Manual Catalyst Enterprises, Inc
Scan Configuration Registers
To perform a configuration scan select S can Configuration
Registers from the Exerciser dropdown list on the menu bar.
The system will search for PCI devices on the bus and display the
configuration as shown in Figure 41. All devices on the bus are
reported. To see information on additional devices click Next>.
Figure 41 Configuration Header Display Dialog Box
You may edit all of the parameters displayed in white, if your
hardware allows it. Edit the field and then click on the "Write PCI
Configuration to this Device" button.
To save configuration read all devices, find your device and save it to
a file.
PCI 2.1 or PCI 2.2 Specification Scan check may be performed to either the
PCI 2.1 or PCI 2.2 specification. The selection of which
specification is made on the Software Global Settings dialog
box. To set these options click Configuration on the main
menu bar and then choose Software Settings.
44
Page 51

TA660 User's Manual Catalyst Enterprises, Inc
Device Compliance To perform an immediate device compliance on a device,
see Compliance Device Test on page 87.
45
Page 52

TA660 User's Manual Catalyst Enterprises, Inc
Generate Traffic and Measure Performance
Make sure that the TA660 is in the State Analyzer & Exerciser configuration and is
operating in the Easy Mode as shown on the Main Menu bar below.
Performance Analysis with exerciser requires you to define an
exerciser program as described in Defining an Exerciser Program on
page 33.
Click the Performance Analysis Icon on the menu bar to open
the Performance Analysis dialog box as shown in Figure 42.
Figure 42 Performance Analysis with Exerciser
To perform Performance Analysis with the exerciser:
1. Define the exerciser program, such as reading or writing to a known
memory location(s).
2. Click the Performance Analysis Tab and set up the Performance
Analysis as described in Performance Analysis on page 25.
3. Click Run.
46
Page 53

TA660 User's Manual Catalyst Enterprises, Inc
Generate Traffic and Measure Trace Statistics
Make sure that the TA660 is in the State Analyzer & Exerciser configuration and is
operating in the Easy Mode as shown on the Main Menu bar below.
Click the Trace Statistics Icon on the menu bar to open the
Trace Statistics dialog box as shown in Figure 43.
Figure 43 Trace Statistics With Exerciser
To obtain Trace Statistics with the exerciser:
1. Set the trace statistics options and the Trigger Point as described in
Obtaining Trace Statistics on page 27.
2. Click the Exerciser Tab and define the Exerciser Program as
described in Defining an Exerciser Program on page 33.
3. When all the parameters have been specified, click Run to capture
the specified data and perform the statistics reporting.
47
Page 54

TA660 User's Manual Catalyst Enterprises, Inc
48
Page 55

TA660 User's Manual Catalyst Enterprises, Inc
Perform Timing Analysis
Make sure that the TA660 is in the State & timing Analyzer configuration and is
operating in the Easy Mode as shown on the Main Menu bar below.
In this mode you may immediately detect and capture timing
violations on all bus signals. Any bus "glitch" of 1.5 ns or greater is
captured as a timing violation.
You may also perform a Setup/Hold Limits search on any or all PCI
bus signals by using a convenient signal mask.
To perform an immediate timing analysis, click the Timing
Violation Icon to open the Timing Violation Analysis dialog box.
Figure 44 Timing Violation Analysis Dialog Box
Timing Violation Capture
1. Set the desired data capture options such as Pre-Trigger %, Display
Memory etc. and click Run.
The occurrence of the first timing violation will cause a trigger and
open the Timing Violation Results display as shown in Figure 45.
49
Page 56

TA660 User's Manual Catalyst Enterprises, Inc
Figure 45 Timing Violation Results Display
50
Page 57

TA660 User's Manual Catalyst Enterprises, Inc
Search for Setup & Hold Limits
To search for setup and hold limits click the Setup/Hold Limits
search Icon to open the Setup and Hold Limits Mask definition
dialog box.
Figure 46 Setup and Hold Limits Mask Definition Dialog Box
Select the signals that you wish to ignore in the search and then click
Search. At the completion of the search the result is displayed as
shown in Figure 47.
Figure 47 Setup and Hold Limits Search Result
51
Page 58

TA660 User's Manual Catalyst Enterprises, Inc
52
Page 59

TA660 User's Manual Catalyst Enterprises, Inc
Advanced Mode
The Advanced Mode expands the analyzer capability by allowing you to program special
custom debugging projects and define complex triggering levels. Such projects are
programmed by defining and the sequencer menus.
The State & Timing analyzer configuration, in addition to the special programming with
event and sequencer files, also expands the Timing Violation Analysis by allowing you to
chose leading and trailing edge timing values.
With this expanded capability you may perform all of the same analysis functions as in
the Easy Mode but with much customization.
• Setup complex triggering level to Capture data and trigger using
custom projects.
• Perform timing characterization timing violation detection.
• Capture bus activity and the device under test response under
different conditions using the exerciser.
• Do Performance analysis on PCI bus activities.
• Measure and report Statistics on selected parameters.
Easy Mode Access As a convenience to allow you to get a quick snapshot of
bus activity, the Advanced Mode menu bar includes the Red
Easy mode button.
Capture Data Project
Make sure that the TA660 is in the State Analyzer & Exerciser configuration and is
operating in the Advanced Mode as shown on the Main Menu bar below.
1. Click the Black button on the Main Menu bar to open the Custom
Project dialog box shown in Figure 48.
For a custom project you must program/define:
• An Exerciser Program
• A set of Events
• A sequencer Program
Example Files Your analyzer includes a set of pre-defined Project, Event
and sequencer files. You may load a complete Project or
import Events and Sequencer programs to perform pre-
53
Page 60

TA660 User's Manual Catalyst Enterprises, Inc
determined tasks. For more detail see Example Files on
page 85.
Figure 48 Custom Project Dialog Box/Exerciser Program
54
Page 61

TA660 User's Manual Catalyst Enterprises, Inc
Programming the Exerciser
Make sure that the Exerciser Program Tab is selected on the Custom Project Dialog box
as shown in Figure 48. To program the Exerciser:
1. The Exerciser Program dialog box opens as default with one active
program line. You may add additional active program lines by
clicking Add.
Insert Program Line To insert a new program line between previously added
active program lines, position the cursor below the line
where you want to insert the new line and click the Insert
button.
2. Select a command such as MEM Write from the command
dropdown list for each active program line.
Available Exerciser Commands
Interrupt ACK
Special Cycle
I/O Read
I/O Write
MEM Read
MEM Write
CONFIG Read
CONFIG Write
MEM Read Multiple
MEM Read Line
MW & Invalidate
DAC : I/O Read
DAC : I/O Write
DAC : MEM Read
DAC : MEM Write
DAC : MEM Read Multi
DAC : MEM Read Line
DAC : MW & Invalidate
No Termination TA660 to Transfer data as
Target without termination.
Disconnect with data TA660 to Generate Disconnect
as Target at the last data phase.
Disconnect without data Generate disconnect after the
last data phase.
Target Abort with data Generate Target Abort at the
last data phase.
Target Abort without data Generate Target Abort after the
last data phase.
55
Page 62

TA660 User's Manual Catalyst Enterprises, Inc
3. Each of the commands when selected will generate a corresponding
bus cycle.
4. Enter a TARGET ADDRESS that you would like to write to and
enter the DATA to be written to that address.
TA660 Address as Target When a Target command is chosen from the available
COMMAND list a "TA660 Address as Target" button
appears on the Exerciser Program Tab. Click this button to
open the Base Address Setting Dialog Box.
Figure 49 Target Base Address Setting
Setting the Base Address Enter the base address and click OK. You must use
this address in your master program to read or write
from TA660.
Burst Data Writes For burst data write operations requiring multiple data you
may select a previously created data file from a list of Data
Files by clicking Browse and selecting a pre-defined data
file, or create a new data file by clicking Data Block. See
Creating a Data Block File on page 35.
Padding/Bus Utilization Checking Insert Idle and entering the number of idles
desired will insert Idle states at the end of each compiled
command. See Figure 51. With adding idles at the end of
commands the TA660 can be precisely controlled on how
long it would be utilizing the bus.
56
Page 63

TA660 User's Manual Catalyst Enterprises, Inc
32/64 Bit Addressing To set 32 or 64 bit addressing mode click the button next to
the DMA size edit box to open the Program Line Properties
dialog box shown in Figure 50.
Figure 50 Program Line Properties Dialog Box
5. Set Exerciser options as described in Setting Exerciser Options on
page 58.
6. When done, click Compile . . . to generate the executable exercise
code as displayed in
Figure 51 Compiled Output File With Padding
Forcing Errors : All signals displayed in blue may be changed to force errors
and anomalies.
Wait States Wait states may be inserted by pointing the cursor on the
line where a Wait State is desired and then clicking Insert.
Looping You may define a loop by clicking in the Loop Start column
next to the program line where you wish for the loop to start
and in the Loop End column next to the program line where
you wish for the loop to end. For the loop to execute, you
must enable the loop option when setting the Exerciser
Options.
57
Page 64

TA660 User's Manual Catalyst Enterprises, Inc
Forcing an Interrupt You may force interrupts for a specific number of clocks
during the program execution by double clicking in the Int#
field for that line and then setting the interrupts in the Int#
dialog box.
Figure 52 Setting Interrupts
Setting Exerciser Options
You may set the exerciser options globally for all input program types or locally on the
Exerciser Programming window.
To set the exerciser options globally, click Exerciser on the menu
bar and select Options from the dropdown list to open the
exerciser dialog box as shown in Figure 53.
Figure 53 Exerciser Options Dialog Box
Set Options Enabled Selecting the exerciser options menu globally from the
menu bar enables the option setting for both, Master and
Target program files. When setting exerciser options from
the Exerciser Program window, only the options that are
58
Page 65

TA660 User's Manual Catalyst Enterprises, Inc
required by the selected commands are enabled. For
example, if you are using Master commands only, the
Target options are grayed out.
Looping To run an exerciser program in a loop, set Loop Master or
Loop Target or both as applicable. To loop a fixed number
of times, set the Loop Counter to On and enter the number
of loops to execute. Setting the loop counter to Off will
cause the program to loop indefinitely.
On Target Disconnect Options
Use Same Transaction Completes from the disconnect
point on, regardless of the
number of times the target
issues a disconnect. The TA660
will take it from where the
target disconnect was issued and
try to complete the transaction
from that point on.
Use Next Transaction The TA660 will bypass all of
the transactions in the current
command and will jump to the
transaction for the next
command.
On Target Retry Options
Infinite Retry The TA660 will retry the
Advance to Next The TA660 will bypass the
Master Abort on No DEVSEL# Options
Disabled The FRAME# will stay asserted
Enabled The TA660 will issue a Master
Master Assert FRAME#
Regardless of Grant Once the TA660 is set to
current command until the
target transfers data.
current command and go to the
next transaction for the next
command.
indefinitely and the TA660 will
not issue a Master ABORT.
ABORT on the 5th clock if no
DEVSEL# is asserted.
become a master, it asserts the
frame and starts the transaction
regardless of the status of the
GNT#.
59
Page 66

TA660 User's Manual Catalyst Enterprises, Inc
After Grant Asserted The TA660 will request the bus
and start the transaction only
after the GNT# is asserted.
Master Completes Transaction at Time Out
Disabled The TA660 continues to
complete the transaction for
however many clocks it takes
regardless of GNT# being
deasserted.
Enabled The TA660 completes the
current transaction as soon as
possible after GNT# is
deasserted.
Set Interrupts
Setting interrupts may be done in two ways, 1) From a compiled program for a specified
number of clocks or 2) Outside of a compiled program, indefinitely until reset by the user
again. To set it indefinitely:
To set one or more interrupts click Exerciser on the menu bar
and then select Set Interrupts from the dropdown list to open the
Set Interrupt dialog box.
Figure 54 Set Interrupts Dialog Box
Select the interrupts that you wish to set and click OK.
Continuous Setting, Outside Program Setting the interrupts in this manner
sets them continuously until you uncheck them.
Limited Duration, Inside Program You may set one or more interrupts for one or
more program steps when running compiled Program files.
See Forcing an Interrupt on page 58.
60
Page 67

TA660 User's Manual Catalyst Enterprises, Inc
Defining Event Patterns
An Event pattern defines the PCI bus signals, including address, data and control signals
to:
• Define the data capture manipulation.
• Set a trigger in the sequencer.
• Define events that are used for Performance Analysis and Bus
Utilization measurement.
You may define up to 8 events identified as follows:
EV1 - EV8 8 Events with identical capability.
XGRP0 - XGRP3 Events based on external signals.
DEFAULT NAMES EV1 - EV8 are default event names that may be changed to
a user defined descriptive name for reference in the
Sequencer and Performance analysis displays.
PCI SIGNALS All PCI bus signals are included except JTAG which is used
for boundary scan testing.
EXTERNAL The TA660 supports 16 external signals that are all sampled
and captured in memory in synch with the PCI bus signals.
61
Page 68

TA660 User's Manual Catalyst Enterprises, Inc
Defining an Event Pattern
1. Click the Event Patterns tab to open the Event Pattern Definition
dialog box.
Figure 55 Event Pattern Definition Dialog Box
To enter a parameter or edit a previously entered parameter, doubleclick in the appropriate data field to open a corresponding dialog box,
enter the required data, and click OK. The changes entered will be
reflected in the edited data field.
Keyboard Edit You may also edit all of the data fields by using the
keyboard by moving through the available data fields using
the arrow keys and pressing Enter on the desired field to
either open the associated dialog box or to change the
contents from X to 0 to 1.
For example, to define EV1 as a CUSTOM event, double click first in
the EV1 field and then in each of the data fields that you wish to
define to set the required parameters in the corresponding dialog box.
Set Default To set all of the PCI signals to the default value of don’t
care, X, for any given event EVx, position the highlighted
cursor anywhere in that row and hit the “del” key.
Set Transfer Type The transfer type selection dialog box shown in Figure 56
controls the pre-determined signal settings and address
62
Page 69

TA660 User's Manual Catalyst Enterprises, Inc
limits based upon the XFER type selected. For example,
with A32 selected as shown, the address field is
automatically limited to 32 bits, a limited CBE dialog as
shown in Figure 57 is enabled, 64 bit settings in the PAR
dialog and the R/G dialog are grayed out. Additionally the
IDSEL, FRAME#, IRDY#, DEVSEL#, TRDY# and
STOP# are pre-defined and unchangeable.
Figure 56 Transfer Type Selection Dialog Box
Figure 57 Limited CBE Dialog Box
Figure 58 Event File Setup for XFER Type A32
63
Page 70

TA660 User's Manual Catalyst Enterprises, Inc
Programming the Sequencer
The sequencer is used for data capture manipulation, generating
complex triggering on bus events and starting the exerciser (if
required).
The TA660 Sequencer includes 32 states, S0 to S31. The Sequencer
always starts at S0. Each state can be programmed to go to any other
state depending on the occurrences of specified patterns in that state.
Jump to any state is conditional. At any of the states S1-S30, the
Sequencer may jump to several other possible states depending on
which of the specified conditions have been met first.
A Trigger may be set in the Sequencer to occur:
1. Unconditionally at any state,
2. On protocol error (PE),
3. On occurrences of Events or on Boolean expressions of Events.
4. On occurrence of a timing error.
5. On occurrence of external trigger input.
Unconditional trigger is mostly useful when data sampling requires
more than one Sequencer state. So the trigger may be set to occur at
S1 and then continue to sample data based on several sequences of
events.
The data capture choices for any state are:
All Captures all data on every cycle,
None Captures no data,
EV1 – EV8 Captures data as specified for each
events
!EV1-!EV8 Captures all data outside the specified
address or data range.
Expression Captures data as defined by a Boolean
expression.
The state transition events for all states are:
Any Unconditional.
Protocol Error A Protocol Error.
Timing Error Timing Error
EV1 – EV8 Predefined events.
!EV1-!EV8 If not pre-defined.
64
Page 71

TA660 User's Manual Catalyst Enterprises, Inc
Expression A Boolean equation of events. e.g.
EV1+!EV2.
External External trigger
Figure 59 Sequencer Form Style Programming Dialog Box
Unlimited Else If The menu form allows only 2 Else If statements but in the
Text Form the user may add as many Else If statements as
desired.
To View As Text Click the Text button on the Sequencer Form menu.
Pre-Trigger The Sequencer menu includes a Pre-trigger XX% function
which lets you set the percent of data to be captured before
and after the triggering event. This percentage is set by
default to 50%. For more details see Set Trigger on page
69.
Start Exerciser Checking this option will run the exerciser program
whenever the sequencer enters the state for which it is set.
The Sequencer definition dialog box shown Figure 59 displays the
programmable states as follows:
S0 The starting state, displayed always.
S1 - S31 These states can be viewed and
programmed two at a time by using
the scroll bar on the right side of the
screen.
65
Page 72

TA660 User's Manual Catalyst Enterprises, Inc
Defining a Boolean Expression
To define an expression, scroll down the list of options in the
dropdown list where you wish to use an expression and click on
Expression to open the Expression Editor window as shown in Figure
60
Figure 60 Expression Editor Window
Double click the Event Names and Operators as required to define the
desired Boolean expression and click OK.
66
Page 73

TA660 User's Manual Catalyst Enterprises, Inc
Programming the Sequencer as Text
To program the sequencer as text, click the Text button on the
Sequencer Form menu to open the text programming window as
shown in Figure 61.
Figure 61 Prototype Text Programming Window
The text programming window opens with three default prototype
states with all programmable parameters displayed in blue.
Additional States You may add unlimited additional states by clicking the
Add State button. Programmable parameters are displayed
as blue.
Maximize Display You may maximize the programming window by clicking
the Full Screen button.
To Change Parameters
1. Position the display cursor over the parameter and double click the
left mouse button to open a list box with available choices for that
parameter. See Figure 62.
2. Choose the desired parameter with the display cursor and double
click the left mouse button.
To Delete a Parameter Double click the parameter to be deleted and select delete.
Add Else If You may include Else If statements in your program by
clicking the Add Else If button. To remove the added Else
If, double click on it and choose <Delete> from the open list
box.
67
Page 74

TA660 User's Manual Catalyst Enterprises, Inc
Figure 62 Changing the Programmable Parameters
Optimum Workspace To avoid scrolling the display in long sequencer programs
you may minimize completed states by double clicking the
symbol next to the state to be minimized. To expand the
minimized state, double click the state name.
Figure 63 Minimized State Display
Deleting a State To delete a state, place the cursor in the text for that state
and click the Delete button.
68
Page 75

TA660 User's Manual Catalyst Enterprises, Inc
Set Trigger
Set trigger is available to be set by the user for states S1 - S31. When
set trigger is selected, a trigger is enabled, when the Sequencer enters
that state for the first time. The amount of data to be captured before
and after the trigger may be set as a percentage of pre-trigger,
between 0% and 100%. This may be done by positioning the pretrigger slider to the desired percentage. This feature allows the
evaluation of bus activity leading up to and after the triggering event.
The operation of the pre trigger in the data memory is conceptually
illustrated in Figure 64
Pre-Trigger Data: The capture of the specified percentage of the data prior to
the triggering event cannot be guaranteed and may in some
cases be 0. This can occur in cases where the triggering
event occurs before the required number pre-trigger event
data can be stored. In these cases the data display will show
fewer than the specified data points prior to the triggering
event.
Figure 64 Pre-Trigger Example, 20% Pre-Trigger
69
Page 76

TA660 User's Manual Catalyst Enterprises, Inc
Virtual Address Trigger
Make sure that the TA660 is operating in the Advanced Mode as shown on the Main
Menu bar below.
1. Click the Blue button on the Main Menu bar to open the Custom
Project dialog box shown in Figure 65.
For a Virtual Address Trigger project you must program/define:
• Virtual Address Data Capture conditions.
• A set of Event Patterns
• An Exerciser Program, if in State Analyzer & Exerciser
configuration.
Figure 65 Virtual Address Trigger Dialog Box
2. Set the Virtual Address Data Capture and Trigger Selection options.
3. Click on the Exerciser Program Tab and set the exerciser options as
described in Setting Exerciser Options on page 58.
4. Click on the Event Patterns dialog box and define up to 8 Event
Patterns as described in Defining Event Patterns on page 61
5. When complete click Run.
Note: Please note that there are several clocks, 6 to 8, between the time the
virtual address occurs until the EXT TRIG signal occurs.
Without Exerciser If you do not require exerciser generated bus traffic then
you may perform this action by switching to the Analyzer
Only configuration.
70
Page 77

TA660 User's Manual Catalyst Enterprises, Inc
State & Timing Analyzer
Make sure that the TA660 is in the State & Timing Analyzer
configuration and is operating in the Advanced Mode as shown on
the Main Menu bar below.
Click the Black button on the main menu bar to open the Timing
Measurement setup dialog box below.
Figure 66 Timing Measurement Setup Dialog Box
1. Choose the signals intended for timing violation analysis in the
Mask area of the dialog box and mask each signal that is to be
excluded from the analysis. Alternately you may click the 32 bit or
64 bit button and then uncheck or check the signals that you want
included in the analysis.
2. Set the desired Leading and Trailing edge values in the Parameters
area of the dialog box by either dragging the vertical L and T bars to
the desired position or by using the > >> or < << buttons to position
the timing definition bars incrementally. The >> and << buttons
move the bars in 2 ns increments and the > and < buttons in 0.10 ns
increments.
3. Click the Event Patterns and Sequencer Tabs and create Event
Patterns and a Sequencer Program as described in Defining Event
Patterns on page 62 and Programming the Sequencer on page 64 and
click Run.
71
Page 78

TA660 User's Manual Catalyst Enterprises, Inc
After the occurrence of a timing violation the timing violation display will open as shown
in Figure 67. The red signals represent timing violation. Bus signals are shown in a code.
As an example 00000080 indicates that the timing problem is for AD7, and 1000000C
indicate the problem is for AD28, AD3 & AD2 signals.
Figure 67 Timing Violation Results Display
To view the result as a list file output display, click the List
button.
Display Setup Use the setup screen to configure your display.
1. Click the Setup Screen button in the results display window to open
the Timing Error Signal selection dialog box as shown in Figure 68.
Figure 68 Timing Error Signal Selection
2. Select the signals for display from the Remaining Signals list and
click Add.
3. Select other display options such as display of time in units of time
or clocks, show gridlines etc. and click OK.
72
Page 79

TA660 User's Manual Catalyst Enterprises, Inc
For a detailed description of display manipulation, see Display Manipulation on page 95.
Search for Setup & Hold Limits
To search for setup and hold limits click the Setup/Hold Limits
search Icon to open the Setup and Hold Limits Mask definition
dialog box.
Figure 69 Setup and Hold Limits Mask Definition Dialog Box
Select the signals that you wish to ignore in the search and then click
Search. At the completion of the search the result is displayed as
shown Figure 70.
Figure 70 Setup and Hold Limits Search Result
73
Page 80

TA660 User's Manual Catalyst Enterprises, Inc
74
Page 81

TA660 User's Manual Catalyst Enterprises, Inc
Performance Analysis
Your TA660 offers you two ways to do Performance Analysis, Realtime and statistical. Performance Analysis may be performed in any
of the TA660 configurations.
Exerciser Program When operating in the State Analyzer & Exerciser
configuration, an exerciser program is required to generate
bus traffic.
Real-time analysis uses hardware counters and dual ported FIFOs.
The counters count the events at all times and interface with CPU via
the FIFO to pass the results. This method results in the most accurate
performance measurement since the counters are never stopped to be
read.
ADVANTAGE: Continuous Real-time measurement.
DISADVANTAGE: Measurement results are based on an
average. Minimum and maximum can
not be measured and reported in this
mode.
Statistical analysis is done by capturing the data
into memory and post processing it by software. In this mode TA660
allows the capture to occur after an occurrence(s) of events so the
captured data would include mostly the desired transactions and not
unrelated bus activities.
ADVANTAGE: Many more measurements are
DISADVANTAGE: Non Real-time, Software post
Real-time Analysis
Continuous, Real-Time Analysis measures bus performance of up to
533 MB/Sec, 64-bit 66MHz. The analysis measurements are taken in
accordance with predefined analysis projects (*.pep). Some
predefined analysis projects are included with your software for
immediate use or, you may create your own custom analysis projects
by setting analysis options, creating analysis equations, event patterns
and exerciser programs.
possible than in the Real-time method.
It is possible to measure Min, Max
and Average counts.
processing the data.
75
Page 82

TA660 User's Manual Catalyst Enterprises, Inc
Performing a Pre-defined Analysis
Click the Performance Analysis Icon on the menu bar to open
the Performance Analysis dialog box.
Figure 71 Performance Analysis Dialog Box
1. Click Load to open the Load dialog box.
2. Select a pre-defined analysis file and click Open to load the file.
3. Click Run to perform an analysis.
Creating a New Analysis Project
To create a new analysis program you must define/program:
• Performance Analysis Options.
• Event Patterns
• Analysis Equations
• An Exerciser Program
76
Page 83

TA660 User's Manual Catalyst Enterprises, Inc
Setting Analysis Options:
To set analysis options make sure that the Performance Analysis Tab has been selected
and click on the Advanced Options button in the Performance Analysis Dialog Box to
open the Analysis Type Setting dialog box shown below.
ANALYSIS TYPE
Entire Bus To count the events defined in the
event file at all addresses.
Address Override Specific Address and Events at Specific Address
selections override the addresses set in the event file.
Specific Address To count only all of the address events
defined in the event tab.
Events at a Specific Address To count all of the events
defined in the event tab after the
occurrence of the specific address
selected. This mode may be used to
measure a data burst rate of a specific
transfer.
Specific Address Selecting the Specific Address or the Events at a Specific
Address enables address entry on the Performance Analysis
dialog box.
Per Event Tab To count bus cycles such as memory
and I/O operations at two or more
addresses that are specified in the
event tab, e.g. I/O operation of two
different agents.
77
Page 84

TA660 User's Manual Catalyst Enterprises, Inc
UPDATE INTERVAL
Set the update rate between 500 us and 10 minutes by positioning the
Update Interval slider with the mouse cursor.
ANALYSIS WINDOW SETTINGS
Percent Ratio Select Based on The Greatest to
display results relative to the largest
value or Based on Clock, to display
an absolute measurement of all values.
Select *1 , *10, *20, *50 or *100 to
zoom the display scale from 100% full
scale to 1% full scale.
Reset/Accumulate With Reset selected, the measurement
counters are reset at the beginning of
each interval. With Accumulative
selected, the measurement counters
will continue to add up.
Chart Mode Choose Only Update Period to
Show Expression Chose Report Mode and or Chart
Defining Event Patterns
1. Click the Event Patterns Tab
2. Define the Event Patterns as described in Defining Event Patterns on
page 60.
display the default number of period
only and choose Periods and specify
number updated periods desired to see
on the display.
Mode to see the result of the
equations in both report format as well
as graphical.
78
Page 85

TA660 User's Manual Catalyst Enterprises, Inc
Writing And Editing Analysis Equations
Analysis equations are needed for generating the results of the measurement on the
Reports window. They are entered in simple algebraic format observing standard
algebraic conventions for operations using EV1 to EV8 (or their corresponding name) as
the variables, Clock is used for the number of system clocks, and Freq is used for system
frequency. The "Description" line is used to enter the report title.
1. Click the Equation Tab to open the Equation Editor dialog box as
shown in Figure 72.
Figure 72 Equation Editor Dialog Box
Add a New Line To add a new equation line at the bottom of the list, click
the Add button.
Insert a Line To insert a new equation above an existing equation line
click the cursor in the line above which you wish to insert
the new line and then click the Insert button.
New Equation Double click in a blank Expression line to open the
Expression Dialog.
1. Type an equation name in the Name edit box.
2. Enter the equation in the Expression edit box using the Available
Items and operators from the Equation tab.
3. Enter the units to be displayed in the Unit edit box.
Edit Equation Double click in the line of the equation that you wish to edit
to open the Expression Dialog and perform the necessary
editing.
79
Page 86

TA660 User's Manual Catalyst Enterprises, Inc
Programming the Exerciser
1. Click the Exerciser Program tab.
2. Program the Exerciser as described in Programming the Exerciser on
page 55
Save Results If you would like to save the analysis results, click Save
data into the File enter the number of samples you wish to
save and the name of the output file.
Save Settings To save the measurement setup, first select Save to open the
Save As Dialog Box, enter a new file name to save as a
*.pep file and click Save.
3. To perform the analysis Click OK.
Figure 73 Analysis Real Time Display
4. In the Display area, select any combination from the available
display options, 2D, 3D, Stacked, etc… . From the “Graphic
Settings” in the Performance analysis menu you may select scale for
vertical and horizontal display.
80
Page 87

TA660 User's Manual Catalyst Enterprises, Inc
Saved Performance Analysis
Review
Your TA660 offers you the ability to review the results of previously
performed and saved performance analyses.
Click View on the menu bar and then select Performance
Analysis Review to open the Open dialog box.
Select a previously generated performance analysis file *.paf and
click OK to open the performance analysis windows and a Statistics
Review Window for that analysis file as shown in Figure 74.
Figure 74 Review of Saved Performance Analysis
81
Page 88

TA660 User's Manual Catalyst Enterprises, Inc
To review the previously saved performance analysis you may drag
the scroll bar on the Play Control Panel to the desired location or
command it to step through automatically.
Trace Statistics
Trace Statistics analysis is implemented by capturing data in memory
and then post processing it with software. The analysis software is
capable of measuring important parameters such as Minimum and
Maximum latency occurrences for any target or user defined specific
target, command utilization such as how many times an I/O write
versus I/O read occurs or, how many times memory commands occur.
on page 31 Lists the parameters that you may select for a report.
Click the Trace Statistics Icon on the menu bar to open the
Trace Statistics dialog box.
Creating a New Trace Project
To create a new trace project you must define/program:
• Trace Statistics Options.
• Event Patterns
• A sequencer program
• Analysis Equations
• An Exerciser Program
82
Figure 75 Trace Statistics Dialog Box
Page 89

TA660 User's Manual Catalyst Enterprises, Inc
Setting Trace Options
Selecting Parameters Select the parameters to be measured from the Analyze List
Of shown in Figure 75. Move the selected parameter to the
right window for software to perform interrogation on that
parameter during post processing by clicking the =>> button
next to the Of edit box. Parameters may be defined as
minimum, average, maximum or count and or percent
depending on which unit applies. Parameters may also be
defined, if applicable, by address type.
Optimum Number of Samples Set the amount of data to be captured in the
memory for post processing for each interval. The larger the
number of samples the more time is required for
downloading and processing, Therefore you should select
an optimum number of samples to be captured to memory
such as 1000. This takes about one second to process. If
your application requires more data then a larger number
should be entered.
Update Interval If a small number of data samples is expected to be
captured, say 1000, and the application does not require
repeated measurement, you may want to sample data once
every 5 or 10 seconds by changing the Update Interval to 5
or 10 seconds as required. . The larger of the two number of
data samples or faster update rate will be the dominating
setup for data capture time.
View List Select the items you want to view on the display by
highlighting and clicking the items in the View List.
Display as Text The report in text as well as graphics may be displayed on
the screen during run time by checking the Report box.
Save Measurements All measurements may also be saved and reviewed later,
select SAVE and specify the output file name. The results
may be viewed under view.
83
Page 90

TA660 User's Manual Catalyst Enterprises, Inc
Defining Event Patterns
1. Click the Event Patterns Tab
2. Define the Event Patterns as described in Defining Event Patterns on
page 61.
Programming the Exerciser
1. Click the Exerciser Program tab.
2. Program the Exerciser as described in Programming the Exerciser on
page 55
Defining Equations
1. Click the Equations Tab
2. Define Equations as described in Writing And Editing Analysis
Equations on page 79.
Running the Trace Project
1. After all of the configuration and programming steps have been
completed, click the Trace Statistics Tab and verify that the items
that you wish to collect statistics on are highlighted.
2. Click Run to collect trace statistics.
84
Page 91

TA660 User's Manual Catalyst Enterprises, Inc
Example Files
A number of pre-defined projects with defined event patterns and
sequencer programs are include with your analyzer. You may Load a
complete project to perform an immediate data capture and trigger, or
you may Import event patterns and sequencer programs to assemble
a project without much programming.
Create a Project Click the Black button on the menu bar to open a Project
Definition dialog box.
Figure 76 Project Definition Dialog Box
Load a Project To load a pre-defined project click the Load button on the
bottom of the Project Definition Dialog Box.
Select a pre-defined project from the examples folder and
click OK.
85
Page 92

TA660 User's Manual Catalyst Enterprises, Inc
Import a Sequencer Program To import a pre-defined sequencer program,
open a new project, select the sequencer tab and click the
Import button on the bottom of the Project Definition
Dialog Box.
Select a pre-defined sequencer from the examples folder
and click OK.
Import an Event Pattern To import a pre-defined event pattern, select the event
tab and click the I mport button on the bottom of the Project
Definition Dialog Box.
Select a pre-defined event from the examples folder and
click OK.
86
Page 93

TA660 User's Manual Catalyst Enterprises, Inc
Compliance Device Test
The TA660A incorporates a built in “Compliance Device Test” that
performs the PCI compliance checklist. The Compliance Device
Test is available only while operating in the Analyzer & Exerciser
configuration.
To view a comprehensive description of the PCI Compliance
Checklist, click Compliance on the menu bar and then select View
check list which opens the checklist as a Microsoft Word for 2.1
spec and Acrobat format for 2.2 spec that you may review on line or
print.
NOTE 1: To view the Compliance checklist version 2.1 specifications requires
Microsoft Word to be installed on your system.
NOTE 2: To view the C ompliance checklist version 2.2 requires Acrobat reader
to be installed on your system.
87
Page 94

TA660 User's Manual Catalyst Enterprises, Inc
Executing a Compliance Device Test
Click “Start Test” from the Compliance drop down list on the menu
bar to open the Compliance Tests Configuration dialog box.
Note: Be sure that your board is not involved in running any
application program during the Compliance Test.
Figure 77 Compliance Tests Configuration Dialog Box
Click the browse button to the right of the “Found Devices” field to
have the TA660A search for all PCI devices on the bus. The software
will then display a list of found devices with the ID code and the
vendor code for each of the devices found on the bus.
1- Select the device you like to perform the test on.
2- Choose the desired tests from the “Tests List” and click Add >.
Test Description For a description of each test, click on a test and view the
test description on the bottom of the Compliance Tests
Configuration dialog box.
88
Page 95

TA660 User's Manual Catalyst Enterprises, Inc
Setting the Compliance Test Options
Select the desired device for compliance test and open the
Compliance Tests Options by clicking the Options button.
Figure 78 Compliance Tests Options Selection Dialog Box
Configuration Space Tests Check the device to be tested as Master, Target or
both.
Master Protocol Tests Select protocol test options such as I/O, Memory. For
Master test the user is expected to interact and cause his
master card to perform a series of expected transactions. For
the list of these transactions and the order they appear refer
to the " Compliance Test_IUT User Guide.doc" . This
document should be installed in "C:\Program
files\Catalyst\Doc" directory.
DEVSEL# Speed Select the target DEVSEL# decode speed.
Continuous Mode In cases where you would like the test to be performed
repetitively, check the Continuous Mode box and set the
number of times to be repeated. Click OK to complete
setting the options.
Checklist Compatible with Select the PCI specification that you wish the test to
follow, PCI 2.1 or PCI 2.2.
89
Page 96

TA660 User's Manual Catalyst Enterprises, Inc
Save Configuration You may save the test configuration for use later by clicking
Save. Assign a test file name to the configuration and click
Save.
Report Mode When Overview is checked, only test results are displayed,
however, when Detail is checked all details are listed and
explained.
Target Protocol Tests
Executing a Saved Configuration
Run Previous Configuration To run a Compliance test with a previously saved
configuration, click Load and select a configuration file.
Specify the output file name where the test results are to be saved and
click Start.
After clicking Start several messages may display, depending on the
selected test, to guide the user through the test.
Example Test
The following test (1.09) finds the addresses that are free for the
TA660 as target.
90
Figure 79 Compliance Test Setup
Page 97

TA660 User's Manual Catalyst Enterprises, Inc
Choose test (1.09) and click Add -> and then Start.
After a short time the device found dialog as shown in Figure 80 will
open, requesting you to perform an action.
Figure 80 Device Found Dialog
Perform the requested action and click OK.
Repeat Process for all displayed windows.
91
Page 98

TA660 User's Manual Catalyst Enterprises, Inc
After the final action is performed, a Compliance Result report is
displayed.
Figure 81 Compliance Result Report
This report may be printed for future reference.
An additional report is generated on the display during this test. This
report may be used to access the details on the performed test for the
data generated and captured on the bus during the test. To access this
data double click on the message line for the desired test to open a
92
Page 99

TA660 User's Manual Catalyst Enterprises, Inc
display with the data, written and read, from the IUT board. For NO
responses the cursor is usually located at the non compliant event as
shown in Figure 82.
Figure 82 Display With Non Compliant Trigger
93
Page 100

TA660 User's Manual Catalyst Enterprises, Inc
Program Device
The Program Device function initializes the configuration registers
for use in a passive motherboard.
To program a device, click “Program Device” from the Compliance
dropdown list.
After a brief period a list of programmable devices appears as shown
in Figure 83.
Figure 83 Select Device for Programming Dialog
Check the box next to the device you wish to program and then click
the Program Checked Devices button.
Figure 84 Programming Device Complete Message
94
 Loading...