

Page 1
Getting Started
Manual
WaveRunner 6 Zi
and 12-Bit HRO
Oscilloscopes
Page 2

Page 3

WaveRunner 6 Zi and
12-Bit HRO Oscilloscopes
Getting Started Manual
January 2013
Page 4

© 2013 Teledyne LeCroy, Inc. All rights reserved.
Unauthorized duplication of Teledyne LeCroy documentation materials other than for
internal sales and distribution purposes is strictly prohibited. Clients may distribute and
duplicate Teledyne LeCroy documentation for their own internal educational purposes.
WaveRunner 6 Zi and Teledyne LeCroy are registered trademarks of Teledyne LeCroy, Inc.
Windows is a registered trademark of Microsoft Corporation. Other product or brand names
are trademarks or requested trademarks of their respective holders. Information in this
publication supersedes all earlier versions. Specifications subject to change without notice.
Warranty
NOTE: THE WARRANTY BELOW REPLACES ALL OTHER WARRANTIES, EXPRESSED OR IMPLIED,
INCLUDING BUT NOT LIMITED TO ANY IMPLIED WARRANTY OF MERCHANTABILITY, FITNESS,
OR ADEQUACY FOR ANY PARTICULAR PURPOSE OR USE. TELEDYNE LECROY SHALL NOT BE
LIABLE FOR ANY SPECIAL, INCIDENTAL, OR CONSEQUENTIAL DAMAGES, WHETHER IN
CONTRACT OR OTHERWISE. THE CUSTOMER IS RESPONSIBLE FOR THE TRANSPORTATION
AND INSURANCE CHARGES FOR THE RETURN OF PRODUCTS TO THE SERVICE FACILITY.
TELEDYNE LECROY WILL RETURN ALL PRODUCTS UNDER WARRANTY WITH TRANSPORT
PREPAID.
The oscilloscope is warranted for normal use and operation, within specifications, for a
period of three years from shipment. Teledyne LeCroy will either repair or, at our option,
replace any product returned to one of our authorized service centers within this period.
However, in order to do this we must first examine the product and find that it is defective
due to workmanship or materials and not due to misuse, neglect, accident, or abnormal
conditions or operation.
Teledyne LeCroy shall not be responsible for any defect, damage, or failure caused by any of
the following: a) attempted repairs or installations by personnel other than Teledyne LeCroy
representatives or b) improper connection to incompatible equipment, or c) for any damage
or malfunction caused by the use of non-Teledyne LeCroy supplies. Furthermore, Teledyne
LeCroy shall not be obligated to service a product that has been modified or integrated
where the modification or integration increases the task duration or difficulty of servicing
the oscilloscope. Spare and replacement parts, and repairs, all have a 90-day warranty.
The oscilloscope's firmware has been thoroughly tested and is presumed to be functional.
Nevertheless, it is supplied without warranty of any kind covering detailed performance.
Products not made by Teledyne LeCroy are covered solely by the warranty of the original
equipment manufacturer.
922136-00 Rev A
January 2013
Page 5

Getting Started Manual
922136-00 Rev A
i
TABLE OF CONTENTS
Welcome ............................................................................................... 1
How This Manual Is Organized ............................................................... 2
Safety Instructions ................................................................................. 3
Symbols ................................................................................................... 3
Precautions ............................................................................................. 3
Operating Environment .......................................................................... 4
Cooling .................................................................................................... 4
Cleaning .................................................................................................. 5
Calibration............................................................................................... 5
Power ...................................................................................................... 6
Hardware .............................................................................................. 8
The Front of Your Oscilloscope ............................................................... 8
I/O Panel ............................................................................................... 12
The Back of Your Oscilloscope .............................................................. 14
Basic Controls ...................................................................................... 17
Hardware and Software Controls ......................................................... 17
Front Panel Controls ............................................................................. 18
Front Panel Control Groupings ............................................................. 19
Probe / Signal Connection Interfaces .................................................... 31
Probe Interfaces.................................................................................... 31
ProBus Interface ................................................................................... 32
Probes ................................................................................................... 33
Passive Probe Compensation ............................................................... 34
Display Dashboard ............................................................................... 35
Screen Layout, Groupings, and Controls .............................................. 35
Menu Bar .............................................................................................. 35
The Quick Access Toolbar ..................................................................... 36
The Signal Display Grid ......................................................................... 36
Trace Descriptor Labels ........................................................................ 39
B
Page 6

WaveRunner 6 Zi and 12-Bit HRO Oscilloscopes
ii
922136-00 Rev A
Dialog Area ............................................................................................ 42
Shortcut Toolbar ................................................................................... 48
Message Bar .......................................................................................... 49
Turning on Channels and Traces ............................................................50
Timebase ..............................................................................................51
Overview ............................................................................................... 51
Timebase Setup and Control ................................................................. 51
Sampling Modes ...................................................................................52
Overview ............................................................................................... 52
Selecting a Sampling Mode ................................................................... 52
Single-shot Sampling Mode .................................................................. 52
Sequence Sampling Mode – Working with Segments .......................... 53
RIS Sampling Mode for Higher Sampling Rates .................................... 59
Roll Mode .............................................................................................. 60
Vertical .................................................................................................61
Overview ............................................................................................... 61
Channel Controls ................................................................................... 61
Actions for Trace C1 Buttons ................................................................ 63
Pre-Processing Controls ........................................................................ 64
Trigger ..................................................................................................68
Overview ............................................................................................... 68
Trigger Types ......................................................................................... 69
Trigger Settings ..................................................................................... 73
Trigger Setup ......................................................................................... 74
TriggerScan............................................................................................ 79
Viewing Waveforms ..............................................................................83
Display ................................................................................................... 83
Persistence ............................................................................................ 87
WaveStream Display Mode................................................................... 89
Adjusting Trace Intensity ...................................................................... 90
Page 7

Getting Started Manual
922136-00 Rev A
iii
Zooming Waveforms ............................................................................ 91
Overview ............................................................................................... 91
Zooming a Single Channel ..................................................................... 92
Touch-and-Drag Zooming ..................................................................... 94
Quickly Zooming Waveforms ................................................................ 94
Measuring with Cursors ....................................................................... 95
Overview ............................................................................................... 95
Cursor Types ......................................................................................... 95
Cursors Setup ........................................................................................ 95
Measurement Parameters .................................................................... 99
Overview ............................................................................................... 99
Parameter Setup ................................................................................. 100
Measure Modes .................................................................................. 101
Help Markers ...................................................................................... 102
Measurement Parameter Analysis ...................................................... 104
Overview ............................................................................................. 104
Creating and Viewing a Histogram ..................................................... 106
Creating and Viewing a Trend ............................................................. 112
Creating a Track View ......................................................................... 113
Pass-Fail Parameter Testing ................................................................ 114
Math ................................................................................................. 121
Math Traces and Functions Overview ................................................ 121
Math Setup ......................................................................................... 122
Mask Testing ..................................................................................... 124
Creating a Mask .................................................................................. 124
Quick Access to Pass/Fail Setup Dialogs ............................................. 125
Removing a Mask from the Display .................................................... 126
Right-Hand Dialogs ............................................................................. 126
WaveScan Overview .......................................................................... 127
Signal Views ........................................................................................ 128
B
Page 8

WaveRunner 6 Zi and 12-Bit HRO Oscilloscopes
iv
922136-00 Rev A
Search Modes ..................................................................................... 129
Parameter Measurements .................................................................. 129
Sampling Mode ................................................................................... 129
Customization Overview ..................................................................... 130
Documenting Work with LabNotebook ................................................ 131
Overview ............................................................................................. 131
LabNotebook Dialog ............................................................................ 131
Save/Recall ......................................................................................... 136
Overview ............................................................................................. 136
Saving and Recalling Setups ................................................................ 137
Saving and Recalling Waveforms ........................................................ 138
Utilities .............................................................................................. 143
Utilities Setup ...................................................................................... 143
Disk Utilities ........................................................................................ 156
Preferences ......................................................................................... 158
System Recovery Tool ......................................................................... 164
Restoring Software Using Acronis® ..................................................... 164
Reference ........................................................................................... 168
Specifications ...................................................................................... 168
Certifications ....................................................................................... 168
End-User License Agreement for Teledyne LeCroy® X-Stream Software
............................................................................................................ 171
Windows® License Agreement ............................................................ 182
Contact Teledyne LeCroy .................................................................... 183
Index .................................................................................................. 184
Page 9

Getting Started Manual
922136-00 Rev A
1
Welcome
Thank you for purchasing a Teledyne LeCroy product. We're certain you'll
be pleased with the detailed features so unique to our instruments.
With 16 times more resolution, unmatched accuracy and impressive signal
fidelity, Teledyne LeCroy High Resolution Oscilloscopes are a new breed of
instrument delivering more vertical resolution, unmatched accuracy,
impressive signal fidelity, and true 12 bit vertical resolution.
This WaveRunner6 Zi and 12-Bit HRO Getting Started Manual is designed
to cover important safety and installation information for your
oscilloscope, along with standard procedures so you're quickly working on
waveforms. The Teledyne LeCroy website at teledynelecroy.com maintains
the most current specification information and the online help file on your
instrument may be accessed for more comprehensive documentation.
Sections of the online help residing on your oscilloscope may be printed
and transferring the help file itself to a USB memory device is a fairly
common procedure. For details on how to access your online help file can
be found in a .pdf file on the desktop of your oscilloscope or you can search
for Operator's Manual for Zi Oscilloscopes on the Teledyne LeCroy website
at teledynelecroy.com.
When your product is delivered, verify that all items on the packing list or
invoice copy have been shipped to you. Contact your nearest Teledyne
LeCroy customer service center or national distributor if anything is missing
or damaged. If there is something missing or damaged, and you do not
contact us immediately, we cannot be responsible for replacement.
We truly hope you enjoy using Teledyne LeCroy's fine products.
Sincerely,
David C. Graef
Teledyne LeCroy Corporation
Vice President and Chief Technology Officer
B
Page 10

WaveRunner 6 Zi and 12-Bit HRO
2
922136-00 Rev A
How This Manual Is Organized
First, we cover your instrument's unique hardware and software features in
the following sections:
Hardware
Basic Controls
Probe and Signal Connection Interfaces
Display Dashboard
Turning on Channels and Traces
Essential Core Oscilloscope Functions
This section covers the essential Teledyne LeCroy oscilloscope core
functions, such as:
Timebase
Sampling Modes
Vertical
Trigger
Viewing
Zooming
Measuring
Math
Masks
Customization
LabNotebook
Save/Recall
Utilities
Reference
The Reference section is set aside and covers items like Certifications, how
to Contact Teledyne LeCroy for Support, and to always maintains the most
current specification information. The website should always be checked
for frequent updates.
Page 11
Getting Started Manual
922136-00 Rev A
3
CAUTION of potential damage to instrument, or WARNING of
potential for bodily injury. Attend to the accompanying
information to protect against personal injury or damage. Do
not proceed until conditions are fully understood and met.
High voltage. Risk of electric shock.
Measurement ground connection.
Safety (protective) ground connection.
Alternating Current.
Standby Power (front of instrument).
Safety Instructions
This section contains instructions that must be observed to keep the
instrument operating in a correct and safe condition. You are required to
follow generally accepted safety procedures in addition to the precautions
specified in this section. The overall safety of any system incorporating
this instrument is the responsibility of the assembler of the system.
Symbols
These symbols appear on the instrument's front or rear panels and in its
documentation to alert you to important safety considerations.
Precautions
Use proper power cord. Use only the power cord shipped with this
instrument and certified for the country of use.
Maintain ground. This product is grounded through the power cord
grounding conductor. To avoid electric shock, connect only to a grounded
mating outlet.
Connect and disconnect properly. Do not connect/disconnect probes or
test leads while they are connected to a voltage source.
B
Page 12

WaveRunner 6 Zi and 12-Bit HRO
4
922136-00 Rev A
Observe all terminal ratings. Do not apply a voltage to any input (C1, C2,
C3, C4 or EXT) that exceeds the maximum rating of that input. Refer to the
front of the oscilloscope for maximum input ratings.
Use only within operational environment listed. Do not use in wet or
explosive atmospheres.
Use indoors only.
Keep product surfaces clean and dry.
Do not block the cooling vents. Leave a minimum six-inch (15 cm) gap
between the instrument and the nearest object. Keep the underside clear
of papers and other objects.
Do not remove the covers or inside parts. Refer all maintenance to
qualified service personnel.
Do not operate with suspected failures. Do not use the product if any part
is damaged. Obviously incorrect measurement behaviors (such as failure to
calibrate) might indicate impairment due to hazardous live electrical
quantities. Cease operation immediately and sequester the instrument
from inadvertent use.
Operating Environment
Temperature: 5 to 40 °C.
Humidity: Maximum relative humidity 80 % for temperatures up to
31° C decreasing linearly to 50 % relative humidity at 40° C (or at the upper
operational temperature limit).
Altitude: Up to 10,000 ft (3,048 m) at or below 25° C.
Cooling
The instrument relies on forced air cooling with internal fans and vents.
Take care to avoid restricting the airflow to any part of the oscilloscope.
Around the sides and rear, leave a minimum of 15 cm (6 inches) between
the instrument and the nearest object. At the bottom, the oscilloscope feet
(up or down) provide adequate clearance.
CAUTION. Do not block oscilloscope vents. Always keep the area
beneath the oscilloscope clear of paper and other items.
Page 13

Getting Started Manual
922136-00 Rev A
5
The instrument also has internal fan control circuitry that regulates the fan
speed based on the ambient temperature. This is performed automatically
after start-up.
Cleaning
Clean only the exterior of the oscilloscope using a damp, soft cloth. Do not
use harsh chemicals or abrasive elements. Under no circumstances
submerge the instrument or allow moisture to penetrate it. Avoid electric
shock by unplugging the power cord from the AC outlet before cleaning.
CAUTION. Do not attempt to clean internal parts. Refer to qualified
service personnel.
Calibration
The oscilloscope is calibrated at the factory prior to being shipped. The
recommended calibration interval is one year. Calibration should be
performed by qualified personnel only.
The oscilloscope software includes automatic and manual calibration
functions.
CAUTION. It is required that all inputs be removed from the
oscilloscope prior to performing a manual calibration.
Schedule an annual factory calibration as part of your regular maintenance.
Extended warranty, calibration, and upgrade plans are available for
purchase. Contact your Teledyne LeCroy sales representative or
customersupport@teledynelecroy.com to purchase a service plan.
B
Page 14

WaveRunner 6 Zi and 12-Bit HRO
6
922136-00 Rev A
Power
AC Power Source
100-240 VAC (+/-10%) at 50/60 Hz (+/-5%)
100-120 VAC (+/-10%) at 400 Hz (+/-5%)
Installation Category: 300V CAT II
Manual voltage selection is not required because the instrument
automatically adapts to line voltage.
Power Consumption
8-BIT MODELS:
Power Consumption (Nominal): 425 Watts (425 VA)
Max Power Consumption (with all PC peripherals, active probes connected
to 4 channels, and MSO active): 500 Watts (500 VA)
12-BIT MODELS:
Power Consumption (Nominal): 325 Watts (325 VA)
Max Power Consumption (with all PC peripherals, active probes connected
to 4 channels, and MSO active): 425 Watts (425 VA)
Power consumption in Standby Mode: 15 Watts
Power and Ground Connections
The instrument is provided with a 10A/250V 18AWG rated grounded cord
set containing a molded three-terminal polarized plug and a standard
IEC320 (Type C13) connector for making line voltage and safety ground
connections.
The AC inlet ground is connected directly to the frame of the instrument.
For adequate protection again electric shock, connect to a mating outlet
with a safety ground contact.
WARNING. Interrupting the protective conductor inside or outside
the oscilloscope, or disconnecting the safety ground terminal,
creates a hazardous situation. Intentional interruption is prohibited.
Page 15

Getting Started Manual
922136-00 Rev A
7
Standby Power
The Standby Power button controls the operational state of the
oscilloscope. Press the button to switch the instrument On or into Standby
mode (Off).
Always use the Power button or the File > Shutdown menu option to
execute a proper shut down process and preserve settings before powering
down.
Powering off does not disconnect the oscilloscope from the AC power
supply. The only way to fully power down the instrument is to shut down
then unplug the AC power cord from the outlet. We recommend
unplugging the instrument if it will be unused for a long period of time.
B
Page 16
WaveRunner 6 Zi and 12-Bit HRO
8
922136-00 Rev A
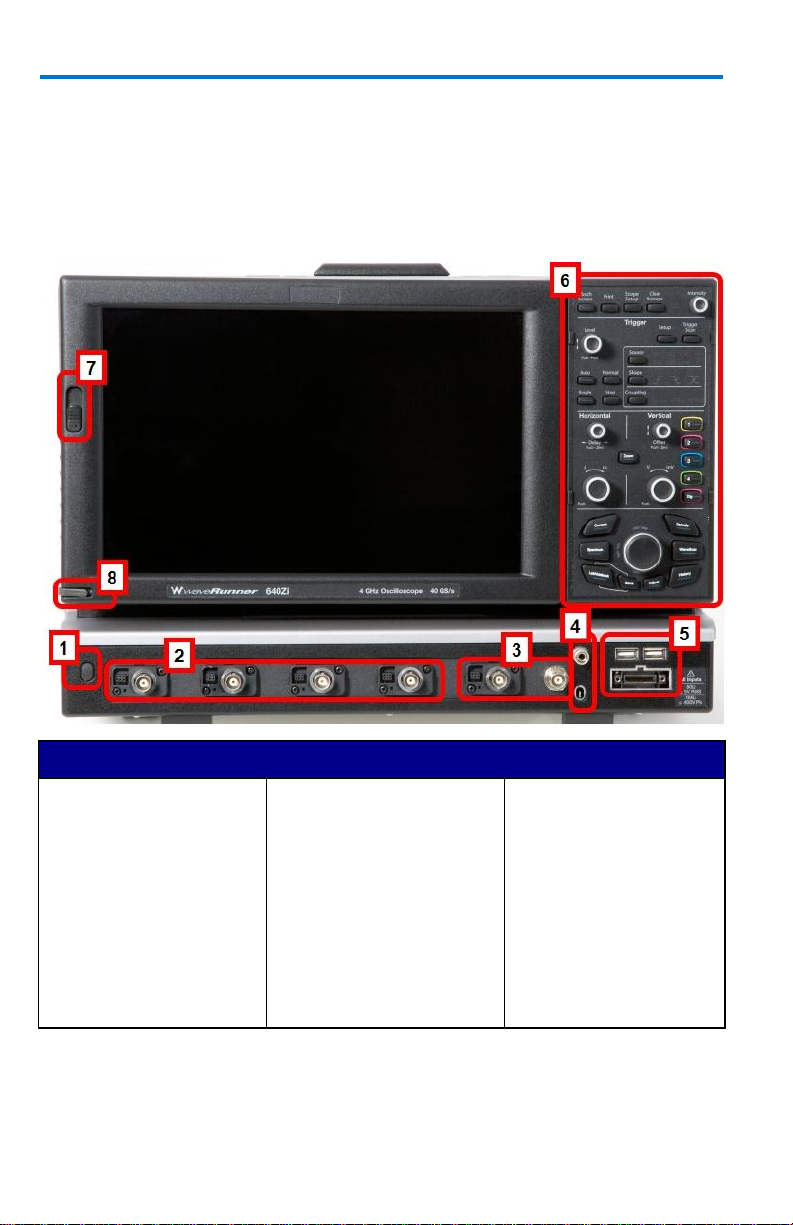
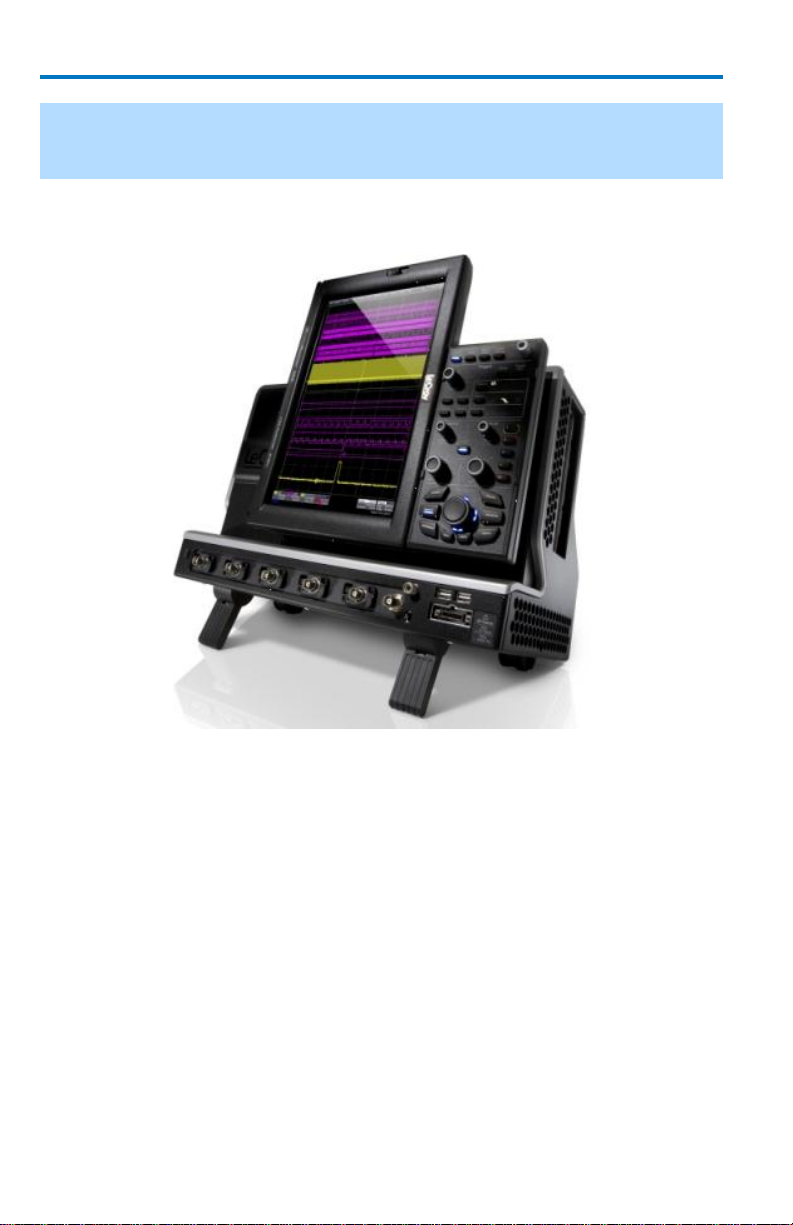
Number and Description
1. Power Button
2. Channel Inputs
3. EXT Input and
AUX Output
connectors
4. Ground Connector
and Probe
Calibration Hook
5. USB Connections
and Teledyne
LeCroy Bus Port
6. Front Panel
Control
7. Rotating Display
Release Switch
8. Touch Screen
Stylus
Hardware
The Front of Your Oscilloscope
Numbered labels on this image correspond with descriptions on the
following table.
Page 17
Getting Started Manual
922136-00 Rev A
9
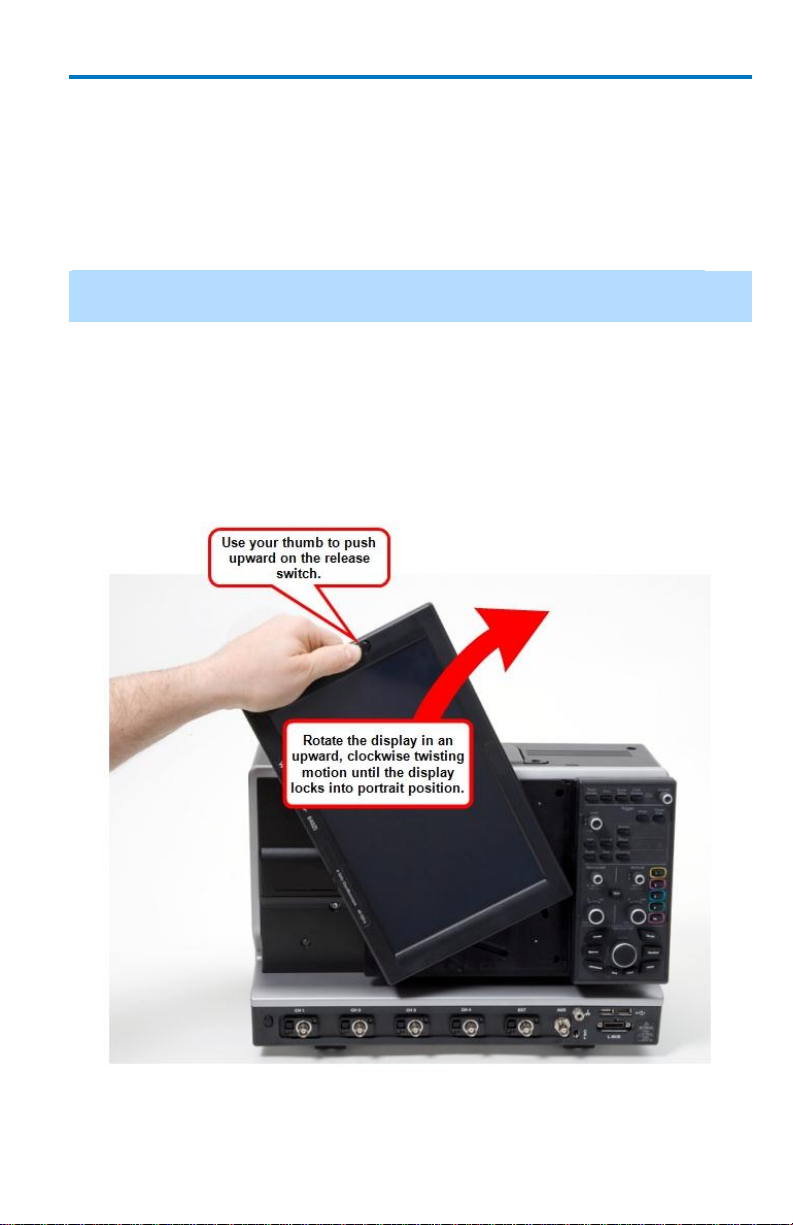
Rotating and Tilting the Display
The display panel allows for Rotation and Tilting adjustments. These
adjustments allow you to position your instrument with unmatched
versatility.
Rotate and Tilt your display using the following instructions:
Note: Your oscilloscope should always be firmly planted on a solid supporting
surface at all times.
ROTATING THE DISPLAY
Rotate the display by firmly grasping the left side of the display. Use your
thumb to push upward on the release switch (on the front-left side of the
display), and then use your wrist to forcibly rotate the display in an
upward, clockwise twisting motion until the display locks into portrait
position.
Rotating the display from landscape (horizontal) to portrait (vertical) positioning.
B
Page 18
WaveRunner 6 Zi and 12-Bit HRO
10
922136-00 Rev A
Note: For models without a latch on the left side of the display, grip the same side
firmly and rotate in an upward, clockwise twisting motion. The track clicks in and
out of the two positions without the use of the latch.
The user interface then adjusts its layout from landscape (horizontal) to
portrait (vertical). This setup is ideal for viewing high-amplitude signals.
The Rotating Display shown in portrait layout position.
Reverse the process by grasping the now upper side of the display. Again,
use your thumb to push upward on the release switch; but, now use your
wrist to forcibly rotate the display in a downward, counter-clockwise
twisting motion until the display locks back into landscape position.
The user interface then adjusts the layout back from portrait (vertical) to
landscape (horizontal).
Page 19
Getting Started Manual
922136-00 Rev A
11
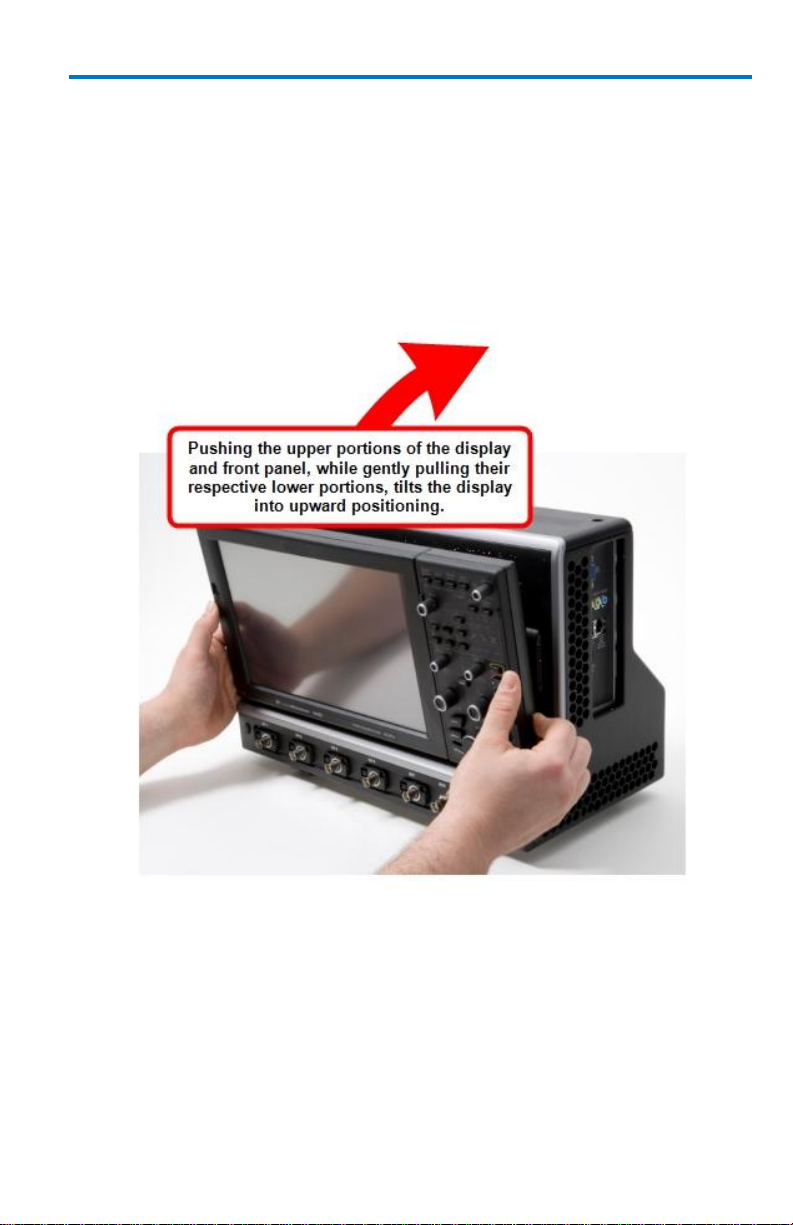
TILTING THE DISPLAY
The display can be tilted (while in either Landscape or Portrait mode) into
Upward or Downward positioning for convenience.
Tilt the display by firmly grasping the far left side of the display and the far
right side of the front panel. Use your wrists to forcibly tilt the display by
pushing the upper-portions forward (to tilt upward) or the lower-portions
backward (to tilt downward) until the desired positioning is reached.
Tilting the display by pushing the upper-portions of the display/front panel
forward - tilting the display from downward to upward positioning.
B
Page 20
WaveRunner 6 Zi and 12-Bit HRO
12
922136-00 Rev A
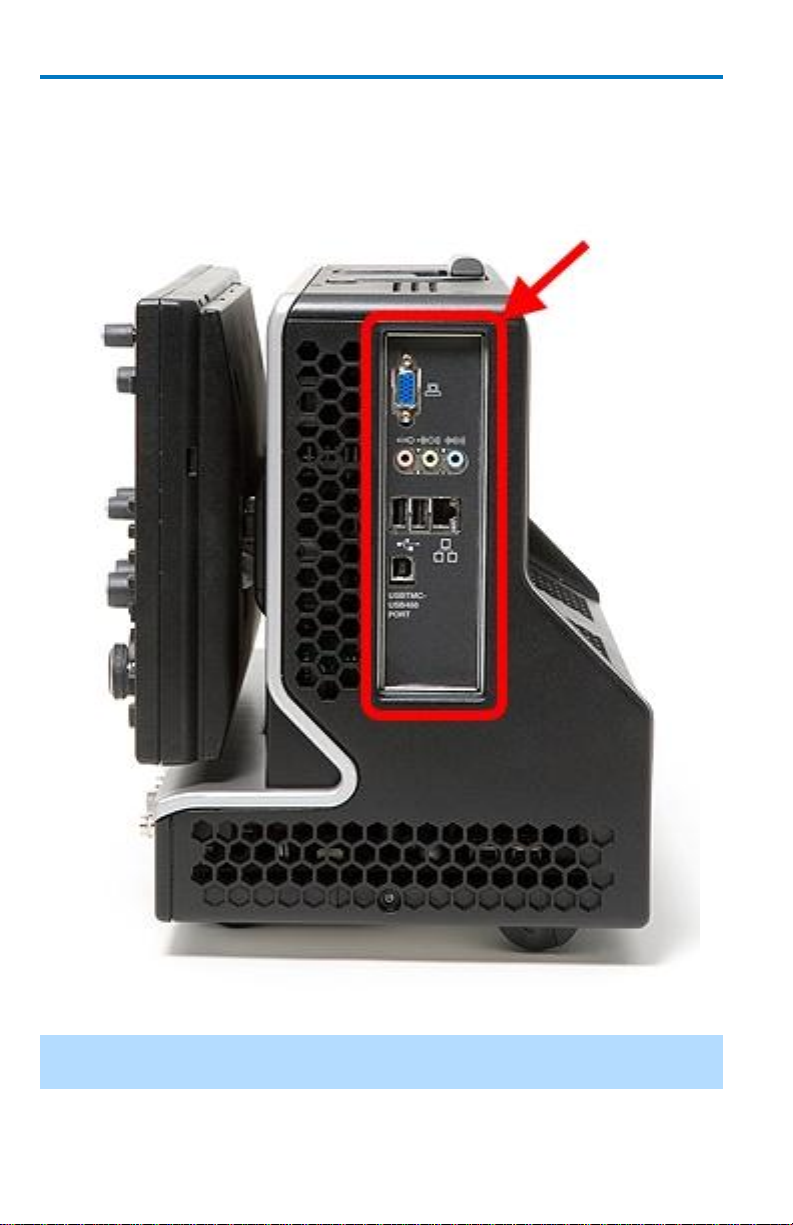
I/O Panel
The I/O Panel is located on the right side (facing) of the instrument as
follows:
Note: A Teledyne LeCroy Bus (LBUS) connection is located on the The Front of
Your Oscilloscope (on page 3).
Page 21
Getting Started Manual
922136-00 Rev A
13
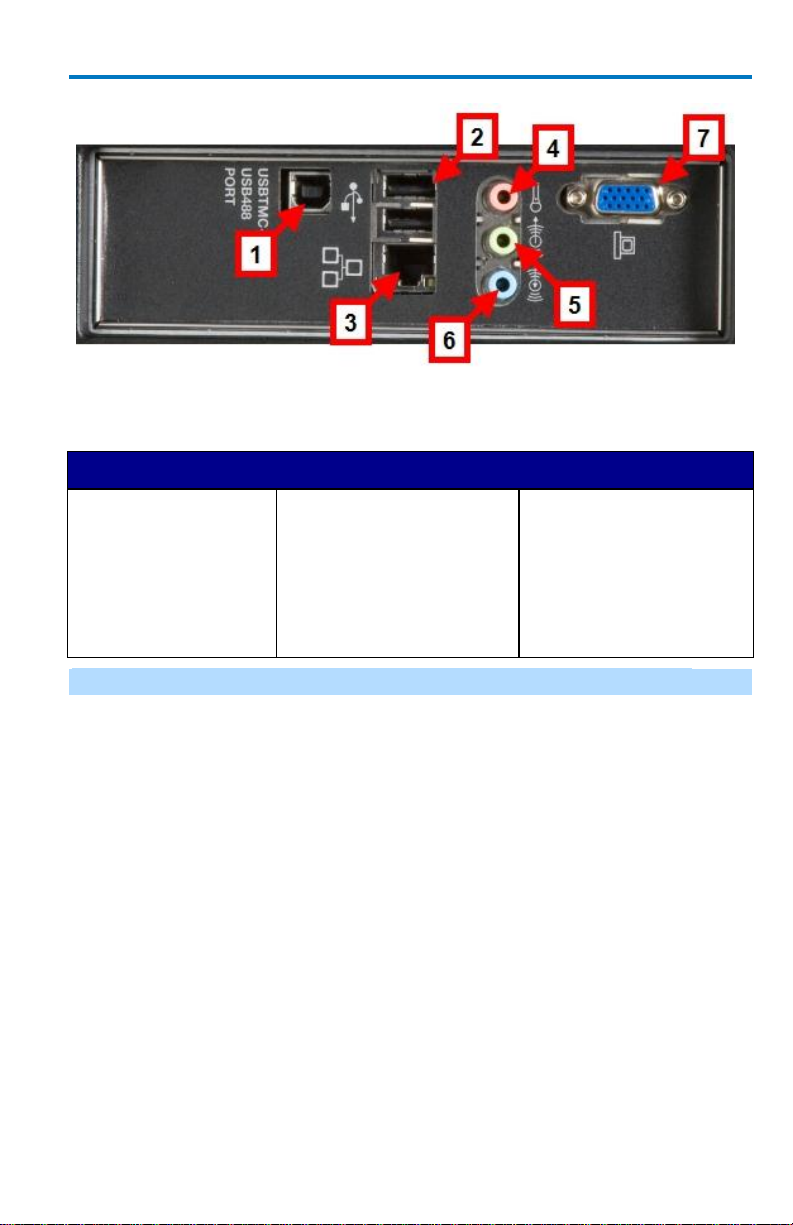
Number and Description
1. USB488
Connection
2. USB A
Connections
3. Ethernet Port
4. Microphone
Connection
5. Speaker
Connection
6. Line In
Connection
7. External VGA
Monitor
Connection
Numbered labels on the following I/O Panel image correspond with
descriptions on the following table.
Note: Contact a system administrator when connecting to any internal LAN.
B
Page 22
WaveRunner 6 Zi and 12-Bit HRO
14
922136-00 Rev A
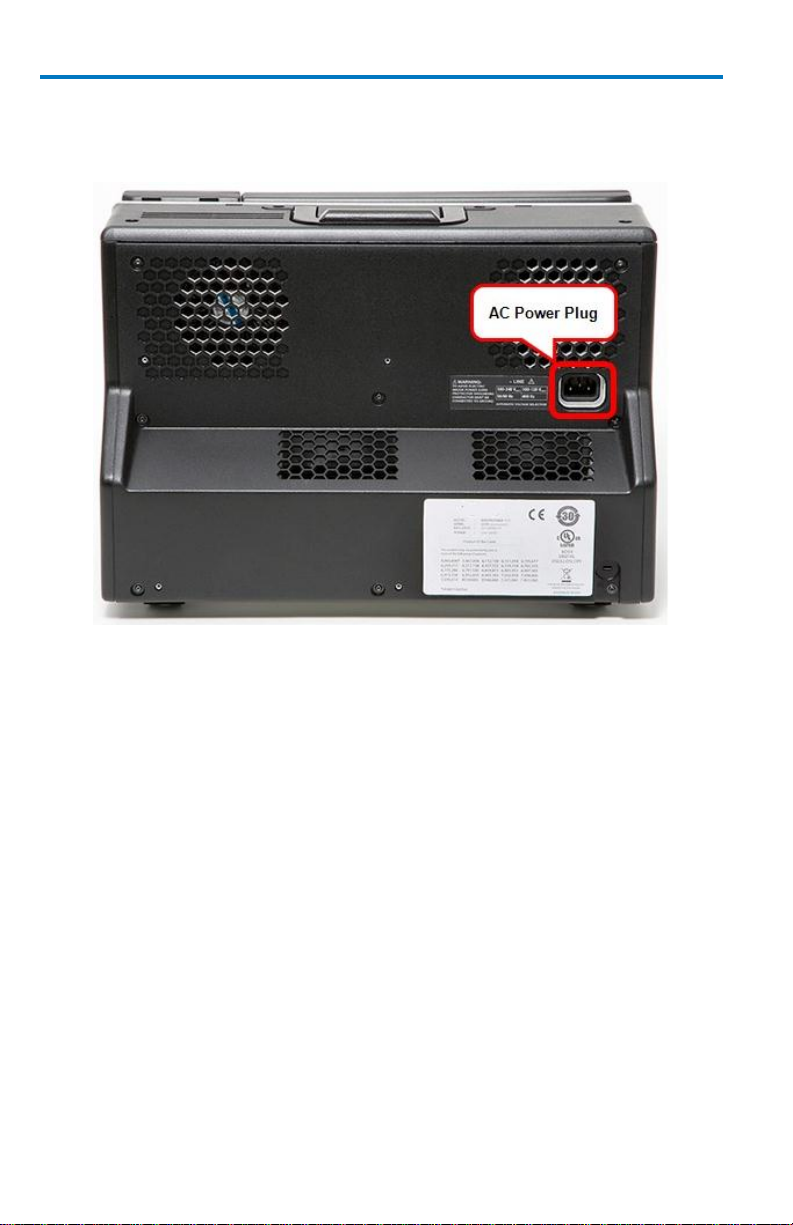
The Back of Your Oscilloscope
The AC Power Plug is located on the back panel of your instrument.
Removable Hard Drive Option
The WaveRunner 6 Zi and 12-Bit HRO have a removable hard drive option
available. The remainder of this topic explains how to properly remove and
reinstall the WaveRunner 6 Zi and 12-Bit HRO removable hard drive.
PLEASE NOTE THE FOLLOWING:
The WaveRunner 6 Zi and 12-Bit HRO removable hard drive option
must be specified when ordering and installed at the Teledyne
LeCroy factory. Contact your Teledyne LeCroy representative for
details using Contact Teledyne LeCroy for Support.
When this option is ordered, a removable hard drive is installed
inside your oscilloscope and an additional removable hard drive is
also provided.
Never attempt to extract a removable hard drive without powering
down your instrument first.
Page 23
Getting Started Manual
922136-00 Rev A
15
WARNING. Only removable hard drives supplied by Teledyne LeCroy
should ever be used in your instrument. Teledyne LeCroy drives bear
a Teledyne LeCroy sticker and serial number indicating the intended
oscilloscope model with which it's supposed to be used.
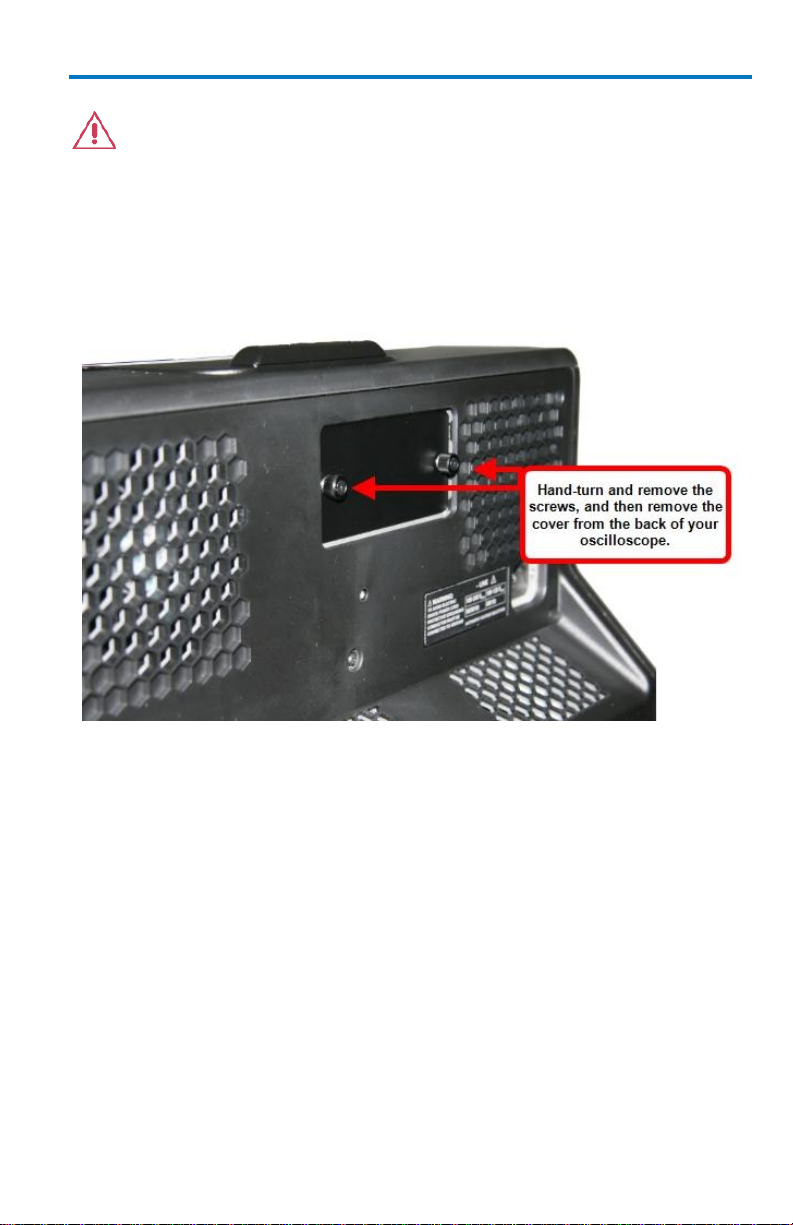
When extracting your removable hard drive (if you have this option) handturn and remove the screws, and then remove the cover from the back of
your oscilloscope.
B
Page 24
WaveRunner 6 Zi and 12-Bit HRO
16
922136-00 Rev A
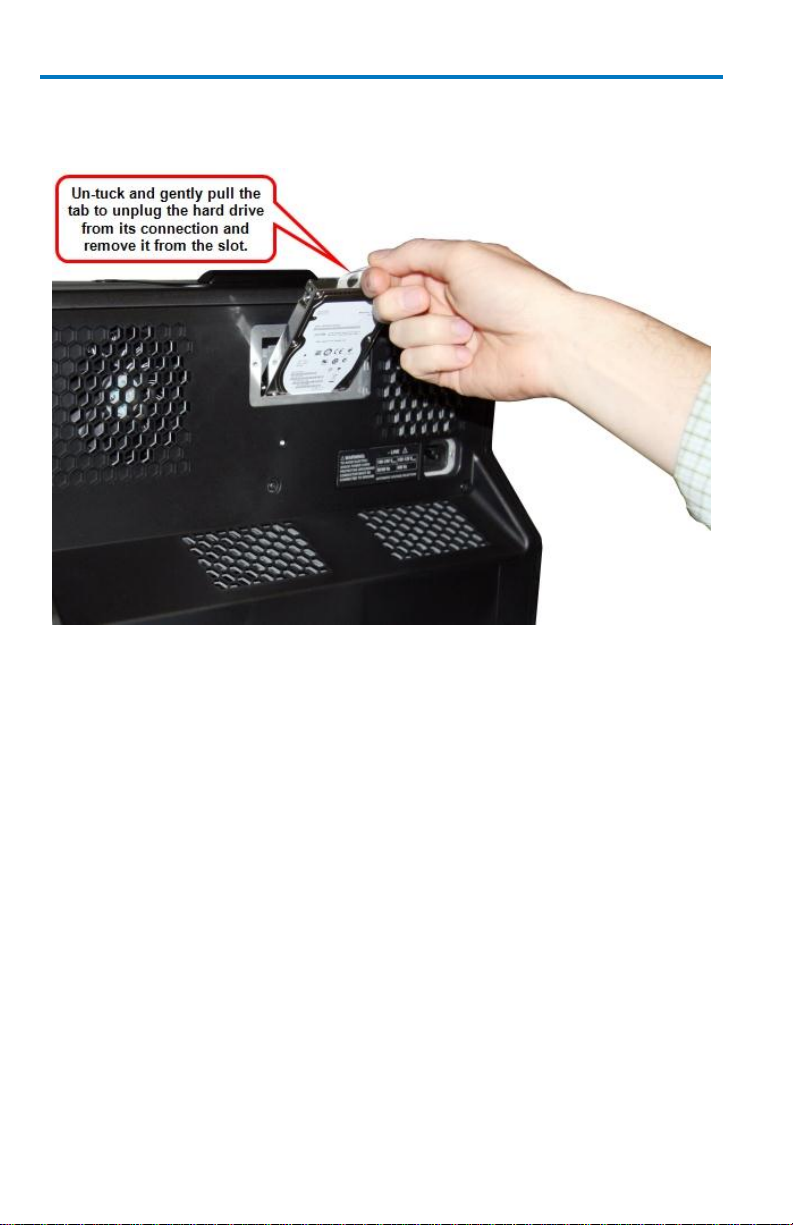
Now, un-tuck and gently pull the tab to unplug the hard drive from its
connection and remove it from the slot.
When reinstalling your removable hard drive, be sure its placed back into
the slot in the correct direction. Firmly press the drive into place securing
its internal connection to your oscilloscope.
Page 25
Getting Started Manual
922136-00 Rev A
17
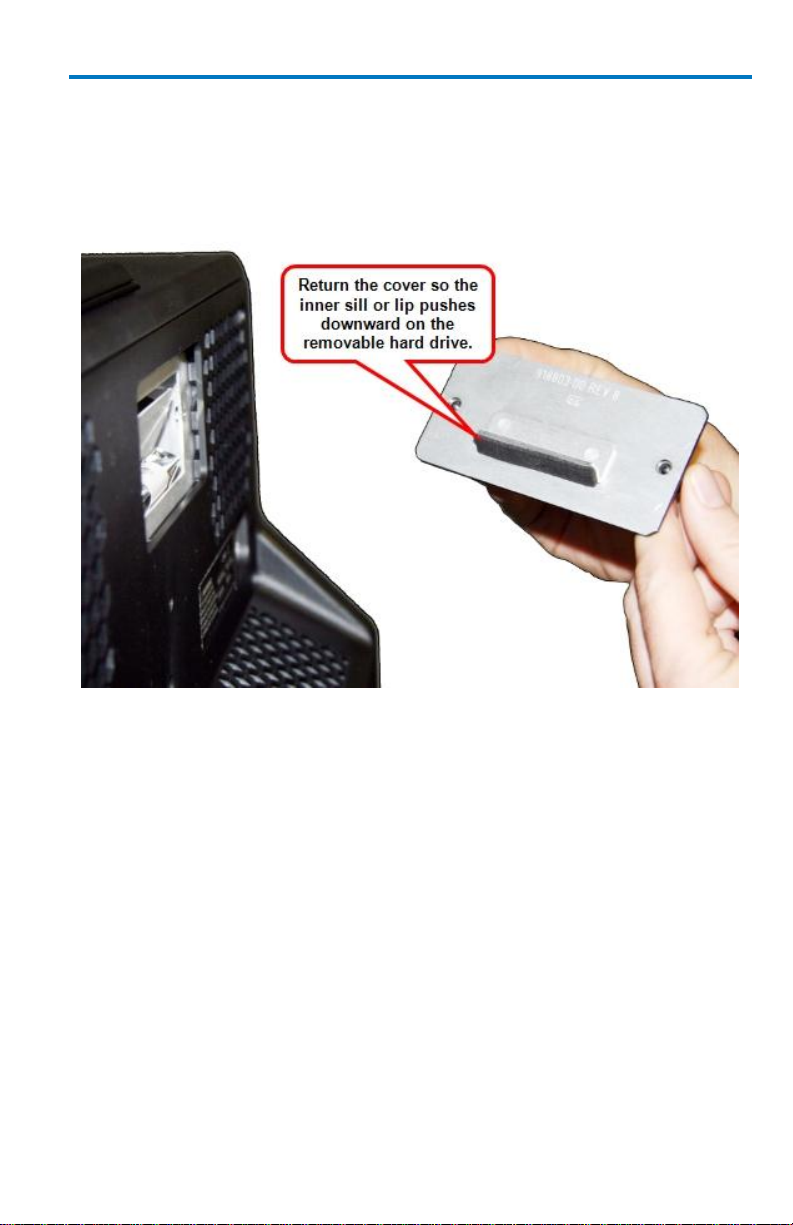
Finally, to make sure the removable hard drive cover is returned in the
correct direction to the back of your oscilloscope, a sill or lip on the inside
of the cover should be situated so it pushes downward on the removable
hard drive.
Basic Controls
Hardware and Software Controls
The following Basic Control topics cover the general usage of the hardware
buttons located on the oscilloscope's front panel and the screen control
interface elements of the software.
B
Page 26
WaveRunner 6 Zi and 12-Bit HRO
18
922136-00 Rev A
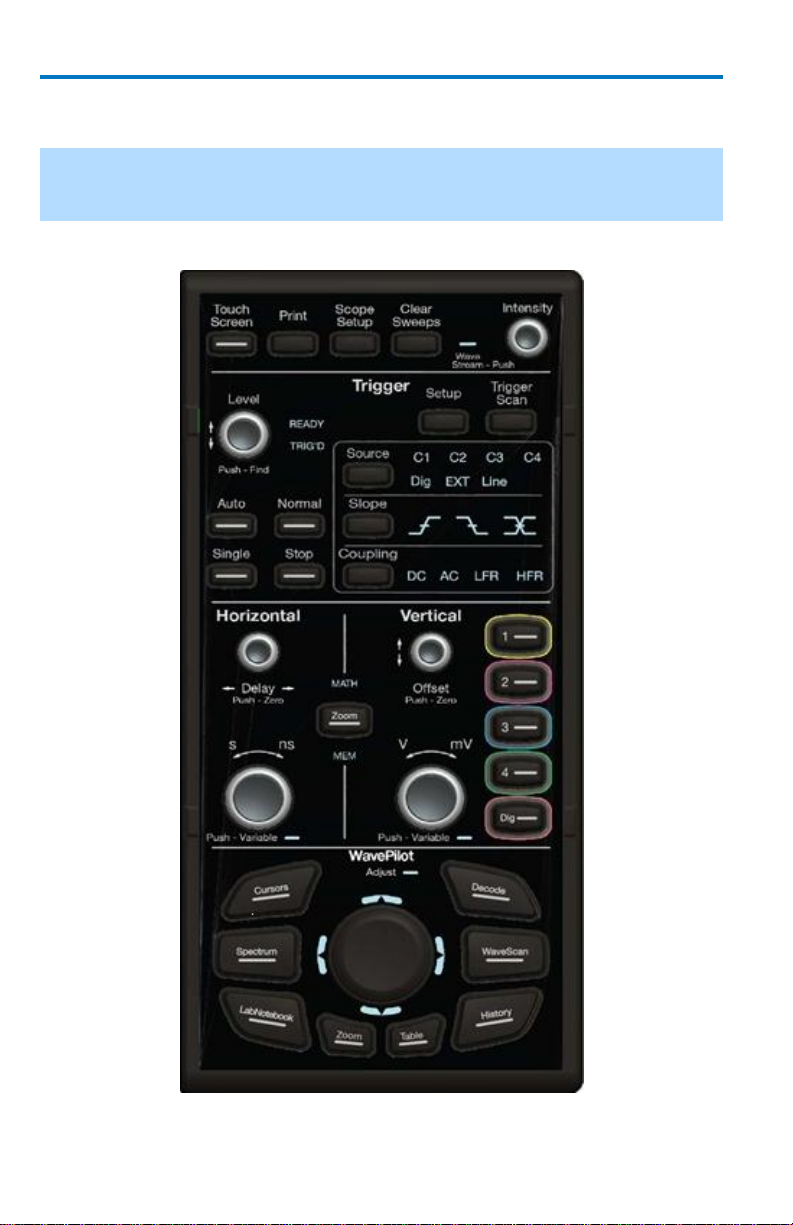
Front Panel Controls
Note: Many specific Front Panel Controls directly correspond with Screen Layout
Controls. For example, the Print front panel general control button corresponds
with the Hardcopy function at Utilities → Utilities Setup → Hardcopy.
The following picture shows the Front Panel Control.
Front panel for WaveRunner 6 Zi and 12-Bit HRO oscilloscopes.
Page 27
Getting Started Manual
922136-00 Rev A
19
Front Panel Control Groupings
The front panel is divided into sections based on various functions. The
following topics explain these sections in more detail.
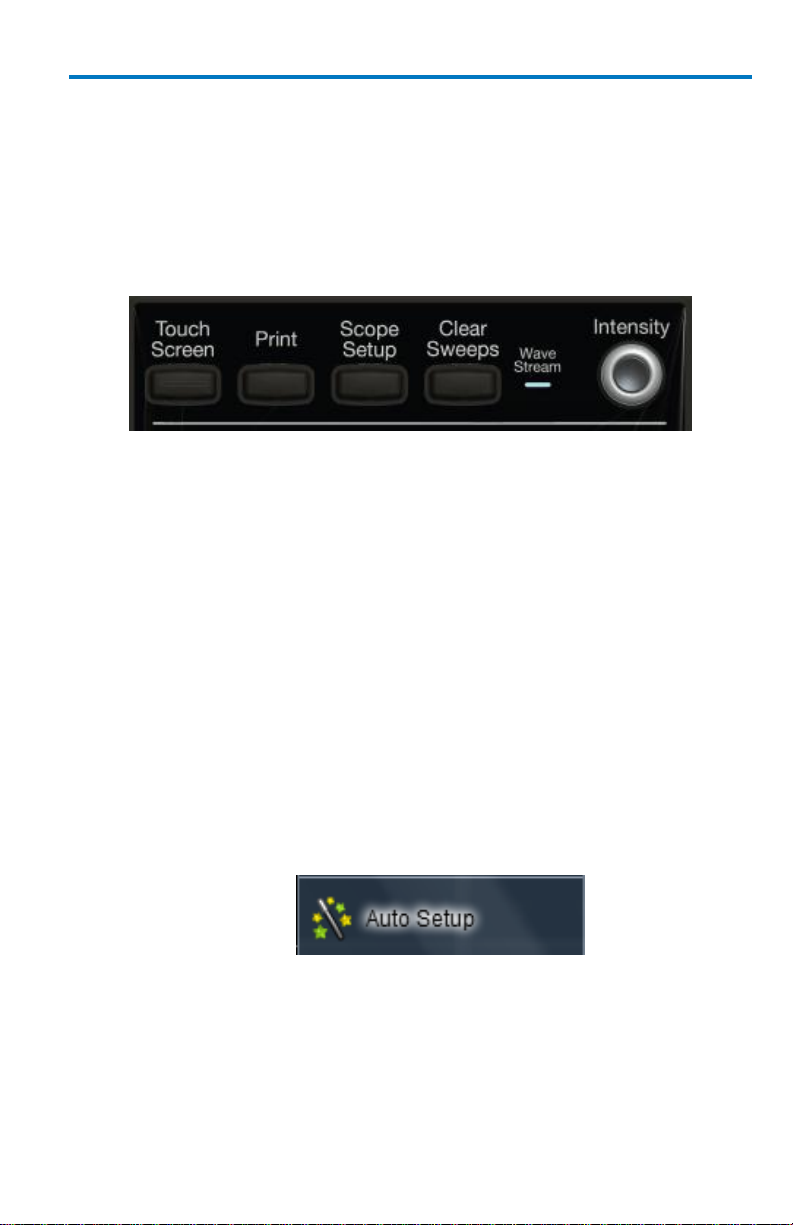
Miscellaneous Controls and WaveStream Indicator
This topmost section of the front panel provides the following functions:
Touch Screen - By default this button's blue backlit LED is ON and
the touch screen is enabled. By pressing this button and turning off
the LED, the touch screen is then disabled.
Print - Press this button and it automatically executes the based on
the settings you've made as described in Printing and Hardcopy
Functions (on page 147).
You can set the oscilloscope to automatically spool directly to a
printer, to a file, an email (with attachment), or to the clipboard.
Scope Setup - Press once and the Scope Setup flyout menu is shown.
The Scope Setup flyout menu quickly provides access to Auto Setup,
C1 Find Scale, C2 Find Scale, C3 Find Scale, C4 Find Scale, and
Default Setup buttons. These functions perform various automatic
setup configurations to your instrument. This corresponds to the
Auto Setup... selection on the menu bar from the Vertical,
Timebase, or Trigger menus.
Press the Auto Setup... button on the flyout menu to perform a full
auto setup. Press a Channel Find Scale button on the flyout menu to
perform a quick auto setup for that channel only.
B
Page 28

WaveRunner 6 Zi and 12-Bit HRO
20
922136-00 Rev A
Press the AUTO SETUP... front panel button twice to perform the last
selection from the Auto Setup... flyout menu (the default is to
perform a full auto setup).
If Auto Setup is run when no channels are turned on, all channels are
affected. When more than one channel is turned on, the first
channel with a signal applied to it is automatically set up for edge
triggering.
Perform an autosetup of all these functions together by pressing the
Auto Setup... front panel button.
Clear Sweeps - Press to clear data from multiple sweeps
(acquisitions) including: persistence trace displays, averaged traces,
parameter statistics, and Histicons. During waveform readout,
cancels readout. This is the same as pressing Clear Sweeps on the
Measure → Measure Setup... or Math → Math Setup dialogs.
WaveStream - Indicates when WaveStream mode is ON. Refer to
WaveStream Mode (on page 89) for more information.
Intensity - Press to toggle between WaveStream OFF and ON for
Analog Persistence and WaveStream ON for Color Persistence. When
you turn the knob, if WaveStream is ON, the WaveStream display
intensity changes. When you turn the knob, if WaveStream is OFF,
changes the Intensity setting. Corresponds with the screen menu
selection: Display → Display Setup (on page 84).
Page 29
Getting Started Manual
922136-00 Rev A
21
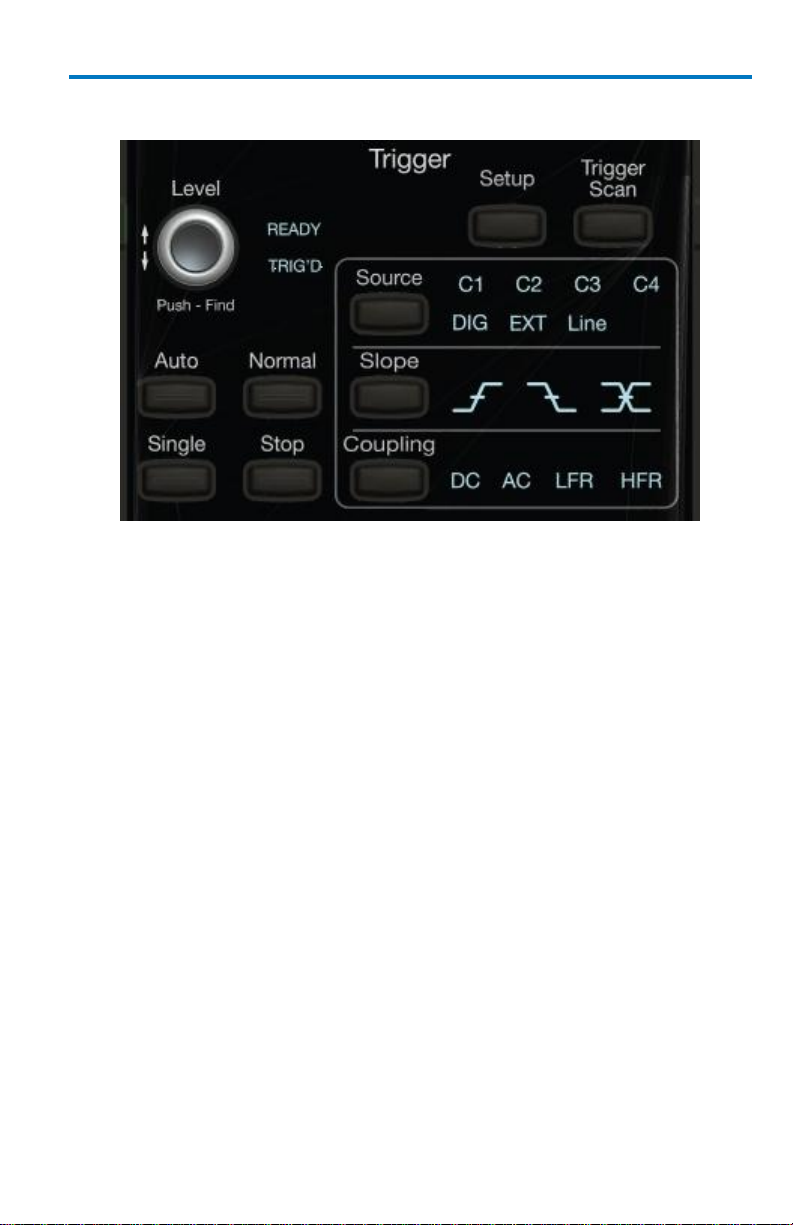
Trigger Front Panel Controls
Level - Pressing this button sets the trigger level to 50%. Turn the
knob to change the trigger threshold level. The threshold level is
indicated on the Trigger label.
READY and TRIG'D Indicators - The READY indicator is lit when the
trigger is armed. TRIG'D is lit momentarily when a trigger occurs. A
fast trigger rate causes the light to stay lit continuously.
Setup - Press once to open the Trigger Setup... dialog. Corresponds
with screen menu selection: Trigger → Trigger Setup.... Press the
Trigger SETUP front panel button again to close the Trigger Setup...
dialog.
Trigger Scan - Pressing the Trigger Scan button opens the
TriggerScan dialog to help you quickly find rare waveform glitches
and anomalies.
Source - This button directly selects through the available Source
field values (C1, C2, C3, C4, Dig, EXT, and Line) usually accessed on
the Setup section of the main Trigger dialog.
Slope - This button directly selects through the available Slope field
values (Positive, Negative, or Either) usually accessed on the Setup
section of the main Trigger dialog.
Coupling - This button directly selects through the available
Coupling field values - DC, AC, LFR (Low-Frequency Rejection), or
B
Page 30

WaveRunner 6 Zi and 12-Bit HRO
22
922136-00 Rev A
HFR (High-Frequency Rejection) - usually accessed on the Setup
section of the main Trigger dialog.
Auto - Press to turn on Auto Trigger mode, which triggers the
oscilloscope after a time-out, even if the trigger conditions are not
met.
Normal - Press to turn on Normal Trigger mode, which triggers the
oscilloscope each time a signal is present that meets the conditions
set for the type of trigger selected.
Single - Press to turn on Single Trigger mode, which arms the
oscilloscope to trigger once (single-shot acquisition) when the input
signal meets the trigger conditions set for the type of trigger
selected. If the scope is already armed, it will force a trigger.
Stop - Press to prevent the scope from triggering on a signal. If you
boot up the instrument with the trigger in Stop mode, a no trace
available message is shown. Press the Trigger AUTO front panel
button to display your trace.
Page 31

Getting Started Manual
922136-00 Rev A
23
Horizontal Front Panel Controls
Note: Horizontal front panel controls can be applied to signals, Math, Zoom, or
Memory traces. See Math, Zoom, and Memory Indicators and Controls (on
page 25) for more information.
Delay - Press to toggle between a zero horizontal delay value and
the previous horizontal delay value. Turn to change the horizontal
delay value.
Time/Div - Turn to set the time/division of the oscilloscope timebase
(acquisition system). When using this Horizontal control on a Math,
Zoom, or Memory trace, you can press this button to toggle
between fixed and variable adjustments. Turn the knob to change
the value.
B
Page 32

WaveRunner 6 Zi and 12-Bit HRO
24
922136-00 Rev A
Vertical Front Panel Controls
Note: Vertical front panel controls can be applied to signals, Math, Zoom, or
Memory traces. See Math, Zoom, and Memory Indicators and Controls (on
page 25) for more information.
Channels - The channel buttons (1 - 4 and Digital) control both
channel ON/OFF and which channel is active for the Vertical Offset
and Volts/Div knobs controls. If a channel is OFF, pressing that
channel button turns it on and makes it active. If a channel button is
ON, pressing that channel button makes it active, and then pressing
it a second time turns it OFF.
Offset - Press to toggle between a zero vertical offset value and the
previous vertical offset value for the selected channel. Turn to
change the vertical offset value for the selected channel.
Gain - Press to toggle between fixed and variable gain adjustment.
Turn to change the gain value.
Page 33

Getting Started Manual
922136-00 Rev A
25
Math, Zoom, and Memory Indicators and Controls
When pressed, the Zoom automatically creates a Zoom trace of all
active channels. Math and Memory traces must first be enabled on
their respective dialogs in Math → Math | Memory Setup... for use
by the front panel controls.
When Math, Zoom, or Memory traces are enabled - see Math →
Math | Zoom | Memory Setup..., respectively - the corresponding
indicator light illuminates and the Horizontal and Vertical controls
specifically control the Math, Zoom, or Memory trace.
The Push - Variable function on the Time/Div front panel control for
Horizontal only applies to Math, Zoom, or Memory traces and not
Channels. Press the button to toggle between fixed and variable
adjustments or turn the knob to change the value.
The WavePilot Control Area and The SuperKnob
The WavePilot Control Area contains buttons that correspond to specific
functions. These function buttons are used together with the SuperKnob to
provide increased instrument control at your fingertips.
The SuperKnob is a joystick-like knob in the center of the WavePilot Control
Area used to make selections or provide specific values.
B
Page 34

WaveRunner 6 Zi and 12-Bit HRO
26
922136-00 Rev A
The SuperKnob shown on the WavePilot Control Area.
SUPERKNOB FIELD CONTROL AND THE ADJUST HELP FLYOUT MENU
Whenever you access a non-text entry or file browsing control on a dialog,
the Adjust Help Flyout menu is shown.
The Probe Attenuation control value being changed using the SuperKnob.
Control values can be adjusted using the touch screen, a connected mouse,
or by use of the SuperKnob. Turning the SuperKnob moves through
available control values and, as indicated by the Help Flyout menu, pressing
the SuperKnob provides Toggle Variable functionality; meaning, fine and
coarse adjustments (if available for the particular control) may be selected
for use.
The WavePilot Control Area provides powerful control of Cursors, Decode,
WaveScan, History, LabNotebook, and Spectrum by their respective
function buttons on the front panel. Based on the function button selected,
additional functions are then available on the SuperKnob.
Page 35

Getting Started Manual
922136-00 Rev A
27
PLEASE NOTE THE FOLLOWING:
Not all functions have a function assigned to each (or any) left, right,
up, or down SuperKnob control. Some only have one or two
controls. Deactivated SuperKnob control directions are shown as unlabeled and grayed-out on respective Help Flyout menus.
The name of the current mode being used is shown vertically on the
left side of the Help Flyout menu.
When a function button is pressed and the SuperKnob control
changes, a corresponding clearly-labeled, Help Flyout menu
indicates additional functions available when using the SuperKnob to
joystick in left, right, up, or down directions.
The Table Mode Help Flyout menu for the Spectrum Function button.
Some models have Table and Zoom LED indicators along with
Adjust. Others have only an Adjust LED with Zoom and Table
buttons containing backlit LEDs.
ZOOM AND TABLE BUTTONS
The Zoom and Table buttons may (or may not) provide additional control
for a specific WavePilot funciton you have selected.
Zoom Button
With the Zoom button selected (for a function that has the Zoom control)
you can twist the SuperKnob dial to adjust the zoom value for your
displayed waveform.
Table Button
With the Table control selected (for a function that has the Table control)
you can joystick up or down to Page Up or Down through the table results.
You can also twist the SuperKnob dial to sequentially navigate each row of
the table results.
B
Page 36

WaveRunner 6 Zi and 12-Bit HRO
28
922136-00 Rev A
CURSORS
Use the SuperKnob to adjust Cursors by pressing the Cursors function
button. Once pressed, the Cursors Help Flyout menu is shown.
Note: For more information about the use of Cursors, see Measuring with
Cursors (on page 95).
Horizontal, Off, and Vertical
Pressing the Cursor Function button moves through states for Horizontal
Absolute, Horizontal Relative, Vertical Absolute, Vertical Relative, and
Off.
LED's surrounding the SuperKnob provide visual indication of cursor status
as follows:
When opposing LED's (Top/Bottom and Left/Right) are lit, the
cursors are in a Relative state.
When no LED's surrounding the SuperKnob are lit, the cursors are in
an Absolute or Off state.
Using the SuperKnob with Cursors
The SuperKnob joystick is used for cursor control while in Horizontal and
Vertical states in the following manner:
Horizontal - Cursors Help Flyout menu is shown with instructions for
left and right joystick use of the SuperKnob described as Leftmost
and Rightmost. When either is selected, you can twist the
SuperKnob to adjust the respective cursor.
Vertical - Cursors Help Flyout menu is shown with instructions for
left and right joystick use of the SuperKnob described as Topmost
and Bottommost. When either is selected, you can twist the
SuperKnob to adjust the respective cursor.
Pushing the SuperKnob button changes the cursor control from the
two available states with the added state of tracking (moving the
pair together in parallel).
You can force cursors to swap identities in the event where one is
adjusted past the level of its other extreme. Meaning, if you were to
adjust a bottommost cursor above its respective topmost cursor, the
bottommost would then become the topmost and vice versa.
Note: Zoom and Table buttons are not used for Cursors.
Page 37

Getting Started Manual
922136-00 Rev A
29
DECODE
When first pressing the Decode function button, the Serial Decode dialog is
shown. Subsequent presses of the Decode function button produce the
following results:
If you haven't enabled a Decode signal, it Closes the Serial Decode
dialog.
If you have enabled a Decode signal, it Closes the Serial Decode
dialog and disables the Decode signal.
If you have enabled a Decode signal, and the Serial Decode dialog is
closed or a different dialog is currently opened (say, the Zoom
dialog), the Serial Decode dialog is Opened.
Zoom and Table Buttons for Decode
The Zoom and Table buttons are used as described in The WavePilot
Control Area and The SuperKnob Overview (on page 25). Decode tables
are shown beneath the main display area.
WAVESCAN
When first pressing the WaveScan function button, the WaveScan dialog is
shown with table data showing in a column to the left of the main display
area. Subsequent presses of the WaveScan function button produce the
following results:
WaveScan is turned On and you click Close on the WaveScan dialog
or open a different dialog (say, the Zoom dialog), and then click the
WaveScan function button, the WaveScan dialog is Opened.
WaveScan is turned Off and the WaveScan dialog is Closed.
The Zoom and Table buttons are used as described in The WavePilot
Control Area and The SuperKnob Overview (on page 25).
HISTORY
When first pressing the History function button, the History dialog is
shown with table data showing in a column to the left of the main display
area. Subsequent presses of the History function button produce the
following results:
History is turned On and you click Close on the History dialog or
open a different dialog (say, the Zoom dialog), and then click the
History function button, the History dialog is Opened.
B
Page 38

WaveRunner 6 Zi and 12-Bit HRO
30
922136-00 Rev A
History is turned Off and the History dialog is Closed.
On the History dialog, a Capacity control is provided.
Note: A default value for the Capacity control is generated based on your
instrument's specific Acquisition Memory Setting (it also varies based on specific
setups, configurations, and settings at any given time).
The Zoom and Table buttons are used as described in The WavePilot
Control Area and The SuperKnob Overview (on page 25).
LABNOTEBOOK
When first pressing the LabNotebook function button, the LabNotebook
dialog is shown. The button toggles between opening and closing the
LabNotebook dialog - unless you already have LabNotebook entries stored.
With LabNotebook entries already stored subsequent presses of the
LabNotebook function button:
opens the LabNotebook dialog and your first My Notebook Entry is
shown on the display area in Preview mode.
closes the LabNotebook dialog and the My Notebook Entry preview.
As mentioned, with LabNotebook entries already stored a subsequent
press of the LabNotebook function button shows the preview along with
the dialog. You can then turn the SuperKnob to move through entries
shown in My Notebook Entries on the LabNotebook dialog. Pushing the
SuperKnob performs a Flashback (Recall) of the stored entry selected in the
My Notebook Entries on the LabNotebook dialog.
Note: Zoom and Table buttons are not used for LabNotebook.
SPECTRUM
When first pressing the Spectrum function button, the Spectrum dialog is
shown with table data showing in a column to the left of the main display
area. Subsequent presses of the Spectrum function button produce the
following results:
Spectrum Analysis is turned Off and the SpectrumAnalyzer dialog is
Closed.
Spectrum Analysis is turned On and you click Close on the
SpectrumAnalyzer dialog or open a different dialog (say, the Zoom
dialog), and then click the Spectrum function button, the
SpectrumAnalyzer dialog is Opened.
Page 39

Getting Started Manual
922136-00 Rev A
31
Zoom and Table buttons are used as described in The WavePilot Control
Area and The SuperKnob Overview (on page 25). In addition, a spectrum-
specific Table control functionality Centers the Frequency of your
displayed waveform when the SuperKnob is pressed based on the
particular Frequency row you have selected from the Spectrum table
displayed to the left of the main display area.
The Table Help Flyout menu for the Spectrum Function button.
Probe / Signal Connection Interfaces
Probe Interfaces
Teledyne LeCroy oscilloscopes utilize one or more proprietary probe
interfaces providing a complete measurement solution from probe tip to
oscilloscope display. Compared to standard BNC and Probe Ring interfaces,
this intelligent interconnection between your instrument and the probe or
accessory eliminates the guesswork and errors that occur when probe
settings are made manually, and also offers the following important signal
fidelity advantages:
Upon connection to the oscilloscope channel, the probe is
recognized and some setup information, such as input coupling and
attenuation, is performed automatically.
System (probe plus oscilloscope) gain settings are automatically
calculated and displayed based on the probe attenuation.
Active probes typically provide automatic matching of probe to
oscilloscope response using probe response data stored in an onboard EEPROM. This ensures the best possible combined probe plus
oscilloscope channel frequency response without requiring the user
to perform any de-embedding procedure.
B
Page 40

WaveRunner 6 Zi and 12-Bit HRO
32
922136-00 Rev A
Probe interfaces differ in bandwidth, so the interfaces contained on your
oscilloscope depend on the bandwidth rating of the oscilloscope model you
purchased.
When a probe is connected, it is recognized and an additional tab with the
probe model name is displayed to the right of the C1 tab.
The channel dialog layout showing Input A's ProLink interface controls setup
after connection.
This additional tab contains specific information on the connected probe.
In addition, default values for the probes coupling and attenuation (which
may not be changed) are automatically downloaded from the probe, and
these settings along with other attributes are shown on the corresponding
probe dialog.
The dialog showing the connected probe's control attributes.
ProBus Interface
The ProBus interface contains a 6-pin power and communication
connection and a BNC signal connection to the probe. It offers both 50 Ω/1
MΩ input impedance and provides probe power and control for a wide
range of probes such as high impedance passive probes, high impedance
active probes, current probes, high voltage probes, and differential probes.
ProBus also includes sense rings for detecting passive probes. The ProBus
interface may also have a BNC-terminated cable connected directly to it.
Page 41

Getting Started Manual
922136-00 Rev A
33
ProBus is based on a BNC connector and, depending on the exact BNC
connector used and the oscilloscope design, is rated for up to 4 GHz with
50 Ω coupling or up to 1 GHz for 1 MΩ coupling (depending on the exact
model purchase).
Probes
Teledyne LeCroy offers a variety of passive and active probes for use with your XStream oscilloscope. Visit teledynelecroy.com for specifications and ordering
information.
Current Probes - Current Probes measure the current passing
through a wire; current probes do not use the traditional probing
style of placing a tip onto a test point. Instead, a wire is placed inside
the jaw of the probe, which allows the probe to measure the current
(in Amps).
Active Probes - There are two different types of active probes:
single-ended and differential.
Single-Ended - A single-ended active probe is associated with
measuring voltages at high frequencies. Measurement with an active
probe requires a test point and a ground point. The ground (also
called earth) acts as a zero reference for the test point
measurement.
Differential Probes - Differential active probes are like two probes in
one. Instead of measuring a test point in relation to a ground point
(like single-ended active probes), differential probes measure the
difference in voltage of a test point in relation to another test point.
Passive Probes - Passive probes measure voltages at lower
frequencies (<500 MHz). They have higher input capacitance (input
C) and do not need power to operate (unlike active probes). At
higher frequencies, higher input capacitance loads the test circuit,
attenuating the signal. This is why active probes are used in high
frequency applications. Passive probes also measure voltage in
reference to ground.
High Voltage Probes - These are active, single-ended probes
designed to safely measure high voltages. They measure the voltage
in reference to ground.
B
Page 42

WaveRunner 6 Zi and 12-Bit HRO
34
922136-00 Rev A
Passive Probe Compensation
Passive probes must be compensated to flatten overshoot. This is
accomplished by means of a trimmer at the connector end of the probe.
1. Attach the connector end of your passive probe to any channel.
2. Connect the probe end to the CAL output connector at the front of
the oscilloscope. Ground the probe.
3. Adjust the trim pot at the connector end of the probe until the
square wave is as flat as possible.
Page 43

Getting Started Manual
922136-00 Rev A
35
Display Dashboard
Screen Layout, Groupings, and Controls
The instrument's screen is divided into the following main sections:
Menu Bar
Signal Display Grid
Descriptor Labels
Dialog(s)
The Message Bar
Note: Many front panel controls directly correspond with screen layout controls.
For example, the Print front panel general control button corresponds with the
Hardcopy function set from Utilities → Utilities Setup → Hardcopy.
Menu Bar
The top of the screen contains a menu bar of commonly used functions.
Whenever you touch one of these buttons and make a selection from its
drop-down menu, the dialog area at the bottom of the screen displays the
corresponding dialog.
Specific Menu Bar functions are referenced using arrow-separated path
descriptions. For example, the Save Setup function is referenced as File →
Save Setup....
PLEASE NOTE THE FOLLOWING:
B
Page 44

WaveRunner 6 Zi and 12-Bit HRO
36
922136-00 Rev A
For common oscilloscope operations, you don't need to use the top menu
bar (since you can access most dialogs from the Front Panel or from the
Descriptor Labels). However, it is the only way to access setup or other
dialogs for Display Setup, Save or Recall Waveform, Save or Recall Setups,
Print Setup, Vertical (Channel), Horizontal, or Trigger Status, Memory
(Reference Waveform) Setup, Pass/Fail Setup, or Utilities and Preferences
Setup....
The Quick Access Toolbar
The Quick Access portion of the toolbar is located on the right side of the
menu bar. It contains the Rotate Display button.
When the display is rotated, touch this button to adjust the user interface
to a portrait layout. The button toggles from portrait layout back to
landscape.
For additional information on rotating and tilting the display, refer to
Hardware and Software Controls (on page 17).
The Signal Display Grid
The grid area is divided into 8 vertical divisions and 10 horizontal divisions
just like any other oscilloscope. Set up the signal display area by touching
Display → Display Setup... from the menu bar.
The Display dialog offers a choice of grid combinations and can also set the
grid intensity.
Page 45

Getting Started Manual
922136-00 Rev A
37
There are several indicators on the grid to help you understand the
following:
Trigger Delay - This indicator is located along the bottom edge of the
grid. Trigger delay allows you to see the signal prior to the trigger
time.
All trigger delay values (including post-trigger delay, shown here) are
displayed in the Timebase Descriptor Label. Zero delay is the
horizontal center of the oscilloscope display.
The default setting (Time) is for delay readout (in seconds) and to
move proportionately when the timebase knob is turned. If you
want to set delay (Div) to a fixed position on the grid, and then have
it stay fixed as the timebase changes, go to Utilities → Preference
Setup... and select the Acquisition dialog to make the setting.
Post-trigger Delay - This is indicated by a left-pointing arrow to the
lower-left of the grid. Pre-trigger delay is indicated by a rightpointing arrow to the lower-right of the grid.
B
Page 46

WaveRunner 6 Zi and 12-Bit HRO
38
922136-00 Rev A
Trigger Level - This indicator is located at the right edge of the grid.
It tracks the trigger level as you reposition the trace up or down, or
change scale. When triggering is stopped, a hollow arrow indicates
where the new level ends up when triggering resumes.
Push the LEVEL knob to reset the level to 50%.
Zero Volts Level - This indicator is located at the left edge of the
grid. Change the zero volts level by turning the vertical OFFSET knob.
Push the knob to reset the indicator to the middle of the grid.
Signal Display Grid Pop-Up Menu
On the Signal Display Grid, the Pop-up menu provides assistance while using the
oscilloscope.
Clicking on a waveform opens a pop-up menu. From this pop-up menu, you
can perform the following functions:
Open the Setup dialog for the trace
Turn the trace descriptor label off
Open the Math dialog for the trace
Open the Measure dialog for the trace
Annotate the selected trace
Page 47

Getting Started Manual
922136-00 Rev A
39
Trace Descriptor Labels
Shown just beneath the grid display, these boxes provide a summary of
your channel, timebase, and trigger settings.
When a trace is selected its corresponding descriptor label is shown
highlighted.
The C1 Trace Descriptor Label is selected; C2 is not.
Make vertical or horizontal channel adjustments by touching the respective
label. The setup dialog for the function is shown beneath.
Channel trace labels show the vertical settings for the trace and cursor
information (if cursors are in use). The title bar of the label includes
indicators for (SinX)/X interpolation, waveform inversion (INV), deskew
(DSQ), coupling (DC/GND), bandwidth limiting (BWL), and averaging (AVG).
These indicators have a long and short form, respectively.
Besides channel traces, math and parameter measurement labels are also
displayed. Labels are displayed only for traces that are turned on.
Vertical and horizontal trace descriptor (labels) are displayed below the
grid. They provide a summary of your channel, timebase, and trigger
settings. Make vertical or horizontal channel adjustments by touching the
respective label. The setup dialog for the function is shown beneath.
TimeBase trace descriptor labels show the trigger delay setting, time per
division, and sampling information.
B
The long and short forms of trace descriptor indicators.
Page 48

WaveRunner 6 Zi and 12-Bit HRO
40
922136-00 Rev A
Trigger trace descriptor labels show the trigger mode (Auto, Normal, or
Stopped). It also shows the coupling (DC), trigger type (Edge), source (C1),
level (0 mV), and slope (Positive).
Setup information for horizontal cursors, including the time between
cursors and the frequency, is shown beneath the TimeBase and Trigger
trace descriptor labels.
Actions for Trace Buttons
You can access the same functions as the ones produced when using the
Signal Display Grid Pop-Up menu just by clicking a trace-descriptor label,
which shows its corresponding dialog. From the respective dialog, you're
able to access the same functions as Actions for Trace X buttons.
Open the Setup dialog for the trace.
Open the Math dialog for the trace.
Open the Measure dialog for the trace.
Annotate the selected trace.
For more information, see the Actions for Trace Buttons section of Dialog
Area (on page 42).
Annotating Traces
The instrument gives you the ability to add an identifying label, bearing
your own text, to a waveform display:
Page 49

Getting Started Manual
922136-00 Rev A
41
For each waveform, you can create multiple labels and turn them all on or
all off. Also, you can position them on the waveform by dragging or by
specifying an exact horizontal position.
Touch the waveform you want to annotate right on the display grid, and
then touch Set label... on the pop-up menu. A dialog box opens in which to
create the label. The first time creating a waveform label, Label1 is
provided as default text when the Add label button is touched.
From this pop-up you can edit existing annotations, change the label
placement on the waveform, add labels, remove labels, and toggle the
visibility. The following bullets show you how.
B
Page 50

WaveRunner 6 Zi and 12-Bit HRO
42
922136-00 Rev A
If you are modifying an existing label, under Labels touch the label
you want to change.
Note: If the dialog for the trace you want to annotate is currently
displayed, you can touch the label button at the bottom to display the
Trace Annotation setup dialog.
You may place a label anywhere you want on the waveform. Labels are
numbered sequentially according to the order in which they are added,
and not according to their placement on the waveform.
If you want to change the label's text, touch inside the Label Text
field. A pop-up keyboard appears for you to enter your text. Touch
O.K. on the keyboard when you are done. The edited text
automatically appears in the label on the waveform.
Precisely place the label by touching inside the Horizontal Pos. field
and provide a horizontal value, using the pop-up numeric keypad.
Add another label by touching the Add label button. Delete a label
by selecting the label from the list, and then touching the Remove
label button.
Make labels visible by touching the View labels checkbox.
Dialog Area
The lower portion of your oscilloscope screen is where information is
shown, selections are made, and data is input. These screens are organized
into tabular displays, subtabs, or pop-up dialogs. The dialog area is
controlled by Touch Screen Controls and Front Panel Controls.
Touch Screen Controls
Various touch screen user interface controls are provided for easily
entering data. Their functionality is described in this topic and you'll see
them referenced throughout the documentation.
Page 51

Getting Started Manual
922136-00 Rev A
43
POP-UP SELECTOR CONTROLS
When Pop-Up selector controls are touched, sometimes a very small box is
shown right inside the control - as in the following control for Coupling on
the C1 dialog.
Pop-Up Selector Control for smaller values.
Other times, a larger box is shown after touching a control. This larger PopUp has categorical buttons along the left column along with labels (and
sometimes descriptions) for the selectable entry values.
B
Pop-Up Selector Control for values with varied types.
Page 52

WaveRunner 6 Zi and 12-Bit HRO
44
922136-00 Rev A
TEXT ENTRY CONTROLS
Most controls can be touched once and you can then provide a value using
an attached (or double-touch/click to use the Virtual, on-screen) keyboard.
Text entry field for LabNotebook using the Virtual Keyboard.
Page 53

Getting Started Manual
922136-00 Rev A
45
FOLDER/FILE BROWSING CONTROLS
These controls allow for navigation to or from folders (on the hard drive or
memory device) for retrieving or storing items such as waveforms,
LabNotebook entries, to name a few.
Note: The instrument's hard disk is partitioned into drive C: and drive D:. Drive C:
contains the Windows operating system and the instrument application software.
Drive D: is intended for data files.
B
Folder/File Browsing recall waveform controls.
Page 54

WaveRunner 6 Zi and 12-Bit HRO
46
922136-00 Rev A
FLYOUT MENU CONTROLS
Flyout Menus provides a variety of solutions for a particular main area of
functionality. It does this by providing a set of buttons subdividing the
control into more specific functions on the right-side of the display.
An example of Flyout Menu Controls is seen in the Setup front panel
button.
Setup Flyout Menu control.
Page 55

Getting Started Manual
922136-00 Rev A
47
PRECISION DATA ENTRY CONTROLS
Certain fields requiring precise value entry assist you by having precision
entry means. When these controls are selected, you can provide values as
follows:
Keyboard
Touch inside a text entry control and you can manually type the value in
using an attached (or double-touch/click to use the Virtual, on-screen)
keyboard.
Slider Bar
Some models provide what is known as a Slider Bar along the bottom of
the screen when a keyboard is attached to the instrument. The Slider Bar
allows you to select your entered value by moving a horizontal slider (left
to right provides low to high amounts).
Pop-Up Keypad
Some models provide a pop-up Keypad when you touch twice in the same
control. A keypad button is also provided on the slider bar (on models that
have the slider bar) which shows the pop-up keypad when touched.
B
Text entry field for LabNotebook using the Virtual Keyboard.
Page 56

WaveRunner 6 Zi and 12-Bit HRO
48
922136-00 Rev A
For many controls, once the Pop-Up Keypad is shown the Front Panel
Controls (on page 18) can be used to adjust the value in the pop-up. The
Pop-Up contains Up and Down arrow buttons, Set to Max, Default, and
Min buttons, and the Keypad itself for providing your value.
The slider bar also has a handy default value button for quickly entering the
default for the control.
Default and Keypad Buttons on the Slider Bar are only shown on 7, 8, and 9
Zi models (with a keyboard attached).
UNIQUE WaveRunner 6 Zi and 12-Bit HRO and 12-Bit HRO FEATURE: The 6
Zi and 12-Bit HRO provides touch-screen interface controls in a different manner.
See The WavePilot Control Area and The SuperKnob Overview in the online
help.
Shortcut Toolbar
Several dialogs contain common functions accessible from a row of buttons
that can save you having to select the respective function from the menu
bar or the Signal Display Grid Pop-Up Menu.
For example, at the bottom of the Channel Setup dialog, these buttons
(sometimes labeled as Actions) perform the following functions:
Measure - Opens the Measure menu. You can then select a
parameter from this menu without leaving the Channel Setup dialog.
The parameter automatically appears below the grid.
Zoom - Creates a zoom trace of the channel trace whose dialog is
currently displayed.
Math - Opens the Math menu. You can then select a math function
from this menu without leaving the Channel Setup dialog. A math
trace of the channel whose dialog is currently open is automatically
displayed.
Page 57

Getting Started Manual
922136-00 Rev A
49
Decode - Opens the main Serial Decode dialog where protocol
option measurements can be applied to signals.
Store - Loads the channel trace into the next available memory
location (M1 to M4).
Find Scale - Automatically performs a vertical scaling that fits the
waveform into the grid.
Next Grid - Automatically moves the channel trace whose dialog is
currently open onto the next grid. If you have only one grid
displayed, a new grid will be created automatically, and the trace
moved.
Note: This button is not available on all oscilloscope models.
Label - Enables you to attach identifying labels to your waveforms.
The labels are preserved when the waveform is saved as a
LabNotebook entry and when saved to file.
Probe Cal - Cable Deskew - Opens the Probes Cal. dialog where
various Gain, Offset, Skew, Source, and Advanced controls are
available for probe signal calibration.
Another example is seen in the buttons appearing at the bottom of the
Measure Px dialogs. The button may be selected in order to display the
functions named on the buttons (sometimes labeled as Actions):
Using these buttons allow you to remain in the Measure dialog while
setting up a Math trace on a parameter measurement.
Message Bar
At the bottom of the oscilloscope display is a narrow message bar. The
current date and time are displayed at the far right. Status, error, or other
messages are also shown in this area.
B
Actions for Trace buttons on the Cx dialog.
Page 58

WaveRunner 6 Zi and 12-Bit HRO
50
922136-00 Rev A
Turning on Channels and Traces
PLEASE NOTE THE FOLLOWING:
If you want to display each trace on its own grid automatically,
enable Autogrid by touching Display → Autogrid from the menu bar.
You can turn channels on and off using the software, for more
information see Vertical Overview (on page 61)
On the front panel, press a channel select button to display the trace
descriptor label for that input channel and turn on the channel.
Turn on a math function trace by touching Math → Math Setup...
from the menu bar. Touch the corresponding On checkbox to
activate the desired trace.
You can also quickly create traces (and turn on the trace label) for
math functions and memory traces, without leaving the Vertical
Adjust dialog, by touching the icons at the bottom of the Vertical
Adjust dialog.
Whenever you turn on a channel, math, or memory trace using either the
menu bar or trace descriptor label, the dialog at the bottom of the screen
automatically switches to the vertical setup or math setup dialog for that
selection.
You can configure your traces from here, including math setups.
The Trace Dialog is shown on the lower (dialog) portion of the screen. The
tab is labeled with the corresponding channel number as follows:
Page 59

Getting Started Manual
922136-00 Rev A
51
Timebase
Overview
You can access Timebase settings using the front panel Horizontal controls,
the Timebase → Horizontal Setup... on the menu bar, or by touching the
Timebase trace descriptor label. The main Timebase dialog is then shown
and contains sections for Sampling Mode, Timebase Mode, and Real Time
Memory.
A section specifically used for combining channels is located on the far
right of the main Timebase dialog. This section varies based on your
oscilloscope model.
Timebase Setup and Control
1. With the Timebase dialog showing, touch inside the Time/Division
data entry control and provide a value using your preferred input
control method. Additional information on using the touch screen
controls can be found in the Dialog Area (on page 42).
2. Touch inside the Delay data entry control and provide a value.
B
Page 60

WaveRunner 6 Zi and 12-Bit HRO
52
922136-00 Rev A
Sampling Modes
Overview
Depending on your timebase, you can choose Single-shot Sampling Mode
(below), also known as Real Time mode, Sequence Sampling Mode (on page
53), or RIS Sampling Mode (on page 59) mode sampling.
Newer instruments offer Roll Mode (on page 60)
Some instruments also offer Roll Mode (on page 60).
Selecting a Sampling Mode
1. Touch Timebase → Horizontal Setup... from the menu bar.
2. In the Timebase dialog, touch a Sample Mode button.
3. If you chose Sequence Mode, touch the Sequence tab. The
Sequence dialog is shown. Use the following controls to provide
details for controls such as Number of Segments, Enable Timeout,
Timeout (value), Display Mode, and Show Sequence Trigger Times.
Single-shot Sampling Mode
Basic Capture Technique
A single-shot acquisition is a series of digitized voltage values sampled on
the input signal at a uniform rate. It is also a series of measured data values
associated with a single trigger event. The acquisition is typically stopped a
defined number of samples after this event occurs: a number determined
by the selected trigger delay and measured by the timebase. The
waveform's horizontal position (and waveform display in general) is
determined using the trigger event as the definition of time zero.
You can choose either a pre- or post-trigger delay. Pre-trigger delay is the
time from the left-hand edge of the display grid forward to the trigger
event, while post-trigger delay is the time back to the event. You can
sample the waveform in a range starting well before the trigger event up to
the moment the event occurs. This is 100% pre-trigger, and it allows you to
Page 61

Getting Started Manual
922136-00 Rev A
53
see the waveform leading up to the point at which the trigger condition
was met and the trigger occurred. (The instrument offers up to the
maximum record length of points of pre-trigger information.) Post-trigger
delay, on the other hand, allows you to sample the waveform starting at
the equivalent of 10,000 divisions after the event occurred.
On fast timebase settings, the maximum single-shot sampling rate is used.
But for slower timebases, the sampling rate is decreased and the number
of data samples maintained.
The relationship between sample rate, memory, and time can be simply
defined as:
Capture Interval = 1/Sample Rate X Memory
and
Capture Interval/10 = Time Per Division
Sequence Sampling Mode – Working with
Segments
Using Sequence Mode, thousands of trigger events can be stored as
segments into the oscilloscope's memory (the exact number depends on
oscilloscope model and memory options). This is ideal when capturing
many fast pulses in quick succession or when capturing few events
separated by long time periods. The instrument can capture complicated
sequences of events over large time intervals in fine detail, while ignoring
the uninteresting periods between the events. You can also make time
measurements between events on selected segments using the full
precision of the acquisition timebase.
Sequence mode offers a number of unique capabilities:
You can acquire up to four channels simultaneously.
You can minimize dead time between trigger events for consecutive
segments.
You can view time stamps for acquisitions.
You can zoom segments or used them as input to math functions.
B
Page 62

WaveRunner 6 Zi and 12-Bit HRO
54
922136-00 Rev A
You can combine sequence mode with an advanced trigger to isolate
a rare event, capture all instances over hours or days, and
view/analyze each afterwards.
You can use Sequence mode in remote operation to take full
advantage of the instrument's high data-transfer capability.
In Sequence mode, the complete waveform consists of a number of fixedsize segments acquired in single-shot mode (see the instrument
specifications for the limits). The oscilloscope uses the sequence timebase
setting to determine the capture duration of each segment as 10 x
time/div. With this setting, the oscilloscope uses the desired number of
segments, maximum segment length, and total available memory to
determine the actual number of samples or segments, and time or points.
How the instrument captures segments
Sequence Display Modes
The instrument gives you a choice of five ways to display your segments:
Adjacent
Page 63

922136-00 Rev A
55
Waterfall (cascaded)
Mosaic (tiled)
Overlay
Getting Started Manual
Perspective
Note: some display modes have limitations on the number of segments that can
be shown at one time.
Sequence Mode Setup
When setting up Sequence Mode, you define the number of fixed-size
segments acquired in single-shot mode (see the instrument specifications
for the limits). The oscilloscope uses the sequence timebase setting to
determine the capture duration of each segment. Along with this setting,
the oscilloscope uses the number of segments, maximum segment length,
B
Page 64

WaveRunner 6 Zi and 12-Bit HRO
56
922136-00 Rev A
and total available memory to determine the actual number of samples or
segments, and time or points.
Setting up Sequence Mode (Adjacent)
1. Touch Timebase → Horizontal Setup... on the menu bar.
2. Click the Sequence tab.
3. Under Acquisition Settings, touch inside the Num Segments data
entry control and provide a value using your preferred input control
method. Additional information on using the touch screen controls
can be found in the Dialog Area (on page 42).
Note: The number of segments you choose to display can be less than the
total number of segments in the waveform. For example, in the pop-up
images above, the number of display segments is 10, but the total number
of segments entered in the timebase dialog's Num Segments control is
100.
4. Touch the Enable Timeout checkbox.
5. Touch inside the Timeout data entry control and provide a timeout
value.
Note: Use the sequence mode timeout to automatically interrupt the
sequence acquisition if the timeout value is exceeded without a valid
trigger. The timeout period accounts for instances when a Num Segments
miscount occurs for some reason and the oscilloscope waits indefinitely for
Page 65

Getting Started Manual
922136-00 Rev A
57
an unforthcoming segment. During that time, no oscilloscope functions are
accessible. By means of a timeout value, however, the acquisition will be
completed, the waveform displayed, and control of the oscilloscope
returned to the user after the timeout has elapsed.
6. Under Display Settings, touch inside the Display mode control, and
select a sequence mode display from the pop-up menu.
7. Touch the SINGLE trigger front panel button.
Note: Once a single acquisition has started, you can interrupt the
acquisition at any time by pressing the SINGLE front panel button a second
time or by pressing the STOP front panel button. In this case, the segments
already acquired will be retained in memory.
Zooming Segments in Sequence Mode
You can zoom individual segments easily using the QUICKZOOM front panel
button. When you zoom, the zoom traces default to Segment 1. Channel
descriptors indicate the total number of segments acquired. Zoom
descriptors indicate [Seg #] and #Segments in the Zoom. You can scroll
through the segments using ZOOM front panel position knob.
1. Touch the front panel Quickzoom button.
B
Sample Zoom of Segments in Sequence Mode
Page 66

WaveRunner 6 Zi and 12-Bit HRO
58
922136-00 Rev A
2. Turn the ZOOM front panel position knob to scroll through the
segments.
3. To vary the degree of zoom, touch the newly created Zx trace label.
The setup dialog for the zoom (Z1 to Z4) opens. It shows the current
horizontal and vertical zoom factors.
4. If you want to increase or decrease your horizontal or vertical zoom
in small increments, touch the Var. checkbox to enable variable
zooming. Now with each touch of the zoom control buttons, the
degree of magnification changes by small increments.
OR
If you want to zoom in or out in large standard increments with each
touch of the zoom control buttons, leave the Var. checkbox
unchecked.
OR
If you want to set exact horizontal or vertical zoom factors, touch
inside the Horizontal Scale/div data entry control and enter a timeper-div value, using the pop-up numeric keypad. Then touch inside
the Vertical Scale/div control and enter a voltage value.
Displaying an Individual Segment
1. Touch Math → Math Setup... on the menu bar.
2. Touch a function tab Fx showing its corresponding dialog.
3. On the dialog, touch inside the Operator1 control and select the
Segment button from the pop-up menu.
4. In the dialog on the right, touch the Select tab.
5. Touch inside the First Selected data entry control and select the first
segment you want to display. Use the same method to provide a
value in the Number of Selected data entry control.
Page 67

Getting Started Manual
922136-00 Rev A
59
Note: In Persistence mode, the segments are automatically overlaid one on top of
the other in the display. In non-Persistence mode, they appear separately on the
grid.
Viewing Time Stamps
You can view time stamps for each segment.
1. Touch Timebase → Acquisition Status on the menu bar.
OR
Touch Vertical → Channel Status on the menu bar.
2. Touch the Trigger Time tab.
3. Under Show Status For, touch the Time button.
4. Touch inside the Select Segment control and enter a segment
number value (you can also touch the arrow buttons to scroll
through segment times).
RIS Sampling Mode for Higher Sampling Rates
RIS (Random Interleaved Sampling) is an acquisition technique that allows
effective sampling rates higher than the maximum single-shot sampling
rate. It is used on repetitive waveforms with a stable trigger. The maximum
effective RIS sampling rate is achieved by making multiple single-shot
acquisitions at maximum real-time sample rate. The bins thus acquired are
B
View Segment Time Stamps
Page 68

WaveRunner 6 Zi and 12-Bit HRO
60
922136-00 Rev A
positioned approximately 5 ps (200 GS/s) apart. The process of acquiring
these bins and satisfying the time constraint is a random one. The relative
time between ADC sampling instants and the event trigger provides the
necessary variation.
The instrument requires multiple triggers to complete an acquisition. The
number depends on the sample rate: the higher the sample rate, the more
triggers are required. It then interleaves these segments (in the following
graphic) to provide a waveform covering a time interval that is a multiple of
the maximum single-shot sampling rate. However, the real-time interval
over which the instrument collects the waveform data is much longer, and
depends on the trigger rate and the amount of interleaving required.
Note: RIS mode is not available when the oscilloscope is operating in fixed
sample or DBI 25 - 45 GHz) modes as covered in Smart Memory (available in the
online help files) and Combining Channels topics, respectively.
Roll Mode
Roll mode displays, in real time, incoming points in single-shot acquisitions
that have a sufficiently low data rate. The oscilloscope rolls the incoming
data continuously across the screen until a trigger event is detected and
the acquisition is complete. The parameters or math functions connected
to each channel are updated every time the roll mode buffer is updated, as
if new data is available. This resets statistics on every step of Roll mode
that is valid because of new data.
Note: If the processing time is greater than the acquire time, the data in memory
gets overwritten. In this case, the instrument issues a Channel data is not
continuous in ROLL mode!!! warning and rolling starts over again.
Page 69

Getting Started Manual
922136-00 Rev A
61
Vertical
Overview
You can access Vertical settings using the front panel Vertical controls, by
selecting Vertical→ Channel Setup... on the menu bar, or by touching the
Channel trace descriptor label. The following screen-shot shows the C1
Vertical dialog on a LabMaster as an example. For each channel, a
corresponding Vertical dialog contains sections with respective controls.
1. Channel Controls (below) let you set up individual channels.
2. Actions for Trace C1 Buttons (on page 63) let you perform certain
actions on the channel, such as Math, Zoom, and Measure actions.
3. Pre-Processing Controls (on page 64) let you set up pre-process
controls, such as cable de-embedding and interpolation.
Channel Controls
The individual Channel Controls section of the dialog provides the following
functions for your respective channel:
Channel Inputs - For each channel, you can set the Channel Input to
either Input A (Upper) or Input B (Lower). The Channel Row LED
Indicators display which input is set for each channel.
PLEASE NOTE THE FOLLOWING:
Vertical Scale - For each channel, you can set the vertical scale or
sensitivity and choose whether to use fixed or variable gain
adjustment.
Vertical Offset - For each channel, you can select between zero
vertical offset or to set the offset to a specific value.
B
Not all oscilloscope models have Upper and Lower Channel
Inputs. In those cases, no Selected Input buttons are
provided.
Slave Acquisition Modules indicate alternative, or B channels,
on named LED indicators.
Page 70

WaveRunner 6 Zi and 12-Bit HRO
62
922136-00 Rev A
Coupling - The maximum input voltage depends on the input used.
Values are displayed on the front of the oscilloscope. Whenever the
voltage exceeds this limit, the coupling mode automatically switches
from DC 50 Ω to GROUND. You then have to manually reset the
coupling to DC 50 Ω.
CAUTION.While the unit does provide this protection,
damage can still occur if extreme voltages are applied
Bandwidth - Each oscilloscope contains only the Full selection and
those bandwidths less than the rated oscilloscope bandwidth. Antialiasing filters are applied to limit bandwidth at lower sample rates,
regardless of bandwidth limit selection.
Probe - Teledyne LeCroy's ProBus, ProLink, and 2.92 mm system
automatically senses probes and sets their attenuation for you. For
each channel, the probe attenuation can also be set manually.
Setting Up Channels
1. Touch Vertical → Channelx Setup... from the menu bar.
2. Touch inside the Trace On checkbox to display the trace.
3. On pertinent model oscilloscopes, under Selected Input, touch the
Input A (Upper) button or Input B (Lower) button. Otherwise, no
Selected Input buttons are provided.
4. Turn the VERTICAL GAIN front panel knob for the selected channel.
OR
Touch inside the Volts/Div field and enter a value. Click the keypad
button to enter a value using the pop-up keypad, or use the
up/down arrows.
The set voltage is shown on the trace descriptor label and in the
Volts/Div field in the dialog.
Page 71

Getting Started Manual
922136-00 Rev A
63
5. Turn the VERTICAL OFFSET adjust front panel knob directly above the
channel button whose waveform you want to move vertically. Or
you can touch inside the Offset field and type in a value on the popup keypad. To set the vertical offset to zero, touch the Zero button
directly below the Offset field.
6. Touch inside the Coupling control and select a coupling mode from
the pop-up menu.
7. Touch inside the Bandwidth control and provide a Bandwidth Limit
value using your preferred input control method. Additional
information on using the touch screen controls can be found in the
Dialog Area (on page 42).
8. Touch inside the Probe Atten. data entry control if you want to set
the attenuation manually, and provide a value using your preferred
input control method. Additional information on using the touch
screen controls can be found in the Dialog Area (on page 42).
Actions for Trace C1 Buttons
Actions for Trace C1 buttons provide quick access to various functions for
your respective channel. The following functions are available:
Measure - Turn on a Measurement trace. Choose a measurement
parameter from the Measurement pop-up window to determine a
wide range of waveform properties. For example, you can use
measurement parameters to automatically calculate many attributes
of your waveform, like rise-time, rms voltage, and peak-to-peak
voltage.
Zoom - QuickZoom automatically displays a zoom of the channel or
trace on a new grid.
Math - Turn on a Math trace. Choose a Math function from the
Math pop-up window.
Decode - Shows the main Decode dialog.
Store - Transfers the current trace into a corresponding memory
trace.
B
Page 72

WaveRunner 6 Zi and 12-Bit HRO
64
922136-00 Rev A
Find Scale - Automatically calculates peak-to-peak voltage, and
chooses an appropriate Volts/Div scale to fully display the
waveform.
Next Grid - This button transfers a copy of your waveform into
another grid. If another grid is not showing, the system creates a
new grid for you.
Note: This button is disabled while using Auto Grid.
Label - Shows the Trace Annotation pop-up where you can provide
label text and positioning information.
Pre-Processing Controls
Pre-Processing is meant as before Math processing. Pre-Processing controls
provide the following functions for your respective channel:
Averaging - Specifically performs continuous averaging or the
repeated addition, with unequal weight, of successive source
waveforms. It is particularly useful for reducing noise on signals
drifting very slowly in time or amplitude. The most recently acquired
waveform has more weight than all the previously acquired ones:
the continuous average is dominated by the statistical fluctuations
of the most recently acquired waveform. The weight of old
waveforms in the continuous average gradually tends to zero
(following an exponential rule) at a rate that decreases as the weight
increases.
Deskew - Adjusts the horizontal time offset by the amount entered.
The valid range is dependent on the current timebase setting. Preprocessing deskew and the Math deskew function perform the same
activity.
Page 73

Getting Started Manual
922136-00 Rev A
65
Invert - Invert the waveform for the selected channel.
Cable De-Embedding - When making measurements on serial data
signals, losses in the cables used in the test setup can reduce the
accuracy of your signal (for example, signal amplitude and risetime),
as well as introduce Inter-Symbol Interference. These cable effects
can dramatically alter your serial data measurements and potentially
create mask test violations.
The Cable De-Embedding option allows you to quickly specify the
characteristics of the cables (typically found on the cable's data
sheet) in your test setup and analyze your signal with the effects of
the cables removed.
Note: The Cable De-Embedding checkbox is only available if you have
the option. Learn more about this software option and Contact Teledyne
LeCroy for Support.
Interpolation - Linear interpolation, which inserts a straight line
between sample points, is best used to reconstruct straight-edged
signals such as square waves. (Sinx)/x interpolation, on the other
hand, is suitable for reconstructing curved or irregular wave shapes,
especially when the sample rate is 3 to 5 times the system
bandwidth.
Noise Filter - Enhanced Resolution (ERES) filtering increases vertical
resolution, allowing you to distinguish closely spaced voltage levels.
The tradeoff is reduced bandwidth. The functioning of the
instrument's ERES is similar to smoothing the signal with a simple,
moving-average filter. Use ERES on single-shot waveforms, or where
the data record is slowly repetitive (when you cannot use averaging).
Use it to reduce noise when your signal is noticeably noisy, but you
do not need to perform noise measurements. It also may be used
when performing high-precision voltage measurements: zooming
with high vertical gain, for example.
Response Optimization Modes
Frequency response and group delay of the oscilloscope contributes to the
pulse response characteristics of the oscilloscope. By slightly adjusting
these characteristics using digital signal processing, the characteristic
response of the oscilloscope can be optimized for your specific application.
B
Page 74

WaveRunner 6 Zi and 12-Bit HRO
66
922136-00 Rev A
Frequency response is defined as the decrease in the magnitude response
with respect to frequency. A fourth-order Bessel roll-off slightly attenuates
the frequencies near the bandwidth rating of the oscilloscope while a brickwall frequency response passes slightly higher frequency content.
Group delay is defined as the rate of change of the total phase shift with
respect to angular frequency through a device or transmission medium.
Amplifiers in analog oscilloscopes typically have some group delay at the
highest frequencies. This inherent group delay minimizes the preshoot
present on a step response and provides the traditional pulse response
with no preshoot before the step. When zero group delay is provided at all
frequencies, preshoot and overshoot is equalized.
Teledyne LeCroy provides three choices for Response Optimization Mode
selection. These choices combine a frequency and group delay response to
optimize the oscilloscope for particular applications.
Pulse Response - A group delay compensation minimizing preshoot,
this selection most resembles the response of an analog oscilloscope
by controlling group delay to be slightly non-zero at the highest
frequencies. In addition, a fourth-order Bessel frequency response is
implemented.
Page 75

Getting Started Manual
922136-00 Rev A
67
Eye Diagram - Flat group delay compensation resulting in equalized
preshoot and overshoot. This selection improves the symmetry of
serial eye diagrams. In addition, a fourth-order Bessel frequency
response is implemented.
Flatness - Flat group delay compensation with a brick-wall frequency
response. While this provides the fastest rise time, there is also a
slight penalty of more preshoot and overshoot compared to Eye
Diagram mode. This selection is most often used in narrow-band
RF measurements where it is desired to maintain constant
magnitude response over the oscilloscope passband.
B
Page 76

WaveRunner 6 Zi and 12-Bit HRO
68
922136-00 Rev A
Trigger
Overview
Triggering is the way an oscilloscope selects an exact moment in time on a
signal to then be shown on the screen. If the pattern of a signal happens to
be repetitive, a continuous waveform pattern is inherently visible on the
display.
But without a regular signal pattern, the oscilloscope requires controls to
determine what specific point in time (when a trigger is met) to show the
signal on the display. This is accomplished and affected in a variety of ways.
Some trigger settings allow for pre-trigger, post-trigger, and a delay
between the time of the trigger event and the time when the display is
refreshed (or sweeped) and the waveform is again shown on the screen.
The instrument uses many waveform capture techniques that trigger on
features and conditions that you define. These triggers fall into the
following major categories:
Simple Triggers - activated by basic waveform features or conditions
such as a positive or negative slope, and hold‐off
SMART Triggers - sophisticated triggers that enable you to use basic
or complex conditions for triggering. Use SMART Triggers for signals
with rare features, like glitches.
Measurement Trigger - triggers that allow you to leverage
parameter measurements as waveform trigger conditions. A
measurement trigger is either the only trigger or the final trigger in a
chain of trigger events including hardware triggers.
MultiStage Triggers - varied forms of triggers including Cascaded,
QualFirst, and Qualified allowing varied combinations of triggers
and trigger stages.
Serial Triggers - provide serial data protocol specific triggering for a
wide variety of standards.
Page 77

Getting Started Manual
922136-00 Rev A
69
Trigger Types
There are a set of standard Trigger Types. These Triggers are basic
waveform features or conditions such as a positive or negative slope, and
hold-off and are available on all oscilloscopes along with tools like Software
Assisted Trigger and Trigger Scan.
In addition, there are more sophisticated triggers for setting basic or
complex conditions. These include Smart Triggers, Serial Trigger,
Measurement Triggers, and MultiStage Triggers.
Learn more and Contact Teledyne LeCroy for Support.
Edge
A simple trigger, Edge trigger is activated by basic waveform features or
conditions such as positive or negative slope, and holdoff.
Note: On WaveMaster 8 Zi and Zi-A and LabMaster 9 Zi-A, up to 15 GHz
bandwidth is available while Edge Triggering (provided no holdoff is selected).
Width
Width trigger allows you to define a positive- or negative-going pulse width
bounded by a voltage level, above or below an occurring trigger. Or you
can specify a pulse width and voltage range, within or outside an occurring
trigger.
Pattern (Logic)
Logic trigger enables triggering on a logical combination (pattern) of five
inputs: CH1, CH2, CH3, CH4, and AUX (sometimes referred to as EXT on
legacy oscilloscope models). You have a choice of four Boolean operators
(AND, NAND, OR, NOR), and you can stipulate the high or low voltage logic
level for each input independently.
B
Page 78

WaveRunner 6 Zi and 12-Bit HRO
70
922136-00 Rev A
Smart
These are a specific set of sophisticated trigger types. Smart trigger types
are used to set conditions on signals with rare features, like the glitches
and others as follows:
WINDOW
A smart trigger occurs when a signal enters or exits a window defined by
adjustable thresholds.
INTERVAL
While Glitch trigger performs over the width of a pulse, Interval trigger
performs over the width of an interval - the signal duration (the period)
separating two consecutive edges of the same polarity: positive to positive
or negative to negative. Use interval trigger to capture intervals that fall
short of, or exceed, a given time limit. In addition, you can define a width
range to capture any interval that is itself inside or outside the specified
range - an Exclusion trigger by interval.
GLITCH
Glitch trigger is a simpler form of Width trigger. Use Glitch trigger when
you want to define a fixed pulse-width time or time range only. Glitch
trigger makes no provision for voltage levels or ranges.
DROPOUT
Used primarily in single-shot applications, and usually with a pre-trigger
delay, Dropout trigger can detect lost signals. The trigger is generated at
the end of the timeout period following the last trigger source transition.
Page 79

Getting Started Manual
922136-00 Rev A
71
RUNT
The Runt trigger occurs when a pulse crosses a first threshold line, but fails
to cross a second threshold line before re-crossing the first. Other defining
conditions for this trigger are the edge (triggers on the slope opposite to
that selected) and runt width.
SLEW RATE
SlewRate trigger activates a trigger when the rising or falling edge of a
pulse crosses two threshold levels: an upper level and a lower level. The
pulse edge must cross the thresholds faster or slower than a selected
period of time.
Measurement
This trigger type allows you to leverage parameter measurements as
waveform trigger conditions. A measurement trigger is either the only
trigger or the final trigger in a chain of trigger events including hardware
triggers.
TV
Not available on all instruments, TV triggers provide stable triggering on
standard or custom composite video signals. Use them on PAL, SECAM,
NTSC, or HDTV systems.
MulitStage
B
Page 80

WaveRunner 6 Zi and 12-Bit HRO
72
922136-00 Rev A
Touching this MultiStage trigger type shows the additional MultiStage
types on the dialog. Select from Cascaded, QualFirst, and Qualified as
follows:
CASCADED
The Cascaded trigger allows you to define successive trigger Stages
(referred to as Stage A, B, C, and D) as arm, trigger/arm, trigger/arm,
trigger criteria, respectively.
QUALFIRST
In single trigger mode, QualFirst arms the oscilloscope on the A event, and
then triggers on all subsequent B events.
Note: This button is enabled when using the sequence sampling mode. It is
commonly used in sequence mode for disk drive applications with the index pulse
defined as the A qualifier signal and the servo gate signal as the B triggering
events.
QUALIFIED A-B
In single trigger mode, Qualify A-B arms the oscilloscope on the A event,
and then triggers on the B event. If the oscilloscope is in Normal trigger
mode, it automatically resets after the B event. Arm trigger events can be
set for Edge, Pattern, State, and PatState. State is briefly explained as
follows:
State
The State trigger is a level-qualified trigger which requires that the
qualifying signal remain above or below a specified voltage level for a
trigger to occur. For State trigger, you specify the time or number of events
after the signal has gone above or below the voltage level when you want
the trigger to occur.
Page 81

Getting Started Manual
922136-00 Rev A
73
Serial Trigger
Protocol-enabled serial trigger capabilities are available as options on
several oscilloscope models.
SERIES-SPECIFIC FEATURE: On earlier model oscilloscopes, such as legacy
versions of WaveJet, WaveRunner, WaveSurfer (including Xi/Xs non-A/B models,
and Legacy SDA models include a set of Serial protocol tools as part of the core
components.
Clock and Data Recovery (CDR)
SERIES-SPECIFIC FEATURE: 80-bit Serial Trigger (without decode capability) is
standard on SDA model oscilloscopes and optional on WavePro, WaveMaster, and
DDA model oscilloscopes. The CDR feature is optional for the WaveRunner 6 Zi
family, including 8b/10b decode.
Trigger Settings
Horizontal and Vertical adjustments are typically made for all trigger types
using either the Delay or Level knobs on the front panel of the instrument
or their respective controls on the Timebase setup dialog.
Horizontal: Turn the DELAY knob in the HORIZONTAL control group
to adjust the trigger's horizontal position. Or, touch inside the Delay
control and provide a value on the Timebase dialog using your
preferred input control method. Additional information on using the
touch screen controls can be found in the Dialog Area (on page 42).
The trigger location is shown by a marker under the grid.
Post-trigger delay is indicated by a left-pointing arrow at the lowerleft of the grid.
B
Page 82

WaveRunner 6 Zi and 12-Bit HRO
74
922136-00 Rev A
The time value is given in the title line of the Timebase label at the
lower-right of the grid.
Vertical: Turn the LEVEL knob in the TRIGGER control group to adjust
the trigger's vertical threshold.
Turn this knob to adjust the level of the trigger source or the
highlighted trace. Level defines the source voltage at which the
trigger will generate an event: a change in the input signal that
satisfies the trigger conditions.
Alternatively, in the Trigger dialog, you can touch inside the Level
control and provide a value using your preferred input control
method. Additional information on using the touch screen controls
can be found in the Dialog Area (on page 42). Quickly set a level of
zero volts by touching the Zero Level button.
An arrow on the right side of the grid shows the threshold position.
This arrow is only visible if the trigger source is displayed.
Trigger Setup
Based on your Trigger Type selection, sections of the main Trigger dialog
and additional dialogs altogether vary.
Most trigger types have Type, Setup, and Level selections. The following
sections explain some of the standard setup configurations for different
trigger types.
1. Make your Type selection by touching the button corresponding to
the desired trigger.
2. Touch inside the trigger Source control for your first Setup
configuration and select a source on which to trigger.
3. If available, touch inside the Coupling control and select a coupling
mode.
Page 83

Getting Started Manual
922136-00 Rev A
75
Coupling refers to the type of signal coupling at the input of the
trigger circuit. Choices of trigger coupling vary by oscilloscope
model.
With DC coupling, all of the signal's frequency components are
coupled to the trigger circuit for high-frequency bursts.
4. Touch inside the trigger Slope control and choose the direction of
the trigger voltage transition used for generating a particular trigger
event.
The selection is then shown to the right of the dialog as follows for a
Positive Slope selection on an Edge Trigger.
Edge trigger works on the selected edge at the chosen level. The slope
(positive or negative) is specified on the Trigger label permanently shown
4. Level defines the source voltage at which the trigger circuit
generates an event (a change in the input signal that satisfies the
trigger conditions). The selected trigger level is associated with the
chosen trigger source. Note that the trigger level is specified in volts
and normally remains unchanged when the vertical gain or offset is
modified.
The Amplitude and Range of the trigger level have limits as detailed
in the datasheet specifications regularly maintained on
teledynelecroy.com.
B
to the lower-right of the grid.
Page 84

WaveRunner 6 Zi and 12-Bit HRO
76
922136-00 Rev A
Touch inside the Level data entry control and provide a value using
your preferred input control method. Additional information on
using the touch screen controls can be found in the Dialog Area (on
page 42).
Provide a voltage level (in millivolts).
PLEASE NOTE THE FOLLOWING:
Once specified, Trigger Level and Coupling are the only parameters
remaining unchanged as you switch from trigger mode to trigger
mode for each trigger source.
Some additional controls and dialogs for triggers that differ are
provided in the following topics as examples.
Optimize for HF
The Optimize for HF checkbox can be used on an Edge trigger to reject high
or low frequencies.
The checkbox is marked by default; meaning, the instrument is optimized
for high-frequency waveforms.
Note: If you are measuring a waveform that is 10 MHz or slower, be sure to
unmark the checkbox to avoid triggering on an incorrect slope.
Width Condition is
Width triggers (and other triggers equipped with conditional logic) have
conditional logic settings as follows.
Your Width Condition can be specified as Less Than, Greater Than, In
Range and Out Of Range.
Page 85

Getting Started Manual
922136-00 Rev A
77
In Range and Out Of Range conditions can be further set with Upper and
Lower Values (for Limits), or Nominal width and Delta (for Delta).
Note: Width Condition settings are summarized on the far right of the dialog.
Holdoff by Time or Events
Holdoff is an additional condition of Edge and Pattern triggers. It can be
expressed either as a period of time or an event count. Holdoff disables the
trigger circuit for a given period of time or number of events after the last
trigger occurred. Events are the number of occasions on which the trigger
condition is met. The trigger resumes when the holdoff has elapsed and its
other conditions are met.
Select the holdoff by touching the Time or Events buttons on the Holdoff
dialog.
Now, click the corresponding control and provide a value.
Use holdoff to obtain a stable trigger for repetitive, composite waveforms.
For example, if the number or duration of sub-signals is known you can
disable them by choosing an appropriate holdoff value. Qualified triggers
operate using conditions similar to holdoff.
HOLD OFF BY TIME
Sometimes you can achieve a stable display of complex, repetitive
waveforms by placing a condition on the time between each successive
trigger event. This time would otherwise be limited only by the input signal,
the coupling, and the instrument's bandwidth. Select a positive or negative
slope, and a minimum time between triggers. The trigger is generated
when the condition is met after the selected holdoff time, counted from
the last trigger. The delay is initialized and started on each trigger.
B
Page 86

WaveRunner 6 Zi and 12-Bit HRO
78
922136-00 Rev A
Edge Trigger with Holdoff by Time. The bold edges on the trigger source indicate
that a positive slope has been selected. The broken upward-pointing arrows
indicate potential triggers, which would occur if other conditions are met. The
bold arrows indicate where the triggers actually occur when the holdoff time has
been exceeded.
HOLD OFF BY EVENTS
Select a positive or negative slope and a number of eventwis. An event is
the number of times the trigger condition is met after the last trigger. A
trigger is generated when the condition is met after this number, counted
from the last trigger. The count is restarted on each trigger. For example, if
the event number is two, the trigger occurs on the third event.
Edge Trigger with Holdoff by Events (in this example, two events). The bold edges
on the trigger source indicate that a positive slope has been selected. The broken,
upward-pointing arrows indicate potential triggers, while the bold ones show
where triggers actually occur after the holdoff expires.
Page 87

Getting Started Manual
922136-00 Rev A
79
Auxiliary Input Trigger
Some instrument models provide auxiliary input trigger capability. It's done
as a pattern trigger, on the Ext dialog.
Select X1, or ÷10. You can also select from DC50Ω, Gnd, and DC1MΩ
Impedance values.
TriggerScan
TriggerScan is a debugging tool (available for any trigger type) that helps
you quickly find rare waveform glitches and anomalies. With TriggerScan,
you can build a list of trigger setups to look for rare events and
automatically sequence through each one. TriggerScan can use any type of
trigger setup available including edge, width, and qualify as well as Smart
Triggers (such as, glitch and runt triggers). TriggerScan automates two key
processes in triggering rare events:
1. Trains the system by looking at normal acquired waveforms. During
the training, the oscilloscope analyzes the waveforms to determine
what waveforms normally look like. Using this information, it
generates a list of smart trigger setups to trigger on abnormal
situations.
2. Loads the smart trigger setups from the Trainer and cycles through
these. As triggers occur, they are overlaid on the screen. All
acquisition settings are preserved and you can use all the functions
of the oscilloscope to find the root cause of these anomalies
including, WaveScan, Histograms, and advanced analysis.
B
Page 88

WaveRunner 6 Zi and 12-Bit HRO
80
922136-00 Rev A
Training TriggerScan
The TriggerScan Trainer inspects a currently acquired waveform and
automatically builds a list of common trigger setups used to find rare
events.
PLEASE NOTE THE FOLLOWING:
You must acquire and display at least 3 cycles of a signal before
running the Trainer.
You should run the Trainer if you want to change the trigger types or
if you change the channel or signal.
1. Touch Trigger → Trigger Setup... from the menu bar.
2. On the Trigger dialog, click the TriggerScan tab.
3. Touch the Trainer button and select a channel as the source for the
training on the Trigger Scan Trainer pop-up. Also choose the types
of triggers the Trainer should use to train the system and then touch
the Start Training button. The training begins. When it is complete, a
list of smart trigger setups is displayed in the Trigger List.
Page 89

Getting Started Manual
922136-00 Rev A
81
Starting TriggerScan
After you have run the Trainer, the Trigger List displays a list of smart
trigger setups. You can add or remove trigger setups. You can also update
the selected smart trigger setup. Once you have made any changes to the
Trigger List, you are ready to start scanning.
1. Touch Trigger → Trigger Setup... from the menu bar.
2. On the Trigger dialog, click the TriggerScan tab and its
corresponding dialog is shown.
3. If you want to add a new trigger setup, touch the Trigger tab and set
the new trigger as desired on the Trigger dialog. Then, back on the
TriggerScan dialog, touch the Add New button to append the new
trigger to the Trigger List.
B
Page 90

WaveRunner 6 Zi and 12-Bit HRO
82
922136-00 Rev A
4. If you want to replace the selected trigger setup with the current
trigger setup, highlight the setup in the Trigger List and touch the
Update Selected button.
5. If you want to show a specific trigger setup on the Trigger List,
highlight its corresponding row on the list, and then touch the Load
Selected button.
Note: If you want to delete all trigger setups in the Trigger List, touch the
Delete All button.
6. If you want to delete a trigger setup, highlight the setup in the
Trigger List and touch the Delete Selected button.
7. All trigger setups can be deleted regardless of selections on the
Trigger List with one step by touching the Delete All button.
5. Once you have made any changes to the Trigger List, touch the
Trainer button and then restart the scan by touching the Start
Training button on the Trigger Scan Trainer pop-up. The oscilloscope
automatically sequences through all the trigger setups.
PLEASE NOTE THE FOLLOWING:
You can tune the dwell time that the oscilloscope waits
before loading the next trigger setup using the Dwell Time
data entry control.
If you have Persistence display mode enabled, all trigger
events are recorded on the display. Refer to the Persistence
Setup (on page 88) topic for instructions on enabling
Persistence display mode.
If you want TriggerScan to stop when the next oscilloscope
trigger, check the Stop On Trigger checkbox. You can use this
to isolate specific trigger setups.
Saving TriggerScan Setups
You should save TriggerScan setups once you have made any modifications
to the Trigger List. The current Trigger List is not be preserved after exiting
the application unless you save it.
1. On the TriggerScan dialog, touch inside the Setup File Name data
entry control and providing a file name using your preferred input
control method. Additional information on using the touch screen
controls can be found in the Dialog Area (on page 42).
Page 91

Getting Started Manual
922136-00 Rev A
83
OR
Touch the Browse button and select a location and file name.
2. Touch the Save Setup... button.
Note: You can load previously saved TriggerScan setups by touching the Browse
button, locating the file, and then touching Load Setup....
Viewing Waveforms
Display
Oscilloscope display grids present the trace information in a voltage vs.
time format. The oscilloscope analog-to-digital converter (ADC) information
is displayed vertically on the grid with the ADC bits divided proportionally
according to their amplitude on the grid. Channel traces are typically 8-bits
of vertical data, whereas Math traces are 16-bits of vertical data. Teledyne
LeCroy grids consist of eight vertical divisions.
When displaying channel traces on the grid, use of less than full-grid
amplitude results in some reduced vertical resolution and accuracy. For
instance, if a channel trace is displayed as two divisions high on a grid, the
number of ADC bits utilized is...
This is quite less than the full 8-bit resolution. Such a reduction in vertical
resolution may be acceptable if the primary measurement consideration is
for rough timing measurements; however, if vertical accuracy or extreme
timing accuracy is a requirement, it is better to increase the amplitude of
the signal to utilize close to maximum grid height. In order to accomplish
this while still providing the ability to view many signals at one time on the
oscilloscope display Teledyne LeCroy provides multi-grid capability. This
creates multiple oscilloscope grids, each with 8-bit vertical resolution, and
allows many full-resolution grids (but vertically smaller in grid height) for
concurrent display without affecting the vertical resolution.
Different grid displays are available based on instrument and installed software
packages. For example, some displays show side-by-side, instead of vertically
stacked grids. The additional grid displays offer more convenient views of multiple
waveforms. Refer to your instrument datasheet at teledynelecroy.com for detailed
information as to which grid displays are provided with your oscilloscope.
B
2/8 * 2^8 or 64 bits
Page 92

WaveRunner 6 Zi and 12-Bit HRO
84
922136-00 Rev A
Display Setup
Access and adjust the different display configurations on our oscilloscope
using the following steps:
Note: Not all grid styles are available on all instruments. Grid styles vary based on
both oscilloscope model and whether or not you have the SDAII software option
loaded on your oscilloscope. Learn more about software options and Contact
Teledyne LeCroy for Support.
1. Touch Display → Display Setup... on the menu bar.
2. Touch one of the Display combination buttons.
PLEASE NOTE THE FOLLOWING:
Small images label each Display combination button and indicate its
corresponding grid configuration.
Autogrid automatically adds or deletes grids as you select more or
fewer waveforms to display.
If more than a certain amount of display setups are available for
your oscilloscope, a Grid control is shown and presents the Select
Grid pop-up when touched.
Page 93

Getting Started Manual
922136-00 Rev A
85
3. Touch inside the Grid Intensity data entry control.
4. Provide a value from 0 to 100 (percent).
5. Touch the Grid on top checkbox if you want to superimpose the grid
over the waveform.
Note: Depending on the grid intensity, some of your waveforms may be
hidden from view when the grid is placed on top. To undo, simply uncheck
Grid on top.
6. Touch the Axis labels checkbox to permanently display the values of
the top and bottom grid lines (calculated from volts/div) and the
extreme left and right grid lines (calculated from the timebase).
7. Choose a line style for your trace: solid Line or Points.
8. Touch inside the trace Intensity data entry control if you want to
change the value.
9. Enter a value from 0 to 100.
Note: Access the Monitor tab for external monitor display settings. Refer to the
External Display topic for more details.
SEQUENCE MODE DISPLAY
Set up a Sequence Mode display by first selecting a Sequence trigger mode
in the Timebase → Horizontal Setup dialog. You must also have entered a
Num Segments value. For more information on setting up Sequence Mode,
see the Sequence Sampling Mode (on page 53) topic.
1. Touch Display → Display Setup... on the menu bar.
2. Touch inside the Display Mode control and select a display mode
from the pop-up menu.
Touch inside the Num seg displayed control and enter a value, using
the pop-up keypad.
Touch inside the Starting at control and enter a value.
B
Page 94

WaveRunner 6 Zi and 12-Bit HRO
86
922136-00 Rev A
Moving Traces from Grid to Grid
You can move traces from grid to grid with the touch of a button.
Moving a Channel or Math Trace
1. Touch the trace descriptor label for the waveform you want to
move.
2. Touch the Next Grid button.
Note: If you have more than one waveform displayed on only one grid, a second
grid automatically opens when you select Next Grid.
Displays Containing Masks
Since masks are pixel-based display renderings, you can think of them as
part of the Display feature set on your instrument. Masks and mask testing
are applied to waveforms as part of Pass/Fail functionality accessed from
Analysis → Pass/Fail from the menu bar.
Note: For more detailed information about Masks and other Pass/Fail
functionality, such as removing a mask from your display, refer to Mask Testing
(on page 124).
Dual Display Grid Selection
Make a dual grid display selection for showing on an external display (once
properly connected to the I/O panel) by selecting Display → Display
Setup....
Page 95

Getting Started Manual
922136-00 Rev A
87
Note: First-time setup may show a different Display tab. Fix this by touching File
→ Exit on the menu bar and re-launching the oscilloscope software using the
Start DSO shortcut on the desktop.
1. Touch the Dual button on the Display Mode section.
2. Touch inside the Grid control on the Grid Mode section of the dialog.
The Select Grid pop-up is shown.
3. Touch the Dual Display category and choose from Single/Single,
Dual/Dual, and Quad/Quad options.
Your grid selection is now shown on both displays.
Persistence
Persistence Overview
The Persistence feature helps you display your waveform and reveal its
idiosyncrasies or anomalies for a repetitive signal. Use Persistence to
accumulate on-screen points from many acquisitions to see your signal
change over time. The instrument persistence modes show the most
frequent signal path in three-dimensional intensities of the same color, or
graded in a spectrum of colors.
You can show persistence for up to eight inputs for any channel, math
function, or memory location (M1 to M4).
B
Page 96

WaveRunner 6 Zi and 12-Bit HRO
88
922136-00 Rev A
Persistence Setup
Touch Display → Persistence Setup... on the menu bar.
Now, touch the Persistence On checkbox and refer to the following
scenarios based on your needs.
Persistence Setup for All Input Channels at Once
1. Touch the All Locked button.
2. Touch one of the Mode buttons.
3. Touch the Show last trace checkbox if you want the last trace
displayed.
4. Touch inside the Saturation data entry control and provide a whole
number integer.
For more information on saturation, see the Saturation Level topic.
5. Touch inside the Persistence time data entry control and make a
selection from the pop-up menu.
Persistence Setup for Each Input Channel Individually
1. Touch the Per Trace button.
2. Touch one of the persistence mode buttons next to an input
channel.
To turn off persistence for an individual channel, touch the left-most
persistence mode button next to the channel.
OR
Page 97

Getting Started Manual
922136-00 Rev A
89
For each input channel, touch its tab to set up persistence for that
channel.
3. Touch one of the mode buttons.
4. Touch the Show last trace checkbox if you want the last trace
displayed.
5. Touch inside the Saturation data entry control and enter a whole
number integer,.
6. Touch inside the Persistence time data entry control and make a
selection from the pop-up menu.
7. If you want to return all input channel setups to their default
settings, touch the Reset All button.
WaveStream Display Mode
This fast viewing mode provides brightness-graded intensity with a decay
time similar to the action of phosphor on an analog screen.
WaveStream mode operates at up to 80 GS/s with an update rate of up to
several thousand waveforms/second for better capture of higher frequency
abnormal events.
B
Page 98

WaveRunner 6 Zi and 12-Bit HRO
90
922136-00 Rev A
Adjusting Trace Intensity
The INTENSITY knob adjusts the brightness of your trace.
The intensity value is shown in the bottom-right corner of the screen.
PLEASE NOTE THE FOLLOWING:
Pushing the Intensity knob changes the Persistence status in the following
ways.
OFF - When the button hasn't been pushed, it may be turned to
control the trace Intensity control value.
Analog Persistence - When the button is pushed once, the
waveform resembles a trace on a phosphor oscilloscope. Turning the
knob affects persistence with a blended form of Intensity and
Saturation. As the knob is turned clockwise, the Intensity value
increases while the Saturation value decreases. The opposite occurs
when the button is turned counter clockwise.
Color Persistence - The button behaves the same way as Analog.
However, the grid display shows a color waveform where red
indicates most frequent occurrences while blue denotes the less
frequent.
Instead of using the knob, you can provide values for Intensity (same
control on Display and Persistence dialogs) or Saturation controls.
Page 99

Getting Started Manual
922136-00 Rev A
91
Zooming Waveforms
Overview
You can magnify a selected region of a waveform using the Zoom function.
On Zi model oscilloscopes, you can display up to four Zoom (Z1 - Z4) and
eight Math Zoom traces (F1 - F8). You can zoom:
A single channel - covered in To Zoom a Single Channel (on page
92).
A math or memory trace - known as Zooming Memory or Math
Function Traces.
Multiple waveforms at once - covered in To Zoom Multiple
Waveforms Quickly (on page 94).
Segments in a sequence - found in Sampling Modes → Sequence
Sampling Mode (on page 53)
You can also use the Multi-Zoom Math function to create time-locked zoom
traces for selected waveforms. For more information, refer to Math →
Multi-Zoom).
At any time, you can zoom a portion of a channel waveform or
Memory/Math function trace by touching and dragging a rectangle around
any part of the input waveform, see the To Zoom by Touch-and-Drag (on
page 94) topic. The zoom trace will size itself to fit the full width of the grid.
The degree of magnification, therefore, will depend on the size of the
rectangle that you draw.
You can also use the front panel QUICKZOOM button to create multiple
zooms, one for each displayed input channel. For more information, see
the To Zoom Multiple Waveforms Quickly (on page 94) topic.
Previewing Zoomed Waveforms
When you zoom a waveform, a preview of the zoomed area is shown on
the Preview section of the Zx dialog.
B
Page 100

WaveRunner 6 Zi and 12-Bit HRO
92
922136-00 Rev A
Zooming a Single Channel
The Zoom button appears as a standard button at the bottom of the
channel Cx Vertical Adjust setup dialog for you to create a zoom trace of
your input waveform.
1. On the menu bar, touch Vertical → Channel X Setup....
OR
Touch the channel trace descriptor label for a displayed channel.
2. Touch the Zoom at the bottom of the Cx Vertical Adjust dialog. A zoom
trace (one of Z1 to Z4) is created for the selected channel.
3. Vary the degree of zoom by touching the newly created Zx trace label. The
setup dialog for the zoom (Z1 to Z4) opens. It shows the current
horizontal and vertical zoom factors.
4. If you want to increase or decrease your horizontal or vertical zoom
in small increments, touch the Var. checkbox to enable variable
zooming. Now with each touch of the zoom control buttons, the
degree of magnification changes by a small increment.
 Loading...