

Page 1
INSTRUCTION MANUAL
MODEL 514
NDIR
A
NALYZER
DANGER
HIGHLY TOXIC AND OR FLAMMABLE LIQUIDS OR GASES MAY BE PRESENT IN THIS MONITORING
SYSTEM.
PERSONAL PROTECTIVE EQUIPMENT MAY BE REQUIRED WHEN SERVICING THIS SYSTEM.
HAZARDOUS VOLTAGES EXIST ON CERTAIN COMPONENTS INTERNALLY WHICH MAY PERSIST FOR
A TIME EVEN AFTER THE POWER IS TURNED OFF AND DISCONNECTED.
ONLY AUTHORIZED PERSONNEL SHOULD CONDUCT MAINTENANCE AND/OR SERVICING. BEFORE
CONDUCTING ANY MAINTENANCE OR SERVICING CONSULT WITH AUTHORIZED SUPERVISOR/
MANAGER.
Teledyne Analytical Instruments
A Business Unit of Teledyne Electronic Technologies
P/N M63700
08/06/99
ECO # 99-0323
Page 2

Copyright © 1999 Teledyne Analytical Instruments
All Rights Reserved. No part of this manual may be reproduced, transmitted,
transcribed, stored in a retrieval system, or translated into any other language or computer language in whole or in part, in any form or by any means, whether it be electronic, mechanical, magnetic, optical, manual, or otherwise, without the prior written
consent of Teledyne Analytical Instruments, 16830 Chestnut Street, City of Industry, CA
91749-1580.
Warranty
This equipment is sold subject to the mutual agreement that it is warranted by us
free from defects of material and of construction, and that our liability shall be limited to
replacing or repairing at our factory (without charge, except for transportation), or at
customer plant at our option, any material or construction in which defects become
apparent within one year from the date of sale, except in cases where quotations or
acknowledgements provide for a shorter period. Components manufactured by others
bear the warranty of their manufacturer. This warranty does not cover defects caused by
wear, accident, misuse, or neglect. We assume no liability for direct or indirect damages
of any kind and the purchaser by the acceptance of the equipment will assume all
liability for any damage which may result from its use or misuse.
We reserve the right to employ any suitable material in the manufacture of our
apparatus, and to make any alterations in the dimensions, shape or weight of any parts,
in so far as such alterations do not adversely affect our warranty.
Important Notice
This instrument is intended to be used a tool to gather valuable data. The information provided by the instrument may assist the user in eliminating potential hazards
caused by the process that the instrument is intended to monitor; however, it is essential
that all personnel involved in the use of the instrument or its interface with the
process being measured be properly trained in the process itself, as well as all
instrumentation related to it.
The safety of personnel is ultimately the responsibility of those who control
process conditions. While this instrument may be able to provide early warning of
imminent danger, it has no control over process conditions, and can be misused. In
particular, any alarm or control system installed must be tested and understood, both as
they operate and as they can be defeated. Any safeguards required such as locks, labels,
or redundancy must be provided by the user or specifically requested of Teledyne.
The purchaser must be aware of the hazardous conditions inherent in the
process(es) he uses. He is responsible for training his personnel, for providing hazard
warning methods and instrumentation per the appropriate standards, and for ensuring
that hazard warning devices and instrumentation are maintained and operated properly.
TAI, the manufacturer of this instrument, cannot accept responsibility for conditions beyond its knowledge and control. No statement expressed or implied by this
document or any information disseminated by the manufacturer or his agents is to
be construed as a warranty of adequate safety control under the user's process
conditions.
Teledyne Analytical Instruments
A Business Unit of Teledyne Electronic Technologies
Page 3

Table of Contents
1.0 Introduction
1.1 Method of Analysis............................................................1-1
1.2 Modules (Condulets) .........................................................1-2
1.2.1 Source Module .......................................................1-5
1.2.2 Sample Module ..................................................1-5
1.2.3 Power Module ..................................................1-5
1.2.4 Detector Module ..................................................1-5
1.2.5 Local Meter Readout ..............................................1-6
1.2.6 Control Module ..................................................1-6
1.3 Typical Applications ..........................................................1-6
2.0 Operational Theory
2.1 Circuit Description.............................................................2-2
2.1.1 Source Module .................................................... 2-2
2.1.2 Sample Module ..................................................2-3
2.1.3 Power Module ..................................................2-4
2.1.4 Detector Module ..................................................2-8
2.1.5 Control Module ..................................................2-10
3.0 Installation
3.1 Location ............................................................................3-1
3.2 Sample Saction Installation...............................................3-1
3.2.1 Filtering ..................................................................3-1
3.2.2 Effluent Return........................................................3-2
3.2.3 Flow Control ...........................................................3-2
3.2.4 Selector Manifold....................................................3-3
3.2.5 Automatic Zero Operation.......................................3-3
3.3 Electrical Installation .........................................................3-3
3.3.1 Power Check..........................................................3-3
3.4 Analysis Unit .....................................................................3-5
3.5 Optical Alignement............................................................3-6
4.0 Operations
4.1 Control Functions..............................................................4-1
4.1.1 General Purpose Version: Analysis Section...........4-1
4.1.2 General Purpose Version: Controle Module...........4-2
4.1.3 Explosion-Proof Version: Control Module ..............4-3
Teledyne Analytical Instruments
A Business Unit of Teledyne Electronic Technologies
Page 4

4.2 Start-up..............................................................................4-4
4.2.1 Preliminary Inspection............................................4-4
4.2.2 Pre-Start-up Electrical Checkout ............................4-5
4.2.3 Power On Observation ...........................................4-5
4.3 Calibration.........................................................................4-6
5.0 Maintenance & Troubleshooting
5.1 Replacement of Sample Cell Optics .................................5-2
5.2 Replacement of Filter Wheel Optics..................................5-2
5.3 Replacement of Source Lamp Assembly ..........................5-3
5.4 Replacement of Filter Position Sensor..............................5-4
5.5 Replacement of Preamplifier Circuitr Card........................5-4
5.6 Re-screening of Lens ..................................................5-5
5.7 Troubleshooting ..................................................5-5
Appendix
Specifications ....................................................................A.1
Application Data ................................................................A.2
Recommended Spare Parts List .......................................A.3
Drawing List ......................................................................A.4
Teledyne Analytical Instruments
A Business Unit of Teledyne Electronic Technologies
Page 5

Introduction 1.0
1.0 Introduction
The Model 514 Photometric Analyzer measures the concentration of
one component in a mixture of liquids or gases continuously by measuring
the radiation absorbed in selected bands in the near infrared (NIR) spectral
region. Most liquids or gases having a characteristic absorption spectrum in
this region can be measured with the analyzer. When we refer to the NIR
region we mean that portion of the electromagnetic energy spectrum from
1.0 to 2.8µ. This range can be extended to somewhat longer wavelengths
using special detectors. Most organic and some inorganic compounds can be
analyzed in the NIR region.
For example, the 514 is used to analyze parts per million (PPM) or the
percentage concentration of water in a variety of compounds (see Typical
Applications). The analyzer can also be used to measure the concentration of
one organic compound in the presence of another organic compound.
1.1 Method of Analysis
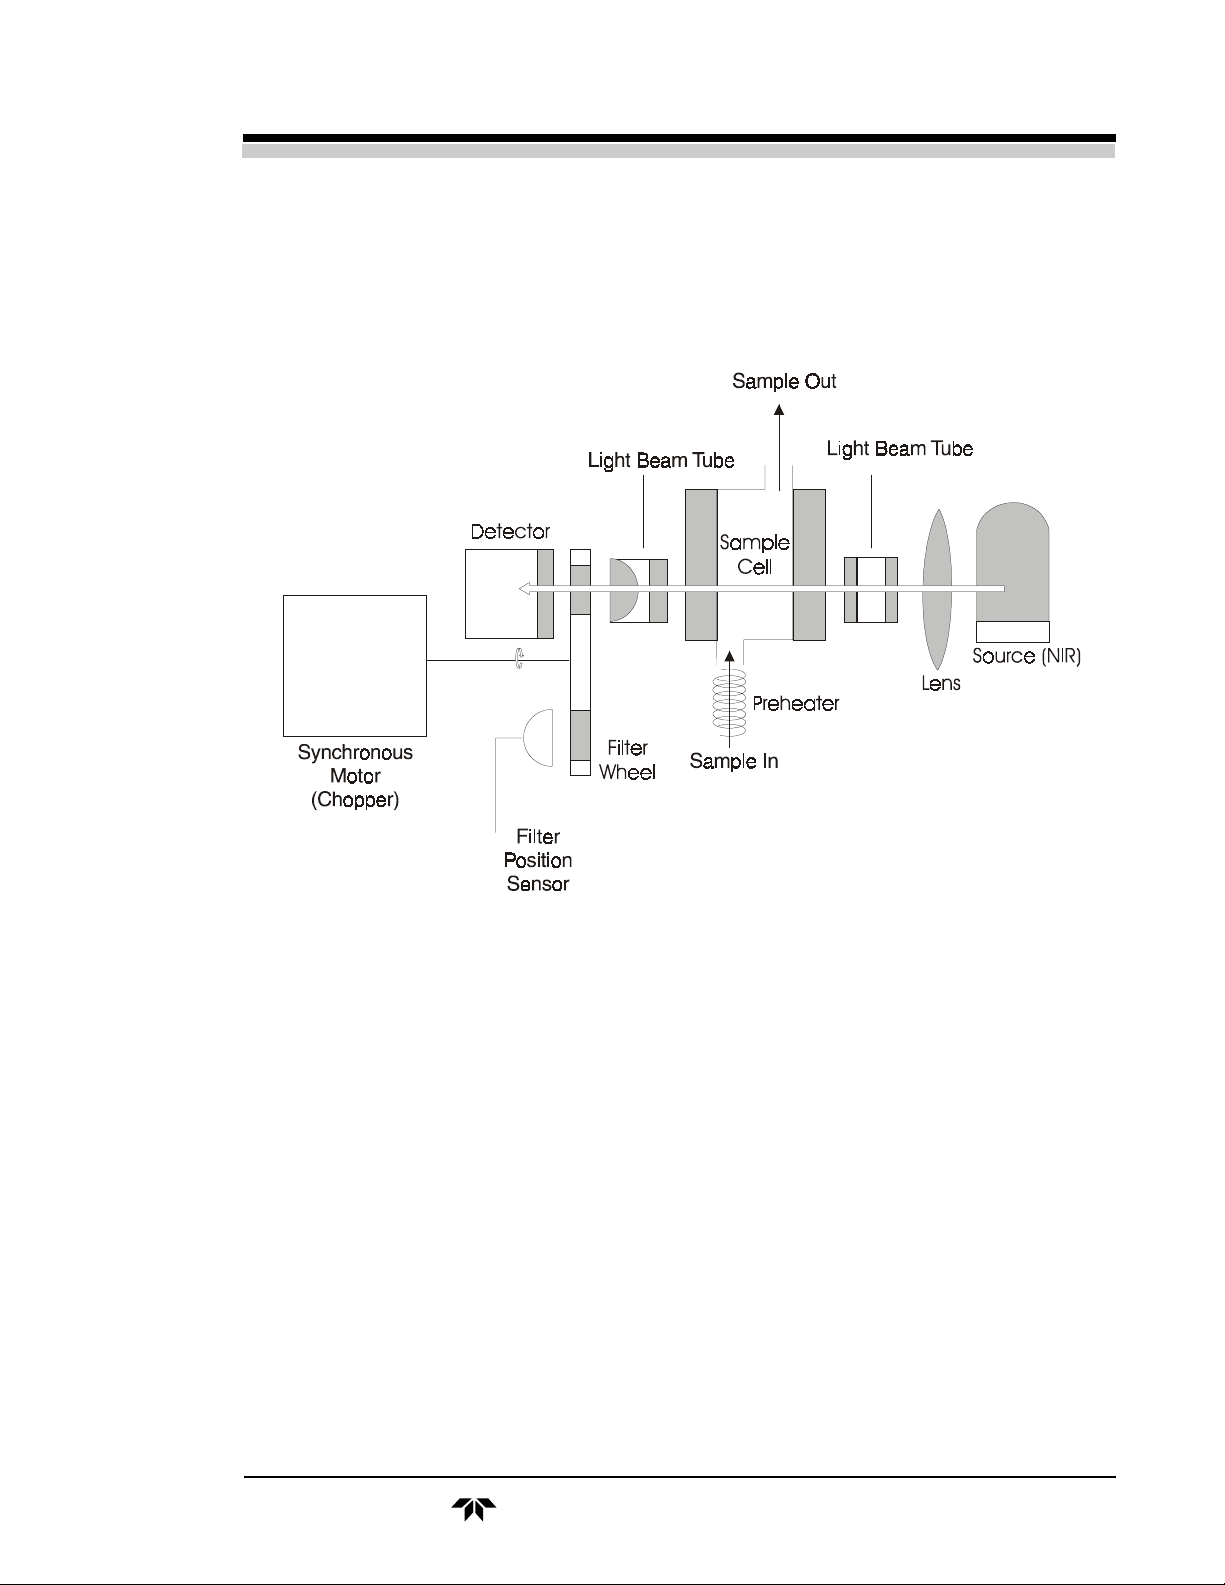
The 514 contains an optical system consisting of a quartz iodine source
lamp for NIR energy emission, collimating lens, sample cell and detector.
Isolator or light beam tubes filled with nitrogen gas interconnect the source
and sample, and sample and detector modules. In front of the detector is a
motor-driven filter wheel containing two optical interference-type filters,
located 180° from each other. These filters, designated the reference and
measuring filters, are alternately and continuously rotated in and out of the
optical path. The sample flows continuously through the sample cell absorbing energy at various wavelengths throughout the NIR spectrum. The wavelengths and intensities of absorption peaks throughout the spectrum are
characteristic of the specific compounds that are present in the sample.
In any photometric analysis, there is always the component that we are
interested in analyzing, and background components that we are not interested in measuring. Both the component of interest and the background
component may have complex NIR absorption spectra.
Teledyne Analytical Instruments
A Business Unit of Teledyne Electronic Technologies
1–1
Page 6

1.0 Introduction
The quantitative measurement of a compound using the 514 is based on
Beer’s Law, which states that the intensity of a beam of monochromatic
radiation transmitted through a sample decreases exponentially as the concentration of the absorbing sample increases.
To approximate monochromatic radiation, a specific wavelength is
isolated by the use of the interference-type filters. The filters allow transmission of NIR over a narrow band pass region of the NIR spectra and completely block all other wavelengths. Proper selection of the measuring and
reference filter wavelengths allows the accurate isolation and measurement
of the component of interest.
The use of two filters allows cancellation of energy changes due to
turbidity, dirty sample cell windows, and aging of the source and electronic
components.
The center band pass of the measuring filter is selected to transmit
energy in a narrow region where the component of interest absorbs strongly
in comparison with background absorbance. The center band pass of the
reference filter is selected to transmit energy in a band pass region where the
background absorption of NIR energy is equivalent to that seen by the
measuring filter. The reference filter is also selected to be in a region where
the component of interest has minimal absorption of energy.
The optical beam is converted from steady state to pulsed energy by the
rotation of the filters in the optical path. The measuring and reference pulses
of radiation strike a detector which converts the pulses of radiation into
electrical pulses which are then amplified. Signal processing involves
converting the electrical signals to logarithmic signals, and then comparing
the measuring to the reference logarithmic signals in order to give a readout
representing the concentration of the component of interest in the sample.
1.2 Modules (Condulets)
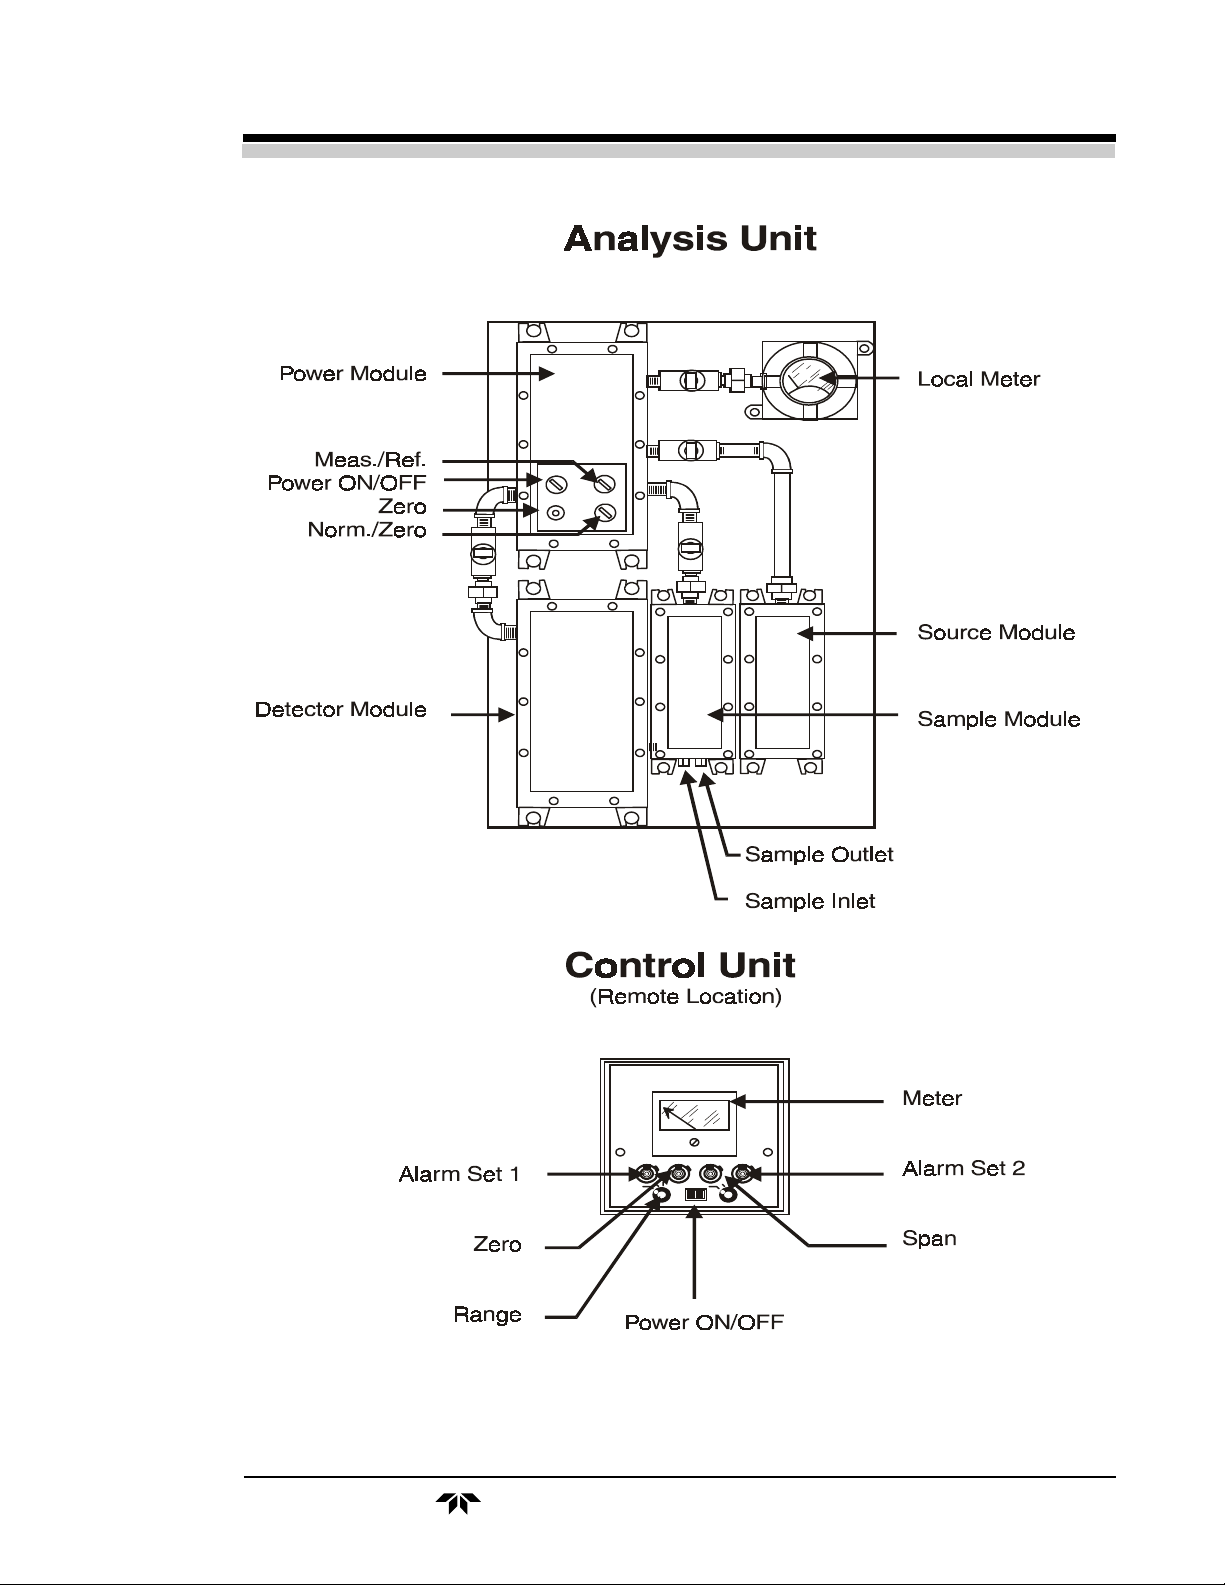
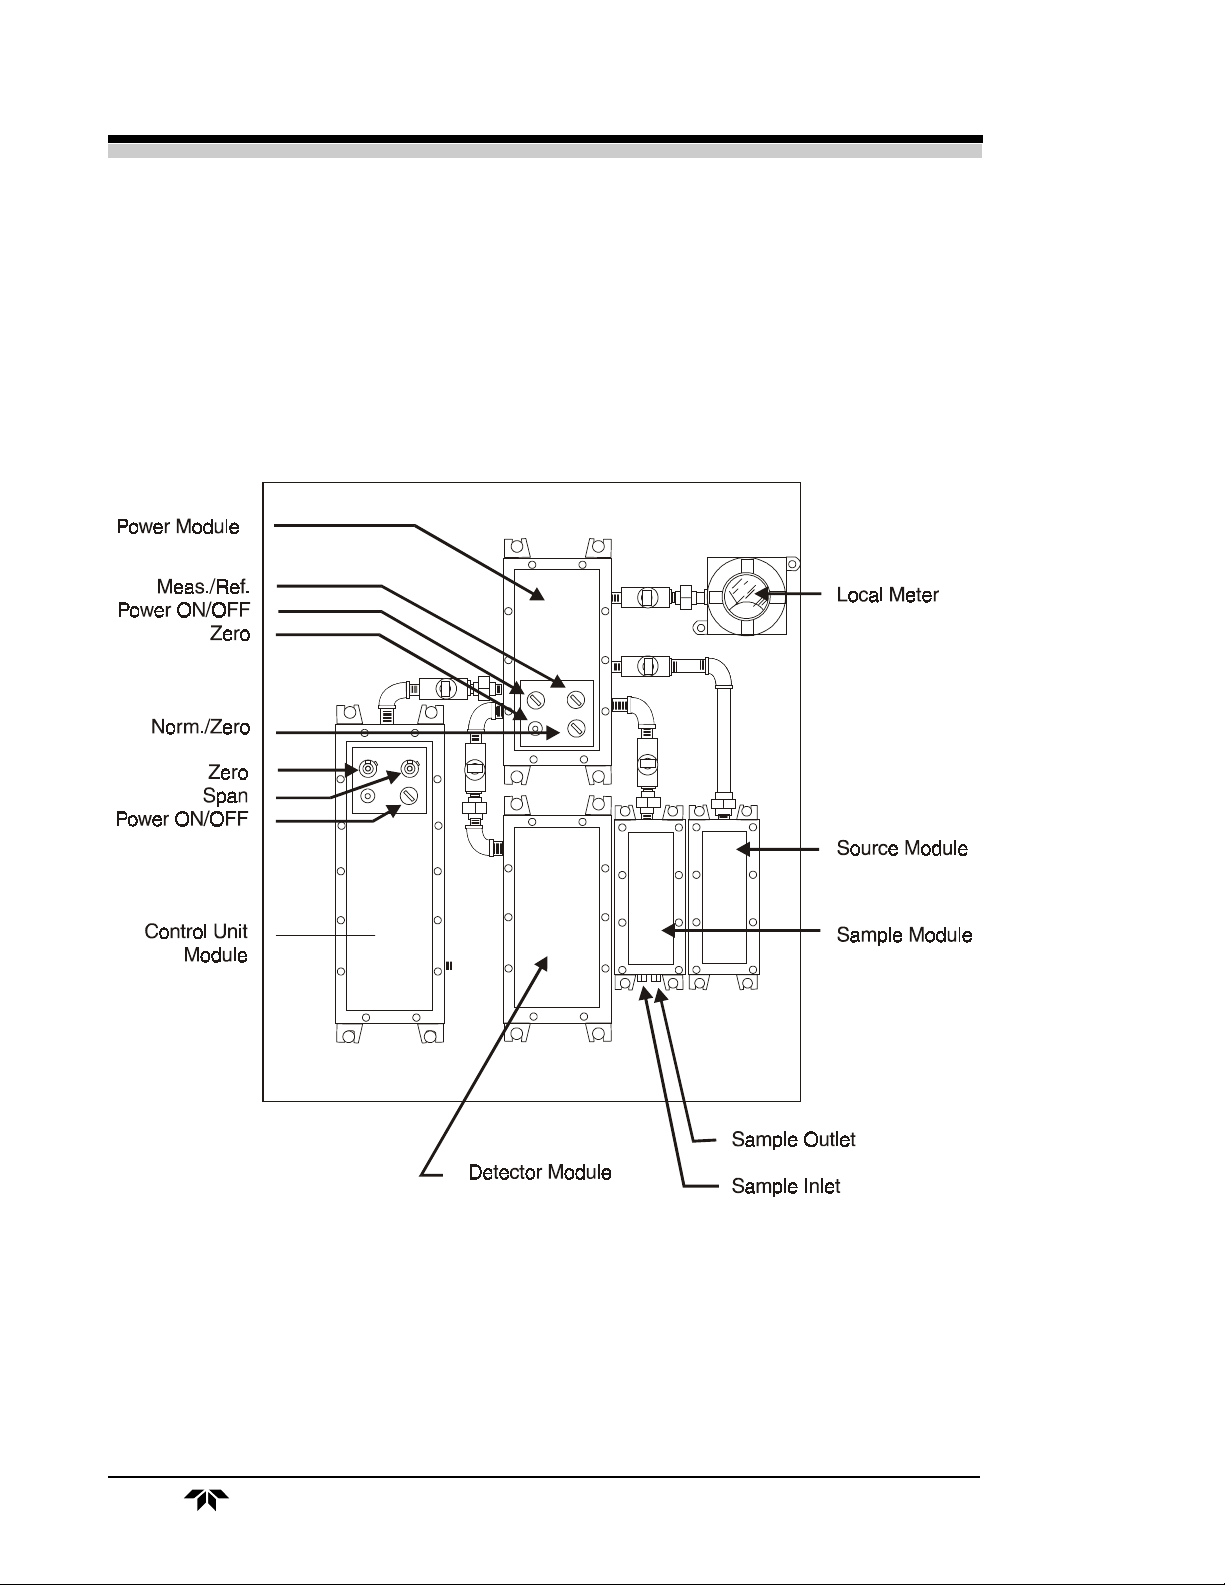
Physical layout of the analyzer is shown in Figures 1-1 and 1-2. The
control module is usually located apart from the analysis unit in a control
room. The explosion-proof version has the control and analysis units
mounted in one weather-resistant NEMA-12 enclosure suitable for outdoor
installation.
The analysis section is designed for hazardous area installation. Housings are rated for use in Class I, Div. I, Group D hazardous environments.
1–2
Teledyne Analytical Instruments
A Business Unit of Teledyne Electronic Technologies
Page 7
Introduction 1.0
Figure 1-1. Model 514 Photometric Analyzer (with General-Purpose Control Unit)
Teledyne Analytical Instruments
A Business Unit of Teledyne Electronic Technologies
1–3
Page 8
1.0 Introduction
Figure 1-2. Model 514 Photometric Analyzer (with Explosion-Proof Control Unit)
1–4
Teledyne Analytical Instruments
A Business Unit of Teledyne Electronic Technologies
Page 9

Introduction 1.0
1.2.1 Source Module
The source module or condulet houses the quartz iodine source lamp,
collimating lens/lens holder, and transformer. The 115 VAC power to the
source transformer is derived directly from the line voltage regulating transformer installed in the power module.
1.2.2 Sample Module
The insulated sample module has sample inlet and outlet lines constructed of 1/8" O.D. 316SS tubing. The sample is routed through a
preheater, through the sample cell, then drained from the outlet port. A
thermistor-controlled preheater and compartment space heater are powered
from temperature controllers located in the power module. A thermal cutout
switch prevents temperature “runaway”.
The sample cell, which is configured for each particular application, is
provided with sapphire windows to admit NIR radiation.
1.2.3 Power Module
The power module contains a line voltage regulating transformer (with
capacitor) and three temperature controller circuit cards.
Each of the controllers incorporates a bridge circuit containing a thermistor located in the volume/compartment to be controlled. Bridge imbalance
produces an error signal, resulting in operation of the final control element
(heater) to restore bridge balance, and controlling the temperature to within a
fairly narrow proportional band.
Control functions for the analysis section are located on the power
module (see Figure 4-1).
1.2.4 Detector Module
As noted above, the detector is a part of the optical system (see Figure
2-1). The detector cell is mounted within a hermetically sealed block with a
quartz window through which the optical energy enters. The assembled cell
block, together with the preamplifier subassembly, filter wheel, and filter
position sensor, are contained within a temperature-controlled compartment
In addition to the heated optical compartment, the detector module
contains the chopper motor, power transformer, and six circuit cards whose
function is described in section 2. 2. 4, Detector Module.
Teledyne Analytical Instruments
A Business Unit of Teledyne Electronic Technologies
1–5
Page 10

1.0 Introduction
1.2.5 Local Meter Readout
For analyzer configurations having a remotely located control module,
the local meter is used to read the reference and measuring peak heights, or
the voltage output from the buffer amplifier before voltage-to-current conversion.
When the control module is integral with the analysis section, i. e., the
explosion-proof configuration, the meter is connected to the output of the
control module in order to display the concentration of the component of
interest as well as the previously mentioned information.
1.2.6 Control Module
In the explosion-proof version, the calibration meter is used as an all
purpose readout; in this case, there is some modification in the switching at
both the control module and power module.
In addition to control switching, adjustment (zero and span), and readout components, the control module has provisions for five circuit cards: an
automatic zero/extended voltage amplifier, E-to-I converter, I-to-E converter,
power supply, and alarm comparator. The alarm comparator circuit card
incorporates two circuits with jumpers that permit setting the alarm(s) for
high, low, high/low, high/high, and low/low settings. Setpoint adjustments
are performed with potentiometers on the module front panel.
1.3 Typical Applications
WATER MONITORING
Background Typical Range
Acids, including: 0–4000 PPM
Acetic
Formic
Sulfuric
Acetaldehyde 0–1000 PPM
Air 0–2%
Alcohols, including: 0–400 ppm
Butanol
Ethanol
Isopropanol
Methanol
Alkanes, including: 0–500 ppm
Heptane
Hexane
1–6
Teledyne Analytical Instruments
A Business Unit of Teledyne Electronic Technologies
Page 11

Ammonia 0–1000 ppm
Aromatics, including: 0–500 ppm
Benzene
Cumene
Toluene
Xylene
Chlorinated Hydrocarbons including: 0–200 ppm
Carbon Tetrachloride
Ethyl Chloride
Ethylene Dichloride
Methyl Chloride
Perchloroethylene
Propylene Dichloride
Trichloroethylene
Vinyl Chloride
Chloroprene 0–200 ppm
Chloropicrin 0–200 ppm
Deuterium Oxide 0–200 ppm
Epichlorohydrin 0–2000 ppm
Ethylene Glycol 0–500 ppm
Freons 0–500 ppm
Gasoline 0–500 ppm
Hydrogen Fluoride 0–10%
Hydroperoxides 0–5%
Kerosene 0–500 ppm
Ketones 0–1000 ppm
Methyl Acetate 0–1000 ppm
Methyl Methacrylate 0–1000 ppm
Oils 0–1%
Olefins 0–500 ppm
Pentane 0–300 ppm
α-Picolene 0–300 ppm
Phenol 0–1000 ppm
Polyols 0–500 ppm
Propylene Glycol 0–500 ppm
Propylene Oxide 0–200 ppm
Sulfinol 0–15%
Sulfur Dioxide 0–1000 ppm
Vinyl Acetate 0–2%
NOTE: Range may be higher or lower per application.
Introduction 1.0
Teledyne Analytical Instruments
A Business Unit of Teledyne Electronic Technologies
1–7
Page 12

1.0 Introduction
OTHER NIR ABSORBERS
Acetic Acid
Alcohols
Amines
Aromatics
Butadiene
Carbonyls
Chloroprene
Esters
Hydrocarbons
Hydrogen Chloride
Hydrogen Fluoride
Hydroxyl Value
Ketones
Olefins
Oximes
Epoxides
Methylene
1–8
Teledyne Analytical Instruments
A Business Unit of Teledyne Electronic Technologies
Page 13

Operational Theory 2.0
2.0 Operational Theory
The energy source for the analyzer is provided by a high intensity
quartz iodine lamp located in the source module. Quartz iodine was chosen
because it produces sufficient NIR to operate the system and maintains a
nearly constant brightness over its lifetime. (See Figures 2-1 and 2-2).
This energy is then fed through the sample, which is temperature
controlled, and into the detector module where it passes through a rotating
filter wheel before reaching the lead sulfide (PbS) detector.
The filter wheel, driven at 30 RPS or 1800 RPM by a synchronous
AC motor, contains two optical filters with bandpasses selected for each
application, thus providing reference and measuring pulses from which the
required information may be obtained.
The detector receives pulses at the rate of 60 PPS, or two pulses per
revolution of the filter wheel. Every other pulse is from the measuring
filter, while the alternate pulse is from the reference filter, so that pulses
through the measuring filter alternate with pulses through the reference
filter. A filter position sensor, which is an optical device having an integral
light source and light detector, differentiates between the two.
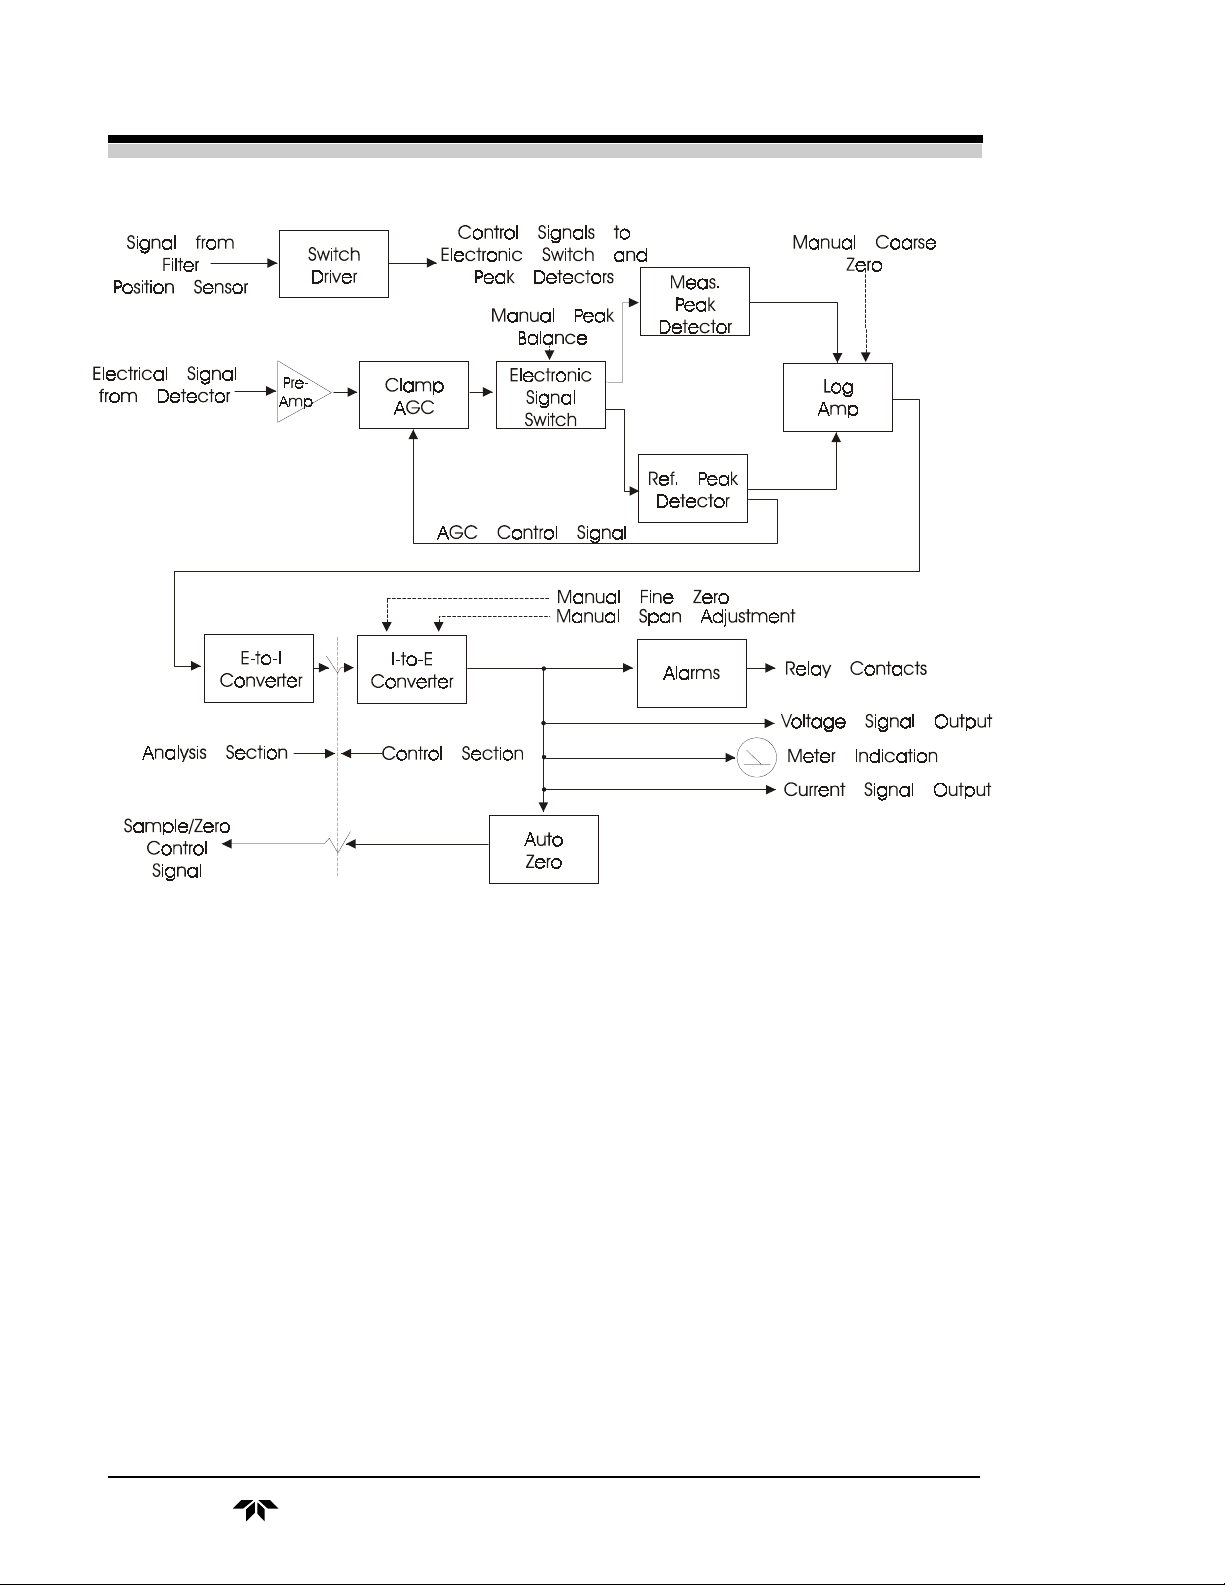
The two entrained pulses received by the detector each revolution are
amplified through a preamplifier which is physically located inside the
sealed compartment with the filter wheel and detector. This signal is then
sent to a clamping circuit where an exact zero reference is established.
This clamped video signal is then fed through a gain control network,
which is controlled by the automatic gain control loop, through another
amplifier, to the electronic switch. This switch is controlled by the switch
driver network which derives its information from the filter position sensor
in order to separate the entrained video signal into its component parts of a
measuring peak and a reference peak. These peaks are then fed through a
balancing network and channeled into separate peak height detectors which
produce DC voltage levels which are exactly equal to the peak height or
absolute magnitude of the voltage from the base to the peak of each of the
pulses.
Teledyne Analytical Instruments
A Business Unit of Teledyne Electronic Technologies
2–1
Page 14

2.0 Operational Theory
At this point the reference signal is fed back to the automatic gain
control loop to maintain the desired system gain. In addition, both the
measuring and reference levels are fed to selector switches in order to
enable direct meter indication, which greatly eases the task of balancing
the system during initial system installation and periods of calibration.
The DC voltage levels are fed to a logarithmic ratio amplifier which
produces a voltage output that is proportional to the logarithm of the ratio
of the two DC input voltages. This output voltage, directly proportional to
the concentration of sample, is, within certain limits, a linear function of
the concentration. For purposes of transmission, the voltage signal is
converted by an E-to-I converter; thus, the output signal from the analysis
unit is a current signal that is proportional to the concentration of sample in
the sample module.
Upon arrival at the control module, which is normally located in a
remote location away from the analyzer unit, the signal is processed
through an I-to-E converter which incorporates fine zero and span controls
for calibration. Following the span control, a buffer amplifier provides
isolation between the calibrated signal and any of the selected output
devices. This signal is then sent to the meter driver circuit and readout
meter, to the alarm comparator circuits, voltage output circuits, current
output circuits, etc., depending upon the particular application requirement.
There is also an option of providing an automatic zero circuit (see
drawing B-14729) in the control unit. This circuit provides electrical
signals for switching a fluid which contains none of the material to be
measured into the sample module, electrically adjusting the zeros and
switching back to sample.
2.1 Circuit Descriptions
2.1.1 Source Module
The source module is the source of infrared energy. This is provided
through the use of a high-intensity quartz iodine lamp operating directly
from a 6.3 V transformer. To ensure a stable source of radiation in the face
of line-voltage variations, the lamp transformer derives its input directly
from a line voltage-regulating transformer, selected for its ability to maintain a constant output voltage level regardless of fluctuations in the input
line voltage within the control range of 105 to 130 VAC.
In some applications where we have an abundance of energy due to
low sample absorption, the focusing lens is removed to avoid excess
energy reaching the detector. However, other systems have high energy
2–2
Teledyne Analytical Instruments
A Business Unit of Teledyne Electronic Technologies
Page 15
Operational Theory 2.0
losses in the sample module due to strong sample absorbance or exceptionally long sample path-lengths. These systems require a focusing lens to
gather and collimate the radiation for maximum utilization of source
energy. The collimating lens is quartz.
Figure 2-1. Optical System
2.1.2 Sample Module
The sample cell, generally constructed of 316SS, is located in the path
of the NIR radiation, between the source and the detector modules. Each
compound in the sample path exhibits its own characteristic absorption
spectrum. Cell spacer thicknesses will vary depending upon the absorbance
of the component of interest at the measuring wavelength. Due to the
possible variation of absorption with temperature, it is necessary to maintain the sample at a constant temperature during analysis. To achieve this,
two separate methods of temperature control are employed
1. A preheater is used on the incoming sample stream to raise it to
the desired level.
2. The entire sample module is separately controlled to maintain
the sample temperature during analysis.
Teledyne Analytical Instruments
A Business Unit of Teledyne Electronic Technologies
2–3
Page 16
2.0 Operational Theory
Figure 2-2 Analyzer System - Block Diagram
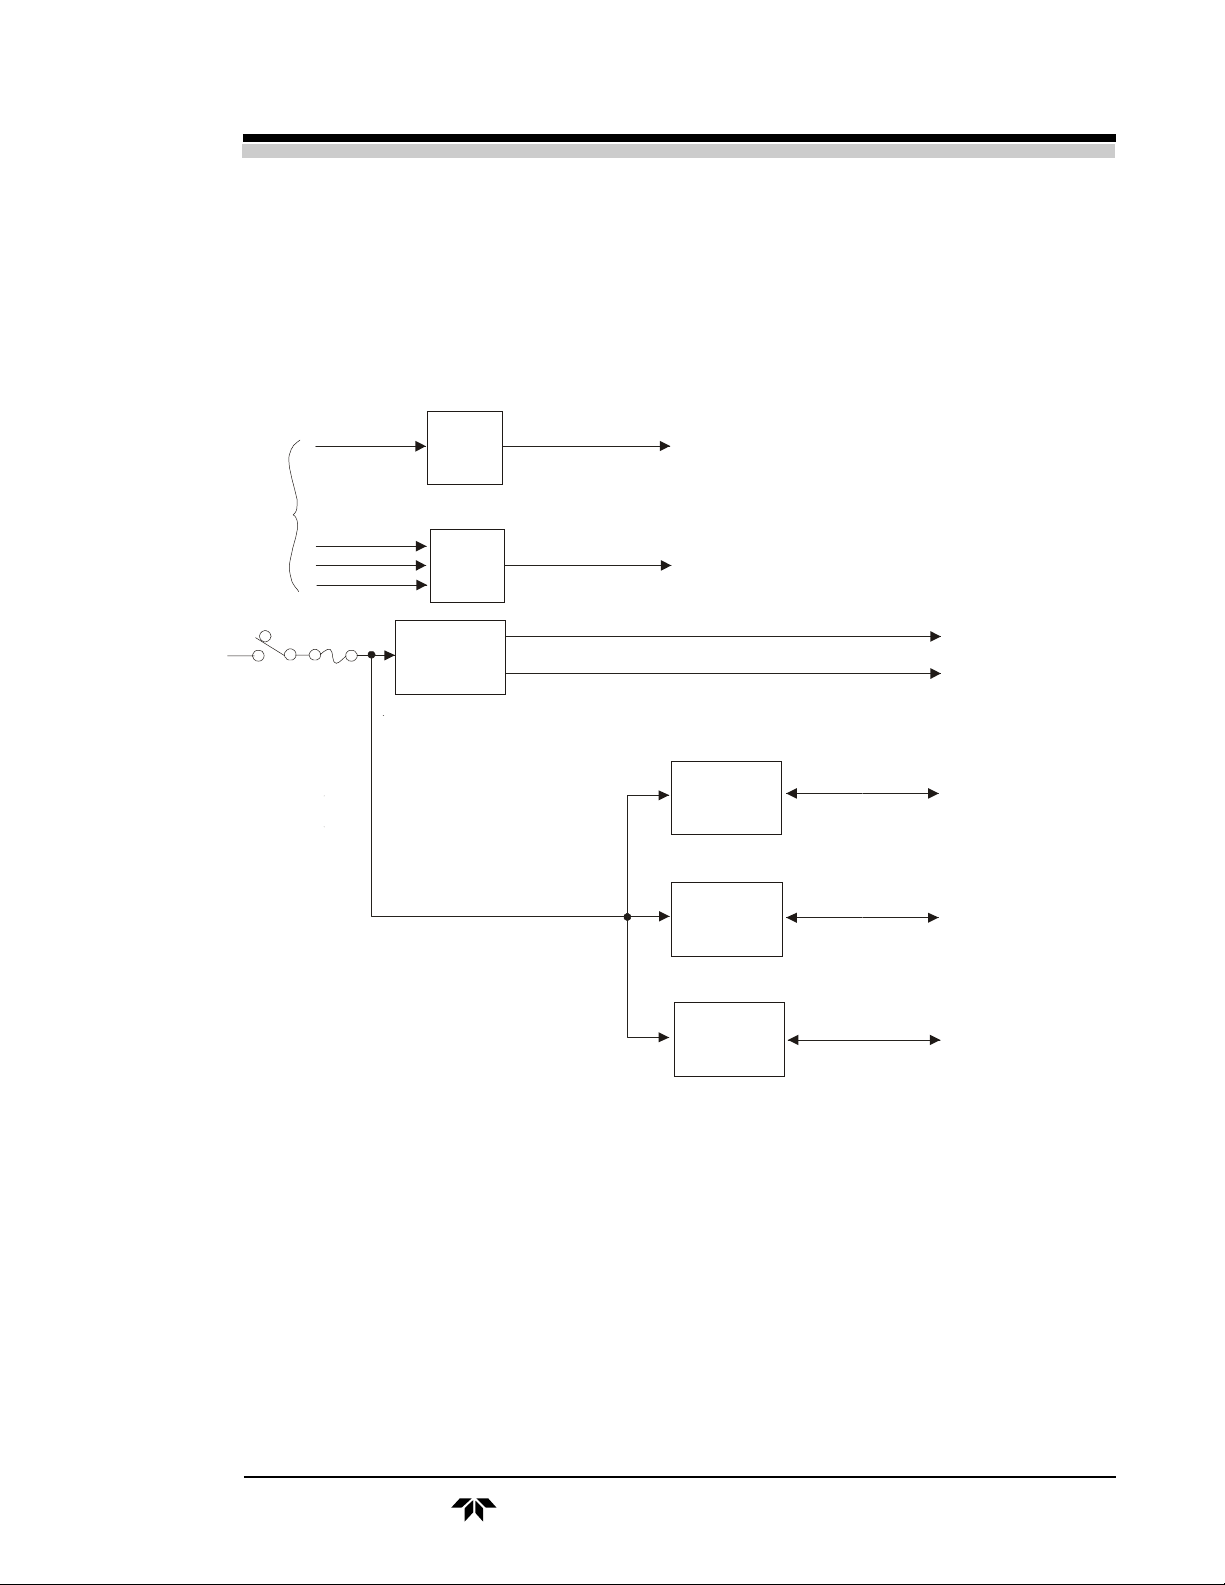
2.1.3 Power Module
See Figure 2-3. The power module controls power to the analyzer unit,
providing the switching function for the local meter, and providing temperature control for the sample and detector modules. In the case of the explosion-proof configuration, where the control unit is mounted locally, the
power module simply routes the AC input power to its destination and
allows the control unit to provide the ON/OFF function.
When power is applied to the system, it is directed to the constant
voltage transformer and to the three temperature controllers which are
insensitive to line voltage fluctuations.
In order to facilitate easier calibration and to provide a quick visual
indication of the instrument’s status, a local meter is provided. With the
2–4
Teledyne Analytical Instruments
A Business Unit of Teledyne Electronic Technologies
Page 17
Operational Theory 2.0
NORM/ZERO switch on the power module set to the NORM position, the
meter will provide a constant readout of either the reference level or the
measuring level. During calibration periods, the ZERO switch control may
be used to monitor the signal into the E-to-I converter, and if a known zero
sample is applied, then the ZERO potentiometer may be varied to ensure
zero output to the control unit.
115 VAC
60 Hz
Input
S1
From Detector Module
Power
15 VDC
MEAS
REF
ZERO
5A
Coarse
Zero
Control
Selector
Switch
Line Voltage
Regulator
Transformer
To Log Amplifier
To Meter Driver
Preheater
Temp.
Control
Sample
Module
Temp.
Control
115 VAC to
Source Module
115 VAC to
Detector Module
Thermistor
and Heater
Thermistor
and Heater
Detector
Module
Temp.
Control
Thermistor
and Heater
Figure 2-3. Power Module - Block Diagram
All of the temperature controller circuit cards for the analyzer are
located in the power module. The schematic diagram for these circuits is
shown in dwg. B-15016.
The purpose of the time-proportional temperature controllers is to sense
the temperature in the compartment or volume to be controlled and, at a rate
of approximately twice per second, turn on the heater(s) for a specified
portion of the time cycle, depending upon how much heat is needed. When
Teledyne Analytical Instruments
A Business Unit of Teledyne Electronic Technologies
2–5
Page 18

2.0 Operational Theory
ON, the heater is fully turned on; only the duration of the ON interval will
vary.
As the compartment heats up, the heater-on time interval is shortened.
The less heat needed, the shorter the heater-on interval during each cycle.
Since TRIAC Q1 is used as the control element for the heater, it is supplied
with the full AC line power. The output TRIAC is mounted on a heat sink
and can handle the full heater wattage.
A4 is a zero crossing switch and TRIAC driver, providing a gating
signal output pulse to turn on the TRIAC. Turn-on pulses are only applied
to TRIAC Q1 when commanded by a control signal, i.e., at the time the
line voltage crosses zero.
A1B is a comparator that compares the output of the temperature
amplifier (voltage representing temperature) A1A (at pin 5) with a reference ramp voltage from A2B (at pin 6), causing TRIAC Q1 to be turned on
for a time interval proportional to the required heat.
A2B and A3 comprise a ramp generator that produces a sawtooth
voltage ranging from 6 to 12 VDC with a period of approximately one-half
second.
The output voltage from the temperature amplifier A1A will range
from less than 6 volts to something more than 12 volts. When the output
voltage is greater than 12 volts, the TRIAC will be turned on a full time
interval each cycle. When the output is less than 6 volts, the TRIAC will be
turned off all the time. When the output is in the middle of the range
(approximately 9 volts), the TRIAC will be turned on for about one-half of
the time interval.
The thermistor, which is a negative temperature coefficient device, is
set up in a bridge circuit. Resistor R2, the setpoint resistor, is selected to be
approximately equal to the resistance of the thermistor at the desired
operating temperature. The other half of the bridge, the voltage divider
network comprised of resistors R4 and R5, is balanced. When the resistance of the thermistor is equal to the resistance of R2 at the desired operating temperature, the bridge is balanced and the voltage at pins 2 and 3 of
A1A is the same.
When the temperature in the compartment rises, the thermistor resistance will decrease and the inverting input of A1A will fall below the
reference point. This input will be amplified by A1B to broaden the proportional band and preclude the possibility of the device overshooting and
operating as an on/off temperature controller.
2–6
Teledyne Analytical Instruments
A Business Unit of Teledyne Electronic Technologies
Page 19
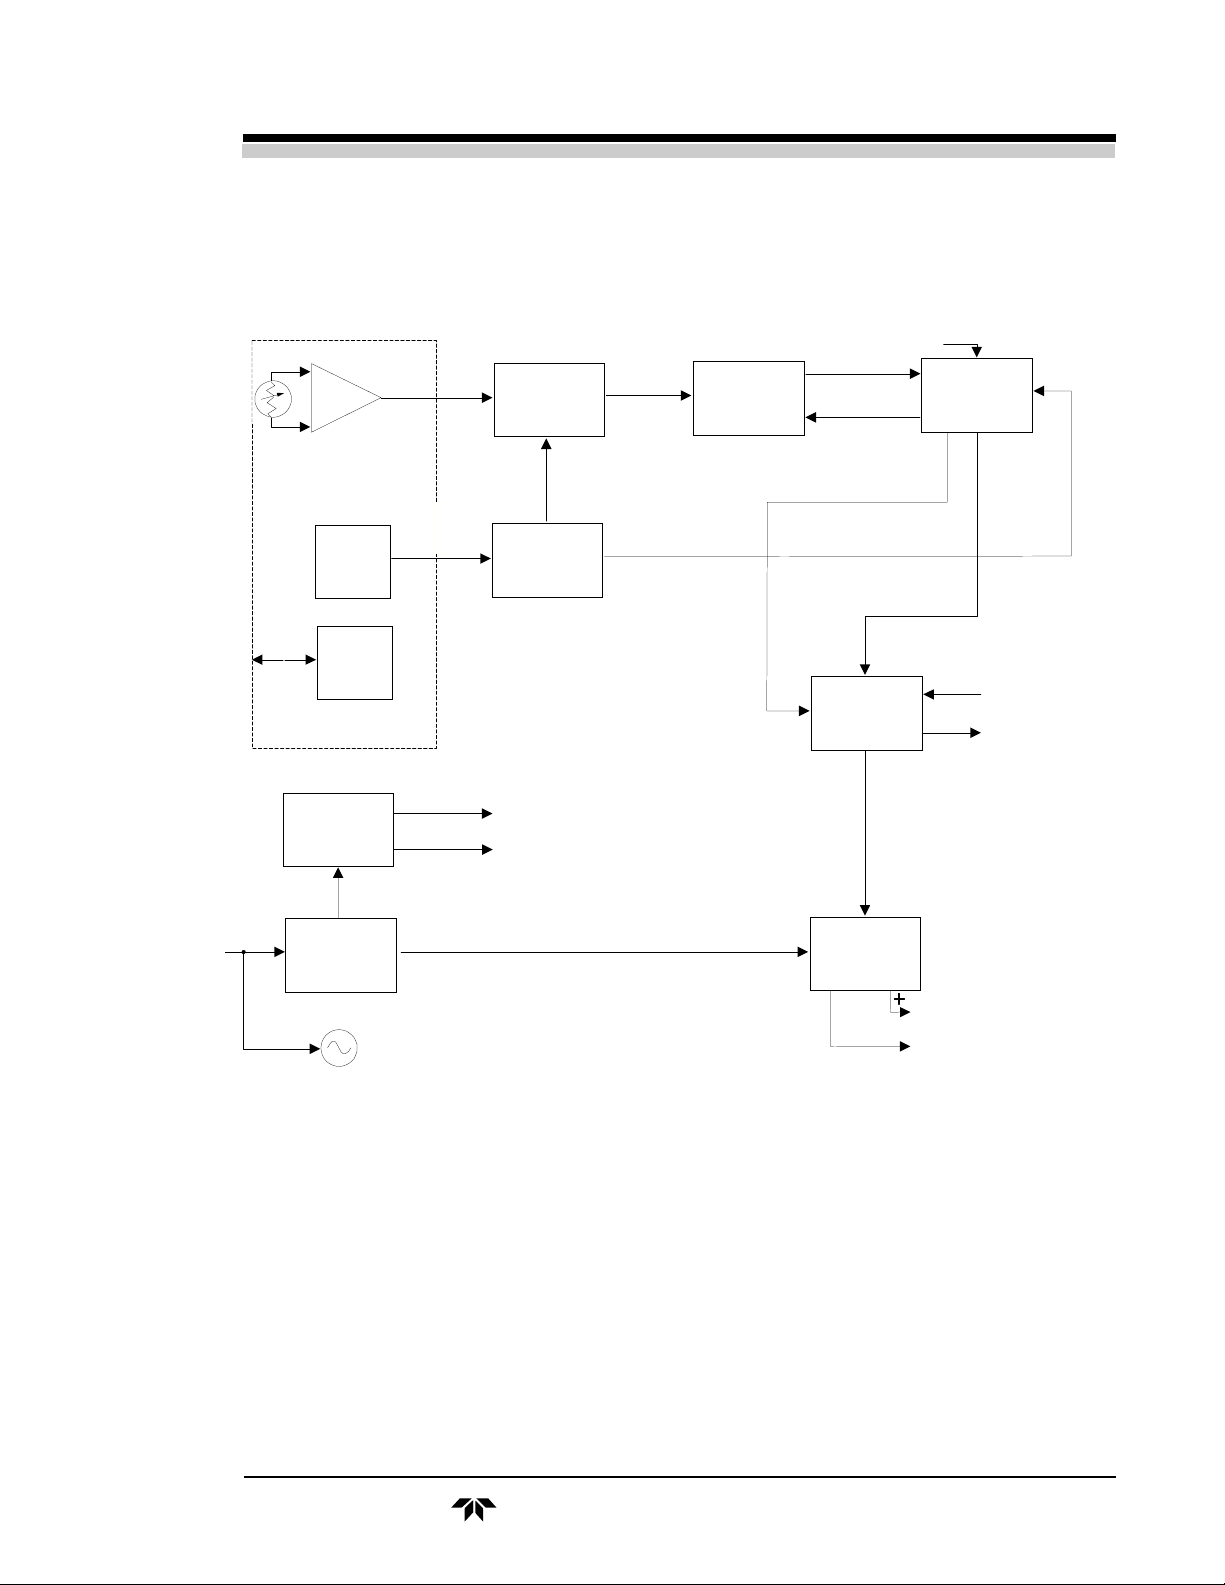
To
Power
Module
PbS
Detector
Circuit components C1, D3, and D4 provide stable internal power to
the rest of the controller circuitry.
Video
Signal
Preamplifier
Filter
Position
Sensor
Heater
&
Therm.
Detector
Compartment
Power
Supply
Filter Pos.
Signal
(Gate Pulse)
15 VDC
24 VDC
Clamp
Signal
Switch
Driver
Timing
Clamped
Video
Clamping
Switch
Operational Theory 2.0
Manual Peak Balance
Video
AGC
(+9VDC)
Ref.Level
Ref. Level
Switching Signals
(S, S', P, P')
Log
Amplifier
0to0.4VDC
FullScale
Elec.S ig.
Sw. & Peak
Level Detect.
Meas.Level
(+9VDC)
Coarse
Zero
Control
From
Power
Module
To Meter
115 VAC
60 Hz
Input
Power
Transformer
Chopper
Motor
E-to-I
Converter
Com.
10 to 18 mA (Nominal Value)
To ControlModule
Figure 2-4. Detector Module - Block Diagram
Operating controls for the analysis section are located on the door
casting of the power module enclosure. In the general purpose configuration, these controls include the POWER ON/OFF switch, the MEAS/REF
switch to select the measuring or reference peak voltage to be fed to the
local meter driver, ZERO control, and the NORM/ZERO switch, which
operates in conjunction with the MEAS/REF and ZERO controls.
When used with the explosion-proof control module, the NORM/REF
and NORM/MEAS switches are used on the module instead of the MEAS/
REF switch. A NORM/ZERO switch is also included.
Teledyne Analytical Instruments
A Business Unit of Teledyne Electronic Technologies
2–7
Page 20

2.0 Operational Theory
2.1.4 Detector Module
See Figure 2-4. After energy has passed through the sample, it arrives at
the filter wheel where it is fed alternately through two filters (measuring and
reference) before reaching the detector.
These filters are specially selected for each application according to the
absorption characteristics of the compounds under analysis. The reference
and measuring filter waveforms occur along a baseline at approximately 16
milliseconds intervals; each reference or measuring waveform reoccurs at a
time interval of 33 mS, or one per revolution of the filter wheel.
At the detector, infrared energy is transformed into electrical pulses and
fed through an impedance-matched preamplifier (see dwg. A-14619). Depending upon the application, length of the cell spacer, etc., the gain of the
preamplifier may vary from 1 to 10, depending upon the energy intensity at
the detector, to achieve an AC signal output of approximately 0.1 to 1.0 volt
peak-to-peak.
Additionally, the detector, filters, and preamplifier are housed in an
electrically and thermally isolated box to provide maximum stability and
minimum noise. This box, or compartment, is normally temperature controlled at 46 °C.
The negative-going video from the preamplifier is fed to the clamp
circuit (see dwg. B-14561) to establish a precise zero reference to the
baseline of the pulses. This is accomplished by applying a gate to Ql at a
time when neither filter is in the energy path. This gated signal is fed
through A2 where it subtracts itself from the composite signal at the noninverting input. The signal output of A3 is clamped to ground and has an
amplitude of approximately two times the input.
The gating pulse for the clamp circuit is derived from the filter position sensor which is located in the detector compartment. The sensor emits
radiation which is reflected from the white pattern on the rear side of the
rotating filter wheel and sensed by a photo transistor. This creates a square
wave of 5 volts amplitude at TP4 which is then further processed by Q2,
A4 and A5 to generate the gating pulse for the clamp circuit as well as the
switching signals S, S', P and P', which are later used to demodulate the
composite video.
The clamped-to-ground, negative-going video is then sent to the
automatic gain control circuit (see dwg. B-14564). This circuit receives a
reference signal from the peak level detector and uses it to adjust the
current through LEDs B1 and B2. The current through LED B1 controls its
2–8
Teledyne Analytical Instruments
A Business Unit of Teledyne Electronic Technologies
Page 21

Operational Theory 2.0
light output and, therefore, the resistance of its shunt resistors. This enables
the signal at TP2 to be continually adjusted up or down to hold the reference
signal at a constant level (nominally 9 volts) and thus eliminate the effects of
turbidity or other foreign substances in the sample, within design limits.
After the automatic gain control circuit, the signal proceeds to the peak
level detector, where it is demodulated by A1 and A2, using the timing
signals previously generated (see dwg. B-14554). Potentiometer R3 can be
used to precisely balance the signal levels by adjusting the feedback loop
gain resistance of the two respective peaks. The separate peaks are then sent
through peak detector networks where they are transformed into stable DC
voltage levels. In the case of the reference peak level, it is from here that a +9
VDC signal is fed back to the automatic gain control network. The signal
levels are then fed to either one of two logarithmic ratio amplifiers (see dwgs.
C-14586 and C-14907).
For applications of high sensitivity, a chopper-stabilized log amplifier is
used (see dwgs. C-14586 and C-17706). A3 generates an approximate 200
Hz square wave which alternately allows the signals to be fed into the log
amplifier (A1) itself, and then blocks the measuring level and feeds the
reference level into both log amplifier inputs, allowing it to zero itself. The
log signal is then applied through amplifier A4 and A6 to A7 where a
coarse zero offset voltage may be applied through the ZERO potentiometer
on the power module
For less sensitive applications, a simpler log ratio circuit is used (dwg.
C-14907). The reference and measuring levels are processed through a
filter network before being compared by A1. This comparison results in
the log ratio output which is fed to A2 for application to a zero offset
voltage from the zero adjust potentiometer on the power module.
From the log amplifier the signal is finally sent to the voltage-tocurrent (E-to-I) converter for transmission to the control unit. Conversion
of the voltage signal to a current signal allows for signal transmission over
greater distances without noise pickup.
The E-to-I converter (see dwg. B-14075) is set with a nominal offset
so that with 0 VDC input, 10 mA output is obtained. This baseline setting
is adjustable through R7, the zero adjustment.
The converter is scaled so that with a 0.5 VDC input, the output will
be 20 mA (set with balance potentiometer R12). Output nominally ranges
from 10 mA to 18 mA with a 0 to 0.4 VDC input. When required, zero
drift can be accommodated; i.e., inputs ranging from -0.5 to +0.5 VDC will
produce 0 to 20 mA outputs.
Teledyne Analytical Instruments
A Business Unit of Teledyne Electronic Technologies
2–9
Page 22

2.0 Operational Theory
Power for the detector module is provided by a center-tapped transformer which takes 115 VAC input, reduces it to 40 VAC, then feeds the
voltage to the DC power supply. An additional winding on the transformer
provides output power to the E-to-I card.
The power supply utilizes a fullwave rectifier in order to provide +24
VDC unregulated. The 24 VDC is further filtered, then fed through a
voltage regulator to obtain +15 VDC regulated.
As noted previously, the filter wheel is driven by a synchronous AC
chopper motor which operates at 1800 RPM. The filter wheel performs
two functions: (1) switching filters, and (2) chopping the optical signal to
give pulses which can be amplified for high quality processing.
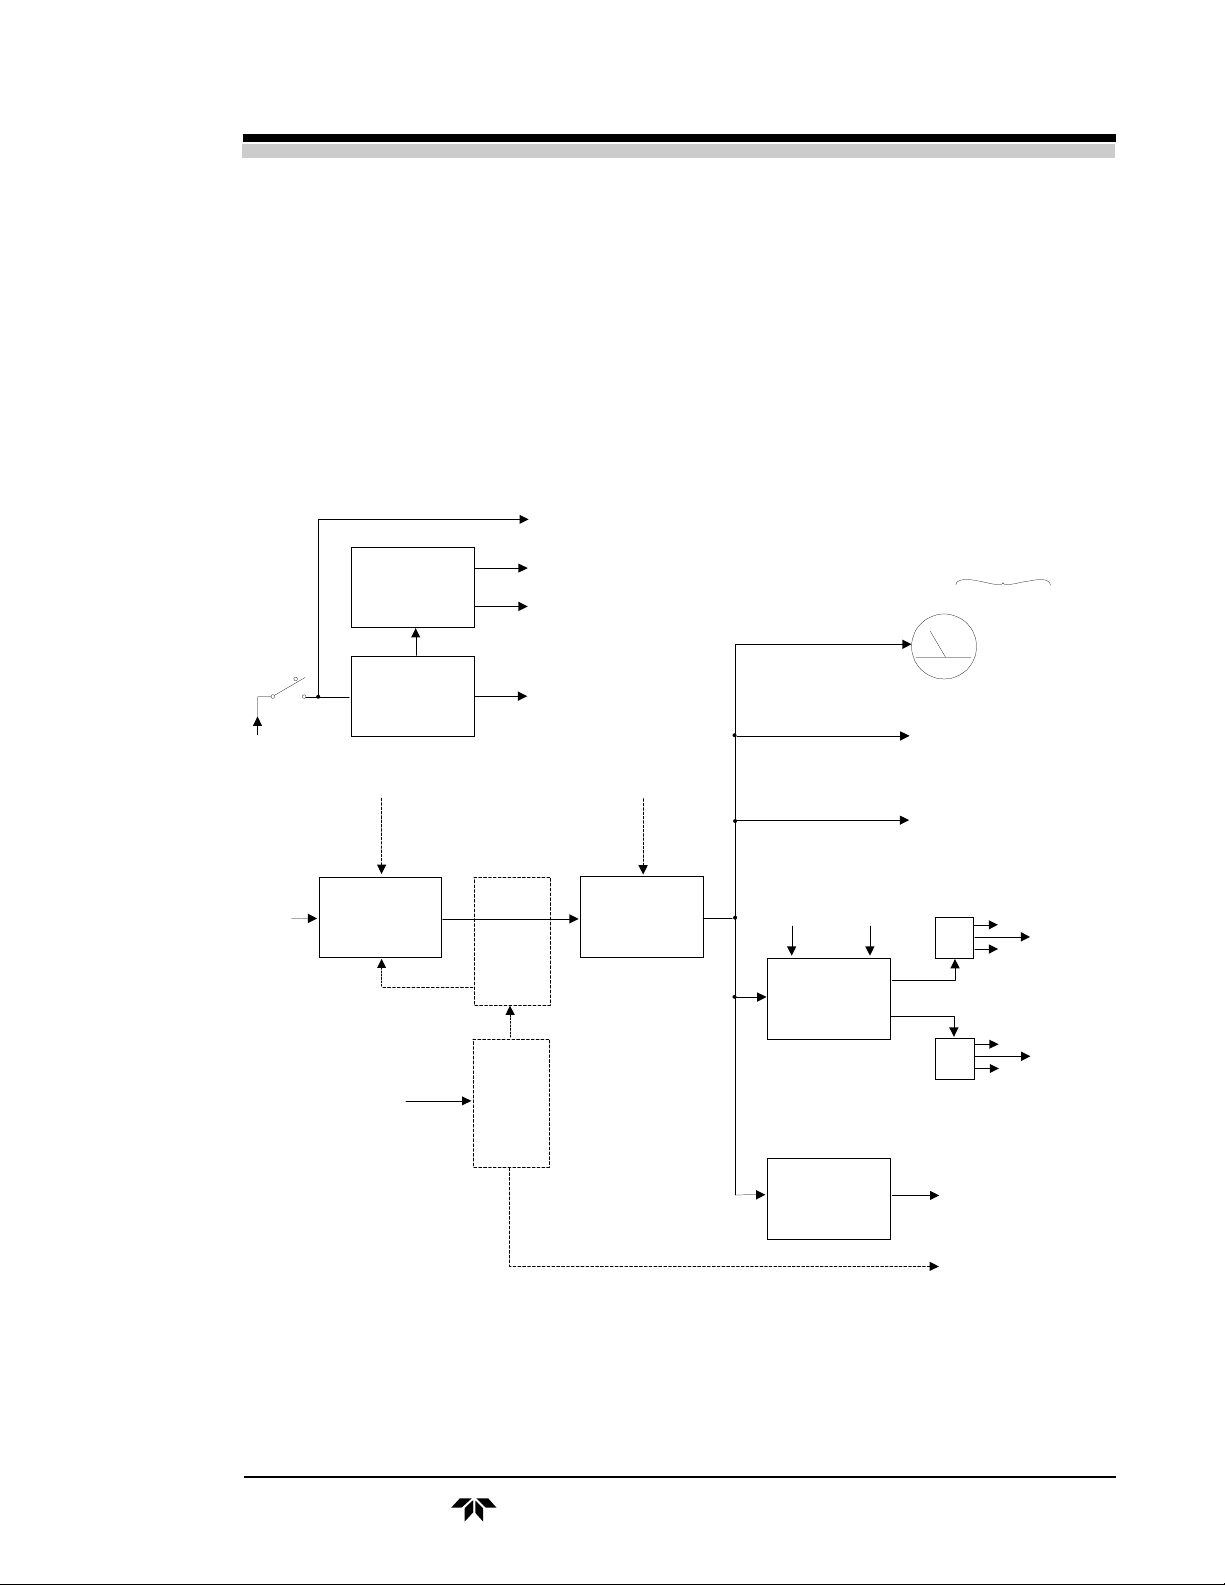
2.1.5 Control Module
The control module provides voltage and current output signals which
are properly scaled for the application, alarm signals in the form of relay
contacts, and a meter output. Optional provisions are also included for an
automatic zero and dual-range capability.
Upon arrival at the control module, the milliampere signal is converted to a 0 to +2 volt full scale output for connection to the span
potentiometer (see dwg. A-14620). An optional millivolt output can also be
provided by the I-to-E converter circuit card. At this point, fine zero
control is also applied by means of a potentiometer located on the front of
the module.
The voltage is then scaled so that 1 VDC full scale output is obtained
at the center of the span potentiometer. This signal is coupled through an
extended voltage amplifier circuit and used to drive the 0 to 100 µA meter
on the control module.
The standard 0 to 1 VDC output is also generated by the extended
voltage amplifier circuit (see dwg. B-16221).
The 0 to 1 VDC full scale from the span potentiometer is connected to
the alarm comparator circuit (see dwg. B-14718) where it is used to drive a
pair of amplifier circuits which couple the alarm setpoints to relays K1 and
K2.
A current output (normally 4 to 20 mA) is optional. If desired, an
optically isolated current transmitter can be installed in the explosion-proof
control module.
2–10
Teledyne Analytical Instruments
A Business Unit of Teledyne Electronic Technologies
Page 23
Operational Theory 2.0
Power for the control module is provided by a center-tapped transformer which takes the 115 VAC input, reduces it to 40 VAC, and feeds the
voltage to a DC power supply identical to the one installed in the detector
module. Power supply outputs are +24 VDC unregulated, and +15 VDC
regulated.
To Timer
Power
115 VAC
60 Hz
Input
Current
Signal
Input
From
Analysis
Unit
Power
Supply
Power
Transformer
Manual
Fine Zero
I-to-E
Converter
115 VAC
60 Hz
±
15 VDC
24 VDC
±
To I-to-E Converter
Span
Adjust.
Ext. Volt.
Auto
Zero
Timer
Amplifier
Meter
Indication
(0 to 1 V f.s.)
(0 to 5 mV f.s.)
Manual Setpoint Adjust.
Voltage
Millivolts
#1
Comparator
#2
Alarm
Relays
Output
N.O.
N.C.
N.O.
N.C.
Com.
Com.
E-to-I
Converter
(4 to 20 mA)
Figure 2-5. Control Module - Block Diagram
Teledyne Analytical Instruments
A Business Unit of Teledyne Electronic Technologies
Current
Standard
Valve
Control
Signal
2–11
Page 24

2.0 Operational Theory
2–12
Teledyne Analytical Instruments
A Business Unit of Teledyne Electronic Technologies
Page 25

Installation 3.0
3.0 Installation
Before power is supplied to the analyzer, all modules should be opened
and inspected for damage or loose components. Also check unit for proper
wiring and connections. All plug in circuit cards should be removed and
checked individually for correct assembly.
3.1 Location
The analysis section should be installed in an area where the ambient
temperature does not fall below 32 °F or rise above 110 °F. Steam or
electrical enclosure heating may be provided as an option. Do not install
the assembly in the path of an air conditioner or in an extremely drafty
area. The analysis section, as well as the explosion-proof version of the
analyzer, is suitable for installation in Class I, Group D, Division I areas.
Since the analysis section of the general purpose version of the analyzer is
enclosed in a weather-resistant enclosure, it is suitable for outdoor location.
The control module of the general purpose version of the analyzer is
generally intended for flush panel mounting indoors in general purpose
areas.
3.2 Sample Section: Installation
Recommendations
See Figure 3-1. The sample is introduced and drained (or vented) from
two 1/8 " Swagelok bulkhead fittings located on the bottom side of the
sample module. The following guidelines are recommended:
3.2.1 Filtering
Suspended particulate matter must be eliminated from the process
sample prior to introduction into the analyzer sampling system. Aside from
clogging the lines, accessories, integral sample paths of the analyzer and
coating sample cell windows, solid particles may interfere with the analy-
Teledyne Analytical Instruments
A Business Unit of Teledyne Electronic Technologies
3–1
Page 26

3.0 Installation
sis. TAI recommends that a bypass filter assembly in the sample loop be
installed.
Sample
Zero Fluid
Span Fluid
Cell Drain
Calibration
Fluid Return
Sample Return
Filter installed only
when required
Bypass
Flowmeter
Ring Manifold
Diff. Regulator
Sample Outlet
Analyzer Flow Cell
Samp le Inlet
Sample
Flowmeter
Regulator
Bypass Valve
Figuire 3-1. Sampling Considerations
3.2.2 Effluent Return
Returning the sample effluent to the process may require a separate
calibration fluid return so that the calibration fluids can be kept out of the
process during standardization periods.
3.2.3 Flow Control
A differential pressure regulator is often used in TAI systems across the
sample flowmeter and needle valve control to give a constant flow, regardless of upstream or downstream pressure fluctuations. Constant flow may or
may not be important, depending upon the application.
It is necessary to insure sufficient contact of the sample with the
preheater in order to bring the sample up to the control temperature. Do not
allow flow in excess of 50 ml/minute.
For liquid applications, TAI recommends that the throttle valve and
flowmeter always be downstream from the analyzer. Such an installation
will pressurize the sample cell and eliminate bubbles in the sample.
Bubbles suspended in the sample fluid will produce erratic, ambiguous
analysis of the sample.
3–2
Teledyne Analytical Instruments
A Business Unit of Teledyne Electronic Technologies
Page 27

Installation 3.0
The cell with sapphire windows will withstand up to 600 psi pressure.
TAI does not recommend high pressure sample handling, but don’t hesitate
to slightly pressurize the analyzer for optimum results.
3.2.4 Selector Manifold
TAI recommends a three valve selection system that reports into a
“ring” manifold for sample and calibration fluid control. Such a system
will permit you to conserve calibration fluid. Calibration fluids can be
introduced by a simple gravity system. A bypass valve around the differential pressure regulator is recommended for calibrating with gravity feed.
Calibration fluid flow need only be long enough to insure adequate flushing of the system, and then the calibration fluid drain valve can be closed.
A ring manifold will insure a good flush with a minimum expenditure of
fluid.
3.2.5 Automatic Zero Operation
Analyzers equipped with automatic zero control will require a threeway electrically or pneumatically actuated valve in the sample system. In
addition, if it is undesirable for zero fluid to return to the process, a similar
three-way valve must be used for the calibration fluid return. In addition, a
time delay on the operation of the second three-way valve is desirable to
allow sample fluid purging of the zero fluid in the analyzer returning to the
process stream. This time delay must be built into the analyzer at the time
of purchase.
With automatic zeroing, zero fluid can be actuated manually by
setting the SAMPLE-ZERO switch to the ZERO position. Span fluid is
introduced by setting the switch to SPAN.
3.3 Electrical Installation
3.3.1 Power Check
1. Plug in the +15 volt power supply PC card (see dwg. B-14708)
but leave all other PC boards out.
2. Turn power ON.
3. With a digital multimeter (DMM), check for +15 volts on the
+15 volt power supply.
4. Check for proper starting of the chopper motor and source lamp.
Teledyne Analytical Instruments
A Business Unit of Teledyne Electronic Technologies
3–3
Page 28

3.0 Installation
WARNING: The light intensity from the quartz iodine lamp is intense and
should not be looked at directly without special protective
eyewear. Protective goggles with shaded lenses (Fed. Spec. #5)
should be worn if it is necessary to look directly at the source.
Explosion-Proof Version
See dwg. B-16571.
Control module power in:
TS2-14: Hot
TS2-13: Neutral
TS2-12: Ground
Control module output:
TS2-1 (Com)
TS2-2 (+)
TS2-3 (Com)
TS2-4 (+)
TS2-10 (Com)
TS2-9 (+)
TS1-1 (-)
TS1-2 (+)
TS1-6 (Com)
TS1-7 (N.O.)}alarm relay K1
TS1-8 (N.C.)
TS1-9 (Com)
TS1-10 (N.O.)}alarm relay K2
TS1-11 (N.C.)
NOTE: In order to maintain the explosion-proof integrity of the system,
See dwg. C-15245.
Control Module Power In:
}0-1 V output
}mA output
}mV output
}mA output (isolated)
interconnecting wiring between the power and control modules is
performed by TAI.
General Purpose (Control Module Remote)
TS2-14: Hot
TS2-15: Neutral
TS2-16: Ground
Power Module Power In:
TS1-1: Hot
TS1-2: Neutral
TS1-3: Ground
3–4
Teledyne Analytical Instruments
A Business Unit of Teledyne Electronic Technologies
Page 29

Control Module (mA Input):
+ - TS2-7 from TS2-7
mA output
Control Module Output:
TS2-1 (Com)
TS2-2 (+)
TS2-3 (Com)
TS2-4 (+)
TS2-10 (Com)
TS2-9 (+)
TS2-12 (Com)
TS2-11 (N.O.)}alarm relay K1
TS2-13 (N.C.)
TS1-12 (Com)
TS1-11 (N.O.)}alarm relay K2
TS1-13 (N.C.)
{
Com - TS2-8 from TS2-6
}0-1 V output
}mA output
}mV output
Installation 3.0
}Power module
3.4 Analysis Unit
Explosion-Proof Version, Control Unit: Input power connections for
this unit are at TS2 pins: 12 (ground), 13 (neutral), 14 (line) (see dwg. B-
16571). The input resistance between line and neutral with the ON/OFF
switch in the ON position should be 4 ohms +10%. The resistance between
ground-hot and ground-neutral should be infinite resistance.
General Purpose Version, Control Unit: Control unit input
power connections are to be found at TS2 pins: 14 (line), 15 (neutral), 16
(ground) (see dwg. C-15245). The input resistance between line and
neutral with the ON/OFF switch in the ON position should be infinite
resistance.
General Purpose Version, Power Module: Power Module input
power connections are at TS1 pins: -1 (line), -2 (neutral), -3 (ground) (see
dwg. C-15245). The input resistance between line and neutral with the ON/
OFF switch in the ON position should be 5 ohms +10%. The resistance
between ground-line and ground-neutral should be infinite resistance. At
this point all interconnections between the control unit and power module
should be made. The interconnections are as follows: Connect the input AC
power to TS2: -14 (line), -15 (neutral), -16 (ground).
Next, a power line connection should be installed between the control
unit switch AC power in TS1: -14 (line), -15 (neutral), -16 (ground), and
the power module AC power in TS1: -1 (line), -2 (neutral), -3 (ground).
Teledyne Analytical Instruments
A Business Unit of Teledyne Electronic Technologies
3–5
Page 30

3.0 Installation
Signal connections should now be installed from the control unit TS2: -7
(plus), 6 (common) (see dwg. C-15245).
3.5 Optical Alignment
The object of optical alignment is to bring the optimum source energy
to the detector. Generally the optimum energy will be the maximum
amount of energy which can be focused on to the detector. This can be done
by adjusting the various elements in the source module (see dwg. C-14628).
WARNING: The light intensity from the quartz iodine lamp is intense and
should not be looked at directly without special protective
eyewear. Protective goggles with shaded lenses (Fed. Spec.
#5) should be worn if it is necessary to look directly at the
source.
Use a Variac on the input AC line to reduce the voltage and the lamp
intensity to a tolerable level.
1. Vertical lamp position is achieved by loosening the screws of
the base lamp bracket and moving the assembly up or down.
2. Horizontal position is achieved by loosening the Allen screw at
the base of the lamp holder which allows side to side movement
of the lamp.
3. Beam focusing is then achieved by loosening the lens holding
bracket and moving the lens back and forth until the best
focusing is obtained.
4. First visually optimize the lamp energy using a white piece of
paper at various locations in the light path. Make adjustments as
in steps 1, 2, and 3 above.
5. Then electronically optimize the energy as follows (the preamp
must be installed in the detector compartment):
a. Insert an extender card in the switch driver and clamp
position (remove keys as necessary).
b. Connect an oscilloscope to pin 6 (video from pre-amp),
and pin 3 (ground).
c. Remove the lens assembly from the light path.
d. Optimize lamp energy by adjusting the lamp position as
described in steps 1 and 2 above.
e. Replace the lens assembly.
f. Focus the lamp as described in step 3 to give the
maximum peak heights displayed on the oscilloscope.
g. If a Variac was used to alter the light intensity,
disconnect it and reconnect source to power supply.
3–6
Teledyne Analytical Instruments
A Business Unit of Teledyne Electronic Technologies
Page 31

Operations 4.0
4.0 Operations
Before shipment, TAI calibrates the analyzer for your application when
feasible. Calibration data is listed in the Appendix. Prior to calibration, TAI
checks the electronics of the analyzer and makes all of the necessary internal
printed circuit board adjustments. Calibration is performed to determine the
proper zero and span settings, and also to verify that the analyzer response is
linear.
After calibration, TAI makes a lengthy stability check to insure that the
analyzer performs within all specifications. We advise that you recalibrate
your equipment as part of start-up for the following reasons:
1. During shipment, it is possible that components have been jarred
out of position or damaged.
2. Your process may be of a proprietary nature. Beyond checking
electrical stability, TAI is unable to make a meaningful calibration of the system, requiring these adjustments to be made by
you.
3. In other cases precise calibration can only be made with the
analyzer connected to your process stream.
In any case, it is important that you calibrate the analyzer when it is
first installed. Zero checks should be made routinely once or twice a week
and span calibration should be performed weekly, at first, and monthly
after reproducibility is assured.
4.1 Control Functions
4.1.1 General Purpose Version, Analysis Section
The control functions for the analysis section are located on the power
module:
Teledyne Analytical Instruments
A Business Unit of Teledyne Electronic Technologies
4–1
Page 32

4.0 Operations
1. POWER ON/OFF: This switch controls power to the analysis
section.
2. NORM/ZERO: NORM setting gives a local meter reading of
the peak-to-peak (P-P) voltage of the measuring or reference
signal, depending upon the mode setting of the MEAS/REF
switch.
ZERO setting allows the meter to display the voltage output of
the analysis section after comparing the logarithm of the
measuring and reference signals. This output is fed to meter
driver prior to conversion to a current signal for transmission to
the control module.
With zero fluid in the cell, the analysis section local meter
should read zero when the NORM/ZERO control is set to
ZERO. The setting of the MEAS/REF switch has no effect on
meter readout in the ZERO position of this switch.
3. MEAS/REF: selects either the measuring or reference peak
voltage to be fed to the local meter driver. The NORM/ZERO
switch must be in the NORM position; the reference peak
voltage should read 9±0.1 volts. With zero fluid in the sample
cell, the measuring peak voltage should be the same as the
reference peak voltage.
4. ZERO: potentiometer control allows an adjustment of the
analysis section output voltage to the E-to-I converter. The
ZERO control should be adjusted to give a zero reading when
zero fluid is in the sample cell.
5. Local Meter Readout: reads reference or measuring peak
heights, or voltage output from buffer amplifier before E-to-I
conversion.
4.1.2 General Purpose Version, Control Module
l. ZERO:control to adjust the control module to read zero output
when zero fluid is in the sample cell, i.e., fine zero.
4–2
2. SPAN:control to adjust the span calibration to make the control
module meter read the correct concentration of the span fluid.
3. POWER ON/OFF: This switch controls power to the control
module.
Teledyne Analytical Instruments
A Business Unit of Teledyne Electronic Technologies
Page 33

Operations 4.0
4. ALARM SET (#l and #2): optional controls; position of dial
setting determines alarm setpoints. If dual alarms are used,
these may be set for high/low, high/high or low/low. Single
alarms can be either high or low. Dial settings can be determined
from the following formula:
X = Unknown dial setting to achieve desired alarm setpoint.
A = Analysis scale unit for low end of range.
B = Analysis scale unit for high end of range.
C = Analysis scale unit desired for alarm setpoint.
X =
(C-A)(1000)
(B-A)
For example, if the range of analysis is 20-80%, and a desirable alarm
setpoint is 30%, then A = 20, B = 80, and C = 30
X =
(30-20)(1000)
= 167
(80-20)
5. RANGE: optional switch; allows changing the range by some
predetermined amount, such as 4X or 5X; i.e., dual range: low
range of 0-100 ppm and a high range of 0-500 ppm.
6. Mode: selector for units incorporating an automatic zero.
SAMPLE position is the automatic zero; ZERO position is the
manual zero; SPAN position is the manual span adjustment.
7. Meter Readout: indicates the concentration of the component
of interest.
4.1.3 Explosion-Proof Version: Control Module
When the control module is integral with the analysis section (explosion-proof), it has all of the same control functions as the remote control
module. However, the meter readout function will be performed by the
analysis section.
Since the meter readout must handle functions for both the analysis
section and the control module, some of the controls on the power module
are different from those on the general purpose unit.
The NORM/REF and NORM/MEAS switches are on the power
module in place of the MEAS/REF switch. In addition, the NORM/ZERO
switch is located on the power module.
Teledyne Analytical Instruments
A Business Unit of Teledyne Electronic Technologies
4–3
Page 34

4.0 Operations
To read output from the control module, the NORM/ZERO, NORM/
REF and NORM/MEAS switches all must be in the NORM position.
4.2 Start-up
Information contained in this paragraph is based on the premise that the
analyzer has been properly installed as outlined in Chapter 3.0, and that it is
in operable condition. If difficulties arise during start-up, it is probable that
some form of damage has incurred during shipment or some installation error
has inadvertently been made.
Accessory test equipment is not necessary for start-up of the 514.
However, if the analyzer malfunctions at start-up, an oscilloscope and a
multimeter will be required for troubleshooting (see Chapter 5.0). TAI
recommends that a dual trace oscilloscope be used. A dual trace oscilloscope will permit the operator to see two different waveforms simultaneously.
4.2.1 Preliminary Inspection
Before power is supplied to the analyzer, all modules should be opened
and inspected for damage or loose components. Plug-in circuit cards should
be firmly seated in their sockets. All barrier strip wiring connections must be
inspected, and user-installed wiring between units verified as being in agreement with the system interconnection diagram.
Control Settings
Prior to turning on the power, the controls on and within the control
module should be positioned as follows:
Analyzers not equipped with Auto Zero
1. ON/OFF switches on OFF.
2. SPAN control preset to the setting noted in Specific Application
Data in the Appendix.
Analyzers equipped with Auto Zero
1. ON/OFF switches on OFF.
4–4
2. SAMPLE/ZERO switch on ZERO.
3. RUN/TEST switch (on timer unit within control module) in
TEST position.
Teledyne Analytical Instruments
A Business Unit of Teledyne Electronic Technologies
Page 35

Operations 4.0
4. SPAN control preset to the setting noted in Specific Application
Data in the Appendix.
4.2.2 Pre-Start-up Electrical Checkout
After the preliminary procedures have been accomplished (refer to
Preliminary Inspection and Control Settings, above), the integrity of the
system interconnection and the power sources must be verified before
attempting the analytical start-up procedures.
The observations and measurements described in the following paragraphs are vital to the operation of the analyzer. If the analyzer does not
respond as described, the equipment has been damaged in shipment or
installation, or the user-installed wiring is in error. If a problem arises,
correct it before proceeding further.
The following procedures should be employed in the same sequence
in which they appear.
4.2.3 Power On Observations
Turn both the analysis section and control module ON/OFF switches to
ON and make the following observations:
1. Open the analysis section detector module and verify that the
chopper motor is operating. The motor should start turning the
instant power is established. If it does not, check the integrity of
the main fuse on the control module door. If the fuse is blown,
re-check the power service connections on TS2 in the control
module, and the control module to analysis section
interconnection wiring (refer to Electrical Installation in
Chapter 3.0: Installation, and dwg. C-15245).
2. The lamp source should light the instant power is established.
Open the cover on the source module to verify illumination.
WARNING: 1. The light intensity from the quartz iodine lamp is intense
and should not be looked at directly without special protective
eyewear. Protective goggles with shaded lenses (Fed. Spec.
#5) should be worn if it is necessary to look directly at the
source.
2. Before opening any of the enclosure covers with the power on,
make certain that the area has been classified as safe to do so.
3. If the analyzer section has been equipped with the automatic zero
option, the zero solenoid device in the accessory sampling system
Teledyne Analytical Instruments
A Business Unit of Teledyne Electronic Technologies
4–5
Page 36

4.0 Operations
should have energized the instant power was established. The
device (or devices) should be energized because the mode switch
has been preset to the ZERO position.
4. If the test procedure was normal, the devices should have been
seen or heard to operate as described by personnel located at the
analysis section installation site, and no further check need be
made at this time. If operation is not as described, refer to
Troubleshooting in Chapter 5.0.
5. Check analyzer operation by completing the calibration
procedure described below in Calibration after allowing the
instrument to warm up. The electrical circuits take from 30 to
40 minutes to stabilize.
NOTE: It will take at least four hours for the analyzer to completely stabilize
with respect to temperature.
4.3 Calibration
Standardization Fluids
Two standardization fluids are necessary to calibrate the analyzer:
1. Zero Fluid:The zero standard fluid must have a composition
similar to the sample, and ideally, contains none of the
components of interest. The zero fluid should be laboratory
analyzed to determine its composition. The exact composition
must be known, as the accuracy of the analysis can be no better
than the your knowledge of the standardization fluid.
2. Span Fluid: The span fluid must be representative of the
sample fluid in composition (like the zero fluid), and contain a
measured quantity of the component of interest. The component
of interest content of the fluid should be in the region of 75% to
100% of the range of measurement. As with the zero fluid, the
accuracy of the system is dependent upon the your knowledge
of the span fluid composition. Ideally, the span sample should
contain 100% of whatever the instrument is set up to analyze.
Procedure
1. Introduce zero fluid (see above) into the sample cell. Flow liquid
samples into the cell at a flow rate of less than 50 ml/minute to
allow the sample preheater time to heat the sample up to the
4–6
Teledyne Analytical Instruments
A Business Unit of Teledyne Electronic Technologies
Page 37

Operations 4.0
control temperature. Make certain that bubbles are not introduced
or formed in the cell. (Some back-pressure may help avoid this.)
Gas samples can be introduced at about 200 ml/minute.
2. Turn the power module NORM/ZERO switch to NORM.
3. Turn the power module MEAS/REF switch to REF. Verify that
the analysis section meter reads 9±0.1 volts.
4. Make adjustment of the measuring peak voltage as follows
(zero fluid must be in the sample cell during this adjustment):
a. Switch the MEAS/REF switch to the MEAS position.
The meter should read almost the same as in the REF
mode. If the reading is somewhat different, the
measuring peak may be re-adjusted with R3 on the peak
level detector circuit card (see dwg. B-14554 and “Peak
Level Detector” in Chapter 5) inside the detector
module.
b. If the measuring peak is so far out of balance with the
reference peak that it can no longer be adjusted with
potentiometer R3, the optical filters require rescreening. If the analyzer has been in use for some time,
it is possible that the sample cell windows need cleaning
or that a filter has deteriorated.
Another cause of peak imbalance might be that the
sample chemical background has changed. In some
cases, TAI is not able to duplicate the background your
sample for purposes of optically balancing the analyzer
before shipment. In these cases, it is necessary for you to
screen for an approximate balance, and to then
electronically adjust R3 for precise balance. To do so:
1. Reset R3 to its midpoint.
2. Re-screen the filter wheel, as necessary, to obtain a
measuring voltage within 10% of the reference voltage.
Every time a screen is added or removed from a filter, the
analyzer must be turned off, and the filter wheel removed
from the analyzer. When the filter wheel is replaced in the
analyzer, its rotational position is not critical, but the
white backing must face in the direction of the position
sensor. The filter wheel must also be securely tightened,
so that no slippage or vibration can occur. See Figure 5-1.
NOTE: Refer to Figure 5-1 when installing filter screens. Screens should be
installed in the filter disk cup, under the filter holder. Also, if a
Teledyne Analytical Instruments
A Business Unit of Teledyne Electronic Technologies
4–7
Page 38

4.0 Operations
balance ring is used, it should be placed over the screen.
5. Turn the NORM/ZERO switch to ZERO. The analysis section
meter should be made to read zero by adjusting the coarse
ZERO control on the analysis section power module.
6. Check the control module SPAN setting to make sure it agrees
with the calibration results obtained by TAI (see Specific
Application Data in the Appendix).
7. Adjust the ZERO control on the control module to give a zero
reading on the control module meter.
8. Add span fluid (see Span Fluid, above) to the sample cell. Make
certain that all of the zero fluid is displaced.
c. After screening to bring the measuring voltage to within
10% of the reference voltage, adjust R3 as in step a
above to make the measuring peak voltage read the
same as the reference peak voltage.
9. Adjust the control module SPAN control to obtain the correct
meter reading with reference to the concentration of span fluid.
For example, if the sample contains 100% of whatever the
instrument is set up to analyze, then the SPAN control must be
adjusted for a full scale reading, i. e., 200 ppm water in EDC.
10. Re-check the ZERO setting with zero fluid.
11. If desired, the linearity of the analyzer can be checked with a
fluid intermediate in concentration between the zero and the
span fluid.
12. The analyzer is now calibrated. It is often desirable to check
calibration (fine tune) on a dynamic sample from your process,
double checking the 514 analyzer response with laboratory
analyzed grab samples. This is desirable where there is a
possibility that your sample stream may have some background
materials not in the makeup of the calibration fluid.
13. From time to time, re-check the zero setting. If it is found that
there is no zero drift, re-checking the zero setting may become
unnecessary or may be performed only on an occasional basis.
4–8
14. Some optical filters used in some applications will be so
temperature sensitive that screening must be performed with the
filters near the operating temperature.
Teledyne Analytical Instruments
A Business Unit of Teledyne Electronic Technologies
Page 39

Maintenance & Troubleshooting 5.0
5.0 Maintenance & Troubleshooting
Under normal operating conditions, little or no maintenance is required.
When, after prolonged use, the sample cell builds up an accumulation of dirt
or particulate deposits that take the instrument out of range of the ZERO
controls, then the sample cell must be removed (see Figure 5-2) and the
optics cleaned.
The filters should also be checked to see if any deposits have accumulated on their surfaces, requiring cleaning. Also, carefully inspect the filters
for any signs of deterioration. If necessary, remove and replace filter(s) (see
Figure 5-1). If optics/filters require cleaning, proceed as follows:
1. Windows are synthetic sapphire and lenses are quartz. They can
be cleaned, if necessary, with mild detergent and water, or with a
solvent such as ethanol.
2. The filters are sensitive to moisture and can be damaged by
water. They are held in place with epoxy cement which may be
attacked by solvents. Therefore, if filters must be cleaned beyond
the removal of dust with a brush, they may be cleaned by
application of ethanol with a cotton-tipped swab, being careful
not to wet the epoxy cement.
CAUTION: Extreme care must be observed when cleaning the optics of the
analyzer, particularly the reference and measuring filter elements,
which are critical, coated interference-type filters. Do not use
abrasive cleaners of any type. Dust or dirt can be removed with a
camel’s hair brush.
Periodic lamp replacement may be necessary. This is performed by
disconnecting the old lamp, removing it, and reconnecting the leads of a
replacement lamp.
With the exception of the items noted above, the analyzer system is
virtually maintenance-free and should perform satisfactorily almost indefinitely.
Teledyne Analytical Instruments
A Business Unit of Teledyne Electronic Technologies
5–1
Page 40

5.0 Maintenance & Troubleshooting
5.1 Replacement of Sample Cell Optics
If it becomes necessary to remove the sample cell optics for cleaning,
proceed as follows (see dwg. C-14631):
1. Loosen the bulkhead nuts on the two Swagelok fittings located
on the bottom of the condulet.
2. Remove the four mounting screws that secure the backplate to
the condulet interior.
3. Remove the two top mounting screws for sample preheater.
4. Unclip heater assembly from top of the compartment.
5. Remove two bulkhead fittings for clearance, then remove entire,
wired backplate assembly. There is no need to remove the wire
connections to the terminal strips. However, observe caution
when removing backplate from condulet; make sure that wire is
not twisted or pulled from connections.
6. Disassemble sample cell (see Figure 5-2).
7. To reinstall the sample cell, reverse the removal/disassembly
procedure.
5.2 Replacement of Filter Wheel Optics
If it becomes necessary to replace filter wheel optics, or re-screen
filter(s), proceed as follows:
1. Remove four screws securing detector compartment cover;
remove cover from compartment.
2. Use long-handled Allen-head wrench (7/64") to remove filter
wheel from chopper motor shaft. Hold filter wheel steady, insert
wrench in sockethead screw, then rotate shaft to remove the
screw and washers.
3. Carefully remove the filter wheel. Make certain that filter is not
touched with fingers, scratched, or marred in any way. Oil from
the fingers, or merely a fingerprint on the filters, can seriously
degrade performance of the analyzer.
5–2
Teledyne Analytical Instruments
A Business Unit of Teledyne Electronic Technologies
Page 41

Maintenance & Troubleshooting 5.0
4. A total of six spare screens are furnished with the analyzer
system. As shown in Figure 5-1, the screens are placed under the
filters. Re-screen, as required, then reassemble filter wheel and
install by reversing the removal/disassembly procedure. Make
sure to reassemble any balance weights or, if balancing facilities
are available, re-balance filter wheel if re-screening has resulted
in a weight shift.
5. It is extremely important that the filters are not
interchanged. The measuring filter is located adjacent to the
white arc on the filter wheel. If the filters are interchanged, meter
readings will be reversed, i. e., the meter will indicate downscale
values instead of upscale.
5.3 Replacement of Source Lamp Assembly
The replacement source lamp assembly is installed in place with the
evacuation seal oriented toward the right side of the module, i. e., away from
the lens. Make lamp electrical connections to terminals TS1-3 and TS1-4
(green leads).
After replacement, it may be necessary to adjust the lens associated with
the source lamp. Two screws secure the lens mount by means of slotted
mounting holes, permitting horizontal and vertical adjustment of the lens.
Likewise, the screw securing the source lamp mount can be loosened,
allowing movement of the lamp for adjustment purposes. After adjustment,
re-tighten all mounting screws. Make adjustments as follows:
1. Disconnect power originating in the power module (line voltage
regulating transformer) by removing the leads from TS1-1 and
TS1-2 in the source module.
2. Connect lamp transformer primary terminals (black, black-red
leads) to a source of adjustable AC (Variac, Powerstat, etc.).
3. Energize the source lamp sufficiently to make the optical
adjustment; however, do not make source lamp illumination so
excessive that brightness can harm the eyes or make the mount
too hot to handle.
4. Move the lamp until the light can be seen centered in the optical
tube separating the source and sample modules.
Teledyne Analytical Instruments
A Business Unit of Teledyne Electronic Technologies
5–3
Page 42

5.0 Maintenance & Troubleshooting
5. Using an oscilloscope, check the AC video signal at TP1 of
automatic gain control card (see dwg. B-14564). Maximize the
signal output with the adjustment, then tighten all screws in the
lens and lamp mounts
6. If an oscilloscope is not available, remove the filter wheel (see
Figure 5-1) and place a sheet of white paper in front of the
detector. Then adjust the lamp until the brightest, most uniform
spot of light is obtained. Avoid dark spots in the middle or sides.
The light shining on the detector may be viewed with a dental
mirror. Make certain that the detector is completely covered with
light.
NOTE: Do not touch the source lamp with fingers. The envelope must be
clean. If necessary, clean with mild detergent and water or solvent.
5.4 Replacement of Filter Position Sensor
The filter position sensor is installed within the detector compartment;
the sensor is secured to its mount by a single 4-40 screw. To replace the
sensor, proceed as follows:
1. Remove the four screws securing the detector compartment
cover; remove the cover from compartment.
2. Remove mounting screw. Pull the sensor free from its mount.
3. Tag all wiring, then cut the wiring to the sensor.
4. Splice new wiring and cover with shrink tubing. The sensor
“tail” should be removed so that the space between the sensor
and the filter wheel is approximately 1/8 ".
5. After all wiring has been made and the spacing is correct, secure
filter position sensor with 4-40 screw.
5.5 Replacement of Preamplifier Circuit Card
The preamplifier circuit card is installed inside a preamplifier subassembly which, in turn, is located within the detector compartment. To replace the
preamplifier circuit card, proceed as follows (see dwg. D-14665 and C-
14667):
5–4
1. Remove four screws securing detector compartment cover;
remove cover from compartment.
Teledyne Analytical Instruments
A Business Unit of Teledyne Electronic Technologies
Page 43

Maintenance & Troubleshooting 5.0
2. Loosen bottom nut on coaxial connector so that connector can be
pulled free of the receptacle.
3. Remove mounting screw used to secure subassembly base to
detector compartment interior.
4. Release the subassembly box from its mounting flange and
carefully remove it from the compartment. The two additional
connectors are the slip-on type and can be slipped off of their
receptacles as the subassembly is removed.
5. After the subassembly box is removed, the box can be opened for
removal of the circuit card.
6. Make certain that the slipon connectors are properly installed and
that the nut is tightened on the coaxial connector. Reverse the
removal procedure to finish reinstallation.
5.6 Re-screening of Lens
Gain resistor R4 in the preamplifier establishes the voltage output to the
clamp circuit (see dwg. A-14619). The resistor is selected for the application.
If there is too much light for a particular application, R4 is reduced to
approximately 1 megohm. If there is still too much light, the light path can be
attenuated by installation of a screen in the lens holder, held in position by
the installed lens.
5.7 Troubleshooting
When troubleshooting the analyzer, it may be helpful to note that the
reference and measuring level signals are split at the peak level detector.
Thus, if one of the signals is faulty but not the other, it might be an indication
of a malfunction in the peak detector circuit card, ahead of the log amplifier.
If the meter indications are the same, but too high or too low, it may be an
indication that something is malfunctioning ahead of the peak detector
circuit.
Use waveforms and voltages in this section to isolate troubles to specific components or circuits.
In the event of an electronic malfunction, always check the power
supply voltages before starting a detailed troubleshooting procedure.
The voltages given in the waveform and voltage tabulations are not
necessarily exact under all operating conditions. Depending upon the
application and various potentiometric adjustments, they may vary. They are
Teledyne Analytical Instruments
A Business Unit of Teledyne Electronic Technologies
5–5
Page 44

5.0 Maintenance & Troubleshooting
Symptom
Calibration voltages near zero
on local analysis meter (less
than standard 9 VDC).
Shift in readings at concentration meter.
Noisy output at concentration
meter (or noisy recorder trace).
Trace wanders (erratic or noisy
signal at concentration meter.)
Nonlinear output as a function
of concentration of the sample;
output noisy.
Cause
Source lamp burned out.
Changes in voltage to source
lamp, i.e., changes in line
voltage supply to lamp.
Preamplifier not providing a
strong enough output signal.
Source lamp burned out.
Clamp circuit defective (signal
not clamped to ground).
Corrective Action
Check lamp and replace, if
necessary. After replacement,
adjust optics (refer to section ×).
Check transformer at source
lamp module; replace, if necessary. Check line voltage regulating transformer in power module; replace, if necessary.
Check preamplifier output
signal. Use either J3 at preamplifier or connector pin 6 at
switch driver. Replace preamplifier circuit card, if necessary.
Check voltage at calibration
meter. If both voltages are
well below 9 VDC, check/
replace source lamp.
Check for clamped video input
to auto. gain control (check
TP1); replace switch driver and
clamp circuit card, if required.
Check switch signal outputs
from switch driver and clamp
circuit card: P, P', S, and S'.
Concentration meter operates
backwards; meter deflection is
from right to left.
5–6
Teledyne Analytical Instruments
A Business Unit of Teledyne Electronic Technologies
Filters in filter wheel installed
incorrectly.
Check filter installation. The
measuring filter should be
installed adjacent to the white
painted arc (see Figure 5-1).
Page 45

Maintenance & Troubleshooting 5.0
Symptom
Output goes to zero or full
scale (either extreme).
Discrepancy between recorder trace (current) and
reading on concentration
meter.
Cause
E-to-I converter defective
(check output transistors Q3,
Q4 or Q5).
Failure of A1 IC (log amplifier) in
log amplifier circuit.
Failure of I-to-E converter.
Failure of extended voltage
amplifier.
E-to-I converter defective.
Corrective Action
Check/replace, if required. If
meter sits on zero, also check
auto. gain control circuit card;
replace, if required.
Check log amplifier for 0 to 0.4
VDC full scale output. If IC A1 is
replaced, make sure that
balance potentiometers are
adjusted. Refer to Table VI.
Check input to pin 14. If input is
correct, check output at pin 15
for 0 to +4 VDC full scale.
Replace I-to-E converter, if
required.
Check input at pin 2 and output
at pin 5. If pin 5 output voltage
is not 0-1 VDC full scale output,
check/replace circuit card.
Check/replace, if required. Pay
particular attention to the output
transistors (Q3, Q4 and Q5).
Check/replace fuse F1, if
necessary.
Output drifts slowly up or
down.
Defect in temperature controller
circuitry.
Check/replace temperature
controller circuit card, as
required.
Teledyne Analytical Instruments
A Business Unit of Teledyne Electronic Technologies
5–7
Page 46

5.0 Maintenance & Troubleshooting
Secondary Adjustments
Ref. Desig.
Detector Module
Location
Function
R7
(20K)
R12
(500 ohms)
R15
(1K)
R26
(10K)
R7, R9
(2K each)
R16
(1K)
R36
(20K)
R10, R11
(2K each)
R3
(10K)
E-to-I Converter
(sch. B-14075)
E-to-I Converter
(sch. B-14075)
Log Amplifier
(sch. C-14907)
Log Amplifier
(sch. C-14907)
Log Amplifier
(sch. C-14907)
Log Amplifier
(sch. C-14586)
Log Amplifier
(sch. C-14586)
Log Amplifier
(sch. C-14586)
Peak Level Detector
(sch. B-14554)
Zero adjustment—adjusts output at 10
mA for 0 VDC input.
Balance adjustment—adjusts output at
20 mA for 0.5 VDC input.
Span adjustment (coupled with factory
select R8 and R16)—adjusts output of
A2 for 0.4 VDC full scale.
Meter trim adjustment—adjusts meter
driver and amplifier.
Balance adjustments for logarithmic
amplifier A1 (see Note 1).
Span adjustment (coupled with factory
select R13 and R17)—adjusts output of
A7 (signal to E-to-I converter) for 0.4
VDC full scale.
Meter trim adjustment—adjusts meter
driver and amplifier.
Balance adjustments for logarithmic
amplifier A1 (see Note 2).
Peak level balancing adjustment—
balances signal levels of reference and
measuring voltages (on local calibration
meter).
Control Module
5–8
P2
(10K)
R1
(10K)
R5
(5K)
R2
(10K)
Automatic Gain Control
(sch. B-14564)
Extended Voltage Amplifier
(sch. B-16221)
Extended Voltage Amplifier
(sch. B-16221)
Alarm Comparator
(sch. B-14718)
Reference voltage level adjustment for
automatic gain circuit—sets the voltage
to whlch the auto. gain control will hold
the reference peaks. To set, switch
calibration meter to “reference” and read
the reference level on the meter. Adjust
for +9 VDC which is the nominal value
used.
Adjusts offset of Q1 amplifier.
Meter trim potentiometer.
Alarrn setpoint trim potentiometer.
Teledyne Analytical Instruments
A Business Unit of Teledyne Electronic Technologies
Page 47

Maintenance & Troubleshooting 5.0
given more as an indication of magnitudes to be expected rather than as
exact values.
The troubleshooting chart cannot possibly identify all malfunctions that
may occur. Isolate the malfunction by using the waveform/voltage information, then replace the suspected circuit card.
All schematic and and circuit assemblies are given in the Drawing List
in the Appendix.
Adjustment of R7 and R9 on Log Ratio Amplifier Circuit
Card
When the log amplifier integrated circuit (A1) is replaced on the log
ratio amplifier circuit card, it is necessary to readjust potentiometers R7 and
R9 in order to balance the circuit.
In order to make the adjustments, have an extender card, a 100K
resistor for connection between A1-2 and A1-7 (across C5), and a highimpedance voltmeter handy to measure the voltage between A1-7 and
connector pin 9.
Proceed as follows:
1. Temporarily install 100K resistor across A1-2 and A1-7 (across
C5).
2. Disconnect connector pin 9 from 9 VDC by lifting a connection
on the extender card. Connect pin 9 of printed circuit card to A11 (signal common).
3. Adjust R7 until the voltage measured at A1-7 is zero.
4. Remove 100K resistor from A1-2 and
5. Reconnect connector pin 9 to 9 VDC.
6. Using a high-impedance voltmeter to measure voltages at pins 7
and 9 of the card extender, adjust R3 on the peak detector circuit
card until they are equal. With the reference and measuring
voltages equal and at approximately 9 volts, adjust R9 of the log
circuit card until the voltage at A1-10 is zero.
7. The log amplifier module (A1) is now balanced.
Teledyne Analytical Instruments
A Business Unit of Teledyne Electronic Technologies
5–9
Page 48

5.0 Maintenance & Troubleshooting
Adjustment of R10 and R11 on Chopper-Stabilized Log
Amplifier Circuit Card
When the log amplifier integrated circuit (A1) is replaced on the
chopper-stabilized log amplifier circuit card, it is necessary to readjust
potentiometers R10 and R11 in order to balance the circuit.
In order to make the necessary adjustments, it is necessary to have an
extender card, one 20KΩ resistor, and a high impedance voltmeter.
Proceed as follows:
1. Use an extender card so that connections are accessible
2. Temporarily connect a 20K resistor (stable, not composition type)
between A1-2 and A1-7 (across C2).
3. Unplug A2, A3 and A5.
4. Jumper A5-7 to A5-5 at socket and A2-3 to A2-6 at socket.
5. Install card in card extender and turn on analysis unit power.
6. Verify that voltage to pin 7 of the card edge connector is
approximately 9 VDC (measure between pin 7 and pin 14).
7. Adjust potentiometer R10 until the voltage measured at A1-7 is
zero with respect to signal common (TP3).
8. Remove jumpers installed in step (4).
9. Remove resistor connected in step (2).
10. Disconnect connector pin 7 from input by lifting a connection on
the extender card.
11. Temporarily connect a 20K resistor between A5-7 and A5-15 to
A1-16.
12. Jumper between A5-6 and A5-7 to provide the 9 VDC through
20K into A1-2 and through 20K into A1-16.
13. Adjust potentiometer R11 until the voltage measured at TP2 is
zero.
5–10
Teledyne Analytical Instruments
A Business Unit of Teledyne Electronic Technologies
Page 49

Maintenance & Troubleshooting 5.0
14. The log amplifier integrated circuit (A1) is now balanced.
15. Remove the 20K resistor, the jumper, restore connections,
replace ICs, then turn on the instrument power and check control
loop by measuring voltage at the output of A2. Voltage should be
-3 VDC, nominal.
16. If voltage is positive, R11 is out of balance or a component in the
loop has failed.
Photometric Laboratory Adjustment Procedure
Before power is supplied to the analyzer, all modules should be opened
and inspected for damage or loose components also check unit for proper
wiring and connections. All plug in circuit cards should be removed and
checked individually for correct assembly.
Analysis Unit
Explosion-Proof Version, Control Unit: Input power connections for
this unit are at TS2 pins: 12 (ground), 13 (neutral) 14 (line) (see dwg. B-
16571). The input resistance between line and neutral with ON/OFF switch
in the ON position should be 4 ohms +10%. The resistance between groundhot and ground-neutral should be infinite resistance.
General Purpose Version, Control Unit: Control unit input
power connections are to be found at TS2 pins: 14 (line), 15 (neutral), 16
(ground) (see dwg. C-15245). The input resistance between line and neutral
with ON/OFF switch in the ON position should be infinite resistance
General Purpose Version, Power Module: Power Module input
power connections are at TS1 pins: -1 (line), -2 (neutral), -3 (ground) (see
dwg. C-15245). The input resistance between line and neutral with ON/OFF
switch in the ON position should be 5 ohms +10%. The resistance between
ground-line and ground-neutral should be infinite resistance. At this point all
interconnections between the control unit and power module should be
made. The interconnections are as follows: Connect the input AC power to
TS2: -14 (line), -15 (neutral), -16 (ground).
Next, a power line connection should be installed between the control
unit switch AC power in TS1: -14 (line), -15 (neutral), -16 (ground) and the
power module AC power in TS1: -1 (line), -2 (neutral), -3 (ground). Signal
Teledyne Analytical Instruments
A Business Unit of Teledyne Electronic Technologies
5–11
Page 50

5.0 Maintenance & Troubleshooting
connections should now be installed from the control unit TS2: -7 (plus), 6
(common) (see dwg. C-15245).
Power Check
1. Plug in the +15 volt power supply PC card (see dwg. B-14708)
but leave all other PC boards out.
2. Turn power ON.
3. With a digital multimeter (DMM), check for +15 volts on the +15
volt power supply.
4. Check for proper starting of the chopper motor and source lamp.
WARNING: The light intensity from the quartz iodine lamp is intense and
should not be looked at directly without special protective
eyewear. Protective goggles with shaded lenses (Fed. Spec. #5)
should be worn if it is necessary to look directly at the source.
Optical Alignment
This procedure is identical to the “Optical Alignment” section in Chapter 2. The object of optical alignment is to bring the optimum source energy
to the detector. Generally the optimum energy will be the maximum amount
of energy which can be focused on to the detector. This can be done by
adjusting the various elements in the source module (see dwg. C-14628). See
warning above.
Use a Variac on the input AC line to reduce the voltage and the lamp
intensity to a tolerable level.
1. Vertical lamp position is achieved by loosening the screws of the
base lamp bracket and moving the assembly up or down.
2. Horizontal position is achieved by loosening the Allen screw at
the base of the lamp holder which allows side to side movement
of the lamp.
3. Beam focusing is then achieved by loosening the lens holding
bracket and moving the lens back and forth until the best
focusing is obtained.
4. First visually optimize the lamp energy using a white piece of
paper at various locations in the light path. Make adjustments as
in Steps 1, 2, and 3 above.
5–12
5. Electronically optimize the energy as follows (the pre-amp must
be installed in the detector compartment):
Teledyne Analytical Instruments
A Business Unit of Teledyne Electronic Technologies
Page 51

Maintenance & Troubleshooting 5.0
a. Insert an extender card in the switch driver and clamp
position. Remove keys as necessary.
b. Connect an oscilloscope to pin 6 (video from pre-amp), and
pin 3 (ground).
c. Remove the lens assembly from the light path.
d. Optimize lamp energy by adjusting the lamp position as
described in steps 1 and 2 above.
e. Replace the lens assembly.
f. Focus the lamp as described in step 3 to give the maximum
peak heights displayed on the oscilloscope.
g. If a Variac was used to alter the light intensity, disconnect it
and reconnect source to power supply.
Component Selection
Each 514 is made for a specific application. Therefore each will have
specifically selected electronic and optical components. These component
values are selected per application by the Photometric department.
Measuring and Reference Optical Filters
The Photometric department will supply the optical filters; mount each
filter in a filter holder (TAI P/N A1810) using 5-minute epoxy. Mount these
optical filter assembly in the filter chopper wheel. The measuring filter is
mounted on the edge of the chopper wheel with the white strip (see Fig. 5-1).
Proportional Temperature PCB
To fine tune temperature control, vary the resistance used by changing out
resistor R2 in the three boards below, which use the same schematic (see dwg.
B-15016).
Detector heater: R2
Space heater: R2
Sample heater: R2
Pre-Amp Gain
To select the gain, replace resistor R4 in schematic A-14619.
Log Card
One of three different types of log boards is selected, depending on the
application. Replace the indicated resistors on the boards noted to adjust the
logarithmic waveform.
Chopper-stabilized log PCB: R13 and R17 (See dwg. C-14586)
Log ratio PCB: R8 and R16 (See dwg. C-14907)
Dual log PCB:R13 and R17 (See dwg. C-17706)
Teledyne Analytical Instruments
A Business Unit of Teledyne Electronic Technologies
5–13
Page 52

5.0 Maintenance & Troubleshooting
E-to-I Converters
Analysis unit E-to-I (see dwg. B-14075):
0-0.5 volts in
10-20 mA out
R1 = 50 Ω (TAI P/N R262)
Control unit E-to-I (see dwg. B-16631): This is an optional card
capable of providing the following outputs with 0-1 volt in and
the listed values for R1:
1. 1 to 4 mA, R1 = 250 Ω
2. 4 to 20 mA, R1 = 63.5 Ω
3. 10 to 50 mA, R1 = 25 Ω
Alarm Comparator (Optional)
See dwg. B-14618.
Extended Voltage Amp
R3 is installed for outputs greater than 1 VDC (see dwg. A-14620).
I-to-E Converter
See dwg. A-14620.
Single Range: Strap point A to point B (see dwg. B-14454). R11 is
not used for single range applications.
Dual Range: Strap C to I and D to T
Millivolt output (Optional): R8 and R9
Filter Position Sensor Adjustment
The filter position sensor is mounted in the detector condulet assembly
(see dwg. C-14667). To adjust this sensor (power supplies installed):
1. Plug in the switch driver. Clamp the PCB into a card extender
and insert into the detection module.
2. Loosen the sensor bracket mounting screw.
3. Attach an oscilloscope to circuit board connector, pin 8 of the
switch driver PCB.
4. Adjust the sensor until the best sensor square wave is achieved.
Refer to Table IV at the end of this chapter.
5. A further check will be done later under Automatic Gain Control.
Switch Driver and Clamp Circuit (B-14561)
Refer to Table IV at the end of this chapter. For the remainder of the
adjustments in this section continue testing with the switch driver PCB
attached to a card extender as described above.
5–14
Teledyne Analytical Instruments
A Business Unit of Teledyne Electronic Technologies
Page 53

Maintenance & Troubleshooting 5.0
1. Adjust the input square wave at pin 8 to be equal above and
below ground. To accomplish this R2 must be raised or lowered
in value. This is necessary for proper operation of the rest of the
switching circuit.
2. Check the following test points for proper wave forms (refer to
Table IV at the end of the chapter):
a. TP4 (S). Square wave clamped to ground with +5V P-P.
b. TP3 (S). Square wave clamped to ground with +5V P-P
180° out of phase with S.
c. TP1 (P). Five (5) volt spikes with the tips at ground and
the base line of +5V (5V P-P).
d. TP2 (P). Same as TP1 (P) except 180° out of phase.
e. TP5. Clamp reset pulse. 30V P-P spike centered around
ground +15V and -15V.
f. Remove the card extender and re-insert the switch driver
card in the analyzer.
Balancing the Measuring and Reference Peak
Heights
For the electronic checkout the peak heights are balanced with air in the
sample cell. The peak heights will later be re-balanced with sample in the
sample cell, prior to chemical calibration. The peaks must be balanced within
+10% in air before the electronic calibration can be accurately completed.
1. Connect an oscilloscope to pin 6 on the circuit board connector
of the switch driver PCB. The video from the pre-amp will
displayed on the oscilloscope.
2. To determine which peak is the measuring or reference, connect
another oscilloscope lead (use a dual trace scope) to TP3 on the
switch drive PCB. The +5 volt (positive going) portion of the
square wave will correspond to the measuring peak (see Table
IV).
3. Screen the larger peak until about a +10% balance is achieved.
Never screen both filters.
Automatic Gain Control (AGC) PCB
See dwg. B-14564. Insert the AGC in the detector module. Refer to
Table IV for wave forms and test points (TPs).
Teledyne Analytical Instruments
A Business Unit of Teledyne Electronic Technologies
5–15
Page 54

5.0 Maintenance & Troubleshooting
1. TP1 (Violet): The clamped video should be between -0.4 to –
2V P-P volts. The base line is clamped to ground. Screen the
optical beam to achieve -0.4 to -2 volts P-P.
2. At this time set the gain of amplifier A1 to approximately 100. To
accomplish this, it is necessary that the peak level detector PCB
not be in place due to the fact that it is part of the AGC loop.
a. Connect one lead of a dual trace oscilloscope to TP2
(gray), the other to TP3 (green).
b. Set the attenuation so that the signal at TP2 is attenuated
by a factor of 100 compared to the one at TP3.
c. At this point you may note that the wave form at TP3 is
saturated. To get it out of saturation simply place screens
in the light path until a good trace is obtained.
d. Adjust P1 until both wave forms are the same. (Note:
actually 100 to 1)
3. Remove required screens in the light path to bring the voltage at
TP1 (violet) back between -0.4 to -2 volts P-P. Install the peak
level detector PCB. With the scope at TP3 of the AGC you
should see the wave form come out of saturation due to AGC
control.
4. Connect one input of the oscilloscope to TP5 on the Switch
Driver and clamp. Connect other input to TP3 on AGC. The
spike should be close to the halfway point between the negative
going peaks at TP3. It does not have to be exact as long as it
doesn’t coincide with the signal. If the spike is off, move the filter
wheel position sensor. If the spike falls on the signal it will clamp
it to ground.
5. After adjusting the sensor recheck Section 1.6, Switch Driver and
Clamp Circuit.
5–16
Peak Level Detector (PLD) PCB
Refer to Table IV.
1. With the oscilloscope leads at TP1 (red) and TP2 (blue) adjust
R3 until the two wave forms are of equal size.
2. With an oscilloscope lead at TP3 (yellow), adjust R15 until the
square wave is reduced to 20 mV P-P or less (best straight line).
3. Repeat step 2 with a scope lead at TP4 (orange) using R14 for
adjustment.
Teledyne Analytical Instruments
A Business Unit of Teledyne Electronic Technologies
Page 55

Maintenance & Troubleshooting 5.0
4. Using a digital multimeter (DMM) at TP4 (orange) adjust P2 on
the AGC PCB until 9 volts is obtained.
5. With the meter at TP3 (yellow) adjust R3 of the peak level
detector until 9 volts is obtained.
6. Repeat steps 3 and 4 until both TP4 and TP3 read +9.0 VDC.
This represents the zero absorbance condition.
Log Amplifier PCBs
One of three different types of log boards is selected, depending on the
application. Insert the appropriate log PCB in the analyzer, using a card
extender. The meter trim circuit adjustment (below) is common to all three
log boards. The three sections after that describe individual log amplifier
adjustments.
Meter Trim Circuit Adjustment
This adjustment calibrates the local meter so that its readings correlate
with known voltages in from the peak level detector (PLD).
General Purpose Control Unit:
1. Set the power module control functions as follows: MEAS/REF
to REF, NORM/ZERO to NORM.
2. Adjust the meter trimpot until the meter reads 90% of full scale.
The meter trimpot on the chopper stabilized log amp (C-14586)
and the log ratio board (C-14907) is R36, and on the adjustable
log ratio board (C-14907) is R26.
3. Now turn the MEAS/REF switch to the MEAS position. The
local meter should read 9 VDC if the PLD adjustments were
properly done.
Explosion Proof Control Unit:
Teledyne Analytical Instruments
A Business Unit of Teledyne Electronic Technologies
5–17
Page 56

5.0 Maintenance & Troubleshooting
With the explosion proof units, the power module ZERO, REF, and
MEAS levels, and the control unit meter readout for component of interest
concentration all are read on the local meter.
1. Set the power module control functions as follows: NORM/REF
to REF, NORM/MEAS to NORM and NORM/ZERO to
NORM. The REF level is now displayed on the local meter.
2. Adjust the meter trimpot until the meter reads 90% of full scale.
The meter trimpot or the chopper stabilized log amp (C-14586)
and the log ratio board (C-14907) is R36, and on the adjustable
log ratio board (C-14907) it is R26.
3. Now switch the NORM/REF to NORM and NORM/MEAS to
MEAS. Meter should now read 9 volts if the PLD balance
adjustments were properly done.
Log Ratio Amplifier Adjustments (dwg. C-14907):
When the log amplifier integrated circuit (A-1) is replaced on the log
ratio amplifier circuit card, it is necessary to re-adjust potentiometers R7 and
R9 in order to balance the circuit. To make the adjustments, the user must
have an extender card, a 100KΩ resistor for connection between A1-2 and
A1-7 (across C5), and a high impedance voltmeter to measure the voltage
between A1-7 and connector pin 9. Proceed as follows:
1. Temporarily install a 100K resistor across A1-2 and A1-7 (across
C5)
2. Disconnect connector pin 9 from 9 VDC by lifting a connection
on the extender card. Connect pin 9 of printed circuit card to A11 (signal common).
3. Adjust R7 until the voltage measured at A1-7 is zero.
4. Remove 100K resistor from A1-2 and A1-7.
5. Reconnect connector pin 9 to 9 VDC.
6. Using a high impedance voltmeter to measure voltages at pins 7
and 9 of the card extender, adjust R3 on the peak detector circuit
card until they are equal. With the reference and measuring
voltages equal and at approximately 9 volts, adjust R9 of the log
circuit card until the voltage at A1-10 is zero.
7. The log amplifier module (A-1) is now balanced..
8. The adjustment of R1 will be done during chemical calibration.
This adjustment allows fine adjustment on the gain of A2, so that
the output of A2 will be 0 to 0.4 VDC when zero and span fluids
are passed through the analyzer.
5–18
Teledyne Analytical Instruments
A Business Unit of Teledyne Electronic Technologies
Page 57

Maintenance & Troubleshooting 5.0
9. Switch NORM/REF to REF. Adjust R36 to give 90% of scale
on the analysis section meter.
10. Switch to MEAS. Meter should read 9 VDC.
11. Switch the NORM/ZERO switch to ZERO. Adjust the course
ZERO so that the meter reads zero. The ZERO control should
end up around 500.
12. The remainder of the adjustments on this PCB must be made in
by TAI Photometric personnel.
Chopper Stabilized Log Amplifier
Refer to dwg. C-14586. When the log amplifier integrated circuit (A-1)
is replaced on the chopper stabilized log amplifier circuit card, it is necessary
to readjust potentiometers R10 and R11 in order to balance the circuit. In
order to make the necessary adjustments, it is necessary to have an extender
card, one 20KΩ resistor, and a high impedance voltmeter. Proceed as follows:
1. Use an extender card so that connections are accessible.
2. Temporarily connect a 20KΩ resistor (stable, not composition
type, between A1-2 and A1-7 (across C2).
3. Unplug A2, A3 and A1.
4. Jumper A5-7 to A5-5 at socket and A2-3 to A2-6 at socket.
5. Install card in card extender and turn on analysis unit power.
6. Verify that voltage to pin 7 of the card edge connector is
approximately 9 VDC (measure between pin 7 and pin 14).
7. Adjust potentiometer R10 until the voltage measured at A1-7 is
zero with respect to signal common (TP3).
8. Remove jumpers installed in step 4.
9. Remove resistor connected in step 2.
10. Disconnect connector pin 7 from input by lifting a connection on
the extender card.
11. Temporarily connect a 20K resistor between A5-7 and A5-15 to
A1-16.
12. Jumper between A5-6 and A5-7 to provide the 9 VDC through
20K into A1-2 and through 20K into A1-16.
Teledyne Analytical Instruments
A Business Unit of Teledyne Electronic Technologies
5–19
Page 58

5.0 Maintenance & Troubleshooting
13. Adjust potentiometer R11 until the voltage measured at TP2 is
zero.
14. The log amplifier integrated circuit A-1 should now be balanced.
15. Remove the 20K resistor and the jumper. Restore connections,
replace IC’s, turn on the instrument power, and check control
loop by measuring voltage at the output of A2. Voltage should be
-3 VDC, nominal.
16. If voltage is positive, R11 is out of balance or a component in the
loop has failed. A slight adjustment of R11 (no more than 2 or 3
turns) should cause the voltage to change polarity to give the
required negative voltage at pin 6 of A2.
17. Check pins 8 and 10 on amplifier A3 for presence of +5 volt
square wave on the oscilloscope.
18. Switch NORM/REF to REF. Adjust R36 to give 90% of scale (9
VDC) on the analysis section meter.
19. Switch to MEAS. Meter should read 9 VDC.
20. Switch the NORM/ZERO switch to ZERO position. Adjust the
coarse ZERO to cause the meter to read zero. The ZERO control
should end up around 500.
21. The remainder of the adjustments on this PCB must be made by
TAI Photometric personnel
Chopper Stabilized Adjustable Log Ratio Amplifier
(Dual Log Board)
See dwg. C-17706. The dual log circuit is used when it becomes
necessary to unequally balance the logarithmic waveform of the reference
voltage and the logarithmic waveform of the measuring voltage so that an
interfering, NIR absorbing, background compound can be cancelled out.
When an interfering compound, in a three or more component mixture,
absorbs more at the selected reference wavelength than it does at the measuring wavelength, the dual log PCB affords a means of balancing, and thereby
cancelling, these inequalities. This type of compensation is only necessary in
a three or more component mixture. It is not necessary where only two
compounds are present.
5–20
1. When the adjustable log ratio board is used, disable the AGC
circuit by removing A3 and A4 on the AGC board (B-14430).
Teledyne Analytical Instruments
A Business Unit of Teledyne Electronic Technologies
Page 59

Maintenance & Troubleshooting 5.0
2. When the log amplifier integrated circuit A1 is replaced on the
chopper stabilized log amplifier circuit card, it is necessary to readjust potentiometers R10 and R11 in order to balance the circuit.
You should have on hand an extender card to help make
connections accessible, one 20K ohm resistor, and a high
impedance voltmeter.
a. Temporarily connect a 20K resistor (stable, not
composition type) between A1-2 and A1-7, across C2.
b. Unplug A2, A3, A5, and A9.
c. Jumper A5-7 to A5-5 at the socket and A2-3 to A2-6 at
the socket.
d. Install the card in the card extender and turn on the
analysis unit power.
e. Verify that voltage to pin 7 of the card edge connector is
approximately 9 volts. Measure between pin 7 and pin
14.
f. Adjust potentiometer R10 until the voltage measured at
A1-7 is zero with respect to signal common TP3
g. Remove jumpers installed in step c.
h. Remove resistor connected in step a.
i. Set R34 to give 9 volts on A9-6. Also set R34 to give 9
volts on A9-14.
j. Remove Q1 from its socket.
k. Disconnect connector pin 7 from input by lifting a
connection on the extender card.
l. Temporarily connect a 20K resistor between A5-7 and
A5-15 to A1-16.
m. Jumper between A9-6 and A5-7 to provide the 9 VDC
through 20K into A1-2 and through 20K into A1-16.
n. Adjust potentiometer R11 until the voltage measured at
TP2 is zero.
o. The log amplifier integrated circuit A-1 is now balanced.
p. Remove the 20K resistor and the jumper. Restore
connections and replace IC’s. Turn on the instrument
power and check the control loop by measuring voltage at
the output of A2. Voltage should be -3 VDC, nominal.
q. If voltage is positive, R11 is out of balance or a
component in the loop has failed. A slight adjustment of
R11 should cause the voltage to change polarity. After
checking this go back to the nominal -3 VDC by
adjusting R11.
Teledyne Analytical Instruments
A Business Unit of Teledyne Electronic Technologies
5–21
Page 60

5.0 Maintenance & Troubleshooting
r. Check pins 8 and 10 on amplifier A3 for presence of +5
volt square wave on scope.
s. Switch NORM/REF to REF. Adjust R36 to give 90% of
scale (9 VDC) on the analysis section meter.
t. Switch to MEAS. Meter should read 9 volts.
u. Switch the NORM/ZERO switch to ZERO position.
Adjust the coarse ZERO to cause the meter to read zero.
The ZERO control should end up around 500.
v. The remainder of the adjustments on this PCB must be
made by TAI Photometric personnel
E-to-I Converter for Analysis Unit
Refer to dwg. B-14075. This unit will have 10 to 20 mA output, with 0
to 0.5 volts input. This means when operating at the recommended range of
0 to 0.4 volts from the log PCB, the output from E-to-I PCB will be 10 to 18
mA.
1. Insert this board in the analyzer using a card extender.
2. Adjust the coarse ZERO control, on the power module, for zero
volts into the E-to-I converter. Measure this voltage with a DMM
at TP1 (red) on the log board or at pin 6 of the E-to-I circuit
board connector.
3. Adjust R7 to give 10 mA output between pins 1 and 13.
4. Adjust the coarse ZERO control to give 0.5 volts in at pin 6.
In some cases you may not be able to adjust from 0 to 0.5 volts.
Since the E-to-I board gives a linear current output with voltage,
the following formula can be used to calculate the current output
(I out) in mA relative to voltage in (V in)
I out = 20 (V in) + 10mA
5. Adjust R12 to obtain 20 mA or the appropriate output determined
in step 4 between pins 1 and 13.
6. Repeat steps 2 through 5 until the results are reproducible.
Note: This card is the last PCB located in the detector condulet.
5–22
Teledyne Analytical Instruments
A Business Unit of Teledyne Electronic Technologies
Page 61

Maintenance & Troubleshooting 5.0
Proportional Heater PCBs
See dwg. B-15016. There are three proportional heat PCBs, all of
which are located in the power module.
1. There are no adjustments on this card other than the installation
of R2 per desired temperature regulation (see section 5.×:
Component Selection). The type and value of thermistor used is
necessary for proper selection of R2.
2. There are two ways of testing the controlling action of the PCBs.
The first is a preliminary test on the board. The second tests the
performance of the board in the 514 analyzer.
a. Test the heater PCB in the “heater card test jig” in TAI’s
quality control area. A potentiometer on the test jig will
simulate the thermistor resistance. As this pot is varied,
the lamp (simulating the analyzer heater) will turn on and
off.
b. Place the PCBs in their normal positions in the analyzer
power module. Connect a 100V neon lamp between the
case of Q1 and the positive side of C1, or across the
heaters. When the heater has reached temperature
equilibrium the lamp will blink on and off at a rapid rate
(fraction of a second) indicating proper proportional
control. A slow blink rate (several seconds) indicates ON/
OFF heat control, but improper proportional control.
Control Unit
Power Supply, +15 Volts.
To check the control unit power supply, plug in control unit +15 volt
power supply and check for +15 volts.
I-to-E Converter
See dwg. A-14620. This card has no calibration adjustments, so all that
can be checked is proper operation at the output of A2 (circuit board pin 15),
which is 0-1 volt out for an input of 10-20 mA at circuit board pin 14.
Teledyne Analytical Instruments
A Business Unit of Teledyne Electronic Technologies
5–23
Page 62

5.0 Maintenance & Troubleshooting
Extended Voltage Amplifier
See dwg. B-16221. To adjust the offset voltage of Q1:
1. Remove the I-to-E converter.
2. With zero volts into pin 2 install a meter at the output of Q1.
3. Adjust R1 for zero offset at the output of Q1.
4. Reinstall the I-to-E board.
Meter Trim & Output Voltage Calibration
For localized explosion-proof control modules, the trim calibration is
done as in the “Meter Trim Circuit Adjustment” section under Log Amplifier
PCBs.
For the General Purpose Control Unit Models:
1. Place a DMM on the output pin 6, on Q1 or circuit board
connector pins. Set the SPAN setting to 250 or higher.
2. Adjust the coarse ZERO potentiometer on the power module to
give zero volts on the DMM. The control unit meter should read
zero.
3. Adjust the coarse ZERO potentiometer to give the full scale
output voltage on the DMM (generally 1.00 volt). If the 0-1 volt
adjustment cannot be made with the coarse ZERO, increase the
span control setting.
4. Once the instrument is set for the proper output voltage, adjust
R5 to make the control unit meter read exactly 100% of full scale.
Check a few points in between 0 and 100% to see if the output
tracks with meter reading in a linear fashion.
Control Unit Options
E-to-I Converter
5–24
See dwg. B-16631.
1. Install R1 per current output desire (see “Control Unit E-to-I”
under Component Selection). With zero volts in adjust R7 until
the desired lower current output level is obtained.
Teledyne Analytical Instruments
A Business Unit of Teledyne Electronic Technologies
Page 63

Maintenance & Troubleshooting 5.0
2. Change the input voltage to 1 volt. Adjust R12 until the upper
current level is achieved.
3. Repeat 1 and 2 until repeatability is achieved.
Alarm Comparators, Single and Dual
See dwg. B-14718.
1. PCB strappings (jumper wires) for set point alarm actuation are
as follows:
Dual: Above-Above: A to F & E, B to G, C to D
Dual: Below-Below: A to G & D, B to F, C to E
Dual: Above-Below: A to F & D, B to G, C to E
Dual: Below-Above: A to G & E, B to F, C to D
Single: Below: A to G, B to F
Single: Above: A to F, B to G
2. Single Alarm PCB: Adjust R2 until 1 volt is obtained at the
full clockwise position of P2 (setting of 1000). If the instrument
output of the alarm is set for 1 volt full scale the alarm is set for 1
volt full scale. The alarm relay should activate or deactivate
within +2% of the P2 dial setting.
3. Dual Alarm PCB: Same as above, except both relays should
activate or deactivate within +2% of P2 and P3 dial settings.
Teledyne Analytical Instruments
A Business Unit of Teledyne Electronic Technologies
5–25
Page 64

5.0 Maintenance & Troubleshooting
Photometric Laboratory Calibration
Procedure
1. Connect a recorder to the control unit.
2. Remove any screens placed over the sample cell that are in the
optical path.
3. Bolt cover on sample compartment.
4. Remove main cover from detector module to gain access to test
points.
5. Make certain proper optical filters are in place.
6. Small detector compartment covers must be in place.
7. Turn on analyzer and recorder.
8. With an oscilloscope, check all sync. pulses on the switch driver
and clamp circuit (refer to Table IV at the end of this chapter).
9. Wait one hour for warm-up.
10. Flow zero fluid into the sample cell. Lock in place. Zero fluid is
the background fluid with a minimum amount of the component
being measured.
11. With an oscilloscope, check the waveform at TP1 (violet).
Balance measure and reference peaks heights within 20%. The
clamped video should be between -0.4 to -2 volts P-P. The base
line is clamped to ground. Change the preamplifier gain resistor,
R4, to obtain -0.4 to -2 volts P-P, if necessary.
12. Connect one lead of a dual trace oscilloscope to TP2 (gray), the
other to TP3 (green).
13. On the peak level detector PCB connect a DMM to TP4 (orange)
and ground (any black test point). Adjust P2 on the automatic
gain control PCB until 9.00 volts are obtained.
5–26
14. With the meter at TP3 (yellow) adjust R3 on the PLD until the
calculated voltage is obtained. Some calculations will have to be
made to properly calibrate the analyzer when the zero fluid is not
exactly zero for the component of interest. When the zero fluid is
zero for the component of interest the PLD voltage at TP3 is set
Teledyne Analytical Instruments
A Business Unit of Teledyne Electronic Technologies
Page 65

Maintenance & Troubleshooting 5.0
to 9.00 volts. When the zero fluid concentration (Cz) is some
other value, proceed as follows:
Estimate the absorbance change (Afs) expected for full scale
changes in concentration. Then from the concentration of the
component of interest in the zero fluid (C
meter reading (M
zero fluid (V
log(
) calculate the voltage setting at TP3 for the
fs
).
z
Vz) = - (Afs) C
9M
Example: IfAfs = 1 unit
Mfs = 10%
Cz = 1%
Then:
log Vz = - (1) (1)
9 10
z
fs
) and the full scale
z
log V
z
10
9
=10
-.1
Vz = (9) (0.79) = 7.15 volts
15. On the chopper stabilized log board place a DMM at TP1 (red).
Adjust the coarse ZERO control on the analysis unit to give an
output equal to (Cz/Cfs)(Vfs). Vfs equals the voltage output from
the chopper stabilized log board for a full scale deflection, which
equals 400 mV. For example, if:
Cz = 1%
Cfs = 10%
then the voltage output at TP1 will equal
(1/10)(400 mV) = 40 mV.
16. Set the span control on the control unit to 500.
17. Adjust the fine ZERO control on the control unit to give a meter
reading equal to Cz.
18. Re-check the peak voltages on the switch driver and clamp
circuit at TP1 (violet). If the peaks have increased, it is probably
due to outgassing in the sample cell caused by improperly
locked-in sample, or by a leak in the system. Correct the problem
and repeat steps 10 thru 20.
Teledyne Analytical Instruments
A Business Unit of Teledyne Electronic Technologies
5–27
Page 66

5.0 Maintenance & Troubleshooting
19. Fill the sample cell with span fluid. Turn unit off, remove
chopper stabilized log board and place it on an extender board.
Turn the unit back on and adjust R16 on the chopper stabilized
log board to give a voltage at TP1 (red) equal to:
(Cs - Cz) V
M
fs
fs
where Vfs is the voltage output from TP1 for full scale deflection,
which equals 400 mV.
Example: If Cs = 8%
= 1%
C
z
M
= 10%
fs
Then:
Voltage output at TP1 = 8-1 (400 mV)
10
= 280 mV
Set the SPAN control (on the control module) to give a meter
reading of
Cs - C
z
20. Adjust the coarse ZERO control on the analysis unit until the
voltage at TP1 (red) is equal to:
(Cs/Mfs)V
fs
5–28
21. Record the following data:
a. VDC on PLD, TP3 and TP4
b. VDC on chopper stabilized log operator, TP1 (red)
c. AC P-P on chopper stabilized log operator, TP2 (yellow)
d. AC P-P on automatic gain control PCB TP1 (violet)
e. Control unit meter readout.
22. An oscilloscope on TP2 (yellow) will display a 400 Hz square
wave. If this peak-to-peak voltage is less than 100 mV, decrease
the value of R13 (which will be 1KΩ for most applications). If
the P-P voltage is greater than 0.4 volts, increase the value of
R13. If the voltage is still above 0.4 volts, the cell spacer must be
decreased, or other optical filters selected.
23. With a DMM on the log PCB TP1 (red) record VDC. If it is
below 0.2 volts, adjust R16; increase R17 if you run out of
adjustment with R16. If the voltage is higher than 0.4 volts,
Teledyne Analytical Instruments
A Business Unit of Teledyne Electronic Technologies
Page 67

Maintenance & Troubleshooting 5.0
adjust R16; decrease R17 if you run out of adjustment with R16.
The actual limit is 0.5 volts, with 0.4 volts giving some leeway.
The log circuit will give accurate results for much higher voltage
(as high as 4 volts), but the next stage (E-to-I) will not be
accurate above 0.5 volts in.
24. As a check go back to the zero fluid. The meter should read the
correct zero fluid concentration. Record the data points as in step
23.
25. Lock zero fluid in the sample cell. Run overnight stability.
Visually inspect the sample cell for bubbles, indicating sample
outgassing and cell leakage. Stability can also be run by
removing the liquid from the sample cell, and drying out the cell
with acetone followed by dry nitrogen or air purging. Screen the
optical path to obtain the same P-P voltages (as when liquid was
in the cell) at TP1 (violet) on the automatic gain control PCB.
Purge with dry gas continuously.
Balance Ring
Reference Filter
Rotated 180 Degrees
Chopper M otor
Shaft
Reference Filter
Screen
White Enamel
Measuring Filter
Measuring Filter
Figure 5-1. Filter Wheel - Exploded View
Teledyne Analytical Instruments
A Business Unit of Teledyne Electronic Technologies
5–29
Page 68

5.0 Maintenance & Troubleshooting
Cell Window
Holder
Window
Clamp
Cell
Figure 5-2. Sample Cell - Exploded View
Clamp
O-Rings
5–30
Teledyne Analytical Instruments
A Business Unit of Teledyne Electronic Technologies
Page 69

Appendix
Appendix
Specifications
Accuracy: ±2% full scale or better
Reproducibility: ±1% full scale or better
Noise: Less than ±1%
Drift: Less than 1% per day
Diurnal: Less than 1% per day
Sensitivity: 0.02 to 1.5 absorbance units
Electronic Response: 90% in 10 seconds
Light Source: Quartz iodine lamp
Filter Wavelengths: 1.0 to 2.8 microns
Sample Cell: Stainless steel with sapphire windows,
standard; others available;
length per application
Flow Rate: Typically 50-200 cc/min. (depending
upon application)
Ambient Temperature: 0° to 50° C (without available auxiliary
heating).
Electrical Requirements: 115 VAC, 60 Hz (standard)
Readout Device: Meter on control module
Analog Output Signal: 0-1 V (standard)
Options Designated by Model # Suffix
B1: Local Explosion Proof Control Unit
B2: Remote Explosion-proof Control Unit
I5, I20 or I50: Current Outputs
S1 or S2: One or Two Alarm Circuits
K5, K10 or K100: Millivolt Output Signals
E5 or E10: Voltage Outputs in lieu of 0 to 1 V output
D: Dual Range
A: Automatic Zero
O5, O20 or O50: Optically Isolated Current Outputs
(explosion-proof control unit only)
Teledyne Analytical Instruments
A Business Unit of Teledyne Electronic Technologies
A–1
Page 70

Appendix
Statistics
Customer Order No.:_________________________________________
TAI Sales Order No.:_________________________________________
Equipment Model Nos.:_________________________________________
Analyzer Serial No.:_________________________________________
Analysis
Component of Interest:_________________________________________
Start-up ZERO setting:__ Coarse_____________ Fine ______________
Start-up SPAN setting:_________________________________________
Specific Application Data
Analyzer:_________________________________________
System:_________________________________________
Range 1:______________________ Range 2: ___________
Background:_________________________________________
Noise:_________ Linearity: ___________ Diurnal: _____
Optics
Source:_________________________________________
Measuring Cell
Length:_________________________________________
Materials
Spacer:_________________________________________
O-Ring:_________________________________________
Windows:_________________________________________
Temperature
Preheater:_________ °C Space Heater: __________ °C
Optical Filters:
Measuring Wavelength:_________ µ, 1/2 BW __________ TAI #:_______
Reference Wavelength:_________ µ, 1/2 BW __________ TAI #:_______
Detector Type:_________________________________________
Detector Compartment Temperature:________ °C
Meter Dial Marking:_________________________________________
Output Signals:_________ m V _________ V___________I
_________ Iso I
Alarms:
Mode: Relays energized above or below setpoint
A–2
ABOVE BELOW
No. 1
No. 2
Teledyne Analytical Instruments
A Business Unit of Teledyne Electronic Technologies
Page 71

Drawing List
Circuit Connection Drawings
Source Module A-14704
Sample Module A-14703
Detector Module C-14581
Power Module (for Explosion-Proof Control Unit) C-14746
Power Module (for General Purpose Control Unit) C-14731
Control Module (Explosion Proof) C-15829
Control Module (General Purpose) C-14691
Outline Drawings
Analysis Unit w/Explosion-Proof Control Unit D-18308
General Purpose Control Unit C-16801
Analysis Unit D-18307
Source Module Assembly C-14628
Sample Module Assembly C-17356
Detector Module Assembly D-14665
Detector Box Subassembly C-14667
Analyzer System Outline w/Integral
Explosion-Proof Control Unit C-15644
Analysis Unit Outline C-18313
Control Unit Outline General Purpose B-15066
Appendix
C-15695
Electrical-Power Module
Proportional Temperature Controller Sch. B-15016
Proportional Temperature Controller Assy. B-14449
Electrical-Control Module
I-to-E Converter Sch. A-14620
I-to-E Converter Assy. B-14454
Alarm Comparator Sch. B-14718
Alarm Comparator Assy. A-9309
Extended Voltage Amplifier Sch. B-16221
Extended Voltage Amplifier Assy. A-15163
E-to-I Converter Sch. B-16631
E-to-I Converter Assy. B-14702
Auto Zero/Ext. Voltage Ampl. Sch. B-14729
Automatic Zero Assy. A-16888
Teledyne Analytical Instruments
A Business Unit of Teledyne Electronic Technologies
A–3
Page 72

Appendix
Drawing List, Continued
Electrical-Detector Module
Preamplifier Sch. A-14619
Preamplifier Assy. A-14505
Switch Driver and Clamp Sch. B-14561
Switch Driver and Clamp Assy. B-14434
Automatic Gain Control (AGC) Sch. B-14564
Automatic Gain Control (AGC) Assy. B-14430
Peak Level Detector, Sample and Hold Sch. B-14554
Peak Level Detector, Sample and Hold Assy. B-14441
Chopper-Stabilized Log Amplifier Sch. C-14586
Chopper-Stabilized Log Amplifier Assy. B-14579
Log Ratio Amplifier Sch. C-14907
Log Ratio Amplifier Assy. B-14083
E-to-I Converter Sch. B-14075
E-to-I Converter Assy. B-14453
Electrical-Power Supply
Regulated Power Supply Sch. B-14708
Regulated Power Supply Assy. A-9306
Interconnection Diagrams
Analyzer System (w/Explosion-Proof Control Unit) B-16571
Analyzer System (w/General Purpose Control Unit) C-15245
Spare Parts List
QTY P/N DESCRIPTION
Power Condulet Assembly
5 F11 Fuse, 5 A
3 B14449 Printed Circuit Card Assembly, Temperature Controller
Control Unit Assembly
1 A9306 Printed Circuit Card Assembly, Power Supply
1 B14454 Printed Circuit Card Assembly, I/E Converter
1 A9309 Printed Circuit Card Assembly, Alarm Comparator (if
equipped with alarm option)
1 B14702 Printed Circuit Card Assembly, E/I Converter (if
equipped with current output option)
A–4
Teledyne Analytical Instruments
A Business Unit of Teledyne Electronic Technologies
Page 73

Appendix
1 A16888 Printed Circuit Card Assembly, Auto Zero/Meter Driver
(if equipped with automatic zero)
1 A15163 Printed Circuit Card Assembly, Extended Voltage
Amplifier (if not equipped with automatic zero)
1 O84 Optically Isolated E/I Converter Assembly (Explosion
Proof only)
5 F11 Fuse, 5 A
Detector Condulet Assembly
1 A9306 Printed Circuit Card Assembly, Power Supply
1 B14430 Printed Circuit Card Assembly, AGC
1 B14434 Printed Circuit Card Assembly, Switch Driver
1 B14441 Printed Circuit Card Assembly, Peak Level Detector
1 B14453 Printed Circuit Card Assembly, E/I Converter
1 B14083 Printed Circuit Card Assembly, Log Ratio Module
or
1 B14579 Printed Circuit Card Assembly, Chopper Stabilized Log
Amplifier
1 S239 Filter Position Sensor
1 T174 Thermistor
1 B14668 Detector Cell Assembly
1 A14505 Printed Circuit Card Assembly, Preamplifier
1 D60976 Power Supply Assembly
A minimum charge is applicable to spare parts orders.
IMPORTANT: Orders for replacement parts should include the part number
and the model and serial number of the system for which the
parts are intended.
Send orders to:
TELEDYNE ANALYTICAL INSTRUMENTS
16830 Chestnut Street
City of Industry, CA 91749-1580
Telephone: (626) 934-1500
TWX: (910) 584-1887 TDYANYL COID
FAX: (626) 961-2538
Web: www.teledyne-ai.com
or your local representative
Teledyne Analytical Instruments
A Business Unit of Teledyne Electronic Technologies
A–5
Page 74

Appendix
A–6
Teledyne Analytical Instruments
A Business Unit of Teledyne Electronic Technologies
 Loading...