

Page 1

XGA VIEWER
OPERATIONS MANUAL
Super Systems Inc.
www.supersystems.com
7205 Edington Drive
Cincinnati, OH 45249
513-772-0060
Fax: 513-772-9466
Page 2
XGA Viewer Operations Manual
Super Systems Inc.
USA Office
Corporate Headquarters
7205 Edington Drive
Cincinnati, OH 45249
Phone: (513) 772-0060
http://www.supersystems.com
uper Systems Mexico
S
Sistemas Superiores Integrales S de RL de CV
Calle 3 Int.: 11.
Zona Ind. Benito Juarez
Querétaro, Qro. Méx.
C.P.: 76120
Phone: +52 (442) 210 2459
http://www.supersystems.com.mx
Super Systems Europe
Units 3 & 4, 17 Reddicap Trading Estate,
Sutton Coldfield, West Midlands
B75 7BU
UNITED KINGDOM
Phone: +44 (0) 121 329 2627
http://www.supersystemseurope.com
uper Systems China
S
No. 335 XianXia Road
Phone: +86 21 5206 5701/2
http://www.supersystems.com
Room 308
Shanghai, CHINA
200336
Super Systems Inc. Page 2 of 46
Page 3

XGA Viewer Operations Manual
Table of Contents
Introduction ..................................................................................................................................... 5
Standard Usage ........................................................................................................................... 5
Compatible Products ................................................................................................................... 5
Prerequisites................................................................................................................................... 5
Installation ...................................................................................................................................... 5
Connecting the Computer to the Gas Analyzer (MGA or PGA) ........................................................ 8
USB Connection ........................................................................................................................... 9
Direct Connection to Computer Using Ethernet Crossover Cable .............................................10
Ethernet Network Connection ....................................................................................................11
Starting the Software .....................................................................................................................12
XGA Viewer .....................................................................................................................................12
File Button ..................................................................................................................................13
Save Graph Image As ..............................................................................................................13
Check for Software Updates ...................................................................................................13
About .......................................................................................................................................14
Exit ..........................................................................................................................................15
Print Button ................................................................................................................................15
Print Chart ..............................................................................................................................15
Print Preview Chart ................................................................................................................15
Print Notes..............................................................................................................................16
Print Preview Notes ................................................................................................................16
Options Button ............................................................................................................................16
Instruments Setup ..................................................................................................................16
Add An Instrument ..............................................................................................................17
Remove An Instrument .......................................................................................................18
Modify An Instrument..........................................................................................................18
Data Backup ...........................................................................................................................19
Language ................................................................................................................................20
View Grid Data Button ................................................................................................................20
Export Button ..........................................................................................................................21
Data To CSV .........................................................................................................................21
Data To TSV .........................................................................................................................21
Data To TXT .........................................................................................................................22
Print Preview Button ..............................................................................................................22
Print Button ............................................................................................................................22
Real Time Mode Button ..............................................................................................................22
Instrument Menu Button ............................................................................................................22
Edit Template .........................................................................................................................22
Add A Trend .........................................................................................................................23
Remove A Trend ..................................................................................................................23
Super Systems Inc. Page 3 of 46
Page 4

XGA Viewer Operations Manual
Modify A Trend ....................................................................................................................23
PGA Setup ...............................................................................................................................27
Saving Changes To The Setup .............................................................................................32
Canceling Changes To The Setup .......................................................................................33
Download Data Button................................................................................................................33
SSi XGA Viewer Main Screen Overview ..........................................................................................34
Trend Values Context Menu .......................................................................................................35
View Statistics .........................................................................................................................35
Show On Graph .......................................................................................................................36
Properties ...............................................................................................................................36
Graph Manipulation Buttons ......................................................................................................36
Cursor Button - ...............................................................................................................36
Zoom Button - .................................................................................................................37
Pan Button - ....................................................................................................................37
Restore Button - .............................................................................................................37
Sessions .....................................................................................................................................37
Troubleshooting Ethernet Connection Problems ..........................................................................39
Compatible IP Address ...............................................................................................................39
Pinging the Instrument ..............................................................................................................40
Ping Request Timeout ................................................................................................................41
Revision History .............................................................................................................................42
Appendix 1: PGA3500/MGA6000 – Template Channel 1 Data Definitions .....................................43
Appendix 2: PGA3510/MGA6010 – Template Channel 1 Data Definitions .....................................45
Super Systems Inc. Page 4 of 46
Page 5

XGA Viewer Operations Manual
Introduction
Prerequisites
“setup.exe”
Installation
“setup.exe”
Cancel
Next >
setup.exe
The XGA Viewer application will allow you to download, view, and report on the data logged by
your Super Systems gas analyzer unit(s).
Standard Usage
The following illustrates the typical usage of the application.
Step 1: Gather data with your gas analyzer unit
In most cases this is as simple as having your analyzer unit turned on. Our instruments are
always logging input data as long as they are powered up.
Step 2: Download the data
Downloading the data consists of properly connecting the PC or Laptop containing the XGA
Viewer software to the analyzer unit, and pressing the “Download Data” button on the
application interface.
Step 3: Review and report on the data
Once the data has been downloaded the analyzer unit may be disconnected as all data is stored
locally on the PC.
More details on how to perform these tasks are provided later in this manual.
Compatible Products
The application will work with the following SSi products:
• MGA6000
• MGA6010
• PGA3500
• PGA3510
For XGA Viewer to be installed and run properly, several prerequisites must be met. These
include the following:
• Microsoft .NET Framework 2.0 (or higher).
• SQL Compact 3.5.
• Mobile Device Center (Windows Vista, 7, & 8) or ActiveSync (Windows XP)
These prerequisites will be installed automatically when the
run from the installation folder or disc.
installation program is
Note: Before beginning the installation, the person performing the installation must have
administrative rights on the local computer, or the installation will not be successful
click on the
software
cancel the installation of the XGA Viewer. The cancellation must be confirmed. Click on the
If prerequisites must be installed, the
.
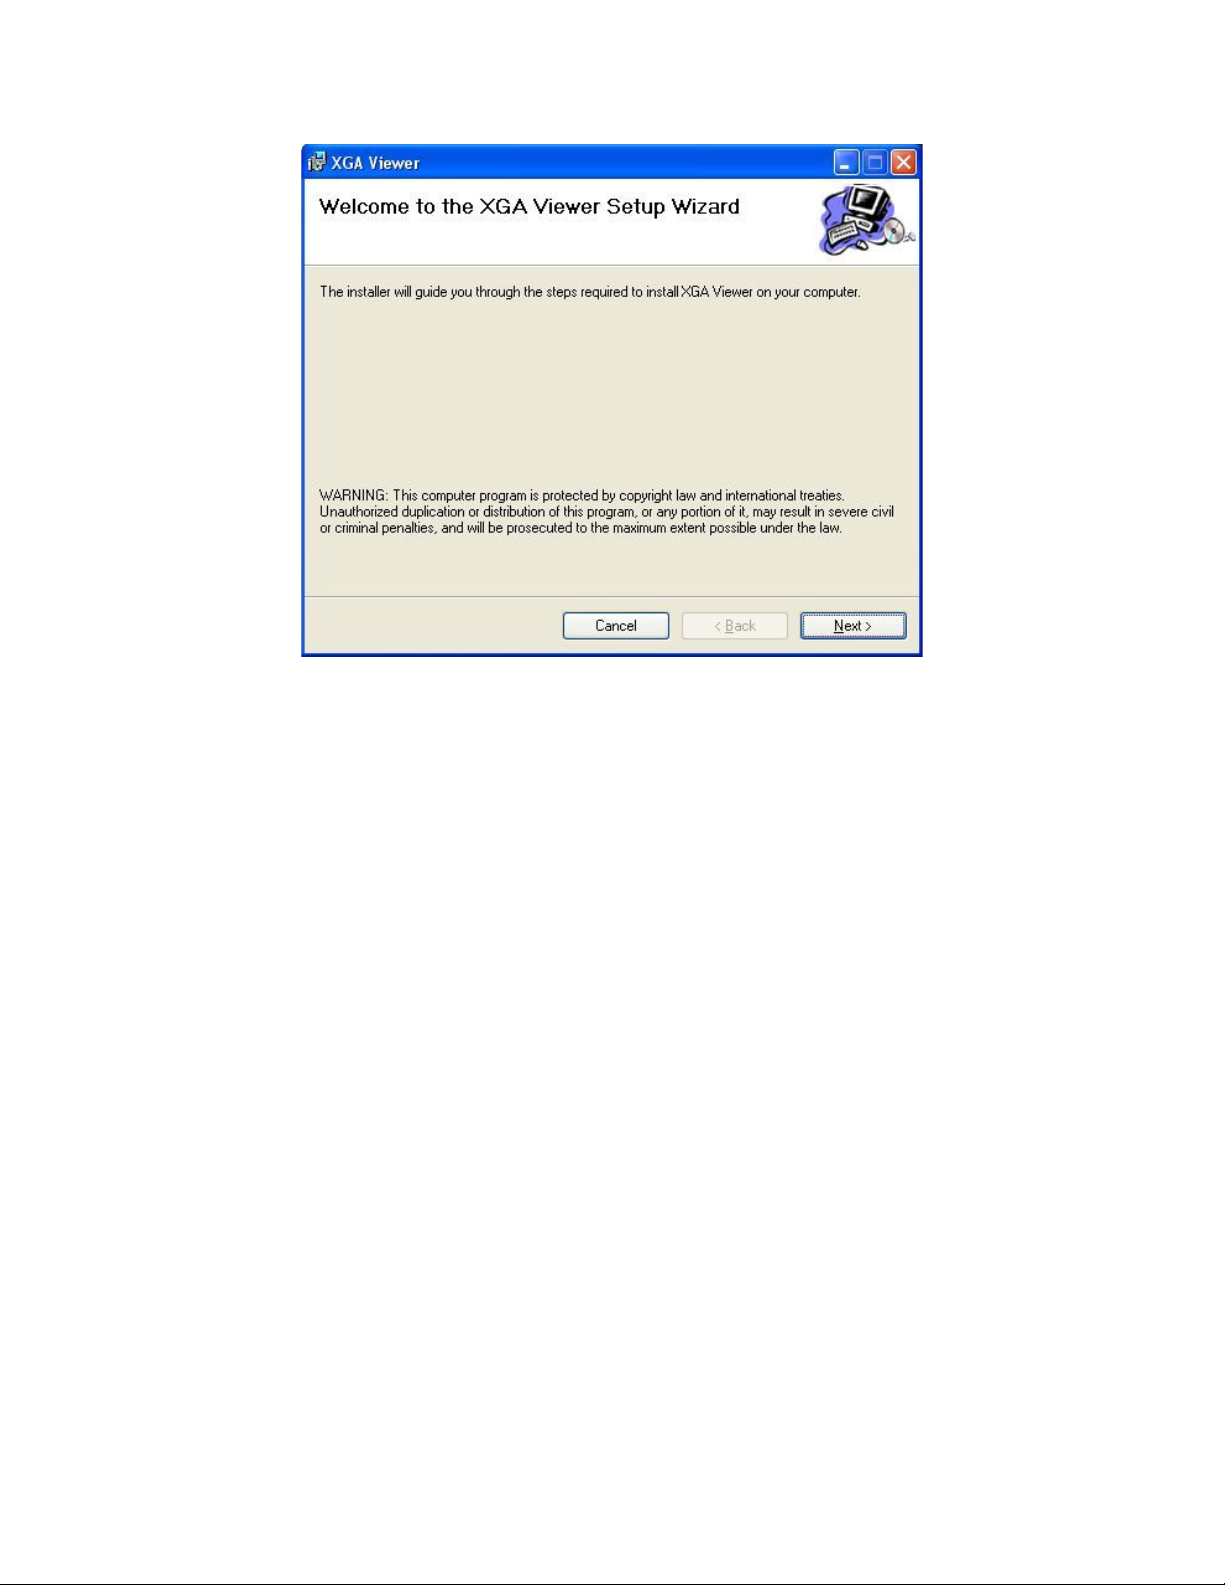
The first screen displayed is an introductory screen. Click on the
button to continue with the installation.
file from the setup CD. This will begin the installation wizard for the
program will install them.
. Double-
button to
Super Systems Inc. Page 5 of 46
Page 6
XGA Viewer Operations Manual
Figure 1 - First installation screen
Browse…
Disk Cost…
< Back
Next >
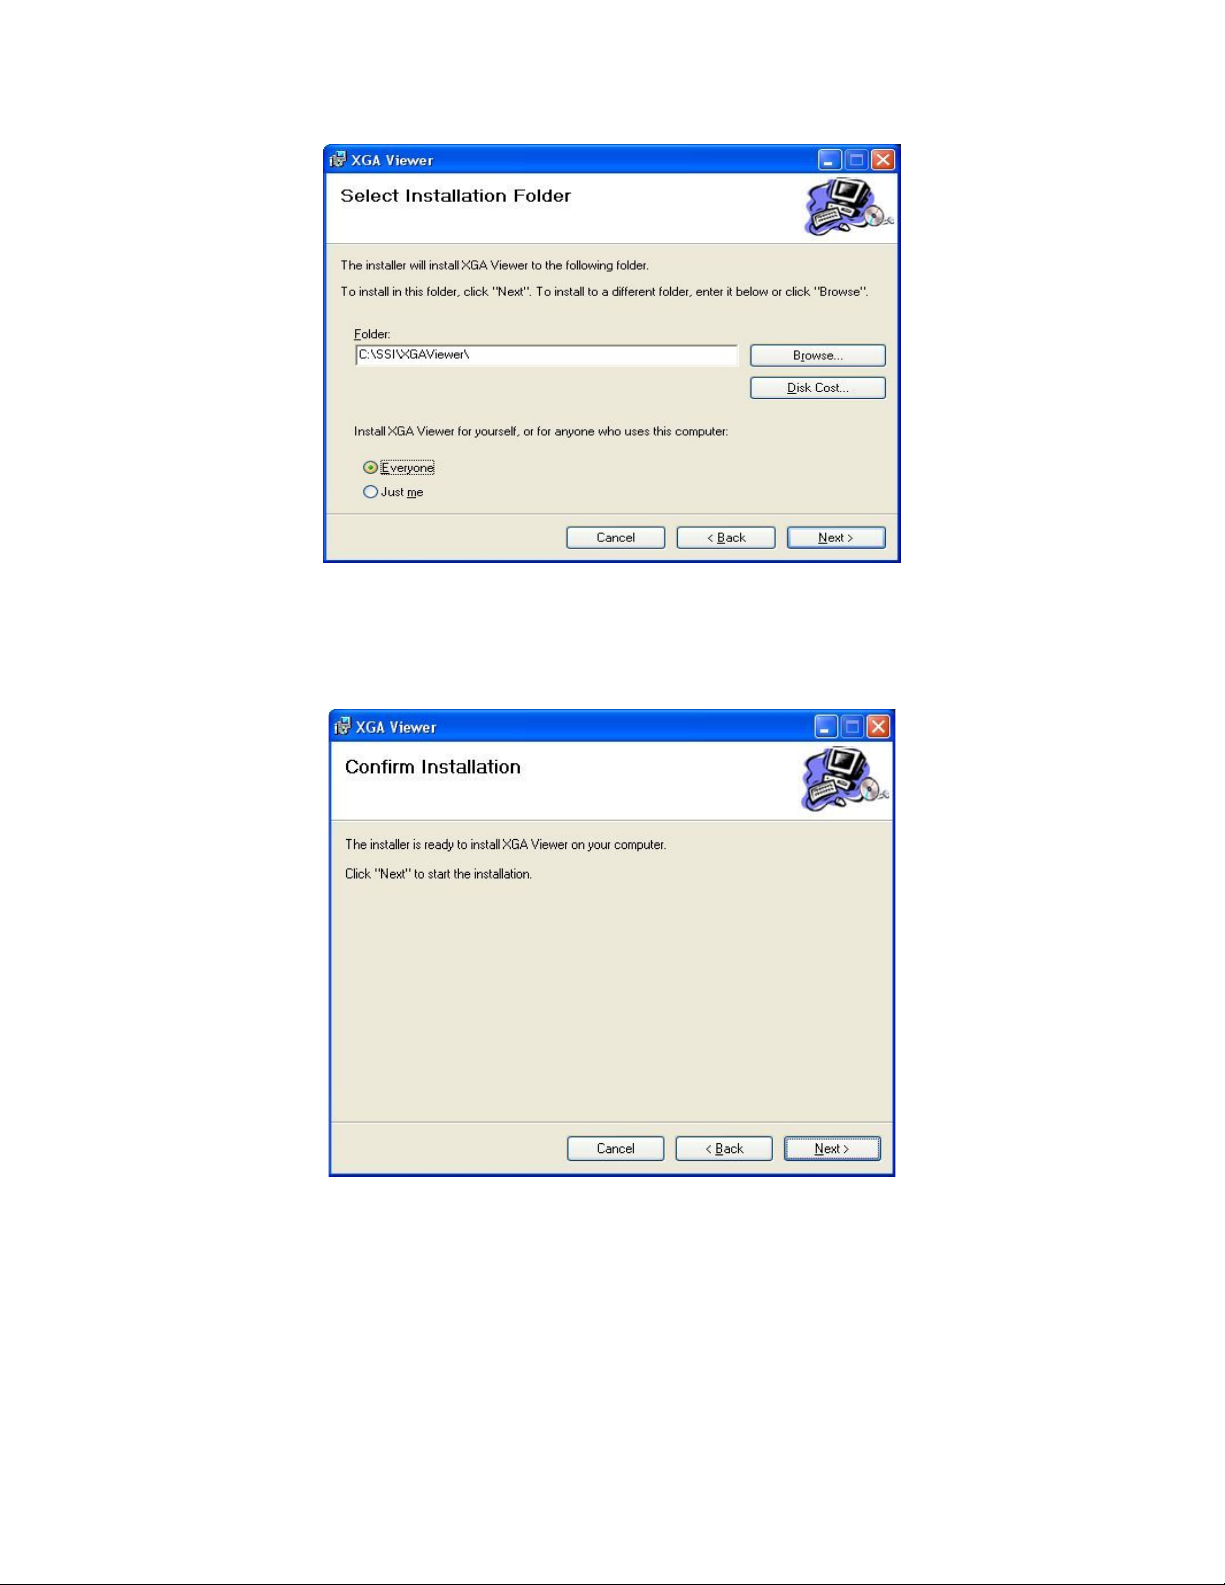
The second screen will allow the user to select the location for the installation of the software.
The default path is “C:\SSi\XGAViewer\”. To change this path, the user can either type in the
new path, or click on the
displayed. Clicking on the
button and select the new path from the dialog box that is
button will display all of the available hard drives –
network and local – and the amount of disk space available on each drive. This will allow the
user to determine if there is enough disk space available to install the software to another
location. The two options near the bottom right – “Everyone” and “Just Me” will allow the user
the option of installing the software for the user that is currently logged on to the target
computer (“Just Me”) or to install the software so that anyone logged on to the target computer
can access the software (“Everyone”). The
the
button will continue with the installation.
button will display the first screen again, and
Super Systems Inc. Page 6 of 46
Page 7
XGA Viewer Operations Manual
Figure 2 - Installation selection screen
< Back
Next >
Figure 3 - Installation confirmation screen
The third screen will allow the user to begin the installation. Clicking on the
display the second screen, and clicking on the
button will begin the installation of the
XGA Viewer software.
button will
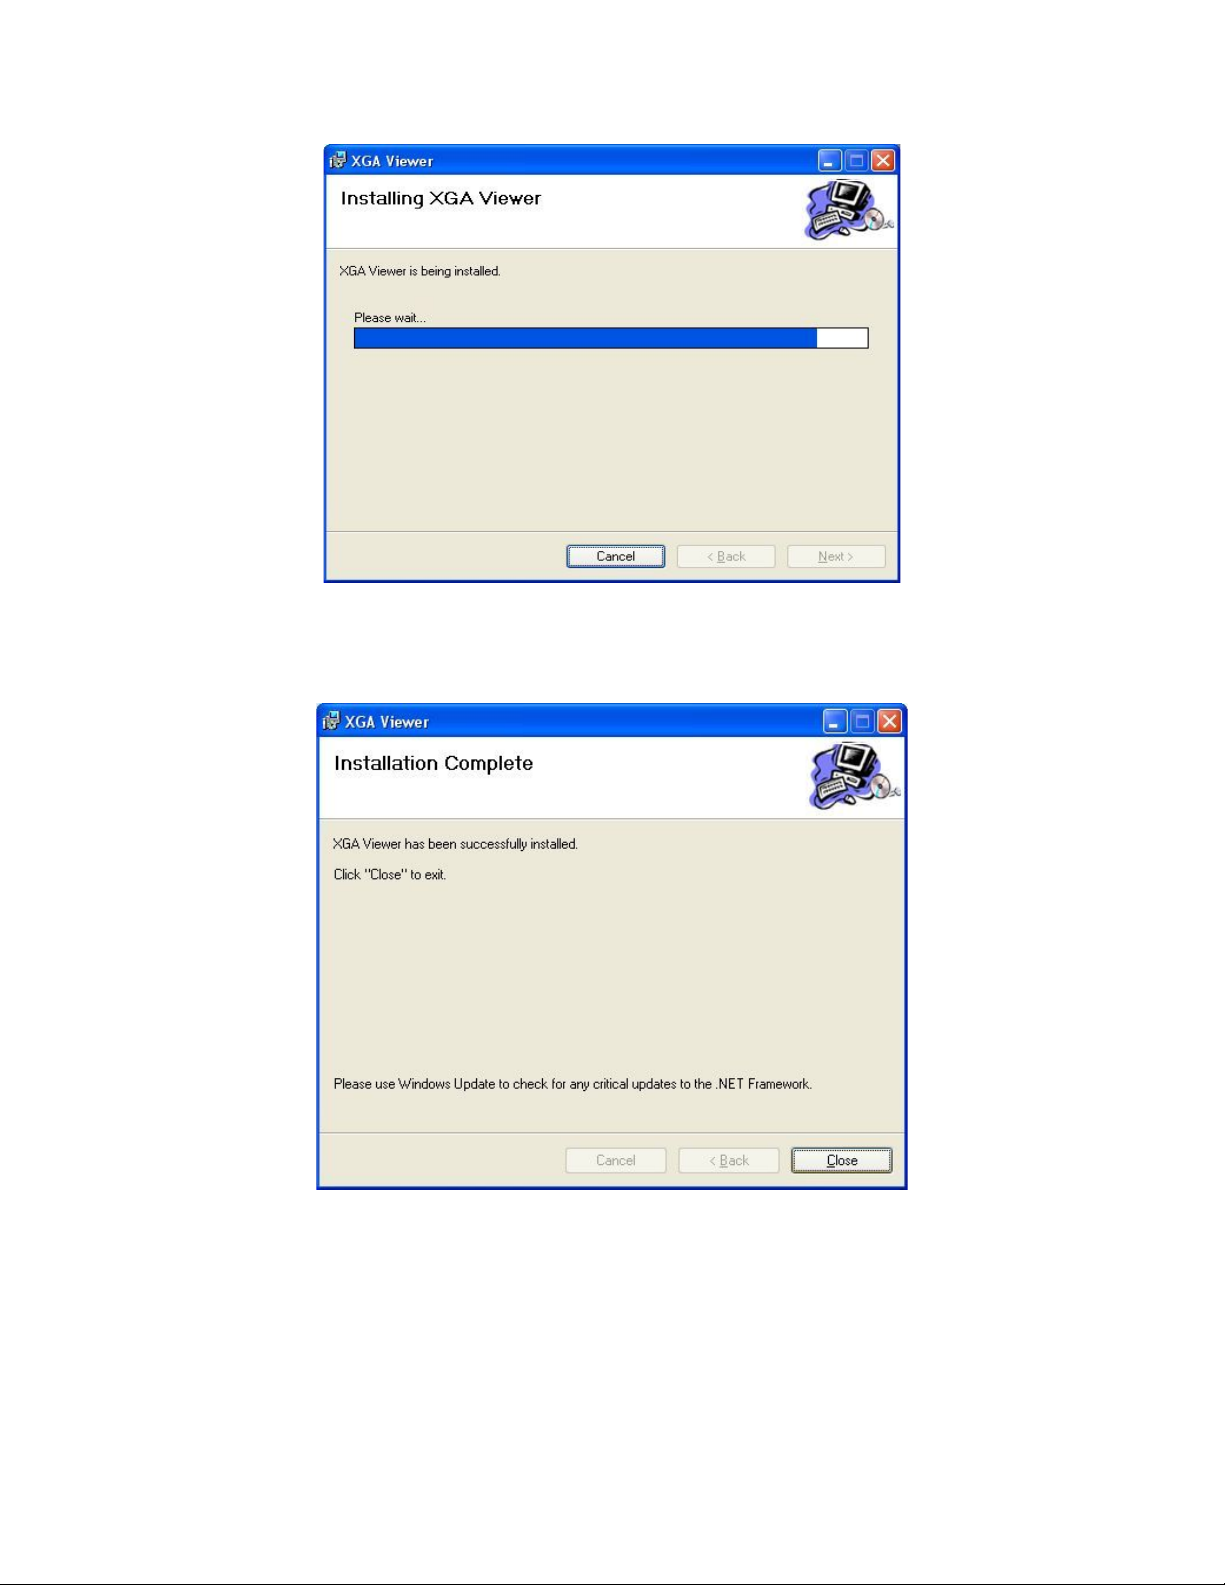
The next screen will display the progress of the installation. Once the installation has
completed, the final screen will be displayed.
Super Systems Inc. Page 7 of 46
Page 8
XGA Viewer Operations Manual
Figure 4 - Installation progress screen
Close
Figure 5 - Installation completion screen
Connecting the Computer to the Gas Analyzer (MGA or PGA)
Once the final screen is displayed, the XGA Viewer software has been installed and can be run at
any time. Click on the
button to close out the installation screen.
In order to be able to communicate with your analyzer, the computer where the XGA software is
installed must be connected to it via Ethernet with compatible TCP/IP settings. There are two
common configurations for accomplishing this: a USB connection, a direct connection with a
crossover cable, and plugging both the analyzer and the computer into a LAN. The crossover
cable and LAN methods require compatible TCP/IP settings.
Super Systems Inc. Page 8 of 46
Page 9
XGA Viewer Operations Manual
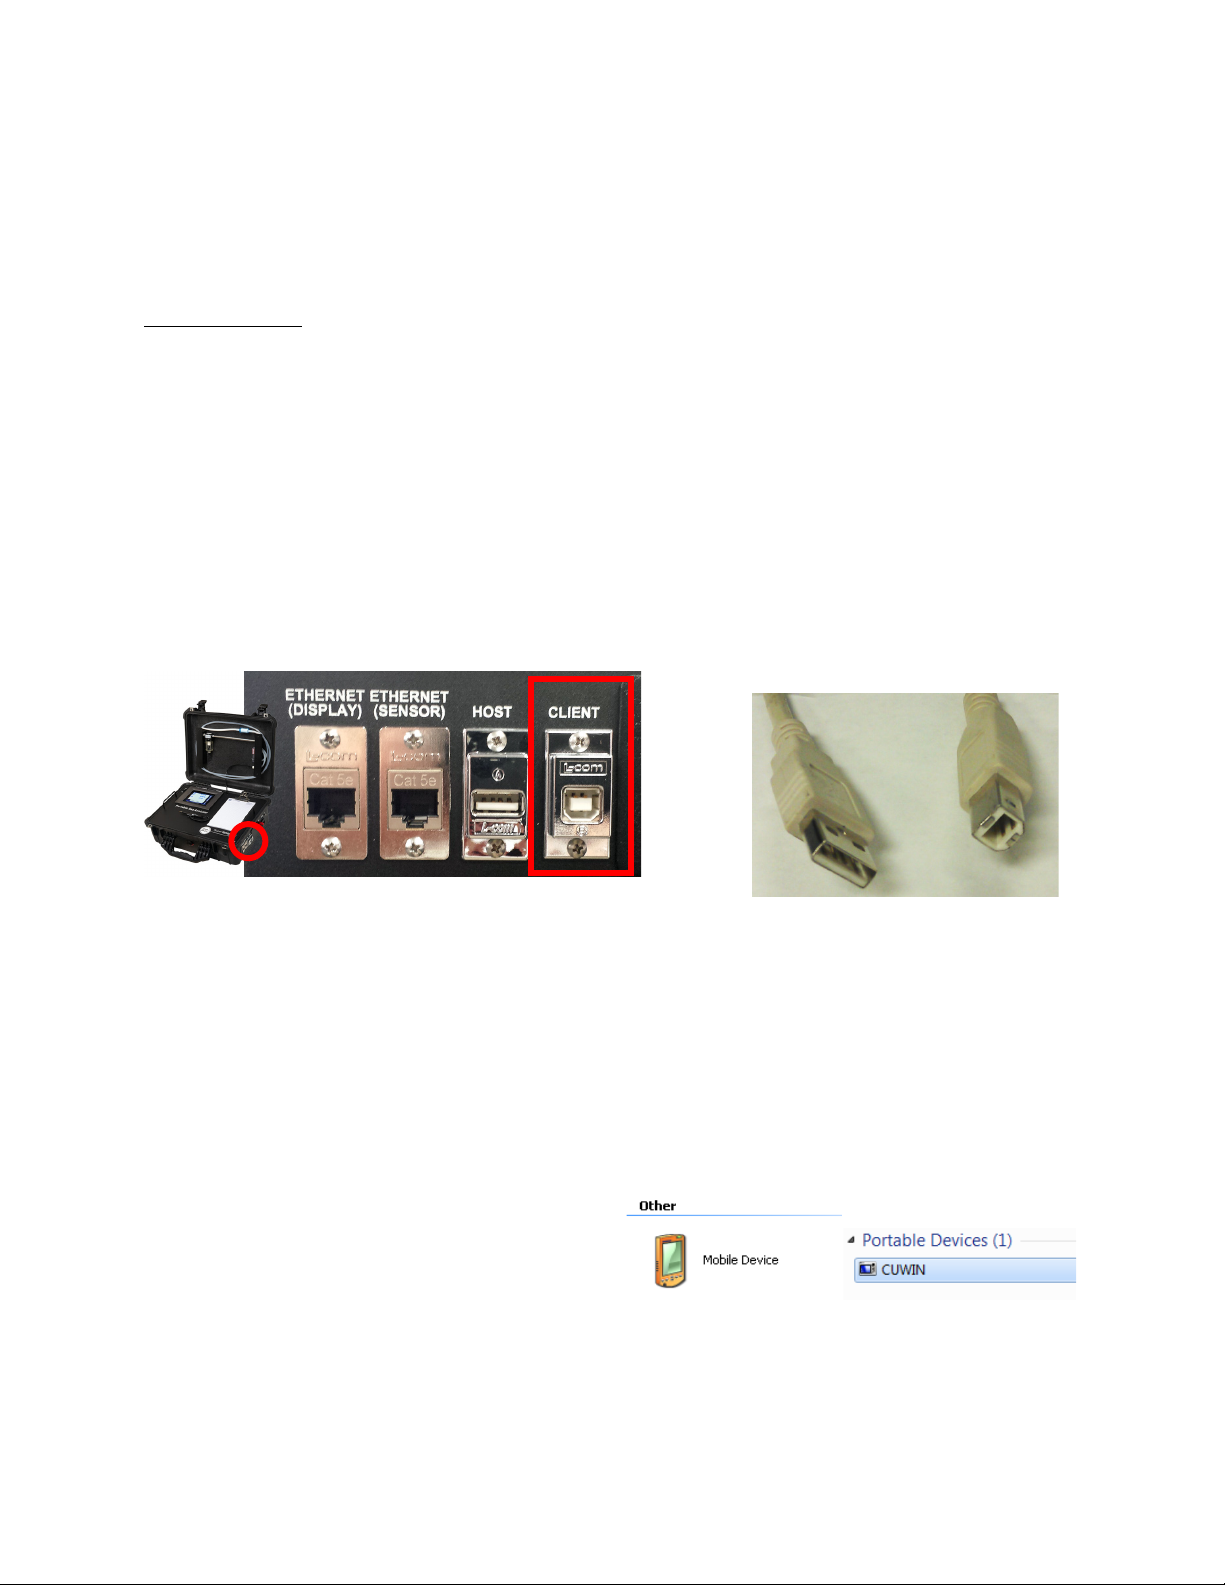
Figure 6 - Location of USB connection point for
connecting instrument to local computer
Figure 7 - USB connection types
Standard-A (left), Standard-B (right)
NOTE: If there is any question as to whether
Figure 8 - Device Icons in
Windows XP (left) and Windows Vista, 7, or 8 (right)
It is likely that some configuration to either the PC or the analyzer will be needed before a
connection can be established. If you are having troubles establishing a connection with a
crossover cable or using a LAN after reading the instructions for your configuration, see the
Troubleshooting Ethernet Connection Problems section of this manual.
USB Connection
The gas analyzer can be connected directly to a local computer using a USB cable. Windows
uses special software to transfer files and information between the data logger and the local
computer when connected via USB. If you are using Windows XP, this software is called
ActiveSync. If you are using Windows Vista, Windows 7, or Windows 8, the software is called
Mobile Device Center. If the required software was not installed prior to installing XGA Viewer,
the XGA Viewer setup utility (run from setup.exe) would have installed the required software.
To connect the gas analyzer to a local computer with USB, first make sure that the instrument
is turned on. Next, identify the USB connection point used to connect the data logger to the local
computer (Figure 6). To connect the data logger to the computer, you will need a USB cable with
cable ends that look like those in Figure 7.
Connect the instrument to the local computer via USB. If you are connecting the instrument to
the computer via USB for the first time, you may see a message on the screen saying that
Windows is installing drivers, especially on Windows Vista, Windows 7, and Windows 8. Windows
may also ask you if you want to set up the device. If this happens, allow Windows to install the
drivers, but close the device setup window from ActiveSync or Mobile Device Center.
the computer is detecting the data logger and
connecting to it properly, check the “My
Computer” window in Windows XP or the
“Computer” window in Windows Vista, 7, & 8.
The data logger should appear in this window
with a mobile or portable device icon, as
shown in
Figure 8. Other devices, such as
smartphones, may also appear as part of the
same list.
Super Systems Inc. Page 9 of 46
Page 10
XGA Viewer Operations Manual
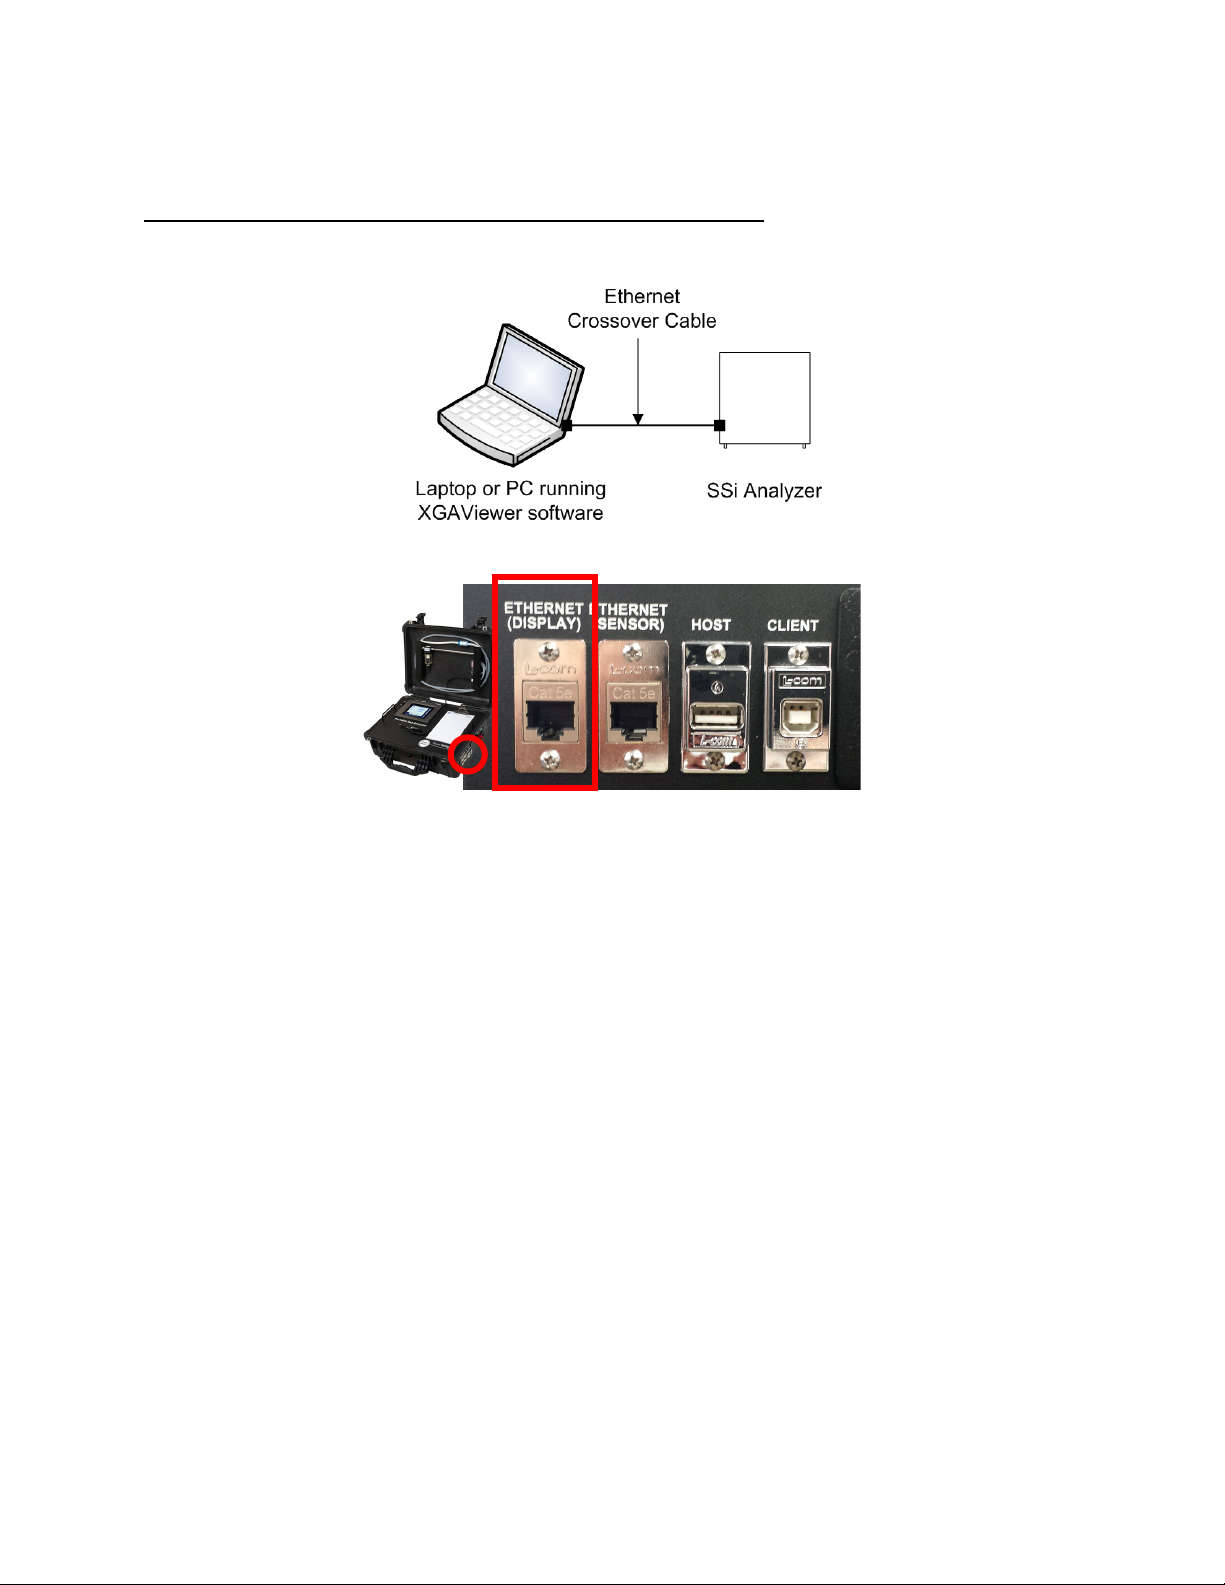
Figure 9 - Direct Connection with Ethernet Crossover Cable
Figure 10 - Location of Ethernet port for cable connection
Once the instrument is connected to the computer via USB, you may start XGA Viewer.
Direct Connection to Computer Using Ethernet Crossover Cable
With this configuration the laptop or PC is connected directly to the analyzer with an Ethernet
crossover cable.
NOTE: Some PGA units will have only one Ethernet port. If only one is available, use that one.
To get this configuration working correctly you must set the TCP/IP settings of both the analyzer
and the PC to be compatible. Below are our recommended settings for this TCP/IP v4:
On the analyzer:
• IP Address: 192.168.1.205
• Net Mask: 255.255.255.0
• Gateway: 192.168.1.1
Consult the manual for your analyzer for instructions on how to change these values. Also note
that the last number in the IP address can be different and does not need to be 205 – it just has
to be different than the computer. Also if you own more than one SSi analyzer, you may want to
configure each one to have a different IP Address by changing the last number (again, using the
TCP/IP v4 protocol as the example).
On the PC:
• IP Address: 192.168.1.100
• Net Mask: 255.255.255.0
• Gateway: 192.168.1.1
To set the IP address on your PC or laptop:
• Open the “Control Panel”
• Open “Network Connections”
Super Systems Inc. Page 10 of 46
Page 11
XGA Viewer Operations Manual
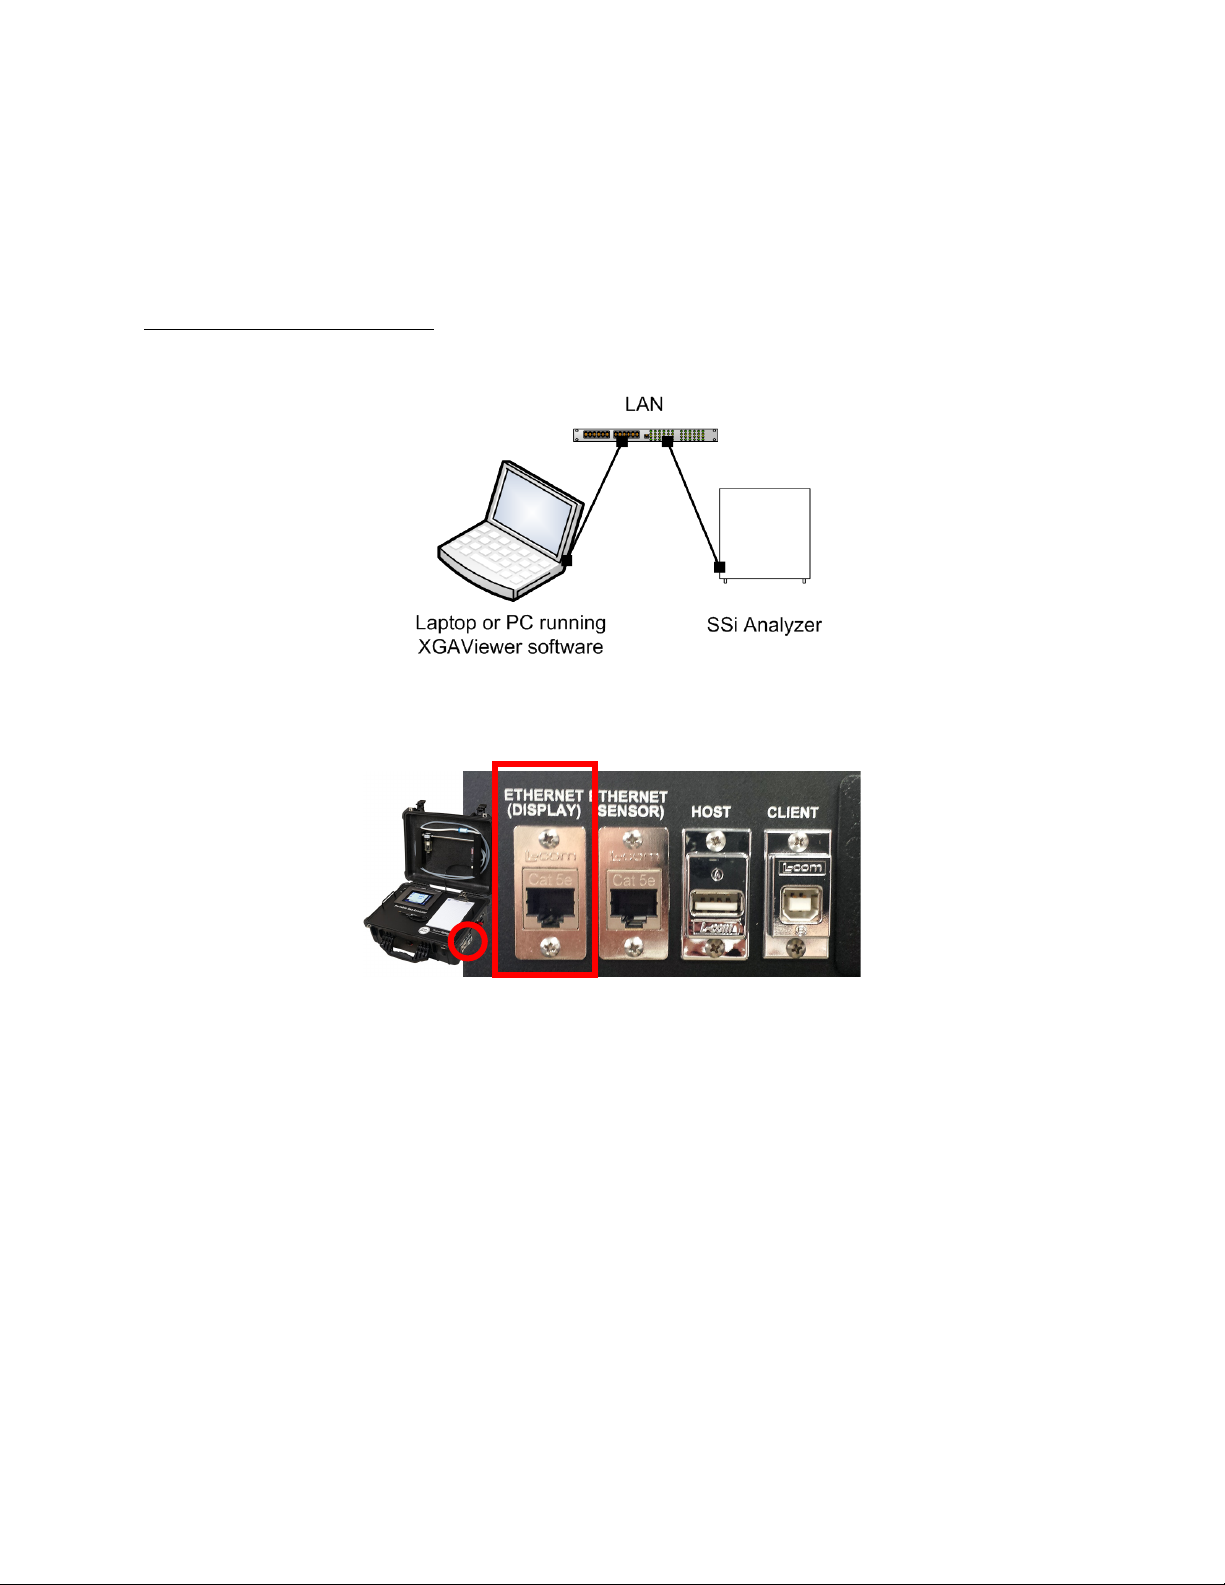
Figure 11 - Ethernet network connection
Figure 12 - Location of Ethernet port for cable connection
• Click “Local Area Connection” and choose “Properties”
• Select “Internet Protocol (TCP/IP)” in the list box and choose “Properties”.
On this screen you will need to choose the “Use the following IP address” option and enter the
values listed above. Be sure to confirm and close all dialogs after making your changes.
Ethernet Network Connection
Another common configuration is to have the PC/laptop connected to the same local area
network as the analyzer.
NOTE: Some PGA units will have only one Ethernet port. If only one is available, use that one.
To get this configuration working correctly you must set the TCP/IP settings of the analyzer to
be compatible with your network. Your PC should already be configured correctly.
Ask your IT department or network administrator for appropriate IP Address / Net Mask /
Gateway settings.
Super Systems Inc. Page 11 of 46
Page 12

XGA Viewer Operations Manual
Starting the Software
IMPORTANT!
setup.exe
XGA Viewer
Instrument
Download Data
Instrument
Mobile Device Center/ActiveSync, Microsoft .NET Framework 2.0 or higher, and SQL Compact
3.5 must be installed before XGA Viewer can be run. The
software will automatically install Mobile Device Center/ActiveSync, Microsoft .NET Framework
2.0 or higher, and SQL Compact 3.5 if needed. See the
Installation section for more information.
program that installs the
Note: The XGA Viewer software cannot be run without at least one PGA or MGA set up
software has never been run before, The XGA Viewer software will display the
Analyzers
information on how to set up an instrument through the software). If no instruments are set up
and the user closes down the
shut down. When the software is started back up again, the user will again be presented with
the
screen will no longer be displayed at start up.
When the SSi XGA Viewer software is first started, the screen that will be displayed will be the
Main screen.
screen (see the menu section Options Button→ Instruments Setup below for
Configure Analyzers
Configure Analyzers
screen. Once an instrument has been added, the
screen, then the XGA Viewer software will
Note: When the SSi XGA Viewer software is run for the very first time, the user
Configure
Configure Analyzers
. If the
will need to set up an instrument either as a PGA or an MGA before the Main screen will be
displayed. The software cannot run without at least one instrument set up. See the section
Instruments Setup
modify an instrument
down box, the user can begin to download the initial data from the device by clicking on the
take a few minutes to complete
downloading data from a device.
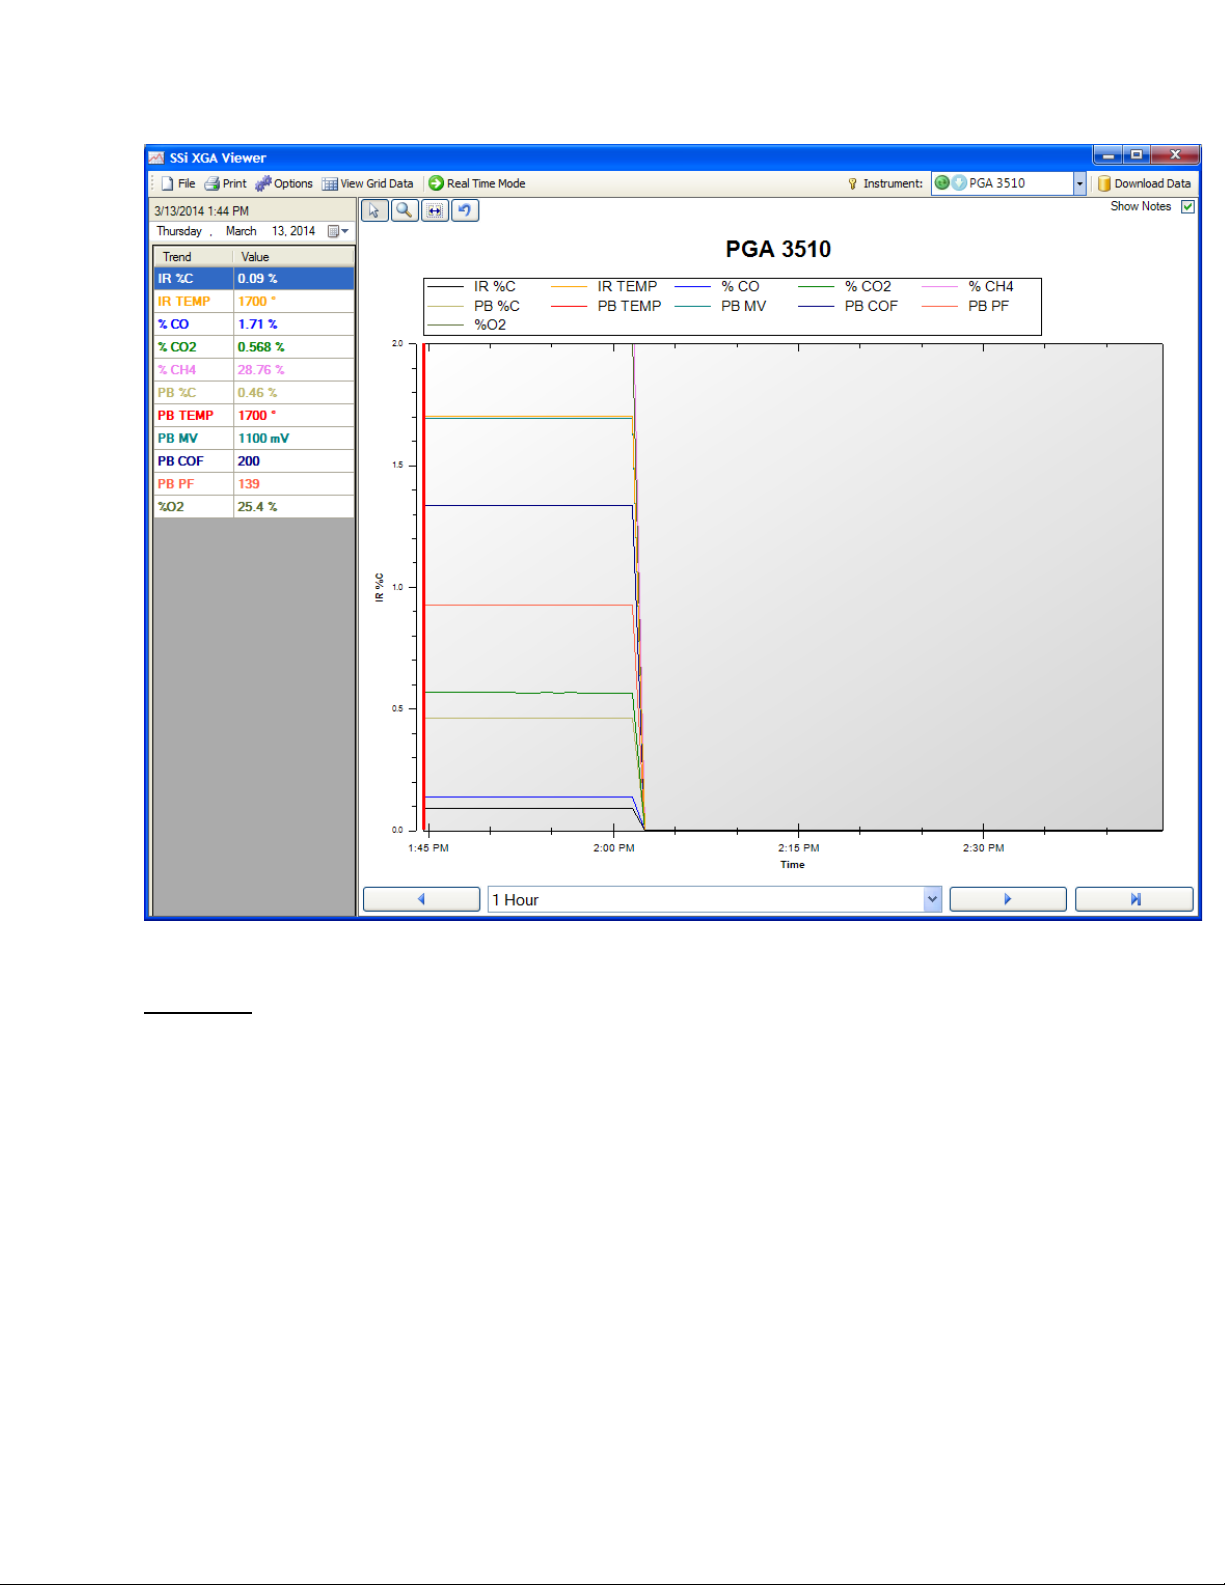
Figure 13
program can be found. Note the
and the green circle in that box. A green circle indicates an ActiveSync or Mobile Device Center
connection, while a blue circle indicates an Ethernet RPC connection.
shows the XGA Viewer chart screen, where most of the functions of the XGA Viewer
under the
. Once an instrument is set up and selected from the
button.
Options Button
section for more instructions on how to set up or
drop-
Note: If there is a lot of data to download, the download process may
. See the section Download Data Button for more information on
drop-down box in the top right corner of the screen
Super Systems Inc. Page 12 of 46
Page 13
XGA Viewer Operations Manual
Figure 13 - XGA Viewer chart screen
File Button
Save Graph Image As
This menu option will allow the user to save an image of the graph. Clicking on this menu
option will display a common Windows Save As dialog. The user will have to provide a name and
a location for the image, as well as select the type of image to save the graph as. There are five
options for image types: .png, .gif, .jpg, .tif, or .bmp.
Check for Software Updates
This menu option will check for any available updates to the SSi XGA Viewer software over the
Internet.
Updates
to the user asking for permission to install the update.
Super Systems Inc. Page 13 of 46
Note: An Internet connection must be available before the
menu option can be used
. If there is an update available, a message will be displayed
Check For Software
Page 14
XGA Viewer Operations Manual
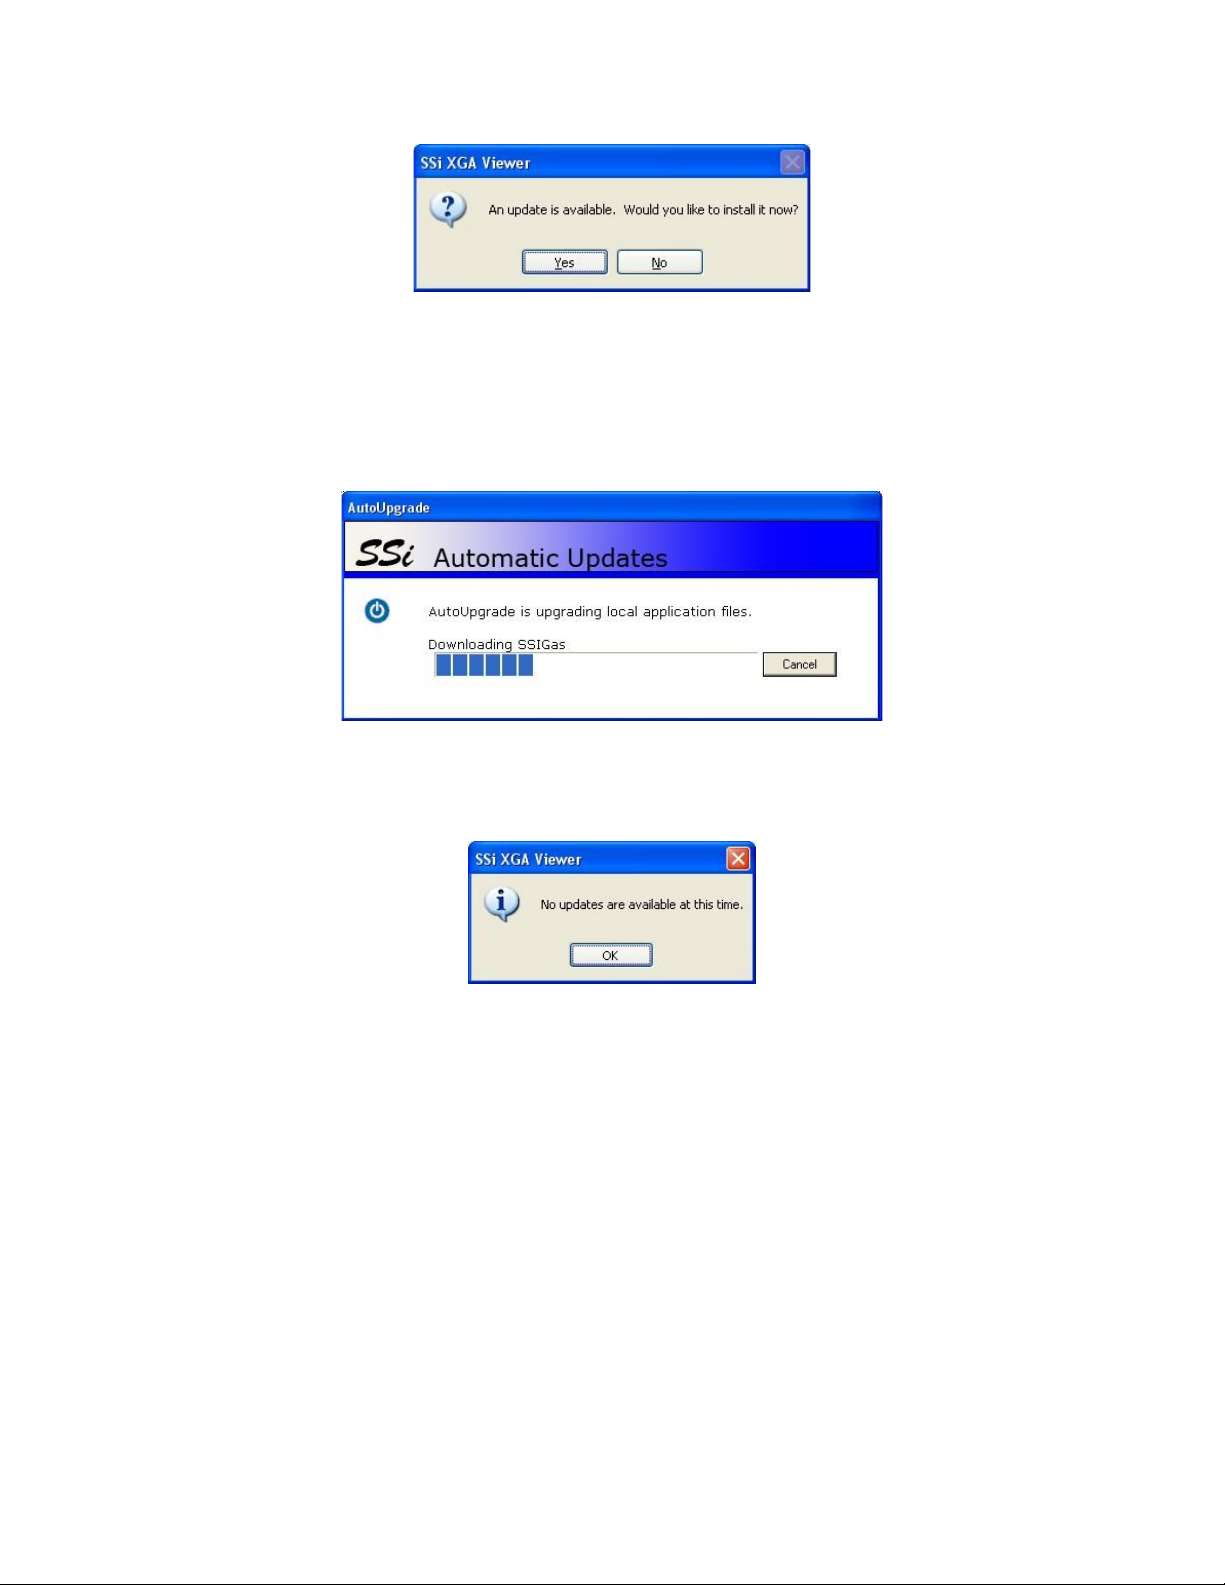
Figure 14 - "Update is available" box
Yes
Figure 15 - Upgrade progress box
Figure 16 - "No updates are available" box
Clicking on the No button will not update the software. Clicking on the
button will update
the software. Note: It is important to save any changes before updating the software. When
the update begins, the SSi XGA Viewer software will shut down and an update screen will be
displayed, detailing the progress of the update. Once the update is complete, the SSi XGA
Viewer software will restart.
If there is no update available, or if there is no Internet connection, the SSi XGA Viewer software
will display a message.
About
Selecting this option will bring up details on the version number and revision history of the
software.
Super Systems Inc. Page 14 of 46
Page 15

XGA Viewer Operations Manual
Figure 17 - "About" window
It is important to save any changes
before shutting the software down.
Exit
This menu option will exit the SSi XGA Viewer software.
Print Button
Print Chart
This Menu option will allow the user to print out the selected chart to a local printer or a printer
on a network.
Note: There must be at least one printer setup up on the computer running the SSi XGA Viewer
software in order to be able to print a chart
.
Print Preview Chart
This menu option will allow the user to see a preview of the chart before actually printing the
chart out.
Super Systems Inc. Page 15 of 46
Page 16

XGA Viewer Operations Manual
Figure 18 - Print Preview window
Print Notes
If there is more than one page to the report, the user can view each page by changing the
“Page” number in the top right of the screen. The printer button - - will print the to the last
printer used from the SSi XGA Viewer software. If nothing has been printed from the software,
the graph will print to the default printer set up on the local computer.
Print Notes
Selecting this menu option will bring up a Print dialog box from which you can print all of the
currently displayed
notes
on the XGA Viewer trend chart.
Print Preview Notes
This option will bring up a window to preview the printout session notes that will be printed
when
Options Button
is selected.
Instruments Setup
This menu option will allow the user to set up a PGA or MGA instrument for the SSi XGA Viewer
software. Clicking on this menu option will display the
the user can add, modify, or delete an instrument.
Super Systems Inc. Page 16 of 46
Configure Analyzers
screen, from which
Page 17

XGA Viewer Operations Manual
Figure 19 - Configure Analyzers window
Add
Figure 20 - Add New Instrument window
PGA
MGA
This screen will display all of the instruments that have been set up through the SSi XGA Viewer
software. The instrument’s Name, Serial Number, and IP Address will be displayed in the
“Configured Analyzers” area.
Add An Instrument
Click on the
button to add an instrument. This will display the
Add New Instrument
screen.
The instrument setup contains four fields:
• Instrument Name – This is the name for the instrument. This name will be the
referenced name for the instrument throughout the SSi XGA Viewer software.
• Serial Number – This is the serial number from the instrument. The serial number can
be found on the
About/Sign On
screen on both the PGA and the MGA (Menu Option 10).
• IP Address – This will be the IP address for the instrument. The IP address can be found
on the
Set IP Address
• Model – This is the model type of the instrument. The model can be either
screen on both the PGA and the MGA (Menu Option 26).
or
.
Super Systems Inc. Page 17 of 46
Page 18

XGA Viewer Operations Manual
Figure 21 - Scan window
very
Scan
Scan
OK
OK
Cancel
Remove
Properties
Save
Cancel
Save
Cancel
If all of the fields are known, the user can manually enter the information in. Note: Data from
the instrument is stored on the local computer by Serial Number, so it is
serial number entered is correct. However, the
will display any SSi instrument located on that network.
When the screen is first displayed, it will automatically begin a scan of the network. To
manually begin a scan of the network, click on the
make any changes to the software while a scan is in progress
few seconds.
Note: If there are any other SSi instruments located on the network being
link will scan the available network and
button.
Note: The user will be unable to
. A typical scan will only take a
scanned, such as a 9200 controller, these instruments will be displayed as well
desired instrument by clicking on that instrument (the selected instrument will be highlighted in
button. The fields from the
button to cancel the add process. The “Configured Analyzers” area
blue) and click on the
populated with the appropriate information. The Instrument name will be filled in unless the
user has inserted some text already. This name can be changed if desired. Once all four fields
are populated with the appropriate data, the user can click on the
instrument, or the
will be re-populated to reflect the changes.
Remove An Instrument
To remove an instrument from the SSi XGA Viewer software’s setup, select the desired
instrument from the “Configured Analyzers” list and click on the
delete the selected instrument from the software’s setup.
Add New Instrument
button to add the
Note: Removing an instrument will
not delete the actual logged data from the SSi XGA Viewer’s installation folder
important that the
. Select the
screen will be
button. This will
.
Modify An Instrument
To modify an instrument in the SSi XGA Viewer software’s setup, select the desired instrument
from the list and click on the
identical to the
information and click on the
the modification.
Once all of the necessary instruments have been added, deleted, or modified, click on the
button to save these changes, or click on the
Super Systems Inc. Page 18 of 46
Add New Instrument
button to save the information, or the
button. This will display the
screen in both form and function. Modify the desired
button to cancel all of the changes.
Properties
screen, which is
button to cancel
Page 19

Data Backup
Figure 22 - "Browser For Folder" window for Data Backup
Figure 23 - "Data Backup" options
Backup Data Now
XGA Viewer Operations Manual
This menu option will allow the user to back up the logged data from any instruments that have
been set up through the SSi XGA Viewer software to a central network location. Clicking on this
menu option will display the
Data Backup
screen, which will allow the user to set the backup
options for the logged data.
The
button acts as a run-once backup, which will back up all of the logged
data to a specified location only once. Once this button is clicked, the user will have to specify
the location for the backup of the logged data.
Super Systems Inc. Page 19 of 46
Page 20

XGA Viewer Operations Manual
OK
Cancel
OK
Cancel
Language
Figure 24 - Language selections
The user can select an existing location for the backup, or the user can create a new folder in a
specified location for the backup. Select the desired folder and click on the
the backup process, or click on the
clicked, the backup process will begin.
The “Automatic Backup” area will allow the user to set up the SSi XGA Viewer software to
automatically backup the logged data whenever the logged data is downloaded. Checking the
“Automatically Backup My Data After Every Download” checkbox will back up the logged data
every time the logged data is downloaded. The user must specify a location for the backup.
Note: If no backup location is provided, the backup will not take place
button to cancel the backup. Once the OK button is
. Click on the folder
button to start
browsing button, , to display the
location for the backup, or the user can create a new folder in a specified location for the
backup. Select the desired folder and click on the
the
button to not set the backup location.
Browse For Folder
screen. The user can select an existing
button to set the backup location, or click
Note: The user may see a DOS-style screen
while the logged data is downloading. This is normal and the DOS-style screen will close when
the backup has finished
.
Language
The
Viewer interface. These languages are English (en), Spanish (es), Portuguese (pt), Italian (it),
Japanese (ja), French (fr), Thai (th), and Chinese (zh).
option allows you to select among eight different languages to use for the XGA
View Grid Data Button
This menu option will allow the viewer to see the logged data in a tabular format, instead of in a
chart format.
The tabular data will appear on a separate screen. To close the grid view screen, click on the
red “X” - - in the top right of the screen.
Super Systems Inc. Page 20 of 46
Page 21

XGA Viewer Operations Manual
Figure 25 - Data Grid
Export
Export Button
The
data can be viewed as a separate file. The three formats are: CSV, TSV, and TXT. Clicking on
this button will display a sub-menu filled with the various export functions. Exporting the
tabular data to any format will require the user to give a file name and a location for the file in
the common Windows Save As dialog.
Data To CSV
This option will export the tabular data to a CSV (*.csv) format. CSV stands for Comma
Separated Values. A .csv file is typically viewed through a spreadsheet program, such as
Microsoft Excel, with each column in the tabular data corresponding to a column in the .csv file,
and each row in the tabular data corresponding to a row in the .csv file.
Data To TSV
This option will export the tabular data to a TSV (*.tsv) format. TSV stands for Tab Separated
Values. A .tsv file is typically viewed through a text-editing program, such as Microsoft’s
Notepad or WordPad, or Helios’ TextPad. Each column in the tabular data corresponds to a
button will allow the user to export the data to three different formats so that the
Super Systems Inc. Page 21 of 46
Page 22

XGA Viewer Operations Manual
Print
Print
Print
Real Time
Mode
Real
Time Mode
Download Data
column in the .tsv file separated by a tab, and each row in the tabular data corresponds to a row
in the .tsv file.
Data To TXT
This option will export the tabular data to a TXT (*.txt) format. TXT stands for text, and .txt files
usually contain no special formatting. A .txt file is typically viewed through a text-editing
program, such as Microsoft’s Notepad or WordPad, or Helios’ TextPad. Each column in the
tabular data corresponds to a column in the .txt file separated by a tab, and each row in the
tabular data corresponds to a row in the .txt file.
Print Preview Button
This menu option will display a print preview dialog identical to the
option from the
instead of the chart. The functionality of the print preview will be identical to the
print preview.
menu button, except that the print preview will be of the tabular data
Print Preview Chart
menu
menu’s
Print Button
This menu option will print out the tabular data, and the functionality is identical to the
functionality of the
data will be printed instead of the chart.
Real Time Mode Button
When the Real Time Mode is turned on, the SSi XGA Viewer software will automatically
download logged data every 60 seconds. When Real Time Mode is turned off, the
button will have a light blue background. When Real Time Mode is turned on, the
button will have an orange background and there will be a sixty-second countdown
Print Chart
menu option from the
menu button, except that the tabular
next to the button - - and the arrow buttons and chart interval drop-down
list will be disabled. Every time the countdown hits zero, the chart and the variables on the left
will be updated with the latest information. When the SSi XGA Viewer software is in Real Time
Mode, the
button is disabled.
Note: The SSi XGA Viewer software does not
automatically back up the logged data while it is in Real Time Mode. To back up the logged
data, Real Time Mode must be turned off
Instrument Menu Button
This menu option will allow the user to modify a template for the instrument that is selected in
the instrument drop-down list - , or modify the setup of the selected
instrument (PGA only).
.
Edit Template
This option will allow the user to modify the template that is used for the selected instrument.
Note: The template will vary depending on whether the instrument is a PGA or an MGA
Clicking on this option will display the
Edit Template
The
the trend and a description of the trend will be displayed. The user will be able to add, remove,
or modify existing trends.
screen will display all of the existing trends for the template. The name of
Edit Template
screen.
.
Super Systems Inc. Page 22 of 46
Page 23

XGA Viewer Operations Manual
Figure 26 - "Edit Template" window
Add…
Remove
Properties
Add A Trend
Click on the
the bottom of the list and the name will be “NEW_TREND” with a description of “New Trend”.
button to add a new trend to the template. The new trend will be displayed at
Note: Adding a new trend will simply add the default information. Once the trend is added, the
user will have to modify the trend to get the relevant information to display on the chart
the section Modify A Trend in this section of the manual for more information on how to modify
the trend once it is created.
Remove A Trend
To remove a trend from the template’s setup, select the desired trend from the list and click on
the
Modify A Trend
To modify a trend in the template, select the desired trend and then click on the
button. This will display the
There are four tabs on the Edit Trend screen:
• General – This tab contains general information about the trend, such as name,
• Formatting – This tab contains information about the formatting of the trend, such as the
• Data – This tab contains information about where the data for the trend is coming from.
• Advanced – This tab contains advanced information, such as using an algebraic
button. This will delete the selected trend from the template’s setup.
Edit Trend
description, etc.
units, decimal places, etc.
expression to format the data.
screen with the
General
tab displayed.
. See
Super Systems Inc. Page 23 of 46
Page 24

XGA Viewer Operations Manual
Figure 27 - "Edit Trend" window – General tab
0
General Tab:
The “Trend Name” will be the name for the trend. This is how the trend will be identified on the
chart, tabular data, and any printed material. The name should be both short and descriptive.
The “Trend Description” will be a brief description of what the trend is. This will be displayed on
Edit Template
the
screen. The description, like the name, should be both short and descriptive
of the trend.
The “Enable this trend” checkbox will enable the trend, which means that the SSi XGA Viewer
software will begin to display the data logging for that value.
logged all of the time, but the user can decide which to display and which to not
Note: All of the variables are
.
The “This trend may be viewed on the chart” checkbox will allow the trend to be viewed on the
chart display.
Formatting Tab:
The “Units” will be the display units for the trend. This could be a % for a gas trend, such as
%C, or it could be °F or °C for a temperature trend.
The “Decimal Places” will be the number of decimal places to display on the trend. This value
can range anywhere from
to 4 decimal places displayed.
The “area” section will set up how the trend is displayed on the chart. The “Color” will be the
color of the trend line and trend information displayed on the left of the screen. The “Chart
Min” will be the minimum value for the range of the chart. The “Chart Max” will be the
maximum value for the range of the chart.
Super Systems Inc. Page 24 of 46
Page 25

XGA Viewer Operations Manual
Figure 28 - "Edit Trend" window - Formatting tab
Data Tab:
Note: Each trend value has a specific location in the data log files. Do not modify any of these
values without first contacting Super Systems Inc
.
The “Channel” will be the specific channel to pull the data from.
The “Slot” will be the specific slot to pull the data from.
The “Decimal Places” will be the number of source decimal places for the logged data.
Super Systems Inc. Page 25 of 46
Page 26

XGA Viewer Operations Manual
Figure 29 - "Edit Trend" window - Data tab
0
0
Advanced Tab:
The “Expression” will be an algebraic expression that can be used to translate the data. Use an
“x” to represent the data in the equation. For example, to subtract 100 from the values, use the
following expression: “x – 100”. With this example, a value of 1700 °F will be displayed as 1600
°F.
The “Special Values” will display the specified values (“Message”) when the current value
(“Data”) is present. A common use for the special values is when the value reaches
. The
“Data” would be 0, and the “Message” would be “----”, which means that whenever that trend
had a value of
, the trend’s display on the left of the screen would display a line of dashes. The
“Message” field can contain either numbers or text.
Super Systems Inc. Page 26 of 46
Page 27

XGA Viewer Operations Manual
Figure 30 - "Edit Trend" window - Advanced tab
Download Data
NOTE:
Add…
PGA Setup
Note: The operator will need to download data from the PGA using the
before the PGA Setup menu can be used. See the
information on downloading the data from the instrument
The PGA Setup menu will allow the user to set up the variables that will help define a session on
the PGA. Depending on the PGA unit that you have, there will be several tabs associated with
the PGA Setup.
Older style PGA units (i.e., PGA3500) will have these tabs:
• Site Names
• Equipment Types
• Equipment Names
• Operators
• Notes
Newer style PGA units (i.e., PGA3510) will have only Equipment Types, Equipment Names, and
Operators.
Site Names:
(
The site names will include any site or location where the PGA or MGA will be used. A “site” can
be a city, state, building, or even a section of a building. To add a site name, enter the new site
name in the text box and click on the
This tab is associated only with older style PGA units, such as the PGA3500.)
button. To remove a site name, select the site name
Download Data Button
.
section below for
button
Super Systems Inc. Page 27 of 46
Page 28

XGA Viewer Operations Manual
Remove
Figure 31 - "PGA Setup" window – Site Names tab
Add…
Remove
from the list and click on the
names.
button. There can be a maximum of sixteen (16) site
Equipment Types:
The equipment types will list the different types of equipment, such as furnaces or generators,
that the PGA or MGA will be used on. To add an equipment type, enter the new equipment type
name in the text box and click on the
equipment type from the list and click on the
button. To remove an equipment type, select the
button. There can be a maximum of
sixteen (16) equipment types.
Super Systems Inc. Page 28 of 46
Page 29

XGA Viewer Operations Manual
Figure 32 - "PGA Setup" window - Equipment Types tab
Add…
Remove
Equipment Names:
The equipment names will list the names of any of the equipment types. For instance, if there
are two batch furnaces, the “Equipment Types” will have “Batch Furnace”, but the “Equipment
Names” will have “FCE 1” and “FCE 2”. To add an equipment name, enter the new equipment
name in the text box and click on the
equipment name from the list and click on the
button. To remove an equipment name, select the
button. There can be a maximum of
sixteen (16) equipment names.
Super Systems Inc. Page 29 of 46
Page 30

XGA Viewer Operations Manual
Figure 33 - "PGA Setup" window - Equipment Names tab
Add…
Remove
Operators:
The operators tab will list any operators that would be starting a session on the PGA. To add an
operator, enter the new operator in the text box and click on the
operator, select the operator from the list and click on the
button. To remove an
button. There can be a
maximum of sixteen (16) operators.
Super Systems Inc. Page 30 of 46
Page 31

XGA Viewer Operations Manual
Figure 34 - "PGA Setup" window - Operators tab
NOTE:
Add…
Remove
Notes:
(
This tab is associated only with older style PGA units, such as the PGA3500.)
The notes will list any notes that the user would like to include during a session on the PGA,
such as “Door Open” or “Possible Air Leak”. To add a note, enter the new note in the text box
and click on the
button. There can be a maximum of sixteen (16) notes.
button. To remove a note, select the note from the list and click on the
Super Systems Inc. Page 31 of 46
Page 32

XGA Viewer Operations Manual
Figure 35 - "PGA Setup" window - Notes tab
Save and Upload to Instrument
Upload Database
Figure 36 - "Failed to upload" box
Saving Changes To The Setup
To save any of the changes that have been made, click on the
button (PGA3500) or the
button (PGA3510). If there is a problem with the save,
there will be an error message displayed.
If the save completed successfully, there will be a message letting the user know that the items
were uploaded and that the power to the PGA will need to be cycled before the changed can take
effect.
Super Systems Inc. Page 32 of 46
Page 33

XGA Viewer Operations Manual
Figure 37 - Successful upload
Cancel
Cancel
Canceling Changes To The Setup
To cancel any changes made to the setup, click on the
Download Data Button
This menu option will allow the user to download the logged data from the selected instrument
in the instrument drop-down list - . Clicking on this button will display
the
Downloading Data
logged data immediately
When the
instrument. Once connected, it will determine how many new files are present, and then it will
begin to download each file to the instrument’s folder on the local computer.
Downloading Data
screen.
.
screen is first displayed, it will attempt to connect to the
Note: Once the screen is displayed, it will begin to download
button.
Note: Each
instrument’s folder on the local computer is named by the instrument’s serial number
Downloading Data
the top of the screen. Each file being downloaded will be displayed on the screen as well. A
white circle with an arrow - - means that the file is being downloaded. A green circle with a
check mark - - means that the file has been downloaded. The status of the download will be
displayed above the progress bar during the download process. If there is an error during the
download or the SSi XGA Viewer software cannot connect to the instrument, there will be a red
circle with a white x - - detailing the error. If the user wishes to have the
screen automatically close when the downloading process is finished, click on the “Close this
dialog when downloading is complete” checkbox. If this checkbox is not checked, the user will
have to manually close the
screen will display the progress of the download through a progress bar at
Downloading Data
Downloading Data
screen by clicking on the
button, or by
. The
clicking on the red X in the top right of the screen - .
Super Systems Inc. Page 33 of 46
Page 34

XGA Viewer Operations Manual
Figure 38 - "Downloading Data" window
SSi XGA Viewer Main Screen Overview
Figure 39 - XGA Viewer Main Screen Components
A) Current Time of Cursor – This will display the date/time that the cursor is displayed at
on the chart. The date/time displayed will update as the cursor is moved along the chart
interval’s time period (X-axis).
Super Systems Inc. Page 34 of 46
Page 35

XGA Viewer Operations Manual
a. 1 Hour
b. 2 Hours
c. 4 Hours
d. 8 Hours
e. 12 Hours
f. 1 Day
g. 2 Days
h. 4 Days
i. 1 Week
Figure 40 - Trend Values Context Menu
B) Trend Values – This will display all of the selected trend data points at the specified time
(cursor position).
C) Test Sessions – These are any test sessions that have been performed on the selected
instrument (PGA only).
D) Chart Cursor – The chart cursor is the vertical red line on the chart. This is the cursor
that will allow the user to view the trend data points for a specific date/time. Unless
moved by the user, the cursor is located at the left of the chart.
E) Chart Interval – This is the range for the time period (X-axis) for the chart. The options
for the interval are:
F) Go To Current Date/Time – This will allow the user to display the current date/time’s
data. Clicking on this button once will display the most recent
The left and right arrow buttons next to the chart interval will move the chart either backward
or forward by the selected interval, which will allow the user to view previous data logged data
at the selected interval.
Trend Values Context Menu
If the user right-clicks on any of the trend values (Item B above), a context menu will be
displayed.
downloaded
data.
View Statistics
The
View Statistics
selected trend value.
Trend Analysis
The
Super Systems Inc. Page 35 of 46
menu option will allow the user to view some basic statistics about the
screen contains five statistics that can be viewed.
Page 36

XGA Viewer Operations Manual
Figure 41 - Trend Analysis window
Properties
• Data Points – This is the number of data logged data points for the specific trend. These
data points are dependent on the chart interval time framed chosen (Item E from above).
For example, if the chart interval is 1 hour, then the number of data points would be 61.
If the chart interval is 4 hours, then the number of data points would be 241.
• Minimum – This is the lowest value that the specific trend reached within the selected
chart interval time frame.
• Maximum – This is the highest value that the specific trend reached within the selected
chart interval time frame.
• Average – This is the average value for the specific trend value within the selected chart
interval time frame. All of the trend’s data points are added up and divided by the
number of data points to determine the average trend value.
• Std. Deviation – This is the standard deviation for the specific trend value within the
selected chart interval time frame. The standard deviation is a statistical value that
determines how far from the average value each data point value was.
Show On Graph
This option will allow the user to view the specific trend value on the graph, or remove the trend
value from the graph. If the trend value is viewed on the graph, there will be a check mark next
to the
be a check mark next to the
Show On Graph
on the graph, that trend’s values will still be displayed on the left of the screen (Item B from
above)
.
menu option. If the trend value is not viewed on the graph, there will not
Show On Graph
menu option.
Note: If the trend value is not viewed
Properties
This option will allow the user to modify the specific trend’s properties, such as the formatting,
or the name. This menu option will actually just display the
section above) for the specific trend. Clicking on the
clicking on the
section above).
Graph Manipulation Buttons
button from the
Edit Template
Properties
screen (Instrument Menu Button
Edit Trend
menu option is the same as
screen (Modify A Trend
Cursor Button -
The cursor button will display the arrow cursor on the graph. This acts as the default setting for
the graph and does not manipulate or change the graph in any way, but it will allow the user to
move the graph’s cursor.
Super Systems Inc. Page 36 of 46
Page 37

XGA Viewer Operations Manual
Figure 42 - Zoom window
Figure 43 - Test Sessions shown
Figure 44 - Test Sessions hidden
Zoom Button -
The zoom button will allow the user to zoom in on a portion of the graph. To zoom in on a
portion, click on the zoom button. The user will need to set the boundaries of the zoom by
clicking on an area of the graph and dragging the cursor to include all of the desired area. Once
this is done, the graph will display the new area and the graph will go back to cursor mode.
Pan Button -
The pan button will allow the user to pan, or move, the chart’s display forward or backward
along the x-axis (time) or up or down along the y-axis (trend minimum and maximum). This
feature is useful when the user wants to view trend data in the past, or to view a trend line on
the chart that exceeds the chart’s current maximum value. The chart will stay in pan mode until
the user changes the mode to one of the other options.
Restore Button -
The restore button will undo any of changes made to the graph and re-display the default view.
Sessions
Super Systems Inc. Page 37 of 46
Page 38

XGA Viewer Operations Manual
Hide
Sessions
Figure 45 - Trend Chart and Test Sessions displayed on same screen
Any sessions performed on the PGA can be downloaded and viewed through the XGA Viewer
software. A session will allow the user to identify the operation of the PGA and break all of the
logged data into manageable sections. Once a session has been performed on the PGA and
downloaded to the XGA Viewer software, the Test Session button will be displayed at the top of
the graph. Clicking on this button will display the sessions that have been performed on the
PGA, as well as changing the text on the button to “Hide Sessions”. Clicking on the
button will hide the sessions again.
Note: A session does not need to be completed before it can be downloaded and viewed with
the XGA Viewer software
• Start – The date/time the session was started
• End – The date/time the session was ended
• Site – The site of the session
• Equipment Type – The type of equipment for the session
• Equipment Name – The name of the equipment for the session
• Test Number – The number assigned to the session
• Operator – The operator who performed the session
For a more detailed explanation about sessions, see the Instrument Menu Button→ PGA Setup
menu section above. Double-clicking on a session record will re-size the graph’s x-axis to start
at the session’s start time and end at the session’s end time. Any notes entered during the
session will be displayed on the graph as well. To hide the note, uncheck on the “Show Notes”
check box in the top right corner of the graph. Checking the check box will show the notes on
Super Systems Inc. Page 38 of 46
. The parts of a session displayed on the XGA Viewer are:
Page 39

XGA Viewer Operations Manual
Troubleshooting Ethernet Connection Problems
Figure 46 - "Run" dialog box
the graph again. The session’s start and stop time will be noted on the graph. Clicking on the
arrow buttons at the bottom of the graph will essentially take the graph out of “Session” view
and hide any visible notes.
This section includes a list of tools and recommendations to use when diagnosing connection
problems.
Compatible IP Address
The most common reason for lack of communication between the software and the analyzer is
incorrect TCP/IP settings. The first thing you should do is find out what the IP address is for
both the laptop/PC and the analyzer.
Finding the IP Address of the analyzer:
• Look in the menu system for your particular product for the IP Address. If you have
trouble finding it, consult your user manual.
Finding the IP Address of the PC:
• Go to Start->Run and enter “CMD” to get to the command prompt
• At the command screen, type “IPCONFIG” and press enter. This will display your
current TCP/IP settings. More than one adapter may appear – you’re looking for the IP
Address of the “Local Area Connection”.
Super Systems Inc. Page 39 of 46
Page 40

XGA Viewer Operations Manual
Figure 47 - IPCONFIG IP configuration output
Typically this means that the first three numbers match up, and the
forth number is different.
Figure 48 - PING output
Once you have the IP Address for the PC/Laptop you should compare them and verify that the IP
Addresses are compatible.
Pinging the Instrument
Once you have verified that the IP Addresses are compatible you should try to ping the
instrument.
How to ping the instrument:
• Go to Start->Run and enter “CMD” to get to the command prompt
• Type “PING 192.168.1.205” at the command prompt, substituting the IP Address with
that of your instrument. In the example below, an which had an IP address of
192.168.1.234 was being pinged.
This represents a successful ping attempt. Once we can ping the instrument the XGAViewer
software usually does not have any problems communicating with it.
Super Systems Inc. Page 40 of 46
Page 41

XGA Viewer Operations Manual
Ping Request Timeout
If you fail to get at ping response and instead get “Request timed out” messages, you should
consider the following as they are common causes for communications problems:
• Recheck the physical connections – make sure all Ethernet wires are good and
completely plugged in
• Disable any firewalls or antivirus software. Once you determine a particular firewall or
anti-virus program is preventing communications you can figure out how to make an
exception within the program for the XGAViewer software so that you can keep it
running.
Further suggestions if the previous are not successful:
• If you are trying to connect over a LAN, consider trying the direct connection with a
crossover cable and configuring a static IP address for your computer/laptop. See
“Direct connection with a crossover” in this manual for more detailed instructions.
• If you are going through a router or hub, cycling the power to it may fix the problem
• Consider attempting to connect with a different PC or Laptop. This may help narrow
down the issue.
If you are unable to resolve the issue, please call Super Systems at 513-772-0060 for further
support.
Super Systems Inc. Page 41 of 46
Page 42

Revision History
Revision
Level
Description
Date
MCO #
-
Initial Release
01/14/2008
N/A
A
Added “Connecting to your Analyzer”
Framework 2.0” section
06/19/2008
2069
B
Revised manual for software updates to
6/20/2014
2106
XGA Viewer Operations Manual
section; Added “Troubleshoot Connection
Problems” section; Added note to
“Installing the XGA Viewer Software”
section; Added the “Overview” section;
Added note to “Checking for Microsoft .NET
XGA Viewer, including compatibility with
newer instrumentation
Super Systems Inc. Page 42 of 46
Page 43

XGA Viewer Operations Manual
Appendix 1: PGA3500/MGA6000 – Template Channel 1 Data Definitions
Slot Name Description
Src
Dec
Disp
Dec
Units
Min Max Exp
0
IR %C
% Carbon as
with IR Temperature
2 2 %
0.00
2.00
None
1
IR TEMP
Temperature of the
0
0
°F or
°C
0
2000
None
2
% CO
Measured % Carbon
Monoxide
2 2 % 0 25
None
3
% CO2
Measured % Carbon
Dioxide
4 3 % 0 2
None
4
% CH4
Measured % Methane
/ Natural Gas
2 2 % 0 25
None
5
PB %C
% Carbon as
controller
2 2 %
0.00
2.00
None
6
PB TEMP
Temperature of the
0
0
°F or
°C
0
2000
None
7
PB MV
Millivolts from the
probe
0 0 MV 0 1300
None
8
PB COF
CO Factor in the
controller
0 0 None
0
300
None
9
PB PF
Process Factor in the
controller
0 0 None
0
300
None
10
% O2
Measured % Oxygen
sensor
1 0 % 0 25
None
This section will display the channel 1 data definition variables for the PGA3500 and MGA6000
templates that are used in the XGA Viewer software. This section is meant to be a reference for
users.
be used
values in light gray apply only to the PGA template. Each trend value has nine main points:
Note: These values are only suggested values, but it is recommended that these values
. The trend values in light blue apply to both the PGA and MGA template, while the trend
• Slot – The slot that the trend value will be located in
• Name – The name of the trend value
• Description – A description of the trend value
• Src Dec – The number of decimals that the source value has
• Disp Dec – The number of decimal places to display
• Units – This will be the units the value will be representing, such as % or °F/°C
• Min – This is the suggested chart y-axis minimum value
• Max – This is the suggested chart y-axis maximum value
• Exp – This can be an expression to view the data
computed by CO,
CO2, and CH4 values
gas in the furnace
computed by the
atmosphere
probe
Super Systems Inc. Page 43 of 46
atmosphere
atmosphere
from electrochemical
Page 44

XGA Viewer Operations Manual
Slot Name Description
Src
Dec
Disp
Dec
Units
Min Max Exp
11
FLOW
Flow Rate
0 0 SCFH
N/A
N/A
None
12
IR
FACTOR
IR Adjustment Factor
0 0 None
N/A
N/A
None
13
CH4
FACTOR
CH4 Adjustment
Factor
0 0 None
N/A
N/A
None
14
% H2
Measured %
Hydrogen
2 2 % 0 50
None
15
4-20 IN
Measured value of 420 mA user input
0 0 Varie
s
0
100
4=0, 20=100
18
PRESSUR
Gas Pressure in
2 2 kPa
Varie
Varies
None
19
SUGG
COF
Suggested CO Factor
0 0 None
0
300
None
20
SUGG PF
Suggested Process
Factor
0 0 None
0
300
None
21
FACTOR
Adjustment Factor
0 0 None
N/A
N/A
None
22
PUMP
STATUS
Pump Status
N/A
N/A
None
N/A
N/A
None
23
IR MODE
Operating Mode
N/A
N/A
None
N/A
N/A
None
24
DC VOLTS
DC Voltage from
2 2 V DC
N/A
N/A
None
25
OPER
VOLTS
DC Voltage being
used by instrument
2 2 V DC
N/A
N/A
None
26
BATT
VOLTS
DC Voltage from
battery
2 2 V DC
N/A
N/A
None
29
% HI CO2
Measured % CO2
2 2 %
0.00
20.00
None
30
CALC DP
Calculated Dew Point
0
0
°F or
°C
0
80
None
31
PUMP
Pump Mode
0 0 None
0 1 0=MANUAL
2=AUTO
Table 1 - Template Channel 1 Data Definitions for PGA3500/MGA6000
E
instrument
internal power supply
s
MODE
Super Systems Inc. Page 44 of 46
from high range CO2
sensor
Temperature
1=MANUAL
Page 45

XGA Viewer Operations Manual
Appendix 2: PGA3510/MGA6010 – Template Channel 1 Data Definitions
Slot Name Description
Src
Dec
Disp
Dec
Units
Min Max Exp
0
IR %C
% Carbon as
with IR Temperature
2 2 %
0.00
2.00
None
1
IR TEMP
Temperature of the
0
0
°F or
°C
0
2000
None
2
% CO
Measured % Carbon
Monoxide
2 2 % 0 25
None
3
% CO2
Measured % Carbon
Dioxide
4 3 % 0 2
None
4
% CH4
Measured % Methane
/ Natural Gas
2 2 % 0 25
None
5
PB %C
% Carbon as
controller
2 2 %
0.00
2.00
None
6
PB TEMP
Temperature of the
0
0
°
°C
0
2000
None
7
PB MV
Millivolts from the
probe
0 0 MV 0 1300
None
8
PB COF
CO Factor in the
controller
0 0 None
0
300
None
9
PB PF
Process Factor in the
controller
0 0 None
0
300
None
10
% O2
Measured % Oxygen
sensor
1 0 % 0 25
None
11
FLOW
Flow Rate
0 0 SCFH
N/A
N/A
None
This section will display the channel 1 data definition variables for the PGA3510 and MGA6010
templates that are used in the XGA Viewer software. This section is meant to be a reference for
users.
be used
values in light gray apply only to the PGA template. Each trend value has nine main points:
Note: These values are only suggested values, but it is recommended that these values
. The trend values in light blue apply to both the PGA and MGA template, while the trend
• Slot – The slot that the trend value will be located in
• Name – The name of the trend value
• Description – A description of the trend value
• Src Dec – The number of decimals that the source value has
• Disp Dec – The number of decimal places to display
• Units – This will be the units the value will be representing, such as % or °F/°C
• Min – This is the suggested chart y-axis minimum value
• Max – This is the suggested chart y-axis maximum value
• Exp – This can be an expression to view the data
computed by CO,
CO2, and CH4 values
gas in the furnace
computed by the
atmosphere
probe
F or
Super Systems Inc. Page 45 of 46
atmosphere
atmosphere
from electrochemical
Page 46

XGA Viewer Operations Manual
Slot Name Description
Src
Dec
Disp
Dec
Units
Min Max Exp
12
IR
FACTOR
IR Adjustment Factor
0 0 None
N/A
N/A
None
13
CH4
FACTOR
CH4 Adjustment
Factor
0 0 None
N/A
N/A
None
14
% H2
Measured %
Hydrogen
2 2 % 0 50
None
15
K100PA
Sensor Pressure
2 2 Kilo
ls
0
300
None
16
IR COF
IR Suggested COF
0 0 none
1
999
None
17
IR PF
IR Suggested PF
0 0 none
1
999
None
18
CALC
Flag. 0 = COF, 1 = PF.
0 0 none
0 1 None
19
PUMP
Pump Mode
0 0 none
0 2 None
20
IR MODE
IR Control Mode
0 0 none
0 1 None
21
DC VOLT
DC Voltage
3 3 volts
0
25
None
22
PASS
CODE 0
Level 1 Pass Code
0 0 none
0
30000
None
23
PASS
CODE 1
Level 2 Pass Code
0 0 none
0
30000
None
24
CAL
STAGE
Calibration Stage
0 0 none
0
19
None
25
PIC STAT
PIC Status
0 0 none
0
16
None
26
INT
TIMER
Interval Timer
0
0
minute
0
9999
None
27
HIGH CO2
High CO2 Value
2 2 % 0 100
None
Table 2 - Template Channel 1 Data Definitions for PGA3510/MGA6010
pasca
Super Systems Inc. Page 46 of 46
 Loading...