

Page 1
COLOR TOUCH SCREEN
DATA LOGGER
OPERATIONS MANUAL
Super Systems Inc.
7205 Edington Drive
Cincinnati, OH 45249
513-772-0060
800-666-4330
Fax: 513-772-9466
www.supersystems.com
Page 2

Table of Contents
Product Specifications ........................................................................................................................... 5
Software Installation .............................................................................................................................. 6
Changing the System Date and Time ................................................................................................... 6
Finding and Setting the IP Address of the Color SDS Data Logger ................................................. 7
Calibration ............................................................................................................................................... 9
Getting Started ........................................................................................................................................ 9
Analog Inputs ........................................................................................................................................ 10
Voltage connections............................................................................................................................ 11
4 – 20 mA Current Loop connections ................................................................................................. 11
Survey Templates ................................................................................................................................. 11
Installing the SDS Software ................................................................................................................ 13
Connecting the SDS Data Logger to a Network ............................................................................... 14
In Windows Vista and Windows 7 ...................................................................................................... 15
In Windows XP .................................................................................................................................... 16
Web Portal .............................................................................................................................................. 19
Home Screen ........................................................................................................................................... 19
Menu ....................................................................................................................................................... 20
Survey .................................................................................................................................................. 21
Instrument Information ...................................................................................................................... 23
Chart Scaling ....................................................................................................................................... 24
View Input Types ................................................................................................................................. 24
View Offsets ........................................................................................................................................ 25
Select Input Channels.......................................................................................................................... 26
Edit Input Types .................................................................................................................................. 28
Edit Offsets .......................................................................................................................................... 28
Spool Correction ................................................................................................................................. 29
About................................................................................................................................................... 30
Calibration ........................................................................................................................................... 31
Datalog Deletion ................................................................................................................................. 34
Passcodes ............................................................................................................................................ 35
Cold Junction Thermistor Calibration ................................................................................................. 36
Full Data Action ................................................................................................................................... 36
Exit Program ........................................................................................................................................ 37
Configuration ...................................................................................................................................... 37
Super Systems Inc. Page 2 of 104
Color Touch Screen Data Logger Operations Manual
Page 3
Reset Calibration Dates ....................................................................................................................... 38
Set Nominals ....................................................................................................................................... 39
Set K Factors ........................................................................................................................................ 41
SDX Control ......................................................................................................................................... 42
Modbus Control .................................................................................................................................. 43
SDS Reporter ........................................................................................................................................ 45
File Menu Options ................................................................................................................................. 45
File New / New Button .......................................................................................................... 45
File Open / Open Button .......................................................................................................... 46
Manually Creating a Survey Record .................................................................................................... 48
Comparison Check .............................................................................................................................. 57
File Save / File Save As / Save Button .................................................................................. 60
File Export....................................................................................................................................... 60
File Print ......................................................................................................................................... 60
Print Button ................................................................................................................................. 62
File Print Preview ........................................................................................................................... 63
File Exit ........................................................................................................................................... 63
SDS Menu Options ................................................................................................................................ 63
SDS Manage Survey Templates ...................................................................................................... 63
SDS Download Surveys and Data ................................................................................................... 63
SDS Launch Direct FTP .................................................................................................................... 65
SDS View Real-time Data ................................................................................................................ 66
SDS Manage Survey Records .......................................................................................................... 68
SDS Perform Comms Test ............................................................................................................... 70
Options Menu Options .......................................................................................................................... 72
Options Multiple SDS Mode ........................................................................................................... 72
Options Show Labels On Chart ....................................................................................................... 72
Options Color Screen Scanning ...................................................................................................... 72
Help Menu Options ............................................................................................................................... 72
Help Check for Updates .................................................................................................................. 72
Help About ..................................................................................................................................... 73
SDS Data Tags ...................................................................................................................................... 74
Creating a Personalized Template ...................................................................................................... 82
Super Systems Inc. Page 3 of 104
Color Touch Screen Data Logger Operations Manual
Page 4

SDS Template Manager ....................................................................................................................... 84
Description of Template Manager Screen Tabs ............................................................................... 87
Revision History ...................................................................................................................................... 91
Appendix 1: Quick Start Guide ................................................................................................................ 92
Unpacking the Color SDS Data Logger ................................................................................................ 92
Warming Up and Charging the Data Logger ....................................................................................... 93
Turning on the Data Logger ................................................................................................................ 94
Connecting the Thermocouple Wires and Setting the Input Type ..................................................... 94
Using Survey Templates ...................................................................................................................... 95
Starting a Survey ................................................................................................................................. 95
Stopping Survey .................................................................................................................................. 97
Installing SDS Reporter ....................................................................................................................... 97
Connecting the SDS Data Logger to a Local Computer via USB .......................................................... 98
Downloading Data with SDS Reporter ................................................................................................ 99
Generating a Report .......................................................................................................................... 101
Super Systems Inc. Page 4 of 104
Color Touch Screen Data Logger Operations Manual
Page 5

The Color SDS Touch Screen Data Logger (SDS8120 / SDS8140) provides the hardware
and software needed to meet industry standards for furnace temperature uniformity by
logging and generating temperature and data log reports.
It is easy to use and addresses the many industrial applications where data logging,
trending, and reporting are required. The product is available in either the 20- or 40channel version with user-defined inputs for each channel and comes with reporting
software to easily generate survey reports.
The easy to use Survey Template and Report Manager provide users with all of the tools
needed to generate uniformity reports. The Report Manager includes a report writer
that allows the user to set up reports to meet their specific requirements. The Template
Manager allows survey specific data to be created, updated and used during the
reporting process. All reports can be printed, saved electronically and emailed using
the software utilities. The SDS software tools, along with the data logger, combine to
create a powerful solution for data logging and reporting temperature uniformity
surveys.
Product Specifications
• User defined “logging” intervals as frequently as 10 seconds
• AC (90 – 240 V) and DC Power
• Rechargeable battery – Approximately 12 hours of “runtime”
• Dimensions: 16”D X 20”L X 8”H
• Password protected menu options
• Easy calibration
• Web-page enabled real-time view
• Ethernet and USB serial communications
• 16-Bit A/D converter
• 1 gigabyte of on-board storage
Super Systems Inc. Page 5 of 104
Color Touch Screen Data Logger Operations Manual
Page 6
Degrees F.
A/D
Accuracy
Accuracy
Accuracy
TC Type
Min
Max
Full scale
Full Scale
At 1600 Degrees
F.
At 1600 Degrees F
with thermistor
error
B
32
3308
0.0124%
0.0179%
0.29
0.65
C
32
4208
0.0062%
0.0067%
0.11
0.47
E
-328
1832
0.0031%
0.0032%
0.05
0.41
J
-346
2192
0.0031%
0.0036%
0.06
0.42
K
-328
2502
0.0031%
0.0045%
0.07
0.43
N
-328
2372
0.0031%
0.0052%
0.08
0.44
NNM
0
1409
0.0031%
0.0033%
0.05
0.41
R
-58
3214
0.0062%
0.0118%
0.19
0.66
S
-58
3214
0.0124%
0.0133%
0.21
0.57
T
-328
752
0.0062%
0.0119%
0.19
0.55
Table 1 - Thermocouple Types, Scaling, and Accuracy
*** Note: Accuracy at 1600 Degrees F with thermistor error requires SDS firmware
level 1.10 or later ***
Software Installation
You will find the SDS Reporter software CD that ships with the unit includes all the
reporting and administrative utilities. Insert the CD into the optical drive on your
computer and click the setup.exe file. You will be given a step-by-step instruction for
completing the installation process. See Installing the SDS Software section for more
details.
Changing the System Date and Time
The time and date that SDS uses are based on the time and date of the touch screen
operating system. To change the time and date, first shut down the SDS software
(Figure 1); note that this requires administrator access. Once the software is shut down,
double tap on the time shown in the task bar at the bottom of the screen on the
operating system desktop (Figure 2). Change the date and time in the dialog box that
appears.
Super Systems Inc. Page 6 of 104
Color Touch Screen Data Logger Operations Manual
Page 7
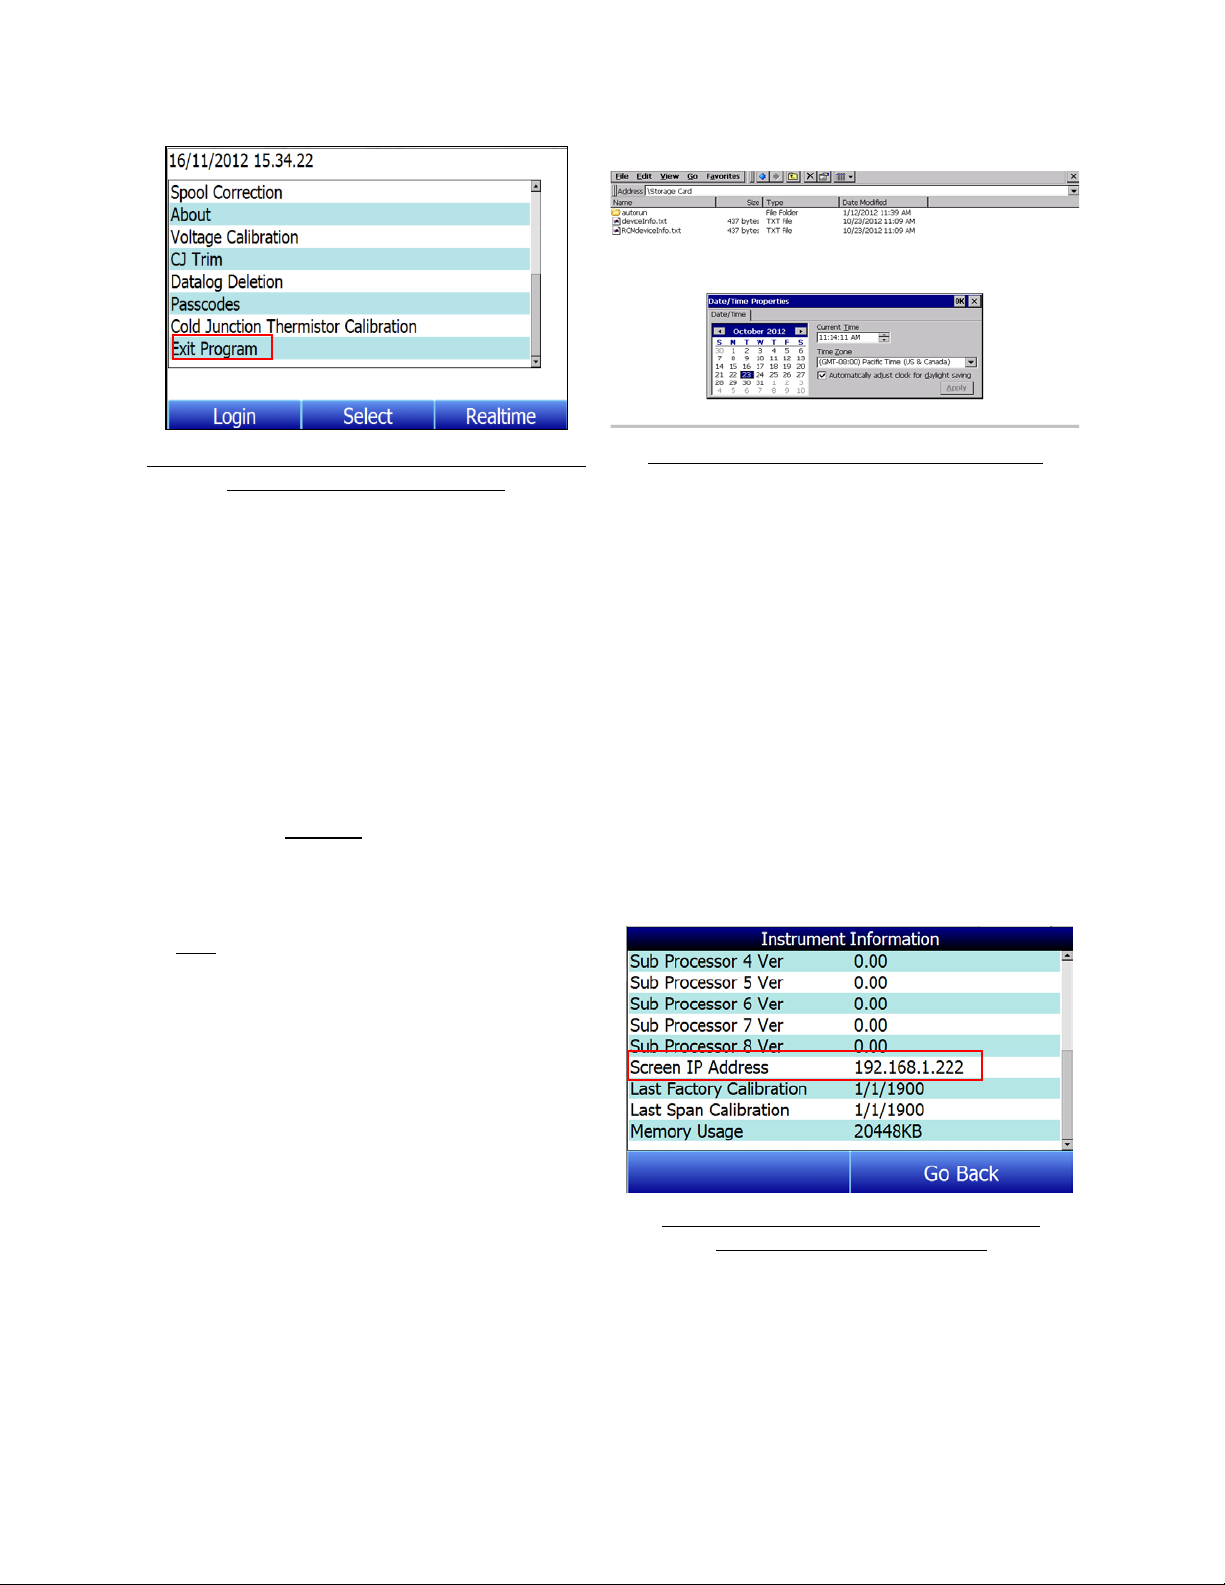
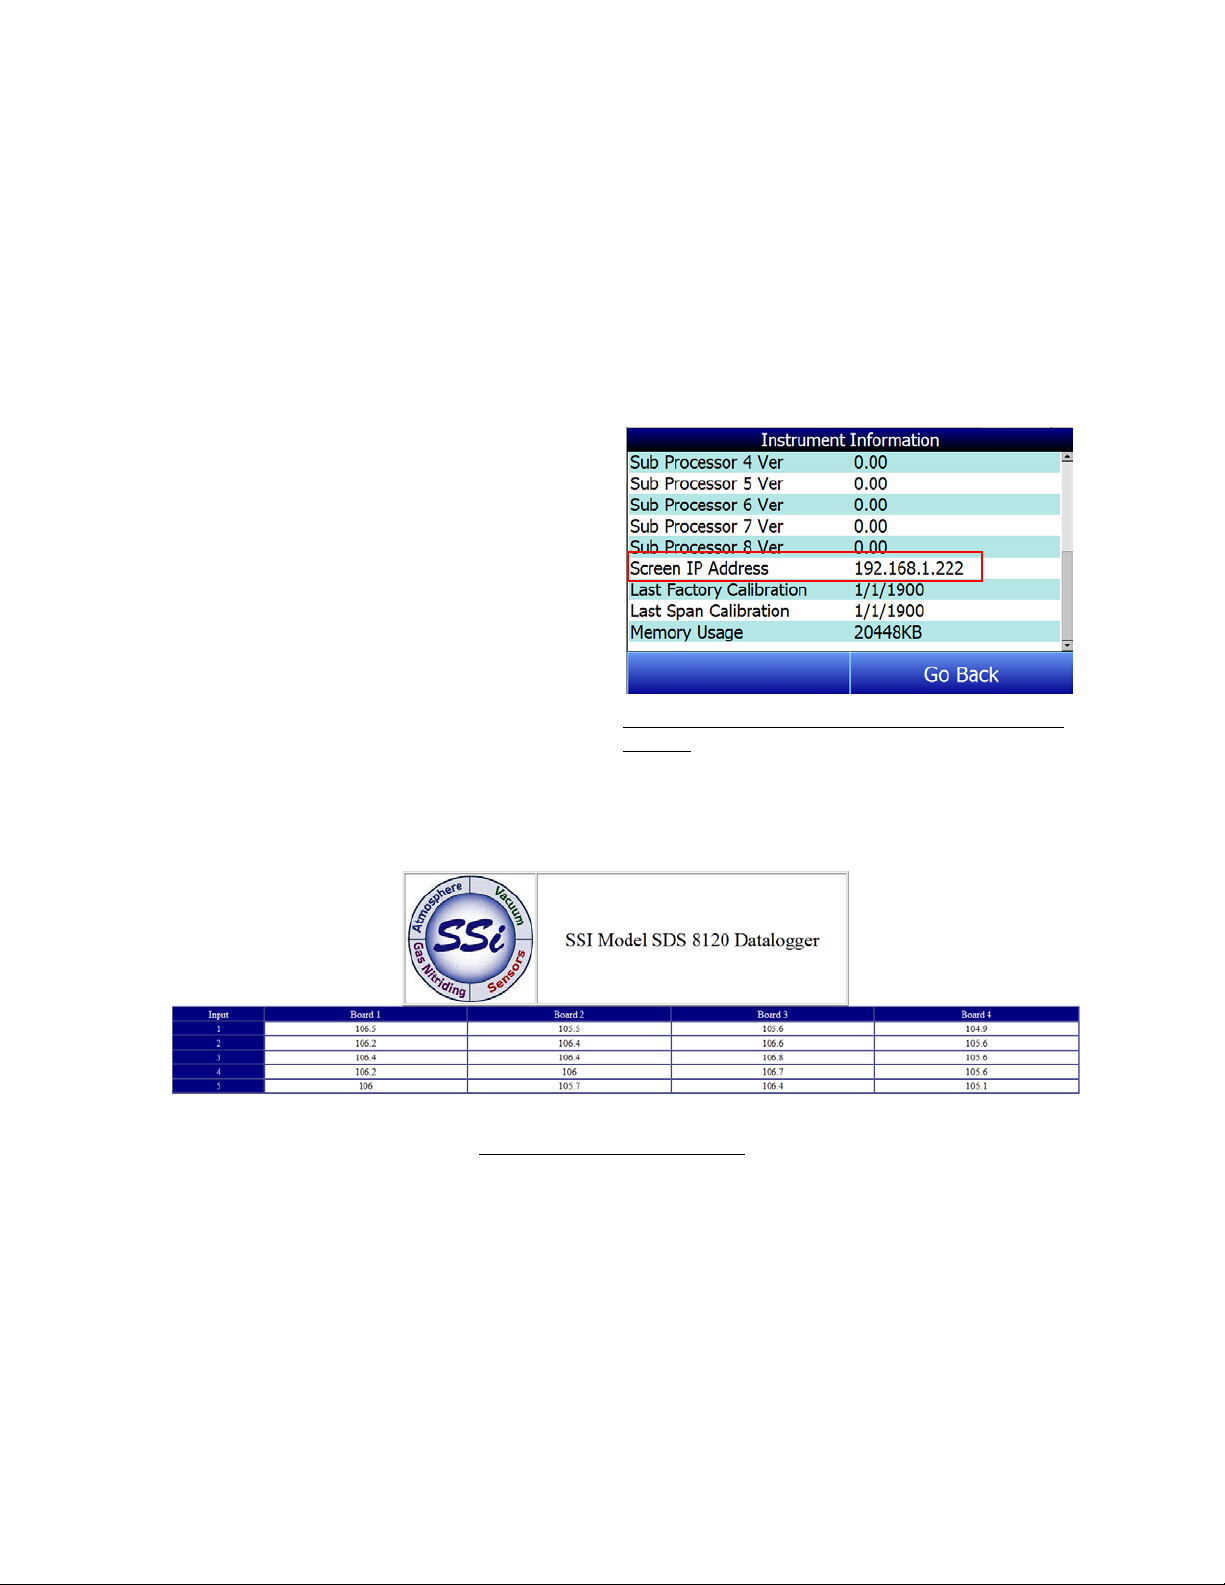
To find the current IP address of the data
Figure 1 - Option to Shut Down the SDS Software
(Administrator Access required)
Figure 2 - Date and Time Change Dialog Box
Once you have changed the date and time, you will need to save the changes to the
operating system registry. This is done using the “SaveRegs” application. In most cases,
the “SaveRegs” shortcut will be installed on the operating system desktop. Double tap
on the shortcut and save the registry settings. Then close the “SaveRegs” window.
Finding and Setting the IP Address of the Color SDS Data Logger
For certain functions, it may be necessary to find the IP address (the address that
identifies the device on a network) of the Color SDS Data Logger. A possible example of
this could be Connecting the SDS Data Logger to a Network. Less frequently, it may be
necessary to change the IP address of the data logger, or to change it from a dynamic IP
address assigned by the local network to a static IP address that does not change
(unless you change it or set the IP address back to dynamic).
logger, simply open the Instrument
Information screen and scroll down to the
Screen IP Address (Figure 3)
By default, the Windows CE operating system on which the data logger software runs
obtains IP addresses dynamically. This means that the IP address may change
depending on a number of factors. In order to change IP assignment or the IP address
itself, you will need to shut down the SDS software and access the operating system
Control Panel. This procedure is described below.
Super Systems Inc. Page 7 of 104
Color Touch Screen Data Logger Operations Manual
Figure 3 - Location of Screen IP Address in
Instrument Information screen
Page 8
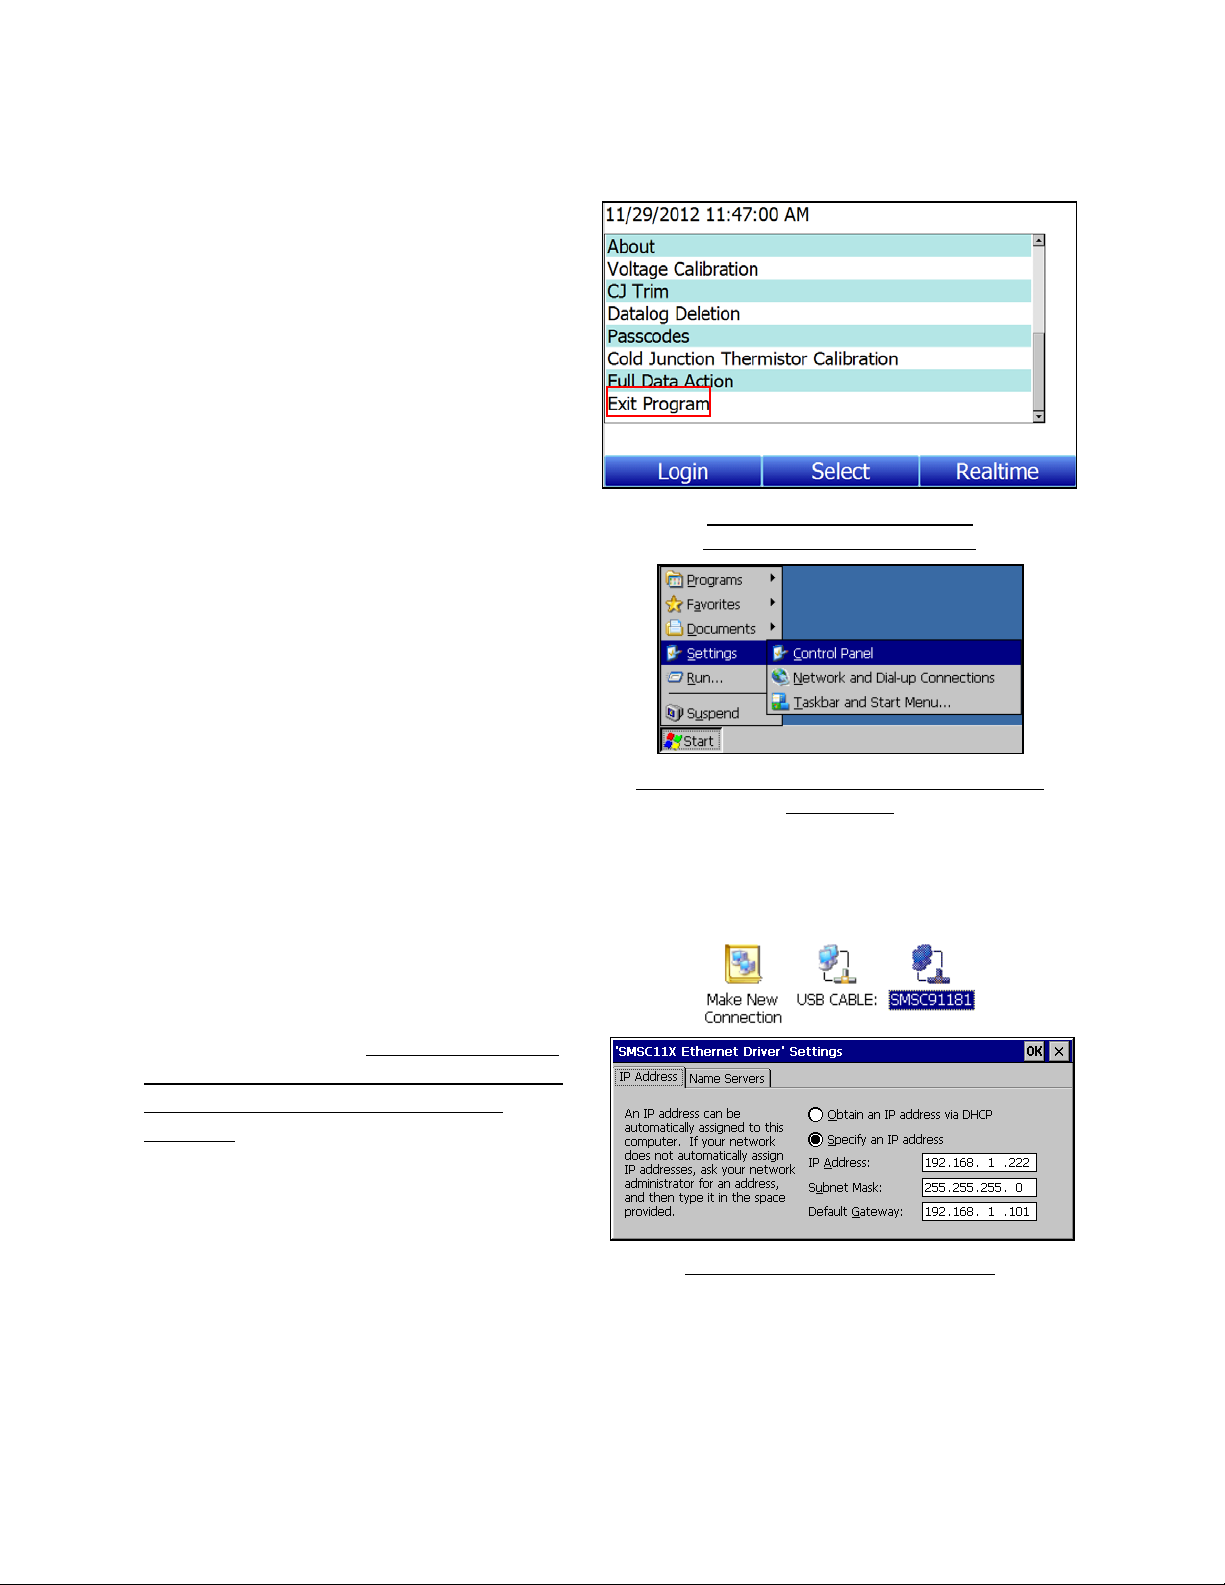
To change the IP address of the Color
Next, click Start, Settings, and Network
Double tap on the connection for the Color
Make sure that the
IP address does not conflict with another
IP address already assigned on the
network.
responsible for routing network traffic.
SDS Data Logger, first shut down the
SDS software. This requires
administrator access.
and Dial-up Connections (Figure 5).
Figure 4 - Exit Program option
(requires administrator access)
SDS touch screen device (in the example,
it is called “SMSC91181”). An Ethernet
Driver settings window will appear, giving
you the ability to specify an IP address. To
do so, click the “Specify an IP address”
radio button (see Figure 6). Then enter an
IP address manually.
You will also need to add a Subnet Mask
and a Default Gateway. The subnet mask
is usually already determined for the
network. A common subnet mask is
255.255.255.0; however, check with the
network administrator to be sure. The
default gateway is usually the address of
the network router or other device that is
Figure 5 - Accessing the Network and Dial-Up
Connections
Figure 6 - Specifying an IP Address
Super Systems Inc. Page 8 of 104
Color Touch Screen Data Logger Operations Manual
Page 9
Calibration
The SDS data logger is calibrated prior to shipment. The calibration process is
available through the touch screen Menu on the data logger. Instructions for calibration
are included in this manual. Super Systems calibrates the SDS data logger using NIST
traceable instruments that are listed on the calibration certificate included with the
device. The default calibration is performed using a zero and span routine for the
millivolt range of 0 – 80mV unless otherwise specified on the purchase order. Ranges
and thermocouple types will be listed on the certification provided with the SDS data
logger. Each range that is being used should be calibrated. For a list of suggested mV
ranges by thermocouple types, please refer to Table 1 - Thermocouple Types, Scaling,
and Accuracy. Other calibration ranges are available upon request.
An input device will be used to input a specific type K thermocouple value and the data
logger value will be recorded. This will be performed at different temperatures and
printed with the certificate.
Getting Started
IMPORTANT:
When using SDS Reporter with the Color SDS Data Logger, Options >
Color Screen Scanning must be selected. Refer to the section Options Color Screen
Scanning for more details.
When logging data, the operator will use the on-board display to start and stop the data
logging / survey process. The first steps related to data logging are connecting the
inputs to the terminal strips on the data logger. Each terminal strip represents a single
analog board with 5 inputs. You can remove these terminal strips by pulling up on both
ends of the terminal strip.
Depending on the model number, you have either 20 or 40 input channels for data
logging. For each channel there will be a positive and negative connection which must
be attached to the appropriate input.
The operator defines an input type for each channel.
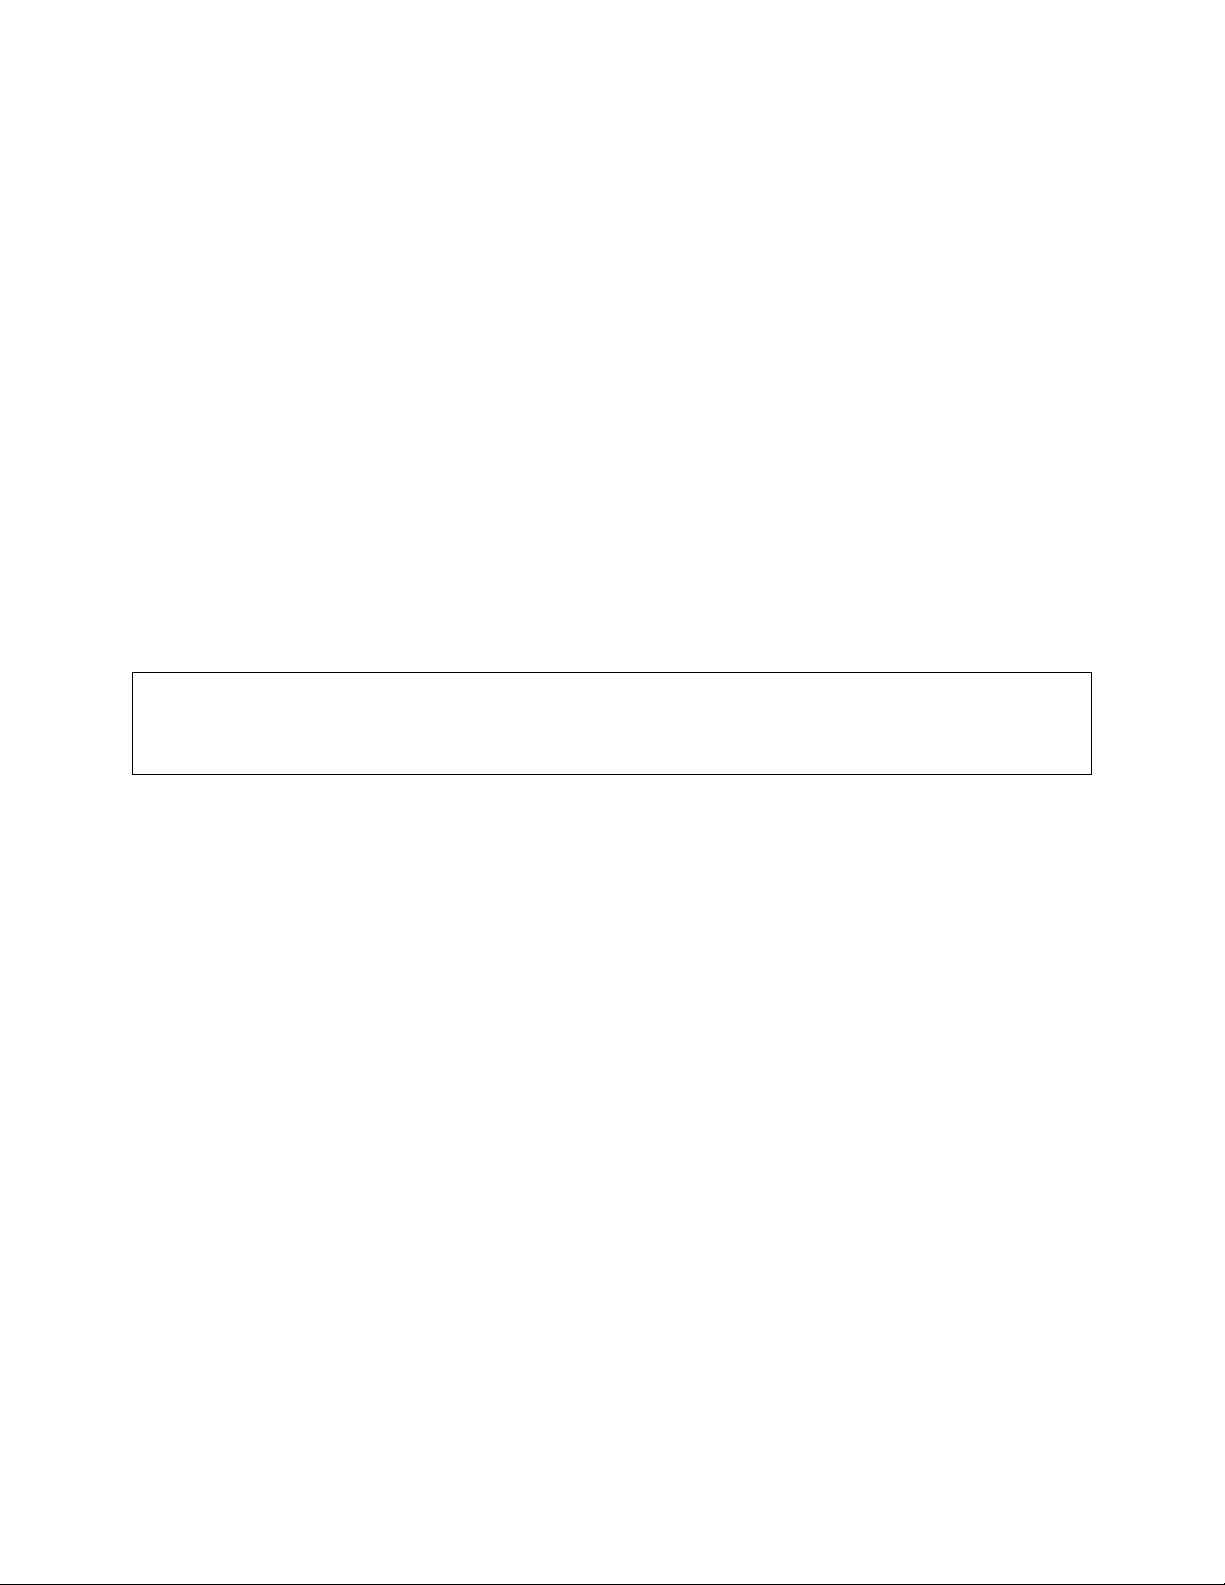
Once the inputs have been connected, the operator selects which inputs will be included
in the survey. This is done in two ways:
1. When a template has been selected, the input channels setup for the template,
as defined in the Template Manager, will be the selected channels for the survey.
It is strongly suggested that you select a template prior to running a survey. If
you want to create new templates, please see the section
Manager
. Survey Control and input selection screens are shown in Figure 7.
SDS Template
Super Systems Inc. Page 9 of 104
Color Touch Screen Data Logger Operations Manual
Page 10
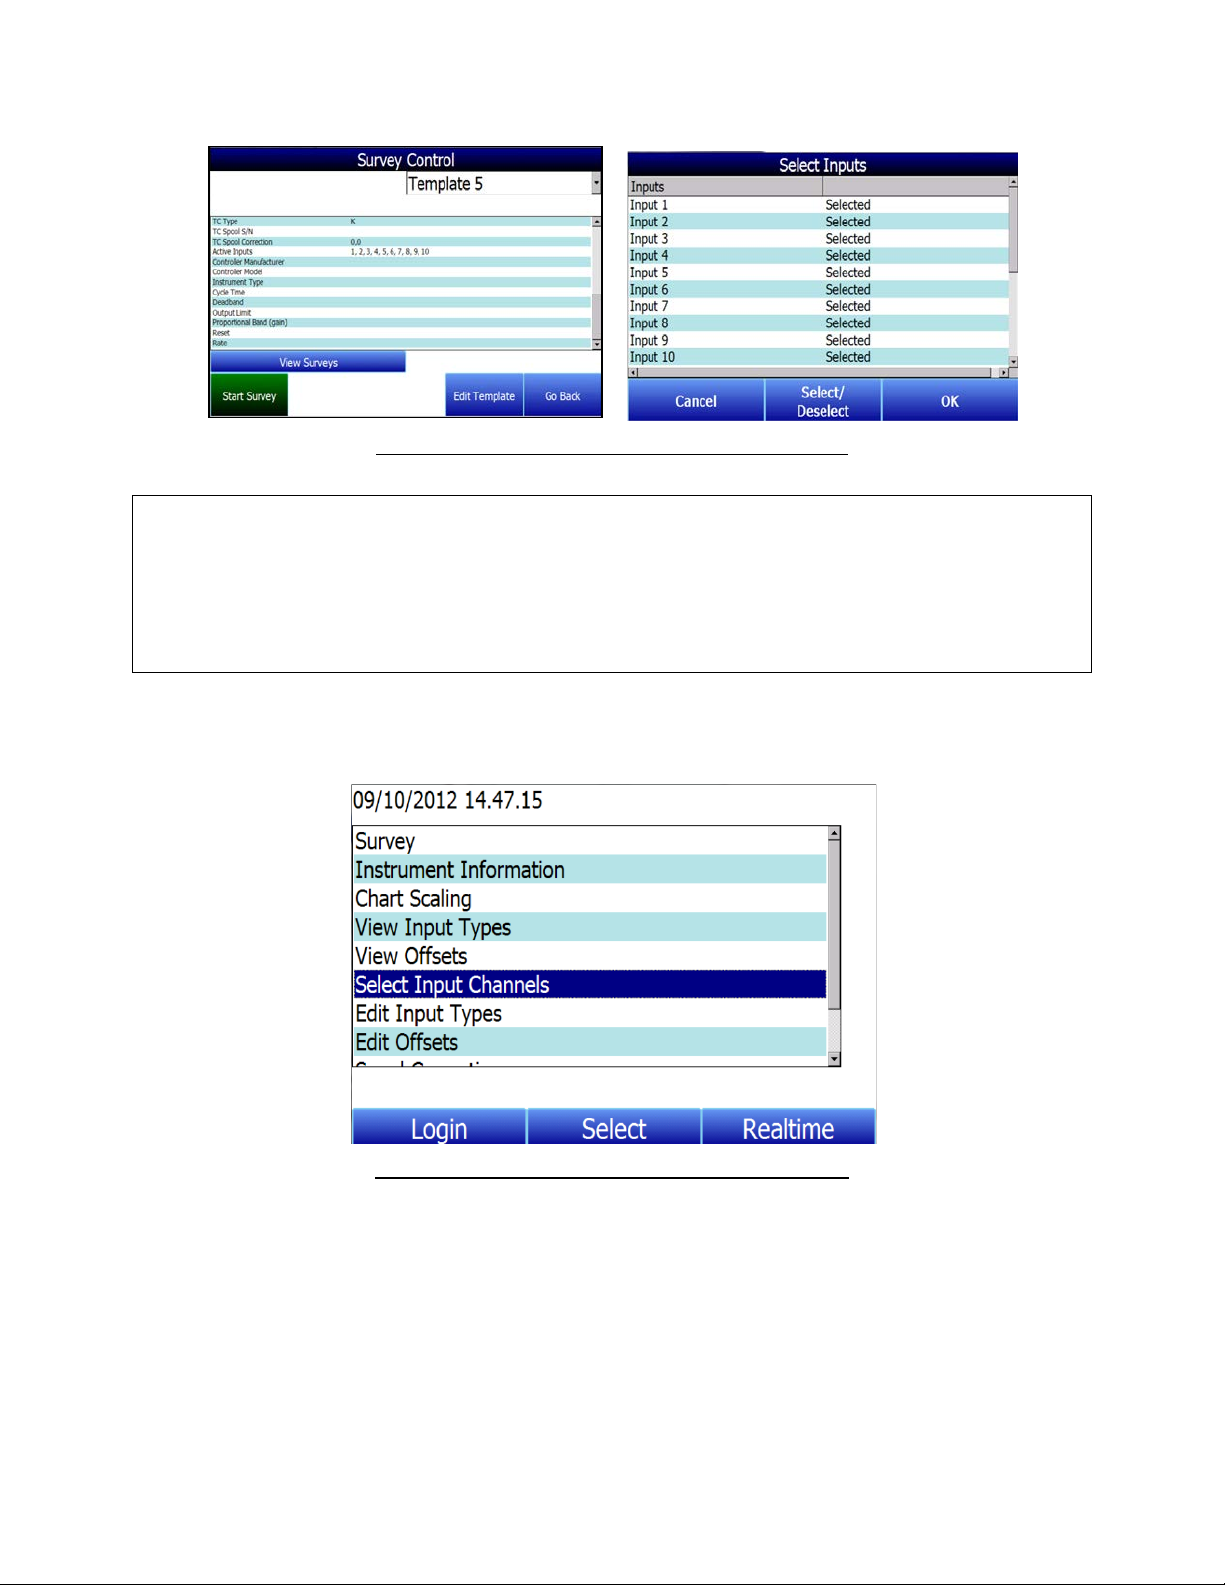
Figure 7 - Survey Control and Input Selection screens
IMPORTANT: Input channels defined in the Survey Template will override the settings in
the
Select Input Channel
option once the survey is started. All channels are being data
logged at all times. The active inputs provide real time information on the display and
evaluation for stabilization, hottest TC and coldest TC. In the event that a TC is not
selected, it can be selected when using SDS Reporter for inclusion in the final survey
report.
2. Once a survey is started, the input selection can be updated on the data logger
using the
Select Input Channels
option.
Figure 8 - Select Input Channels Option in Main Menu
Analog Inputs
The Super Systems, Inc. 31631 Analog Board contains a group of five channels isolated from the
main DC power source. The board can be connected to thermocouples, voltage sources from
20mV full scale to 1.28 Volts full scale, or 4 – 20 mA current loops.
current loops to avoid damaging the input (see 4 – 20 mA Current Loop connections).
Thermocouple wires can be connected directly to the terminal blocks. The thermocouple
junctions should not be grounded. If they do touch a ground reference, all thermocouples on a
Super Systems Inc. Page 10 of 104
Color Touch Screen Data Logger Operations Manual
Take caution when using
Page 11

board must have a common ground reference. If multiple thermocouples are connected to
different ground reference points, the accuracy of all thermocouples on the board cannot be
guaranteed to be accurate.
Voltage connections
Voltages from 0 mV to 1.28 Volts can be directly connected to the terminal blocks. When
measuring ground-referenced voltages, all references must share a common ground
reference. If the voltage sources are connected to different ground reference points, the
accuracy of all the voltage sources connected to the board need to be checked for accuracy.
4 – 20 mA Current Loop connections
Before connecting the current loop, insert the shorting jumper on the board for each channel
used to measure current loops. This jumper inserts the 62-ohm shunt resistor across the input
of the A/D. If multiple current loops are connected to one board, all must share the same power
supply and ground reference points or the accuracy of all the current loops need to be checked
for accuracy.
Survey Templates
The data logger will default to the last survey template used. To modify the template being
used, the operator can go to the
Survey
menu option. This data will be carried over for the
reporting process to make the reporting quick and easy. On the Survey Template screen there
are parameters, such as setpoint, that can be modified for a specific survey. After setting the
required parameters, the start survey process can be selected. This will timestamp the
selection and the data logger will log all channels that have been selected for logging.
The operator may receive deviation alarms depending on the current input and setpoint as well
as the alarm settings. The alarm will notify the operator when an input is outside the
plus/minus tolerance for the setpoint. The alarm information will display on the data logger
and show the number of channels above tolerance and below the tolerance. The survey
continues to run. It is simply providing the operator with the information on the display.
The operator can view the input channel data on a number of different screens. The
display
will display all channels on the device.
overview
At any time, the operator can view the data in real time from the computer using the SDS
Reporter software. When selected, the real time data option displays data every 10 seconds.
The system will update the data in 10 second intervals every minute. Follow instructions for
connecting the data logger to the PC.
Super Systems Inc. Page 11 of 104
Color Touch Screen Data Logger Operations Manual
Page 12
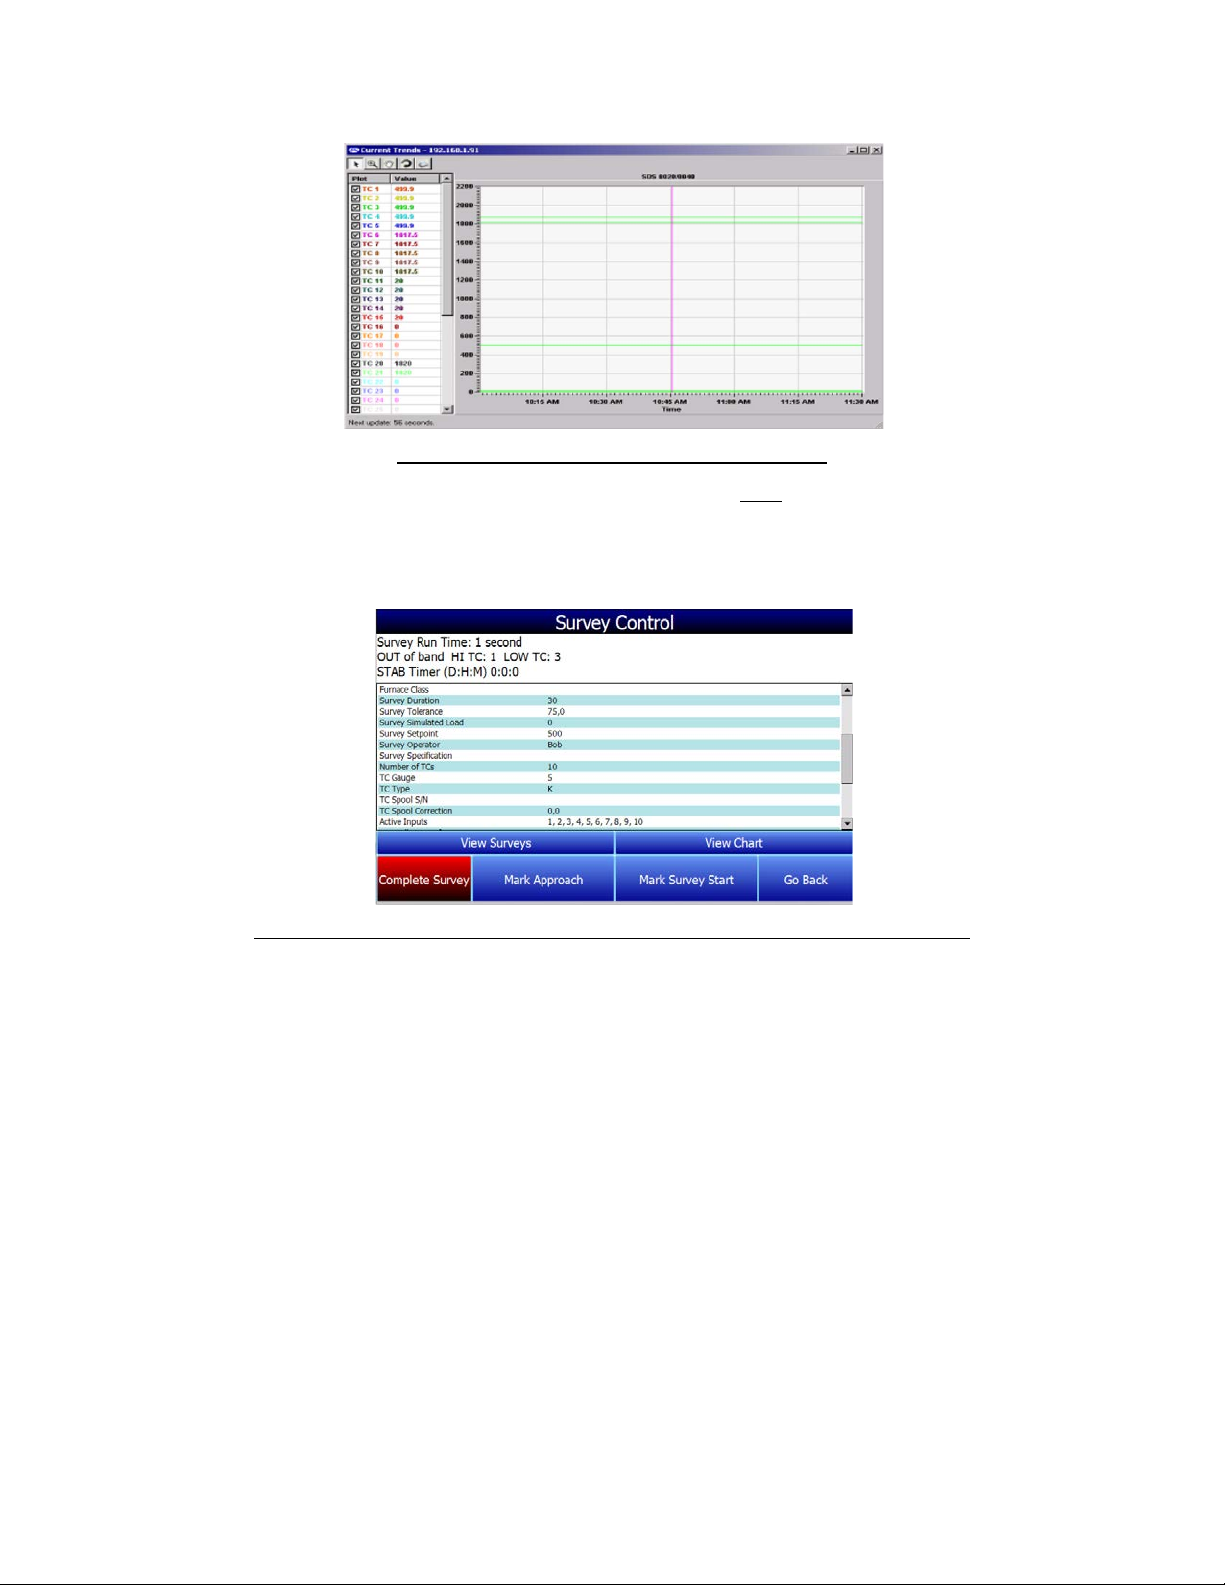
Figure 9 - Current Trends Screen (SDS Reporter)
While the survey is running, several options are available: To stop the survey, select
Survey
main menu). Use
heating up to its target temperature. Use
Click
data being logged.
After stopping the survey, other surveys can be taken by repeating the above steps. At any time,
all survey data can be downloaded to the PC using the Download Surveys and Data option on
SDS Reporter. Follow instructions for connecting the data logger to the PC.
Once the data has been downloaded, it is available for reporting. By clicking on the File > Open
menu option, the operator will be given the Report dialog to generate a survey report. Reports
use logged data and the user specified interval in the report. The report template that is
selected will form the final report view with all of the template data, survey data and additional
report parameters that are entered. The report templates are user-defined and should be
configured to meet your needs. All reports can be saved and displayed at a later date.
from the Survey Control screen (which can be opened using the Survey option from the
Mark Approach
Figure 10 - Survey Control Window (visible from the data logger during a survey)
View Surveys
to view data on past surveys. Click
to add a timestamp to the survey on when the furnace was
Mark Survey Start
View Chart
to mark when the survey began.
to view the current chart of
Complete
Super Systems Inc. Page 12 of 104
Color Touch Screen Data Logger Operations Manual
Page 13
Installing the SDS Software
IMPORTANT: The person installing the SDS Software must have administrative rights on the
computer(s) where the installation is taking place for the installation to be successful.
Double-click on the setup file, setup.exe, to start the auto-installation. (Avoid installing from
SDSSetup.msi, as this will not install prerequisites if necessary.) If there is no version of the
SDS Reporter running on the computer, the installation will prompt the user for the download
location (Figure 11).
Figure 11 - SDS Reporter setup screen
Prerequisites for installing SDS Reporter include .NET Framework 2.0, SQL CE 3.5, and either
ActiveSync or Windows Mobile Device Center. The setup.exe program will check to make sure
that these prerequisites are installed and, if necessary, install them.
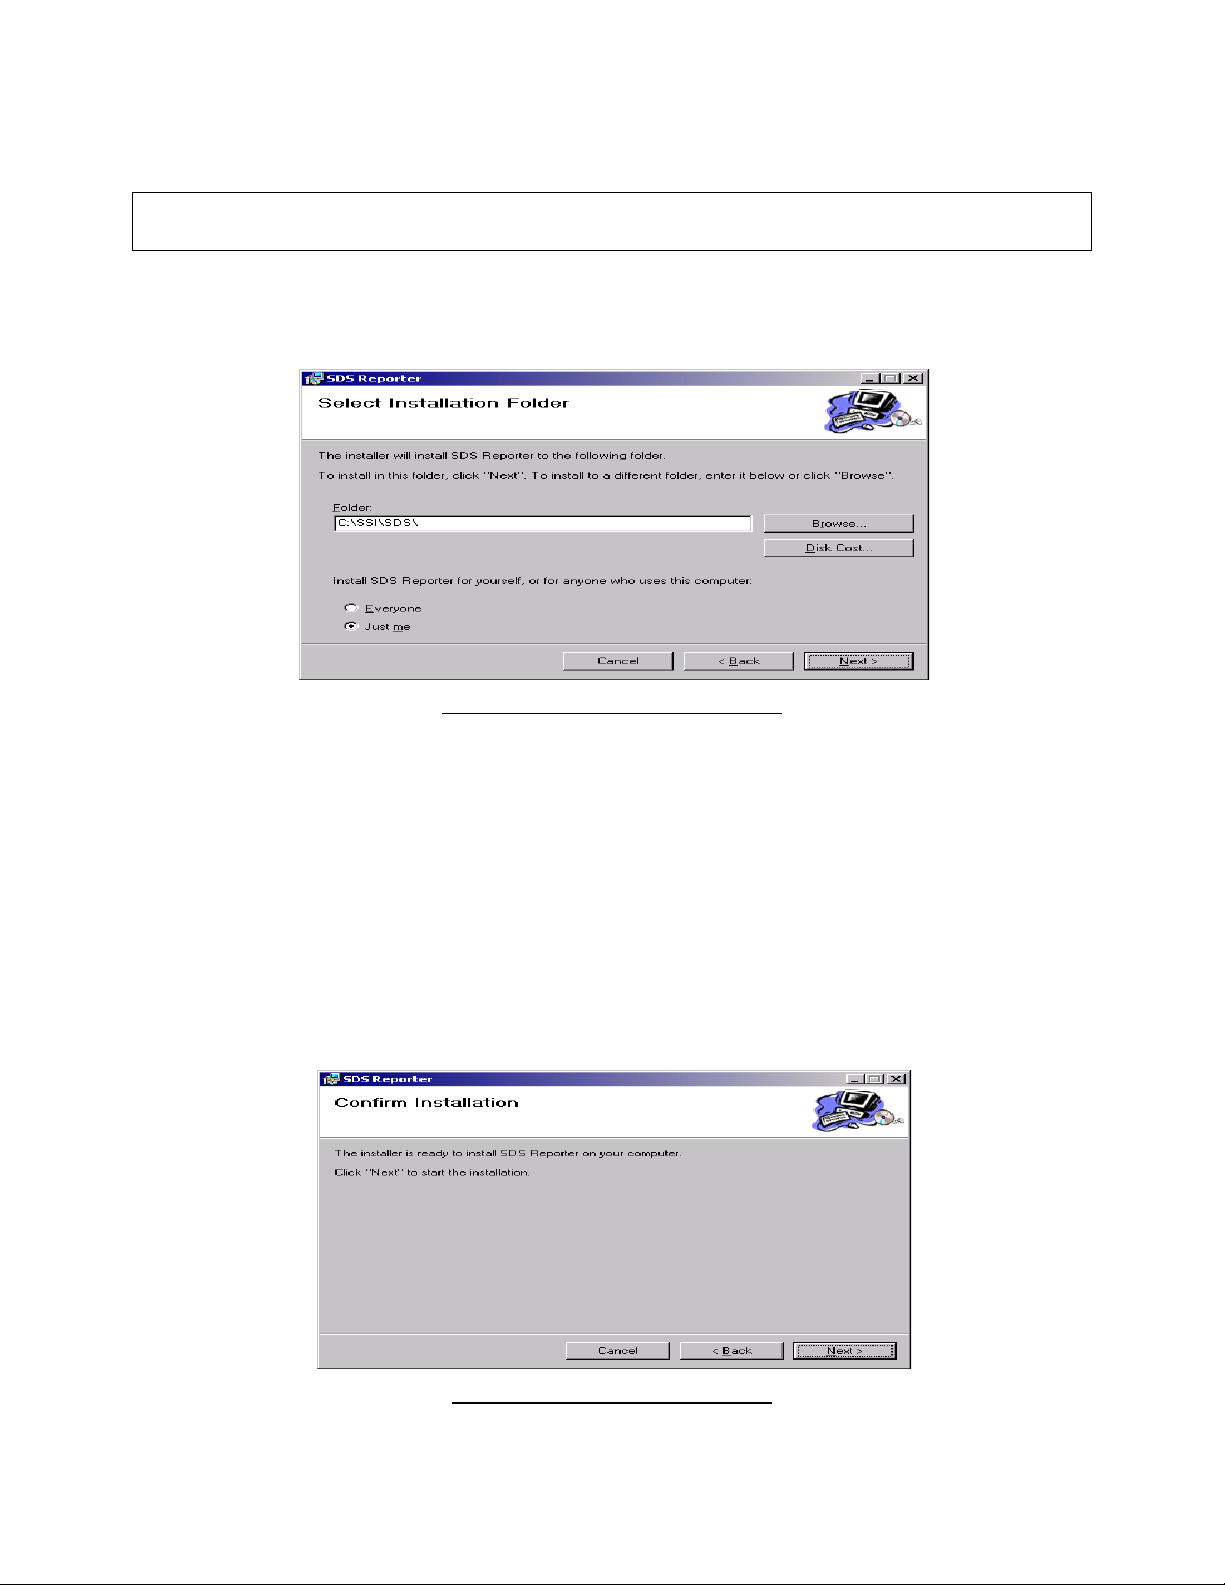
The default location is “C:\SSI\SDS”. Click on the “Browse” button to select an alternate
location. Clicking on the “Disk Cost…” button will display the available computer drives onto
which the SDS Reporter can be downloaded, as well as the total space, available space, and
required space for each drive. Selecting the “Everyone” option will install the SDS Reporter for
all users on the computer, while selecting the “Just me” option will only install the
SDSReporter for the current user. Clicking on the “Cancel” button will prompt the user to
confirm exiting the setup without continuing. Clicking on the “< Back” button will display the
previous screen, which is the introduction screen for the installer. Clicking the “Next >” button
will continue with the installation process (Figure 12).
Figure 12 - Installation ready screen
Super Systems Inc. Page 13 of 104
Color Touch Screen Data Logger Operations Manual
Page 14
Clicking on the “Cancel” button will prompt the user to confirm exiting the setup without
continuing. Clicking on the “< Back” button will display the previous page, which is the
installation setup page (Figure 11). Clicking on the “Next >” button will install the software to
the specified location. Once the software has been installed, the installer can be closed. The
SDS Reporter software will now be ready to use.
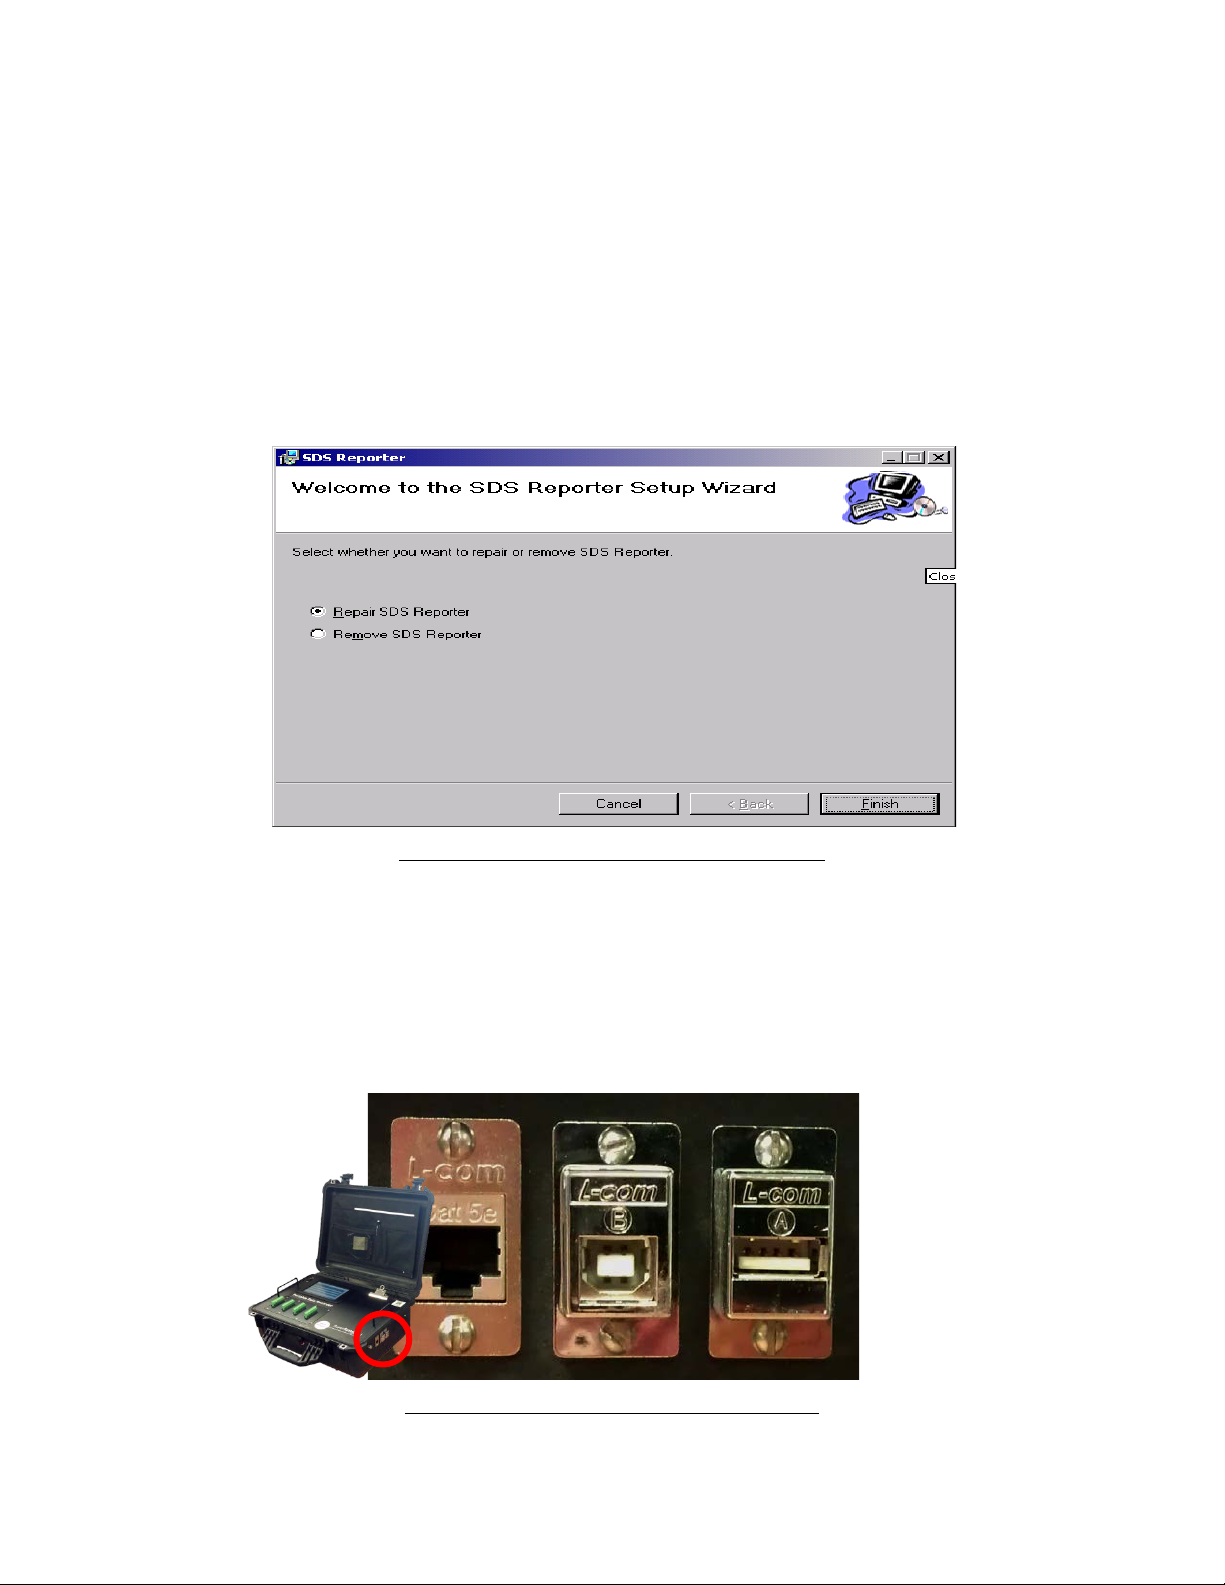
If there is a version of the SDS Reporter already installed on the computer, the installer will
either re-install the software (Repair SDS Reporter option) or remove the software from the
computer (Remove SDS Reporter option) (Figure 13). Clicking on the “Finish” button will
proceed with the selected action. Note: The installer does not remove any subfolders in the
main SDS folder. These files will have to be manually removed.
Figure 13 - Repair/Remove SDS Reporter screen
Connecting the SDS Data Logger to a Network
Every SDS Data Logger shipped includes an Ethernet crossover cable that will connect the data
logger to a network. Once the data logger is connected to a network, the SDS Reporter
software will be able to find it during any searches.
Connecting the data logger to your network or directly to a PC can be accomplished using the
Ethernet port on your data logger.
Figure 14 - Location of Ethernet and USB ports
Super Systems Inc. Page 14 of 104
Color Touch Screen Data Logger Operations Manual
Page 15
If you are connecting the data logger to your network, you will need an Ethernet cable (the cable
In Windows Vista and Windows 7, open the
provided is a crossover cable for direct connections to a PC). The cable is plugged into the data
logger Ethernet plug; the other end should be plugged into a network hub. If the IP Address of
the data logger needs to be changed, this can be done on the data logger through the Set IP
Address menu option.
If you are not putting the data logger on the network, you should use the Ethernet crossover
cable that has been provided with the device. Ethernet crossover cables are most often
used when connecting two Ethernet computers without a hub. An Ethernet crossover cable has
its send and receive wires crossed. When using a hub or switch, this is automatically done for
you.
With a crossover cable, you are forming a network between the computer that you are directly
plugged into and the data logger. There will be some network settings on the data logger and
on the computer that you will have to configure for the two devices to communicate.
Setting an IP address in the data logger is described in Finding and Setting the IP Address of the
Color SDS Data Logger above.
Network settings can be found through the
Control Panel
in Microsoft Windows.
Using the crossover cable will require the Local Area Connection to be modified.
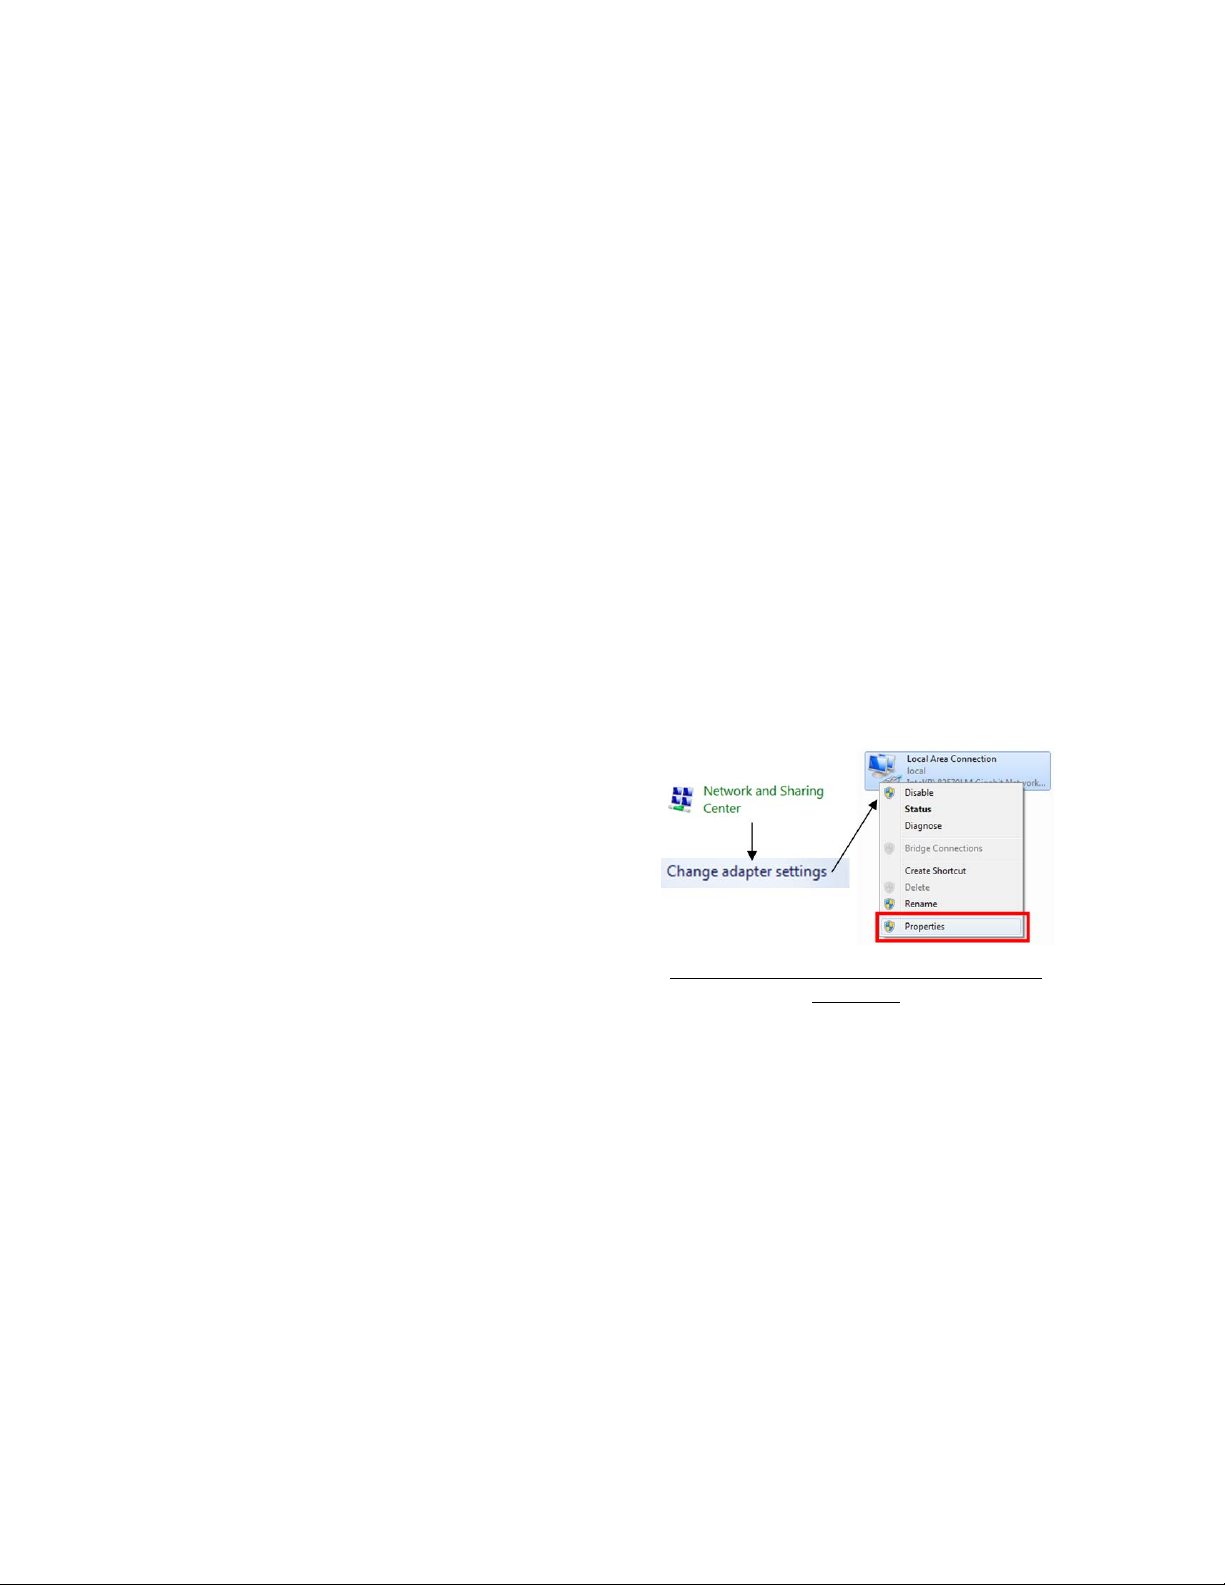
In Windows Vista and Windows 7
Network and Sharing Center menu within
Control Panel. Click “Change adapter settings”.
This will bring up a list of network connections,
including active and inactive ones. Right click
on the name of the network to which the Color
SDS Data Logger is or will be connected, and
then click Properties.
Figure 15 - Accessing Network Connection
properties
Super Systems Inc. Page 15 of 104
Color Touch Screen Data Logger Operations Manual
Page 16
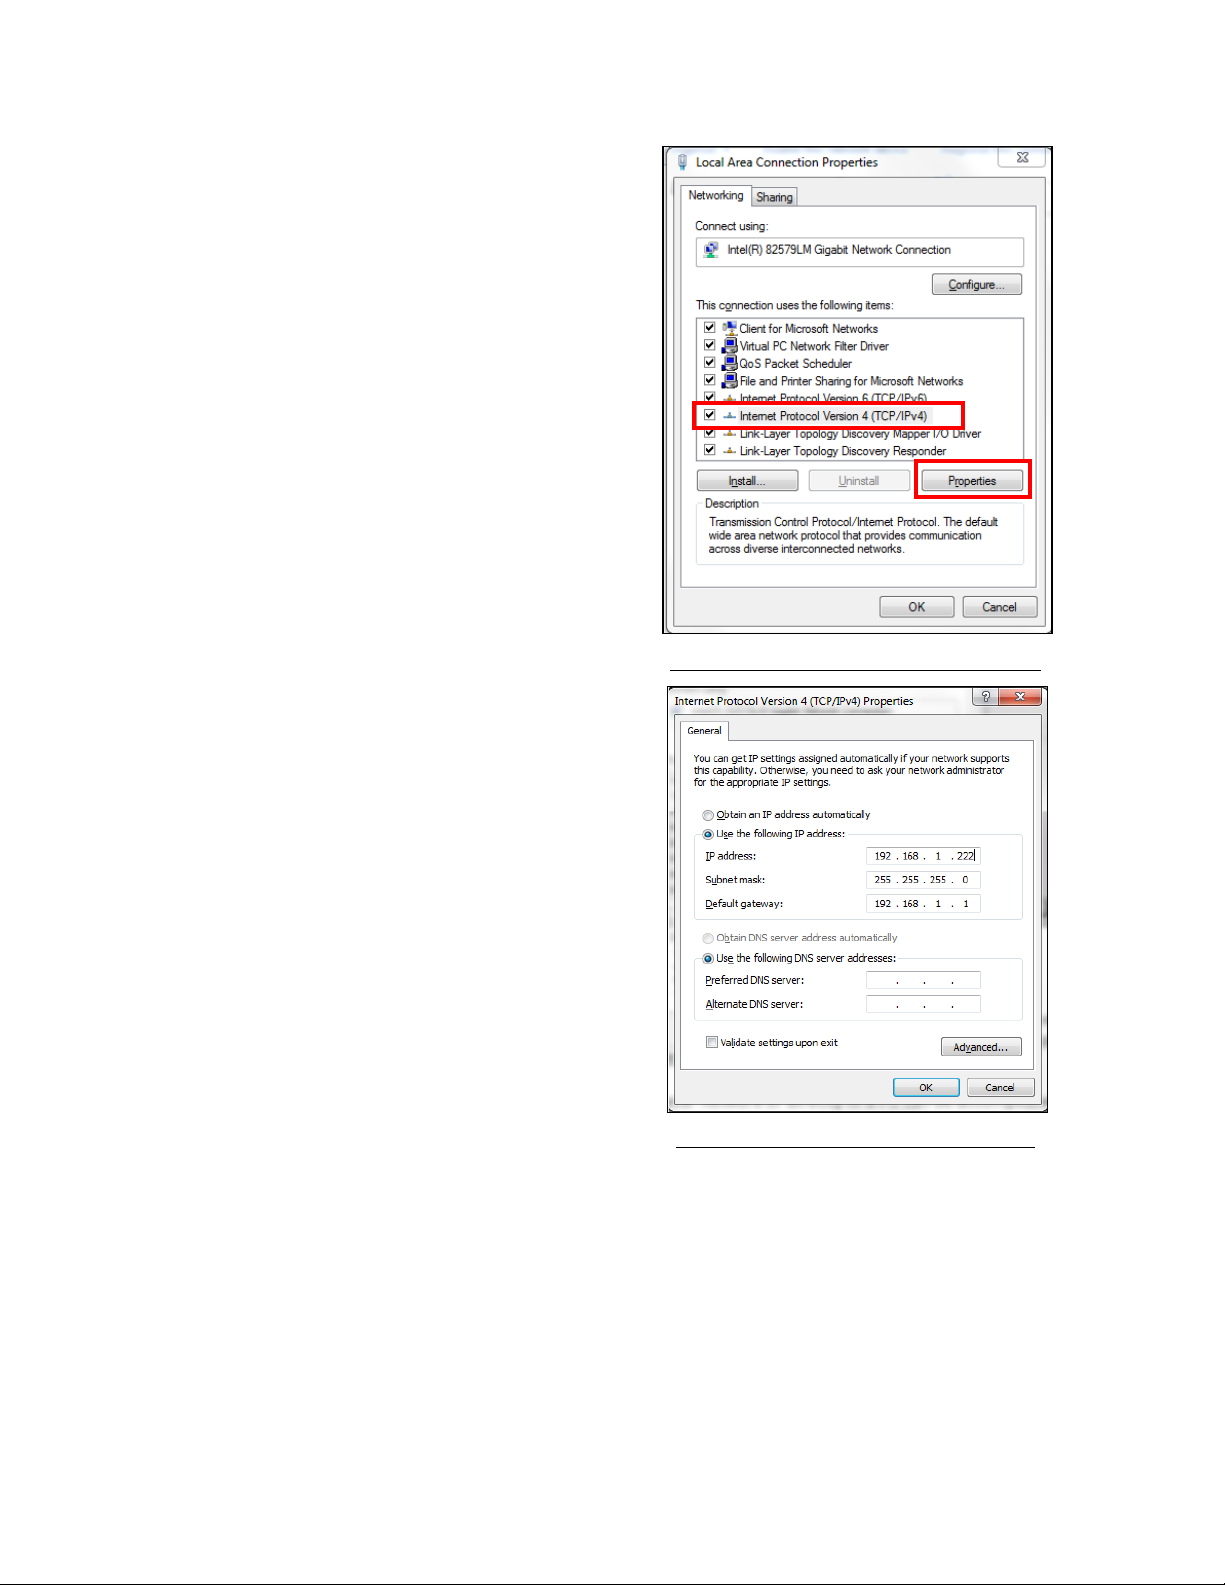
The network properties window will appear.
In the Internet Protocol Version 4 (TCP/IPv4)
Click on the line that reads “Internet Protocol
Version 4 (TCP/IPv4)” and then click Properties.
Properties window, you will need to select the
option for Use The Following IP Address. These
settings should match the settings on the Color
SDS Data Logger.
To change the network settings on your
computer you may need additional information.
If needed, please refer to the computer manual.
Figure 16 - Accessing TCP/IPv4 Properties
In Windows XP
The Properties can be changed by highlighting the connection and using the right mouse button
to click and select the Properties tab or by highlighting the connection and clicking on Change
setting of this connection.
Super Systems Inc. Page 16 of 104
Color Touch Screen Data Logger Operations Manual
Figure 17 - Changing IP address settings
Page 17
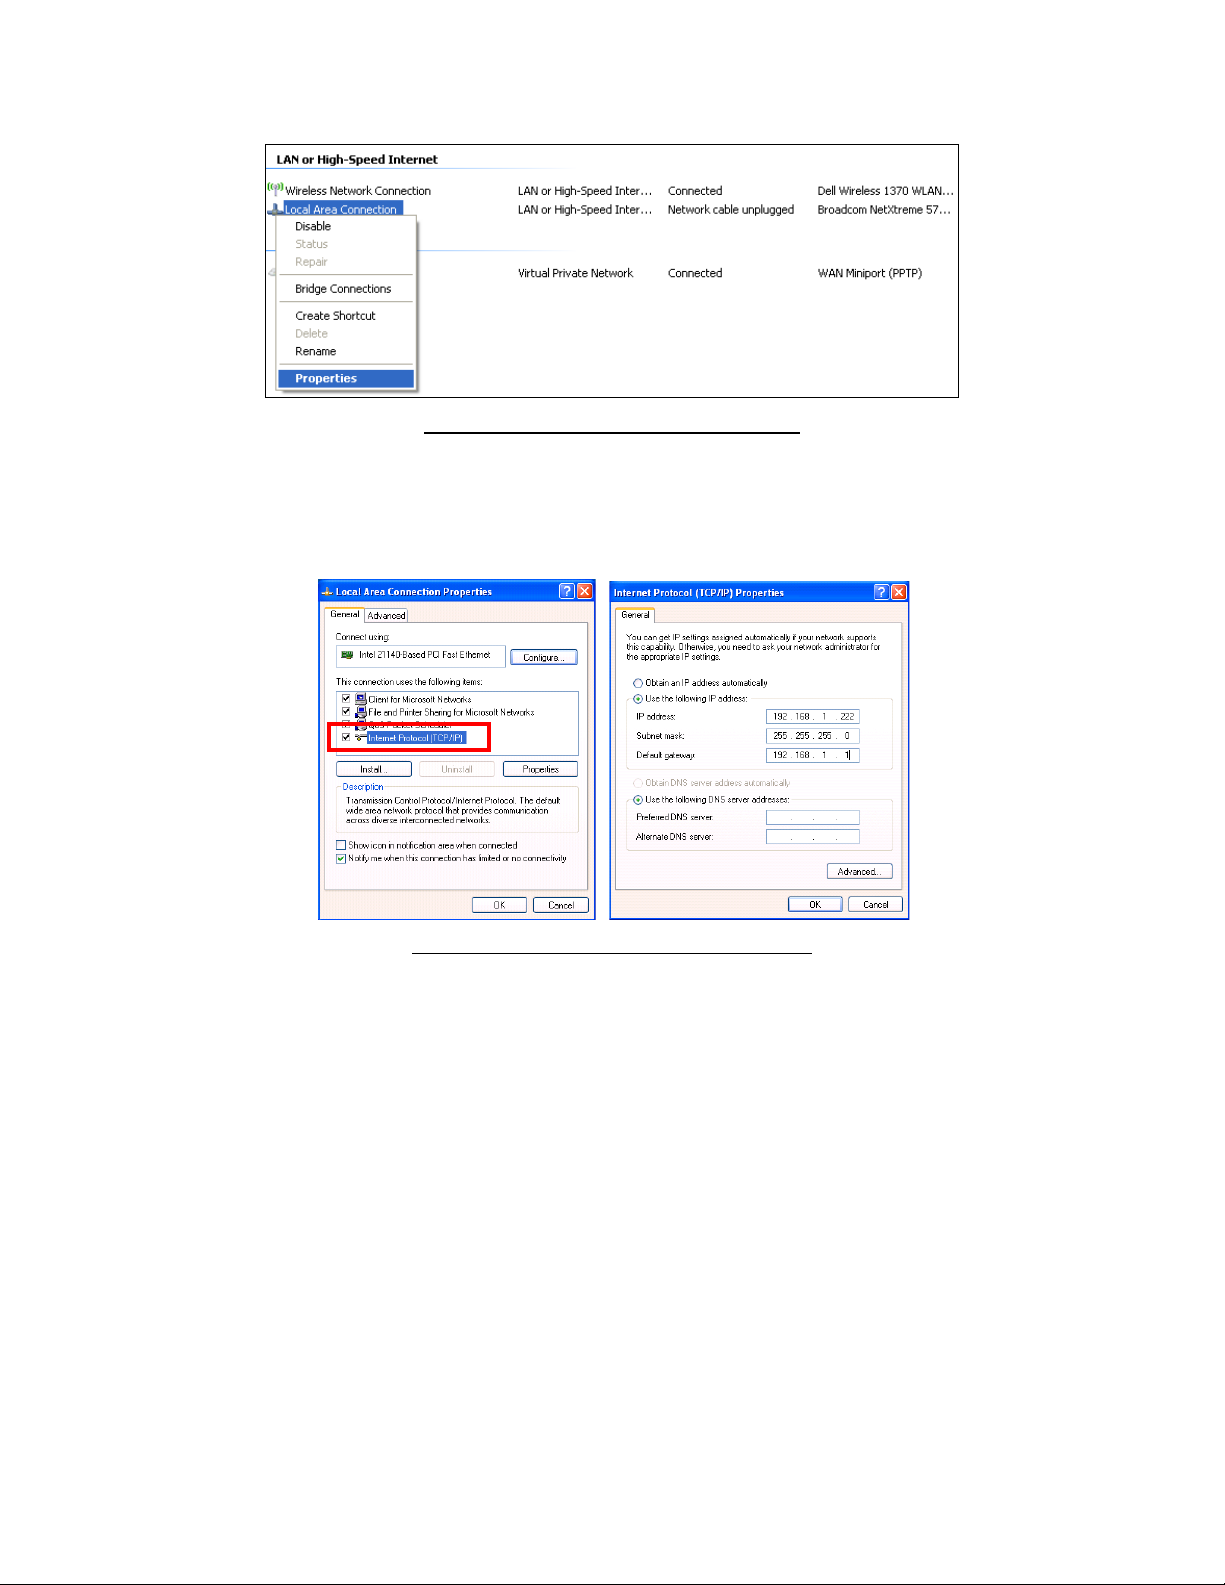
Figure 18 - Network Connection Properties
Once the Local Area Connection Properties screen is displayed, the Local Area Connection
Properties tab should be highlighted. Click on Internet Protocol (TCP/IP) and then click the
Properties button to display Internet Protocol (TCP/IP) Properties.
Figure 19 - Network Connection Dialog Boxes
In the Internet Protocol (TCP/IP) Properties window, you will need to select the option for Use
The Following IP Address. These settings should match the settings on the Color SDS Data
Logger.
To change the network settings on your computer you may need additional information. If
needed, please refer to the computer manual.
Connecting the SDS Data Logger to a Local Computer via USB
The data logger can be connected directly to a local computer using a USB cable and SDS
Reporter. Windows uses special software to transfer files and information between the data
logger and the local computer when connected via USB. If you are using Windows XP, this
software is called ActiveSync. If you are using Windows Vista or Windows 7, the software is
called Mobile Device Center. If the required software was not installed prior to installing
SDSReporter, the SDSReporter Setup utility (run from setup.exe) would have installed the
required software.
Super Systems Inc. Page 17 of 104
Color Touch Screen Data Logger Operations Manual
Page 18
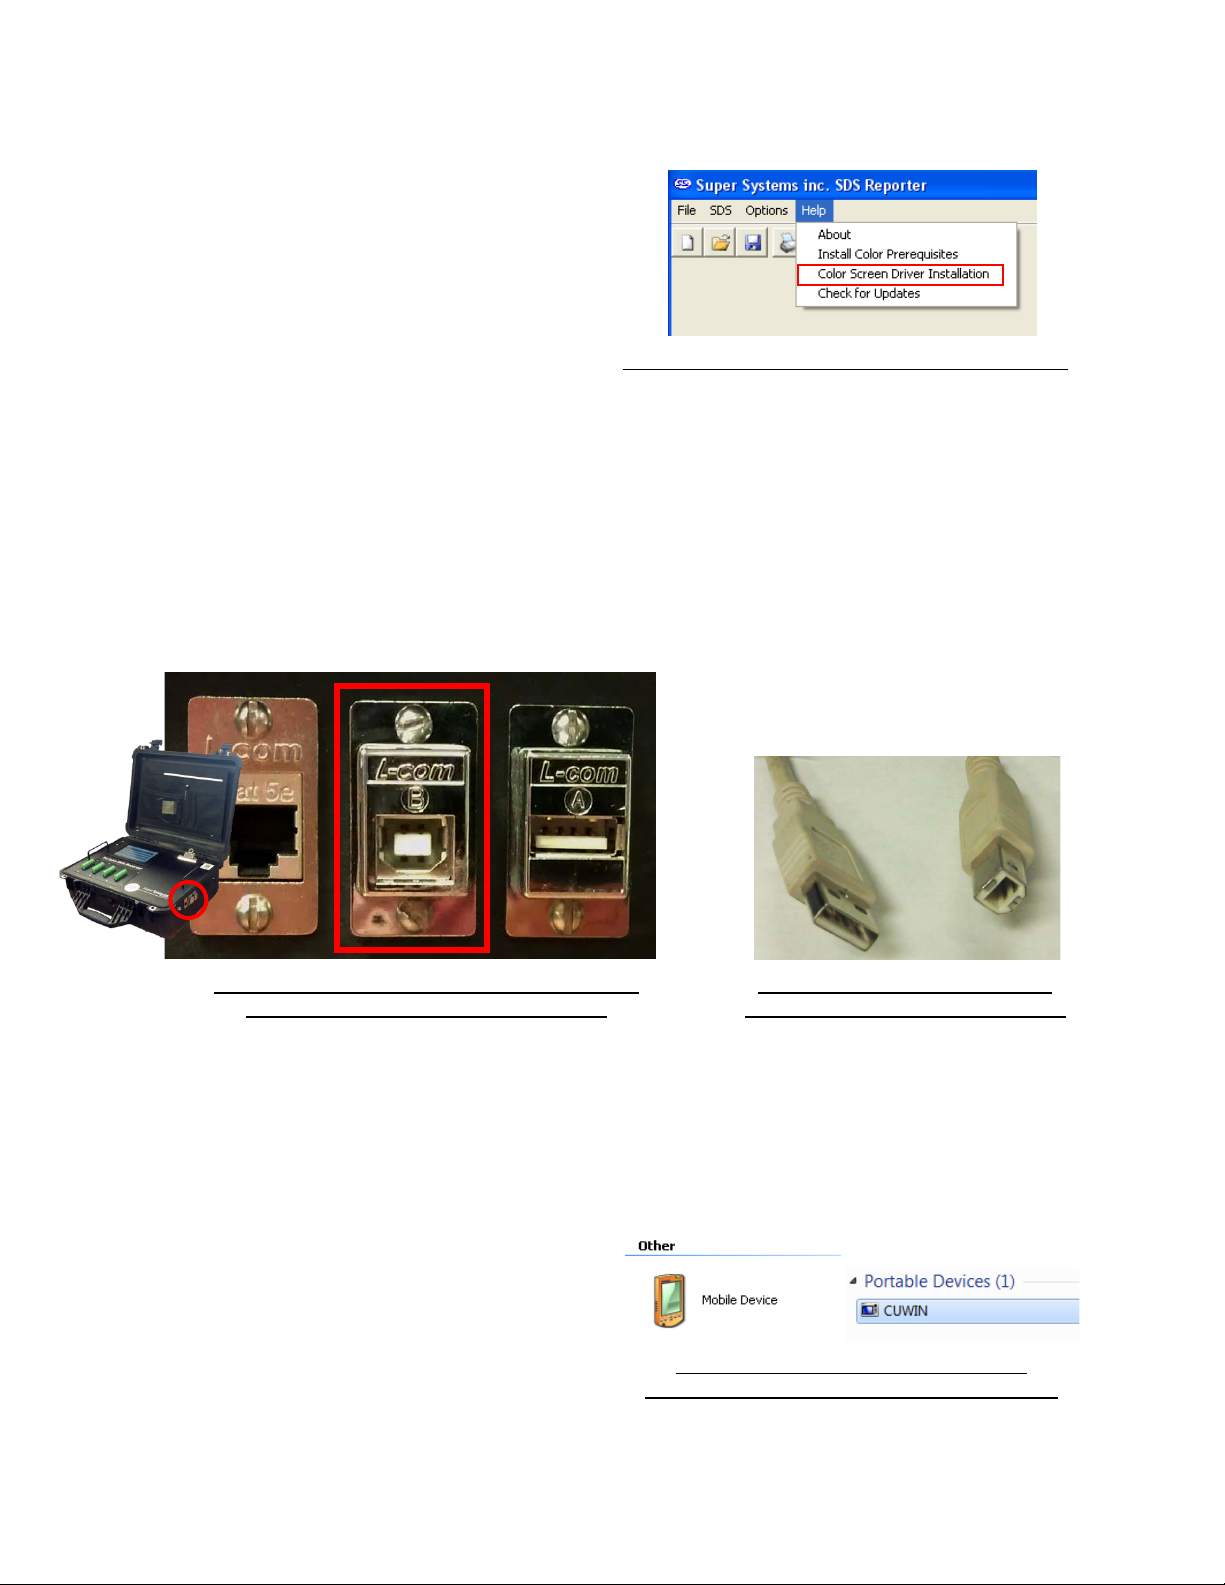
Windows XP requires a driver for it to properly
Help
NOTE: If there is any question as to whether
shown in Figure 23. Other devices, such as
connect to the data logger’s color touch
screen operating system. Install this driver, if
necessary, by selecting the “Check Screen
Driver Installation” option under the
menu in SDSReporter (
Figure 20), and then
clicking “Start Driver Installation” on the next
screen.
Figure 20 - Color Screen Driver Installation option
If you are using an older version of SDSReporter, be sure to update it by clicking “Check for
Updates”, also in the
Help menu, and then downloading the update when prompted.
To connect the SDS Data Logger to a local computer with USB, first make sure that the data
logger is turned on and that the SDS software is running on the touch screen. Next, identify the
USB connection point used to connect the data logger to the local computer (shown in Figure
21). To connect the data logger to the computer, you will need a USB cable with cable ends that
look like those in Figure 22.
Figure 21 - Location of USB connection point for
connecting data logger to local computer
Connect the SDS Data Logger to the local computer via USB. If you are connecting the data
logger to the computer via USB for the first time, you may see a message on the screen saying
that Windows is installing drivers, especially on Windows Vista and 7. Windows may also ask you
if you want to set up the device. If this happens, allow Windows to install the drivers, but close
the device setup window from ActiveSync or Mobile Device Center.
the computer is detecting the data logger and
connecting to it properly, check the “My
Computer” window in Windows XP or the
“Computer” window in Windows Vista and 7.
The data logger should appear in this window
with a mobile or portable device icon, as
Super Systems Inc. Page 18 of 104
Color Touch Screen Data Logger Operations Manual
Figure 22 - USB connection types
Figure 23 - Data Logger Device Icons in
Windows XP (left) and Windows 7/Vista (right)
Standard-A (left), Standard-B (right)
Page 19
smartphones, may also appear as part of the
same list.
To access the web portal, first open a web
Once the SDS Data Logger is connected to the computer via USB, start SDS Reporter.
Web Portal
The Color SDS Data Logger features a web-based portal that can be accessed by web browser,
using Ethernet, from any computer that is connected to the same network as the data logger.
The web portal displays current temperature readings for each thermocouple input.
browser (such as Internet Explorer or Firefox).
Next, in the location bar, type
http://
followed
by the IP address of the data logger. One way
of finding this IP address is to obtain it from
the Instrument Information window, as shown
in
Figure 24.
Figure 24 – Instrument Information screen and IP
address
Once you’ve entered the needed web address, you will see a screen that looks like the following
one.
Home Screen
The default Home Screen for the SDS will display the temperature at each channel. The grey
bar along the top represents the 4 analog boards and the numbers along the left-hand side
represent the 5 channels for each board.
Super Systems Inc. Page 19 of 104
Color Touch Screen Data Logger Operations Manual
Figure 25 - Web Portal Screen
Page 20
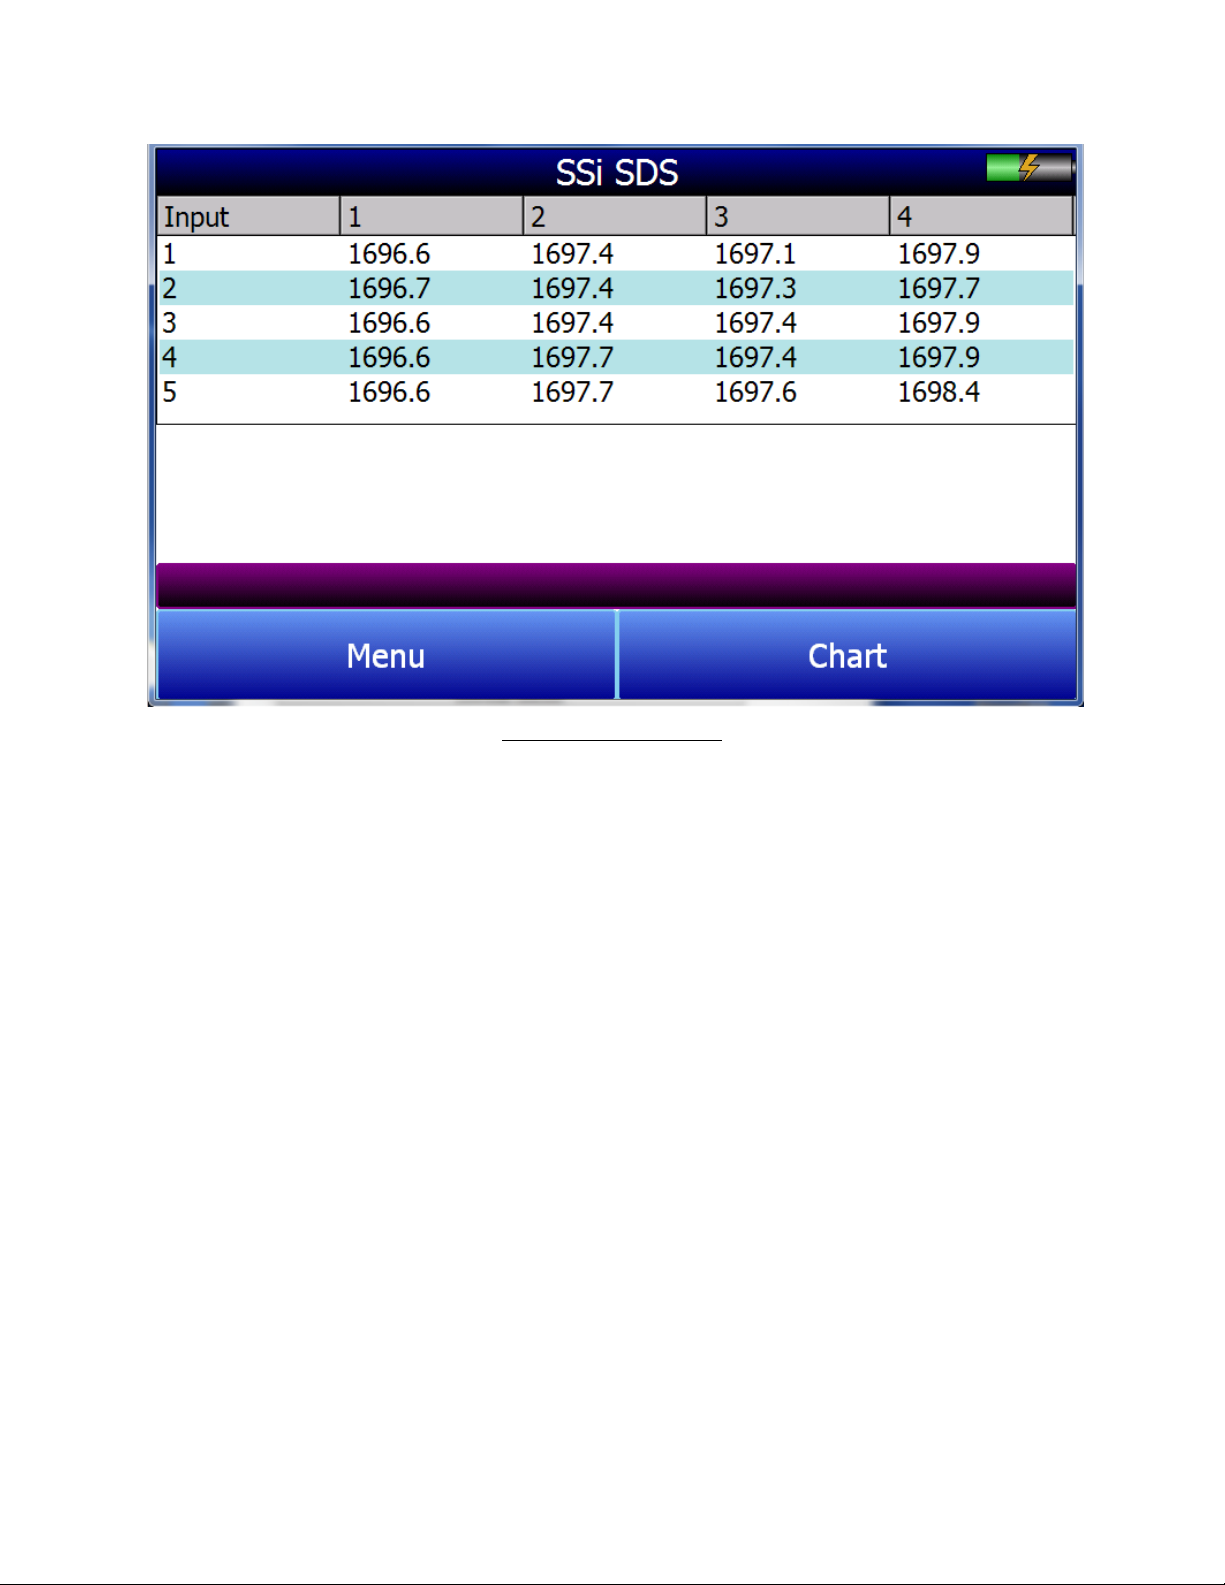
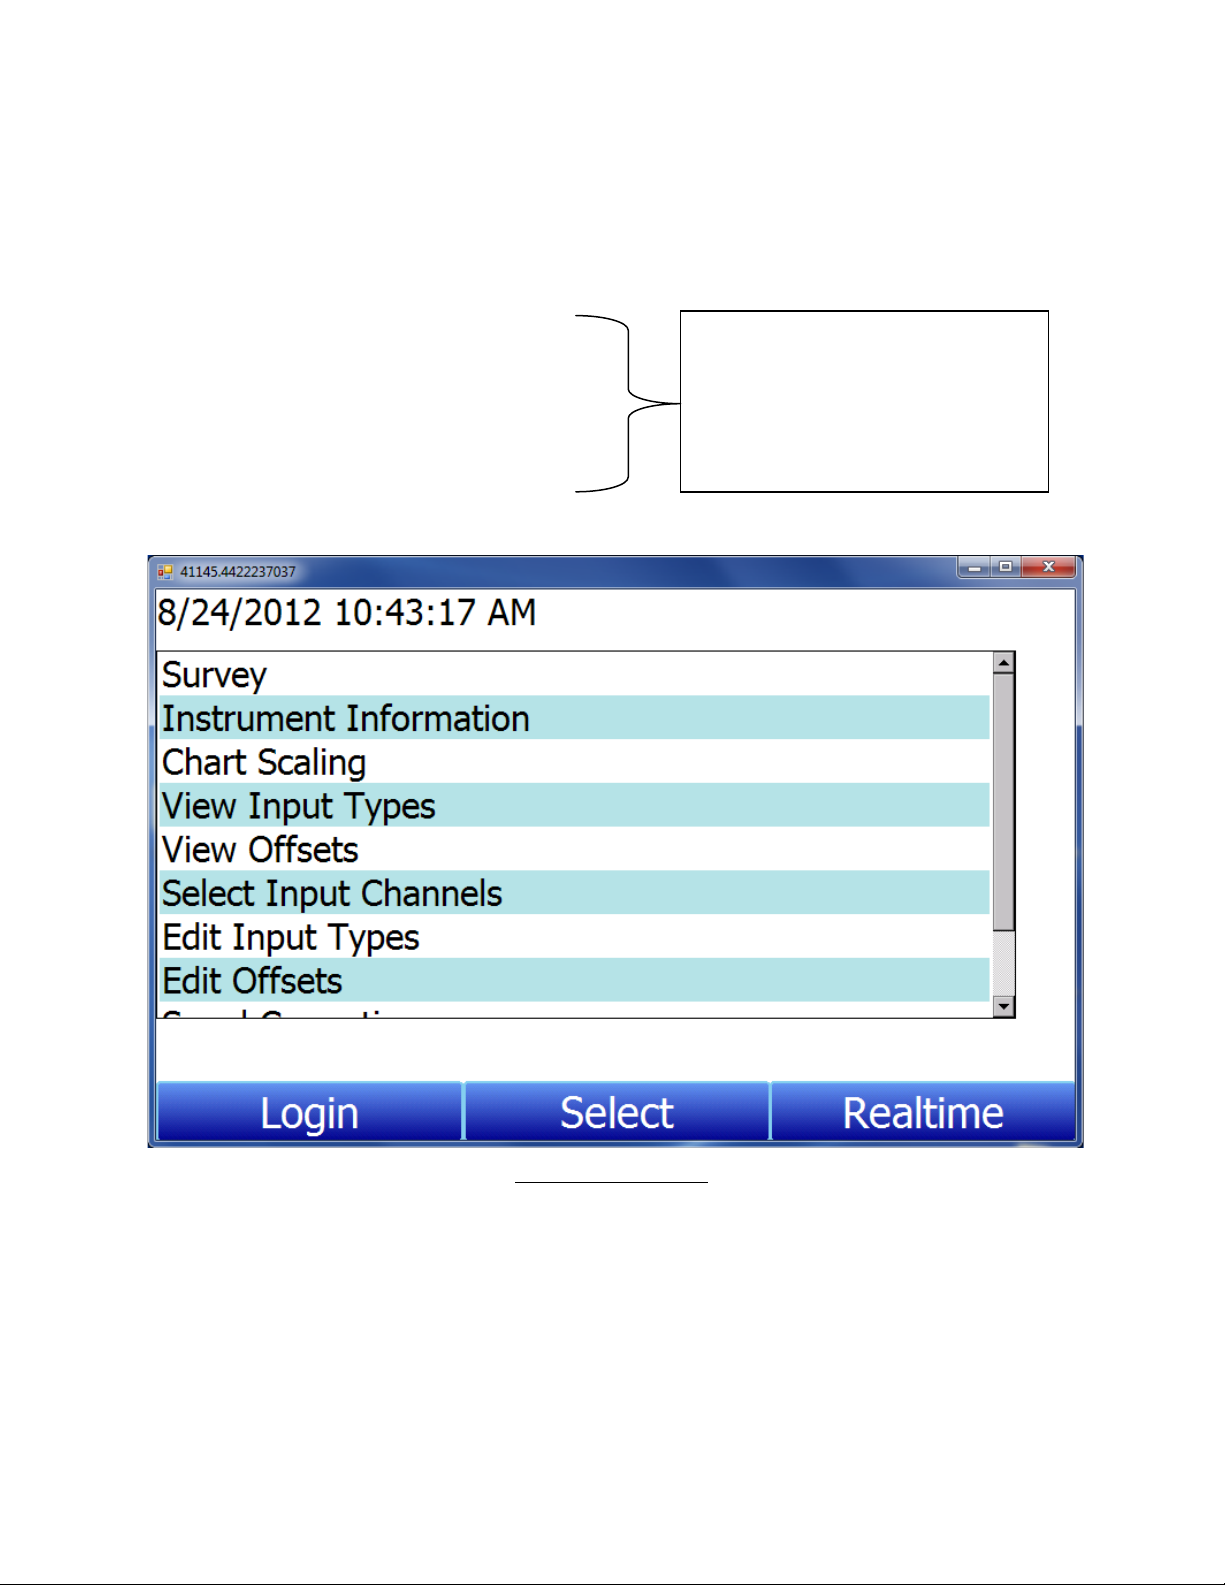
Figure 26 - Home Screen
Menu
Menu contains the list of operations that the SDS performs as well as other information about the unit.
The viewable Menu items change depending on the login value. The complete list of Menu items
includes:
User-Level Access (or Higher) Required:
• Survey
• Instrument Information
• Chart Scaling
• View Input Types
• View Offsets
• Select Input Channels
• Edit Input Types
• Edit Offsets
• Spool Correction
• About
Supervisor Access (or Higher) Required:
• Voltage Calibration
• CJ Trim
• Datalog Deletion
Super Systems Inc. Page 20 of 104
Color Touch Screen Data Logger Operations Manual
Page 21
Please call Super Systems Inc.
Control, or Modbus Control.
Administrator Access (or Higher) Required:
• Passcodes
• Cold Junction Thermistor Calibration
• Full Data Action
• Exit Program
Highest Level Security Access Required:
• Configuration
• Reset Calibration Dates
• Set Nominals
• Set K Factors
• SDX Control
• Modbus Control
Technical Support (800-666-4330)
before attempting to access any of
these Menu items: Configuration,
Reset Calibration Dates, Set
Nominals, Set K Factors, SDX
Survey
This option contains the survey information and the controls to perform a survey. The
appropriate template can be chosen from the dropdown menu in the top right-hand
corner. The Edit Template button allows for changes to be made to the selected survey.
When editing a survey, pressing OK will make changes only for that particular survey,
while pressing Save will permanently change the template. The View Surveys button
will display a list of previous surveys from the selected time range. Once the template
Super Systems Inc. Page 21 of 104
Figure 27 - SDS Menu
Color Touch Screen Data Logger Operations Manual
Page 22
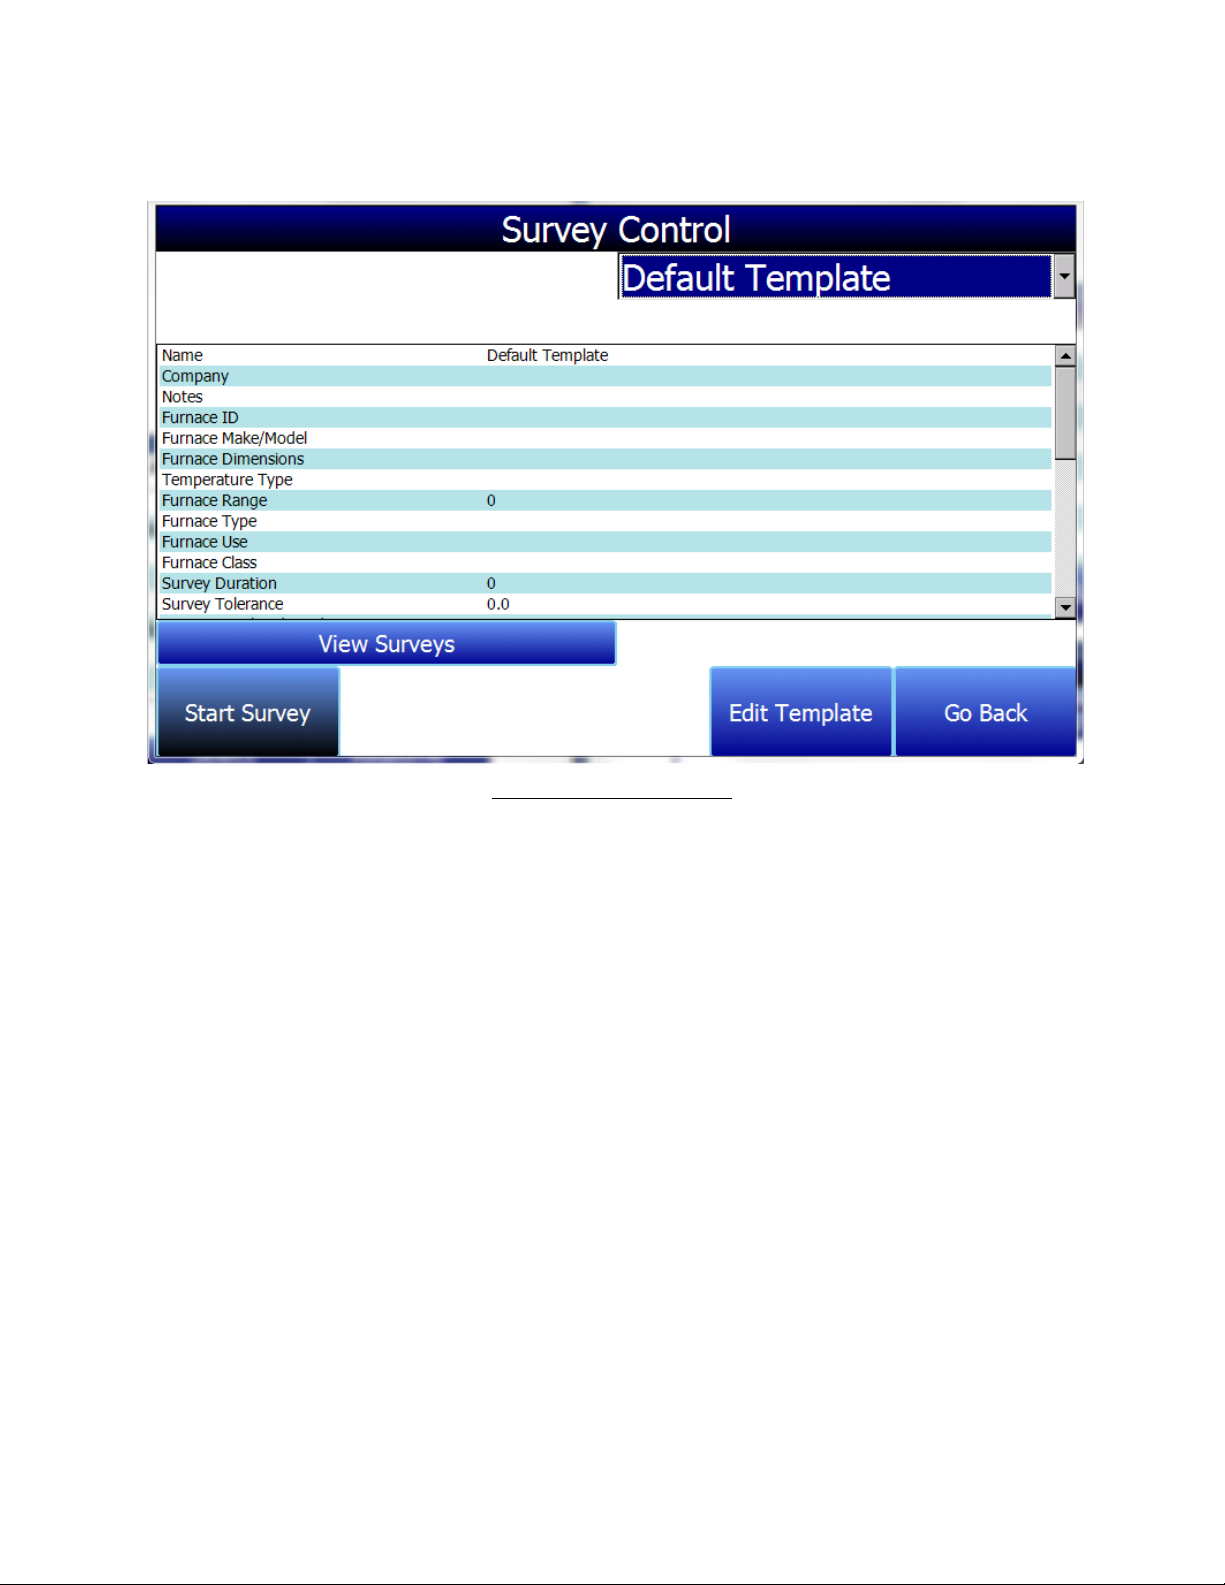
has been selected and any necessary edits have been made, press Start Survey to
begin.
Figure 28 - Survey Window
Super Systems Inc. Page 22 of 104
Color Touch Screen Data Logger Operations Manual
Page 23
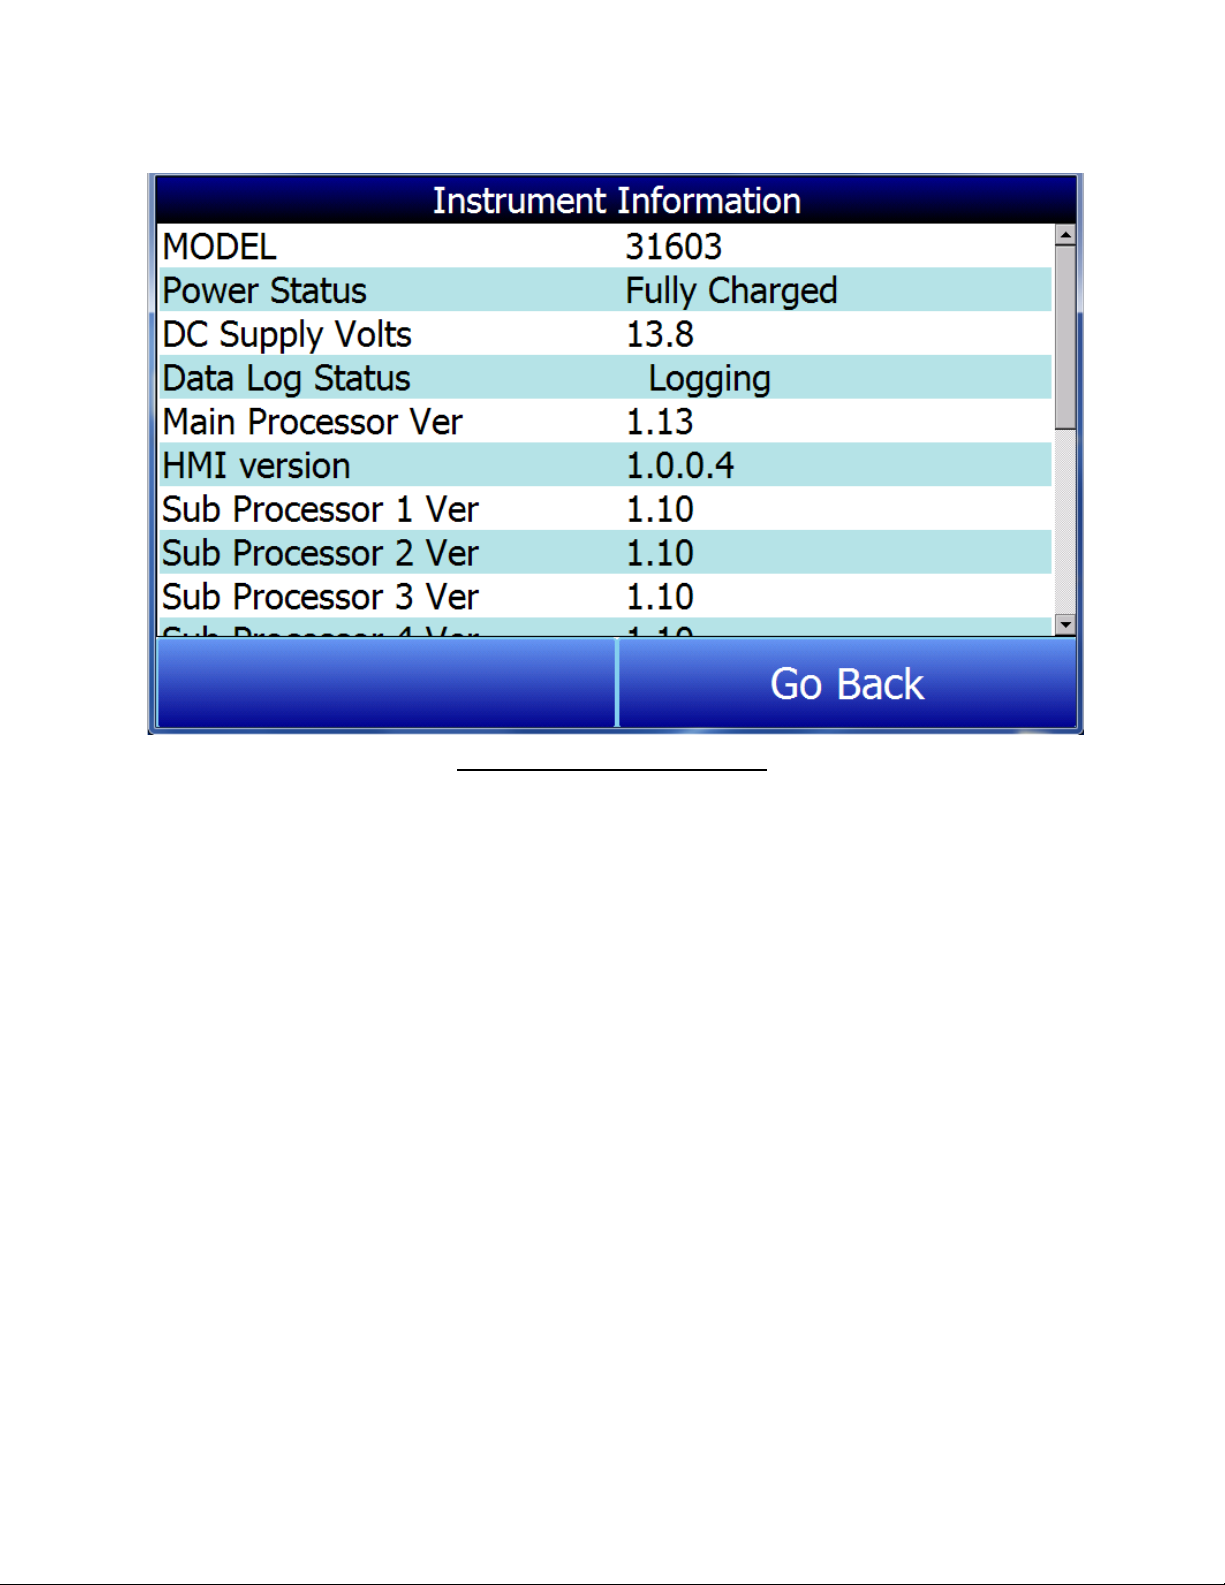
Instrument Information
Figure 29 - Instrument Information
Instrument Information displays the condition of several parameters for the SDS, and no
changes can be made to this screen.
Super Systems Inc. Page 23 of 104
Color Touch Screen Data Logger Operations Manual
Page 24
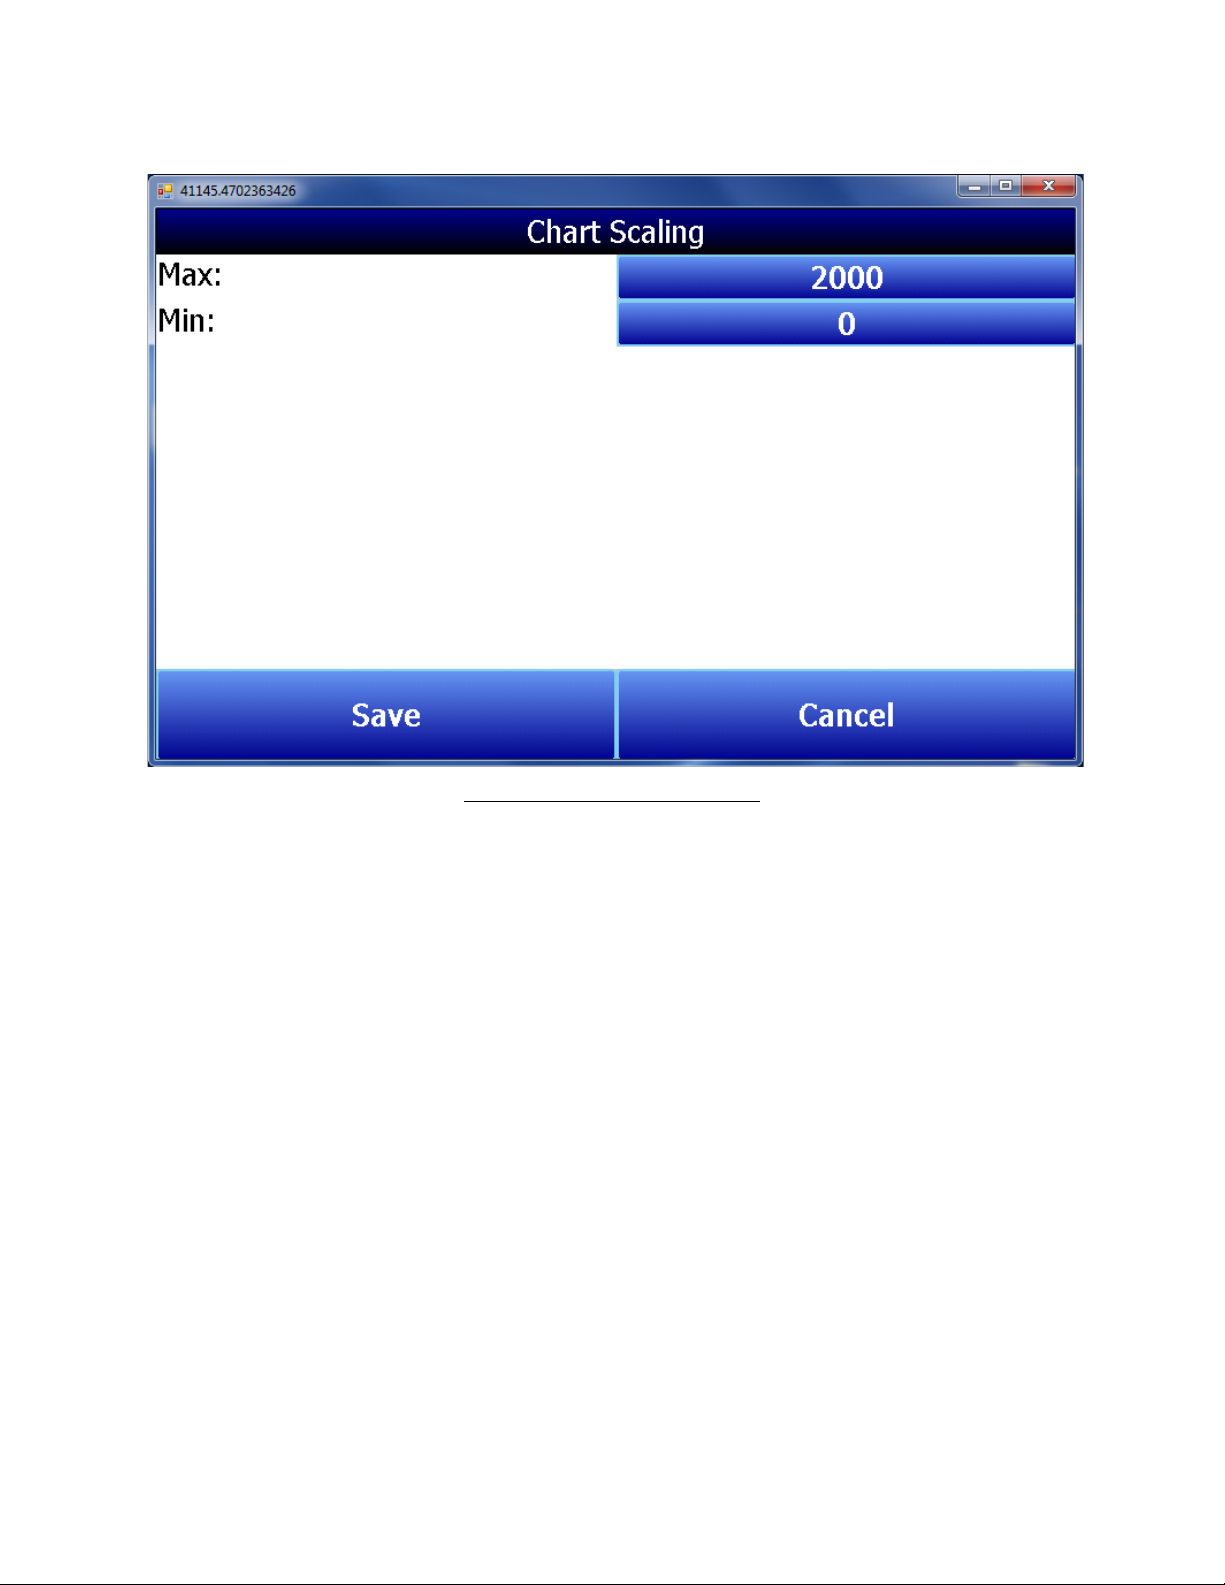
Chart Scaling
Figure 30 - Chart Scaling Window
Chart scaling allows the user to adjust the maximum and minimum degrees displayed
on the chart. To change, press the blue button with the max or min number, press OK,
then press Save.
View Input Types
This menu option displays the thermocouple type for each of the 20 channels. No
changes can be made to this screen.
Super Systems Inc. Page 24 of 104
Color Touch Screen Data Logger Operations Manual
Page 25
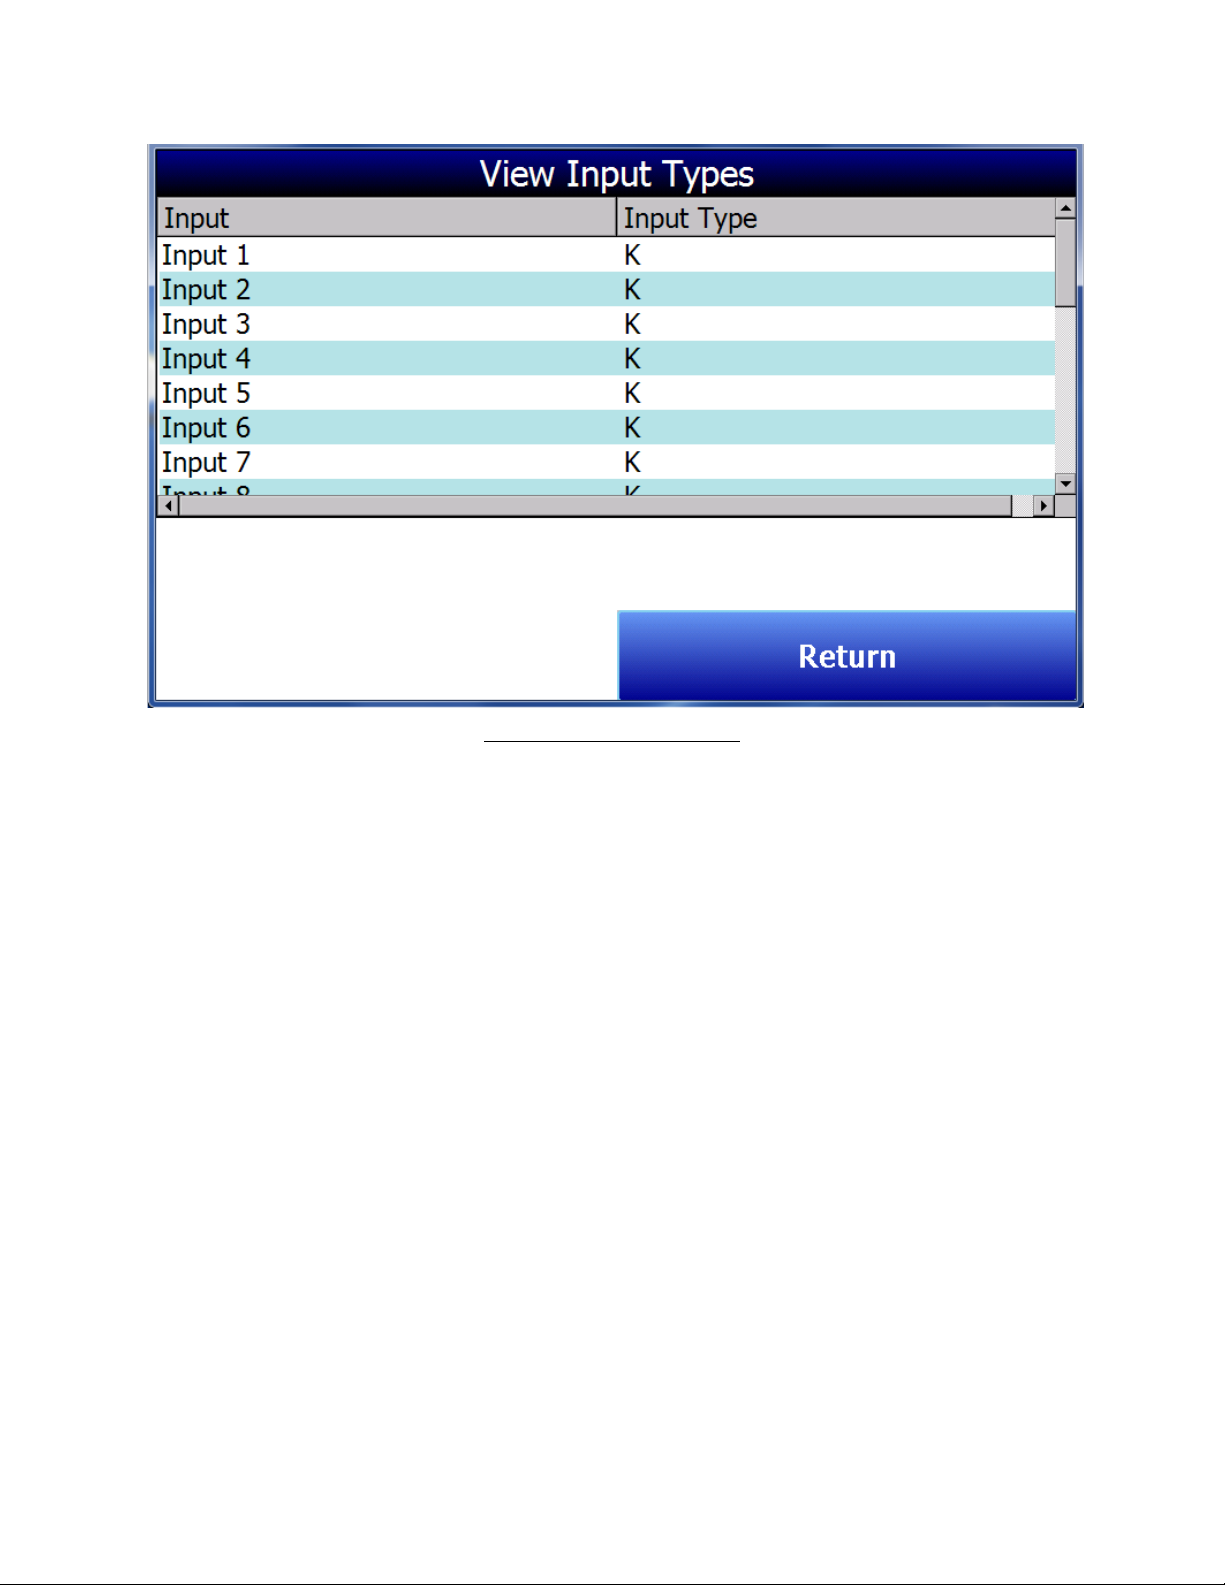
Figure 31 - View Input Types
View Offsets
View Offsets displays the offset values for each thermocouple channel on the SDS. No
changes can be made to this screen.
Super Systems Inc. Page 25 of 104
Color Touch Screen Data Logger Operations Manual
Page 26
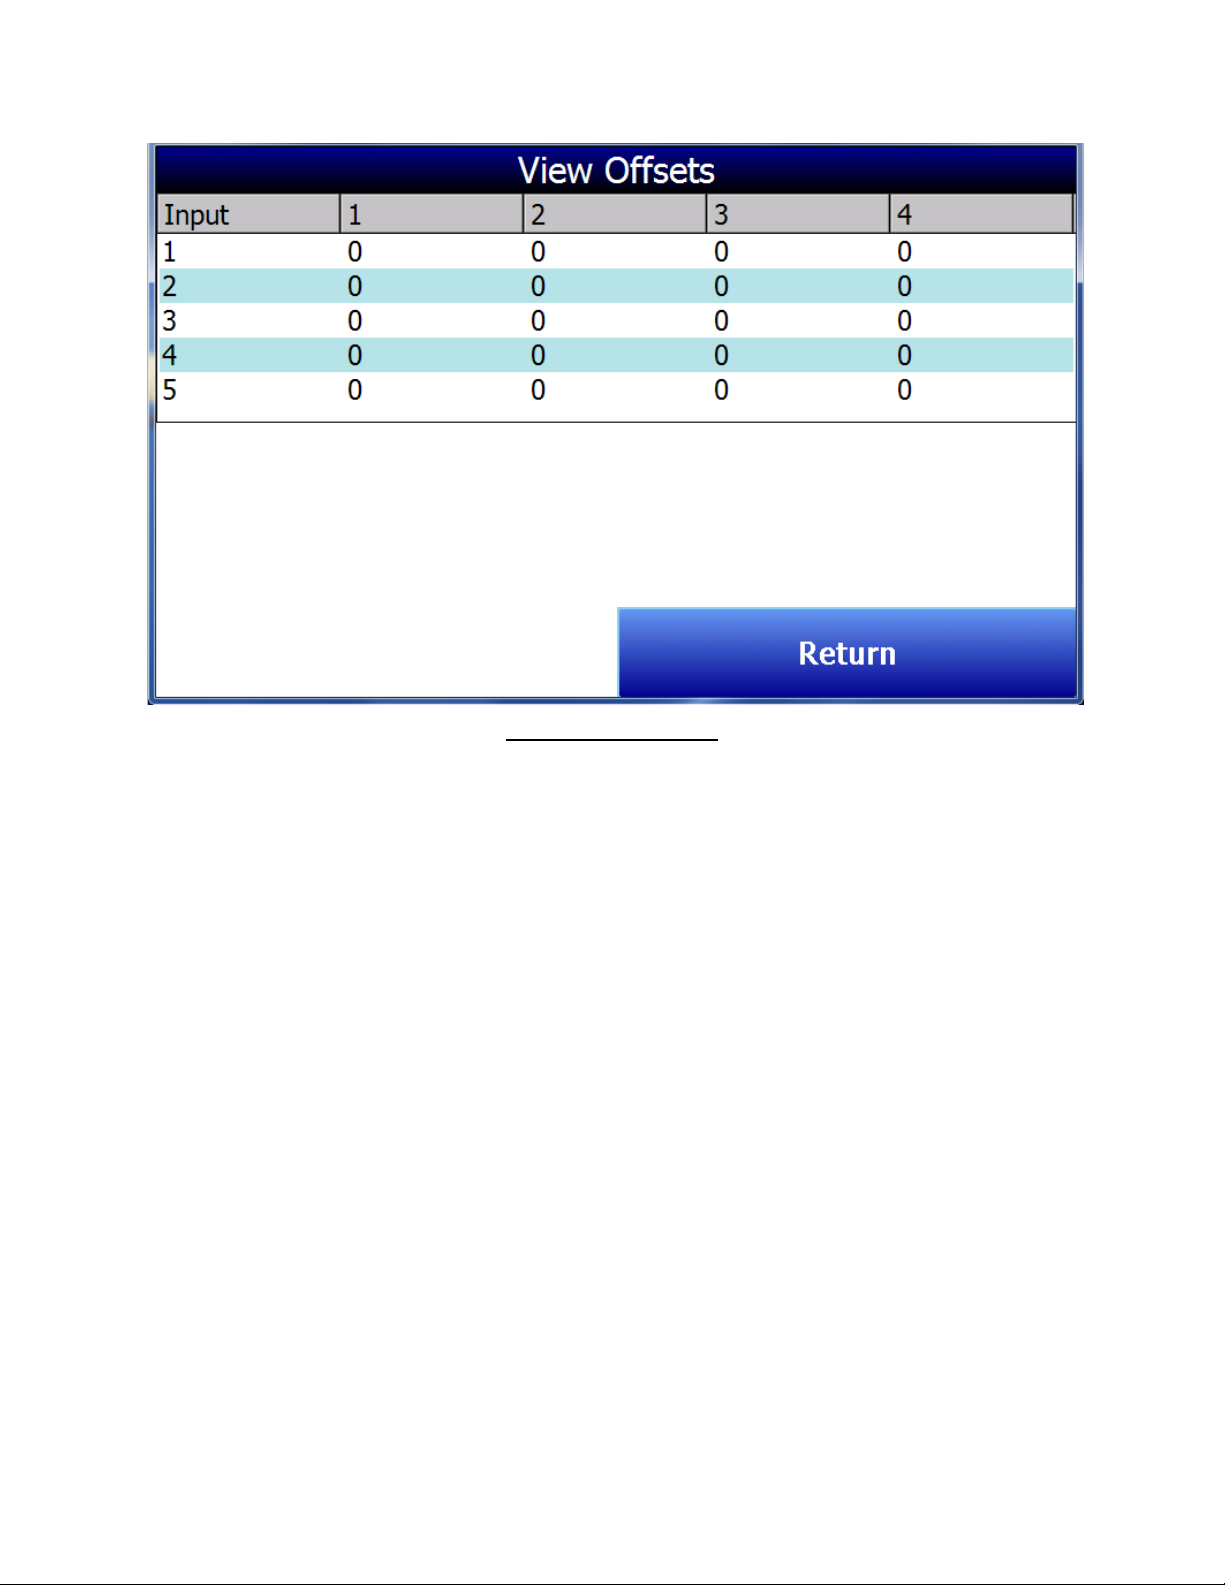
Figure 32 - View Offsets
Select Input Channels
Select Input Channels allows the user to manually determine whether a thermocouple
is included in a survey or not while the survey is running. First press Select Inputs.
Then, highlight the Input # to toggle between Select/Deselect. To save changes, press
OK.
Super Systems Inc. Page 26 of 104
Color Touch Screen Data Logger Operations Manual
Page 27
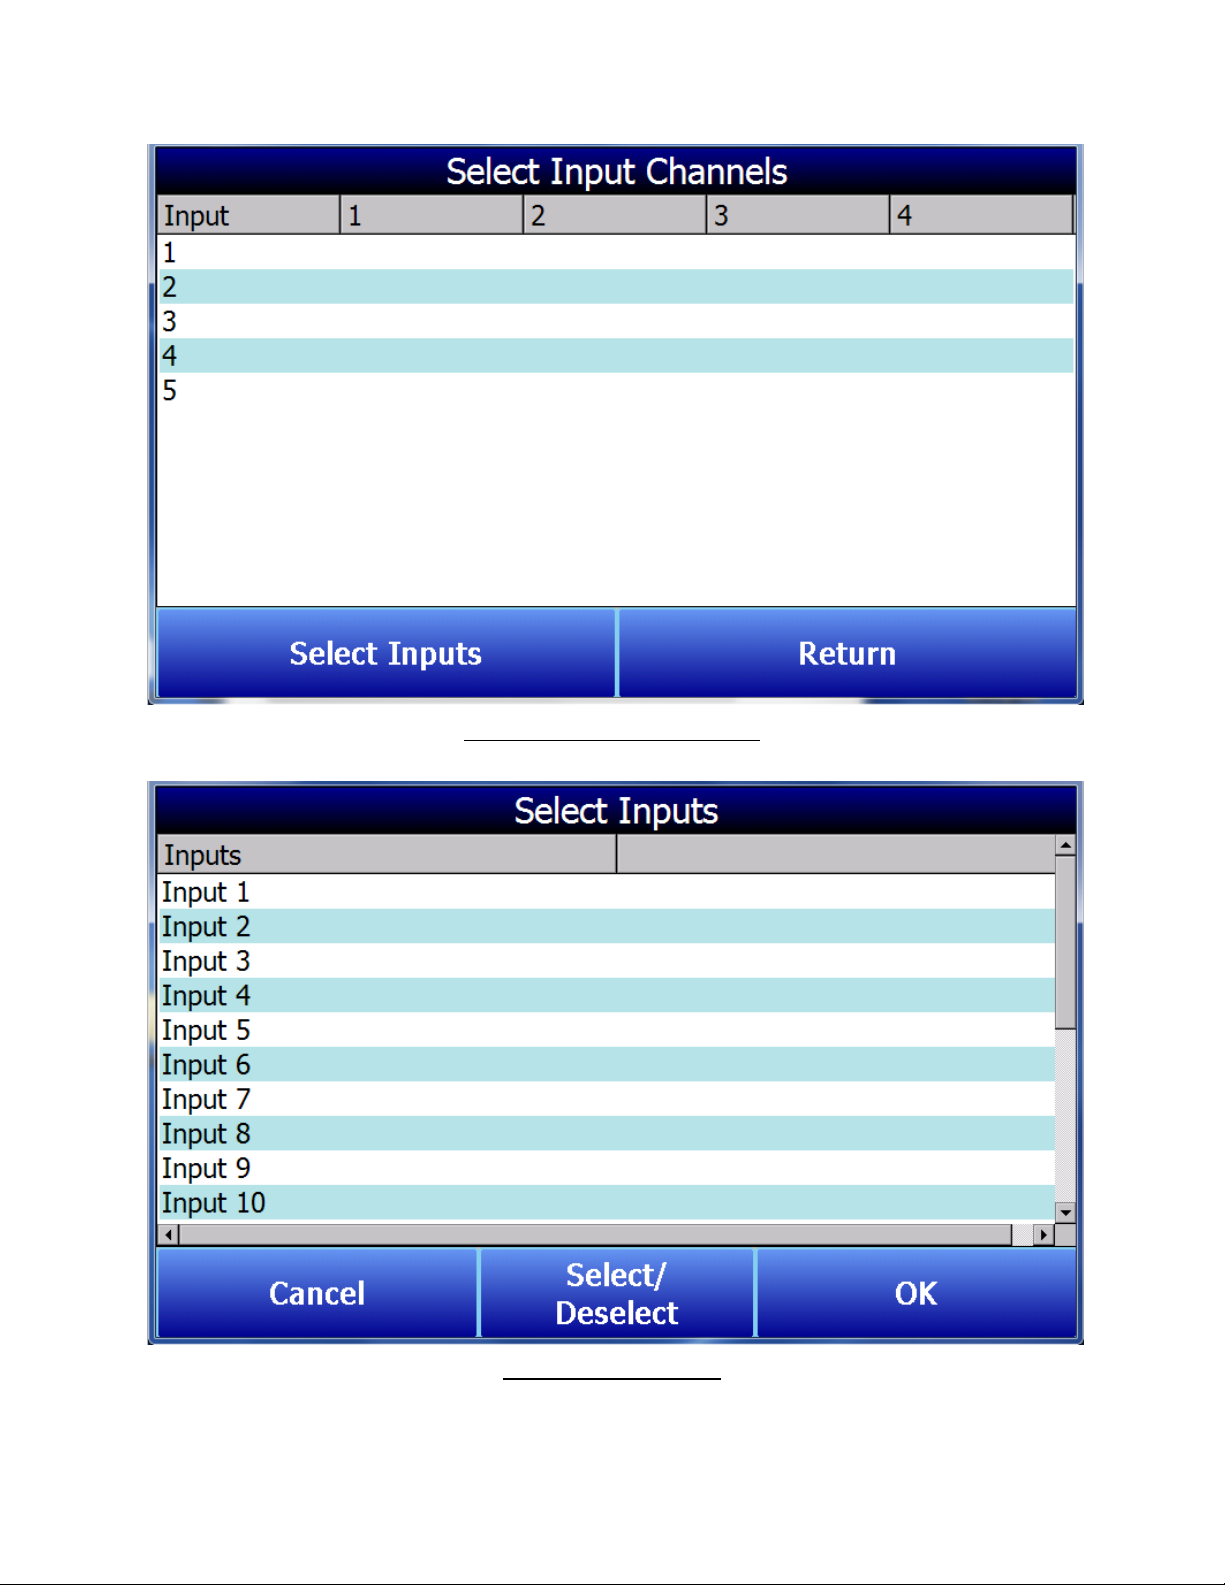
Figure 33 - Select Input Channels
Figure 34 - Select Inputs
Super Systems Inc. Page 27 of 104
Color Touch Screen Data Logger Operations Manual
Page 28
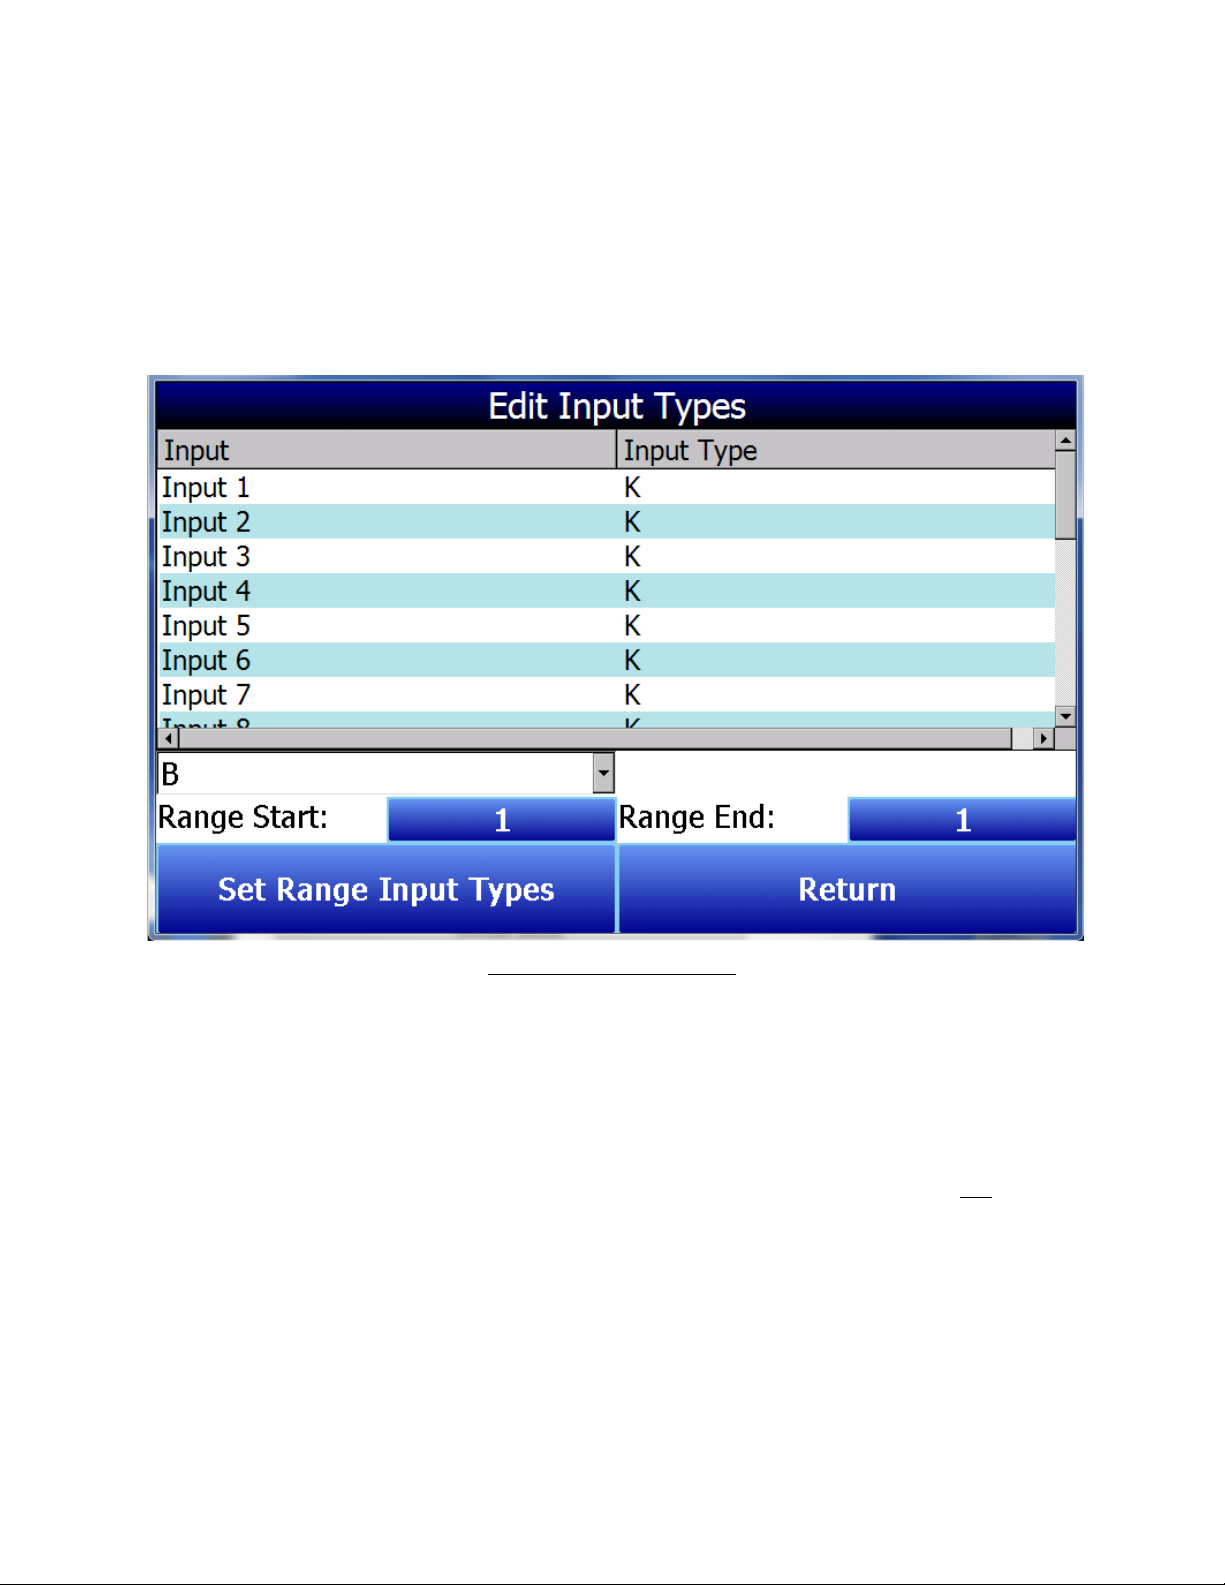
Edit Input Types
Edit Input Types allows the type of thermocouple to be changed for any channel. The
drop-down bar contains a list of thermocouple types. Select the appropriate
thermocouple types. The Range Start and Range End correspond to the channels of the
SDS that will be changed. To change only one channel, set the Range Start and Range
End both to that number. To change all channels, the Range Start will be 1 and the
Range End will be 20. Any interval in between can also be used. Press Set Range Input
Types to save.
Figure 35 - Edit Input Types
Edit Offsets
The Edit Offsets option will change the offset for each thermocouple. Press the blue
number button next to Select Input and enter the appropriate channel number. Press
OK. Then enter the Offset Value and press OK.
NOTE: These offsets should be used to address the calibration report parameters to
correct for a known deviation by individual channel at a specific temperature OR to
compensate for an individual thermocouple wire for each channel. All offsets that are
used can be displayed on the final report using the reporting tags.
Super Systems Inc. Page 28 of 104
Color Touch Screen Data Logger Operations Manual
Page 29
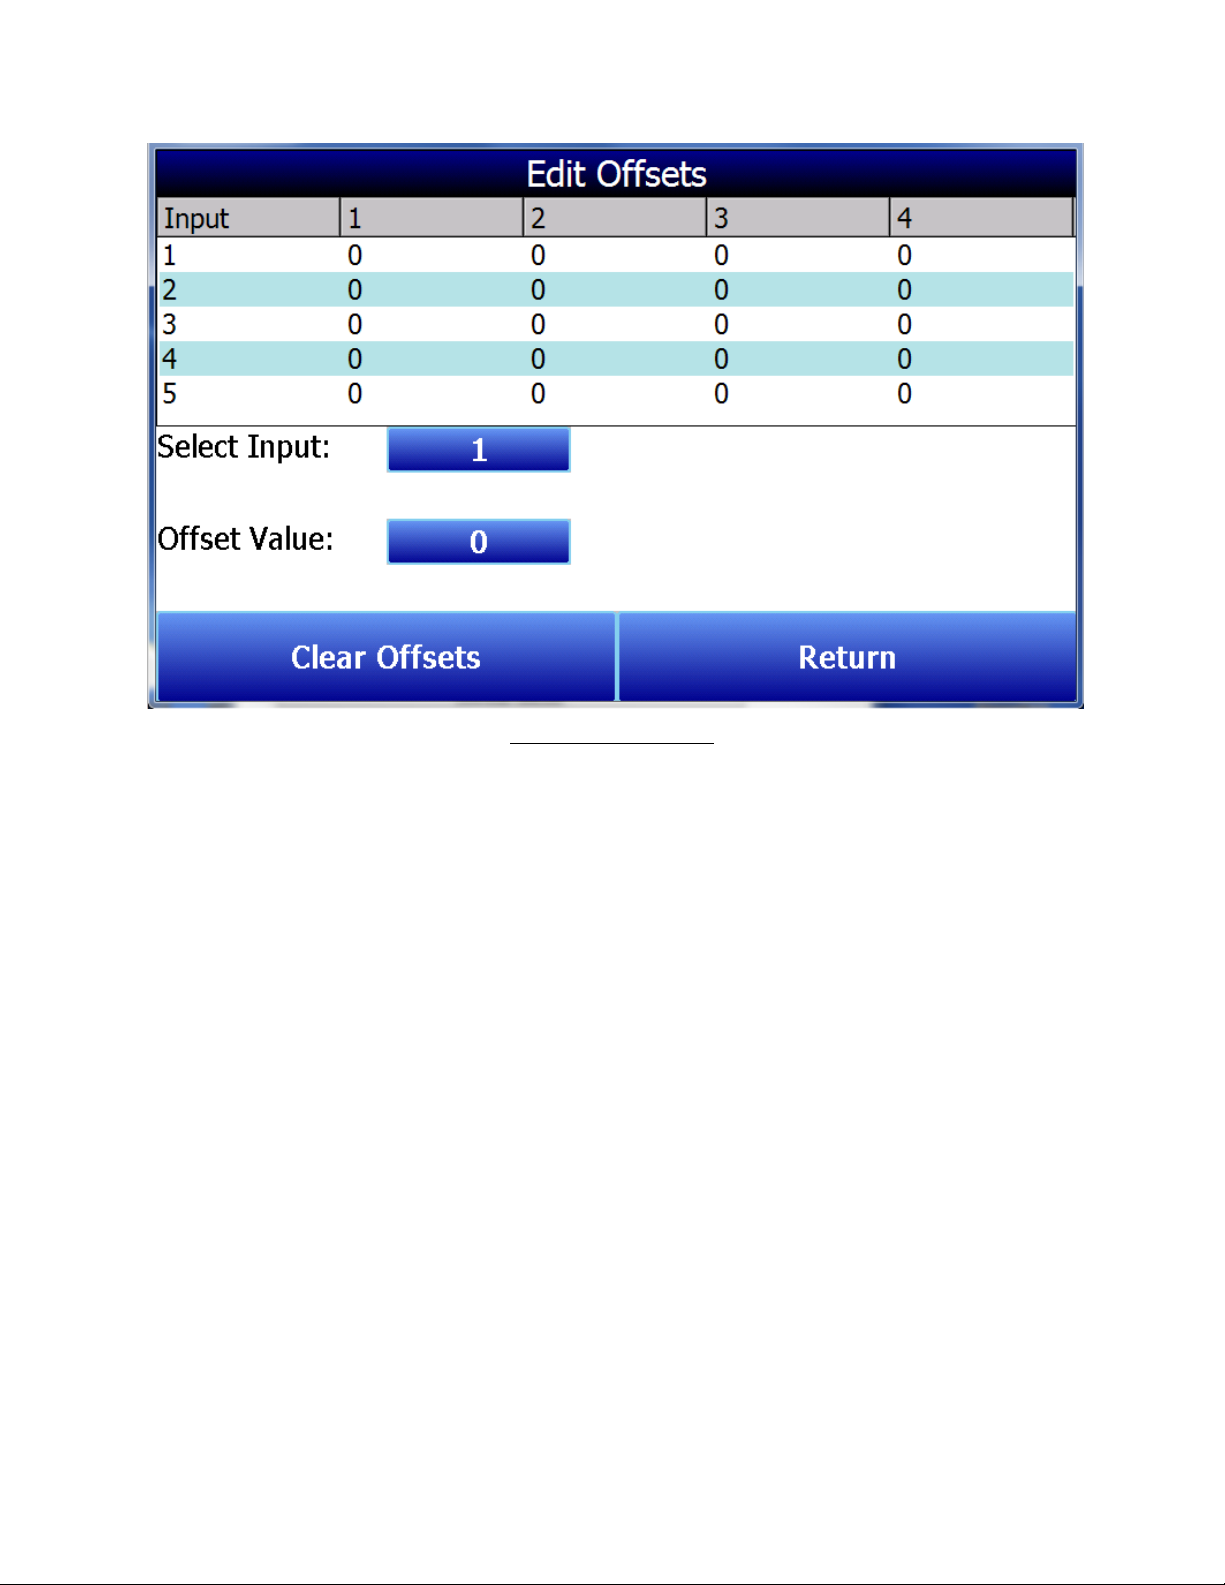
Figure 36 - Edit Offsets
Spool Correction
This menu item allows the thermocouple Spool Correction to be modified. First select
the temperature type from the drop down menu, then enter the spool correction value
and press Set Spool Correction to save. Press return to go back to the Menu list. The
thermocouple spool correction can be used to before a survey is run so that the data
displayed is corrected. You can also enter the TC offset in after the survey is completed
using the SDS Reporter software.
Super Systems Inc. Page 29 of 104
Color Touch Screen Data Logger Operations Manual
Page 30
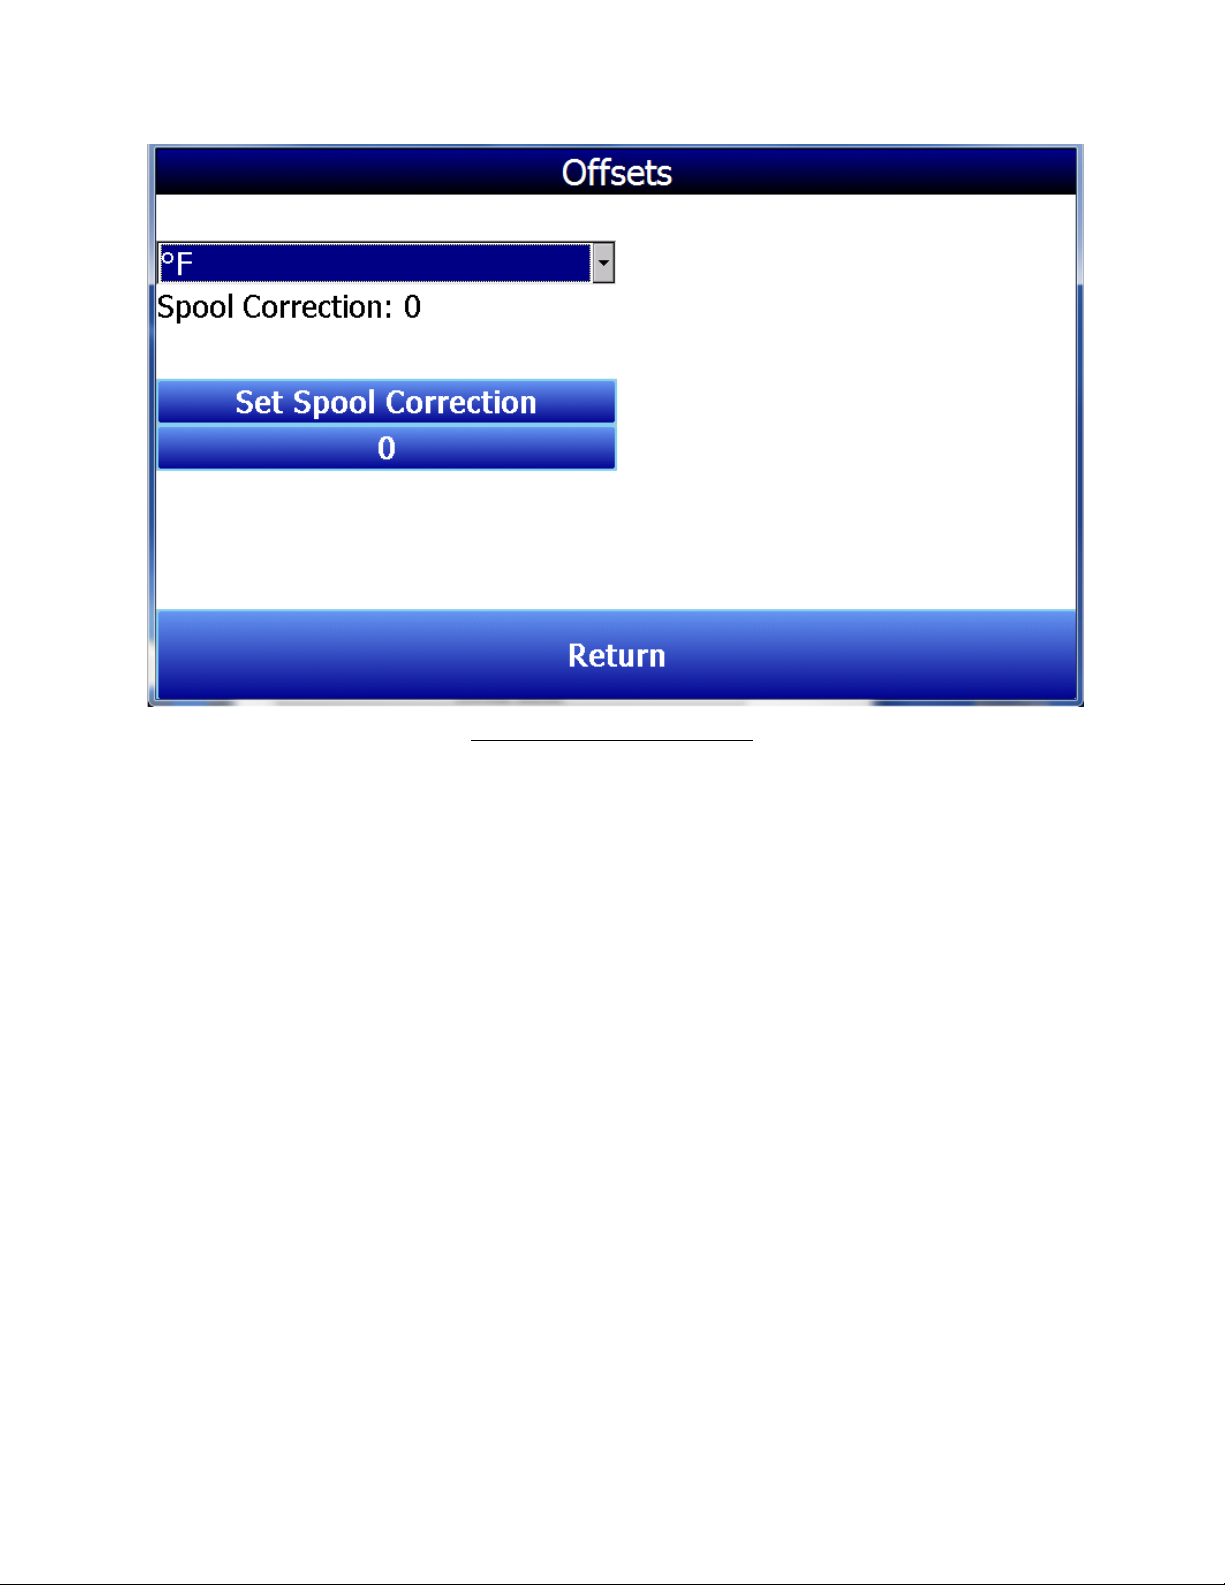
Figure 37 - Set Spool Correction
About
This screen will display basic information about the SDS including the version and the
serial number. Nothing on this screen can be changed.
Super Systems Inc. Page 30 of 104
Color Touch Screen Data Logger Operations Manual
Page 31

Figure 38 - The About Screen
IMPORTANT:
Do not perform any of these calibrations without a sourcing device that is properly
additional calibration steps.
Calibration
Before using the SDS Data Logger in surveys, it is essential to ensure that the unit is properly
calibrated. This means that
are converted (scaled) to values that accurately reflect the
the user will typically need to perform (before using the data logger in surveys) are the Voltage
Calibration and Cold Junction Trim Calibration (also called CJ Trim). First, the Voltage
Calibration will be performed to ensure that the voltages measured by the leads connected to
each thermocouple are scaled correctly. Second, the CJ Trim will be performed to ensure that
the temperature measured at each data logger terminal (where the cold junction is created) is
correctly scaled. Both types of calibration require a sourcing device and thermocouple wire. The
sourcing device should be calibrated and certified to generate accurate voltages before these
calibrations are performed.
connected and sourcing voltage into the proper inputs on the Color SDS Data Logger. Running a
calibration without a sourcing device that is providing voltage into the unit may require
raw
voltages
measured
by instruments connected to the data logger
actual
voltages. The calibrations that
Voltage Calibration
The leads that connect to each input thermocouple measure the voltage generated by that
thermocouple. In most cases, the voltage that the data logger detects (the raw voltage) is
slightly different from the actual voltage generated by the thermocouple. When properly
performed, a Voltage Calibration (also called an Input Calibration) ensures that the SDS Data
Super Systems Inc. Page 31 of 104
Color Touch Screen Data Logger Operations Manual
Page 32

Logger software properly scales the raw voltage so that an accurate temperature can be
calculated. The Voltage Calibration consists of two parts: a Zero Calibration and a Span
Calibration. A Zero Calibration ensures that the raw voltage is scaled properly when the actual
voltage at a thermocouple is zero volts. A Span Calibration ensures that the raw voltage is
scaled properly when the actual voltage is 90% of the upper limit of the desired range (for
example, 72 mV when the upper limit of the range is 80 mV).
Figure 39 shows what the Voltage Calibration screen looks like.
Figure 39 - Voltage Calibration screen
The horizontal row of numbers represents each circuit board containing five inputs. The
vertical column of numbers represents each individual input. A 20-input SDS Data
Logger will feature four circuit boards depicted on this screen, while a 40-input unit will
feature eight circuit boards. Since each board has five inputs, a Voltage Calibration
usually involves five inputs on the same board at one time. A single input can be
calibrated if it is suspected that the temperature reading associated with one input is
incorrect.
Range Value: The mV value shown in the drop-down box represents the range value for
the particular kind of thermocouple wire that you are using in the calibration. Pressing
the question mark (“?”) will bring up a window that shows the range value specific to
various kinds of thermocouple wire.
Zero or Span: Check “Zero” to perform a Zero Calibration. Check “Span” to perform a
Span Calibration.
All or Use Selected: Check “All” to calibrate all inputs. Check “Use Selected” to
calibrate a group of inputs selected by pressing the Select Inputs button and choosing
the inputs that you want to calibrate.
Super Systems Inc. Page 32 of 104
Color Touch Screen Data Logger Operations Manual
Page 33

Set up your calibration device as needed. When ready to begin calibrating, press
Calibrate.
Figure 40 - Setting Up A Voltage Calibration
Figure 41 - Voltage Calibration (Span)
Ready to Begin
Use the results of the calibration to set up offsets for the SDS Data Logger. Editing
offsets is described in the “Edit Offsets” section above.
CJ Trim
For the Trim calibration, TC wire should be used. The trim calibration is performed by
connecting a thermocouple calibration device to each input and outputting a trim
temperature that should be equal to the expected operating temperature. For example,
the calibration could be completed using an output temperature of 1700°F. After the
zero calibration and span calibration, the temperature may read 1701.5°F instead. This
type of calibration should be used instead of the regular cold junction thermistor
calibration unless the cold junction temperatures are reading a temperature that is
much too high for what the ambient temperature could possibly be. A cold junction
thermistor calibration can be used in this instance when need be, but the Trim
Calibration is preferred.
IMPORTANT:
1. Ensure that a sourcing device is properly connected and sourcing voltage into the proper
inputs on the Color SDS Data Logger.
2. Ensure that the input types are set up correctly. See View Input Types and, if necessary,
Edit Input Types.
3. If the data logger has been brought inside from a cold environment, wait 30 minutes
before performing the Cold Junction Trim Calibration. This will provide enough time for
the data logger to reach a stable temperature.
Before performing this calibration:
To perform a cold junction trim, first select the thermocouple type from the dropdown
list. Select the inputs that will be included by pressing the Select Inputs button. Enter
the Target Value and press Calibrate.
Super Systems Inc. Page 33 of 104
Color Touch Screen Data Logger Operations Manual
Page 34

Figure 42 - CJ Trim Screen
Cold Junction Thermistor Calibration
This procedure is performed by Super Systems Inc. before the SDS Data Logger is
shipped. In most cases, the procedure will not need to be performed in the field. If a
situation should arise where a cold junction calibration may need to be performed in the
field, please contact Super Systems Inc. Technical Support at 800-666-4330.
Datalog Deletion
The Color SDS Data Logger includes an option to delete log data files and survey data
files. This option is useful when these data files are no longer needed or when removing
them would free up space on a storage card nearing its full capacity. The Datalog
Deletion screen (Figure 43) allows you to change the date and time range of the files
that will be deleted (Start Date and End Date). The Delete Log Data button will cause
only the log data files to be removed, while the Delete Survey and Log Data button will
delete both the survey data and log data files.
Super Systems Inc. Page 34 of 104
Color Touch Screen Data Logger Operations Manual
Page 35

Figure 43 - Datalog Deletion Screen
Passcodes
This screen allows the user to set the passcodes to access the higher-level functions on the
SDS. To change either passcode, press the corresponding button, enter the new code, and
press OK.
Super Systems Inc. Page 35 of 104
Color Touch Screen Data Logger Operations Manual
Page 36

Figure 44 - Passcode Change Screen
Cold Junction Thermistor Calibration
Please refer to the Calibration section above for more details.
Full Data Action
Full Data Action allows you to configure the way in which the SDS software handles data logging
and data log files as the storage card nears its full capacity. This can happen as data log files
are continually added to the storage card, eventually leading to the card running out of storage
space. As shown in Figure 45, there are two choices in this menu: Automatic Deletion and Stop
Datalogging.
Automatic Deletion causes the SDS software to delete data log files (starting with the oldest)
automatically as the storage card nears its full capacity; it will not delete data log files that have
been written less than 30 days before the current system date and time. For this reason, it is
important that the system date and time be set correctly when this setting is used and the
storage card is nearing its full capacity. For more information on setting the system date and
time, refer to Changing the System Date and Time.
Stop Datalogging causes the SDS software to stop logging data to the storage card when the
storage card is nearing its full capacity. When this occurs, a message box will appear indicating
that data logging has stopped. Click OK to close the window. In order to resume data logging,
you will need to restart the Color SDS Data Logger. For more information on deleting data log
files, see the section on Datalog Deletion.
Super Systems Inc. Page 36 of 104
Color Touch Screen Data Logger Operations Manual
Page 37

Figure 45 - Full Data Action options
Exit Program
Selecting this option allows you to exit the Color SDS Touch Screen program. A confirmation box will
appear when you select this option (Figure 46). There are very few situations where this action would
need to be performed.
Figure 46 - Shut Down Interface confirmation
Configuration
The Configuration Menu contains the following items:
• Communications Setup. This menu item allows you to change the COM port
number, address, and baud rate of the communications port used to connect the
touch screen interface to the SDS mainboard.
• Compact Database. When clicked, Compact Database optimizes and reduces the
size of the database contained on the storage card.
• Read/Write Data. Using this feature, you can view the raw data on the underlying
hardware and also write data to the underlying hardware. This feature should not
be used in most circumstances.
• About. This option simply shows the About screen for Super Systems SDS, as
shown in Figure 38.
• Shut Down Software. This option shuts down the SDS touch screen.
• Set Serial Number. This feature allows you to change the serial number of the
touch screen software. This setting should not be changed.
• Degree Type. This feature allows you to change the unit of measurement used for
temperature—degrees Fahrenheit or degrees Celsius.
• Product Type. This feature allows you to change the SDS product type as it is
known to the touch screen software.
Super Systems Inc. Page 37 of 104
Color Touch Screen Data Logger Operations Manual
Page 38

• Thermistor Calibration. This feature
allows for calibration of the ambient
thermistor (pictured in Figure 47)
and internal thermistor.
Figure 47 - Location of Ambient
(External) Thermistor
IMPORTANT:
Before attempting to access Configuration features, please contact Super
Systems Inc. Technical Support (800-666-4330).
Reset Calibration Dates
To change either of these dates, press the corresponding button and enter the new
date. Press OK to save.
Super Systems Inc. Page 38 of 104
Color Touch Screen Data Logger Operations Manual
Figure 48 - Configuration Menu
Page 39

Figure 49 - Reset Calibration Dates
IMPORTANT:
Avoid resetting calibration dates without first contacting Super Systems
Inc. Technical Support (800-666-4330).
Set Nominals
Nominals are calibration constants used in the process of converting raw analog data to
voltage values. The
Set Nominals menu provides the ability to reset calibration
constants for all inputs, or for a specified set of inputs, to default values.
A user may decide to use this feature if, for example, temperature readings from the
SDS are deemed to be outside a certain acceptable range and subsequent calibrations
are not successful. When the calibration constants are reset, the device is placed in an
uncalibrated state and will require recalibration. If recalibration does not result in
temperature readings that are within an acceptable range, it is likely that the SDS has
experienced hardware damage and will need to be shipped to Super Systems Inc. for
repair.
The Set Nominals screen is shown in Figure 50. To reset all nominals, simply select the
checkbox labeled “All” and then press the Set Nominals button.
Super Systems Inc. Page 39 of 104
Color Touch Screen Data Logger Operations Manual
Page 40

Figure 50 - Set Nominals
To reset nominals for specific inputs, first select the checkbox labeled “Use Selected”
and then press the Select Inputs button. The Select Inputs screen will appear. Select
each input for which you would like to reset the nominals, and then press Select
Highlighted for each one. Note that you may enter a range of inputs using the “Select
Range” feature. These screens are shown in
Figure 51. Once you have selected the
specific inputs for which you want to reset nominals, press Return and then press Set
Nominals on the
Set Nominals screen.
Super Systems Inc. Page 40 of 104
Color Touch Screen Data Logger Operations Manual
Page 41

Figure 51 - Use Selected Inputs in Set Nominals Screen
IMPORTANT:
Avoid setting nominals without first contacting Super Systems Inc.
Technical Support (800-666-4330).
Set K Factors
K Factors are mathematical coefficients that help correct for changes in outside
temperature. When correctly programmed, K Factors help minimize the effect of
outside temperature variations on thermocouple temperature readings. It is possible to
adjust K Factor settings from the Set K Factors menu, but doing so is not recommended
without first contacting Super Systems Inc. Technical Support. See the notice below.
IMPORTANT:
Avoid adjusting K Factors on any channel without first contacting Super
Systems Inc. Technical Support (800-666-4330). Incorrect adjustment of K Factors will
likely result in incorrect temperature readings.
Super Systems Inc. Page 41 of 104
Color Touch Screen Data Logger Operations Manual
Page 42

Figure 52 - Set K Factors
SDX Control
By selecting Run for SDX Control, the SDS will run a program called SDX that monitors
thermocouples to ensure they are calibrated properly using the SDX software module.
SDX is available through SSi.
Super Systems Inc. Page 42 of 104
Color Touch Screen Data Logger Operations Manual
Page 43

Figure 53 - SDX Control
IMPORTANT:
Avoid running SDX without first contacting Super Systems Inc. Technical
Support (800-666-4330).
Modbus Control
Running Modbus Control will enable the Modbus protocol to read and write registers.
To set this up, press
monitored. Press
Run, then determine the range of Modbus registers that will be
OK to save.
Super Systems Inc. Page 43 of 104
Color Touch Screen Data Logger Operations Manual
Page 44

Figure 54 - Modbus Control Not Running Screen
Figure 55 - Run Modbus Control Window
Super Systems Inc. Page 44 of 104
Color Touch Screen Data Logger Operations Manual
Page 45

IMPORTANT:
Avoid running Modbus control without first contacting Super Systems Inc.
Technical Support (800-666-4330).
SDS Reporter
IMPORTANT:
When using SDS Reporter with the Color SDS Data Logger, Options >
Color Screen Scanning must be selected. Refer to the section Options Color Screen
Scanning for more details.
Figure 56 - SDS Reporter initial screen
When the SDS Reporter software is started up, the user sees the above screen (Figure 56). The
four menu options to choose from are:
choose from: New , Open , Save , and Print .
File Menu Options
File New / New Button
The New option allows the user to create a new report that will include the report properties,
the trend chart, and the TC data (Figure 57). Note: the selected tab will be in Red when it is
active only for the three main tabs – Report Properties, Chart, and Data.
Super Systems Inc. Page 45 of 104
Color Touch Screen Data Logger Operations Manual
File, SDS, Options
and
Help
. There are four buttons to
Page 46

Figure 57 - Report Properties Tab
File Open / Open Button
The Open menu option will allow the user to choose an existing report from a common Windows
Open dialog box. The software will open the dialog box in the “SDSReports” folder (typically,
C:\SSi\SDS\SDSReports) for existing reports (.SDSReport) to open.
The Report Properties tab contains several tabs, which in turn contain the information that
makes up the report. The first tab is the Report tab (Figure 57), which contains the data to use
for the report, the report template to use, the report heading or title, the survey results, and any
notes about the report.
Super Systems Inc. Page 46 of 104
Color Touch Screen Data Logger Operations Manual
Page 47

Figure 58 - Report Properties Report Tab
Clicking on the open box, , next to the “Data” field will display a screen from which the
user can select the interval time (ten seconds, twenty seconds, thirty seconds, one minute, two
minutes, or five minutes) and also the specific survey to use (Figure 58). This screen will only
display survey data that has already been downloaded (SDS → Download Surveys and Data).
Figure 59 - Load Survey Data screen
The default interval is one minute. Select the survey to use and click on the “Use” button.
Information included with the data sources is: Template Name, [Company Name - Furnace Id],
(Survey box Serial number), and the date/time range of the survey data. Any manual entries will
have [Manual Entry] at the beginning. See the section
Manually Creating a Survey Record
for
information on how to add a survey record manually. Clicking on the open box next to the
“Report Template” field will open a dialog box from which the user can select the specific report
template to use for the report. The software will open the dialog box in the
“SDSReportTemplates” folder (typically C:\SSi\SDS\ReportTemplates) for existing report
templates to use. The “Report Heading / Title” field is for the heading or title of the report and
Super Systems Inc. Page 47 of 104
Color Touch Screen Data Logger Operations Manual
Page 48

the “Survey Results (Pass/Fail)” field is for the results of the survey. The “Notes” field is for any
general notes for the report.
Manually Creating a Survey Record
Clicking on the “Advanced: Manually Create Survey Record” link from the Load Survey Data
screen will allow the user to create a survey record to use. Clicking on this link will display the
“Manually Create Survey Record” form (Figure 60). Five pieces of data are required to manually
create a record: the SDS model, serial number, the start time and date of the survey, the end
time and date of the survey, and the TC Spool Offset. All data will need to be downloaded from
the SDS either before or after this process in order to get data. To download all data, please
refer to section SDS Download Surveys and Data.
Figure 60 - Manually Create Survey Record form
The drop-down list next to “Survey Box Model” contains a list of the available models. Make
sure to select the appropriate Color SDS Data Logger. Select the model type (the Color SDS
Data Logger is referred to as “SDS Touch Screen”). Enter the SDS serial number on the next
line, “Survey Box Serial Number”. The serial number can be found in the About window, as
discussed in the About section. The process for selecting the start date/time and the end
date/time is the same. To select a date, click on the down arrow next to the time listed. This
will bring up a calendar from which the user can select a new date (Figure 61). Select the new
date by clicking on it.
Super Systems Inc. Page 48 of 104
Color Touch Screen Data Logger Operations Manual
Page 49

Figure 61 - Select new date
The date of the survey start /end is listed to the right of the drop-down list. To select a time,
click on the hours, minutes, seconds or “AM/PM”. The selected field will be highlighted. Each
field can be changed by using the up or down arrows on the keyboard. If the survey start date is
later than the survey end date, a message will be displayed to the user and the record will not
be added (Figure 62).
Figure 62 - Survey start/end date error message
Enter the TC spool offset and click on the “Add Record” button to add the record. Clicking on
the “Cancel” button will cancel the add process and bring the user back to the “Load Survey
Data” dialog box. If the add was successful, a message box will be displayed (Figure 63).
Figure 63 - Record Add successful message
The added record will be displayed chronologically in the top of the list. Any record manually
added will begin with “[Manual Entry]” (Figure 64). If the manually created survey is less than
one second, it will not be displayed in the list.
Super Systems Inc. Page 49 of 104
Color Touch Screen Data Logger Operations Manual
Page 50

Figure 64 - Manual entry on Load Survey Data form
NOTE: Most of the “Report Properties” tabs (Report, Furnace, Survey Box) will need to be filled
out manually as well.
The next tab is the Thermocouples tab (Figure 65). This tab contains the information about the
thermocouple settings and it also lists the active thermocouples. The information in the
thermocouple settings includes: the temperature type (F or C), the number of thermocouples,
the number of TCs used in the report, the thermocouple type, the thermocouple gauge, the
thermocouple spool number, whom the thermocouple was calibrated by, the date the
thermocouple was calibrated, and the thermocouple spool correction factor. Clicking on the
“Change” button will allow the user to change the spool correction (Figure 66).
Figure 65 - Report Properties Thermocouples Tab
Super Systems Inc. Page 50 of 104
Color Touch Screen Data Logger Operations Manual
Page 51

Figure 66 - Spool Correction screen
All values displayed to the users are corrected
TC Spool and a channel offset, the user would be shown the net result of those offsets into the
value displayed.
. That means if there is a defined offset for the
There are checkboxes for a possible forty thermocouples, but only the active thermocouples will
have checks in the checkboxes. Clicking on the “Define Control TC” link will allow the user to
select the TC or TCs that will be the control TC(s) (Figure 67). The operator can select any of the
thermocouples to be the control TC(s) and provide an optional description for that TC.
Figure 67 - Define Control TC screen
Clicking on the Accept button will set the selected control TC(s). Once a control TC(s) has been
selected, the TC’s number will be in Red on the “Active Thermocouples” section of the
Thermocouples tab.
The thermocouple(s) that is identified as the control TC will not be used for
the TC summary when identifying hottest and coldest channels.
Clicking on the “View Offsets used in Survey” link will display a list of the offsets that were used
on the survey (Figure 68
means the Offset defined for these TCs have already been incorporated into the value the
operator would see. IF there is a value for the TC Spool Correction Factor, that value will also
be incorporated providing a corrected view for the user.
Super Systems Inc. Page 51 of 104
).
All values that are displayed to the users are corrected values.
Color Touch Screen Data Logger Operations Manual
That
Page 52

Figure 68 - TCOffsets screen
Note: Checking or unchecking TCs on the Thermocouples Tab will affect the TCs plotted on the
Chart Tab.
The Thermocouples tab also includes an option to view and edit individual TC correction factors
(see Figure 69). Once these correction factors are in place, they will be applied to TC values
from survey data. These corrections will be reflected in the report generated by SDS Reporter.
Super Systems Inc. Page 52 of 104
Color Touch Screen Data Logger Operations Manual
Page 53

Figure 69 - Viewing and Editing Individual TC Correction Factors
The TC correction factors are passcode protected in the
SDS Reporter installation folder (typically, the “C:\SSi\SDS” folder). The default passcode is 2.
To change it, open the
file:
PASSCODE=
SDSReporter.ini
x
file and add this line in the [SETTINGS] block of the .ini
SDSReporter.ini
file contained in the
Where x is zero or a positive integer.
The next tab is the Furnace tab (Figure 70), which contains the furnace ID, the make and model
of the furnace, the furnace type, the furnace use, the furnace’s operating range, the furnace
dimensions, the furnace class (newer versions only), and an optional image of the furnace.
Super Systems Inc. Page 53 of 104
Color Touch Screen Data Logger Operations Manual
Page 54

Figure 70 - Report Properties Furnace Tab
Clicking on the open box next the image frame will open a dialog box where the user can search
for an image of the furnace to use.
The next tab is the Survey Box tab, which contains information about the survey box itself, such
as the make and model, the serial number, whom the survey box was calibrated by, and the
calibration date (Figure 71).
Figure 71 - Report Properties Survey Box Tab
The next tab is the Survey Details Tab (Figure 72). The Survey Details tab contains the company
name, the survey start date, the survey duration, the actual duration of the survey, the survey
Super Systems Inc. Page 54 of 104
Color Touch Screen Data Logger Operations Manual
Page 55

specification(s), whom the survey was performed by, whom the survey was approved by, the
date range for the survey, and the due date of the next survey.
Figure 72 – Report Properties Survey Details Tab
The next tab is the Survey Parameters Tab (Figure 73). The Survey Parameters tab contains: the
survey tolerance, the survey setpoint, the overtemp setpoint, the simulated load in pounds, and
the microns.
The Cooling/Heating combo box affects tags:
• <SDS:OV>
• <SDS:OD>
• <SDS:OVT>
Heating is default. If Cooling is selected, values below the tolerance range are thought to be
overshot instead of above the tolerance range (as they are thought to be for Heating).
Super Systems Inc. Page 55 of 104
Color Touch Screen Data Logger Operations Manual
Page 56

Figure 73 - Report Properties Survey Parameters Tab
The next tab is the Controller Tab (Figure 74). This tab contains the Controller manufacturer,
the controller model, and the instrument type (newer versions only) in the “Temperature
Controller Settings” area and this tab also contains the PID Settings: cycle time, dead band,
output limit, PB (Gain), rate, and reset.
Figure 74 - Report Properties Controller Tab
The User Defined tab contains twenty fields that can be defined by the user and included in the
report. To create a user defined field, click on the “Modify User Defined Fields”. This will
display a screen that will allow the user to edit the fields (Figure 75). The user can type in the
name or description of the field and click the “Save” button.
Super Systems Inc. Page 56 of 104
Color Touch Screen Data Logger Operations Manual
Page 57

Figure 75 - User Defined Fields screen
Comparison Check
SDS Reporter includes two Comparison Check tabs, as shown in Figure 76. The two Comparison Check
tabs perform the same function with different defined data sets.
Figure 76 - Report Properties Comparison Check window
Super Systems Inc. Page 57 of 104
Color Touch Screen Data Logger Operations Manual
Page 58

The information for the comparison check is generated from several of the Report Properties
Report Field
Location in Tabs
Comparison
Factor
Thermocouples, click View
Offsets Used in Survey
button*
Thermocouples, click View
Offsets Used in Survey
button
fields.
Time Chart Start Time
Comparison Test T/C
Spool Number
Middle Left of Comparison
Check
Comparison T/C
Number
Comparison T/C Wire
Correction Factor
Instrument Correction
Comparison T/C
Temperature Readings
Adjacent T/C Number
for Comparison Check
Adjacent T/C Wire
Correction
Adjacent Instrument
Correction Factor
Adjacent T/C
Temperature Readings
for Comparison Check
CC Difference
Top Right of Comparison
Check
Top Right of Comparison
Check
Thermocouples
Records the temperature
of the Comparison T/C
Top Right of Comparison
Check
Records the temperature
of Adjacent T/C
Difference Between
Comparison T/C and
Adjacent T/C temperatures
*The offsets for the T/C Wire Correction can be adjusted solely for the purpose of the
comparison by checking the box on the Comparison Check page labeled
Corrections.
A header text and a body text can be put in the report. There are Preview Report and Print
Report buttons in the top left hand corner of the Comparison Check page.
Super Systems Inc. Page 58 of 104
Accept/Reject Criteria =
Tolerance of Furnace
Set on Comparison Check
Page, Middle Right
Accept/Reject Dependent on A/R Criteria
Table 2 - Location of Report Fields
Color Touch Screen Data Logger Operations Manual
Use Custom Wire
Page 59

The Chart Tab (Figure 77) contains the charted information from the time specified on the
survey. This tab is similar in design and function to the Real-Time chart (Figure 89
). When the
chart tab is active, the chart toolbar buttons also appear and these buttons can be used to zoom
in on a section of the chart, pan the chart up, down, left or right, and refresh the chart back to
its original values. The screen will display 2 horizontal lines that represent the high and low
temperature tolerance levels based on the setpoint. This display will change based on the
tolerance level and setpoint defined in the Report Parameters. For more information about the
function of this screen, see the section “
SDS View Real-time Data.”
Figure 77 - Chart Tab
Note: checking or unchecking TCs on the Chart Tab will affect the Active TCs on the Report
Properties – Thermocouples tab.
The Data Tab (Figure 78) contains the data from each thermocouple for the each interval
selected from the Load Survey Data screen (Figure 59).
Figure 78 - Data Tab
Clicking on the “Round this data off to the nearest degree” link will pop up a message box
confirming the action (Figure 79). The rounding only affects imported data. The data in the
Super Systems Inc. Page 59 of 104
Color Touch Screen Data Logger Operations Manual
Page 60

logged files will still contain data rounded to one decimal place. Clicking on the “Yes” button
will round the data.
Figure 79 - Round data confirmation
File Save / File Save As / Save Button
This will save any changes made to a new or existing report. If an existing file was opened, then
the software will automatically save the file without prompting. If a new file was created, then
the software will display a common Windows Save dialog box that will allow the user to save the
report to the “SDSReports” folder. Once the report has been saved to the “SDSReports” folder,
the software will automatically save the file the next time the save command is chosen.
Clicking the Save As menu option will automatically bring up the Save dialog box.
File Export
There are four sub-menu options available for the export function:
Export Report to Word
Export Report to RTF
Export Survey Data to CSV
Export to Word - All
The
Export Report to Word
which will provide more detail than the standard .rtf file format, if that option is desired. When
this menu option is clicked, the software will automatically begin to export the report selected
to a word document. Once the report has been exported, the new document will be displayed.
Note – no save dialog box will be displayed to the user
“temp.doc” to the “C:\Temp” directory. The user can rename and save this report to any other
desired location.
Note – any time this menu option is used, the resulting report will be saved as
“temp.doc”, so any previous report that has not been re-saved will be lost
RTF
menu option will export the report to a rich-text format (RTF). When this menu option is
clicked, the software will display a Windows Save dialog box that will save the .rtf file to the
“SDSReports” folder. The
data (as seen on the Data tab) to a comma-separated value format file. When this menu option
is clicked, the software will display a Windows Save dialog box that will save the .csv file to the
“SDSReports” folder. The
information to a Word file (report data, survey data, etc).
menu option will export the report to a Word document format,
. Initially, the report is saved as
. The
Export Report to
Export Survey Data to CSV
Export to Word – All
menu option will export all of the survey’s
menu option will export all of the survey
File Print
This menu option is slightly different from the print button. There are five sub-menu options
available:
Print Report
Print Survey TC Data
Print Approach TC Data
Print All
Print Multiple Surveys
Super Systems Inc. Page 60 of 104
Color Touch Screen Data Logger Operations Manual
Page 61

The
Print Report
user will have to select the printer to print the report (Figure 80).
The
Print Survey TC Data
tab). The user will have the option to configure the page settings and select a printer to print to
(Figure 81).
menu option will allow the user to print out a copy of the .SDSReport file. The
Figure 80 - Print prompt screen
menu option will print out a copy of the TC data (as seen on the Data
Figure 81 - Page Setup screen
The
Print Approach TC Data
tabular format. The
Approach TC Data – at once. The user will be able to select the printer (Figure 80). All three
options will be printed as separate reports.
Print All
menu option will allow the user to just print the approach data in a
menu option will print all of the options – Report, Survey TC Data,
Print Multiple Surveys
The SDS Reporter software will support the ability to print multiple setpoint survey reports.
Note – The software does not support multiple setpoint surveys
report screen can be accessed by the File Print Print Multiple Surveys menu option.
. The multiple setpoint survey
Note
– When the screen is first displayed, the main SDS Reporter screen will be closed and any
Super Systems Inc. Page 61 of 104
Color Touch Screen Data Logger Operations Manual
Page 62

unsaved data will be lost
setpoint survey report.
The Print Multiple Setpoint Survey screen will allow the user to select a report template that
utilizes the multiple setpoint survey tags (described below) and up to 5 survey files
(.SDSReport).
The search buttons -
- next to each field
will allow the user to
select the specific
report template or
survey file for the
report.
Once the report
template and survey
files have been
selected, the user will
be able to export the
report to Word by
clicking on the
to Word button.
In order to view the
multiple setpoints on a
survey, the user will
need to use the {
screen (Figure 82). What the {
all of the following tags until another {
example, the following could be an excerpt from the template file:
{1} Survey #1 Duration: <SDS:DUR>
{2} Survey #2 Duration: <SDS:DUR>
{3} Survey #3 Duration: <SDS:DUR>
Setpoint: <SDS:SP>
Max TC Value: #mtcv#
{4} Survey #4 Duration: <SDS:DUR>
This survey would display the durations for each of the survey files, and it would also display the
survey setpoint and max T/C value for survey #3. Notice that the normal data tags are still
used. The new tag only tells the software which survey to pull data from.
Export
n
} tag, where n is the survey number from the
survey reports, the report template file does not need to be updated
software will default to the first survey file. On the actual report the {
When the
will re-open.
Print Multiple Setpoint Survey
. Any unsaved data will need to be saved before printing the multiple
Figure 82 - Print Multiple Setpoint Survey screen
Print Multiple Setpoint Survey
n
} tag does is tell the report to use the nth survey information for
n
} tag is found. Using the displayed screen as an
Note – For single
. If no {n} tag is used, the
n
} tag is invisible.
screen is closed down, the main SDS Reporter screen
Print Button
When the user clicks on the Print button, the software will display the print preview screen,
which is similar in design and function to the print preview screen on the View Real-time chart
(Figure 90 or Figure 83 below).
Super Systems Inc. Page 62 of 104
Color Touch Screen Data Logger Operations Manual
Page 63

File Print Preview
The print preview screen is similar in design and function to the print preview screen on the
View Real-time chart (Figure 90) and is displayed here (Figure 83
Button” under the
SDS View Real-time Data menu option for an explanation of the screen.
). See the section “Print
There are three sub-menu options available:
Print Preview Report
Print Preview Survey TC Data
Print Preview Approach TC Data
Each option will display a print preview of the desired report.
Figure 83 - Print Preview screen
File Exit
This menu option will exit the application.
SDS Menu Options
SDS Manage Survey Templates
The Manage Survey Templates menu option will display the SDS Template Manager screen,
which will allow a user to add new templates and modify existing templates. See the section
SDS Template Manager Screen for a more detailed description of the functions of this screen.
SDS Download Surveys and Data
The Download Surveys and Data menu option will allow the user to download surveys from a
specific SDS instrument. When the menu option is clicked, the SDS software will begin to
search for any and all data loggers located on the network (Figure 84).
Super Systems Inc. Page 63 of 104
Color Touch Screen Data Logger Operations Manual
Page 64

Figure 84 – SDS Data Log Extractor screen
Any data logger found on the network will be added to the drop-down list at the top of the
screen. If no devices are found, a message box will pop up letting the user know that no devices
were found on the network (Figure 85). Check the network connections to verify that any data
logger and computer are properly connected to the network.
Figure 85 - No SDS devices found box
Select the instrument from which to download the data files from the drop-down list box
labeled “SDS:”. Under the
user to choose to download only data that has been used in surveys, or all of the logged data.
The SDS data logger will log data continuously when it is on regardless if a survey is running or
not. There will be a check mark next to the menu option selected. The default menu option is
Only data used in surveys
Options
. To download all data, make sure that
menu, the
Download
menu option (Figure 86) will allow the
All data
is checked.
Figure 86 - Download menu option
The
After Downloading
Super Systems Inc. Page 64 of 104
options do not apply to use with the Color SDS Data Logger.
Color Touch Screen Data Logger Operations Manual
Page 65

The SDS software will begin to download the survey data once the user has clicked on the
“Download” button (Figure 88). The button will read “Abort” while the data files are
downloading.
If the user chose to only download data files used in surveys, and no data files are found, the
software will display an error message (Figure 87).
Figure 87 - No survey records found box
The files will be downloaded to: SDS\(SDS Model number)\log(year)─e.g.,
SDS\SDS505000\log2006.
Figure 88 - SDS Data Log Extractor progress
The software will display a continuous progress of the download status (see Figure 88). Note:
since there may a large number of files to download, this process may take several minutes to
complete.
When all of the files have been downloaded, the words “Operation Complete” will be at the
bottom of the list, and the button at the bottom will read “Download”. A message box will also
be displayed reading “Operation Complete”. Clicking on the
OK button on the message box will
close down the download data screen.
Clicking on the “Abort” button will stop the download and close the SDS Data Log Extractor
screen. Any files that have already been downloaded will not be erased. The next time the user
wishes to download survey data from the same device, the files that have already been
downloaded will be skipped and not be downloaded again.
SDS Launch Direct FTP
The Launch Direct FTP option does not apply to the Color SDS Data Logger.
Super Systems Inc. Page 65 of 104
Color Touch Screen Data Logger Operations Manual
Page 66

SDS View Real-time Data
Figure 89 – Real-time Data screen
The View Real-time Data menu option will display the most current real-time data available.
This screen will update itself with the most current real-time data every 60 seconds. The
amount of time left until the next update will be displayed in the bottom left-hand corner of the
screen. When it does update, the software will connect to the SDS, download the data, and redraw the screen. Any screen settings, such as the size of the graph and how zoomed in the user
is, will not be changed. Note: If the Multiple SDS Mode menu option is checked, then the SDS
software will display a device selection box that will allow the user to choose which device to
gather the real-time data from. If the Multiple SDS Mode menu option is not checked, then the
SDS software will gather real-time data from the first SDS device that it finds on the network.
Note: it is possible to view real-time data from more than one SDS instrument at a time. To
view multiple real-time data, click on the View Real-time data menu option again and select the
next SDS instrument. The Chart tab will display the real-time data as a graph, along with the
tolerance, displayed as 2 blue lines. The Data tab will display the real-time data in numerical
form. On the Chart tab, all of the buttons are available. On the Data tab, only the Print button is
available.
Cursor Button
This is the default cursor used on the screen. The user can select the various TCs to plot and
move the scrollbar on the left side of the screen up or down in order to see more TCs.
Super Systems Inc. Page 66 of 104
Color Touch Screen Data Logger Operations Manual
Page 67

Zoom Button
This will allow the user to zoom in the graph of the real-time data. Once the cursor is over the
graph it will change to a crosshair, . The user can then hold down the left mouse button and
drag the cursor to highlight the section of the graph that is to be enlarged. Letting go of the
mouse button will enlarge the graph.
Pan Button
This will allow the user to pan to a different part of the graph. Once the cursor is over the
graph, it will change to a crosshair with arrows: . By holding down the left mouse button
and moving the mouse left, right, up, or down, the user can move the scale of the graph by
minutes or temperature, or both.
Refresh Button
This will refresh the graph and reset the graph’s display values to their default values. For the
values along the y-axis, the refresh sets the range from 0 to 2400. For the minutes along the xaxis, the refresh encompasses approximately two hours. Note: when the Real-time screen first
loads up, the graph encompasses roughly one hour of data. The graph is marked with fifteenminute intervals along the x-axis.
Print Button
This will create a print preview of the graph for printing purposes. When the user clicks on the
Print button, the Print Preview screen will be displayed (Figure 90).
Figure 90 - Print Preview screen
From the Print Preview screen, the user can choose to zoom in on the preview by pre-defined
percentages (10% - 500%) or leave the zoom on the default setting (auto). The user can also
determine how many pages to view at once (one, two, three, four or six). The default is one
page. The upper right-hand corner of the Print Preview screen contains a page counter, which
will allow the user to select which page to preview. Clicking on the “Close” button will close the
Print Preview screen without printing the chart. Clicking on the Print button ( ) will print the
Super Systems Inc. Page 67 of 104
Color Touch Screen Data Logger Operations Manual
Page 68

document. Note: the Zoom function is for preview purposes only and will not affect the actual
print size. Once the document has been printed, the user can close the Print Preview screen.
Real-time button
This button will allow the user to keep the cursor in a real-time mode, which will automatically
update the TC values on the left of the screen after every update. Clicking on this button will
start the real-time mode. Clicking on this button a second time will take the screen out of realtime mode.
left will no longer be up-to-the-minute accurate
The checkboxes under the “Plot” section will allow the user to determine which TCs to plot on
the graph. Checking a specific TC will display that TC’s data on the graph. The data under the
“Value” section is the current temperature of the TC. Note: even if the Pan button or the Zoom
button has been selected, the user can still select or de-select the TCs. This will not affect the
zoom status or the pan status.
The “Override Tolerance” checkbox will allow the user to override the tolerance that is set up
for the report.
the real-time screen
tolerance. The tolerance bars on the graph will also update with these changes.
SDS Manage Survey Records
Note - The graph will still continue to update once a minute, but the values on the
.
Note – This does not change the actual tolerance on the survey report, only on
. Once checked, the user will be able to select a setpoint and a new
Figure 91 - Manage Survey Records – Local Survey Records Tab
The Manage Survey Records screen will allow the operator to delete survey records from the
survey database file either locally on the computer or remotely on the SDS data logger. The
“Local Survey Records” tab (Figure 91) will work with survey records saved locally to the
computer. To select multiple sequential records, hold down the Shift key and click on the
desired survey records. To select non-sequential records, hold down the Ctrl key and click on
the desired survey records. The operator will have to confirm the deletion by clicking on the
“Yes” button on the message box (Figure 92).
Super Systems Inc. Page 68 of 104
Color Touch Screen Data Logger Operations Manual
Page 69

Figure 92 - Confirm deletion of local records
Figure 93 - Remote SDS Survey Records Tab
The “Remote SDS Survey Records” tab (Figure 93) will allow the operator to delete survey
records directly from the SDS data logger. The drop-down list at the top of the screen will list
all of the SDS data loggers found on the network.
Note: The drop-down list may take a few moments to search the network for SDS data loggers
.
Note: Currently, the drop-down list will also be populated with Video Recorder data loggers.
Please use caution when selecting a data logger from the list; deleting data from a Video
Recorder could produce undesirable consequences
correct data logger, he/she can click on the “Load” button to load the survey data. To select
multiple sequential records, hold down the Shift key and click on the desired records. To select
multiple non-sequential records, hold down the Ctrl key and click on the desired records.
Clicking on the “Delete” button will remove the survey records from the list.
. When the operator has selected the
Note – The survey
records will be removed from the list, but not actually deleted from the SDS data logger until
the “Save Changes” button has been clicked. If one or more survey record is accidentally
deleted, click on the “X” in the top right of the screen to close the screen down, and start over.
Clicking on the “Save Changes” button will save the changes back to the SDS data logger. No
confirmation is needed for this action. Once the changes have been saved, a message box will
be displayed (Figure 94).
Super Systems Inc. Page 69 of 104
Color Touch Screen Data Logger Operations Manual
Page 70

Figure 94 - Changes Saved message box
SDS Perform Comms Test
The Perform Comms Test menu option will send out a broadcast over the network to determine
if any SDS instruments are located on the network. If an instrument is located on the network,
the software will attempt to ping the device. This function will let the user know if
communication with an SDS instrument through the SDS Reporter software is possible. When
the test has finished, one of three options will happen:
1. No SDS found
No SDS instruments were found on the network. Check the network connections. A
message will be displayed to the user (Figure 95). Click the “OK” button to close the form
Figure 95 - No SDS found on network message
2. One or more SDS were found.
One or more SDS instruments were found on the network, and all responded to the ping.
A message will be displayed (Figure 96).
Figure 96 - Communications OK message
This means that all communications appear to be ok (Figure 97). Click the “Close”
button to close the form.
Super Systems Inc. Page 70 of 104
Color Touch Screen Data Logger Operations Manual
Page 71

Figure 97 - Communications OK message on Test Comms dialog box
3. One or more SDS were found, but one or more failed to respond to a ping.
SDS instruments were found on the network, but one or more did not respond to a ping.
For each instrument that does not successfully respond to the ping, the user will be
informed that there was a problem testing the communications and the software will
give the IP address of the SDS instrument(s) that failed to respond as well as the IP
address of the SDS instrument(s) that did respond successfully to the ping (Figure 98).
The most common cause is different subnets between the SDS and the computer (Figure
99). The user may need to change the IP address of the SDS through menu option 26,
Set IP Address
. Click the “Close” button to close the form.
Figure 98 - One or more SDS did not respond message on Test Comms dialog box
Figure 99 - One or more SDS did not respond message
If the user is attempting to communicate with the SDS directly using a laptop that also
has a wireless network on it, the wireless network could interfere with some of the SDS
Reporter functions. The UDP error could happen if the user tried to ping a data logger
while a wireless network was enabled (Figure 100). Any wireless network should be
disabled before running the SDS Reporter software.
Super Systems Inc. Page 71 of 104
Color Touch Screen Data Logger Operations Manual
Page 72

Figure 100 - UDP Error
Options Menu Options
Options Multiple SDS Mode
This is a toggle switch for the application. If there are multiple SDS instruments located on the
network, click this menu option. Once clicked, there will be a check mark next to the menu
item. If this menu option is not checked and there are multiple SDS instruments on the
network, the software will use the first SDS device that is found. This menu option is checked
by default.
Options Show Labels On Chart
This is a toggle switch for the application. When checked, this will display the “Begin Survey”
label for the survey on the real-time graph (Figure 101).
Figure 101 - Label from real-time graph
Options Color Screen Scanning
This is a toggle switch for the application. This option must be checked in order for SDS
Reporter to scan for the Color SDS Data Logger. This scanning will take place over Ethernet and
over USB using ActiveSync (Windows XP) or Mobile Device Center (Windows Vista/7).
Help Menu Options
Help Check for Updates
The Check for Updates menu option will check for updates over the Internet and automatically
update the SDS firmware and software. If an update is found, the software will display a
message box asking the user for update confirmation (Figure 102).
Figure 102 - Update found message box
Super Systems Inc. Page 72 of 104
Color Touch Screen Data Logger Operations Manual
Page 73

The software will automatically update the files and restart the application (Figure 103)
Figure 103 - Automatic Update screen
If no updates are available, then the software will display a message box informing the user
(Figure 104).
Figure 104 - No updates message box
Help About
The About menu option displays the SDS Reporter version that is running, and all of the
previous versions with any version notes (Figure 105).
Figure 105 - SDSReporter About box
Super Systems Inc. Page 73 of 104
Color Touch Screen Data Logger Operations Manual
Page 74

SDS Data Tags
#mtcn#
#xtcn#
#mtcv#
#xtcv#
#md#
#xd#
SDS Data tags are created so that all of the template information and survey data can
automatically be used for the report process. Data that is captured during the survey is
summarized to provide the overall results for the report. This can be in the form of a graph,
tabular data, text, etc. Data tags have been specifically created to address the uniformity
requirements for AMS and other standards. We have tags that address overshoot, minimum TC
with value, maximum TC with value, trend data, tabular data, etc. An example of an output from
the data tags can be seen by opening the Example report from the SDS Reporter provided with
the installation. The only data not generated from data tags is the tabular print out of the actual
temperatures. This data is generated from the
Survey TC Data
option and will print all data
points that are displayed on the graph between the “start” and “stop” selected by the user in the
survey.
In the figure below (Output From Data Tags), you can see an example of the data tags for the
graph, survey setpoint, minimum and maximum TCs with values and deviation. The data tags
used to generate the information below are:
<SDS:GRAPH600x400>
TC Survey Summary
Temperature Setpoint: <SDS:SP>°#
Minimum TC number:
Minimum TC Value:
Min deviation from setpoint:
Maximum TC number:
Maximum TC Value:
Max deviation from setpoint:
Super Systems Inc. Page 74 of 104
Color Touch Screen Data Logger Operations Manual
Page 75

Figure 106 - Output from Data Tags
Tag Description Usage
SDS:FILE The filename the report is saved as <SDS:FILE>
SDS:PD The current date when the report is printed <SDS:PD>
SDS:PT The current time when the report is printed <SDS:PT>
SDS:FID The furnace ID <SDS:FID>
SDS:FM Furnace make/model <SDS:FM>
SDS:FT Furnace type <SDS:FT>
SDS:FU Furnace use <SDS:FU>
SDS:FD Furnace dimensions <SDS:FD>
SDS:FC Furnace Class <SDS:FC>
SDS:FOR Furnace operating range <SDS:FOR>
SDS:SD Survey date <SDS:SD>
SDS:ST Survey time <SDS:ST>
SDS:SDR Survey date range <SDS:SDR>
SDS:DUR Duration of the survey <SDS:DUR>
SDS:OP Operator. Survey performed by <SDS:OP>
SDS:APP Survey approved by <SDS:APP>
SDS:TITLE The heading, or title, of the report <SDS:TITLE>
Super Systems Inc. Page 75 of 104
Color Touch Screen Data Logger Operations Manual
Page 76

Tag Description Usage
SDS:NOTE Notes for the survey <SDS:NOTE>
SDS:TOL Survey tolerance / uniformity required <SDS:TOL>
SDS:OTS Overtemp setpoint <SDS:OTS>
SDS:SP Survey setpoint <SDS:SP>
SDS:TCN Number of thermocouples <SDS:TCN>
SDS:TCT Thermocouple type <SDS:TCT>
SDS:TCS Thermocouple spool number <SDS:TCS>
SDS:TCC Thermocouple calibrated by <SDS:TCC>
SDS:TCCD Thermocouple calibration date <SDS:TCCD>
SDS:TCCF Thermocouple spool correction factor <SDS:TCCF>
SDS:SDN Next survey due date <SDS:SDN>
SDS:SDSM Survey box make/model <SDS:SDSM>
SDS:SDSS Survey box serial number <SDS:SDSS>
SDS:SDSC Survey box calibrated by <SDS:SDSC>
SDS:SDSCD Survey box calibration date <SDS:SDSCD>
SDS:SDSCF Survey box correction factor <SDS:SDSCF>
SDS:SPEC Specifications the survey meets <SDS:SPEC>
SDS:INT Sample interval <SDS:INT>
SDS:T Temperature character – F or C <SDS:T>
SDS:SIM Simulate load, in pounds <SDS:SIM>
SDS:OVS Overshoot (Deprecated) <SDS:OVS>
SDS:MIC Microns <SDS:MIC>
SDS:RES Survey result <SDS:RES>
SDS:GRAPH600x400 Inserts a 600X400 image of the graph <SDS:GRAPH600x400>
SDS:COM Company name <SDS:COM>
SDS:UDUR User defined survey duration <SDS:UDUR>
SDS:UTCN User defined number of thermocouples <SDS:UTCN>
SDS:PCT PID cycle time <SDS:PCT>
SDS:PDB PID dead band <SDS:PDB>
SDS:POL PID output limit <SDS:POL>
SDS:PPB PID PB (gain) <SDS:PPB>
SDS:PR PID rate <SDS:PR>
Super Systems Inc. Page 76 of 104
Color Touch Screen Data Logger Operations Manual
Page 77

Tag Description Usage
SDS:PRE PID reset <SDS:PRE>
SDS:CMF Temperature controller manufacturer <SDS:CMF>
SDS:CMA Temperature controller make/model <SDS:CMA>
SDS:IT Controller instrument type <SDS:IT>
SDS:TCG Thermocouple gauge <SDS:TCG>
SDS:OV Overshoot - yes or no <SDS:OV>
SDS:OD Outputs TC and temp if overshoot occurred <SDS:OD>
SDS:OVT Time the overshoot occurred <SDS:OVT>
SDS:CTD Inserts a note regarding the control <SDS:CTD>
Thermocouple. Inserts nothing if no control
Thermocouple was chosen
SDS:CTN Control thermocouple. Inserts “None” if <SDS:CTN>
None is defined
°# °degree type °#
SDS:ED Survey end date <SDS:ED>
SDS:ET Survey end time <SDS:ET>
SDS:TCM Thermocouple map (image) <SDS:TCM>
SDS:UD1 User defined field 1 <SDS:UD1>
SDS:UD2 User defined field 2 <SDS:UD2>
SDS:UD3 User defined field 3 <SDS:UD3>
SDS:UD4 User defined field 4 <SDS:UD4>
SDS:UD5 User defined field 5 <SDS:UD5>
SDS:UD6 User defined field 6 <SDS:UD6>
SDS:UD7 User defined field 7 <SDS:UD7>
SDS:UD8 User defined field 8 <SDS:UD8>
SDS:UD9 User defined field 9 <SDS:UD9>
SDS:UD10 User defined field 10 <SDS:UD10>
SDS:UD11 User defined field 11 <SDS:UD11>
SDS:UD12 User defined field 12 <SDS:UD12>
SDS:UD13 User defined field 13 <SDS:UD13>
SDS:UD14 User defined field 14 <SDS:UD14>
SDS:UD15 User defined field 15 <SDS:UD15>
Super Systems Inc. Page 77 of 104
Color Touch Screen Data Logger Operations Manual
Page 78

Tag Description Usage
SDS:UD16 User defined field 16 <SDS:UD16>
SDS:UD17 User defined field 17 <SDS:UD17>
SDS:UD18 User defined field 18 <SDS:UD18>
SDS:UD19 User defined field 19 <SDS:UD19>
SDS:UD20 User defined field 20 <SDS:UD20>
*** Survey scope data tags – {n} where n is the survey number – are used to display survey
information for the multiple survey report feature. See the section
more information on how to use these data tags ***
Sample Output
Tag Sample Output
SDS:FILE SDSReport1.sdsreport
SDS:PD 2/16/06
SDS:PT 11:30:00 AM
Print Multiple Surveys
for
SDS:FID Batch 1
SDS:FM Furnace Mfg.
SDS:FT Batch Gas Draw
SDS:FU Temper
SDS:FD 24 x 15 x 12
SDS:FC A
SDS:FOR 650 - 1000°C
SDS:SD 2/16/06
SDS:ST 11:30:00 AM
SDS:SDR 2/13 THRU 2/14
SDS:DUR 00:30:00
SDS:OP Shaun Scott
SDS:APP Scott Brown
SDS:TITLE Test Survey 1
SDS:NOTE This is a test survey
SDS:TOL [+/-] 10
SDS:OTS +10
SDS:SP 750
Super Systems Inc. Page 78 of 104
Color Touch Screen Data Logger Operations Manual
Page 79

Tag Sample Output
SDS:TCN 20
SDS:TCT K
SDS:TCS Z458
SDS:TCC Soandso
SDS:TCCD 1/15/06
SDS:TCCF -1
SDS:SDN 2/28/06
SDS:SDSM SSI SDS8120
SDS:SDSS SDS60293201
SDS:SDSC Super Systems Inc
SDS:SDSCD 1/15/12
SDS:SDSCF -1.0
SDS:SPEC AMS 2750-D and E
SDS:INT 10s
SDS:T F
SDS:SIM 500
SDS:OVS None
SDS:MIC N/A
SDS:RES Passed
SDS:GRAPH600x400 [An image of the graph]
SDS:COM Company Name
SDS:UDUR 30 mins
SDS:UTCN 20
SDS:PCT 20
SDS:PDB 2
SDS:POL 2
SDS:PPB 2
SDS:PR 2
SDS:PRE 2
SDS:CMF Super Systems
SDS:CMA 7EK
SDS:IT B
Super Systems Inc. Page 79 of 104
Color Touch Screen Data Logger Operations Manual
Page 80

Tag Sample Output
SDS:TCG 16
SDS:OV Yes
SDS:OD TC6 - 1700°
SDS:OVT 5:30
SDS:CTD TC5 is the control TC, and is not used in uniformity survey
results
SDS:CTN TC5
°# °F
SDS:ED 2/16/06
SDS:ET 11:30:00 AM
SDS:TCM [Thermocouple image]
TC Offsets
Tag Description Usage
#o1# Offset for TC1 #o1#
#cf1# Individual correction factor for TC1 #cf1#
Tag Sample Output
#o1# -1
Min/Max/Mean/Spread/Deviation
Tag Description Usage
#n1# Minimum temp for TC1 within the selected #n1#
Survey region. Substitute numbers for other
TCs
#x1# Max temp for TC1 #x1#
#m1# Mean temp for TC1 #m1#
#s1# Spread for TC1 #s1#
#vn1# Deviation @min temp from setpoint
for TC1 #vn1#
#vx1# Deviation @max temp from setpoint
for TC1 #vx1#
Super Systems Inc. Page 80 of 104
Color Touch Screen Data Logger Operations Manual
Page 81

Tag Description Usage
#vm1# Deviation @mean temp from setpoint for #vm1#
TC1
#mtcn# Minimum TC number #mtcn#
#mtan# Minimum TC number during approach #mtan#
segment
#mtav# Minimum TC value during approach #mtav#
segment
#mtcv# Minimum TC value #mtcv#
#mtcx# The maximum temperature of the #mtcx#
minimum TC
#md# Minimum calculated survey TC absolute #md#
deviation from setpoint
#rect# Recovery Time – the time between the #rect#
when the first TC comes into tolerance
the time when the last TC comes into
tolerance
#xtcn# Maximum TC number #xtcn#
#xtan# Maximum TC number during approach #xtan#
segment
#xtav# Maximum TC value during approach #xtav#
segment
#xtcm# Minimum temperature of the maximum #xtcm#
TC
#xtcv# Maximum TC value #xtcv#
#xd# Maximum calculated survey TC absolute #xd#
deviation from setpoint
Tag Sample Output
#n1# 183
#x1# 183
#m1# 183
#s1# 12.5
Super Systems Inc. Page 81 of 104
Color Touch Screen Data Logger Operations Manual
Page 82

Tag Sample Output
#vn1# 383
#vx1# 383
#vm1# 383
#mtcn# 2
#mtan# 2
#mtav# 150
#mtcv# 1
#mtcx# 500
#md# 201.0
#rect# 3 mins 30 secs
#xtcn# 1
#xtan# 6
#xtav# 1500
#xtcm# 500
#xtcv# 183
#xd# 383.0
#ts# 13.8
Creating a Personalized Template
To create a personalized template, the user needs to open a document in WordPad and save it
to the “ReportTemplates” folder in the main installed folder as a Rich Text Format (.rtf) file. Any
of the SDS data tags listed in the above section can be used to create a company-specific
template. For example, suppose that someone wanted to create a simple template called
“NewTemplate” which displays the current date and time the report is printed, the company
name, the title of the report, the number of thermocouples used, and the results of the survey.
First, the user would open WordPad and save the file as “NewTemplate.rtf” in the
“ReportTemplates” folder in the main installed folder. Next, the user would set up any initial
formatting settings, such as margin sizes, page layout (portrait or landscape), etc. Now, the
user can set up the template to his or her company’s specifications. Suppose that the current
date and time will be in the top right corner of the report and should be 10-point Arial font. On
the first line, the user can select the right-justified option, the 10-point font size option, and the
Arial font option. This will leave the cursor in the top right corner. Next, the user will enter the
following exactly (including the brackets): <SDS:PD>. This will be where the current date is
displayed. On the next line, the user can enter <SDS:PT>. This will be where the current time is
displayed. Now suppose the title of the report should be centered, bold, 14-point Arial font. The
user will select the center-justified option, and the 14-point font size option. This will place the
cursor in the middle of the line. The user will then enter <SDS:TITLE>. The rest of the report -
Super Systems Inc. Page 82 of 104
Color Touch Screen Data Logger Operations Manual
Page 83

company name, number of thermocouples used, and the results of the survey - can be leftjustified, non-bold, 12-point font. On the next line, the user will select the left-justified option,
the 12-point font size option, and deselect the bold option. The user can then enter: Company
name: <SDS:COM>. On the next line the user can enter: Number of thermocouples used:
<SDS:TCN>. On the next line, the user will enter: Survey results: <SDS:RES>. Next, make sure
the document is saved and close the document out. Note: it is always good practice to save a
document in progress often in case of power failure. The resulting template should resemble
Figure 107 below.
Figure 107 - Completed NewTemplate report template (saved as an RTF file in WordPad)
Next, the user will select the report template to use from the SDSReporter application’s Open
option. Clicking on the Open button, , next to the Report Template field will allow the user
to choose which report template to use (Figure 58). The user can choose the NewTemplate.rtf
file. Next, the user will choose the “Export to RTF” print menu option on the File menu and
choose the location to save the .rtf file. The actual report should resemble Figure 108 below.
Figure 108 - Actual NewTemplate report
Super Systems Inc. Page 83 of 104
Color Touch Screen Data Logger Operations Manual
Page 84

SDS Template Manager
The purpose of a template is to save the user’s time by filling in some of the more generic
survey data. For example, the user could create a template for one customer, including
company name, TC type, etc; then when the survey is run using this template, this information is
already present and it won’t need to be entered for each survey run for that customer. The new
SDS Template Manager (Figure 109) allows the user to see all of the templates currently stored
on the SDS instrument, as well as any templates saved to a local computer. The Template
Manager also allows the user to create new templates and save them to a local file on a
computer or network, or to the SDS instrument.
Figure 109 - New SDS Template Manager
Description/Function of Template Manager Screen buttons/menu options
This section will describe the function of the toolbar buttons and menu options for the Template
Manager Screen. Clicking on either the form button or the menu option will produce the same
result, so each pair of button/menu option will be explained in this section.
New Button / File New
The New button, , or New menu option will allow the user to create a new set of templates. The
maximum number of templates that can be added per file is 32. Note: initially, there are no templates in
the file.
Open Button / File Open
The Open button, , or the Open menu option will allow the user to open an existing template
file either from the local computer, or from an SDS instrument on the network (Figure 110).
Super Systems Inc. Page 84 of 104
Color Touch Screen Data Logger Operations Manual
Page 85

Figure 110 - Open template menu option
The use will be able to open a local template file or a template file that is on an SDS. If the user
selects a local file, the user will be able to click on the
The SDS software will display a common Windows dialog box for the user to select which file to
open. If the user selects an SDS instrument, the SDS Software will display a selection box with
all of the available SDS instruments on the network. Note: Since the SDS software is searching
the network for all SDS devices, it may take a couple of minutes for the selection box to be
displayed. This list will be populated with all of the available SDS devices found when the “Open
Template File” screen is first opened. Clicking on the
the network for available SDS instruments. Once a local or remote file has been selected, click
on the
without opening a file. Note: When the Open Button or the Open menu option is clicked, the tabs
that contain all of the fields for the template will not become visible – an individual template
must be selected to view the tabs. Once the file has been loaded, the filename will be listed
above the Templates list on the left of the form (
Open File button to open the file, or click on the Cancel button to close down the screen
Figure 109).
Browse button to select the file to open.
Scan button will allow the user to re-scan
Save Buttons / File Save
The Save button, , or Save menu option will allow the user to save the current file back to
the local machine or the SDS instrument. Note: Any changes made to any template will be
saved at once when this option is selected. Note: If the user is working with a new template file,
the Save function will act like the Save As function (see below section).
File Save As
This option acts the same way as the Save option, only it will display a dialog box that will allow
the user to select the file to save (Figure 111). This functionality of this screen is similar to the
Open Template screen (Figure 110
remotely on an SDS instrument. If the user selects to save the file locally, the user will be able
to click on the
will be able to select the location and give the template file a name. If the user selects to save
the file to a remote SDS, the software will display a selection box with all of the available SDS
instruments on the network. Note: Since the SDS software is searching the network for all SDS
devices, it may take a couple of minutes for the selection box to be displayed. This list will be
Super Systems Inc. Page 85 of 104
Browse button, which will display a common Windows save dialog box. The user
Color Touch Screen Data Logger Operations Manual
). The template file can be saved locally on a computer or
Page 86

populated with all of the available SDS devices found when the “Save Template File As” screen
is first opened. Clicking on the
available SDS instruments. Once a local file or remote file has been selected, click on the
Scan button will allow the user to re-scan the network for
Save
File button to save the file, or click on the Cancel button to close down the screen without saving
the file.
Figure 111 - Save Template File As… screen
The software will always display a message box with the success or failure of the save.
Exit Button / File Exit
This option will close the Template Manager screen.
Add Template Button
This option will add a template to the collection of templates stored in memory, up to 32 total templates.
The only required field is the Template Name. The default template name is <Template Name>
Once a template has been added, the new template will be loaded into the fields.
Delete Button
This option will delete a template from the collection of 32 templates stored in memory.
Copy Button
This button will copy a template into the collection, assuming there are less than 32 templates
already. This would be useful if the user only wanted to change one or two items on the
template, such as the setpoint.
Arrow Buttons
The arrow buttons next to the Copy button will allow the user to change the order of the
templates in the file. This way, the more commonly used templates can be kept at the top of the
file so the user will not have to scroll down to see the template on the SDS. The up arrow
button will move the template up one position, and the down arrow button will move the
template down one position.
Super Systems Inc. Page 86 of 104
Color Touch Screen Data Logger Operations Manual
Page 87

Description of Template Manager Screen Tabs
Template Information Tab
Figure 112 - Template Information tab
This tab contains general information about the template such as the Template Name, the Company
Name, furnace information such as the furnace ID, the make and model of the furnace, the furnace
dimensions, the temperature type (Fahrenheit or Celsius), the temperature range, the furnace type, the
furnace use, the furnace class, and any Notes about the template. See “Description of Template Manager
Screen Fields” for the maximum number of characters allowed per field.
Super Systems Inc. Page 87 of 104
Color Touch Screen Data Logger Operations Manual
Page 88

Survey Information Tab
Figure 113 - Survey Information tab
This tab contains information about the survey such as the Survey Duration in minutes, the Survey
setpoint, The survey Tolerance, the Operator performing the survey, the simulated load, in pounds, and
the Specification the survey meets.
Super Systems Inc. Page 88 of 104
Color Touch Screen Data Logger Operations Manual
Page 89

Active TCs Tab
Figure 114 - Active TCs Tab
This tab contains information about the active TCs such as the number of TCs used, the Gauge of the TC,
the TC type, spool serial number, spool correction, and a check box for each of the TCs. There is also a
check box to allow the user to use the active settings for the TCs or to individually select the TCs to use on
the SDS instrument. Checking “Use these active TC settings” will set the checked TCs.
Super Systems Inc. Page 89 of 104
Color Touch Screen Data Logger Operations Manual
Page 90

Controller Information Tab
Figure 115 - Controller Information Tab
This tab contains information about the controllers such as the Controller Manufacturer, the
Controller Model, and the instrument type. It also contains information about the PID settings
such as the Cycle Time, the Dead Band, the Output Limit, the PB (gain), the Rate, and the Reset.
Super Systems Inc. Page 90 of 104
Color Touch Screen Data Logger Operations Manual
Page 91

Revision History
Rev.
Description
Date
MCO #
New
Initial Release
03/05/2013
2112
Super Systems Inc. Page 91 of 104
Color Touch Screen Data Logger Operations Manual
Page 92

Appendix 1: Quick Start Guide
The purpose of this Quick Start Guide is to provide a step-by-step guide to using the Color SDS
Data Logger for the very first time. More specifically, this guide provides a procedure for
preparing and using the data logger in survey operations beginning with receipt of shipment and
concluding with downloading data with SDS Reporter after the survey has been run and
generating reports. This guide provides concise information on unpacking, setting up, and
operating the Color SDS Data Logger, as well as downloading data and generating a report; for
more detailed information, please refer to specific sections of the manual.
Unpacking the Color SDS Data Logger
When you receive the Color SDS Data Logger, it will arrive in a box similar to the one shown
below.
Typical Box in Which Color Touch Screen Data Logger is Shipped
When the shipment arrives, move the box to a sturdy, elevated location (such as a table that can
support the weight of the data logger) with a working electrical outlet nearby and sufficient
room in which to work. When moving the box, employ proper safety precautions in order to
avoid personal injury.
Once the box containing the data logger has been placed on a sturdy work surface, you may
begin removal of the data logger from the box. First, using a utility knife or other appropriate
cutting instrument, cut the tape on top of the box. Then turn the box on its side and pull the box
flaps back, ensuring that there is enough clearance on the work surface that the data logger
will fit, with minimal risk of falling.
Super Systems Inc. Page 92 of 104
Color Touch Screen Data Logger Operations Manual
Page 93

SDSReporter CD
Calibration Certificate
USB Cable
Power Cord
Color Touch Screen
Removing Data Logger from Box
Carefully remove the data logger and other contents from the box. Place the data logger flat on
the table, and set the box aside. The contents should include items shown in the picture below.
Data Logger
Standard Contents of Box
Warming Up and Charging the Data Logger
If the data logger was recently brought indoors from a cold outside environment, allow the data
logger to warm up to the ambient temperature before plugging it in or turning it on. This will
help prevent condensation from forming on or inside the data logger and will help prevent
damage to electrical parts.
If the data logger has not been charged, first plug it into an electrical outlet using the electrical
cord provided. Allow the unit to charge until the charging light turns from red to green (green is
fully charged).
Super Systems Inc. Page 93 of 104
Color Touch Screen Data Logger Operations Manual
Page 94

Red – Charging Green – Charged
Move the data logger to the survey area.
Power Switch in “ON” Position
after one minute of operation.
Charging Indicator on Data Logger
Turning on the Data Logger
Turn on the data logger by turning the switch located
on the side of the unit to the “ON” position.
The data logger will turn on. The touch screen will start. After a few minutes, the main Color
SDS Touch Screen menu will appear. Ensure that there are no error messages on the screen
Connecting the Thermocouple Wires and Setting the Input Type
Connect the thermocouple wires to the input boards on the data logger.
Connecting Thermocouple Wires to Input Board
Set the Input Type (thermocouple wire type) using the Edit Input Types menu.
Super Systems Inc. Page 94 of 104
Color Touch Screen Data Logger Operations Manual
Page 95

Edit Input Types
Using Survey Templates
If a survey has been run previously, the data logger will default to the last survey template used.
To modify the template being used, access the
Survey
menu option. This option contains the
survey information and the controls to perform a survey.
Choose the appropriate template from the drop-down menu in the top right-hand corner.
The Edit Template button allows for changes to be made to the selected survey. When editing a
survey, pressing
OK will make changes only for that particular survey, while pressing Save will
permanently change the template.
The View Surveys button will display a list of previous surveys from the selected time range.
Starting a Survey
Once the template has been selected and any necessary edits have been made, press Start
Survey to begin. This will timestamp the selection and the data logger will log all channels that
have been selected for logging.
Super Systems Inc. Page 95 of 104
Color Touch Screen Data Logger Operations Manual
Page 96

Survey Window
You may receive deviation alarms depending on the current input and setpoint as well as the
alarm settings. The survey continues to run. It is simply providing you with the information on
the display.
You can view the input channel data on a number of different screens. The
option will display all channels on the device.
While the survey is running, several options are available: To stop the survey, select
Survey
main menu). Use
target temperature. Use
from the Survey Control screen (which can be opened using the Survey option from the
Mark Approach
Mark Survey Start
to add a timestamp on when the furnace was heating up to its
to mark when the survey began.
Overview Display
Complete
Survey Control Window (visible from the data logger during a survey)
Click
View Surveys
data being logged.
Super Systems Inc. Page 96 of 104
to view data on past surveys. Click
Color Touch Screen Data Logger Operations Manual
View Chart
to view the current chart of
Page 97

Stopping Survey
When finished, select
Complete Survey
from the Survey Control screen (which can be opened
using the Survey option from the main menu).
Installing SDS Reporter
IMPORTANT: The person installing SDS Reporter must have administrative rights on the
computer(s) where the installation is taking place for the installation to be successful.
Double-click on the setup file, setup.exe, to start the auto-installation. (Avoid installing from
SDSSetup.msi, as this will not install prerequisites if necessary.) If there is no version of the
SDS Reporter running on the computer, the installation will prompt the user for the download
location.
SDS Reporter setup screen
Prerequisites for installing SDS Reporter include .NET Framework 2.0, SQL CE 3.5, and either
ActiveSync or Windows Mobile Device Center. The setup.exe program will check to make sure
that these prerequisites are installed and, if necessary, install them.
The default installation location is “C:\SSI\SDS”. Click on the “Browse” button to select an
alternate location. Clicking on the “Disk Cost…” button will display the available computer
drives onto which the SDS Reporter can be downloaded, as well as the total space, available
space, and required space for each drive. Selecting the “Everyone” option will install the SDS
Reporter for all users on the computer, while selecting the “Just me” option will only install the
SDSReporter for the current user.
Click the “Next >” button to continue with the installation process.
Super Systems Inc. Page 97 of 104
Color Touch Screen Data Logger Operations Manual
Page 98

Windows XP requires a driver for it to properly
Help
Installation ready screen
Click on the “Next >” button to install the software to the specified location. Once the software
has been installed, close the installation program.
Connecting the SDS Data Logger to a Local Computer via USB
The data logger can be connected directly to a local computer using a USB cable. Windows uses
special software to transfer files and information between the data logger and the local
computer when connected via USB. If you are using Windows XP, this software is called
ActiveSync. If you are using Windows Vista or Windows 7, the software is called Mobile Device
Center. If the required software was not installed prior to installing SDSReporter, the
SDSReporter Setup utility (run from setup.exe) would have installed the required software.
connect to the data logger’s color touch
screen operating system. Install this driver, if
necessary, by selecting the “Check Screen
Driver Installation” option under the
menu in SDSReporter, and then clicking “Start
Driver Installation” on the next screen.
Color Screen Driver Installation option
If you are using an older version of SDSReporter, be sure to update it by clicking “Check for
Updates”, also in the
Help menu, and then downloading the update when prompted.
To connect the SDS Data Logger to a local computer with USB, first make sure that the data
logger is turned on and that the SDS software is running on the touch screen. Next, identify the
USB connection point used to connect the data logger to the local computer. To connect the
data logger to the computer, you will need a USB cable with cable ends that look like those
shown in the figure at right, below.
Super Systems Inc. Page 98 of 104
Color Touch Screen Data Logger Operations Manual
Page 99

NOTE: If there is any question as to whether
same list.
The “Color Screen Scanning” option must be checked
Color Screen Scanning Option
Location of USB connection point for
connecting data logger to local computer
Standard-A (left), Standard-B (right)
USB connection types
Connect the SDS Data Logger to the local computer via USB. If you are connecting the data
logger to the computer via USB for the first time, you may see a message on the screen saying
that Windows is installing drivers, especially on Windows Vista and 7. Windows may also ask you
if you want to set up the device. If this happens, allow Windows to install the drivers, but close
the device setup window from ActiveSync or Mobile Device Center.
the computer is detecting the data logger and
connecting to it properly, check the “My
Computer” window in Windows XP or the
“Computer” window in Windows Vista and 7.
The data logger should appear in this window
with a mobile or portable device icon, as
shown at right. Other devices, such as
Windows XP (left) and Windows 7/Vista (right)
Data Logger Device Icons in
smartphones, may also appear as part of the
Once the SDS Data Logger is connected to the computer via USB, start SDS Reporter.
Downloading Data with SDS Reporter
in order for SDS Reporter to scan for the Color SDS
Data Logger. This scanning will take place over USB
using ActiveSync (Windows XP) or Mobile Device
Center (Windows Vista/7).
Open the Download Surveys and Data option in SDS Reporter. The software will begin to search
for any data loggers located on the network.
Super Systems Inc. Page 99 of 104
Color Touch Screen Data Logger Operations Manual
Page 100

SDS Data Log Extractor screen
Any data logger found on the network will be added to the drop-down list at the top of the
screen. If no devices are found, a message box will pop up letting the user know that no devices
were found on the network. Check the network connections to verify that any data logger and
computer are properly connected to the network.
No SDS devices found box
Under the
to download only data that has been used in surveys, or all of the logged data. (The SDS data
logger will log data continuously when it is on regardless if a survey is running or not. There
will be a check mark next to the menu option selected.) The default menu option is
used in surveys
Options > Download
. To download all data, make sure that
menu, the
Download
menu option will allow the user to choose
Only data
All data
is checked.
Download menu option
Super Systems Inc. Page 100 of 104
Color Touch Screen Data Logger Operations Manual
 Loading...