

Page 1

PH2
Portable Hydrogen Analyzer
Operations Manual
Please read, understand, and follow these instructions before operating this equipment.
Super Systems, Inc. is not responsible for damages incurred due to a failure to comply with
these instructions. If at any time there are questions regarding the proper use of this analyzer,
please contact us at (800) 666-4330 for assistance.
7205 Edington Drive
Cincinnati, OH 45249
513-772-0060 800-666-4330
Fax: 513-772-9466
www.supersystems.com
Page 2

Table of Contents
Basic Operating Description: .......................................................................................................... 2
Chart ............................................................................................................................................... 3
Chart Sub Menu .............................................................................................................................. 4
Menu ............................................................................................................................................... 6
Exit Program ............................................................................................................................... 7
Instrument Information ............................................................................................................... 7
Pump Control .............................................................................................................................. 8
Communications Setup ............................................................................................................... 8
Instrument Configuration ............................................................................................................ 9
Output Configuration ..................................................................................................................10
Output Calibration ......................................................................................................................11
Sensor Calibration ......................................................................................................................13
Performing a Zero Calibration................................................................................................13
Performing a Span Calibration ...............................................................................................13
Modifying Network Settings (Such as IP Address) ........................................................................14
Use with Touch Screen Manager ...................................................................................................15
Changing the System Date and Time .............................................................................................15
Spare Parts ....................................................................................................................................17
Revision History .............................................................................................................................18
SSi Portable Hydrogen Analyzer
Rev A
1
Page 3
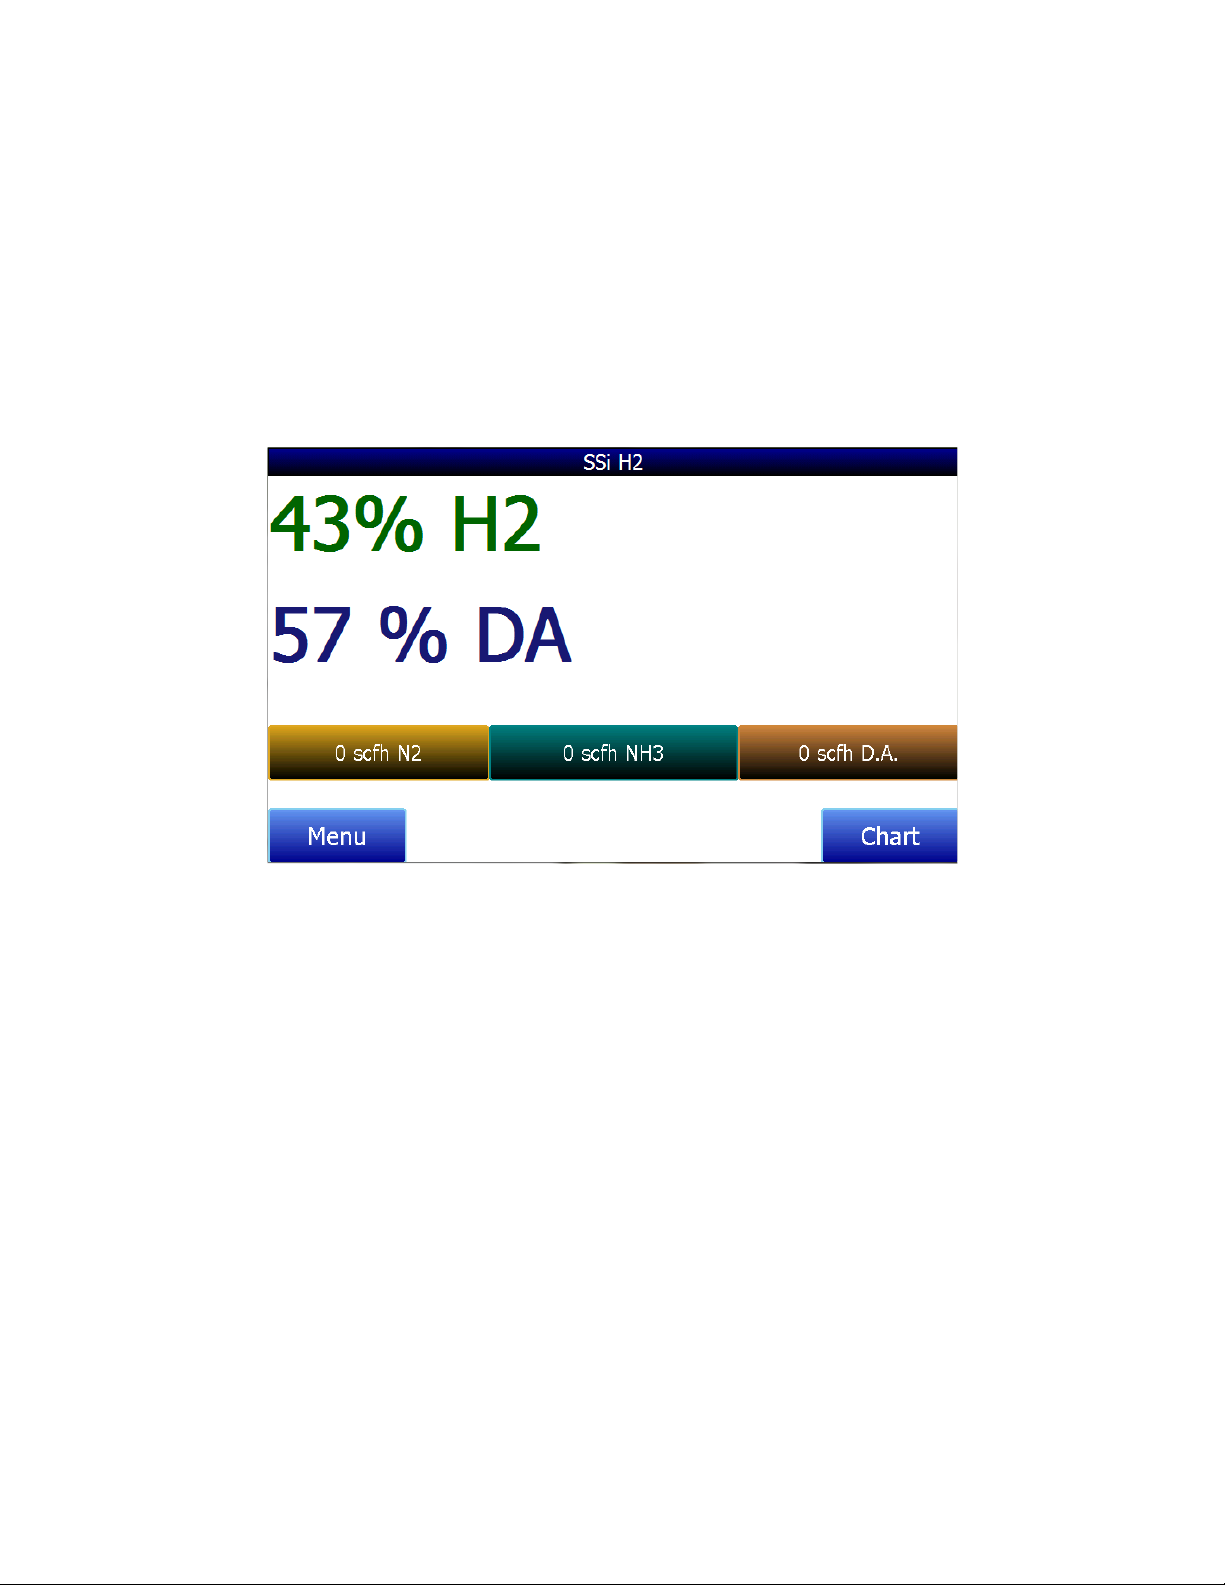
Basic Operating Description:
This instrument uses the measurement of Hydrogen to display % Hydrogen (H
(DA), and % Ammonia (NH
). When the flow rates of Nitrogen, Ammonia, and Dissociated
3
Ammonia are manually entered, the instrument can also calculate Nitriding potential (Kn).
When the instrument is turned on, it will display % H
additional values (%NH
or Kn), see the “Instrument Configuration” screen. The 4-20mA output
3
and %DA on the screen. To display
2
on the side of the case can be set up to retransmit the any of these measurements in whatever
range is appropriate for the application.
), % Dissociation
2
The home screen also displays the flow of N2, NH3, and D.A. These values can be entered by the
operator when the instrument is in the mode to evaluate Kn or %DA. This is discussed further
under the Instrument Configuration section. The
will take the operator to the configurable options within the controller. The
bottom right-hand corner of the screen will display the data trend chart.
Menu button in the bottom left-hand corner
Chart button in the
SSi Portable Hydrogen Analyzer
Rev A
2
Page 4
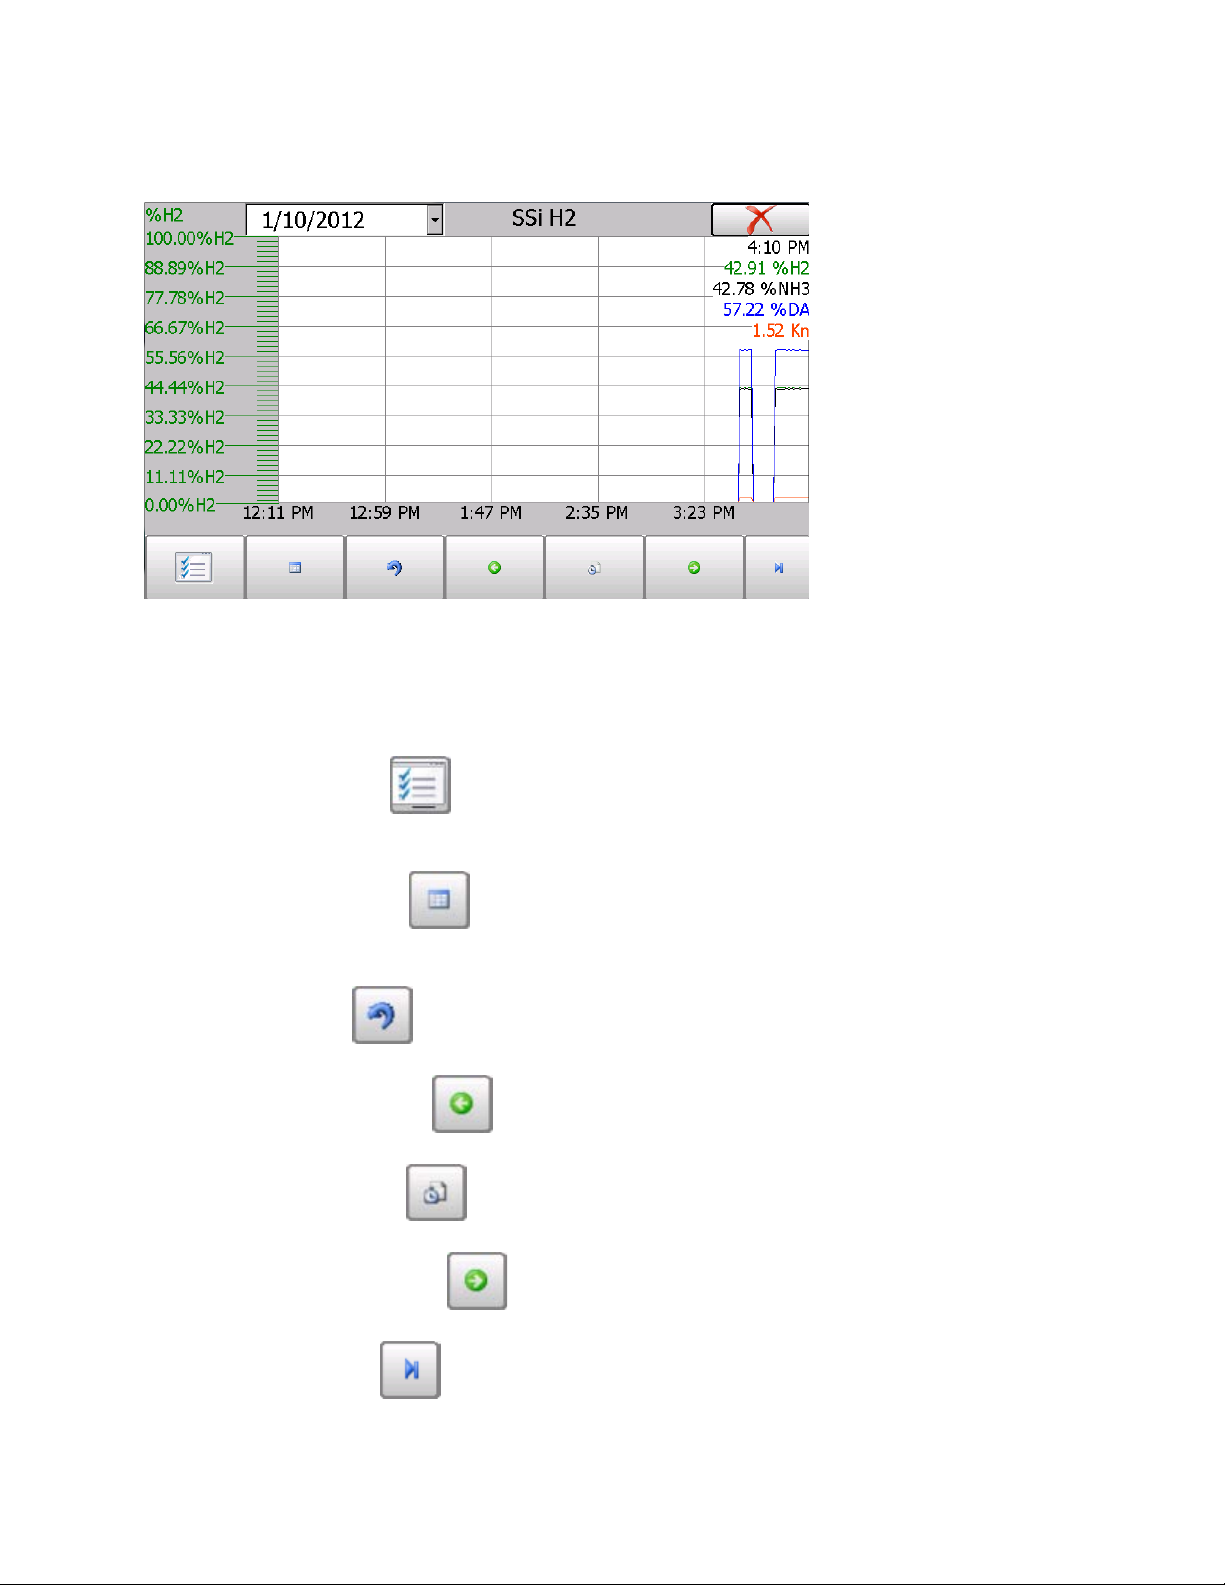
Chart
The Chart Display shows between 1 hour and 24 hours of process variable data on the screen
and can be scrolled back to view all of the data stored on the hard drive. The vertical timelines
change as the time changes on the screen.
The function buttons run along the bottom of the screen.
The Trend Lines button trend chart to display. If the checkbox next to each trend line is checked, then that trend line
will be displayed.
The Datagrid View button instead of with trend lines. The trend data is shown in 1-minute intervals. Clicking on the
button on this screen will close the screen down and return to the Chart Display screen.
The Refresh button - - will refresh the screen’s trend data if the screen is not in realtime mode.
The left green arrow button specified chart interval.
The chart interval button chart. The options are:
The right green arrow button - - will move the chart’s view forward in time by the
specified chart interval.
1 Hour, 2 Hours, 4 Hours, 8 Hours, 12 Hours, or 24 Hours.
- will allow the user to select or de-select the trend lines on the
- will display a screen with the trend data in a grid format
OK
- will move the chart’s view backward in time by the
- will determine the number of hours displayed on the trend
The blue arrow button the chart will automatically be updated once a minute.
SSi Portable Hydrogen Analyzer
Rev A
- will toggle real-time mode on and off. When in real-time mode,
3
Page 5
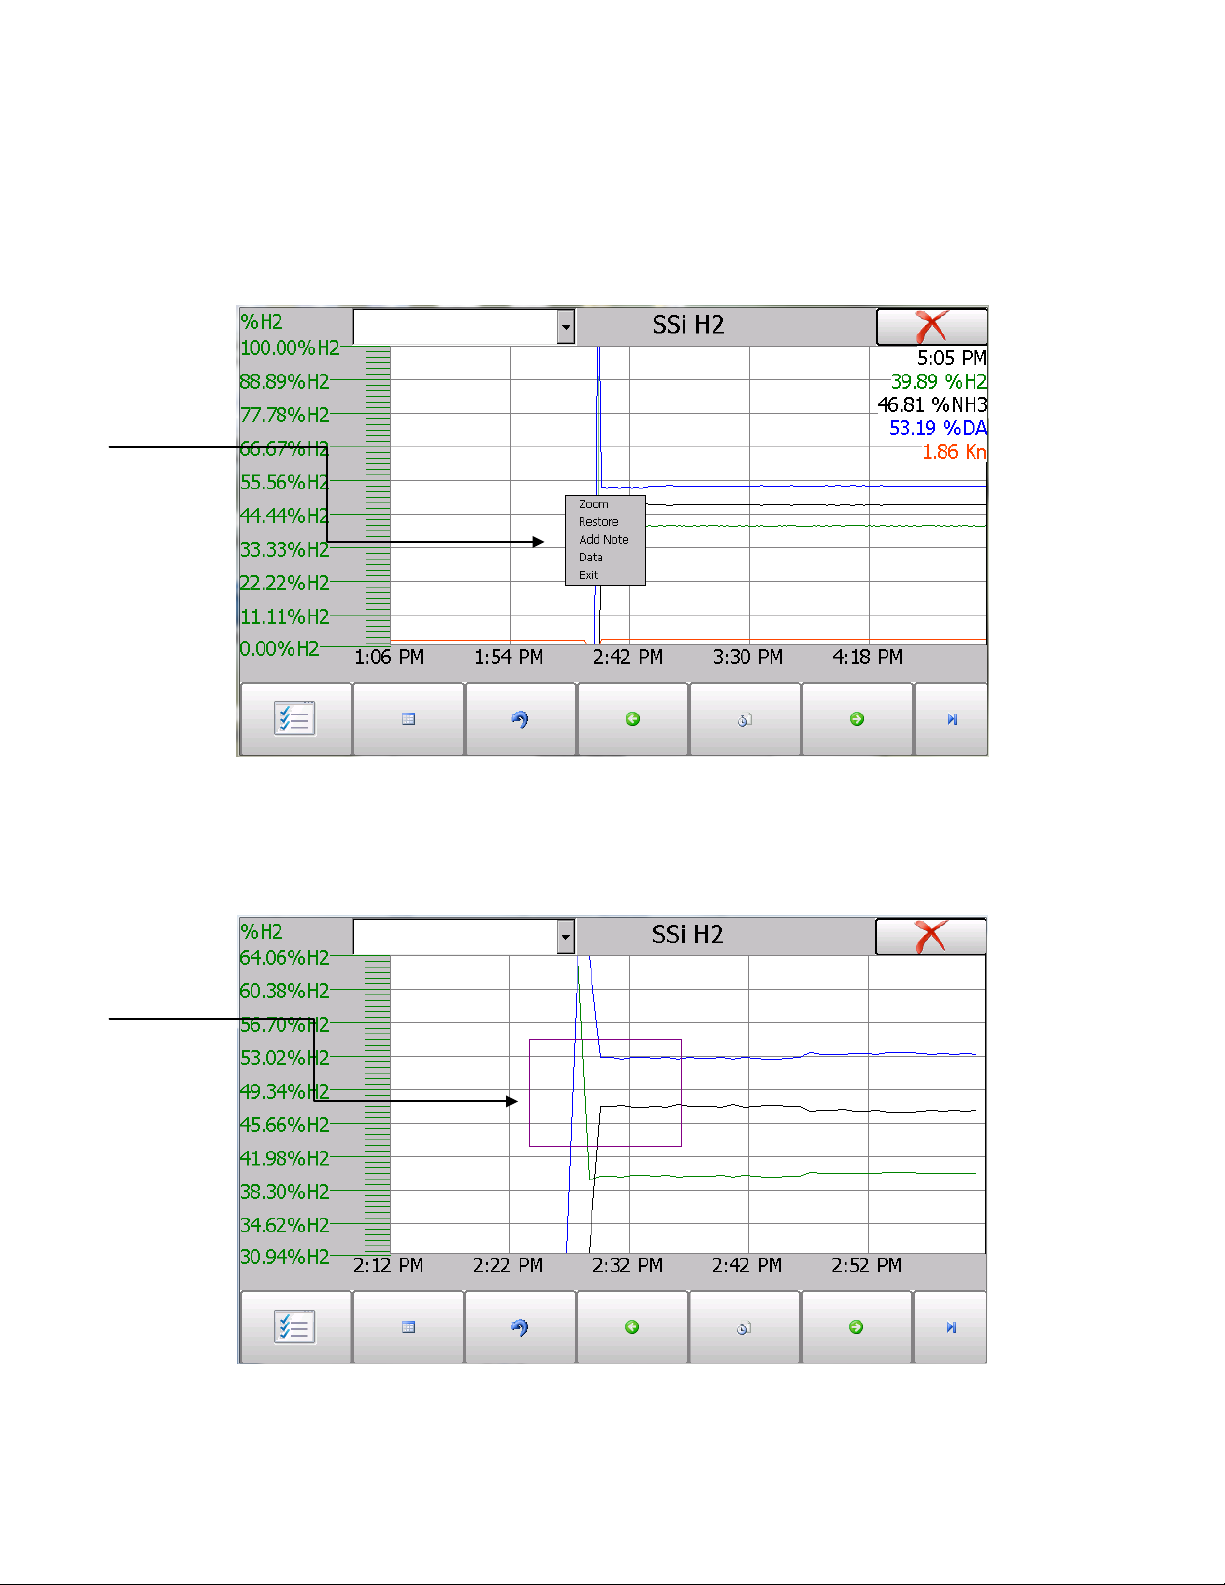
Chart Sub Menu
There is a sub-menu available by putting a finger or a stylus anywhere on the chart and
pressing down for 1-2 seconds. The sub-menu will have the following options available:
Restore, Add Note, Data, and Exit.
Zoom,
The Zoom option will allow the user to zoom in on a particular part of the screen. Once this has
been selected, the user can take a stylus or a finger and create a box around the desired data.
Once the user releases the stylus or finger, a zoom is no longer possible, and the user will need
to re-select the option from the sub-menu to zoom in again.
SSi Portable Hydrogen Analyzer
Rev A
4
Page 6

The Restore option will back out of any zoom options that have been performed and display the
chart screen as it initially was.
The Add Note option allows the operator to enter a note on the chart, similar to writing on a
paper chart. Pressing the
operator ID or initials and a note. The user has the option to enter a note using the operator
interface keyboard, where he or she will be able to type in the note; or the user can use the
Signature mode, which will allow them to write a note using a stylus.
The Data option will show the trend data as a data grid instead of the trend lines on a chart.
Add Note option displays a screen where the operator can enter the
This functionality is exactly the same as if the user pressed the Datagrid View button from the chart screen.
Exit will close out the sub-menu without selecting an item.
Pressing the red ‘X’ in the top right-hand corner of the screen will take the user back to the
status screen.
-
SSi Portable Hydrogen Analyzer
Rev A
5
Page 7

Menu
Accessing the Menu screen will show two available options:
Additional menu items are available when an authorized user logs in using an appropriate Pass
Code. When the Administrator Pass Code is entered (default = 2), the user will also be able to
access the following options:
To access any items on the menu list, touch the item to highlight it and then press Select. A
specific description of each item on the list follows:
6
SSi Portable Hydrogen Analyzer
Rev A
Page 8

Exit Program
Selecting Exit Program will allow the operator to shut down the user interface. This can be
done by selecting
Yes when prompted or No to return to the Menu list. If the user interface is
shut down, it will restart automatically when the power to the instrument is cycled.
Instrument Information
Instrument Information displays the default parameters of the Portable H
. This screen
2
provides information on any applicable revision levels and serial numbers. It also shows if the
instrument is logging data. There are no functions that can be performed on this screen; it is
for informational purposes only.
The Go Back button will return to the Menu list.
7
SSi Portable Hydrogen Analyzer
Rev A
Page 9

Pump Control
Pump Control will allow the operator to turn the pump on or off by selecting the corresponding
button. Pressing
Communications Setup
Return will display the Menu list.
The communication modes shown on this screen are for display only and should not be
modified.
8
SSi Portable Hydrogen Analyzer
Rev A
Page 10

Instrument Configuration
Instrument Configuration will modify the measured quantity display on the overview screen.
This instrument will always display Percent Hydrogen (%H
), and it is capable of displaying
2
three additional different parameters if desired. These include:
• Percent Dissociation (DA)
• Percent Ammonia (NH
)
3
• Nitriding Potential (Kn)
One additional parameter can be displayed along with Hydrogen by highlighting it and pressing
OK.
Percent Hydrogen
The percent hydrogen is the amount of Hydrogen that is being detected by the thermal
conductivity sensor inside the instrument. There are no additional calculations being
performed to this value.
Percent Dissociation
Dissociation is derived from the amount of Hydrogen in the sample gas. Flow rates must be
entered at the bottom of the screen to obtain a true %DA calculation.
Percent Ammonia
The amount of Ammonia can also be inferred from the Hydrogen value.
Nitriding Potential
The accurate calculation of Nitriding potential requires the flow rates of other gases that are
being introduced into the process. All of the flow rates must be in the same units and scaling.
SSi Portable Hydrogen Analyzer
Rev A
9
Page 11

Kn can only be calculated by entering the flow of Nitrogen (N
), Ammonia (NH3) and Dissociated
2
Ammonia (DA). These values are entered at the bottom of the home screen when Kn is
selected.
To change the display, click on Mode and press Edit. This will allow the operator to choose
between Hydrogen, Dissociation, NH
mode and press
Ok to modify this option.
, and Kn for analysis and display. Select the appropriate
3
Minimum H2 for NH3 display
There may be times when the process is not active. During these times, the measured
Hydrogen value displayed on the screen will remain valid, but the calculated % NH
will not be
3
valid since it is based on the assumption that the known process gases are involved. In these
cases, it may be more desirable to hide the display of NH
known to be incorrect. This can be done by setting a minimum level of H
instead of displaying a value that is
3
that will be present
2
when the process is active. When the Hydrogen drops below this level, the instrument will know
that the process is not active and the NH
readings are not valid so it will not display NH3.
3
Output Configuration
There is one 4-20mA output that can be configured for any of the four parameters. The operator
can select the Source (H
, DA, NH3, Kn), the zero value (the value to be represented by 4mA) and
2
the span value (the value to be represented by 20mA).
10
SSi Portable Hydrogen Analyzer
Rev A
Page 12

Output Calibration
The Portable H2 has one 4-20 mA output. For optimal accuracy the output can be verified and if
necessary calibrated.
Equipment needed:
A calibrator with the ability to measure Milliamps.
Zero Calibration - Outputs
To perform a zero calibration, click on the Zero output option. The circle will be filled in with a
dot for the selected option. When ready to start the calibration, click on the
Prep for Cal button.
SSi Portable Hydrogen Analyzer
Rev A
11
Page 13

The user will then measure the current at the appropriate output terminals and enter that value
into the blue box by tapping on it once to bring up a number pad. Save this value by pressing
OK.
Click on the Calibrate button to begin the calibration.
Span Calibration - Outputs
To perform a span calibration, click on the Span Output option. The circle will be filled in with a
dot for the selected option. When ready to start the calibration, click on the
Prep for Cal button.
The user will then measure the current at the appropriate output terminals and enter that value
into the blue box by tapping on it once to bring up a number pad. Save this value by pressing
OK.
Click on the Calibrate button to begin the calibration.
SSi Portable Hydrogen Analyzer
Rev A
12
Page 14

Sensor Calibration
A proper calibration of the sensor requires two gases. The first gas should be pure Nitrogen or
Argon. This contains no Hydrogen, and is therefore referred to as the Zero Gas. The second
gas is the Span Gas. The Span Gas should ideally contain a quantity of Hydrogen similar to the
amount of Hydrogen in the process to be measured. The Span Gas should also include any
other gases that are present in the process gas in their respective percentages. The more
similar to the process gas the calibration gas is, the more accurate the calibration will be.
Performing a Zero Calibration
On the Sensor Calibration page, select Zero Hydrogen. Begin the flow of gas through the
analyzer using the flexible sample tubing assembly. The flow rate should be 1.5 to 2.0 SCFH as
measured on the flow meter in the lid of the case. The gas should not be under any pressure
other than the amount required to maintain the appropriate flow amount. The target Value is
shown on the screen. For a Zero Calibration, this will be 0.00 (the amount of Hydrogen in the
Zero Gas). The Measured H
Value can be seen at the bottom of the screen. When this value
2
comes to equilibrium, it will not be showing any upward or downward trends, only the slight
oscillation of the readings. This usually occurs in approximately 30 seconds. When the sensor
is at equilibrium, press the green
Calibrate button to perform the zero calibration. After the
Zero Calibration is complete, turn off the flow of gas and disconnect it from the enclosure.
Performing a Span Calibration
To perform a span calibration, select Span Hydrogen, and flow the span gas in the same
manner as the zero gas. The Target Value should be set to the exact amount of Hydrogen that is
in the Span Gas cylinder. Then the same procedure should be followed as the Zero calibration,
with the
Calibrate button being pressed after the readings reach equilibrium. After the Span
Gas calibration is complete, turn off the flow of gas, disconnect the cylinder from the enclosure.
SSi Portable Hydrogen Analyzer
Rev A
13
Page 15

Modifying Network Settings (Such as IP Address)
From the operating system screen, click
Double tap on the connection for the PH2 touch
If using the PH2 on a network, it may be necessary to modify network settings manually.One of
the most common reasons for modifying network settings is to manually assign an IP address
to the touch screen. If you are not familiar with IP addressing and network settings, it is
recommended that you first speak to your network administrator.
To modify the network settings, first shut down the interface using the Exit Program option (as
described in the
Exit Program section).
Once the PH
interface is shut down, you will see the operating system screen. The following
2
procedure is typical for changing the IP address.
Start, Settings, and Network and Dial-up
Connections.
screen (in the example, it is called
“SMSC91181”). An Ethernet Driver settings
window will appear, giving you the ability to
specify an IP address. To do so, click the
“Specify an IP address” radio button. Then
enter an IP address manually.
SSi Portable Hydrogen Analyzer
Rev A
14
Page 16

Make sure that the IP address does not conflict
with another IP address already assigned on
the network.
You will also need to add a Subnet Mask and a
Default Gateway. The subnet mask is usually
already determined for the network. A common
subnet mask is 255.255.255.0; however, check
with the network administrator to be sure. The
default gateway is usually the address of the
network router or other device that is
responsible for routing network traffic.
If you have questions about the specific network to which you are connecting the PH
, please
2
contact the network administrator.
Use with Touch Screen Manager
The PH2 is compatible with SSi’s Touch Screen Manager (TS Manager) software, which allows a
Windows-based computer to connect to and access data from the PH
use TS Manager, the Windows-based computer must be connected to the PH
touch screen. In order to
2
using an Ethernet
2
connection or a USB connection with Active Sync or Mobile Device Center. For more information
on using TS Manager, refer to the TS Manager manual available on the Super Systems Inc.
website:
http://www.supersystems.com
TS Manager is typically supplied with any new purchase of the PH
(“Manuals” link).
. If you need information on
2
obtaining TS Manager, please contact Super Systems Inc. at (800) 666-4330.
Changing the System Date and Time
The time and date that the PH2 screen software uses are based on the time and date of the
touch screen operating system. To change the time and date, first shut down the software as
shown in the picture below (also described in the Exit Program section). Once the software is
shut down, double tap on the time shown in the task bar at the bottom of the screen on the
operating system desktop. Change the date and time in the dialog box that appears.
SSi Portable Hydrogen Analyzer
Rev A
15
Page 17

Once the date and time are changed, the system registry should be saved in order to ensure
that any settings you changed are maintained when the touch screen is restarted or powered
down and powered up again. To save the registry, follow these steps.
1. Click on the Start menu, and then select Programs. Determine whether an Advantech menu
is present, such as the one shown in the figure below.
2. If an Advantech menu IS present: Select “Registry Saver” under the Advantech menu. A
“SUCCESS” window similar to the one shown below should appear on the screen.
16
SSi Portable Hydrogen Analyzer
Rev A
Page 18

3. If an Advantech menu is NOT present: Open the “Run” dialog box by pressing the “Start”
menu and selecting
complete” window similar to the one shown below should appear on the screen.
Run. In the dialog box, type
saveregs
and press OK. A “Registry Save
Spare Parts
The following items can be purchased as needed for the PH2.
SSI
P/N
32012
20624
13550
33018
20634 Notepad, Universal portable instruments
36033
33095
20315
31033
37048
DESCRIPTION
Battery 12VDC
H2 Sensor
Touch Screen Display
Power Cord, AC
Flow scope, .2 to 2.0scfh
Fuse, 2 amp slow blow
Sample Tubing Assembly
In-Line Filter
Bowl Filter Assembly
31027
13084
30054 Zero Gas Calibration Kit (including regulator)
SSi Portable Hydrogen Analyzer
Rev A
Element for Bowl Filter
Span Gas Calibration Kit (40% H2)
17
Page 19

Revision History
Rev.
Description
Date
MCO #
-
Initial Release
2/1/2012
2093
A
Added information on Touch Screen
5/1/2013
2122
Manager, modifying network settings,
and changing system date and time
SSi Portable Hydrogen Analyzer
Rev A
18
 Loading...