

Page 1

User Manual
EAZ0077L00C Rev. A
Page 2

Legal Information
IMPORTANT:
Trademarks
Snap-on, ShopStream Con nect, SureTrack, Fast-Track Troubleshoo ter, ShopKey , ShopKe y Pro and VERUS PRO
are trademarks registered in the United States and other countries of Snap-on Incorporated. All other marks are
trademarks or registered trademarks of their respective holders.
Copyright Information
© 2014 Snap-on Incorporated. All rights rese rved.
Disclaimer of Warranties and Limit ation of Liabilities
The information, specifications and illustrations in this manual are based on the latest information available at the
time of printing. While the authors have taken due care in the p rep aratio n of this manual, n othing cont aine d here in:
• Modifies or alters in any way the standard terms and co nd itions of the purch ase, lease, or rent al ag reement
under the terms of which the equipment to which this m anual relate s was acquired.
• Increases in any way the liability to the customer or to third parties.
Snap-on reserves the right to make changes at any time without notice.
Before operating or maintaining this unit, pl ease re ad this manual car efully p aying extra atten tion to the sa fety
warnings and precautions.
Contact Information (North America)
Websites:
http://diagnostics.snapon.com
ShopStream Connect
http://diagnostics.snapon.com/ssc
Phone / E-mail - Technical Assistance
1-800-424-7226 / diagnostics_support@snapon.co m
For technical assistance in all other markets, contact your selling agent.
EAZ0077L00C Rev . A 10-F-14 NA
ii
Page 3

Safety Information
For your own safety and the safety of others, and to prevent damage to the equipment an d
vehicles upon which it is used, it is important that the accompanying Important Safety Instructions
be read and understood by all persons operating, or coming into contact with, the equipment. We
suggest you store a copy near the Diagnostic Tool in sight of the operator.
This product is intended for use by properly trained and skilled p rofessional a utomotive
technicians. The safety messages presented throughout this manual are reminders to the
operator to exercise extreme care when using this test instrument.
There are many variations in procedures, techniques, tools, and p art s for servicing vehicles, as
well as in the skill of the individual doing the work. Because of the vast number of test applications
and variations in the products that can be tested with this instrument, we cannot possibly
anticipate or provide advice or safety messages to cover every situation. It is the responsibility of
the automotive technician to be knowledgeable of the system being tested. It is essential to use
proper service methods and test procedures. It is import ant to perform tests in an ap propriate and
acceptable manner that does not endanger your sa fety, the safety of others in the work area, the
equipment being used, or the vehicle being tested.
It is assumed that the operator has a thorough underst anding of vehicle systems before using this
product. Understanding of these system principl es and oper ating th eories is nece ssary fo r
competent, safe and accurate use of this instrument.
Before using the equipment, always refer to and follow the safety messages and applicable test
procedures provided by the manufacturer of the vehicle or equipment being tested. Use the
equipment only as described in this manual.
Read, understand and follow all safety messag es and instru ctions in this manual , the
accompanying Important Safety Instr uction s, an d on the test equipm ent.
iii
Page 4
Safety Information Safety Signal Words
'$1*( 5
:$51 ,1*
&$87,21
:$51 ,1*
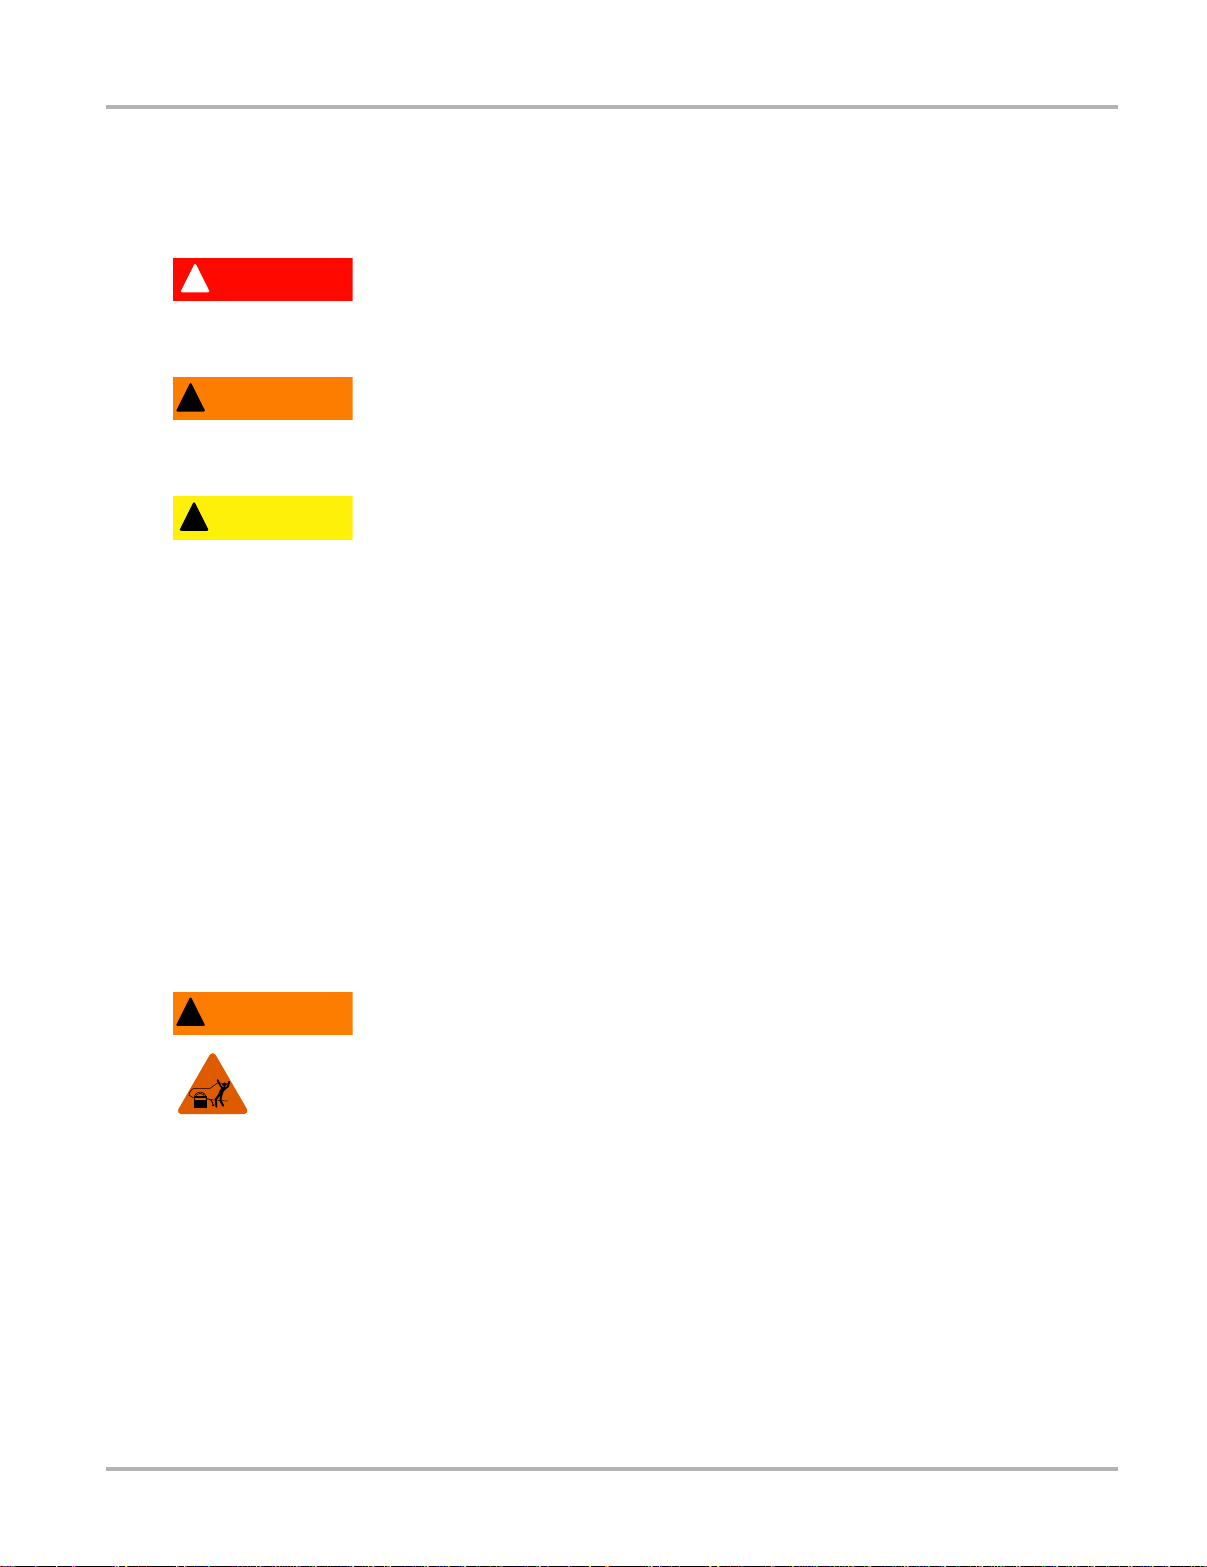
Safety Signal Words
Safety messages are provided to help prevent personal injury and equipm ent damage. All safety
messages are introduced by a signal word indicating the haza rd level.
Indicates an imminently hazardous situation which, if not avoided, will result in death or serious
injury to the operator or to bystanders.
Indicates a potentially hazardous situation which, if not avoided, could result in death o r serious
injury to the operator or to bystanders.
Indicates a potentially hazardous situation which, if not a voided, may result in moderate or minor
injury to the operator or to bystanders.
Safety Message Conventions
Safety messages are provided to help prevent personal injury and equipm ent damage. All safety
messages are introduced by a signal word indicating the haza rd level.
Safety messages communicate the hazard, hazard avoidance and possible consequences using
three different type styles:
• Normal type states the hazard.
• Bold type states how to avoid the hazard.
• Italic type states the possible consequences of not avoidi ng the ha zard.
An icon, when present, gives a graphical description of the potential hazard.
Example:
Risk of unexpected vehicle movement.
• Block drive wheels before performing a test with the engine running.
A moving vehicle can cause injury.
Important Safety Instructions
For a complete list of safety messages, refer to the accompanying safety information.
SAVE THESE INSTRUCTIONS
iv
Page 5

Content s
Safety Information..................................................................................................................... iii
Contents....................................................................................................................................... i
Chapter 1: Using This Manual................................................................................................... 1
Conventions.................................................................................................................................. 1
Bold Text................................................................................................................................ 1
Symbols ................................................................................................................................. 1
Terminology ........................................................................................................................... 1
Notes and Important Messages............................................................................................. 2
Procedures............................................................................................................................. 2
Hyperlinks .............................................................................................................................. 2
Tool Help................................................................................................................................ 2
Chapter 2: Introduction.............................................................................................................. 3
Features and Specifications........................................................................................................ 3
Diagnostic Tool ............. .... ... ... ... ... .... ... ... ... ....................................... ... .... ... ... ... ... .... ... ... ........ 3
Scan Module........................................ ....................................... ... ... ... .................................. 7
Scope Multimeter Module ...................................................................................................... 9
Chapter 3: Getting Started....................................................................................................... 11
Turning On.................................................................................................................................. 11
Function Icons...................................................................................................................... 11
Toolbar................................................................................................................................. 13
Windows Toolbar .................................................................................................................14
Turning Off.................................................................................................................................. 14
Emergency Shutdown.......... ... ... ... .... ... ....................................... ... ... ... .... ... ... ... ... .... ... ... ...... 14
Chapter 4: Navigation .............................................................................................................. 15
Controls...................................................................................................................................... 15
Control Buttons .................................................................................................................... 15
LEDs .................................................................................................................................... 16
The Stand ........................................................................................................................... 16
Camera Operation......................................................... .... ... ... ... ... .... ......................................... 16
Chapter 5: Scanner Operations............................................................................................... 18
Getting Started ........................................................................................................................... 18
The Demonstration Program................................................................................................ 18
Disconnecting the Diagnostic Tool From a Vehicle.............................................................. 19
Menu Options, Scanner .......... ... ... .... ... ... ... .... ... ... ....................................... ... ... ... .... ... ... ... ... 20
Vehicle Identification................................................................................................................... 23
Alternative Vehicle Identification.......................................................................................... 24
Connecting to a Vehicle.............................................................................................................. 25
Data Cable Connection........................................................................................................ 25
No Communication Message............................................................................................... 26
Navigation................................................................................................................................... 26
i
Page 6

Contents
Scanner Screen Layout ................................. ... ... ... .... ... ... ... ... .... ...................................... ... 26
Screen Messages ................................................................................................................ 29
Making Selections................................................................................................................ 29
Operations.................................................................................................................................. 29
Data Display......................................................................................................................... 31
Codes Menu..... .... ... ... ....................................... ... ... .... ... ... ... ....................................... ... ...... 35
Functional Tests...... ....................................... ... ... ... .... ... ... ....................................... ... ... ...... 38
Generic Functions................................................................................................................ 39
Troubleshooter..................................................................................................................... 40
Scanner Toolbar Operations......... .... ... ... ... .... ... ... .......................................... ...................... 41
Exiting the Scanner .................................................................................................................... 48
Downloading Firmware............................................................................................................... 49
Chapter 6: OBD Direct Operations.......................................................................................... 52
OBD Health Check..................................................................................................................... 53
Global OBD II Code Check......................................... ... ... ....................................... ... ... ... ... 53
Global OBD II Clear Codes........... .... ... ... ............................................................................. 54
Readiness Monitors ............................................................................................................. 54
MIL Status............................................................................................................................ 55
OBD Diagnose............................................................................................................................ 55
Start Communication ........................................................................................................... 55
Connector Information ............................ ... .... ... ... ... ....................................... ... ... .... ... ... ... ... 59
Manual Protocol Selection ................................................................................................... 59
Chapter 7: Guided Component Test Operations................................................................... 60
Vehicle Identification................................................................................................................... 60
Menu Options, Guided Component Test.............................................................................. 61
Creating a Favorites List...................................................................................................... 63
Identifying a Test Vehicle..................................................................................................... 64
Operations.................................................................................................................................. 66
Component Information ....................................................................................................... 66
Tests .................................................................................................................................... 67
Chapter 8: Scope Multimeter Operations............................................................................... 71
Remote Scope Multimeter Setup................................................................................................ 71
Getting Started ........................................................................................................................... 72
Capabilities .......................................................................................................................... 73
Leads, Probes and Adapters ............................................................................................... 74
Menu Options, Scope Multimeter......................................................................................... 77
Navigation................................................................................................................................... 78
Screen Layout...................................................................................................................... 78
Making Selections................................................................................................................ 82
Operations.................................................................................................................................. 83
Starting the Scope and Multimeter....................................................................................... 83
Measurement Out of Range................................................................................................. 85
Scope and Multimeter Setup................................................................................................ 85
Chapter 9: SureTrack™ Operations........................................................................................ 99
Using SureTrack in Scanner Mode............................................................................................. 99
Common Replaced Parts Graph........................................................................................ 100
Dashboard Feature Information......................................................................................... 101
ii
Page 7

Contents
Starting SureTrack from the Home Screen .......................................... ... ... .... ... ... ... ... .............. 104
SureTrack Website................................................................................................................... 105
Header Bar......................................................................................................................... 106
Navigation Bar ................................................................................................................... 108
Main Screen.......................................................................................................................110
SureTrack Tips......................................................................................................................... 111
SureTrack Questions................................................................................................................ 111
Closing a Question .. ... ... .... ... ....................................... ... ... ... ... .... ... .................................... 113
Chapter 10: Repair Information Operations......................................................................... 114
Chapter 11: Vehicle History Operations............................................................................... 115
Screen Layout .......................................................................................................................... 115
Vehicle History Main Body................................................................................................. 116
Vehicle History Toolbar...................................................................................................... 116
Chapter 12: Data Manager Operations ................................................................................. 120
Screen Layout .......................................................................................................................... 120
Navigation................................................................................................................................. 121
Operations................................................................................................................................ 121
My Data.............................................................................................................................. 121
Up ...................................................................................................................................... 122
Open .................................................................................................................................. 122
New.................................................................................................................................... 123
Delete................................................................................................................................. 124
Rename ............................................................................................................................. 125
Save...................................................................................................................................125
Properties........................................................................................................................... 126
More...................................................................................................................................126
Saved File Structure................................................................................................................. 127
Chapter 13: Help Operations................................................................................................. 128
Using the Help Toolbar...................................................................... ... ... ... .... ... ... ... ... .... ... ...... . 128
Chapter 14: System Settings Operations............................................................................. 130
Paired Devices .................................................................................. ... ... ... .............................. 130
Pairing the Scan Module.................................................................................................... 131
Shop Information...................................................................................................................... 132
Chapter 15: Maintenance....................................................................................................... 134
Diagnostic Tool.............................. ... ... .... ... ... ... .... ...................................... .... ... ... ... ... .... .......... 134
Cleaning the Touch Screen ............................................................................................... 134
Calibrating the Touch Screen ............................................................................................ 134
Cleaning and Inspecting the Diagnostic Tool..................................................................... 137
Battery Service...................................................................................................................138
Operating System Restore ... ... ... ... .... ... ... ... .... ... ................................................................. 141
Scan Module..................... ... .... ... ....................................... ... ... ... .............................................. 141
Cleaning and Inspecting the Scan Module ........................................................................ 141
Replacing the Protective Handgrip....................................... ... .... ... ... ... .... ... ... ... ... .... ... ... ... . 142
Index........................................................................................................................................ 148
iii
Page 8

Chapter 1 Using This Manual
This manual contains basic operating instructions and is structured in a manner to help you
become familiar with your Diagnostic Tool features and perform basic operations.
The illustrations in this manual are intended as reference only and may not depict actual screen
results, information, functions or standard equipment. Contact your sales representative for
availability of other functions and optional equipment.
1.1 Conventions
1.1.1 Bold Text
Bold emphasis is used in procedures to highlight selectab le items such as buttons an d menu
options.
Example:
• Select Functions.
1.1.2 Symbols
The “greater than” arrow (>) indicates an abbreviated set o f se lection instructions.
Example:
• Select Utilities > T ool Setup > Date.
The above statement abbreviates the following procedure :
1. Select the Utilities icon.
2. Select the Tool Setup submenu.
3. Highlight the Date option from the submenu.
1.1.3 Terminology
The term “select” describes tapping/touching an ico n on the touch screen, or highlighting an icon
or menu choice and then selecting the confirmation menu choice such as Continue, Accept, OK,
Yes, or other similar choice.
Example:
• Select Reset.
The above statement abbreviates the following procedure :
1. Navigate to the Reset icon.
2. Select the Reset icon with your stylus.
1
Page 9

Using This Manual Conventions
NOTE:
IMPORTANT:
IMPORTANT:
1.1.4 Notes and Important Messages
The following messages are used.
Note
A note provides helpful information such as additional explanations, tip s, and comme nt s.
Example:
i For additional information refer to...
Important
Important indicates a situation which, if not avoided, may result in damage to the test equipment
or vehicle.
Example:
Disconnecting the USB cable during vehicle communication can cause damage to the ECM.
1.1.5 Procedures
An arrow icon indicates a procedure.
Example:
z To change screen views:
1. Select View.
The dropdown menu displays.
2. Select an option from the menu.
The screen layout changes to the format you selected.
1.1.6 Hyperlinks
Hyperlinks, or links, that take you to other related articles, procedures, and illustrations are
available in electronic documents. Blue colored text indica tes a se lect able hyp erlink.
Example:
Read all applicable Safety Information before using this tool!
1.1.7 Tool Help
To display help topics for this tool, select a help option from the Help menu.
2
Page 10

Chapter 2 Introduction
The Diagnostic Tool is a specialized personal automotive diagnostic solution that combines
information with test instrumentation to help you diagnose symptoms, codes, an d complaint s
quickly and efficiently. There are three main components to the system:
• Diagnostic Tool—the central processor and monitor for the system
• Scan Module—the device for accessing vehicle data
• Scope Multimeter Module—the device for sampling circuit s and sign als
This manual describes the construction and operation of th ese three devic es and how th ey work
together to deliver diagnostic solutions.
2.1 Features and Specifications
2.1.1 Diagnostic Tool
1— Audio Speaker
2— Battery Status Indicator LED (light emitting diode)
3— Microphone
4— Hard Drive Activity LED
5— Directional Buttons; left (
6— S (Shortcut) Button (special functions)
7— Enter Button
8— Camera (shutter) Button
9— Virtual Keyboard Button
10—Brightness Button
11—Power Button
), right (), up (), down ()
Figure 2-1 Model D10 front view
3
Page 11

Introduction Features and Specifications
/HIW6LGHRI8QLW
1— Hinged Cover
2— USB (universal serial bus) Ports (2)
3— Head Phone Jack
4— Microphone Jack
5— DC Power Supply Input jack
Figure 2-2 Model D10 side view
1— Kensington Lock (standard security device connection, device not included)
2— Battery Compartment Cover
3— Collapsible Stand (closed)
4— Camera Lens
Figure 2-3 Model D10 back view
4
Page 12

Introduction Features and Specifications
Technical Specifications
Processor:
Intel Atom Z530P 1.6GHz
Operating System
Microsoft Windows Embedded Standard SP3
T ouc h Screen
Resistive Touch Panel
Display:
10.2 inch diagonal, LCD TFT
1024 x 600 resolution WSVGA
16 bit color
Battery:
Lithium Ion Smart Battery Pack
Approximate 4 hour run time
Approximate 4 hour charge time (with or without unit operating)
DC Jack Operating Voltage
10V to 32V DC
Communications:
802.11 b/g/n Wireless
Bluetooth 2.0
Dimensions:
Width:
13.23 inches
336.1 mm
Height:
8.07 inches
205 mm
Depth:
2.41 inches
61.3 mm
Weight (including battery pack and Scope Multimeter Module):
5.1 lbs.
2.31 kg
Weight (including battery pack, without Scope Multimeter Module):
4.5 lbs.
2.04 kg
Operating Temperature Range (ambient):
At 0 to 90% relative humidity (non-condensing)
32 to 113°F
0 to 45°C
5
Page 13

Introduction Features and Specifications
Storage Temperature (ambient):
At 0 to 70% relative humidity (non-condensing)
–4 to 140°F
–20 to 60°C
Environmental Conditions:
This product is intended for indoor use only.
This product is rated for Pollution Degree 2 (normal conditions).
Power Supply:
Supply Rating; 19 VDC. 3.42A
Power Sources
Your Diagnostic Tool can receive power from any of the following sources:
• Internal Battery Pack
• AC/DC Power Supply
• Vehicle Power
• Docking Cradle (Optional)
Internal Battery Pack
The Diagnostic Tool can be powered from the internal rechargeable battery. A fully charged
standard battery provides sufficient power for about 4 hours of continuous operation. A LED on the
front of the Diagnostic Tool indicates the battery state of charge.
AC/DC Power Supply
The Diagnostic Tool can be powered from a wall socket using the AC/DC power supply. The AC/
DC power supply also powers the internal battery pack charging process.
Vehicle Power
The Diagnostic Tool can be powered from a standard 12-volt power p ort on the test vehi cle
through a direct cable connection. The vehicle power cable connect s to the DC power supply jack
on the left side of the Diagnostic Tool.
Docking Cradle (Optional)
The Diagnostic Tool can be powered and operated wh en installed on the optional dockin g cradle.
The docking cradle also powers the internal battery pack charging process and allo ws USB
connectivity for attaching peripherals. Contact your sales r epresentative for additional details.
6
Page 14
Introduction Features and Specifications
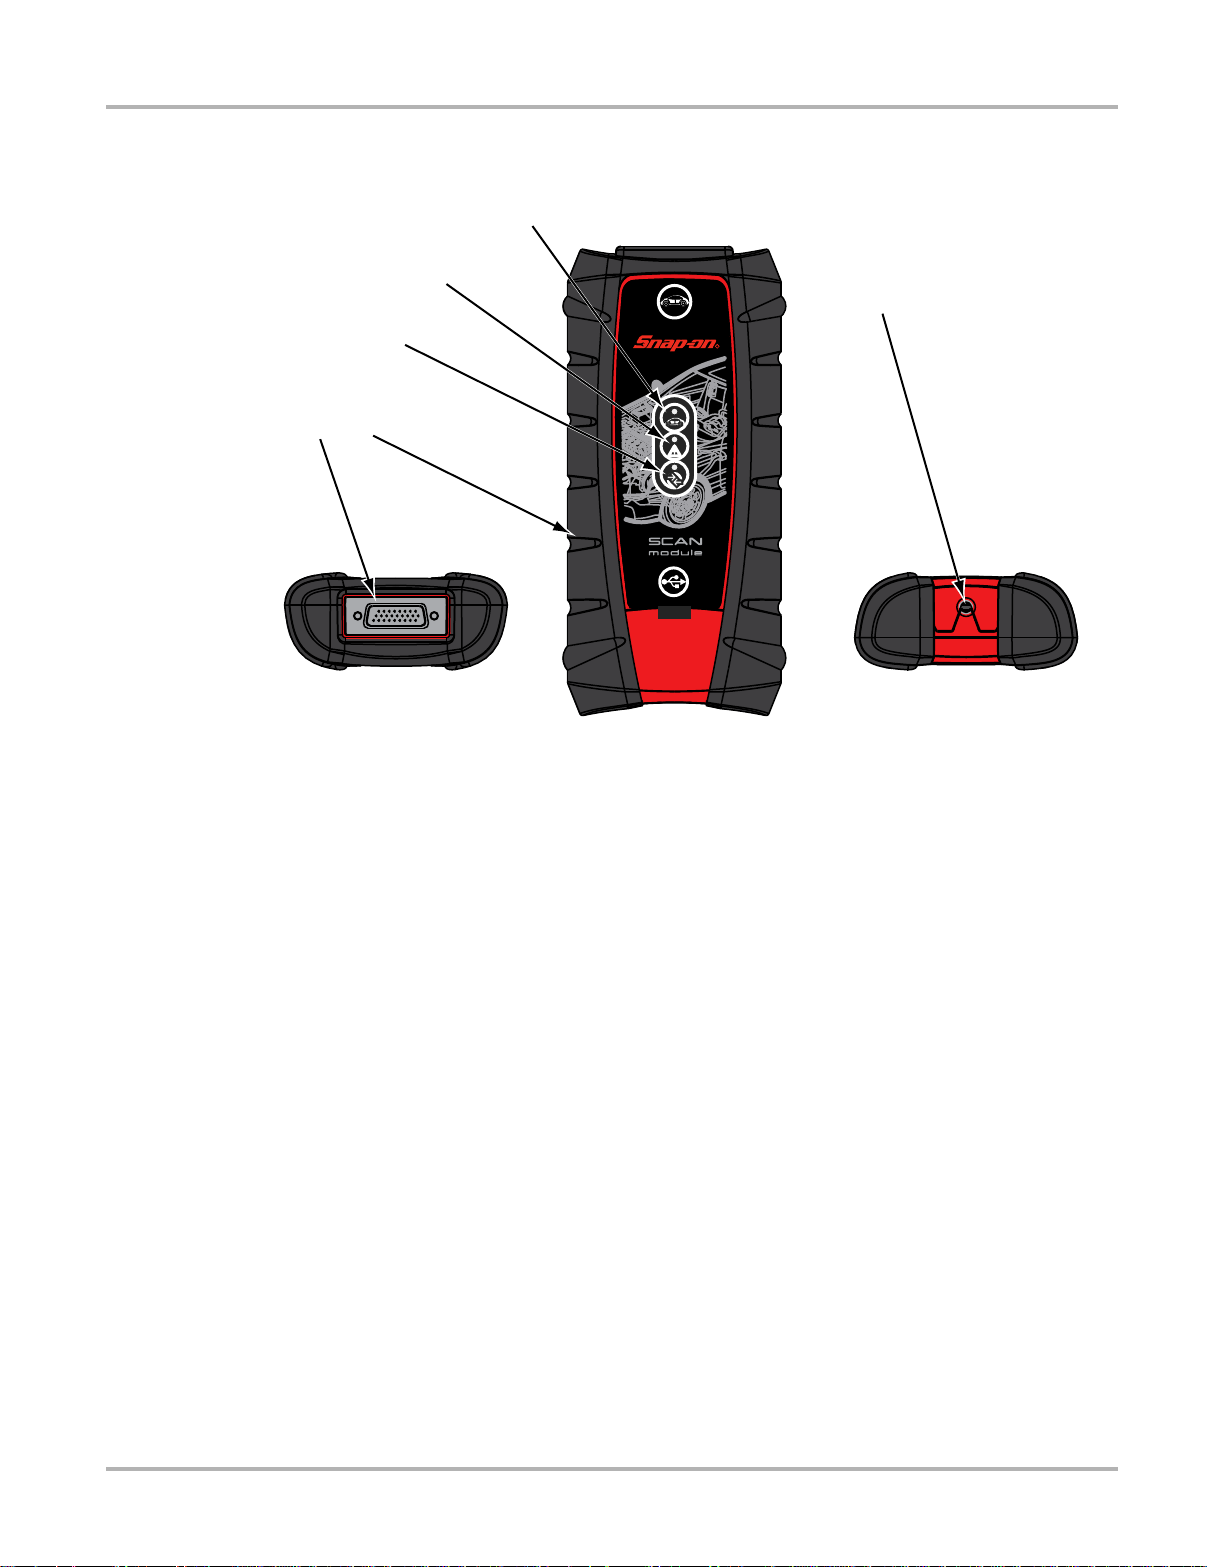
2.1.2 Scan Module
7RS
)URQW
5
($//%
%RWWRP
1— Data cable connector
2— Memory card port (remove protective hand grip for access)
3— Bluetooth LED (green)
4— Communication issue LED (red)
5— Vehicle power LED (green)
6— Universal serial bus (USB) jack (remove protective hand grip f or access )
Figure 2-4 Scan Module
Wireless Communication
The Scan Module is a wireless communications device that transmits vehicle data to the
Diagnostic Tool without a physical connection. A signal lost due to moving out of range
automatically restores itself when the Diagnostic Tool is brought closer to the Scan Module. The
Scanner sounds a tone when the signal is lost.
7
Page 15

Introduction Features and Specifications
Technical Specifications
Dimensions:
Length:
8.04 inches
204.3 mm
Height:
3.82 inches
97 mm
Depth:
1.66 inches
42.1 mm
Weight (including protective hand grip):
0.9 lbs.
0.408 kg
Communications:
Bluetooth 2.0
USB Power:
5V @ 500mA
Data Cable Connector Power:
8V to 32V, Maximum 12 Watts
Operating Temperature Range (ambient):
At 0 to 90% relative humidity (non-condensing)
32 to 113°F
0 to 45°C
Storage Temperature (ambient):
At 0 to 70% relative humidity (non-condensing)
–4 to 140°F
–20 to 60°C
Environmental Conditions:
This product is intended for indoor use only.
This product is rated for Pollution Degree 2 (normal conditions).
Power Sources
The Scan Module operates on 12V or 24V vehicle power , which it r eceives through the data cable
connector. The Diagnostic T ool powers on whenev er it is connected to an OBD-II/EOBD compliant
data link connector (DLC). For non OBD-II/EOBD compliant vehicles, the Diagnostic Tool can be
powered from a suitable power port on the test vehicle using the auxiliary power cable supplied
with your kit.
8
Page 16
Introduction Features and Specifications
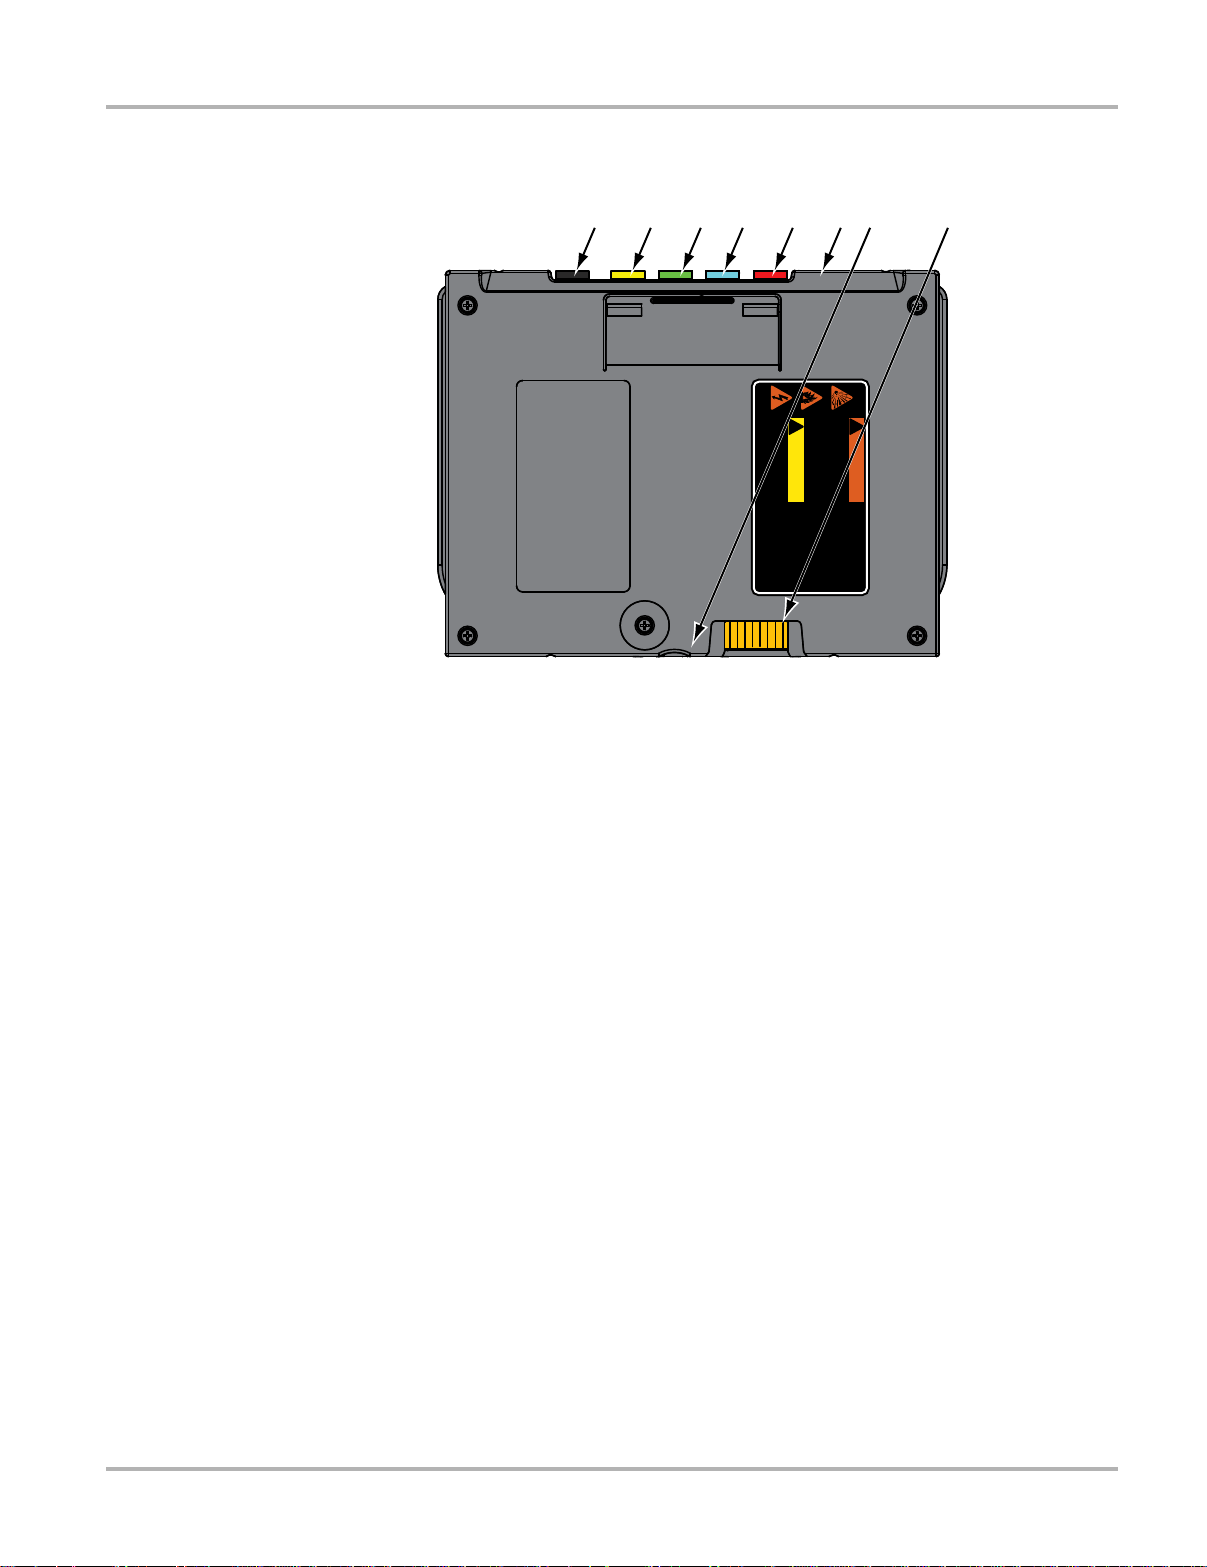
2.1.3 Scope Multimeter Module
5,6.2)(;3/26,21
)/$0$%/()8(/$1'9$3256&$1,*1,7(
7+,6(48,30(17+$6,17(51$/$5&+,1*2563$5.,1*3$576
'2127(;326(72)/$00$%/(9$3256
/2&$7(7+,6(48,30(17$7/($67PP,1&+(6
$%29(7+()/225
5,6.2)(/(&75,&$/6+2&.
'21275(029(&29(525%$&.
1286(56(59,&$%/(3$576,16,'(
5()(56(59,&,1*7248$/,),('6(59,&(3(56211(/
(;3/26,2125)/$0(&$1&$86(,1-85<
(/(&75,&$/6+2&.&$1&$86(,1-85<
&$87,21
:$51,1*
1— Common (Ground) Jack
2— Channel 1 Jack
3— Channel 2 Jack
4— Channel 3 Jack
5— Channel 4 Jack
6— Auxiliary Connector (not visible in illustration)
7— USB Jack (under protective cover)
8— Diagnostic Tool Connection
Figure 2-5 Scope Multimeter Module, removed from Diagnostic T ool
Remote Operation
The Scope Multimeter Module installs into the Diagno stic Tool and is held in place by a lock tab.
Depress the lock tab and the Scope Multimeter Module is e asily removed fr om the Diag nostic
Tool. A USB cable (supplied with your kit) can then be used to co nnect the Scope Multimeter
Module to the Diagnostic Tool. Now, you can co ntinue to remotely monitor circuit activity while
moving the Diagnostic Tool around the vehicle.
9
Page 17

Introduction Features and Specifications
Technical Specifications
Dimensions:
Length:
6.75 inches
171.5 mm
Height:
5.1 inches
129.5 mm
Depth:
0.89 inches
22.6 mm
Weight (including protective hand grip):
0.66 lbs.
0.30 kg
Operating Temperature Range (ambient):
At 0 to 90% relative humidity (non-condensing)
32 to 113°F
0 to 45°C
Storage Temperature (ambient):
At 0 to 70% relative humidity (non-condensing)
–4 to 140°F
–20 to 60°C
Environmental Conditions:
This product is intended for indoor use only.
This product is rated for Pollution Degree 2 (normal conditions).
Power Sources
The Scope Multimeter Module operates on USB power (5V @ 500mA) supplied by the Diagnostic
Tool. Power is provided either through direct connection to the Diagn ostic Tool, or through a USB
cable when the Scope Multimeter Module is separated from the Diagnostic Tool.
10
Page 18

Chapter 3 Getting Started
Make sure the Diagnostic Tool has a charged battery or is connected to an AC/DC power supply
(see Power Sources on page 8). It is highly recommended to back up personal and saved data to
a USB mass storage device on a regular basis to prevent loss in the event of system corruption or
hard disk drive failure.
3.1 Turning On
Press the Diagnostic Tool Power button to switch the Diagnostic Tool on. The system boots up,
then opens the Home screen (Figure 3-1).
1. Function Icons
2. Toolbar
3. Windows Toolbar
Figure 3-1 Sample Home screen
3.1.1 Function Icons
The Function Icons configure the Diagnostic Tool for the type of test to be performed. Table 3-1 on
page 12 gives brief descriptions of the available icons, which operations are available depend s
upon the individual configuration of your system. Use the stylus or your finger tip to select from the
icons.
11
Page 19
Getting Started T urning On
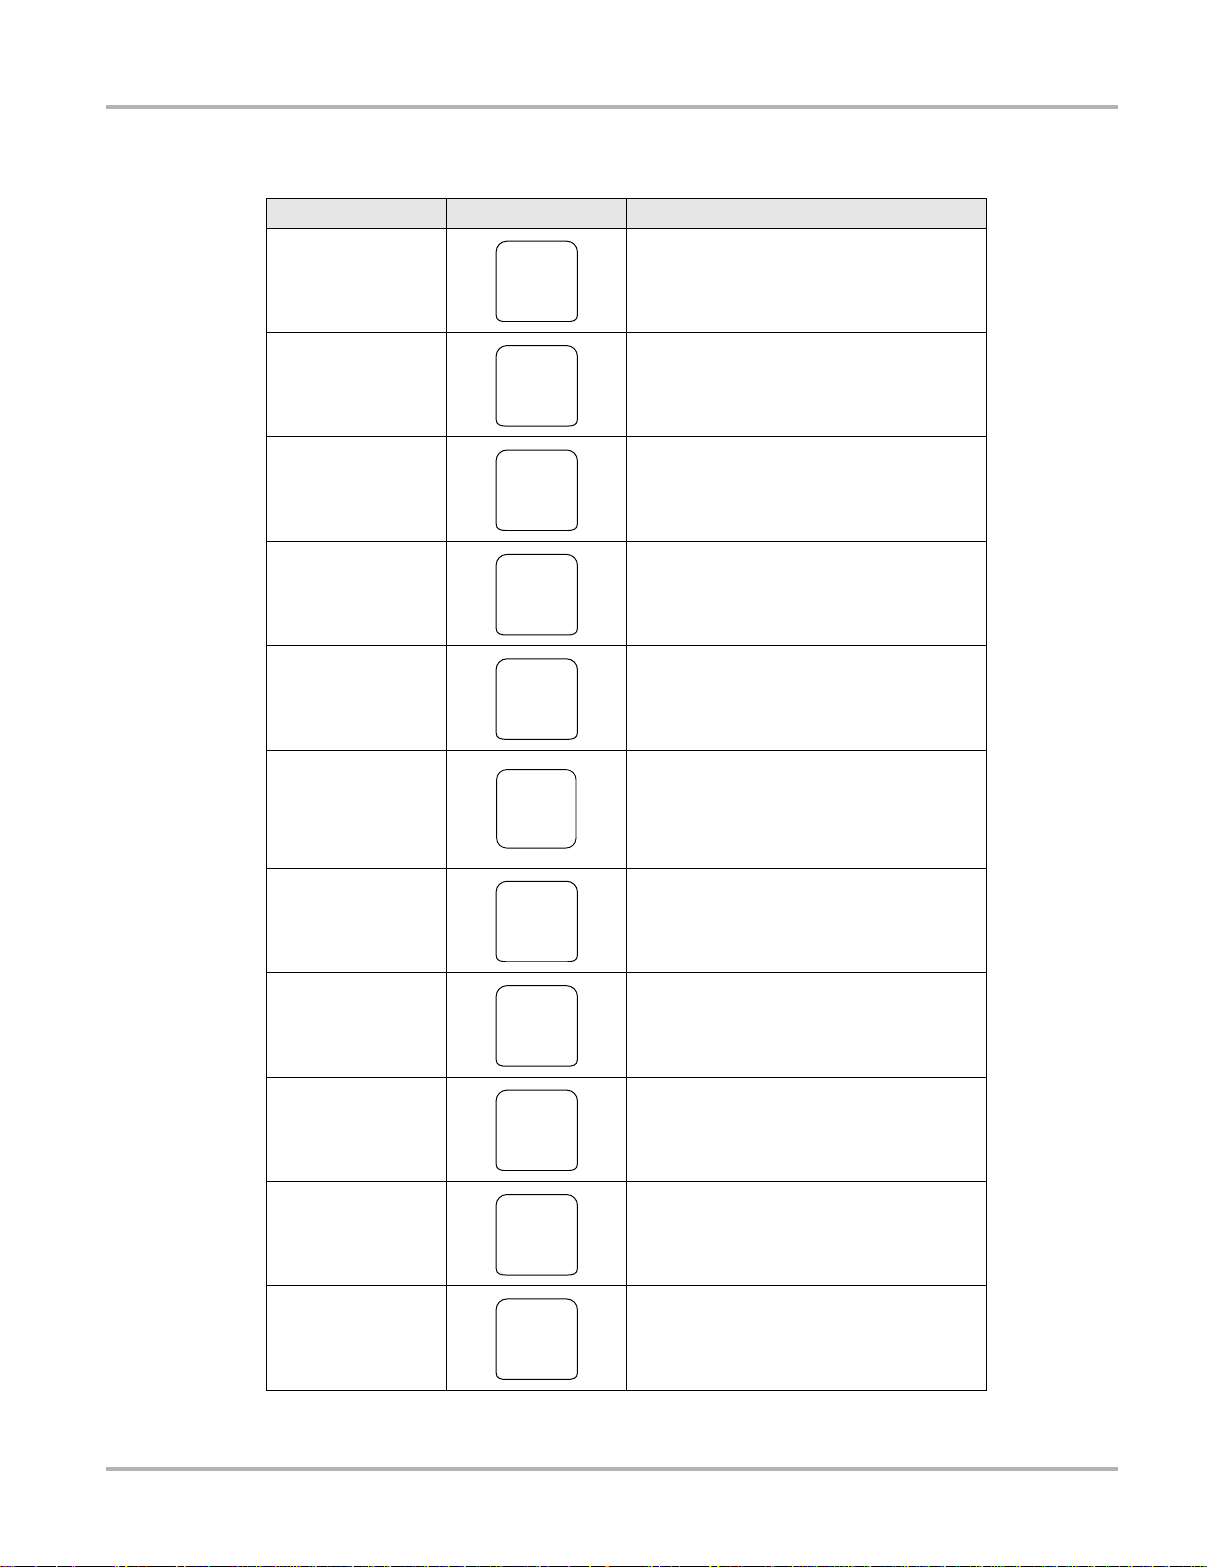
Table 3-1
Name Icon Description
Configures the Diagnostic Tool to operate
Scanner
as a scan tool. See Scanner Operations on
page 18.
Allows you to perform generic OBD-II or
OBD Direct
EOBD system tests without identifying the
specific vehicle. See OBD Direct
Operations on page 52.
Guided Component
Test
Scope Multimeter
SureTrack
Repair Information
Vehicle History
Data Manager
Opens a diagnostic database of specific
tests for the identified vehicle. See Guided
Component Test Operations on page 60.
Configures the Diagnostic Tool to operate
as a lab scope, graphing multimeter, or
digital multimeter. See Scope Multimeter
Operations on page 71.
Opens the SureTrack website. See
SureTrack™ Operations on page 99.
Provides the information needed to make
repairs once you have made your
diagnosis. The linked program varies by
region. See Repair Information Operations
on page 114.
Identifies the test vehicle and organizes and
manages work in progress and service
records. See Vehicle History Operations on
page 115.
Opens the organization system for saved
data files. See Data Manager Operations on
page 120.
Help
System Settings
Exit
Opens the on-line help for the system. See
Help Operations on page 128.
Establishes and manages connections to
peripheral devices, such as the Scan
Module. See System Settings Operations
on page 130.
Closes the Diagnostic Tool software and
returns the display to the Windows desktop.
See Turning Off on page 14.
12
Page 20

Getting Started T urning On
3.1.2 Toolbar
Operation of the icons located on the toolbar are described in the t able belo w:
Table 3-2
Name Icon Description
Home
Windows Toolbar
Menu
Change Vehicle
View Record
Hardware Status
Menu Options
Selecting this icon returns you to the Home
screen from any test.
Selecting this icon opens and closes the
standard Windows toolbars at the top and
bottom of the screen.
Selecting this icon opens a menu that
provides information and basic operations
and features for the current screen.
The currently identified vehicle is shown to
the right of the icons, selecting allows you to
change the identified test vehicle.
Selecting the icon opens an editable
worksheet of vehicle records.
Indicates the connectivity status of the Scan
Module.
Indicates the connectivity status of the
Scope Multimeter.
The Menu icon on the Toolbar at the base of the display screen opens a list of basic operations
and features. The list of options varies depending upon which module, or to ol function, is active.
Selecting a menu item opens a submenu of choices, and some submenus also open a n additional
menu. A right arrowhead (
) indicates additional choices are available. Touch an item to select
it. The following Menu options are available from the Home Screen:
• Safety Information—opens the Important Safety Instructions document.
• Help—allows you to view supporting documentation, selectin g open s a su bmenu.
Safety Information is available for all of the modules, and Help, as explained below , displays in the
SureTrack, V ehicle History, Data Manager, Help, and System Settings modules. Additional m enu
options are available for the Scanner, OBD Direct, Guided Component Test, and Scope
Multimeter modules. These additional menu options are detailed in their respective module
chapters.
Safety Information
Selecting Safety Information opens an electronic version of the printed Important Safety
Instructions that were included with your Diagnostic Tool kit. The Important Safety Instructions
document should be read and understood p rior to using the Diagno stic Tool.
13
Page 21

Getting Started Turning Off
Help
A variety of utilities and additional resources are available through the Help menu. Basic menu
options, which are available for all modules, include:
• User Manual
• Vers ion Info
• Activation Status
User Manual
This option opens this document, which provides overall navigation and operation infor mation for
the Diagnostic T ool.
Version Info
This option opens a window showing the version of the software and a co py of the Sof t ware
License Agreement. Select OK to close the window.
Activation Status
This option opens a dialog box with version and licensing details for the system, and activation
status for the Diagnostic Tool and all other modules.
3.1.3 Windows Toolbar
This is the standard Windows toolbar . Your Diagnostic T ool is a fully functional personal computer
based on the Windows Embedded S t andard operatin g system. Refer to Mi crosoft documentati on
for additional information.
3.2 Turning Off
All vehicle communication must be terminated before shutting down the Diagnostic Tool. A
warning message displays if you attempt to shut down while the Scan Module is communicating
with a vehicle. Forcing a shut down while communicating ma y lead to ECM problems on som e
vehicles. Exit the Scan Module before turning off.
z To turn off the Diagnostic Tool:
1. Navigate to the Home screen.
2. Select the Exit icon.
3. From the Windows desktop, open the Windows Start menu.
4. Select Turn Off Computer.
5. Select Turn Off in the dialog box.
The open programs close and the power turns of f.
3.2.1 Emergency Shutdown
In case of emergency, press and hold the Power button for 5 seconds to force a shutdown.
14
Page 22
Chapter 4 Navigation
This chapter discusses how to use the hardware controls and features for th e Diagnostic Tool.
There are no external controls on the Scan Module or Scope Multimeter Module . They can only be
operated when used in conjunction with the Diagnostic Tool.
4.1 Controls
The external controls on the Diagnostic Tool are simple because most operations are controlled
through the touch screen. Touch screen navigation is menu driven, which allows you to quickly
locate the test, procedure, or data tha t you need throu gh a series of ch oices and qu estions.
Detailed descriptions of the menu structures are found in the chapters for the various modules.
The following sections describe the external controls and fe atures of the Diagnostic Tool.
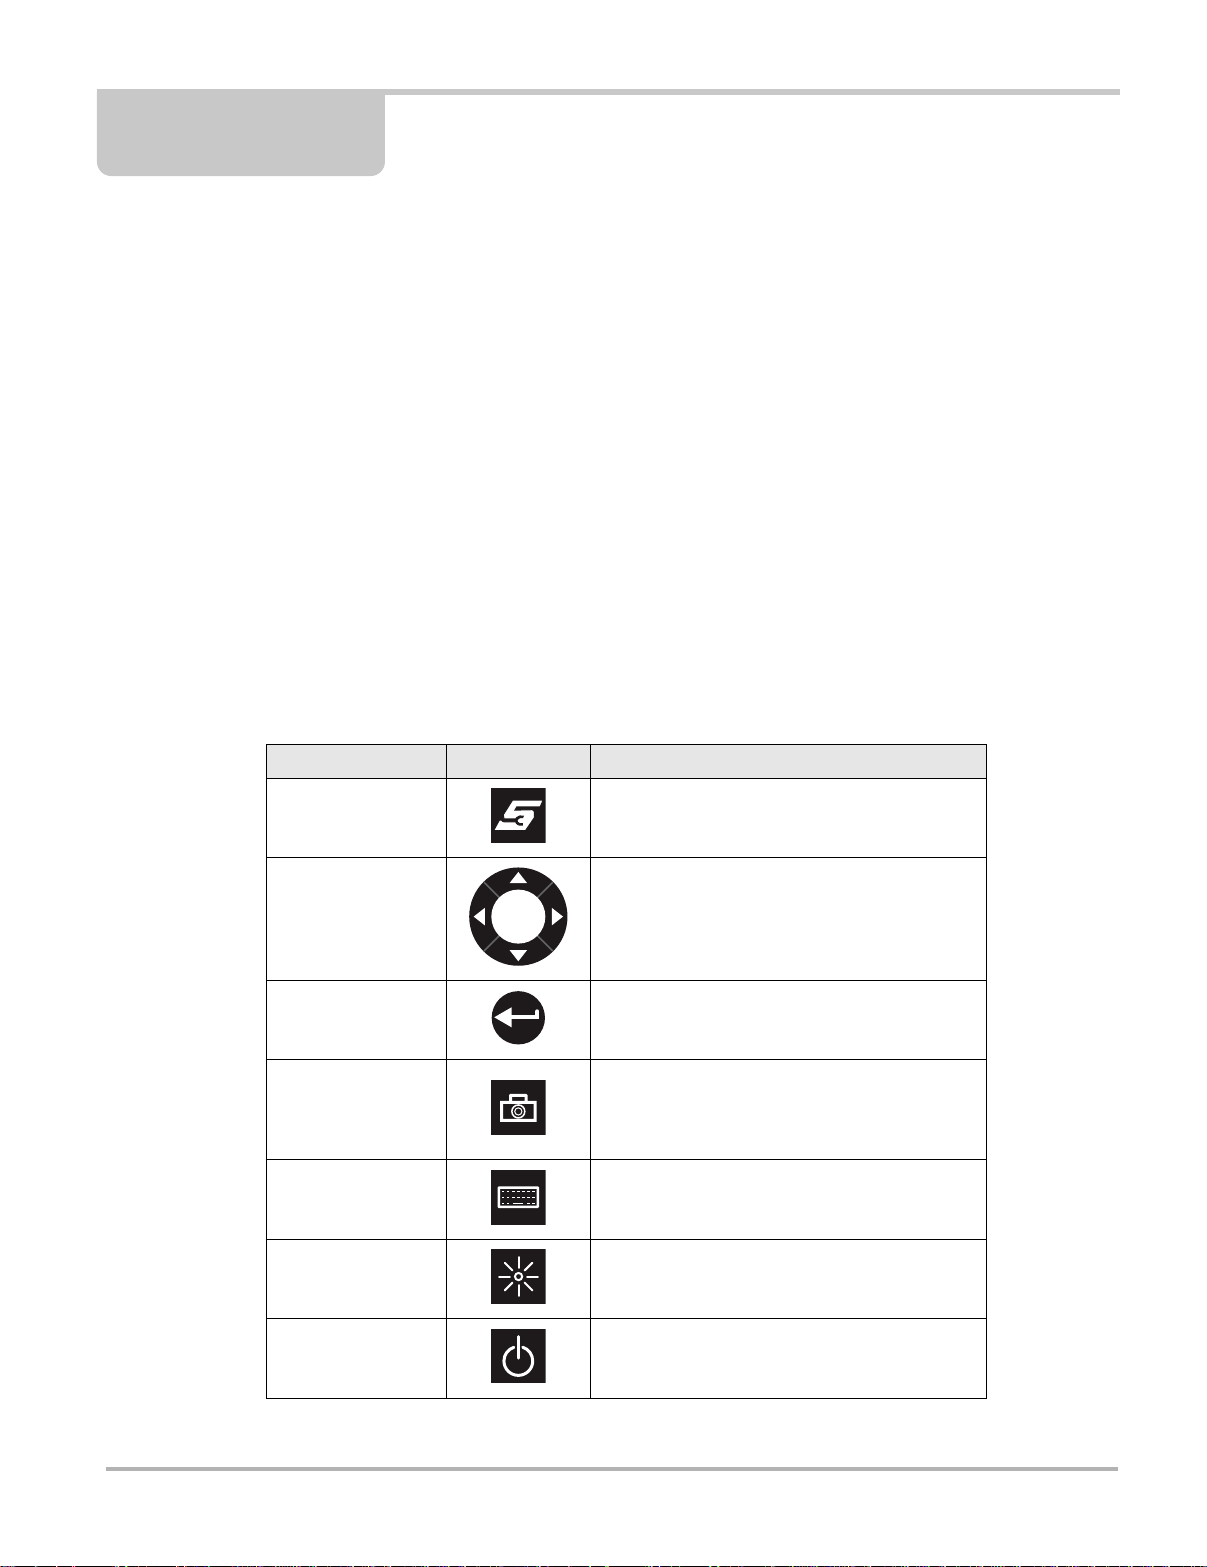
4.1.1 Control Buttons
Name and location of control buttons:
Table 4-1 Diagnostic Tool control buttons
Name Button Description
S (Shortcut) Button
Directional Buttons
Enter Button
Camera Button
Keyboard Button O pens or closes the virtual keyboard.
Brightness Button
Power Button Turns the Diagnostic Tool on and off.
A function button that provides a shortcut for
capturing a screen image.
Moves the cursor or highlight on the display
screen up, down, right, or left.
Selects a highlighted item or returns the display
to the previous screen.
Operates the built-in camera. Press once to
open the application. The button then acts as a
shutter to take a photograph of what is visible
on the screen.
Increases the screen backlighting in seven
incremental steps, then returns to the lowest
setting and repeats.
All other tool operations are controlled through the touch screen.
15
Page 23

Navigation Camera Operation
4.1.2 LEDs
There are two light-emitting diodes (LEDs) on the front face of the Diagnostic T ool (see Figure 2-1
on page 3 for locations):
• Battery Status Indicator LED—this Diagnostic Tool uses three colors to show the battery and
power status as follows:
– Green indicates either a battery with a full or nearly full charge, or the Diagnostic Tool is
being powered by the AC/DC Power Supply.
– Orange indicates a battery that is charging. An orange LED that fades on and of f at three
second intervals indicates the Diagnostic Tool is in Standby mode.
– Red indicates a low battery (15% of capacity or less).
• Hard Drive Activity LED—illuminates when the central processing unit (CPU) is reading or
writing to the hard disk drive (HDD).
4.1.3 The St and
The built-in stand extends from the back of the Diag nostic Tool to allow hands-free viewing. The
stand clips into the Diagnostic Tool for storage and pivots out so the display is at a 45 degree angle
when in use.
4.2 Camera Operation
A single press of the Camera button on the front of the Diagnostic T ool activates the camera. With
the camera active, the touch screen becomes the view finder and is also used for reviewing
photographs that are taken. Icons on the touch screen a re used to operate the camera. The icons
change depending on what camera function is active:
Table 4-2 Camera icons (part 1 of 2)
Name Icon Description
Photo
Gallery
Exit
OK
Acts as a shutter to take a photograph of what is
visible in the view finder, which is the left-hand
portion of the screen.
Opens a thumbnail gallery of recently taken
pictures.
Closes the camera application and returns to
the previous screen.
Displays after a picture is taken. Selecting
saves the photograph and returns to the view
finder.
Delete
Displays after a picture is take n an d in Gall ery
mode. Selecting discards the photograph and
returns to the previous screen.
16
Page 24

Navigation Camera Operation
Table 4-2 Camera icons (part 2 of 2)
Name Icon Description
Back
Previous
Next
Displays in Gallery mode. Selecting returns to
the previously viewed screen.
Displays in Gallery mode. Selecting opens the
picture prior to the current image in the gallery.
Displays in Gallery mode. Selecting opens the
picture after the current image in the gallery.
z To use the camera:
1. Press the Camera button.
The camera screen opens and the Camera button now controls the shutter.
2. Focus the image to be captured in the view finder.
3. Press the Camera button, or select the Photo icon.
The view finder now shows the captured picture.
4. Select OK to save the image, or Delete to delete it.
The view finder is live and the Camera button is the shutter, repeat steps 2, 3, and 4 to take
additional pictures.
5. Select Exit from the live view to close the camera application.
Photographs are stored on the hard drive and can be retrie ved two ways:
1. From the Diagnostic Suite; select Dat a Ma nager from the Home scr een, then open the
Camera Folder.
2. From the desktop; select My Documents > ShopStream > Camera Folder.
17
Page 25

Chapter 5 Scanner Operations
The Scanner allows you to establish a dat a lin k to the electronic contr ol systems of the vehicle
being serviced to retrieve diagnostic trouble codes (DTCs), view live data parameters, and
perform tests. The Scanner can access the electro nic control module (ECM) for var ious veh icle
control systems such as engine, transmission, antilock brake system (ABS) and more.
5.1 Getting St arted
Before initial use the Scan Module must be paired with the Diagnostic Tool to establish a wireless
communication link. Refer to Pairing the Scan Module on page 131 for details. Both the Scan
Module and the Diagnostic Tool must be powered on.
5.1.1 The Demonstration Program
The Scanner demonstration program allows you to become familiar with many of the test
capabilities without connecting to a vehicle. Sample data and mock test results help you learn the
menus and basic operations of the Scan Module.
z To start the demonstration program:
1. From the Home screen, select the Scanner icon to op en th e manufa cturer men u.
The manufacturer menu includes all makes for which Scanner information is available. There
is also a Demonstration icon included in the list.
Figure 5-1 Sample demonstration selection
18
Page 26

Scanner Operations Getting Started
IMPORTANT:
2. Select the Demonstration icon.
A menu of demonstration choices now displays:
– US Domestic—contains actual data captured while driving a 2001 Chevrolet Tahoe. Look
for the throttle position (TP) sensor dropout while analyzing the data in Graphing mode.
– OBD Training Mode—provides simulated data for an OBD-II/EOBD vehicle that allows
you to access any of the standard functions.
3. Select either option and a confirmation messa ge disp lays.
4. Select OK to load the selected database.
5. Follow the on-screen instructions and select as needed until the Systems menu displays.
6. Select from any of the systems listed, then select from the submenus.
Do not connect a vehicle to the Scan Module while in the Demonstration mode.
5.1.2 Disconnecting the Diagnostic Tool From a Vehicle
When disconnecting the Diagnostic Tool from the vehicle, make sure the Scanner sof tware is not
communicating with the vehicle.
z To exit Scanner and disconnect from a vehicle:
1. From a codes or data display screen, select the Exit icon o n the upper toolba r.
Figure 5-2 Sample upper toolbar Exit icon
The screen goes to the codes or data menu.
2. Select the Back icon on the upper toolbar.
Figure 5-3 Sample upper toolbar Back icon
The screen goes to the system menu.
3. Select the Back icon on the upper toolbar.
A “stopping communication” message briefly displays followed by the systems menu.
4. Select the Change Vehicle icon on the Toolbar.
Figure 5-4 Sample Toolbar Change Vehicle icon
The vehicle description on the toolbar should now read “No Active Vehicle”.
19
Page 27
Scanner Operations Getting Started
NOTE:
5. Select the Home icon on the To olbar.
Figure 5-5 Sample Toolbar Home icon
The Home screen displays.
6. Disconnect the test adapter from the vehicle connector.
i Damage to the electronic control module (ECM) of the vehicle can occur if communica tion is
disrupted. Ensure that the vehicle communication cable is pr operly connected a t all times during
testing. Exit all active tests before removing the test cable or turning of f.
5.1.3 Menu Options, Scanner
The Toolbar Menu icon at the base of the screen opens a menu ne ar the top o f th e display.
Figure 5-6 Sample Scanner Menu icon options
The following Menu options are available:
• Safety Information—opens the Important Safety Instructions document.
• File—allows you to print or save the data being viewed.
• Tools—allows you to perform cert a in mainten ance operations and adjust tool settings.
• Help—allows you to view supporting documentation.
20
Page 28

Scanner Operations Getting Started
File
Use to print or save a copy of the data currently being viewed. Menu optio ns include:
• Save—opens a submenu with these options:
– Screenshot—saves a graphic image of the current screen.
– Collected Data—saves a recording of all the data currently in the buf fer plus the number
of frames designated after the trigger event (see Properties on page 44).
• Print—opens a submenu with these options:
– Screen—sends the current screen image to a printer.
– Troubleshooter—prints the full text of the troubleshooter topic shown in the main body.
Selecting an option opens a Windows Print dialog box for p rinting or saving the file.
Tools
This option allows you to adjust tool settings to your personal preferences. Selecting Tools opens
a menu with two options:
• Units Setup
• Display BEN
Units Setup
The units of measurement can be changed for temper ature, vehicle speed, air pressure and other
pressure readings. Choose between US customary or metric units of measure.
z To change the units setup:
1. Select Tools > Units Setup.
The Measurement Units Setup dialog box opens.
Figure 5-7 Sample Units Setup screen
2. Use the dropdown menus to select the desired value for each item.
3. Select Accept to close the dialog box and apply the changes.
21
Page 29

Scanner Operations Getting Started
Display BEN
Selecting opens a screen with the Balco Engine Number (BEN) of the currently identified vehicle.
The BEN is used internally for data coordination, and you may be as ked to provide to a Customer
Care representative for troubleshooting communication problems.
Help
A variety of utilities and additional resources are available through the Help menu:
• User Manual
• Vers ion Info
• Activation Status
• User’s Manuals
• About Scanner Hardware Version
• About Scanner
The User Manual, V ersion Info , and Activati on Status options are the same as explained
previously, see Menu Options on page 13 for details. Other options are explained below.
User’s Manuals
This option opens a menu of additional support document a tion, such as vehicle communication
software manuals, available to assist in your diagnosis. These manuals provide connection
information, detailed test procedures, and other resou rce material for specific veh icles.
Figure 5-8 Sample User’s Manuals menu
Select Exit to close the Help module and return to the Scanner.
22
Page 30

Scanner Operations Vehicle Identification
About Scanner Hardware Version
This option opens a dialog box showing the hardwa re version and other details abou t the Scanner
module. A Copy to Clipboard icon allows you to paste the infor mation to a document or e-ma il.
About Scanner
This option opens a dialog box that shows the sof tware version and other Scanner module de tails.
A Copy to Clipboard icon allows you to paste the information to a do cument or e-mail.
5.2 Vehicle Identification
The Scanner information presented is provided by a direct lin k to the ECM of th e test vehicle.
Therefore, certain attributes of th e test vehicle must be entered into the Diagnostic Tool so that the
data displays correctly. Vehicle identification information is carrie d over if you enter the Scan
Module either from the Guided Component Test module or from one of the records stored in the
Vehicle History mod ule. Howeve r, in some instances you may need to enter additional attributes.
The vehicle identification sequence is menu driven, simply follow the screen prompts and make a
series of choices. Each selection advances to the next screen. A Back icon in the upper left corner
of the screen returns to the previous screen. Procedure s vary by vehicle.
z To identify a vehicle for Scanner testing:
1. Select the Scanner Function icon from the Home screen.
A list of manufacturers displays (Figure 5-9).
Figure 5-9 Sample manufacturer list
2. Select the manufacturer of the test vehicle from the list.
A model year menu displays.
23
Page 31

Scanner Operations Vehicle Identification
NOTE:
i You can limit th e number o f manufacture rs that appear o n the list by selecting Configure
Favorites from the toolbar. See Creating a Favorites List on page 63 for details.
3. Select the year of the test vehicle from the menu.
A list of vehicle types or models displays. Several selections may be required to identify the
vehicle type and model, follow the screen prompts and enter the req uired information .
A confirmation page showing the identified vehicle displays once all th e require d dat a has
been entered. Review the information to make sure it is cor rect.
4. Select OK and a list of systems available for testing on the vehicle displays (Figure 5-10).
Figure 5-10 Sample available tests list
5. Select a test to continue.
The identification sequence is now complete. For additional information refer to Navigation on
page 26 for details on how to navigate thro ugh th e Scanner da t a an d Operations on page 29 for
information on how to perform test s.
5.2.1 Alternative Vehicle Identification
Occasionally , you m ay identify a test vehicle th at the Scan ner does not r ecognize, the d at abase
does not support, or has some unique characterist ics that prevent it from co mmunicating with the
Scanner through the normal channels. In these instances, ther e is an alternate choice that al lows
you to establish communication with the vehicle:
• OBDII/EOBD—allows you to perform generic OBD-II or EOBD tests, see OBD Direct
Operations on page 52 for additional information.
24
Page 32

Scanner Operations Connecting to a Vehicle
5.3 Connecting to a Vehicle
5.3.1 Data Cable Connection
Connection of the data cable to the Diagn ostic T ool and vehicle DLC is required for Scan ner and
OBD-II/EOBD testing.
Depending on the vehicle, the supplied DA-4 data cable may be used alo ne or may req uire
optional adapters.
• All OBD-II/EOBD compliant vehicles - Use the supplied DA-4 data cable. The 26-pin end of
the cable attaches to the data cable co nnecto r o n the top of the Diagno stic Tool. The16-pin
end connects to the vehicle DLC. The cable connecto rs are secured with captive screws.
• All non-OBD-II/EOBD (OBD-I) compliant vehicles - Use the supplied DA-4 data cable with
the optional DA-5 adapter and a manufacturer specific adapter. The 26-pin end of the cable
attaches to the data ca ble conne ctor on th e top of the Diagnostic Tool. The16-pin end
connects to the DA-5 adapter , the DA-5 adapter connects to the manufacturer specific adapter
and then connects to the vehicle DLC. The cable connectors are secured with captive screws.
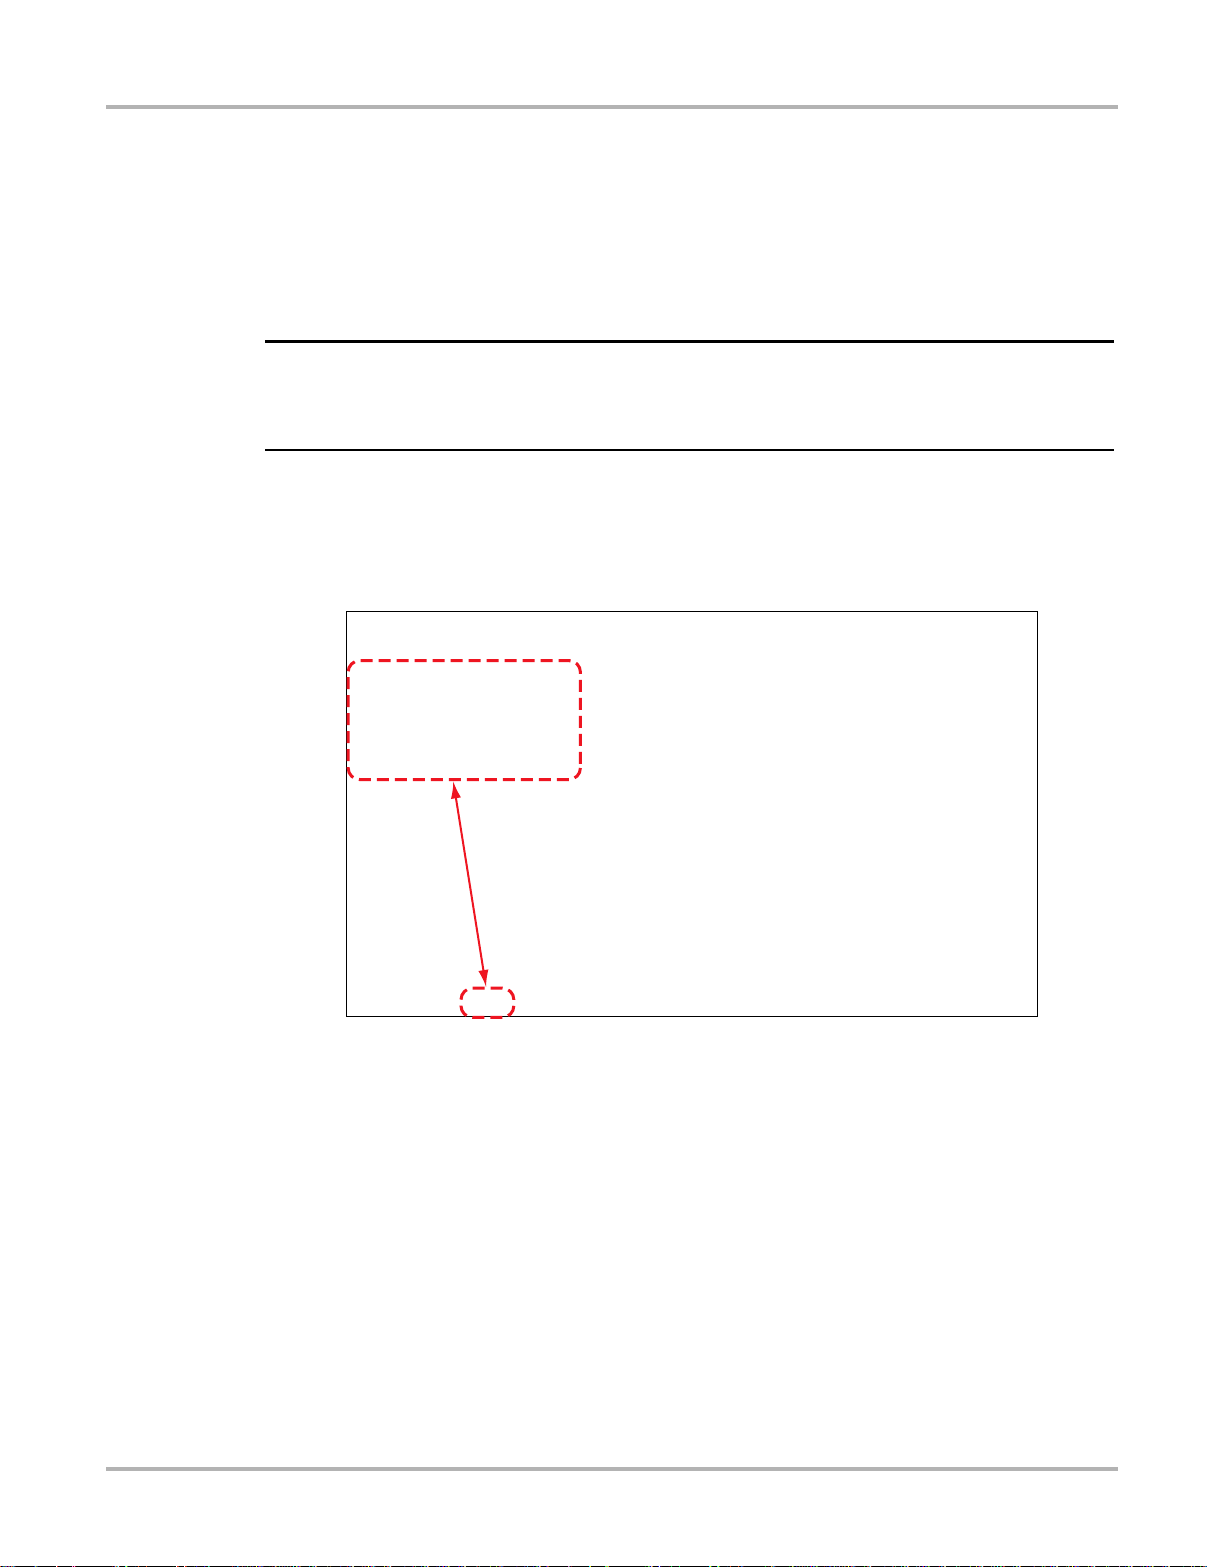
On-screen cable and adapter connection instructions are pr ovided while using the Scann er and
OBD-II/EOBD functions. The instructions may also include the location of the vehicle DLC
(Figure 5-11). If required, additional connection information can be found in the appropriate
vehicle communication software manual for the v ehicle. Vehicle communication sof tware manuals
are available online, see the website information at the front of this manual
Figure 5-11 Vehicle connection data cable message
For data cable vehicle power connection information, see Vehicle Power on page 6.
25
Page 33

Scanner Operations Navigation
z To connect the data cable to the vehicle:
1. Follow the on-screen instructions for connecting to the vehicle (Figure 5-11).
2. Select Continue once the data cable is connected.
The Diagnostic Tool establishes communication then displays a list of available tests. If the
Diagnostic T ool is unable to establish a communications link, a “no communications” message
displays.
3. Select from the available tests to open a submenu of test options.
5.3.2 No Communication Message
If the Scanner is unable to establish a communication link, a “n o communicatio n” message
displays. A “no communication” message means the Scan Module and the veh icle ele ctronic
control module cannot communicate with each other for some reason.
The following conditions cause a “no communication” message to display:
• The Scanner is unable to establish a communication link with the vehi cle.
• You selected a system for testing that the vehicle is not equipped with (such as ABS).
• There is a loose connection.
• There is a blown vehicle fuse.
• There is a wiring fault on the vehicle, or in the data cable or adapter.
• There is a circuit fault in the data cable, Personality Key, or adapter.
• Incorrect vehicle identification was entered.
Refer to the Vehicle Com municati on Sof tware m anuals for m anufa cturer-specific p roblems.
5.4 Navigation
This section describes how to navigate the Scanner interface and select scann er tests.
5.4.1 Scanner Screen Layout
The Scanner screens typically include three sections (Figure 5-12):
1— Scanner Toolbar
2— Main Body
3— Data Buffer Toolbar
Figure 5-12 Scanner screen layout
26
Page 34

Scanner Operations Navigation
Scanner T oolbar
The Scanner toolbar contains a number of icons that allow you to configure the displayed dat a and
to exit. The table below provides a brief explanation of the Scanner toolb ar ico n oper ation s:
Table 5-1 Scanner toolbar icons
Name Icon Description
Exit
Back
Custom
Alarms
Properties
Graph View
Save
Closes the current test and returns you
to the menu.
When available, returns to the
previously viewed screen.
Allows you to select which parameters
are displayed on the screen.
Allows you to set an alarm on certain
data parameters when the signal goes
above or below the alarm setting.
Allows you to adjust the display
characteristics for all of the data
screens.
Allows you to simultaneously view up
to 16 data graphs at a time.
Saves a copy of the current frame of
data that can be viewed on the tool or
in ShopStream Connect.
Opens a standard Windows Print
Print
More
Scale
Sweep
dialog box for saving a print copy of the
current frame of data.
Opens a dropdown menu of the
additional options shown below.
Switches the scale values, displayed
along the left-hand side of the graphs,
on and off.
Switches the sweep values, displayed
at the base of the graphs, on and off.
Main Body
The main body of the screen varies depending on the st age of operation. The main body can show
vehicle identification selections, the main menu, test data, instructions, troubleshooting
information, controls, and other diagnostic information.
27
Page 35

Scanner Operations Navigation
Data Buffer Toolbar
Whenever communication is established with a vehicle, the Scanner con tinuousl y records da t a
transmitted by the ECM in the data buffer. The toolbar below the main body of the screen contains
the icons for navigating the buffered data (Table 5-2).
Table 5-2 Data buffer toolbar icons
Name Icon Description
Snapshot Arms the software to take a snapshot of vehicle data
Go To Start Moves to the first frame in the data buffer
Pause
Play
Go To End Moves to the last frame in the data buffer
Clear Erases data in the data buffer
Step Back Moves to the previous frame in the data buffer
Frame Counter Indicates the data buffer frame currently displayed
Step Forward Moves to the next frame in the data buffer
Suspends data capture and changes to show the
Play icon
Starts or resumes dat a capture and changes to show
the Pause icon
Zoom In
Zoom Out
Increases the magnification by decreasing the sweep
of the graph
Decreases the magnification by increasing the
sweep of the graph
Use the slider in the middle of the toolbar to quickly move throug h p aused da t a.
Figure 5-13 Sample data buffer slider
28
Page 36

Scanner Operations Operations
5.4.2 Screen Messages
Screen messages appear when additional input is n eeded before pro ceeding. Th ere ar e three
types of on-screen messages; confirmations, warnings, and errors.
Confirmation Messages
Confirmation messages inform you when you are about to perform an a ction that can not be
reversed or when an action has been initiated and your conf irmatio n is needed to con tinue.
When a user-response is not required to continue, the message displays br iefly before
automatically disappearing.
Warning Messages
Warning messages inform you wh en co mpleting the selected action may result in an irreversible
change or loss of data.
Error Messages
Error messages inform you when a system or procedural error has occurred. Examples of
possible errors include a disconnected cable or a peripheral, such as a printe r, is powered off.
5.4.3 Making Selections
The Scanner software is a menu driven pro gram that present s a ser ies of choi ces one at a time.
As you select from a menu, the next menu in the series displays. Each selection narrows the focus
and leads to the desired test. Use your fingertip or the stylus to make menu selections.
5.5 Operations
The Scanner allows you to establish a dat a lin k to the electronic contr ol systems of the vehicle
being serviced in order to view live data para meters and perform tests. You can use selected
functional tests, get troubleshooting tips, and access vehicle-specific trouble codes for various
vehicle control systems such as engine, transmission, antilock brake system (ABS) and more.
The Scanner has two main functions:
1. Scanner—provides access to Vehicle Communication Software functions such as reading
codes, viewing data, and performing functional tests.
2. Fast-Track Troubleshooter—provides the diagnostic power of Fast-Track Troubleshooter, a
database of experience based information developed by master technicians.
29
Page 37

Scanner Operations Operations
After a system is selected and the Scanner est ablishes com munication with the ve hicle, a
Scanner Main menu, which lists available tests, displays.
Figure 5-14 Sample Scanner Main menu
Main menu options vary slightly by year, make, and model. The main menu may include:
• Data Display— displays data parameter in formation fr om the vehicle electronic co ntrol
module. Selecting may open a submenu of viewing options.
• Codes Menu—displays diagnostic trouble code (DTC) records from the vehicle electronic
control module. Selecting may open a submenu of viewing options.
• Clear Codes—erases DTC records and other data from the ECM. This selection is found on
a Codes submenu for some models.
• Functional Tests—provides specific subsystem and Guided Component Tests. The tests
vary depending on the manufacturer and model.
• Actuator T ests—similar to functional tests, checks the operation of certain actuators, such as
solenoid valves and relays.
• Memory Resets—allows you to reprogram adaptive values fo r cert ain compone nt s af ter
making repairs. Selecting opens a subme nu. These options are found on the Functio nal Tests
Menu for some models.
• System Tests—provides specific subsystem testing. Performing these tests is similar to
functional tests.
• Generic Functions—lets you access certain availa ble Gen eric OBD II functions from a
proprietary menu (1996 and ne wer veh icles only).
• Troubleshooter—provides step-by-step procedures, integrating parameter data an d
retrieving trouble codes when appropriate, for specific symptoms of the identified vehicle.
z To perform a Scanner test
1. Open Scanner—Select Scanner on the Home screen.
2. Identify the vehicle—Identify the test vehicle by selecting from the me nu options.
3. Select the system—Select the system to be tested from the systems menu.
4. Connect the data cable to the ve hicle—Follow the on-screen con nection instruction s to
connect the Scan Module to the test vehicle.
5. Select a test from the Scanner main menu—Select the desired test.
30
Page 38

Scanner Operations Operations
5.5.1 Data Display
Depending upon the test vehicle, this selection may appear as Data, Data Display, Data Only,
Data (No Codes), or something similar . All are similar. Selecting has one of the following results:
• A submenu of data viewing choices displays.
• Vehicle dat a d isplays.
A submenu displays when more than one data viewing mode is available on the identified vehicle.
On some models, the engine must be started or cranked before data can be displayed. For these
models, a “Waiting to Co mmunicate” messag e displays if the eng ine was n ot cranke d or st ar ted.
Data Screens
When a Data selection is made, the screen displays the data list for the selected mo dule.The
items available for any electronic control module vary from one vehicle to another.
Data is presented in a 2-column format. An abbreviated parameter name is at the left of each
column and its value is at the right edge of the column. Parameters display in the order that they
are transmitted by the ECM, so expect variation between vehicles.
Gesture scrolling allows you to quickly move through the data list. Simply touch the screen and
drag your finger up or down to reposition th e parameters being displayed. Position bars
momentarily appear to the right of each column to indicate the po sition of the curr ent screen in
relation to the entire list as you scroll. Each column of parameters scrolls independently of the
other column. Figure 5-15 shows a typical data screen.
1— Graph icon
2— Parameter name
3— Parameter value
Figure 5-15 Sample data screen
31
Page 39

Scanner Operations Operations
Data Graphs
Select the Graph icon to open a data graph for that p ara meter (Figure 5-16). Selecting a
parameter for graph view moves it to the top of the list. Select the Graph icon again to close the
graph for that parameter and return to a dat a list view.
Figure 5-16 Sample graph view
The icons that display on each data gr aph allow you configure settings for the selected graph only:
Table 5-3 Data graph icon operations
Name Icon Description
Select to expand the graph to fill the entire screen,
Expand/Collapse
Graph Properties
select again to collapse the graph to the standard
view.
Select to open the Graph Properties dialog box,
which allows you to set triggers for recording a
snapshot and to adjust the scale.
Triggers
Triggers esta blish threshold values, an upper limit and a lower limit, for recording a data snapshot.
A snapshot allows you to closely evaluate conditions that caused the trigger ing even t.
When a snapshot is taken, the Scanner captures addition al data after the trigger point is detected,
data collection pauses, and the buf fered information is automatically saved as a movie. This gives
you a complete picture of what was happening before the fact, what occurred at the trigger po int,
and what happened after the fact.
Data collection is paused following a trigger event. Select the Play icon to resume viewing live
data. A vertical line now appears on each of the data g raphs to indica te the triggerin g point. The
trigger line on the parameter that triggered the snap shot is a different color than those on the othe r
graphs. This makes it easy to determine which p arameter caused the trigger when triggers are set
for multiple parameters.
32
Page 40

Scanner Operations Operations
NOTE:
z To adjust the amount of data collected after a trigger:
1. Select the Properties icon on the Scanner toolbar to open the dialog box.
2. Highlight one of the Samples After Trigger options:
3. Select the Accept icon to close the dialog box.
i You ca n also adjust the amount of dat a collected af ter a triggering event using the Properties icon
on the Scanner toolbar. See Properties on page 44 for additional information.
z To set triggers and record a snapshot:
1. Select the Graph Properties icon on the parameter graph you wish to set trigg ers on.
The Graph Properties dialog box opens.
2. From the Graph Properties dialog box, select Triggers On.
A check mark appears in the box and the Min and Max fields activate (Figure 5-17).
3. Select either Max: (maximum) or Min: (minimum) to activate that field and open the keyboard.
4. Typ e the desired trigge r value into th e field.
5. Select the other field and enter a trigger value, then close the virtual keyboar d.
6. Select Save to close the dialog box.
Trigger lines (blue for upp er and re d for lower ) disp lay on th e selected p a rameter gr aph.
The area between the upper and lower trigger lines est a blishes the trigger ing co ndition. Any
data points that register outside of the set trigger conditions initiates a snapshot.
Figure 5-17 Sample Graph Properties dialog box
7. Select Snapshot on the Dat a Buffer T oo lbar to ar m the sn ap shot.
The Snapshot icon changes color to indicate it has been a rmed (Figure 5-18).
Figure 5-18 Sample armed Snapshot icon
33
Page 41

Scanner Operations Operations
NOTE:
Once all of the data is compiled, data collect ion p ause s and the informatio n is saved a s a
movie. A confirmation screen displays to let you know the name automa tically assigned to the
saved file and where to locate it.
Figure 5-19 Sample saved movie confirmation screen
8. Select OK to close the confirmation screen.
9. Select the Play icon on the toolbar to resume viewing live data.
i Selecting an armed Snapshot icon disarms it.
Scale
Scale adjusts the upper and lower values displayed on the vertical axis of a dat a graph. T wo scale
modes are available; auto scale and manual sca le. Auto scale, which is the default setting,
automatically adjusts the graph scale based upon the minimum and maximum values transmitted
by the ECM. Manual scale allows you to set the minimum and maximum values.
z To manually set the scale on a gra ph:
1. Select the Graph Properties icon to open the di alog box for the graph you wish to scale.
2. From the Graph Properties dialog box ( Figure 5-20), select Auto Scale On.
The check mark is cleared from the box and the minimum and maximum fields activate.
3. Select either Max: (maximum) or Min: (minimum) to activate that field and open the keyboard.
4. Typ e the desired scale value in to the field .
5. Select the other field and enter a value, then close the virtual keyboard.
6. Select Save to close the dialog box.
34
Page 42

Scanner Operations Operations
Figure 5-20 Sample manual scale selection
The dialog box closes and the parameter scale is now a t the set value s.
Using Zoom
The zoom options on the Data Buf fer toolbar allow you to chan ge th e magnification level of the
sweep when viewing data graphs. Use the Zo om In (+) icon to increase magn ification, an d the
Zoom Out (–) icon to decrease magnification.
5.5.2 Codes Menu
This selection may appear as Codes, Codes Menu, Codes Only, Codes (No Data), or something
similar on the menu. Selecting opens a list of data para meter vie wing options tha t may include:
Display Codes
Selecting opens either a list of diagnostic troubl e codes (DTCs) stored in the sele cted electronic
control module (ECM), or a submenu of DTC viewing options. Submenu options may include:
• Trouble Code Info rmation—opens a list of codes in ECM memory .
• History Codes—opens a list of codes whose symptoms are not currently presen t. History
codes indicate an intermittently occurring problem.
• Failed This Ignition—opens a list of codes that set during the current ignition cycle.
• MIL SVS or Message Requested—displays ECM requests to light the malfunction indicator
lamp (MIL) or service vehicle soon (SVS) lamp, or display a driver information alert.
• Last Test Failed—displays a complete list of failed tests.
• T est Failed Since Code Cleared—displays a list of test s that failed since the last time codes
were cleared from ECM memory.
35
Page 43

Scanner Operations Operations
A code list includes the DTC, a brief description, and a Fix It! icon that opens a dropdown menu
of hyperlinks to sources of more det ailed infor mation ab out the co de ( Figure5-21).
The SureTrack frame above a code list can be expa nded (More) or collapsed (Less) by selecting
the up or down caret, respectively . Once you are logged into SureTrack, the common replaced
parts graph for the highlighted DTC displays if More is selected. See Common Replaced Part s on
page 109 for more details.
Figure 5-21 Sample code list and SureTrack information
Clear Codes
The Scanner clears trouble codes from the ECM memo ry on some vehicles. If this function is not
available on the test vehicle, Clear Codes does not appear a s a menu op tion.
z To clear codes:
1. Select Clear Codes from the Codes Menu.
A confirmation message displays.
2. Make sure any conditions shown on the confirmatio n messag e are met, th en select Yes.
A “codes cleared” message displays once the operation is co mplete .
3. Select Continue to return to the Codes Menu.
Freeze Frame/Failure Records
This selection displays the DTC that was set, along with corresponding data, when the ECM
commanded the malfunction indicator lamp (MIL) to turn on.
36
Page 44

Scanner Operations Operations
DTC Status
This selection allows you to view the records of a particular DTC.
z To check DTC status
1. Select DTC Status from the Codes Me nu.
The DTC St atus entry fie ld displays and the virtual ke yboard opens (Figure 5-22).
2. Use the virtual keyboard to enter the characters of the DTC.
3. Select the virtual keyboard Backspace icon if needed to erase a character.
4. Select the virtual keyboard Return key once all the code char acters are enter ed.
Figure 5-22 Sample DTC Status entry field
The DTC status report displays (Figure 5-23).
Figure 5-23 Sample DTC status report
5. Select Exit to return to the DTC status entr y scre en.
6. Select Exit again to return to the Codes menu.
37
Page 45

Scanner Operations Operations
IMPORTANT:
5.5.3 Functional Tests
The Functional Tests selection is used to access vehicle-specific subsystem and guided
component tests. Available test s vary by manu facture r, year, and model, and only the a vailable
tests display in the menu.
There are four general types of functional test operations:
• Information Test s—are read-only tests, like selecting “VIN” from a Functional Tests menu to
display the VIN of the identified vehicle.
• T oggle Tests—switch a component, such as a solenoid, relay, or switch, between two
operating states.
• Variable Control Tests—command a cert ain value for a system or comp onent, su ch as
varying the spark timing in 1° increment s or the EGR valve du ty cycle in 10% incre ment s.
• Reset Test s—reset the adap tive, or learn ed, values that ar e stored in th e electron ic control
module.
Selecting Functional Tests opens a menu of test options that varies by make and model.
Selecting a menu option either activates the test or opens a submenu of a dditional choices. Follow
all screen instructions while performing tests. How and what information is presented o n the
screen varies according to the type of test being performed.
Do not enter any functional tests while driving on a r oad test. During some functional test s, the
ECM makes changes to ignition timing, fuel delivery, and other en gine functions, which may a ffect
engine operation and vehicle control.
Some toggle and variable control tests display functional test controls at the top of th e screen with
data stream information below (Figure 5-24).
Figure 5-24 Sample functional test controls
38
Page 46

Scanner Operations Operations
Functional test controls allow you manipulate the test signal as shown in Table 5-4.
Table 5-4 Functional test control icons
Name Icon Description
Test Activates the test.
Return Moves focus back to the data list.
Change List Allows you to switch data lists.
Custom
Minus
Plus
5.5.4 Generic Functions
The Generic Functions selection opens a menu of available OBD- II/EOBD functions on 1996
and newer vehicles. For additional information on generic functio ns refer to th e Global OBD
Vehicle Communications Sof twar e Manual. Menu options typically include:
• MIL Status - displays the ID and status of the Malfunction Indicator Lamp (MIL)
• Fast Track Troubleshooter - displays a menu of available experience-based tests and tip s
• Readiness Monitors—displays the status of the OBD-II/EOBD required monitors
• ($01) Display Current Data - displays a screen cont ai ning Gener ic OBD PID dat a
• ($02) Freeze Frame—displays data stored in ECM memor y when a DT C is set
• ($05) Oxygen Sensor Monitoring—displays on-board oxygen senso r monitori ng test r esult s
• ($06) On-Board Monitored Systems—displays the st atus of system moni tors
• ($08) Request Control of On-Board System—establishes bidirectional ECM communication
• ($09) Calibration Identification—displays the ECM calibration identification numbers
• ($09) Calibration Verification Number—displays the ECM calibration
• ($09) In-Use Performance Tracking—displays a monitoring conditions report
• ($09) Ve hicle Identificatio n Number—d isplays th e VIN
• ($0A) Emissions Related Fault with Permanent S tatus—displays a record of permanent codes
Allows you to select which parameters display during
the functional test.
Switches an item to low or off, or incrementally
reduces a variable signal.
Switches an item to high or on, or incrementally
increases a variable signal.
39
Page 47

Scanner Operations Operations
NOTE:
5.5.5 Troubleshooter
Fast-Track® Troubleshooter is a database of experience-based information of validated
real-world repair strategies that have been compiled by top-notch technicians. Troubleshooter
simplifies the diagnosis process, as it contains information on virtually all common diagnostic
trouble code (DTC) problems and driveability symptoms.
Troubleshooter informatio n is organized into a series of diagnostic tips that are designed to quickly
lead you to the root cause of a p articular problem. The tips are vehicle-sp ecific, which means only
tips that relate to the identified vehicle are presented . Selecting ope ns a menu that may includ e:
• Code Tips—provides det ailed information on setting conditions, testing, and interp reting test
results for specific codes.
• Symptom Tips—provides diagnostic tests and procedures based on vehicle operation.
• Time Savers—provides supplementa l information , such as firing order an d #1 cylin der
location, that may be needed to make a diagnosis.
• Common Problems—provides advice and remedies for certain “pattern failures” that have
been experienced on vehicles of the same model.
• T ests and Procedures—explains how to perform certain tests on the specifi c test vehi cl e.
Some tips provide specifications and installation information as well.
• Fast-Track Data Scan (Normal Values)—contains information and guidelines on how to
validate data readings for certain sensors a nd actu ators, live data values are provided.
i Troubleshooter appears in a Scanner menu only if tips are available for the system se lected on the
identified vehicle.
40
Page 48

Scanner Operations Operations
IMPORTANT:
Certain live data parameter values display directly within the tip when performing Troubleshooter
tests and procedures. A tip may also contain a hyperlink to a Troubleshooter Reference, another
test or procedure, or a supplemental o peration, such as Cl ear Code s. Hyperlinks are shown in
blue, and selecting them opens the link. T r oublesh ooter Reference s open in a sep a rate win dow.
(Figure 5-25).
1— Live data values
2— Hyperlink
Figure 5-25 Sample data values within a Troubleshooter tip
5.5.6 Scanner Toolbar Operations
The Scanner toolbar is used to configure certai n aspect s of the d isplayed dat a and to exit. The
following sections explain how to use the toolbar .
Custom
The Custom icon on the Scanne r T oolbar is used to determine which specific parameters display .
Minimizing the number of parameters on the data list allows you to focus on any suspicious or
symptom-specific data parameters. You can add or remove most parameters from the list. Any
parameter that has a lock icon next to it cannot be removed from the list.
Limiting the number of parameters that display allows for a faster refresh rate of the data. A
smaller data lists also reduces the amount of memory used for saved files.
41
Page 49

Scanner Operations Operations
NOTE:
z To create a custom data list:
1. Select Custom on the Scanner Toolbar.
The parameter selection dialog box with all of the p aramete rs selected o pens (Figure 5-26).
2. Select the Deselect All icon to clear the highlights from the screen.
3. Create a custom data list by selecting the parameters to be included. Highlighting indicates a
parameter that displays, parameters that are no t high lighted do not display.
Figure 5-26 Sample custom configuration screen
Keep the following in mind when configuring a custom data list:
– Gesture scroll if the list of parameters is longer than what is shown on the screen.
– Use the Select All icon to display the complete list.
– Use the Deselect All icon to remove all the currently selected parameters from the list.
– Select individual parameters to highlight and include them in the list.
– Select individual highlighted parameters to remove them from the list.
– Use the Cancel icon to return to the data display.
4. Once all desired parameters have been selected, re turn to the dat a l ist:
– Use the List View icon to return to a data screen in PID List format.
– Use the Graph View icon to return to a dat a screen in Graph View format, see Graph View
on page 45 for details.
i Graph View is only available when 16 or fewer parameter s (the n umber th at can d isplay on a
single screen) were selected for the custom list. Make sure that no more than 16 para meters are
highlighted if the screen displays a single graph when the Graph V i ew icon is selected.
42
Page 50

Scanner Operations Operations
NOTE:
Alarms
Alarms are visual indicators alongside a parameter in the data display list that change color to
show the signal status. A green alarm indicates on, a gray alarm indicates off. Only digital
parameters, those with a range limited to two states, can h ave alarms. Parameters with
continuous ranges, such as variable voltage and pressure values, cannot have alarms. Th e alarm
indicator assignments remain as selected until you exit the dat a list:
z To configure alarm settings:
1. Select the Alarms icon on the Scanner Toolbar .
The Alarm List dialog box opens.
2. Check the parameters that you want to show alarms.
3. Select Save.
Alarm indicators now appear next to the selected parameter s in the Dat a List ( Figure 5-27).
Figure 5-27 Sample alarm indicators
i Alarms can only be set for certain parameters. If the Alarm List dialog box is empty , no parameters
are available and alarms cannot be set.
43
Page 51

Scanner Operations Operations
Properties
The Properties icon on the Scanner Toolbar is used to configure certain characteristics of the
parameter graph display . Selecting op ens a Properties dialog box that allows you to adjust colors,
settings, and sweep (Figure 5-28).
Figure 5-28 Sample properties dialog box
Selecting either color option, Edit Plot Color or Edit Background Color opens a standard color
selection dialog box. Select a color, then select OK to close the dialog box.
The Show Grid icon is used to switch a background grid pattern on the data graphs on and off:
• To switch the grid on; select to highlight Show Grid, then select Accept.
• To switch the grid off; select Show Grid twice so it is not highlighted, then select Accept.
The Samples After Tr igger setting deter mines how many da t a samples are r ecorded fo llowing a
triggering event. The highlighted samples icon indicates the number of frames that are included in
the recording after a triggering event.
The sweep options let you choose the amount of data that displays across the graph. V alues are
in sample points, or frames of data. A frame of dat a equals one complete transmission of the serial
data by the electronic control module.
44
Page 52

Scanner Operations Operations
NOTE:
Graph View
Graph View allows you to simultaneously display u p to 16 p arame ter graphs ( Figure 5-29). The
graphs must first be opened in the data list in order to be included whe n Graph V i ew is selected
from the toolbar . The display default s to a single graph if more than 16 graphs are open when the
toolbar icon is selected. Should this happen, return to the dat a list an d close some of the gra phs.
A toolbar in Graph View allows you switch scale and swee p values on and off, and to return to the
List View. The Data Buffer toolbar at the base of the screen remains active.
i The screen does not scroll in Graph View mode, it adjusts to show only the selected pa rameters .
Figure 5-29 Sample Graph View screen
Graph View mode can also be engage d from the custom dat a list configur ation screen. Refer to
Custom on page 41 for details.
45
Page 53

Scanner Operations Operations
Save
The Save icon is used to record movies of vehicle da t astream values. Saved files and be helpful
when trying to isolate an intermittent problem or to verify a repair during a road test.
z To save a movie:
• Select Save.
A save movie dialog box displays while data is being saved. The movie is saved wh en the
message box disappears.
Figure 5-30 Sample save dialog box
Saved files can later be viewed by selecting Dat a Manage r on the h ome screen . Fro m the Dat a
Manger open the Scanner Data Folder, then locate and select the saved file to be viewed.
Print
Selecting Print from the toolbar opens a standard Win dows Print d ialog bo x. Select from the
options as needed to print the current frame of data.
Figure 5-31 Sample print dialog box
46
Page 54

Scanner Operations Operations
NOTE:
If the Diagnostic T ool is connected to a printer , the current frame of data is printed. If the Diagnostic
Tool is not connected to a printer, the frame of data is save d as an “XPS” file. A dialog box opens
so that you can name the print file and specify the location that it is saved to, follow the on-screen
instructions.
Saved files can be printed at a later date, or opened and reviewed.
i Saved print files cannot be viewed using the Data Manager , they can only be o pened into an
internet browser.
z To open a saved print file:
1. Minimize the Diagnostic Suite to view the desktop.
2. From the desktop select My Documents > ShopStream > Scanner Data Folder .
3. Locate the file you wish to view.
4. Double select the file to open it.
The internet browser and file open.
More
Whenever the More icon appears on the toolbar it indicates that there are additional op tions
available. Selecting the More icon from the Scanner toolbar opens a dropdown menu that offers
two choices that only apply to data graphs:
• Scale
• Sweep
Scale
The Scale option switches the scale values, displayed along the left-hand side of the data graphs,
on and off (Figure 5-32). The dropdown menu closes once a selection is made.
Figure 5-32 Sample data graph scales
47
Page 55

Scanner Operations Exiting the Scanner
NOTE:
Sweep
The Sweep option switches the sweep values, displayed below the data graphs, o n and off
(Figure 5-33). The dropdown menu closes once a selection is made.
Figure 5-33 Sample data graph sweep
5.6 Exiting the Scanner
The Scanner remains open as long as there is an active communication link with the vehicle. You
must disconnect this co mmuni cati on l ink i n orde r to exit fro m Scanner te st s a nd close th e
Diagnostic Tool software. A warning message displays if you attempt to shut down while the
Scanner is communicating with an ECM.
i Damage to the vehicle electronic control module (ECM) may occur if communication is disrupted.
Make sure the data cable and th e USB cable are pr operly connected a t all times during testing.
Exit all tests before disconnecting the test cable or turnin g of f the too l.
z To exit the Scanner:
1. From an active screen, select Exit from the Scanner Toolbar to return to the Systems Menu.
2. From the Systems Menu, select Back from the Scanner data menu.
A “stopping communications” message briefly displays followed by the Scanner main m enu.
Now, the Sca nner is no longer communicating with the vehicle and it is safe to return to the Home
screen and exit the Diagnostic Tool software.
48
Page 56

Scanner Operations Downloading Firmware
5.7 Downloading Firmware
The internal programming of the Scan Module, known as the firmwa re, can be updated using the
VERUS PRO Diagnostic T ool. Firmware updates increase the Scan Module capabilities, typically
by adding support for new tests, new models, o r enhanced applicati ons to the databases. A
notification message displays if an update is available when Scanner is selected from the VERUS
PRO Home screen (Figure 5-34).
Figure 5-34 Firmware update available message
The Diagnostic Tool automatically searches for available updates for all of the VERUS PRO
components when it is connected to the internet. Any updates that are found a re downloaded and
stored on the Diagnostic Tool. However , the u pdate must be inst alled in o rder to complete the
process. This section describes installing an update to the Scan Module firmware.
The firmware update process, as explained in the following procedure, begins automatically after
ten seconds unless the Update Now or Update Later icon is selected. Selecting Update Now
begins the process immediately. Update Later defers the operation, closes the message, an d
opens the Scan Module. Not updating does not impact ope rations, th e Scan Module r emains
functional but may not benefit from the additional features available in the update. Selecting
Details in the upper-right corner opens a list of what is inclu ded in the upd ate.
49
Page 57

Scanner Operations Downloading Firmware
NOTE:
z To update the firmware:
1. Turn on the Diag nostic Tool.
2. Connect the Scan Module to the Diagnostic Tool as follows (Figure 5-35):
a. From the bottom of the Scan Module, gently lift up and out on the sides of the handgrip to
free it from housing.
b. Open the hinged cover on the base of the Scan Module to expose the USB jack.
c. Plug the small end of the USB cable into the USB jack on the Scan Module.
d. Plug the large end of the USB cable into one of the ports on the side of the Diagnostic
Tool.
1— Hinged cover
2— USB jack
Figure 5-35 Scan Module service jack
i The Scan Module and Diagnostic Tool must be connected with the USB cable to update the
firmware. The USB cable powers the Scan Module so there is no need to connect to a vehicle .
3. Select Scanner from the Diagnostic Tool Home screen.
50
Page 58

Scanner Operations Downloading Firmware
4. Select OK when the firmware update notification displays.
The update begins and installation progr ess is tracke d on the screen ( Figure 5-36).
Figure 5-36 Sample update in progress screen
A “Reprogramming succeeded” message displays once the inst a llation pr ocess is complete
(Figure 5-37).
Figure 5-37 Sample firmware update complete message
5. Select OK to close the message and return to Scanner operations.
The Scan Module, with the latest firmware update, is now read y to use.
51
Page 59

Chapter 6 OBD Direct Operations
This Home screen option allows you to access Generic OBD-II/EOBD Scanner tests without
completing a vehicle identification. OBD Direct presents a quick way to check for diagnostic
trouble codes (DTCs), isolate the cause of an illuminated malfunction indicator lamp (MIL), check
monitor status prior to emissions certification testing, verify repairs, and perform a number of other
services that are emissions-related. This mode is also used for testing OBD-II/EOBD compliant
vehicles that are not included in the Scanner data bases.
OBD Direct is a Scanner function, and the Scan Module must be connected to the test vehicle and
communicating with the Diagnostic Tool. This function only provides generic OBD-II/EOBD
information. To access enhanced OBD-II/EOBD functions, select Scanner from the Home screen.
Options for the Menu icon on the Toolbar at the base of the screen are the same as those available
for the Scanner module. Refer to Menu Options, Scanner on p a ge 20 for details.
Selecting OBD Direct on the Home screen opens a menu with two options (Figure 6-1):
Figure 6-1 Sample OBD Direct main menu
52
Page 60

OBD Direct Operations OBD Health Check
6.1 OBD Health Check
The OBD Health Check offers a way to quickly che ck for and clear generic dia gnostic trou ble
codes (DTCs) and to check readiness monitors. Selecting OBD Health Check opens a submenu
of options (Figure 6-2).
Figure 6-2 Sample OBD Health Check menu
6.1.1 Global OBD II Code Check
This option displays any stored emission related generic DTCs reported by the ECM. Sele cting
opens a submenu with two choices: Codes and Pending Codes.
Select an option to display the code list. Refer to Codes Menu on page 35 and the Global OBD
Vehicle Communication Software Manual for additional information.
Codes
Codes displays a list of current emission related DTCs. OBD-II/EOBD Codes have a priority
according to their emission severity, with higher priority codes overwriting lower priority codes.
The priority of the code determines the illumination of the MIL and the code erase procedure.
Manufacturers rank codes dif feren tly, so expect to see differences between makes.
53
Page 61

OBD Direct Operations OBD Health Check
Pending Codes
The purpose of this service is to enable the scan tool to obta in “pending” o r maturing d iagnostic
trouble codes. These are codes whose setting conditions were met during the last drive cycle, but
need to be met on two or more consecutive drive cycles before the DTC a ctually sets.
The intended use of this service is to assist the service techni cian af ter a vehicle r ep air and after
clearing diagnostic information, by reporting test results after a single driving cycle.
• If a test failed during the driving cycle, the DTC associated with that test is reported. If the
pending fault does not occur again within 40 to 80 warm-up cycles, the fault is automatically
cleared from memory.
• T est results repo rted by this service do not necessarily indicate a faulty component or system.
If test results indicate another failure after additional driving, then a DTC is set to indicate a
faulty component or system, and the MIL is illuminated.
6.1.2 Global OBD II Clear Codes
This option is used to clear all emission related diagnostic data such as, DTC records, free ze
frame data, and test results, from ECM memory. Although OBD Direct only displays generic
OBD-II data, clearing codes erases all of the stored data including any enhanced codes.
A confirmation screen displays when the clear codes option is selected to prevent accidental loss
of data. Select Yes on the confirmation screen to continue. Refer to Codes Menu on page 35 and
the Global OBD Vehicle Communication Software Manual for additional information.
6.1.3 Readiness Monitors
Use this menu option to check the readiness of the monitoring system. An OBD-II/EOBD system
checks the status of emission-related subsystems by running continuous or periodic te st s. Test
results are shown in the data viewer (Figure 6-3).
Figure 6-3 Sample readiness monitor test report
Gesture sweep to view the entire list of Readiness Monitors to ensure that all tests are complete.
It is possible to print the readiness test status or save it as part of a Vehicle history.
54
Page 62

OBD Direct Operations OBD Diagnose
6.1.4 MIL St atus
This item is used to check the current condition of the malfunction ind icator lamp (MIL). Additional
information, such as which ECM commanded the MIL on a nd the dist ance driven while the MIL is
on (if supported), can also be displayed. It is also possible to print the MIL Status.
6.2 OBD Diagnose
Selecting OBD Diagnose opens a menu with the following options:
• Star t Communication —begins the test session
• Connector Information—provides data link conn ector ( DLC) loca tion det ails for most models
• Manual Protocol Selection—allows you to select which protocol to use
6.2.1 St art Communication
Use the following procedure to conduct an OBD Direct test session:
z To perform an OBD Direct Test:
1. Select Start Communication s from the OBD Direct m enu.
A generic connection message will display (Figure 6-4), connect the Scan Module to the
test vehicle as instructed.
Figure 6-4 Sample generic connection message
55
Page 63

OBD Direct Operations OBD Diagnose
2. Select Continue.
A communications message that shows how many ECMs were detected, which ECM is
communicating, and which communication protocol is being used displays (Figure 6-5).
Figure 6-5 Sample communication message
3. Select Continue and a menu of available tests displays (Figure 6-6).
Figure 6-6 Sample Start Communication menu
4. Select a test to continue.
56
Page 64

OBD Direct Operations OBD Diagnose
Readiness Monitors
Use this menu item to check the status of the monitored system. If a monitored system is not
supported, it is not displayed. Scroll, if needed, to view the entire list of monitors. Selecting
Readiness Monitors opens a submenu with two choices:
• Monitors Complete Since DTC Cleared—displays the results of all monitor tests that have
run since the last time the electronic control module (ECM) memory was cleared.
• Monitors Complete This Cycle—displays only the resu lts of monitor tests that ran during the
current drive cycle, they reset when the ignition is switched off.
MIL Status
This item is used to check the current condition of the malfunction ind icator lamp (MIL). Additional
information, such as which ECM commanded the MIL on an d also the dista nce traveled while the
MIL is on (if supported), can also be displayed. It is also possible to p rint the MIL Status.
Fast-Track Troubleshooter
Fast-Track® Troubleshooter is a database of experience-based information of validated
real-world repair strategies that have been compiled by top-notch technicians since 19 88. T he
Troubleshooter system simplifies the d iagnosis proces s, as it contains information on virtually all
common diagnostic trouble code (DTC) problems and driveability symptoms for most vehicles
covered by the vehicle communication software.
($01) Display Current Data
Use this item to display the current emission related data from the selected electronic control
module (ECM) of the vehicle. Displayed data includes analog inputs and output s, digital inputs and
outputs, and system status information broadcast on the veh icle data stream. OBD Direct data
displays similar to Scanner data, refer to Data Display on page 31 for details.
($02) Display Freeze Frame Data
This item is used to display freeze fame data for any stored emission related diagnostic trouble
codes (DTC). In most cases the stored frame is the last DTC that occurred. Certain DTCs, those
that have a greater impact on vehicle emission, ha ve a higher priority. In these cases, the highest
priority DTC is the one for which the freeze frame records are retained.
Freeze frame data includes a “sna ps hot” of critical p ar ameter valu es at the time the DTC set.
($03) Display Trouble Codes
This option displays any stored emission related DTCs reported by the various ECMs. The OBD
Direct code report is similar to a Scanner module code r eport, and in cludes the Fix It icon with
hyperlinks to SureTrack and Repair Information details. See Display Codes on page 35 for
additional information.
57
Page 65

OBD Direct Operations OBD Diagnose
($04) Clear Emissions Related Data
This item is used to clear all emission related diagnostic data such as, DTCs, freeze frame data,
and test results from the memory of the selected ECM.
($05, 06, 07) Display T est param./Results
This option opens a submenu of test parameters and test result s fro m various sensors, mon itor
test results, and a record of DTCs dete cted during the last drive cycle. The menu includes:
• Oxygen Sensor Monitoring ($05)
• On-Board Monitored Systems ($06)
• DTCs Detected During Last Drive ($07)
($08) Request Control of On-board System
This service enables bidirectional control of the ECM so that the Scanner is able to tr ansm it
control commands to operate the vehicle system. This function is useful in determin ing how well
the ECM responds to a command.
Available options vary by make, model, and year o f the test veh icle. Select a test and follow the
on-screen instructions.
($09) Read V ehicle Identification
This selection displays the vehicle identification number (VIN), the calibration identification , and
the calibration verification number (CVN) of the test vehicle.
($09) In-use Performance Tracking
This selection displays the “In-use Performance Tracking” of monitored data. It is basically a
record of the number of times each of the monitor tests have bee n completed.
($0A) Emission Related DTC with Permanent Status
This service displays a record of any “permanent” codes o n late -model ve hicles if the veh icle
supports Service $0A. A permanent status DTC is one that was severe enough to illuminate the
MIL at some point, but the MIL may not be on at the present time.
Whether the MIL was switched off by clearing codes or because the setting conditions did not
repeat after a specified number of drive cycles, a record of the DTC is ret ained by the ECM.
Permanent status codes automatically clea r after repa irs have been made and the related system
monitor runs successfully.
58
Page 66

OBD Direct Operations OBD Diagnose
6.2.2 Connector Information
This option opens a database of vehicle diagnostic connector locations that includes most makes
and models.
z To locate a vehicle diagnostic connector:
1. Select Connector Information from the System menu.
2. Select a manufacturer from the list presented.
3. Select a model from the list presented.
Instructions for which, if any, cable adapter or pin to use displays.
4. Select Continue.
Information on where to locate the vehicle dia gnostic conn ector disp lays.
5. Select Continue to return to the System menu.
6.2.3 Manual Protocol Selection
A communication protocol is a standardized way of dat a commun ication b etween an ECM and a
scan tool. Global OBD may use several different com munication pr otocols. Th e scan tool
automatically connects to an available protocol, which displays on the connection message
(Figure 6-5). Some vehicles communicate on more than one protocol. Use the Manu al Protocol
Selection option to switch to a different protocol.
Select Manual Protocol Selection and message displays advising you to make sur e you know
the correct protocol for the test vehicle. An incorrect selection may activate warning lamp s and set
CAN related faults on the vehicle. Select OK and a menu of options displays (Figure 6-7).
Figure 6-7 Sample communication protocol menu
59
Page 67

Chapter 7 Guided Component Test
:$51 ,1*
IMPORTANT:
Operations
The Guided Component Test software is a component-testing power house, prov iding you with a
robust diagnostic database for use with scopes and meters. It is like having access to a complete
library of shop manuals for testing engine-management compon ent s, transmissio n sensors and
components, and ABS systems.
Guided Component Test helps you with everything from selecting the app ropriate test for a
specific component to showing the hook-up location and correct pin configuration. This software
thoroughly guides and instructs you on p roper testing procedures and o ffers tip s from the internal
troubleshooter database. The Guided Component Test procedures, tips, and meter settings
reduce your overall set-up and diagnostic testing time. V ehicle -specific Guided Component Tests
are provided for engine, transmission, ABS, charging, transfer case and suspension systems.
Risk of electrical shock.
•Read the Important Safety Instructions document provided separate ly for messages on
the safe use of this product.
• This product is intended for Measurement Category I (for example, automotive 12V
systems), do not use this product for Measurement Categories II, III, and IV.
• Measurement Category I is for performing measurements on circuits not directly
connected to MAINS or MAINS circuits (an example of a MAINS circuit is 120V AC or
240V AC household or industrial electricity), do not connect this product to MAINS or
MAINS circuits.
• Do not apply the Black Ground Lead to test points other than ground/system return/
vehicle chassis.
Electrical shock can cause personal injury, equipment damage, or circuit damage.
Maximum rated transient over voltage impulse is 500 volts, do not exceed the rated
transient over voltage.
7.1 Vehicle Identification
The Guided Component Test information presented is specific to the vehicle being tested.
Therefore, certain attributes of th e test vehicle must be entered into the Diagnostic Tool so that the
correct data can be retrieved. Vehicle identification information is carried over if you enter the
Guided Component Test module either from the Scan Module or from on e of the records stored in
the Vehicle Histor y module. However, you may need to enter additional attributes in some
instances.
The vehicle identification sequence is menu driven, you simply follow th e screen prom pt s and
make a series of choices. Each selection you make advances you to the next screen.
60
Page 68

Guided Component Test Operations Vehicle Identification
7.1.1 Menu Options, Guided Component Test
Selecting the Toolbar Menu icon at the base of the screen of fers th e following optio ns:
• Safety Information—opens the Important Safety Instructions document. See Safety
Information on page 13 for additional information.
• File—allows you to print, save and set page settings of the data being viewed.
• Top Level Menus—allows you to access supplemental information and tr aining progra ms.
• Help—allows you to view supporting documentation. See Help on p age14 for additional
information.
File
Selecting File opens a menu of print options:
• Print Article—selecting has one of two results:
– If a printer is connected, the file is sent to the printer.
– If a printer is not connected, the article is saved as a (.xps) file, which can be retrie ve d,
moved, or copied and printed at a later time.
• Print Preview—opens a representation of what the printed file will look like.
• Page Setup—allows you to adjust margins and paper orientation .
Top Level Menus
Selecting Top Level Menus opens a list of the following options:
• Features Benefits
• How To
• Power User Tests
• Snap-on Automotive Theory
Features Benefits
Selecting Features Benefit s opens a menu page that includes:
• 5-Minute Walk Thru W ith Demo Boa rd—explains how to u se the optiona l demonstrat ion
board to generate sample signals.
• Features & Benefits—pro vi des descri ptions and a brief overview of meter functions.
• Accessories—opens a menu of optional equipment available.
• Product Description—provides descriptions and a brief overview of meter operations.
The demonstration board not only helps you le arn ho w to use the Guided Compo nent Test
software, it allows you to hone your skills and diagnostic technique without an actual test vehicle.
Power User Tests
The Power User Tests option gives you quick access to a pre-configured meter fo r conducting a
number of control system tests. Tests are available with or without on-screen help. Help typically
provides a description of the test along with expected results and a link to th e pre-set meter.
61
Page 69

Guided Component Test Operations Vehicle Identification
How To
The How To option provides a list of available on-screen instructions for performing tasks. Scroll
to view the entire list. Typ ical topics include :
• 10-Minute Electronic Classes—provides brief instruction in basic elec tronics an d circuit
connections.
• 15-Minute Ignition Classes—provides an introductio n to basic ignition testing.
• Illustrated T erms & Definitions—provides definitions of terms, dr awings and tips associated
with Guided Component Testing.
• No-start Basics—provides a guideline for diagnosing a no-st a rt condition.
• O2 Sensor & Feedback System Analysis—displays the Guide d Compone nt Test meter in
the “live” graphing mode with O2S test tips to help you understand the fundament al concept s
of O2S diagnostics.
• T est T i ps—gives on-screen instructions for performing specific Guided Component Tests
along with drawings and tips.
• 20-Minute Current Ramp Classes—provides an introduction to current ramp testing.
• Minute Current Ramp Classes—provides an introduction to current ramp testing.
• Theory And Operation—provides basic theory and operatio n informatio n for related
components.
Snap-on Automotive Theory
Selecting the Snap-on Automotive Theory option provides you basic operation, theor y and
testing information on various systems such as:
• Air Conditioning
• Diesel Particulate Filters
• High-Intensity Discharge Headlights
• Supplemental Restraint Systems
• Diagnosing Battery Draws
• Electronic Parking Assistance Class
• LIN-Bus
• Tire Pressure Monitoring
62
Page 70

Guided Component Test Operations Vehicle Identification
7.1.2 Creating a Favorites List
Once a Guided Component Test database is loaded, a list of manufacturers displays. This list is
often long and includes makes that are not freq uently used. A to olbar at th e top of the scree n
allows you to custom configure the manufacturer list to display only the makes you fre quently
service.
z To configure a favorites list:
1. Select Configure Favorites on the toolbar.
A list of selectable manufacturers displays.
Figure 7-1 Sample manufacturer list
Figure 7-2 Sample Configure Favorites screen
2. Select each manufacturer you want to include, selected manufactures ar e highlighted .
63
Page 71

Guided Component Test Operations Vehicle Identification
NOTE:
i Manufacturers appear on the favorites list in the order in which they are selected. Therefore, if you
select the makes you work on most frequently first, they will appear at the top of the list.
3. Select Finished on the toolbar once your selections have been made.
The screen returns to the manufacturer list, but only the makes you selected display. Note the
“Favorites” toolbar selection now reads “Full list”.
4. Select Full List on the toolbar to view the complete list of manufacturers.
5. Select Back on the toolbar at any time to return to the previous screen.
Your favorites list is what will display whenever a Guided Component T est dat abase is started in
the future. The list can be modified at any time by selecting Con figure Fa vorites from the too lbar.
7.1.3 Identifying a Test V ehicle
Exact procedures to identify the test vehicle may vary somewhat by vehicle a nd marke t. The
following procedure, which identifies a 2008 Ford Focus for testing the fuel injection system, is
typical of what to expect.
z To identify a vehicle for Guided Component Test:
1. Select the Guided Component Tes t F unction icon from the Hom e screen.
2. Select which database to load for the test vehicle if requested (optional).
After the database loads, a list of manufacturers displays.
3. Select FORD and a model year menu displays.
4. Select 2008 from the year menu and a list of availabl e models d isplays.
5. Select FOCUS from the model list and a list of available engines displays.
6. Select 2.0L from the engine list and a confirmation dialog box displays (Figure 7-3).
Figure 7-3 Sample confirmation dialog box
7. From the confirmation dialog box, select OK to continue, or Cancel to return to the engine list.
64
Page 72

Guided Component Test Operations Vehicle Identification
NOTE:
A list of tests available for the identified vehicle displays (Figure 7-4).
Figure 7-4 Sample available tests list
8. Select FUEL INJECTION and a fuel injection component test menu displays (Figure 7-5).
Figure 7-5 Sample available component tests list
9. Select a test to continue.
The identification sequence is now complete, refer to the Operations section that follows for
details on how to navigate through the Guided Com ponent Test information and perform tests.
i If you return to the Home screen and select Scanner or Vehicle History the vehicle identification
entered here is carried over. However, additional informa tion may be nee ded by some modules.
65
Page 73

Guided Component Test Operations Operations
7.2 Operations
The Guided Component Test software provides vehicle specific Guided Compon ent Test
procedures and information that aid in setting up scop es and mete rs. Once a test vehi cle is
identified, you can select a Guided Component Test from the list of available tests. For most
selections two main choices are available on the component menu:
1. COMPONENT INFORMATION—provides info rmation on the selected com ponent a nd
connector pin details that assists you in under st and ing the comp onent s prior to dia gnosis.
2. TESTS—provides a pre-configured list of tests, guides you through performing the tests, and
offers tips and resour ces to re duce setup an d testing time.
7.2.1 Component Information
Component Information provides details on specific vehicle components to provide a better
understanding of the components prior to d iagnosis.
The Component Information screens contain information to assist you with testing. The screens
are divided in sections to help quickly guide you to the correct information (Figure 7-6):
• Operation—provides a general description of normal component opera tion.
• Connector—displays the component connector and lists pin assignments.
• Location—identifies the component location and the best place for te sting it.
• T ech note—pr ovides Guided Co mponen t Test-related tips (for example, common failures or
faults) as well as update or recall information.
Figure 7-6 Sample Component Information screen
z To view component information:
1. Select a component from the tests list.
2. Select COMPONENT INFORMATION from the comp onent men u.
66
Page 74

Guided Component Test Operations Operations
NOTE:
NOTE:
i An additional selection, such as front or rear for an oxygen sensor (O2S), may be required before
advancing to the component information screen.
The component information screen displays (Figure 7-6).
3. Always Gesture sweep to view any additional information below what is visible.
4. Select Back at any time to return to the previous screen.
7.2.2 Tests
The Tests section guides you through the process of performing tests on a specific component. It
also provides specifications, tips on how and where to connect the test meter leads, and also
automatically configures the multimeter or lab scope to perform the selected test.
Once a test vehicle is identified, you can select a component from the available test s list.
z To select a test:
1. Select a component from the list.
2. Select TEST to open the list.
i More than one selection is available in some instances. For example, select Ig nition Tests and a
menu offering Primary Tests and Secondary Tests displays.
The list shows all of the tests available for the selected componen t, choices var y by make,
model, and year.
Selecting opens an additional submenu similar to the one shown in Figure 7-7 when more
than one option is available.
Figure 7-7 Sample O2S voltage test submenu
67
Page 75

Guided Component Test Operations Operations
3. Select a test option and the test screen displays (Figure 7-8).
Figure 7-8 Sample Test screen
4. Gesture sweep to view any additional information.
5. Select Back at any time to return to the previous screen, or select Exit to return to the main
component menu.
Hyperlinks
Guided component test screens contain hyperlinks that can ei ther t ake you to another p age
containing additional information or open an additio nal window o n top of th e current scr een.
Hyperlinks display as icons. Common hyperlinks are:
– View Meter—opens a live meter set up to perform the test in the lower portion of the
screen (Figure 7-9). Once the meter view is open, the Guided Component Test toolbar at
the top of the screen is replaced by the Scope Multimeter toolbar, which allows you to
make adjustments to the settings. See Scope Multimeter Toolbar on page 79 for details.
– Show More Information—advances to a new screen with more detailed information
about a particular test, select Back to return to the test screen.
68
Page 76

Guided Component Test Operations Operations
View Meter
A Meter icon, which is only available in the Guided Component Test view meter mode, appears on
the upper toolbar (Figure 7-9).
Figure 7-9 Sample view meter window
Three view meter options are available:
1. With View Meter active (Figure 7-9), select the Meter icon on the toolbar once and the meter
expands to fill the entire screen.
2. Select the Meter icon a second time and the meter open as a separate wind ow (Figure 7-10).
This window can remain open if you switch to the Scan Module and can be accessed from the
Windows toolbar at the bottom of the screen. You can also resize and reposition the meter
window on the screen.
Figure 7-10 Sample meter view in a separate window
69
Page 77

Guided Component Test Operations Operations
IMPORTANT:
Selecting the Close icon (red box with an X) when viewing the meter in a separate window
closes the meter and returns you to the Guided Component Test screen.
3. Select the Meter icon a third time to close the separate window and return to the st a ndard
meter view as shown in Figure 7-9.
Select Exit from the toolbar to close meter view and return to the Guided Component Test
screen.
Connecting to a Test Vehicle
Before performing a test, you must connect the meter test leads to the vehicle. Certain Guided
Component Tests require the use of specific leads. Information on specific leads and other
connecting information displays on the initial test screen. Follow the on-screen connection
instructions in the test procedure to connect the test leads.
Performing a Test
Once you connect the te st lea ds to the vehicle, you can proceed with testing.
z To perform Guided Component Tests:
1. Follow the instructions displayed in the test procedure section.
2. Gesture sweep to view all of the instructions and follow the on-screen proced ures.
3. Select the View Meter hyperlink to display test results.
4. Refer to the on-screen information to verify test results.
Refer to Scope Multimeter Operations on page 71 for additional information on working with the
View Meter window.
70
Page 78

Chapter 8 Scope Multimeter Operations
:$51 ,1*
IMPORTANT:
NOTE:
This Scope Multimeter module provides all the tools needed for pe rforming ele ctrical an d
electronic circuit tests and for monitoring sign als and circuit activity. The Scope Multimeter module
easily separates from the Dia gnostic Tool and connects with a USB cable so that test results can
be remotely monitored as you perform other tasks.
The Scope Multimeter works interactively with other modules. Selecting “View Meter” from a
Guided Component Test or Scanner Test opens the Scope Multimeter module.
Risk of electrical shock.
• Read the Safety Information provided for import ant warnings on t he use of this product
• This product is intended for Measurement Category I (for example, automotive 12V
systems), do not use this product for Measurement Categories II, III, and IV.
• Measurement Category I is for performing measurements on circuits not directly
connected to MAINS or MAINS circuits (an example of a MAINS circuit is 120V AC or
240V AC household or industrial electricity), do not connect this product to MAINS or
MAINS circuits.
• Do not apply the Black Ground Lead to test points other than ground/system return/
vehicle chassis.
Electrical shock can cause personal injury, equipment damage, or circuit damage.
Maximum rated transient over voltage impulse is 500 volts, do not exceed the rated
transient over voltage.
8.1 Remote Scope Multimeter Setup
The Scope Multimeter module can be removed from the Diagnostic Tool, then connected to the
Diagnostic Tool with a USB cable. This increases the range of mobility for the Diagnostic Tool
while monitoring signals on the test vehicle. A Type A/B USB cable, which is provided with yo ur kit,
makes the connection.
i The Scope Multimeter module can be removed from the Diagnostic Tool at any time, whether
powered on or not. However, data and settings will be lost if it is removed while operating.
To prevent accidental loss of data, make it a practice to first save the current data if desired, then
select either the Power Off or Back icon from the to olbar to suspend meter oper ation. Power Of f
saves the current settings, but does not save data. Settings ar e not sa ved if Back is selected .
71
Page 79

Scope Multimeter Operations Getting Started
z To setup the Scope Multimeter for remote viewing:
1. Depress the Scope Multimeter module release tab loca ted on the top of the Diagno stic Tool
(Figure 8-1).
Figure 8-1 Scope Multimeter release tab
2. Slide the Scope Multimeter module free of the Diagnostic Tool.
3. Open the USB jack cover on the bottom of the Scope Multimeter module ( Figure 8-2).
Figure 8-2 Scope Multimeter module USB jack location
4. Connect the square end of the USB cable to the jack on the Scope Multimeter.
5. Open the hinged cover on the left- hand side of the Diagnostic Tool (Figure 8-3).
1— Hinged cover
2— USB ports
Figure 8-3 Scope Multimeter module USB jack location
6. Connect the rectangular end of the USB cable to either of the two port s on the Diagnostic Tool.
The Scope Multimeter is now ready for remote use.
8.2 Getting St arted
The Scope and Multimeter module enables the following functions:
• Lab Scope
• Ignition Scope
• Graphing Multimeter
• Digital Multimeter
72
Page 80

Scope Multimeter Operations Getting Started
8.2.1 Capabilities
The following tables detail the software and hardware capabilities.
Table 8-1 Scope
Function Range Accuracy/Comments
Ch. 1—yellow banana jack
Signal Measurement
Sample Rate
Bandwidth DC–3 MHz 3 db point @ 3 MHz
Input Impedance
VDC (Full Scale) 100mV–400V Do not measure greater than 75VDC
VAC (Full Scale) 100mV–400V Do not measure greater than 50VAC (rms)
Low Amp Probe
Ch. 2—green banana jack
Ch. 3—blue banana jack
Ch. 4—red banana jack
For 50uS sweep 6MSPS
For 100uS sweep 3MSPS
For all other sweeps 1.5 MSPS
10 MOhm
4kOhm @ 3MHz
20A scale (100mV/Amp)
40A scale (10mV/Amp)
60A scale (10mV/Amp)
@ DC
Each channel input is referenced to
common ground input (GND—black banana
jack)
Continuous sampling,
MSPS = mega samples per second
Channel 1–4
Connect Low amp Probe (+) to Ch. 1
(yellow banana jack) and (–) to GND input
(black banana jack).
See NOTE below.
Table 8-2 Graphing Multimeter
Function Range Accuracy/Comments
Ch. 1—yellow banana jack
Signal Measurement
Sample Rate 1.5 MSPS
Bandwidth DC–3 MHz 3 db point @ 3 MHz
Input Impedance
VDC (Full Scale) 75VDC Do not measure greater than 75VDC
VAC (Full Scale) 50VAC Do not measure greater than 50VAC (rms)
Ohm Measurement
Diode Test
Continuity Test
Ohms 40 Ohm–4 MOhm Fixed scales
Low Amp Probe
Table 8-3 Digital Multimeter (part 1 of 2)
Function Range Accuracy/Comments
Signal Measurement Ch. 1—yellow banana jack
VDC (Full Scale) 75VDC Do not measure greater than 75VDC
VAC (Full Scale) 50VAC Do not measure greater than 50VAC (rms)
Signal Measurement
Input Impedance
Ch. 2—green banana jack
Ch. 3—blue banana jack
Ch. 4—red banana jack
10 MOhm
4kOhm @ 3MHz
Ch. 3—blue banana jack
Ch. 4—red banana jack
20A scale (100mV/Amp)
40A scale (10mV/Amp)
60A scale (10mV/Amp)
10 MOhm
@ DC
Each channel input is referenced to
common ground input (GND—black banana
jack)
Continuous sampling,
MSPS = mega samples per second
Channel 1–4
Connect Low amp Probe (+) to Ch. 1
(yellow banana jack) and (–) to GND input
(black banana jack).
See NOTE below.
Channel 1 input is referenced to common
ground (GND—black banana jack)
73
Page 81

Scope Multimeter Operations Getting Started
NOTE:
IMPORTANT:
IMPORTANT:
Table 8-3 Digital Multimeter (part 2 of 2)
Function Range Accuracy/Comments
Ohm Measurement
Diode Test
Continuity Test
Ohms 40 Ohm–4 MOhm Fixed scales or Auto Ranging
Glitch capture Approximately 50 uS
Diode Test 2 V Scale
Ch. 3—blue banana jack
Ch. 4—red banana jack
i 200V to 400V scales are not to be used to measure signals greater than 50VAC (rms) or 75VDC.
Do not use the Low Amp Probe to measure current on conductors at a potential gr eater than
46V AC pe ak or 70VDC.
8.2.2 Leads, Probes and Adapters
The Scope Multimeter uses standard safety b anana plug s that are compatible with many
accessories. The various leads, probes, clips, and adapters that ar e supplied with, or available as
optional equipment, are explained in this section.
When removing leads from their sockets, do not pull on the wire because it can damage the leads.
Pull on the plug.
Channel 1 Lead
Figure 8-4 Yellow Channel 1 Lead
The shielded yellow lead is used for Channel 1 (Figure 8-4) and other channel connections that
need additional grounding. The lead color matches the color of socket 1 on the Scope Multimeter
and the color of trace 1 on the test screens.
This yellow lead includes a black, right-angle, common ground plug and a b lack, st ackable,
common ground plug. The non-stackable ground plug alwa ys connects to the gro und (GND) jack
on top of the Diagnostic Tool. The stackable ground plug is used for co nnecting a dditional leads,
such as the Channel 2 Lead or the Secondary Coil Adapter Lead, that re quire g rounding . The
stackable lead grounds through the non-stackable lead and does not need to be connected to the
jack on the Diagnostic Tool.
74
Page 82

Scope Multimeter Operations Getting Started
Channel 2 Lead
Figure 8-5 Green Channel 2 lead
The shielded green lead (Figure 8-5) is used for Channel 2. The lead color matches the color of
socket 2 on the Scope Multimeter and the color of trace 2 on the test screens. This green lea d
includes a stackable, black, right-angle ground p lug.
Channel 3 Lead
Figure 8-6 Blue Channel 3 lead
The non-shielded blue lead (Figure 8-6) is used for either Channel 3 or Digital Meter minus (–).
The lead color matches the color of socket 3 on the Scope Multimeter , as well a s the color of trace
3 on the test screen.
Channel 4 Lead
Figure 8-7 Red Channel 4 lead
The non-shielded red lead (Figure 8-7) is used for either Channel 4 or Digital Meter plus (+). The
lead color matches the color of socket 4 on the Scope Multimeter, as well as the color of tr ace 4
on the test screen.
Alligator Clips
Figure 8-8 Alligator clip
Insulated alligator clips, colored to match each test lead, are included. A black clip for the common
ground lead is also supplied (Figure 8-8). Each clip plugs into the straight end of a channel lead.
75
Page 83

Scope Multimeter Operations Getting Started
Test Probes
Figure 8-9 Test probe
Two test p robes ar e included , one black an d one red (Figure 8-9). The test probes plug into the
straight end of the test leads.
Secondary Coil Adapter Lead (optional)
Figure 8-10 Secondary Coil Adapter lead
The optional Secondary Coil Adapter lead (Figure 8-10) connects to the clip-on secondary wire
adapter , coil-in- cap adapte r or coil-on -plug adap ter to display secon dary wavefor ms.
Secondary Ignition Clip-on Wire Adapter (optional)
Figure 8-11 Secondary Ignition Clip-on Wire Adapter
The optional Secondary Ignition Clip-on Wire Adapter (Figure 8-11) connects the Secondary Coil
Adapter lead to a secondary ignition lead on the vehicle to display ignition patterns.
Inductive RPM Pickup Adapter (optional)
Figure 8-12 Inductive RPM Pickup adapter
The optional Inductive RPM Pickup adapter (Figure 8-12) connects to the scope auxiliary
connector of the Diagnostic Tool with a DB9F plug. It can be used to trigger a waveform or display
RPM. With the Ignition Scope, the RPM Pickup connects to cylinder number one to est ablish the
firing order.
76
Page 84

Scope Multimeter Operations Getting Started
Low Amp Current Probe (optional)
The optional Low Amp Current Probe provides accura te and reliabl e non- intrusive testing of
ignition coils, fuel injectors, fuel pumps, relays, electric motors, and parasitic draw . The optional
Low Amp Current Probe measures current from 10 mA to 60 Amps.
Figure 8-13 Low Amp Current Probe
8.2.3 Menu Options, Scope Multimeter
The Menu icon on the Toolbar at the base of the screen opens a menu with the following options:
• Safety Information—opens the Important Safety Instructions document.
• File—allows you to print or save the data or meter setup being viewed.
• Setup—allows you to adjust certain tool settings once a te st has bee n selected.
• Help—allows you to view supporting documentation.
File
Use to print or save a copy of the data currently being viewed. Selecting opens a submenu:
• Save Multimeter—opens an additional submenu with these options:
– Save Configuration—saves the current screen setup as a preset for quick access.
– Save Single Frame—saves a recording of the current screen.
– Save All Frames—saves a recording of the current screen plus all the data in the buffer.
• Print—opens a standard Windows Print dialog box for printing the current screen.
Setup
This option allows you to adjust tool settings to your personal prefer ences. Selecting opens a
menu of the following:
• Unit Setup—opens the Unit Setup dialog box to adjust trace and display settings
• Snapshot—opens the Snapshot dialog box for selecting how triggered dat a is sa ved.
• Ignition—opens the Ignition dialog box for setting up to display secondary ignition patter ns.
77
Page 85

Scope Multimeter Operations Navigation
Help
A variety of utilities and additional resources are available through the Help menu:
• User Manual
• Vers ion Info
• Activation Status
• Scope About
The User Manual, V ersion Info , and Activati on Status options are the same as explained
previously, see Menu Options on page 13 for details.
Scope About
This option opens a dialog box that cont ains the sof tware version and other specific det ails about
the Scope module.
8.3 Navigation
The following section describes how to navigate the screen interface.
8.3.1 Screen Layout
The screens typically include the following sections (Figure 8-14):
• Scope Multimeter T oolbar—allows you to co nfigure the tool for the type of test and to adjust
the settings for each channel, or trace.
• Main Body of the screen—displays test results. Options on the toolbar let you select h ow
tests display on the screen.
• Trace De t ails—displays trace settings, which can be adju sted or switched through the touch
screen.
• Record/Playback Control T oolbar—allows you to record and navigate th rough paused data.
1— Scope Multimeter Toolbar
2— Main body
3— Trace Details
4— Record/Playback Control Toolbar
Figure 8-14 Scope Multimeter screen layout
78
Page 86

Scope Multimeter Operations Navigation
Scope Multimeter Toolbar
The Scope Multimeter toolbar is used to set up the too l for testing and to configure the settings for
each trace. Table 8-4 on page 79 gives brief descriptions of the control icons on the toolbar:
Table 8-4 Scope Multimeter toolbar icons
Name Icon Description
Back Returns to the previously viewed screen.
Setup
Data
Cursors
Refresh
File
Print
Power Off
Main Body of the Screen
Opens a dialog box that allows you to select
personal preferences for viewing and saving data.
Switches the trace information displayed at the base
of the screen between three available states.
Opens a dialog box that allows you to switch cursors
on and off, and to reposition them on the screen.
Clears the Min/Max and Current values on the trace
details section of the screen.
Opens a dialog box that allows you to select options
for saving data.
Opens a dialog box that allows you to configure and
print data.
Switches the Scope Multimeter off. This retains the
settings and reduces battery drain when switching to
a different module. The Play and Record icons on the
Playback toolbar switch the meter back on.
The main body of the screen varies depending on what display options have been selecte d. Up to
four traces, along with digital readout s of curre nt signal va lues, signal st a tus and tr iggering
conditions, can be displayed simultaneously on the main body of the screen. Adjustments to the
display are made through the scope toolbar as explained above.
Each trace is displayed as voltage over time on a standard oscilloscope screen. V olt age level is
recorded on the vertical, or “y”, axis and time is presented on th e horizontal, or “x”, axis of the
screen. V a lues are sho wn for each g raduati on on the scales.
When using transducers, the pressure bein g sensed by the transducer is converted into a voltage
signal. However, the values are shown as pressure on the display screen rather than voltage.
79
Page 87

Scope Multimeter Operations Navigation
Trace Details
The Trace Det ails section disp layed at th e base of the screen ca n be used to quickly adjust
settings for capturing the trace. The Tr ace details are accessed using either the Data icon on the
upper toolbar or the T ouch a nd Grow icon on the Playback toolbar. Both icons function the same
and cycle the Trace Det ails selection through three states:
• Displayed—trace settings are displayed in this mode.
• Expanded—trace settings are displayed in a la rger forma t in this mod e.
• Off—trace settings are not displayed in this mode.
Adjustments are made by selecting the item to be changed on the touch scree n. A dash (–)
indicates a function that is not selected, and an icon indicates an active function (Figure 8-15).
1— Peak Detect on
2— Filter on
3— Inverted trace
4— Coupling AC on
5— Sweep setting
6— T rigger setup
7— Trigger set on the rising slope
Figure 8-15 Sample data detail display
80
Page 88

Scope Multimeter Operations Navigation
The following trace adjustments and settings are available:
• Profile—switches the trace for the selected channel on and off.
• Channel—opens a dialog box that allows you to configure the trace setup (see Trace Controls
on page 85 for details).
• Probe—opens a dialog box that allows you to select the type of test probe being used .
• Peak Detect—maximizes the signal sampling rate in order to capture fast events, such as
spikes, glitches and other anomalies, that may normally be undetected .
• Filter—smooths out the trace when the signal is disrupted by noise or other interference.
• Inverted—switches the polarity of the displayed signal.
• Coupling AC—subtracts the average value of the waveform by blocking th e DC portion of an
input signal to amplify the AC portion. This makes small variations in the trace visible.
• Scale—opens a dialog box that allows you to select the scale, which is the total value
displayed on the vertical axis of the display.
• Sweep—the current sweep setting is shown in white at the end of the scale list, selecting
opens a dialog box that adjusts the sweep (see Sweep Controls on page 87 for details).
• Slope—only active when a trigger is set, indicates whether the trigger is set to activate on the
rising or falling slope of the trace. Selecting the slope icon switches the slope. The white dash
at the bottom of the slope column is used to set the trigger, selecting it opens the trigger setup
dialog box (see Trigger Contr ols on pag e 88 for details).
Record/Playback Control Toolbar
The record/playback control toolbar at the base of th e screen is used for r ecording d at a and fo r
reviewing paused data. Use the stylus or your finger tip to activate the icons. A position co unter in
the toolbar displays a numerical value of where the current screen is in relation to the en tire
recorded file.
Use the slider in the middle of the toolbar to quickly move throug h p aused da t a.
Figure 8-16 Sample data buffer slider
Use the toolbar icons (Table 8-5) to more precisely navigate the data.
Table 8-5 Data buffer toolbar icons (part 1 of 2)
Name Icon Description
Snapshot
Step Back Moves to the previous point in the recorded data
Arms the software to take a snapshot of the sampled
data
Back 1 Frame Moves to the previous frame in the recorded buffer
81
Page 89

Scope Multimeter Operations Navigation
Table 8-5 Data buffer toolbar icons (part 2 of 2)
Name Icon Description
Stop Stops recording data
Record Begins recording data
Play Recording
Forward 1 Frame Moves to the next frame in the recorded data
Step Forward Moves to the next point in the recorded data
Position Indicator
Touch and Grow
Zoom
8.3.2 Making Selections
Plays the data recording in a continuous loop at
actual speed
In record mode, indicates how much data is
collected. In playback mode; shows the position of
the buffered data currently displayed as
minutes:seconds:milliseconds of elapsed time
Expands and collapses the Trace Detail area on the
display screen to allow for easier finger tip control
Increases or decreases the magnification of the
graph
Most selections for setting up and operating the scope are made using the stylus and the scope
toolbar . The cursor lines, the trace zero line, and the trigger point indicato r (+) can be repositioned
by selecting and dragging them in the main body of the screen.
There are two basic types of controls on the toolbar:
• Switches
• Dialog boxes
A Switch changes states when selected. Changes happen immed iately as the se lection is made.
A dialog box opens as a separate window on the screen an d typically includ es a number o f
choices. Changes happen immediately, however , th e dial og box must b e closed to return to the
main window and continue. Make a selection to close the dialog box.
82
Page 90

Scope Multimeter Operations Operations
8.4 Operations
This section describes configuring the scope or meter and perform ing test s.
8.4.1 St arting the Scope and Multimeter
Use the following procedure to set up the scope multimeter for performin g test s.
z To start the scope multimeter:
1. Select the Scope Multimeter icon on the Home screen.
The Scope Multimeter main menu, a list of setup options, displays;
– Lab Scope
– Ignition Scope
– Graphing Meter
– Digital Multimeter
– Presets
2. Select from the menu options.
A submenu of scope or meter configuration displays, see below for additional infor mation.
3. Select a configuration and the Scope Multimeter opens.
Presets
Presets are factory configured meter settings for common component tests. Selecting o pens a list
of available setups. Selecting from the list opens the scope multimeter configured to pe rform the
selected test. In addition to the factory presets, you can create your own custom meter
configurations and save them as presets.
Lab Scope Options
The following options are available for testing:
• 4 Channel Lab Scope
• Volt s DC
• Low Amps (20)
• Low Amps (40)
• Low Amps (60)
• Ignition Probe
• 100 PSI V acuu m
• 100 PSI Pressure
• 500 PSI Pressure
• 5000 PSI Pressure
83
Page 91

Scope Multimeter Operations Operations
Ignition Scope Options
The following options are available for testing:
• Parade
• Cylinder
• Raster
• Superimposed
• Single Cylinder Ignition
Graphing Options
The following options are available for testing:
• 4 Channel Graphing
• Volt s DC
• Volt s DC A verage
• Volt s AC RMS
• Ohms
• Frequency
• Pulse Width
• Injector Pulse Width
• Duty Cycle
• Low Amps (20)
• Low Amps (40)
• Low Amps (60)
• MC Dwell (60)
• MC Dwell (90)
• 100 PSI V acuu m
• 100 PSI Pressure
• 500 PSI Pressure
• 5000 PSI Pressure
Digital Multimeter Options
The following options are available for testing:
• Volt s DC
• Volt s DC A verage
• Volt s AC RMS
• Ohms
• Diode/Continuity
• Low Amps (20)
• Low Amps (40)
• Low Amps (60)
84
Page 92

Scope Multimeter Operations Operations
:$51 ,1*
IMPORTANT:
8.4.2 Measurement Out of Range
A group of arrows display when a measurement is out of range for the scale se lected:
• Arrows pointing UP—measurement over maximum range
• Arrows pointing DOWN—measurement under minimum rang e
Volt age mea surements also display arrows in place of live values when the voltage exceeds the
input rating of the meter .
Risk of electrical shock.
• Do not exceed voltage limits between inputs as indicated on the rating label.
• Use extreme caution when working with circuits that ha ve greater than 40 volts AC or
24 volts DC.
Electrical shock can cause personal injury, equipment damage, or circuit damage.
If arrows are displayed in the live voltage values, discontinue circuit te sting.
Correct an out-of-range condition by selecting a scale setting appro priate for th e signal be ing
sampled. See “Trace Controls” on page 85 for more information.
8.4.3 Scope and Multimeter Setup
The following sections explain how to adjust the scope and multimeter for the specific type of
signal being sampled. Most of these setup operations are available from the toolba r.
Trace Controls
The Trace controls are used to adjust individual char acteristics o f how the signal is sampled and
displayed for each of the four traces.
z To adjust trace controls:
1. Select Setup from the Scope Multimeter toolbar.
The Scope Multimeter Preferences dialog bo x opens.
2. Select Traces to open the submenu.
3. Select the trace to be configured from the submenu.
The traces dialog box displays (Figure 8-17).
85
Page 93

Scope Multimeter Operations Operations
1— Trace tabs
2— Trace Probe icon
3— T race Scale icon
4— Trace characteristics check boxes
5— Auto Find icon
6— Baseline position
7— Back icon
8— Exit icon
Figure 8-17 Traces dialog box
4. Select the Trace Probe icon to open the men u.
5. Highlight a probe on the list and select OK to close the window.
6. Select the Trace Scale icon to adjust the ve rtical scale of the displa y.
A dropdown menu opens. Menu options vary depending upon which test lea d is selected.
7. Select a trace scale option, then close the window.
8. Select or deselect the trace characteristic items as needed:
– Displayed—this trace is on screen when checked, and not visible when not checked.
– Inverted—signal polarity is reversed when checked, normal when not checked.
– Coupling AC—check when sampling an AC signal, uncheck for DC signals.
– Peak Detect—use when trying to capture a fast event or signal glitch .
– Filter—use when radio frequency interference (RFI) may be disrupting the signal.
9. The scope samples the signal and internally calculates the b est way to di splay it when Auto
Find is selected. A scale and the vertical position for the zero line of the trace that allows the
whole waveform to fit on the screen is established when Auto Find is selected. If Auto Find is
selected on the trigger channel, it also set s the trigger level halfway between the minimum and
maximum value of the sampled signal to provide a stable waveform.
10. The baseline position is the zero line of the trace, use the slider and arrows to a djust it.
11. Select Back to return to the Preferences dialog box, or select Exit to close the dialog box and
return to the scope.
86
Page 94

Scope Multimeter Operations Operations
Sweep Controls
Sweep is the amount of time represented by the screen, or the horizontal scale of the display.
z To adjust Sweep controls:
1. Select Setup from the Scope Multimeter toolbar.
The Scope Multimeter Preferences dialog bo x opens.
2. Select the Sweep icon to open the sweep dialog box (Figure 8-18)
Figure 8-18 Sample Sweep Setup dialog box
3. Choose an option from the list.
4. Select Back to return to the Preferences dialog box, or select Exit to close the dialog box and
return to the scope.
87
Page 95

Scope Multimeter Operations Operations
Trigger Controls
Triggering allows you to set the scope so that it only begins displaying a trace once predeter mined
signal conditions, or triggers, are met. The trigger point is indicated by a plus sign (+) on the scope
grid. The plus sign can be dragged across the grid with the stylus to roughly position it. The trigger
controls allow you to precisely position the trigger.
z To adjust trigger controls:
1. Select Setup from the Scope toolbar. The Scope Multimeter Preferences dialog box opens.
2. Select Trigger to open the Trigger Setup dialog b ox (Figure 8-19).
3. Use the dialog box controls to set the trigger.
4. Select OK to close the dialog box.
5. Select Back twice to close the Scope Multimeter Preferences dialog box.
1— Source—selects the triggering event:
- Trace 1—sets the trigger to channel 1.
- Trace 2—sets the trigger to channel 2.
- Trace 3—sets the trigger to channel 3.
- Trace 4—sets the trigger to channel 4.
- Cylinder—sets triggering to the firing of a cylinder detected by the optional RPM
Pickup or Secondary Ignition Adapter.
- None—switches triggering off.
2— Mode—sets the method of triggering:
- Auto (automatic)—if a trigger is found, the waveform displays. If a trigger is not found
after about a half second, the waveform and a “trigger not found” message displays.
- Manual—if a trigger is found, the waveform displays. If a trigger is not found nothing
displays (no waveform and no message).
3— Slope—sets triggering to the rising (top icon) or falling (lower icon) slope of the signal
waveform.
4— V ertical position—moves the trigger position up and down on the gr id.
5— Horizontal position—moves the trigger tim ing l ef t and rig ht on the gr id
6— Select Back to return to the Preferences dialog box, or select Exit to close the dialog box
and return to the scope.
Figure 8-19 Trigger controls
88
Page 96

Scope Multimeter Operations Operations
View Controls
Use the view controls to set display attributes.
z To adjust view controls:
1. Select Setup from the Scope Multimeter toolbar.
The Scope Multimeter Preferences dialog bo x opens.
2. Select View to open a submenu.
3. Select an option from the submenu dialog box. Option details are explained below.
Four options are available on the submenu:
– Display—use to adjust what information displays and how it appears
– Layout—use to set how many traces display and how they display on the screen
– Units—use to adjust time and voltage interval settings
– Back— use to return to the Preferences dialog box, or select Exit to close the dialog box
and return to the scope.
Display Settings
Selecting Display from the View submenu opens the Display di alog box ( Figure 8-20).
Figure 8-20 Sample Display dialog box
89
Page 97

Scope Multimeter Operations Operations
The following options are available from the Display dialog box:
• Show RPM—adds an engine speed field at the top of the scr een ( Figure 8-21).
Figure 8-21 Sample Show RPM selected
• Show Digital KV—available only in ignition scope, displays digital kilovolt readings, rather
than waveforms, on the screen (Figure 8-22).
Figure 8-22 Sample Show Digital KV selected
90
Page 98

Scope Multimeter Operations Operations
• Show Grid—switches grid lines on the screen off and on (Figure 8-23).
Figure 8-23 Sample grid selected
• Invert Colors—switches the screen background to white.
Layout Settings
The selected radio knob on the Layout dialog box shows which se tting is active . Use your finger
or the stylus to switch between settings:
• 1 window—shows all traces on the same screen (Figure 8-23).
• 2 windows—shows two separate traces in two ways: horizontal, one b elow another
(Figure 8-24) or vertical, side-by-side (Figure 8-25).
• 3 windows—shows three traces, one below another, on the same screen (Figure 8-26).
• 4 windows—shows four traces, one below another, on the same screen.
Figure 8-24 Sample 2 Windows horizontal display
91
Page 99

Scope Multimeter Operations Operations
Figure 8-25 Sample 2 Windows vertical display
Figure 8-26 Sample 3 Windows display
92
Page 100

Scope Multimeter Operations Operations
Unit Setup
The Unit Setup dialog box allows you to switch between Full Scale or Per Division settings for the
trace setup and the display settings. Selecting Full Scale configur es the unit s to the full viewing
area of the screen, while Per Division adjusts the units to a single di vision ( one tenth) of the
screen.
The selected radio knob on the Units dialog box shows which setting is active. Use your finger or
the stylus to switch between settings (Figure 8-27).
Figure 8-27 Sample View Units dialog box
Setup Controls
Basic tool settings are adjusted here.
z To adjust setup controls:
1. Select Setup from the Scope Multimeter toolbar.
The Scope Multimeter Preferences dialog bo x ope ns
2. Select Setup from the dialog box.
A submenu of options displays:
– Back—use to return to the Preferences dialog box.
– Units—use to set how measurement values display, US standard or metric.
– Snapshot—use to adjust the percentage of data captured following a trigger event.
– Ignition—use to configure the ignition scope for the test vehicle.
Selecting from the submenu opens a dialog box for that item. Dialog box options for each item
are discussed in the following sections.
3. Make dialog box selections as needed.
4. Select Exit to close the dialog box and return to th e scope .
93
 Loading...