

Page 1
User Manual
August 2012
EAZ0077L00A Rev. B
Page 2

Trademarks
IMPORTANT:
Snap-on, ShopStre am, and ShopStream Connect, are trademarks of Snap-on Incorporated.
All other marks are trademarks or registered tr ademarks of th eir resp ective hold ers.
Copyright Information
©2012 Snap-on Incorporated. All rights rese rved.
Disclaimer of Warranties and Limitation of Liabilities
The information, specifications and illustrations in this manual are based on the latest information available at the
time of printing. While the authors have taken due care in the p rep ara tion of this manua l, nothing con t ained he rein:
• Modifies or alters in any way the standard terms and cond itions of the purchase, lea se, or rent al agre ement
under the terms of which the equipment to which this m anual relate s was acquired.
• Increases in any way the liability to the customer or to third parties.
Snap-on reserves the right to make changes at any time without notice.
Before operating or maintaining this u nit, please read this ma nual carefully paying extra attention to the safety
warnings and precautions.
Visit our websites at:
http://diagnostics.snapon.com (North America)
www1.snapon.com/diagnostics/uk (United Kingdom)
snapontools.com.au (Australia and New Zealand)
For Technical Assistance Call
1-800-424-7226 (North America)
CALL +44 (0) 845 601 4736 (United Kingdom)
E-mail DiagnosticsUKproductsupport@snapon.com (United King dom)
For technical assistance in all other markets, cont act your selling agent.
ii
Page 3

Safety Information
'$1*( 5
:$51 ,1*
&$87,21
For your own safety and the safety of others, and to prevent damage to the equipment an d
vehicles upon which it is used, it is important that the accompanying Important Safety Instructions
be read and understood by all persons operating, or coming into contact with, the equipment. We
suggest you store a copy near the unit in sight of the operator.
This product is intended for use by properly trained and ski lled pro fessional automo tive
technicians. The safety messages presented throughout this manual are reminders to the
operator to exercise extreme care when using this test instrument.
There are many variations in procedures, techniques, tools, and p art s for servicing vehicles, as
well as in the skill of the individual doing the work. Because of the vast number of test applications
and variations in the products that can be tested with this instrument, we cannot possibly
anticipate or provide advice or safety messages to cover every situation. It is the responsibility of
the automotive technician to be knowledgeable of the system being tested. It is essential to use
proper service methods and test procedures. It is import ant to perform tests in an appropriate and
acceptable manner that does not endanger your sa fety, the safety of others in the work area, the
equipment being used, or the vehicle being tested.
It is assumed that the operator has a thorough underst anding of vehicle systems before using this
product. Understanding of these system principl es and oper ating th eories is nece ssary for
competent, safe and accurate use of this instrument.
Before using the equipment, always refer to and follow the safety messages and app licable te st
procedures provided by the manufacturer of the vehicle or equipment being tested. Use the
equipment only as described in this manual.
Read, understand and follow all safety messag es and instructio ns in this manual, the
accompanying Important Safety Instr uction s, an d on the test equipm ent.
Safety Message Conventions
Safety messages are provided to help prevent personal injury and equipm ent damage. All safety
messages are introduced by a signal word indicating the haza rd level.
Indicates an imminently hazardous situation which, if not avoided, will result in death or serious
injury to the operator or to bystanders.
Indicates a potentially hazardous situation which, if n ot avoided, could result in death o r serious
injury to the operator or to bystanders.
Indicates a potentially hazardous situation which, if not a voided, may r esult in modera te or mino r
injury to the operator or to bystanders.
iii
Page 4

Safety Information Important Safety Instructio ns
:$51 ,1*
Safety messages contain three different type styles.
• Normal type states the hazard.
• Bold type states how to avoid the hazard.
• Italic type states the possible consequences of not avoid ing th e hazard.
An icon, when present, gives a graphical description of the potential hazard.
Example:
Risk of unexpected vehicle movement.
• Block drive wheels before performing a test with engine running.
A moving vehicle can cause injury.
Important Safety Instructions
For a complete list of safety messages, refer to the accomp anyin g Important Safety Instructions.
SAVE THESE INSTRUCTIONS
iv
Page 5

Contents
Safety Information..................................................................................................................... iii
Contents....................................................................................................................................... i
Chapter 1: Using This Manual................................................................................................... 1
Conventions.................................................................................................................................. 1
Bold Text................................................................................................................................ 1
Symbols ................................................................................................................................. 1
Terminology ........................................................................................................................... 1
Notes and Important Messages............................................................................................. 2
Hyperlinks .............................................................................................................................. 2
Procedures............................................................................................................................. 2
Chapter 2: Introduction.............................................................................................................. 3
Display Device............................................................................................................................. 3
Functional Description ......................... ... ... .... ... ... ....................................... ... ... ... .... ... ... ... ..... 3
Technical Specifications ........................................................................................................5
Power Sources....................................................................................................................... 6
Scan Module..................... ... ....................................... ... .... ... ... ... .......................................... ... ..... 7
Functional description.................................... ... ....................................... ... ... ... ... .... ... ........... 7
Technical Specifications ........................................................................................................8
Power Sources....................................................................................................................... 8
Scope Multimeter Module............................................................................................................. 9
Functional Description ......................... ... ... .... ... ... ....................................... ... ... ... .... ... ... ... ..... 9
Technical Specifications ...................................................................................................... 10
Power Sources..................................................................................................................... 10
Chapter 3: Getting Started....................................................................................................... 11
Powering Up............................................................................................................................... 11
Module Buttons.................................................................................................................... 11
Toolbar................................................................................................................................. 13
Windows Toolbar .................................................................................................................16
Powering Down .......................................................................................................................... 17
Emergency Shutdown.......... ... ... ... .... ... ... ... ....................................... ... .... ... ... ... ... ................ 17
Chapter 4: Navigation .............................................................................................................. 18
Controls and Features................................................................................................................ 18
Control Buttons .................................................................................................................... 18
LEDs .................................................................................................................................... 19
The Stand ........................................................................................................................... 19
Camera Operation...................................................... ... .... ...................................... ... .... ... ......... 19
Chapter 5: Scanner Operations............................................................................................... 21
Getting Started ........................................................................................................................... 21
The Demonstration Program................................................................................................ 21
Disconnecting the Diagnostic Platform From a Vehicle....................................................... 22
i
Page 6

Contents
Vehicle Identification................................................................................................................... 23
Alternative Vehicle Identification.......................................................................................... 25
Connecting to a Vehicle.............................................................................................................. 26
Cables.................................................................................................................................. 26
No Communication Message............................................................................................... 27
Navigation................................................................................................................................... 27
Scanner Screen Layout ............................. .... ... ... ... ....................................... ... ... .... ... ... ... ... 27
Screen Messages ................................................................................................................ 30
Making Selections................................................................................................................ 30
Operations.................................................................................................................................. 30
Data Display......................................................................................................................... 32
Codes Menu..... .... ...................................... .... ... ... ... .... ... ...................................... .... ... ... ...... 36
Functional Tests... ... ... ... .... ... ... ... ....................................... ... ... .... ... ... ... ................................ 39
Generic Functions................................................................................................................ 40
Troubleshooter..................................................................................................................... 41
Scanner Toolbar Operations......... .... ... ... ... .... ... ....................................... ... ... ... ... .... ... ......... 42
Exiting the Scanner .................................................................................................................... 48
Downloading Firmware...............................................................................................................49
Chapter 6: OBD Direct Operations.......................................................................................... 52
OBD Health Check..................................................................................................................... 52
Global OBD II Code Check..................................... ....................................... ... ... .... ... ... ... ... 53
Global OBD II Clear Codes........... .... ... ... ....................................... ... ... .... ... ... ... ................... 54
Readiness Monitors ............................................................................................................. 54
MIL Status............................................................................................................................ 54
OBD Diagnose............................................................................................................................ 55
Start Communication ........................................................................................................... 55
Select Communication Protocol........................................................................................... 58
Connector Information ......................... ... ... .... ... ....................................... ... ... ... ... .... ... ......... 59
Chapter 7: Component Test Operations ................................................................................ 60
Vehicle Identification................................................................................................................... 60
Creating a Favorites List................................... ... ... .... ...................................... ... .... ... ......... 61
Identifying a Test Vehicle..................................................................................................... 62
Operations.................................................................................................................................. 64
Component Information ....................................................................................................... 64
Tests .................................................................................................................................... 65
Chapter 8: Scope Multimeter Operations............................................................................... 69
Remote Scope Multimeter Setup................................................................................................ 69
Getting Started ........................................................................................................................... 70
Capabilities .......................................................................................................................... 71
Leads, Probes and Adapters ............................................................................................... 72
Navigation................................................................................................................................... 75
Screen Layout...................................................................................................................... 75
Making Selections................................................................................................................ 79
Operations.................................................................................................................................. 79
Starting the Scope and Multimeter....................................................................................... 79
Scope and Multimeter Setup................................................................................................ 81
ii
Page 7

Contents
Chapter 9: Ask-a-Tech Operations ......................................................................................... 93
Ask-a-Tech Tips ...................................... ... ... ... .... ... ... ... ....................................... ... ... .... ............ 93
Launching Ask-a-Tech................... ... ... .... ...................................... .... ... ... ... .... ... ......................... 94
Ask-a-Tech Home Page.......................... ... ... ... .... ... ... ... ....................................... ... ... .... ... ... ... ... 94
Ask-a-Tech Pulse . ... ... ....................................... ... ... .... ... ... ... ....................................... ... ... ... 95
What Do You Want To Do? ................................................................................................. 96
Chapter 10: Information Operations..................................................................................... 100
Chapter 11: Vehicle History Operations............................................................................... 101
Screen Layout .......................................................................................................................... 101
Vehicle History Main Body................................................................................................. 101
Vehicle History Toolbar...................................................................................................... 102
Chapter 12: Data Manager Operations ................................................................................. 106
Screen Layout .......................................................................................................................... 106
Navigation................................................................................................................................. 107
Operations................................................................................................................................ 107
My Data.............................................................................................................................. 107
Up ...................................................................................................................................... 108
Open .................................................................................................................................. 108
New.................................................................................................................................... 108
Delete................................................................................................................................. 109
Rename ............................................................................................................................. 110
Save................................................................................................................................... 111
Properties........................................................................................................................... 111
More................................................................................................................................... 112
Saved File Structure................................................................................................................. 112
Chapter 13: Help Operations................................................................................................. 113
Using the Help Toolbar.................................. ....................................... ... ... .... ... ... ... ................. 113
Chapter 14: System Settings Operations............................................................................. 114
Paired Devices ........................................... ....................................... ... ... ... .... ... ... .................... 114
Pairing the Scan Module.................................................................................................... 115
Shop Information...................................................................................................................... 116
Chapter 15: Maintenance....................................................................................................... 118
Display Device.......................................................................................................................... 118
Cleaning the Touch Screen ............................................................................................... 118
Calibrating the Touch Screen ............................................................................................ 118
Cleaning and Inspecting the Display Device...................................................................... 121
Battery Service...................................................................................................................121
Operating System Restore ... ... ... ....................................... ... ... .... ... ... ... .............................. 124
Scan Module..................... ... ....................................... ... .... ... ... ... ... ........................................... 125
Cleaning and Inspecting the Scan Module ........................................................................ 125
Replacing the Protective Handgrip.......................................... .... ... ... ... .... ... ...... ... .... ... ... ... . 125
Software License Agreement, North America ................................. ... ... .... .......................... 126
Index............................. ....................................... ... ....................................... ... ....................... 131
iii
Page 8

Chapter 1 Using This Manual
This manual contains tool usage instructions.
Some illustrations shown in this manual may contain modules and optional equipment that are not
included on your system. Contact your sales representative for availability of other modules and
optional equipment.
1.1 Conventions
The following conventions are used.
1.1.1 Bold Text
Bold emphasis is used to highlight selectable items such as buttons and menu options.
Example:
• Press the OK button.
1.1.2 Symbols
Different types of arrows are used. The “gre ater than” arrow ( >) indicates an abbrevia ted set of
selection instructions.
Example:
• Select Utilities > T ool Setup > Date.
The example statement abbreviates the followin g procedur e:
1. Navigate to the Utilities screen.
2. Highlight the Tool Setup submenu.
3. Highlight the Date option from the submenu.
4. Press OK to confirm the selection.
The solid arrows (
Example:
• Press the down arrow.
1.1.3 Terminology
The term “select” means highlighting a button or menu item and pre ssing the Accept, OK, Y es, or
other similar button to confirm the selection.
Example:
• Select Reset.
, , , ) refer to the four directions of th e dire ctional arr ow keys.
1
Page 9

Using This Manual Conventions
NOTE:
IMPORTANT:
IMPORTANT:
The above statement abbreviates the following procedu re:
1. Navigate to and highlight the Reset selection.
2. Press the OK, or similar, button.
1.1.4 Notes and Important Messages
The following messages are used.
Notes
A NOTE provides helpful information such as additional explanations, tips, and comment s.
Example:
i For additional information refer to...
Important
IMPORTANT indicates a situation which, if not avoided, may result in damage to the test
equipment or vehicle.
Example:
Do not disconnect the data cable while the Scanner is commun icating with the ECM.
1.1.5 Hyperlinks
Hyperlinks, or links, that take you to other related articles, procedures, and illustrations are
available in electronic documents. Blue colore d text indicates a select ab le hyperli nk.
Example:
Read all applicable Safety Information before using this tool!
1.1.6 Procedures
An arrow icon indicates a procedure.
Example:
z To change screen views:
1. Select the View button.
The dropdown menu displays.
2. Select an option from the menu.
The screen layout changes to the format selected.
2
Page 10
Chapter 2 Introduction
The Diagnostic Platform is a specialized personal automotive d iagnostic solution tha t combines
information with test instrumentation to help you diagno se symptoms, co des, and complain t s
quickly and efficiently. There are three main components to the system:
•
Display Device—the central processor and monitor for the system
•
Scan Module—the device for accessing vehicle data
•
Scope Multimeter Module—the device for sampling circuit s and sign als
This manual describes the construction and operation of th ese three devic es and how th ey work
together to deliver diagnostic solutions.
2.1 Display Device
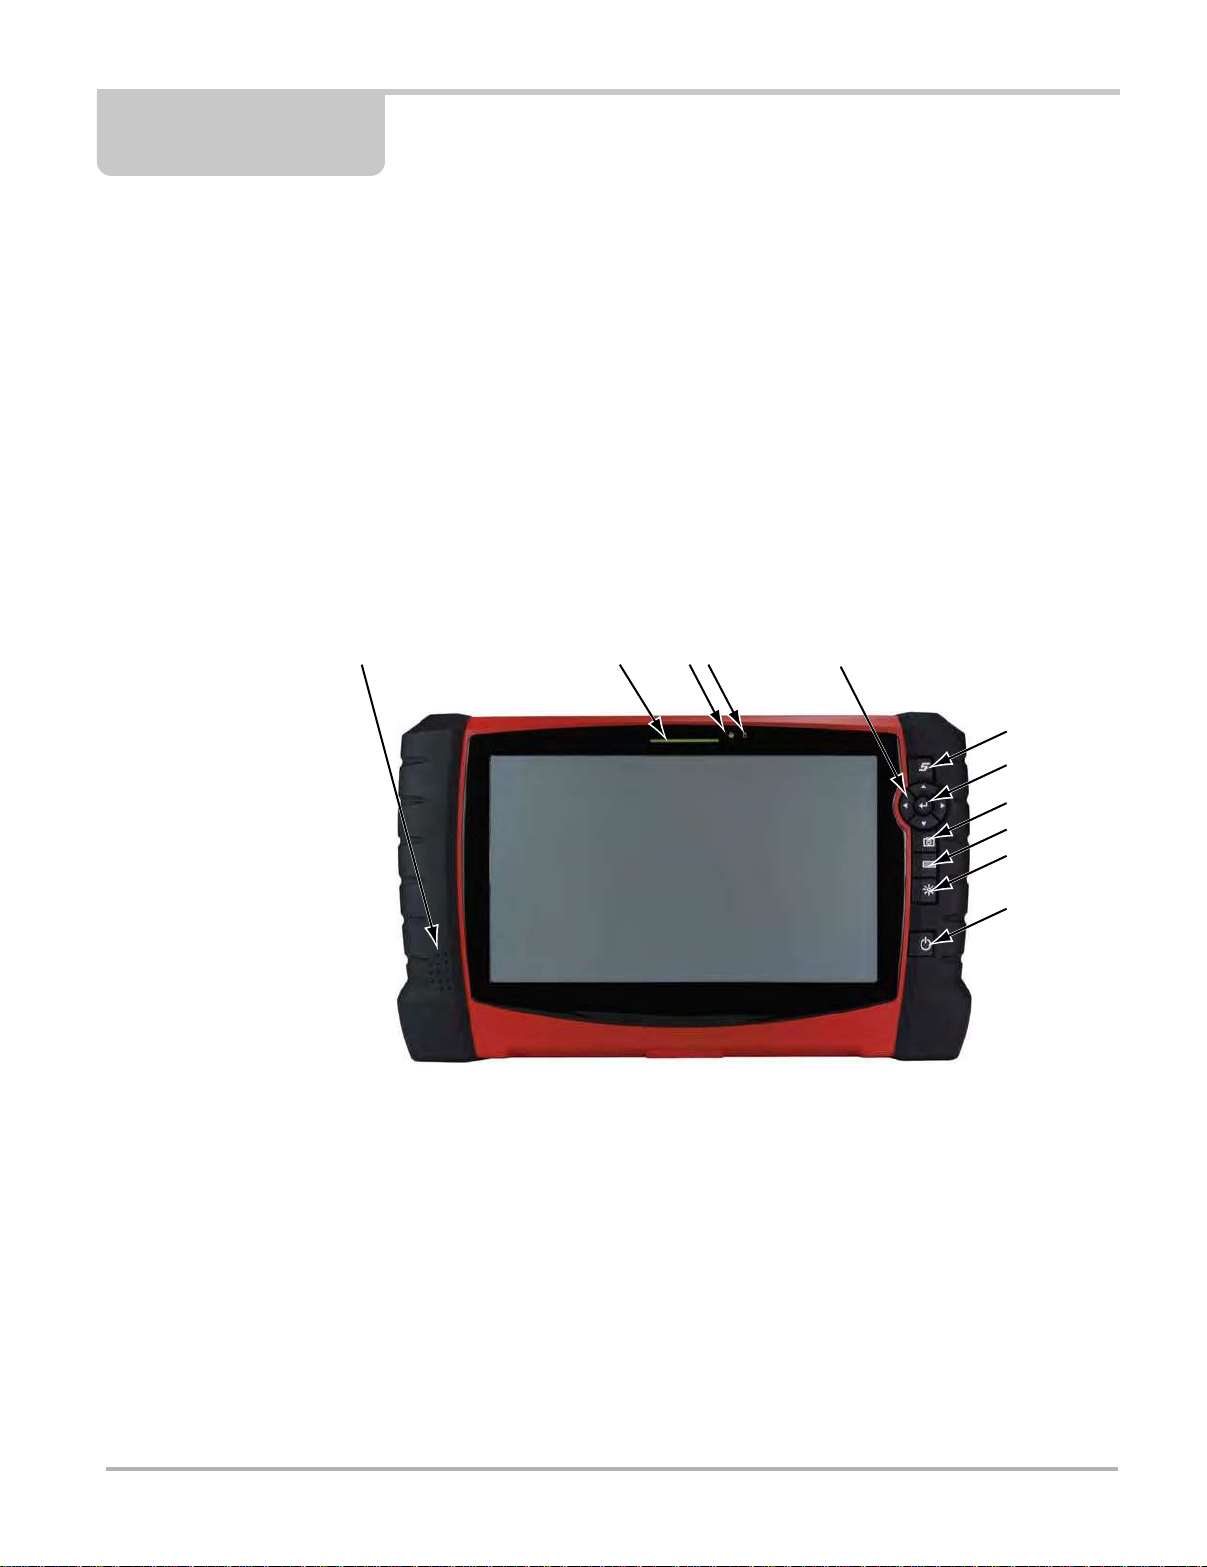
2.1.1 Functional Description
1— Audio Speaker
2— Power Indicator LED (light emitting diode)
3— Microphone
4— Hard Drive Activity LED
5— Directional Buttons; left (
6— S Button (special functions)
7— Enter Button
8— Camera (shutter) Button
9— Virtual Keyboard Button
10—Brightness Button
11—Power Button
), right (), up (), down ()
Figure 2-1 Model D10 front view
3
Page 11
Introduction Display Device
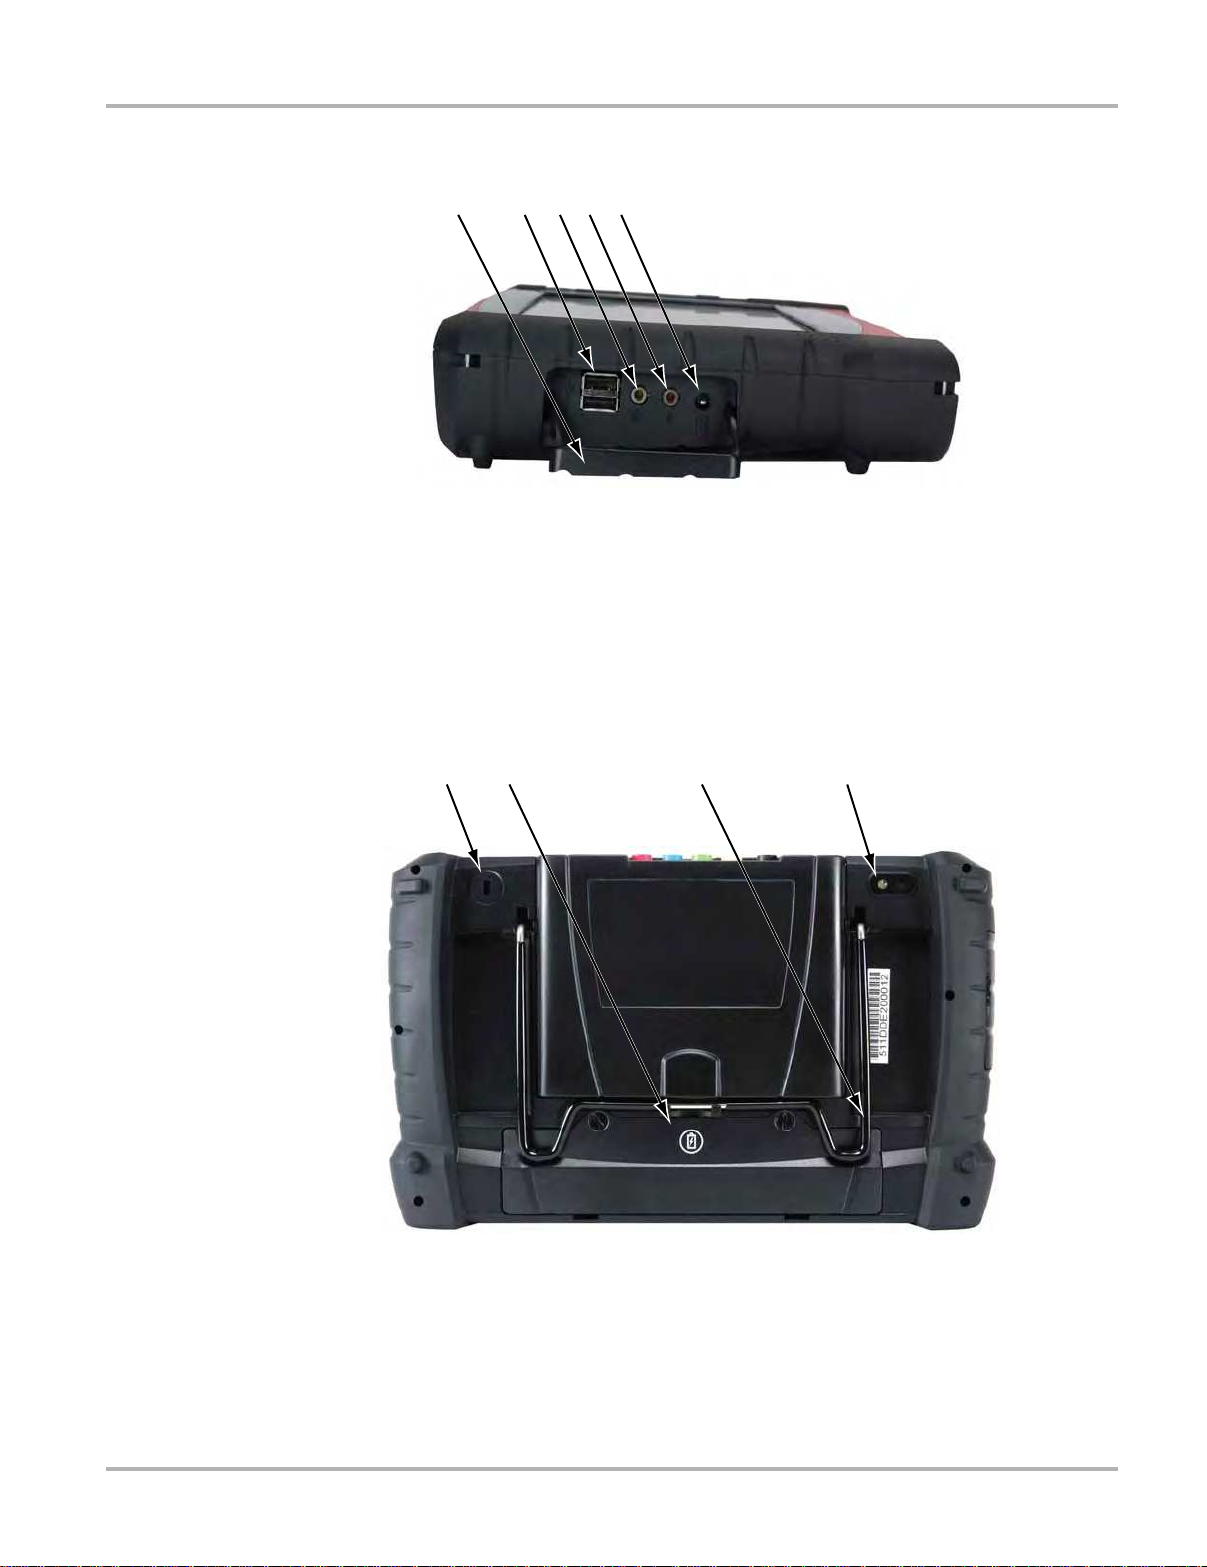
/HIW6LGHRI8QLW
1— Hinged Cover
2— USB (universal serial bus) Ports (2)
3— Head Phone Jack
4— Microphone Jack
5— DC Power Supply Input Port
Figure 2-2 Model D10 side view
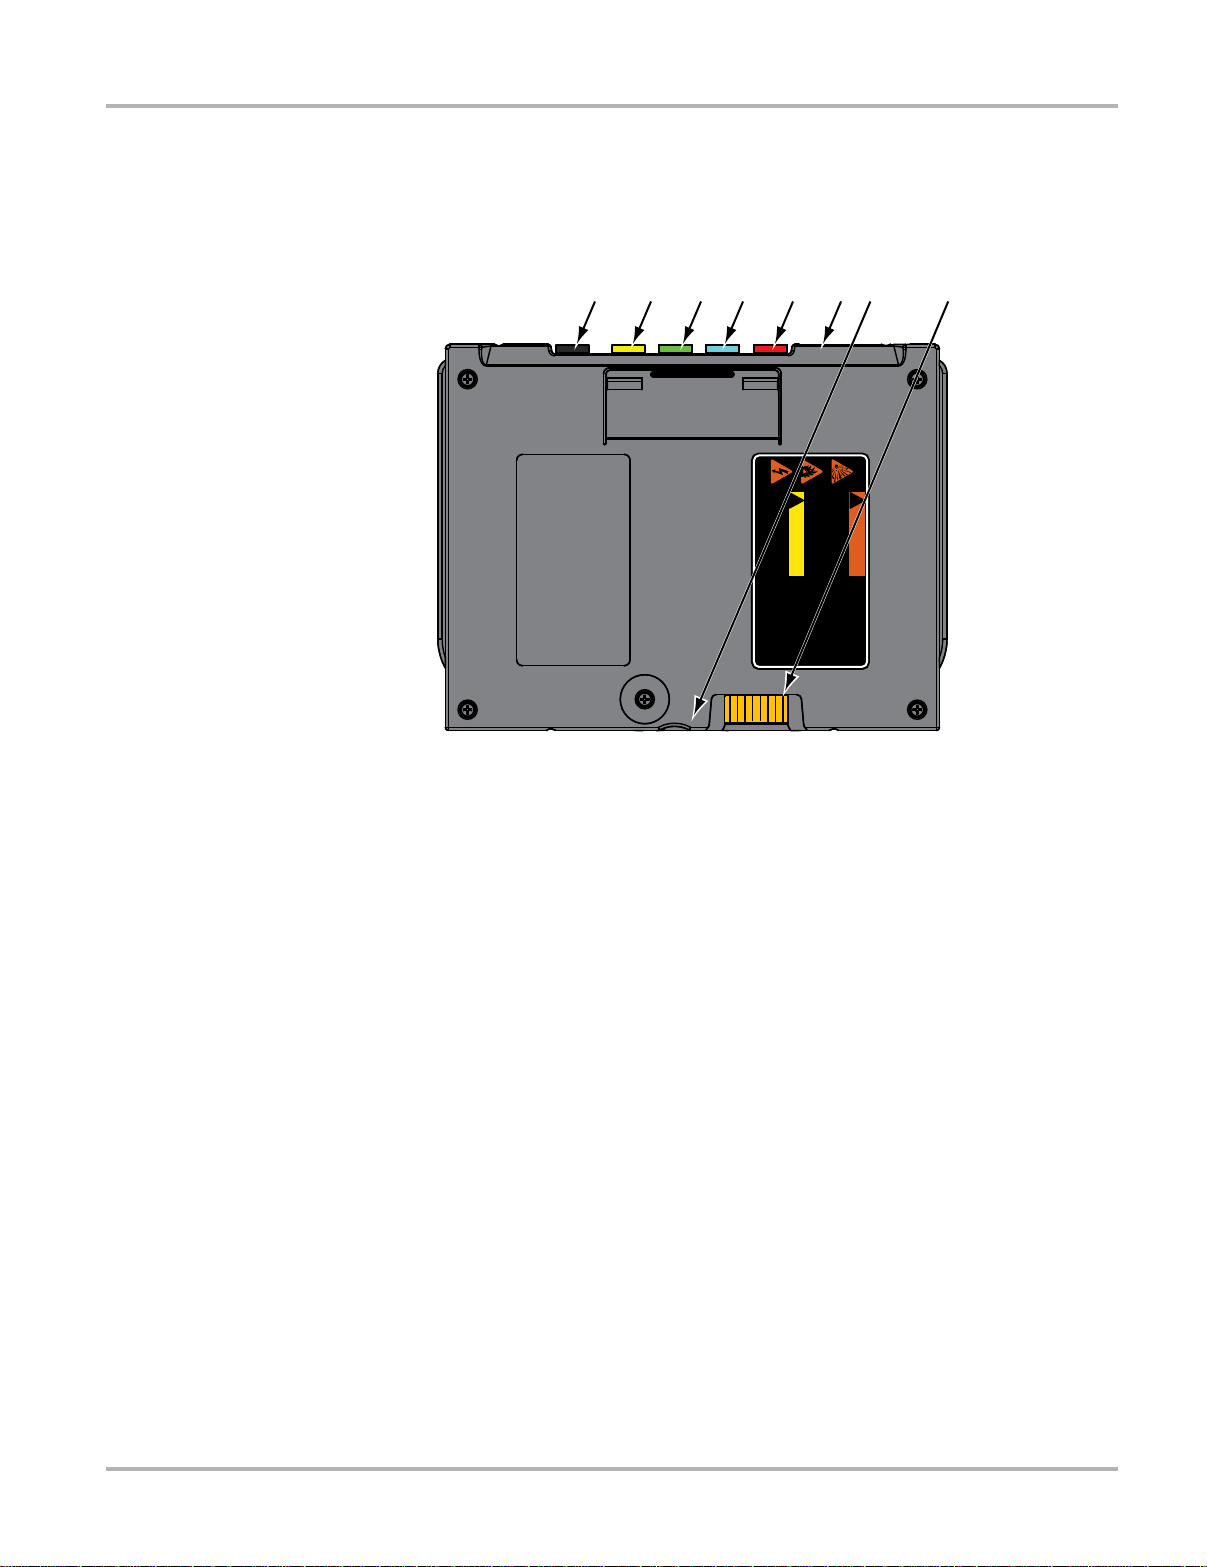
1— Kennsington Lock (standard security device connection, device not included)
2— Battery Compar tment Cove r
3— Collapsible S tand (closed)
4— Camera Lens
Figure 2-3 Model D10 back view
4
Page 12

Introduction Display Device
2.1.2 Technical Specifications
Processor:
Intel Atom Z530P 1.6GHz
Operating System
Microsoft Windows Embedded Standard SP3
T ouc h Screen
Resistive Touch Panel
Display:
10.2 inch diagonal, LCD TFT
1024 x 600 resolution WSVGA
16 bit color
Battery:
Lithium Ion Smart Battery Pack
Approximate 4 hour run time
Approximate 4 hour charge time (with or without unit operating)
DC Jack Operating Voltage
10V to 32V DC
Communications:
802.11 b/g/n Wireless
Bluetooth 2.1 + EDR
Dimensions:
Width:
13.23 inches
336.1 mm
Height:
8.07 inches
205 mm
Depth:
2.41 inches
61.3 mm
Weight (including battery pack and Scope Multimeter Module):
5.1 lbs.
2.31 kg
Weight (including battery pack, without Scope Multimeter Module):
4.5 lbs.
2.04 kg
5
Page 13

Introduction Display Device
Operating Temperature Range (ambient):
At 0 to 90% relative humidity (non-condensing)
32 to 113°F
0 to 45°C
Storage Temperature (ambient):
At 0 to 70% relative humidity (non-condensing)
–4 to 140°F
–20 to 60°C
Environmental Conditions:
This product is intended for indoor use only
This product is rated for Pollution Degree 2 (normal conditions)
Power Supply:
Supply Rating; 19 VDC. 3.42A
2.1.3 Power Sources
Your Display Device can receive power from any of the following sources:
Internal Battery Pack
•
• AC/DC Power Supply
• Vehicle Power
• Docking Cradle (Optional)
Internal Battery Pack
The display unit can be powered from the internal rechargeable ba ttery. A fully charged standard
battery provides sufficient power for about 4.5 hours of continuous operation. A LED on the front
of the unit indicates the battery state of charge.
AC/DC Power Supply
The display unit can be powered from a wall socket using the AC/DC power supply. The AC/DC
power supply also powers the internal battery pack charging process.
V ehicle Power
The display unit can be powered from a standar d 12-volt power port on the test vehicle through a
direct cable connection. The vehicle power cable connects to the DC power supp ly port on the left
side of the display unit.
Docking Cradle (Optional)
The display unit can be powered and operated when inst alled on the optional docking cradle. Th e
docking cradle also powers the internal battery pack charging process and allows USB
connectivity for attaching peripherals. Contact your sale represent a tive for addition al det ails.
6
Page 14
Introduction Scan Module
($//%
5
7RS
)URQW
%RWWRP
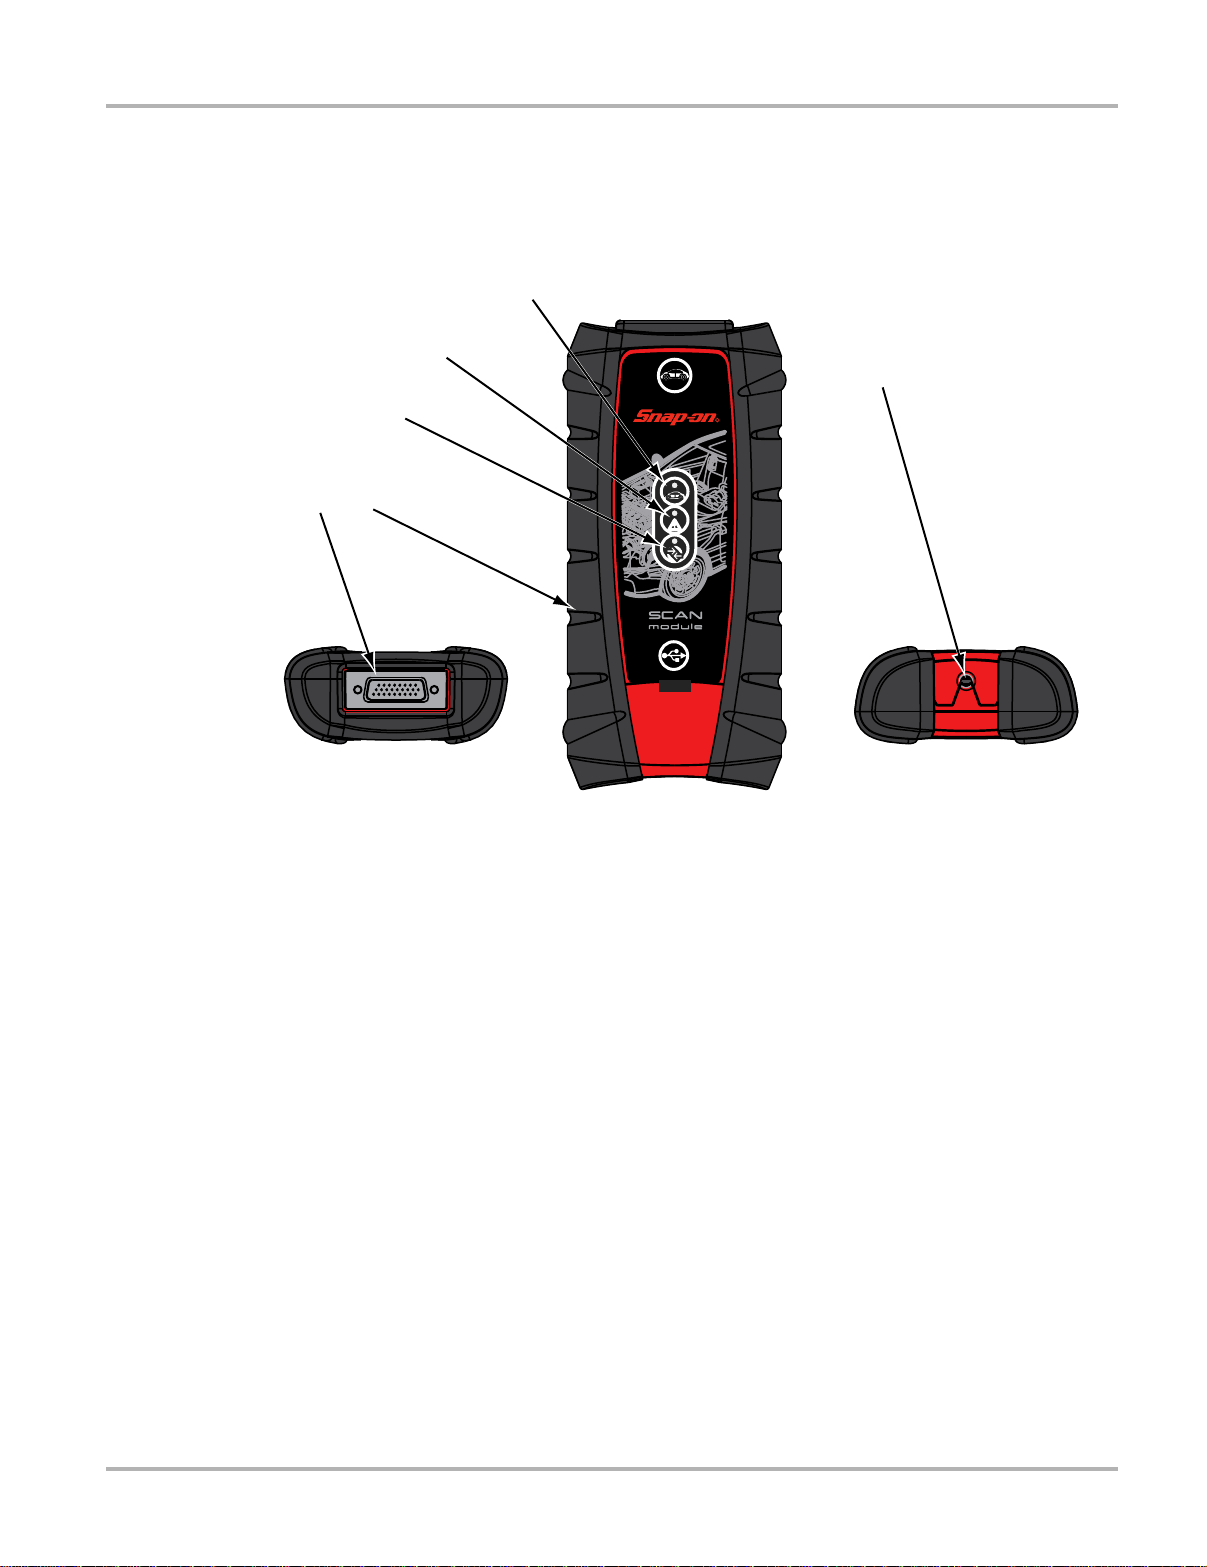
2.2 Scan Module
2.2.1 Functional description
1— Data cable connector
2— Memory card port (remove protective hand grip f or access)
3— Bluetooth LED (green)
4— Communication issue LED (red)
5— V e hicle power L ED (green)
6— Universal serial bus (USB) port (remove prote ctive hand gr ip for access )
Figure 2-4 Scan Module
Wireless Communication
The Scan Module is a wireless communications device that transmits vehicle dat a to th e disp lay
device without a physical connection. The working range of the transmitter is abo ut 30 feet
(9.14 m). A signal lost due to moving out of range automatically restores itself when the display
unit is brought closer to the Scan Module. The Scanner sounds a tone and the Display Device
shows a warning message when the signal is lost.
7
Page 15

Introduction Scan Module
2.2.2 Technical Specifications
Dimensions:
Length:
8.04 inches
204.3 mm
Height:
3.82 inches
97 mm
Depth:
1.66 inches
42.1 mm
Weight (including protective hand grip):
0.9 lbs.
0.408 kg
Communications:
Bluetooth 2.0 Class 1
USB Power:
5V @ 500mA
Data Cable Connector Power:
8V to 32V, Maximum 12 Watts
Operating Temperature Range (ambient):
At 0 to 90% relative humidity (non-condensing)
32 to 113°F
0 to 45°C
Storage Temperature (ambient):
At 0 to 70% relative humidity (non-condensing)
–4 to 140°F
–20 to 60°C
Environmental Conditions:
This product is intended for indoor use only
This product is rated for Pollution Degree 2 (normal conditions)
2.2.3 Power Sources
The Scan Module operates on 12V or 24V vehicle power , which it r eceives through the data cable
connector. The unit powers o n whenever it i s connected to an OBD-II/EOBD comp liant dat a lin k
connector (DLC). For non OBD-II/EOBD compliant vehicles, the unit can be powered from a
suitable power port on the test vehicle using the auxiliary power cable supplied with your kit.
8
Page 16
Introduction Scope Multimeter Module
:$51,1*
&$87,21
5,6.2)(;3/26,21
)/$0$%/()8(/$1'9$3256&$1,*1,7(
7+,6(48,30(17+$6,17(51$/$5&+,1*2563$5.,1*3$576
'2127(;326(72)/$00$%/(9$3256
/2&$7(7+,6(48,30(17$7/($67PP,1&+(6
$%29(7+()/225
5,6.2)(/(&75,&$/6+2&.
'21275(029(&29(525%$&.
1286(56(59,&$%/(3$576,16,'(
5()(56(59,&,1*7248$/,),('6(59,&(3(56211(/
(;3/26,2125)/$0(&$1&$86(,1-85<
(/(&75,&$/6+2&.&$1&$86(,1-85<
2.3 Scope Multimeter Module
2.3.1 Functional Description
1— Common (Ground) Port
2— Channel 1 Port
3— Channel 2 Port
4— Channel 3 Port
5— Channel 4 Port
6— Auxiliary Port (not visible in illustration)
7— USB Port (under protective co ver)
8— Display Device Connection
Figure 2-5 Scope Multimeter Module, removed from Display Device
Remote Operation
The Scope Multimeter Module installs into the Display Device and is held in place by a lock tab.
Depress the lock tab and the Scope Multimeter Module is easily removed from the Display Device.
A USB cable (supplied with your kit) can then be used to connect the Scop e Multimeter Module to
the Display Device. Now, you can continue to remotely monitor ci rcuit activity while moving the
Display Device around the vehicle.
9
Page 17

Introduction Scope Multimeter Module
2.3.2 Technical Specifications
Dimensions:
Length:
6.75 inches
171.5 mm
Height:
5.1 inches
129.5 mm
Depth:
0.89 inches
22.6 mm
Weight (including protective hand grip):
0.66 lbs.
0.30 kg
Operating Temperature Range (ambient):
At 0 to 90% relative humidity (non-condensing)
32 to 113°F
0 to 45°C
Storage Temperature (ambient):
At 0 to 70% relative humidity (non-condensing)
–4 to 140°F
–20 to 60°C
Environmental Conditions:
This product is intended for indoor use only
This product is rated for Pollution Degree 2 (normal conditions)
2.3.3 Power Sources
The Scope Multimeter Module operates on USB power (5V @ 5 00mA) supplie d by the Display
Device. Power is provided either through direct connection to the Display Device, or through a
USB cable when the Scope Multimeter Module is separated from the Display Device.
10
Page 18
Chapter 3 Getting Started
Make sure the Display Device has a charged battery or is connected to an AC/DC power supply
Power Sources on page 8). It is highly recommended to back up personal and saved data to
(see
a USB mass storage device on a regular basis to prevent loss in the event of system corruption or
hard disk drive failure.
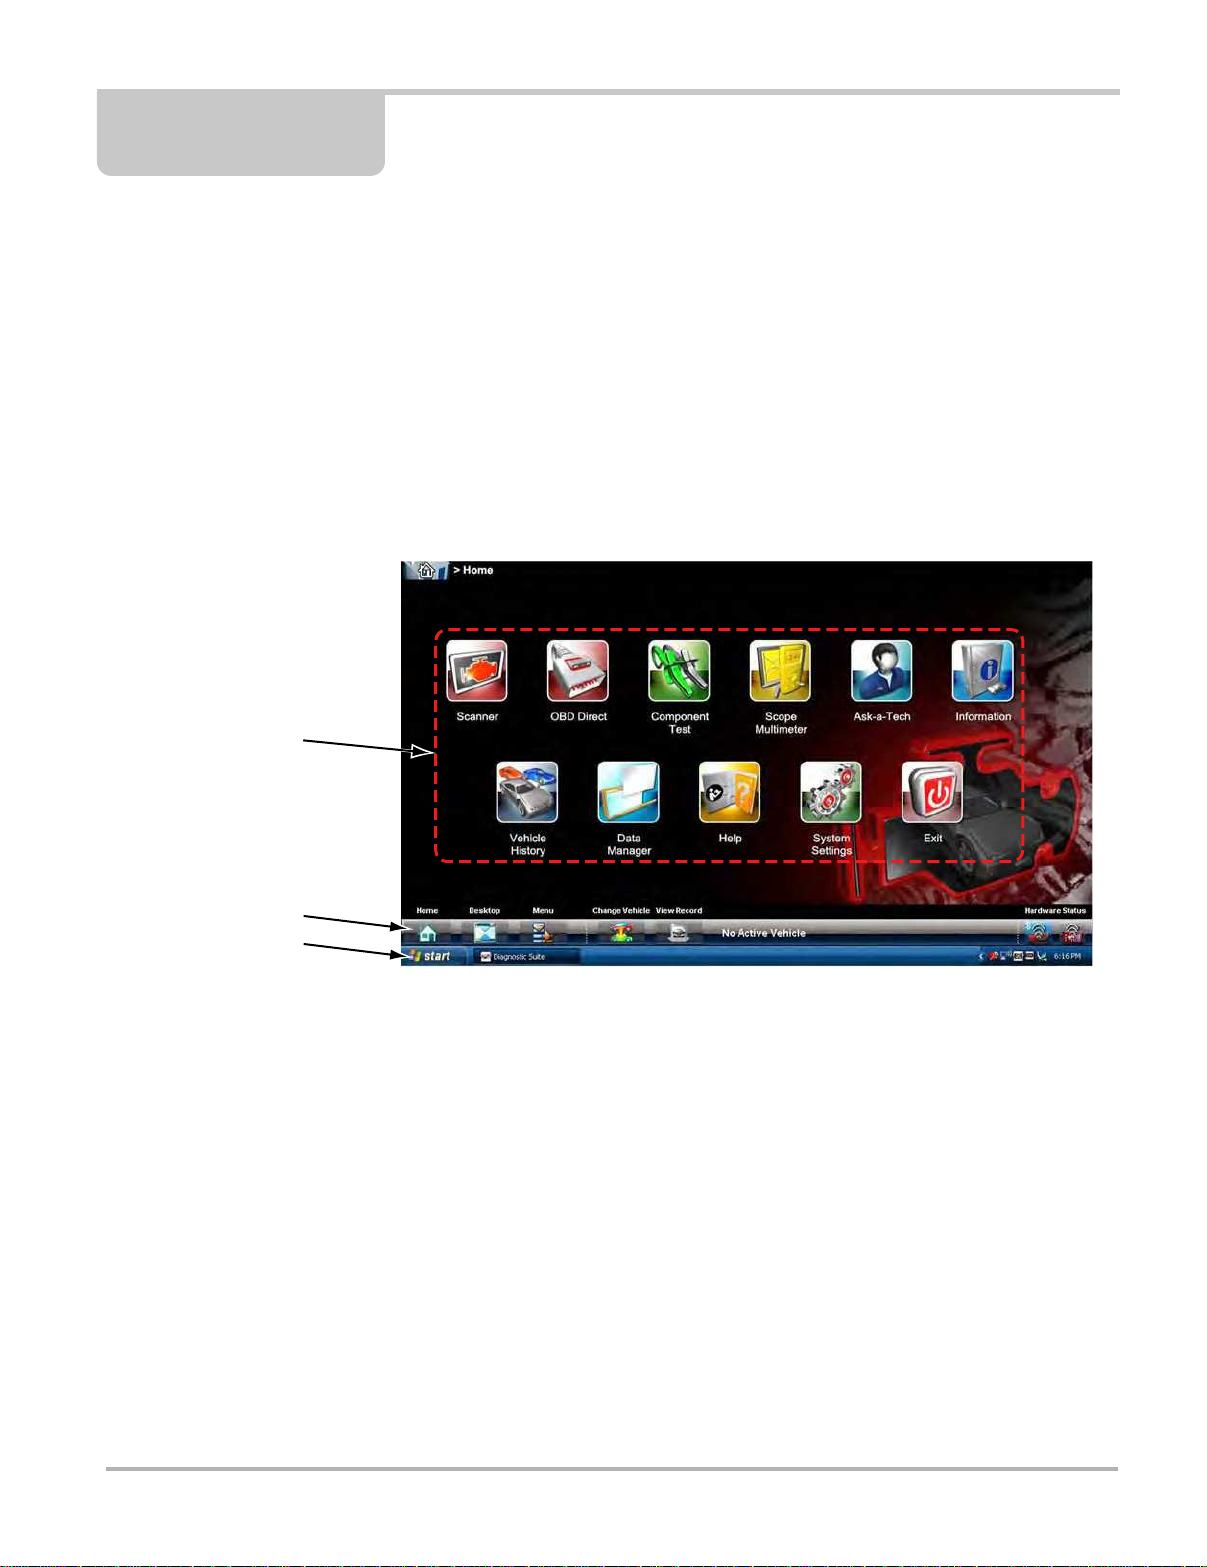
3.1 Powering Up
Press the Display Device Power button to switch the unit on. The system boots up, then opens the
Home screen (
Figure 3-1).
1. Module Buttons
2. Toolbar
3. Windows Toolbar
3.1.1 Module Buttons
The Module buttons configure the Display Device for the type of test to be performed.
page 12 gives brief descriptions of the available Module buttons, which operations ar e available
depends upon the individual configuration of your system. Use the stylus or your finger tip to select
from the Module buttons.
Figure 3-1 Sample Home screen
Table 3-1 on
11
Page 19
Getting Started Powering Up
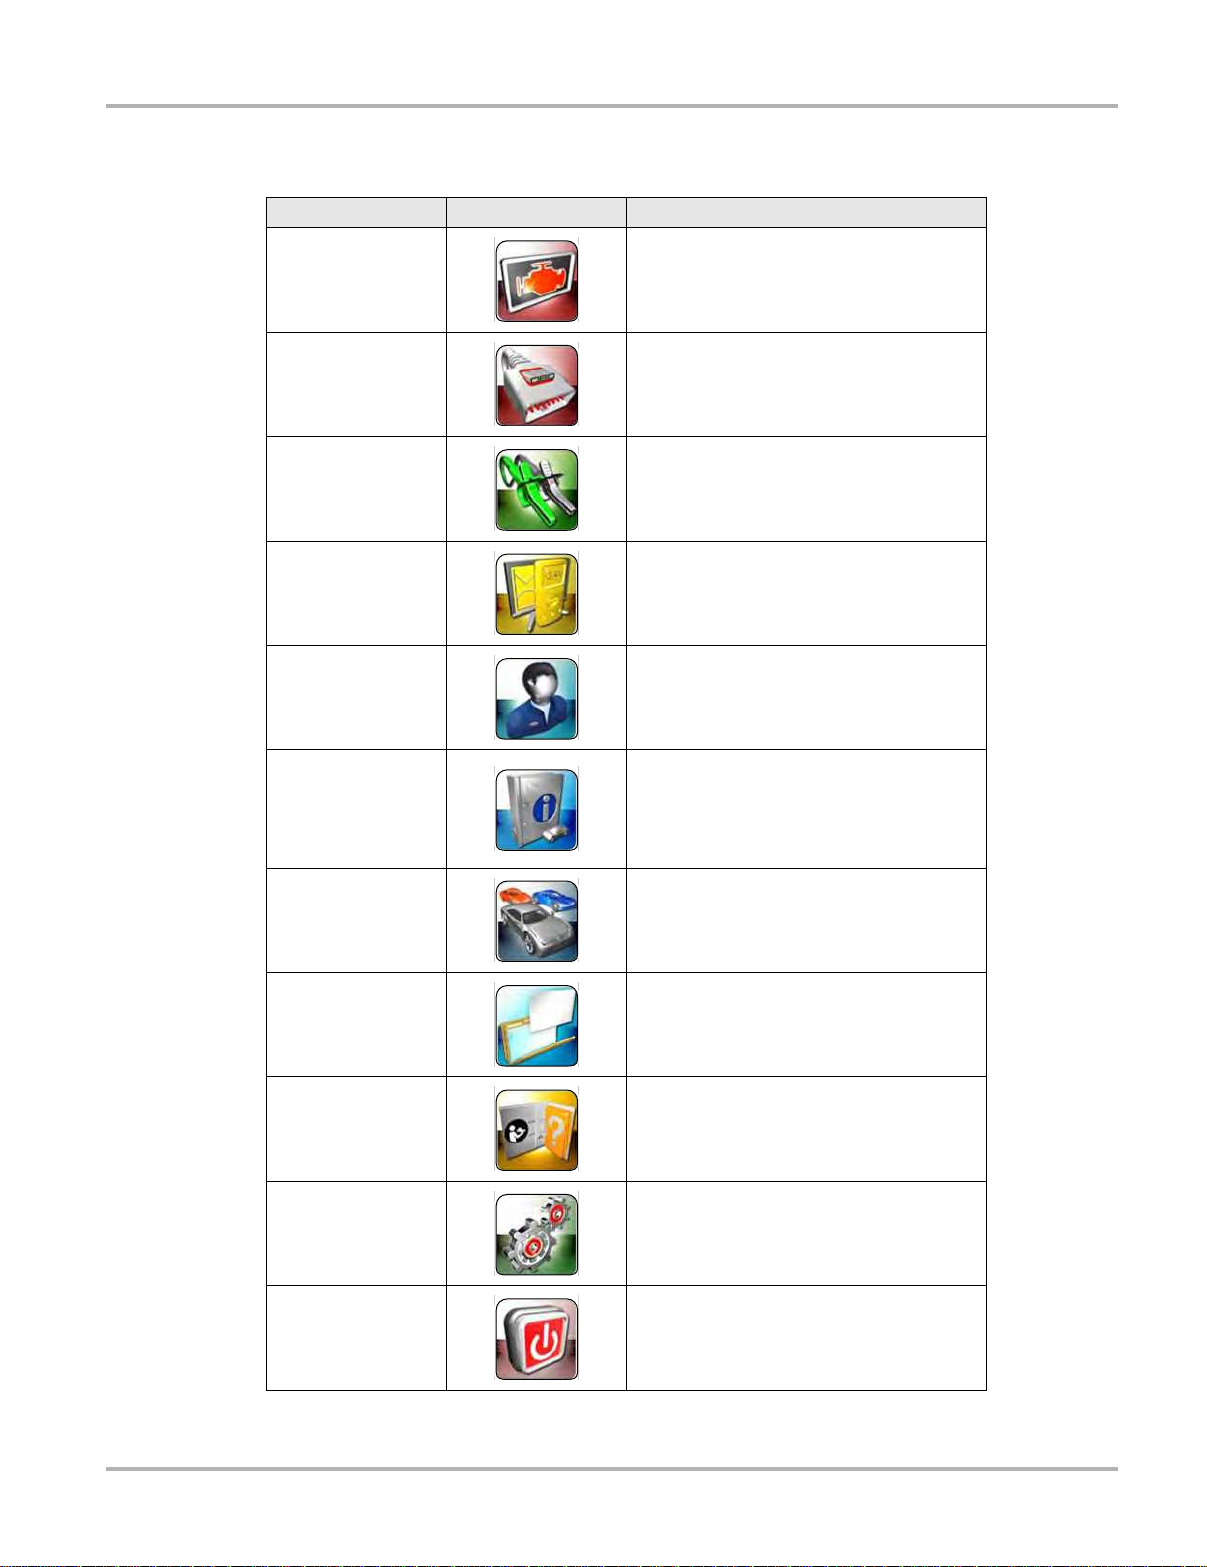
Table 3-1 Module buttons
Name
Button
Description
Scanner
OBD Direct
Component Test
Scope Multimeter
Ask-a-Tech
Information
Configures the unit to operate as a scan
tool. See
Scanner Operations on page 21.
Allows you to perform generic OBD-II or
EOBD system tests without identifying the
specific vehicle. See
Operations
on page 52.
OBD Direct
Opens a diagnostic database of specific
tests for the identified vehicle. See
Component Test Operations on page 60.
Configures the unit to operate as a lab
scope, graphing multimeter, or digital
multimeter. See
Operations
Scope Multimeter
on page 69.
Launches the Ask-a-Tech website. See
Ask-a-Tech Operations on page 93.
Provides the information needed to make
repairs once you have made your
diagnosis. The linked program varies by
region. See
Information Operations on
page 100.
Vehicle History
Data Manager
Help
System Settings
Exit
Identifies the test vehicle and organizes and
manages work in progress and service
records. See
Vehicle History Operations on
page 101.
Opens the organization system for saved
data files. See
Data Manager Operations on
page 106.
Opens the on-line help for the system. See
Help Operations on page 113.
Establishes and manages wireless
connections to peripheral devices, such as
the Scan Module. See
Operations
on page 114.
System Settings
Closes the diagnostic Platform software and
returns the display to the Windows desktop.
See
Powering Down on page 17.
12
Page 20
Getting Started Powering Up
3.1.2 Toolbar
Operation of the buttons located on the toolbar are describe d in the t ab le below:
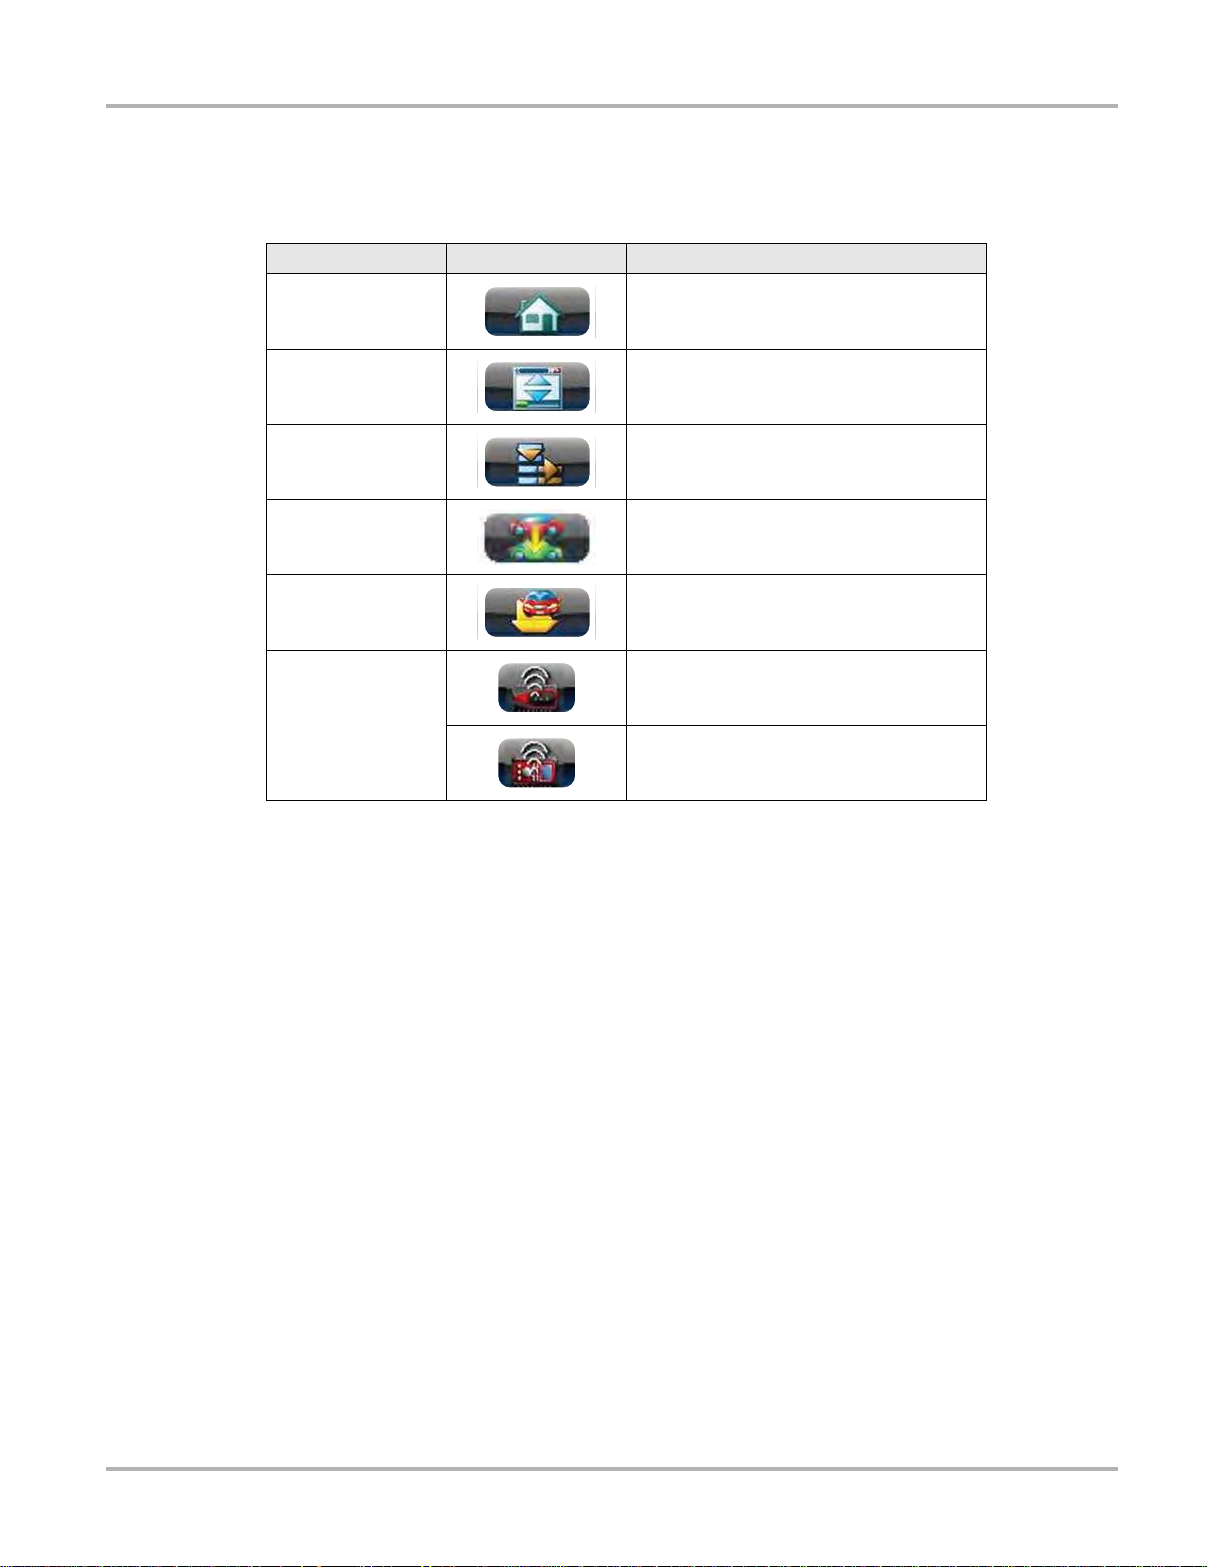
Table 3-2 Module buttons
Name
Button
Description
Home
Windows Toolbar
Menu
Change Vehicle
View Record
Hardware Status
Menu Button Options
Touching this button returns you to the
Home screen from any test.
Touching this button opens and closes the
standard Windows toolbars at the top and
bottom of the screen.
Touching this button opens a menu that
provides information and basic operations
and features for the current screen.
The currently identified vehicle is shown to
the right of the buttons, touching allows you
to change the identified test vehicle.
Touching the button opens an editable
worksheet of vehicle records.
Indicates the wireless connectivity status of
the Scan Module.
Indicates the wireless connectivity status of
the Scope Multimeter.
The Menu button on the Toolbar at the base of the display screen opens a list of basic operations
and features. Menu options vary by module and may include:
• Safety Information—opens the Important Safety Instructions document, which should be
read and understood prior to using the Diagnosti c Plat fo rm.
• File—allows you to print or save the data being viewed.
• Edit—allows you to configure alarms when viewing Scanner data.
• Setup—allows you to adjust tool settings.
• Help—allows you to view supporting documentation.
Selecting a menu item opens a submenu of choices, and some submenus also open a n additional
menu. A right arrowhead (
) indicates additional choices are available. Touch an item to select it.
File
Use to print or save a copy of the data currently being viewed. Selecting opens a submenu:
• Save—available from the Scan Module, opens an additional submenu with these options:
– Screenshot—saves a graphic image of the current screen
– Collected Data—saves a recording of all the data currently in the buf fer plus the number
of frames designated after the trigger event (see
13
Properties on page 44).
Page 21

Getting Started Powering Up
• Print—available from the Scan Module, opens an additional submenu with these options:
– Screen—sends the current screen image to a printer.
– Troubleshooter—prints the full text of the troubleshooter topic shown in the main body.
• Print Article—available from the Component Test module, has one of the following results:
– If connected to a printer, the file is sent to the printer.
– If not connected to a printer, the article is saved as a .xps file, which can be retrieved,
moved, or copied and printed at a later time.
• Print Preview—available from the Component T est module, displays how the selected article
will appear when printed.
• Page Setup—available from the Component Test module, opens a dialog box that allows you
to adjust the format (orientation and margins) of th e p ages to be prin ted.
Selecting a print option opens a standard Windows Prin t dialog bo x, which allows yo u to print or
save the file.
Edit
This Scan Module option performs the same function as the Alarms bu tton on the Scann er
Toolbar. (For more information refer to
Alarms on page 43).
Setup
This Scan Module option allows you to adjust tool settings to your personal preferences. Selecting
Tools opens a submenu that includes the following:
Graph Properties
•
• Unit Setup
• Download Firmware
• Display BEN
Graph Properties
Selecting opens the General Graph Properties dialog box, which is similar to what is available
from the Properties button on the Scanner Toolbar (see
here apply to all of the graphs. Graph properties options allow you to :
Properties on page 44). Changes made
• Change the background and plot colors of the graphs.
• Switch graph grid lines on and off.
• Adjust how much data is captured after a triggering event.
• Adjust the sweep time of the graphs.
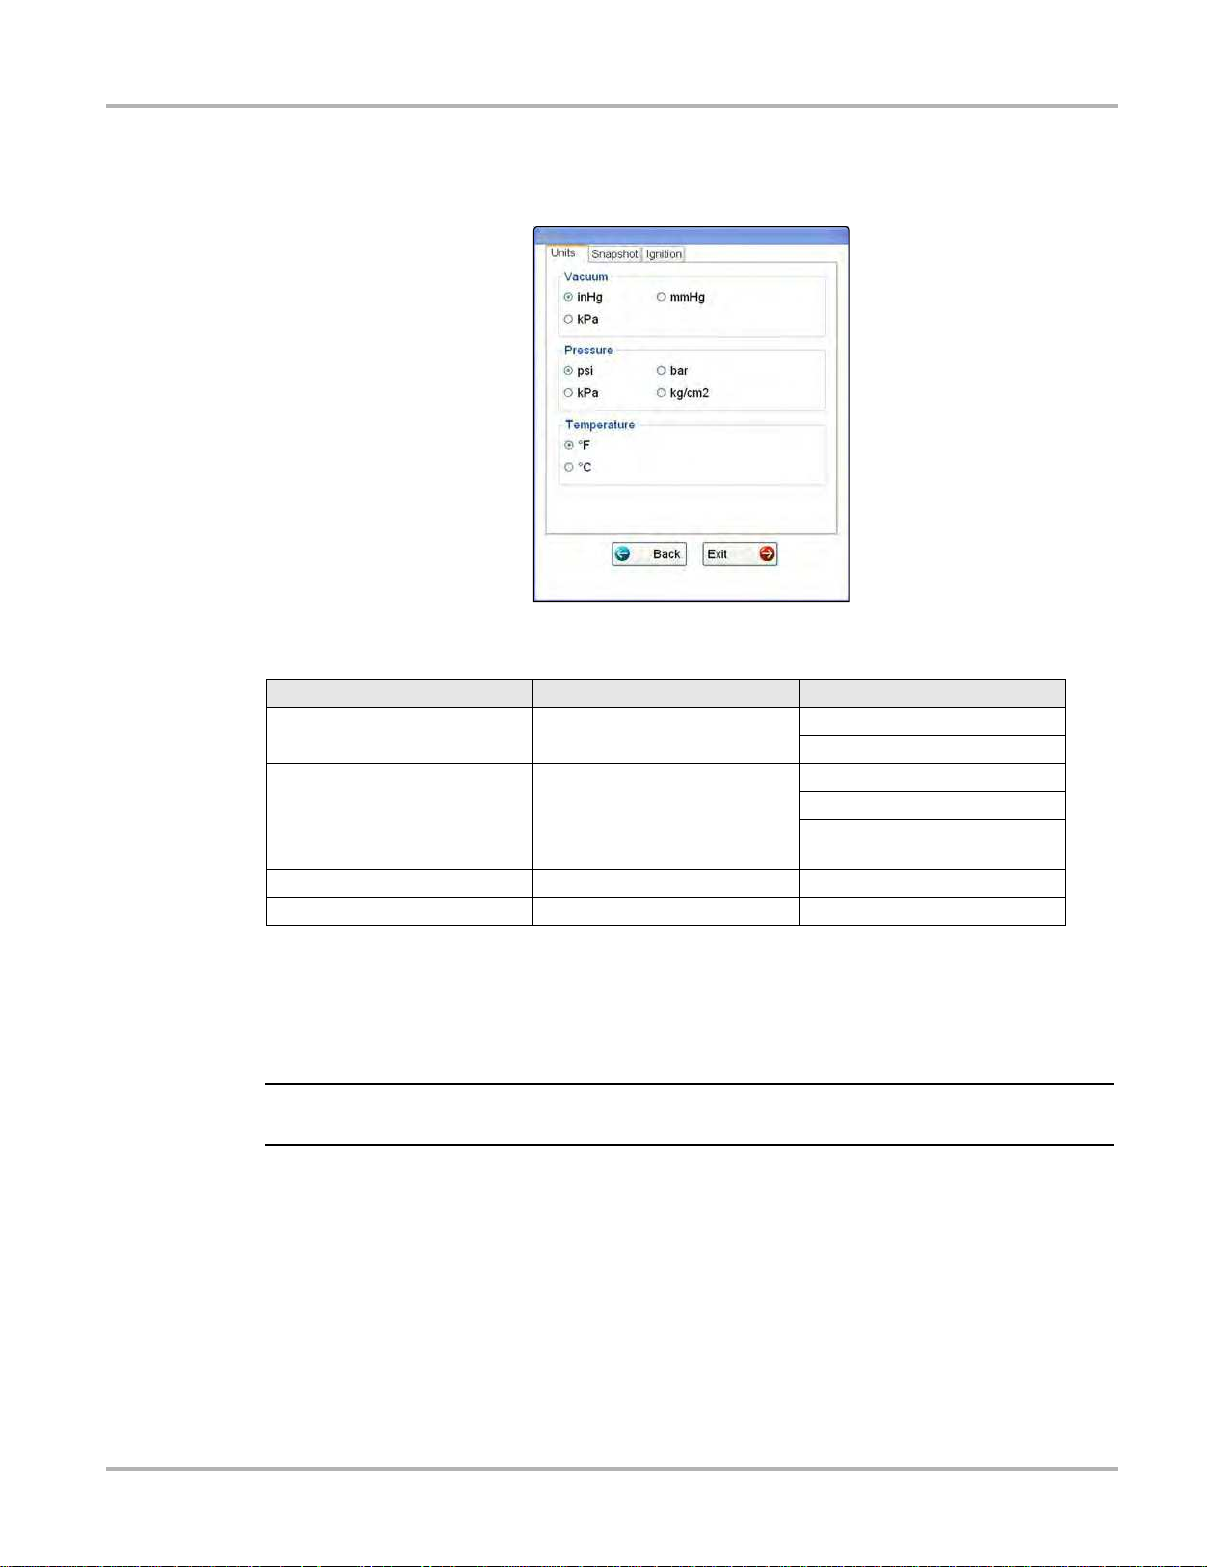
Unit Setup
Selecting opens a dialog box that allows you to choose between US customary or metric units of
measure for temperature, vehicle speed, and pressure read ings.
z To change the units setup:
1. From the Toolbar select Setup > Unit Setup.
The Setup dialog box opens to the Units t ab (
Figure 3-2).
14
Page 22
Getting Started Powering Up
NOTE:
2. Tap the values to select each item, the “radio knob” indicates the selected setting .
3. Tap Back or Exit to close the dialog box and apply the changes.
Figure 3-2 Sample view options
Table 3-3 Scan tool units of measurement
Setting
Vacuum
(manifold pressure)
Pressure kPa (kilopascal)
Temperature °C (degrees Celsius) °F (degrees Fahrenheit)
Vehicle Speed kph (kilometers per hour) mph (miles per hour)
kPa (kilopascal)
Default
inHg (inches of mercury)
mmHg (millimeters of mercury)
psi (pounds per square inch)
bar (atmosphere)
kg/cm2 (kilograms per
centimeter squared)
Option
Download Firmware
This option is used to update the firmware on your Dis pl ay De vi ce. F or firmware information,
contact your sales representative or Customer Ca re. While do wnloading the firmware , do not
interrupt the download process. Connection interruption may result in da mage to the unit.
i It is recommended to connect the unit to an AC power source when downloading firmware.
Display BEN
This option shows the BEN of the currently identified vehicle in the Scanner toolbar. The BEN is a
unique identifier that is used internally for data coor dination a nd communica tion.
15
Page 23

Getting Started Powering Up
Help
A variety of utilities and additional resources are available through the Help menu. Menu options
vary by module and may include:
•
User Manual
• Vers ion Info
• Activation Status
• User’s Manuals
• About Component Test
• About Scanner
User Manual
This option opens this document, which provides overall navigation and oper ation information for
the Diagnostic Platform.
Version Info
This option opens a window showing the version of the software and a co py of the Sof t ware
License Agreement. Tap OK to close the window.
Activation Status
This option opens a dialog box with version and licensing details for the system, and activation
status for the Display device and all other modules.
User’s Manuals
This Scan Module option opens a submenu of support docu ment ation , such as ve hicle
communication software manuals. These manu als provide co nnection an d test inform ation for
specific vehicles. Selecting a menu item opens a printable PDF ve rsion of the docume nt in a
separate window .
About Component Test
This option opens a dialog box that contain s so f tware vers ion and details, copyright data, and
other specific details about the Component Test module.
About Scanner
This option opens a dialog box that contain s so f tware vers ion and details, copyright data, and
other specific details about the Scan Modul e.
3.1.3 Windows Toolbar
This is the standard Windows toolbar. Y our Display Device is a fully functional personal computer
based on the Windows Embedded S t andard ope rating system. Refer to Microsoft documenta tion
for additional information.
16
Page 24

Getting Started Powering Down
3.2 Powering Down
All vehicle communication must be terminated before shutting down the Display Device. A
warning message displays if you attempt to shut down while the Scan Module is communicating
with the vehicle. Forcing a shut down while communicating may lead to ECM proble ms on some
vehicles. Exit the Scan Module before powering down.
z To power down the Display Device:
1. Navigate to the Home screen.
2. Select the Exit button.
3. From the Windows desktop, open the Windows Start menu.
4. Select T urn Off Computer.
5. Select Turn Off in the dialog box.
The open programs close and the power switches of f.
3.2.1 Emergency Shutdown
In case of emergency, press and hold the Power button for 5 seconds to force a shutdown.
17
Page 25
Chapter 4 Navigation
This chapter discusses how to use the hardware controls and features for the Displ ay Device.
There are no external controls on the Scan Module or Scope Multimeter Module , They can only be
operated when used in conjunction with the Display Device.
4.1 Controls and Features
The external controls on the Display Device are simple because most operations are controlled
through the touch screen. Touch screen navigation is menu driven, which allows you to quickly
locate the test, procedure, or data that you need throu gh a series of choices and qu estions.
Detailed descriptions of the menu structures are found in the chapters for the various modules.
The following sections describe the external controls and featur es of the d isplay de vice.
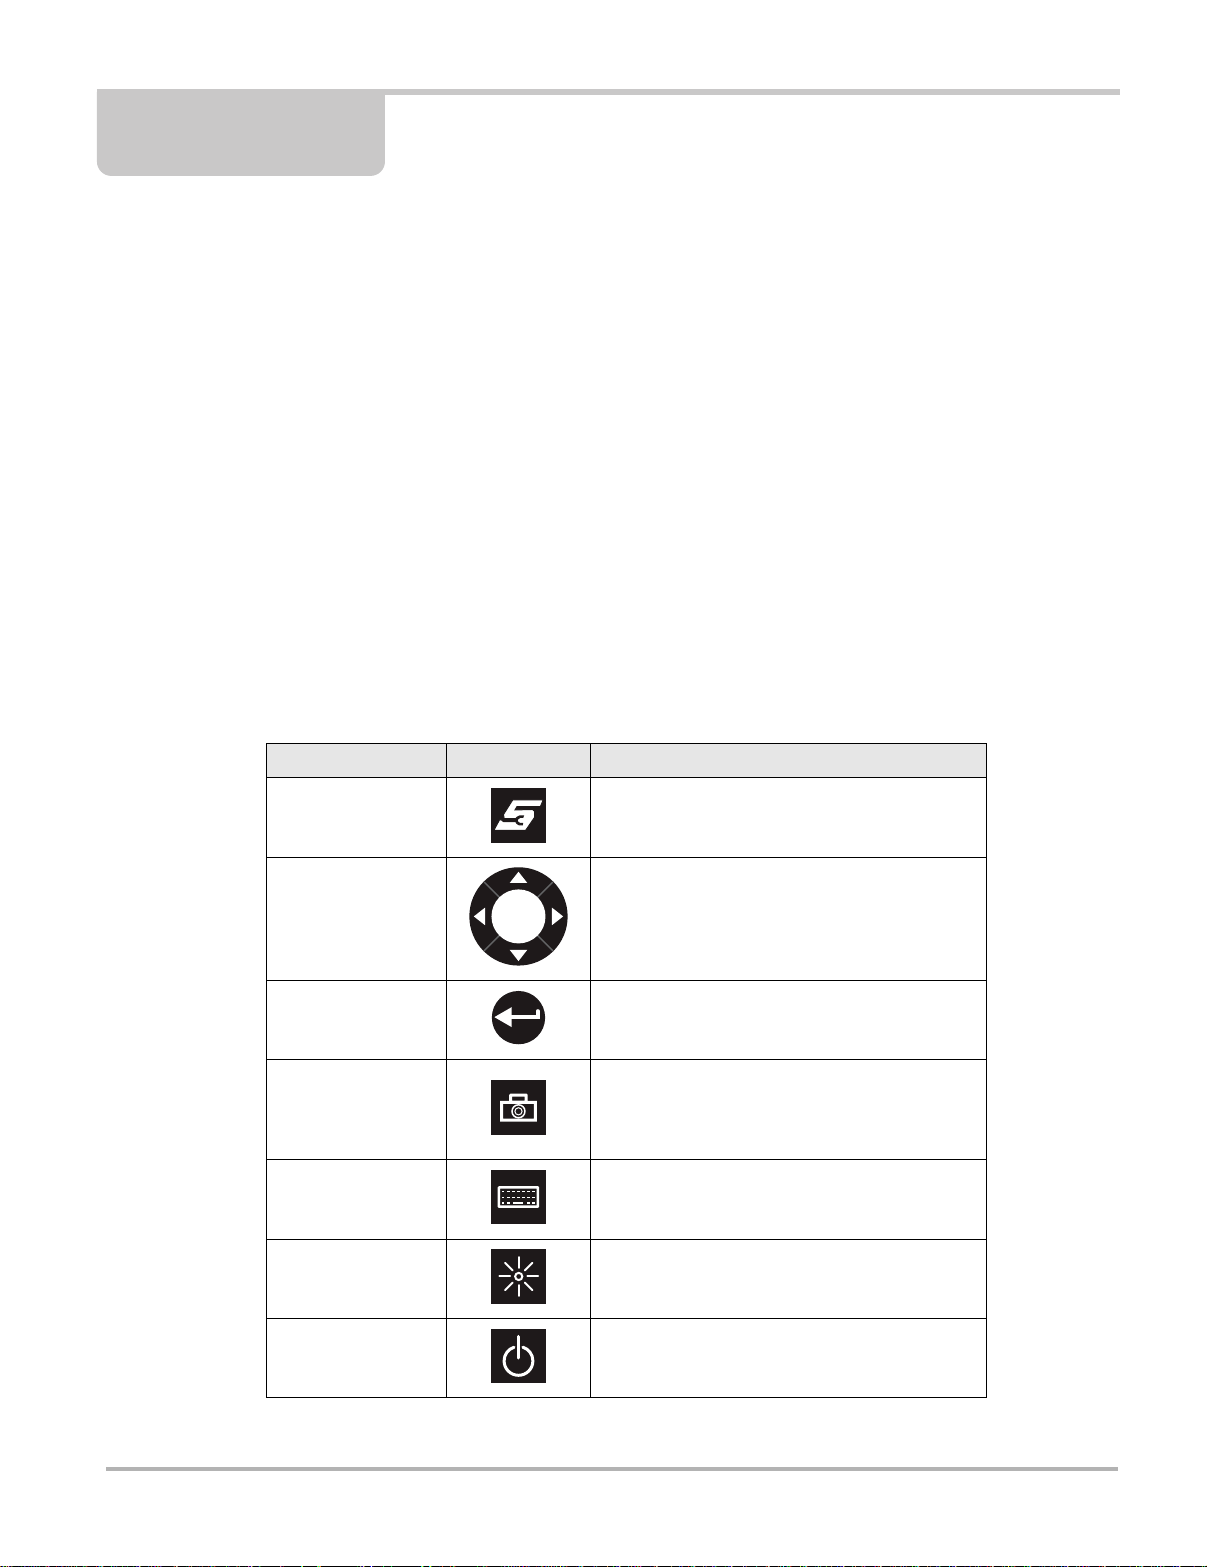
4.1.1 Control Buttons
Name and location of control buttons:
Table 4-1 Display Device control buttons
Name
Button
Description
S Button
Directional Buttons
Enter Button
Camera Button
Keyboard Button Opens or closes the virtual keyboard.
Brightness Button
Power Button Turns the unit on and off.
A function button that provides a shortcut for
capturing a screen image.
Moves the cursor or highlight on the display
screen up, down, right, or left.
Selects a highlighted item or returns the display
to the previous screen.
Operates the built-in camera. Press once to
open the application. The button then acts as a
shutter to take a photograph of what is visible
on the screen.
Increases the screen backlighting in seven
incremental steps, then returns to the lowest
setting and repeats.
All other tool operations are controlled through the touch screen.
18
Page 26

Navigation Camera Operation
4.1.2 LEDs
There are two light-emitting diodes (LEDs) on the front face of the device (see
page 3 for locations):
• Power Indicator LED—this device uses three colors to show the battery and power status as
follows:
– Green indicates a either a battery with a full, or nearly full, charge or DC po we r
– Orange indicates a battery that is charging. An orange LED that fades on and of f at three
second intervals indicates the unit is in Standby mode.
– Red indicates a low battery (15% of capacity or less).
• Hard Drive Activity LED—illuminates when the central processing unit (CPU) is reading or
writing to the hard disk drive (HDD).
4.1.3 The St and
The built-in stand extends from the back of the unit to allow hands- free viewing . The st and clips
into the unit for storage and pivots out so the display is a t a 45 deg ree an gle when in use.
4.2 Camera Operation
A single press of the Camera button on the front of the Dis play Devic e activates the camera. With
the camera active, the touch screen becomes the view finder and is also used for reviewing
photographs that are taken. Buttons on the touch scree n are used to o perate the came ra. Th e
buttons change depending on what camera function is active:
Table 4-2 Camera buttons (part 1 of 2)
Name
Button
Figure 2-1 on
Description
Photo
Gallery
Exit
OK
Delete
Acts as a shutter to take a photograph of what is
visible in the view finder, which is the left-hand
portion of the screen.
Opens a thumbnail gallery of recently taken
pictures.
Closes the camera application and returns to
the previous screen.
Displays after a picture is taken. Selecting
saves the photograph and returns to the view
finder.
Displays after a picture is taken and in Gallery
mode. Selecting discards the photograph and
returns to the previous screen.
19
Page 27
Navigation Camera Operation
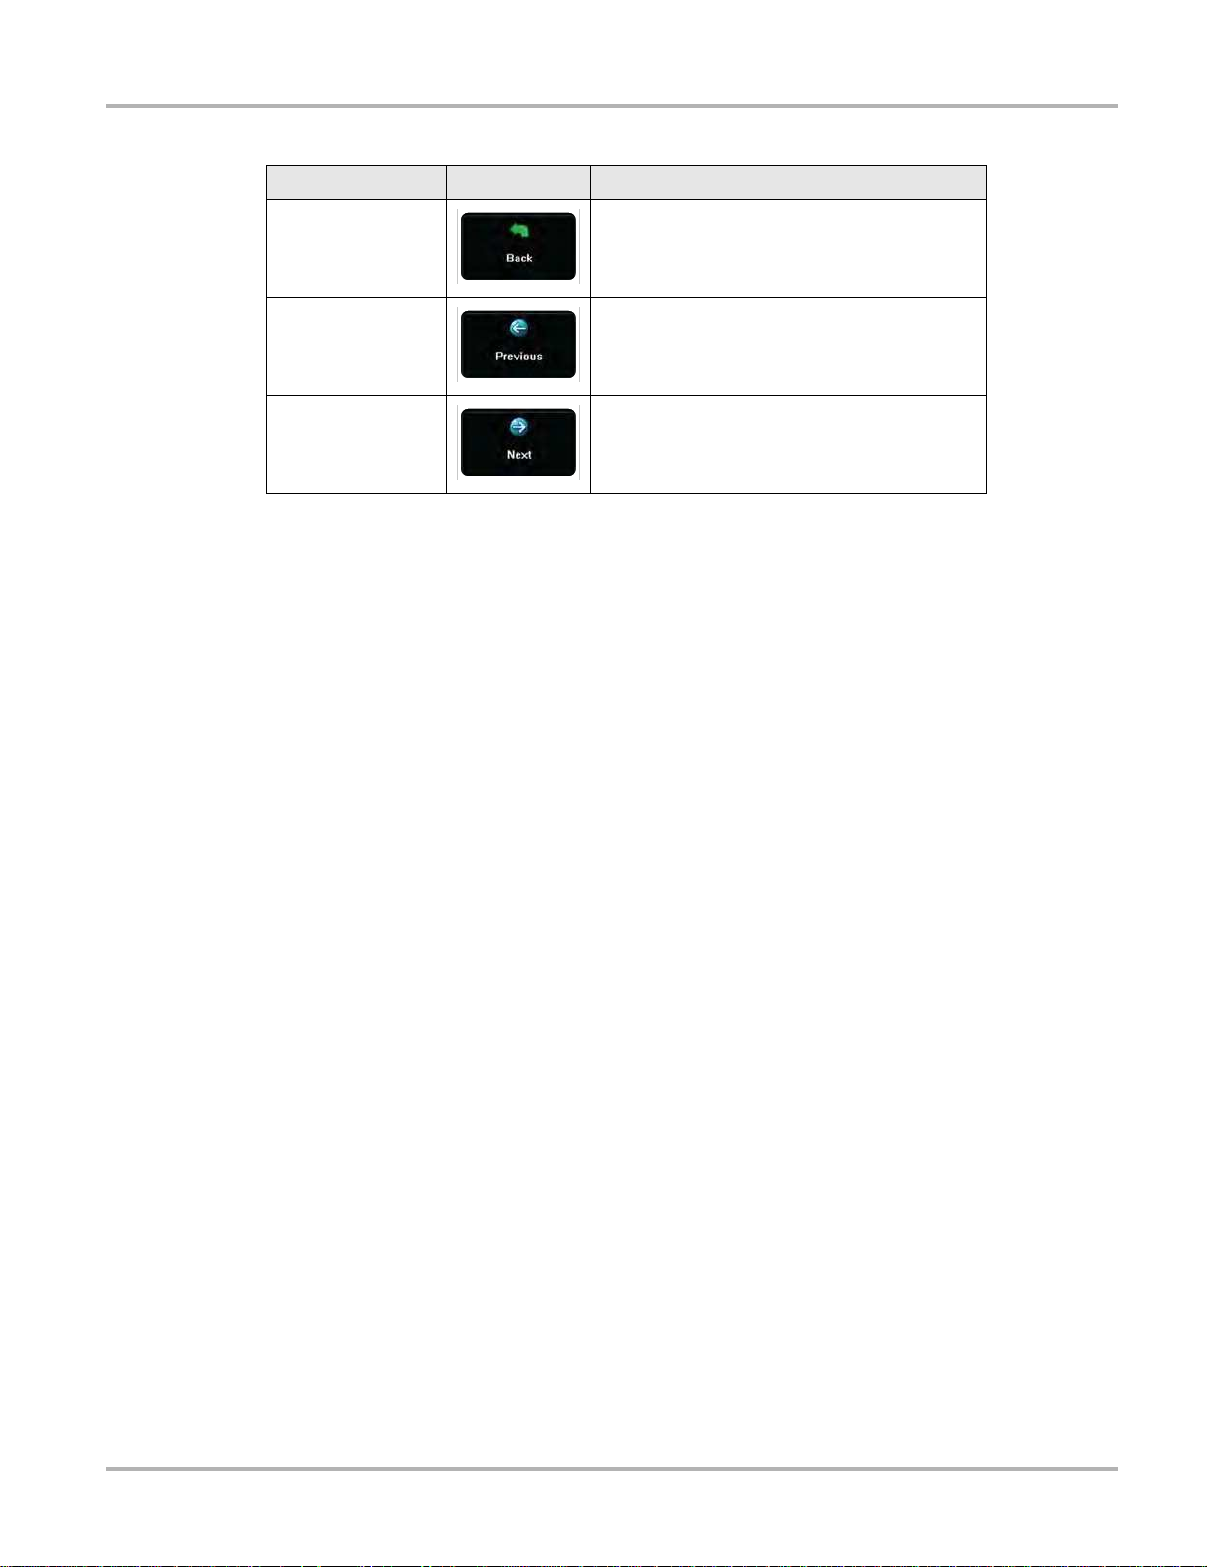
Table 4-2 Camera buttons (part 2 of 2)
Name
Button
Description
Back
Previous
Next
Displays in Gallery mode. Selecting returns to
the previously viewed screen.
Displays in Gallery mode. Selecting opens the
picture prior to the current image in the gallery.
Displays in Gallery mode. Selecting opens the
picture after to the current image in the gallery.
z To use the camera:
1. Press the Camera button.
The camera screen opens and the Camera button now controls the shutter.
2. Focus the image to be captured in the view finder.
3. Press the Camera button, or tap the Photo button.
The view finder now shows the captured picture.
4. Select OK to save the image, or Delete to delete it.
The view finder is live and the Camera button is the shutter, repeat steps 2, 3, and 4 to take
additional pictures.
5. Select Exit from the live view to close the camera application.
Photographs are stored on the hard drive and can be r etrieved from the desktop by selectin g
My Documents > ShopStream > Camera Folder.
20
Page 28

Chapter 5 Scanner Operations
The Scanner allows you to establish a dat a lin k to the ele ctronic control systems of the vehicle
being serviced to retrieve diagnostic trouble codes (DTCs), view live data parameters, and
perform tests. The Scanner can access the electro nic control module (ECM) for var ious veh icle
control systems such as engine, transmission, antilock brake system (ABS) and more.
Scanner testing requires connecting the Scan Module to the test vehicle using the data cable and
test adapters. On screen instructions tell you how to connect the Scan Modu le, additiona l
connection information can be found in the appropriate vehicle communication sof tware manual
for the test vehicle, which is available through the Help menu.
5.1 Getting Started
Prior to first use of the Scan Module the unit must be p aired with the Display Device to establish a
wireless communication link. Refer to
A demonstration program allows you to become familiar with Scanner operations and testing
without being connected to an actual vehicle.
Pairing the Scan Module on page 115 for details.
5.1.1 The Demonstration Program
The Scanner demonstration program allows you to become familiar with many of the test
capabilities without connecting to a vehicle. Sample data and mock test results help you learn the
menus and basic operations.
The Scan Module must be paired with the display device to use th e demonstration progra m. See
Pairing the Scan Module on page 1 1 5 for de t ails. Both the Scan Mod ule and the displa y device
must be powered on.
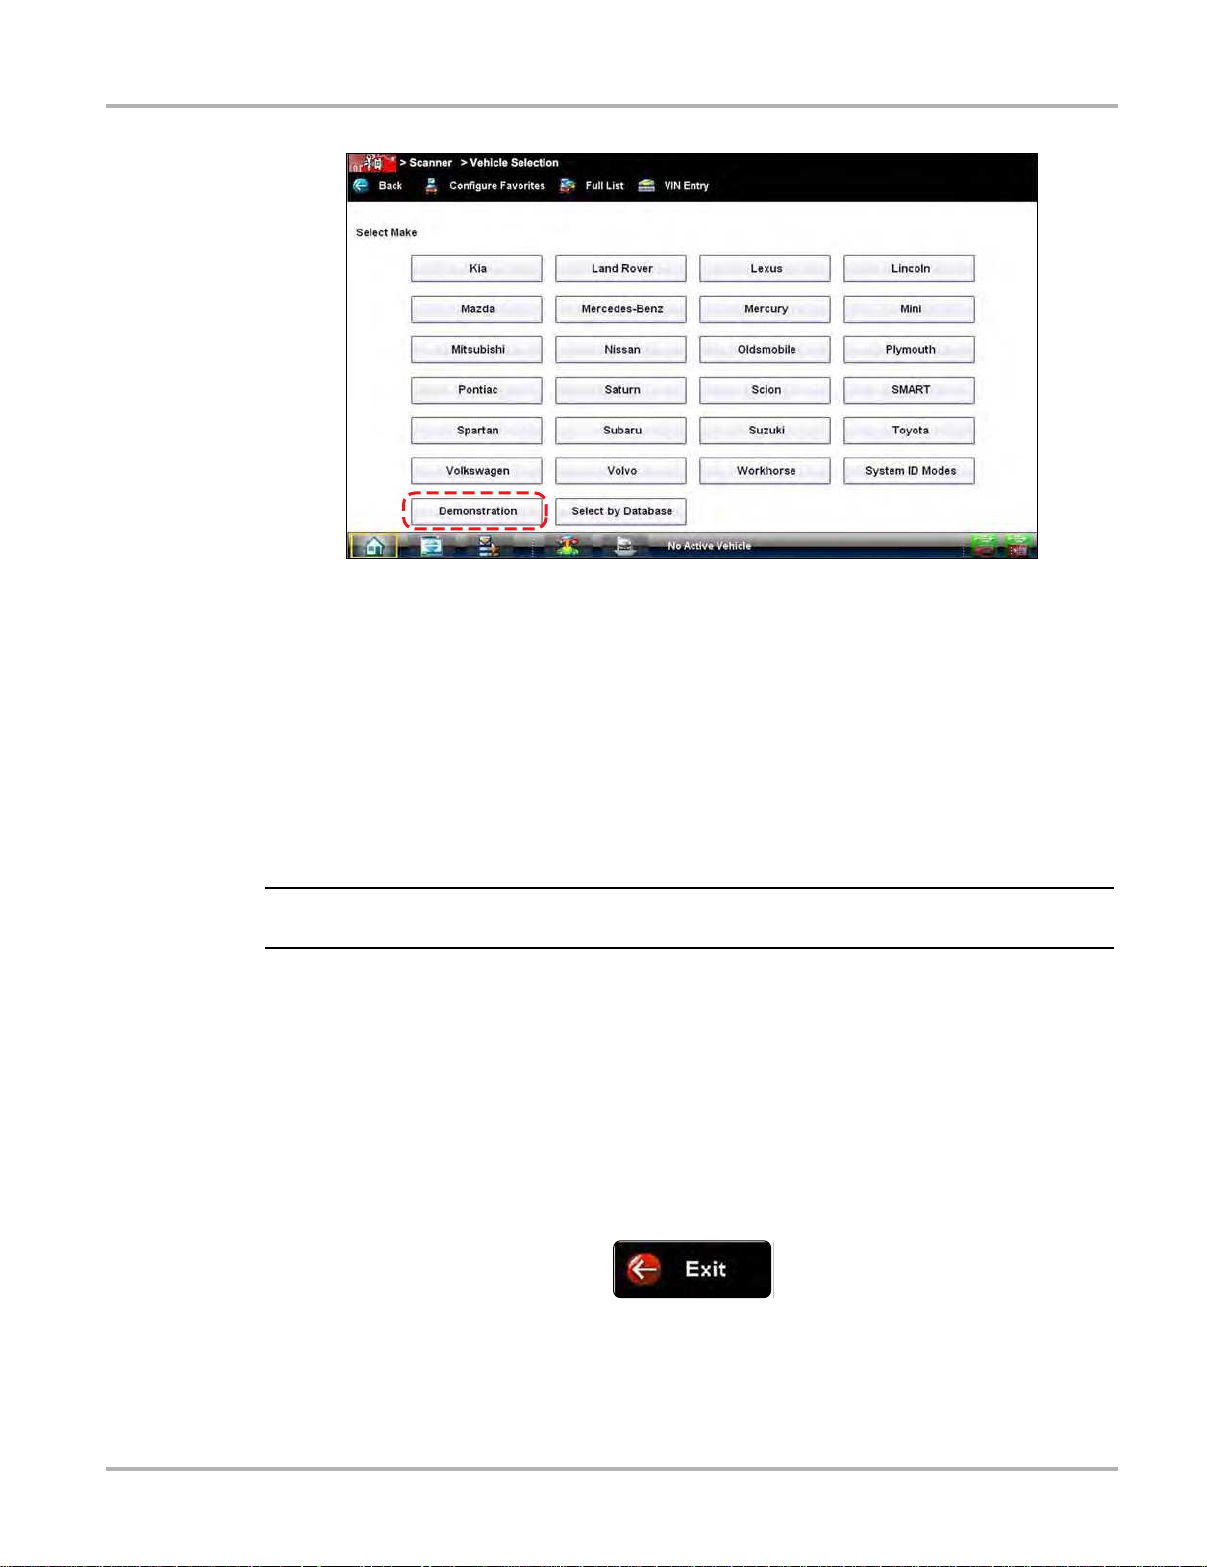
z To start the demonstration program:
1. From the Home screen, tap the Scanner icon.
The manufacturer menu displays. This menu includes all makes that are covered by any of the
Diagnostic Platform modules, not just those for which Sca nner information is available. There
is also a Demonstration button included in the list.
2. Tap the Demonstration button.
21
Page 29
Scanner Operations Getting Started
IMPORTANT:
Figure 5-1 Sample demonstration selection
A screen with two choices now displays:
– US Domestic—contains actual data captured while driving a 2001 Chevrolet T ahoe. Look
for the throttle position (TP) sensor dropout while analyzing the data in Graphing mode.
– OBD Training Mode—provides simulated data for an OBD-II/EOBD vehicle that allows
you to access any of the standard functions.
3. Select either option and a confirmation message di splays.
4. Select Ok to load the selected database.
5. Follow the on-screen instructions and select as needed until the Systems menu displays.
6. Select from any of the systems listed, then select from the submenus.
Do not connect a vehicle to the Scan Module while in the Demonstration mode .
5.1.2 Disconnecting the Diagnostic Platform From a Vehicle
When disconnecting the Diagnostic Platform from the vehicle, make sure the Scanner software is
not communicating with the vehicle.
z To exit Scanner and disconnect from a vehicle:
1. From a codes or data display screen, tap the Exit button on the upper toolbar.
Figure 5-2 Sample upper toolbar Exit button
The screen goes to the codes or data menu.
2. Tap the Back button on the upper toolbar.
22
Page 30
Scanner Operations Vehicle Identification
NOTE:
Figure 5-3 Sample upper toolbar Back button
The screen goes to the system menu.
3. Tap the Back button on the upper toolbar.
A “stopping communication” briefly displays followed by the systems menu.
4. Tap the Change Vehicle button on the Toolbar.
Figure 5-4 Sample Toolbar Change Vehicle button
The vehicle description on the toolbar should now read “No Active Vehicle”.
5. Tap the Home button on the Toolbar.
Figure 5-5 Sample Toolbar Home button
The Home screen displays.
6. Disconnect the test adapter from the vehicle connector.
i Damage to the electronic control module (ECM) of the vehicle can occur if communica tion is
disrupted. Ensure that the vehicle communication cable is pr operly connected a t all times during
testing. Exit all active tests before removing the test cable or powering down.
5.2 V ehicle Identification
The Scanner information presented is provided by a direct lin k to the ECM of th e test vehicle.
Therefore, certain attributes of the test vehicle must be entered into the Diagnostic Platform so
that the data displays correctly. V ehicle identification information is carried over if you enter the
Scan Module either from the Component Test module or from one of the records stored in the
Vehicle History mod ule. However, you may need to enter additional attributes in some instances.
The vehicle identification sequence is menu driven, you simply follo w the scree n prompts and
make a series of choices. Each selection you make advances to the next screen. A Back button
in the upper left corner of the screen re turns you to the previo us screen. Exa ct procedur es may
vary somewhat by vehicle.
z To identify a vehicle for Scanner testing:
1. Tap the Scanner module button from the Home screen.
A list of manufactures displays (
Figure 5-6).
23
Page 31

Scanner Operations Vehicle Identification
NOTE:
Figure 5-6 Sample manufacturer list
2. Select the manufacturer of the test vehicle from the list.
A model year menu displays.
i You can limit the number of manufacturers that appear on the list by selecting Configure Favorites
from the toolbar. See Creating a Favorites List on page 61 for details.
3. Select the year of the test vehicle from the menu.
A list of vehicle types or models displays. Several selections may be required to identify the
vehicle type and model, follow the screen prompt s and enter the required information.
A confirmation dialog box displays once all the required dat a has been en tered (
Figure 5-7).
Figure 5-7 Sample confirmation dialog box
24
Page 32

Scanner Operations Vehicle Identification
NOTE:
4. From the Confirm vehicle details dialog box, sele ct:
a. OK to continue.
b. Cancel to return to the engine list.
When Yes is selected a list of systems available for testing on the identified vehicle displays.
5. Select a test to continue (
Figure 5-8).
Figure 5-8 Sample available tests list
The identification sequence is now complete, refer to
navigate through the Scanner dat a and
tests.
Operations on page 30 for information on how to perform
Navigation on page 27 for details on how to
i If you return to the Home screen and select Component Test, Information, or another module the
vehicle identification entered here is carried over . However , additional information may be needed
in some instances.
5.2.1 Alternative V ehicle Identification
Occasionally , you m ay identify a test vehicle th at the Scanner does not r ecognize, the d at abase
does not support, or has some unique characterist ics that prevent it from co mmunicating with the
Scanner through the normal channels. In these instances, a menu of alternate choices that allow
you to establish communication with the vehicle by other means displays. In add ition to being able
to identify a different manufacturer, the following alternatives are available:
• OBDII/EOBD—allows you to perform generic OBD-II or EOBD tests, see
Operations
on page 52 for additional information.
• System ID Modes—allows you to begin the vehicle identification by first selecting the system
to be tested. Selecting opens a menu of manufacturers that support this mode.
• Select by Database—allows you to begin the vehicle i dentification by fir st selecting which
manufacturer database to load. Selecting ope ns a menu of available databases.
OBD Direct
25
Page 33

Scanner Operations Connecting to a Vehicle
5.3 Connecting to a V ehicle
Make a selection from the systems available for testing list a nd instructions for co nnectin g the
Scanner to the vehicle with the data cable display on the scree n (
Figure 5-9).
5.3.1 Cables
One of two data cables, one for OBD-II/EOBD compliant vehicles and one for no n-OBD-II/EOBD
models, are used to connect the Scan Module to the test vehicle. The 26-pin end of either cab le
attaches to the data cable port on the Scan Module and is secured with two captive screws. The
16-pin end of the OBD-II cable plugs directly into the data link connector (DLC) of the test vehicle.
The 15-pin end of the non-OBD-II cable att aches to a ca ble adapter and is secu red with ca ptive
screws, the adapter then plugs into the diagnostic connector on the test vehicle.
A replaceable 7.5 amp blade-type fuse is inst alled in the vehicle conne ctor end of the cable to
protect the unit from high circuit voltage and current. A green LED, also on the vehicle connector
end of the cable, illuminates whenever there is power supplied to the cable. An LED that fails to
illuminate indicates either a problem on the vehicle power circuit or a blown data cable fuse.
All OBD-II/EOBD vehicles have vehicle battery power (B+) available on the DLC, so th e Scan
Module should power on as soon as the cable is connected to the vehicle. The auxiliary power
cable supplies power for testing models that do not have B+ available on the diagnostic connector .
An OBD-I Data Cable and adapters (optional in some markets) are required for testing models that
are not OBD-II or EOBD compliant.
The large end of the auxiliary power cable plugs into the vehicle accessory port. The small end of
the cable fits into a power port built into the side of the cable adapter. An in-line fuse on the
auxiliary cable provides circuit protection.
Figure 5-9 Sample vehicle connection message
On-screen instructions on the display device screen tell you which cable, and adapter if needed,
to use once a test vehicle has been identified. The screen message also includ es the loca tion of
the vehicle diagnostic connector. Follow the on-screen instructions for connecting to the vehicle.
26
Page 34

Scanner Operations Navigation
5.3.2 No Communication Message
If the Scanner is unable to establish a communication s link, a “n o communications” me ssage
displays. A “no communication” message, means the Scan Module and the vehicle control
module cannot communicate with each other for some reason.
The following conditions cause a “no communication” message to disp lay:
• The Scanner is unable to establish a communication link with the veh icle.
• You selected a system for testing that the vehicle is not equipped with (such as ABS).
• There is a loose connection.
• There is a blown vehicle fuse.
• There is a wiring fault on the vehicle, or in the data cable or ada pter.
• There is a circuit fault in the data cable, Persona lity Key, or adapter.
• Incorrect vehicle identification was entered.
Refer to the Vehicle Com municati on Software manuals for manufacturer-specific problems.
5.4 Navigation
This section describes how to navigate the Scanner interface and sele ct scanner test s.
5.4.1 Scanner Screen Layout
The Scanner screens typically include three sections (
Figure 5-10):
1— Scanner Toolbar
2— Main Body
3— Data Buffer Toolbar
Figure 5-10 Scanner screen layout
27
Page 35

Scanner Operations Navigation
Scanner T oolbar
The Scanner toolbar contains a number of bu ttons that allow you to con figure the disp layed d at a
and to exit. The table below provides a brief explanation of the Scanner toolbar button operations:
Table 5-1 Scanner toolbar buttons
Name
Button
Description
Exit
Back
Custom
Alarms
Properties
Graph View
Save
Closes the current test and returns you
to the menu.
When available, returns to the
previously viewed screen.
Allows you to select which parameters
are displayed on the screen.
Allows you to set an alarm on certain
data parameters when the signal goes
above or below the alarm setting.
Allows you to adjust the display
characteristics for all of the data
screens.
Allows you to simultaneously view up
to 16 data graphs at a time.
Saves a copy of the current frame of
data that can be viewed on the tool or
in ShopStream Connect.
Opens a standard Windows Print
Print
More
Scale
Sweep
dialog box for saving a print copy of the
current frame of data.
Opens a dropdown menu of the
additional options shown below.
Switches the scale values, displayed
along the left-hand side of the graphs,
on and off.
Switches the sweep values, displayed
at the base of the graphs, on and off.
Main Body
The main body of the screen varies depending on the st age of operation. The main body can show
vehicle identification selections, the main menu, test data, instructions, troubleshooting
information, controls, and other diagnostic information.
28
Page 36

Scanner Operations Navigation
Data Buffer Toolbar
Whenever communication is established with a vehicle, the Scanner con tinuousl y recor ds dat a
transmitted by the ECM in the data buffer. The toolbar below the main body of the screen contains
the buttons for navigating the buffered da t a (
Table 5-2 Data buffer toolbar buttons
Name
Go To Start Moves to the first frame in the data buffer
Button
Table 5-2).
Description
Pause
Play
Go To End Moves to the last frame in the data buffer
Clear Erases data in the data buffer
Step Back Moves to the previous frame in the data buffer
Frame Counter Indicates the data buffer frame currently displayed
Step Forward Moves to the next frame in the data buffer
Suspends data capture and changes to show the
Play button
Starts or resumes dat a capture and changes to show
the Pause button
Snapshot Arms the software to take a snapshot of vehicle data
Zoom In
Zoom Out
Increases the magnification by decreasing the sweep
of the graph
Decreases the magnification by increasing the
sweep of the graph
Use the slider in the middle of the toolbar to quickly move through paused data.
Figure 5-11 Sample data buffer slider
29
Page 37

Scanner Operations Operations
5.4.2 Screen Messages
Screen messages appear when additional input is n eeded befor e pro ceeding. There are thr ee
types of on-screen messages, confirmations, warnings, and errors.
Confirmation Messages
Confirmation messages inform you when you are about to perform an actio n that cannot be
reversed or when an action has been initiated and your con firmatio n is needed to con tinue.
When a user-response is not required to continue, the message displa ys briefly be fore
automatically disappearing.
Warning Messages
Warning messages inform you wh en co mpleting the selected action may result in an irreversible
change or loss of data.
Error Messages
Error messages inform you when a system or procedural error has occurred. Examples of
possible errors include a disconnected cable or a peripheral, su ch as a prin ter, is powered off.
5.4.3 Making Selections
The Scanner software is a menu driven pro gram that present s a ser ies of choi ces one at a time.
As you select from a menu, the next menu in the series displays. Each selection narrows the focus
and leads to the desired test. Use your fingertip or the stylus to make menu selections.
5.5 Operations
The Scanner allows you to establish a dat a lin k to the ele ctronic control systems of the vehicle
being serviced in order to view live data par ameters and perform tests. You can use selected
functional tests, get troubleshooting tips, and access vehicle-specific trouble codes for various
vehicle control systems such as engine, transmission, antilock brake system (ABS) and more.
The Scanner has two main functions:
1. Scanner—provides access to V e hicle Commun ication So f tware functio ns such as re ading
codes, viewing data, and performing functional tests.
2. Fast-Track Troubleshooter—provides the diagnostic power of Fast-T r ack Troubleshooter, a
database of experience based information developed by master technicians.
After a system is selected and the Scanner est ablishes com munication with the vehicle, a
Scanner Main menu, which lists available tests, displays.
30
Page 38

Scanner Operations Operations
Figure 5-12 Sample Scanner Main menu
Main menu options vary slightly by year, make, and model. The main menu may include:
• Data Display— displays data par ameter information from the vehicle co ntrol mod ule.
Selecting may open a submenu of viewing options.
• Codes Menu—displays diagnostic trouble code (DTC) records from the vehicle control
module. Selecting may open a submenu of viewing options.
• Clear Codes—erases DTC records and other data from the ECM. Th is selection is found on
a Codes submenu for some models.
• Functional Tests—provides specific sub syst em a nd component tests. The tests vary
depending on the manufacturer and model.
• Actuator T ests—similar to functional tests, checks the operation of certain actuators, such as
solenoid valves and relays.
• Memory Resets—allows you to reprogram adaptive valu es for certain components after
making repairs. Selecting opens a su bmenu. These options are found on the Fu nctional Tests
Menu for some models.
• System Tests—provides specific subsystem testing. Performing these tests is similar to
functional tests.
• Generic Functions—lets you access certai n available Gen eric OBD II functions fro m a
proprietary menu (1996 and newe r vehicles only) .
• Troubleshoot er—provide s step-b y-step pr ocedures , integr ating p ara meter da t a and
retrieving trouble codes when appropriate, for specific symptoms of the identified vehicle.
z To perform a Scanner test
1. Launch the Scanner—Tap Scanner on the Home screen.
2. Identify the vehicle—Identify the test vehicle by selecting from the menu option s.
3. Select the system—Select the system to be tested from the systems menu.
4. Connect the data cable to the vehicle—Follo w the on-scree n connection instr uctions to
connect the Scan Module to the test vehicle.
5. Select a test from the Scanner main menu—Select the desired test.
31
Page 39

Scanner Operations Operations
5.5.1 Data Display
Depending upon the test vehicle, this selection may appear as Data, Data Display, Data Only,
Data (No Codes), or something similar . All are similar. Selecting has one of the following results:
• A submenu of data viewing choices displays.
• Vehicle data displays.
A submenu displays when more than one data viewing mode is available on the identified vehicle.
On some models, the engine must be started or cranked before data can be displayed. For these
models, a “Waiting to Co mmunicate” messag e displays if the eng ine was n ot cranke d or st ar ted.
Data Screens
When a Data selection is made, the screen displays the data list for the se lected module. The
items available for any control module vary from one vehicle to another.
Data is presented in a 2-column format. An abbreviated parameter name is at the left of each
column and its value is at the right edge of the column. Parameters display in the order that they
are transmitted by the ECM, so expect variation between vehicles.
Gesture scrolling allows you to quickly move through the data list. Simply touch the screen and
drag your finger up or down to reposition th e parameters being displayed. Position bars
momentarily appear to the right of each column in dicate the po sition of the curr ent screen in
relation to the entire list as you scroll. Each column of parameters scrolls independently of the
other column.
Figure 5-13 shows a typical data screen.
1— Graph button
2— Parameter name
3— Parameter value
Figure 5-13 Sample data screen
32
Page 40

Scanner Operations Operations
Data Graphs
Tap the Graph button to open a data graph for that p ar ameter (
Figure 5-14). Selecting a
parameter for graph view moves it to the top of the list. Tap the Graph button again to close the
graph for that parameter and return to a dat a list view.
Figure 5-14 Sample graph view
The icons that display on each data graph allow you configure settings for the selected graph only:
Table 5-3 Data graph icon operations
Name
Button
Description
Expand/Collapse
Graph Properties
Tap to expand the graph to fill the entire screen, tap
again to collapse the graph to the standard view.
Tap to open the Graph Properties dialog box, which
allows you to set triggers for recording a snapshot
and to adjust the scale.
Triggers
Triggers esta blish threshold values, an upper limit and a lower limit, for recording a data snapshot.
A snapshot allows you to closely evaluate conditions that caused the trigger ing even t.
When a snapshot is taken, the Scanner captures addition al data after the trigger poin t is detected,
data collection pauses, and the buf fered information is automatically saved as a movie. This gives
you a complete picture of what was happening before the fact, what occurred at the trigger po int,
and what happened after the fact.
Data collection is paused following a trigger event. Select the Play button to resume viewing live
data. A vertical line now appears on each of the dat a graphs to ind icate the tr iggering po int. The
trigger line on the parameter that triggered the snap shot is a different color than those on th e other
graphs. This makes it easy to determine which param eter caused the trigger when triggers are set
for multiple parameters.
33
Page 41

Scanner Operations Operations
NOTE:
z To adjust the amount of data collected after a trigger:
1. Tap the Properties button on the Scanner toolbar to open the dialog box.
2. Highlight one of the Samples After Trigger options:
3. Tap the Accept button to close the dialog box.
i You can also ad just the a mount of dat a collected after a triggering event using the Properties
button on the Scanner toolbar. See Properties on page 44 for additional information.
z To set triggers and record a snapshot:
1. Tap the Graph Properties icon on the parameter grap h you wish to set trig gers on.
The Graph Properties dialog box opens.
2. From the Graph Properties dialog box, tap Triggers On.
A check mark appears in the box and the minimum and maximum fields activa te
Figure 5-15).
(
Figure 5-15 Sample Graph Properties dialog box
3. Tap either Max: (maximum) or Min: (minimum) to activate that field and open the ke yboard.
4. Type the desire d trigger valu e into th e field.
5. Tap the other field and enter a trigger value, then close the virtual keyb oard.
6. Tap Save to close the dialog box.
Trigger lines (blue for upp er and re d for lower ) disp lay on th e selected p a rameter gr aph.
The area between the upper and lower tr igger lines establishes the trigg ering condition. Once
the snapshot is armed, any data po int s that register out side of the set trigger conditions
initiates a snapshot. The Scanner continues to reco rd the pr eset amoun t of dat a after the
trigger and includes it in the snapshot.
7. Tap Snapshot on the Data Buffer Toolbar to arm the snapshot.
The Snapshot button changes color to indicate it has been armed (
34
Figure 5-16).
Page 42

Scanner Operations Operations
NOTE:
Figure 5-16 Sample armed Snapshot button
Once all of the data is compiled, data collect ion p ause s and the infor mation is save d as a
movie. A confirmation screen displays to let you know the name au tomatically assigned to the
saved file and where to locate it.
Figure 5-17 Sample saved movie confirmation screen
8. Select OK to close the confirmation screen.
9. Tap the Play button on the toolbar to resume viewing live data.
i Selecting an armed Snapshot button disarms it.
Scale
Scale adjusts the upper and lower values displayed on the vertical axis of a dat a graph. T wo scale
modes are available; auto scale and manual scal e. Auto scale, which is the default setting,
automatically adjusts the graph scale based upon the minimum and maximum values transmitted
by the ECM. Manual scale allows you to set the minimum and maximum valu es.
z To manually set the scale on a graph:
1. Tap the Graph Properties icon to open the dialog box for the graph you wish to scale.
2. From the Graph Properties dialog box, tap Auto Scale On .
35
Page 43

Scanner Operations Operations
Figure 5-18 Sample manual scale selection
The check mark is cleared from the box and the minimum and maximum fields activate
3. Tap either Max: (maximum) or Min: (minimum) to activate that field and open the ke yboard.
4. Type the desire d scale value into the field .
5. Tap the other field and enter a value, then close the virtual keyboard.
6. Tap Save to close the dialog box.
The dialog box closes and the parameter scale is now a t the set value s.
Using Zoom
The zoom options on the Data Buf fer toolbar allow you to change th e magnification level of the
sweep when viewing data graphs. Use the Zoom In (+) b utton to increa se magnification , and the
Zoom Out (–) button to decrease magnification.
5.5.2 Codes Menu
This selection may appear as Codes, Codes Menu, Codes Only, codes (No Data), or something
similar on the menu. Selecting opens a list of dat a p ara meter viewing o ptions that m ay include:
• Display Codes
• Clear Codes
• Freeze Frame/Failure Records
• DTC Status
Display Codes
Selecting opens either a list of diagnostic troubl e codes (DTCs) stored in the sele cted electronic
control module (ECM), or a submenu of DTC viewing options. Submenu options includ e:
• Trouble Code Info rmation—opens a list of codes in ECM memory
36
Page 44

Scanner Operations Operations
• History Codes—opens a list codes whose symptoms are not currently present. History codes
indicate an intermittently occurring problem.
• Failed This Ignition—opens a list of codes that set during the current ignition cycle.
• MIL SVS or Message Requested—displays ECM requests to light the malfunction indicator
lamp (MIL) or service vehicle soon (SVS) lamp, or display a driver information alert.
• Last Test Failed—displays a complete list of failed tests.
• T est Failed Since Code Clea red—displays a list tests that failed sin ce the last time codes
were cleared from ECM memory.
A code list includes the DTC, a brief description, and an information button that opens a dropdown
menu of hyperlinks to sources of more detailed information abou t the code module (
Figure 5-19).
Figure 5-19 Sample code list
Selecting the information button on the right side of the code fiel d opens the dropdown m enu:
Table 5-4 Code dropdown menu options
Name
Ask-a-Tech
Information
Icon
Links to the Ask-a-Tech website with the active code in the search
field. Select search to get information about the code. See
Tech Operations
Links to the Information module, which may vary depending upon
the region and what options are available on your system. See
Information Operations on page 100 for additional information.
on page 93 for additional information.
Description
Clear Codes
The Scanner clears trouble codes from the control module memory on some vehicles. If this
function is not available on the test vehicle, Clear Codes does not appear as a men u option.
z To clear codes:
1. Select Clear Codes from the Codes Menu.
Ask-a-
37
Page 45

Scanner Operations Operations
A confirmation message displays.
2. Make sure any conditions shown on the confirmation messag e are m et, then select Yes.
A “codes cleared” message displays once the operation is co mplete .
3. Select Continue to return to the Codes Menu.
Freeze Frame/Failure Records
This selection displays the DTC that was set, along with corresponding data, when the ECM
commanded the malfunction indicator lamp (MIL) to turn on.
DTC Status
This selection allows you to view the records of a particular DTC.
z To check DTC status
1. Select DTC Status from the Codes Menu .
The DTC St atus entry fie ld displays and the virtual ke yboard ope ns (
Figure 5-20).
Figure 5-20 Sample DTC Status entry field
2. Use the virtual keyboard to enter the characters of the DTC.
3. Tap the virtual keyboard Backspace bu tton if needed to erase a characte r.
4. Tap the virtual keyboard Return key once all the code characters are ente red.
The DTC status report displays (
Figure 5-21).
38
Page 46

Scanner Operations Operations
Figure 5-21 Sample DTC status report
5. Tap Exit to return to the DTC status entry screen.
6. Tap Exit again to return to the Codes menu.
5.5.3 Functional Tests
The Functional Tests selection is used to access vehicle-specific subsystem and component
tests. Available test s vary by manufactu rer, year, and model, and o nly the a vailable tests display
in the menu.
There are four general types of functional test operation s:
• Information Test s—are read-only tests, like selecting “VIN” from a Functional Tests menu to
display the VIN of the identified vehicle.
• T oggle Tests—switch a component, such as a solenoid, relay, or switch, between two
operating states.
• Variable Control Tests—command a certain value for a syste m or comp onent, such as
varying the spark timing in 1° increment s or the EGR valve du ty cycle in 10 % increment s .
• Reset Test s—reset the adap tive, or lea rned, values th at are stored in the con trol module.
Selecting Functional T est s opens a menu of test options that varies by make and model. Selecting
a menu option either activates the test or opens a submenu of additional choices. Follow all
screen instructions while performing tests. How and what information is presented on the screen
varies according to the type of test being performed.
Some toggle and variable control tests display functional test controls at the top of th e screen with
data stream information below (
Figure 5-22).
39
Page 47

Scanner Operations Operations
Figure 5-22 Sample functional test controls
Functional test controls allow you manipulate the test signal as shown in Table 5-5.
Table 5-5 Functional test control buttons
Name
Button
Description
Test Activates the test.
Return Moves focus back to the data list.
Change List Allows you to switch data lists.
Custom
Minus
Plus
5.5.4 Generic Functions
The Generic Functions selection opens a menu of available OBD- II/EOBD functions on 1996
and newer vehicles. For additional information on generic function refer to the Global OBD Vehicle
Communications Software Manual. Menu options typically include:
Allows you to select which parameters display during
the functional test.
Switches an item to low or off, or incrementally
reduces a variable signal.
Switches an item to high or on, or incrementally
increases a variable signal.
40
Page 48

Scanner Operations Operations
• Readiness Monitors—displays the status of the OBD-II/EOBD required monitors
• ($02) Freeze Frame—displays dat a stored in ECM memor y when a DTC is set
• ($05) Oxygen Sensor Monitoring—displays on-board oxygen senso r monitor ing te st result s
• ($06) Non-Continuous Monitors—displays the status of system monitors
• ($08) Request Control of On-Board System—establishes bidirectional ECM communication
• ($09) Calibration Identification—displays the ECM calibration identification numbers
• ($09) Calibration Verification Number—displays the ECM calibration
• ($09) In-Use Performance Tracking—displays a monitoring conditions report
• ($09) Ve hicle Identificatio n Number —displays th e VIN
Refer to the Global OBD Vehicle Communications Software Manual for additional information.
5.5.5 T roubleshooter
Fast-Track® Troubleshooter is a database of experience-based information of validated
real-world repair strategies that have been compiled by top-notch technicia ns since 1988. T he
Troubleshooter system simplifies the d iagnosis pr ocess, as it contains information on virtually all
common diagnostic trouble code (DTC) problems and driveability symptoms for most vehicles
covered by the vehicle communication software.
Troubleshooter informatio n is organized into a series of diagnostic tips that are designed to quickly
lead you to the root cause of a p articular problem. The tips are vehicle-sp ecific, which means only
tips that relate to the identified vehicle are presented.
Troubleshooter appears in a Scanne r menu only if tips are available for the system selected on the
identified vehicle. Selecting opens a Troubleshoote r Menu th at typica lly include s:
• Code Tips—provides det ailed information on setting conditions, testing, and interpre ting test
results for specific codes.
• Symptom Tips—provides diagn ostic test s and pr ocedur es based on vehicle o peration.
• Time Savers—provides supplementa l information , such as firing order and #1 cylin der
location, that may be needed to make a diagnosis.
• Common Problems—provides advice and remedies for certain “pattern failures” that have
been experienced on vehicles of the same model.
• T ests and Procedures—explains how to perform certain tests on the specifi c test vehi cle.
Some tips provide specifications and installation information as well.
• Fast-Track Data Scan (Normal Values)—contains information and guidelines on how to
quickly validate data readings for certain sensor s and actuators, live data values are provide d
for comparison.
Certain live data parameter values display directly within the tip when performing Troubleshooter
tests and procedures. A tip may also contain a hyperlink to a T r oubleshooter Refere nce, another
test or procedure, or a supplemental oper ation, such as Cl ear Code s. Hyperlinks ar e shown in
blue, and tapping them opens the link. Troubleshooter References open in a separate window.
(
Figure 5-23).
41
Page 49

Scanner Operations Operations
IMPORTANT:
1— Live data values
2— Hyperlink
Figure 5-23 Sample data values within a Troubleshooter tip
5.5.6 Scanner Toolbar Operations
The Scanner toolbar is used to configure cert ain aspects of the displayed data and to exit. The
following sections explain how to use the toolbar .
Custom
The Custom button on the Scanner Toolbar is used to determine which specific parameters
display. Minimizing the number of parameters on the data list allo ws you to focus o n any
suspicious or symptom-specific data parameters. You can add or remove most parameters from
the list. Any parameter that has a lock icon next to it cannot be removed from the list.
Limiting the number of parameters to display only tho se that apply to a p articular situation allows
for a faster refresh rate of the dat a. A smaller dat a list s also redu ces the amount of memory used
for saved files.
z To create a custom data list:
1. Select Custom on the Scanner Toolbar .
The parameter selection dialog box with all of the parameters selected opens (
2. Tap the Deselect All button to clear the highlights from the screen.
Figure 5-24).
42
Page 50

Scanner Operations Operations
NOTE:
Figure 5-24 Sample custom configuration screen
3. Create a custom data list by tapping the parameters to be included. Highlighting indicates a
parameter that displays, parameters that are no t hi ghlighted do not display.
Keep the following in mind when configuring a custom data list:
– If the list of parameters is longer than what is shown on the screen, touch and drag the
screen to bring the additional parameters into view.
– Use the Select All button to display the complete list.
– Use the Deselect All button to remove all the currently selected p arameters from the list.
– Tap individual parameters to highlight and include them in the list.
– Tap individual highlighted parameters to remove them from the list.
– Use the Cancel button to return to the data display.
4. Once all desired parameters have been selected, retu rn to the d at a li st:
– Use the List View button to return to a data screen in PID List format.
– Use the Graph View button to return to a data screen in Graph View format (see
on page 45 for details.
View
Graph
i Graph View is only available when 16 or fewer parameters ( the numb er th at can di splay on a
single screen) were selected for the custom list. Make sure that no more tha n 16 pa rameters ar e
highlighted if the screen displays a single graph when the Graph View button is selected.
Alarms
Alarms are visual indicators alongside a parameter in the data display list that change color to
show the status of the signal. A green alarm indicates on, a gray alarm in dicates of f. Only dig it al
parameters, those with a range limited to two states, can h ave alarms. Parameters with
continuous ranges, such as variable voltage and pre ssure values, cannot ha ve alar ms.
The Alarms selection is used to configure visual indicators on certain data parameters. If a vehicle
does not provide signals for these functions, the alarm indicators are unused.
43
Page 51

Scanner Operations Operations
NOTE:
The alarm indicator assignments remain as selected until you exit the data list:
z To configure alarm settings:
1. Select the Alarms button on the Scanner Toolbar .
The Alarm List dialog box opens.
2. Check the parameters that you want to show alarms.
3. Select Save.
Alarm indicators now appear next to the selected parameter s in the Dat a List. The indi cators
are green when the value is on or high, and gray when the value is of f or low (
Figure 5-25).
Figure 5-25 Sample alarm indicators
i Alarms can only be set for certain parameters. If the Alarm List dialog box is empty , no parameters
are available and alarms cannot be set.
Properties
The Properties button on the Scanner Toolbar is used to configure certain characteristics of the
parameter graph display . Selectin g opens a Properties dialog box that allows you to adjust colors,
settings, and sweep (
Selecting either color option, Edit Plot Color or Edit Background Color, opens a st andard color
selection dialog box. select a color, then tap OK to close the dialog box.
The Show Grid button is used to switch a background grid pattern on the data graphs on and off:
• To switch the grid on; tap to highlight Show Grid, then tap Accept.
• To switch the grid off; tap Show Grid twice so it is not highlighted, then ta p Accept .
The Samples After Tr igger setting deter mines how many da t a samples ar e recorded following a
triggering event. The highlighted samples button indicates the num ber of frames that are included
in the recording after a triggering event.
Figure 5-26).
44
Page 52

Scanner Operations Operations
Figure 5-26 Sample properties dialog box
The sweep options let you choose the amount of data that displays across the graph. V alues are
in sample points, or frames of data. A frame of dat a equals one complete transmission of the serial
data by the control module.
Graph View
Graph View allows you to simultaneously displa y up to 16 p ar ameter g raphs (
graphs must first be opened in the data list in order to be include d when Graph View is selected
from the toolbar . The display default s to a single graph if more than 16 graphs are open when the
toolbar button is selected. Should this happen, return to the data list and close some of the graphs.
Figure 5-27). The
Figure 5-27 Sample Graph View screen
45
Page 53

Scanner Operations Operations
NOTE:
A simple toolbar in Graph View allows you switch sca le and sweep values on and of f, and to return
to the List View. The Data Buffer toolbar at the base of the screen remains active.
i The screen does not scroll in Graph View mode, it adjusts to show only the selected p ara meters.
Graph View mode can also be engage d from the custom data list configuration screen. Refer to
Custom on page 42 for details.
Save
The Save button is used to record movies of vehicle datastream values. Saved files and be helpful
when trying to isolate an intermittent problem or to verify a repair during a road test.
z To save a movie:
• Select Save.
A save movie dialog box displays while data is being saved. The movie is saved when th e
message box disappears.
Figure 5-28 Sample save dialog box
Saved files can later be viewed by selecting Data Manager on the ho me screen. From the Dat a
Manger open the Scanner Data Folder, then locate and select the saved file to be viewed.
Print
Selecting Print from the toolbar opens a standard Windows Prin t dialog box. Select fro m the
options as needed to print the current frame of data.
46
Page 54

Scanner Operations Operations
NOTE:
Figure 5-29 Sample print dialog box
If the Display Device is connected to a printer, the current frame of data is printed. If the Display
Device is not connected to a printer, the frame of data is saved as an “XPS” file. A dialog box
opens so that you can name the print file and specify the location that it is saved to, follow the
on-screen instructions.
Saved files can be printed at a later date, or opened and reviewed .
i Saved print files cannot be viewed using the Data Manager, they can only be opened into an
internet browser .
z To open a saved print file:
1. Minimize the Diagnostic Suite to view the desktop.
2. From the desktop select My Document s > Sh opS tream > Scanner Da ta Folder.
3. Locate the file you wish to view.
4. Double tap the file to open it.
The internet browser launches and the file opens.
More
Whenever the More button appears on the toolbar it indi cates th at there ar e additio nal options
available. Selecting the More button from the Scanner toolbar opens a dropdown menu that offers
two choices that only apply to data graphs:
• Scale
• Sweep
Scale
The Scale option switches the scale values, displayed along the left-hand side of the data graphs, on and
Figure 5-30). The dropdown menu closes once a selection is made.
off (
47
Page 55

Scanner Operations Exiting the Scanner
Figure 5-30 Sample data graph scales
Sweep
The Sweep option switches the sweep values, displayed below the data graphs, on and off
Figure 5-31). The dropdown menu closes once a selection is made.
(
Figure 5-31 Sample data graph sweep
5.6 Exiting the Scanner
The Scanner remains open as long as there is an active communication link with the vehicle. You
must disconnect this co mmuni cat ion link in o rder to exit fro m Scanner te st s and clo se the
Diagnostic Platform software. A war ning me ssage di splays if you attempt to shut down while the
Scanner is communicating with an ECM.
48
Page 56

Scanner Operations Downloading Firmware
NOTE:
i Damage to the vehicle electronic control module (ECM) may occur if communication is disrup ted.
Make sure the data cable and th e USB cable a re pr operly connected at a ll times during testing.
Exit all tests before disconnecting the test cable or powering down the tool.
z To exit the Scanner:
1. From an active screen, select Exit from the Scanner Toolbar to return to the Systems Menu.
2. From the Systems Menu, select Back from the Scanner dat a menu .
A “stopping communications” message briefly displays followed by the Scann er main menu .
Now, the Sca nner is no longer communicating with the vehicle and it is safe to return to the Home
screen and exit the Diagnostic Platform software.
5.7 Downloading Firmware
The internal programming of the Scan Module, known as the firmwa re, can be updated using the
VERUS Diagnostic Platform. Firmware updates increase the Scan Module diagnostic capabilities,
typically by adding new tests, new models, or enhanced application s to th e dat ab ases.
The display device automatically searches for available updates for all of the VERUS component s
when it is connected to the internet. Any updates that are found ar e downloaded and stored on the
device. However , the update mu st be inst al led in order to comp lete the pr ocess. This section
describes installing an update to the Scan Module firmware. A notification message displays if an
update is available when Scanner is selected from the VERUS Home scre en (
Figure 5-32 Firmware update available message
Figure 5-32).
The firmware update process, as explained in the following procedure, begins automatically after
ten seconds unless the U pdat e Now or Update Later button is selected. Selecting Update Now
begins the process immediately. Update Later defers the operation, closes the message, an d
launches the Scan Module. Not updating does not imp act operatio ns, the Scan Modu le remains
49
Page 57

Scanner Operations Downloading Firmware
NOTE:
fully functional but may not benefit from the add itional features a vailable in the upda te. Selecting
Details in the upper-right corner opens a list of what is included in the update.
z To update the firmware:
1. Power on the Display Device.
2. Connect the Scan Module to the Display Device as follows (
a. From the bottom of the Scan Module, gently lift up and out on the sides of the han dgrip to
free it from housing.
b. Open the hinged cover on the base of the Scan Module to expose the USB port.
c. Plug the small end of the USB cable into the USB port on the Scan Module.
d. Plug the large end of the USB cable into o ne of the port s on the side of the display device.
Figure 5-33):
1— Hinged cover
2— USB port
Figure 5-33 Scan Module service port
i The Scan Module and Display Device must be connected with the USB cable to update the
firmware. The USB cable powers the Scan Module so there is no need to conn ect to a vehi cle.
3. Select Scanner from the Display Device Home screen.
4. Select OK when the firmware update notification displays (
The update begins and installation progr ess is tracke d on the screen (
50
Figure 5-32).
Figure 5-34).
Page 58

Scanner Operations Downloading Firmware
Figure 5-34 Sample update in progress screen
A “Reprogramming succeeded” message displays on ce the installation process is complete
Figure 5-35).
(
Figure 5-35 Sample firmware update complete message
5. Select OK to close the message and return to Scanner operations.
The Scan Module, with the latest firmware update, is now read y to use.
51
Page 59

Chapter 6 OBD Direct Operations
This Home screen option allows you to access Generic OBD-II/EOBD Scanner tests without
completing a vehicle identification. OBD Direct presents a quick way to check for diagnostic
trouble codes (DTCs), isolate the cause of an illuminated malfunction indicator lamp (MIL), check
monitor status prior to emissions certification testing, verify repairs, and perform a number of other
services that are emissions-related. This mode is also used for testing OBD-II/EOBD compliant
vehicles that are not included in the Scanner dat abase s.
OBD Direct is a Scanner function, and the Scan Module must be connected to the test vehicle and
communicating with the Display Device. This function only provides generic OBD-II/EOBD
information. To access enhanced OBD-II/EOBD functions, select Scanner from the Home screen.
Selecting OBD Direct on the Home screen opens a menu with two options (
Figure 6-1 Sample OBD Direct main menu
Figure 6-1):
6.1 OBD Health Check
The OBD Health Check offers a way to quickly che ck for and clear gener ic diagnostic tr ouble
codes (DTCs) and to check readiness monitors. Selecting OBD Health Check opens a submenu
of options (
Figure 6-2).
52
Page 60

OBD Direct Operations OBD Health Check
Figure 6-2 Sample OBD Health Check menu
6.1.1 Global OBD II Code Check
This option displays any stored emission related generic DTCs reported by the ECM. Selectin g
opens a submenu with two choices: Codes and Pending Codes.
Select an option to display the code list. Refer to
Vehicle Communication Software Manual for additional information.
Codes
Codes displays a list of current emission related DTCs. OBD-II/EOBD Codes have a priority
according to their emission severity, with higher priority codes overwriting lower priority codes.
The priority of the code determines the illumination of the MIL and the code erase procedure.
Manufacturers rank codes dif feren tly, so expect to see differences between makes.
Pending Codes
The purpose of this service is to enable the scan tool to obt ain “pen ding” o r maturing d iagnostic
trouble codes. These are codes whose setting conditions were met during the last drive cycle, bu t
need to be met on two or more consecutive drive cycles before the DTC a ctually se t s.
The intended use of this service is to assist the service techn ician af te r a vehicle r ep air and af ter
clearing diagnostic information, by reporting test results after a sing le driving cycle.
Codes Menu on page 36 and the Global OBD
• If a test failed during the driving cycle, the DTC associated with that test is reported. If the
pending fault does not occur again within 40 to 80 warm-up cycles, the fault is automatically
cleared from memory.
• T est results repo rted by this service do not necessarily indicate a faulty component or system.
If test results indicate another failure after additional driving, then a DTC is set to indicate a
faulty component or system, and the MIL is illuminated.
53
Page 61

OBD Direct Operations OBD Health Check
6.1.2 Global OBD II Clear Codes
This option is used to clear all emission related diagnostic data such as, DTC records, free ze
frame data, and test results, from ECM memory. Although OBD Direct only displays generic
OBD-II data, clearing codes erases all of the stored data including any enhanced codes.
A confirmation screen displays when the clear codes option is selected to prevent accidental loss
of data. Select Y es on the confirmation screen to continue. Refer to
the Global OBD Vehicle Communicatio n Software Manual for additional information.
Codes Menu on page 36 and
6.1.3 Readiness Monitors
Use this menu option to check the readiness of the monitoring system. An OBD-II/EOBD system
checks the status of emission-related subsystems by running continuous or periodic te st s. Test
results are shown in the data viewer (
Figure 6-3).
Gesture sweep to view the entire list of Readiness Monitors to ensure that all tests are complete.
It is possible to print the readiness test status or save it as part of a Vehicle history.
6.1.4 MIL Status
This item is used to check the current condition of the Malfunction Indicator (MIL ). Additional
information, such as which ECM commanded the MIL on a nd the dist ance driven while the MIL is
on (if supported), can also be displayed. It is also possible to print the MIL Status.
Figure 6-3 Sample readiness monitor test report
54
Page 62

OBD Direct Operations OBD Diagnose
6.2 OBD Diagnose
Selecting OBD Diagnose opens a menu with the following options:
• Star t Commu nication—begin s the test session
• Select Communication Protocol—allows you to select which protocol to use
• Connector Information—provides data link conn ector ( DLC) loca tion details for most models
6.2.1 Start Communication
Use the following procedure to conduct an OBD Direct test session:
z To perform an OBD Direct Test:
1. Select Start Communications from the OBD Dir ect menu.
A generic connection message displays (
test vehicle as instructed.
Figure 6-4), connect the Scan Module to the
Figure 6-4 Sample generic connection message
2. Select Continue.
A communications message that shows how many ECMs were detected, Which ECM is
communicating, and which communication protocol is being used displays (
55
Figure 6-5).
Page 63

OBD Direct Operations OBD Diagnose
Figure 6-5 Sample communication message
3. Select Continue and a menu of available tests displays (
Figure 6-6 Sample Start Communication menu
4. Select a test to continue.
Figure 6-6).
Readiness Monitors
Use this menu item to check the readiness of the monitoring system. If a moni tor system is n ot
supported, it is not displayed. Scroll, if needed, to view the entire list of monitors. Selecting
Readiness Monitors opens a submenu with two choices:
• Monitors Complete Since DTC Cleared—displays the results of all monitor tests that have run
since the last time the electronic control module (ECM) memory was cleared.
• Monitors Complete This Cycle—displays only the results of monitor tests that ran during the
current drive cycle, they reset when the ignition is switched off.
56
Page 64

OBD Direct Operations OBD Diagnose
MIL Status
This item is used to check the current condition of the Malfunction Indicator (MIL ). Additional
information, such as which ECM commanded the MIL on and also the distance tra velled while the
MIL is on (if supported), can also be displayed. It is also possible to p rint the MIL Status.
Fast-Track Troubleshooter
Fast-Track® Troubleshooter is a database of experience-based information of validated
real-world repair strategies that have been compiled by top-notch technicia ns since 1988. T he
Troubleshooter system simplifies the d iagnosis pr ocess, as it contains information on virtually all
common diagnostic trouble code (DTC) problems and driveability symptoms for most vehicles
covered by the vehicle communication software.
($01) Display Current Data
Use this item to display the current emission related data from the selected electronic control
module (ECM) of the vehicle. Displayed data includes analog inputs and output s, digital inputs and
outputs, and system status information broadcast on the vehicle data stream.
($02) Display Freeze Frame Data
This item is used to display freeze fame data for any stored emission related diagnostic trouble
codes (DTC). In most cases the stored frame is the last DTC that occurred. Certain DTCs, those
that have a greater impact on vehicle emission, ha ve a higher priority. In these cases, the highest
priority DTC is the one for which the freeze frame records are re t ained.
Freeze frame data includes a “snap sho t” of crit ical parameter values at the time the DTC set.
($03) Display Trouble Codes
This is used to display any stored emission related DTCs reported by the various ECMs.
($04) Clear Emissions Related Data
This item is used to clear all emission related diagnostic data such as, DTCs, freeze frame data,
and test results from the memory of the selected ECM.
($05, 06, 07) Display T est param./Results
This selection opens a submenu of test parameters and test results form various sensors, such as
the oxygen sensor (O2S), monitor test results, and a record of DTCs detected during the last drive
cycle. The menu includes:
• Oxygen Sensor Monitoring ($05)
• Specific Monitored Syste ms ($06)
• DTCs Detected During Last Drive ($07)
57
Page 65

OBD Direct Operations OBD Diagnose
($08) Request Control of On-board System
This service enables bidirectional control of the ECM, that is the Scanner transmits control
commands to operate the vehicle system. This function is useful in determin ing how well the ECM
responds to a command.
Available options vary by make, model, and yea r of the test veh icle. Select a test and follow the
on-screen instructions.
($09) Read V ehicle Identification
This selection displays the vehicle identification number (VIN), the calibration identification, a nd
the calibration verification number (CVN) of the test vehicle.
($09) In-use Performance Tracking
This selection displays the “In-use Performance Tracking” of monitored data. It is basically a
record of the number of times each of the monitor tests have bee n completed.
6.2.2 Select Communication Protocol
A communication protocol is a standardized way of dat a commun ication b etween an ECM a nd a
scan tool. Global OBD may use several different commun ication pr otocols.
Touch Select Communication Protocol to open a menu of options (
Figure 6-7).
Figure 6-7 Sample communication protocol menu
When the All Protocols setting is used the Scanner attempts to estab lish commu nication using
each protocol on order to determine which one the vehicle is broadcasting on.
58
Page 66

OBD Direct Operations OBD Diagnose
6.2.3 Connector Information
This option opens a database of vehicle diagnostic connector locations that includes most makes
and models. The menu driven interface leads you quickly to the dif ficu lt to fin d test connecto r.
z To locate a vehicle diagnostic connector:
1. Select Connector Information from the System menu.
2. Select a manufacturer from the list presented.
3. Select a model from the list presented.
Instructions for which, if any, cable adapter or pin to use displays.
4. Select Continue.
Information on where to locate the vehicle dia gnostic conn ector di splays.
5. Select Continue to return to the System menu.
59
Page 67

Chapter 7 Component Test Operations
:$51 ,1*
IMPORTANT:
The Component Test software is a component-testing power house, pro viding yo u with a robust
diagnostic database for use with scopes and meters. It is like having access to a complete library
of shop manuals for testing engine-management compo nent s , transmission se nsors and
components, and ABS systems.
Component Test helps you with everything from selecting the appro priate test for a specific
component to showing the hook-up location and correct pin configu ration. This sof twa re
thoroughly guides and instructs you o n proper testing procedur es and offe rs tips from the internal
troubleshooter database. The component test pro cedu res, tips , and mete r settings redu ce your
overall set-up and diagnostic testing time. Vehicle-specific component tests are provided for
engine, transmission, ABS, charging, transfer case and suspension systems.
Risk of electrical shock.
• Read the Important Safety Ins tructions document provided sep arately for messages o n
the safe use of this product.
• This product is intended for Measurement Category I (for example, automotive 12V
systems), do not use this product for Measurement Categories II, III, and IV.
• Measurement Category I is for performing measurements on circuits not directly
connected to MAINS or MAINS circuits (an example of a MAINS circuit is 120V AC or
240V AC household or industrial electricity), do not connect this product to MAINS or
MAINS circuits.
• Do not apply the Black Ground Lead to test points other than ground/system return/
vehicle chassis.
Electrical shock can cause personal injury, equipment damage, or circuit damage.
Maximum rated transient over voltage impulse is 5 00 volts, do not exceed the rated
transient over voltage.
7.1 V ehicle Identification
The component test information presented is specific to the vehicle being tested. Therefore,
certain attributes of the test vehicle must be en tere d into the Diagnostic Pla t form so that th e
correct data can be retrieved. Vehicle identification information is carried over if you enter the
Component Test module either from the Scan Module or from one of the record s stored in the
Vehicle History mod ule. However, you may need to enter additional attributes in some instances.
The vehicle identification sequence is menu driven, you simply follo w the scree n prompts and
make a series of choices. Each selection you make advances you to the next screen.
60
Page 68

Component Test Operations Vehicle Identification
7.1.1 Creating a Favorites List
Once a Component Test database is loaded, a list of manufacturers displays. This list is often long
and includes makes that are not frequently used. A toolbar a t the top of the scr een allows you to
custom configure the manufacturer list to display only the makes you frequently service.
Figure 7-1 Sample manufacturer list
z To custom configure the manufacturer list:
1. Tap Configure Favorites on the toolbar.
A list of selectable manufacturers displays.
Figure 7-2 Sample Configure Favorites screen
2. Tap each manufacturer you want to include, selected manufactures are highlighted.
61
Page 69

Component Test Operations Vehicle Identification
NOTE:
i Manufacturers appear on the favorites list in the order in which they are selected. Therefore, if you
select the makes you work on most frequently first, they will appear at the top of the list.
3. Tap Finished on the toolbar once your selections have been made.
The screen returns to the manufacturer list, but only the makes you selected display. Note the
“Favorites” toolbar selection now reads “Full list”.
4. Tap Full List on the toolbar to view the complete list of manufacturers.
5. Tap Back on the toolbar at any time to return to the previous screen.
Your favorites list is what will display whenever a Component T est dat abase is launched in the
future. The list can be modified at any time by selecting Configure Favorites from the toolbar .
7.1.2 Identifying a Test Vehicle
Exact procedures to identify the test vehicle may vary somewhat by vehicle a nd marke t. The
following procedure, which identifies a 2008 Ford Focus for testing the fuel injection system, is
typical of what to expect.
z To identify a vehicle for Component Test:
1. Tap the Component Test module button from the Home screen.
2. Select which database to load for the test vehicle if requested (optional).
After the database loads, a list of manufacturers displays.
3. Select FORD and a list of systems available for testing displays (
Figure 7-3).
Figure 7-3 Sample available systems menu
4. Select FUEL INJECTION and a model year menu displays.
5. Select 2008 from the year menu and a list of available models d isplays.
6. Select FOCUS from the model list and a list of available engines displays.
7. Select 2.0L ZETEC from the engine list and a confirmation dialog box displays (
62
Figure 7-4).
Page 70

Component Test Operations Vehicle Identification
NOTE:
Figure 7-4 Sample confirmation dialog box
8. From the confirmation dialog box, select OK to continue, or Cancel to return to the engine list.
A list of tests available for the identified vehicle displays (
Figure 7-5).
Figure 7-5 Sample available tests list
9. Select a test to continue.
The identification sequence is now complete, refer to the Operations section that follows for
details on how to navigate through the Co mponen t Test information and perform tests.
i If you return to the Home screen and select Scanner or Information the vehicle identification
entered here is carried over. However, additional information m ay be needed by some modules.
63
Page 71

Component Test Operations Operations
7.2 Operations
The Component Test software provides vehicle specific component test pro cedure s and
information that aid in setting up scopes and me ters. Once a test vehicle is identified, you can
select a component test from the list of available test s. For most selections two main choices are
available on the component menu:
1. COMPONENT INFORMATION—provides information o n the selected com ponent a nd
connector pin details that assists you in und erst a nding the components prior to diagnosis.
2. TESTS—provides a pre-configured list of tests, guides you through performing the tests, and
offers tips and resour ces to re duce setup an d testing time.
7.2.1 Component Information
Component Information provides details on specific vehicle compon ent s to p rovide a better
understanding the components p rior to diagn osis.
The Component Information screens contain information to assist you with testing. The screens
are divided in sections to help quickly guide you to the correct information (
Figure 7-6):
Figure 7-6 Sample Component Information screen
• Operation—provides a general description of normal component opera tion.
• Connector—displays the component connector and lists pin a ssignment s.
• Location—identifies the component location and the best place for testing it.
• T ech note—provides componen t test-related tips (for example, common failures or faults) as
well as update or recall information.
z To view component information:
1. Select a component from the tests list.
2. Select COMPONENT INFORMATION from the compone nt menu.
64
Page 72

Component Test Operations Operations
NOTE:
NOTE:
i An additional selection, such as front or rear for an oxygen sensor (O2S), may be required befor e
advancing to the component information screen.
The component information screen displays (
edge of the screen appears if there is additional in formation b elow what is visible.
3. Gesture sweep to view any additional information.
4. Select Back at any time to return to the previous screen.
Figure 7-6). A scroll indicator along the right
7.2.2 Tests
The Tests section guides you through the process of performing tests on a specific component. It
also provides specifications, tips on how and where to connect the test meter leads, and also
automatically configures the multimeter or lab scope to perform the se lected test.
Once a test vehicle is identified, you can select a component from the available test s list.
z To select a test:
1. Select a component from the list.
2. Select TEST to open the list.
i More than one selection is available in some instances. For example, a primary and a secondary
tests selection display when ignition tests is selected.
The list shows all of the tests available for the selected compon ent, choices var y by make,
model, and year.
Selecting opens an additional submenu similar to the one shown in
than one option is available.
Figure 7-7 when more
Figure 7-7 Sample O2S voltage test submenu
65
Page 73

Component Test Operations Operations
3. Select a test option and the test screen displays (Figure 7-8).
Figure 7-8 Sample Test screen
4. Gesture sweep to view any additional information.
A scroll indicator displays momentarily along the righ t edge of the screen if there is additional
information below what is on the screen.
5. Select Back at any time to return to the previous screen, or select Exit to return to the main
component menu.
Hyperlinks
Component test screens contain hyperlinks that can either t ake you to an other page containing
additional information or open an additional wi ndow on top o f the current screen . Hyperlinks
display as buttons. Common hyperlinks are:
– View Meter—opens a live meter set up to perform the test in the lower portion of the
screen (
of the screen is replaced by the Scope Multimeter toolbar, which allows you to make
adjustments to the settings. See
– Show More Information—advances to a new screen with more detailed information
about a particular test, select Back to return to the test screen.
View Meter
A Meter button, which is only available in the Component Test view meter mode, appears on the
upper toolbar (
Figure 7-9). Once the meter view is open, the Component Test toolb ar at the top
Scope Multimeter Toolbar on page 75 for details.
Figure 7-9).
66
Page 74

Component Test Operations Operations
Figure 7-9 Sample view meter window
Three view meter options are available:
1. With View Meter active (
Figure 7-9), tap the Meter button on the toolbar once and the meter
expands to fill the entire screen.
2. Tap the Meter button a second time and the meter open as a separate window (
Figure 7-10).
This window can remain open if you switch to the Scan Module and can be accessed from the
Windows toolbar at the bottom of the screen. You can also resize and reposition the meter
window on the screen.
Figure 7-10 Sample meter view in a separate window
Tapping the Close button (red box with an X) when viewing the meter in a separate window
closes the meter and returns you to the Component Test screen.
3. Tap the Meter button a third time to close the separate window and return to the standard
meter view as shown in
Figure 7-9.
Select Exit from the toolbar to close meter view and return to the Component Test screen.
67
Page 75

Component Test Operations Operations
IMPORTANT:
Connecting to a Test Vehicle
Before performing a test, you must connect the meter test leads to the vehicle. Certain compone nt
tests require the use of specific leads. Information on specific leads and other connecting
information displays on the initial test screen. Follow the on-screen connection instructions in the
test procedure to connect the test leads.
Performing a Test
Once you connect the te st lea ds to the vehicle, you can proceed with testin g.
z To perform component tests:
1. Follow the instructions displayed in the test procedure section.
2. Gesture sweep to view all of the instructions and follow the on-screen procedur es.
3. Select the View Meter hyperlink to display test results.
4. Refer to the on-screen information to verify test results.
Refer to Scope Multimeter Operations on page 69 for additional information on wor king with the
View Meter window.
68
Page 76

Chapter 8 Scope Multimeter Operations
:$51 ,1*
IMPORTANT:
NOTE:
This Scope Multimeter module provides all the tools needed for pe rforming ele ctrical an d
electronic circuit tests and for monitorin g signals and circuit activity. The Scope Multimeter module
easily separates from the Display Device and connects with a USB cable so that test results can
be remotely monitored as you perform other tasks.
The Scope Multimeter works interactively with other modules. Selecting “V iew Me ter” from a
Component Test or Scanner test launches the Scope Multimeter module.
Risk of electrical shock.
• Read the Safety Information provided for import ant warnings on t he use of this product
• This product is intended for Measurement Category I (for example, automotive 12V
systems), do not use this product for Measurement Categories II, III, and IV.
• Measurement Category I is for performing measurements on circuits not directly
connected to MAINS or MAINS circuits (an example of a MAINS circuit is 120V AC or
240V AC household or industrial electricity), do not connect this product to MAINS or
MAINS circuits.
• Do not apply the Black Ground Lead to test points other than ground/system return/
vehicle chassis.
Electrical shock can cause personal injury, equipment damage, or circuit damage.
Maximum rated transient over voltage impulse is 5 00 volts, do not exceed the rated
transient over voltage.
8.1 Remote Scope Multimeter Setup
The Scope Multimeter module can be removed from the Display De vice, the n connected to the
Display Device with a USB cable. This increases the range of mobility for the Display Device while
monitoring signals on the test vehicle. A T ype A/B USB cable, which is provided with your kit,
makes the connection.
i The Scope Multimeter module can be removed from the Display Device at any time, whether
powered on or not. However, data and settings will be lost if it is removed while operating.
To prevent accidental loss of data, make it a practice to first save the current data if desired, then
select either the Power Off or Back button from the toolbar to suspend meter operation. Power
Off saves the current settings, but does not save data. Settings are not saved if Back is selected.
69
Page 77

Scope Multimeter Operations Getting Started
z To setup the Scope Multimeter for remote viewing:
1. Depress the Scope Multimeter module release tab located on the top of th e unit (
Figure 8-1 Scope Multimeter release tab
2. Slide the Scope Multimeter module free of the Display device.
3. Open the USB port cover on the bottom of the Scope Multimeter module (
Figure 8-2 Scope Multimeter module USB port location
4. Connect the square end of the USB cable to the port on the Scope Multimeter.
5. Open the hinged cover on the left- hand side of the Display Device (
Figure 8-2).
Figure 8-3).
Figure 8-1).
1— Hinged cover
2— USB ports
Figure 8-3 Scope Multimeter module USB port location
6. Connect the rectangular end of the USB cable to either of the two ports on the Display Device.
The Scope Multimeter is now ready for remote use.
8.2 Getting Started
The Scope and Multimeter module enables the following functions:
• Lab Scope
• Ignition Scope
• Graphing Multimeter
• Digital Multimeter
70
Page 78

Scope Multimeter Operations Getting Started
8.2.1 Capabilities
The following tables detail the software and hardware capabilities.
Table 8-1 Scope
Function
Ch. 1—yellow banana jack
Signal Measurement
Sample Rate
Bandwidth DC–3 MHz 3 db point @ 3 MHz
Input Impedance
VDC (Full Scale) 100mV–400V Do not measure greater than 75VDC
VAC (Full Scale) 100mV–400V Do not measure greater than 50VDC (rms)
Table 8-2 Graphing Multimeter
Function
Signal Measurement
Sample Rate 1.5 MSPS
Bandwidth DC–3 MHz 3 db point @ 3 MHz
Input Impedance
VDC (Full Scale) 75VDC Do not measure greater than 75VDC
VAC (Full Scale) 50VAC Do not measure greater than 50VDC (rms)
Low Amp Probe
Ch. 2—green banana jack
Ch. 3—blue banana jack
Ch. 4—red banana jack
Single trace mode = 6 MSPS
(Ch. 1 only)
Dual trace mode = 3 MSPS
(Ch. 1 & 2 only)
Four trace mode= 1.5 MSPS
(Ch. 1–4)
10 MOhm
4kOhm @ 3MHz
Ch. 1—yellow banana jack
Ch. 2—green banana jack
10 MOhm
4kOhm @ 3MHz
20A scale (100mV/Amp)
40A scale (10mV/Amp)
Range
@ DC
Range
@ DC
Each channel input is referenced to
common ground input (GND—black banana
jack)
Continuous sampling,
MSPS = mega samples per second
Channel 1–4
Each channel input is referenced to
common ground input (GND—black banana
jack)
Continuous sampling,
MSPS = mega samples per second
Channel 1–4
Connect Low amp Probe (+) to Ch. 1
(yellow banana jack) and (–) to GND input
(black banana jack).
See NOTE below.
Accuracy/Comments
Accuracy/Comments
Table 8-3 Digital Multimeter
Function
Signal Measurement Ch. 1—yellow banana jack
VDC (Full Scale) 75VDC Do not measure greater than 75VDC
VAC (Full Scale) 50VAC Do not measure greater than 50VDC (rms)
Signal Measurement
Input Impedance
Ohm Measurement
Diode Test
Continuity Test
Ohms 400 Ohm–40 MOhm Fixed scales or Auto Ranging
Glitch capture Approximately 50 uS
Diode Test 2 V Scale
10 MOhm
Ch. 3—blue banana jack
Ch. 4—red banana jack
Range
Channel 1 input is referenced to common
ground (GND—black banana jack)
Each channel input is referenced to
common ground (GND—black banana jack)
71
Accuracy/Comments
Page 79

Scope Multimeter Operations Getting Started
NOTE:
IMPORTANT:
IMPORTANT:
i 200V to 400V scales are not to be used to measure signals greater th an 50 VAC (rms) or 75VDC.
Do not use the Low Amp Probe to measure current on conductors at a poten tial greater than
46V AC pe ak or 70VDC.
8.2.2 Leads, Probes and Adapters
The Scope Multimeter uses standard safety ban ana plug s that are compatible with many
accessories. The various leads, probes, clips, and adapters that ar e supplied with, or available as
optional equipment, are explained in this section.
When removing leads from their sockets, do not pull on the wire because it can damage the leads.
Pull on the plug.
Channel 1 Lead
Figure 8-4 Yellow Channel 1 Lead
The shielded yellow lead is used for Channel 1 (
need additional grounding. The lead color matches the colo r of socket 1 on the Display Device and
the color of trace 1 on the test screens.
This yellow lead includes a black, right-angle, common ground plug an d a black, st ackab le,
common ground plug. The non-st ackable ground plug always con nects to th e ground (GND) port
on top of the unit. The stackable ground plug is used for conn ecting additional leads, such as the
Channel 2 Lead or the Secondary Coil Adapter Lead, that require groun ding. The st ackable lead
grounds through the non-st ackable lead and does not need to be connected to the port on the uni t.
Figure 8-4) and other channel connections that
Channel 2 Lead
Figure 8-5 Green Channel 2 lead
The shielded green lead (
socket 2 on the Display Device and the color of trace 2 on the test screens. This green lead
includes a stackable, black, right-angle ground p lug.
Figure 8-5) is used for Channel 2. The lead color matches the color of
72
Page 80

Scope Multimeter Operations Getting Started
Channel 3 Lead
Figure 8-6 Blue Channel 3 lead
The non-shielded blue lead (
Figure 8-6) is used for either Channel 3 or Digital Meter minus (–).
The lead color matches the color of socket 3 on the Display Device, as well as the color of trace 3
on the test screen.
Channel 4 Lead
Figure 8-7 Red Channel 4 lead
The non-shielded red lead (
Figure 8-7) is used for either Channel 4 or Digital Meter p lus (+). The
lead color matches the color of socket 4 on the Display Device, as well as the color of trace 4 on
the test screen.
Alligator Clips
Figure 8-8 Alligator clip
Insulated alligator clips, colored to match each test lead, are included. A black clip for the common
ground lead is also supplied (
Figure 8-8). Each clip plugs into the straight end of a channel lead.
Test Probes
Figure 8-9 Test probe
Two te st probes ar e included , one black an d one red (
straight end of the test leads.
73
Figure 8-9). The test probes plug into the
Page 81

Scope Multimeter Operations Getting Started
Secondary Coil Adapter Lead (optional)
Figure 8-10 Secondary Coil Adapter lead
The optional Secondary Coil Adapter lead (
Figure 8-10) connects to the clip-on secondary wire
adapter , coil-in- cap adap ter or coil- on-plug a dapter to display secondary wa veforms.
Secondary Ignition Clip-on Wire Adapter (optional)
Figure 8-11 Secondary Ignition Clip-on Wire Adapter
The optional Secondary Ignition Clip-on Wire Adapter (
Figure 8-11) connects the Secondary Coil
Adapter lead to a secondary ignition lead on the vehicle to display ignition patterns.
Inductive RPM Pickup Adapter (optional)
Figure 8-12 Inductive RPM Pickup adapter
The optional Inductive RPM Pickup adapter (
Figure 8-12) connects to the scope auxiliary port of
the Display Device with a DB9F plug. It can be used to trigger a waveform or display RPM. With
the Ignition Scope, the RPM Pickup connects to cylind er number one to est a blish the fir ing or der.
Low Amp Current Probe (optional)
The optional Low Amp Current Probe provides accura te and re liabl e non-intru sive testing of
ignition coils, fuel injectors, fuel pumps, relays, electric motors, and parasitic draw . Use to
measure current from 10 mA to 60 Amps with a r esolution of 1 m A.
Figure 8-13 Low Amp Current Probe
74
Page 82

Scope Multimeter Operations Navigation
8.3 Navigation
The following section describes how to navigate the screen interface.
8.3.1 Screen Layout
The screens typically include the following sections (
Figure 8-14):
• Scope Multimeter T oolbar—allows you to co nfigure the tool for the type of test and to adjust
the settings for each channel, or trace.
• Main Body of the screen—displays test results. Options on the toolbar let you select h ow
tests display on the screen.
• Trace De t ails—displays trace settings, which can be adju sted or switched through the touch
screen
• Record/Playback Control T oolbar—allows you to record and navigate th rough paused data.
1— Scope Multimeter toolbar
2— Main body
3— Trace Details
4— Record/Playback Control toolbar
Figure 8-14 Scope Multimeter screen layout
Scope Multimeter Toolbar
The Scope Multimeter toolbar is used to set up the tool for testing and to configure the settings for
each trace.
Table 8-4 on page 76 gives brief descriptions of the control buttons on the toolbar:
75
Page 83

Scope Multimeter Operations Navigation
Table 8-4 Scope Multimeter toolbar buttons
Name
Back Returns to the previously viewed screen.
Button
Description
Setup
Data
Cursors
Refresh
File
Print
Power Off
Main Body of the Screen
Opens a dialog box that allows you to select
personal preferences for viewing and saving data.
Switches the trace information displayed at the base
of the screen between three available states.
Opens a dialog box that allows you to switch cursors
on and off, and to reposition them on the screen.
Clears the Min/Max and Current values on the trace
details section of the screen.
Opens a dialog box that allows you to select options
for saving data.
Opens a dialog box that allows you to configure and
print data.
Switches the Scope Multimeter off. This retains the
settings and reduces battery drain when switching to
a different module. The Play and Record buttons on
the Playback toolbar switch the meter back on.
The main body of the screen varies depending on what display options have been selecte d. Up to
four traces, along with digital readout s of cur rent signa l values, signa l st at us and trigg ering
conditions, can be displayed simultaneously on the main body of the screen. Adjustments to the
display are made through the scope toolbar as explained above.
Each trace is displayed as voltage over time on a standard oscilloscope screen. V olt age level is
recorded on the vertical, or “y”, axis and time is presented on the horizon t al, or “x” , axis of the
screen. V a lues are sho wn for each g raduati on on the scales.
When using transducers, the pressure being sensed by the transducer is converted into a voltage
signal. However, the values are shown as pressure on the display screen rather than voltage.
Trace Details
The Trace Det ails section disp layed at th e base of the screen ca n be used to quickly adjust
settings for capturing the trace. The Trace det ails are accessed using either the Data button on the
upper toolbar or the Touch and Grow button on the Playback toolbar. Both buttons function the
same and cycle the Trace Det ails se lection through th ree st ates:
• Displayed—trace settings are displayed in this mode
• Explanded—trace settings are displayed in a larger format in this mode
• Off—trace settings are not displayed in this mode
76
Page 84

Scope Multimeter Operations Navigation
Adjustments are made by tapping th e item to be cha nged on the touch screen. A da sh (–)
indicates a function that is not selected, and an icon indicates an active function (
Figure 8-15).
1— Peak Detect on
2— Filter on
3— Inverted trace
4— Coupling AC on
5— Sweep setting
6— T rigger setup
7— Trigger set on the rising slope
Figure 8-15 Sample data detail display
The following trace adjustments and settings are availab le:
• Profile—switches the trace for the selected channel on and off.
• Channel—opens a dialog box that allows you to configure the trace setup (see
on page 81 for details).
Trace Controls
• Probe—opens a dialog box that allows you to select the type of test probe being used.
• Peak Detect—maximizes the signal sampling rate in order to capture fast events, such as
spikes, glitches and other anomalies, that may normally be undetected .
• Filter—smooths out the trace when the signal is disrupted by noise or other interference.
• Inverted—switches the polarity of the displayed signal.
• Coupling AC—subtracts the average value of the waveform by blocking the DC por tion of an
input signal to amplify the AC portion. This makes small variations in the trace visible.
• Scale—opens a dialog box that allows you to select the scale, which is the total value
displayed on the vertical axis of the display.
• Sweep—the current sweep setting is shown in white at the end of the scale list, selecting
opens a dialog box that adjusts the sweep (see
Sweep Controls on page 83 for details).
• Slope—only active when a trigger is set, indicates whether the trigger is set to activate on the
rising or falling slope of the trace. Tapping the slope icon switches the slope. The white dash
77
Page 85

Scope Multimeter Operations Navigation
at the bottom of the slope column is used to set the trigger, selecting it opens the trigger setup
dialog box (see
Trigger Controls on page83 for details).
Record/Playback Control Toolbar
The record/playback control toolbar at the base of th e screen is used for r ecording d at a and fo r
reviewing paused data. Use the stylus or your finger tip to activate the buttons. A position counter
in the toolbar
Use the slider in the middle of the toolbar to quickly move through paused data.
displays a numerical value of where the current screen is in relation to the entire recorded file.
Figure 8-16 Sample data buffer slider
Use the toolbar buttons (
Table 8-5 Data buffer toolbar buttons (part 1 of 2)
Name
Snapshot
Step Back Moves to the previous point in the recorded data
Back 1Frame Moves to the previous frame in the recorded buffer
Stop Stops recording data
Record Begins recording data
Play Recording
Table 8-5) to more precisely navigate the data.
Button
Arms the software to take a snapshot of the sampled
data
Plays the data recording in a continuous loop at
actual speed
Description
Forward 1 Frame Moves to the next frame in the recorded data
Step Forward Moves to the next point in the recorded data
Indicates the position of the buffered data currently
Position Indicator
displayed. Values are minutes:seconds:milliseconds
of elapsed time
78
Page 86

Scope Multimeter Operations Operations
Table 8-5 Data buffer toolbar buttons (part 2 of 2)
Name
Button
Description
Touch and Grow
Zoom
8.3.2 Making Selections
Most selections for setting up and operating the scope are made using the stylus a nd the scope
toolbar . The cursor lines, the trace zero line, and the trigger point indicato r (+) can be repositioned
by selecting and dragging them in the main body of the screen.
There are two basic types of controls on the toolbar:
• Switches
• Dialog boxes
A Switch changes states when tapped. Cha nges happen immediately a s the selection is ma de.
A dialog box opens as a separate window on the scree n and typically includ es a numbe r of
choices. Changes happen immediately, however, th e dial og box must b e closed to return to the
main window and continue. Make a selection to close the dialog box.
Expands and collapses the Trace Detail area on the
display screen to allow for easier finger tip control
Increases or decreases the magnification of the
graph
8.4 Operations
This section describes configuring the scope or meter and performing te st s.
8.4.1 Starting the Scope and Multimeter
Use the following procedure to set up the scope multimeter for per forming test s.
z To start the scope multimeter:
1. Select the Scope Multimeter button on the Home screen.
The Scope Multimeter main menu, a list of setup options, displays;
– Lab Scope
– Ignition Scope
– Graphing Meter
– Digital Multimeter
– Presets
2. Tap to select from the menu options.
A submenu of scope or meter configuration displays, see below for addition al information.
3. Tap to select a configuration and the Scope Multimeter opens.
79
Page 87

Scope Multimeter Operations Operations
Presets
Presets are factory configured meter settings for common component tests. Selectin g opens a list
of available setups. Selecting from the list opens the scope multimeter configured to perform the
selected test. In addition to the factory presets, you can create your own custom meter
configurations and save them as presets.
Lab Scope Options
The following options are available for testing:
• 4 Channel Lab Scope
• Volt s DC
• Low Amps (20)
• Low Amps (40)
• Low Amps (60)
• Ignition Probe
• 100 psi Vacuum
• 100 psi Pressure
• 500 psi Pressure
• 5000 psi Pressure
• MT5030 Vacuum
• MT5030 Pressure
• EEDM506D Temperature
Ignition Scope Options
The following options are available for testing:
• Parade
• Cylinder
• Raster
• Superimposed
• Single Cylinder Ignition
Graphing Options
The following options are available for testing:
• Dual Graphing
• Volt s DC
• Volt s DC A verage
• Volt s AC RMS
• Frequency
• Pulse Width
• Injector Pulse Width
• Duty Cycle
80
Page 88

Scope Multimeter Operations Operations
• Low Amps (20)
• Low Amps (40)
• Low Amps (60)
• MC Dwell (60)
• MC Dwell (90)
• 100 psi Vacuum
• 100 psi Pressure
• 500 psi Pressure
• 5000 psi Pressure
• MT5030 Vacuum
• MT5030 Pressure
• EEDM506D Temperature
Digital Multimeter Options
The following options are available for testing:
• Volt s DC
• Volt s DC A verage
• Volt s AC RMS
• Ohms
• Diode/Continuity
• Low Amps (20)
• Low Amps (40)
• Low Amps (60)
8.4.2 Scope and Multimeter Setup
The following sections explain how to adjust the scope and multimeter for the specific type of
signal being sampled. Most of these setup operations are available from the toolba r.
T race Controls
The Trace controls are used to adju st individual char acteristics o f how the signal is sampled and
displayed for each of the four traces.
z To adjust trace controls:
1. Select Setup from the Scope Multimeter toolbar.
The Scope Multimeter Preferences dialog bo x ope ns
2. Select Traces to open the submenu.
3. Select the trace to be configured from the submenu.
The traces dialog box displays (
Figure 8-17).
81
Page 89

Scope Multimeter Operations Operations
1— Trace tabs
2— Trace Probe button
3— T race Scale button
4— Trace characteristics check boxes
5— Auto Find button
6— Baseline position
7— Back button
8— Exit button
Figure 8-17 Traces dialog box
4. Select the Trace Probe button to open the menu.
5. Highlight a probe on the list and tap OK close the windo w.
6. Select the Trace Scale button to adjust the vertical scale of the display.
A dropdown menu opens. Menu options vary depending upo n which test lead is selected.
7. Select a trace scale option, then close the window.
8. Select or deselect the trace characteristic items as needed:
– Displayed—this trace is on screen when checked, and not visible when not checked.
– Inverted—signal polarity is reversed when checked, normal when not checked.
– Coupling AC—check when sampling an AC signal, uncheck for DC signals.
– Peak Detect—use when trying to capture a fast event or signal glitch .
– Filter—use when radio frequency interference (RFI) may be disrupting the signal.
9. The scope samples the signal and internally calculates the best wa y to display it when Auto
Find is selected. A scale and the vertical position for the zero line of the trace that allows the
whole waveform to fit on the screen is established when Auto Find is selected. If Auto Find is
selected on the trigger channel, it also set s the trigger level halfway between the minimum and
maximum value of the sampled signal to provide a stable wavefo rm.
10. The baseline position is the zero line of the trace, use the slider and arrows to adjust it.
11. Select Back to return to the Preferences dialo g box, or select Exit to close the dialog box and
return to the scope.
82
Page 90

Scope Multimeter Operations Operations
Sweep Controls
Sweep is the amount of time represented by the screen, or the horizontal scale of the display.
z To adjust Sweep controls:
1. Select Setup from the Scope Multimeter toolbar.
The Scope Multimeter Preferences dialog bo x ope ns
2. Select the Sweep button to open the sweep dialog box (
Figure 8-18)
Figure 8-18 Sample Sweep Setup dialog box
3. Choose an option from the list.
4. Select Back to retur n to the Preferences dialog box, or select Exit to close the dialog box and
return to the scope.
Trigger Controls
Triggering allows you to set the scope so that it only begins displaying a trace once predeter mined
signal conditions, or triggers, are met. The trigger point is indicated by a plus sign (+) on the scope
grid. The plus sign can be dragged across the grid with the stylus to roughly position it. The trigger
controls allow you to precisely position the trigger.
z To adjust trigger controls:
1. Select Setup from the Scope Multimeter toolbar.
The Scope Multimeter Preferences dialog bo x ope ns
2. Select Trigger to open the Trigger Setup dia log b ox (
3. Use the dialog box controls to set the trigger.
4. Select OK to close the dialog box.
5. Select Back twice to close the Scope Multimeter Preferences dialog box.
Figure 8-19).
83
Page 91

Scope Multimeter Operations Operations
1— Source—selects the triggering event:
- Trace 1—sets the trigger to channel 1.
- Trace 2—sets the trigger to channel 2.
- Trace 3—sets the trigger to channel 3.
- Trace 4—sets the trigger to channel 4.
- Cylinder—sets triggering to the firing of a cylinder detected by the optional RPM
Pickup or Secondary Ignition Adapter.
- None—switches triggering off.
2— Mode—sets the method of triggering:
- Auto (automatic)—if a trigger is found, the waveform displays. If a trigger is not found
after about a half second, the waveform and a “trigger not found” message displays.
- Manual—if a trigger is found, the waveform displays. If a trigger is not found nothing
displays (no waveform and no message).
3— Slope—sets triggering to the rising (top button) or falling (lower button) slope of the signal
waveform.
4— Vertical position—moves the trigger position up and down on the gr id.
5— Horizontal position—moves the trigg er timi ng lef t and right on the gr id
6— Select Back to return to the Preferences dialog box, or select Exit to close the dialog box
and return to the scope.
Figure 8-19 Trigger controls
z To adjust view controls:
View Controls
Use the view controls to set display attributes.
1. Select Setup from the Scope Multimeter toolbar.
The Scope Multimeter Preferences dialog box o pens.
2. Select View to open a submenu.
84
Page 92

Scope Multimeter Operations Operations
Three types of adjustment are available on the submenu:
– Display—use to adjust what information displays and how it appears
– Layout—use to set how many traces display and how they display on the screen
– Units—use to adjust time and voltage interval settings
Selecting from the submenu opens a dialog box for that item. Dialog box options for ea ch item
are discussed in the following sections.
3. Make dialog box selections as needed.
4. Select Back to retur n to the Preferences dialog box, or select Exit to close the dialog box and
return to the scope.
Display Settings
Selecting Display from the View submenu opens the Display d ialog box (
Figure 8-20 Sample Display dialog box
The following options are available from the Display dialog box:
• Show RPM—adds an engine speed field at the top of the scr een (
Figure 8-21).
Figure 8-20).
Figure 8-21 Sample Show RPM selected
• Show Digital KV—available only in ignition scope, adds kilovolt readings to the screen.
85
Page 93

Scope Multimeter Operations Operations
Figure 8-22 Sample Show Digital KV selected
• Show Grid—switches grid lines on the screen off and on (
Figure 8-23 Sample grid selected
• Invert Colors—switches the screen background to white.
Figure 8-23).
Layout Settings
The selected radio knob on the Layout dialog box shows which setting is active. Use the stylus to
switch between settings:
• 1 Window—shows all traces on the same screen (
Figure 8-23).
• 2 Windows—shows two separate traces in two ways: horizontal, one below another
(
Figure 8-24) or vertical, side-by-side (Figure 8-25)
• 3 windows—shows three traces, one below another, on the same screen (
Figure 8-26).
• 4 windows—shows four traces, one below another, on the same screen.
86
Page 94

Scope Multimeter Operations Operations
Figure 8-24 Sample 2 Windows horizontal display
Figure 8-25 Sample 2 Windows vertical display
Figure 8-26 Sample 3 Windows display
87
Page 95

Scope Multimeter Operations Operations
Units Settings
The Units dialog box allows you to switch between Full Scale or Per Division settings for the trace
setup and the display settings. Selecting Full Scale configures the units to the full viewing area of
the screen, while Per Division adjusts the unit s to a sin gle divisi on (one tenth) of the screen .
The selected radio knob on the Units dialo g box sh ows which setting is active. Use the stylus to
switch between settings (
Figure 8-27).
Figure 8-27 Sample View Units dialog box
Setup Controls
Basic tool settings are adjusted here.
z To adjust setup controls:
1. Select Setup from the Scope Multimeter toolbar.
The Scope Multimeter Preferences dialog bo x ope ns
2. Select Setup from the dialog box.
A submenu of options displays:
– Back—use to return to the Preferences dialog box
– Units—use to set how measurement values display, US standard or metric
– Snapshot—use to adjust the percentage of data captured following a trigger event
– Ignition—use to configure the ignition scope for the test vehicle
Selecting from the submenu opens a dialog box for that item. Dialog box options for ea ch item
are discussed in the following sections.
3. Make dialog box selections as needed.
4. Select Exit to close the dialog box and return to the sco pe.
Units
Selecting Units opens the Setup dialog box. The unit s of measurement can be changed between
US customary or metric. The selected radio knobs on the Setup dialog box show which settings
are active (
Figure 8-28).
88
Page 96

Scope Multimeter Operations Operations
Figure 8-28 Sample Setup Units dialog box
Abbreviation
bar bar
inHg inches of mercury
kg/cm2 kilograms per centimeter squared
kPa kilopascal
mmHg millimeters of mercury
psi pounds per square inch
Description
Snapshot
The Snapshot tab of the Setup dialog b ox opens a window that allows you to select how much
data is captured after a snap shot is triggered (
ten to ninety percent in ten-percent increments, are shown as buttons with the current se tting
highlighted. Select a button, then select Back or Exit to close the dialog box.
Figure 8-29). Available selections, which range from
Refer to
Figure 8-29 Sample Snapshot dialog box
Trigger Controls on page 83 for information on how to setup a trigger.
89
Page 97

Scope Multimeter Operations Operations
Ignition
The Ignition tab of the Setup dialog box is used to configu re th e scope fo r disp laying se condar y
ignition patterns. There are two main selection fields (Type and Cylinders) and the fields vary
depending upon the type of ignition system selected in dialog bo x (
Figure 8-30).
Figure 8-30 Sample Setup Ignition dialog box
z To setup ignition tests
1. Select the Setup button to open the Setup dialog box.
2. Select the Ignition tab of the dialog box.
3. Highlight the ignition system for the test vehicle in the “T ype” field :
– Standard—use for systems with a distributor
– Waste Spark—use for coil pack systems that fire 2 plugs simultaneously
– Direct—use for coil-on-plug systems
– Other—use for systems that do not fit any of the above categories
4. Select the number of cylinders for the test vehicle in the “Cylinders” field.
Scroll through the list using the up and down arro ws on eithe r side of the numb er.
5. This step varies depending upon the type of ignition system:
– If testing a Standa rd system, select the Firing Order.
– If testing an Other system, select the RPM Factor.
Scroll through the list of available choices using the up and down arrows below the
displayed firing order or RPM factor.
6. This step also varies depending upon the type of ignition system:
– On a St andard or Direct system, ch oose between Coil and Plug for the Number 1 T rigger.
– On a waste Spark system, select the polarity of the firings using the +, –, and
arrow buttons.
7. Select Back to retur n to the Preferences dialog box, or select Exit to close the dialog box and
return to the scope.
90
Page 98

Scope Multimeter Operations Operations
Data
The Data button on th e toolbar switc hes the trace d et ails info rmatio n at the base of the scree n
through three states as previously explained in
Trace Details on page 76.
Cursor Controls
Select Cursors from the toolbar to open the Cursors dialog box (
Figure 8-31).
1— Cursor 1 controls
2— Cursor 2 controls
3— Show or Hide button
4— Back button
Figure 8-31 Cursor controls
Cursor 1, the top slider and arrows, is the left-hand cursor on the screen. Curs or 2, the lower set
of controls, is the right-hand cursor on the screen. Drag the slider or tap the arr ows to position the
cursors. Each tap of the stylus moves the cursor incrementally in the direction of the arrow.
Select Show to display the cursors (the button changes to Hide).
Select Hide to conceal the cursors (the button changes to Show).
Select Back to close the dialog box.
Refresh Controls
Selecting the Refresh button from the Scope Multimeter Toolbar clears the minimum and
maximum digital values and updates th e viewing screen .
File Controls
Selecting File from the toolbar opens a dialog box with a menu of save options:
• Save Configuration—saves the current setup values as a preset.
• Save Single Frame—saves the data currently on the screen only.
• Save All Frames—saves the current screen plus all the data sto red in the buffer.
91
Page 99

Scope Multimeter Operations Operations
NOTE:
z To save a file or configuration:
1. Select File from the toolbar.
2. Select a save option from the dialog box.
Figure 8-32 Sample file setup dialog box
The Save As dialog box and the virtual keyboard open.
3. Use the keyboard to name the file to be saved, then either select the Save butto n or tap return
on the keyboard.
A configuration description dialog box opens.
i The description entered here is what displays in the information panel of the Dat a Man ager.
4. Use the keyboard to enter a description of the file to be saved.
5. Select the OK button or tap return on the keyboard.
6. Select OK to close the file setup dialog box.
Once a configuration is saved, it becomes available as a preset. Files are saved to the Scope
Multimeter Data Folder and can be retrieved thro ugh the Data Manager.
Print Controls
Selecting Print from the toolbar opens a standard Windows Prin t dialog box set up to print the
current screen. A printer must be connected and setup on the Displa y Device. If not, th e “Add
Printer Wizard” opens and guides you through the proc edure. Se lect from the menus as neede d.
92
Page 100

Chapter 9 Ask-a-Tech Operations
Currently available in North America only, the Ask-a-Tech module provides a forum to network
with other professional technicians and gives you access to a vast dat abase o f rep a ir and
diagnostic tips along with proven field fixes. Th e informa tion o n the website is develo ped by
technicians for technicians and cannot be found in a service or rep a ir manual.
9.1 Ask-a-T ech T ips
An Ask-a-T ech Tip is a concise description of a rep air for a particular problem on a specific vehicle
developed by your fellow technicians. Tips go through various st ages of de velopment a s they
evolve from a question posted to the group to a verified repair for the posted question.
Depending upon the complexity of the problem, it may take several days or weeks to find a
solution. Established tips may also change when technicians deve lop better ways to pe rform the
task. There are two basic types of Tip:
• Certified Tips—the se tip s have be en closely scrutinize d and a dhere to est ablish ed quality
control standards
• Community Tip s—the se tip s were de velope d solely by the community of Ask- a-Tech users
Tips display as a list on the website with an icon along the right-hand edge. The icons indicate the
type of information the tip includes and how the tip was developed:
Icon
Ty pe of T ip
Certified
Edited Certified
Community
Question
Reference
This Tip has been subject to strenuous quality control.
Community members are free to comment on or edit the
Tip to improve it. As soon as a Certified Tip is edited it
becomes an Edited Certified Tip.
This Tip originated as a Certified Tip but has been
changed by the Community. The Community is given the
opportunity to make Certified Tips more specific to a
vehicle, and to expand and enhance the content. It is
expected that as time passes, tips evolve to provide
better ways of repairing a specific problem.
Indicates a Tip that generated by the Community. These
tips were developed by the network of technicians to
address a problem on a specific vehicle.
This icon denotes a Question that is being asked by
somebody in the Community looking for information on a
problem they are experiencing.
Indicates a Fast-Track Troubleshooter Reference. Search
for a Fast-Track Troubleshooter Reference either by
entering the reference number into the search box, or by
selecting vehicle attributes from the navigation pane.
Description
93
 Loading...