

Page 1

UROSKOP D3
Start-up Instructions
SP
with POLYDOROS SX
and
FLUOROSPOT H with Supervision
© Siemens AG 1998
The reproduction, transmission or
use of this document or its contents
is not permitted without express
written authority. Offenders will be
liable for damages. All rights,
including rights created by patent
grant or registration of a utility
model _or_ design,_are_ reserved.
Register 4 English
Print No.: RLL5-310.034.04.04.02 Doc. Gen. Date: 12.98
Replaces: RLL5-310.034.04.03.02
Page 2

0 - 2Revision
Chapter Page Revision
1all04
2all04
3all04
4all04
5all04
6all04
7all04
8all04
9all04
10 all 04
11 all 04
12 all 04
UROSKOP D3 Register 4 RLL5-310.034.04 Page 2 of 4 Siemens AG
Rev. 04 12.98 TD PS 24 Medical En gineering
Page 3

Contents 0 - 3
Page
1 _______General information ____________________________________________1 - 1
Safety information . . . . . . . . . . . . . . . . . . . . . . . . . . . . . . . . . . . . 1 - 1
General information and information on documentation . . . . . . . . . . . . . . . . 1 - 1
Preliminary information on image quality test . . . . . . . . . . . . . . . . . . . . . . 1 - 2
Purpose: . . . . . . . . . . . . . . . . . . . . . . . . . . . . . . . . . . . . . . . 1 - 2
Sequence of work:. . . . . . . . . . . . . . . . . . . . . . . . . . . . . . . . . . 1 - 2
Requirements for start-up . . . . . . . . . . . . . . . . . . . . . . . . . . . . . . . . 1 - 2
Required Documents . . . . . . . . . . . . . . . . . . . . . . . . . . . . . . . . . . 1 - 2
Required measuring instruments . . . . . . . . . . . . . . . . . . . . . . . . . . . . 1 - 3
2 _______Start-up preparation ____________________________________________2 - 1
Protective measures. . . . . . . . . . . . . . . . . . . . . . . . . . . . . . . . . . . 2 - 1
Measuring the line voltage . . . . . . . . . . . . . . . . . . . . . . . . . . . . . . . 2 - 1
Checking the on-site emergency shutdown butto n . . . . . . . . . . . . . . . . . . . 2 - 1
Checking the phase connection. . . . . . . . . . . . . . . . . . . . . . . . . . . . . 2 - 2
Measuring the internal line impedance . . . . . . . . . . . . . . . . . . . . . . . . . 2 - 2
Checking unacceptable ground connections . . . . . . . . . . . . . . . . . . . . . . 2 - 3
Switching on the generator . . . . . . . . . . . . . . . . . . . . . . . . . . . . . . . 2 - 3
3 _______Generator functions ____________________________________________3 - 1
Checking the emergency stop switches. . . . . . . . . . . . . . . . . . . . . . . . . 3 - 1
Checking the control panel . . . . . . . . . . . . . . . . . . . . . . . . . . . . . . . 3 - 1
Function check of the anode starter. . . . . . . . . . . . . . . . . . . . . . . . . . . 3 - 1
Key to 7-segment display on board D95: . . . . . . . . . . . . . . . . . . . . . . 3 - 1
LED status display. . . . . . . . . . . . . . . . . . . . . . . . . . . . . . . . . . 3 - 1
Checking the fluoroscopic and exposure release circuit . . . . . . . . . . . . . . . . 3 - 2
Fluoroscopic circuit . . . . . . . . . . . . . . . . . . . . . . . . . . . . . . . . . 3 - 2
Exposure release circuit . . . . . . . . . . . . . . . . . . . . . . . . . . . . . . . 3 - 2
Controls and indicator lamps for radiation protection . . . . . . . . . . . . . . . . . . 3 - 3
Door contact for radiation disable function . . . . . . . . . . . . . . . . . . . . . 3 - 3
Indicator lamps for tube assembl y selection. . . . . . . . . . . . . . . . . . . . . 3 - 3
Checking the kV/mA values . . . . . . . . . . . . . . . . . . . . . . . . . . . . . . . 3 - 3
Checking the mAs values . . . . . . . . . . . . . . . . . . . . . . . . . . . . . . . . 3 - 4
Start-up of the automatic exposure control . . . . . . . . . . . . . . . . . . . . . . . 3 - 4
4 _______Unit movements________________________________________________4 - 1
Preparation and limit values for tabletop lift . . . . . . . . . . . . . . . . . . . . . . . 4 - 1
Lifting movement . . . . . . . . . . . . . . . . . . . . . . . . . . . . . . . . . . . . 4 - 2
Oblique projection . . . . . . . . . . . . . . . . . . . . . . . . . . . . . . . . . . . . 4 - 3
Tilting movement . . . . . . . . . . . . . . . . . . . . . . . . . . . . . . . . . . . . 4 - 4
Longitudinal movement of the tabl etop . . . . . . . . . . . . . . . . . . . . . . . . . 4 - 5
Transverse movement of the tabletop. . . . . . . . . . . . . . . . . . . . . . . . . . 4 - 6
Siemens AG Register 4 RLL5-310.034.04 Page 3 of 6 UROSKOP D3
Medical Engineering Rev. 04 12.98 TD PS 24
Page 4

0 - 4 Contents
Page
5 ____ __ Radiation geometry_____________________________________________5 - 1
Test conditions . . . . . . . . . . . . . . . . . . . . . . . . . . . . . . . . . . . 5 - 2
Evaluation. . . . . . . . . . . . . . . . . . . . . . . . . . . . . . . . . . . . . . 5 - 3
Test conditions . . . . . . . . . . . . . . . . . . . . . . . . . . . . . . . . . . . 5 - 4
Brief description of the test . . . . . . . . . . . . . . . . . . . . . . . . . . . . . 5 - 4
Visual check of the fluoroscopic field limitation . . . . . . . . . . . . . . . . . . . 5 - 5
Checking the overframing of the fluoroscopic field size displayed on the monitor . 5 - 5
Checking the centering of radiation fiel d and monitor image center . . . . . . . . 5 - 6
Evaluation of overframing in fluoroscopy . . . . . . . . . . . . . . . . . . . . . . 5 - 6
Evaluation of off-center in fluoroscopy . . . . . . . . . . . . . . . . . . . . . . . 5 - 6
6 ______ Checking the tomographic device_________________________________ 6 - 1
Accuracy of the tomographic height display . . . . . . . . . . . . . . . . . . . . 6 - 2
Resolution and tomographic proc edure . . . . . . . . . . . . . . . . . . . . . . 6 - 2
7 ______ Fluoroscopic dose rate__________________________________________7 - 1
General. . . . . . . . . . . . . . . . . . . . . . . . . . . . . . . . . . . . . . . . . 7 - 1
Preliminary remarks . . . . . . . . . . . . . . . . . . . . . . . . . . . . . . . . . . 7 - 1
Basic information on the dose / dose rate measurement for I.I. workstations . . . 7 - 1
Determining the dose/dose rate directly at the I.I. input . . . . . . . . . . . . . . 7 - 1
Formulas for calculating the dose/dose rate in the measurement plane for
dose/dose rate setting . . . . . . . . . . . . . . . . . . . . . . . . . . . . . . . 7 - 2
Indirect dose rate test at the customer site. . . . . . . . . . . . . . . . . . . . . . . 7 - 3
Setting when the indirect dose rate is out of tolerance. . . . . . . . . . . . . . . . . 7 - 3
Maximum skin dose rate . . . . . . . . . . . . . . . . . . . . . . . . . . . . . . . . 7 - 4
8 ______ Television system ______________________________________________8 - 1
Function check of ambient light sensor. . . . . . . . . . . . . . . . . . . . . . . . . 8 - 1
B-signal values (without bias li ght/dark current component) . . . . . . . . . . . . . . 8 - 1
Image artifacts (Para. 5 .10 Chapter 5D) . . . . . . . . . . . . . . . . . . . . . . 8 - 2
9 ______ Digital Fluoro Radiography/FLUOROSPOT H________________________9 - 1
General information and remarks . . . . . . . . . . . . . . . . . . . . . . . . . . . 9 - 1
Dose/pulse test during start-up (indirect dose check) . . . . . . . . . . . . . . . . . 9 - 5
BA (video+blanking) signal values / setting the iris diaphragm in DR operation . . . . 9 - 6
Dynamic test . . . . . . . . . . . . . . . . . . . . . . . . . . . . . . . . . . . . 9 - 7
Edge enhancement. . . . . . . . . . . . . . . . . . . . . . . . . . . . . . . . .9 - 11
Mean value assessment (GGM= sliding weighted averaging) . . . . . . . . . . .9 - 11
Resolution and minimum contrast . . . . . . . . . . . . . . . . . . . . . . . . . . .9 - 12
Checking the DSA system . . . . . . . . . . . . . . . . . . . . . . . . . . . . . . .9 - 14
Checking the hardcopy camera . . . . . . . . . . . . . . . . . . . . . . . . . . . .9 - 16
Adjusting the hardcopy camera. . . . . . . . . . . . . . . . . . . . . . . . . . .9 - 16
UROSKOP D3 Register 4 RLL5-310.034.04 Page 4 of 6 Siemens AG
Rev. 04 12.98 TD PS 24 Medical En gineering
Page 5

Contents 0 - 5
Page
Preparing and evaluating the SMPTE test image . . . . . . . . . . . . . . . . . 9 - 16
Image artifacts and transmission interference. . . . . . . . . . . . . . . . . . . 9 - 17
Image artifacts. . . . . . . . . . . . . . . . . . . . . . . . . . . . . . . . . . . . . 9 - 18
Definition of the rating numbers:. . . . . . . . . . . . . . . . . . . . . . . . . . 9 - 18
Description of the artifacts: . . . . . . . . . . . . . . . . . . . . . . . . . . . . 9 - 18
10 ______Nominal values _______________________________________________10 - 1
I.I. nominal values . . . . . . . . . . . . . . . . . . . . . . . . . . . . . . . . . . . 10 - 1
ADC measuring field . . . . . . . . . . . . . . . . . . . . . . . . . . . . . . . . . 10 - 1
MPL system . . . . . . . . . . . . . . . . . . . . . . . . . . . . . . . . . . . . 10 - 1
SDM system . . . . . . . . . . . . . . . . . . . . . . . . . . . . . . . . . . . . 10 - 1
Fluoroscopic dose rate at the I.I. input . . . . . . . . . . . . . . . . . . . . . . . . 10 - 2
VIDEOMED SX, H1X Emulation . . . . . . . . . . . . . . . . . . . . . . . . . . . 10 - 3
TV monitor . . . . . . . . . . . . . . . . . . . . . . . . . . . . . . . . . . . . . 10 - 3
TV camera . . . . . . . . . . . . . . . . . . . . . . . . . . . . . . . . . . . . . 10 - 3
B signal value (interlaced - Bypass) . . . . . . . . . . . . . . . . . . . . . . . 10 - 3
Vignetting (with bias light) (interlaced - Bypass) . . . . . . . . . . . . . . . . . 10 - 4
AGC measuring field sizes in grid units (GU) . . . . . . . . . . . . . . . . . . . 10 - 4
Pedestal and AGC function
Pedestal . . . . . . . . . . . . . . . . . . . . . . . . . . . . . . . . . . . . . . 10 - 4
Fixed gain TV unit . . . . . . . . . . . . . . . . . . . . . . . . . . . . . . . . . 10 - 4
Dynamic test. . . . . . . . . . . . . . . . . . . . . . . . . . . . . . . . . . . . 10 - 5
Capillary test. . . . . . . . . . . . . . . . . . . . . . . . . . . . . . . . . . . . 10 - 5
Resolution and minimum contrast of the I.I.-TV system (interl . - Bypass). . . . 10 - 6
Image artifacts . . . . . . . . . . . . . . . . . . . . . . . . . . . . . . . . . . . 10 - 6
Digital Fluoro Radiography / DFR . . . . . . . . . . . . . . . . . . . . . . . . . . . 10 - 6
FLUOROSPOT H . . . . . . . . . . . . . . . . . . . . . . . . . . . . . . . . . 10 - 6
Dose/pulse at the I.I. input. . . . . . . . . . . . . . . . . . . . . . . . . . . . . 10 - 6
Amplification of DFR system. . . . . . . . . . . . . . . . . . . . . . . . . . . . 10 - 7
Monitor adjustment . . . . . . . . . . . . . . . . . . . . . . . . . . . . . . . . 10 - 8
BA signal values / Adjustment of iris diaphr agm in DR mode . . . . . . . . . . . 10 - 8
Dynamic test. . . . . . . . . . . . . . . . . . . . . . . . . . . . . . . . . . . . 10 - 9
Black level cutoff (noise halo) . . . . . . . . . . . . . . . . . . . . . . . . . . 10 - 10
Resolution . . . . . . . . . . . . . . . . . . . . . . . . . . . . . . . . . . . . 10 - 10
Minimum contrast . . . . . . . . . . . . . . . . . . . . . . . . . . . . . . . . 10 - 10
Checking the DSA equipment . . . . . . . . . . . . . . . . . . . . . . . . . . 10 - 11
Image artifacts . . . . . . . . . . . . . . . . . . . . . . . . . . . . . . . . . . 10 - 11
11 ______Final steps and electrical safety _________________________________11 - 1
Final work . . . . . . . . . . . . . . . . . . . . . . . . . . . . . . . . . . . . . . . 11 - 1
Measuring the protective conduc tor resistance . . . . . . . . . . . . . . . . . . . . 11 - 1
12 ______Changes to previous version____________________________________12 - 1
Siemens AG Register 4 RLL5-310.034.04 Page 5 of 6 UROSKOP D3
Medical Engineering Rev. 04 12.98 TD PS 24
Page 6

0 - 6 Contents
Page
This page intentionally left blank.
UROSKOP D3 Register 4 RLL5-310.034.04 Page 6 of 6 Siemens AG
Rev. 04 12.98 TD PS 24 Medical En gineering
Page 7

CAUTION
General information 1
Safety information 1
When performing service work and tests, please adhere to the
product-specific safety informati on contained in the document, as
well as the general safety information contained in Register 2 of
the TI binder.
Tests and adjustments performed with radiation ON are identified with the radiation warning symbol . Radiation protection must be worn during these types of adjustments.
General information and information on documentation 1
These instructions contain the checks necessary for system startup.The sequence in
which they are given must be maintained.
The unit movements necessary for these procedures must be carri ed out very carefully
to avoid damaging the equipment in the event of a malfunction.
Since the unit has been adjusted completely at the factory, only the functioning and factory settings (accuracy of tolerance) are checked; the unit must be adapted to on-site
requirements, if necessary.
1 - 1
If any mechanical or electrica l malfunctions oc cur or if tolerances are exceeded (damages
caused by transport etc.), perform ser vi ce work and adjust ments acc ording to adjustm ent
instructions RLL5-310.071.01... or the service instructions for the corresponding components.
Measurement results marked” ” must be entered in the UROSKOP test certificate.
For the acceptance test which is requ ired i n Germany in accordance wit h §16 of the Rönt-
genverordnung (x-ray ordinance) and for the acceptance test required in t he USA, the following checks have already been performed in the factory test area and documented in
the test certificate:
• Visual check of the filt er values.
• Check of the SID display.
• Brightness of the light localizer.
• Coincidence of light fiel d and radiation field.
• Accuracy of the manual format col limation.
• Coincidence of radiatio n field and film center.
• Accuracy of positive beam li mitation (PBL) system for cassett e formats.
• Fluoroscopic field limitat ion.
• Centering of the radiation f ield and monitor image center.
• Function check of the Iontomat measurement fields.
• Unit attenuation facto r.
• Check of the tomographic device.
Siemens AG Register 4 RLL5-310.034.04 Page 1 of 4 UROSKOP D3
Medical Engineering Rev. 04 12.98 TD PS 24
Page 8

1 - 2 General information
NOTICE
Enter the measurement values and the additional values determined during system start-up from the test certificate into the
acceptance certificate (Germany) or in the acceptance test certi fi cate (USA).
Preliminary information on image quality test 1
Purpose: 1
• The image quality test provides objec tive data as a basis for image quality and faci litates
system start-up.
• The test certificate is val id for system acceptance and for futur e service and mainte-
nance work.
Sequence of work: 1
• Follow the sequence of measurements and checks ex actly as describes in order to
ensure correct measurements.
• Enter the results of each measurement i nto the test certificates.
• Compare the measured values with the values indi cated in the list of nominal values .
• If the limit values are exceeded, y ou must determine the cause and correct the er ror or
the erroneous setting before cont inuing the test. Otherwise the measurement s that
follow may be incorrect.
Requirements for start-up 1
• The system must be cabled completely.
• Switch on high voltage only if radi ation is necessary.
Required Documents 1
• Operating instructions UROSKOP D3 RL5-340.208.01...
• Wiring diagram UROSKOP D3 G5403
• Wiring diagram POL YDOROS SX X2075
• Service software
operation UROSKOP D3 RLL5-310.113.02... Logbook, Reg. 10
• Setting Instructions POL YDOROS SX RX63-050.032.02...
• System configuration POL YDOROS SX RX63- 050.034.06...
• IQ T est c ertificate RXD0-000.037.01... Logbook, Reg. 9
• T est certi ficate UROSKOP D3 RLL5-310.035.01... Logbook, Reg.3
• Test certificate POLYDOROS SX X2075 Logbook, Reg. 4
UROSKOP D3 Register 4 RLL5-310.034.04 Page 2 of 4 Siemens AG
Rev. 04 12.98 TD PS 24 Medical En gineering
Page 9

General information 1 - 3
CAUTION
Required measuring instruments 1
• 3-Phase field rotation meter , elect ronic 97 02 713 Y7933
• Internal line impedance meter 84 28 104 RE999
• Service PC
• Oscilloscope > 50 MHz, e.g. Tektronix 2232
with delayed time base
• Multimeter 8060 A (Fluke) 97 02 101 Y4290
• mAs meter 81 60 400 RE999
• Water level 28 69 436 RE999
• Set of Cu filters 44 06 120 RV090
• 17 µm Cu strips (included in the LOG book) 1 1 67 663 G5247
• cm scale
• T omogr aphic cube with resolution test 44 06 054 RV 090
• Protective conductor meter 44 15 899 RV090
• 8x magnifying glass 44 14 850 RH090
• Precision radiation filter 99 00 598 XE999
• Centering cross or lead rul er 96 60 051 RE999 or 28 63 025 RE999
• Mavo monitor , direct ordering 97 02 432 Y0526
• Resolution test patterns, types 41 28 71 820 RE999
• Dynamic test case 37 90 156 X1963
• heart contour diaphragm 37 90 172 X1963
• Capillary test 37 90 180 X1963
• DSA displacement test (with DSA capi llary
test)
• Aperture plate for tomograp hy
97 02 234 Y3155
97 50 019 X1963 (only with DSA)
Successful system start-up can only be ensured by using the
above measurement instruments.
Siemens AG Register 4 RLL5-310.034.04 Page 3 of 4 UROSKOP D3
Medical Engineering Rev. 04 12.98 TD PS 24
Page 10

1 - 4 General information
This page intentionally left blank.
UROSKOP D3 Register 4 RLL5-310.034.04 Page 4 of 4 Siemens AG
Rev. 04 12.98 TD PS 24 Medical En gineering
Page 11
CAUTION
Start-up preparation 2
Protective measures 2
• Observe the protective measures described in Register 1 of the UROSKOP D Logbook.
• Prior to performin g any service work on the generator, swi tch it off with the power OFF
switch on D200.
• In order to deenergize all parts of the system, set the system switc h to the OFF position.
With the generator switched off, line voltage is still present at
transformer T1 and fuse panel D200 (refer to wiring diagram
X2075-1 1 ).
After switching off the generator, approx. 600 V DC voltage are
still present at the inverter; indicated by LEDs V8 and V9 on bo ard
D250 (see X2075-17).
Within approx. 1 1/2 minutes the voltage drops to 0 V; the LEDs go
out at approx. 30 V.
• To prevent unintentional rel ease of high voltage or radiation, set swi tch SS on D200 to
OFF (no actuation of the inverters).
• Remove or insert boards only wit h the generator switched off. Wh en doing so, observe
the ESD guidelines (see TI 219, Info RA.5. RA0- 000.012.19... on microfilm).
2 - 1
• On D211: switch S1 INT OFF (position 2) .
• On D200: switch SS OFF.
Measuring the line voltage 2
• Remove fuses F1, F2 and F3 from the fuse board i n M16 (generator).
• System contactor ON.
• Measure the line voltage.
The voltage must correspond to the val ues indicated in the test certific ate (logbook,
Reg. 3).
Checking the on-site emergency shutdown button 2
• Actuate the emergency shutdown butt on installed by the customer. The entire syst em
must be disconnected from the power line.
• System contactor OFF.
Siemens AG Register 4 RLL5-310.034.04 Page 1 of 4 UROSKOP D3
Medical Engineering Rev. 04 12.98 TD PS 24
Page 12
2 - 2Start-up preparation
Checking the phase connection 2
• Check the correct phase connecti on of the power lines at M16.F1, F2, F3 (X2075-11) ,
using the rotating field instru ment:
• In M16, remove the cover from the fu se holders.
• Connect the3-phase field rotat ion meter to the lower connections of F1, F2, F3 (on the
side of the power supply).
• System contactor ON.
• Perform the measurement.
• System contactor OFF.
• Disconnect the rotating field i nstrument.
Measuring the internal line impedance 2
• Measure the internal line impedan ce at M16. F1. F2. F3 (X2075-11):
- Connect the internal line impedance meter bet ween two phases of F1, F2, F3 (at the
lower connections of the fuse holders ).
- System contactor ON.
- Perform the measurement.
- System contactor OFF.
• Record the measured values in the test certificate (l ogbook Reg. 3)
• Enter the measured values into the ”LINE PARAMETER” module of the system
programming.
Important: In order to obtain the full gener ator power, the internal line impedance
measured may not exceed the following values:
U
line
400 V 0.18 Ohm 0.12 Ohm
440 V 0.20 Ohm 0.16 Ohm
480 V 0.24 Ohm 0.20 Ohm
Internal line impedances of > 250 mOhm reduce power. Refer to RX63-
050.034.05.01.05... Configuration ”LINE PARAMETER”
max. R
SX 50 SX 80
withPOLYDOROS
line
measured
• Reinsert fuses F1, F2 and F3.
• Reattach the cover.
UROSKOP D3 Register 4 RLL5-310.034.04 Page 2 of 4 Siemens AG
Rev. 04 12.98 TD PS 24 Medical En gineering
Page 13
Start-up preparation 2 - 3
CAUTION
Checking unacceptable ground connections 2
(connection between and 0VL ).
• Disconnect the connection l ead between the upper and lower grounding bus (in the
generator power cabinet).
• Using the multimeter, measure the resistance between and 0V
The measured resistance must be approx. > 50 k
Ω.
:
L
• Reconnect the upper and the lower grou nding bus.
Switching on the generator 2
• System contactor ON:
- LED V26 (via fuse F11) must light up on fuse board D200.
In case of an error, check the fuses in M16 and on D200
(X2075-11 and 12).
• Generator ON:
- On fuse board D200, press key and actuate button .
- The LED’s must light up as follows on the service panel of D211:
The +5 V,
If the +5 V voltage is missing, the generator is disabled.
In this case, check the fuses on D200 ( X2075-12). All LED’ s on D200 must l ight
up.
- Following connection of the intermediat e circuit (activation of charging contactor and
power contactor), LEDs V9 and V8 on board D250 must light up (X2075-17).
± 15 V, +24 V supply voltages are immediately present.
A DC voltage > 500 V is applied to the intermediate circuit.
- Following correct initializati on (after approx. 10 sec.), the fol lowing LEDs must light on
the service panel of D211:
( ) ( ) TU1 (after system programming)
GEN-OK,+24 V, +15 V, -15 V, +5 V
If no error has occurred, the 7-segment displays on D210 indi cate ”E000”.
In case of an error, the three-digit error code is displayed.
- When programing the generator, "ALP" appears on the kV di splay of the control deck.
• Check the primary voltage for the s upply voltages (X2075-12) at the coil co nnections of
the GS contactor (X2075-11) in M16:
230 V
250 V
± 10 % at 50 Hz
± 10 % at 60 Hz
• Check the blocking:
On D200: Generator OFF
The generator cannot be switched on again f rom the deck.
Siemens AG Register 4 RLL5-310.034.04 Page 3 of 4 UROSKOP D3
Medical Engineering Rev. 04 12.98 TD PS 24
Page 14

2 - 4Start-up preparation
This page intentionally left blank.
UROSKOP D3 Register 4 RLL5-310.034.04 Page 4 of 4 Siemens AG
Rev. 04 12.98 TD PS 24 Medical En gineering
Page 15
NOTICE
Generator functions 3
Checking the emergency stop switches 3
• System ON.
• Press the three system emergenc y stop switches consecutively:
With the emergency stop switch pr essed in,
- error code ’’U01’ ’ must appear in the
- all system movements must be blocked.
area dose product
Checking the control panel 3
• System ON.
• Select from 40 kV to the max. kV value on t he kV control console by pressing the ± kV
keys.
• Check the mAs display by pressing the ± mAs keys.
display on the control console;
3 - 1
Function check of the anode starter 3
• Generator ON : On D95, display1→2→3
• Set release button S27 to preparati on: the rotating anode boosts.
Display 3
Let go of the release button S27 again: the rotating anode should brake.
Display 6
Key to 7-segment display on board D95: 3
1= Initialization 4= Start-up
2= Init-brakes 5= Continued run
3= Stand-by 6= Brakes
If the ERROR message flashes, please refer to the information contained in the
service so ft ware.
LED status display 3
→4→5
→3
The rotational speed must be checked with the tube assembly
warmed up.
light up depending on the
operating condition
Tube assy. 2 selected
Siemens AG Register 4 RLL5-310.034.04 Page 1 of 4 UROSKOP D3
Medical Engineering Rev. 04 12.98 TD PS 24
*
Tube assy. 1 selected
*
Page 16
3 - 2 Generator functions
NOTICE
Checking the fluoroscopic and exposure release circuit 3
Fluoroscopic circuit 3
• On board D200: SS switch OFF.
• On D211: FL switch ON.
• On D211: the following LED’s must light up (X 2075-23):
- TU1/TU2 TU 1/ TU 2 (acc. to selected workstation/tube assembly)
- small focus
- large focus
- GEN-OK Generator enable state
- DL Fl uoroscopy (FL) "on" (FL request)
- EXT-HW Radiation enable state/safety circuit
- SWR Start/inverter
SWR "start/inverter" is not illuminated as long as Kathotest
(module J05) is programmed.
The "radiation indicator" lights up only with radia tion ON.
• FL switch OFF
• SS switch ON
• FL ON
• Measure the minimum and maximum kV and mA values and enter them int o the
generator certificate.
Exposure release circuit 3
With preparation:
• Set the release button S27 to preparati on .
• On D211, the following LEDs must light up:
- TU1/TU2 TU1/TU2 (acc. to selected workstation/tube assembly)
- / (depending on focus selection)
- GEN-OK Generator enable state
- ZB ZB "ON" (ex posure preparation (ZB) request)
With exposure release:
• Press the release button S27 all the way down.
• On D211, the following LED’s must light up
- VH: Exposure request to unit
- AR: Exposure enable state from unit
- EXT-HW: Radiation enable state/safety circuit
UROSKOP D3 Register 4 RLL5-310.034.04 Page 2 of 4 Siemens AG
Rev. 04 12.98 TD PS 24 Medical En gineering
Page 17
Generator functions 3 - 3
NOTICE
SWR "start/inverter" is not illuminated as long as Kathotest
(module J05) is programmed.
The "radiation indicator" lights up only with radiation on.
• Release radiation release butt on S27.
Controls and indicator lamps for radiation protection 3
At the customer’s request, the following controls and indica tors can be connected in the
power cabinet according to the installation instructions RLL5-310.031.03. .., page 4-6.
Door contact for radiation disable function 3
(e.g. at the door of the examination room)
• Check: When the door is open, radiation release must not be possible.
Indicator lamps for tube assembly selection 3
• Check: For fluoroscopy or exposure preparation, the respect ive indicator lamp
associated with the tube assembly must light up.
Checking the kV/mA values 3
• System OFF.
• Connect oscilloscope to test points MP.kV
• System ON.
• SS switch ON.
• On the control console, sel ect 77 kV, 32 mAs for and focus respectively.
• Release one exposure in each case and check t he kV/mA values of test points
MP.kV
and MP.mA
act
with the oscilloscope.
act
• Enter the measured kV values in to the test generator test certi ficate and compare them
with the values recorded at the fa ctory. They must be within the specifi ed tolerances.
and MP.mA
act
on service board D211.
act
Siemens AG Register 4 RLL5-310.034.04 Page 3 of 4 UROSKOP D3
Medical Engineering Rev. 04 12.98 TD PS 24
Page 18
3 - 4 Generator functions
NOTICE
NOTICE
Checking the mAs values 3
• System OFF.
• On PC board D220 (over H1), remove the jumper from the mAs jacks.
• Connect the mAs meter to the mAs jacks.
• System ON.
• On the control console, select , 77 kV, 80 mAs.
• Release an exposure and check the mAs value on the mAs meter .
• Enter the measured value into the gener ator test certificate.
Start-up of the automatic exposure control 3
Check the functions of the IONTOMAT P and PLANI-IONTOMAT P automatic exposure
control systems according to the generator setting instructions RX63-050.032....
The installation procedures described i n the start -up inst ruct ions
may be disregarded since both subassemblies have alr eady been
installed at the factory.
§16
Since the UROSKOP has no selection for the film-screen keys
H-D-U, identical values must be programmed for H-D-U in the
IONTOMAT.
Checking the reproducibility of the automatic exposure control
• Attach 2.1 mm Cu to the multileaf colli mator.
• Set 77 kV,
100%,
large focus.
• Select Iontomat.
• Release 5 exposures consecutively.
• Enter the measured dose values into the generat or test certificate.
UROSKOP D3 Register 4 RLL5-310.034.04 Page 4 of 4 Siemens AG
Rev. 04 12.98 TD PS 24 Medical En gineering
Page 19
Unit movements 4
Preparation and limit values for tabletop lift 4
• Connect the service PC to connec tor X10 of board D1.
• System (When the emergency stop switch is actuated,” U01” appears in the display).
• If necessary, release th e emergency stop switch.
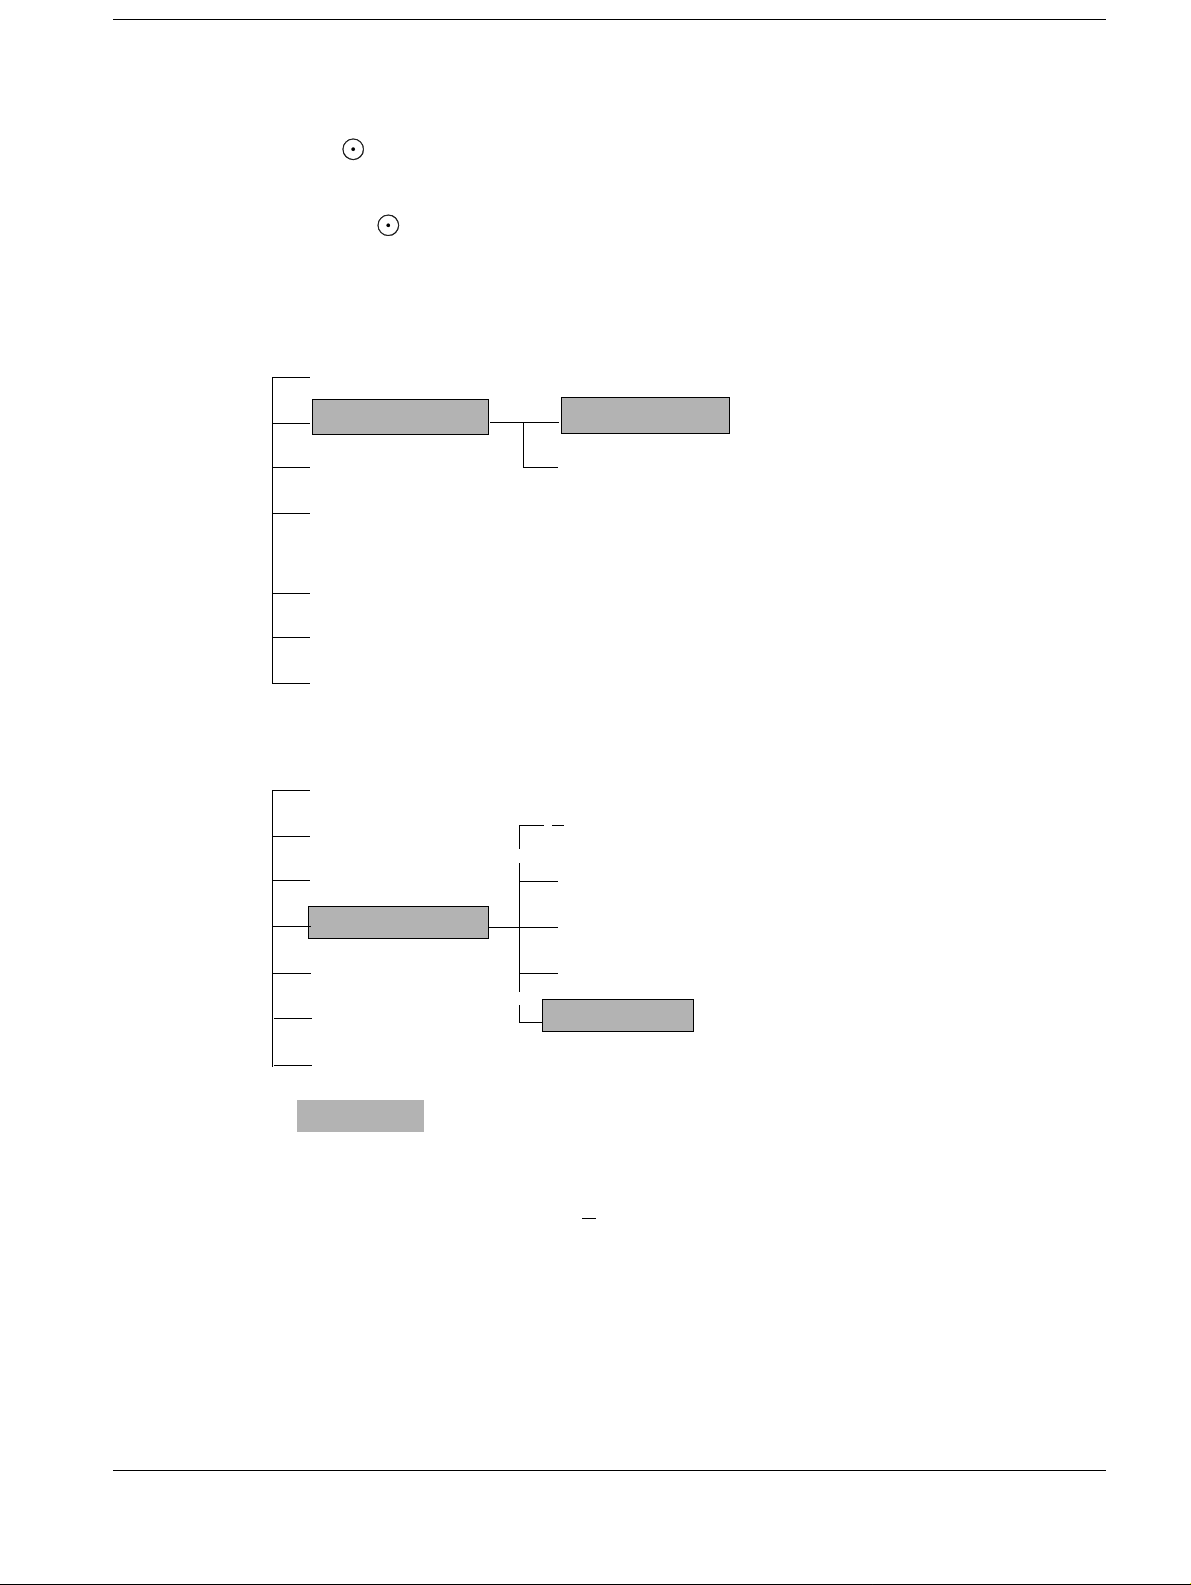
• Service PC .
• Start the service progra m
(refer to the service soft ware instructions RLL5-310.113.02...) .
Main menu
Info database
4 - 1
Unit parameters
Unit state
Unit errors
Calibration
Options
Download
Unit parameters
Load from unit
Load from file
Show
Modify
Send to unit
Load from unit
Load from file
Tomography
Memoskop 2K/100
Write to file
Output
ceiling height
• For ceiling height enter the act ual room height available
• Press return.
• Press <F4>. Initial questions with Yes.
Siemens AG Register 4 RLL5-310.034.04 Page 1 of 6 UROSKOP D3
Medical Engineering Rev. 04 12.98 TD PS 24
Page 20
4 - 2Unit movements
CAUTION
NOTICE
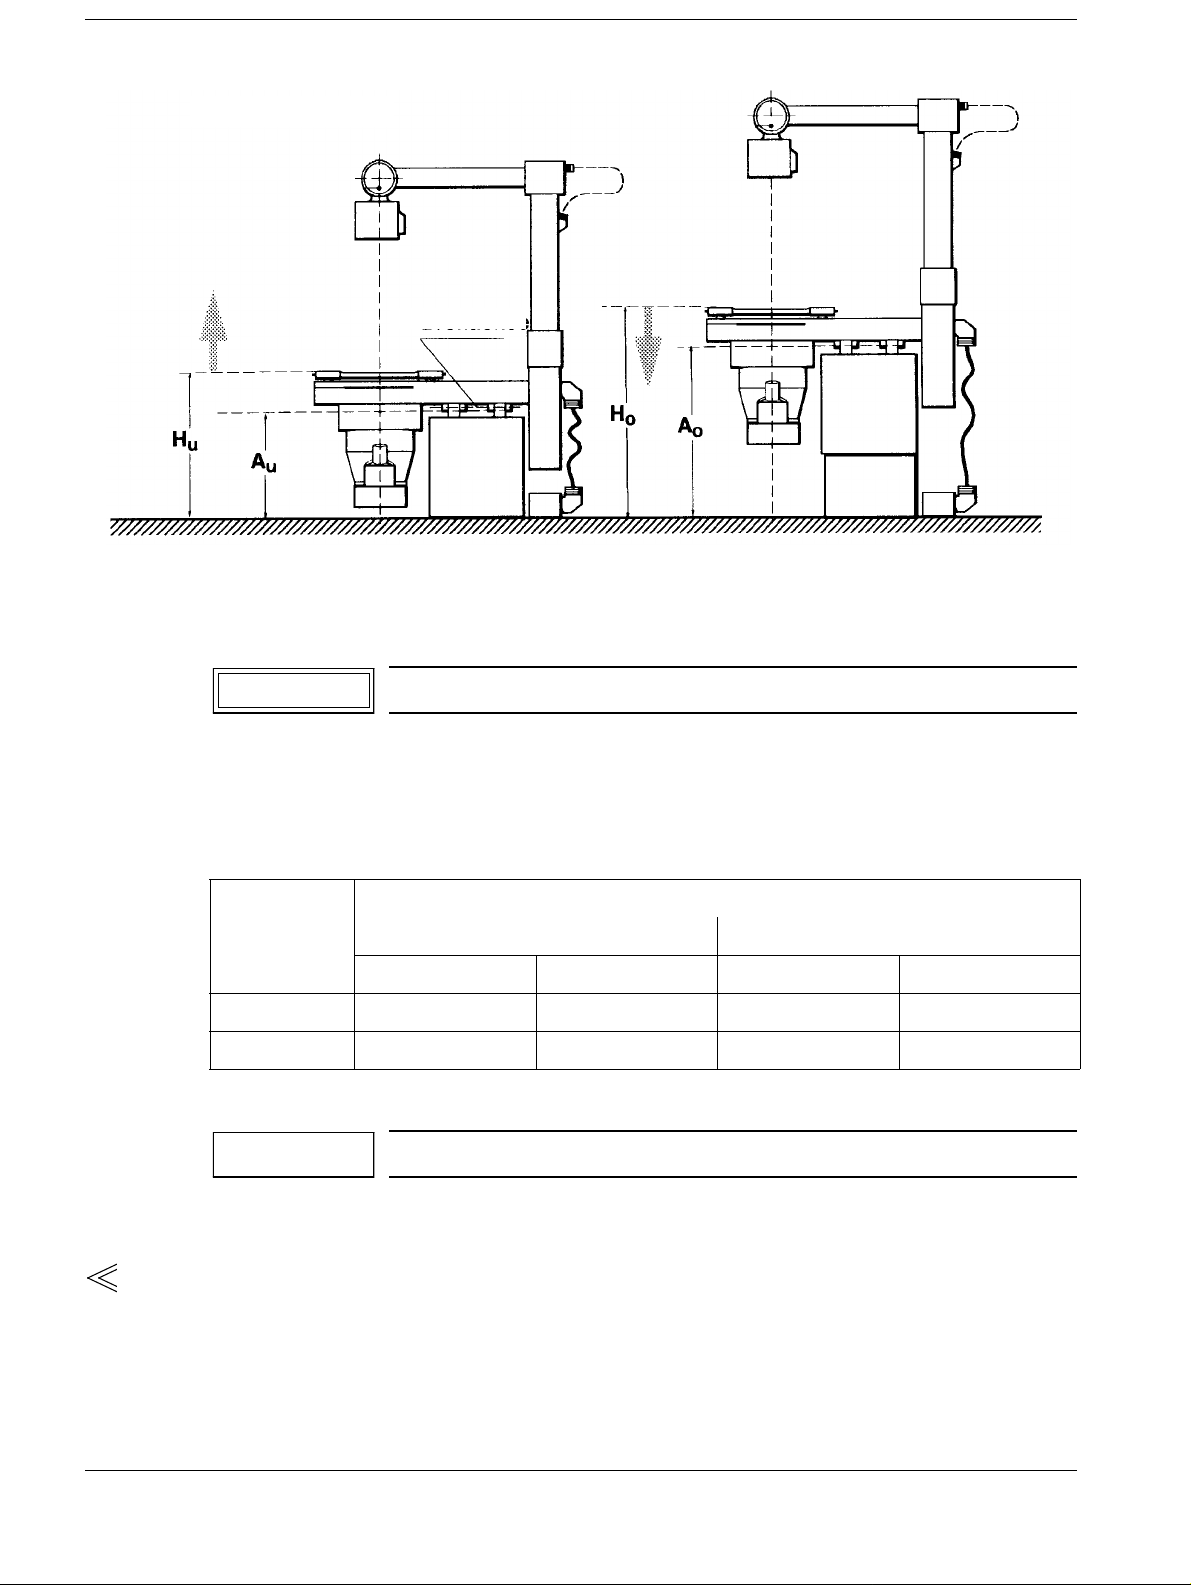
Lifting movement
Rotating axis
Lifting movement 4
Move into the end positions in gradual increments.
• Tilt the unit into the 0° posit ion.
• Successively move the unit into both end pos itions.
• Measure the distance between the floor or top surface of the installation pl ate and the
top surface of the tabletop or rota ting axis for both system positions :
Nominal distance between the floor or top surface of the installation plate
and top surface of the tabletop and rotating axis
H
u
82 cm ± 5 mm 128 cm ± 5 mm 62 cm ± 5 mm 108 cm ± 5 mm
for I.I. 40 86 cm
! minimum distance I.I.
Read the values displayed on the PC and compare them with the factory test values on
the test certificate.
± 5 mm 128 cm ± 5 mm 66 cm ± 5 mm 108 cm ± 5 mm
⇔ floor: 4 cm !
= 128 cm, possible only for room heights 2.60 m and above.
H
o
H
o
A
u
A
o
• Initial the comparison as conf irmation.
Lowest point: 62 cm to center of rot ation with tilted table (+88°).
• Correction: UROSKOP D adjustment instructions
UROSKOP D3 Register 4 RLL5-310.034.04 Page 2 of 6 Siemens AG
Rev. 04 12.98 TD PS 24 Medical En gineering
Page 21
Unit movements 4 - 3
CAUTION
Oblique projection 4
Move into the end positions in gradual increments.
• Swivel the tube assembly support arm i n each case from the 0° position into bot h end
positions, -15° and +15°.
The 15° values must be indicated on the system cont rol console; at the same time, the
safety limit switch must not be pres sed.
• Read the values displayed on the PC under menu it em [
compare them with the factory test v alues in the test certifi cate.
• Initial the comparis on as confirmation.
• Correction: UROSKOP D adjustment instructi ons.
Unit state
], [Current] and
Siemens AG Register 4 RLL5-310.034.04 Page 3 of 6 UROSKOP D3
Medical Engineering Rev. 04 12.98 TD PS 24
Page 22
4 - 4Unit movements
CAUTION
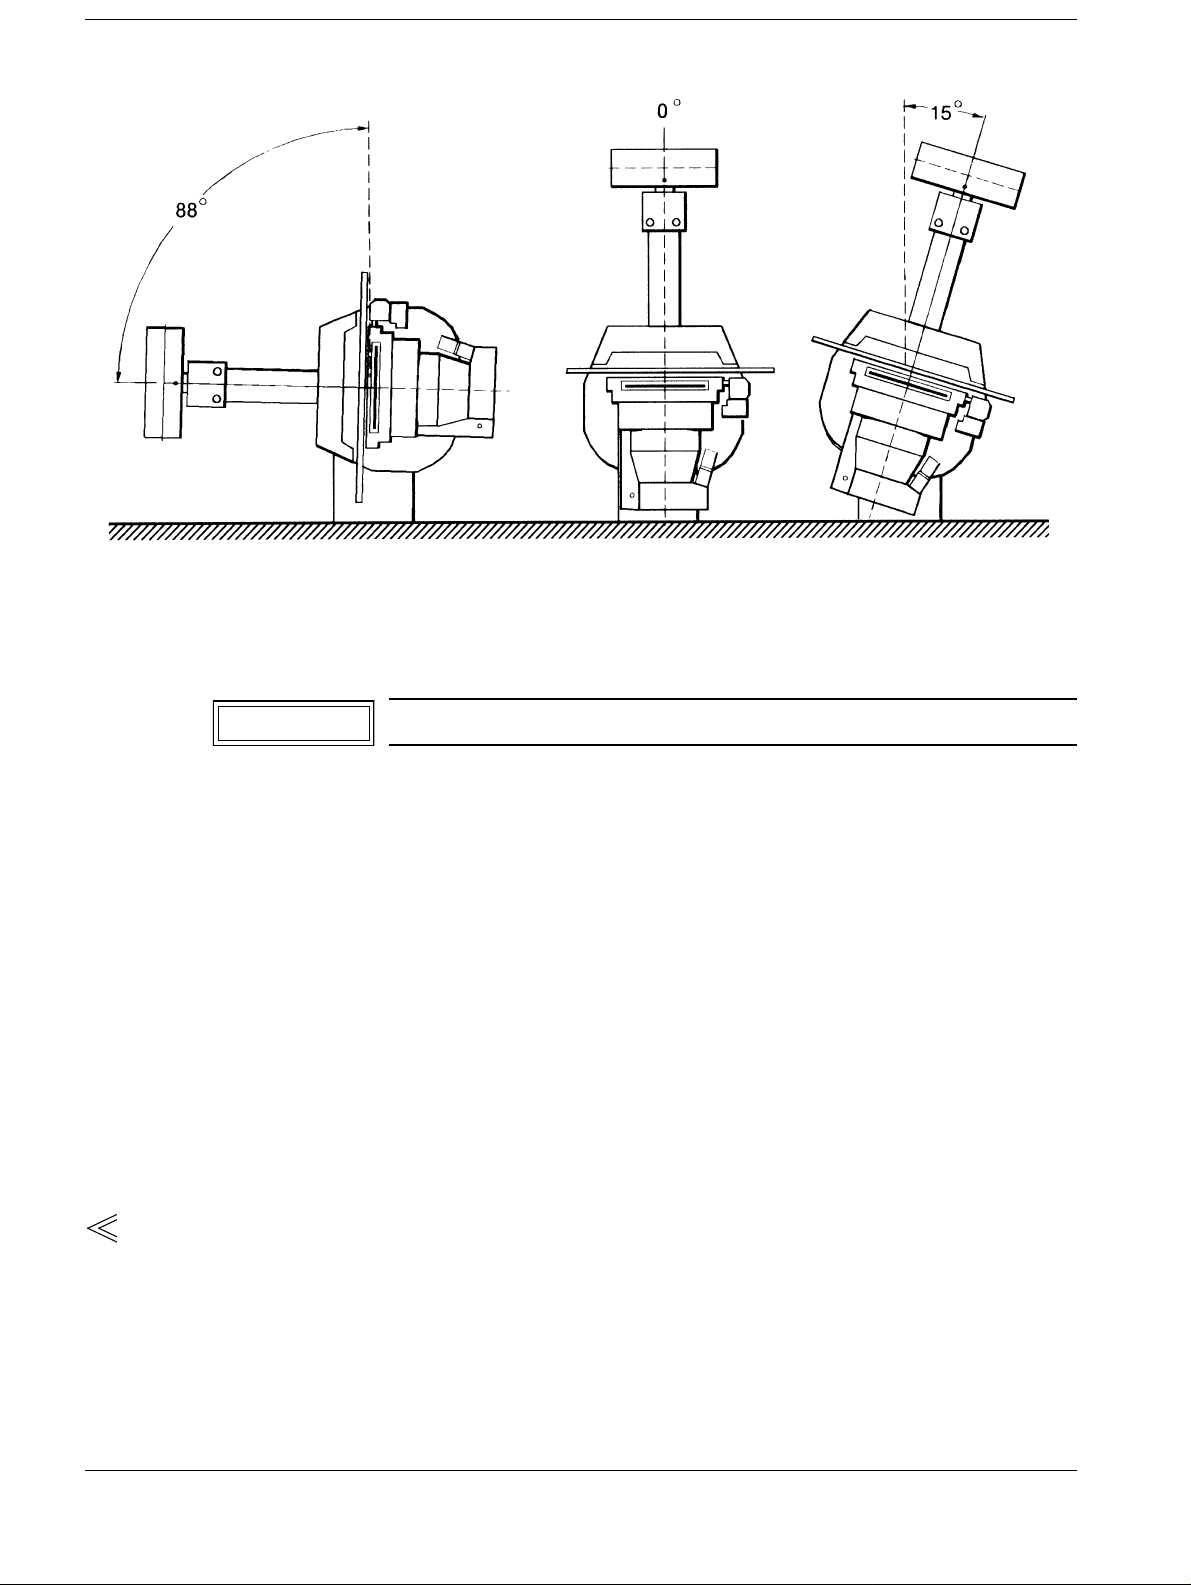
Tilting movement 4
Requirement: The installation plate must be level.
Move into the end positions in gradual increments.
• Tilt the unit in each case from bo th directions into the 0° positi on.
• Check the 0° position in each case with the p recision water level after the automati c stop.
Nominal: 0°
• Swivel from the 0° position in to the +88° end position; the switchi ng cam must not touch
the limit switch.
• Check the +88° end position with th e precision water level.
Nominal: 88°
• Swivel from the +88° end positio n into the -15° end position; the swit ching cam must not
touch the limit switch.
• Check the -15° end position with th e precision water level.
Nominal: - 15°
• Read the values displayed on the PC and compare them with t he factory test values in
the test certificate.
± 0.3°
± 0.5°
± 0.5°
• Initial the comparison as conf irmation.
• Correction: UROSKOP D adjustment instructions .
UROSKOP D3 Register 4 RLL5-310.034.04 Page 4 of 6 Siemens AG
Rev. 04 12.98 TD PS 24 Medical En gineering
Page 23

Unit movements 4 - 5
CAUTION
Wall side
Physician‘s side
Head end
Longitudinal movement of the tabletop 4
Move to the end positions in gradual increments.
• Move the tabletop successivel y into end positions A and K.
• Measure the distance between the l eft tabletop edge and the left front of the front guide
rail for both table pos itions.
Nominal: L
= 573 mm ± 5 mm
a
= 573 mm ± 5 mm
L
k
• Read off the values displayed on the PC and compare them with the factory test value s
of the test certificate.
• Initial the comparis on as confirmation.
• Correction: UROSKOP D adjustment instructi ons.
Siemens AG Register 4 RLL5-310.034.04 Page 5 of 6 UROSKOP D3
Medical Engineering Rev. 04 12.98 TD PS 24
Page 24

4 - 6Unit movements
CAUTION
Wall side
Head end
Physicia n ‘s side
Transverse movement of the tabletop 4
Move to the end positions in gradual increments.
• Tilt the unit into the 0° posit ion.
• Move the transverse carriag e of the tabletop successively into bo th end positions R
and L.
• Measure the distance between the re ar table edge and the front edge of the tub e
assembly support arm for both t able positions:
Nominal: Q
• Initial the comparison as conf irmation.
• Correction: UROSKOP D adjustment instructions .
• End the service program with <F10>.
= 55.5 cm,
l
= 31.5 cm Total tolerance: 5 mm
Q
t
UROSKOP D3 Register 4 RLL5-310.034.04 Page 6 of 6 Siemens AG
Rev. 04 12.98 TD PS 24 Medical En gineering
Page 25

Side
marking
Metal washer
Cassette
center
Head
end
NOTICE
Radiation geometry 5
5 - 1
Fig. 1 Fig. 2
The central beam has been adjusted at the factory and documented on page 4 of the test certificate.
Take a few test exposures to ensure that the setting has not
changed during transport and installation.
The test certificate is contained in the UROSKOP D logbook,
RLL5-310.066.
DHHS
RöV
§16
• Mark the center of a 24 cm x 30 cm (10" x 12") cassette by attaching a metal washer
(Fig. 1).
• Attach a second washer to the casset te as a side marker (Fig. 1).
• Insert the cassette wh ich has been loaded with film in the longi tudinal direction
(side marking at the head end).
Side
marking
Film
drawn diagonals
Z
Metal
washer
Radiation field
exposed film area
Cassette
center
• Collimate the radiation fi eld smaller than the cassette format (approx. 15 cm x 15 cm).
Set the exposure data: approx. 40 kV, 5 mAs and large focus
(with universal film screen) .
• Make one exposure each with the table in th e 0°,+88° and - 15° position in each case.
• Develop the three films.
• Draw the radiation fiel d center onto the developed film (Fig. 2).
• Measure the deviation (z/Fi g. 2) between the radiation field center and the center mar-
king (washer) on the 2 exposures (Z1, Z2) .
• Compare the measured deviations Z1, Z2 with the factory test exposures and enter the
values into the
film center".
The difference from the values determi ned at the factory may be max. 2 mm.
Max. acceptable deviations:
UROSKOP D
test certificate, "Coinc idence of radiation field center and
≤ 1 cm
• If the deviation is greater than > 1 cm, adjust the central beam accordi ng to the adjust-
ment instructions and repeat the test exposures.
Siemens AG Register 4 RLL5-310.034.04 Page 1 of 6 UROSKOP D3
Medical Engineering Rev. 04 12.98 TD PS 24
Page 26

5 - 2Radiation geometry
NOTICE
The accuracy of collimation for the PBL system is tested for three formats.
Film subdivisions can also be selected.
The table position is unimportant for this test.
Test conditions 5
• Expose 3 formats onto one film.
• With large focal spot
r
= 115 cm
B
a
= 7 cm
r
DHHS
RöV
§16
B
M
= 108 cm
/ (rB - a) = 1.065
= r
B
rB - a
r
B
a
Radiation field
Test film
Cassette without film
Tabletop
• Use a 35 cm x 35 cm cassette with film and place it on the tabletop diagonal to the table
edges and centered to the central beam.
• Close the collimator all the way.
• At the generator select the lar ge focus and approx. 50 kV, 25 mAs.
• Now insert three cassettes consecuti vely (film subdivisions as well, if necessar y) without
film in the spotfilm device, s tarting with the smallest format. Rel ease one exposure for
each format. Select full vi ew form for all exposures.
• If available, use the three for mats of 18 cm x 24 cm, 24 cm x 30 cm and 35 cm x 35 cm
for the test.
• The three exposures are shot over one anoth er on the same film. The evaluation is pos-
sible due to the different film densi ty of the individual formats.
Ensure that the format is always collimated from the smaller to
the larger collimator aperture.
• Develop and label the film.
UROSKOP D3 Register 4 RLL5-310.034.04 Page 2 of 6 Siemens AG
Rev. 04 12.98 TD PS 24 Medical En gineering
Page 27

Radiation geometry 5 - 3
Evaluation 5
• Measure the length and width (l’ and b’) of the three radiation fields on the f ilm and
record the values.
• Use the factor M for converti ng the radiation fields from measurement pla ne to film plane.
M = r
• Using M, calculate the radiati on field sizes in the film plane (l and b) f rom the measured
field sizes (l’ and b’) and record the values.
/ rB-a = 115 / (115 - 7) = 1.065
B
l=l'×M; b=b'×M
• Calculate and record the devi ations between nominal format (l
radiation field size in the f ilm plane (l and b) referenced to the SID (r
Tolerance:
l l
r
B
N
≤ 0.02; ≤ 0.02 corresponds to 2%
b b
r
B
N
and bN) and actual
N
).
B
Siemens AG Register 4 RLL5-310.034.04 Page 3 of 6 UROSKOP D3
Medical Engineering Rev. 04 12.98 TD PS 24
Page 28

5 - 4Radiation geometry
Check whether the coincidence between the radiation field and fluoro field are displayed
on the monitor for all image int ensi fier formats . I n addit ion, ch eck t he cen tering of the radi ation field to the monitor image center in the extreme table positions.
Test conditions 5
FLUORO field limitation:
• In one table position
• For all I.I. formats
Centering:
• In 3 table positions
• For I.I. full view format
RöV
§16
§16
X1
Y1
X2
Y2
r
r
B
BV
Strahlenfeld
T estfilm
Zentrierkreuz
ZG
Brief description of the test 5
• Center the centering cross to the cent ral beam under fluoroscopy.
• Open the collimator to maximum aperture and verif y that the collimator blades are
visible on the monitor.
If yes, the check for overframing i s not required.
• Count and record the cm scale divisions of the 4 coordinates X
, X2, Y1, Y2.
1
• If the collimator blades are not vis ible, place a film envelope with tes t film in the plane at
the centering and release fluorosco py (approx. 20 sec.).
• Evaluation:
Compare the radiation field on the test f ilm with the field size on the monitor.
Determine overframing in % of the SID.
Determine the off-center and calculate it in % of the SID.
UROSKOP D3 Register 4 RLL5-310.034.04 Page 4 of 6 Siemens AG
Rev. 04 12.98 TD PS 24 Medical En gineering
Page 29

Radiation geometry 5 - 5
Visual check of the fluoroscopic field limitation 5
• Align the central beam perpendi cular to the I.I. and move the tablet op into the horizontal
position or into a frequently use d mid-range position. Record the ti lt angle of this position.
• Do not insert a cassette in t he spotfilm device. Select I. I. full view format.
• Open the collimator to maximum apertur e and verify that the collimator blades ar e still
visible on the monitor.
• Perform this check for all I .I. formats and record whether the coll imator blades are visible
on the monitor.
• Determine and record: source- centering cross distance (r), SID = 115 cm.
• This completes the fluoros copic field limitation check for al l formats in which the collima-
tor blades are visible on the monitor .
• The degree of overframing must be determi ned for those formats in which all co llimator
blades are not visible.
Checking the overframing of the fluoroscopic field size displayed on the
monitor 5
• Maintain the mid-range table posi tion.
• Attach the centering cross to the tabletop so that the X axis is horizon tal.
• Collimate a small radiatio n field and center the centering cr oss to the radiation field
under fluoroscopy.
• Open the collimator to maximum apertur e. Proceeding outward from the center of the
centering cross, read and record the cm divisions of the 4 coordinates X
width and height displayed on the monitor .
, X2, Y1, Y2 in
1
• Perform this for all I.I . formats in which the collimator blades can no longer be seen on
the monitor at maximum collimator apert ure.
• Place a film envelope with t est film in the plane at the centering cros s and release
fluoroscopy at maximum collimator aper ture until sufficient film densit y is obtained.
• Repeat this for all I. I. formats in which the collimator blades are not visible on the
monitor.
• Make one test film each with the fo rmats to be tested and label.
Siemens AG Register 4 RLL5-310.034.04 Page 5 of 6 UROSKOP D3
Medical Engineering Rev. 04 12.98 TD PS 24
Page 30

5 - 6Radiation geometry
Checking the centering of radiation field and monitor image center 5
• Select I.I. full vie w format. Maintain the mid-range tabl e position.
• Unless already done, center the centeri ng cross to the central beam (tabletop) and open
the collimator to maximum aperture.
• Proceeding outward from the center of the c entering cross, read and record the cm
, X2, Y1 and Y2 displayed on the monitor.
1
+ X2 and Y1 + Y2) is determined and calculated in % of the
1
§16
divisions of the 4 coordinates X
• Repeat the same procedure in the two extre me positions of the table: collimate small,
center the centering cross to t he central beam, open the collimator to maximum
aperture, read off and record t he scale divisions in the X and Y axis.
Evaluation of overframing in fluoroscopy 5
• Measure the width and length of the radi ation fields displayed on th e test films and
record the radiation field sizes ( l and w).
The difference (overframing) between the r adiation field size (l and w) and the fiel d size
displayed on the monitor (X
source-centering cross distance:
Tolerance:
b
(
X1 + X2)
r
≤ 0.02; ≤ 0.02 corresponds to 2%
l
(
X1 + X2)
r
Evaluation of off-center in fluoroscopy 5
• The off-center devi ation (z
lated in each case in the X and Y dir ection for all table positio ns (tilt angles) tested:
z
X
X1 X
and zy) of radiation field and monit or image center is calcu-
x
2
z
;
2 2
Y
==
Y1 Y
2
;
• The off-center deviation is cal culated in % of the source-centering cross di stance.
Tolerance:
z
X
≤ 0.02 ≤ 0.02 corresponds to 2%
;
r r
z
Y
;
UROSKOP D3 Register 4 RLL5-310.034.04 Page 6 of 6 Siemens AG
Rev. 04 12.98 TD PS 24 Medical En gineering
Page 31

NOTICE
Checking the tomographic device 6
The tomographic device has been adjust ed a t the fact ory. The setting is documented in the test certificate and via three test exposures included in the shipment. Take a test exposure to ensure
that the setting has not been changed during t ranspor t and ins tallation.
Anode side
20°
2 mm
approx. 115 mm
6 - 1
SH
a
• Move the tabletop into the horizo ntal position and select "tomography" operating mode.
• Place a foam cube with definit ion tests on the tabletop and center it to the light localizer.
One definition test must be located on t he anode side, the other test must face toward s
the tube assembly support arm.
• Ensure that the notches of the t wo definition tests are located at the same height above
the tabletop; measure this dimension ( approx. 11.5 cm) exactly.
• Select the tomographic height so t hat the numerical tomographic height dis play corres-
ponds exactly to the measured "notch hei ght".Record this dimension as select ed tomo-
graphic height ”SH
” in the test certificate under section 12.
a
• Load film into an 18 cm x 24 cm casset te with high-resolution film -screen combination
and insert it into the spotfilm devi ce.
• Collimate the field size onto th e surface of the test phantom.
• Select the small focus ( ) and insert a 0.3 mm Cu filter into the collimator.
• Select the tomographic patte rn indicated in the test certif icate for the 1st exposure and
set the specified kV value and mAs value.
• Release a tomographic exposure and devel op the film.
The basic film density should be approx. D = 1 to 1.4.
• If necessary, repeat the ex posure with a different mAs value.
Siemens AG Register 4 RLL5-310.034.04 Page 1 of 2 UROSKOP D3
Medical Engineering Rev. 04 12.98 TD PS 24
Page 32

6 - 2 Checking the tomographic device
Accuracy of the tomographic height display 6
• The sharply delineated hole of t he definition test is located in the tomogra phic plane.
§16
• If the hole near the notch is delinea ted sharply, the numerically displ ayed tomographic
height SH
• In the case of deviations, dete rmine the height difference ∆ SH
sharply delineated hole and the not ch (the height difference from one hole to the other is
0.2 cm).
When the actual tomographic height is located above the notch, then
When the actual tomographic height i s located below the notch, then
• Determine and record the actual tomographi c height SH =SH
The deviation
coincides with the actual tomogra phic height SH, i.e. ∆ SHa = 0.
a
in mm between the
a
∆ SH
∆ SH
+ ∆ SHa.
a
∆ SH
must be ≤ 0.5 cm.
a
is positive.
a
is negative.
a
Resolution and tomographic procedure 6
Compare the test exposure made during sys tem st art- up at th e cust omer si te wit h t he corresponding test exposure made at the factory:
• Using a magnifying glass (min. 6x magnifi cation), determine and record the maximum
visible resolution of the te st exposures.
The resolution may not deviate from the resol ution of the factory test exposure by mor e
than one line group; the minimum resoluti on must be
≥ 2 Lp/mm.
• The shape and course of the tomographic patt ern and the evenness of the blurring on
the test exposure must be comparable to the fac tory test exposure.
§16
• Assessing the test exposures:
Compared with the resolution of the Bucky ex posure, the resolution of the tomographi c
exposure may not deviate by more than one li ne group.
The blurring shadows of the holes and line s must run in parallel over the ent ire range.
If this is not the case, the n the film path and the focus path are not i n parallel.
Wavy lines may be caused by oscillations in the s ystem.
• The different film densities of the imaged holes may be caused by grid inter ferences
(this cannot be avoided - it is not critical.)
UROSKOP D3 Register 4 RLL5-310.034.04 Page 2 of 2 Siemens AG
Rev. 04 12.98 TD PS 24 Medical En gineering
Page 33

NOTICE
Fluoroscopic dose rate 7
General 7
The following test measurements for the image quality test certificate ensure that the system is functioning correctly and that the factory settings have not changed.
Important: To recor d the measured values, use the IQ test certificate RXD0-
000.037.01... The paragraphs indicated in brackets in the following
text refer to this test certificate.
The test certificate is located in the UROSKOP D logbook, Register 9.
The customer’s address, system overview and the required measurement instruments
(para. 1, 1.1, 1.2 and 1.3) must be recorded.
Preliminary remarks 7
Basic information on the dose / dose rate measurement for I.I. workstations7
For dose measurement at the I.I. input (KB) or dose rate measurement at the I.I. input
), attach the dosimeter chamber as close as possible to the I. I. In the case of spotfilm
(K
B
devices, place it in the cassette shaft.
7 - 1
Press the emergency STOP button on the Uroskop.
If this is not possible, measure the dose (K
ating layers, on the tabletop.
The measured value is converted into the value at the I.I. input using correction factor m
(unit attenuation factor ).
The unit attenuation factor contains al l attenuating layers between patient, image and
receptor including the di stance fact or; it i s specifi ed in the test certificat es and can also be
determined by multiplying the attenuation factors of the individual layers.
A radiation attenuation of 6% by th e dose measurement chamber must al so be taken i nto
account (factor 0.94).
) or the dose ra te (KTg) in front of the attenu-
Tg
Determining the dose/dose rate directly at the I.I. input 7
Place the dose measurement chamber in the beam path (UROSKOP D2, D3) for measurement. After the ADC has stabilized, press the STOP button. Factor 0.94 does not
apply in this case.
Determining the unit attenuation factor from the indi vidual attenuation factors
Attenuation factor of tabletop, back panel spotfilm device etc. m
Attenuation factor of scattered radiation grid m
Attenuation factor of Iontomat chamber m
T
R
I
2
r
Distance factor attenuation factor mA =
Unit attenuation factor m = mT x mR x mI x mA . . . . . . .
Siemens AG Register 4 RLL5-310.034.04 Page 1 of 4 UROSKOP D3
Medical Engineering Rev. 04 12.98 TD PS 24
B
r
T
Page 34

7 - 2Fluoroscopic dose rate
Cu-Filter
Measurement chamber in front of attenuating layers
Tabletop or spotfilm device back panel
Grid
Unit
attenutation
factor
Iontomat chamber
Measurement chamber in I.I. plane (cassette shaft)
I.I. input
K
B/KB
K
Bg/KBg
K
Tg/KTg
r
B
r
T
= dose/dose rate directly at I.I. input
= measured dose/dose rate in I.I.plane
= measured dose/dose rate in front of attenuating layers
= source-image receptor distance
= distance between source and start of the attenuating layers
Formulas for calculating the dose/dose rate in the measurement plane for
dose/dose rate setting 7
During setting, the dose or dose rate required directly at the I.I. input must be converted
into the measuring plane (I.I. plane or in front of attenuating layers). Use the modified formulas to do this.
Dose Dose rate
Ionization chamber in I.I. plane K
Ionization chamber in front of
= K
Bg
B
KTg = KBg x m KTG = KB x m
attenuation layers
Remark: With Polydoros S and SX generators, radiation attenuation via the dose
measurement chamber is already taken into account duri ng setting (for
adjustment: move the dose measurement chamber out of the beam path).
Do not use factor 0.94 for calculating the dose rate to be set.
KBg = K
B
UROSKOP D3 Register 4 RLL5-310.034.04 Page 2 of 4 Siemens AG
Rev. 04 12.98 TD PS 24 Medical En gineering
Page 35

Fluoroscopic dose rate 7 - 3
NOTICE
Indirect dose rate test at the customer site 7
(Para. 4.1.2 Chapter 4)
Before setting different customer-specific fluoroscopic parameters, check via the indirect
dose rate test that the factory settings have not been changed and that the system functions properly.
- Select the operating conditions documented i n the IQ test certificate.
- Place 2.1 mm Cu (precision radiation filter 99 00 598) in the beam path.
- Open the collimator to maximum aperture.
- If the factory values (kV, mA) are obtained, tran sfer the dose rate values from tabl e
4.1.1 to table 4.1.2.
Notes on the acceptance test in Germany according to §16 RöV:
After programming the customer -specif ic fluoros copic parameters , the dose ra te for all FL
control stages and all I.I. formats must be measured and entered in the acceptance cer tif-
§16
icate together with the kV and mA values. Use 25 mm Al + 1.5 mm Cu as prefiltration.
The dose rate values measured with 25 mm Al + 1.5 mm Cu correspond to the values
measured with 2.1 mm Cu; the resulting kV and mA values are different.
Setting when the indirect dose rate is out of tolerance 7
(Para. 4.2.1 Chapter 4)
If the dose rate must be readjusted after repai r work etc., the dose rate measur ed must be
entered in the image quality test certificate under “Resetting the dose rate”.
Perform measurement of the dose rate and determination of the kV and mA values as
well as the documentation as described above.
Switch the dose meter on at least 15 minutes before measurement
and calibrate it.
Test conditions:
For dose rate measurements, program the anti isowatt curve (C00) to Fluoro 2 and then
perform the checks.
- Source-I.I. distance: 118 cm
- Attach 2.1 mm Cu to the collimator.
Sequence of work:
- Connect DVM to POLYDOROS D901 X2.1 and 7.
- Move the table into its center positi on so that table rails lie outside the beam path.
- Select full view I.I. format and open the coll imator to maximum aperture.
- In the”Adjustment” service program, set ”Ski ndoserate” to the maximum value, at
110 kV and 70 kV.
- Press the EMERGENCY STOP button.
- Place the measurement chamber in front of the I.I., measuring range 1.0 µGy/s, and
center it.
- Select ”Adjustment”/”Doserate”.
Siemens AG Register 4 RLL5-310.034.04 Page 3 of 4 UROSKOP D3
Medical Engineering Rev. 04 12.98 TD PS 24
Page 36

7 - 4Fluoroscopic dose rate
- Click on ”Start Measuring”.
- Increase the current until 876 µGy/s are reached and conf irm with ”ok”.
- Remove the measurement chamber.
- During fluoroscopy, the DVM must read 700 mV
distributor) (check with cl osed light distributor).
- Perform the adjustment.
- Exit the service program with ”Syst. di sconnect”.
Maximum skin dose rate 7
(Para. 4.4.2 Chapter 4)
Measure and record only if required by the country-specific regulations (USA, Canada).
- Full I.I. format
-Min. SID
- Cover I.I. to protect it from radiat ion (protects input layer of I.I.) and remove the fuses of
the I.I. power supply (TV-camera).
- Position the dose measurement chamber 30 cm above the tabletop.
- Ensure that the dose measurement chamber is exposed complete ly.
- Measure the resulting dose rate at all ADC cont rol stages.
- In each case, record the kV and mA values produced (di splay of the generator
console).
± 35 mV; adjust with D100/R1 (in light
DHHS
During start-up, perform measurements for all control stages described above that have
not yet been checked at the factory (customer-specifi c ADC control system parameters).
Enter the ADC control system parameters already checked at the factory fr om table 4.4. 1
in 4.4.2.
Notes on the acceptance test in USA and Canada according to DHHS regulations:
Use the maximum skin dose rate val ues obtained at the factory and during st art-up for the
acceptance test certificate.
UROSKOP D3 Register 4 RLL5-310.034.04 Page 4 of 4 Siemens AG
Rev. 04 12.98 TD PS 24 Medical En gineering
Page 37

Television system 8
Function check of ambient light sensor 8
- Switch on the ambient light sensor.
- Cover the ambient light sensor with your hand:
The monitor image must visually change .
- Switch off the ambient light sensor again.
- Perform all other IQ checks with the ambient l ight sensor switched off.
B-signal values (without bias light/dark current component) 8
(Para. 5.3.1 Chapter 5D)
Notice:
Measure the B-signal with expanded t ime base ( greater accur acy of measur ement) in the
line center and noise center of a line in the image center (Fig.1).
Test conditions:
- Insert the grid
- Source-I.I. distance: 118 cm
- Attach prefiltration of 2.1 mm Cu to the co llimator
8 - 1
Sequence of work:
- Switch on fluoroscopy, select or progra m antiisowatt curve C00
- Measure and record the B-signal for all I.I. formats
Table 5.3.2 (without bias li ght/dark current component)
- Switch off fluoroscopy
.
Notes:
During repeat measurements, th
e B-signal values may drop by up to
15 mV compared to the values measured when setting the iris diaphragm
depending on the system. In this case,
repeat the setting and taking the measured deviation into consideration,
remeasure and record the results.
Noise center,
line center
Siemens AG Register 4 RLL5-310.034.04 Page 1 of 2 UROSKOP D3
Medical Engineering Rev. 04 12.98 TD PS 24
Page 38

8 - 2 Television system
Image artifacts (Para. 5.10 Chapter 5D) 8
- Mark all image artifacts which are detected dur ing setting and image quality tests in
the table in the image quality test certificate. The test point s listed in the table indicate
measurements in which each artifact gener ated is stronger and/or can be better
evaluated.
- If any image artifacts are detected which are no t listed in the table, these must be
described under ”Other artifa cts”.
- To assess the respective artifacts, ther e are three rating numbers which indicate the
extent of each artifact:
Definition of the rating numbers:
1 =No artifacts could be determined during start-up.
2 =A few artifacts occurred sporadically during start-up. The cause could not be located
and the”error” could not be corrected. The artif acts do not adversely affect the overall
appearance of the images and do not compromise the diagnostic value of the images
in any way. The artifacts are determined to be tolerable.
3 =During start-up, artifacts of greater severity occurr ed frequently and they negatively
influenced the overall appearance of the images or compromised their diagnostic
value. Therefore, the artifacts were determined to be intolerable and the system could
not be turned over to the customer.
Description of the artifacts
- Hum:
Inhomogeneity caused by electromagnet ic fields in imaging systems. This ar tifact may
significantly influence the diagnostic value of the images depending on the type of
interference. Ideally , this artifact should not occur at all. However, extremely low level s
can be tolerated. Hum artifacts appear as periodic, horizontal bright and dark
structures in the image; they appear randomly and are not specific to one locati on.
- Streaks:
Very high-frequency electromagneti c fields appear in the image as bright or dark,
sometimes very short, tr ansverse streaks in the image. They are t ransient. Streaks
caused by contaminants on the surfaces of lenses, etc. should be included in t his
group. In this case, they are spe cific to one location and are const ant. Streaks are
unacceptable.
- Fraying:
Fraying is caused by strong black-whi te transitions due to ”overmodulated ” video
amplifiers. The object edge is ”d istorted” laterally t o the right. Slight fraying on t he
black-white step can be tolerated.
- Ghosting:
These artifacts are object c ontours displayed twice, with the sec ond contour generally
shifted laterally. They are caused by reflections in long, poo rly adjusted video cables.
Clearly visible ghosting is unacceptable.
- Microphonics:
Microphonics is caused by mechanical oscillations (rotating anode r unning, etc.)
which are transferred to the TV camera, i nfluence the deflection field s of the electron
beam and mostly display very regular interference structures simil ar to those
generated by electromagnetic hum inter ferences in the TV image. Microphonics is not
acceptable.
UROSKOP D3 Register 4 RLL5-310.034.04 Page 2 of 2 Siemens AG
Rev. 04 12.98 TD PS 24 Medical En gineering
Page 39

NOTICE
Digital Fluoro Radiography/FLUOROSPOT H 9
General information and remarks 9
Unless otherwise indicated, the FLUOROSPOT is always enabled
(no bypass) for the following tests.
Use organ programs as indicated; or generate them, if necessary.
List deviations next to the corresponding test point.
Organ programs for test purposes
Fluoro program:
For image quality acceptance test
Name: Fluoro program
edge enhancement (%): 0
filter coefficient: 0
window upper limit: 511
window lower limit: 256
bone display: black
Image: no
motion detection: not enabled
noise filtra ti on (%):
9 - 1
DR single image:
For image quality acceptance test
Enter dose value according to test conditions.
Name: DR single
kV: manual
kV manual: 70
dose: 100
exposure data from fluoro: no
edge enhancement (%): 0
filter coefficient: 0
window upper limit: 511
window lower limit: 256
bone display: black
Image: no
organ curve: manual-kV selected
kV for dose reduction: manual-kV selected
maximum x-ray pulse width (ms): 3000
blackening correction: 0.0
focus: small
Siemens AG Register 4 RLL5-310.034.04 Page 1 of 20 UROSKOP D3
Medical Engineering Rev. 04 12.98 TD PS 24
Page 40

9 - 2 Digital Fluoro Radiography/FLUOROSPOT H
DR series:
For image quality acceptance test
name: DR series
kV: manual
kV manual: 70
dose: 100
exposure data from fluoro: yes
frames per second: 0.5 (1) (8)
maximum x-ray pulse width (ms): 1000 (800) (65)
scene length (sec: 10s
edge enhancement (%): 0
filter coefficient: 0
window upper limit: 511
window lower limit: 256
Bone display: black
Image: no
organ curve: manual kV selected
kV for dose reduction: 109
stop mode of generator: no
blackening correction: 0.0
focus: small
delta kV: fixed focus selected
UROSKOP D3 Register 4 RLL5-310.034.04 Page 2 of 20 Siemens AG
Rev. 04 12.98 TD PS 24 Medical En gineering
Page 41

Digital Fluoro Radiography/FLUOROSPOT H9 - 3
DSA:
For image quality acceptance test
Enter dose value and frame rate according to test conditions.
Name: DSA
kV: manual
kV manual: 70
dose: 100 (200), (500)
exposure data from fluoro: yes
frames per second: 1/0,5/8 (1/6), (1/6/8)
scene length: 10s (10), (5)
native display
edge enhancement (%): 0
filter coefficient: 0
window upper limit: 511
window lower limit: 256
bone display: black
subtracted display
edge enhancement (%): 0
filter coefficient: 0
window center (W1): 80
contrast (W2): 220
Image: no
organ curve: manual kV selected
kV for dose reduction: 109
blackening correction: 0.0
focus: large
delta kV: fixed focus selected
Siemens AG Register 4 RLL5-310.034.04 Page 3 of 20 UROSKOP D3
Medical Engineering Rev. 04 12.98 TD PS 24
Page 42

9 - 4 Digital Fluoro Radiography/FLUOROSPOT H
Image quality test exposures
The following images are stored on har d disk (HD) for syst ems pret ested at th e facto ry as
a reference for the field service techni cian for system start-up.
Compare the test images taken during start-up at the customer site with the test images
taken at the factory. This will allow you to detect and eliminate any deviations (e.g. deviations which have occurred since the factory test).
Name (Pat)
name
DR_Ramp MP 8.2 (SS off) Single / DR expos. => store 1 image
DSA_Ramp MP 8.2 (SS off) DSA series => save 1-2 images (precon-
LIH_Dyn MP 8.5 (Temp=0) LIH => store monitor
DR_Dyn MP 8.5 (
LIH_Resol MP 8.7 (Temp=0) LIH => store monitor for each I.I. format
DR_Resol MP 8.7 (
DSA_Resol MP 8.7 (1/100) DSA series with each I.I. format
DSA_Dyn I MP 8.9 (1/500) DSA series => store 2 images,
DSA_Dyn II MP 8.9 (6/200) DSA series => save 2 images
DR_HOM MP 8.10 (
DSA_HOM I MP 8.10 (1/500) DSA series with solder tin cross
DSA_HOM II MP 8.10 (6/200) DSA series with solder tin cross
Type of examination
Identification
− / 100) Single/DR expos. => store 1 image
− / 100) Single/DR expos. with each I.I. format
− / 100) Single/DR expos. with solder tin cross
(Remarks on storage)
trast), delete remaining images of the series
Save 1-2 images per series (precontr ast) and
delete remaining images
(mask, filling);
delete remaining images of the series
(mask, filling);
delete remaining images of the series
=> save 2 images (mask, filling);
delete remaining images of the series
=> save 2 images (mask, filling);
delete remaining images of the series
UROSKOP D3 Register 4 RLL5-310.034.04 Page 4 of 20 Siemens AG
Rev. 04 12.98 TD PS 24 Medical En gineering
Page 43

Digital Fluoro Radiography/FLUOROSPOT H9 - 5
CAUTION
Dose/pulse test during start-up (indirect dose check) 9
(Para. 8.1.2 Chapter 8A)
No additional filtration must be selected on the multileaf collimator . The dosimeter must be switched on for at least 15 minutes
and calibrated.
The "indirect dose check" is a simple procedure used during system start-up to check
whether the dose values set and recorded at the factory have changed.
For the ”indirect dose check”, place a 2.1 mm Cu filter (precision radiation filter
99 00 5988) in the beam path and measure the mAs value per pulse (Qg/n) with the collimator at maximum aperture. Subsquently, compare the values with the mAs value per
pulse measured at the factory.
For each measurement, set the same o perating parameter s as used at the f actory (IQ test
certificate, page 6-1); (refer also to dose/pulse, page 9-5 to 9-7).
The test conditions and preparations are the same as described under 8.3.1, but without
the dosimeter. The notes and test procedure provided under 8.1.1 apply.
If the results of the i ndire ct dos e test matc h the f act ory val ues f or mAs/p uls e (recor ded on
page 6-1 of the IQ test certif icate) , transfer the dose values from the t ables on page 6-1 to
the tables on page 6-2. If the mAs values deviate by more than
values with identical tube voltage, measure the dose/pulse again as described on page
9-5.
± 15% from the factory
§16
Notes on the acceptance test in Germany according to § 16 RöV:
Enter the measured dose values/pulse in the acceptance test certificate.
The dose values measured
25 mm Al + 1.5 mm Cu. The mAs values/pulse that depend on the prefiltration are not
enteed into the acceptance test certificate.
with 2.1 mm Cu correspond to the values produced with
Siemens AG Register 4 RLL5-310.034.04 Page 5 of 20 UROSKOP D3
Medical Engineering Rev. 04 12.98 TD PS 24
Page 44

9 - 6 Digital Fluoro Radiography/FLUOROSPOT H
BA (video+blanking) signal values / setting the iris diaphragm in
DR operation
(Para. 8.4.2 Chapter 8A)
Test conditions and preparations:
- Source-I.I. distance: 118 cm
- Attach 2.1 mm Cu prefiltration to the collimat or
- I.I. format: 22 cm, 23 cm, 27 cm or 28 cm
- Connect oscilloscope: CH1 to FLUOROSPOT output (video output/Live= Trans.panel
TP5.
Sequence of work:
BA-signal with LIH with Fluoro 1:
- Select fluoro program on the FLUOROSPOT as described on page 9-1: W1 = 511, W2
= 256, etc.
- Switch on dig. FL with Fluoro 1 (C00) and record the st abilized kV value (Ua); FL OFF.
- Measure and record the BA-signal for LIH:
Select a line in the image center (line 256 / 60 Hz, line 312 / 50 Hz); measure th e level
in the line center and noise center.
BA-signal with DR exposures:
- Select DR organ program on the FLUOROSPOT as described on page 9-1: 70 kV, W1
= 511; W2 = 256, etc.
- To ensure that dose control and iris control are interacting properly, make the f ollowing
consecutive exposures and measure and record the BA-signal respectively at the
FLUOROSPOT output:
9
DR single image - dose 50; dose 100, dose 200
DR series with 0.5 f/s - dose 50, dose 100; dose 200
DR series with 8 f/s - dose 50, dose 100, dose 200
- In each case trigger fluoroscopy brief ly before releasing the exp osure.
Remarks: There is only one iris correction value for all indicated DR modes. For
single images and dose 100, set the BA-signal as precisely as possible
to the nominal value to maintain the tolerances for all modes.
- Record the iris correction value for the DR exposur es.
Start-up of systems at the customer site:
When starting-up prestaged systems, check only the BA-signals for dose step 100. The
values must be within the tolerances specified in t he li st of nominal values. If the tolerances are not maintained, the iris correcti on value must be changed and the whole measurement series must be repeated.
UROSKOP D3 Register 4 RLL5-310.034.04 Page 6 of 20 Siemens AG
Rev. 04 12.98 TD PS 24 Medical En gineering
Page 45

Digital Fluoro Radiography/FLUOROSPOT H9 - 7
CAUTION
Dynamic test 9
During measurements with the dynamic test, no additional filter
must be selected on the multileaf collimator. The nominal values
refer to a tube voltage of 70 kV.
Amplitudes/ Setting the iris diaphragm for DSA mode
- The BA-signal amplitudes of the different at tenuation levels of the dynamic test are
measured at the FLUOROSPOT output with a tube voltage of 70 kV. The requi red
video+blanking levels are obtai ned by correctly adjusting the iris di aphragm.
Remarks: The iris diaphragm has already been adjusted for FL mode (test point
5.3) and for DR exposures (test point 8.4) with a homogeneous
(2.1-mm Cu) phantom and may not be changed. Adjust the iris diaphragm with the dynamic test for DSA mode.
Test conditions and preparations:
- Source-I.I. distance:
OT units = 115 cm
- Grid inserted
- I.I. format: 22 cm, 23 cm, 27 cm or 28 cm
- Attach dynamic test close to the I.I. (wit h heart contour diaphragm and new capi llary
displacement test, part no. 97 50 019).
OT units - on the tabletop
Remarks: For UROSKOP D3, position the dynamic test approx. 25 cm above the
tabletop so that the ring-shaped dominant is located in field 1.
The dynamic test must be displayed on the monitor as shown in Fig.1; if necessary,
change the position of the guide ra ils on the test.
- Connect oscilloscope: CH1 to FLUOROSPOT output (video output/Li ve) = Trans.
panel TP5.
Procedure:
Amplitudes with LIH: - Select fluoro program on the FLUOROSPOT as described
on page 8-1: W1 = 51 1, W2 = 256, etc.
- Switch on dig. FL with Fluoro 1 (C00). Center and coll imate
the dynamic test (Fig.1). After collimating, release f luoroscopy for a short time (approx. 5 s) unti l the ADC has adjusted.
Siemens AG Register 4 RLL5-310.034.04 Page 7 of 20 UROSKOP D3
Medical Engineering Rev. 04 12.98 TD PS 24
Page 46

9 - 8 Digital Fluoro Radiography/FLUOROSPOT H
Remarks: The nominal values for the BA amplitudes with LI H can be obtai ned only
if the AGC measurement field is covered completely by the 1st field of
the dynamic test. This is assured by the AGC measuring field size (progressive) marked in 5.6.1.
If the AGC measurement field exceeds the 1st field, shift the dynamic
test until the 2L field is safely outside the AGC measurement field and
only the 5R field projects into the AGC measurement field.
The 5R field does not distort the measurement as much as the 2L field.
This applies to the rectangular ADC measurement field as well.
Do not undercollimate the ADC measurement field so that the dose values for the exposure match.
AGC measuring field
Collimation size
Collimator
Collimation size
Collimator
- For LIH, measure and record the BA-signal amplitudes of fi elds 2L, 1 and 5R of the
dynamic test: Measure a line in the appro x. image center (approx. line 256) and noise
center.
AGC measuring field
Collimation
size
Collimator
UROSKOP D3 Register 4 RLL5-310.034.04 Page 8 of 20 Siemens AG
Rev. 04 12.98 TD PS 24 Medical En gineering
Page 47

Digital Fluoro Radiography/FLUOROSPOT H9 - 9
CAUTION
BA-signal output
FLUOROSPOT
Line in image center
Important: Do not measure on a line which is covered by a capillary. To ensure
this, move the expanded time base back and forth by a few lines;
the amplitude should not change. A capillary reduces the BA-signal.
- Record the resulting kV value (Ua). If t he value deviates from 70 kV, the dynamic
response of the BA-signal changes.
• At < 70 kV , the dif ference of the BA-signal between f ields 5R and 2L increases
(higher dynamic response).
• At > 70 kV , the dif ference of the BA-signal between f ields 5R and 2L decreases
(lower dynamic response).
Amplitudes with DR exposure:
Select a DR organ program on the FLUOROSPOT as described on page 8-1: 70 kV, W1
= 511, W2 = 256, etc., select dose 100, single image on the unit
The iris correction must be =0 on the generator console and in the
organ program.
- Switch on FL for approx. 5 s.
- Release DR exposure and measure and record the BA-signal amplitudes of fields 2L,
1 and 5R of the dynamic test:
Measure a line in the approx. image center ( approx. line 256) and noise center.
- Record the indicated kV value (Ua).
- Measure and record the iris voltage value U
PL-SX:N11/D270. This test point does not apply to prestaged systems.
act
or U
on M98/D2 resp. N84/D2 or
IRIS
Siemens AG Register 4 RLL5-310.034.04 Page 9 of 20 UROSKOP D3
Medical Engineering Rev. 04 12.98 TD PS 24
Page 48

9 - 10 Digital Fluoro Radiography/FLUOROSPOT H
CAUTION
Amplitudes with DSA exposure:
The iris setting is checked in DSA mode (constant time mode) for both exposure times
(0.5 - 4 f/s = 233 ms; 6 - 8 f/s = 100 ms) because a different iris correction value must be
set for each of the two constant times.
The DSA test scenes will be required at a later point.
Select a DSA organ program on the FLUOROSPOT as described on page 8-2
(subtraction): 70 kV; W1 = 511; W2 = 256 (precontras t exposure), etc.
The iris correction must be =0 on the generator console and in the
organ program.
- Before releasing the DSA scenes, prepare the shi ft test.
- Release one DSA scene with the following exposure data and act uate the
displacement test after approx. ha lf of the scene time has elapsed.
• Dose 500; 1 f/s; scene time = 10 s.
• Dose 200; 6 f/s; scene time = 5 s.
To ensure that defined, reproducible exposure parameters are accepted during test
scenes, proceed as follows:
1. Select a scene with the desired organ program.
2. Release fluoroscopy for approx 5 s. to all ow the ADC to adjust; then the water
value computer sets the corr ect exposure data.
3. Release a short scene (5-6 images) to allow the do se to adjust in constant time
mode.
4. Release the actual test scene without previous f luoroscopy and evaluate the
scene. Delete the first short sc ene.
- Evaluate the next to last native image of each sce ne:
Measure and record the BA-signal amplitude s of fields 2L, 1 and 5R of the dynamic
test. Measure a line in the approx. i mage center (approx. line 256) and noise center.
Please note the important information on page 8A-16.
- Record the indicated kV value (Ua) and record th e fixed programmed iris correcti on
value.
- Measure and record the iris voltage value U
SX:N11/D270. This test point does not appl y to prestaged systems.
Remark: Due to dose scattering from scene to scene, the BA-signal values vary.
To ensure that the level in the 2L field does not exceed the upper limit
value, release at least 5 scenes at 6 f/s and evaluate them. If doubtf ul,
set the iris a little smaller to avoid overmodulation of the
A/D converter. In this case, the result does not have to be within the tolerance for field 1.
For FLUOROSPOTs with DSA, the BA amplitudes have to be mea sured
at the factory and in the field. If there is no DSA option, the dynamic test
does not apply for start-up at the customer site.
act
or U
on M98/D2 or N84/D2 or PL-
IRIS
UROSKOP D3 Register 4 RLL5-310.034.04 Page 10 of 20 Siemens AG
Rev. 04 12.98 TD PS 24 Medical En gineering
Page 49

Digital Fluoro Radiography/FLUOROSPOT H9 - 11
Edge enhancement 9
- Use the DR exposure with the dynamic test image on the monitor.
- Change EGDE ENHANCEMENT from E = 0% to E = 100%, check the function visually
on the monitor and check whether it fu nctions correctly.
When the edge enhancement is increased, gr ay steps are displayed with white and
black edges:
• A white frame is formed around black areas (5R field)
• A black frame is formed around white areas (circles around field numbers)
Mean value assessment (GGM= sliding weighted averaging) 9
- Place the dynamic test in the beam path as described in t he preparations for 8.5.1.
- On the FLUOROSPOT, select the fluoro program as described on page 8-1 (t emporal
filtration = 0%)
- Switch on digital FL with Fluoro 1.
- Observe the noise impression of the image.
- On the FLUOROSPOT, increase the noise filtration in th e fluoro program to 12%.
- Release fluoroscopy again and evaluate whether the noise i n the image has been
reduced.
• Capillaries are more visibl e, etc.
• Blurring is visible duri ng movement of the object.
- Record whether the function is okay.
- On the FLUOROSPOT, reset the noise filtration in the f luoro program to 0%.
Siemens AG Register 4 RLL5-310.034.04 Page 11 of 20 UROSKOP D3
Medical Engineering Rev. 04 12.98 TD PS 24
Page 50

9 - 12 Digital Fluoro Radiography/FLUOROSPOT H
Resolution and minimum contrast 9
(Para. 8.7.2 Chapter 8A)
The determination of the resolution and the check of the minimum contrast can be done
with one measurement arrangement in one test series.
Test conditions:
- Source-I.I. distance: 118 cm
- No edge enhancement (E% = 0)
- 6% Noise filtration during FL
- Open window, that means all gray levels are used (W1 = 51 1; W2 = 256)
- Fluoro 1 with FL (
- Dose step 100 for DR and DSA (70 kV)
Test preparations:
- Attach the lead bar test pattern, type 41
the horizontal position
- Attach a 17 µm Cu strip
- Attach prefiltration of 1.2 mm Cu to the collima tor.
- Switch on fluoroscopy.
- Collimate the radiation field
Do not undercollimate the ADC measuring field t o avoid any overframing.
∼ 70 kV)
➀ to the center of the I.I. and rot ate it 45° from
➁ on the tabletop.
➂ near the lead bar test patter n.
➃ slightly larger than the lead bar test pattern (see figure) .
§16
Notes on the acceptance test in Germany according to§ 16 RöV:
The resolution values measured with 1.2 mm Cu prefiltering and the minimum contrast
(4% radiation contrast with 1.2 mm Cu and approx. 70 kV) evaluated with the 17 µm Cu
strip correspond to the values measured according to the acceptance test conditions.
Enter the values from the image quality test certificate into the acceptance test certificate.
1
2
45°
3
4
UROSKOP D3 Register 4 RLL5-310.034.04 Page 12 of 20 Siemens AG
Rev. 04 12.98 TD PS 24 Medical En gineering
Page 51

Digital Fluoro Radiography/FLUOROSPOT H9 - 13
Sequence of work:
- In each case, perform the check for the foll owing modes with all I.I. format s.
DSA*
Bypass Dig. Fluoro LIH
* Evaluate the precontrast image.
- If more than one matrix size can be selected for DSA mode, the test should be
performed for the largest and smal lest matrix sizes.
- On the FLUOROSPOT, select the test programs described on pages 8-1 and 8-2
respectively and take into acc ount the test conditions described abov e.
- Determine the max. visible resolution and rec ord it in the image quality test cer tificate:
darken the room, avoid any reflectio ns.
- Check whether the 17 µm Cu strip (minimum contrast) i s visible; enter yes or no in the
image quality test cert ificate.
The minimum contrast can be more easily det ected at a greater distance to the object.
Super-
vision
Dig.
Exposure
Dose 100
Matrix:
F/s =
50Hz=1024
60Hz=8841Hardcopy
Siemens AG Register 4 RLL5-310.034.04 Page 13 of 20 UROSKOP D3
Medical Engineering Rev. 04 12.98 TD PS 24
Page 52

9 - 14 Digital Fluoro Radiography/FLUOROSPOT H
Checking the DSA system 9
(Para. 8.9.2 Chapter 8A)
Important image characteristics of the DSA system such as contrast sensitivity, logarith-
mic function and subtraction are checked by means of test expos ures with the dynamic
test. DSA scenes previously produced are evaluated for this purpose.
If the pedestal for Manual 1 ha d to be adjusted when checki ng the black level cut off (noi se
halo), repeat the DSA scenes for the following evaluation.
Evaluation conditions:
- For evaluation, it is necessary to place the mask ont o an image (if necessary, via
REMASK) for which dose adjustment has been accuratel y performed:
• with 6 f/s on image 8
• with 1 f/s on image 3
- Window levels: brightness W1 = 80; co ntrast W2 = 220
- No edge enhancement; E (%) = 0
- In each case, evaluate the next to last DSA image of the ser ies.
Contrast sensitivity:
- In the DSA image, check whether all capillaries are displayed on fields 2L, 1 and 5R of
the dynamic test.
- Subsequently select DSA scenes 1 f/s and 6 f/s on the FLUOROSPOT and evalu ate;
postprocessing operat ing mode.
- In the test certificate, mark those fiel ds in which the respective dark or br ight capillary
is no longer visible.
Logarithmizing function (LOG amplifier):
Logarithmic function is okay if the capillaries in the DSA image display the same gray
level on all Cu steps.
The gray level of the t op bri ght ca pil lary ( 3 mm; 16) i s measu red on f ield s 2L, 1 and 5R b y
means of the DYNAMIC BOX.
- Connect the service PC to the FLUOROSPOT and call up ST 320.
- Select DSA mode on the FLUOROSPOT (not native display)
- On the FLUOROSPOT, call up PAT-DIR, TOOLS, SERVICE
- On the service PC, enter the following:
• Enter password
• "IMAGE QUALITY ASSURANCE"
• "SELECT FOLDER FOR ANALYSIS",
Enter the folder name of the DSA scene.
• "SELECT IMAGE FOR ANALYSIS",
Split image display is selec ted. Usi ng the PC cur sor keys ( left , ri ght), select t he
image.
• "SELECT IMAGE FOR ANALYSIS",
The selected image is displayed.
• "DYNAMIC BOX",
The rectangular measurement field i s displayed on the FLUOROSPOT monitor.
UROSKOP D3 Register 4 RLL5-310.034.04 Page 14 of 20 Siemens AG
Rev. 04 12.98 TD PS 24 Medical En gineering
Page 53

Digital Fluoro Radiography/FLUOROSPOT H9 - 15
• "MOVE BOX"
Using the PC cursor keys, center the square to the bright, 3 mm thick, 16%
capillary.
Ensure that the full width of the capi llary is always loca ted within the DYNAMIC
BOX measurement field
- In each case, measure the gray level of the capil lary in fields 2L, 1 and 5R and record it
(refer to 1/Fig.1)
.
The max. acceptable difference between the gray level of the 1st field and the gray level
of the 2L field or the 5R field = 3 gray levels (refer to the reference value list).
Subtraction:
Subtraction is correct if all CU steps ar e displ ayed with the same gray level.
- Service PC: Using the cursor keys, move the recta ngular measurement field between
two capillaries (2/Fig .1).
- Measure and record the basic gray levels of fiel ds 2L, 1 and 5R. The gray levels must
± 1.
be 0
For the maximum acceptable deviation, ref er to the reference value list.
Siemens AG Register 4 RLL5-310.034.04 Page 15 of 20 UROSKOP D3
Medical Engineering Rev. 04 12.98 TD PS 24
Page 54

9 - 16 Digital Fluoro Radiography/FLUOROSPOT H
Checking the hardcopy camera 9
Start-up and adjustment of the hard copy camera (HCC) on our s ystems is the r esponsibi lity of the manufacturer or supplier. It is expedient for a Siemens service engineer to be
present during the start- up/adjustment so that connection and image quality pro blems can
be quickly resolved.
Checks and documentation for the HCC within the scope of IQ testing are limited to the
following items:
• Documentation of brightness and contrast settings (Look-up tables) of the HCC at t he
time of customer turnover.
• Checking and documenting the contrast gr adient and the geometry of the test fil ms
during evaluation of the SMPTE test i mage.
• Checking and documenting noise-free im age transfer from the DFR system to the HCC
and correct camera function.
Adjusting the hardcopy camera 9
The brightness and contrast control elements on the hardcopy camera vary according to
the manufacturer. They range from switches with dials to software switches in the service
PC.
The brightness and contrast settings (LUT) must be documented so that claims with
respect to the HC image quality can be compared to test films generated dur ing start-up
and produced under the same conditions.
The information necessary regarding brightness and contrast settings differs and is specific to the camera. Respective texts have been prov ided in the IQ measurement certificate to assist with the documentation.
Preparing and evaluating the SMPTE test image 9
Call up the quality test patterns fr om memory on the FLUOROSPOT H and transmit t hem
to the hardcopy camera:
Special function
to HCC.
→ Tools → constancy test → quality test (4:1 or 6:1) → send
UROSKOP D3 Register 4 RLL5-310.034.04 Page 16 of 20 Siemens AG
Rev. 04 12.98 TD PS 24 Medical En gineering
Page 55

Digital Fluoro Radiography/FLUOROSPOT H9 - 17
Evaluation:
Of the four quality test images, only the SMPTE test image is evaluated.
- Measure and record the optical density (blackening) of the 0% to 100% fields with the
densitometer.
- Record as well whether the 5%- and 95% fields are visible.
- Evaluate and record whether the image geometry and the image shar pness are
acceptable.
Geometry: The displayed fields must be square (equal side dimensions at right
angles). All (leng thwise) lin es a nd edg es must be s traig ht and not di storted.
Sharpness: All contrast resolution groups must be visi ble for laser cameras. This
is not always possible for hardcopy cameras with b uilt-in monitors.
Remarks: The film size and segmentation should be selected to that the sharpness
(resolution) of the test exposures is not limited by the resolution capability of the hardcopy camera.
The test film should be archived as a part of the IQ documentation
together with the IQ test certificate.
§16
Image artifacts and transmission interference. 9
Remarks: As a rule, an error message appears on t he DFR system or the hardcopy
camera when there is transmission interference during digital image
transmission from the DFR system to the hardcopy camera; i.e. you will
be aware of image artifacts resulting from transmission problems.
The test film should be checked for image artifacts. The following artifacts are possible:
- Linear structures
- Fraying of sharp edges (Jitter)
- Inhomogeneity
-Artifacts
- Pixel errors
- Scratches, pressure marks, l ight leaks
If artifacts are visible, you must differentiate between those that are acceptable (e.g. for
analog connected cameras) and those that are unacceptable. If the artifacts are not
acceptable, the system may not be turned over to the customer.
The type of artifact should be documented in the space provided.
Information regarding the acceptance test in Germany according to§ 16 RöV:
The quality test image should be prepared twice and incorporated into the acceptance
test log without furt her evaluation as documentation of the starting status of the hardcopy
camera.
Siemens AG Register 4 RLL5-310.034.04 Page 17 of 20 UROSKOP D3
Medical Engineering Rev. 04 12.98 TD PS 24
Page 56

9 - 18 Digital Fluoro Radiography/FLUOROSPOT H
Image artifacts 9
- Mark all image artifacts which have been detec ted during setting and image quality
tests in the table in the image quality test certificate. The test points listed in the tabl e
indicate measurements in which each ar tifact generated is stronger and/or can be
better evaluated.
- If any image artifacts are detected which are no t listed in the table, these must be des -
cribed under ”Other artifa cts”.To evaluate the respective art ifacts, there are three
rating numbers which indicate the ext ent of each artifact:
Compare the test images taken during st art-up at the customer site with the test images taken at the factory.This will assist in detecting and eliminat ing possible deviations
and new artifact occurrences.
Definition of the rating numbers: 9
1 = No artif acts could be determined during start-up.
2 = A few artif acts occurred sporadically during start-up. The cause could not be lo-
cated and the ”error” could not be corrected. The artifact s do not adversely a ffect
the overall appearance of the images and do not compromise the diagnostic value of the images in any way. The artifacts are determine to be tolerable.
3 = During start-up, artifacts of greater severity occurred frequently and they nega-
tively influenced the overall appearance of the images or compromised their
diagnostic value. Therefore, the artifacts were determined to be intolerable and
the system could not be turned over to the customer.
Description of the artifacts: 9
- Pixel errors are image pixels without image informat ion. They are visible as black
dots in the precontrast image and ar e the size of pixels. In the DSA image, they can be
displayed as black or white dots depending on whether the error is caused by the
mask or the precontrast image.
The causes are memory errors or address err ors which are generated in the RAM or in
the mass memory (postprocessing).
Pixel errors that can be tole rated are sporadic, not stationar y, only 1 pixel at one location, max. 3 pixels/image and wi th every 20th image only.
- Ghost images: These artifacts are contours displayed t wice, with the second contour
generally shifted lateral ly. They are caused by reflections in long, poorly adjusted
video cables. Clearly visi ble ghosting is not acceptable.
- Contouring means horizontal or vertical ”streak s” which feign linear structure s that
are not present. They can be detected ver y easily in images which have been generated by a sawtooth signal by continuousl y changing the windowing. Slight contouring
can be tolerated in the test desc ribed above.
UROSKOP D3 Register 4 RLL5-310.034.04 Page 18 of 20 Siemens AG
Rev. 04 12.98 TD PS 24 Medical En gineering
Page 57

Digital Fluoro Radiography/FLUOROSPOT H9 - 19
- Horizontal jitter: Vertical object edges are not displayed on the monitor as ” sharply”
delineated, but as slightly j agged, ”frayed” lines. Jitteri ng results from slight
irregularities in the hor izontal deflection from image line to i mage line or during image
storage and to a certain degree, i t cannot be avoided. In the DSA image, ji ttering
causes slight coincidence err ors that can be tolerated.
To perform the check
as possible in the vertical and hor izontal direction, and a DR exposure must be made
with dose step 100 and single frame with the s mallest zoom format.
Image evaluation criteria:
(e.g. W1 = 310, W2 = 309).
Island formation: Island formations are clearly delineated ar eas of the image which hav e
a uniform gray level and are most ly displayed noise-free. Often they result from an insufficient storage depth and therefore contain wrong image information. So-called ”burnt-out”
places in the image also come under t his headi ng. The y can be tol erat ed to a ver y limit ed
degree only.
Vignetting is always present as a decrease in brightness from the image center towards
the image edge. This is due to the bright ness ef f ect of X- radi ation , the curv atur e of the I .I.
input screen, the electr on o ptics in the I.I ., t he tandem opt i cs between I. I. a nd TV c amera,
the TV camera tube and the picture tube of the monitor. Vignetting is evaluated as an
image artifact only if it shows up too extensively or is strongly asymmetrical (r efer also to
test item 5.4 in the image quality test certifi cate) or if there are large bright ness differences
which are irregularly distributed over the entire image.
If vignetting is within the limit values for fluoroscopy specified on pages 5-4 or 6-14, it can
be classified as an ”image artifact” with eval uation number 1.
, a solder tin cross must be atta ched to the I.I. center as precisely
Very narrow windowing with high contr ast
Artifacts conditional on exposure appear only in DSA images and are caused by exposure fluctuations from image to image duri ng the DSA scene.
If two completely identical images (mask and precont rast image) are subtract ed from one
another, a uniformly bright image, without any structures, is obtained in which only noise
is visible. If the exposure between the mask and the precontrast image is changed, an
image structure is out lined in the DSA image, even if the object remains uncha nged, as a
result of the exposure difference. This is acceptable provided that it is only slightly outlined since, in medical exposures, a similar effect can be caused by patient movement.
Logarithmizing errors: The non-linea r attenuation of the x-radiation depending on the
object density and obje ct thickn ess can be made li near to a l arge ex tent by appl ying a lo garithm to the signal values of the image.
Incorrect setting of a logarithmizing stage causes a brightness step in the display of the
vessel simulation of the DSA phantom. With the DSA standard phantom according to DIN
6868 part 8, the transition from the densest step (1 .4 mm Cu) to the smallest step
(0.2 mm Cu) is used fo r this evalua tion. The gray level of the capillaries must be evaluated
in fields 2L, 1 and 5R of the dynami c test with capil lary test (r efer also to image q uality test
certificate under 8.9). Slight brightness differences of the vessel simulation over the Cu
steps of different thickness are acceptable.
Siemens AG Register 4 RLL5-310.034.04 Page 19 of 20 UROSKOP D3
Medical Engineering Rev. 04 12.98 TD PS 24
Page 58

9 - 20 Digital Fluoro Radiography/FLUOROSPOT H
- Coincidence errors appear only in DSA images.
Artifacts called coinc idence errors are generated in structured objects if the coordi nates of corresponding projection el ements do not coincide between image and mask.
During the tests, only those co incidence errors are taken into account which are not
caused by object movements.
Image structures which occur due to a s light position change of the DSA phantom
when shifting the vessel simulati on cannot be avoided. However, they are i dentical in
all DSA images of a series.
The causes of undesirable coin cidence errors are slight irreg ularities in the horizont al
and vertical deflection of the TV system or errors when storing the image pixel s.
Slight coincidence errors can be to lerated since they do not preclude t he ability to evaluate medical exposures.
To perform checks, make DSA test scenes with do se step 200; 6 f/s and dose step
500; 1 f/s using the soldering tin cross (refer to the test for horizontal jitter) and in each
case, evaluate the entire scene. Place the mask on an image for which dose cont rol
has been accurately completed.
- Inhomogeneity (hum, line errors):
Each image displays certain inhomogen eities to a certain degree (ref er also to vignetting), that do not influence t he diagnostic accuracy of the exposures.
Inhomogeneities caused by electromagneti c interference in the imaging syste m are
unpleasant and disturbing and can, depending on the type of artifacts , considerably
affect the diagnostic value of t he images. It is preferable that they do not occur at all.
They can be tolerated to a very small extent only. Hum interferences ar e displayed in
the image as periodic horizonta l bright/dark structures or as br ight or dark transverse
bars; they are volatile and not st ationary.
Any omission or partial omission of lines can be recognized as dark transve rse streaks
in the TV image.
- Microphonics is caused by mechanical oscillations (rota ting anode revolution etc.)
which are transferred to the TV camera, i nfluence the deflection field s of the electron
beam and mostly display very regular interference structures simil ar to those
generated by electromagnetic hum inter ferences in the TV image. Microphonics is not
acceptable.
- Interference stripes: Enter here all interf erence stripes which have not yet been described previously and whose generat ion is unknown.
Even interference stripes whi ch are caused by dirt on optical surfac es must be entered
here. They are stationary and not v olatile.
Interference stripes ar e not acceptable.
Notes on the acceptance test in Germany according to § 16 RöV:
§16
UROSKOP D3 Register 4 RLL5-310.034.04 Page 20 of 20 Siemens AG
Rev. 04 12.98 TD PS 24 Medical En gineering
The image artifacts detected during start- up are documented i n the image quali ty test cer tificate and must be entered in the acceptance test certificate.
Page 59

Nominal values 10
I.I. nominal values 10
Lead bar test pattern, type 42 directly at the I.I. input; no prefiltration; ≤ 50 kV; monocular
at I.I. output.
10 - 1
formats (cm ) R
I.I. Type
40 cm HDR - IS 40
Remarks: The effective I.I. form ats and the resolution at the I.I. output are not
tested during the IQ test. The values are for troubleshooting only, if the
resolution limit values for image reproduction fall below the limit.
Temperature indicator
Refer to RVB1-AA, 4.10/01 or RXD0-000.038.01... for nominal values.
nominal effective
36.5
28
20
14
28
20
14
at I.I. output
-
Gr
(LP/mm)
2.8
3.4
4.0
5.3
ADC measuring field 10
MPL system 10
measuring field diameter, measured on 44 cm TV monitor
I.I. Type selected Format measur. field ∅
40 HDR - IS 20 6.5
max. permissible center deviation (horizontal, vertical): 1.5 cm
*1 for older image intensifiers (before 3/93)
− 1
(cm)
SDM system 10
I.I. Type
40 HDR - IS 7.6
width of octagonal
measuring field
± 0.7 cm 0.7 cm 1.4 cm
acceptable center
deviation
acceptable deviation
of superimposed field
Siemens AG Register 4 RLL5-310.034.04 Page 1 of 12 UROSKOP D3
Medical Engineering Rev. 04 12.98 TD PS 24
Page 60

10 - 2Nominal values
Fluoroscopic dose rate at the I.I. input 10
2.1 mm Cu filter, X-ray tube voltage 65 - 85 kV
BV-Type /
I.I. Type
40 cm HDR - IS 40
U
Multiplier
Tolerance: I.I. full format
Tolerance of the indirect dose rate control
Values in brackets ( ) apply if TV iris diaphragm is attached.
*1 effective beginning 7/93 (with masked Multiplier only)
*2 Zoom-Dose-Factors for PL S/SX approximate values only.
= 700 - 950 V *1 1 nGy/s = 0.115 µR/s / 1 µR/s = 8.7 nGy/s
Formate
Formats
28
20
14
Dosisleistg.
Dose rate
NGy/s
87
160
315
(435)
Dose rate
(nGy/s)
Supervision
44
80
158
(218)
± 10%; for zoom formats approximate values only.
± 1kV ±10%
Zoom-Dose-Factors
PL S/SX *2 PL
SC65/80
1:
2.0:
4.0:
5.0
0.50:
0.92:
1.81:
2.50
UROSKOP D3 Register 4 RLL5-310.034.04 Page 2 of 12 Siemens AG
Rev. 04 12.98 TD PS 24 Medical En gineering
Page 61

Nominal values 10 - 3
VIDEOMED S X, H1X Emulation 10
Values apply for 50Hz and 60Hz versions
TV monitor 10
Black level regulation = on
Luminance
Test signal 0 %
100 %
BY = 0 - 5 mV
BY = 700 ± 50 mV
Shade 0 % (black 1 + 0.5 cd/m
mit / with
DFR - System
2
Shade 100 % (white): new monitors > 400 ± 20 cd/m
used monitors > 280 cd/m
2
2
ohne / without
DFR-System
BA = 0 - 10 mV
BA = 1100 ± 50 mV
1 + 0.5 cd/m
2
> 560 ± 20 cd/m
> 300 cd/m
2
2
TV camera 10
Configuration values Video Gain max. beam current(nA)
Interlaced 3 dB 1750
Progressive scan 3 dB 1750
Slow Progressive scan 6 dB 1400
target voltage U = 49 - 52 V
grid voltage U
G1
Interlaced U
B-signal: Bias light component (measured value)
progressive U
Sensitivity reserve: 1, B signal (without bias light) U
U ≤ − 15 V
= 28 ± 10 mV
ss
= 28 ± 10 mV
ss
≥ 95 V *1
ss
*1 Limit value for new systems; measure and document at new systems only.
B signal value (interlaced - Bypass) 10
2.1 mm Cu / 2.1 mm Cu; without bias light
factory = 80mV; +15mV /
start-up = 80mV; +10mV /
HK = high contrast curve
Siemens AG Register 4 RLL5-310.034.04 Page 3 of 12 UROSKOP D3
Medical Engineering Rev. 04 12.98 TD PS 24
− 10mV; for HK +15 / − 10 mV
− 20mV; for HK/ZOOM 1-3: +20/ − 20 mV
Page 62

10 - 4Nominal values
Vignetting (with bias light) (interlaced - Bypass) 10
P1
C
∆ 1
∆ 3
0.8 Signal
Signal
P2
∆ 2
100 %
∆ 1 = P1 - C x 100 ≤ 30 %
C
∆ 2 =
∆ 3 =
P2 - C x 100 ≤ 30 %
C
P1 - P2 x 100 ≤ 30 %
C
AGC measuring field sizes in grid units (GU) 10
I.I. format: 22 / 23 / 27 / 28 cm
round measuring field 6.5
Center deviation
shift of analog measuring field
± 0.5 GE / GU
≤ 0.5 GE / GU
≤ 0.3 GE / GU
Pedestal and AGC function Pedestal 10
AVR / AGC interlaced No test required
AVR / AGC progressive No test required
Fixed gain 1 / Hand 1 BA-Signal = 80
Fixed gain 2 / Hand 2 BY-Signal = 50
AGC-function: BA signals with 2.1 mm Cu (for all I.I. formats)
For sliding weighted control
interlaced = 350
Difference between the I.I. formats 40 mV
± 30 mV; progressive = 350 ± 30 mV
±10mV Presetting
±10mV
Fixed gain TV unit 10
TV central
C.C.U Fixed gain 1 Fixed gain 2
Input B signal
[mV]
U
ss
Output BA signal
[mV]
U
D8: 15 99 898
D8: 37 94 208
2000
1410
1100 ± 20 1050 ± 20
2000
1410
UROSKOP D3 Register 4 RLL5-310.034.04 Page 4 of 12 Siemens AG
Rev. 04 12.98 TD PS 24 Medical En gineering
Page 63

Nominal values 10 - 5
Dynamic test 10
I.I. format: 22cm − 28 cm
B/BA signal amplitudes
SID = Grid focusing distance
Dynamic factor (f) = Level/field 2L : level/field 1
B signal BA signal
f
min
17
16
15
14
13
12
11
10
9
8
7
6
66
70
75
80
85 kV
Field 2L
≥ 1200 mV
Field No.
B signal (mV)
Input C.C.U.
BA signal (mV)
Output C.C.U.
(without bias light)
1 80
± 15 mV 350 ± 50 mV
5R no limiting
Capillary test 10
I.I. formats 22 cm, 23 cm, 27 cm, 28 cm
Capillary test (37 90 180)
X
X X X
X X X
X X X
X X
X X X
2L 1 5R
3 mm
2 mm
1 mm
The marked capillaries do not have
to be visible
Siemens AG Register 4 RLL5-310.034.04 Page 5 of 12 UROSKOP D3
Medical Engineering Rev. 04 12.98 TD PS 24
Page 64

10 - 6Nominal values
Resolution and minimum contrast of the I.I.-TV system (interl. - Bypass) 10
1.2 mm Cu filter; test pattern (type 41) 45°; 17 µm Cu strip; approx. 70 kV
I.I. Type: 40 HDR - IS
Full format 1.0
Zoom 1 1.4
Zoom 2 1.8
Zoom 3 2.0
The minimum contrast must be always visible.
Image artifacts 10
Refer to the measuring instructions for a descrip tion of artifacts.
Digital Fluoro Radiography / DFR 10
FLUOROSPOT H 10
Values apply for 50Hz and 60Hz versions.
Dose/pulse at the I.I. input 10
2.1 mm Cu filter, X-ray tube voltage 70 kV
I.I. Format
(cm)
40 HDR - IS
28
20
14
U
Multiplier
*1 effective as of 07/93 (wit h ma sked Multiplier only)
Tolerance
At indirect dose measurement: tolerance
Tolerance for reproducibility at DSA (8/F/s; Dose 500):
≥ 450 V *1 1 nGy = 0.115 µR / 1 µR = 8.7 nGy
± 15% (DSA-Dose 500 + 15% / − 20%)
Dose
50
(nGy/F)
215
400
790
1090
Dose
100
(nGy/F)
435
800
1580
2175
Dose
200
(nGy/F)
870
1600
3160
4350
Dose
500
(nGy/F)
2175
4000
7900
10900
± 15% of the mAs value.
∆ ≤ 20% of average
Zoom-Dose-Factors
PLSX *2 PLSX65/80
0.5:
1.0:
2.0:
2.5
0.50:
0.92:
1.81:
2.50
UROSKOP D3 Register 4 RLL5-310.034.04 Page 6 of 12 Siemens AG
Rev. 04 12.98 TD PS 24 Medical En gineering
Page 65

Nominal values 10 - 7
Amplification of DFR system 10
Cut off pedestal
ADC-DAC function at DR
remaining pedestal
DR from W1/W2 = 259/258
to W1/W2 = 263/262
ADC-DAC function at DR
= 1100 mV ± 10 mV
- Input DFR:
- trigger DR exposure (SS OFF)
upper window level =W1 = 511
- check on TV monitor:
VIDEOMED H1X
bone black
white pixels disappear at lower window level =W2 = 498
bone white
black pixels disappear at lower window level =W2 = 498
VIDEOMED SX / H1X Emulation
bone black
white pixels disappear at lower window level: 60Hz:
bone white
black pixels disappear at lower window level: 60Hz:
ADC-DAC function at DSA
= 730 mV ± 10 mV to VC10
- Input DFR:
- Release DR exposure (assess native image)
1100 mV
upper window level = W1 = 511
− 510
− 510
50Hz:
50Hz:
± 10 mV from VC20
W2 = 498
W2 = 488 − 500
W2 = 498
W2 = 488 − 500
− 510
− 510
- Check on TV monitor:
bone black
white pixels disappear at lower window level: 60Hz:
50Hz:
bone white
black pixels disappear at lower window level: 60Hz:
50Hz:
Siemens AG Register 4 RLL5-310.034.04 Page 7 of 12 UROSKOP D3
Medical Engineering Rev. 04 12.98 TD PS 24
W2 = 498
W2 = 488 − 500
W2 = 498
W2 = 488 − 500
− 510
− 510
Page 66

10 - 8Nominal values
DAC output amplifier
- use DR exposure (see)
- upper window level
output signal DFR
381;
lower window level 380
Live Ref.
= 700 ± 520
= 0 + 5 mV
= 300 ± 50 mV
mV fe = Ref ∆ ≤ 20 mV
Monitor adjustment 10
Luminance white(100%) 260 ± 20 cd
Luminance black(0%) 0.8
5% field (5% and 95%) must be visible.
± 0.1 cd/m
2
BA signal values / Adjustment of iris diaphragm in DR mode 10
Mode
LIH 200
DR Single, Dose 100 225
DR Single, Dose 50/200
DR Serie<6F/s, Dose 50/100/200
BA signal (mV); Output DFR
VIDEOMED H1X VIDEOMED SX
± 20 220 ± 35
± 15
± 35
225
Basic
setting
DR Series 6F/s, Dose 50/100/200 225/ +50/
UROSKOP D3 Register 4 RLL5-310.034.04 Page 8 of 12 Siemens AG
Rev. 04 12.98 TD PS 24 Medical En gineering
− 25
Page 67

Nominal values 10 - 9
Vignetting with DFR
at I.I. full format
∆ 1 = P1 - C x 100 ≤ 35 %
C
∆ 2 =
∆ 3 =
P2 - C x 100 ≤ 35 %
C
P3 - C x 100 ≤ 35 %
C
∆ 4 = P4 - C x 100 ≤ 35 %
C
∆ 5 =
∆ 6 =
P1 - P3 x 100 ≤ 35 %
C
P2 - P4 x 100 ≤ 35 %
C
P4
P1
C
P2
100 %
P3
0,8 D
D
Dynamic test 10
I.I. format 22/23/27/28 cm
Amplitudes / Adjustment of iris diaphragm for DSA mode
Tolerances apply as of software version VC20.
VIDEOMED H1X
BA signal
= 70 kV
U
a
Field No.
2L
1 200
5R no limiting
VIDEOMED SX / H1X Emulation
BA signal
= 70 kV
U
a
Field No.
2L
1 240
5R no limiting
[mV]; Output DFR
LIH
1
≥ 350 570 ± 50 < 650 *1 < 650 *1
± 20 225 ± 25 225 ± 35 225 ± 35
[mV]; Output DFR
LIH
1
≥ 350 570 ± 50 < 650 *1 < 650 *1
± 20 225 ± 25 225 ± 35 225 ± 35
DR
Dose = 100
Single
DR
Dose = 100
Single
DSA (Nativ)
Dose = 500
F/s = 1
Scene= 10 s
DSA (Nativ)
Dose = 500
F/s = 1
Scene= 10 s
DSA (Nativ)
Dose = 200
F/s = 6
Scene= 5 s
DSA (Nativ)
Dose = 200
F/s = 6
Scene= 5 s
*1 If the 2L field were > 650 mV, then < 190 mV would be acceptable for field 1.
Siemens AG Register 4 RLL5-310.034.04 Page 9 of 12 UROSKOP D3
Medical Engineering Rev. 04 12.98 TD PS 24
Page 68

10 - 10 Nominal values
Black level cutoff (noise halo) 10
left half of monitor - limit of noise halo area
1 F/s; Dose 500; scene 10 s; 70 kV from
6 F/s; Dose 200; scene 5 s; 70 kV result
to
measured in the image center
3/4 1/2 1/4
lead half
Resolution 10
1.2 mm Cu filter, test pattern (type 41) 45°; 17 µm Cu-Strips; 70 kV
minimum resolution (LP/mm)
BV-/ I.I.
Format,cm
40 HDR - IS
28
20
14
DR, DSA (native): W1 = 511; W2 = 256; E% = 0, Dose 100
DL: W1 = 511; W2 = 256; E% = 0; temp. filt = 6%
*1 + adjusted and bl ocked
*2 The resolution of the hardcopy camera must not limit the DFR resolution.
Bypass *1 Dig.
Fluoro
0.9
1.2
1.6
2.0
0.9
1.2
1.6
2.0
LIH Super-
vision
0.8
1.0
1.4
1.8
0.9
1.2
1.6
2.0
Digital
exposure
0.9
1.2
1.6
2.2
DSA
(Nativ)
0.9
1.2
1.6
2.2
HCC *2
0.9
1.2
1.6
2.2
Minimum contrast 10
The minimum contrast must always be visible.
Test conditions are the same as for resolution.
UROSKOP D3 Register 4 RLL5-310.034.04 Page 10 of 12 Siemens AG
Rev. 04 12.98 TD PS 24 Medical En gineering
Page 69

Nominal values 10 - 11
Checking the DSA equipment 10
I.I. format = 22cm; 23cm; 27cm; 28cm
Window level DSA image: Brightness W1 = 80; Contrast W2 = 220
- with grid
-E (%) = 0
- Dynamic test with heart contour diaphragm and capillar y test no.37 90 180
3 mm
2 mm
1 mm
1 frame/sec.; dose = 500
scene= 10 s ; 70 kV
Test field Test field
2L 1 5R 2L 1 5R
*1 Contrast sensitivity
16 %
4%
0.75 % XXXXXXXXXXXX
10 %
3%
2% XX
7.5 %
4%
2.5 % X X X X
*2 LOG amplifier
6 frames/sec.; dose = 200
scene= 5 s ; 70 kV
3 mm 16 % n+2
*1 The capillaries marked do not have to be visible.
*2 Tolerances are for Software version VC20 only; no tolerances for VC10 version.
*3 Basic grey level of test field
x = capillary test no. 97 50 019
o = new Iodine capillary test no. 37 90 180
-1
± 10 ± 10 ± 10 ± 10 ± 10 ± 1
0
nn-3n+2-1nn-3
*3 Subtraction
Image artifacts 10
Refer to the measurement protocol for a descri ption of the artifacts.
Siemens AG Register 4 RLL5-310.034.04 Page 11 of 12 UROSKOP D3
Medical Engineering Rev. 04 12.98 TD PS 24
Page 70

10 - 12 Nominal values
This page intentionally left blank.
UROSKOP D3 Register 4 RLL5-310.034.04 Page 12 of 12 Siemens AG
Rev. 04 12.98 TD PS 24 Medical En gineering
Page 71

Final steps and electrical safety 11
Final work 11
• Sign the completed IQ test cert ificate and the general UROSKOP D3 test certif icate.
• If necessary, perform the ac ceptance test according to RöV §16 or DHHS regulati ons,
respectively.
If the settings made at the factory ha ve not changed, the values can be transferred f rom
the test certificate.
• Remove the washer (adjustment aid) that was affixed to the grid as a center mark er.
• Switch the system off.
• Disconnect the service PC fro m the system.
• Reattach all covers and cabin et side panels, with the excepti on of the generator front
panel.
(Refer to Installation Inst ructions RLL5-310.031.03..).
• Repair any paint chips or defe cts.
• Clean the system.
11 - 1
POLYDO ROS
Protective conductor meter
≤ 0.2 Ohm
Unit
T able/Tabletop
Monitor
Cabinets
Transformers
Control console
X-ray I.I.
Tube assembly
Collimator
Measuring the protective conductor resistance 11
Measuring device: Protective conductor meter
Measured value: max. 0.2 Ohm (Observe the country-specific regulations)
(current 10 A, voltage drop: max. 2 V)
Measuring
procedure:
Conditions: Protective conductor resistan ce, ma x. 0.2 Ohm
Measure all conductive system parts within reach as well as the
grounding bus in the generator.
(Exceptions: accessory bars and tabletop).
• If greater , increase the gauge of the pr otective conductor .
• Reduce the contact resista nce (e.g. tighten screws).
• Close the generator cabinet panel.
Siemens AG Register 4 RLL5-310.034.04 Page 1 of 2 UROSKOP D3
Medical Engineering Rev. 04 12.98 TD PS 24
Page 72

11 - 2Final steps and electrical safety
This page intentionally left blank.
UROSKOP D3 Register 4 RLL5-310.034.04 Page 2 of 2 Siemens AG
Rev. 04 12.98 TD PS 24 Medical En gineering
Page 73

Changes to previous version 12
Chapter 0 up to 11 Templates changed
Chapter 0: Revision level changed
Chapter 9: Expanded to add FLUOROSPOT H with Supervision
12 - 1
Chapter 10:
10 - 1
10 - 2
10 - 6
10 - 10
Chapter 12: New
Expanded to add FLOUROSPOT H with Supervision
Table changed
Table changed
Table changed
Table changed
TD PS 24 / Erlwein
TD SP / Heinlein
SMS Iselin
Siemens AG Register 4 RLL5-310.034.04 Page 1 of 2 UROSKOP D3
Medical Engineering Rev. 04 12.98 TD PS 24
Page 74

12 - 2 Changes to previous version
This page intentionally left blank.
UROSKOP D3 Register 4 RLL5-310.034.04 Page 2 of 2 Siemens AG
Rev. 04 12.98 TD PS 24 Medical En gineering
 Loading...