

Page 1
Density
Illumination
Color
New Version
Spectrodensitometer
Spectrodensitometer
/
/
3-in-1 next-generation measurement tool
Color
Density
Illumination
Streamlines color adjustment in printing,
even on substrates with uorescent
whitening agents
Page 2
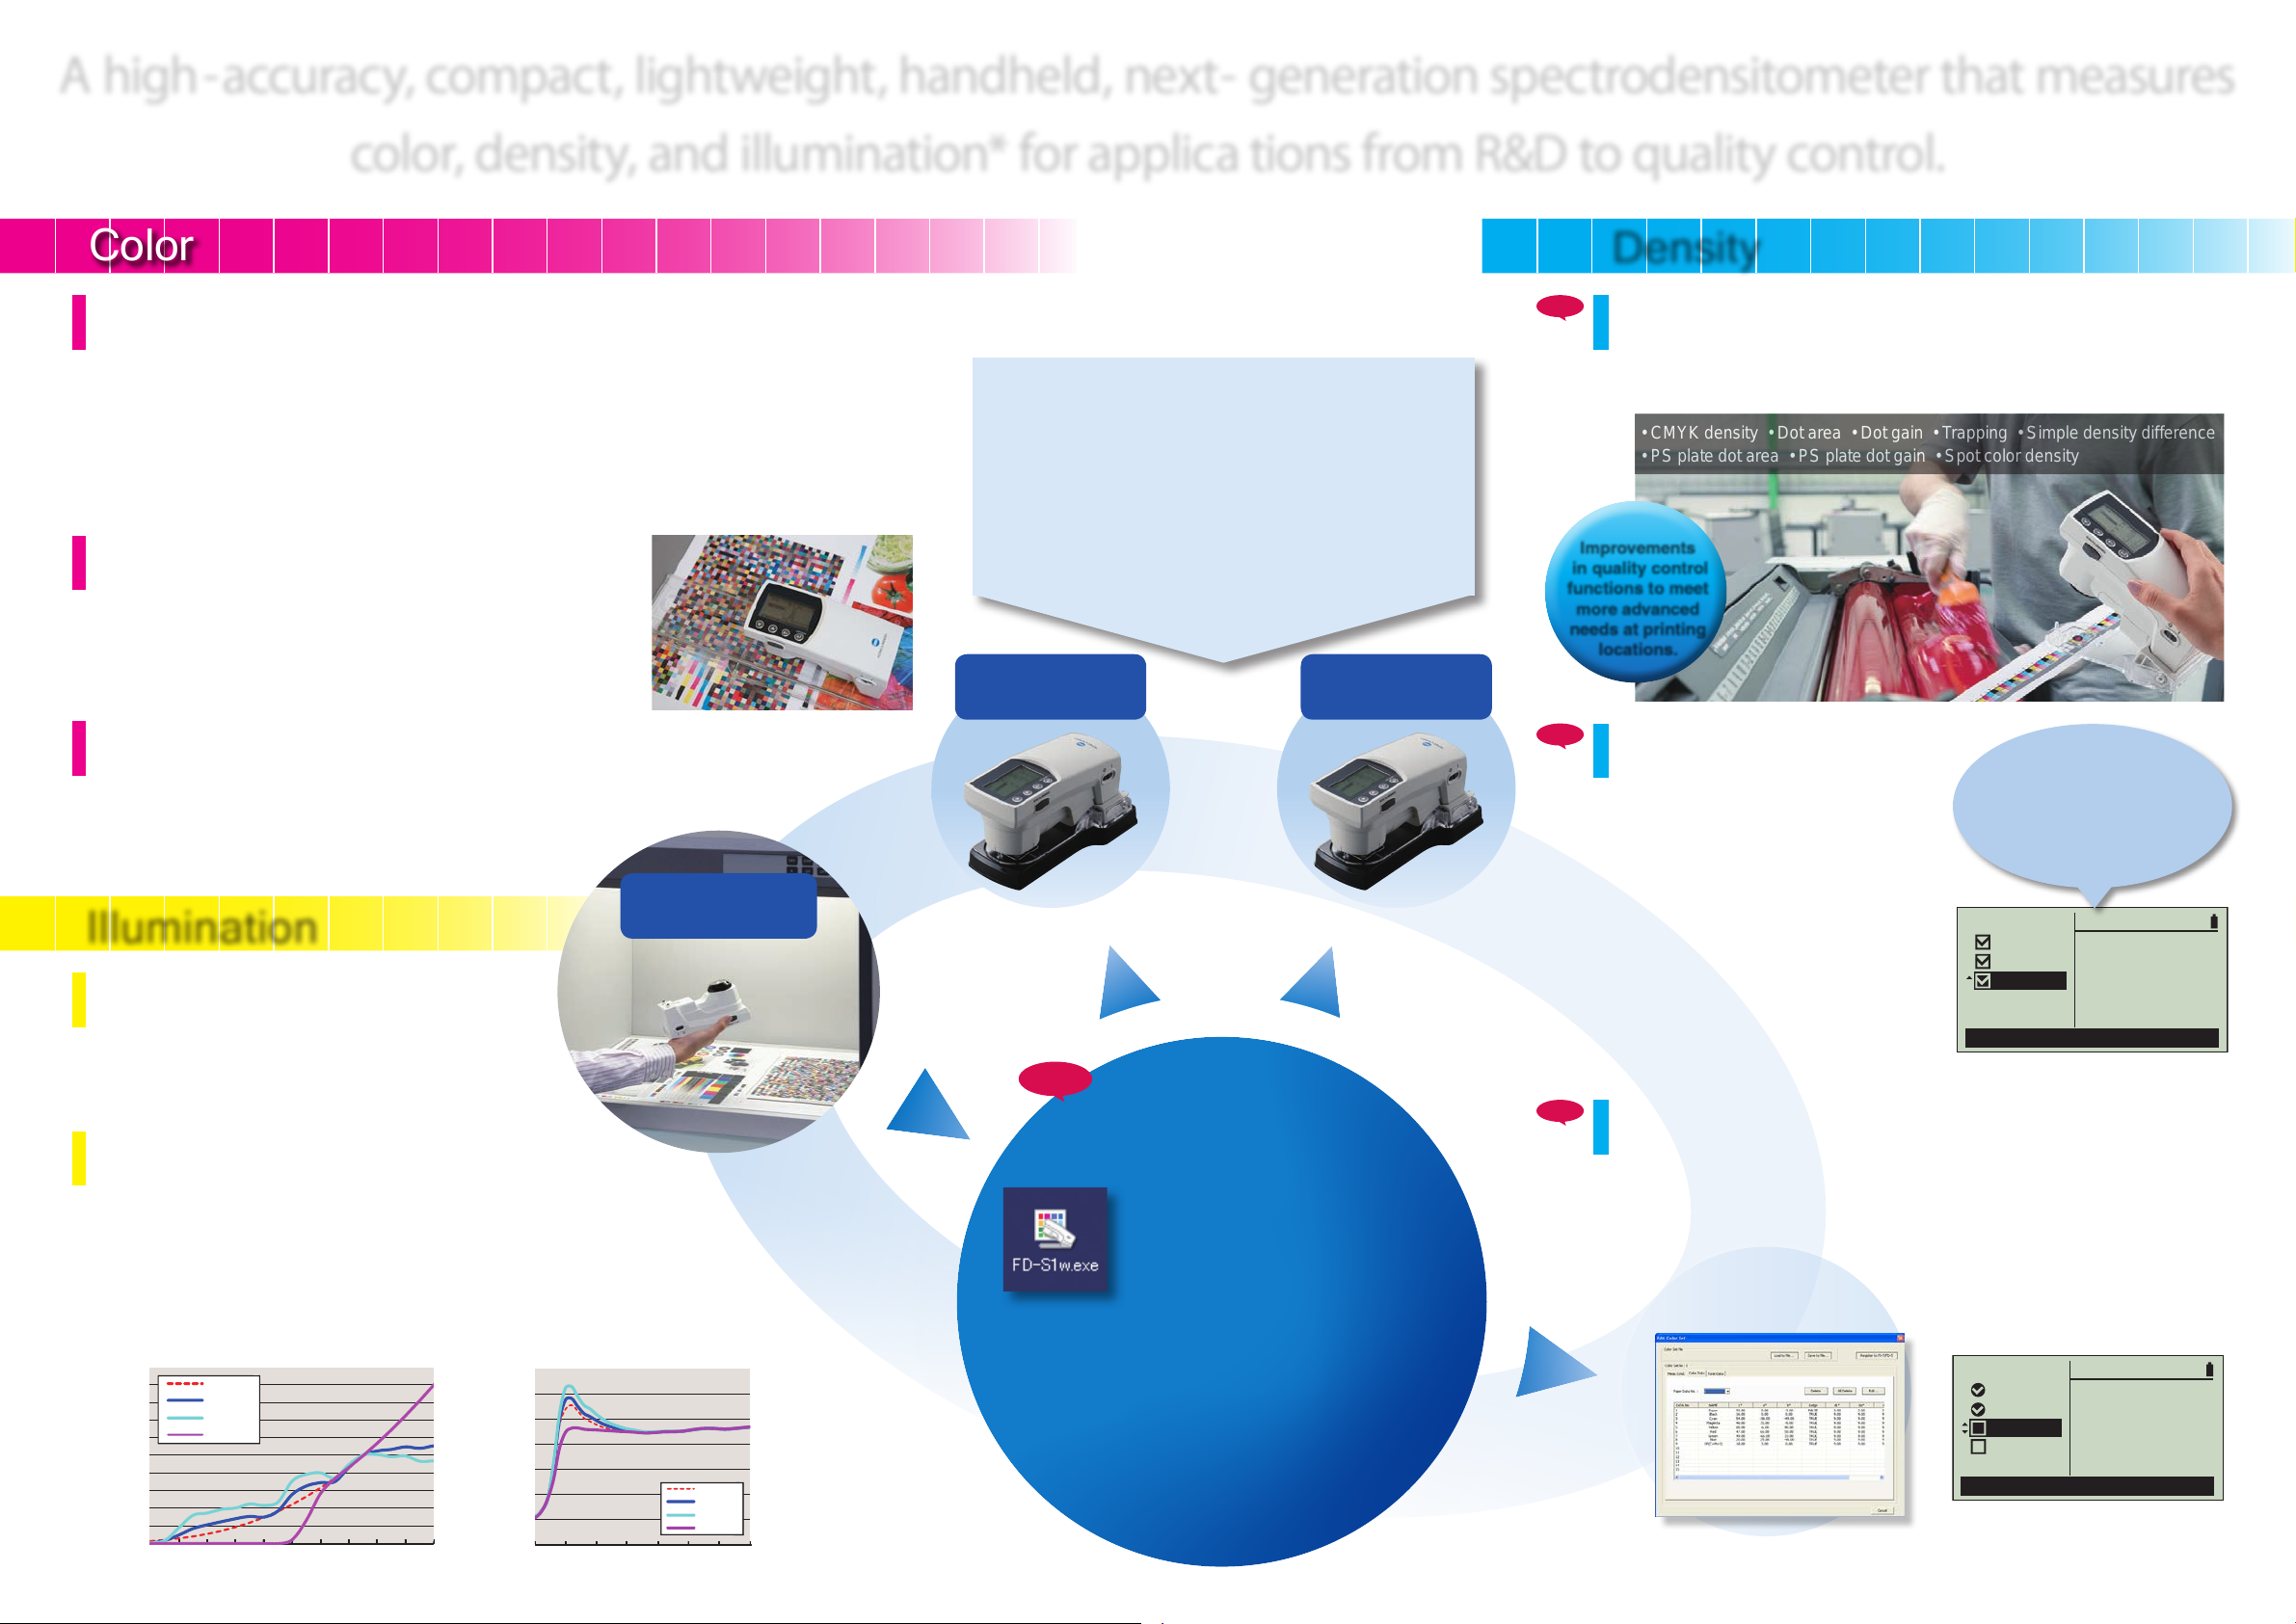
A high-accuracy, compact, lightweight, handheld, next- generation spectrodensitometer that measures
• CMYK density • Dot area • Dot gain • Trapping • Simple density difference
• PS plate dot area • PS plate dot gain • Spot color density
Relativeintensity(a.u.)
A
*FD-7 only
color, density, and illumination* for applica tions from R&D to quality control.
Color
The world’s first measuring instrument that corresponds
to Measurement Condition M1 of ISO 13655
• Konica Minolta’s original VFS (Virtual Fluorescence Standard) technology enables L*a*b* measurements
corresponding to ISO 13655 Measurement Condition M1.
• The FD-7 and FD-5 can take measurements corresponding to all four of the ISO 13655 Measurement
Conditions. Measurements corresponding to M1 are enabled by Konica Minolta’s original VFS (Virtual
Fluorescence Standard) technology, and measurements corresponding to M0 (CIE Illuminant A) and M2
(illumination with UV-cut filter) can also be taken. In addition, by attaching the included polarization filter,
measurements corresponding to M3 (M2+ polarization filter) can be taken.
Scan measurements can be performed.
• Manual scan measurements can be performed when the instrument is
connected to a PC.
• With optional software basICColor catch all, the colorimetric values,
density values, and spectral reflectance values of various test charts
(MediaWedge ECI2002, IT8.7/3, etc.) can be measured in a single
operation.
Spectral output
• When the FD-7 is connected to a computer, the spectral reflectance
data (380 to 730 nm) of samples under various illuminants and
the spectral irradiance data (360 to 730 nm) of the environmental
lighting can be measured and output to a computer. This makes
the FD-7 ideal for research and development applications.
(FD-7 only)
(FD-7 only)
Illumination
Illumination environment light
can be measured.
• The illuminance and color temperature in a color
viewing cabinet or the actual ambient light under which
printed materials will be evaluated can be measured.
Measured environmental light can be set as
illumination light source (user illuminant)
• In the past, when measuring printed materials containing fluorescent whitening agents
(FWA), large differences between measured values and visual evaluation sometimes
occurred. But with the FD-7, colorimetric values can be calculated under the measured
environmental light source, providing results which more closely correspond to on-site
visual evaluation. This ensures customers receive the colors they want and eliminates time
and labor lost resolving customer complaints due to the effects of FWA or metamerism.
Measuredlightsourceintensitydistribution
2
1.8
1.6
1.4
1.2
1
0.8
0.6
0.4
0.2
0
300 320 340 360 380 400 420 440 460 480 500
A
D50
D65
A(Uvcut)
Wavelength(nm)
(FD-7 only)
140
120
100
80
60
40
Spectralreflectance(%)
20
0
380 430 480 530 580 630 680 730
FD-7
(Master body)
D50
D65
A(UVcut)
Wavelength(nm)
By measuring the environmental light source with
an FD-7 master body and then transferring
the user illuminant data to multiple FD-5 or FD-7
working bodies, color control using the same
illumination light source at multiple locations can
be achieved. In addition, theautomatic wavelength
compensation function minimizes inter-instrument
errors when using multiple instruments.
FD-5
(Working body)
FD-5
(Working body)
NEW
Data Management
Software FD-S1w
(included as standard accessory)
Features:
• Transfer of measurement data to Excel® sheet.
• Reading/ registering of user illuminant data to/
from instrument and storage as PC file
• Color set management functions (for instrument
ISO 12647 Check and Target Match functions)*1*
System Requirements
OS Windows XP, Windows
Vista or Windows 7; 32bit or 64-bit versions
Excel Excel 2003 (Windows XP),
Excel 2007 (Widows Vista),
or Excel 2010 (32-bit version;
Windows 7)
The haedware or the computer
system to be used must meet or
exceed the recommended system
requirements for the compatible
OS and Excel version being used.
Compatible Instruments
Spectrodensitometer FD-7, FD-5
Display language
English, Japanese,
Chinese (Simplified)
(Select one during installation.)
Density
NEW
NEW
NEW
2
*1 Target colors (color sets) must be set using the included FD Data Management Software FD-S1w.
*2 Backing conversion function converts the target values to enable evaluation even when backing
conditions for samples do not match those of the targets.
Printing quality control functions
including trapping, dot gain, etc.
• A new industry-standard tool for commercial printing and packaging
printing to improve productivity and quality at low cost.
Improvements
in quality control
functions to meet
more advanced
needs at printing
locations.
Target Match function
• Displays the color difference of mixed
ink from the target color and the density
adjustment needed to bring the mixed
color closer to the target color.
By using the Target Match function,
*1*2
Measure color difference.
Result: Adjusting the
density of spot color with
400 nm peak from 0.86 to
1.16 is predicted to result in
a color difference of 0.48.
ink color adjustment can be performed
without a computer or special software.
· Ideal for spot colors or process colors.
· Displays color difference and density.
· Displays estimated density
TARGETMATCH
Paper
Target
Sample
adjustment needed to bring the
mixed color closer to the target
color and the predicted color
Measuresample
difference after adjustment.
Functions corresponding to
various printing standards
• Pass/fail judgment against ISO, JapanColor, GRACoL®/SWOP®,
PSO, or user-defined custom targets can be performed. The
FD-7 and FD-5 are ideal for on-site printing quality control.
· ISO 12647 check
Color difference, TVI, and mid-tone spread can be evaluated.
· Gray balance
Gray balance can be evaluated using the G7® evaluation method.
*1*2
ISOCHECK
Yellow40%
Red
Green
Blue
16/21
Red:Pass
M12°D50
⊿D(400)
⊿E*94
2.54 @
>>
0.48 @
M12°D50
+0.30D
L*
a*
b*
E*ab
CS01:PT1-AM-BB
0.86D
1.16D
-0.32
0.08
-0.22
0.40
Page 3

Industry's first automatic wavelength
Wavelength-direction shift
compensation function
• Wavelength compensation is performed during white calibration* without
requiring additional work.
• Until now, wavelength compensation could only be carried out as one part
Spectral reflectance
of manufacturer servicing. This task is now performed whenever white
calibration*3 is done, helping to maintain the high reliability of measurement
values until the next periodic servicing.
*3 Except when polarization filter is attached.
World's lightest
*4
• The main body weighs only about 350g, and even with the target
mask attached it's only about 430g, lighter than any previous
spectrodensitometer.
•
This reduces the load on the user's arm during work, improving
efficiency when taking measurements over a long time.
*4 Display-equipped spectrodensitometer. As of December 1, 2012
Worry-free after-sales service
• Worldwide service centers provide rapid support when needed.
• A comprehensive service network is in place to ensure that your instrument is always in top shape.
Wavelength
SYSTEM DIAGRAM
USB Cable (Shape may vary by region.)
IF-A17 (Europe)
IF-A23 (worldwide except Europe)
Spectrodensitometer
FD-7/FD-5
Protection Glass
FD-A04
White
Calibration Plate
FD-A06
Target Mask
FD-A01
Polarization Filter
FD-A08
PC
(commercially available)
Ruler
FD-A02
AC Adapter
(Shape may
vary by region.)
Illuminance Adapter
FD-A03
FD-5, FD-7
Standard accessories
Color Management
Software
basICColor catch all
Soft Case
FD-A05
Standard accessories
only of FD-7
CM-S100w
Spectra Magic® NX
ProfessionalEdition
Basic Edition
Data Management
Software
FD-S1w
XY Automatic ColorMeasurement Stage
ColorScoutA3+
Optional
accessories
DIMENSIONS
(Units: mm)
With removable target mask attached
171.5
165
25
φ6.2
90
70
84.2
Optional accessories
XY Automatic Color-Measurement
Stage ColorScoutA3+
The ColorScoutA3+ enables accurate, highefficiency measurements of color charts
with the Spectrodensitometer FD-7 and
FD-5. It enables automatic positioning and
measurement of the instrument, providing
higher repeatability and reducing labor
compared to manual measurements.
XY automatic color-measurement stage.
Table available with either white surface or black
surface.
Using the ColorScoutA3+ with the FD-7 or FD-5 makes it easier to measure
colorimetric data of color charts under ISO 13655 Measurement Condition M1 or a
user-defined illumination light source (user illuminant) to create user color profiles
that more closely match visual evaluation.
Maximum measurable chart size of 320 x 460 mm improves measurement efficiency
by allowing even large color charts to be measured in a single procedure without the
need to cut up or tile the charts.
Measurement of user-designed charts is also possible. The included ClrChrt software
makes it easy to create a definition file for measuring the user-designed chart.
ClrChrt software (Included)
Measurement data Chart design screen
ColorChart minimum computing requirements
OS; CPU Windows®XP(32-bit), Windows®Vista(32-bit); 300MHz or faster
Hard disk; Memory 30MB or more available disk space; 64MB or more
*1
Color Management Software
bas
olor catch all
ICC
Ideal software for quality control of process color printing targets for offset printing.
For major efficiency increases in daily color control work.
Enables color reproduction closer to visual evaluation with simple operation.
• With basICColor catch all, commonly used templates and jobs are already
included, so there is no need for measurement preparations such as setting
target values, tolerances, etc.
• When the software is started, just select the required measurement
conditions in the Job Management screen. You can then connect
immediately to the Spectrodensitometer FD-7 or FD-5, and PDF reports
can be created and output automatically.
• Data are stored in ISO format (ISO 12642-2), so they can be fed back to
profile creation software. Using Measurement Condition M1 or a userdefined illumination light source (user illuminant) enables color reproduction
closer to visual evaluation.
For ISO 12647-2 printing certification checks and print process quality
management.
•Enables measurement of Fogra® and
IDEAlliance® standards and certification
checking.
•In addition to CIELAB for color, evaluation
results for CMYK dot gain and mid-tone
spread as required for the above certification
checking can also be easily obtained. This
can help discover and resolve problems in
the printing process at an early stage.
Minimum computing requirements
OS Windows
CPU Intel® Pentium® 4 Processor
Memory 512MB
Hard disk At least 100MB of available disk space
®
Vista (32-bit); Windows® 7 (32-bit)
XP SP3 (32-bit); Windows®
*1
NEW
Color Data Software SpectraMagic®
Ideal for color-difference control of spot colors relative to target colors.
*1 Measurements with polarization filter attached cannot be performed.
Achieves overall ease of use with free selection
of evaluation equations and report formatting.
With the new E*94 and E00 color difference equations as
well as a user index that allows users to freely set their own
evaluation equations, SpectraMagic® NX can meet a wide
variety of user needs.
Measurement data can be displayed in list form or in objects
such as spectral graphs, color-difference graphs, etc. that the
user can freely lay out, and those objects can be copied and
pasted as is into other software such as Excel® for easy data
control. In addition, printing screens can also be designed
using the same objects to create user-defined formats for
easy-to-read reports.
List display
Color-difference graph object Pasted into Excel
Minimum Computing Requirements
OS
CPU
Memory
Hard disk
Windows® XP Professional 32-bit SP3, 64-bit SP2; Windows® Vista Business 32-bit, 64-bit;
Windows® 7 Professional 32-bit, 64-bit
(English, Japanese, German, French, Spanish, Italian, Traditional Chinese, Simplified Chinese,
Portuguese, and Hangul versions)
• The hardware of the computer system to be used must meet or exceed the greater of the
recommended system requirements for the compatible OS being used or the following specifications.
Pentium® lll 600 MHz or higher (recommended)
128 MB (256 MB recommended)
450 MB of available disk space (At least 400 MB of available space is required in the system drive.)
*1
NX
Printing screen
®
Page 4

Function
*★New
Density measurement functions
Density, density difference
Dot area
Dot gain
Trapping
PS plate dot area
PS plate dot gain
Spot color density
Gray balance
Midtone spread
ISO 12647 check
Tar g et mat ch
Colorimetric measurement functions
Lab
LCh
Hunter Lab
Yxy
XYZ
E*ab (CIE1976)
E*94 (CIE1994)
E00 (CIE2000)
E (Hunter)
CMC (l:c)
Illuminance measurement functions
Illuminance
Correlated color temperature
Paper index
WI/Tint (ASTME313-96)
ISO Brightness (ISO2470-1)
Brightness (ISO2470-2)
D
65
Fluorescence index
Spectral reflectance
Spectral data output
Memory
Target density 30 30
Tar g et col o r 3 0 30
Color sets of 15 colors each
Other functions
Manual scan
Automatic function
(density, dot area, color)
PASS/FAIL ju dgm en t
Software
basICColor catch all
FD-S1w
SpectraMagic NX
ClrChrt
(Included with ColorScoutA3+)
FD-7 FD-5
●●
●●
●●
★★
★★
★★
★★
★★
★★
★★
★★
●●
●●
●●
●●
●●
●●
●●
●●
●●
●●
●
●
●●
●●
●●
●●
●
3
50 50
2
●
●●
●●
●●
★★
★★
●●
Main specifications
1
Illumination/viewing
system
Spectral separation
device
45°a: 0°(annular illumination)
Conforms to CIE No. 15, ISO 7724/1, DIN5033 Teil 7, ASTM E 1164, and JIS Z
8722 Condition a for reflectance measurements.
Concave grating
Wavelength range Spectral reflectance: 380 to 730 nm; Spectral irradiance (FD-7 only): 360 to 730 nm
Wavelength pitch 10 nm
Half bandwidth Approx. 10 nm
Measurement area Ø3.5 mm
Light source LED
Measurement range Density: 0.0D to 2.5D; Reflectance: 0 to 150%
Density: ı0.01D
Without polarization filter: 0.0D ~ 2.5D, Yellow 0.0D ~ 2.0D
With polarization filter: 0.0D ~ 2.5D, Yellow 0.0D ~ 1.8D
Short-term repeatability
(When measurements taken 30 times at 10-second intervals after
white calibration has been performed)
Colorimetric: Within
(When white plate is measured 30 times at 10-second intervals
after white calibration has been performed)
E00 0.3 (Average of 12 BCRA Series II color tiles compared to values
Inter-instrument
agreement
Within
measured with a master body under Konica Minolta standard conditions; without
polarization filter )
Measurement time Approx. 1.4 s (single-point reflectance measurement without polarization filter)
Measurement
conditions
Illuminants
Corresponding to ISO 13655 Measurement Conditions M0 (CIE Illuminant A),
M1 (CIE Illuminant D50), M2 (illumination with UV-cut filter), and M3 (M2 +
polarization filter); User-defined illuminant
A, C, D50, D65, ID50, ID65, F2, F6, F7, F8, F9, F10, F11, F12, User-defined
illuminant
Observers 2° Standard Observer, 10° Standard Observer
Density ISO Status T, ISO Status E, ISO Status A, ISO Status I; DIN16536
Display language English, French, German, Spanish, Japanese, Chinese (Simplified)
Interface USB 2.0
Output data
Powe r
2
Displayed values; Spectral reflectance data (FD-7 only) ; Spectral irradiance data
(FD-7 only)
Rechargeable internal lithium-ion battery (Number of measurements per charge:
Approx. 2,000 when new without polarization filter); AC adapter; USB bus power
Dimensions (W × D × H) 70 × 165 × 83 mm (Body only); 90 × 172 × 84 mm (With target mask attached)
Weight Approx. 350 g (Body only); Approx. 430 g (With target mask attached)
Operating temperature/
humidity range
Storage temperature/
humidity range
10 to 35°C, 30 to 85% relative humidity with no condensation
0 to 45°C, 0 to 85% relative humidity with no condensation
White Calibration Plate, Target Mask, Protection Glass, AC Adapter, USB Cable,
Standard accessories
Soft Case, Polarization Filter, Data Management Soft ware FD-S1w, Illuminance
Adapter (FD-7 only), Ruler (FD-7 only)
Color Management Software basICColor catch all,
Optional accessories
XY Automatic Color Measurement Stage Color Scout A3+,
Color Management Software SpectraMagic NX
1 Illumination for wavelengths under 400nm is unidirectional.
2 Available when using PC software.
3 Used for ISO 12647 Check / Target match; Must be set using included FD-S1w software.
• Displays shown are for illustration purpose only.
• The specifications and drawings given here are su
• KONICA MINOLTA and the Konica Minolta logo and the symbol mark, and "Giving Shape to Ideas" and SpectraMagic™ are
registered trademarks or trademarks of KONICA MINOLTA, INC.
• The basICColor logo is a registered trademark of basICColor GmbH.
• Other company names and product names used herein are trademarks or registered trademarks of their respective companies.
bject to change without prior notice.
ı
E00 0.05 (Without polarization filter)
SAFETY PRECAUTIONS
For correct use and for your safety, be sure to read the instruction
manual before using the instrument.
Always connect the instrument to the specified power supply
s
voltage. Improper connection may cause a fire or electric shock.
Certificate No : LRQ 0960094/A
Registration Date : March 3, 1995
9242-4897-10 BDEGPK 7©2010 KONICA MINOLTA, INC.
Certificate No : JQA-E-80027
Registration Date : March 12, 1997
 Loading...