

Siemens SINUMERIK 840Di sl, SINUMERIK 840D sl, SINUMERIK 840Di, SIMATIC S7-300, SIMATIC S7-400 Function Manual
...Page 1

Preface
SINUMERIK 840Di sl/840D sl
SINUMERIK 840Di/840D
SIMATIC S7-300/S7-400
ePS Network Services
Function Manual
Introduction
Machine information
Setting up functions
Organizational tasks
Statistics/export
Management
1
2
3
4
5
6
Applies to:
Software Version
ePS Network Services 4.7
Establishing a
connection and
diagnostics
Appendix
7
A
Release 12/2008
Page 2

SINUMERIK® Documentation
Printing history
Brief details of this edition and previous editions are listed below.
The status of each edition is shown by the code in the "Remarks" column.
Status codes in the "Remarks" columns:
A .... New documentation.
B .... Unrevised reprint with new Order No.
C .... Revised edition with new status.
Release Order no. Remark
12/2008 -- C
08/2008 -- C
11/2007 -- C
04/2007 -- C
11/2006 -- C
08/2006 -- C
04/2006 -- C
11/2005 -- C
Registered Trademarks
All designations with the trademark symbol ® are registered trademarks of Siemens AG. Other
designations in this documentation may be trademarks whose use by third parties for their own
purposes can violate the rights of the owner.
Exclusion of Liability
We have checked that the contents of this document correspond to the hardware and software
described. Since variance cannot be precluded entirely, we cannot guarantee full consistency.
However, the information in this publication is reviewed regularly and any necessary corrections are
included in subsequent editions.
Siemens AG
Industry Sector
P.O. Box 3180
91050 Erlangen
GERMANY
Copyright © Siemens AG 2008
Subject to change without prior notice.
Page 3

12/2008 Preface
Preface
SINUMERIK documentation
The SINUMERIK documentation is available in three versions:
• General documentation
• User documentation
• Manufacturer/service documentation
A monthly overview of publications with the available languages is available on the
Internet at:
http://www.siemens.com/motioncontrol
Follow menu items "Support" "Technical Documentation" "Ordering
Documentation" "Printed Documentation".
The Internet version of the DOConCD (DOConWEB) is available at:
http://www.automation.siemens.com/doconweb
Information about training courses and FAQs (frequently asked questions) are
available on the Internet under:
http://www.siemens.com/motioncontrol
Target group
This publication is intended for project engineers, programmers, technologists (of
machine manufacturers), and system startup engineers (of systems/machines).
Use
The Function Manual describes the functions so that the target group is familiar
with and can select them. It provides the target group with the information required
to implement the functions.
Utilization phase: Planning and configuration phase, implementation phase, setup
and commissioning phase
, under the menu item "Support".
Standard scope
This documentation only describes the functionality of the standard version. Additions or revisions made by the machine tool manufacturer are documented by the
machine tool manufacturer.
Other functions not described in this documentation might be executable in the
control. This does not, however, represent an obligation to supply such functions
with a new control or when servicing.
© Siemens AG 2008 All Rights Reserved
ePS Network Services, Function Manual (FH) - Release 12/2008
iii
Page 4

Preface 12/2008
Further, for the sake of simplicity, this documentation does not contain all detailed
information about all types of the product and cannot cover every conceivable case
of installation, operation, or maintenance.
Questions about this document
If you have any queries (suggestions, corrections) in relation to this documentation,
please fax or e-mail us:
Fax +49 9131 98 2176
E-mail mailto:docu.motioncontrol@siemens.com
A fax form is available at the end of this document.
SINUMERIK Internet address
http://www.siemens.com/sinumerik
Technical Support
If you have any technical questions, please contact our hotline:
Europe/Africa
Phone
Fax
Internet
America
Phone
Fax
E-mail
Asia/Pacific
Phone
Fax
E-mail
Note
Country-specific telephone numbers for technical support are provided under the
following Internet address: http://www.siemens.com/automation/service&support
+49 180 5050 222
+49 180 5050 223
http://www.siemens.com/automation/support-request
+1 423 262 2522
+1 423 262 2200
techsupport.sea@siemens.com
+86 1064 719 990
+86 1064 747 474
techsupport.asia@siemens.com
Calls are subject to charge, e.g. 0.14 €/min. on the German landline network.
Tariffs of other phone providers may differ.
© Siemens AG 2008 All Rights Reserved
iv ePS Network Services, Function Manual (FH) - Release 12/2008
Page 5

12/2008 Preface
EC declaration of conformity
The EC Declaration of Conformity for the EMC Directive can be found on the Internet at: http://support.automation.siemens.com
or under the Order No. 15257461 or at the relevant branch office of the A&D MC
Division of Siemens AG.
Safety information
This manual contains notices you have to observe in order to ensure your personal
safety, as well as to prevent damage to property. Notices referring to your personal
safety are highlighted in the manual by a safety alert symbol; notices referring to
property damage only have no safety alert symbol. Depending on the hazard level,
warnings are indicated in a descending order as follows:
!
!
!
Danger
Indicates that death or serious injury will result if proper precautions are not
taken.
Warning
Indicates that death or serious injury may result if proper precautions are not
taken.
Caution
(With warning triangle) Indicates that slight personal injury may result if proper
precautions are not taken.
Caution
(Without warning triangle) Indicates that property damage may result if proper
precautions are not taken.
© Siemens AG 2008 All Rights Reserved
ePS Network Services, Function Manual (FH) - Release 12/2008
Notice
Indicates that an unwanted result or situation may result if the appropriate advice
is not taken into account.
In the event of a number of levels of danger prevailing simultaneously, the warning
corresponding to the highest level of danger is always used. A warning with a
warning triangle indicating risk of physical injury may also include a warning of the
risk of damage to property.
v
Page 6

Preface 12/2008
Qualified persons
The associated device/system must only be set up and operated using this documentation. Commissioning and operation of a device/system may only be performed by qualified personnel. Within the context of the safety notes in this documentation qualified persons are defined as persons who are authorized to commission, ground and label devices, systems and circuits in accordance with established safety practices and standards.
Intended purpose
Please observe the following:
!
Warning
Siemens products must only be used for the applications specified in the catalog
and in the technical documentation. If third-party products and components are
used, they must be recommended or approved by Siemens.
To ensure trouble-free and safe operation of the products, they must be appropriately transported, stored, assembled, installed, commissioned, operated and
maintained. The permissible ambient conditions must be adhered to. The notes in
the associated documentation must be complied with.
© Siemens AG 2008 All Rights Reserved
vi ePS Network Services, Function Manual (FH) - Release 12/2008
Page 7

12/2008 Contents
Contents
1 Introduction ...............................................................................................1-11
1.1 Overview of ePS Network Services Documentation................................1-11
1.2 Overview of functions ..............................................................................1-12
1.3 Operating concept ...................................................................................1-14
2 Maschine information...............................................................................2-19
2.1 Machine overview ....................................................................................2-19
2.1.1 Current control software .......................................................................2-20
2.1.2 Machine events – List view...................................................................2-20
2.1.3 Machine events – Detailed view ...........................................................2-23
2.1.4 Evaluation of workflow actions..............................................................2-24
2.1.5 Evaluation of diagnostics data..............................................................2-25
2.2 Variable monitors - Measurements and measurement series.................2-34
2.2.1 Visualization on the Internet PC ...........................................................2-34
2.2.2 Operating diagrams ..............................................................................2-37
2.2.3 Control elements of the diagrams for individual measurements ..........2-41
2.2.4 Circularity test .......................................................................................2-43
2.2.5 Equability test........................................................................................2-44
2.2.6 Universal axis test.................................................................................2-46
2.2.7 Variable monitors..................................................................................2-47
2.3 Test series on the machine......................................................................2-50
2.3.1 Performing measurement series...........................................................2-50
2.3.2 Requirements for performing the test...................................................2-51
2.3.3 Prolog and epilog program for a measurement....................................2-53
2.3.4 Program example .................................................................................2-56
2.3.5 Commissioning measurements ............................................................2-60
2.3.6 Release protocol between PLC and ePS system.................................2-60
2.3.7 Contour test ..........................................................................................2-61
2.4 Maintenance ............................................................................................2-62
2.5 Remote access ........................................................................................2-64
2.5.1 Remote access functions......................................................................2-64
2.5.2 Functions of a service session..............................................................2-65
2.5.3 Starting a service session.....................................................................2-66
2.5.4 Example of a session via remote access .............................................2-69
2.5.5 Granting permission to execute functions ............................................2-70
2.5.6 Setting up a service conference call.....................................................2-74
2.5.7 Remote control via the keyboard..........................................................2-77
3 Setting up functions .................................................................................3-79
3.1 Maintenance ............................................................................................3-81
© Siemens AG 2008 All Rights Reserved
ePS Network Services, Function Manual (FH) - Release 12/2008
vii
Page 8

Contents 12/2008
3.1.1 Creating maintenance schedules .........................................................3-81
3.1.2 Configuring variable monitors...............................................................3-85
3.2 Configuring measurements and measurement series.............................3-92
3.2.1 Circularity test .......................................................................................3-92
3.2.2 Equability test........................................................................................3-94
3.2.3 Universal axis test.................................................................................3-95
3.2.4 Performing test series...........................................................................3-97
3.3 ePS variables...........................................................................................3-98
3.3.1 ePS variables – List view......................................................................3-98
3.3.2 ePS variables – Detailed view ..............................................................3-100
3.4 Fault services...........................................................................................3-101
3.4.1 Control monitors – List view..................................................................3-101
3.4.2 Control monitors – Detailed view..........................................................3-105
3.4.3 Machine triggers and server triggers ....................................................3-108
3.4.4 Machine trigger on "alarm group" .........................................................3-109
3.4.5 Machine trigger on "PLC variable"........................................................3-111
3.4.6 Machine trigger for "PLC timeout trigger" .............................................3-115
3.4.7 Machine trigger on "new value of ePS variable"...................................3-117
3.4.8 Combined machine trigger on "alarm group" AND "PLC variable".......3-120
3.4.9 Machine trigger for "Time-based trigger"..............................................3-121
3.4.10 Trigger on "Fault message at HMI/PC" ..............................................3-125
3.4.11 Server trigger on "Measurement series reaches limit value"..............3-126
3.4.12 Server trigger on "Maintenance jobs due" ..........................................3-127
3.4.13 Server trigger on "Variable monitor reaches limit value" ....................3-128
3.4.14 Cyclic server trigger for variable monitors ..........................................3-130
3.4.15 Workflow actions.................................................................................3-135
3.4.16 Diagnostic actions...............................................................................3-138
3.5 Global settings .........................................................................................3-148
3.5.1 Setting the notification limit...................................................................3-148
3.5.2 PLC and NC settings ............................................................................3-148
3.6 Copying....................................................................................................3-152
3.6.1 Functions from other machines ............................................................3-152
3.6.2 Copying functions to multiple machines ...............................................3-157
3.7 Client/server communication ...................................................................3-160
3.7.1 Synchronization times...........................................................................3-160
3.7.2 Offline synchronization .........................................................................3-161
3.7.3 Monitoring ePS services .......................................................................3-164
4 Organizational tasks.................................................................................4-165
4.1 Maintenance ............................................................................................4-165
4.1.1 Selecting a maintenance job on a machine..........................................4-168
4.1.2 Opening a maintenance job (PC) .........................................................4-171
4.1.3 Executing/closing a maintenance job (HMI) .........................................4-174
4.2 Service cases...........................................................................................4-178
4.2.1 Service cases - List view ......................................................................4-179
4.2.2 Service cases – Detailed view ..............................................................4-181
4.2.3 Requesting fault processing at the HMI................................................4-184
© Siemens AG 2008 All Rights Reserved
viii ePS Network Services, Function Manual (FH) - Release 12/2008
Page 9

12/2008 Contents
5 Statistics/export........................................................................................5-187
5.1 Multi-machine views ................................................................................5-188
5.1.1 Multi-machine events............................................................................5-188
5.1.2 Summary of machine events ................................................................5-193
5.1.3 Measurement series .............................................................................5-198
5.1.4 Reports .................................................................................................5-203
5.2 Import.......................................................................................................5-210
5.2.1 Active import processes........................................................................5-211
5.2.2 Importing a file ......................................................................................5-212
5.2.3 Importing a directory (requires ActiveX) ...............................................5-212
5.3 Export.......................................................................................................5-213
5.4 Overviews ................................................................................................5-214
5.4.1 Synchronization overview.....................................................................5-214
6 Management ..............................................................................................6-215
6.1 Organization management ......................................................................6-215
6.1.1 Addresses.............................................................................................6-216
6.1.2 Users.....................................................................................................6-217
6.1.3 Machines...............................................................................................6-218
6.1.4 Editing the master data of a machine ...................................................6-221
6.1.5 Creating a machine in the form of a copy.............................................6-225
6.1.6 Organizational data...............................................................................6-233
6.1.7 Download areas....................................................................................6-236
6.2 Personal settings .....................................................................................6-238
7 Establishing a connection and diagnostics...........................................7-239
7.1 Connecting a machine to the HMI ...........................................................7-239
7.1.1 Uploading an alarm model....................................................................7-243
7.1.2 Synchronizing the machine...................................................................7-244
7.1.3 Disconnecting the machine (at HMI and PC) .......................................7-245
7.1.4 Repetition strategy................................................................................7-248
7.1.5 Editing the prolog and epilog program..................................................7-249
7.2 Cooperation areas ...................................................................................7-250
7.2.1 Releasing a machine to an organization ..............................................7-251
7.2.2 Machines in a cooperation area............................................................7-253
7.3 Client diagnostics.....................................................................................7-255
7.3.1 Components of client diagnostics.........................................................7-256
7.3.2 Performing a diagnostics session.........................................................7-258
7.3.3 Other functions .....................................................................................7-259
7.4 Configuring 1:N connections....................................................................7-260
© Siemens AG 2008 All Rights Reserved
ePS Network Services, Function Manual (FH) - Release 12/2008
ix
Page 10

Contents 12/2008
A Appendix ...................................................................................................A-263
A.1 Useful functions of the various device classes........................................A-263
A.2 Functions of the various roles (privilege matrix)......................................A-266
A.3 References ..............................................................................................A-268
I Index.............................................................................................................I-269
© Siemens AG 2008 All Rights Reserved
x ePS Network Services, Function Manual (FH) - Release 12/2008
Page 11

12/2008 1 Introduction
1.1 Overview of ePS Network Services Documentation
1
1 Introduction
1.1 Overview of ePS Network Services Documentation
Document class Content Valid for
Configuring Manual Documentation for commissioning ePS
Network Services in machines and
systems
Function Manual Documentation of all functions that can
be performed via the server UI and
how to use them.
Readme Release notes V4.7 12/2008
Software Installation
Manual
Operating Manual Information for machine operators V4.3 11/2006
ePS Client powerline V04.03.03 02/2008
V4.7 12/2008
V4.7 12/2008
© Siemens AG 2008 All Rights Reserved
ePS Network Services, Function Manual (FH) - Release 12/2008
1-11
Page 12

1 Introduction 12/2008
1.2 Overview of functions
1.2 Overview of functions
What are ePS Network Services ?
The ePS Network Services support machine tool manufacturers and manufacturing
companies with maintenance and services. This is carried out using software
services that are available on a CNC control, S7 control, IPC or standard PC.
This requires both a control on the machine that complies with the specifications,
and Internet access.
The ePS Network Services include:
Remote access
Remote access to the control via a secure Internet infrastructure.
This service permits remote access to the control.
• Desktop control
• File transfer
• Chat
• Video ...
Control monitor services
Recording of events in a history and documentation of the current status of the
control at this point. This allows the status of the device to be analyzed and
compared with earlier states should a fault occur.
The current status of the machine is documented using the following events and
data:
• Alarms, PLC events, time intervals, combinations of machine signals
• Limit value violation and time delay violation from condition monitoring
• Series of measurements/tests and operating performance monitors
• Manual help request by the machine operator in the event of faults
• HMI action log, machine data, NC status data
• PLC trace, PLC data blocks
• Certain files (e.g. log files) of the control
Condition monitoring services
Measurement and documentation of the current machine status on the basis of
predefined, standardized tests and continuous recording of status characteristics
(traverse path, traverse time and traverse operations for one axis). The test
parameters can be defined centrally and configured with appropriate warning limits.
Using series of measurements, it is also possible to identify trends and apply them
as a basis for optimizing maintenance and service activities.
The machine operator can then carry out these predefined tests quickly and easily
and without additional test equipment.
© Siemens AG 2008 All Rights Reserved
1-12 ePS Network Services, Function Manual (FH) - Release 12/2008
Page 13

12/2008 1 Introduction
1.2 Overview of functions
The following tests and monitors are available:
• Circularity test
• Equability test
• Universal axis test
• Variable monitor (NC variable, PLC variable, freely addressable variable)
Data services
Save the current control archives (NCK and PLC archives) on the ePS Server. In
the event of faults, they can be reimported into the controller in a controlled manner
and used as reference for comparisons of control monitors.
Workflow services
Triggering of service and maintenance processes by notification via media that are
internal and external to the system (SMS, e-mail, service cases). Planning,
monitoring, and documentation of maintenance activities on the machine.
Maintenance schedules support you in the following tasks:
• "Look Ahead" maintenance relating to load and usage (see: Control monitors
with machine and service triggers)
• Automated triggering of operating sequences when faults are detected (see:
Maintenance schedules, maintenance jobs, fault help requests, and service
cases).
• Planning condition monitors in terms of dates and content, and monitoring
their processing (see: Maintenance schedules, maintenance jobs and control
monitors)
The Workflow Services can respond to all event sources of the Control Monitor
Services and Condition Monitor Services.
Administration services
Functions for the administration of the system:
• Creation and administration of machines
• Creation and administration of users
• Assignment of access rights for external organizations
• Access to use data / invoices
© Siemens AG 2008 All Rights Reserved
ePS Network Services, Function Manual (FH) - Release 12/2008
1-13
Page 14
1 Introduction 12/2008
1.3 Operating concept
1.3 Operating concept
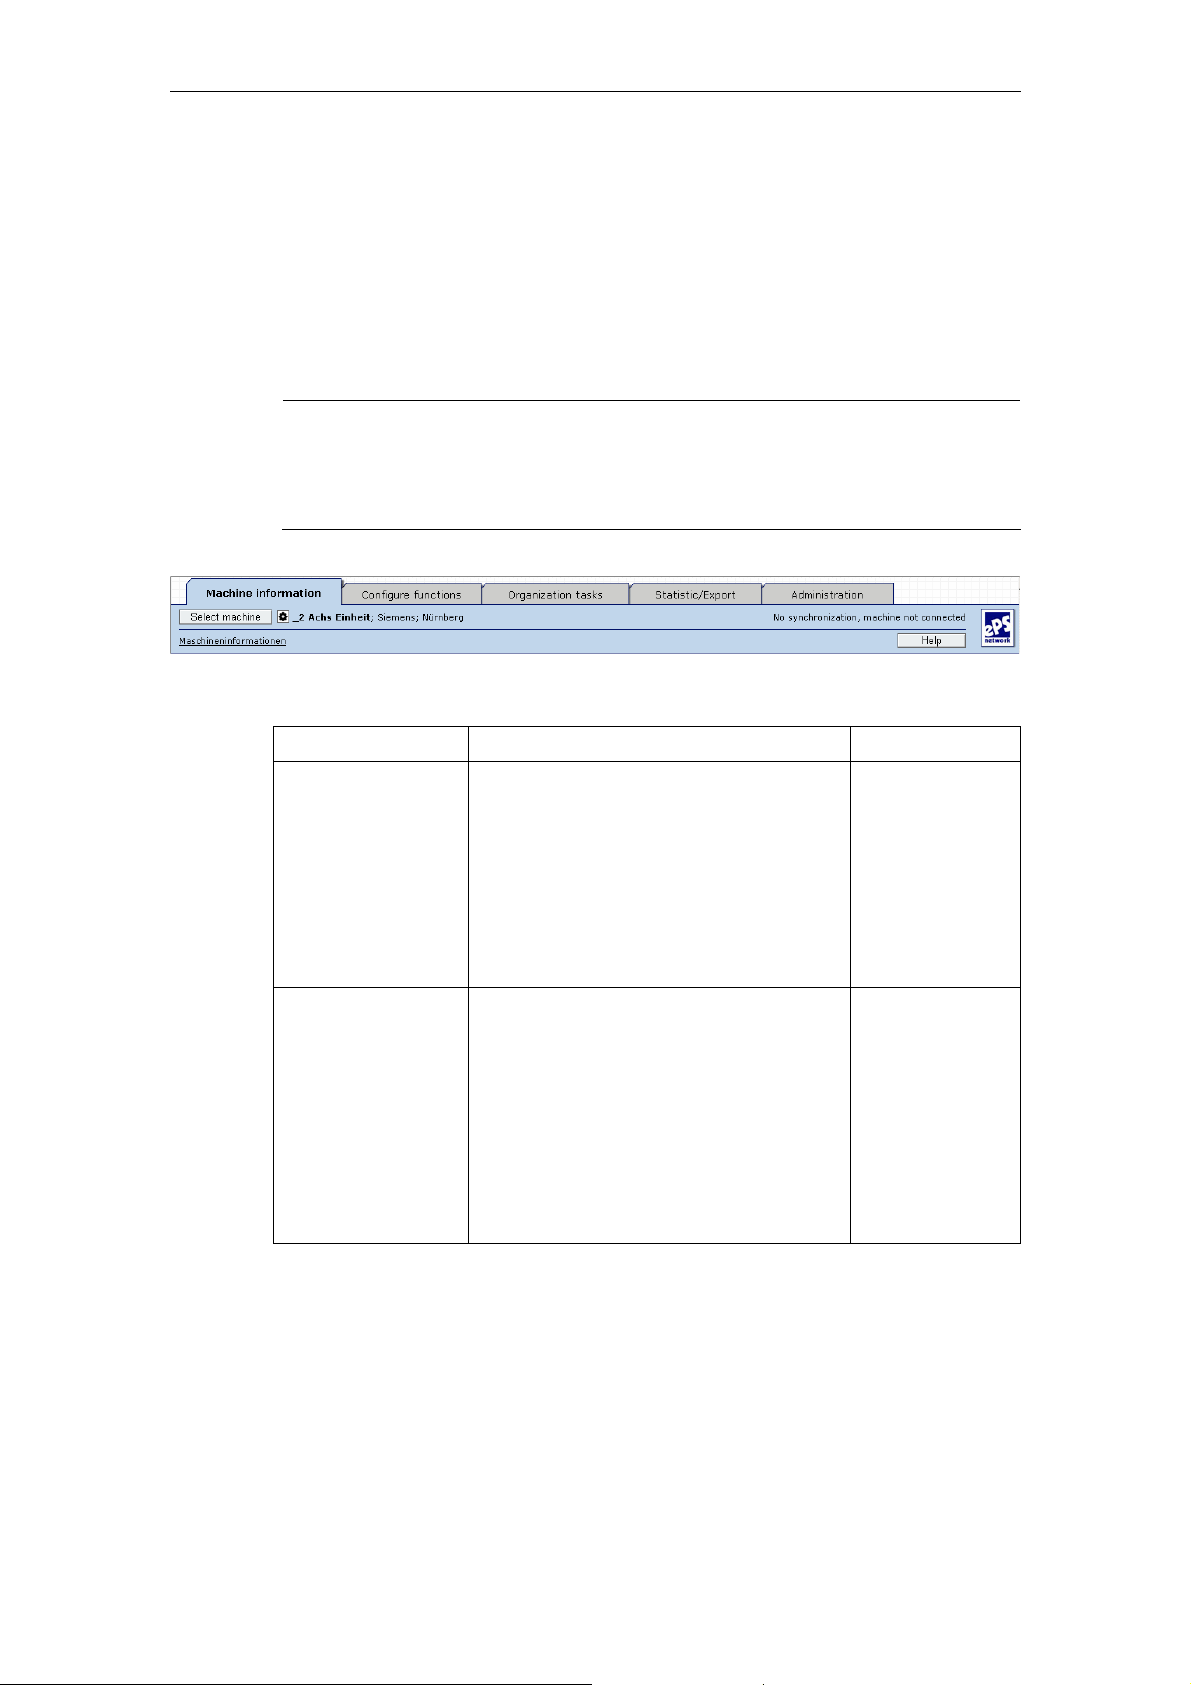
Overview
The functions of the ePS Network Services are divided into five main categories
which can be reached via tabs. The "Machine information" and "Set up functions"
tabs always apply to the selected machine.
Fig. 1-1: Basic principle of operation
Note
The availability of each function to the machine operator in each of the various
roles is described in the Appendix.
Please see the descriptions in each section for details of the functions.
Tab / Section Description
Machine
information
Setting up
functions
The "Machine information" tab contains
important information on a particular
selected machine.
It is divided into the following areas:
• Machine overview
• Maintenance
• Fault services
• Remote access
The "Set up functions" tab allows you to
make all the settings that apply to a
particular selected machine.
It is divided into the following areas:
• Maintenance
• Fault services
• Global settings
• Copying function settings
• Client/server communication
ACTION
ACTION
© Siemens AG 2008 All Rights Reserved
1-14 ePS Network Services, Function Manual (FH) - Release 12/2008
Page 15

12/2008 1 Introduction
1.3 Operating concept
Organizational
tasks
The "Organizational tasks" tab contains
functions and services that apply to all
ACTION
machines of an organization.
It is divided into the following areas:
• Maintenance jobs
• Service cases
Statistics/export The "Import/Export" tab contains
ACTION
functions and services that apply to all
machines of an organization.
It is divided into the following areas:
• Multi-machine views
• Import
• Export
• Overviews
Management The "Administration" tab contains
ACTION
functions and services that apply to the
settings of an organization.
It is divided into the following areas:
• Organization management
• Personal settings
Select machine All machine-related views and
ACTION
configurations require a machine or
machine group to be selected.
The menu for selecting a machine or
machine group is displayed again with
the setting of the last use.
Help Brings up the Help menu with
ACTION
descriptions of ePS Network Services.
© Siemens AG 2008 All Rights Reserved
ePS Network Services, Function Manual (FH) - Release 12/2008
1-15
Page 16
1 Introduction 12/2008
1.3 Operating concept
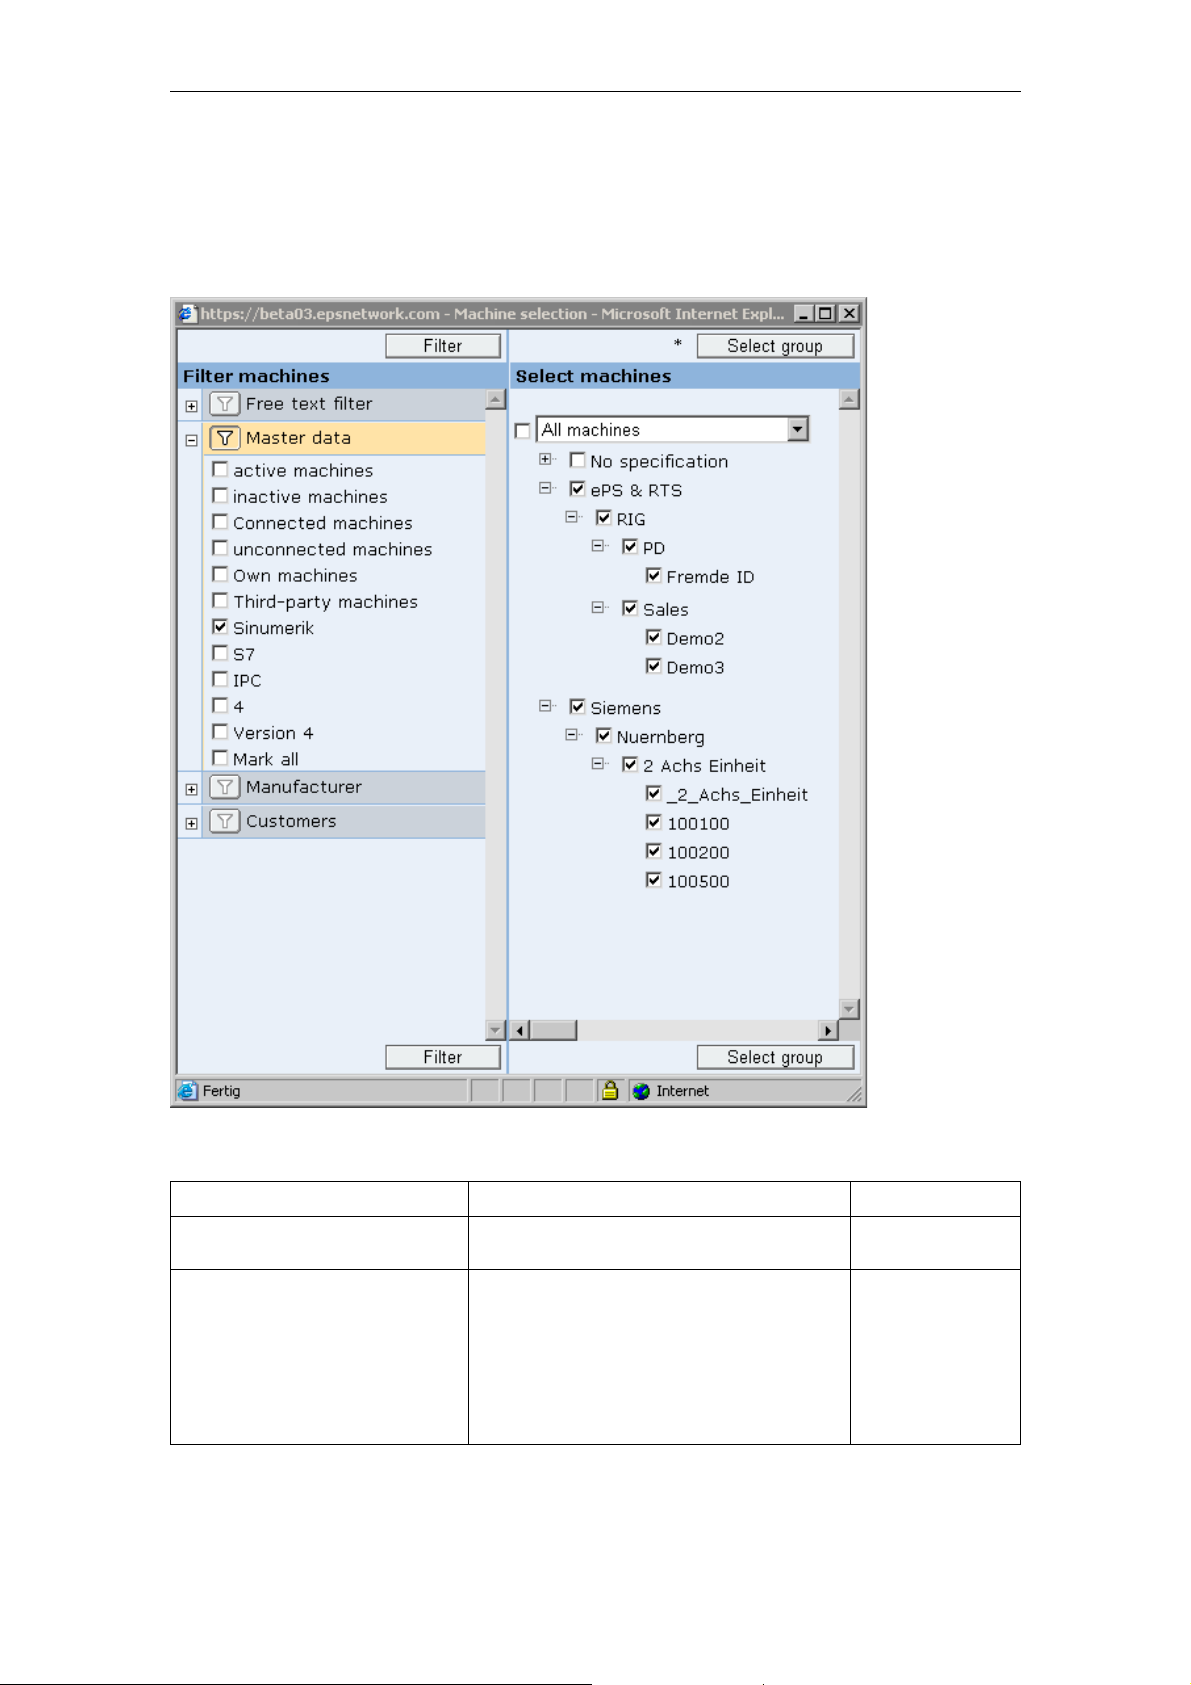
Select machine
The window that appears with the Select machine tab allows you to display, search
for, and filter machines and machine groups.
Fig. 1-2: Filtering machines
Field Content Type
Free text filter Use the +- symbol to open and close the
free text filter dialog box.
• Select - All
• Select - Machine ID
In the selection window, you can
preselect master data information for
filtering.
TOGGLE
ACTION
SELECTION
DISPLAY
• Select - Manufacturer
number
• Select - Internal name
• Select - Manufacturer name
© Siemens AG 2008 All Rights Reserved
1-16 ePS Network Services, Function Manual (FH) - Release 12/2008
Page 17

12/2008 1 Introduction
1.3 Operating concept
Field Content Type
• Enter - Text field for partial
text recognition
To further limit machine selection, you
can enter one or more partial texts
INPUT
DISPLAY
separated by commas to restrict the
filter results.
Master data Use the +- symbol to open and close the
dialog box.
• Active machines
• Inactive machines
• Connected machines
Under Master data, you can select or
clear additional limiting filter conditions
according to current information about
the status of the machines.
TOGGLE
ACTION
TOGGLE
SELECT
DISPLAY
• Disconnected machines
• Own machines
• External machines
• SINUMERIK
• S7
• Version 3
• Version 4
• IPC
• Select all
Manufacturer Use the +- symbol to open and close the
dialog box.
• No data
• …
• …
All manufacturers documented in the
master data are available for filter
selection.
TOGGLE
ACTION
TOGGLE
SELECT
DISPLAY
• …
• Select all
Customers Use the +- symbol to open and close the
dialog box.
• No data
• …
All customers documented in the master
data are available for filter selection.
• …
TOGGLE
ACTION
TOGGLE
SELECT
DISPLAY
• …
• Select all
All machines All machines in the list can be selected
or cleared at the same time.
All machines selected here can be
TOGGLE
SELECTION
DISPLAY
selected as a group.
• Partner for external
machines
• Partner for own machines
As a subgroup of All machines, you can
choose between Released by me or
Released for me.
Filter Updates the current display to these
TOGGLE
SELECTION
DISPLAY
ACTION
filter conditions based upon the entries
and selections you have made.
© Siemens AG 2008 All Rights Reserved
ePS Network Services, Function Manual (FH) - Release 12/2008
1-17
Page 18

1 Introduction 12/2008
1.3 Operating concept
Field Content Type
Select group All machines with a check mark set for
all machines or manually for individual
machines in the list can be defined as a
group.
This group will be used in all menus for
views and functions with multiple
machines.
ACTION
© Siemens AG 2008 All Rights Reserved
1-18 ePS Network Services, Function Manual (FH) - Release 12/2008
Page 19

12/2008 2 Maschine information
2.1 Machine overview
2
2 Maschine information
2.1 Machine overview
Overview
Machine events in the machine information:
The machine events of an individual machine can be viewed in the same way as
the multi-machine events (see Section 5.1 "Multi-machine views") and always refer
to the selected machine only.
Machine information
Machine overview
►
Current control software
►
Machine events
Time series (measurement series and variable monitors)
►
Maintenance
Maintenance jobs
►
Fault services
Report fault
►
Remote access
Executing remote access
►
Teleconference link
►
Using remote access
►
© Siemens AG 2008 All Rights Reserved
ePS Network Services, Function Manual (FH) - Release 12/2008
2-19
Page 20
2 Maschine information 12/2008
2.1 Machine overview
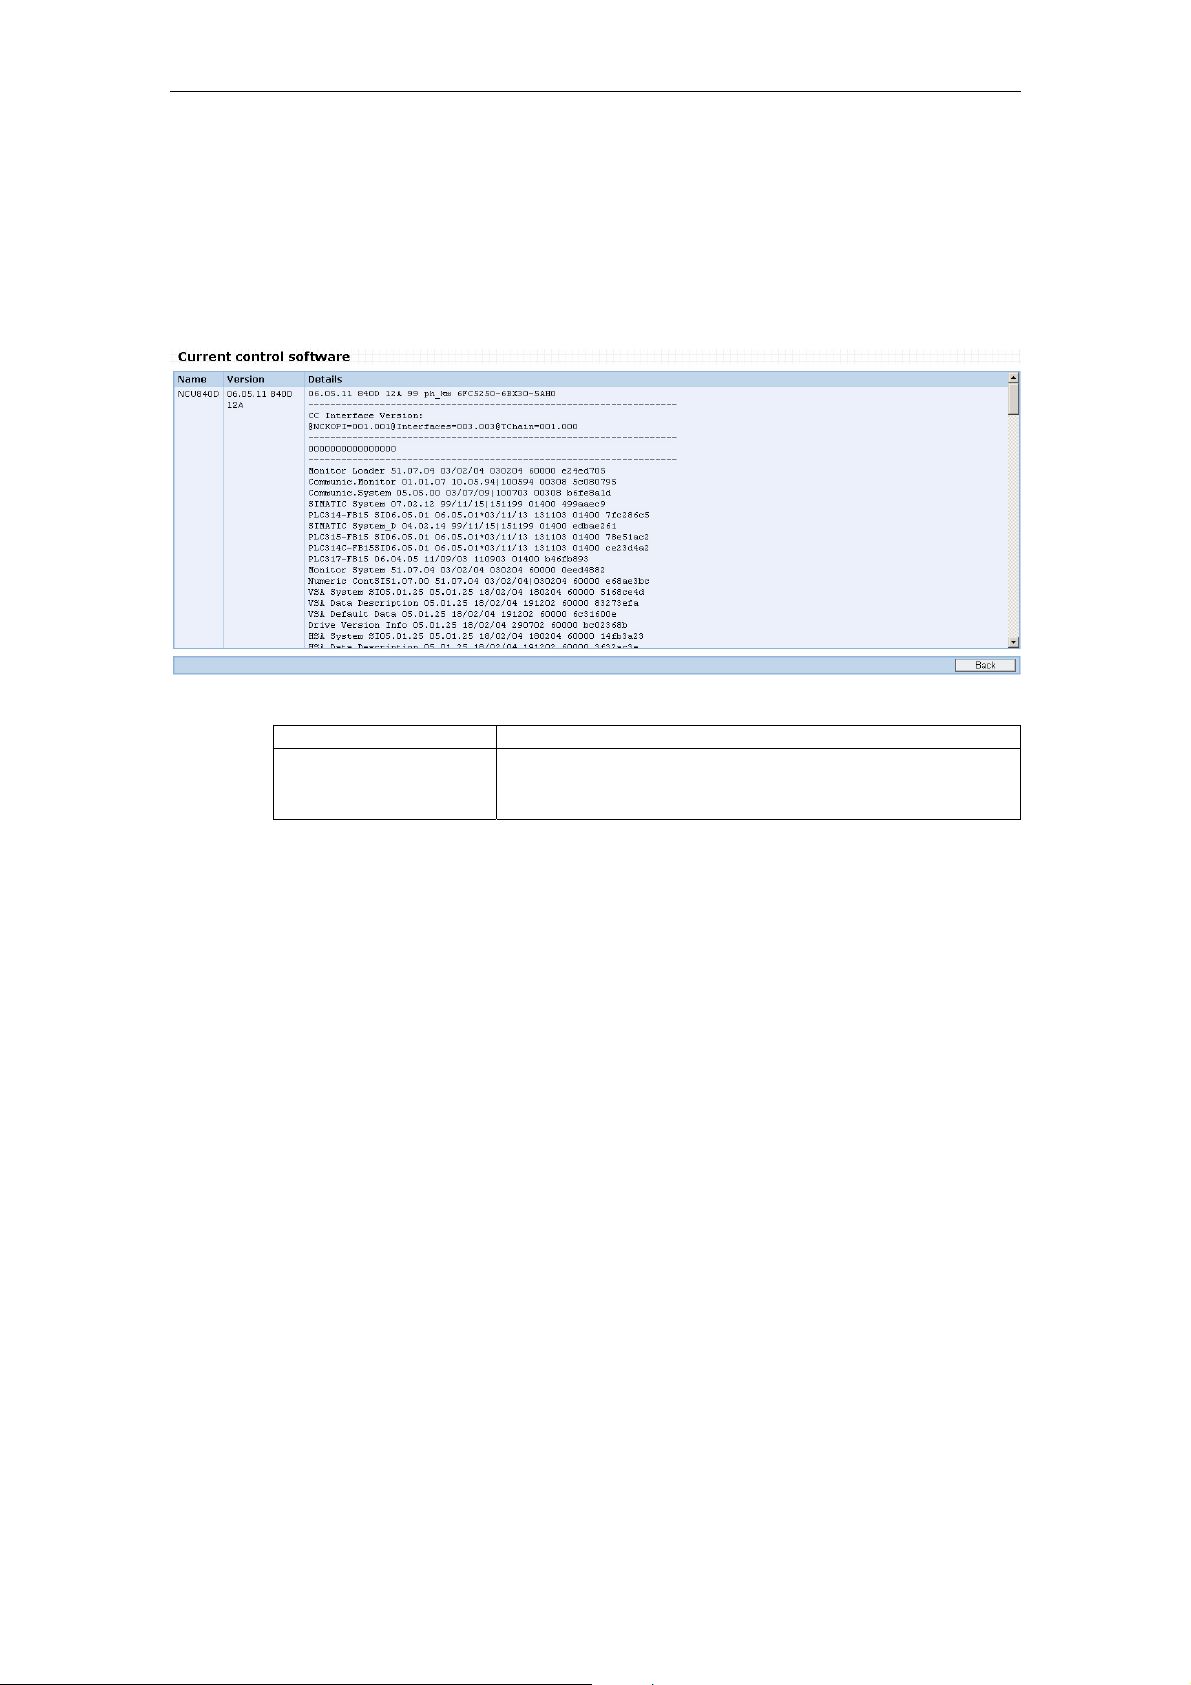
2.1.1 Current control software
Description of functions
In the Machine information area under Current Control Software, you can view all
versions of the software packages currently installed on the control
Fig. 2-1: Control software
Function Description
Current control
software
Displays the installed software version:
The display depends on the device class.
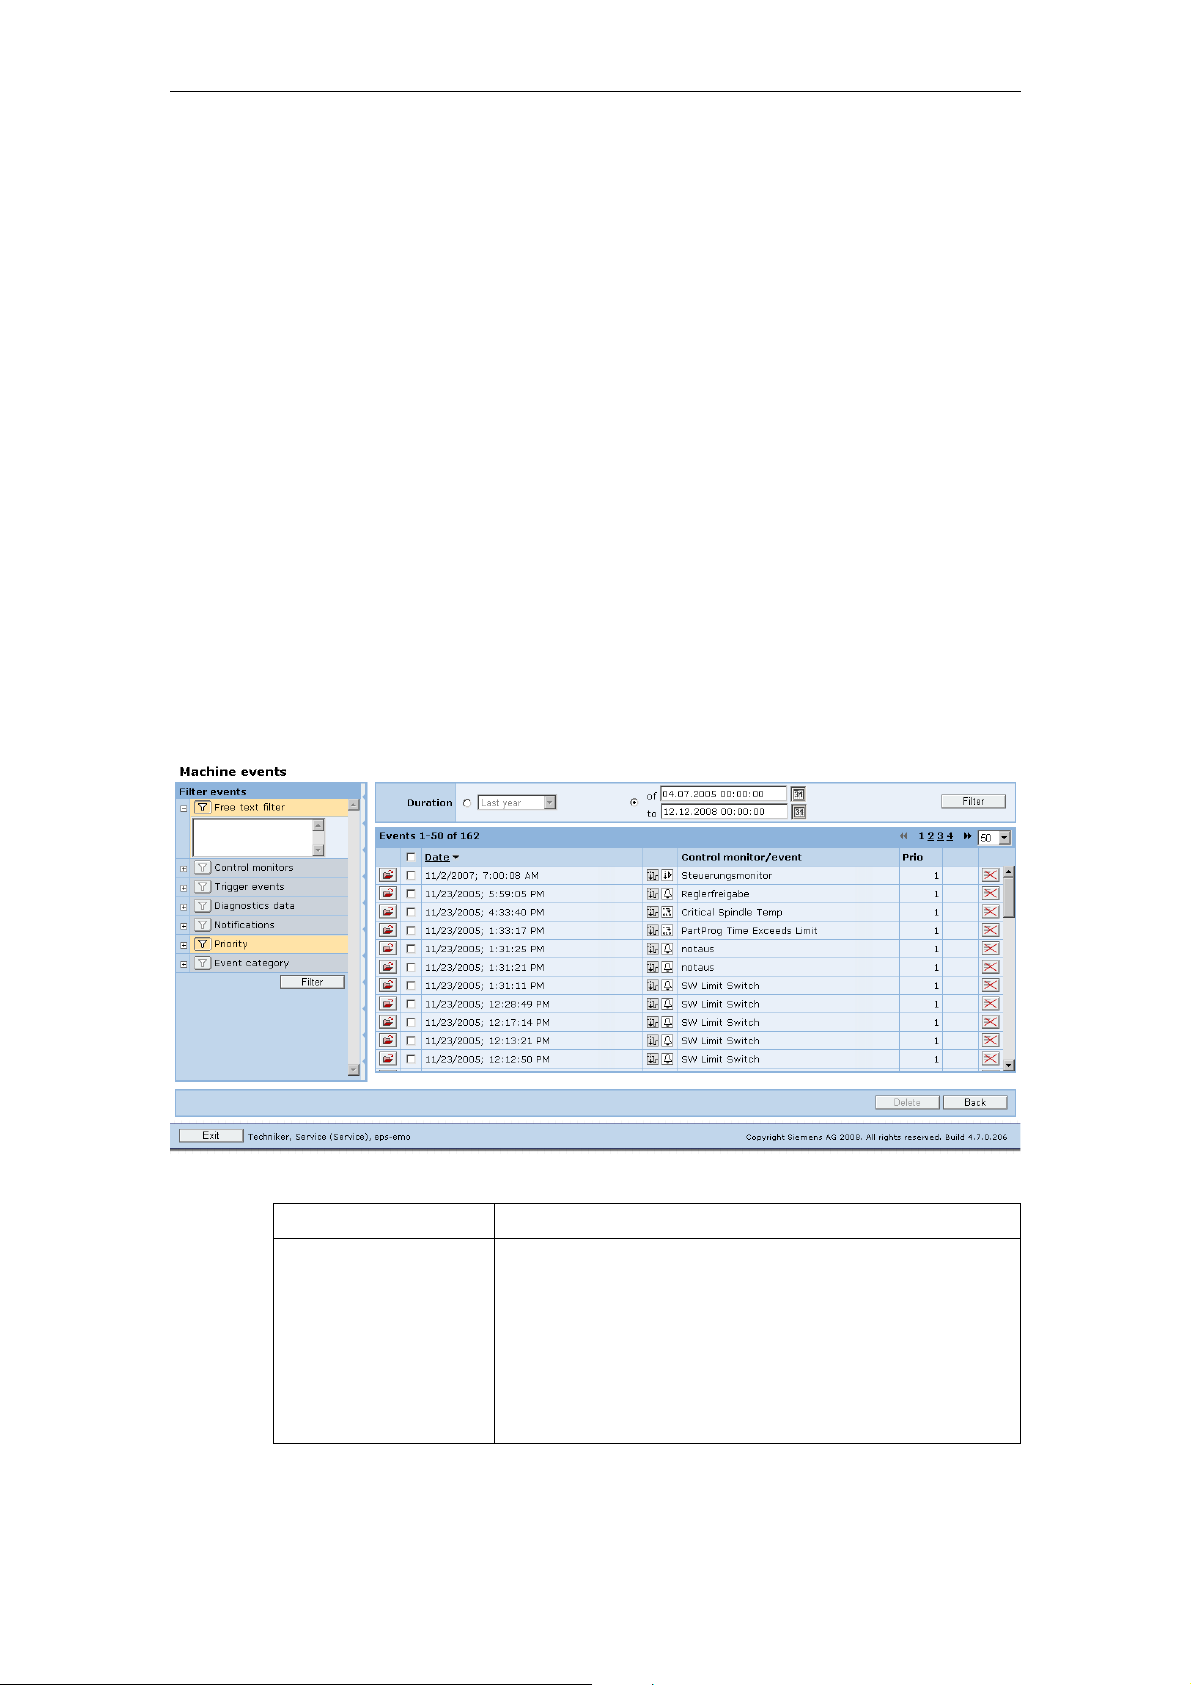
2.1.2 Machine events – List view
Description of functions
Under Machine events in the Machine information area, you can view events for
the selected machine in list format. Examples:
• Events from Control Monitor Services
- Alarm or PLC events
- Fault processing request
- Cyclic events (time trigger)
Events that have been configured by control monitors with the identification
"Without entry in the machine events" do not generate an entry, and their
details cannot be viewed either.
• Events from condition monitor services
- Exceeded interval limits of variable monitors
- Limit value violation for measurement series / test series
© Siemens AG 2008 All Rights Reserved
2-20 ePS Network Services, Function Manual (FH) - Release 12/2008
Page 21
12/2008 2 Maschine information
2.1 Machine overview
• System events
- NC/PLC archives created
- Service sessions performed
For each event, you can view additional diagnostic information or triggered
workflow services and evaluate them (in some cases graphically):
• Workflow services elements
- Transmitted notifications (SMS / e-mail)
- Generated maintenance jobs
- Service cases
• Diagnostics data
- Files
- HMI action log
- Machine data or NC status data
- PLC traces or PLC data blocks
- Variable monitors
To ascertain differences between machine data, NC status data, and data of the
HMI action log, you can compare this data with data of the same type for several
events on the same machine.
Fig. 2-2: Machine events - List view
Function Description
Time frame The following time periods are available:
• Total lifetime
• Last year
• Last six months
• Last three months
• Last month
• Last week Last day
or
© Siemens AG 2008 All Rights Reserved
ePS Network Services, Function Manual (FH) - Release 12/2008
2-21
Page 22

2 Maschine information 12/2008
2.1 Machine overview
Function Description
• User-definable period
• From date to date
Press "Filter" to activate the period setting.
Filter events You can filter events according to their properties.
Various filter criteria are available:
• Filter according to type of event (alarm, PLC, time
trigger, trigger from performance monitors, etc.)
• Filter according to type of diagnostics data (e.g. files,
PLC Traces)
• Filter according to type of triggered Workflow
Services Elements (e.g. maintenance jobs)
• Filter according to event priority
• Filter according to time periods (e.g. today, this
week, from/to)
Note:
The filter can be hidden to make it easier to evaluate the
event history at lower screen resolutions. However, the
filter settings still remain active.
Find events You can browse events using a free text search. The
search is applied to the "Designation" and "Details"
fields.
Note:
Localized alarm texts of the machine loaded into the ePS
server are also found, even if another language is
currently set on your workstation (browser).
Open event You can open the detail view of events, for example, to
view and compare diagnostics data.
Sort events You can sort events according to time stamp (date),
designation or priority.
Note:
If the list of events has already been reduced by filtering
and/or a search, the reduced list is sorted.
Delete event
Delete several events
You can delete individual events.
You can delete several events simultaneously:
• Click the check box in the "Select all" header,
followed by the "Delete" button.
• Select individual entries using the check boxes in the
line and then click the "Delete" button.
Note:
You can select events in the control monitor services to
be "not deletable" (e.g. for verification purpose). You
cannot remove these from the list!
Notice:
Diagnostics data generated with an event are also
deleted; however, triggered Workflow Services Elements
(e.g. maintenance jobs) are not deleted!
© Siemens AG 2008 All Rights Reserved
2-22 ePS Network Services, Function Manual (FH) - Release 12/2008
Page 23
12/2008 2 Maschine information
2.1 Machine overview
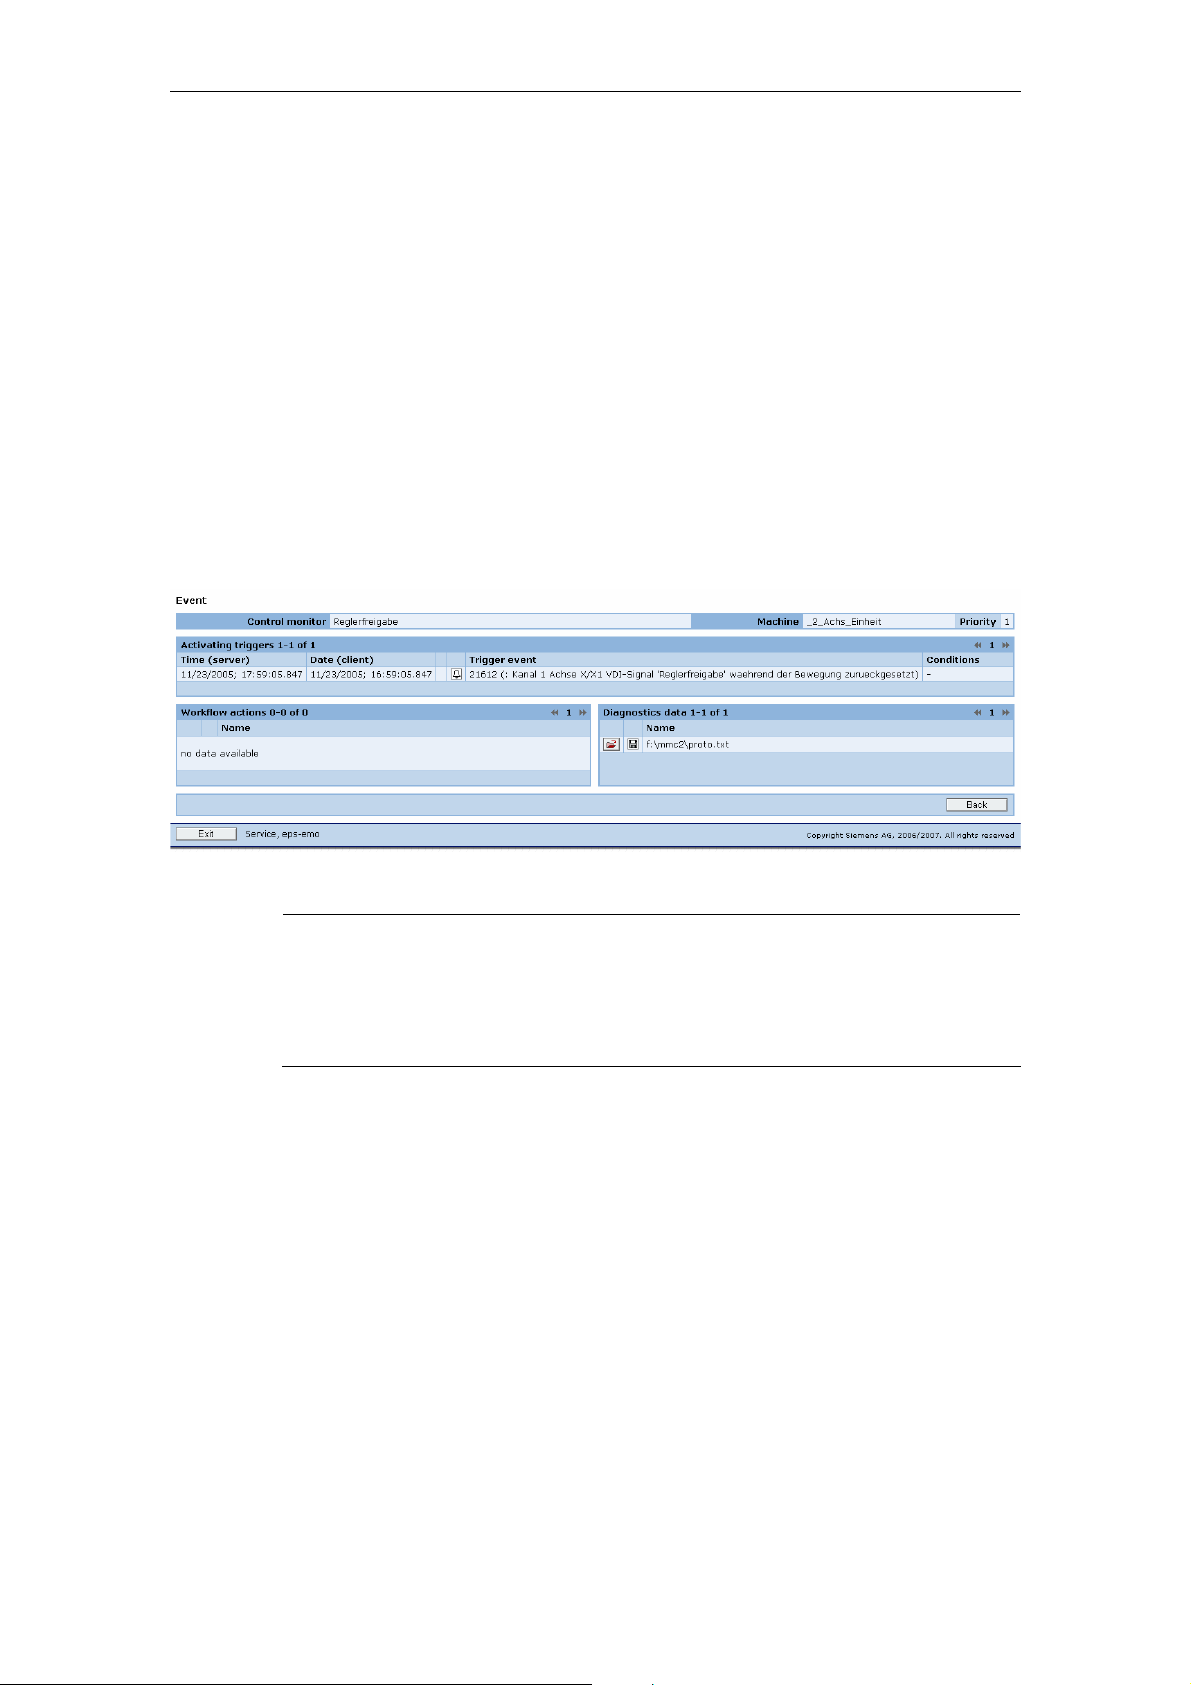
2.1.3 Machine events – Detailed view
Description of functions
In the detailed view of an event you can view detailed information about a trigger
event and the diagnostics data and triggered workflow service elements it
generates.
The detailed view of an event is divided into three areas:
• Trigger
• Workflow actions: Opening displayed actions
(maintenance job, notification)
• Diagnostics data: Opening displayed actions
The visualization is performed analogous to the configuration of a control monitor
except for the restricted editing functions.
Fig. 2-3: Machine events - Detailed view
Note
The detailed information displayed for a particular event depends on the event
type. The timestamp is displayed for all event types.
The time stamp is based on the time set on the machine, in order to achieve a
true-to-life time-based payment for the event.
© Siemens AG 2008 All Rights Reserved
ePS Network Services, Function Manual (FH) - Release 12/2008
2-23
Page 24
2 Maschine information 12/2008
2.1 Machine overview
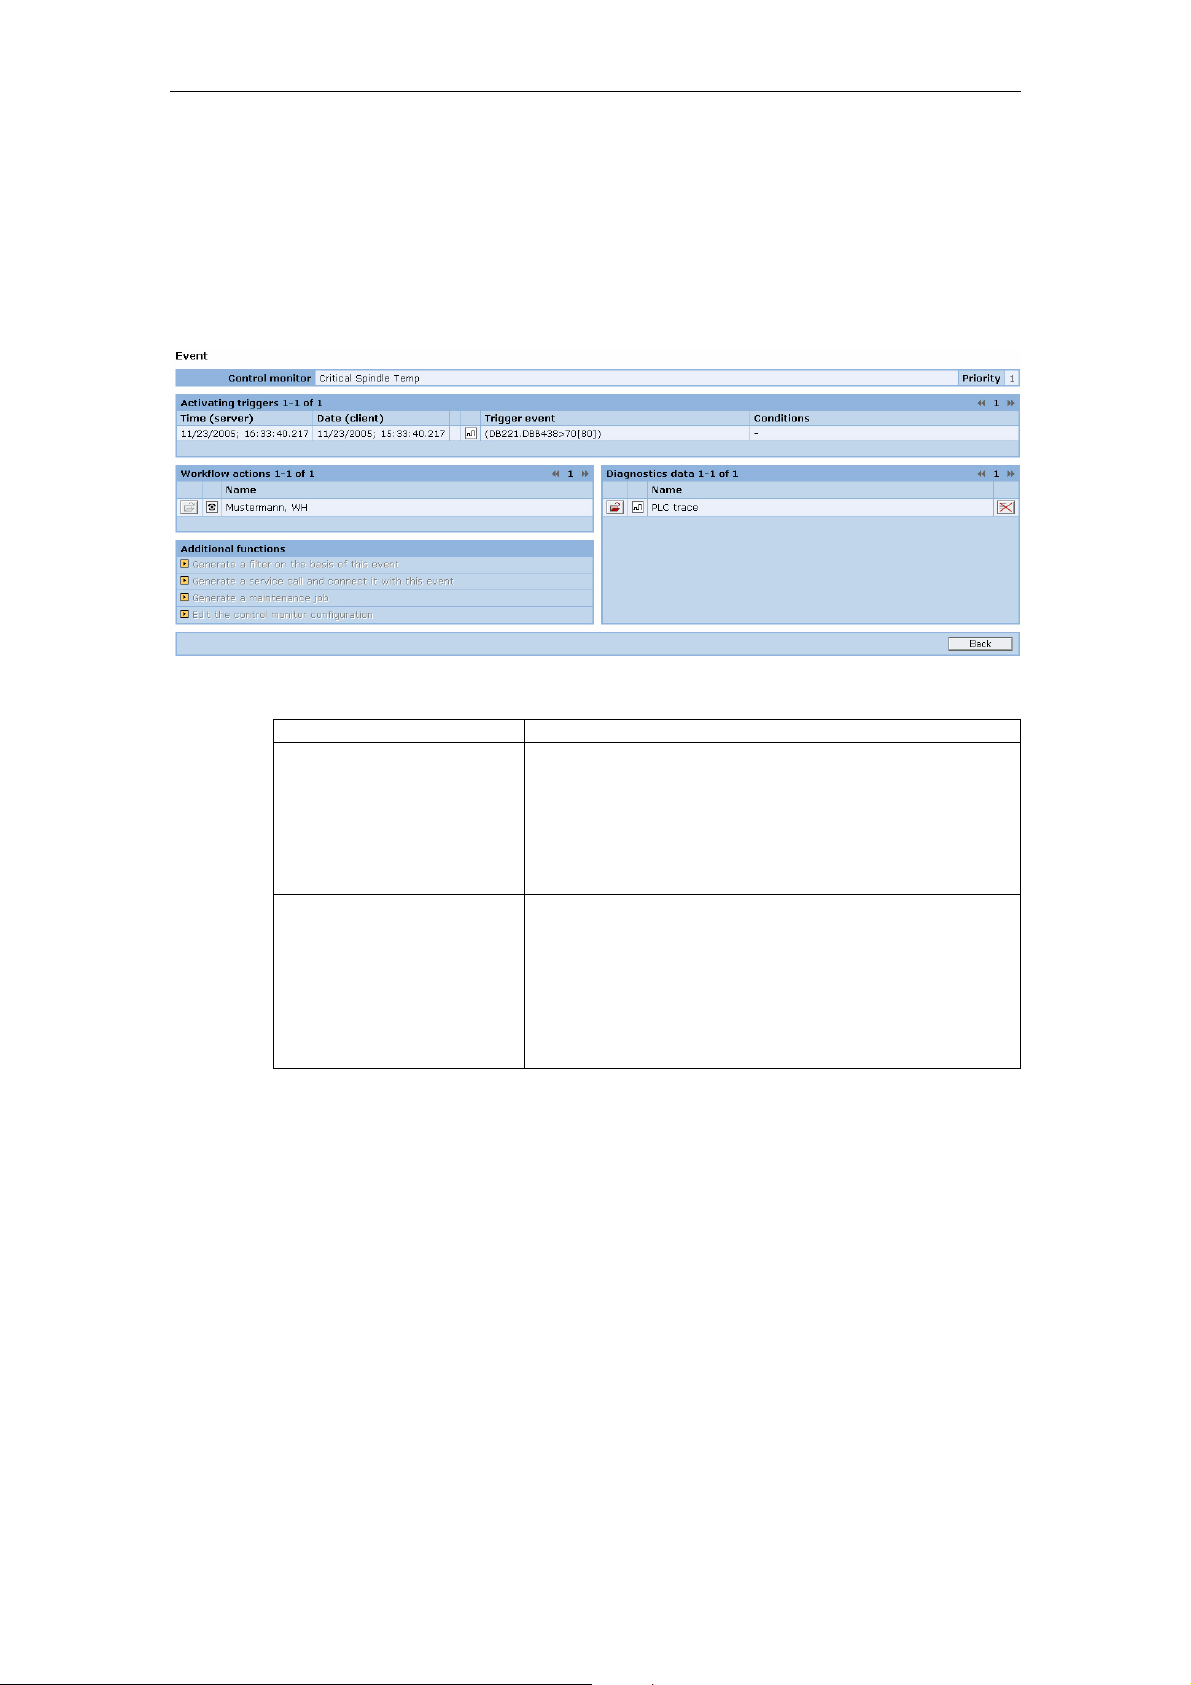
2.1.4 Evaluation of workflow actions
Description of functions
To view notifications, you can jump directly from the evaluation of one diagnostics
data item to another, if it belongs to the same event.
Fig. 2-4: Display of completed workflow actions
Function Description
View workflow element You can view workflow elements in detail. The
workflow element will open, but it will not be possible
to edit it (e.g. maintenance job).
Note:
Notifications and maintenance jobs cannot be edited.
Delete workflow element You cannot delete workflow elements retroactively
from events that have already occurred, since these
show the documentation history.
Note:
Notifications, maintenance jobs and service cases
cannot be deleted.
© Siemens AG 2008 All Rights Reserved
2-24 ePS Network Services, Function Manual (FH) - Release 12/2008
Page 25
12/2008 2 Maschine information
2.1 Machine overview
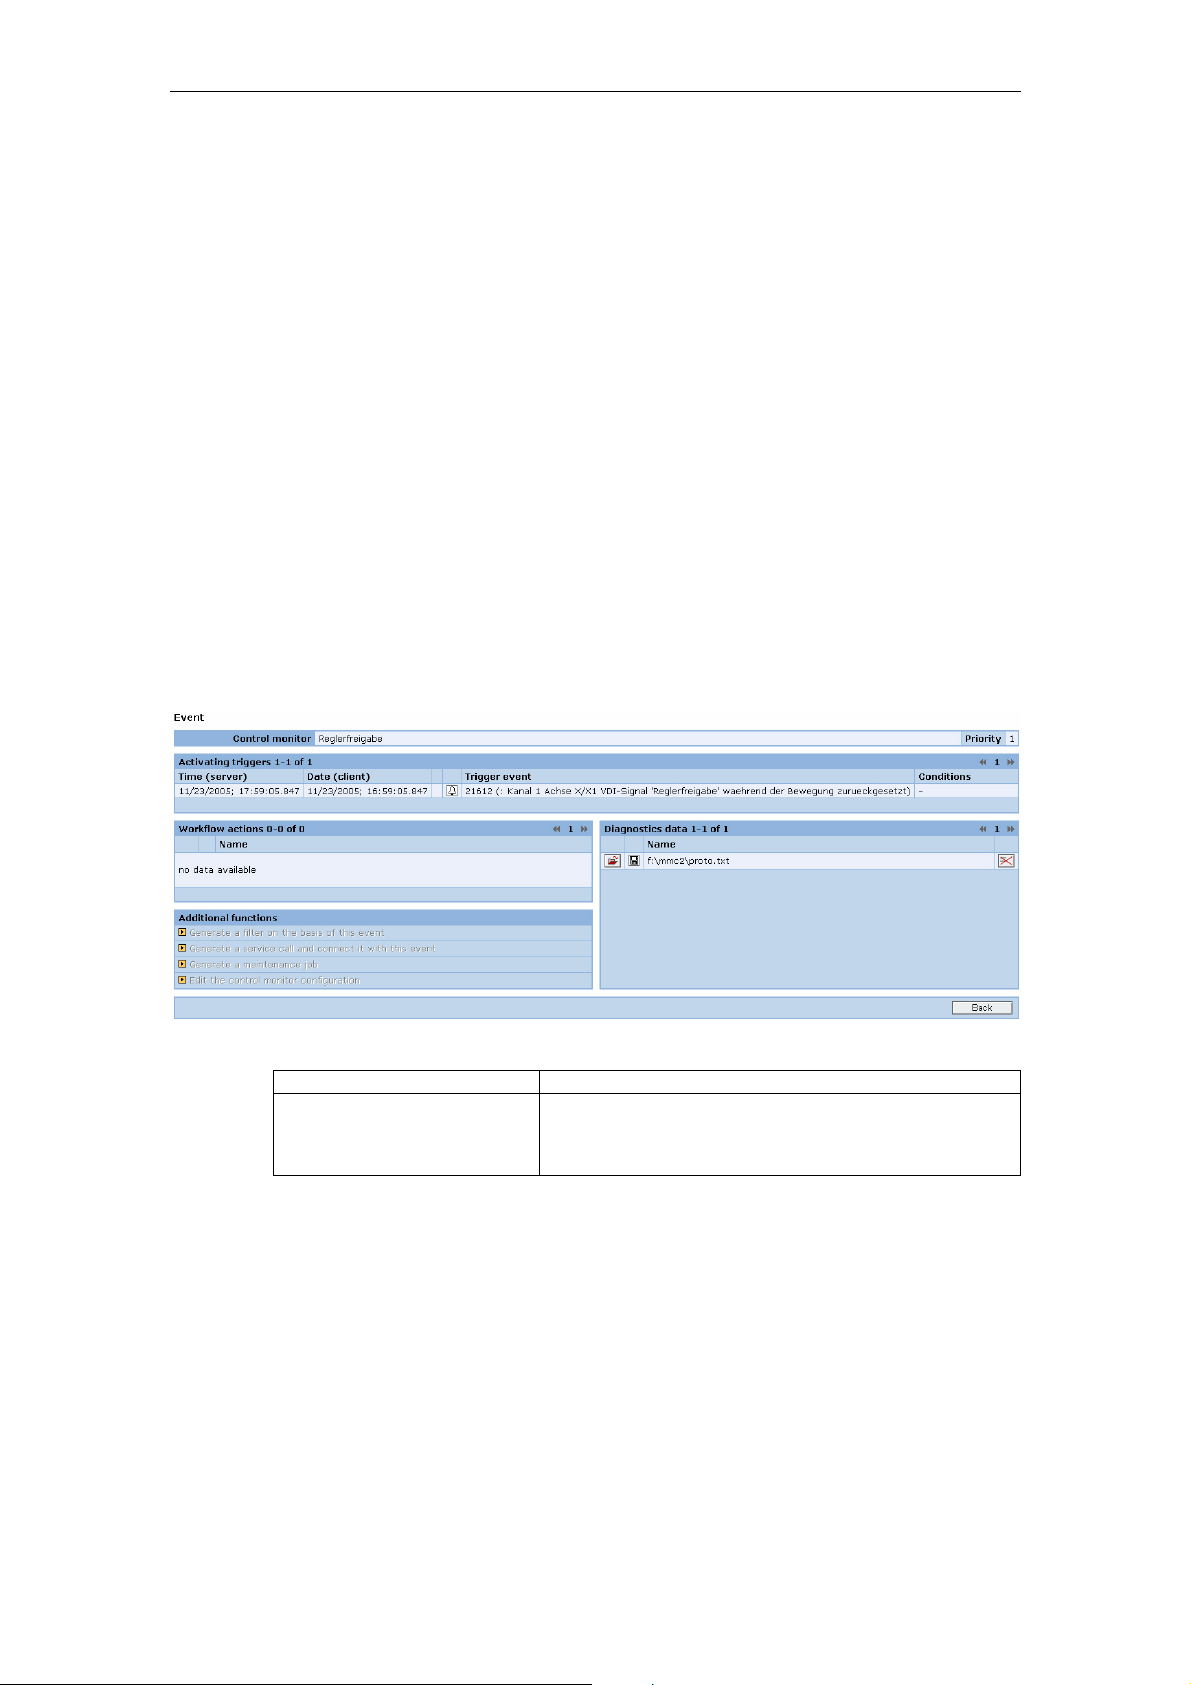
2.1.5 Evaluation of diagnostics data
Description of functions
ePS Network Services offers evaluation tools for data acquired from the actions.
These are either a text viewer (e.g. for machine data) or contain graphic views (e.g.
PLC trace). A comparison tool is available for the machine data, NC status data,
and HMI action log data types of diagnostics data. You can switch directly between
different diagnostics data records of an event.
The following evaluation tools are available for the various diagnostics data:
• Viewing file lists
• Viewing HMI action log
• Viewing machine data
• Viewing NC status data
• Viewing PLC trace (The view can be configured and offers evaluation
functions.)
• Viewing PLC data block/list
• Visualize variable monitors
Fig. 2-5: Display of recorded diagnostics data
Function Description
Diagnostics data You can switch directly from viewing data for one
action to viewing data for another, provided that it
belongs to the same machine event.
© Siemens AG 2008 All Rights Reserved
ePS Network Services, Function Manual (FH) - Release 12/2008
2-25
Page 26
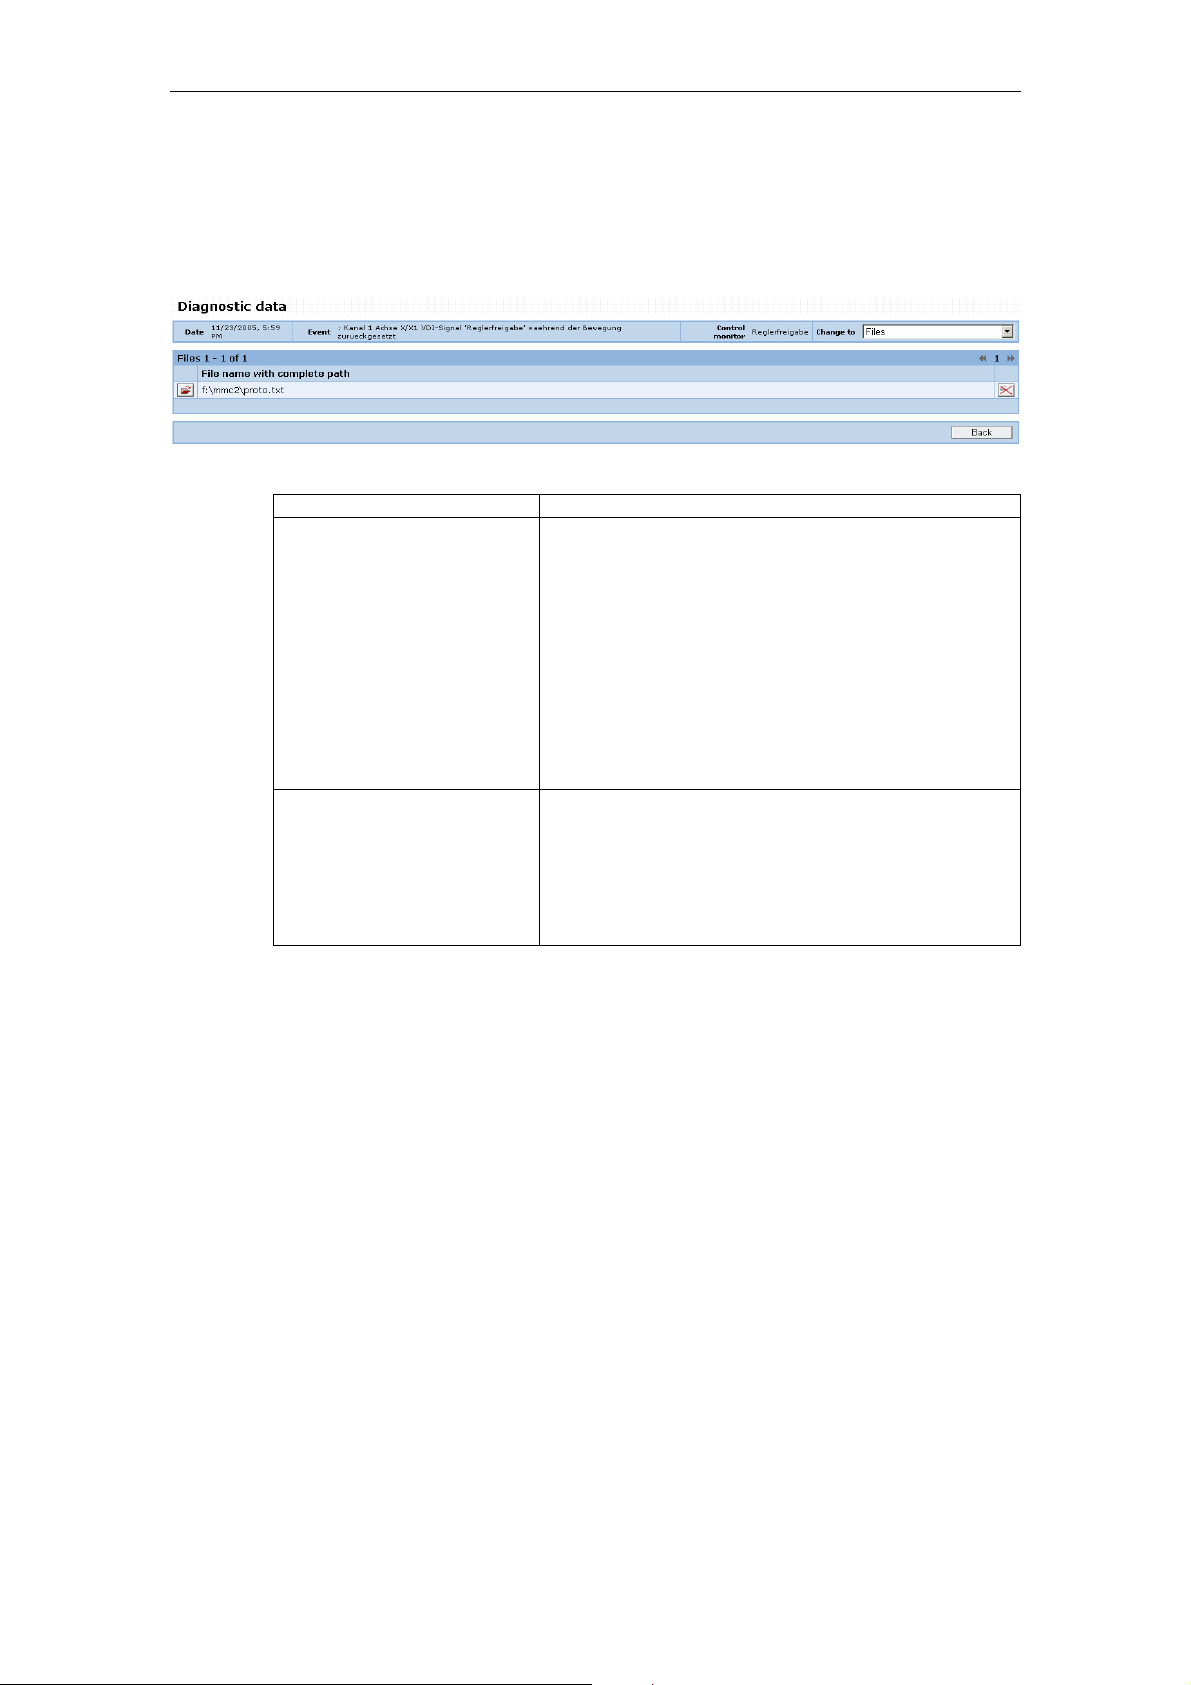
2 Maschine information 12/2008
2.1 Machine overview
File list
The files uploaded from the control with a particular event can be displayed in the
Browser or in another application, or stored on a data carrier.
Fig. 2-6: List of uploaded files
Function Description
Display/save file You can open a file in either a separate browser
window or another application. Alternatively, you
can save the file to a data carrier.
Note:
The type of display depends on the data type and
the applications installed on your system. Pure text
or HTML documents are displayed in a separate
browser window. Applications registered in the
operating system are usually opened directly. You
must save any files with unregistered data types
and open them manually with your application.
FileDelete You cannot delete individual files from machine
events; it is only possible to delete the entire event
entry.
Note:
Deleting individual details from an event constitutes
illegal manipulation of the archived document.
© Siemens AG 2008 All Rights Reserved
2-26 ePS Network Services, Function Manual (FH) - Release 12/2008
Page 27
12/2008 2 Maschine information
2.1 Machine overview
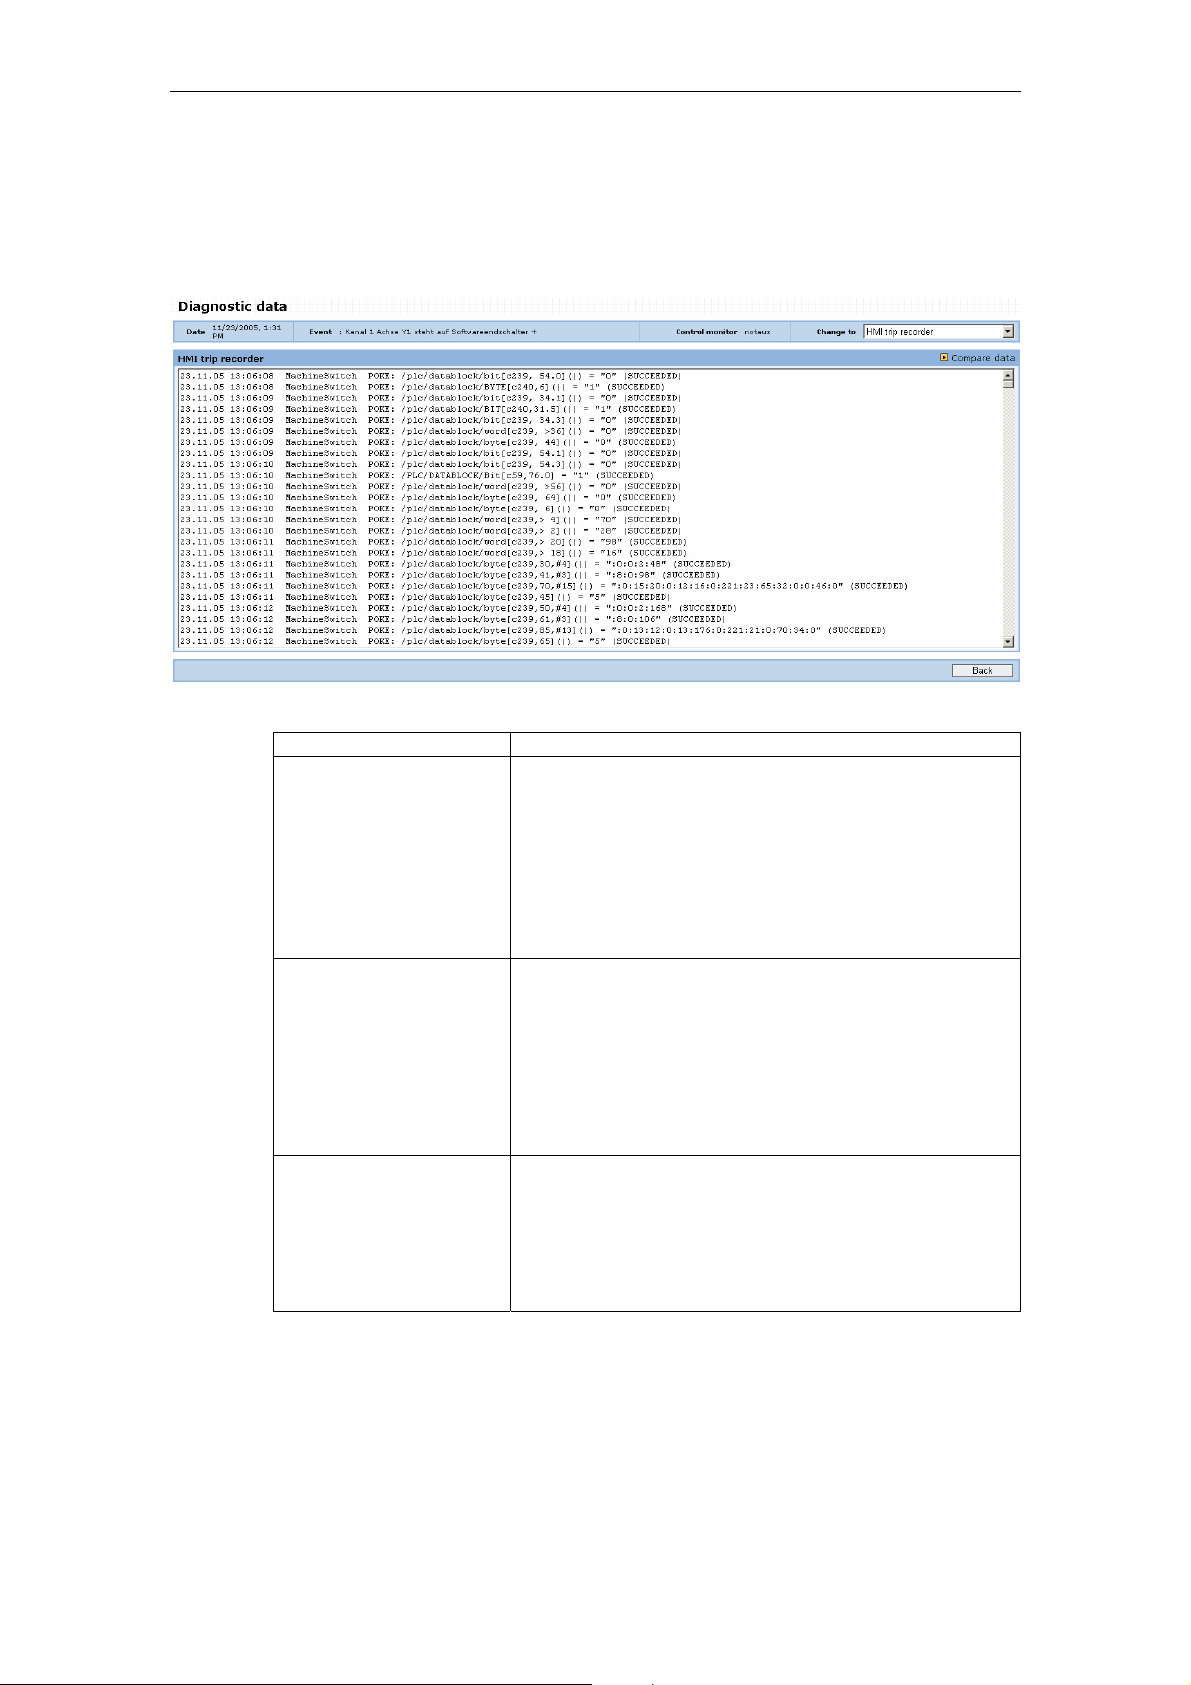
HMI action log
An HMI action log uploaded with an event can be displayed in the browser and
compared with other HMI action logs.
Fig. 2-7: HMI action log display
Function Description
Display the HMI action
log
Compare HMI action
logs
Delete HMI action log You cannot delete individual HMI action log files from
You can display and evaluate the content of an HMI
action log in a text window.
Note:
The content of the HMI action log is defined via local
settings on the control (see Section 3.4 "Global
settings"). The time stamp of the recorded information
is generated from the PLC clock at the time of its
occurrence.
You can compare the HMI action log currently selected
with another. For this purpose, the system provides a
list of all the HMI action logs available for the currently
selected machine.
The HMI action logs are displayed in two horizontally
adjacent windows and can be compared with each
other. The event is displayed for each HMI action log,
together with the event details and time stamp.
machine events; it is only possible to delete the entire
event entry.
Note:
Deleting individual details from an event constitutes
illegal manipulation of the archived document.
© Siemens AG 2008 All Rights Reserved
ePS Network Services, Function Manual (FH) - Release 12/2008
2-27
Page 28
2 Maschine information 12/2008
2.1 Machine overview
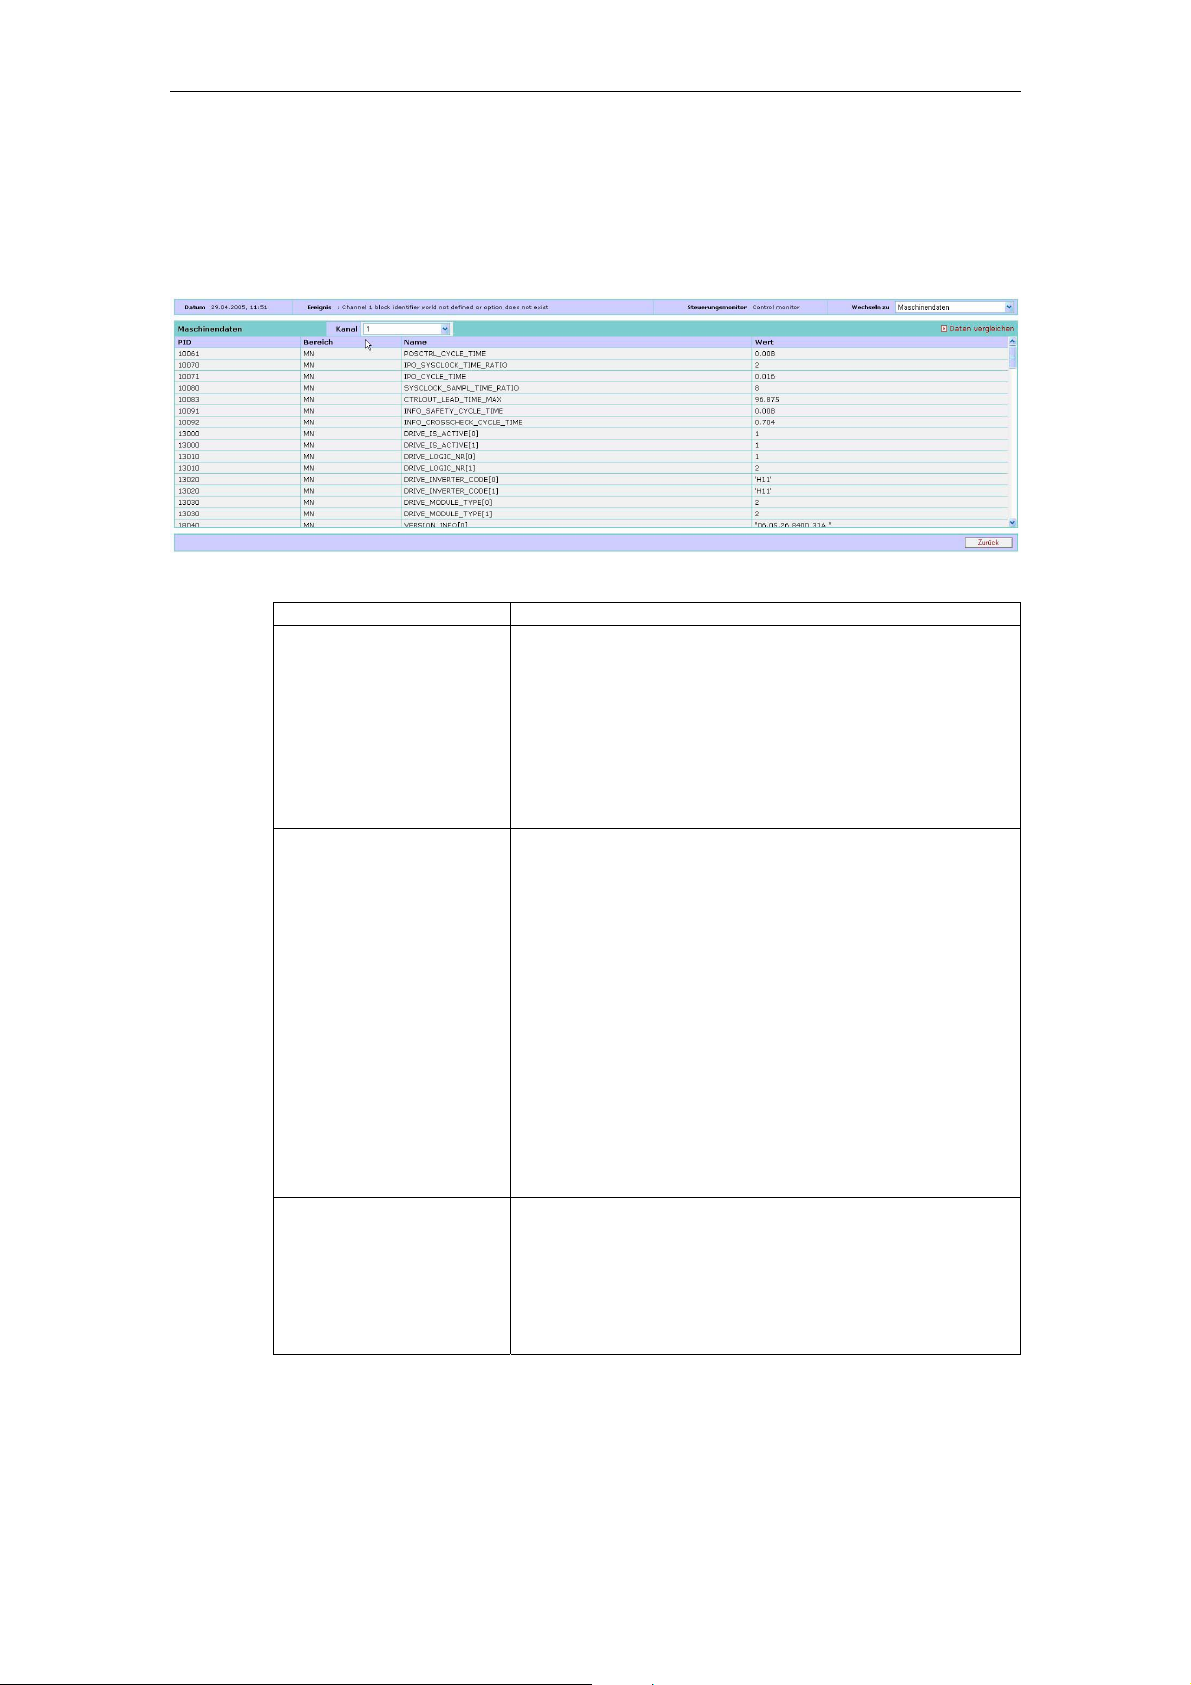
Machine data
Machine data uploaded with an event can be displayed in the browser and
compared with other machine data.
Fig. 2-8: Machine data display
Function Description
Machine dataDisplay You can display and evaluate the content of the
machine data in a table. You can select which channel
you want to view machine data for.
Note:
Machine data without a channel reference is displayed
in the first channel. The machine data generated with
control monitor services does not include any drive
machine data.
Compare machine data You can compare the machine data record currently
selected with another. The system offers you a list of
all available machine data records of the currently
selected machine. The machine data values are
displayed side by side for each machine data item. Any
machine data items with different values in the original
data record and the data record you are comparing
with is highlighted. The event is displayed for each
machine data record, together with the event details
and time stamp.
It is only possible to display differences. The system
then hides all machine data with identical values in the
original data record and data record being compared.
Note:
Drive machine data is not compared.
Delete machine data You cannot delete individual machine data record files
from machine events; it is only possible to delete the
entire event entry.
Note:
Deleting individual details from an event constitutes
illegal manipulation of the archived document.
© Siemens AG 2008 All Rights Reserved
2-28 ePS Network Services, Function Manual (FH) - Release 12/2008
Page 29
12/2008 2 Maschine information
2.1 Machine overview
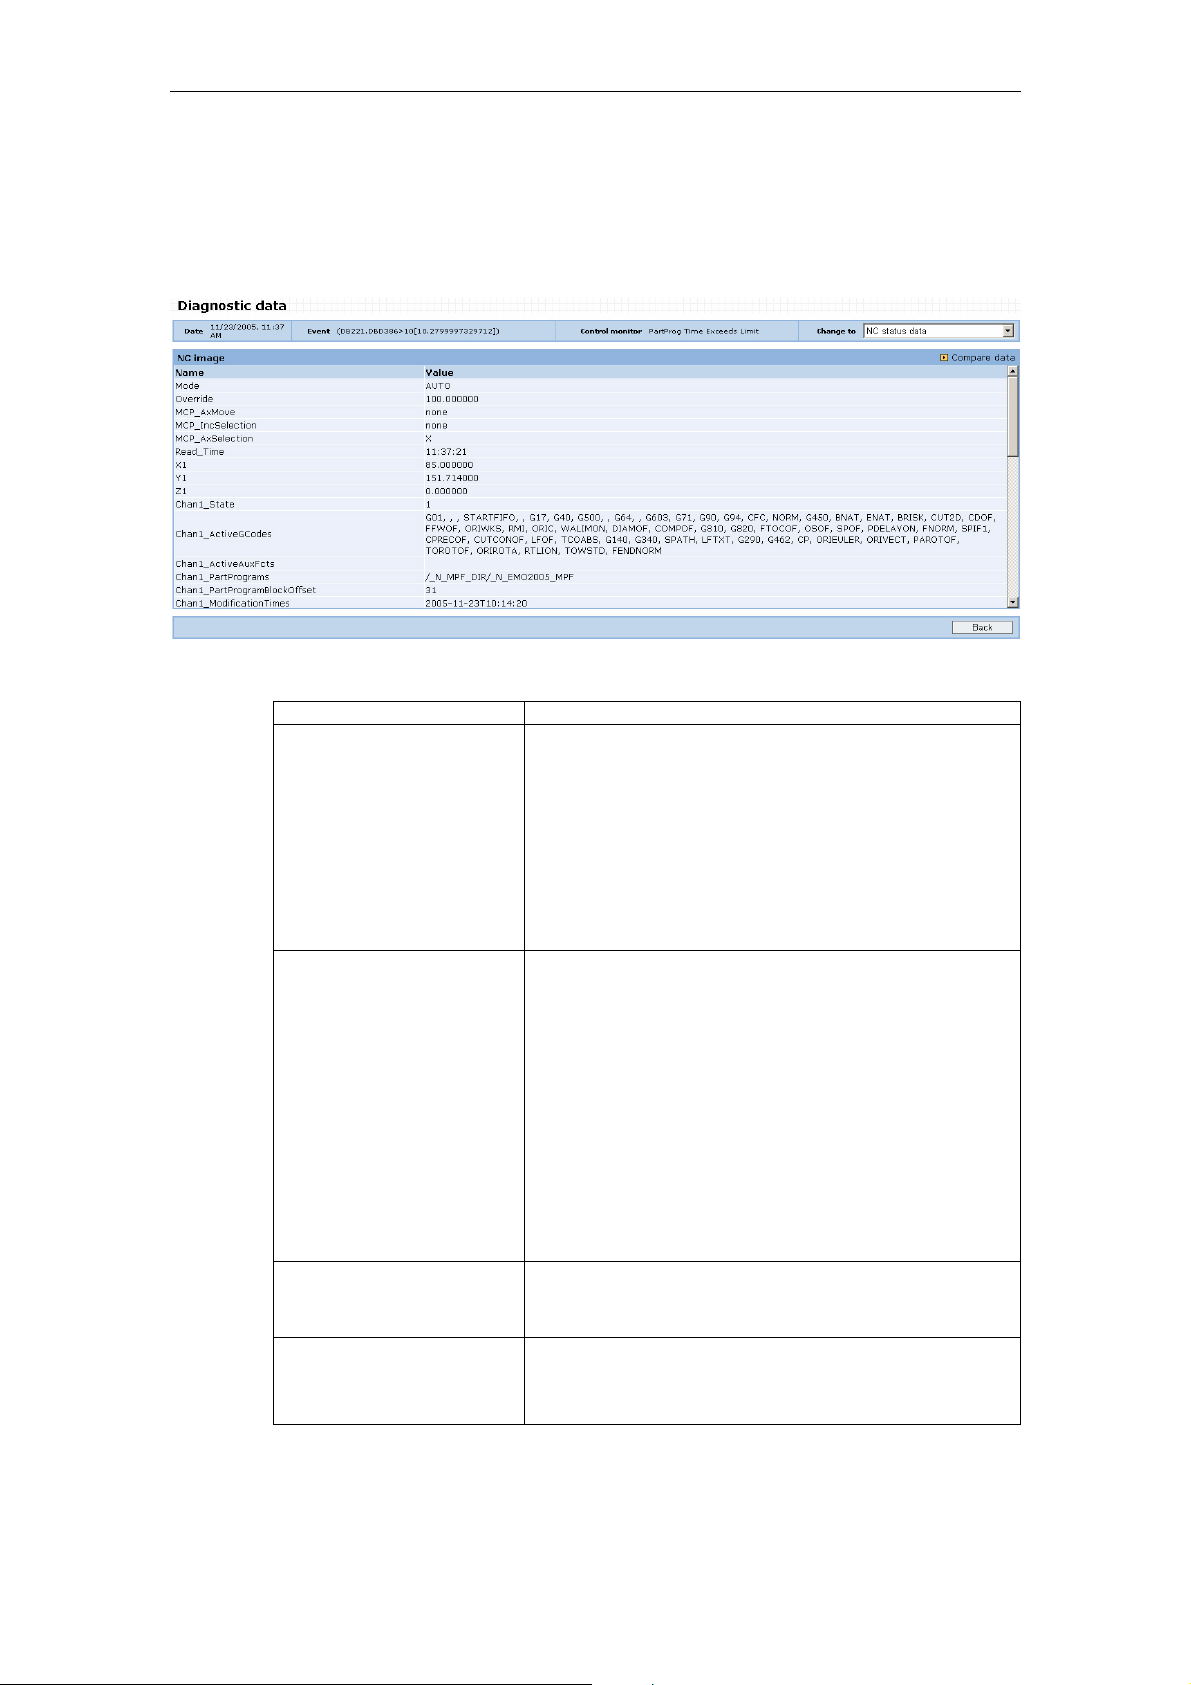
NC status data
NC status data uploaded with an event can be displayed in the browser and
compared with other NC status data.
Fig. 2-9: NC status data display
Function Description
Display NC status data You can display and evaluate the content of the NC
status data in a table and evaluate it.
Notice:
The NC status data reproduces the status of the
relevant NC variables after an event occurs. For
some events (e.g. RESET alarms) there is a danger
of misinterpretation as the event itself influences the
variable value (example: pointer to current block is
reset by alarm).
Compare NC status data You can compare the NC status data record currently
selected with another data record. The system offers
you a list of all available NC status data records of
the currently selected machine. The values of the NC
status data records are listed next to each other by
variable for comparison purposes. Any variable with
different values in the original data record and the
data record you are comparing is highlighted. The
event is displayed for each NC status data record,
together with the event details and time stamp.
It is only possible to display differences. The system
then hides all variables with identical values in the
original data record and data record being compared.
Delete NC status data You cannot delete individual NC status data items
from machine events; it is only possible to delete the
entire event entry.
Note:
Deleting individual details from an event constitutes
illegal manipulation of the archived document.
© Siemens AG 2008 All Rights Reserved
ePS Network Services, Function Manual (FH) - Release 12/2008
2-29
Page 30
2 Maschine information 12/2008
2.1 Machine overview
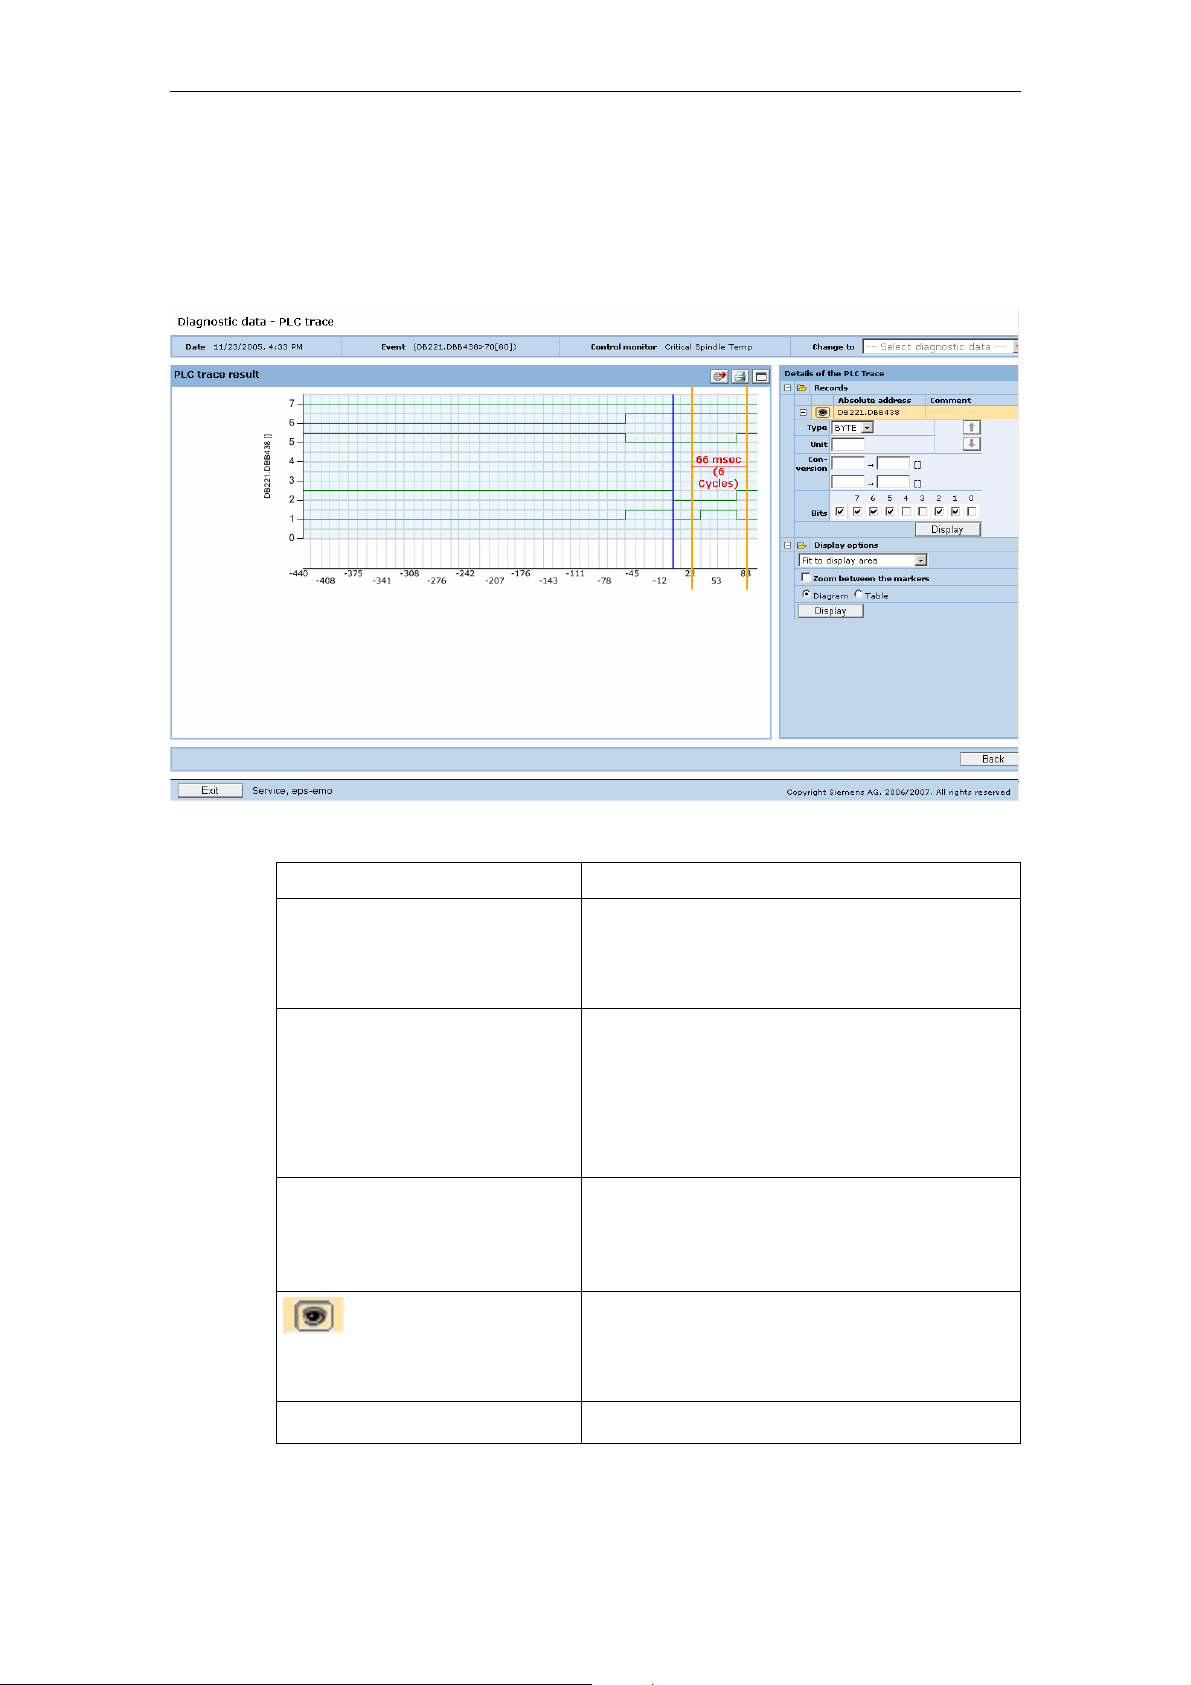
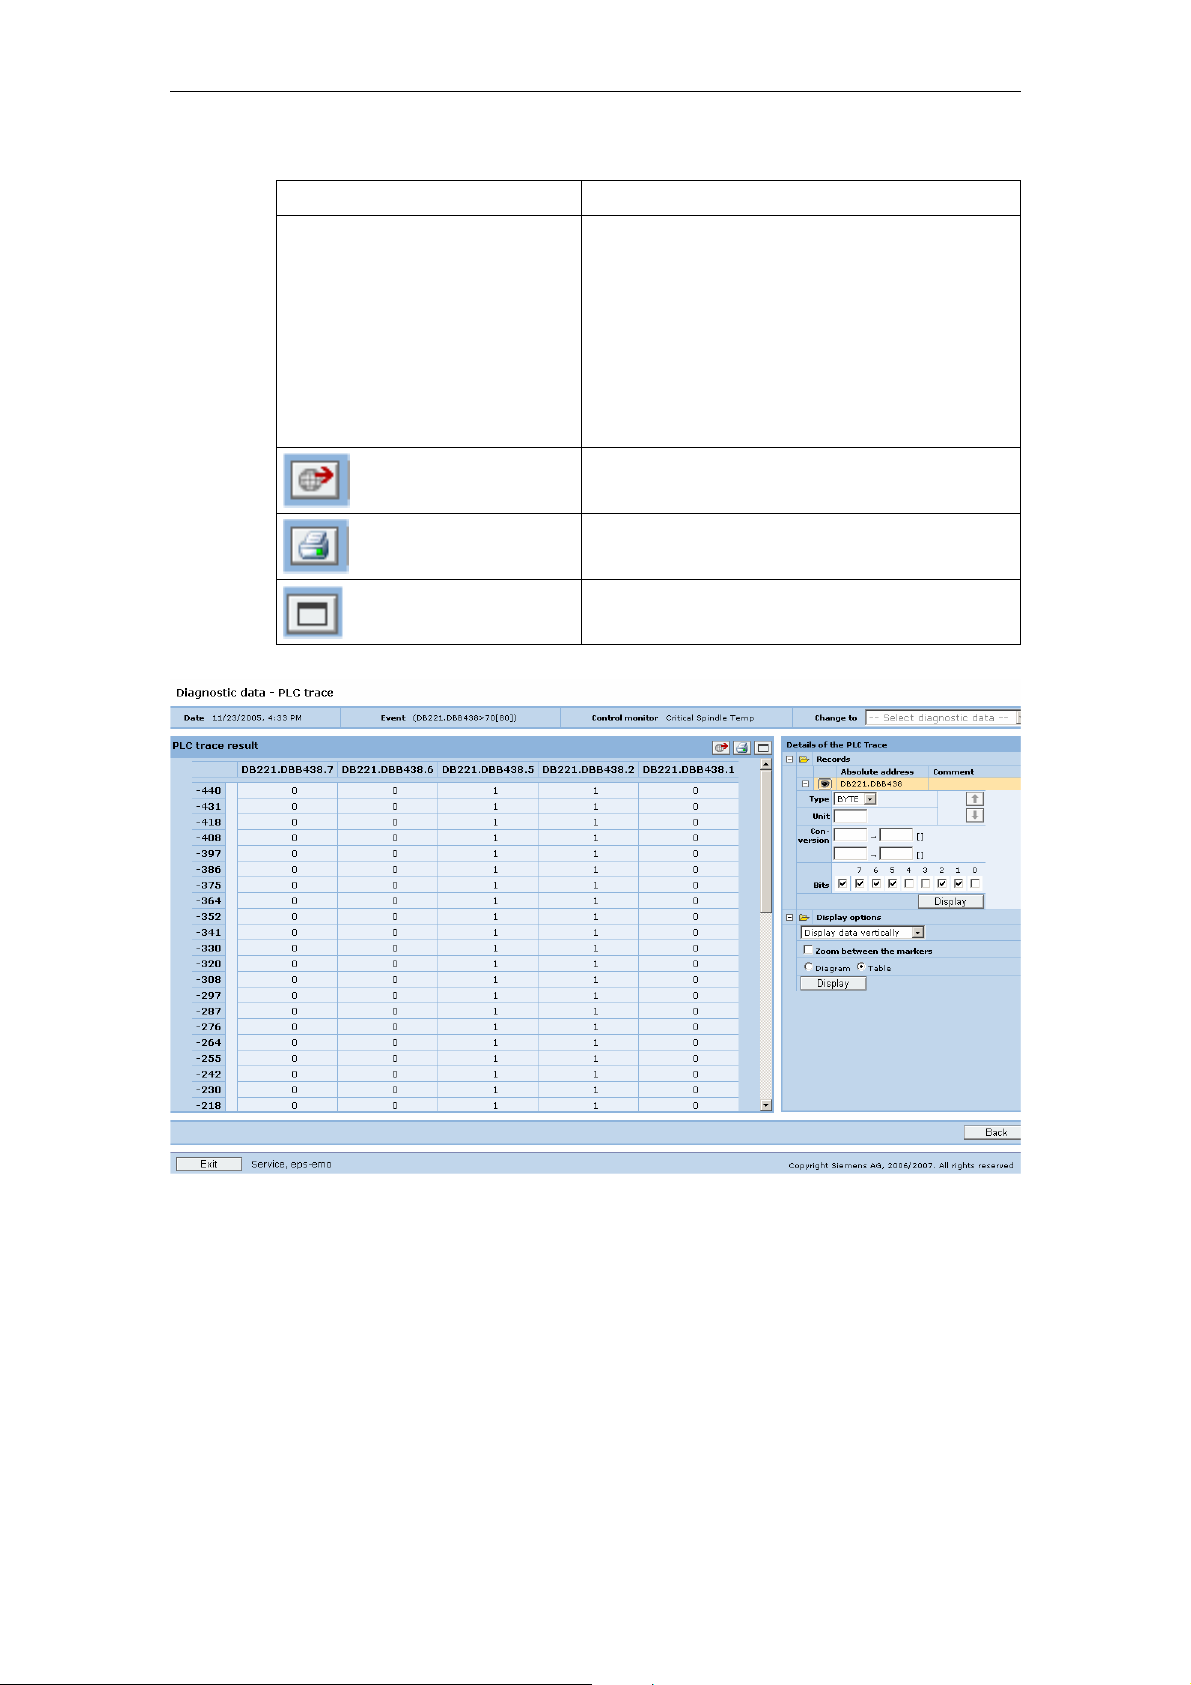
PLC trace
PLC trace data created with an event can be displayed in the browser and
evaluated with graphical tools. Signal curves can be checked by displaying variable
values in the graphical display, setting markers, and zooming.
Fig. 2-10: PLC trace display as diagram
Function Description
Change to As this menu is a detail of the machine events,
Display The PLC trace is displayed for all configured
+ /− Opening and closing of the details for:
PLC trace:
Showing/hiding
variables
and several details may exist for the event, you
can quickly change to other existing diagnostics
data of the event via a menu.
variables in the specified format.
The signal triggering the recording is displayed
and selected as 0 cycle / 0 time.
Display updates the display with the predefined
details for the PLC trace.
• Recordings
• Display options
• Variables
Showing/hiding the graph of the variable in the
display: For a clearer view, variables can be
hidden in the display in order that individual
variable configurations can be viewed.
Type Format of the variables.
© Siemens AG 2008 All Rights Reserved
2-30 ePS Network Services, Function Manual (FH) - Release 12/2008
Page 31

12/2008 2 Maschine information
2.1 Machine overview
Function Description
Unit Dimension of evaluated variable values
(e.g. °C).
Conversion
of display scaling
Evaluation of variable values for the dimension
adjustment, linearly through two defined value
assignments.
The variables can be scaled linearly via two
defined points for the display (e.g. byte value 16
corresponds to 20 °C, byte value 128
corresponds to 90 °C).
Bits Display of a variable in byte format; not as a
value, but individually as a binary signal for
each selected bit. Variables configured as byte
can also be displayed as individual bits (BOOL).
If not all of the individual bits are required in the
view, they can be specifically selected for the
display.
Variable display:
Changing the
sequence
The sequence of the variables can be changed
so that they can be compared directly next to
each other.
PLC trace: Time/cycles display The horizontal axis is always displayed with a
millisecond specification for each cycle. This
can be changed to the cycle number, each
calculated with the starting point 0 from the
trigger.
Display options PLC trace diagrams can be displayed in a
default setting that can be evaluated on every
monitor.
A complete recording can be displayed in a
compressed format, by means of a zoom
setting in a single view. However, this may
result in a loss of information. Every detail is
displayed in an optimized compressed display,
but in the smallest possible view. The minimum
level of precision that can be set for the graph
view is the pixel level, but marking should allow
a cycle level of precision to be set dynamically.
Diagram/table A graphical or tabular display of the variable
values can be selected.
PLC trace: Data display
Horizontal/vertical
The display of the data table can be changed
from a horizontal (time/cycle axis) to a vertical
(variable axis) view.
© Siemens AG 2008 All Rights Reserved
ePS Network Services, Function Manual (FH) - Release 12/2008
2-31
Page 32
2 Maschine information 12/2008
2.1 Machine overview
Function Description
PLC trace: Markings Markings can be set in the PLC trace display
that are used for the difference calculation and
display of the current values.
The markings are retained when using the
zoom function. Depending on the resolution,
they can be positioned on a cycle-specific
basis; the minimum level of precision that can
be set is the pixel level, where all cycles appear
between the markings.
PLC trace: Data
export
PLC trace: Printing
data
PLC trace:
representation
The PLC trace data can be exported as a file
for further processing.
The PLC trace data can be printed on an
installed printer.
The window for the PLC trace display can be
maximized/minimized.
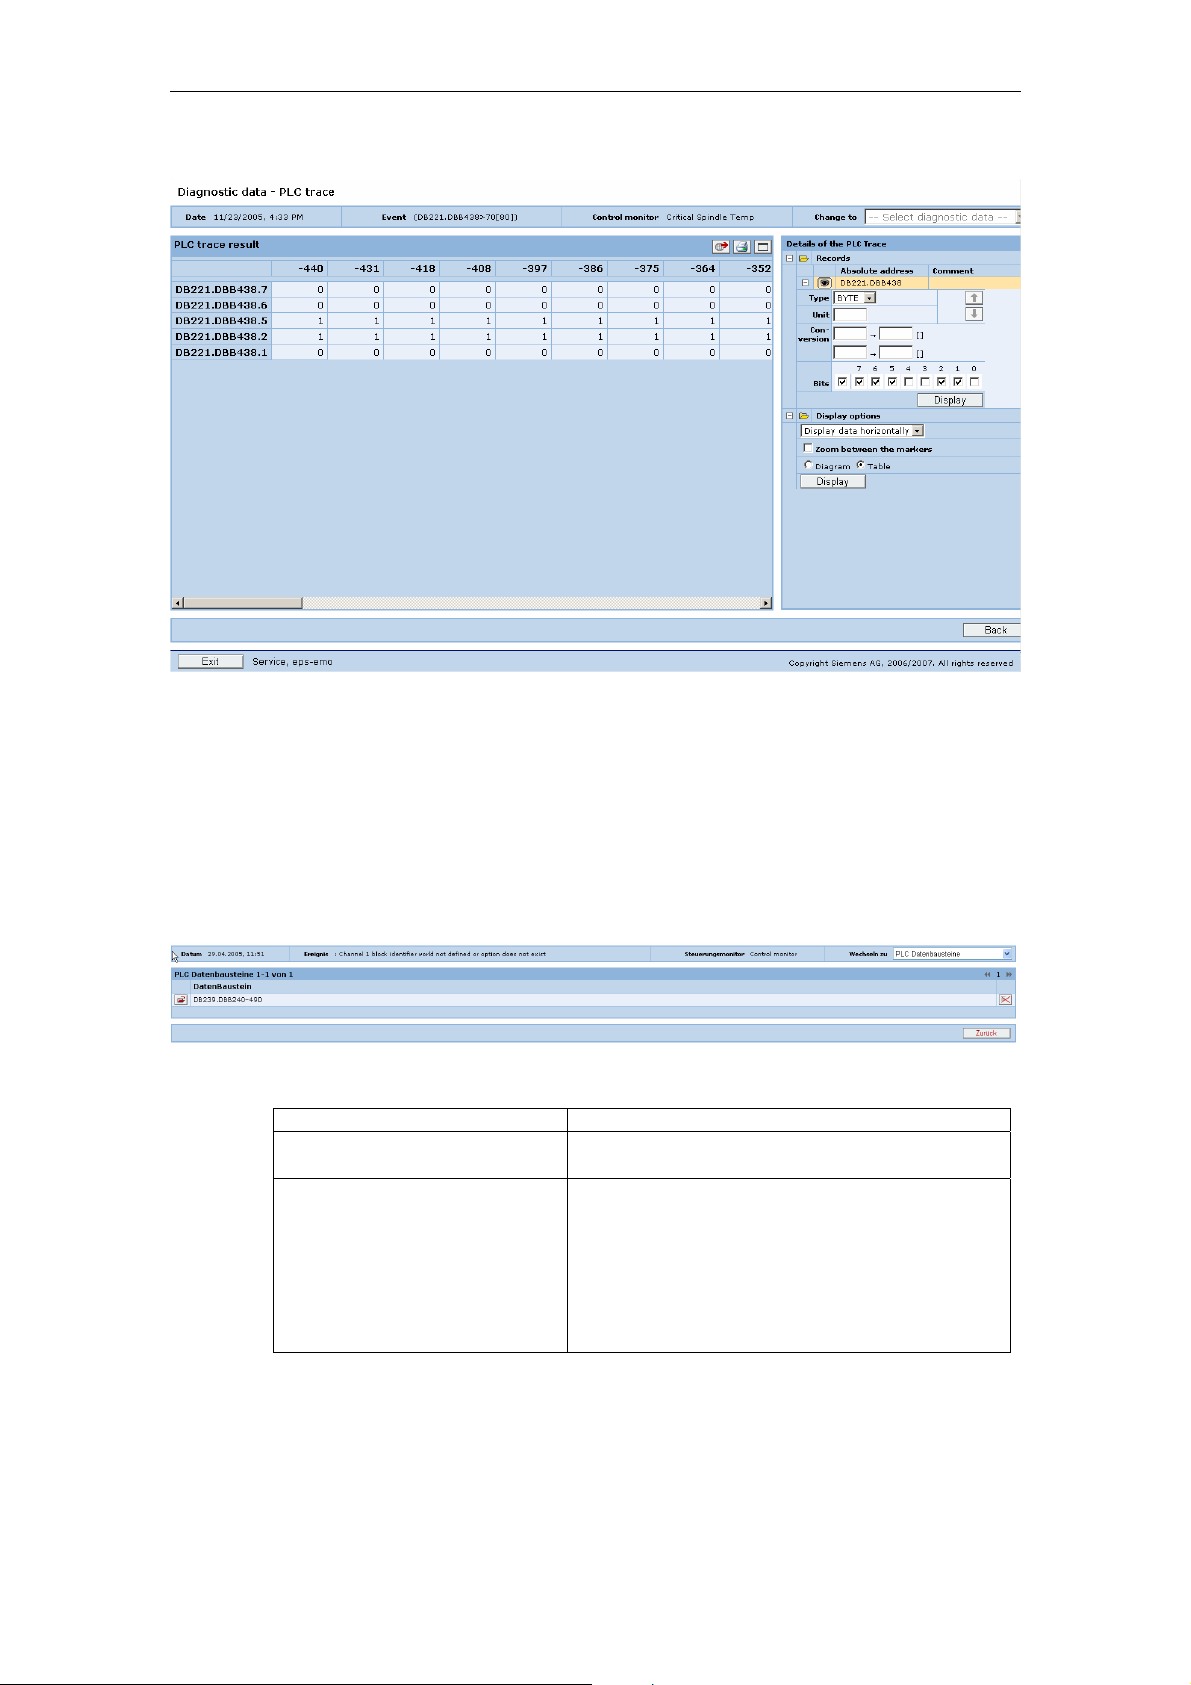
Fig. 2-11: PLC trace values displayed vertically
© Siemens AG 2008 All Rights Reserved
2-32 ePS Network Services, Function Manual (FH) - Release 12/2008
Page 33
12/2008 2 Maschine information
2.1 Machine overview
Fig. 2-12: PLC trace values displayed horizontally
PLC traces uploaded with an event can be displayed in the browser and evaluated
with graphical tools. Incorrect signal curves can easily be found by displaying
variable values in the graphical display, setting markers, and zooming.
PLC data blocks/list
PLC data blocks uploaded from the control on an event can be saved to a data
carrier.
Fig. 2-13: PLC data block display
Function Description
Save PLC data block You can save a PLC data block to an external
Delete PLC data block You cannot delete individual PLC data blocks
data carrier.
from machine events; it is only possible to
delete the entire event entry.
Note:
Deleting individual details from an event
constitutes illegal manipulation of the archived
document.
© Siemens AG 2008 All Rights Reserved
ePS Network Services, Function Manual (FH) - Release 12/2008
2-33
Page 34
2 Maschine information 12/2008
2.2 Variable monitors - Measurements and measurement series
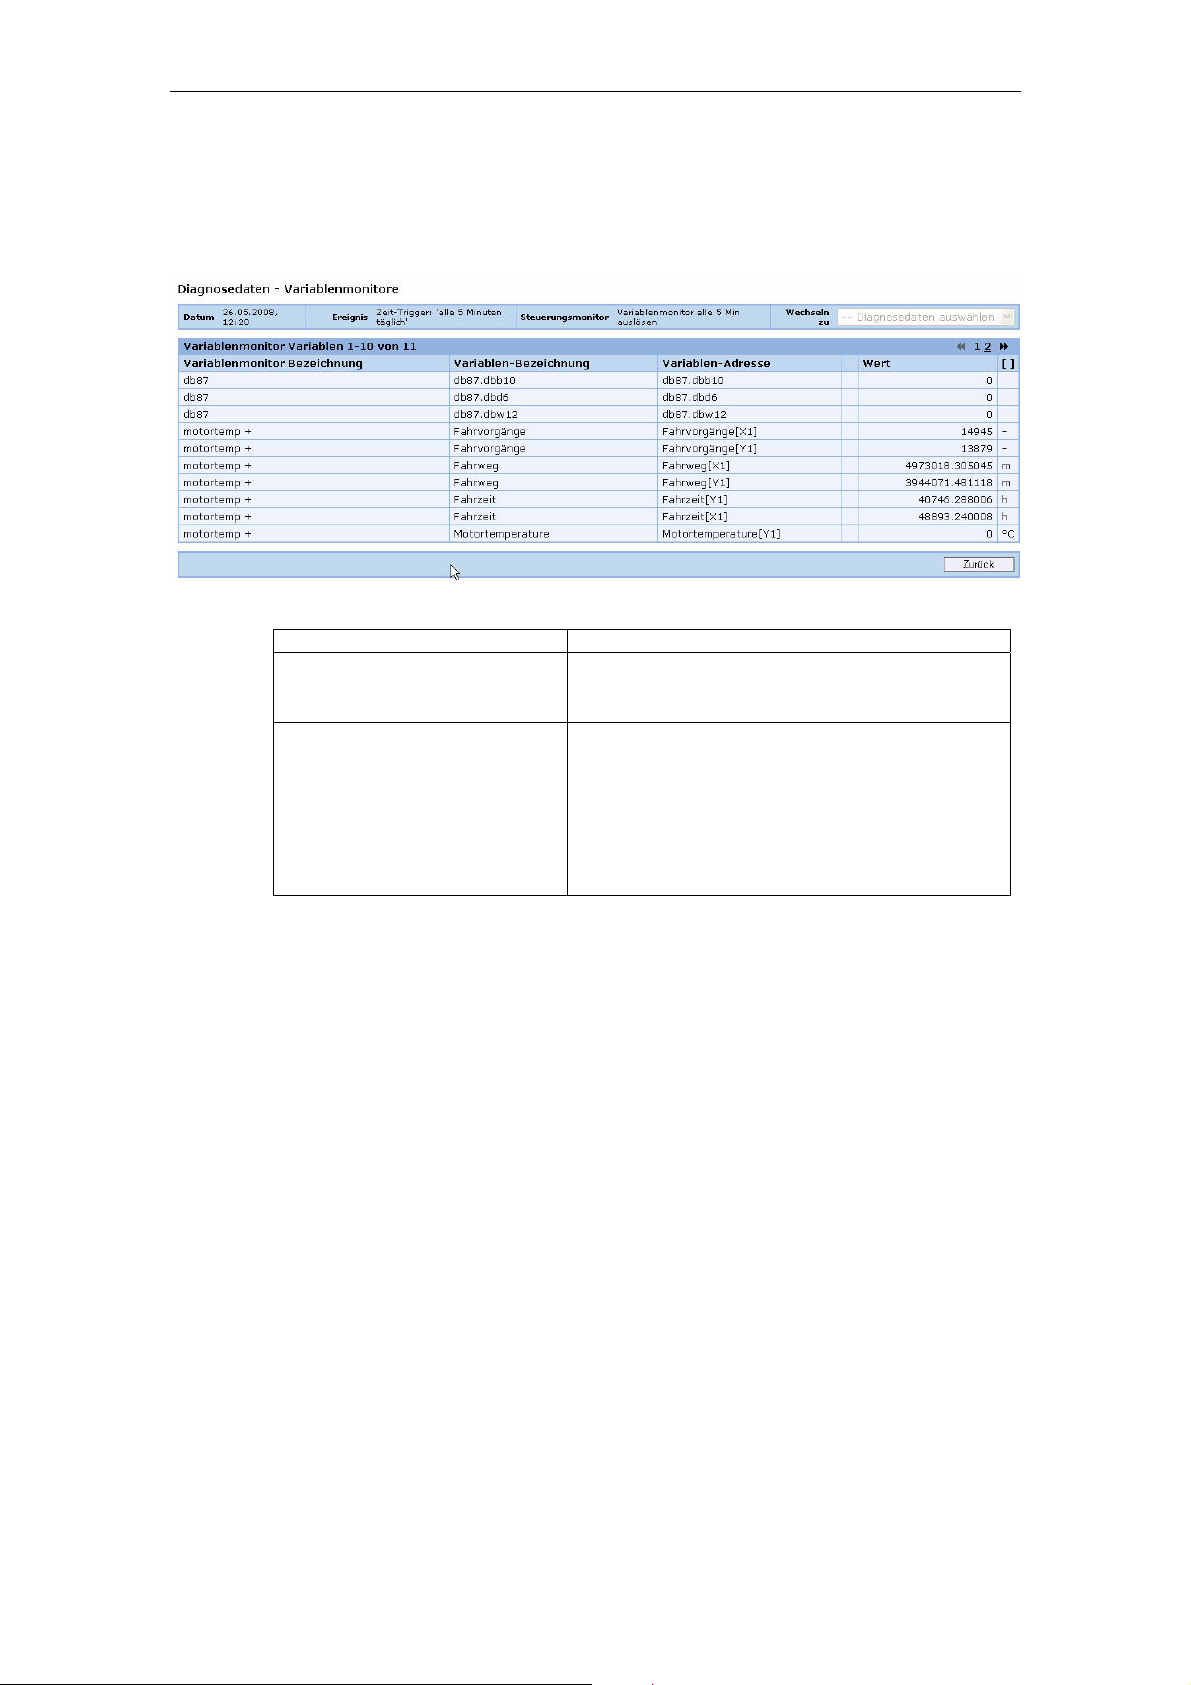
Variable monitors
The data of a variable monitor saved with a machine event can be displayed.
Fig. 2-14: Variable monitor data
Function Description
Open variable monitor You can open the variable monitor and display
the variations with time of all the recorded
monitor data.
Delete variable monitor data
from the event
You cannot delete individual variable monitor
data from machine events; it is only possible to
delete the entire event entry.
Note:
Deleting individual details from an event
constitutes illegal manipulation of the archived
document.
2.2 Variable monitors - Measurements and measurement series
2.2.1 Visualization on the Internet PC
Description of functions
The performance and status of a machine and its modules can be analyzed with
measurements and measurement series that have been performed on the
machine. This includes measurement curves generated from the measurements
and characteristics, as well as additional information about the measurement
result. Trend curves can be generated from characteristics in measurement series.
The machine operator can use the measurement results to make an analysis at a
later point, while away from the machine. Status changes can be derived from the
trend curves. Limit values will show whether any maintenance work is necessary at
an early stage.
© Siemens AG 2008 All Rights Reserved
2-34 ePS Network Services, Function Manual (FH) - Release 12/2008
Page 35
12/2008 2 Maschine information
2.2 Variable monitors - Measurements and measurement series
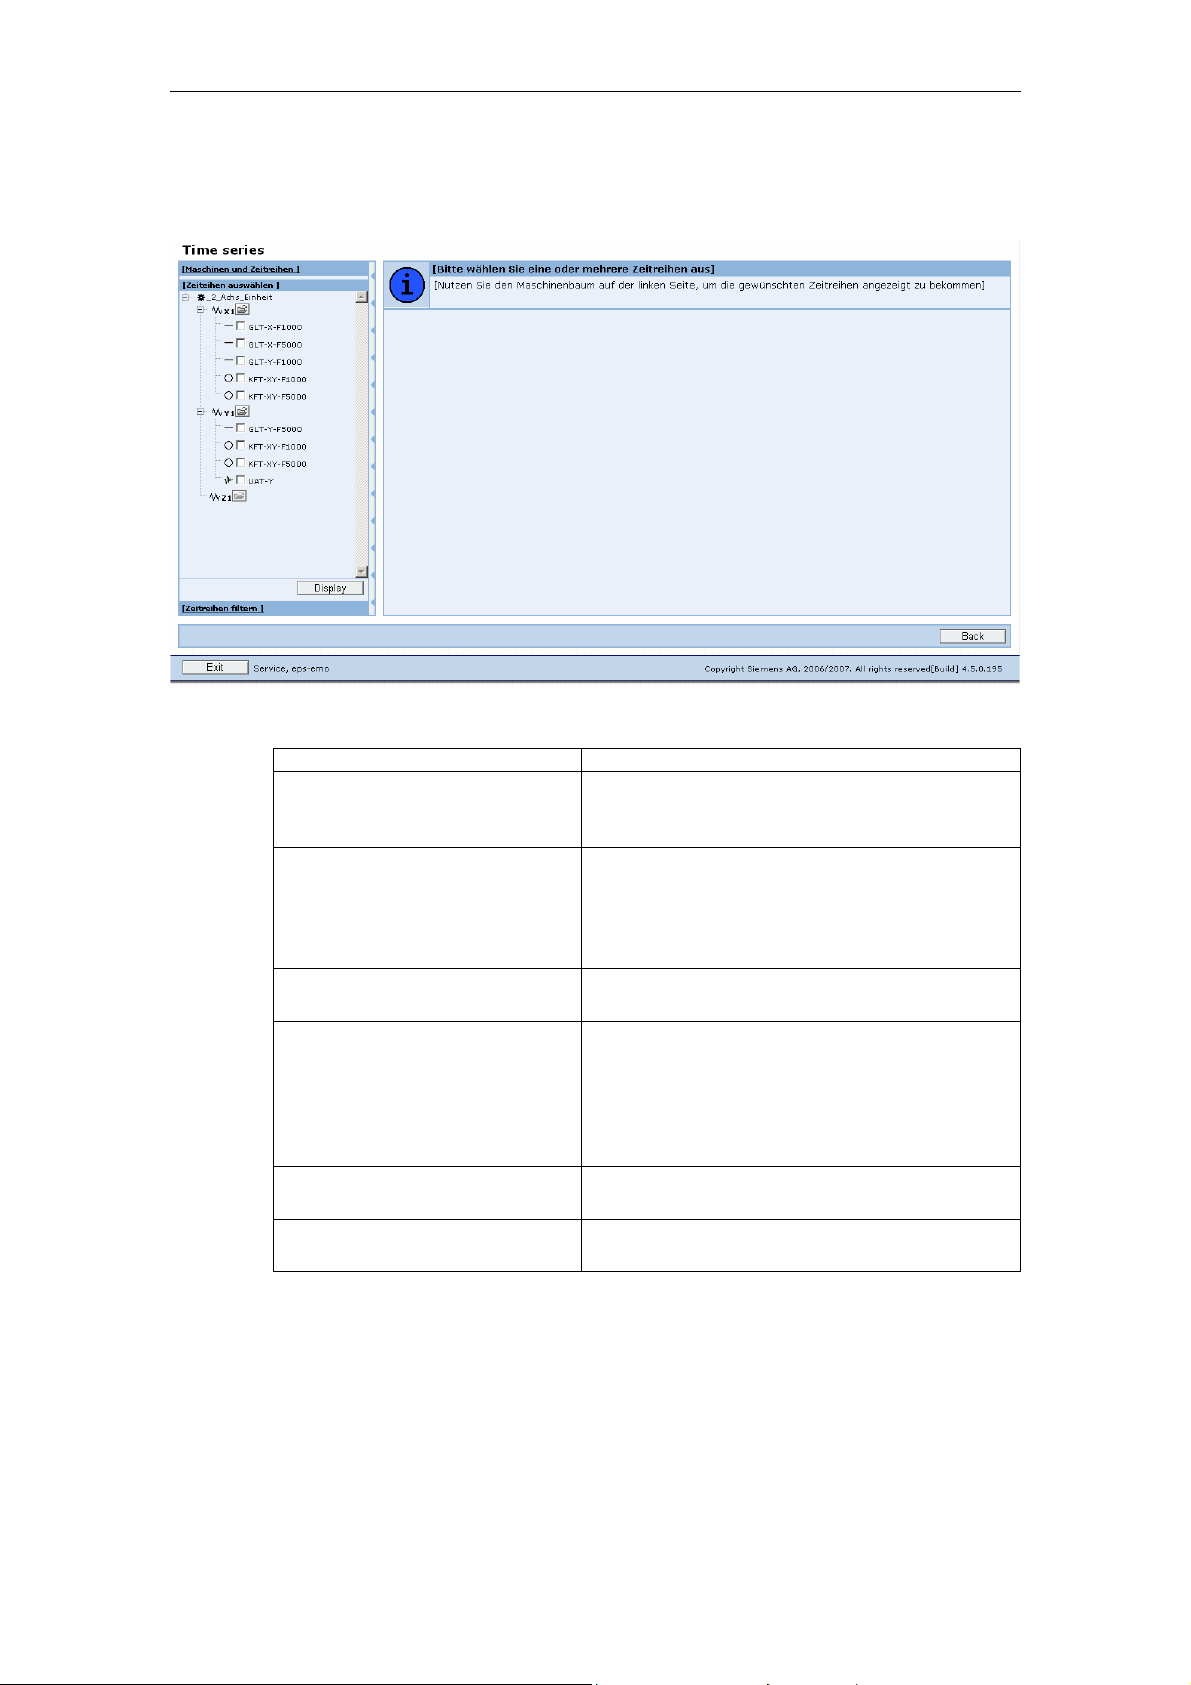
Selection and filter area
Fig. 2-15: Overview of the time series for the machine selected
Function Description
Select the time series The measurement series can be selected from
the machine axes in the selection tree. It is
possible to select several measurement series.
Select individual measurements This function displays a table for the axis
concerned containing all the measurements
that do not belong to a measurement series.
Several measurements for the display can be
selected in the table.
Display The "Display" function shows the selected
measurement series in diagrams.
Filter time series
Test types:
Equability test
Circularity test
This function opens the menu for the purpose
of filtering the measurement series displayed
in the selection. Measurement series can be
filtered according to the type of measurement
series.
Universal axis test
Filter The "Filter" function causes the selected filter
setting to take effect.
Show/hide filter areas This function shows or hides the entire filter
area.
Displaying diagrams of the selected time series
If the user clicks the "Display" text button under the time series selection tree, the
graphs for the selected time series are displayed.
© Siemens AG 2008 All Rights Reserved
ePS Network Services, Function Manual (FH) - Release 12/2008
2-35
Page 36

2 Maschine information 12/2008
2.2 Variable monitors - Measurements and measurement series
Displaying the measurement results
You can view measurement results both on the machine operator panel and on the
PC. Trend curves produced by measurement series can only be viewed on the PC.
The warning and critical limits of the characteristics can give the machine operator
evaluation information about how far the qualitative state of the machine is from the
limit criterion.
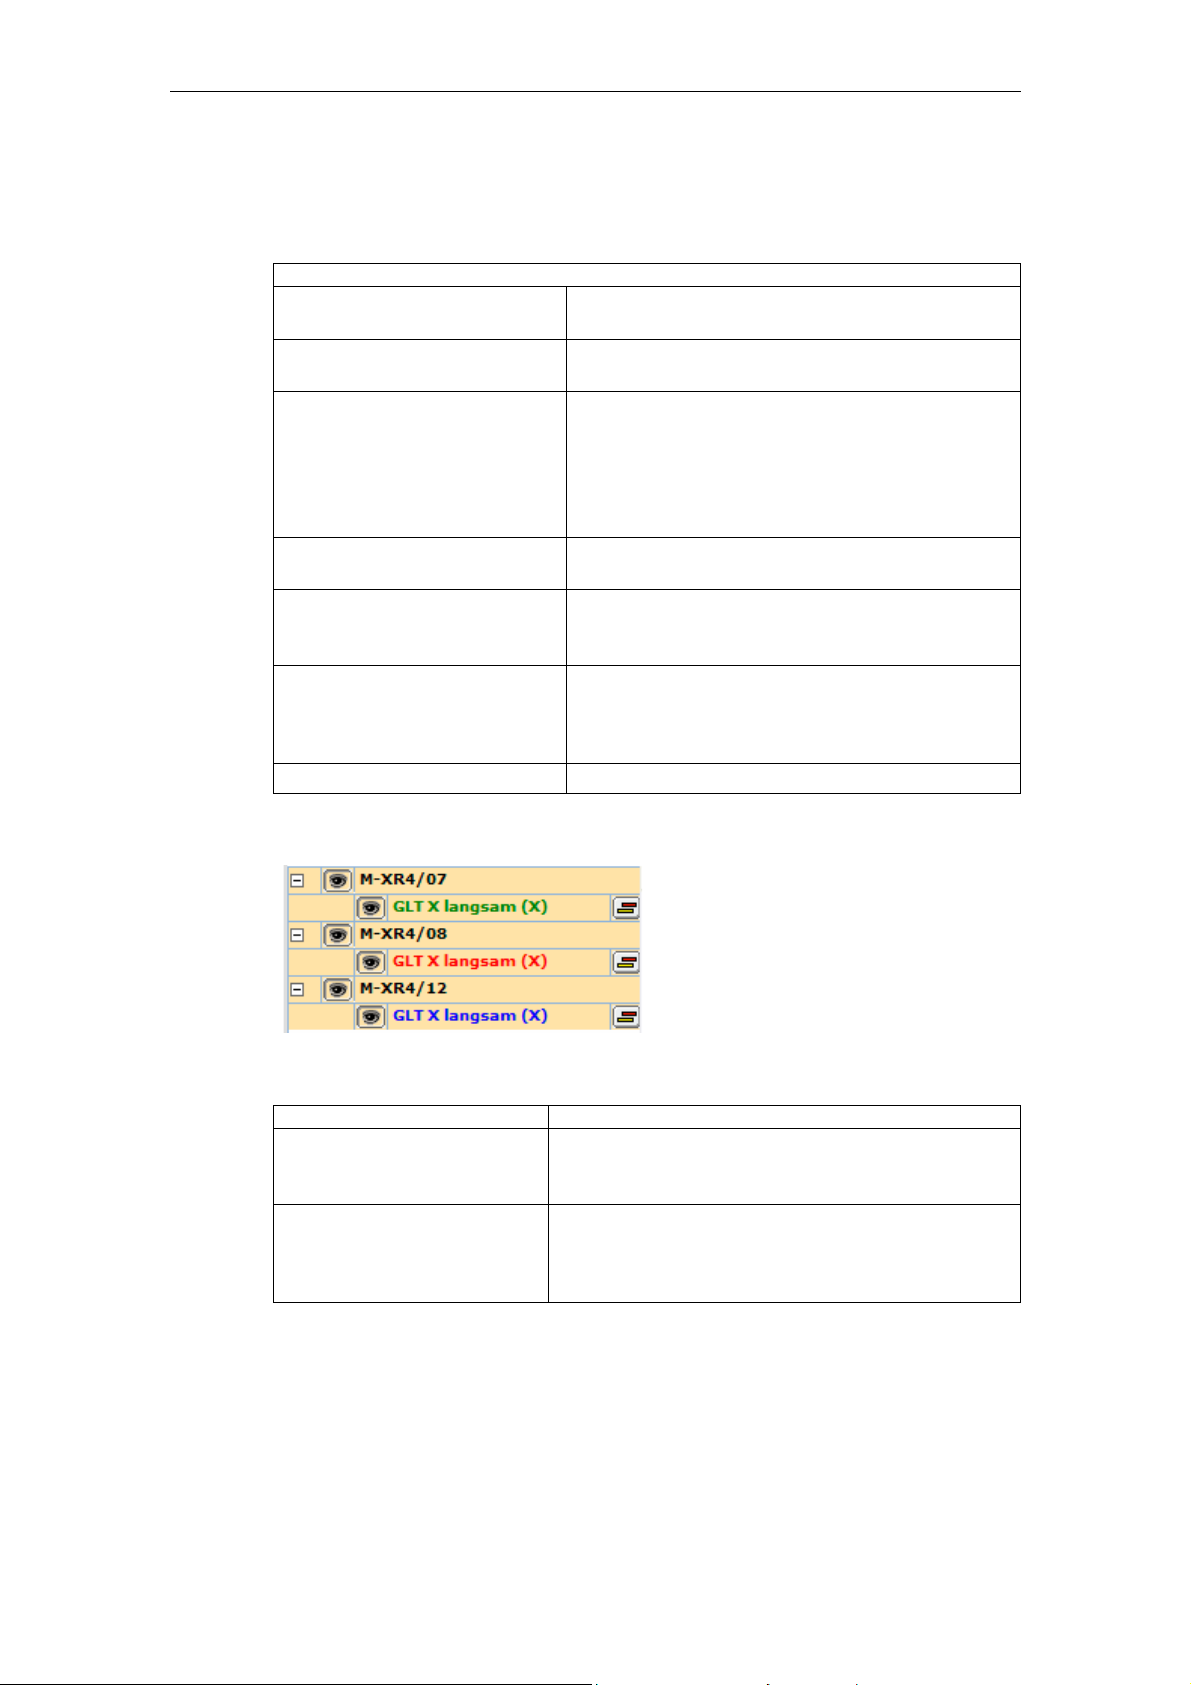
Fig. 2-16: Examples of time series
The trend curve can be generated from the measuring type-specific characteristics
(characteristic over time) by cyclic repetition of individual measurements. This is
used in particular as a basis for condition-oriented maintenance. For this,
measurement series can be generated based on existing individual measurements.
This ensures that the measurement series is based on the same measurement.
Measurement series are used as the basis for condition-oriented maintenance
because the trend curve and the limit values provide a basis for planning
maintenance activities.
How each test is conducted is described in Section 2.3 Test series on the
machine.
The machine operator can view the measurement results on the operator panel of
the machine and on the PC. Trend curves derived from measurement series can
only be viewed by the operator on the PC.
© Siemens AG 2008 All Rights Reserved
2-36 ePS Network Services, Function Manual (FH) - Release 12/2008
Page 37

12/2008 2 Maschine information
2.2 Variable monitors - Measurements and measurement series
Individual measurements for an axis
Measurements that are not generated by the measurement series are displayed in
a table. The measurements to be displayed can be selected in this table. Several
measurements can be selected.
Fig. 2-17: Table of individual measurements
Displaying individual measurements
The "Display table of individual measurements" function opens each of the
individual measurements selected in a separate diagram.
2.2.2 Operating diagrams
General control elements
Function Description
Minimize diagram Reduces the diagram so that only the header line
Restore diagram Restores the minimized diagram to its standard
Maximize diagram Magnifies the diagram so that it fills the entire
Close diagram Closes the diagram
Setting and displaying
markings
is visible.
size.
diagram space.
A pair of markings can be set in the diagram. Leftclick to set the first marking. Move the cursor
without pressing any buttons to position the
second marking, and then left-click. The markings
can be reset if you wish.
The markings are deleted by means of the "Delete
markings" function in the "Display" menu.
© Siemens AG 2008 All Rights Reserved
ePS Network Services, Function Manual (FH) - Release 12/2008
2-37
Page 38

2 Maschine information 12/2008
2.2 Variable monitors - Measurements and measurement series
Function Description
Display in new diagram If the user clicks the "Display in new diagram"
button on the right-hand side next to the dropdown list box, a new diagram of the same type will
be displayed below the diagram that is already
shown.
The regenerated diagram assumes all of the
display properties of the original diagram
(characteristic selected, markings, display,
selection and sequence of time series, etc.), with
the exception of its scale. In a new diagram, the
scale is always set to Auto/Auto.
Export diagram The data points represented in the diagram are
saved in a CSV file.
Changing the characteristic
Fig. 2-18: Drop-down list box for circularity test characteristics
The drop-down list box contains the list of characteristics for each test type. If the
user selects a characteristic, the diagram that has been displayed up to this point
will be replaced by the time series diagram for the characteristic selected.
"Actions" menu
Entries menu
Warm boot Regenerates the diagram.
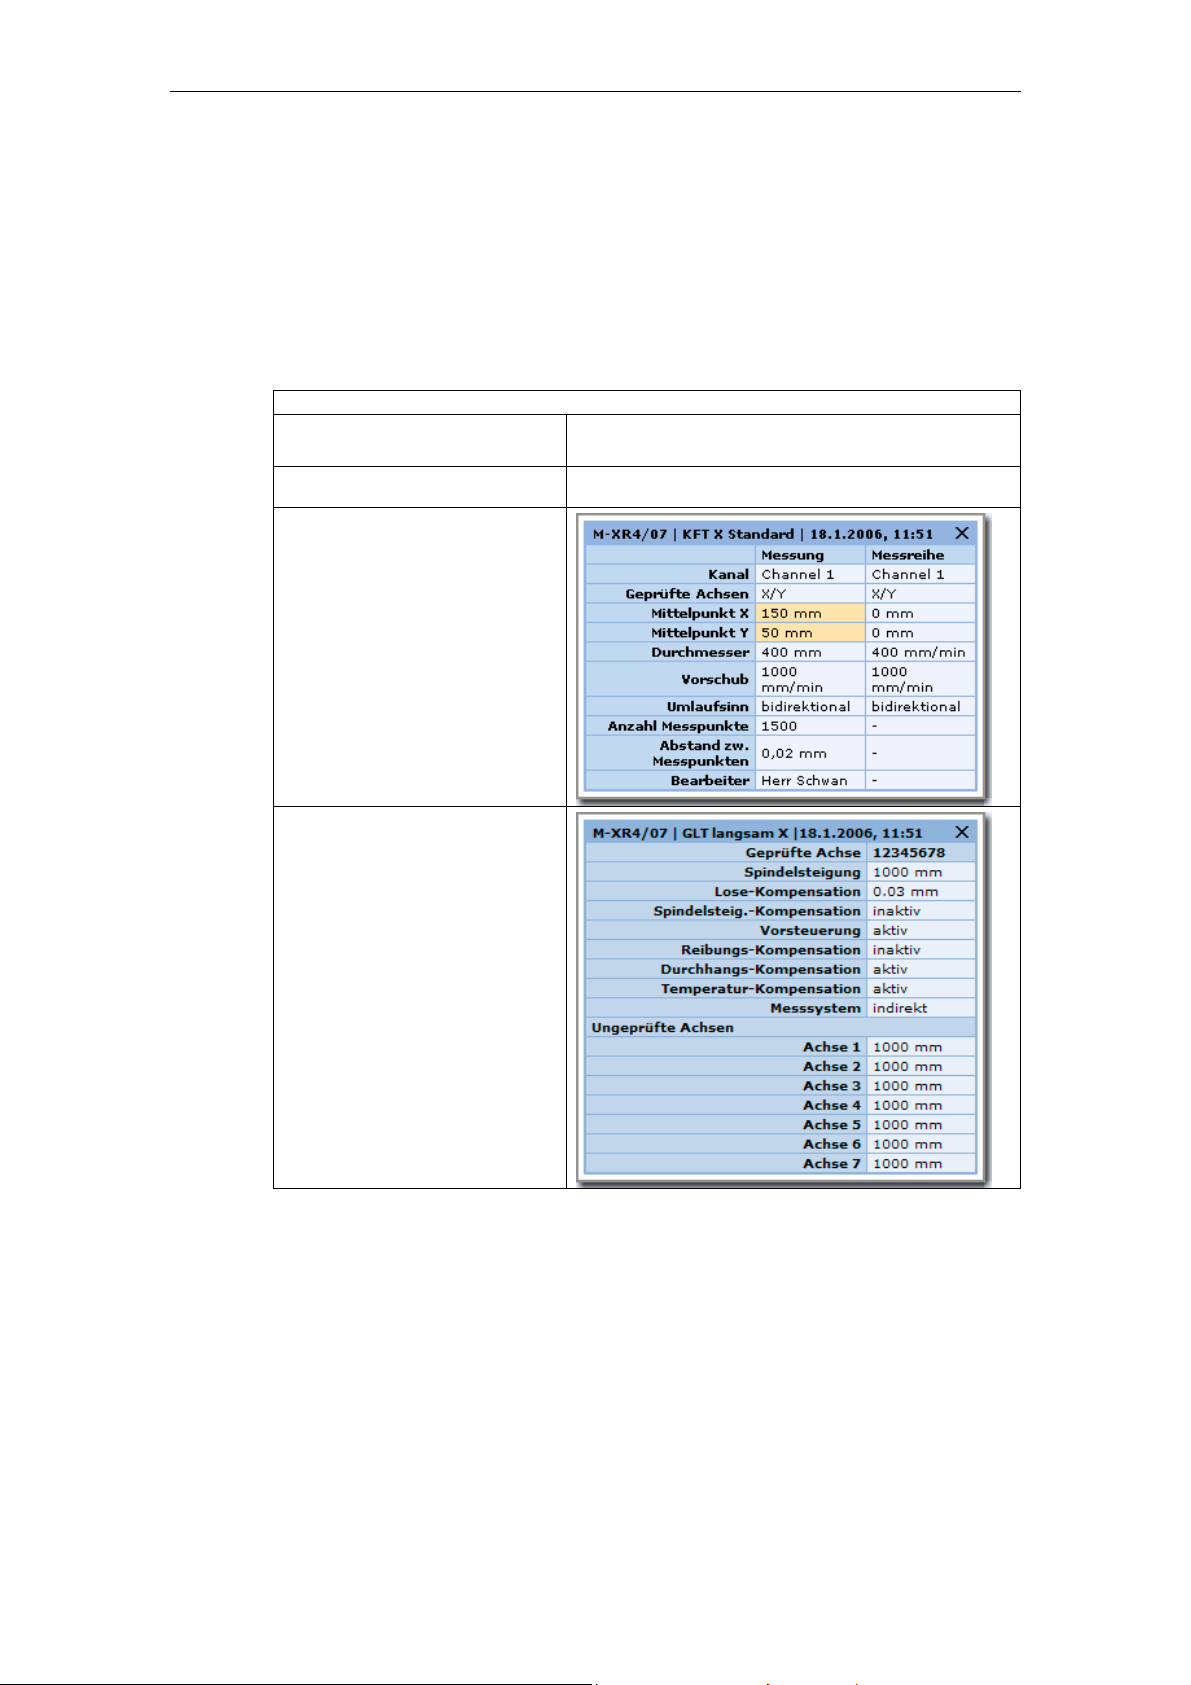
All parameters A table containing the parameters for all of the
Fig. 2-19: Parameters for all measurement series
measurement series shown in the diagram is
displayed.
© Siemens AG 2008 All Rights Reserved
2-38 ePS Network Services, Function Manual (FH) - Release 12/2008
Page 39
12/2008 2 Maschine information
2.2 Variable monitors - Measurements and measurement series
"Display" menu
The display settings of the diagram may be controlled using this menu.
Entries menu
Display all data Displays the complete progression over time of
the time series
Between the markings Displays the time domain between the two
markings
Last month
|
|
|
Last year
Back to previous zoom Generates the diagram with the previous zoom
Time-based distribution The horizontal axis represents the time. The
Equal distribution The measured values are distributed equally
Delete markings Removes the markings from the diagram.
These options are used to select the zoom
factor. When the zoom level is changed, the
diagram is regenerated to reflect this; however,
all of the other settings (in particular, the
markings) remain the same.
setting
measuring points are plotted along this
according to their date.
across the X axis; it is not possible to draw any
further conclusions about the time of the
measurement from the points on the X axis.
List of machines and time series with control elements
Fig. 2-20: Displaying/hiding individual measurement series
Function Description
Hide measurement series This function removes the measurement series
graph from the diagram. The diagram is redrawn,
which involves recalculating the scale.
Display limit values This function plots the limit values of the selected
measurement series in a line in the diagram. If the
limit values are outside the range of values
displayed, an icon indicating this will appear.
© Siemens AG 2008 All Rights Reserved
ePS Network Services, Function Manual (FH) - Release 12/2008
2-39
Page 40
2 Maschine information 12/2008
2.2 Variable monitors - Measurements and measurement series
Context menu of the time series diagram
If the user points the cursor to an individual measuring point within the time series
in the diagram and right-clicks, a context menu containing actions relating to that
measuring point appears. The functions executed via the context menu relate to
either the entire measurement range to which the measuring point belongs (i.e. the
measurement range and the measurement), or simply the measurement
represented by the data point.
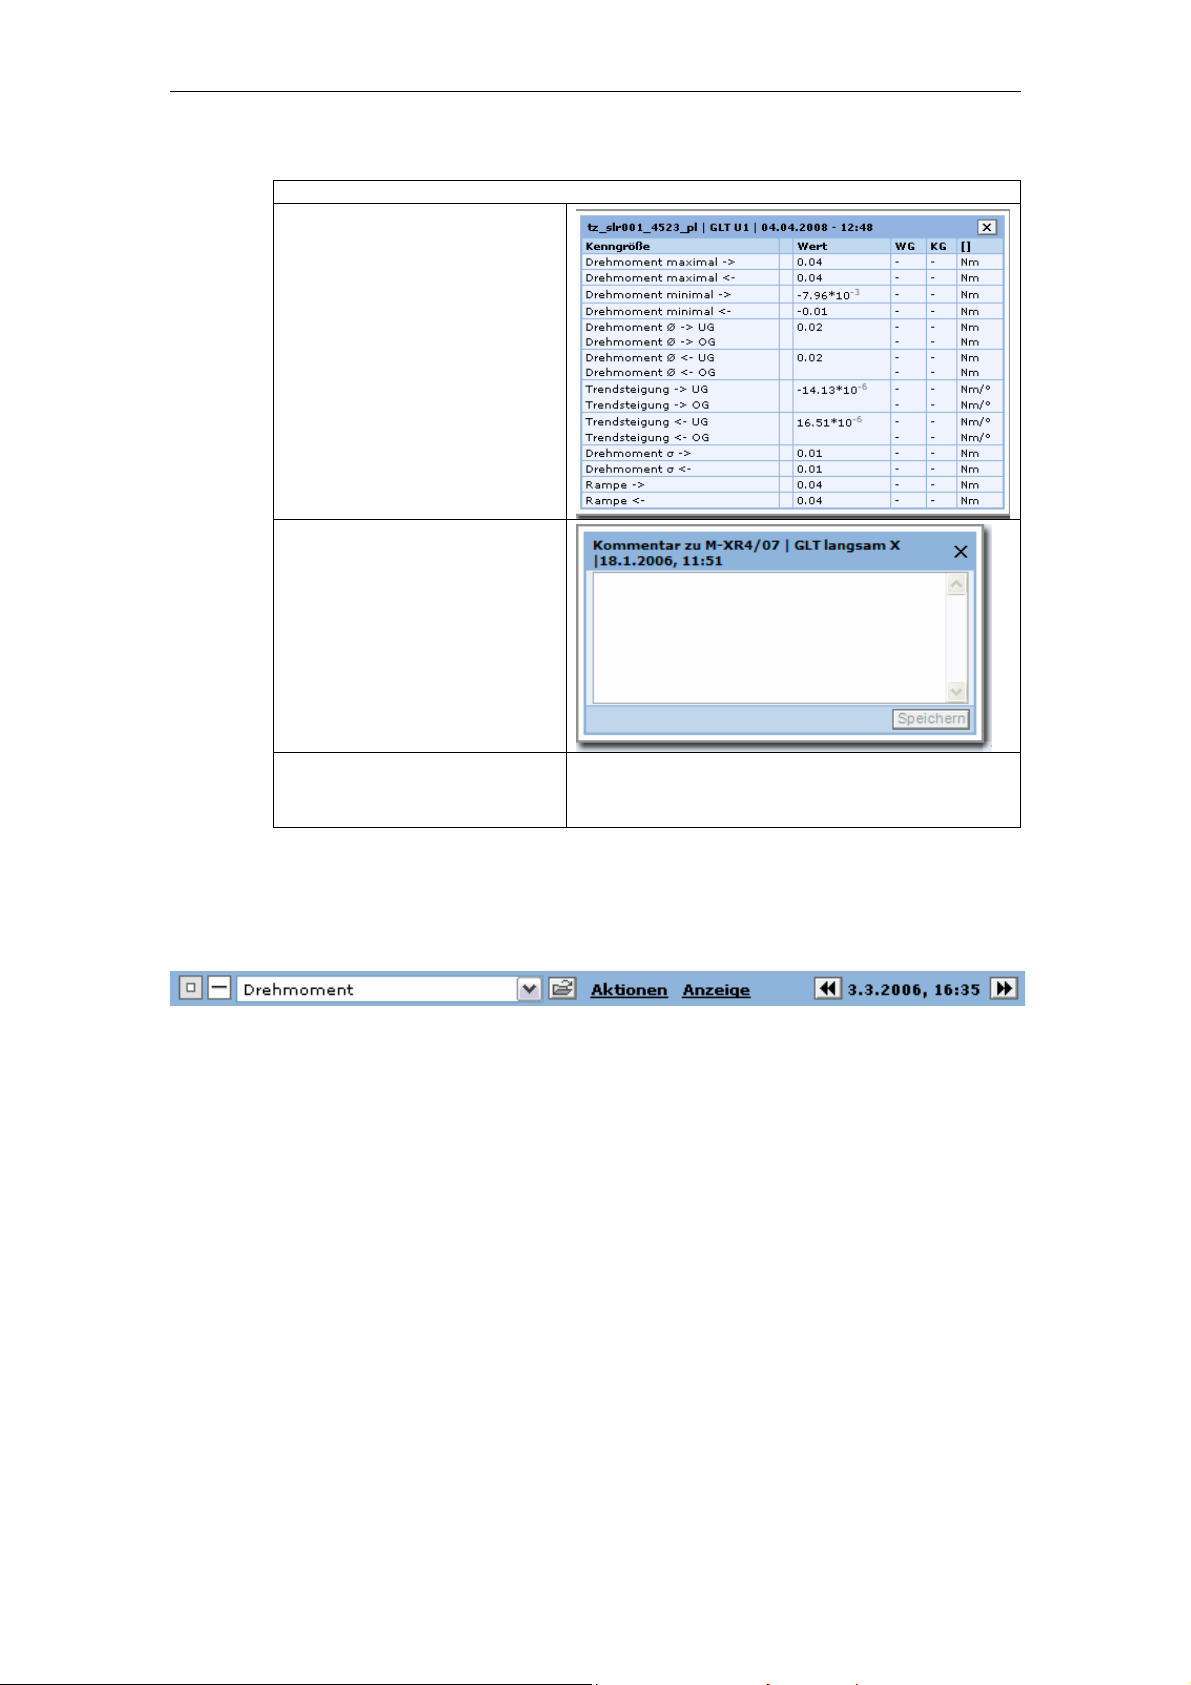
Entries menu
Measurement series comment Displays the measurement series comment. This
can be changed and saved.
Save graphic
Measurement/measurement
series parameters
Supplementary conditions for
measurement
© Siemens AG 2008 All Rights Reserved
2-40 ePS Network Services, Function Manual (FH) - Release 12/2008
Page 41
12/2008 2 Maschine information
2.2 Variable monitors - Measurements and measurement series
Entries menu
Characteristic/limit values
measurement
Measurement comment
Display measurement Displays a diagram with the individual
measurement selected below the time series
diagram shown.
2.2.3 Control elements of the diagrams for individual measurements
Fig. 2-21: Header line for individual measurement diagram
Changing the diagram type
The drop-down list box contains the list of diagram types that are available for each
type of test. If the user clicks a name of a type of diagram, it replaces the type that
has been displayed up until this point.
New type of diagram in a separate diagram
If the user clicks the "Display in new diagram" button on the right-hand side next to
the drop-down list box of diagram types, a new diagram of the same type will be
displayed below the diagram that is already shown.
The new diagram adopts all of the display characteristics of the original diagram
(markings, zoom, etc.), with the exception of the scale. The scale of a cloned
diagram is always Auto/Auto.
© Siemens AG 2008 All Rights Reserved
ePS Network Services, Function Manual (FH) - Release 12/2008
2-41
Page 42

2 Maschine information 12/2008
2.2 Variable monitors - Measurements and measurement series
Where individual measurement diagrams are concerned, the "Actions" menu and
context menu have the same options:
Entries menu
Parameters Shows the pop-up window with the list of measurement
parameters. The same pop-up window can be opened
from the context of the time series.
Supplementary conditions
Shows the pop-up window with the list of measurement
parameters.
Comment Pop-up with measurement comment
Scaling Setting for the diagram scale (for the equability test
only). In the case of the diagrams for the circularity test
and universal axis test, the "Actions" menu does not
contain "Scaling".
Scaling for the equability test
Fig. 2-22: Scaling for the equability test
"Display" menu
This menu is only available for the individual measurement diagram of the
equability test.
Entries menu
All without ramps Displays the entire measuring range, but without
the acceleration ramps
All with ramps Displays the entire measuring range, including
the acceleration ramps
Between the markings Adjusts the zoom factor of the diagram at the
area between the markings. This function
assumes that both of the markings have been
set.
Navigating to previous/next measurement
The two buttons for this function can be used to navigate to the previous or next
measurement of the measurement series in question.
© Siemens AG 2008 All Rights Reserved
2-42 ePS Network Services, Function Manual (FH) - Release 12/2008
Page 43
12/2008 2 Maschine information
2.2 Variable monitors - Measurements and measurement series
Displaying the characteristics and limit values
Fig. 2-23: Table of characteristics and limit values
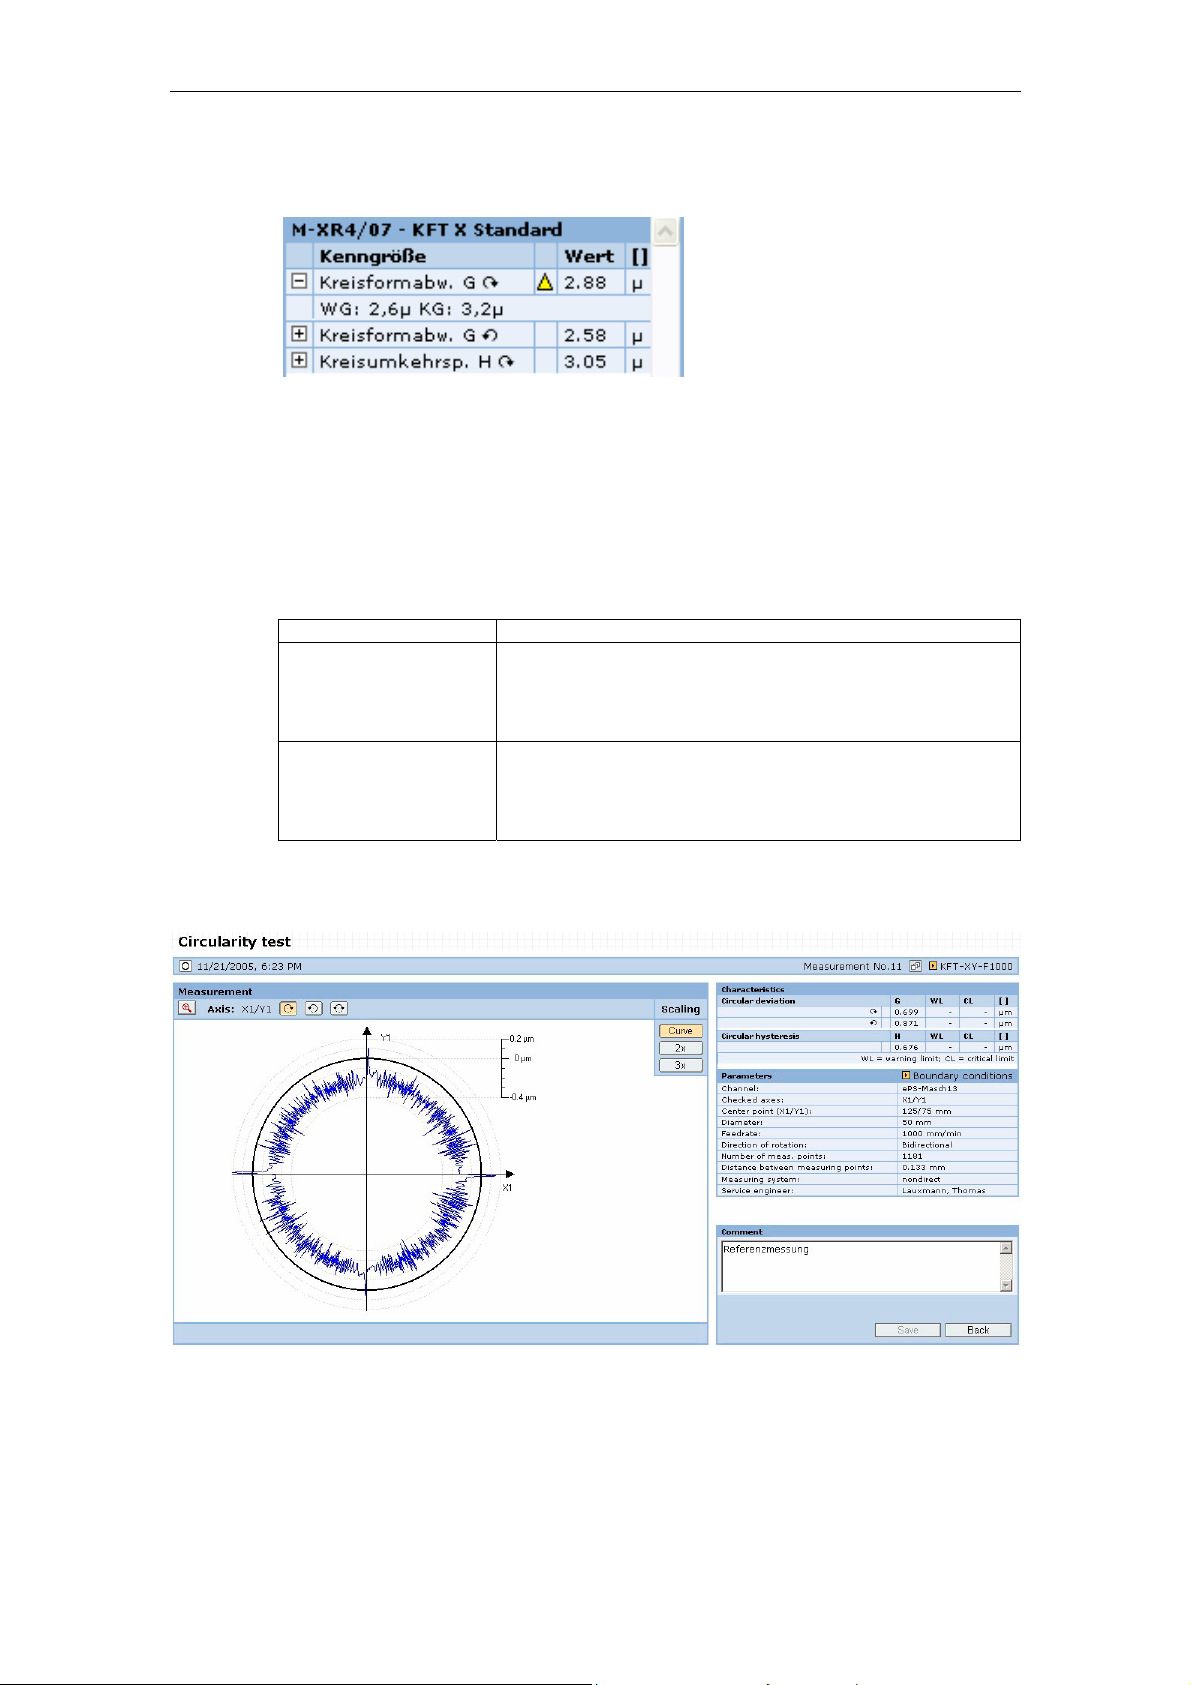
2.2.4 Circularity test
Description of functions
The circularity test produces a polar plot of the circular path and circularity-specific
characteristics:
Characteristic Meaning
Circular deviation The circular deviation is measured on the basis of
ISO 230-4 as difference between the maximum and
minimum radius at movement of a circle in one direction.
A value is calculated for each direction of movement.
Circular hysteresis As defined in ISO 230-4 the circular hysteresis is
determined by establishing the maximum difference of
measured radii on an angular position between the two
directions of movement.
The measurement type-relevant parameters are also specified. The goal is to test
the drive dynamics and accuracy of the two axes involved.
Fig. 2-24: Measuring result of a circularity test
© Siemens AG 2008 All Rights Reserved
ePS Network Services, Function Manual (FH) - Release 12/2008
2-43
Page 44

2 Maschine information 12/2008
2.2 Variable monitors - Measurements and measurement series
2.2.5 Equability test
Description of functions
The equability test result returns the torque/force measurement curve over the axis
position and various torque characteristics. The characteristics are determined for
each direction of movement separately. If nothing else is described for the
characteristics, the characteristics refer to the position range without the
acceleration and braking ramps.
Characteristic Meaning
Maximum torque The maximum returns the maximum torque in the
measured position range. With torque characteristics
with linear trend, the proportion the trend is computed
for determining the maximum torque.
Minimum torque The minimum returns the minimum torque in the
measured position range. With torque characteristics
with linear trend, the proportion of the trend is
computed for determining the minimum torque.
Average torque The characteristic returns the mean torque in the
measured position range with the configured speed.
Independently of the direction, a larger value always
corresponds to a larger torque in the direction of
movement.
Standard deviation The characteristic represents the standard deviation of
the torque characteristic in the measured position
range at the configured speed. With torque
characteristics with a linear trend, the proportion of the
trend is eliminated from the standard deviation.
Increase in the linear
trend of torque
characteristic
Maximum torque of the
acceleration ramp
The characteristic indicates the increase in the change
to the torque at position changes.
The characteristic indicates the maximum torque which
is run in the acceleration ramp.
© Siemens AG 2008 All Rights Reserved
2-44 ePS Network Services, Function Manual (FH) - Release 12/2008
Page 45

12/2008 2 Maschine information
2.2 Variable monitors - Measurements and measurement series
For axes that also have a direct measuring system the overall rigidity curve over
the axis position is also displayed. The rigidity is determined independently of the
direction. The following rigidity characteristics are calculated:
Characteristic Meaning
Maximum rigidity The characteristic returns the maximum rigidity
value via the rigidity characteristic in the measured
position range at the configured speed.
Minimum rigidity The characteristic returns the minimum rigidity value
via the rigidity characteristic in the measured
position range at the configured speed.
Average rigidity For calculating the characteristic, the mean rigidity
value is determined in the measured position range
at the configured speed.
Standard deviation of the
rigidity
For calculating the characteristic, the standard
deviation of the rigidity is determined in the
measured position range at the configured speed.
The equability test notifies the machine operator of faults and interference
resistances from feed axis elements. The curve of the recorded values indicates at
which axis position the disturbance is located. A trend analysis of the
characteristics will indicate any change in the status of the drive train.
Fig. 2-25: Measurement results of an equability test
© Siemens AG 2008 All Rights Reserved
ePS Network Services, Function Manual (FH) - Release 12/2008
2-45
Page 46

2 Maschine information 12/2008
2.2 Variable monitors - Measurements and measurement series
2.2.6 Universal axis test
Description of functions
With the universal axis test different characteristics are calculated which describe
the mechanical properties of an axis.
Characteristic Meaning
Residual torque (Res) This characteristic is not supported.
Coulomb friction (Coul) The Coulomb friction describes the proportion of the
friction which is independent of the speed.
Mixed friction (Mix) This characteristic is not supported.
Viscous friction (Visc) This characteristic describes the proportion of the
friction which increases linear to the speed
Moment of inertia (Inr) The characteristic describes the entire moment of
inertia that needs to be moved by the electrical
drive. This includes the moment of inertia of the
motor.
Torque offset (Const) With axes which are pretensioned in one direction
(e.g. vertical axes) the characteristic indicates the
torque required for compensating for this pretension.
Coherence (K) The coherence indicates how much a model
parameterized with the calculated characteristics
can simulate the measured torque characteristics.
Circular deviation (G) The characteristic describes the maximum position
deviation with axis movement on the basis of a
velocity profile. The calculation of the characteristic
is based on ISO 230-4 as is the case with the
circularity test.
The measurement type-relevant parameters are also specified.
© Siemens AG 2008 All Rights Reserved
2-46 ePS Network Services, Function Manual (FH) - Release 12/2008
Page 47

12/2008 2 Maschine information
2.2 Variable monitors - Measurements and measurement series
Fig. 2-26: Time series for a universal axis test
2.2.7 Variable monitors
Description of functions
Variable monitors enable the recording in the control of changes over time of any
status data. The variable monitors are essentially for long-term recording in slow
data recording cycles (as opposed to the PLC trace).
Up to 32 variables can be recorded in a common cycle in a variable monitor. The
PLC variables recorded can be from the PLC environment: inputs, outputs,
counters, flags, and any data addresses in PLC blocks. From the NC environment,
they can be machine data, setting data, system variables and others.
The variables recorded can be scaled and assigned freely definable units.
Individual variables of a variable monitor can be identified as counting variables
(e.g. workpiece counters). These variables can be used in the configuration of
interval triggers to trigger recurring actions after a certain number of counting units
have elapsed. Counting variables are counted up monotonically. Resetting of the
variables in the control is compensated for by the system because the count is
resumed on the basis of the last value before reset.
Limit values can be configured for each variable for automatic monitoring of the
state. Actions can be triggered when limit values are violated. This is the same as
described for the control monitors.
© Siemens AG 2008 All Rights Reserved
ePS Network Services, Function Manual (FH) - Release 12/2008
2-47
Page 48
2 Maschine information 12/2008
2.2 Variable monitors - Measurements and measurement series
Selection and filter area
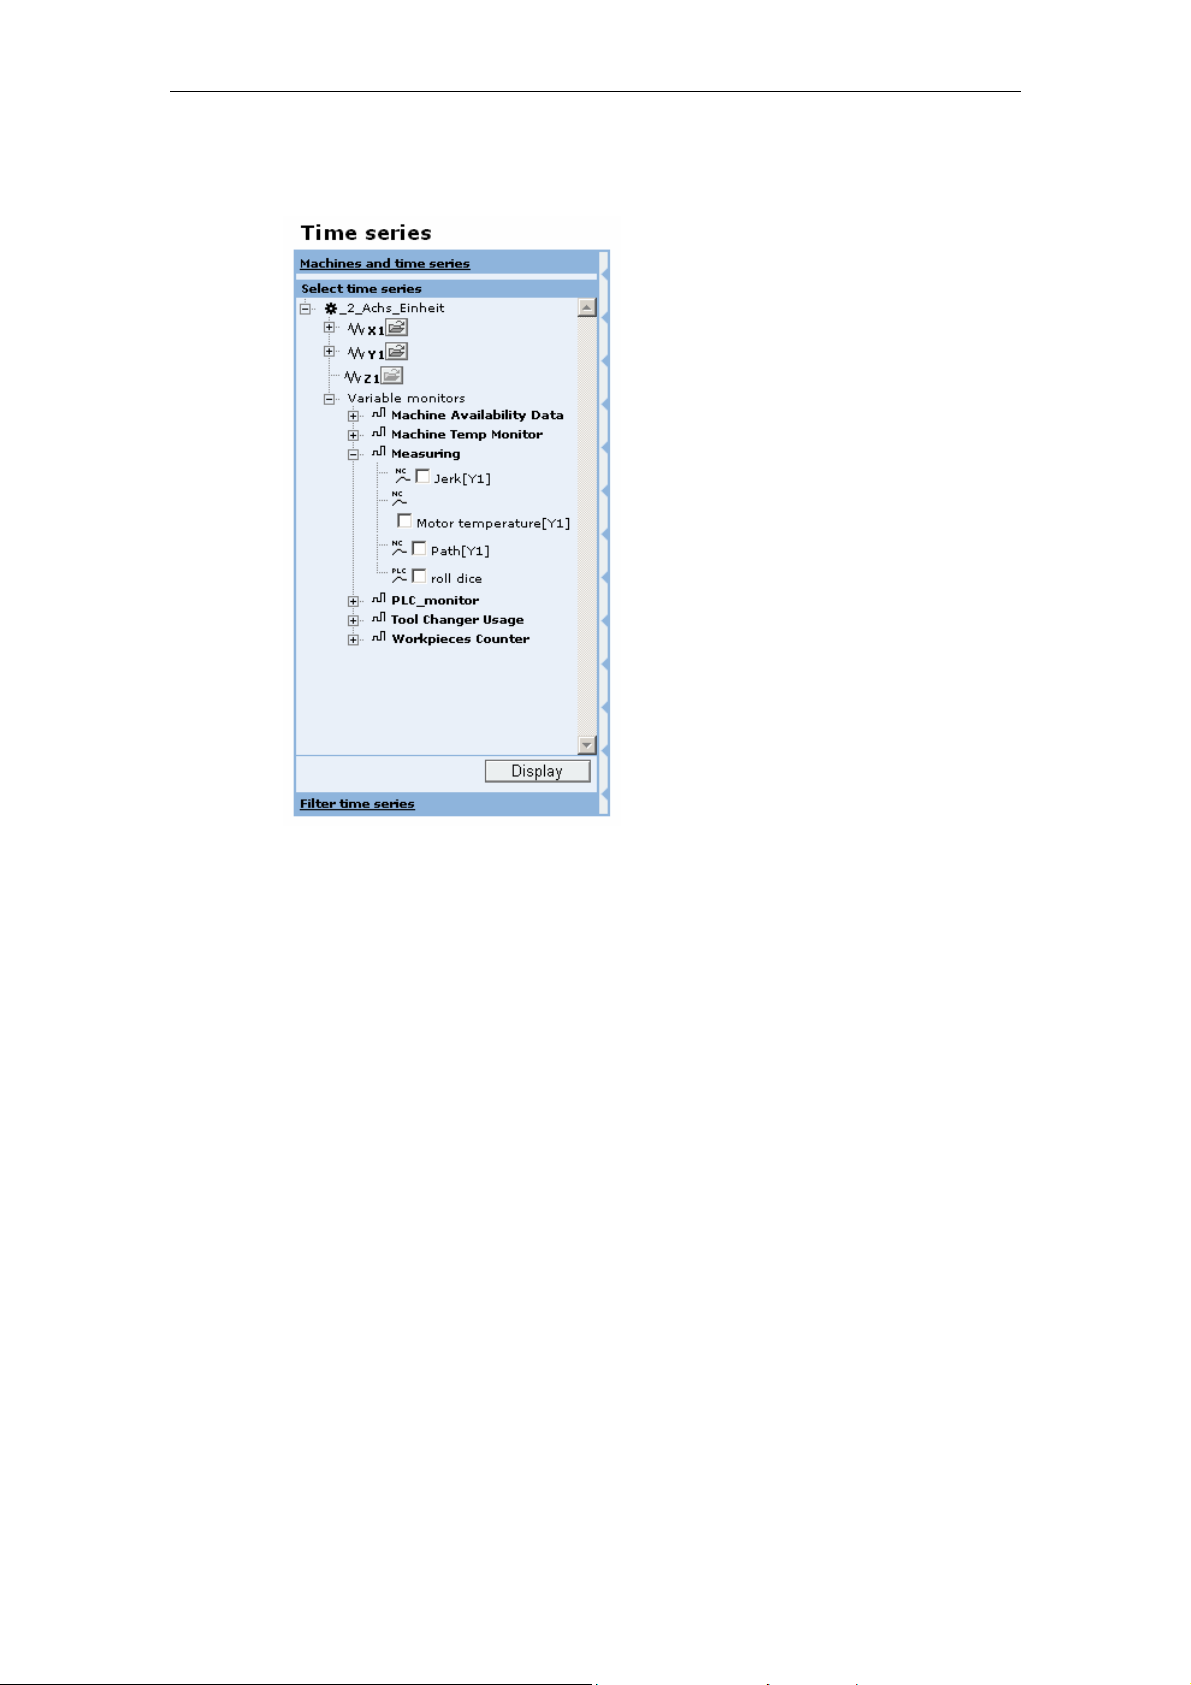
Fig. 2-27: Select variable monitors
Displaying diagrams of the selected variables
To display variables in a diagram, select them in the selection area. Activate the
"Display" field to display all selected variables in one common diagram in graphs.
Any variables from different variable monitors can be displayed together in one
diagram. If you select additional variables and activate the "Display" button, a new
diagram is created which displays the newly selected variables. Any number of
diagrams can be generated.
Operating diagrams
The diagrams for displaying variable monitors are operated in the same way as the
diagrams for displaying measurement series. Some of the available functions may
differ slightly due to the differences between measurement series and variable
monitors. These differences are described in more detail in the following sections.
© Siemens AG 2008 All Rights Reserved
2-48 ePS Network Services, Function Manual (FH) - Release 12/2008
Page 49

12/2008 2 Maschine information
2.2 Variable monitors - Measurements and measurement series
List of displayed variable monitors and variables with control elements
Fig. 2-28: List of displayed variables
Function Description
Hide variable monitor This function removes all variable monitor graphs
from the diagram. The diagram is redrawn, which
involves recalculating the scale.
Hide variable This function removes the variable graph from the
diagram. The diagram is redrawn, which involves
recalculating the scale.
Display limit values This function plots the limit values of the selected
variable in a line in the diagram. If the limit values
are outside the range of values displayed, an icon
indicating this will appear.
"Actions" menu
Entries menu
Warm boot Regenerates the diagram.
Variable details A table is displayed showing detail information
about the displayed variables.
© Siemens AG 2008 All Rights Reserved
ePS Network Services, Function Manual (FH) - Release 12/2008
2-49
Page 50

2 Maschine information 12/2008
2.3 Test series on the machine
2.3 Test series on the machine
2.3.1 Performing measurement series
Perform measurement
The following alternatives are available for performing measurements on the
machine:
• Performing a single measurement with manual entry of parameters before
performing the actual test
• Performance of a single measurement as the repetition of an existing
measurement without changing the parameters
• Performance of a further measurement as part of a series of measurements,
based on the parameters predefined in the measurement series
• Performance of a measurement of a measurement series prescribed by a
maintenance job
• Performance of measurements configured in a test series
• Performance of measurements in a test series by means of a maintenance job
• Performance of measurements in a test series without a machine operator, by
means of a maintenance job under the control of the PLC.
Availability and privileges
Measurements, measurement series, and test series can only be performed on the
operator panel. The authorization required to perform measurements,
measurement series, and test series is described in detail in the Appendix.
Measurement sequence
The sequence is performed as follows independently of the different types of
execution and type of test:
• Machine operator selects measurement, measurement series, or test series
• Confirmation of the parameters of the measurement and display of the
measurement series contained in the test series
• A contour test to check collision can be performed before the actual
measurement
• Check release by the PLC
• Machine operator sets AUTO mode and feedrate override to 100% on the
control
• Machine operator presses NC START on the control
• Perform machine-specific prolog of the measurement movement
• Perform the measurement movement with data recording
• Perform machine-specific epilog of the measurement movement
• Result display
• Save the result
© Siemens AG 2008 All Rights Reserved
2-50 ePS Network Services, Function Manual (FH) - Release 12/2008
Page 51

12/2008 2 Maschine information
2.3 Test series on the machine
Notice
Please observe the information on the operator panel!
2.3.2 Requirements for performing the test
Requirements on the control
When making measurements, the machine axes must be moved with precisely the
motion profile that is defined in the NC program. In addition, it must also be
guaranteed that the motion is also executed in the machine coordinates.
The following functions in the NCK could be problematical when carrying out
measurements (sample selection):
• Asynchronous subprograms
• Static synchronized actions
• Coupled axes
• Kinematic transformations
• Superimposed (overlaid) motion, such as DRF, external work offset
• Tool length compensation
• Functions, that influence the velocity, such as G95
• Functions that change the position, such as DIAMON
• Axis replacement/geometry axis replacement
• Axis is passed over to the PLC (PLC axis)
The NC program for performing the measurement does not affect the functions
listed above. Only the zero offsets are disabled and the offset produced by DRF
and external zero point offset is compensated statically, i.e. the value is corrected
by the value that applies at the beginning of the measurement.
Orientation transformations are a special case. It is possible to execute
measurements with the geometry axes when transformation is active. However, the
offset of the geometry axis coordinates produced by the orientation axes is not
compensated for. It is therefore advisable to deactivate transformation.
Couplings between axes should be separated before the measurement movement
(e.g. in the prolog program). The NC program of the ePS system does not separate
couplings. The ePS system assumes that it is possible to load, select, and start an
NC program (with subroutines) downloaded from the ePS system on the machine
in a particular channel. For machines where the PLC prevents the machine
operator from selecting or starting any NC program, the PLC can communicate
with the ePS system via DB10.DBB90 or DBB91.
Machine data must be set in the control to acquire data for the condition monitoring
measurements. Not only Trace Server machine data but also MD 36730:
DRIVE_SIGNAL_TRACKING must be set.
Drives that are linked via Profibus must be handled differently. Here the Profibus
configuration must be changed so that the torque values can be transmitted to the
control cyclically.
© Siemens AG 2008 All Rights Reserved
ePS Network Services, Function Manual (FH) - Release 12/2008
2-51
Page 52

2 Maschine information 12/2008
2.3 Test series on the machine
Prerequisites of the machine
The measurements for condition monitoring assume that the machine axes can be
traversed separately with precisely the motion profile that is defined by the NC
program for performing the measurements.
Machine designs with parallel kinematics, for example, that do not allow this are
not suitable for condition monitoring by ePS Network Services.
Note
Axes that can only be programmed as positioning axes can only undergo the
synchronized axis test. The circularity test or universal axis test cannot be
performed on these axes.
NC programs are downloaded to the control to carry out the axis tests. There must
be approximately 100 KB free NC program memory available.
A variable $AC_MARKER is used for executing the NC programs. You can
configure the variable index. The default setting for the index is value 5. You must
ensure that the $AC_MARKER variable of the configured index is not used by
other control functions.
Note
The ePS system does not check whether the configured $AC_MARKER variable
is also used by other control functions.
© Siemens AG 2008 All Rights Reserved
2-52 ePS Network Services, Function Manual (FH) - Release 12/2008
Page 53

12/2008 2 Maschine information
2.3 Test series on the machine
2.3.3 Prolog and epilog program for a measurement
Description of functions
To prepare the control making it suitable for the test, an NC program that has been
specially adapted to the machine by the machine manufacturer or end user is
executed at the beginning of the test. This means that machine settings can be
specifically changed so that the test can be performed (example: Disabling
transformations and couplings, resetting pre-set G codes).
Suitable programming of the prolog and epilog program can influence how the test
is performed. When a test series is carried out, individual measurement series can
only be hidden under the tested conditions (e.g. due to a risk of collision).
The prolog and epilog program is reloaded into the control with name
"N_EPS_PROLOGEPILOG_SPF" every time a test is run. The NC program editor
of the operator panel (=HMI-Advanced) can be used to modify this program.
After the test has been performed, the ePS system automatically checks whether
the prolog/epilog program has been changed and, if required by the machine
operator, stores it permanently.
Fig. 2-29: Prompt for NC-START
© Siemens AG 2008 All Rights Reserved
ePS Network Services, Function Manual (FH) - Release 12/2008
2-53
Page 54

2 Maschine information 12/2008
2.3 Test series on the machine
Fig. 2-30: Saving the prolog/epilog program permanently
Call sequence of the NC programs
The prolog and epilog program is executed before and after each measurement
movement. The program is also called at the start of a test series and at the end of
a test series.
Example of a call sequence:
Prolog for test series (testType == "FRAME")
Prolog for measurement series1 (testType == "CIRCULARITY")
Checking the return parameters
Measurement1
Epilog for measurement series1 (testType == "CIRCULARITY")
Prolog for measurement series2 (testType == "EQUABILITY")
Checking the return parameters
Measurement2
Epilog for measurement series2 (testType == "EQUABILITY")
Prolog for measurement series3 (testType == "UNIVERSAL")
Checking the return parameters
Measurement3
Epilog for measurement series3 (testType == "UNIVERSAL")
© Siemens AG 2008 All Rights Reserved
2-54 ePS Network Services, Function Manual (FH) - Release 12/2008
Page 55

12/2008 2 Maschine information
2.3 Test series on the machine
Prolog for measurement series4 (testType == "CIRCULARITY")
Checking the return parameters
Measurement4
Epilog for measurement series4 (testType == "CIRCULARITY")
...
Epilog for test series (testType == "FRAME")
testType == "FRAME" marks the call to start and end of the test series. The other
parameters with this call are irrelevant. testType == "CIRCULARITY" identifies a
circularity test measurement. "EQUABILITY" stands for the equability test and
"UNIVERSAL" for the universal axis test.
In the calls placed before and after a measurement, the further call parameters of
the program contain the specific information about the measurement in accordance
with the table.
Description of the call parameters
All position values refer to the machine coordinate system (MCS).
Equability test Circularity test Universal axis test
ePS_error
ePS_errMsg
doProlog
Return parameters (see below)
TRUE = Call as prolog
FALSE = Call as epilog
testType
FRAME = Prolog/epilog of the test series
(The following parameters are irrelevant.)
testType
measSeriesName
intParam1
EQUABILITY CIRCULARITY UNIVERSAL
Name of the measurement series (in UPPER CASE)
Channel axis number
of the traverse axis
Plane selection
(1 = G17, 2 = G18,
Channel axis number
of the traverse axis
3 = G19)
intParam2
Channel axis number
Reserved Reserved
of the measurement
axis
intParam3
intParam4
intParam5
intParam6
realParam1
Reserved Reserved Reserved
Reserved Reserved Reserved
Reserved Reserved Reserved
Reserved Reserved Reserved
Start position 1st center point
Start position
coordinate of the
circle
realParam2
End position 2nd center point
Maximum position
coordinate of the
circle
realParam3
realParam4
realParam5
Reserved Circle diameter Reserved
Feed Feed Reserved
Reserved Reserved Reserved
© Siemens AG 2008 All Rights Reserved
ePS Network Services, Function Manual (FH) - Release 12/2008
2-55
Page 56

2 Maschine information 12/2008
2.3 Test series on the machine
Equability test Circularity test Universal axis test
realParam6
axParam1
axParam2
axParam3
Reserved Reserved Reserved
Channel axis
(traverse axis)
Machine axis
(measurement axis)
Machine axis
Channel axis 1
(traverse axis)
Channel axis 2
Channel axis
(traverse axis)
Reserved
(traverse axis)
Reserved Reserved
(traverse axis)
axParam4
axParam5
axParam6
Reserved Reserved Reserved
Reserved Reserved Reserved
Reserved Reserved Reserved
Description of the return parameters
You can influence the measurement via the return parameters. The return values
are always queried after call with doProlog = True and testType = " ", i.e. after the
prolog is called for each measurement series. The process then continues according to the returned values.
Equability test Circularity test Universal axis test
ePS_error
ePS_errMsg
0 = (default setting) execute measurement
1 = Suppress execution of measurement, continue with the next
measurement series. Errors are not displayed.
Reserved for future expansions
2.3.4 Program example
Description
Here is a commented example program to illustrate how the prolog and epilog
program can be used to prepare the machine specifically for a certain test. The
structure of the program is as follows:
Prolog for the test series:
This section of the program is only executed once at the beginning of a test series
and also on each single measurement outside a test series. This block contains
everything that has to be executed irrespective of the type of test or the axis that is
to be measured. For example, in this case G codes that are preset on the machine
via machine data (G95, DIAMON, etc.) could be deactivated, the tool could be unloaded, the workpiece removed, and all axes moved to a safe initial position.
Prolog for each measurement:
This section of the program is executed before each measurement, irrespective of
whether the measurement is part of a test series or is performed individually. This
block can be used with call parameters to check which axis is to be tested, which
test type is to be conducted, and with which parameters the measurement will be
performed. For example, when testing certain axes, it may be necessary to move
other axes to another position than the basic position, or the starting point for the
measurement cannot be approached directly (circularity test). Certain actions could
© Siemens AG 2008 All Rights Reserved
2-56 ePS Network Services, Function Manual (FH) - Release 12/2008
Page 57

12/2008 2 Maschine information
2.3 Test series on the machine
also be performed depending on the position range in which the measurement is
performed.
When programming axis movements, it is important to ensure that the parameters
of a measurement always refer to the machine coordinate system if they represent
positions. The example program shows how the axis movement can be offset into
the machine coordinate system using the command SUPA.
It is possible to test the name of the measurement series in the program and to
execute special functions for a certain measurement series. However, that should
be limited to special cases because the parameters of a measurement series can
be changed at any time without its name having to be changed.
Epilog for the test series:
This section of the program is only executed once at the end of a test series and
also after each single measurement made outside a test series. The actions that
are necessary for minimizing the work the machine operator must do in order to
resume the machining process after performing measurements should be executed
in this block.
Epilog for each measurement:
This section of the program is executed after each measurement, irrespective of
whether the measurement is part of a test series or has been performed
individually. It is useful for undoing actions performed before the measurement. It
may be necessary to move all axes back to their safe initial position.
© Siemens AG 2008 All Rights Reserved
ePS Network Services, Function Manual (FH) - Release 12/2008
2-57
Page 58

2 Maschine information 12/2008
2.3 Test series on the machine
PROC EPS_PROLOGEPILOG(BOOL doProlog, ePS_error,
ePS_errMsg, STRING[32] testType,
STRING[32] measSeriesName, INT intParam1,
INT intParam2, INT intParam3, INT intParam4,
INT intParam5, INT intParam6, REAL realParam1,
REAL realParam2, REAL realParam3, REAL realParam4,
REAL realParam5, REAL realParam6, AXIS axParam1,
AXIS axParam2, AXIS axParam3, AXIS axParam4,
AXIS axParam5, AXIS axParam6)
IF (doProlog == TRUE)
MSG("Start of Prolog ... ")
IF ( testType == "FRAME")
MSG("Frame Prolog ...")
T0 M6
BASIC POSITION
TRAFOOF
G94
DIAMOF
G90
ELSE
MSG(testType << " Prolog ...")
IF (axParam1 == C) OR
(axParam1 == A)
IF ($AA_IW[Q]!=0)
ENDIF
ENDIF
IF (axParam1 == U) OR
(axParam1 == W)
IF ($AA_IW[Q]!=180)
ENDIF
ENDIF
IF (testType == "CIRCULARITY")
G1 F1000 SUPA AX[axParam1]=realParam1
G1 F1000 SUPA AX[axParam2]=realParam2
IF (measSeriesName == "KFT_FFWON")
FFWON
ENDIF
ENDIF
; start of Prolog - user section start
; Frame prolog user section actions at the
start of a test series
; Unload tool
; all axes to safe position
; Deactivate transformation
; for lathes, G95 is often placed in front
; prolog for a specific series of
measurements
; handling irrespective of type of
measurement
; procedure when measuring specific axes:
; if axis A or C are to be measured, Q must
be set to 0
; M code for rotation of Q
; if axis U or W are to be measured, Q must
be set to 180
; M code for rotation of Q
; specific procedure for circularity test
; actions for all circularity tests: to avoid
collision, the two axes are moved to the
circle center one after the other. A particular
sequence may be required.
; SUPA, therefore target position in the
machine coordinates
; specifically this series of measurements
should be performed using the pre-control
FFWON
; user DEF area
© Siemens AG 2008 All Rights Reserved
2-58 ePS Network Services, Function Manual (FH) - Release 12/2008
Page 59

12/2008 2 Maschine information
2.3 Test series on the machine
IF (testType == "EQUABILITY")
; actions for all equability tests, e.g.,
approaching the start position
IF ( axParam1 == C ) AND
( realParam1 > 300 )
ePS_error = 1
ENDIF
IF (measSeriesName == "")
ENDIF
ENDIF
IF (testType == "UNIVERSAL")
IF (measSeriesName == "")
ENDIF
ENDIF
MSG(" ... finished Prolog.")
GOTOF PROG_END
ELSE
MSG("Start of Epilog ... ")
IF ( testType == "FRAME")
MSG("Frame Epilog ...")
ELSE
MSG(testType << " Epilog ...")
G90
BASIC POSITION
MSG(" ... finished Epilog.")
ENDIF
ENDIF
PROG_END:
G4 F1
M17
; example of using the return parameter
ePS_error
; skip the equability test with the C axis
; specific actions for single series of
measurements
; actions for all universal axis tests, e.g.
approaching the start position
; specific actions for single series of
measurements
; end of Prolog - user section end
; start of Epilog - user section start
; epilog of test series
; frame epilog user section
; Epilog specifically for the last meas. series
conducted
; all axes back to safe position after
measurement
; end of epilog - user section end
; is required for synchronization
© Siemens AG 2008 All Rights Reserved
ePS Network Services, Function Manual (FH) - Release 12/2008
2-59
Page 60

2 Maschine information 12/2008
2.3 Test series on the machine
2.3.5 Commissioning measurements
Description of functions
The prolog and epilog program must be edited in order to perform measurements.
If measurements are performed on a machine for the first time, or if the prolog and
epilog program has been deleted, then a preconfigured prolog and epilog program
takes effect, which prevents the further execution of the NC programs as the NC
program code runs in an endless loop. This part of the preconfigured prolog and
epilog program must be deleted. A program code adapted to the requirements of
the machine must be used for the prolog or epilog.
Fig. 2-31: Prolog and epilog program
2.3.6 Release protocol between PLC and ePS system
Description of functions
Communication is performed between the ePS system and the PLC for the
execution of a test. The ePS system signals that a test will be executed with axis
movements. The PLC can then put the machine in a suitable state and signals to
the ePS system that the test can begin.
The protocol allows test series that are to be carried out with a maintenance
schedule to be executed in a fully automatic manner while being monitored by the
PLC.
More details are given in /R1/.
© Siemens AG 2008 All Rights Reserved
2-60 ePS Network Services, Function Manual (FH) - Release 12/2008
Page 61

12/2008 2 Maschine information
2.3 Test series on the machine
2.3.7 Contour test
Description of functions
A dry run is possible to ensure measurements can safely be performed on the
machine. The machine operator has the option of executing a dry run with reduced
velocity before beginning the test run configured to a specific type. This allows the
operator to test for safety path motions (contour monitoring) of the machine axes to
avoid collisions, etc.
Fig. 2-32: Selecting the contour test
Field Description Type
Contour test A contour test can be run to check that the
ACTION
measurement part program is collision-free
before actual measurement.
The contour test can also be carried out with the
function "single block execution" active.
Measurement Selection of the "Measurement type" tab. The
ACTION
measurement can be performed once the notes
have been read and understood.
© Siemens AG 2008 All Rights Reserved
ePS Network Services, Function Manual (FH) - Release 12/2008
2-61
Page 62
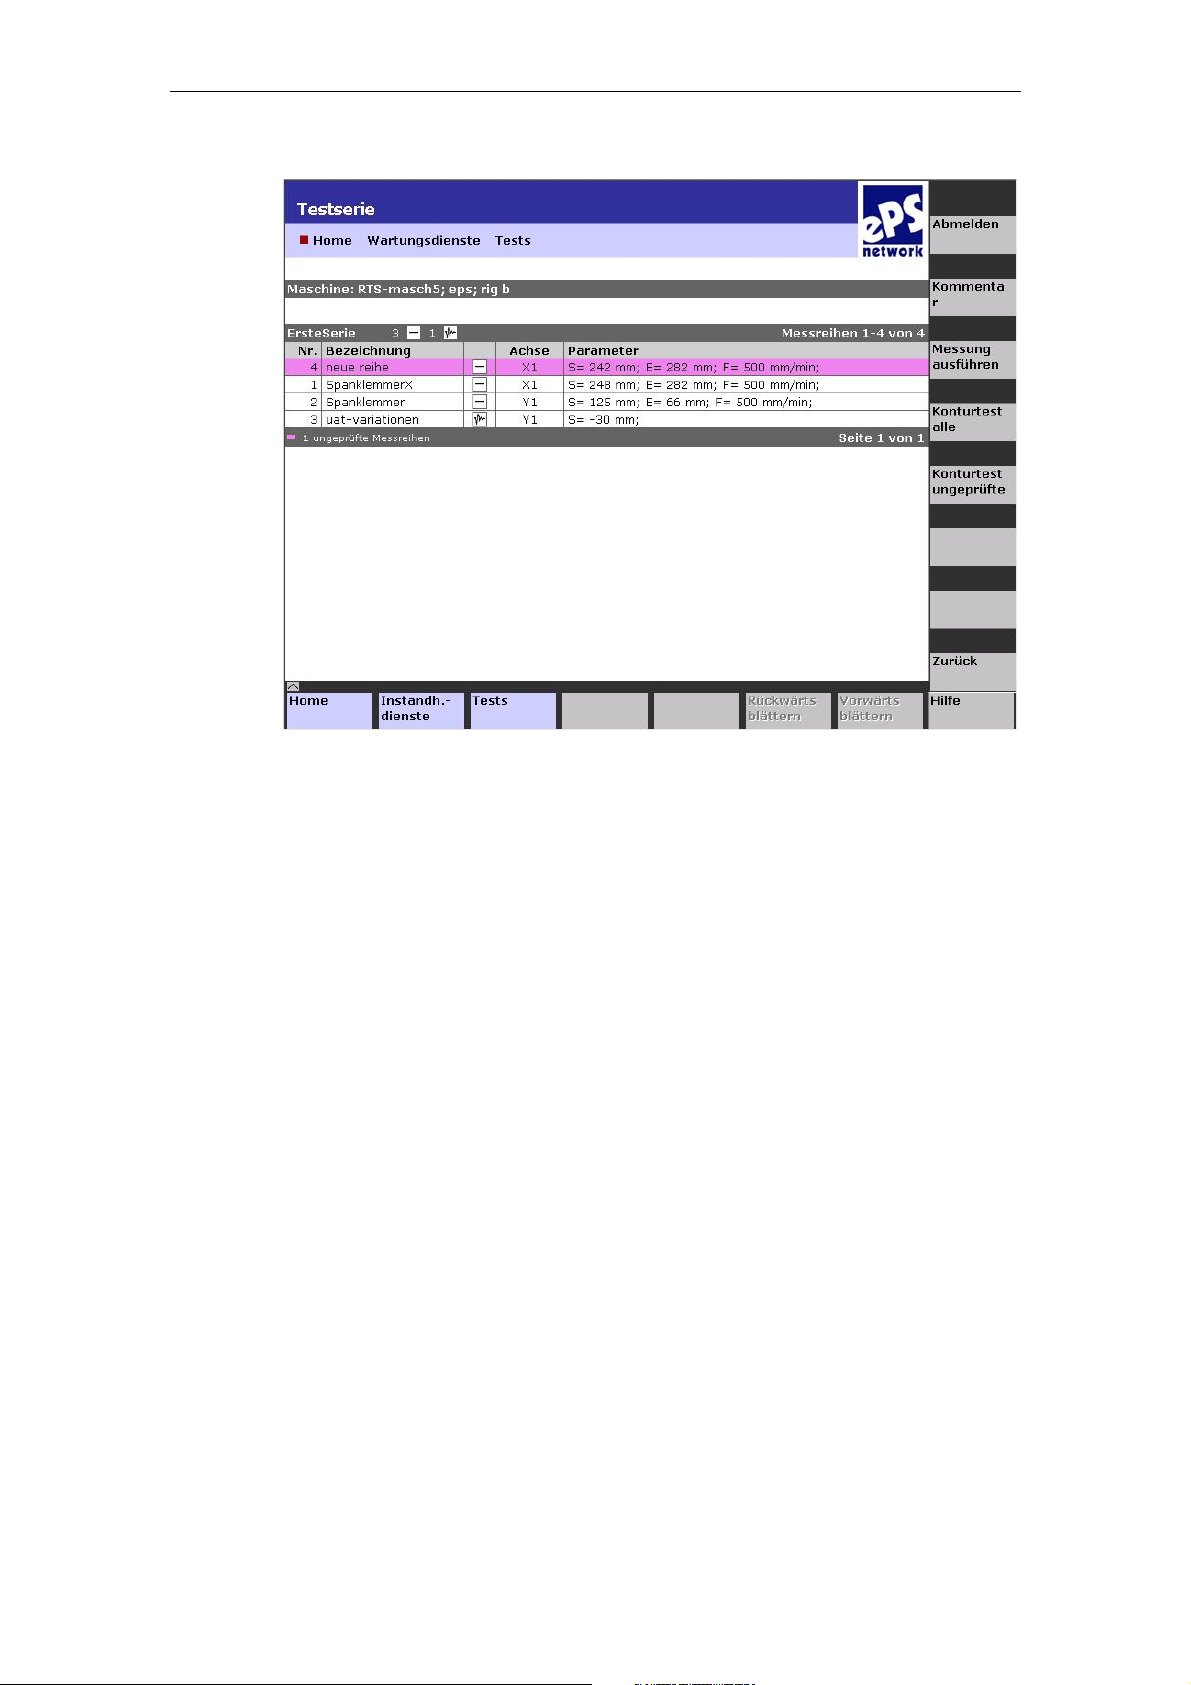
2 Maschine information 12/2008
2.4 Maintenance
Fig. 2-33: Measurement series of a test series
2.4 Maintenance
Description of functions
Entering via "Machine information" "Maintenance jobs" provides an overview of
the jobs that are pending or complete for the single machine that is currently
selected.
The overview of the maintenance jobs on the PC (see Section 4.1.1) is used for the
following purposes:
• Obtaining an overview:
• Editing jobs:
Of the jobs that are pending and already
complete; progress monitoring, planning
service applications.
Automatic editing of controlled maintenance
jobs on an individual basis, via control
monitors and maintenance schedules
Changes made to the job here are on a oneoff basis and do not affect the original
maintenance schedules.
Editing maintenance jobs is only possible for
new jobs that are not due, open or closed.
© Siemens AG 2008 All Rights Reserved
2-62 ePS Network Services, Function Manual (FH) - Release 12/2008
Page 63

12/2008 2 Maschine information
2.4 Maintenance
• Changing work instructions:
• Changing execution time:
• Editing comments:
If other tasks that were not known at the time
of planning must be completed along with
those specified in the maintenance schedule
If you change the work instruction, please
note that this is only valid for the selected
maintenance job. Any necessary
modifications to the underlying maintenance
schedule must be made via the "Set up
function" menu "Maintenance schedules".
Editing maintenance jobs is only possible for
new jobs that are not due, open or closed.
E.g. scheduling tasks that can or should be
performed together for the same day
Editing maintenance jobs is only possible for
new jobs that are not due, open or closed.
Adding comments for the tasks that have
been performed or have not been performed;
attaching detailed service report files to the
job
Editing comments is only possible for new
jobs that are not due, open or closed.
• Acknowledging jobs:
• Deleting jobs:
The maintenance procedures carried out are
acknowledged as OK or Not OK and then
closed.
Jobs can be deleted in their entirety.
This does not affect the underlying
maintenance schedules and control
mechanisms.
Deleting maintenance jobs is only possible
for new jobs that are not due, open or
closed.
© Siemens AG 2008 All Rights Reserved
ePS Network Services, Function Manual (FH) - Release 12/2008
2-63
Page 64

2 Maschine information 12/2008
2.5 Remote access
2.5 Remote access
2.5.1 Remote access functions
Overview
Remote access is an efficient and low-cost way of providing support for machine
tools and production equipment via the Internet.
In the event of a fault, the service organization of the machine manufacturer has
fast access to important control data and diagnostic functions. In that way, the
machine manufacturer or maintenance department of the end user can
immediately analyze the current condition of the machine in which a fault occurred.
Remote access avoids time-consuming in-situ service assignments or at least
helps prepare for them better. Machine manufacturers can therefore reduce their
warranty costs while providing more efficient servicing support for their end users.
Summary of the most important functions
The following functions are available during a link with the machine control. These
functions enable diagnostics and fault rectification via the machine control. It is
usually up to the service technician to execute the function. The technician can
work on all problems via remote access on a PC with a mouse and keyboard.
Function Property
Chat
Desktop sharing
Transfer file
Video
Recording and playback
Remote printing
Permits the exchange of text messages with a
participant in the service session.
Permits the display and remote control of machine
control. For security reasons, however, it is not
possible to initiate machine movements or to start
NC programs. Within the function, areas of the
screen can be marked with the Annotate function,
which is similar to text marker.
Permits the transfer of single or multiple files or
directories. Transfer can be from the service PC
to the machine control or vice versa. This enables
the import of patches to correct errors, for
example. The machine control can also be
updated quickly. Even complex NC programs can
be transferred to the service employee for offline
testing or to the service technician for modification
via file transfer.
Permits the transmission of video images of a
webcam to the machine control
Enable storage of the entire service session or
parts of the service session for training or
archiving purposes.
Permits the printing on a local printer of the
service PC of documents or graphics that are
displayed on the control. This also installs the
printer driver "Active Touch Document Loader" on
the machine control.
© Siemens AG 2008 All Rights Reserved
2-64 ePS Network Services, Function Manual (FH) - Release 12/2008
Page 65

12/2008 2 Maschine information
2.5 Remote access
2.5.2 Functions of a service session
Description of functions
The following functions are available during a link with the machine control. These
functions enable diagnostics and fault rectification via the machine control. It is
usually up to the service technician to execute the function. The technician can
work on all problems via remote access on a PC with a mouse and keyboard.
Several service employees and specialists can work together in a service session
to solve a problem. The service technician who establishes the service session first
keeps control of all functions throughout the service session. All other service
technicians can only observe what is going on. If necessary, the first service
technician can pass on and take back control to or from another service technician
within a desktop control session.
The entire session can also be passed on to a second service employee.
Function Property
Dialog via text window
(Chat)
Remote display of the
operator interface HMI
(Desktop view)
Remote control of all
operating functions
(Desktop control)
Data transfer
(Transfer file)
Conference link
(Transfer session)
You can exchange text messages with the
machine operator online via a chat window. The
"Chat" function can be started without the need to
obtain the machine operator's agreement.
The "Desktop view" function is used to observe all
operating steps at the operator interface of the
machine HMI. That enables you to detect
remotely on the service PC which functions are
triggered on the control. You can provide the
machine operator with instructions using the
annotation function.
You can use the "Desktop control" function to
execute all operating functions of the machine
control via remote access. For safety reasons,
however, it is not possible to initiate machine
movements or to start NC programs.
You can use the "Transfer file" function to transfer
data between the machine control and your
service PC. Data transfer is possible in both
directions.
Which functions and views of drives are used
within data transfer depends on the type of
session set.
You can use the "Assist online support" function
to invite other specialists to join the teleservice
session. The person you invite to join a
teleservice session that is currently underway has
the option of either providing active support or
simply participating in the teleservice as an
observer.
© Siemens AG 2008 All Rights Reserved
ePS Network Services, Function Manual (FH) - Release 12/2008
2-65
Page 66
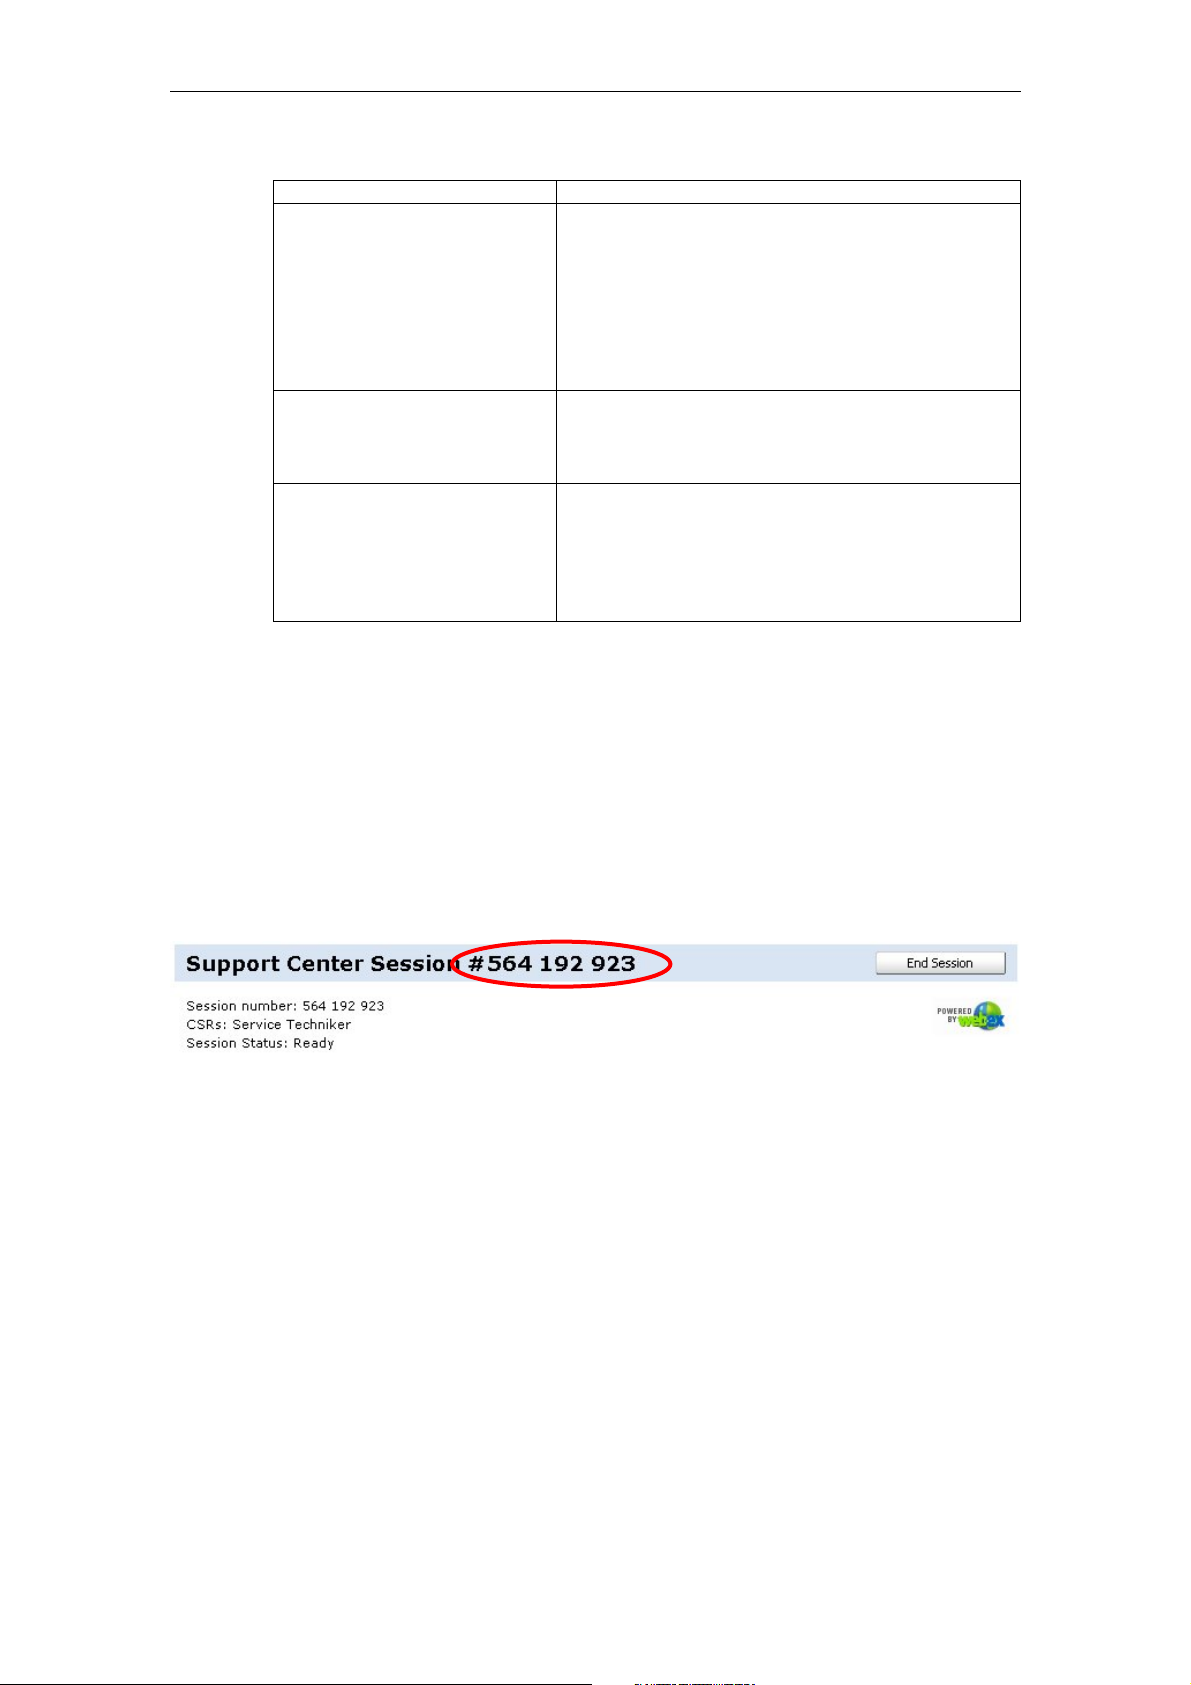
2 Maschine information 12/2008
2.5 Remote access
Function Property
Remarks
(Annotate)
The "Annotate" function provides a kind of marker
pen function. You can use this marker pen to give
the machine operator instructions within the
following functions:
• Remote display - application view and
desktop view
• Remote control - application control and
desktop control
Video transmission from the
PC of the service engineer
(video session)
You can use the "Show video" function to transfer
a video image from your workstation to the
machine operator. This can be used to show a
drawing, for example.
Remote printing
(Remote print)
A special printer can be activated on the control.
If data is output to this printer, it is redirected to
your service PC during an online link. This
enables a printout of important information to be
forwarded to you. The printout is then output on
the printer of the service PC.
2.5.3 Starting a service session
Overview
To open a teleservice session, select main menu item "Machine information" and
then menu item "Run teleservice". Go to the "Remote access" section and click on
the "Run teleservice" link.
The session ID shown is transferred to the machine operator:
Fig. 2-34: Transfer session ID
© Siemens AG 2008 All Rights Reserved
2-66 ePS Network Services, Function Manual (FH) - Release 12/2008
Page 67
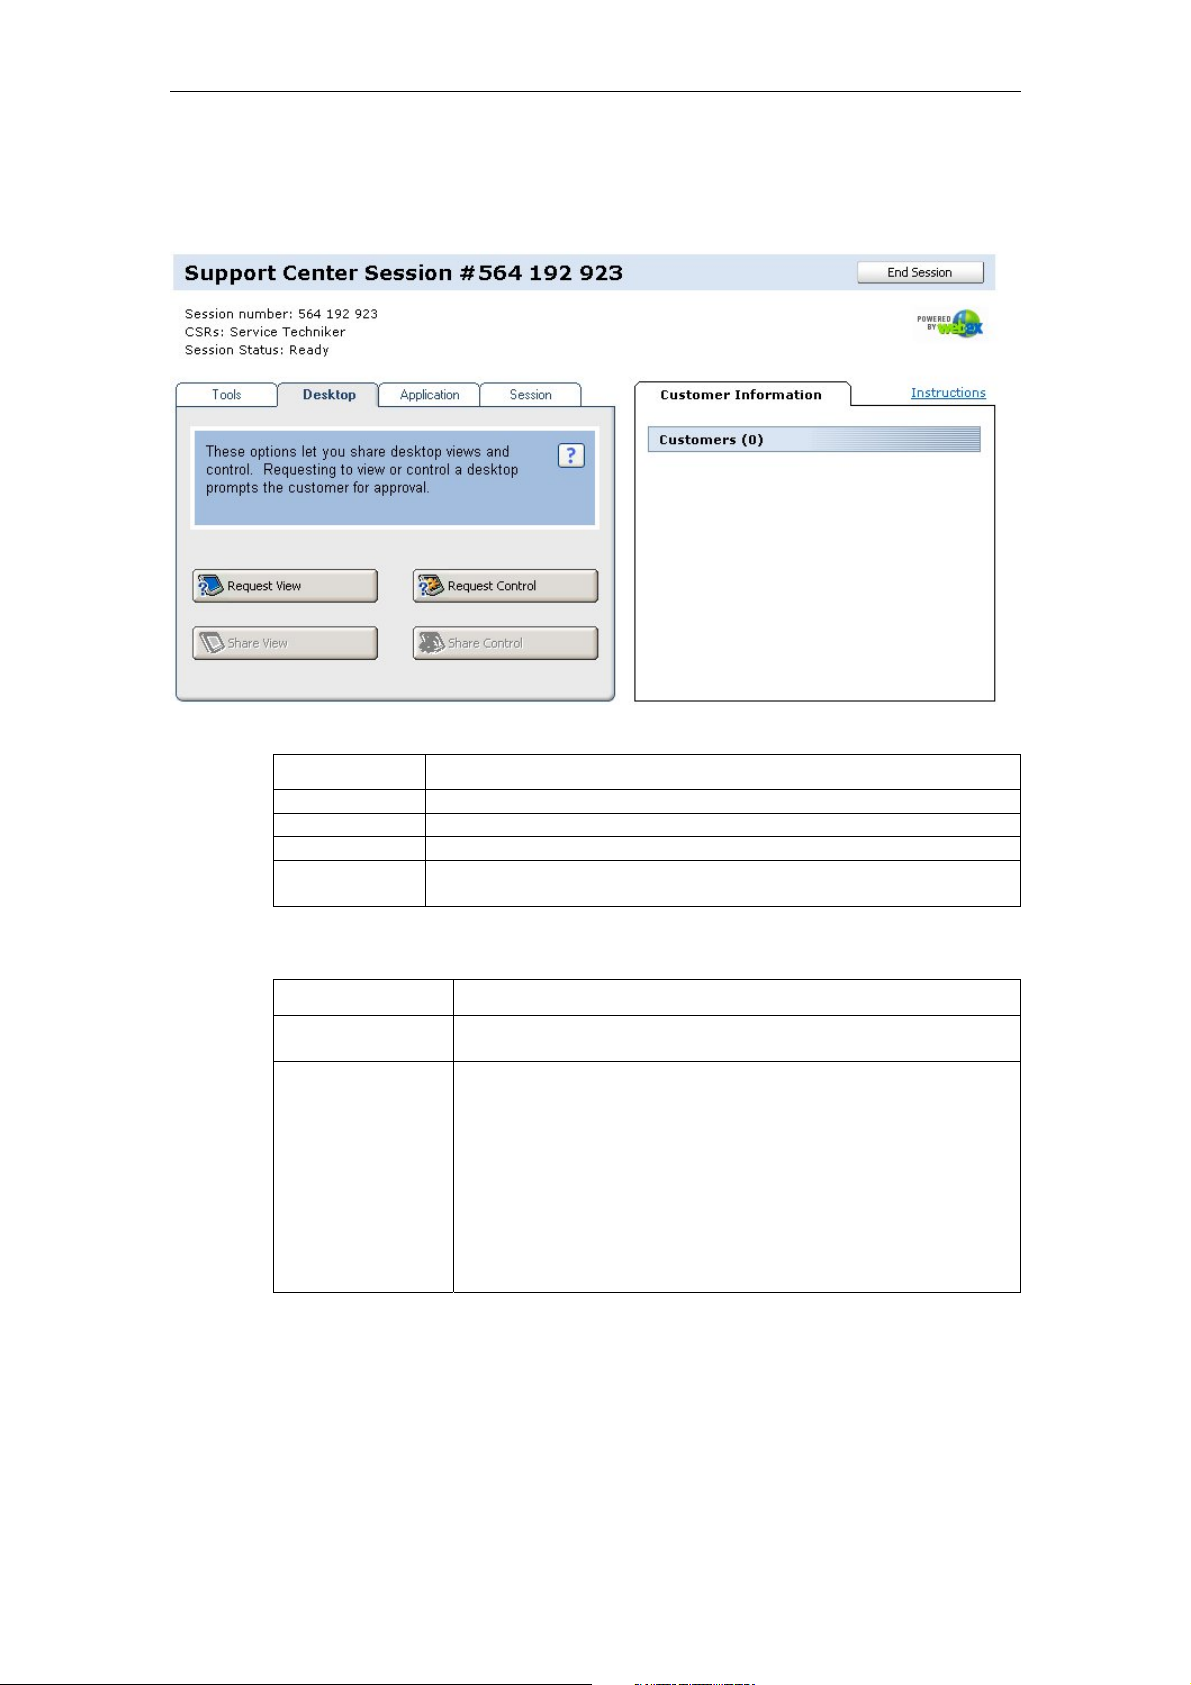
12/2008 2 Maschine information
2.5 Remote access
Description of functions
Fig. 2-35: Main menu of a support center session
Registers Content
Tools Selection of functions: chat, video, or file transfer
Desktop Selection of functions: desktop control or desktop view
Application No longer used starting with ePS Network Services V4.0
Session Selection of functions: transfer session, session options, or end
session
Functions on "Tools"
Function Description
Video This permits the transmission of video images of a webcam
from the service PC to the machine control.
Transfer file Permits the transfer of single or multiple files or directories.
Transfer can be from the service PC to the machine control
or vice versa. This enables the import of patches to correct
errors, for example. The machine control can also be
updated quickly. Even complex NC programs can be
transferred to the service employee for offline testing or for
modification via file transfer.
Which functions (advance or basis file transfer) and views of
drives are used within data transfer depends on the type of
session set for an organization.
© Siemens AG 2008 All Rights Reserved
ePS Network Services, Function Manual (FH) - Release 12/2008
2-67
Page 68

2 Maschine information 12/2008
2.5 Remote access
Function Description
Chat Once initiated, the chat function allows each participant to
send text messages. The participant can choose another
participant to whom he/she wishes to send a message;
alternatively, he/she can broadcast the message to all
service employees who are logged on.
The chat function can be started within the menu at any time.
For communication with the machine operator, it is advisable
to start the chat function before executing the "Desktop
control" function or transferring a file.
Note
It is not easy for the machine operator to operate the chat window without a
mouse. The machine operator can place the chat window in the background or
foreground via softkeys during a desktop control session. The chat window on the
machine control is automatically placed in the foreground if a text message is
received.
If the machine operator wants to send a text message on his or her own initiative
and the chat window is minimized, the operator can place the chat window in the
foreground via a softkey.
Functions under the "Desktop" tab
Function Description
Request View Permits display of a machine control:
Within the function, areas of the screen can be selected
with the Annotate function, which is similar to a text
marker. For safety reasons, however, it is not possible to
initiate machine movements or to start NC programs.
Request Control Permits control of a machine control:
Within the function, areas of the screen can be selected
with the Annotate function, which is similar to a text
marker. For safety reasons, however, it is not possible to
initiate machine movements or to start NC programs.
Functions under the "Session" tab
Function Description
Transfer session Transfer session control to another service technician
Session options Optimize display of complex graphics
End session Ending a service session
© Siemens AG 2008 All Rights Reserved
2-68 ePS Network Services, Function Manual (FH) - Release 12/2008
Page 69

12/2008 2 Maschine information
2.5 Remote access
2.5.4 Example of a session via remote access
Prerequisite
The service session has already been established. You want to open a chat
session with the machine operator, then control the machine control via the
desktop control, transfer data, and record the entire service session.
Starting a chat session
The chat function allows each participant to send text messages once it has been
started. The participant can choose the participant to which he or she wants to
send a message or broadcast the message to all service technicians who are
logged onto the system.
The chat function can be started within the menu at any time. For communication
with the machine operator, it is advisable to start the chat function before executing
the desktop control function or a file transfer.
Procedure
1. To start chatting, click the "Chat" button.
2. Select the recipient. The default setting is "All Participants".
3. Click the "Send" button to send the text message to the participant. You can
optionally use the enter key.
Fig. 2-36: Select recipient
Click the "−" button at the top right of the chat window to close the chat. If a
participant closes the chat window, the initiator receives a message. The person
who closed the Chat window cannot open it again. The initiator must end the chat
and restart it to give all participants a chat window again.
© Siemens AG 2008 All Rights Reserved
ePS Network Services, Function Manual (FH) - Release 12/2008
2-69
Page 70
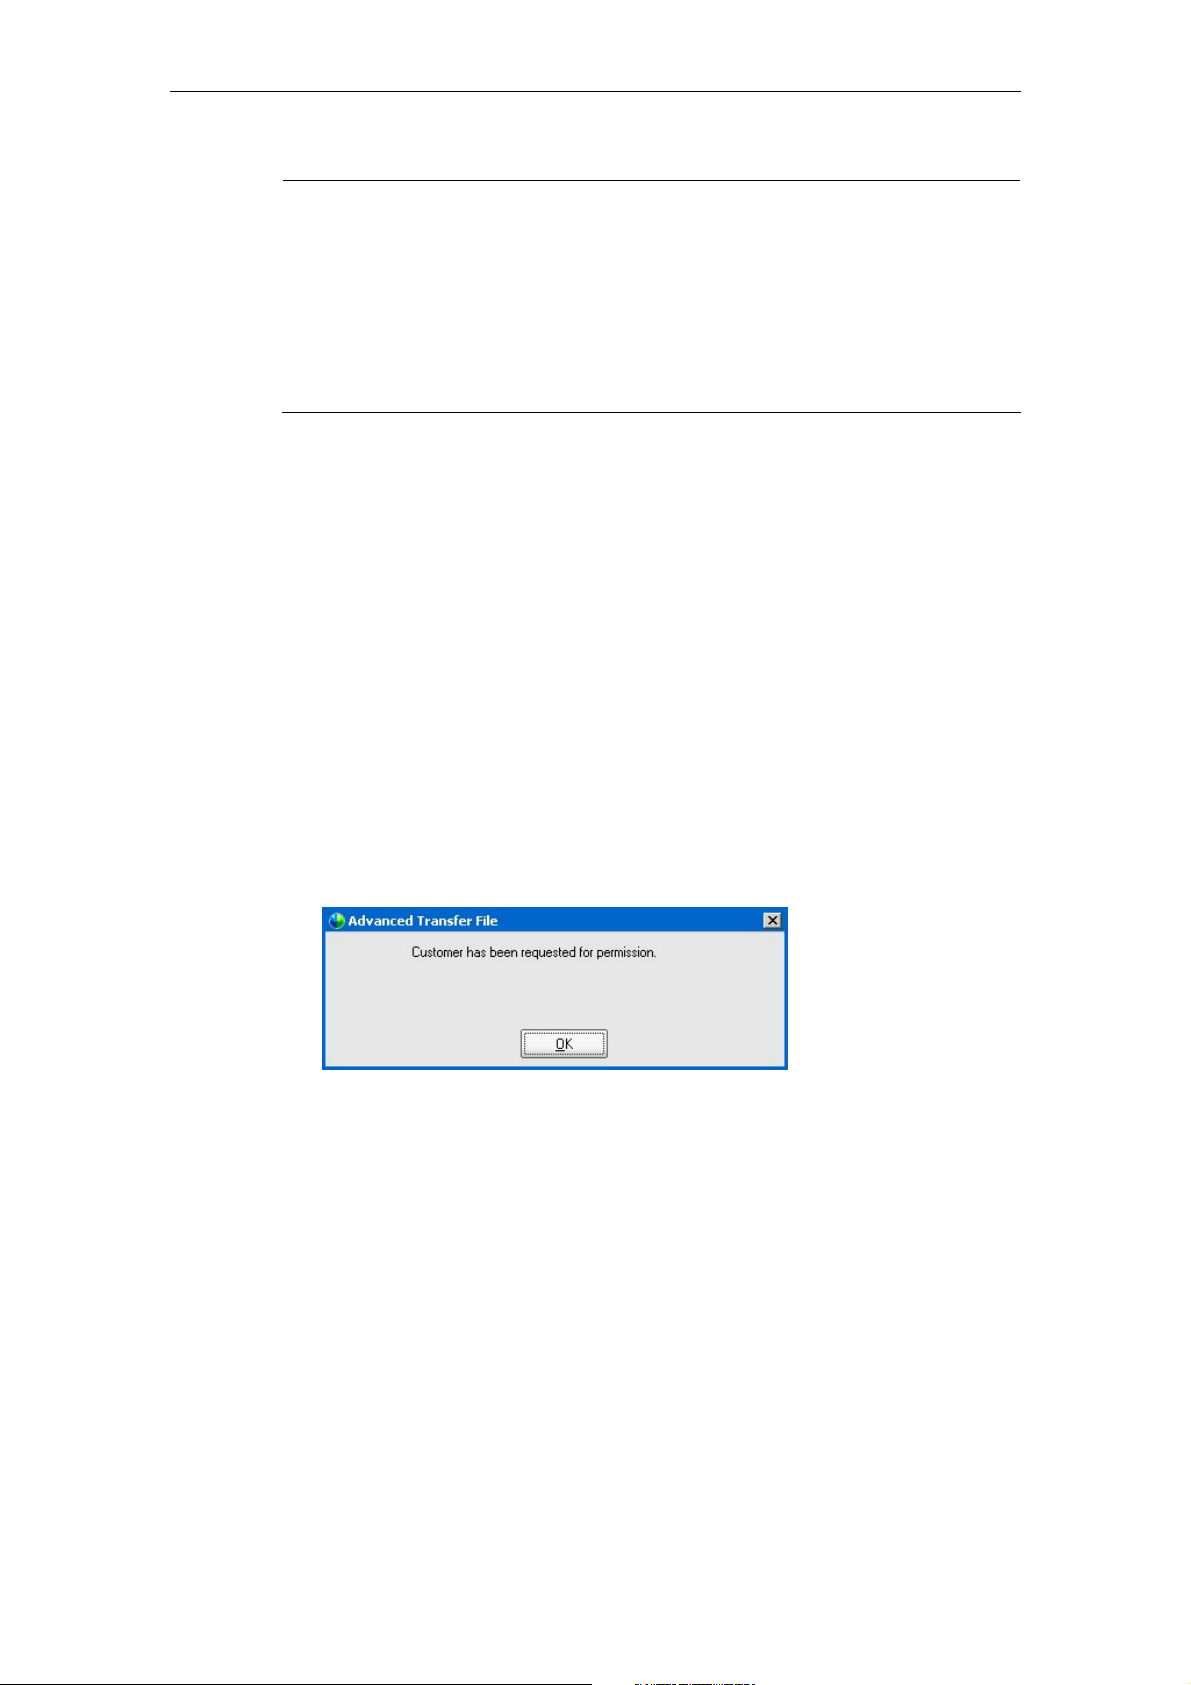
2 Maschine information 12/2008
2.5 Remote access
Note
It is not easy for the machine operator to operate the chat window without a
mouse. The service technician should therefore minimize the chat window during
a desktop control session. The chat window on the machine control is
automatically placed in the foreground if a text message is received.
If the machine operator wants to send a text message on his or her own initiative
and the chat window is minimized, the operator can place the chat window in the
foreground via a softkey.
2.5.5 Granting permission to execute functions
Prerequisite
If you want to take control of the machine control, the machine operator has to
grant you permission. The machine operator can grant you permission for the
requested "Desktop control" function alone, or for all functions that you may still
want to use during the service session.
Indicate to the machine operator that it is simpler for both to grant permission for
the entire session.
Desktop control
1. Go to the "Desktop" tab and click "Request Desktop Control ..."
The following display appears for your information. You can acknowledge it
with "OK".
Fig. 2-37: Requesting permission
2. As soon as permission has been granted at the machine end, the window is
acknowledged automatically.
In this dialog box, the machine operator permits monitoring of the machine
control, as well as general execution of all functions without prior confirmation
by the machine operator via "Grant Permissions for all actions …".
© Siemens AG 2008 All Rights Reserved
2-70 ePS Network Services, Function Manual (FH) - Release 12/2008
Page 71
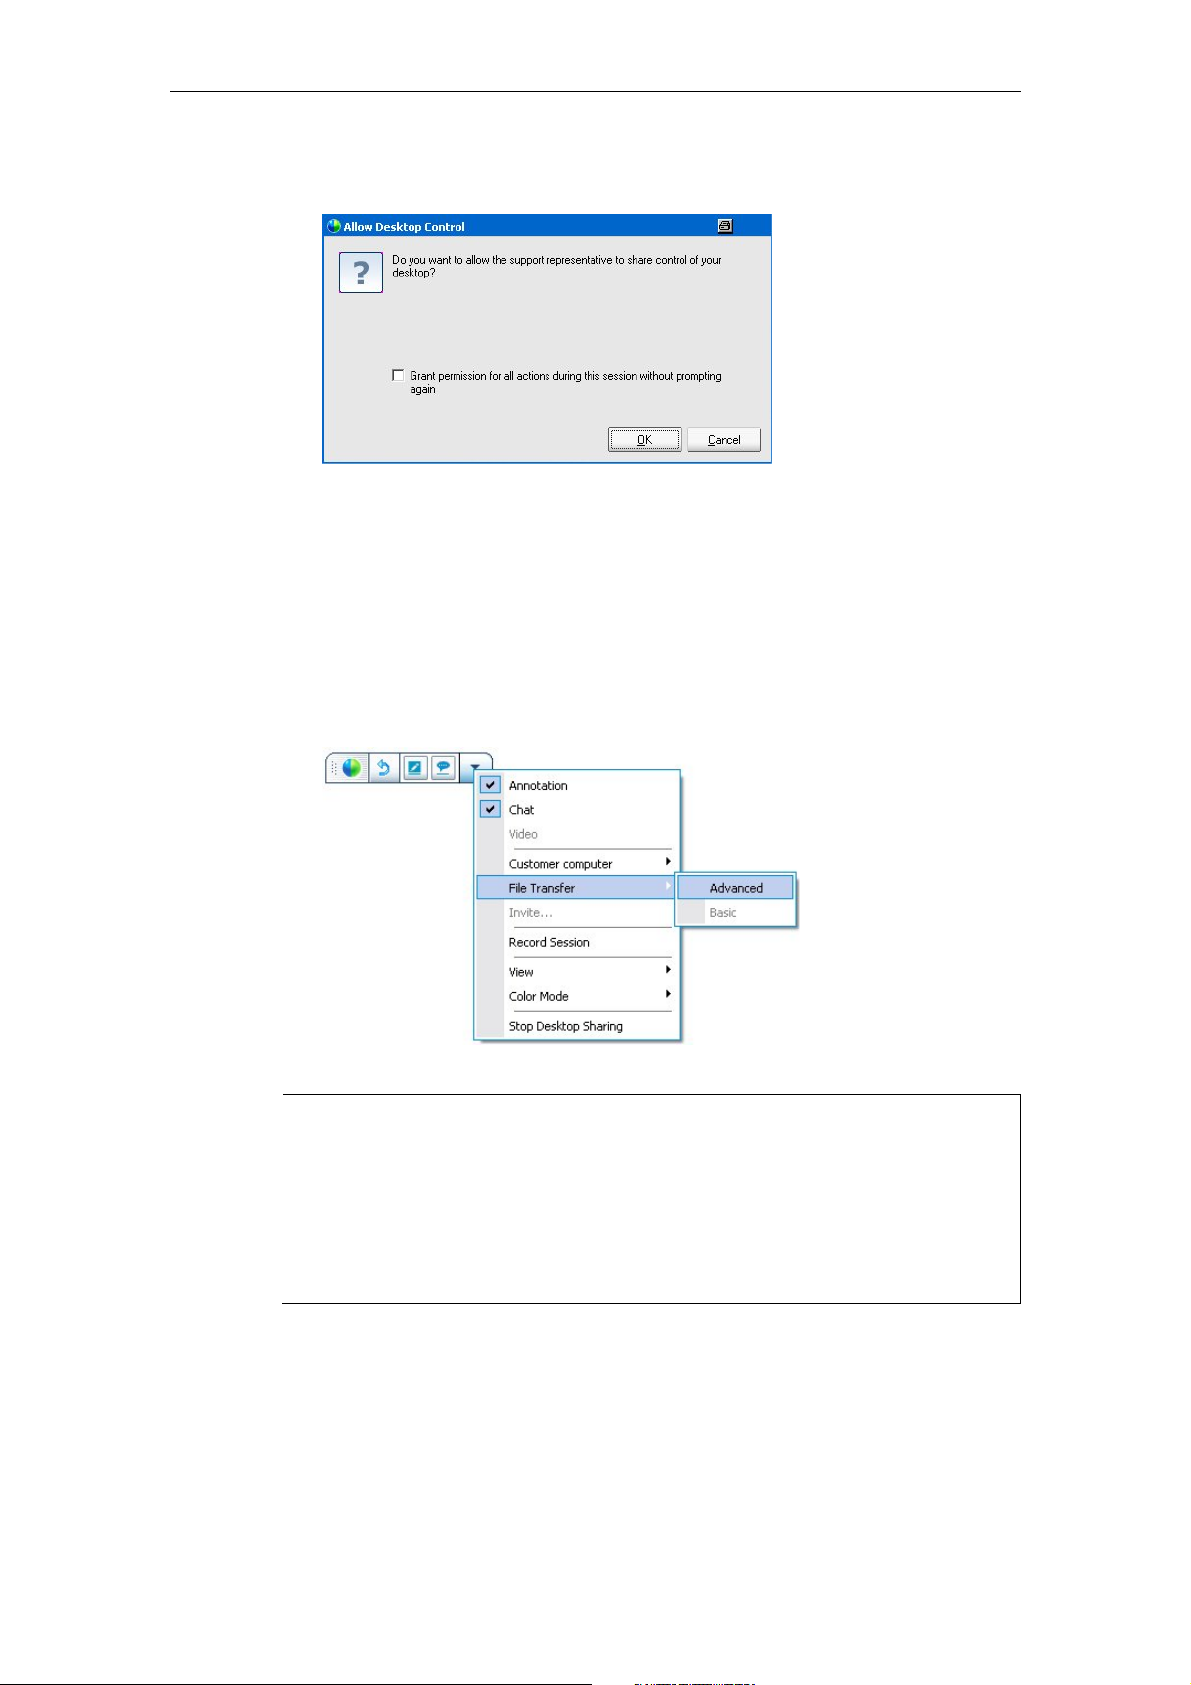
12/2008 2 Maschine information
2.5 Remote access
The following dialog box is displayed to the machine operator:
Fig. 2-38: Granting permission
Data transfer/"Advanced" transfer file:
3. Go to the "Tools" tab and click "Transfer files" in the menu.
The machine operator must agree to this file transfer. Unless the machine
operator has granted general permission to execute all functions, he or she
must agree to each individual transfer.
This transfer may contain one or more files or a whole directory. Alternatively,
you can select the file transfer within the desktop control by clicking on the
"Sharing" button top right, upon which the following dialog box opens.
Fig. 2-39: Starting file transfer
Note
It is advisable to perform data transfer at the ePS Network Services display level
because there are no HMI headers that reduce the screen content at this point. In
the case of file transfer within a desktop control session, both parties can view
and operate the file transfer window. If this is not desired or is not permitted, the
file transfer should only be started from the menu of the service technician. In this
"stand-alone" file transfer, only the service employee has control of the files to be
transferred.
© Siemens AG 2008 All Rights Reserved
ePS Network Services, Function Manual (FH) - Release 12/2008
2-71
Page 72

2 Maschine information 12/2008
2.5 Remote access
Fig. 2-40: Directory structure
4. Open a directory with a double-click. Click the back arrow to go to the next
level up.
To select several files, hold the <CTRL> key down during selection.
5. Data transfer is started by clicking the arrow buttons.
When data transfer has been started, the progress of transfer is indicated,
allowing you to estimate the remaining transfer time.
6. You can end the file transfer with the "X" button.
Fig. 2-41: End file transfer
© Siemens AG 2008 All Rights Reserved
2-72 ePS Network Services, Function Manual (FH) - Release 12/2008
Page 73

12/2008 2 Maschine information
2.5 Remote access
Recording a service session
7. Select the "Record Session" button. The "Record Session" dialog box opens.
Select the storage location and a file name for the Record File and confirm
this name with "Save".
Fig. 2-42: Recorder panel
8. The recorder panel is used to you select the various options and execute
actions.
Start recording by clicking the "Record" button.
You can pause recording at any time and then resume it by clicking "Pause".
To end recording, click the "Stop" button.
Ending desktop sharing
9. To cancel or end desktop sharing, click the "Sharing" button at the top righthand side of the desktop sharing window and select "Stop Desktop Sharing".
Fig. 2-43: "Stop Desktop Sharing"
Selecting screen contents during desktop control
1. To apply annotations or markings to the desktop, click the Sharing button at
the top right-hand corner of the Desktop Sharing window and select
"Annotation".
Fig. 2-44: "Annotation" toolbar
On the "Annotation" toolbar, the cursor changes shape to a marker pen with
which you can select areas of the machine control.
2. To end the "Annotation" function, click the "−" button at the top right-hand
corner of the toolbar.
© Siemens AG 2008 All Rights Reserved
ePS Network Services, Function Manual (FH) - Release 12/2008
2-73
Page 74
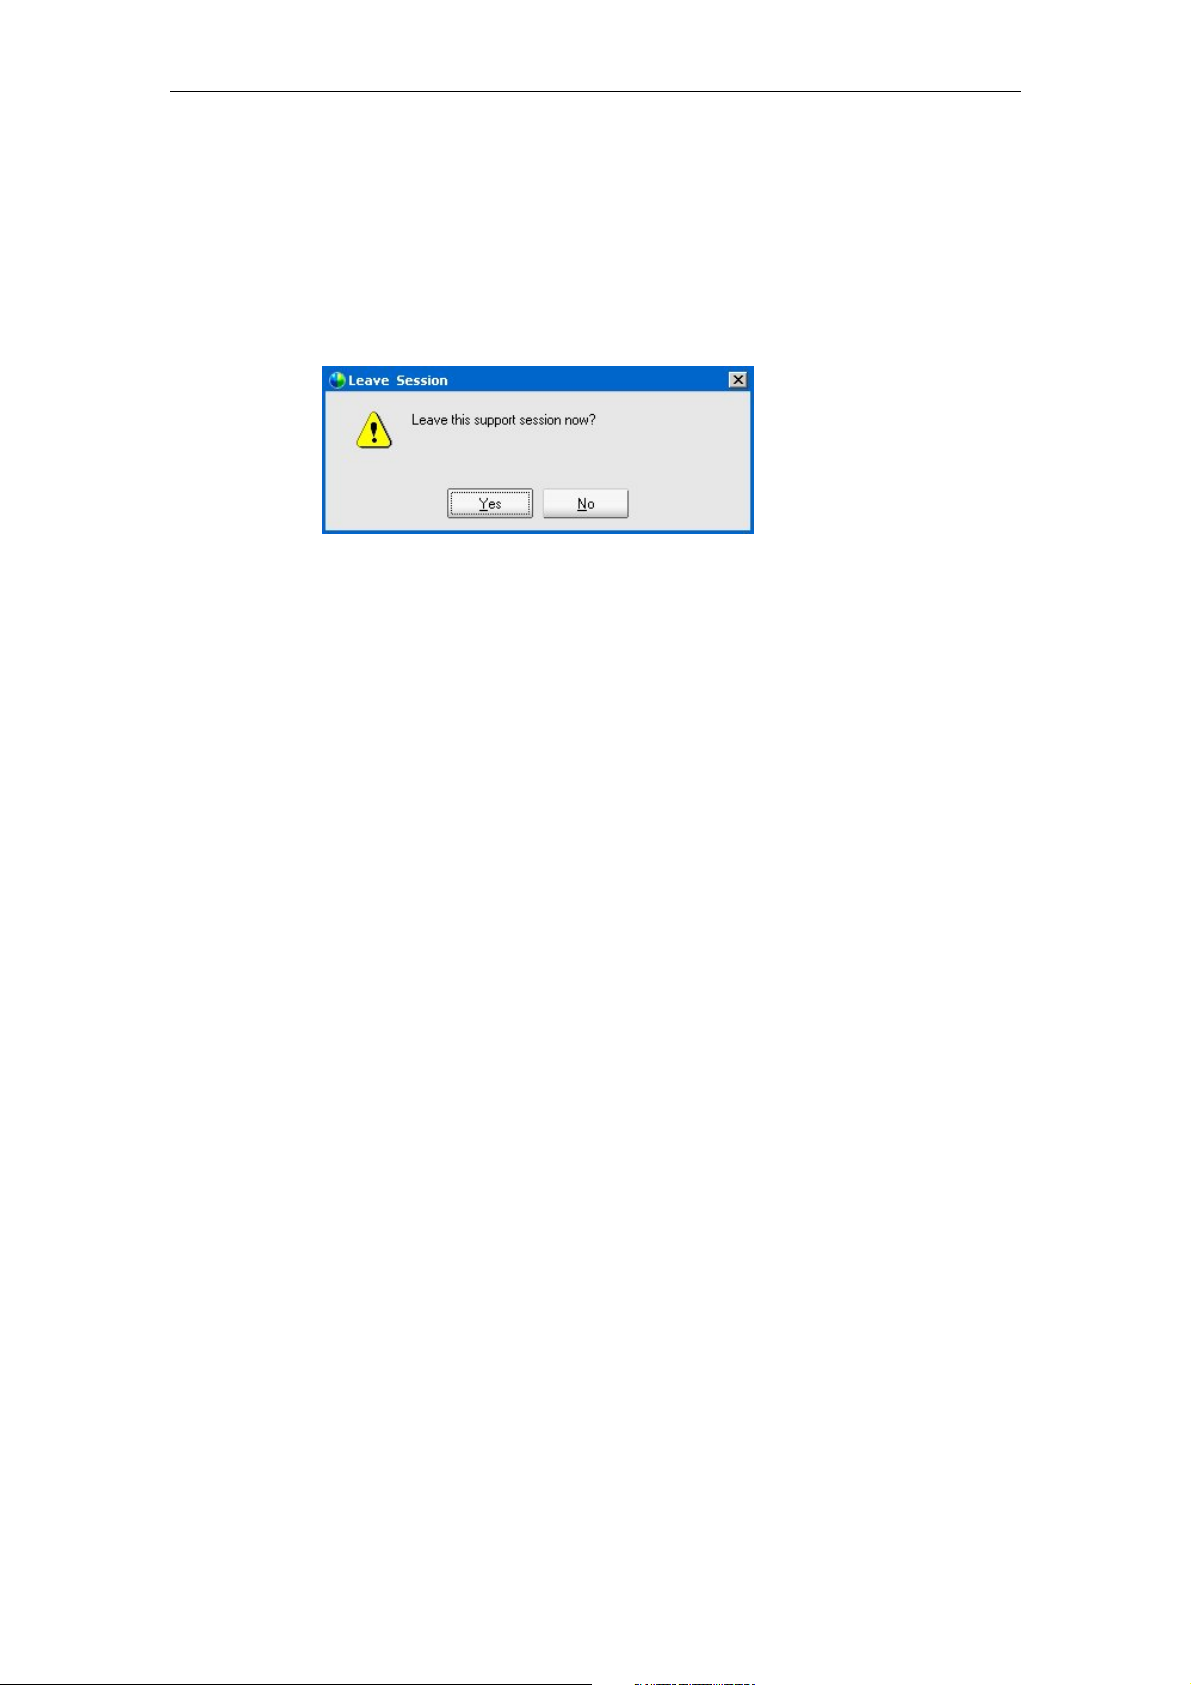
2 Maschine information 12/2008
2.5 Remote access
3. You must then click on the desktop of the machine control with the mouse to
get back mouse control.
Ending a service session
4. To end the service session, click the "Leave session" button. Confirm the end
of the session by clicking Yes.
Fig. 2-45: Leave session
2.5.6 Setting up a service conference call
Description of functions
Several service employees and specialists can work together in a service session
to solve a problem. The service technician who establishes the service session first
keeps control of all functions throughout the service session. All other service
technicians can only observe what is going on. If necessary, the first service
technician can pass on and take back control to or from another service technician
within a desktop control session.
The entire session can also be passed on to a second service employee. After that,
all functions must be confirmed again by the machine operator.
Example
Participants:
• "Service technician 1"
"Service technician 1" opens a "desktop control session" and can execute all
functions of the control.
• "Service technician 2"
"Service technician 2" is logged on with the name "Support Assist".
"Service technicians 2" sees the same content, but cannot execute functions.
(Exception: participating in the chat)
Transferring desktop control to "service technician 2" (Support Assist)
To transfer control, click the "Sharing" button in the top right-hand corner of the
Desktop Sharing window and select "Allow to Control Remotely".
Click on the participant "Support Assist" (example):
© Siemens AG 2008 All Rights Reserved
2-74 ePS Network Services, Function Manual (FH) - Release 12/2008
Page 75
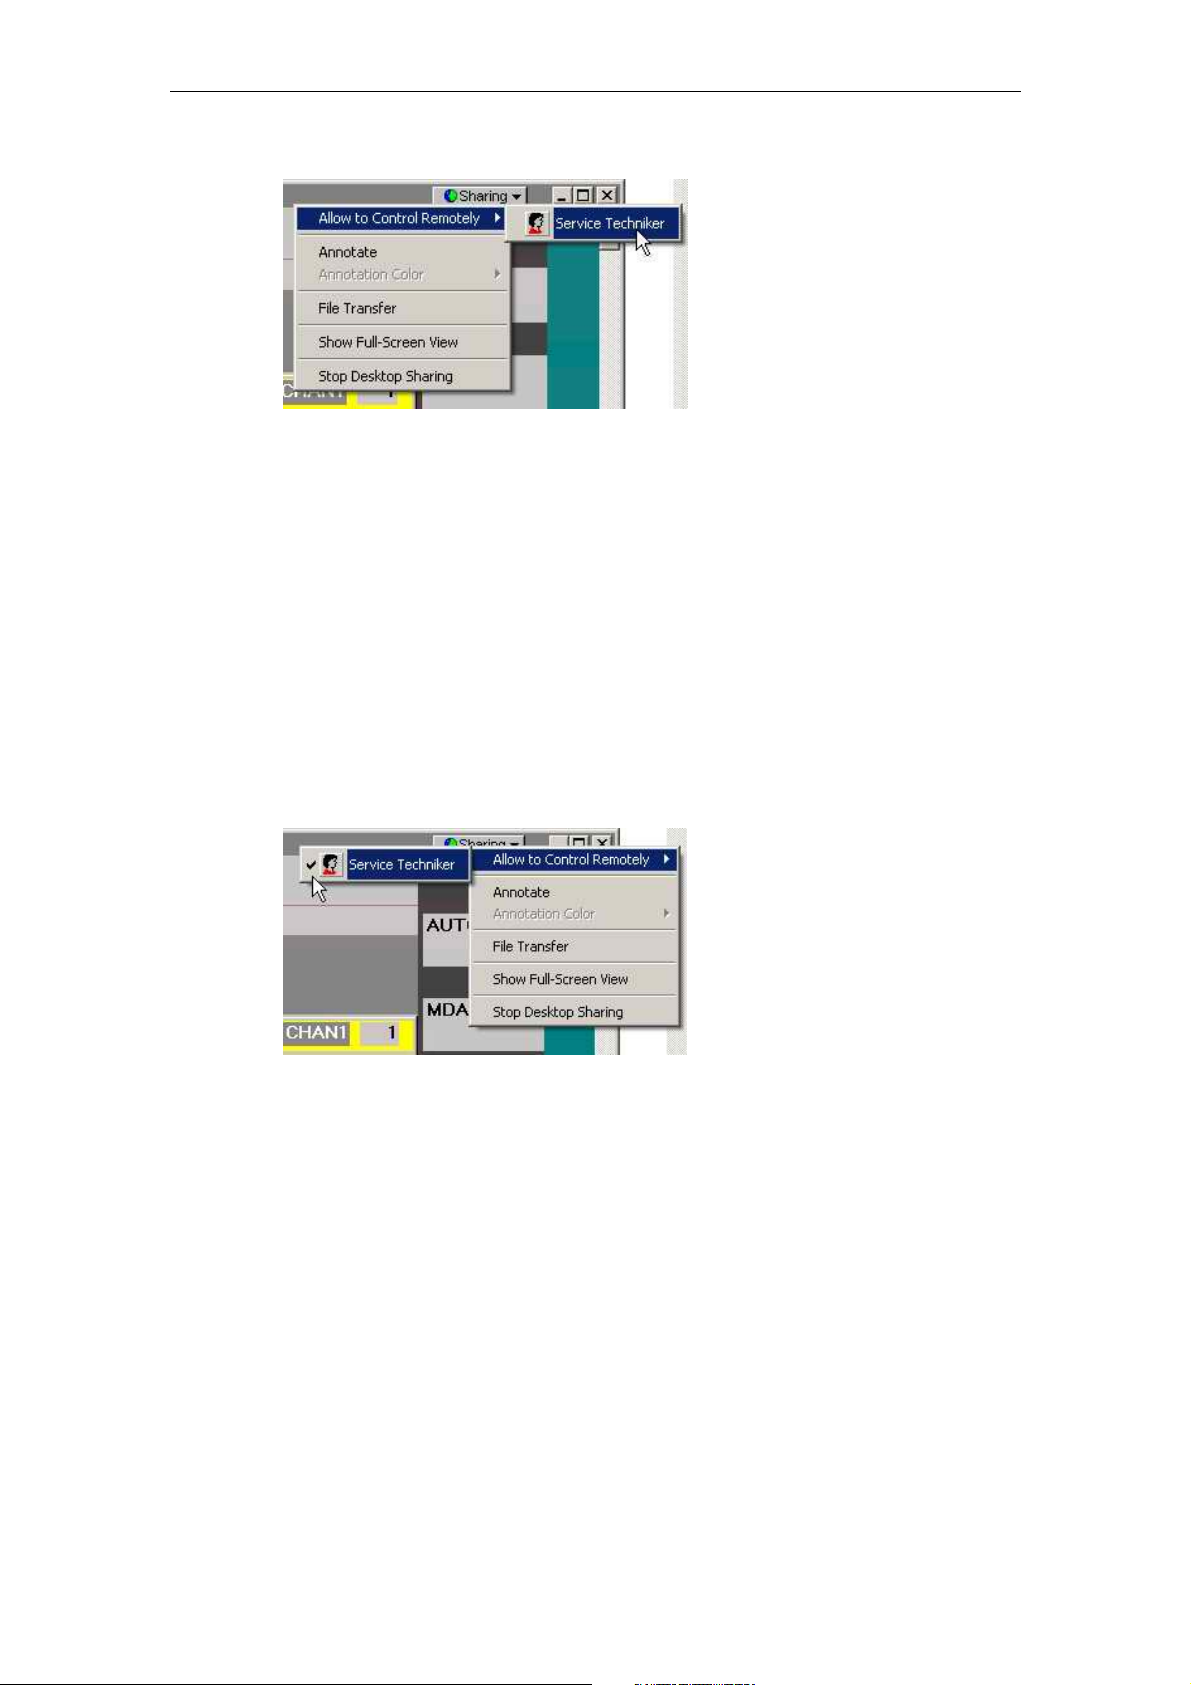
12/2008 2 Maschine information
2.5 Remote access
Fig. 2-46:
Control is transferred to "Service employee 2" for the current desktop control
function. He or she can now take over control by clicking on the desktop of the
machine control with the mouse.
"Service employee 2" can execute the following functions:
• Operate the machine control
• End desktop control
• Exit a service session
Transferring desktop control back from "service technician 2" (Support Assist)
"Service technician 1" can regain control. To transfer control, click the "Sharing"
button in the top right-hand corner of the Desktop Sharing window and select
"Allow to Control Remotely".
Click on the "Support Assist" participant and control is passed back to you.
Fig. 2-47:
© Siemens AG 2008 All Rights Reserved
ePS Network Services, Function Manual (FH) - Release 12/2008
2-75
Page 76

2 Maschine information 12/2008
2.5 Remote access
Transfer of the entire service session
If "service employee 1" transfers the entire service session to "service
employee 2", "service employee 1" can continue to observe the session or leave
the session without closing the entire service session.
"Service employee 1" clicks the "Transfer Session" button.
Fig. 2-48:
A selection menu with the name of the other service technicians who are logged
onto this session is displayed. "Service technician 1" selects "service technician 2"
(example: Support Assist) and acknowledges with OK.
From this point on, "service employee 1" can only participate as an observer. All
functions are deactivated in his/her menu.
"Service employee 2" has taken over the service session completely and can now
let "service employees 3, 4, 5", etc., take part in the session. The service session
can be transferred any number of times.
Note
Transferring the service session within the desktop view or desktop control
terminates the desktop view or desktop control function.
© Siemens AG 2008 All Rights Reserved
2-76 ePS Network Services, Function Manual (FH) - Release 12/2008
Page 77
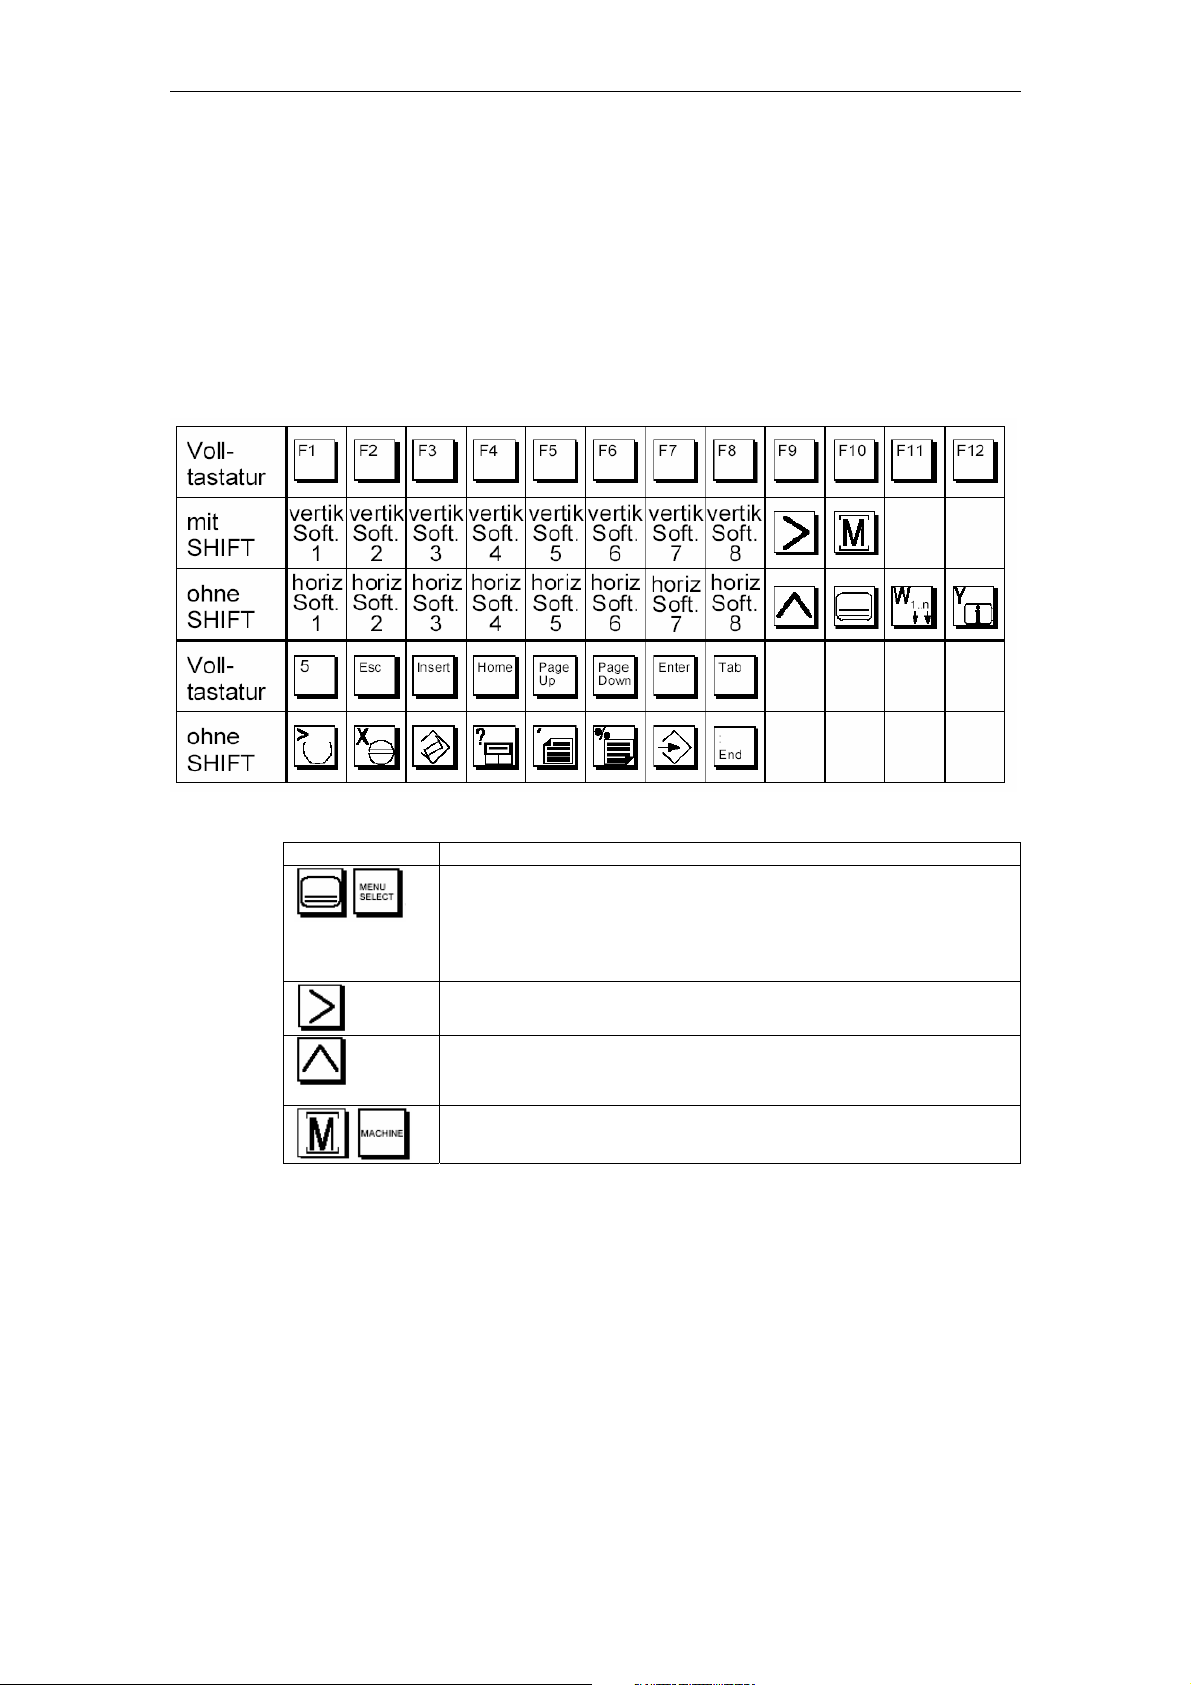
12/2008 2 Maschine information
2.5 Remote access
2.5.7 Remote control via the keyboard
Description of functions
In a service session the special function keys on the operator keyboard can also be
operated using the keyboard of the service PC via remote access. The following
table shows the keys on the PC to which the horizontal and vertical softkeys and
the special keys for the SINUMERIK keyboard are mapped.
Fig. 2-49: Special keys
Key Meaning
Area switchover key
You can call the main menu from any operating area by
pressing this key. Pressing the key twice in succession
changes from the current operating area to the previous one
and back again.
Etc. key
Expansion of the horizontal softkey bar in the same menu.
<Recall> key
The <Recall> key goes to the next highest menu. It also closes
a window.
Machine area key
Direct jump to the "Machine" operating area.
© Siemens AG 2008 All Rights Reserved
ePS Network Services, Function Manual (FH) - Release 12/2008
2-77
Page 78

2 Maschine information 12/2008
2.5 Remote access
Notes
© Siemens AG 2008 All Rights Reserved
2-78 ePS Network Services, Function Manual (FH) - Release 12/2008
Page 79

12/2008 3 Setting up functions
3.1 Maintenance
3
3 Setting up functions
Overview
The functions below are set up, defined and executed in the "Set up functions"
area for a selected machine and its corresponding maintenance and monitoring:
Setting up functions
Maintenance
►
Maintenance schedules
►
Variable monitors
►
Measuring series
►
Test series
►
Prolog and epilog for measurement
►
ePS variables
Fault services
►
Control monitors
Global settings
►
PLC and NC settings
►
Notification limitation
Copying function settings
►
Copying function settings
►
Copying function settings to multiple
machines
Client-server communication
[ Display overview ]
Display an overview of all functions set up
►
Synchronization times
►
Offline synchronization
►
Monitoring ePS services
© Siemens AG 2008 All Rights Reserved
ePS Network Services, Function Manual (FH) - Release 12/2008
3-79
Page 80

3 Setting up functions 12/2008
3.1 Maintenance
All functions and user configurations set up
In the overview of configurations, the first column displays the type of configuration;
the "Name" column displays the configuration names (arranged alphabetically); the
"Required for" column displays other configurations where this subconfiguration is
used; and the "Dependent on" column shows which other configurations are used
as subconfigurations in this configuration.
A gradual fading is used for configuration names that cannot be displayed in full.
The overview can be completely printed out for documentation purposes (printer
icon
c ).
The overview can be exported for the purpose of comparing the configurations and
names, and can be compared with overview exports of other machines in a
spreadsheet program, for example (d icon).
Note
The symbols are only available if a machine is selected.
As soon as a machine is selected, the function for displaying a group-based
overview of all the configurations that the user has created for the machine
becomes available. If required, the selection for display can be set up in the main
functions menu.
d
c
Fig. 3-1: Displaying overview
© Siemens AG 2008 All Rights Reserved
3-80 ePS Network Services, Function Manual (FH) - Release 12/2008
Page 81

12/2008 3 Setting up functions
3.1 Maintenance
3.1 Maintenance
3.1.1 Creating maintenance schedules
Description of functions
The maintenance schedules contain the maintenance-related tasks to be
performed on the machine (maintenance, inspection, and servicing).
Maintenance procedures may be logged in the schedule in a purely text-based
format; alternatively, "intelligent" maintenance procedures, which automatically
determine data via axis tests in order to performing purposeful status-oriented
maintenance, may also be logged.
• The schedules are activated in a control monitor either on a timer- or event-
triggered basis or as a combination of both. The maintenance schedule then
becomes a maintenance order and is due for the responsible organization.
A schedule always applies to just one machine.
• The maintenance jobs are produced on a time-controlled basis, in time
intervals, on an event-triggered basis, or in event-triggered intervals. This is
executed via the universal trigger of a control monitor.
• A maintenance job via a control monitor only becomes pending when the
control monitor is initiated, and is then due immediately.
• Maintenance schedules can be updated at any time: This only affects
maintenance schedules that will be output after the changes have been made,
and not those that have already been output. This also applies if a schedule is
deleted.
Note
If users are logged on to the control as machine operator, they can process the
pending jobs. For machines with version V3, they do not have to be a member of
the target organization; for machines of version V4, they require authorization to
act as machine operator (MO) for this machine.
© Siemens AG 2008 All Rights Reserved
ePS Network Services, Function Manual (FH) - Release 12/2008
3-81
Page 82

3 Setting up functions 12/2008
3.1 Maintenance
Fig. 3-2: Maintenance schedules - List view
Field Content Type
Search Expandable window for filtering
maintenance schedules
Delete filter
Entries in the search window are deleted,
DISPLAY
INPUT
ACTION
and all maintenance schedules are
displayed unfiltered.
The screen remains, but the content is
updated.
Filter
Entries in the search window are used for
ACTION
filtering, and only the filtered maintenance
schedules are displayed.
The screen remains, but the content is
updated.
Responsible org. To further limit the maintenance schedule
display, you can set a filter for the
DISPLAY
SELECTION
organization responsible for carrying out the
maintenance.
Number of lines The number in the display indicates the
number of lines per screen that can be
DISPLAY
SELECTION
shown in this menu. You can select up to
200 lines. A scroll bar will then be displayed
on the screen.
© Siemens AG 2008 All Rights Reserved
3-82 ePS Network Services, Function Manual (FH) - Release 12/2008
Page 83

12/2008 3 Setting up functions
3.1 Maintenance
Field Content Type
Maintenance schedules
• "Create new" icon
Screen changes to an empty
ACTION
maintenance schedule menu for
creating a new schedule.
• "Edit" icon
Screen changes to an existing
ACTION
maintenance schedule menu for editing.
• Name
• "Hand" icon
Name of the maintenance schedule DISPLAY
Displays an icon when the maintenance
DISPLAY
schedule requires tasks to be performed
manually.
• Responsible org.
Displays the organization responsible for
DISPLAY
the maintenance schedule.
• "Copy" icon
Opens the maintenance schedule as if
ACTION
for editing.
The next time you save the maintenance
schedule, it will be saved as a new
maintenance schedule. If you do not
change the name, a consecutive
number will automatically be added.
• "Delete" icon
Deletes the maintenance schedule. The
ACTION
maintenance schedule will only be
deleted if you acknowledge the
confirmation prompt. If you cancel the
prompt, the deletion will not take place.
Fig. 3-3: Editing a maintenance schedule
Field Content Type
Name Short name for the maintenance
procedure. This is also located in the
overview of maintenance jobs on the
ePS Network Services PC and the
machine HMI.
© Siemens AG 2008 All Rights Reserved
ePS Network Services, Function Manual (FH) - Release 12/2008
DISPLAY
INPUT
(Max. 40
characters; any
character
permissible)
3-83
Page 84

3 Setting up functions 12/2008
3.1 Maintenance
Field Content Type
Responsible org. Organization allocated to carry out
the job in this schedule.
Note:
This information is added to the jobs
from this schedule. However, any
organization with access to this
machine can change or delete the
jobs in this schedule.
Number of lines The number in the display indicates
the number of lines per screen that
can be shown in this menu. You can
select up to 200 lines. A scroll bar will
then be displayed on the screen.
Work instruction Explanatory description of the
maintenance task
Link test series Selection of a test series to be
carried out in the framework of the
maintenance job.
Automatically
executing a test series
Link measurement
series
Add file To provide more details about the
Time when the maintenance job is to
be performed
Selection of the "series of
measurements" condition monitor in
which the result of the measurement
is updated as part of a maintenance
job.
Note:
Only one series of measurements
can be selected from the series of
measurements available on the
machine.
task, documents with more
information can be appended.
DISPLAY
SELECTION
DISPLAY
SELECTION
(4 to 20)
DISPLAY
INPUT
SELECTION
SELECTION
SELECTION
DISPLAY
ACTION
Note:
The machine operator at the operator
panel can only view documents in
PDF format.
© Siemens AG 2008 All Rights Reserved
3-84 ePS Network Services, Function Manual (FH) - Release 12/2008
Notice
Changes to maintenance schedules are not applied to pending maintenance jobs.
Changes to maintenance schedules are applied to all maintenance jobs that are
not yet due at the time they become due.
Page 85

12/2008 3 Setting up functions
3.1 Maintenance
Security note on displaying PDF documents
Notice
PDF documents to be displayed on the control operator panel must not contain
any active contents (Java script, e-mail fields, etc.) nor have any HTML Links!
Otherwise there is a danger that it may be possible to navigate from the ePS
system to other Web pages.
ePS Network Services can display PDF documents compatible with Acrobat 1.3
(Reader Version 4.x) on the control operator panel.
For optimum display, please create your PDF documents with the option "Initial
View: Page Only/ Magnification Fit Width".
3.1.2 Configuring variable monitors
Overview
You configure a variable monitor in the following steps:
1. Select the variable monitor or create a new variable monitor.
2. Name the variable monitor; comments and icons can be added as an option.
3. Define the PLC variables.
4. Use a control monitor to execute the variable monitor.
Selecting or creating variable monitors
Since it is possible for each machine to have several variable monitors, there is the
option of sorting them in the overview display either by their names or by the two
classification fields. In addition, it is possible to filter them by searching for specific
parts of text that appear in the Name and Variables columns using the "Search
text" box.
© Siemens AG 2008 All Rights Reserved
ePS Network Services, Function Manual (FH) - Release 12/2008
3-85
Page 86

3 Setting up functions 12/2008
3.1 Maintenance
Fig. 3-4: Select the variable monitor
Fig. 3-5: Configure the variable monitor
Make the following entries to configure a variable monitor:
Field
Content
Name Name of the variable monitor DISPLAY
Triggered from
control monitor
Selection of a control monitor that is to
trigger the variable monitor.
New creation of a control monitor that
is to trigger the variable monitor.
Icon and text Selection of an icon stored in the
system and naming the icon selected.
Notice:
The text entered applies to the entire
Type
INPUT
(Max. 40 charac-
ters; any character
permissible)
DISPLAY
SELECTION
MENU
DISPLAY
SELECTION
INPUT
(Max. 40 charac-
ters; any character
permissible)
© Siemens AG 2008 All Rights Reserved
3-86 ePS Network Services, Function Manual (FH) - Release 12/2008
Page 87

12/2008 3 Setting up functions
3.1 Maintenance
Field
Content
Type
machine and overwrites any existing
text.
Comment Individual text for the variable monitor DISPLAY
INPUT
(Max. 2000 charac-
ters; any character
permissible)
Last
Time stamp of last data capture DISPLAY
measurement
Variables Table of variables configured in the
DISPLAY
variable monitor
Time series Display the time series for the
DISPLAY
selected variable
Name Name of the variable DISPLAY
Warning limit Display the configured values for the
DISPLAY
warning limits
Critical limit Display the configured values for the
DISPLAY
critical limit
Edit Switches to menu to select, add,
Activate limit value of type upper limit ACTION
Activate limit value of type lower limit ACTION
Display the variable as diagram ACTION
Remove variable from the
ACTION
configuration of the variable monitor
ACTION
delete, change variables.
Save Save the changes to the configuration
ACTION
and return to the calling page.
Cancel Discard the changes to the
ACTION
configuration and return to the calling
page.
© Siemens AG 2008 All Rights Reserved
ePS Network Services, Function Manual (FH) - Release 12/2008
3-87
Page 88

3 Setting up functions 12/2008
3.1 Maintenance
Configuring tag
The system provides a selection of predefined variables which can be added to the
variable monitor configuration simply by selecting them.
Fig. 3-6: Variable monitor – configure variables
Field Content Type
Open the form to configure a new
variable
Edit the configuration of a freely defined
variable
Name Name of the variable DISPLAY
Axis With variables that refer to an axis, the
name of the machine axis is displayed
here.
The reference to an axis can be
changed as long as no data was
captured for this variable.
[ ] The unit for the variable is displayed in
this column.
This function is used to create a copy of
the variable.
Remove the variable from the
configuration and delete the data for
this variable
ACTION
ACTION
DISPLAY
SELECTION
DISPLAY
ACTION
ACTION
© Siemens AG 2008 All Rights Reserved
3-88 ePS Network Services, Function Manual (FH) - Release 12/2008
Page 89
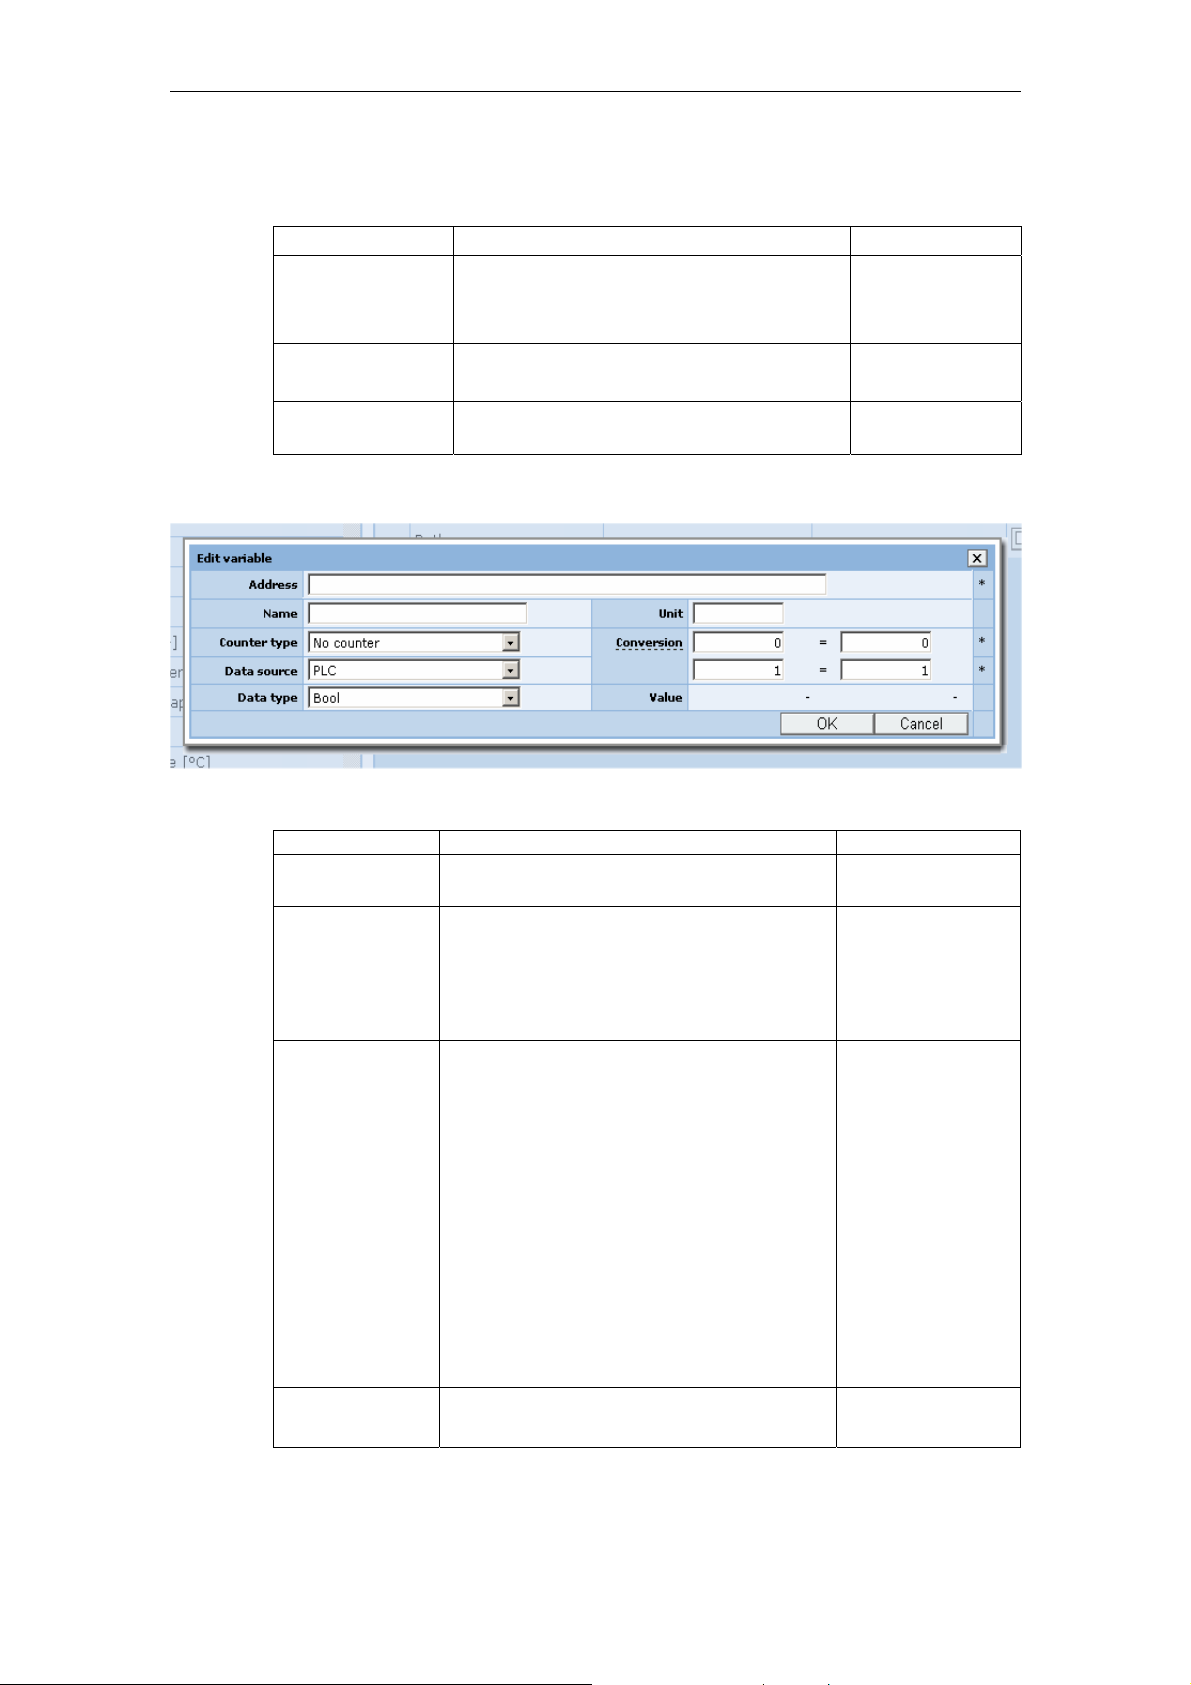
12/2008 3 Setting up functions
3.1 Maintenance
Add variables by selecting them from predefined variables:
Field
Content
Axis The variables that can be selected refer to
one axis each. This axis is defined with
this selection field.
Select all All variables that are available are
selected.
Add The selected variables are added to the
Type
DISPLAY
SELECTION
MENU
SELECTION
ACTION
configuration of the variable monitor.
As an alternative a form can be used to configure any variables.
Fig. 3-7: Variable monitor - select variable
Field Content Type
Address Absolute address in the original syntax of
the data source
Name Optional name for variable, which will then
be used in the variable menu instead of
the absolute address
Counter type No counter:
the variable is always processed with the
current variable value.
Up counter:
the variable is used by the system as an
endless difference totalizer.
Notice:
Bit variables cannot undergo format
changes and cannot be defined as
counters.
Note:
Except for bit variables, all variable
formats can be changed.
Data source e.g.
• PLC:
DISPLAY
INPUT
DISPLAY
INPUT
(Max. 40
characters; any
character
permissible)
DISPLAY
SELECTION
DISPLAY
SELECTION
© Siemens AG 2008 All Rights Reserved
ePS Network Services, Function Manual (FH) - Release 12/2008
3-89
Page 90

3 Setting up functions 12/2008
3.1 Maintenance
Field Content Type
The address is interpreted in
S7 syntax.
• NC:
Address in the syntax of the NC
interface. (DocOnCD – Parameter
Manual 2 from 01/2008, 6FC53973CP10-3AA0 or Toolbox NC
Varselector – Help on BTSS
Data type Interpretation of the variable value in
Variables).
permissible S7 syntax.
Note
:
DISPLAY
SELECTION
The type can always be matched to the
variable and modified within the
permissible formats.
Unit Unit of variables to be recorded DISPLAY
INPUT
Value Display of the current variable value and
converted variable value.
Input and display of the dimension in a
unit for the converted value.
DISPLAY
INPUT
(Max. 5
characters; any
character
permissible)
Conversion
• Output:
Input of 2 values for the real variable
value.
• Converted:
DISPLAY
INPUT
(Max. 32 digits)
Specification for the associated dimensioned values.
Changes to the configuration are not effective until the machine is synchronized.
© Siemens AG 2008 All Rights Reserved
3-90 ePS Network Services, Function Manual (FH) - Release 12/2008
Page 91

12/2008 3 Setting up functions
3.1 Maintenance
Notice
PLC data source:
By default, PLC addresses are restricted to the address range of the smallest
PLC.
To remove this restriction if you are using a more powerful PLC and want to use
the addresses in ePS, you must increase the corresponding values in the trigger
DB (DB239 in ePS Standard) in DW8 for inputs, DW10 for outputs, DW12 for bit
memory, DW14 for timers, and DW16 for counters to the available address
ranges. You must then restart the PC on which the ePS client is installed.
Warning
PLC data source:
Using the trigger DB with an increased address range can cause the PLC to shut
down when the higher addresses are used in ePS configurations if this address
range is not actually available to the connected PLC.
Using (a) control monitor(s) to execute the variable monitor
The "Trigger variable monitor(s)" diagnostic action is used to detect the PLC
variable values promptly and store them on the ePS server. It is only possible to
access the data manually via the machine events or variable monitor data series.
Limit value triggers can be used to react automatically to the variable values via
control monitors.
See also:
• 3.4.1 Control monitors – List view
• 3.3.16 Diagnostic actions
© Siemens AG 2008 All Rights Reserved
ePS Network Services, Function Manual (FH) - Release 12/2008
3-91
Page 92

3 Setting up functions 12/2008
3.2 Configuring measurements and measurement series
3.2 Configuring measurements and measurement series
Description of functions
Configuration of measurements and measurement series it when you define the
parameters required for measurement. The configurations created are always
stored with the measurements and can be used again to repeat the measurements.
That especially applies to measurement series. The configuration of a
measurement series ensures that measurements are made with the same settings
every time. This permits evaluation of the progression of characteristics over time.
In addition to parameters for performing a measurement, the limit values of the
characteristics are also configured. Limit values can be configured for
measurement series. The configuration is only possible on the PC. Individual
measurements that do not belong to a measurement series cannot have limit
values.
Availability and privileges
On the operator panel, a measurement is configured or a measurement series
configuration changed only during the measurement procedure. On the operator
panel, it is only possible to create a measurement series based on a measurement
being performed.
On the PC, it is possible to configure measurement series. The authorization
required to configure measurements and measurement series is described in detail
in the Appendix.
3.2.1 Circularity test
Parameter description
Parameters for conducting a circularity test:
Field Content Type
Name Name of the measurement series
Channel Selection of the required channel:
Axes Selection of possible pairs of geometric
Center point X1 Specification of the center coordinates of
Center point Y2 Specification of the center coordinates of
Diameter Diameter of circle INPUT
Feed Path velocity of the circular movement INPUT
INPUT
(measurements do not have a name).
SELECTION
The channel defines the possible axis pairs
in the "Axes" selection list.
SELECTION
axes
INPUT
the circle for the first axis
INPUT
the circle for the second axis
© Siemens AG 2008 All Rights Reserved
3-92 ePS Network Services, Function Manual (FH) - Release 12/2008
Page 93
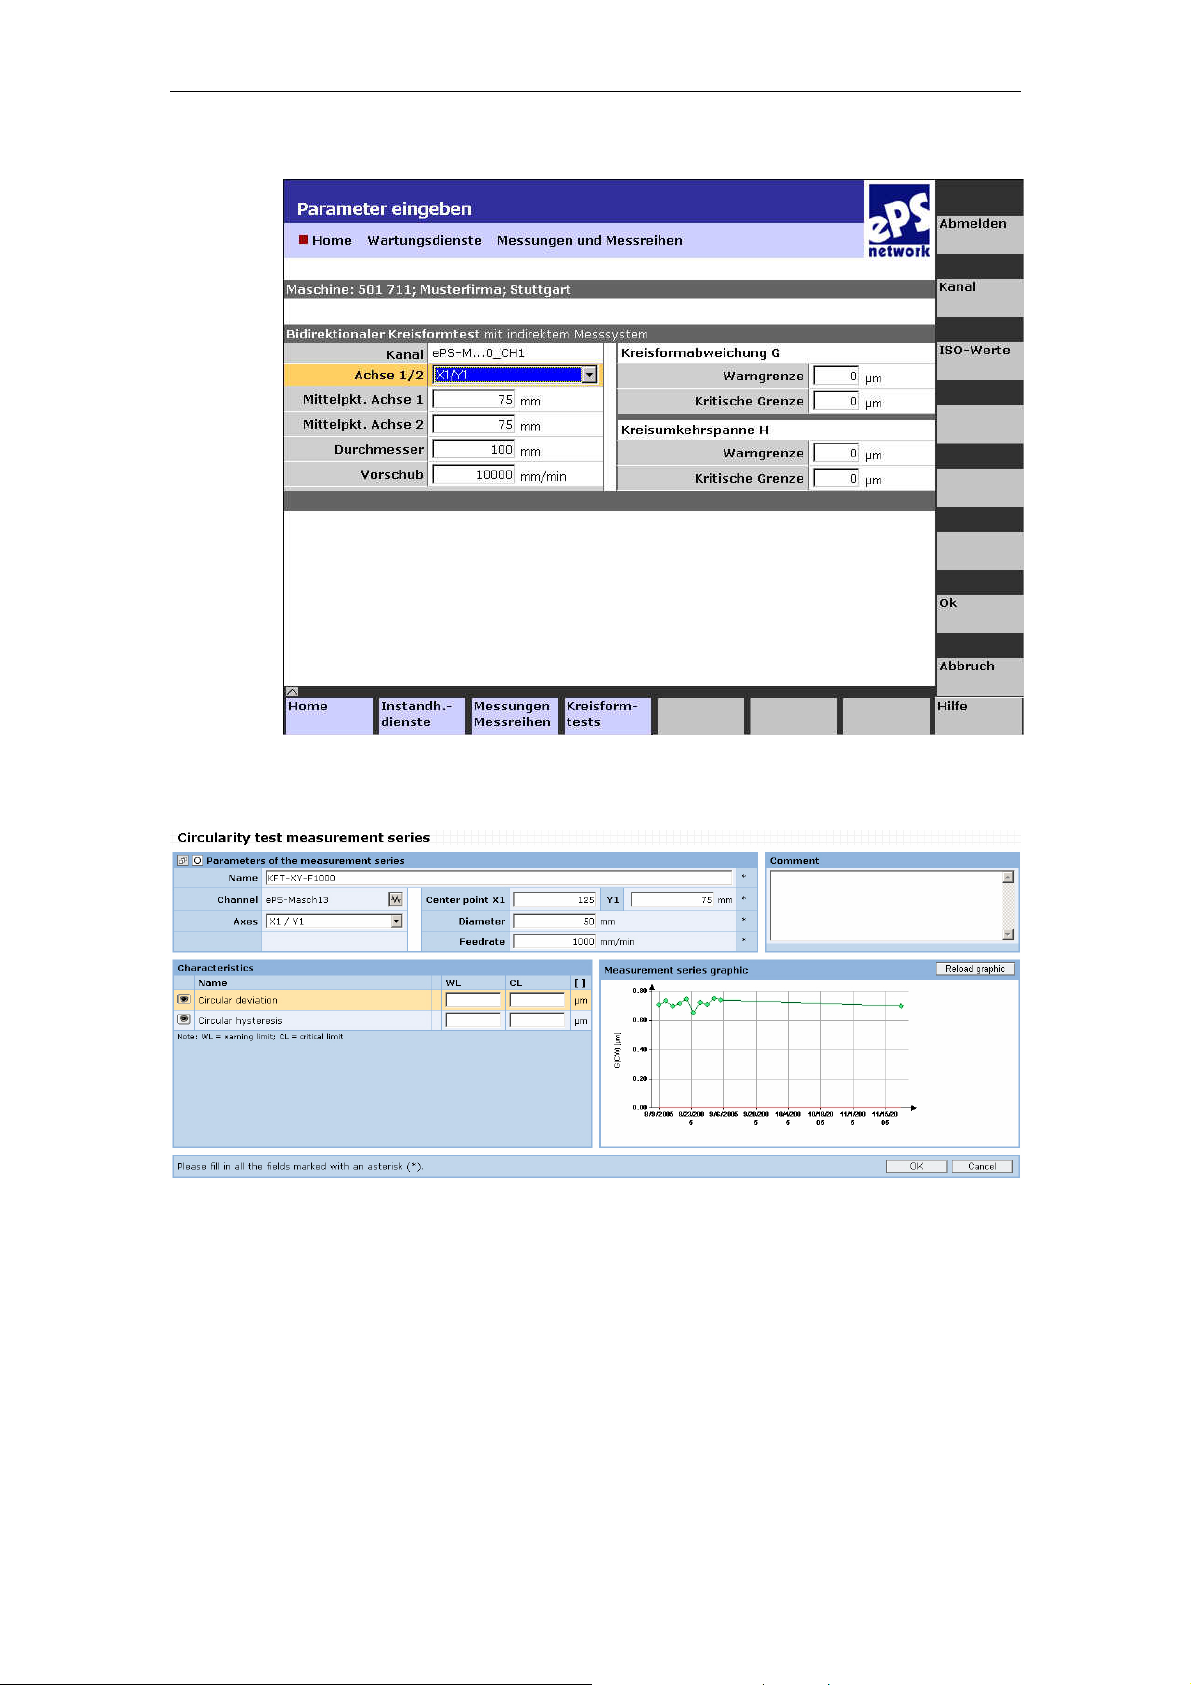
12/2008 3 Setting up functions
3.2 Configuring measurements and measurement series
Fig. 3-8: Circularity test on the operator panel
Fig. 3-9: Measurement series of a circularity test on the PC
© Siemens AG 2008 All Rights Reserved
ePS Network Services, Function Manual (FH) - Release 12/2008
3-93
Page 94
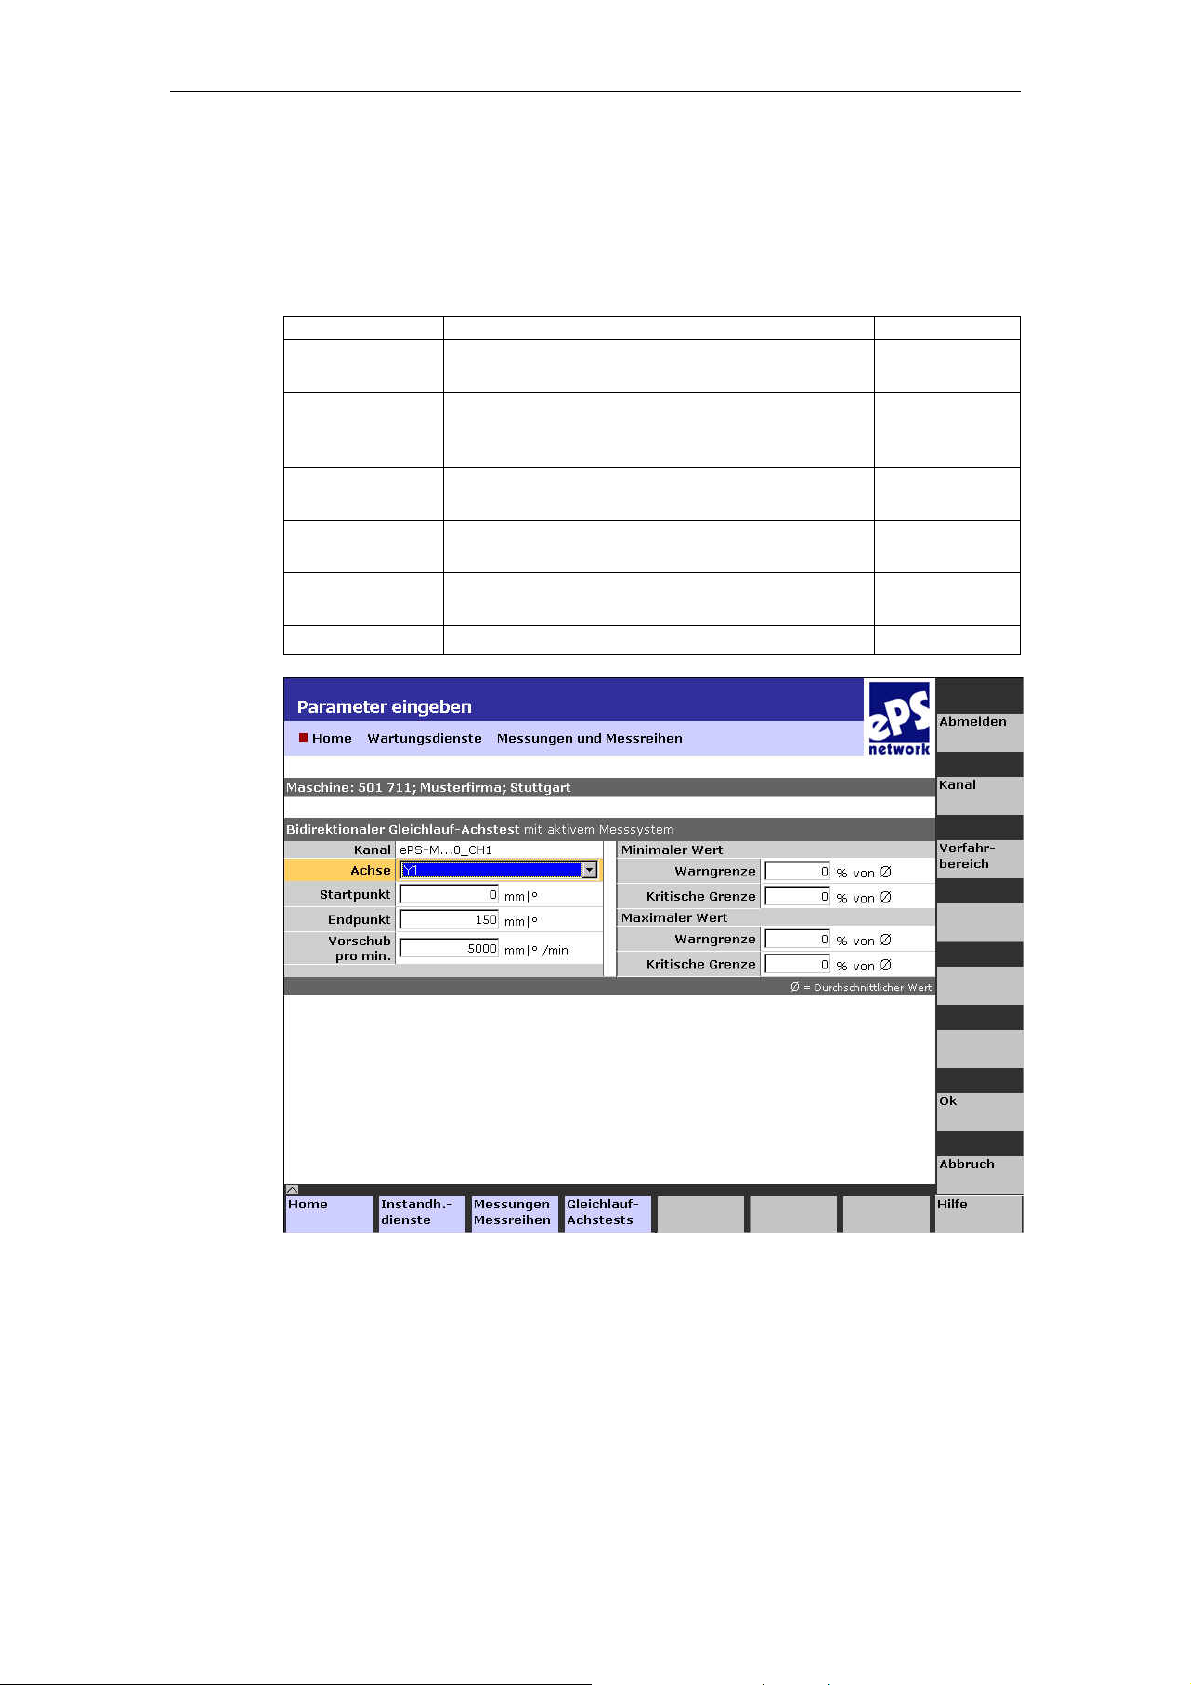
3 Setting up functions 12/2008
3.2 Configuring measurements and measurement series
3.2.2 Equability test
Parameter description
Parameters for conducting an equability test:
Field Content Type
Name Name of the measurement series
(measurements do not have a name).
Channel Selection of the required channel. The
channel defines the possible machine axes in
the "Axis" selection list.
Axis Selection of the possible machine axes that
can be programmed in the selected channel.
Start point The axis position at which the first partial
movement of the measurement begins.
End point The axis position at which the first partial
movement of the measurement ends.
Feed Velocity at which the axis is moved. INPUT
INPUT
SELECTION
SELECTION
INPUT
INPUT
Fig. 3-10: Equability test on the operator panel
© Siemens AG 2008 All Rights Reserved
3-94 ePS Network Services, Function Manual (FH) - Release 12/2008
Page 95
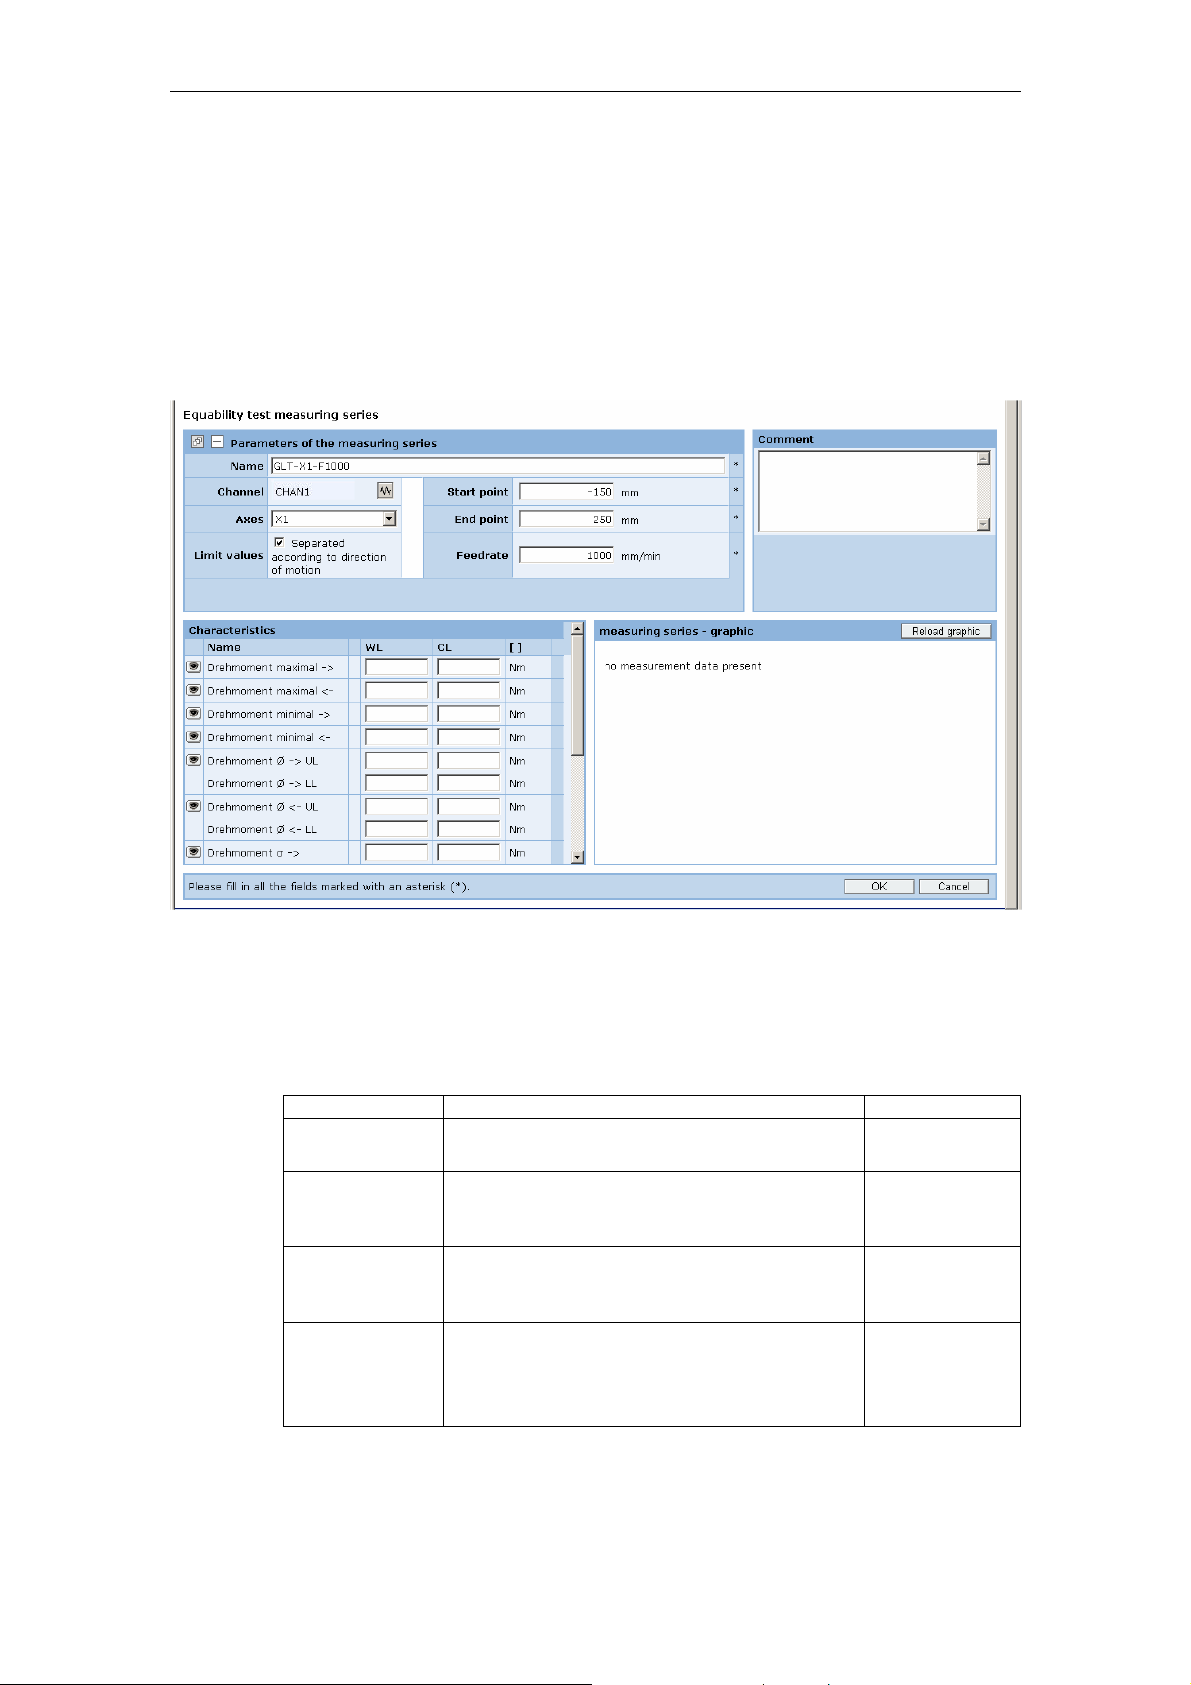
12/2008 3 Setting up functions
3.2 Configuring measurements and measurement series
Configuring the limit values
With the equability test, one movement is carried out each forwards and
backwards. The characteristics are calculated separately for each direction. As
standard limit values are defined for the characteristics and are the same for both
directions of movement.
Optionally limit values can be entered which can have different values for both
directions for each characteristic.
Fig. 3-11: Measurement series of a equability test on the PC
3.2.3 Universal axis test
Parameter description
Parameters for conducting a universal axis test:
Field Content Type
Name Name of the measurement series
(measurements do not have a name)
Channel Selection of the required channel: The
channel defines the possible machine axes
in the "Axis" selection list.
Axis Selection from the possible machine axes
that can be programmed in the selected
channel
Start point The axis position at which the various
movements of the measurement begin.
The position value is never lower than this
value during measurement.
INPUT
SELECTION
SELECTION
INPUT
© Siemens AG 2008 All Rights Reserved
ePS Network Services, Function Manual (FH) - Release 12/2008
3-95
Page 96

3 Setting up functions 12/2008
3.2 Configuring measurements and measurement series
Fig. 3-12: Universal axis test on the operator panel
Fig. 3-13: Measurement series for a universal axis test at the PC
© Siemens AG 2008 All Rights Reserved
3-96 ePS Network Services, Function Manual (FH) - Release 12/2008
Page 97

12/2008 3 Setting up functions
3.2 Configuring measurements and measurement series
3.2.4 Performing test series
Overview
Test series are used to automate measurements for condition monitoring to a great
extent. A test series can contain any number of measurement series. These measurement series are performed one after the other in the defined order when a test
series is run. An machine operator is only required at the machine for the purpose
of starting the test series.
The measurements are made and measurement results stored without any further
operator actions.
Description of functions
Fig. 3-14: Changing the configuration of a test series
The following entries have to be made to configure a test series:
Field Content Type
Name Name of the test series. The system
suggests an automatically generated
name, which you can change. The
names of test series must be unique
within the context of the machine. The
system adds another element to the
name automatically if the name entered
by the machine operator has already
been assigned to another test series.
Channel Selects the required channel. SELECTION
Comment Any text entered to provide a detailed
description of the test series
INPUT
INPUT
© Siemens AG 2008 All Rights Reserved
ePS Network Services, Function Manual (FH) - Release 12/2008
3-97
Page 98

3 Setting up functions 12/2008
3.3 ePS variables
To add, remove, or change the sequence of measurement series, these are
selected in the overview displayed and moved by dragging and dropping or using
the arrow buttons on the form.
A test series can only contain measurement series in one channel. It is not possible
to change the channel of a test series.
Availability and privileges
Test series can only be configured on the PC. The authorization required for
configuring the test series is described in detail in the Appendix.
3.3 ePS variables
3.3.1 ePS variables – List view
Description of functions
With ePS variables, values created by the user in ePS configured logic can be
processed. These values are defined as ePS variables to enable them to be
addressed throughout the ePS logic.
Fig. 3-15: ePS variables – List view
Field Content Type
Remaining memory
Remaining
performance
PLC settings
"New" icon Switches to the menu for creating new
See PLC trigger.
logic for an ePS variable.
DISPLAY
ACTION
© Siemens AG 2008 All Rights Reserved
3-98 ePS Network Services, Function Manual (FH) - Release 12/2008
Page 99

12/2008 3 Setting up functions
3.3 ePS variables
Field Content Type
Number of lines The number in the display indicates
the number of lines per screen that can
DISPLAY
SELECTION
be shown in this menu. You can select
up to 200 lines. A scroll bar will then be
displayed on the screen.
"Edit" icon Switches to the menu for editing the
ACTION
created ePS variable in the line.
Name User-assigned name for the ePS
DISPLAY
variable
Symbol Each ePS variable type has its own
DISPLAY
symbol.
Perf The performance required by the PLC
DISPLAY
is displayed for each variable.
Details Logic for determining the value for the
DISPLAY
ePS variable.
Last measurement Time at which a value was last
DISPLAY
determined for the variable
Value Current, last determined variable value DISPLAY
"!" icon An exclamation mark indicates that an
DISPLAY
ePS variable is defined here, but is not
in use.
A warning triangle indicates that values
have not yet been determined for the
variable because the logic has not yet
been activated by means of
synchronization with the machine
"Delete" icon Deletes the variable in the line in which
client.
ACTION
the "Delete" icon is clicked.
The display does not change, but the
variables move up one line.
OK Click OK to exit the menu. The display
ACTION
changes to the basic "Setting up
functions" screen.
© Siemens AG 2008 All Rights Reserved
ePS Network Services, Function Manual (FH) - Release 12/2008
3-99
Page 100
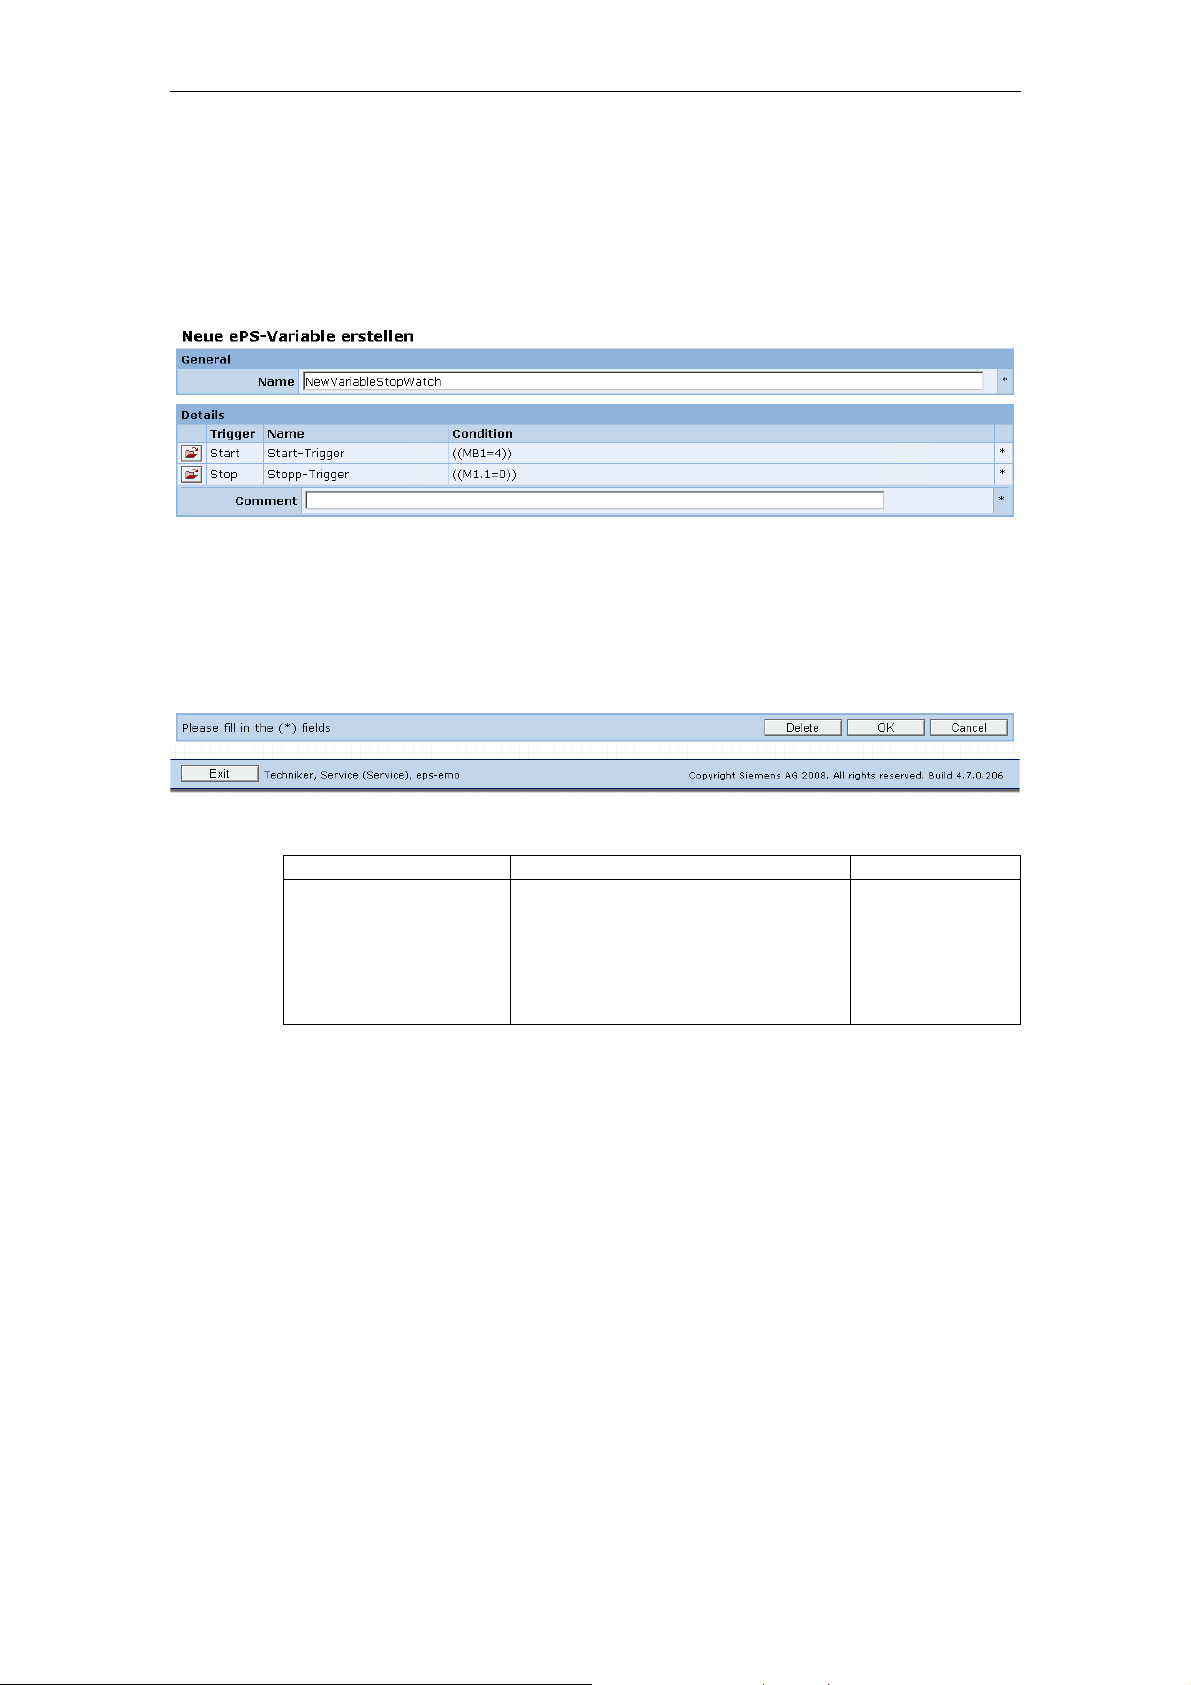
3 Setting up functions 12/2008
3.3 ePS variables
3.3.2 ePS variables – Detailed view
Configuring ePS variables
A menu is provided for creating and editing an ePS variable:
Fig. 3-16: ePS variables – Detailed view
Field Content Type
Icons
Trigger
Names
Condition
Comment
See timeout trigger.
See timeout
trigger.
© Siemens AG 2008 All Rights Reserved
3-100 ePS Network Services, Function Manual (FH) - Release 12/2008
 Loading...