

Page 1
9300 Series Power Meter
User’s Guide
Page 2

Page 3
DANGER
Th
ElectricaI equipment contains hazardous voltages and high speed
moving parts.
Can cause death, serious injury or property damage.
See safety instruction contained herein. Restrict use to qualified personnel.
e use of unauthorized parts in the repair of the equipment
or tampering by unqualified personnel will result in dangerous
conditions that can cause death, serious injury or property
damage.
IMPORTANT
The information contained herein is general in nature and not
intended for specific application purposes. It does not relieve
the user of responsibility to use sound practices in application, installation, operation, and maintenance of the
equipment purchased. Siemens reserves the right to make
changes at any time without notice or obligations. Should a
conflict arise between the general information contained in
this publication and the contents of drawings or supplementary material or both, the latter shall take precedence.
QUALIFIED PERSONNEL
For the purposes of this manual and product labels, "qualified
personnel" is one who is familiar with the installation,
construction, or operation of the equipment and the hazards
involved. In addition, s/he has the following qualifications:
(a) is trained and authorized to energize, de-energize,
clear, ground, and tag circuits and equipment in accordance
with established safety practices.
(b) is trained in the proper care and use of protective gear
equipment such as rubber gloves, hard hat, safety glasses or
face shields, flash clothing, etc., in accordance with established safety procedures
(c) is trained in rendering first aid.
SUMMARY
These instructions do not purport to cover all details or variations in equipment, nor to provide for every possible
contingency to be met in connection with installation, operation, or maintenance. Should further information be
desired or should particular problems arise which are not covered sufficiently for the purchaser’s purposes, the
matter should be referred to the local the sales office.
THE CONTENTS OF THIS INSTRUCTION MANUAL SHALL NOT BECOME PART OF OR MODIFY ANY PRIOR OR
EXISTING AGREEMENT, COMMITMENT OR RELATIONSHIP. THE SALES CONTRACT CONTAINS ALL OBLIGATIONS OF SIEMENS ENERGY & AUTOMATION, INC. THE WARRANTY CONTAINED IN THE CONTRACT
BETWEEN THE PARTIES IS THE SOLE WARRANTY OF SIEMENS ENERGY & AUTOMATION, INC.
ACCESS, ISGS, Isolated Multi-Drop, S7-I/O, SBwin, SAMMS-LV, SAMMS-MV,SEAbus,SIEServe, Static Trip III,
Wisdom, and WinPM are trademark, Sensitrip and Sentron are registered trademarks of Siemens Energy &
Automation, Inc. SIEMENS is a registered trademark and Windows is a trademark of Microsoft Corporation. ION
is a registered trademark of Power Measurement. All other product names mentioned herein are used for identification purposes only and may be the trademarks or registered trademarks of their respective companies.
Page 4
Notices
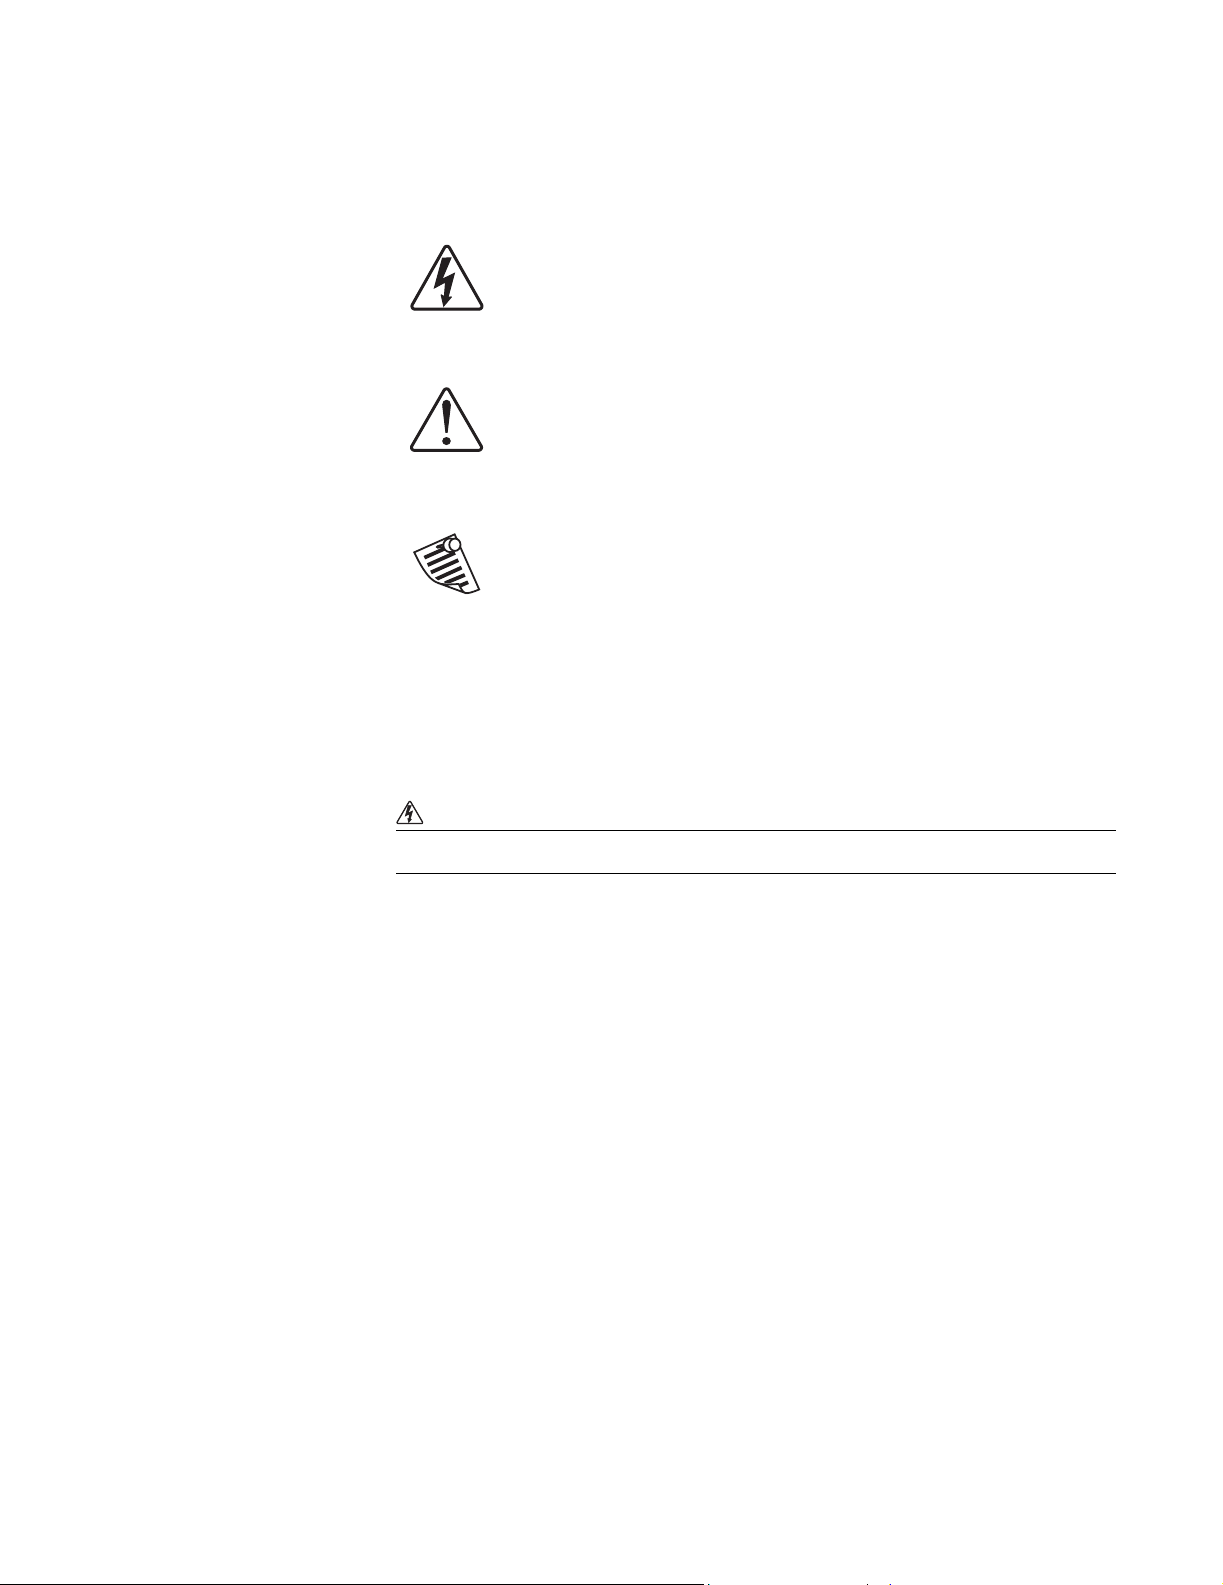
Danger
This symbol indicates the presence of dangerous voltage within and
outside the product enclosure that may constitute a risk of electric
shock, serious injury or death to persons if proper precautions are not
followed.
Caution
This symbol alerts the user to the presence of hazards that may cause
minor or moderate injury to persons, damage to property or damage
to the device itself, if proper precautions are not followed.
Note
This symbol directs the user’s attention to important installation,
operating and maintenance instructions.
Installation Considerations
Installation and maintenance of the 9300 Series meter should only be performed by
qualified, competent personnel that have appropriate training and experience
with high voltage and current devices. The meter must be installed in accordance
with all Local and National Electrical Codes.
DANGER
Failure to observe the following instructions may result in severe injury or death.
During normal operation of the 9300 Series meter, hazardous voltages are
present on its terminal strips, and throughout the connected potential
transformer (PT), current transformer (CT), digital (status) input, control power
and external I/O circuits. PT and CT secondary circuits are capable of generating
lethal voltages and currents with their primary circuit energized. Follow
standard safety precautions while performing any installation or service work
(i.e. removing PT fuses, shorting CT secondaries, etc).
The terminal strips on the meter base should not be user-accessible after
installation.
Do not use digital output devices for primary protection functions. These
include applications where the devices perform energy limiting functions or
provide protection of people from injury. Do not use the 9300 Series in
situations where failure of the devices can cause injury or death, or cause
sufficient energy to be released that can start a fire. The meter can be used for
secondary protection functions.
Do not HIPOT/Dielectric test the digital (status) inputs, digital outputs, or
communications terminals. Refer to the label on the 9300 Series meter for the
maximum voltage level the device can withstand.
Page 5

CAUTION
Observe the following instructions, or permanent damage to the meter may occur.
The 9300 Series meter offers a range of hardware options that affect input
ratings. The 9300 Series meter’s serial number label lists all equipped options.
Applying current levels incompatible with the current inputs will permanently
damage the meter. This document provides installation instructions applicable
to each hardware option.
The 9300 Series meter’s chassis ground must be properly connected to the
switchgear earth ground for the noise and surge protection circuitry to function
correctly. Failure to do so will void the warranty.
Terminal screw torque: Barrier-type (current, voltage, and relay terminal screws:
1.35 Nm (1.00 ft-lbf) max. Captured-wire type (digital inputs/outputs,
communications, power supply: 0.90 Nm (0.66 ft.lbf) max.
FCC Notice
This equipment has been tested and found to comply with the limits for a Class A
digital device, pursuant to Part 15 of the FCC Rules. These limits are designed to
provide reasonable protection against harmful interference when the equipment is
operated in a commercial environment. This equipment generates, uses, and can
radiate radio frequency energy and, if not installed and used in accordance with
the instruction manual, may cause harmful interference to radio communications.
Operation of this equipment in a residential area is likely to cause harmful
interference in which case the user will be required to correct the interference at his
own expense. The Ringer Equivalence Number (REN) for the 9300 Series optional
internal modem is 0.6. Connection to the 9300 Series internal modem should be
made via an FCC Part 68 compliant telephone cord (not supplied). The 9300 Series
cannot be used on a public coin phone service or party line services.
Network Compatibility Notice for the Internal Modem
The internal modem in meters equipped with this option is compatible with the
telephone systems of most countries in the world, with the exception of Australia
and New Zealand. Use in some countries may require modification of the internal
modem’s initialization strings. If problems using the modem on your phone
system occur, please contact Siemens Customer Service
Standards Compliance
CSA: Certified to CAN/
CSA C22.2 No.1010-1
Certified to
UL 3111
CE: approved
Page 6

Page 7

Contents
Chapter 1 Introduction
Chapter 2 Using the Front Panel
9300 Series Meters . . . . . . . . . . . . . . . . . . . . . . . . . . . . . . . . . . . . . . . . . . 12
The ACCESS Meter in an Enterprise Energy Management System . . . . . . . . 14
Data Display and Analysis Tools . . . . . . . . . . . . . . . . . . . . . . . . . . . . . . . . . . . . . . . 14
Communications Protocols . . . . . . . . . . . . . . . . . . . . . . . . . . . . . . . . . . . . . . . . . . . . . 16
Digital and Analog I/O Options . . . . . . . . . . . . . . . . . . . . . . . . . . . . . . . . . . . . . . . . . 16
The Meter is Factory-Configured and Ready to Operate . . . . . . . . . . . . . . . . . . . . 17
Meter Firmware Revision History . . . . . . . . . . . . . . . . . . . . . . . . . . . . . . . . . . . . . . . 18
Ethernet Card Firmware Revision History . . . . . . . . . . . . . . . . . . . . . . . . . . . . . . . 20
Using this Guide . . . . . . . . . . . . . . . . . . . . . . . . . . . . . . . . . . . . . . . . . . . . 21
Getting More Information . . . . . . . . . . . . . . . . . . . . . . . . . . . . . . . . . . . . . . . . . . . . . 21
Displaying Data with the Front Panel . . . . . . . . . . . . . . . . . . . . . . . . . . . . . 24
Front Panel Display Resolution . . . . . . . . . . . . . . . . . . . . . . . . . . . . . . . . . . . . . . . . . 24
Default Front Panel Display Screens . . . . . . . . . . . . . . . . . . . . . . . . . . . . . . . . . . . . . 25
Configuring the Meter with the Front Panel . . . . . . . . . . . . . . . . . . . . . . . . 27
The Front Panel’s Setup Menus . . . . . . . . . . . . . . . . . . . . . . . . . . . . . . . . . . . . . . . . . 27
Clear Functions Menu . . . . . . . . . . . . . . . . . . . . . . . . . . . . . . . . . . . . . . . . . . . . . . . . . 28
Quick Setup Menu . . . . . . . . . . . . . . . . . . . . . . . . . . . . . . . . . . . . . . . . . . . . . . . . . . . . 30
Advanced Meter Setup Menu . . . . . . . . . . . . . . . . . . . . . . . . . . . . . . . . . . . . . . . . . . 32
Display Setup Menu . . . . . . . . . . . . . . . . . . . . . . . . . . . . . . . . . . . . . . . . . . . . . . . . . . 33
Screen Setup Menu . . . . . . . . . . . . . . . . . . . . . . . . . . . . . . . . . . . . . . . . . . . . . . . . . . . 34
Nameplate Info Menu . . . . . . . . . . . . . . . . . . . . . . . . . . . . . . . . . . . . . . . . . . . . . . . . . 35
Security Menu . . . . . . . . . . . . . . . . . . . . . . . . . . . . . . . . . . . . . . . . . . . . . . . . . . . . . . . . 35
Diagnostic Menu . . . . . . . . . . . . . . . . . . . . . . . . . . . . . . . . . . . . . . . . . . . . . . . . . . . . . 35
Custom Front Panel Displays . . . . . . . . . . . . . . . . . . . . . . . . . . . . . . . . . . . 38
Before Customizing the Front Panel . . . . . . . . . . . . . . . . . . . . . . . . . . . . . . . . . . . . . 38
Chapter 3 Default Meter Functionality
Default Meter Functionality . . . . . . . . . . . . . . . . . . . . . . . . . . . . . . . . . . . . 42
Basic Setup . . . . . . . . . . . . . . . . . . . . . . . . . . . . . . . . . . . . . . . . . . . . . . . . . . . . . . . . . . 42
Communications Setup . . . . . . . . . . . . . . . . . . . . . . . . . . . . . . . . . . . . . . . . . . . . . . . . 43
Power Quality Setup (9350) . . . . . . . . . . . . . . . . . . . . . . . . . . . . . . . . . . . . . . . . . . . . 44
Data Logging Setup . . . . . . . . . . . . . . . . . . . . . . . . . . . . . . . . . . . . . . . . . . . . . . . . . . . 45
Setpoint Configuration (9330 and 9350) . . . . . . . . . . . . . . . . . . . . . . . . . . . . . . . . . . 48
Page 8

Meter Clock Configuration . . . . . . . . . . . . . . . . . . . . . . . . . . . . . . . . . . . . . . . . . . . . . 49
Display Configuration . . . . . . . . . . . . . . . . . . . . . . . . . . . . . . . . . . . . . . . . . . . . . . . . . 50
Demand Setup . . . . . . . . . . . . . . . . . . . . . . . . . . . . . . . . . . . . . . . . . . . . . . . . . . . . . . . 52
Factory Information . . . . . . . . . . . . . . . . . . . . . . . . . . . . . . . . . . . . . . . . . . . . . . . . . . . 53
Third Party Protocols . . . . . . . . . . . . . . . . . . . . . . . . . . . . . . . . . . . . . . . . . 54
Using the Modbus RTU Protocol . . . . . . . . . . . . . . . . . . . . . . . . . . . . . . . . . . . . . . . . 54
Using the Modbus/TCP Protocol . . . . . . . . . . . . . . . . . . . . . . . . . . . . . . . . . . . . . . . . 59
Using the DNP 3.0 Protocol . . . . . . . . . . . . . . . . . . . . . . . . . . . . . . . . . . . . . . . . . . . . 60
Using the Profibus Protocol . . . . . . . . . . . . . . . . . . . . . . . . . . . . . . . . . . . . . . . . . . . . 63
Restoring the Factory Configuration . . . . . . . . . . . . . . . . . . . . . . . . . . . . . . 66
Chapter 4 Using ACCESS Software
WinPM.Net Software . . . . . . . . . . . . . . . . . . . . . . . . . . . . . . . . . . . . . . . . 70
WinPM.Net: Management Console . . . . . . . . . . . . . . . . . . . . . . . . . . . . . . 71
Configuring Communications . . . . . . . . . . . . . . . . . . . . . . . . . . . . . . . . . . . . . . . . . . 73
WinPM.Net: Vista . . . . . . . . . . . . . . . . . . . . . . . . . . . . . . . . . . . . . . . . . . . 75
Displaying Data with Vista . . . . . . . . . . . . . . . . . . . . . . . . . . . . . . . . . . . . . . . . . . . . 75
Customizing the Vista Interface . . . . . . . . . . . . . . . . . . . . . . . . . . . . . . . . . . . . . . . . . 81
WinPM.Net: Designer . . . . . . . . . . . . . . . . . . . . . . . . . . . . . . . . . . . . . . . . 83
Basics of ION Architecture . . . . . . . . . . . . . . . . . . . . . . . . . . . . . . . . . . . . . . . . . . . . . 83
Designer’s Main Configuration Screen . . . . . . . . . . . . . . . . . . . . . . . . . . . . . . . . . . . 87
Viewing Real-time Data in Designer . . . . . . . . . . . . . . . . . . . . . . . . . . . . . . . . . . . . . 88
Changing Setup Registers with Designer . . . . . . . . . . . . . . . . . . . . . . . . . . . . . . . . . 88
Customizing Frameworks in Designer . . . . . . . . . . . . . . . . . . . . . . . . . . . . . . . . . . . 90
WinPM.Net: Reporter . . . . . . . . . . . . . . . . . . . . . . . . . . . . . . . . . . . . . . . . 94
Pre-configured Reports . . . . . . . . . . . . . . . . . . . . . . . . . . . . . . . . . . . . . . . . . . . . . . . . 94
Report Creation and Generation . . . . . . . . . . . . . . . . . . . . . . . . . . . . . . . . . . . . . . . . 96
ION Setup Software . . . . . . . . . . . . . . . . . . . . . . . . . . . . . . . . . . . . . . . . . 98
Configuring Communications . . . . . . . . . . . . . . . . . . . . . . . . . . . . . . . . . . . . . . . . . . 98
Basic Meter Configuration . . . . . . . . . . . . . . . . . . . . . . . . . . . . . . . . . . . . . . . . . . . . 101
Displaying Data with ION Setup . . . . . . . . . . . . . . . . . . . . . . . . . . . . . . . . . . . . . . . 102
Chapter 5 Features and Applications
Communications . . . . . . . . . . . . . . . . . . . . . . . . . . . . . . . . . . . . . . . . . . . 106
RS-485 Connections . . . . . . . . . . . . . . . . . . . . . . . . . . . . . . . . . . . . . . . . . . . . . . . . . . 107
Optical Port Connections . . . . . . . . . . . . . . . . . . . . . . . . . . . . . . . . . . . . . . . . . . . . . 108
Ethernet Connections . . . . . . . . . . . . . . . . . . . . . . . . . . . . . . . . . . . . . . . . . . . . . . . . 110
Internal Modem Connections . . . . . . . . . . . . . . . . . . . . . . . . . . . . . . . . . . . . . . . . . . 113
Profibus Connections (9300) . . . . . . . . . . . . . . . . . . . . . . . . . . . . . . . . . . . . . . . . . . . 116
Internet Connectivity . . . . . . . . . . . . . . . . . . . . . . . . . . . . . . . . . . . . . . . . 117
WebMeter and MeterM@il . . . . . . . . . . . . . . . . . . . . . . . . . . . . . . . . . . . . . . . . . . . . 117
WebReach . . . . . . . . . . . . . . . . . . . . . . . . . . . . . . . . . . . . . . . . . . . . . . . . . . . . . . . . . . 118
Page 9

Telnet and Hyperterminal . . . . . . . . . . . . . . . . . . . . . . . . . . . . . . . . . . . . . . . . . . . . 118
Digital and Analog I/O . . . . . . . . . . . . . . . . . . . . . . . . . . . . . . . . . . . . . . 119
Specifying a Port In an ION Module . . . . . . . . . . . . . . . . . . . . . . . . . . . . . . . . . . . . 119
Using the Onboard Digital Outputs . . . . . . . . . . . . . . . . . . . . . . . . . . . . . . . . . . . . 121
Using the Onboard Digital Inputs . . . . . . . . . . . . . . . . . . . . . . . . . . . . . . . . . . . . . . 123
Using the Optional Analog Inputs . . . . . . . . . . . . . . . . . . . . . . . . . . . . . . . . . . . . . 123
Using the Optional Analog Outputs . . . . . . . . . . . . . . . . . . . . . . . . . . . . . . . . . . . . 124
Data and Event Logging . . . . . . . . . . . . . . . . . . . . . . . . . . . . . . . . . . . . . 125
Data Logging (9330 and 9350) . . . . . . . . . . . . . . . . . . . . . . . . . . . . . . . . . . . . . . . . . 125
Event Logging . . . . . . . . . . . . . . . . . . . . . . . . . . . . . . . . . . . . . . . . . . . . . . . . . . . . . . 126
Logging and Recording Capacity . . . . . . . . . . . . . . . . . . . . . . . . . . . . . . . . . . . . . . 127
Time Synchronization . . . . . . . . . . . . . . . . . . . . . . . . . . . . . . . . . . . . . . . 128
Meter Security . . . . . . . . . . . . . . . . . . . . . . . . . . . . . . . . . . . . . . . . . . . . 129
Standard Meter Security . . . . . . . . . . . . . . . . . . . . . . . . . . . . . . . . . . . . . . . . . . . . . . 129
Residual Current Calculation (I4) . . . . . . . . . . . . . . . . . . . . . . . . . . . . . . . 130
Alerting . . . . . . . . . . . . . . . . . . . . . . . . . . . . . . . . . . . . . . . . . . . . . . . . . 131
Alerting ION Software via the Alarm Server . . . . . . . . . . . . . . . . . . . . . . . . . . . . 131
Alerting via an Alphanumeric Pager . . . . . . . . . . . . . . . . . . . . . . . . . . . . . . . . . . . 133
Alerting via a Numeric Pager . . . . . . . . . . . . . . . . . . . . . . . . . . . . . . . . . . . . . . . . . 133
Alerting via Email (9330 and 9350) . . . . . . . . . . . . . . . . . . . . . . . . . . . . . . . . . . . . . 134
Chapter 6 Revenue Metering
9300 Series Revenue Meters . . . . . . . . . . . . . . . . . . . . . . . . . . . . . . . . . . 136
Revenue Meter Models . . . . . . . . . . . . . . . . . . . . . . . . . . . . . . . . . . . . . . . . . . . . . . . 136
Revenue Meter Options . . . . . . . . . . . . . . . . . . . . . . . . . . . . . . . . . . . . . . . . . . . . . . 136
Differences between Standard and Revenue Models . . . . . . . . . . . . . . . . . . . . . . 136
Revenue Meter Energy Register Labels . . . . . . . . . . . . . . . . . . . . . . . . . . . . . . . . . 136
Additional Revenue Metering Modules . . . . . . . . . . . . . . . . . . . . . . . . . . . . . . . . . 137
Security Mechanisms . . . . . . . . . . . . . . . . . . . . . . . . . . . . . . . . . . . . . . . . . . . . . . . . . 137
Anti-Tamper Seals . . . . . . . . . . . . . . . . . . . . . . . . . . . . . . . . . . . . . . . . . . . . . . . . . . . 138
Password Protected Min/Max Register Resets . . . . . . . . . . . . . . . . . . . . . . . . . . . 138
Hardware-based Security . . . . . . . . . . . . . . . . . . . . . . . . . . . . . . . . . . . . . . . . . . . . . 138
Configuring the Revenue Meter . . . . . . . . . . . . . . . . . . . . . . . . . . . . . . . . . . . . . . . 139
Before Disassembling the Meter . . . . . . . . . . . . . . . . . . . . . . . . . . . . . . . . . . . . . . . 139
Inserting the Key . . . . . . . . . . . . . . . . . . . . . . . . . . . . . . . . . . . . . . . . . . . . . . . . . . . . 139
CT & PT Selection . . . . . . . . . . . . . . . . . . . . . . . . . . . . . . . . . . . . . . . . . . . . . . . . . . . 140
Chapter 7 Hardware Reference
Standard Model . . . . . . . . . . . . . . . . . . . . . . . . . . . . . . . . . . . . . . . . . . . 142
General Specifications . . . . . . . . . . . . . . . . . . . . . . . . . . . . . . . . . . . . . . . . . . . . . . . . 143
Unit Dimensions . . . . . . . . . . . . . . . . . . . . . . . . . . . . . . . . . . . . . . . . . . . . . . . . . . . . 144
Communications Specifications . . . . . . . . . . . . . . . . . . . . . . . . . . . . . . . . . . . . . . . . 145
COM1 Port . . . . . . . . . . . . . . . . . . . . . . . . . . . . . . . . . . . . . . . . . . . . . . . . . . . . . . . . . 146
Page 10

COM 2 Port . . . . . . . . . . . . . . . . . . . . . . . . . . . . . . . . . . . . . . . . . . . . . . . . . . . . . . . . . 147
COM 3 Port . . . . . . . . . . . . . . . . . . . . . . . . . . . . . . . . . . . . . . . . . . . . . . . . . . . . . . . . . 148
Ethernet Port . . . . . . . . . . . . . . . . . . . . . . . . . . . . . . . . . . . . . . . . . . . . . . . . . . . . . . . . 148
Profibus Port . . . . . . . . . . . . . . . . . . . . . . . . . . . . . . . . . . . . . . . . . . . . . . . . . . . . . . . . 149
Internal Modem . . . . . . . . . . . . . . . . . . . . . . . . . . . . . . . . . . . . . . . . . . . . . . . . . . . . . 150
LEDs . . . . . . . . . . . . . . . . . . . . . . . . . . . . . . . . . . . . . . . . . . . . . . . . . . . . . . . . . . . . . . . 151
I/O Connections . . . . . . . . . . . . . . . . . . . . . . . . . . . . . . . . . . . . . . . . . . . 152
Electrical Specifications . . . . . . . . . . . . . . . . . . . . . . . . . . . . . . . . . . . . . . 155
Options and Retrofits . . . . . . . . . . . . . . . . . . . . . . . . . . . . . . . . . . . . . . . 157
Terminal Cover . . . . . . . . . . . . . . . . . . . . . . . . . . . . . . . . . . . . . . . . . . . . . . . . . . . . . . 157
Remote Modular Display . . . . . . . . . . . . . . . . . . . . . . . . . . . . . . . . . . . . . . . . . . . . . 158
Switchboard Case . . . . . . . . . . . . . . . . . . . . . . . . . . . . . . . . . . . . . . . . . . . . . . . . . . . . 158
Relay Expansion Board (Grayhill Rack) . . . . . . . . . . . . . . . . . . . . . . . . . . . . . . . . . 163
Analog I/O . . . . . . . . . . . . . . . . . . . . . . . . . . . . . . . . . . . . . . . . . . . . . . . . . . . . . . . . . . 164
TRAN Model . . . . . . . . . . . . . . . . . . . . . . . . . . . . . . . . . . . . . . . . . . . . . . 165
Unit Dimensions . . . . . . . . . . . . . . . . . . . . . . . . . . . . . . . . . . . . . . . . . . . . . . . . . . . . 165
Page 11

1 Introduction
The 9300 Series intelligent metering and control devices are typically used in
enterprise energy management systems such as feeder monitoring and
submetering, and offer unmatched value, functionality, and ease of use. These
meters interface to WinPM.Net software or other automation systems for fast
information sharing and analysis. The 9300 meter is an ideal analog meter
replacement with a multitude of power and energy measurements, analog and
digital I/O, communication ports, and industry-standard protocols. The 9330
meter adds on-board data storage, alarms, and an optional modem. The 9350
meter is further augmented by more sophisticated power quality analysis and a
call-back-on-alarm feature.
In This Chapter
9300 Series Meters . . . . . . . . . . . . . . . . . . . . . . . . . . . . . . . . . . . . . . . . . . 12
The ACCESS Meter in an Enterprise Energy Management System . . . . . . . . 14
Data Display and Analysis Tools . . . . . . . . . . . . . . . . . . . . . . . . . . . . . . . . . . . . . . . 14
Communications Protocols . . . . . . . . . . . . . . . . . . . . . . . . . . . . . . . . . . . . . . . . . . . . . 16
Digital and Analog I/O Options . . . . . . . . . . . . . . . . . . . . . . . . . . . . . . . . . . . . . . . . . 16
The Meter is Factory-Configured and Ready to Operate . . . . . . . . . . . . . . . . . . . . 17
Meter Firmware Revision History . . . . . . . . . . . . . . . . . . . . . . . . . . . . . . . . . . . . . . . 18
Ethernet Card Firmware Revision History . . . . . . . . . . . . . . . . . . . . . . . . . . . . . . . 20
Using this Guide . . . . . . . . . . . . . . . . . . . . . . . . . . . . . . . . . . . . . . . . . . . . 21
Getting More Information . . . . . . . . . . . . . . . . . . . . . . . . . . . . . . . . . . . . . . . . . . . . . 21
Page 12

9300 Series Meters 9300 Series User’s Guide
9300 Series Meters
The 9300 Series meters are intelligent metering and control devices suited to a wide
range of applications. The meters can be used as stand-alone devices, but their
extensive capabilities are fully realized when used as part of an enterprise energy
management (EEM) system.
EEM systems give energy suppliers, service providers, and large industrial and
commercial energy consumers the tools to meet all the challenges and
opportunities of the new energy environment. EEM systems use real-time
information and control to directly address a broad range of requirements
throughout the power delivery chain and across an entire enterprise. These
systems offer an integrated solution to managing new billing structures,
distributed generation, energy purchasing, energy cost control, operational
efficiency, and power quality and reliability.
ION® technology uniquely delivers the benefits of enterprise energy management
through an efficient, economical, and scalable architecture using web-enabled
software and intelligent metering and control devices. ACCESS systems place
intelligence everywhere its needed, delivering information and control to
everyone that needs it, wherever they are. This gives all parties the necessary
information to make the best energy decisions, and the control to act on them.
Systems can span widely dispersed geographic locations and multiple points
within each site. A single, shared system delivers a broad range of functionality
that can satisfy the needs of many different groups within an enterprise, while
integrating seamlessly with existing systems.
Page 12 Chapter 1 - Introduction
Page 13

9300 Series User’s Guide 9300 Series Meters
WinPM.Net™ is a powerful web-ready software suite that can process, analyze,
store, and share information from across your entire organization. Its
compatibility and flexibility means you can introduce individual components, at a
pace you decide, while maintaining your original investments. You can access
information and alarms from any workstation, pager, PDA, or cell phone locally or
around the world, in the format you require. You can also perform coordinated
load and equipment control functions, either manually or automatically. ACCESS
software collects data automatically from ACCESS meters and third-party devices,
so you can manage a single site or a global network of devices. ACCESS software
and hardware products reduce cost of installation and ownership by leverage
existing corporate networks and popular networking technologies, including
serial, wireless, modem, Ethernet and Internet links.
A wide selection of ACCESS intelligent metering and control devices are available,
with choices to meet the specific needs of various key points within an enterprise.
Devices offer a range of high accuracy metering, power quality and reliability
analysis, data and event logging, alarming, control and communications.
This manual discusses the use of all 9300 Series meters. Throughout the manual,
the term “meter” generally refers to all meter models. All differences between the
models, such as a feature specific to one model, are indicated with the appropriate
model number.
The 9300 Series meters can be used effectively in numerous supply side and demand
side operations. Some common meter applications are:
Revenue Metering
Substation Automation
Replacement of Analog Transducers
Commercial/Industrial Metering
Demand Monitoring
Genset Applications
Universal Metering (9330 and 9350)
Utility Sub-Metering (9330 and 9350)
These are just a few of the many possibilities. Contact Siemens Customer Service
if you would like assistance with your application.
Chapter 1 - Introduction Page 13
Page 14
The ACCESS Meter in an Enterprise Energy Management System 9300 Series User’s Guide
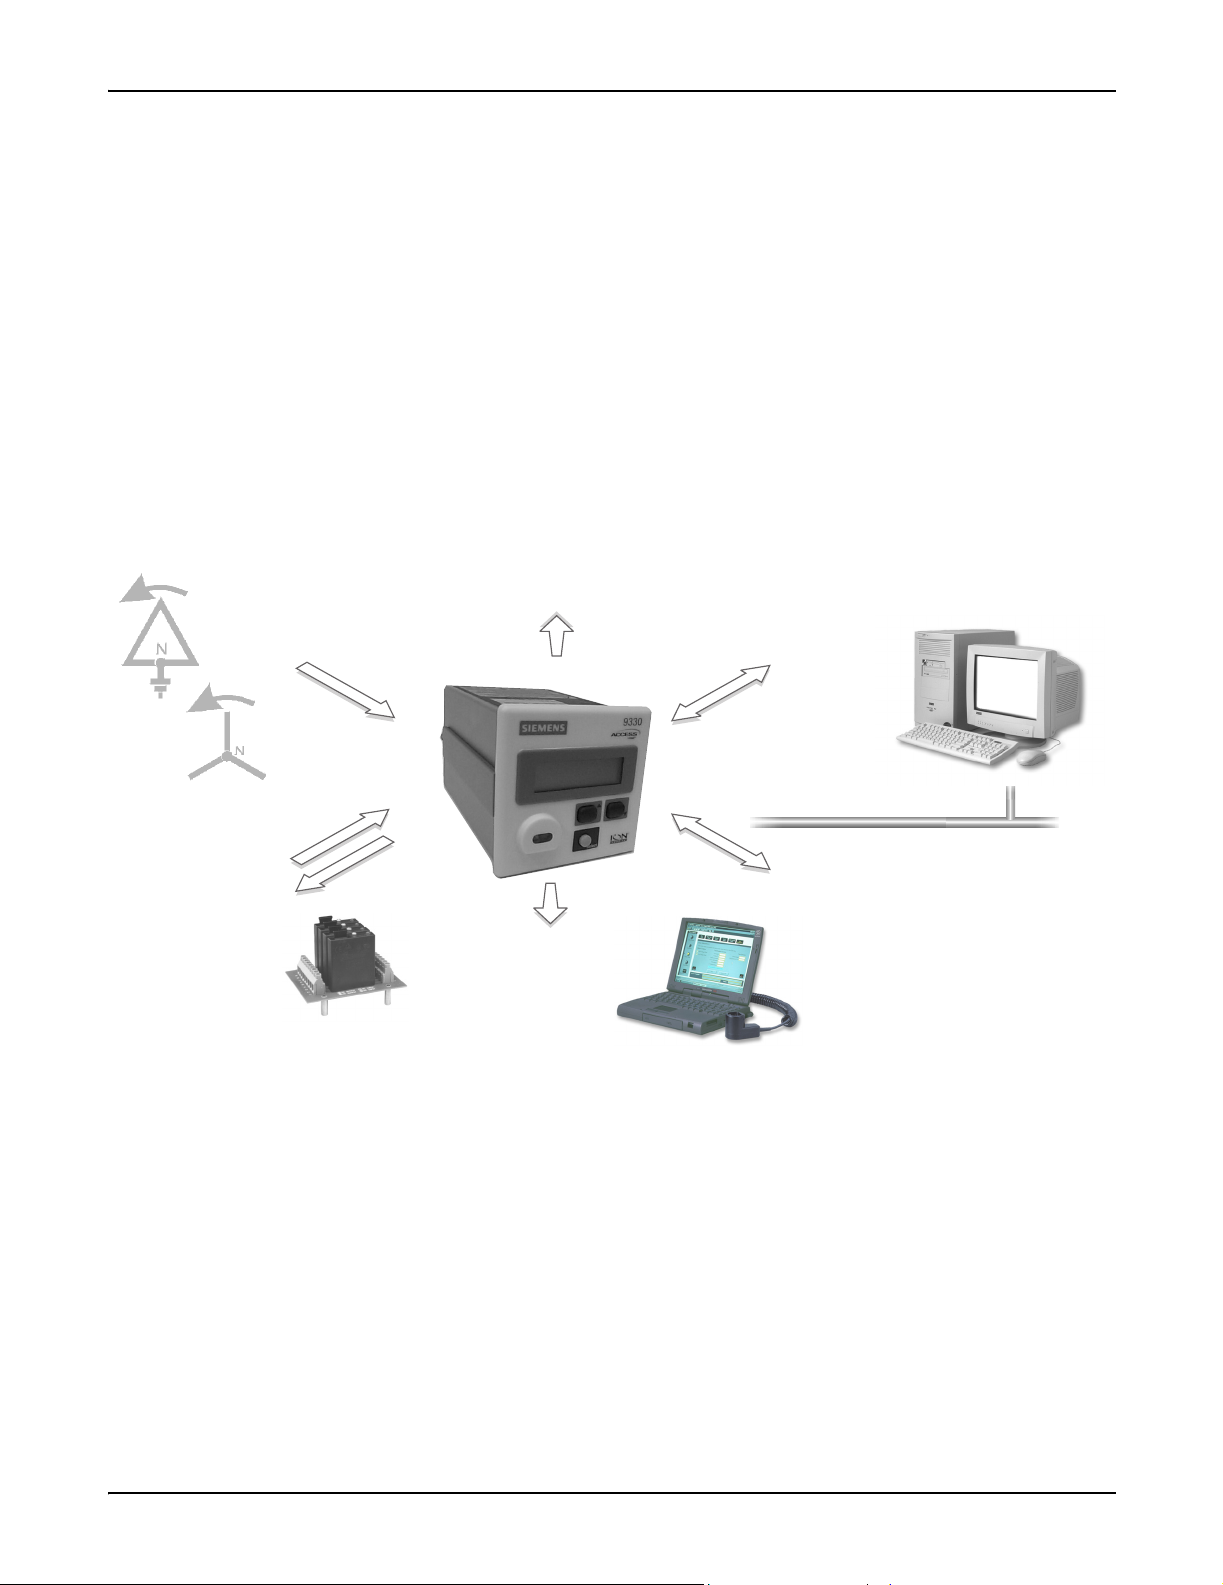
The ACCESS Meter in an Enterprise Energy Management System
Applications that include the meter typically require additional equipment.
Display and analysis software tools are almost always used to manage, interpret
and distribute the data measured or logged by a meter. There are usually a variety
of tools used, and often these tools are connected using different communications
standards and protocols. In many cases, a meter must also provide control
capabilities and device-level data sharing.
The meter can adapt to many situations. Advanced communications allow data to
be shared simultaneously across multiple networks, built-in I/O provides
monitoring and control capabilities, and a variety of display and analysis tools can
be used to monitor your power system.
Power System Connections
Phase voltage and phase current
from Wye, Delta or single-phase
power systems.
I / O
- Energy Pulses
- Breaker Closures
- Digital Signals
- Analog Transducers
Internet Connectivity
- MeterM@il
- WebMeter
On-Site Data Display
- Remote Modular Display
Remote Data Display
- Vista
- WebReach
Data Display and Analysis Tools
Protocols
- ION
- Modbus RTU
- DNP V3.00
- Profibus (9300)
Corporate Network
Communications
- RS-485
- Optical Infrared
- 10 Base-T Ethernet
- 33.6 kbps internal modem
- Profibus port (9300)
Data Analysis Tools
- WinPM.Net Software
- 3rd-Party tools
Not only does the meter’s front panel allow meter configuration and data display,
but the meter also integrates seamlessly with display and analysis software
available from Siemens. WinPM.Net software is the network and device
configuration software that also lets you analyze and monitor your system and
produce reports for any department in an organization. Furthermore, you can use
data acquired by the meter in a variety of third-party systems. ACCESS software
is designed to make use of all the available advanced capabilities.
Page 14 Chapter 1 - Introduction
Page 15

9300 Series User’s Guide Data Display and Analysis Tools
The Front Panel
Local monitoring and standalone applications are facilitated by the meter’s front
panel interface. The front panel combines real-time display features as well as
device configuration functions.
The Remote Modular Display
The Remote Modular Display (RMD) can be added to an existing 9300 SeriesTRAN (Transducer) model to facilitate local monitoring and standalone
applications. The 9300 Series Basic Model provides an integrated front panel
display.
Both the front panel and RMD combine real-time display features with limited
device configuration functions. When used in combination with an WinPM.Net
system, the display provides an interface for field personnel.
WebMeter® Embedded Web Server Feature
An on-board web server combined with an Ethernet port provides quick and easy
access to real-time energy and basic power quality information without special
software: this is WebMeter functionality. The built-in web pages display a range of
energy and basic power quality information through the web-enabled device;
these pages even support basic meter configuration tasks.
MeterM@il® Internal E-Mail Server Feature
Configure the meter to automatically email high-priority alarm notifications or
scheduled system-status update messages to anyone, anywhere within the facility
or around the world. Specify the type of event that triggers an email alert, such as
power quality disturbances or logged data at any pre-determined interval, and
have your ACCESS software administrator program the meter to respond with a
MeterM@il message when these events occur. MeterM@il messages can be
received like any email message over a workstation, cell phone, pager, or PDA.
XML Compatibility
The meters can exchange information using industry-standard XML format. This
simple machine-readable format supports easy integration with custom reporting,
spreadsheet, database, and other applications.
WinPM.Net Software
The complete WinPM.Net software package enables the meter to be part of a fully
networked information system with other meters and local and wide-area
computer networks. WinPM.Net is recommended for all power monitoring
systems where advanced analysis and control capabilities are required.
WinPM.Net provides tools for managing your power monitoring network,
logging data, analyzing real-time and logged data, generating power system
reports, and creating custom functionality at the meter level.
Chapter 1 - Introduction Page 15
Page 16

Communications Protocols 9300 Series User’s Guide
WinPM.Net also offers two ways to remotely view information through a web
browser: WebReach and Microsoft Terminal Services.
WebReach only requires an URL to display a meter’s real-time data and select
views of historical and waveform data from a web browser; there is no client
machine configuration. WebReach is a data display application; there is no
control functionality available through it.
Microsoft Terminal Services enable full WinPM.Net functionality, including
control features. Some client machine configuration is required.
ION Setup™ Software
ION Setup is a meter configuration tool designed specifically to configure and test
meters. ION Setup offers an intuitive graphical interface for performing basic
meter setup, installing templates into meters, viewing real-time and reset
accumulated values, verifying meter calibration and measurements, and setting
up advanced security.
Communications Protocols
The 9300 Series meter can be integrated into various industry-standard
networks. Data that is measured by the unit can be made available to other devices
using ACCESS, Modbus, and DNP V3.00 (9330 and 9350) protocols. The 9300
meter also has the option available to communicate using the Profibus protocol.
You can also configure the meter to import data from devices on these networks.
With these advanced communications functions, the power of the meter can be
utilized in most existing power monitoring systems. Any data display and analysis
software that works with Modbus or DNP devices will also function with the 9300
Series meter.
The standard meter has one infrared port and one or two RS-485 communications
ports (the 9300 has one, the 9330 and 9350 have two). These ports are capable of
data rates up to 19,200 bps. The infrared port on the front panel is compatible with
an ANSI C12.13 Type II magnetic optical communications coupler. It can be used
to communicate real-time measurements via ACCESS, Modbus, or DNP protocols.
The RS-485 and infrared ports can communicate simultaneously. Ordering options
can include a 10Base-T Ethernet port, a 33.6 kbps internal modem, and a Profibus
port, depending on the model type of your 9300 Series meter.
Digital and Analog I/O Options
The 9300 Series meter offers a variety of analog and digital I/O combinations. I/O
connections to the meter are made via captured-wire terminals on the meter. The
analog I/O option can be specified for any 9300 Series meter, allowing you to
monitor a wide range of conditions, such as flow rates, device cycles (RPM), fuel
levels, oil pressures and transformer temperatures. You can output energy pulses
to an RTU or perform equipment control operations.
Page 16 Chapter 1 - Introduction
Page 17

9300 Series User’s Guide The Meter is Factory-Configured and Ready to Operate
Digital Outputs
All 9300 Series meters have four programmable digital output ports. These are
suitable for pulsing or controlling relays. The Infrared Data Port and/or a rear
panel LED can also be used for energy pulsing.
Status Inputs
Four optically isolated digital inputs on the 9330 and 9350 meters can monitor
status, count transducer pulses, breaker trips and pulses from any external “volts
free” dry contact.
Analog Inputs/Outputs
Any meter in the 9300 Series can be equipped with an optional analog I/O card
featuring:
4 analog inputs accepting 0–1mA or 0–20mA, (scalable to 4-20mA)
4 analog outputs accepting 0–1mA or 0–20mA, (scalable to 4-20mA)
NOTE
When equipped with analog I/O, TRAN base units cannot be ordered with a remote display (RMD).
REB Option
Adding the Relay Expansion Board (REB) option can enhance the functionality of
the onboard digital outputs. The REB option includes a four-position Grayhill
module rack and a 100-240VAC to 5VDC power supply. Grayhill modules are
ordered separately.
The Meter is Factory-Configured and Ready to Operate
Although the 9300 Series meter is fully customizable, it is shipped from the factory
with many functions pre-configured. Once installation and basic setup are
performed, all of the basic measurements and energy calculations are ready to
operate, right out of the box. Many users will find that the factory configuration
will serve their purposes without performing any additional configuration.
Chapter 1 - Introduction Page 17
Page 18
Meter Firmware Revision History 9300 Series User’s Guide
Meter Firmware Revision History
9300 Models
Firmware
Versio n
V250 June 2000
V265 March 2001
V271 July 2002 Adds Web Server capabilities when combined with ETH73V272 firmware
Release Date Firmware Enhancements
Rev B Hardware Initial Release
Improved communications performance
Four Calibration Pulsers added
Harmonic update times improved
Analog I/O supported
New Calibration procedure
9330 Models
Firmware
Versio n
V250 June 2000
V265 March 2001
V271 July 2002 Adds Web Server capabilities when combined with ETH73V272 firmware
Release Date Firmware Enhancements
Rev B Hardware Initial Release
Improved communications performance
Adds 4 Calibration Pulser modules to template
Harmonic update times improved
Analog I/O supported.
New Calibration procedure
V272 September 2002 Maintenance Release
V273 September 2002 Maintenance Release
9350 Models
Firmware
Versio n
V265 March 2001
V271 July 2002
V272 September 2002 Maintenance Release
V273 September 2002 Maintenance Release
V274 November 2002 Maintenance Release
Release Date Firmware Enhancements
Analog I/O supported
New Calibration procedure
Adds Web Server capabilities when combined with ETH73V272 firmware, MeterM@il (data logs)
and alerts.
Page 18 Chapter 1 - Introduction
Page 19

9300 Series User’s Guide Ethernet Card Firmware Revision History
Ethernet Card Firmware Revision History
Firmware
Versio n
V102 June 2000 Maintenance release (support for Rev B hardware)
V270 September 2001
V272 July 2002
Release Date Firmware Enhancements
MeterM@il support added (with 9330V270 firmware)
Modbus TCP support added
Adds Web Server capabilities when combined with 9300 Series V271 firmware, MeterM@il (data
logs) for the 9330 and 9350, and alerts for the 9350
Chapter 1 - Introduction Page 19
Page 20

Using this Guide 9300 Series User’s Guide
Using this Guide
This User’s Guide is directed at three types of user: the typical user or operator, the
system administrator, and the advanced user. You might not fit into any of these
groups directly, or perhaps you are both an operator and an administrator. These
classifications are intended to make this guide easier to navigate with respect to
which information is appropriate to your needs.
Typical User or Operator
Most users simply want to display the data provided by the factory-configured
meter. These users want fast access to data through the front panel, ACCESS
software, or a third-party protocol such as Modbus or DNP.
System Administrator or Manager
Some users need to make minor adjustments so that their meters “fit” their power
systems: data recording intervals, demand sub-intervals and other parameters
may need to be set before the meter’s setup is complete. These users will use the
front panel, or ACCESS software to change settings in the device’s operating
software. (WinPM.Net is highly recommended.)
Advanced User or Systems Integrator
Advanced users may want to make use of the flexibility and power provided by
the device’s operating software. These users will need to become familiar with the
ION Architecture, and the ACCESS software tools used to customize the device’s
operation.
Before You Can Use this Guide
By the time you are ready to use this guide, your meter should be installed, basic
setup should have been performed, and communications/basic operation should
have been verified. If the unit is not yet installed and operational, refer to the 9300
Series Installation Guide shipped with the meter.
Getting More Information
Additional information is available from Siemens. Check our web site at
www.sea.siemens.com, contact your local Siemens representative, or contact
Siemens directly (contact information is provided on the first page of this
document). Documents that are related to the installation, operation and
application of the meter are as follows:
Installation Guide
This brief instructional manual is shipped with each meter. It details the mounting,
wiring and basic setup of the device.
ION Programmer’s Reference
This online reference contains detailed descriptions of all of the modules in each
ACCESS meter.
Page 20 Chapter 1 - Introduction
Page 21

9300 Series User’s Guide Getting More Information
WinPM.Net Getting Started Guide
This guide explains the installation and configuration of the WinPM.Net software
suite.
Online WinPM.Net Help
Each WinPM.Net software component has an in-depth online help system.
Application Notes
Online application notes offer detailed, high-level descriptions of real-world
situations, where Siemens’s ACCESS devices and ACCESS software provide
beneficial solutions.
Chapter 1 - Introduction Page 21
Page 22

Getting More Information 9300 Series User’s Guide
Page 22 Chapter 1 - Introduction
Page 23

2 Using The Front Panel
The meter’s front panel is used for both display and configuration purposes. The
liquid crystal display (LCD) screen and the numerous selection, navigation, and
configuration buttons allow quick access to basic meter configuration provided by
special setup screens. The front panel also provides access to the settings of many
other meter functions, such as customizing the type of data the meter displays.
In This Chapter
Displaying Data with the Front Panel . . . . . . . . . . . . . . . . . . . . . . . . . . . . . 24
Front Panel Display Resolution . . . . . . . . . . . . . . . . . . . . . . . . . . . . . . . . . . . . . . . . . 24
Default Front Panel Display Screens . . . . . . . . . . . . . . . . . . . . . . . . . . . . . . . . . . . . . 25
Configuring the Meter with the Front Panel . . . . . . . . . . . . . . . . . . . . . . . . 27
The Front Panel’s Setup Menus . . . . . . . . . . . . . . . . . . . . . . . . . . . . . . . . . . . . . . . . . 27
Clear Functions Menu . . . . . . . . . . . . . . . . . . . . . . . . . . . . . . . . . . . . . . . . . . . . . . . . . 28
Quick Setup Menu . . . . . . . . . . . . . . . . . . . . . . . . . . . . . . . . . . . . . . . . . . . . . . . . . . . . 30
Advanced Meter Setup Menu . . . . . . . . . . . . . . . . . . . . . . . . . . . . . . . . . . . . . . . . . . 32
Display Setup Menu . . . . . . . . . . . . . . . . . . . . . . . . . . . . . . . . . . . . . . . . . . . . . . . . . . 33
Screen Setup Menu . . . . . . . . . . . . . . . . . . . . . . . . . . . . . . . . . . . . . . . . . . . . . . . . . . . 34
Nameplate Info Menu . . . . . . . . . . . . . . . . . . . . . . . . . . . . . . . . . . . . . . . . . . . . . . . . . 35
Security Menu . . . . . . . . . . . . . . . . . . . . . . . . . . . . . . . . . . . . . . . . . . . . . . . . . . . . . . . . 35
Diagnostic Menu . . . . . . . . . . . . . . . . . . . . . . . . . . . . . . . . . . . . . . . . . . . . . . . . . . . . . 35
Custom Front Panel Displays . . . . . . . . . . . . . . . . . . . . . . . . . . . . . . . . . . . 38
Before Customizing the Front Panel . . . . . . . . . . . . . . . . . . . . . . . . . . . . . . . . . . . . . 38
Page 24
Displaying Data with the Front Panel 9300 Series User’s Guide
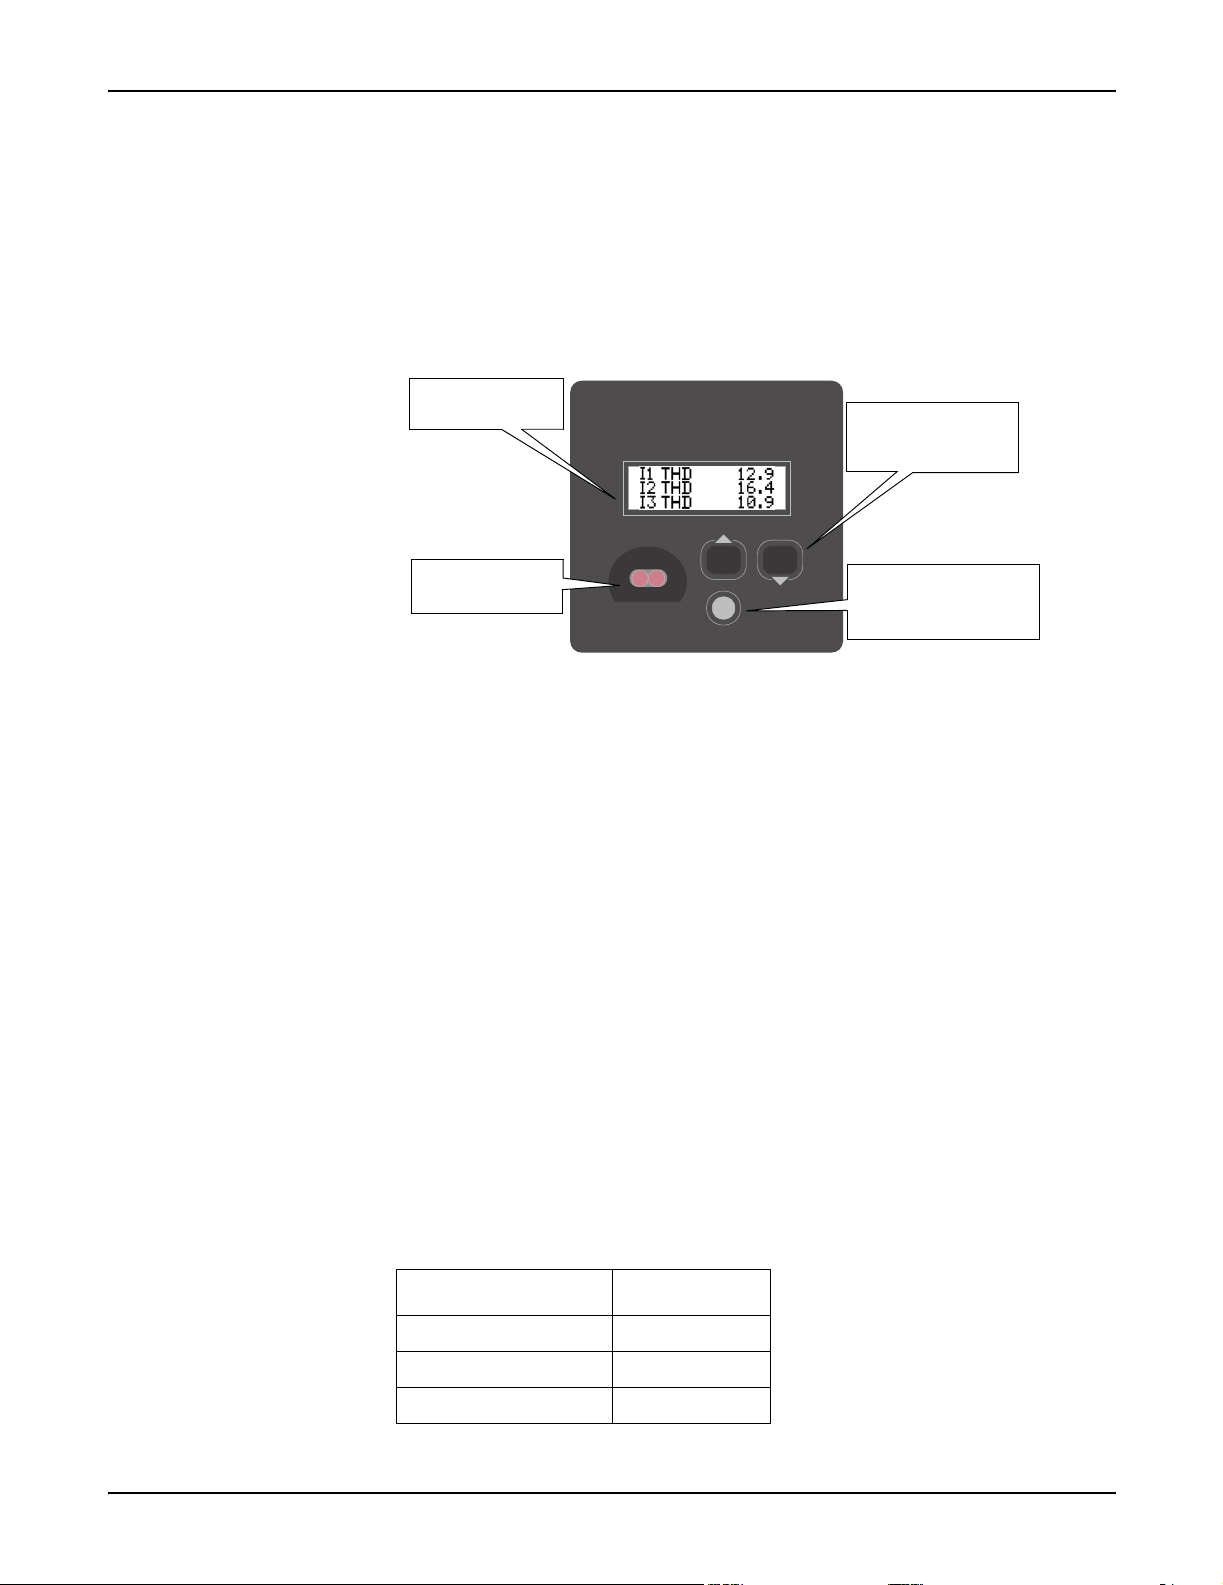
Displaying Data with the Front Panel
The front panel provides a detailed graphics and text display for the meter. The
front panel is configured at the factory with eight displays showing some of the
more commonly used power system values measured by the device (refer to
“Default Front Panel Display Screens”). A Remote Modular Display (RMD) can be
added to an existing TRAN meter to provide a front panel display.
Measurements are
displayed here.
Use the arrow buttons
to scroll through data
display screens.
Optical (Infrared)
port
Button Functions
Press the Up/Down arrow buttons to scroll through the data display screens. You
do not require password authorization to view these screens. The round button,
when pressed, provides access to the Setup menu. Use the front panel’s three
buttons to navigate this menu, and enter settings into the meter. For more
information on setting up the meter using the front panel, refer to “Configuring the
Meter with the Front Panel” on page 27.
Front Panel Display Resolution
When displaying numeric values, the front panel display screen can show up to
nine digits of resolution. This nine digit resolution is available when the display
screen is set to display one parameter. Any multi-parameter screen displays up to
five digits of resolution.
If you require more digit resolution than is available, use ACCESS software to
display data. If a value is too large to be displayed on your display screen (i.e.
greater than 99,999 on a two parameter screen), the front panel uses an abbreviated
engineering notation with standard metric prefixes to indicate the magnitude of
the reading. The following table provides some examples:
Press the round button to
access the Setup menu
or make a selection.
Front Panel Display Value
124K0 124,000
124M0 124,000,000
1G240 1, 240, 000, 000
Page 24 Chapter 2 - Using The Front Panel
Page 25
9300 Series User’s Guide Default Front Panel Display Screens
Numeric values are displayed in base units; voltages are displayed in volts, while
current is displayed in amps. The following values, however, are displayed in kilo
units rather than base units since kilo is the most frequently used value range:
kW
kVA
kVAR
When viewing these parameters with the front panel, remember that the values are
already multiplied by 1000. For example, the reading below indicates
120,000 kilowatts, not 120,000 watts.
kW total 120K0
INVLD and N/A Messages
If the front panel is unable to read a numeric or status value from the meter, it will
display either
received cannot be displayed because it is too large (above 9G999).
INVLD or N/A in place of the value. INVLD indicates that the value
N/A appears if
the register is not available.
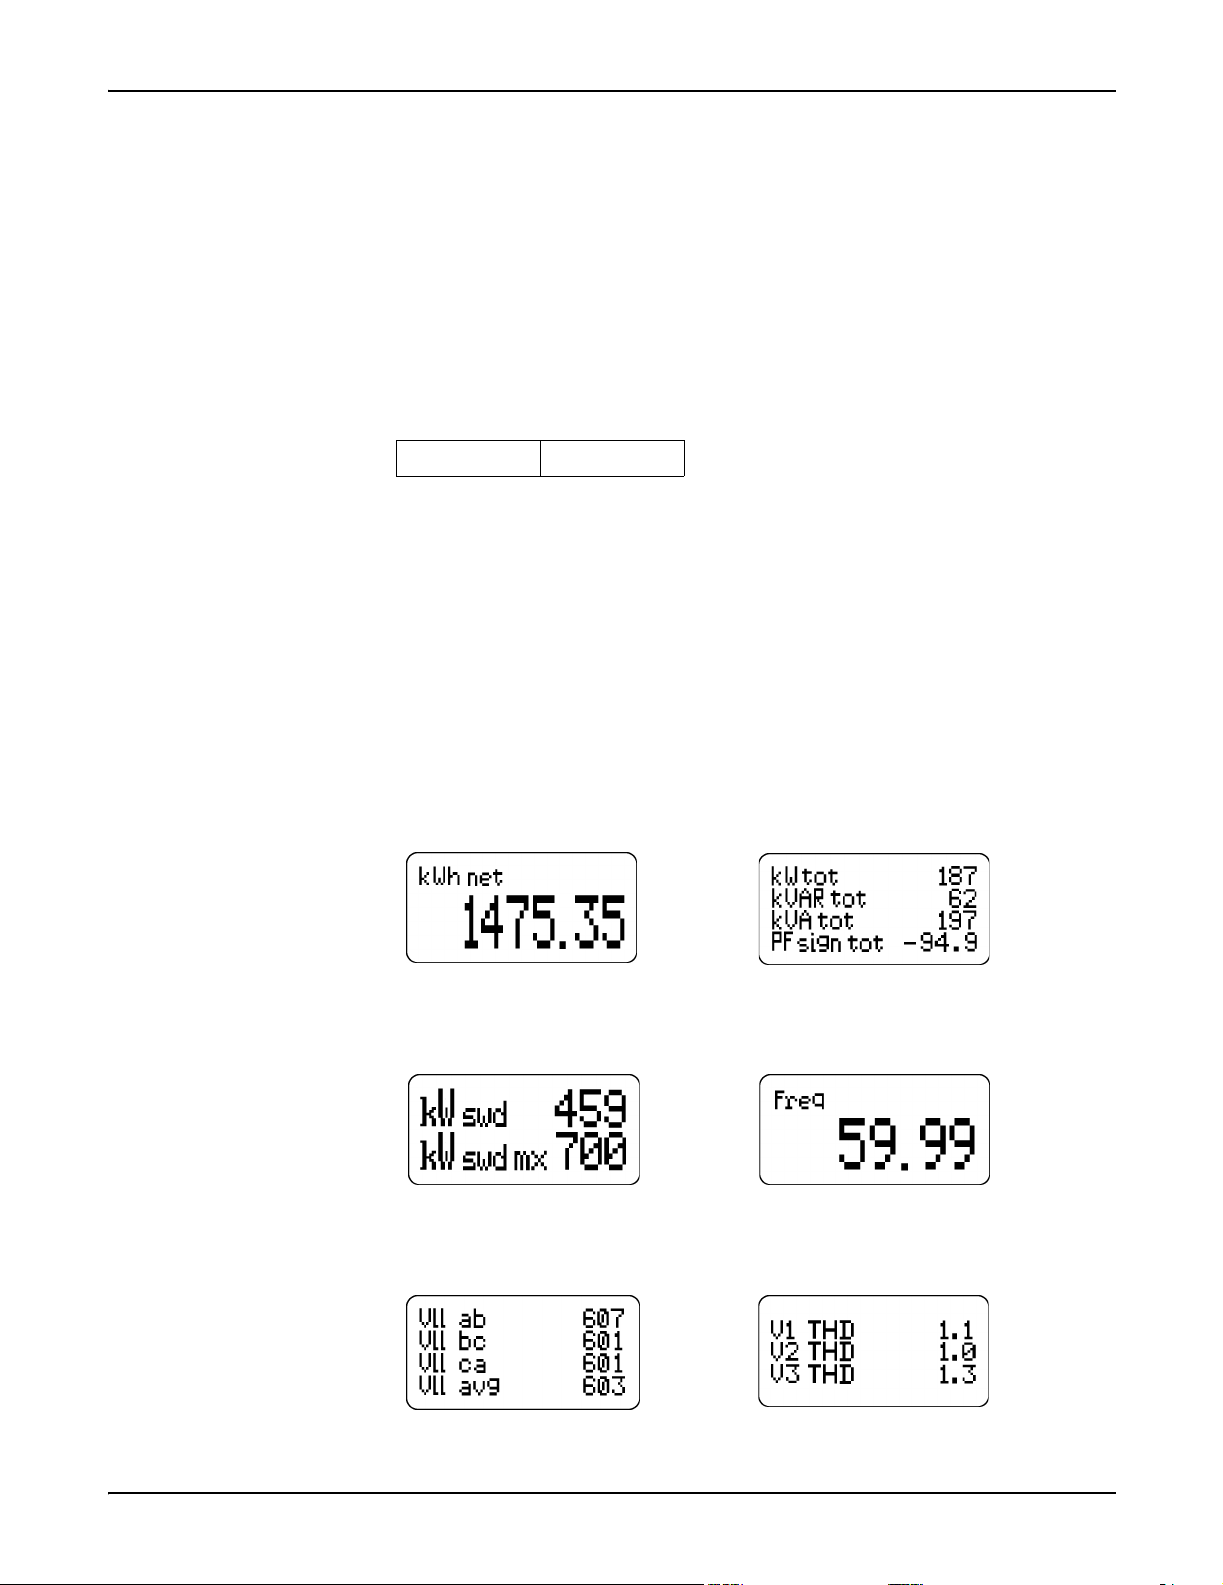
Default Front Panel Display Screens
The meter’s eight default data displays are as follows:
Display 1 (kWh net)
Net Energy
Display 2 (kWh swd / mx)
Present Interval and Maximum
Sliding Window Demand
Display 3 (Volts)
Per-phase and average
line-to-line voltage
Display 5 (Power)
Total Power (true, reactive,
and apparent), Power Factor.
Display 6 (Frequency)
Frequency
Display 7 (V-THD)
Per- phase Vol tage
Total Harmonic Distortion
Chapter 2 - Using The Front Panel Page 25
Page 26

Default Front Panel Display Screens 9300 Series User’s Guide
Display 4 (Amps)
Per-phase and
average current
Display 8 (I-THD)
Per-phase Current
Total Harmonic Distortion
NOTE
Your default data display screens will differ if the meter is in Fixed mode (refer to “Display Mode” on
page 34), or if your meter has custom displays.
Page 26 Chapter 2 - Using The Front Panel
Page 27

9300 Series User’s Guide Configuring the Meter with the Front Panel
Configuring the Meter with the Front Panel
The front panel provides meter setup capability at the meter’s installed location.
All of the meter’s setup registers can be configured moving through menus on the
front panel’s screen (ION module links cannot be modified using the front panel).
The front panel also provides quick access to parameter reset for common
cumulative parameters.
The Front Panel’s Setup Menus
To access the front panel’s device configuration functions, press the round button.
The Setup menu appears listing the meter’s front panel setup options:
Setup Option Description
Clear Functions
Quick Setup Changes settings in the Communications, Power Meter, and Sag/Swell modules.
Adv Meter
Setup
Display Setup Customizes the appearance of the display screen.
Screen Setup Customizes the style and values appearing on the display screens.
Nameplate Info Displays information about the device.
Security
Diagnostics Screens to aid in troubleshooting; refer to “Diagnostic Menu” on page 35.
Resets Min/Max, Sliding Window Demand, Energy, Thermal Demand, Peak
Demand Registers, Harmonics Min/Max, Status Counters, Manual Waveform
Capture, and Disturbance Counts.
Provides access to all the modules in the meter.
Allows you to modify your password. See “Front Panel Password Security” on
page 28.
Accessing the Setup Menus
The three buttons are used to navigate the on-screen menus and edit setup
registers. While the device is displaying data, the Up/Down buttons scroll through
the different display screens. Press the round button at this time to access the Setup
menu.
Navigating Menus
Each menu has a title displayed at the top of the display screen and menu items
displayed below the title. Use the arrow buttons to scroll through the menu items.
To select an item that is highlighted, press the round button. To return to the
previous screen, select R
selecting R
Chapter 2 - Using The Front Panel Page 27
ETURN.
ETURN. Return to the data display screens by repeatedly
Page 28

Clear Functions Menu 9300 Series User’s Guide
Editing Registers
To edit the value of a register, navigate the registers using the arrow keys until the
register you want is highlighted, then press the round button. The register appears
in one of two ways: as a number, or as an option selected from a menu. Once you
have entered the password (if required), a Y
showing the new value of the register. Select Y
register; select N
O to return to the previous screen without changing the value.
Numeric Registers
Use the arrow buttons to change the value of the digit above the cursor.
Change the position of the cursor by holding down an arrow key for about one
second. Holding the up arrow button moves the cursor left one position, and
holding the right arrow button moves the cursor right one position. Once you have
the value you want, press the round button.
Enumerated Registers
Some registers are displayed as a menu of options. The current value of the register
will be displayed in the list with an asterix (*) on either side of it. Use the arrow
buttons to highlight the setting you want, and press the round button.
ES or NO verification screen appears
ES to change the value of the setup
Front Panel Password Security
The password is required when you make a change to a register through the front
panel. Once you have entered a valid password, you can make multiple register
changes. The password is factory set at ‘00000’ (5 zeros). Press the round button
when you have entered the correct front panel password. If you need to change the
password, refer to the section “Security Menu” on page 35.
Clear Functions Menu
The CLEAR FUNCTIONS menu allows you to reset cumulative parameters. To access
the Clear Functions screen, press the round button while the meter is displaying
data; scroll down the Setup menu and select C
Peak Demand Reset
The following Demand parameters are reset when you select P
Maximum and Minimum Rolling (Sliding Window) Demand (kW, kVAR, kVA)
Maximum and Minimum Thermal Demand (kW, kVAR, kVA)
Min/Max Reset
The minimum and the maximum values for each the following parameters are reset
when you select M
LEAR FUNCTIONS.
EAK DMD RSET:
NMX RSET:
Phase and average Current
Line-to-line voltages
Line-to-neutral voltages
Page 28 Chapter 2 - Using The Front Panel
Frequency
PF lead and PF lag
Total kW, kVAR, kVA
Page 29

9300 Series User’s Guide Clear Functions Menu
Sliding Window Demand Reset
These Sliding Window Demand values are reset when SWD
EMAND RSET is selected:
Average Current (I avg) SWD
kVAR SWD
kW SWD
kVA SWD
Thermal Demand Reset
The following Thermal Demand parameters are reset when TD
EMAND RSET is
selected:
Average Current TD
kVAR TD
kW TD
kVA TD
Manual Waveform Trigger
Select this menu item to capture your per-phase current and voltage waveforms.
Harmonics Min/Max Reset
The following Harmonics Parameters are reset when H
Current Total HD (Ia, Ib, Ic)
Voltage Total HD (Va, Vb, Vc)
ARM MNMX RSET is selected:
Energy Reset
The following energy parameters are reset when E
NERGY RSET is selected:
kWh import, export, total and net
kVAh
kVARh import, export, total and net
Status Counters
Each of the four Status Counters that monitor the number of times each Status
input changes are reset when S C
OUNT RSET is selected.
Disturbance Counter Reset
Resets the counter in the Sag / Swell module that keeps track of how many Sags or
Swells are detected by the meter.
Chapter 2 - Using The Front Panel Page 29
Page 30

Quick Setup Menu 9300 Series User’s Guide
Quick Setup Menu
Select QUICK SETUP from the Setup menu to access to the Power Meter module and
the Communications module settings. These settings are all configured when the
meter is initially put into service — typically you will not need to change these
settings once the meter is operational.
Comm 1, Comm 2, and Infrared Comm Menus
The setup registers for the three serial Communication modules are as follows:
Register Default Value Description
CM1 Unit ID
CM1 Baud Rate 9600 The baud rate of the COM 1 port
CM1 Protocol ION The communications protocol for COM 1
CM2 Unit ID
CM2 Baud Rate 9600 The baud rate of the COM 2 port
CM2 Protocol ION The communications protocol for COM 2
IR1 Unit ID
IR1 Baud Rate 9600 The baud rate of the Infrared port
IR1 Protocol ION The communications protocol for the Infrared port
1
The factory set Unit ID is based on the serial number of the meter.
Factory Set
Factory Set
Factory Set
1
1
1
The communications ID for COM 1
The communications ID for COM 2
The communications ID for the Infrared port
Refer to the online ION Programmer’s Reference for details on each Communications
module’s additional registers and their default settings.
Profibus Comm Menu (9300)
In addition to the existing communications ports available on the 9300 meter, the
9300-Profibus option is equipped with a Profibus port capable of operating at baud
rates up to 12 Mbps. You must configure the 9300-Profibus before the meter can
provide power system data to the Profibus network.
The Comm 4 Profibus Communications module has one setting: PB Address. The
default value of this register is 126. Use the front panel to configure this setting to
a unique PB Address on your Profibus network.
Page 30 Chapter 2 - Using The Front Panel
Page 31

9300 Series User’s Guide Quick Setup Menu
Ethernet Menu
The Ethernet module controls the meter’s optional 10Base-T port. Configuring the
Ethernet module registers incorrectly can cause network disruptions. The
following settings can be accessed through the Ethernet Menu:
Setup Register Function
IP Address Sets the IP Address for the meter
Subnet Mask
Gateway
SMTP Server
SMTP Connection Timeout
Webserver Config Access Enables configuration of meter with a web browser
1
Settings available for 9330 and 9350 meters with MeterM@il.
1
Used if subnetting applies to your network – see your network
administrator
Used in multiple network configurations – see your network
administrator
Sets the IP Address for the SMTP Mail Server that is configured to
forward mail from the meter to the final destination
Sets the minimum time that the meter waits for a connection to an
1
SMTP server
Typically your network administrator will provide you with the appropriate IP
address for the meter. The Subnet Mask and Gateway settings are required if you
have communications between multiple Ethernet networks, and if subnetting is
implemented. The SMTP Server and SMTP Connection Timeout settings are
required for MeterM@il (9330 and 9350 meters). Webserver Config Access allows you
to enable/disable configuration of your meter with a web browser.
Power Meter Menu
Select P
OWER METER from the Quick Setup menu to access the following settings:
Register Default Value Description
PM1 Volts Mode 4W-WYE The power system’s configuration – WYE, DELTA, etc.
PM1 PT Prim 347 The Potential Transformer’s primary winding voltage rating.
PM1 PT Sec 347 The Potential Transformer’s secondary winding voltage rating.
PM1 CT Prim 5 The Current Transformer’s primary winding current rating.
PM1 CT Sec 5 The Current Transformer’s secondary winding current rating.
PM1 V1 Polarity NORMAL The polarity of the Potential Transformer on V1.
PM1 V2 Polarity NORMAL The polarity of the Potential Transformer on V2.
PM1 V3 Polarity NORMAL The polarity of the Potential Transformer on V3.
PM1 I1 Polarity NORMAL The polarity of the Current Transformer on I1.
PM1 I2 Polarity NORMAL The polarity of the Current Transformer on I2.
PM1 I3 Polarity NORMAL The polarity of the Current Transformer on I3.
Chapter 2 - Using The Front Panel Page 31
Page 32

Advanced Meter Setup Menu 9300 Series User’s Guide
The remaining Power Meter module setup options and their default values are
given in the online ION Programmer’s Reference. In most cases you can leave them
at their default settings and the meter will function properly.
Sag/Swell Module Settings (9350)
You must set the Sag/Swell module’s Nom Volts setup register to a voltage that
represents the nominal voltage for your power system (for example, 120). If the
Sag/Swell module’s Nom Volts setup register is set to zero, all Sag/Swell module
functions are disabled.
CAUTION
The
Nom Volts
features of the 9350 meter will not properly function.
.
Register Default Description
setup register MUST be set to your primary power system voltage, or the Power Quality
1
Swell Lim
Sag Lim
Nom Volts
1
2
1
The ANSI C84.1 1989 standard recommends a temporary overvoltage limit of 106% for Range B
voltage levels, and a temporary undervoltage limit of 88% for load voltages and 92% for the service
entrance.
The primary power system voltage is sometimes different than the PT Primary setup register value; i.e.
when the PT Primary is used to indicate winding ratio rather than primary voltage.
106
88
2
0
Advanced Meter Setup Menu
The Advanced Meter Setup menu provides access to the setup registers of every ION
module in the meter. To access this menu screen, select A
Setup menu. Follow this procedure to access a setup register:
1. From the Feature Manager screen, select the module’s type.
2. Select the module you want to configure from the list of available modules.
3. From the list of the module’s setup registers, select the one you want to
configure.
The limit a monitored voltage must exceed in order for the meter to
classify it as an overvoltage condition.
The limit a monitored voltage must fall below in order for the meter
to classify it as an undervoltage condition.
The primary power system voltage (line-to-line voltage for Delta
systems, and line-to-neutral voltage for Wye systems).
DV METER SETUP from the
4. Edit the value of the register (see “Editing Registers” on page 3–28).
You may be prompted to enter your password (see “Front Panel Password
Security” on page 3–28). Select Y
register. Select N
O if you want to leave the screen without making any changes.
ES to the next prompt to change the value of the
Refer to the online ION Programmer’s Reference for complete details on each setup
register’s function.
Page 32 Chapter 2 - Using The Front Panel
Page 33

9300 Series User’s Guide Display Setup Menu
Display Setup Menu
When you select DISPLAY SETUP from the Setup menu, you get these settings:
Display Setup Option Default Description
AutoScroll 0 s (Disabled) Time between automatic display screen advance.
Contrast mid The display screen’s contrast level.
Backlight Time 1800 seconds
Update Rate 4 s Period between data display refreshes.
Display Mode Programmable Custom or Factory configured display screen option.
Auto Scroll
Auto Scroll activates each of the enabled display screens in sequence. By default,
the Auto Scroll is disabled. Use the arrow buttons to specify the number of seconds
that each screen is displayed before it flips to the next display screen, then press
the round button to set the value. Any screens that have been disabled will not
appear when Auto Scroll is enabled. Set the numeric value to zero (the default
value) to disable auto scrolling.
Time before display screen backlight automatically
turns off.
Contrast
To change the contrast of the front panel’s display, select CONTRAST. Press an
arrow button once, and the display screen’s contrast slowly changes. Press an
arrow button to stop the process. Press the round button when you are satisfied
with the contrast level.
NOTE
Contrast can be adjusted from any screen by holding down the round button for more than ten seconds.
Release the round button when the contrast is at a suitable level.
Backlight Timeout
This setting changes the amount of time the front panel’s backlight stays on when
the front panel is idle. The backlight has a limited lifespan; to prolong it, you
should only have back-lighting on when you are actively using the front panel.
Select B
ACKLIGHT TIMEOUT, then use the front panel’s buttons to change the
amount of time in seconds that the backlight stays on after a button is pressed.
Update Rate
The update rate specifies how frequently data on the display screen is refreshed.
You may find the values are being updated too frequently, or that the data shown
on screen lags too far behind the actual values. The default update rate is four
seconds; use the front panel’s buttons to change the update rate to suit your needs.
Chapter 2 - Using The Front Panel Page 33
Page 34

Screen Setup Menu 9300 Series User’s Guide
Display Mode
There are two display modes: PROGRAMMABLE MODE and FIXED MODE. The default
is programmable mode, which provides eight data display screens which can be
configured to meet your requirements (see “Custom Front Panel Displays”). Fixed
Mo de displays four screens, each wit h large characters in the display, easily visible
from a distance. The four fixed mode screens display Average Volts, Average
Amps, kW total, and PF total. You cannot customize the fixed mode displays.
Screen Setup Menu
The SCREEN SETUP menu screen allows you to change the data displayed on the
eight display screens. From the S
of display titles appear that correspond to each of the eight display screens (see
“Default Front Panel Display Screens”). The screen number with an asterix (*)
beside it indicates the active display (the screen displayed before you entered
S
ELECT SETUP). Select the screen you want to change, and press the round button.
Two settings appear, V
ALUES and STYLE, that allow you to specify which
measurements to display.
ELECT SETUP menu, select SCREEN SETUP. The list
Style = One Parameter
Style = Four Parameter
Style
The STYLE setting defines the number of parameters on each screen. This setting
has five options for each display screen: O
P
ARAMETER, FOUR PARAMETER, and DISABLED. Select the number of values you
NE PARAMETER, TWO PARAMETER, THREE
want to display (the fewer values you select for display, the larger the
measurement will appear on the display screen).
If you select a large style (for example, one value) for a display screen that is
already set to display more than one value, the front panel warns you with a
message, and displays only the first value — the links to the undisplayable values
are severed and have to be reprogrammed.
Values
The VALUES setting specifies which of the device’s measurements are displayed on
each display screen. When you change the value displayed on a screen, you are
presented with a complete list of the meter’s measurements. Using the lists of
modules provided, select the values you want to have displayed on that display
screen.
The number of
select more values than the style is set to display.
VALUES you can select is a function of the STYLE setting. You cannot
Page 34 Chapter 2 - Using The Front Panel
Page 35

9300 Series User’s Guide Nameplate Info Menu
Nameplate Info Menu
Select NAMEPLATE INFO to display information about the various options of the
device, such as:
Security Menu
manufacturer
meter type and class
service type
voltage and current input ratings
auxiliary power
operating frequency
transformer ratios
meter firmware revision
digital output information
approvals
serial number
accuracy rating
acceptable operating temperature
battery life
configured demand settings
three custom text lines written into
the meter’s Factory module
When any changes are made to the meter via the front panel, the meter prompts
for a user password. The password prevents unauthorized tampering with your
meter’s configuration. Depending on site security, you may want to modify the
user password from the default to protect your configuration. The default
password is 00000 and can be set to a maximum numeric value of 60000.
Changing the User Password
1. Select S
ECURITY from the Setup menu.
Diagnostic Menu
2. You will see that the screen displays 00000. Enter the current password. If you
have not previously changed your password, the default is 00000.
3. Choose M
ODIFY PASSWORD to alter your password (the FACTORY USE ONLY
option is for factory purposes and is not accessible).
4. Enter your new numeric password.
5. Select Y
ES to accept your new password. You will be returned to the Setup menu.
The DIAGNOSTIC menu is accessed from the Setup menu; you can view per-phase
voltage and current harmonics screens, verify communications, verify the digital
I/O, and check the meter’s local time.
Chapter 2 - Using The Front Panel Page 35
Page 36

Diagnostic Menu 9300 Series User’s Guide
Harmonics Diagnostics
Select H
current harmonics to the 31st harmonic. The following is an example of a
harmonics display:
Press and hold the up and down buttons to move the cursor to the harmonic of
interest. The percentage of the fundamental is also displayed.
Communications Diagnostics
The Communications diagnostic screen has a different screens according to the
communications options on your meter.
The RS-485 diagnostic screen shows three boxes labelled COM 1, COM 2 (ETH if
ARMONICS from the Diagnostics menu to view per-phase voltage and
the meter has the optional Ethernet card) and COM 3. The following screen is an
example of Ethernet (COM 2) communication:
COM1
R
T
COM 1 and COM 2 refer to the communications ports on the back panel of the
meter. As there are is no COM2 port on the 9300 meter, the COM2 box never
appears active. The COM 3 box verifies communication through the Infrared
port on the front panel (IR1).
The Ethernet diagnostic screen displays text similar to what you see in the table
below - each label appears with a value next to it. The table explains the meaning
of each possible value.
Label Possible Values Description
ETH73 Version see description Displays the Ethernet meter’s firmware version (e.g. v270)
ETH73 in UPG YES, NO YES means the meter is currently being upgraded
ETH73 Setup N/A, Rec’d
EtherGate YES, NO
ETH
R
N/A means the Setup/options on the meter have not been
transmitted
Rec’d means the Setup/options have been received
YES means EtherGate is supported (9330 and 9350)
NO means EtherGate is not supported (9300)
T
COM3
R
T
Page 36 Chapter 2 - Using The Front Panel
Page 37

9300 Series User’s Guide Diagnostic Menu
The Ethernet Connection diagnostic screen displays text similar to what you see
in the table below - each label appears with a value next to it. The table explains
the meaning of each possible value.
Label Possible Values Description
# Power Ups see description
Connection
# WEB Reqs see description Displays the number of received WEB Page requests
# MeterM@il see description Displays the number MeterM@ils sent
N/A, ION,
Modbus
Displays the number of times the Ethernet card has power
cycled
The type of Ethernet connection:
N/A indicates no connection
ION indicates ION over Ethernet
Modbus indicates either Modbus RTU over Ethernet or Modbus
TCP
I/O Diagnostics
The I/O diagnostics mode verifies the operation of the digital inputs/outputs you
may have connected to the device and, if you ordered the analog I/O option, allows
you to monitor the Analog Input or Analog Output ports on your meter. analog
inputs/outputs. The following diagnostic screens are available:
Digital Ins – This screen displays the four digital input values as seen at the low
level.
Digital Outs – This screen displays the four digital input values as seen at the
low level.
Analog Ins – This screen displays the four analog inputs’s values as seen at each
Analog Input module’s output register.
Analog Outs – This screen displays the four analog outputs’s values as seen at
each Analog Output module’s output register.
Troubleshooting Diagnostics
There are three troubleshooting diagnostic screens available. They are as follows:
kiloWatts – This screen shows per-phase and total kiloWatts.
Volts – This screens shows line to neutral and average volts.
Power Factor – This screen shows signed per-phase and total power factor.
Date/Time Screen
For the 9330 and 9350 meters, this screen displays the time and date from the
device’s internal clock.
For the 9300 meter, this screen displays the time passed sent during a time sync.
The 9300 meter does not increment its internal clock while the meter is powereddown.
Chapter 2 - Using The Front Panel Page 37
Page 38

Custom Front Panel Displays 9300 Series User’s Guide
Custom Front Panel Displays
Custom front panel displays can be created showing any data the meter measures
or calculates. Each display screen can be configured to display any measurements
you require. You can also adjust the size of the characters in each screen so you can
easily read the device’s display from farther away.
There are only eight display screens available for configuration. Since all eight of
the front panel’s screen displays are factory-configured, an existing display must
be changed if you want a custom display. Refer to “Default Front Panel Display
Screens” on page 25 and/or “Display Configuration” on page 50 for details on the
eight default display screens.
The technical note Custom Front Panel Displays has complete details for
personalizing your meter’s display screens.
Before Customizing the Front Panel
In order for the customized screens to be displayed in the front panel’s display, the
meter’s Display Mode must be properly set. Ensure that the Display Options
module’s Display Mode setup register is set to P
setting. If it is required, you can use the meter’s front panel or ACCESS software to
set this register.
ROGRAMMABLE. This is the default
Customizing Displays Using the Front Panel
The SCREEN SETUP menu screen allows you to change the data displayed on the
eight display screens using the front panel (see “Screen Setup Menu” on page 34).
Customizing Displays Using Designer
The front panel display of the 9300 Series is controlled by the Display modules and
Display Options modules. Refer to the ION Programmer’s Reference for detailed
descriptions of the Display module and the Display Options module. Refer to
“ION Enterprise: Designer” on page 83 for details on using Designer.
Display Module
A Display module controls which values are displayed on a display screen, and
how these values are presented. Up to four parameters can be linked to a Display
module — these parameters appear on the display screen when the module is
activated.
Page 38 Chapter 2 - Using The Front Panel
Page 39

9300 Series User’s Guide Before Customizing the Front Panel
Links to a Display module can be made using Designer or the front panel. Each
Display module has one setup register, Display Type, which sets the number of
parameters that the display screen will show.
Power Meter
module
kW tot
kVAR tot
kVA tot
PF sign tot
kWh net
The Display Type setup register has five options: O
P
ARAMETER, THREE PARAMETER, FOUR PARAMETER, AND DISABLED. The number of
Display
Module 5
Source 1
Source 2
Source 3
Source 4
Display
Module 1
Source 1
NE PARAMETER, TWO
inputs for the Display module should match the Display Type setup register.
If you select a Display Type with more parameters than are currently linked to the
Display module, the display screen will show any unavailable inputs as
Display Type is selected which has fewer parameters than are linked to the
module, the Display module will only display the Display Type number, and will
break any links to parameters that it cannot display.
For example, if you have a display screen with four parameters, and you select a
Display Type of One Parameter, the first parameter is displayed and the other three
links to the ION Display module are severed.
N/A. If a
Display Options Module
The Display Options module controls data display settings such as backlight
timeout, automatic display scrolling, parameter update rate, and display mode.
Settings in the Display Options modules are global, and affect all of the front panel
display screens. Refer to “Display Configuration” on page 50 for the Display
Options module’s default setup register settings.
Chapter 2 - Using The Front Panel Page 39
Page 40

Before Customizing the Front Panel 9300 Series User’s Guide
Page 40 Chapter 2 - Using The Front Panel
Page 41

3 Default Meter Functionality
The information provided in this chapter corresponds to factory-configured
ACCESS devices. If you have a custom framework, some of the default settings
may differ for your configuration.
In This Chapter
Default Meter Functionality . . . . . . . . . . . . . . . . . . . . . . . . . . . . . . . . . . . . 42
Basic Setup . . . . . . . . . . . . . . . . . . . . . . . . . . . . . . . . . . . . . . . . . . . . . . . . . . . . . . . . . . 42
Communications Setup . . . . . . . . . . . . . . . . . . . . . . . . . . . . . . . . . . . . . . . . . . . . . . . . 43
Power Quality Setup (9350) . . . . . . . . . . . . . . . . . . . . . . . . . . . . . . . . . . . . . . . . . . . . 44
Data Logging Setup . . . . . . . . . . . . . . . . . . . . . . . . . . . . . . . . . . . . . . . . . . . . . . . . . . . 45
Setpoint Configuration (9330 and 9350) . . . . . . . . . . . . . . . . . . . . . . . . . . . . . . . . . . 48
Meter Clock Configuration . . . . . . . . . . . . . . . . . . . . . . . . . . . . . . . . . . . . . . . . . . . . . 49
Display Configuration . . . . . . . . . . . . . . . . . . . . . . . . . . . . . . . . . . . . . . . . . . . . . . . . . 50
Demand Setup . . . . . . . . . . . . . . . . . . . . . . . . . . . . . . . . . . . . . . . . . . . . . . . . . . . . . . . 52
Factory Information . . . . . . . . . . . . . . . . . . . . . . . . . . . . . . . . . . . . . . . . . . . . . . . . . . . 53
Third Party Protocols . . . . . . . . . . . . . . . . . . . . . . . . . . . . . . . . . . . . . . . . . 54
Using the Modbus RTU Protocol . . . . . . . . . . . . . . . . . . . . . . . . . . . . . . . . . . . . . . . . 54
Using the Modbus/TCP Protocol . . . . . . . . . . . . . . . . . . . . . . . . . . . . . . . . . . . . . . . . 59
Using the DNP 3.0 Protocol . . . . . . . . . . . . . . . . . . . . . . . . . . . . . . . . . . . . . . . . . . . . 60
Using the Profibus Protocol . . . . . . . . . . . . . . . . . . . . . . . . . . . . . . . . . . . . . . . . . . . . 63
Restoring the Factory Configuration . . . . . . . . . . . . . . . . . . . . . . . . . . . . . . 66
Page 42

Default Meter Functionality 9300 Series User’s Guide
Default Meter Functionality
To learn more about the ION modules in your meter, refer to the ION Device
Templates at www.pwrm.com. ION Device Templates list all of the ION modules
available in the current version of your meter, and the total number of each
module. ION Device Templates also show the ranges or options available for each
module’s setup registers.
Basic Setup
Basic configuration of the meter is provided by the Power Meter module. The
Power Meter module is the main connection between the power system
measurements and all other ION modules in the device. This module reports the
values for all voltage, current and power measurements.
The Power Meter module’s setup registers describe details of the power system
being monitored. Many of the Power Meter module’s setup registers are
configured when the meter is initially put into service, although the device will not
operate properly until Volts mode and PT and CT ratios are set. Some registers
may need to be changed to refine the device’s operation.
The functions of the setup registers in the Power Meter module are as follows:
Setup Register Function Defaults
Volts Mode
PT Prim
PT Sec
CT Prim
CT Sec
Vn Polarity The polarity of the Potential Transformer on Vn Normal
In Polarity The polarity of the Current Transformer on In Normal
Phase Order The expected rotation of the voltage phases (ABC or ACB) ABC
Phase Lbls
1
The registers are typically set when the device is commissioned. Changing the values of these registers
while the device is in service is not recommended.
1
1
1
1
1
The power system’s configuration – WYE, DELTA, Single, etc 4W-WYE
The Potential Transformer’s primary winding rating for V1, V2
and V3
The Potential Transformer’s secondary winding rating for V1, V2
and V3
The Current Transformer’s primary winding rating for I1, I2 and I3 5
The Current Transformer’s secondary winding rating for I1, I2
and I3
The phase label format assigned to the outputs (ABC, RST, XYZ,
RYB, RWB or 123)
120
120
5
ABC
Once basic setup is performed (i.e. the PT/CT and Volts Mode settings), the meter
operates properly. Typically there is no need to make further changes to the Power
Meter module’s setup registers.
Page 42 Chapter 3 - Default Meter Functionality
Page 43

9300 Series User’s Guide Communications Setup
Communications Setup
Communication settings are typically configured when the ACCESS meter is
initially put into service. Each communications port on a meter is controlled by a
single Communications module. The modules’ setup registers define the
parameters used for each port, so parameters do vary according to the type of
communications channel selected (i.e. RS-232, RS-485, Modem, Infrared, Ethernet).
Module Name Settings
Communications
Module
Comm 1
Comm 2
Infrared Comm
Comm 1
Comm 2
Infrared Comm COM3 Optical port
Ethernet Comm 10Base-T Ethernet port
Profibus Comm
1
For 9330 / 9350 meters with an optional modem, COM1 is hardwired for ModemGate.
2
COM2 is not available for the 9300 meter.
3
For 9330 / 9350 meters with an optional Ethernet card, COM2 is hardwired for EtherGate.
4 Available for the 9300 meter.
2
4
COM1 RS-485 port and internal modem
COM2 RS-485 port or EtherGate 3 port
Profibus Communications port
1
A communications channel must be configured before you can use ACCESS
software (i.e. Vista or Designer). Altering the settings of the channel that is in use
causes a loss of communications with the meter. Refer to the online ION
Programmer’s Reference for complete details on all the Communications module
setup registers.
Setup Register Description Default
Baud Rate Sets the communications speed, in bits/second for the serial port 9600
RTS Delay Sets the RTS Delay for the serial communications port 0
Unit ID Sets the Unit ID of the communications port
Unit ID is based on
the serial number
1
Protocol Sets the communications protocol for the communications port ION
Comm 1
Ethernet
Profibus Comm PB Address Sets the Profibus Address 126
Chapter 3 - Default Meter Functionality Page 43
Modem Init
IP Address Sets the IP Address of the meter None
Subnet Mask Sets the Subnet Mask setting for the Ethernet Port None
Gateway Sets the Ethernet Gateway setting for the Ethernet Port None
SMTP Server
SMTP Connection
Timeout
2
3
3
1
2
Sets the modem’s initialization string AT&F
Sets the IP Address for the SMTP Mail Server that is configured to
forward mail from the meter to the final destination
Sets the time that the meter will wait when establishing a
connection to an SMTP Server
The factory set Unit ID for this port is based on the serial number of the meter. For example: Serial
number: PA-0009A263-10; Unit ID: 9263.
Setting for the 9330 and 9350 meters.
None
None
Page 44

Power Quality Setup (9350) 9300 Series User’s Guide
3
MeterM@il settings for 9330 and 9350 meters.
Modem Initialization String
The setup register labeled ModemInit is available for 9330 and 9350 meters with
internal modems, and defines the initialization string for the internal modem (by
default, the modem is factory configured to answer on one ring). You should not
require changes to the ModemInit string for normal operation. If you require
advanced modem functionality, you can customize the ModemInit register with a
string up to 47 characters long.
CAUTION
The ModemInit string is automatically sent to the internal modem when the ModemInit setup register is
changed, when the meter is powered up, or when the baud rate of the modem’s Communications
module is changed.
Communications Protocols
By default, all COM ports are configured to use the ACCESS protocol. If you want
to make use of Modbus RTU, DNP 3.00, or GPS configurations, you need to
configure Protocol setup register the Communications module that controls the
port you want to use.
NOTE
The Factory Protocol is reserved for the use by Siemens Customer Service.
Power Quality Setup (9350)
For the 9350 meter, power quality parameters can be set up using the Sag/Swell
module. The Sag/Swell module monitors applicable phase voltages for temporary
undervoltages and overvoltages (i.e. CBEMA Type 2 and Type 3 disturbances).
Once a disturbance is detected, magnitude and duration data is captured by the
Sag/Swell module, and is passed to a data recording framework.
Page 44 Chapter 3 - Default Meter Functionality
Page 45

9300 Series User’s Guide Data Logging Setup
Sag/Swell Module Settings
Setup Register Function Default
1
Nom Volts must be set to enable Power Quality functions. Most applications are
served by the default values entered into the module’s registers, but if you want to
fine-tune Sag/Swell detection, try adjusting the Swell Lim and Sag Lim values.
If the Sag/Swell module’s
meter are disabled. That is why Nom Volts is typically set when the meter is put into service. If
has not been set, enter a value for your power system’s nominal voltage (for example, 120, 277 or 347).
Data Logging Setup
Swell Lim
Sag Lim The magnitude below which a voltage deviation is considered a sag 88
Nom Volts The nominal power system voltage
EvPriority
The primary power system voltage is sometimes different than the PT Primary setup register value; i.e.
when the PT Primary is used to indicate winding ratio rather than
primary voltage.
The magnitude above which a voltage deviation is considered
a swell
The priority assigned to Sag/Swell module events (0 to 255; 255 is
highest)
106
0
200
1
NOTE
Nom Volts
setup register is set to zero, all Power Quality functions of the 9350
Nom Volts
The data recording frameworks contain Data Recorder modules, Waveform
Recorder modules, and Periodic Timer modules. Data Recorder and Waveform
Recorder modules are responsible for logging the power system data. The Periodic
Timer modules control the recording frequency of the recorder modules to which
they are linked.
Default Logging Capacity
The following table summarizes the default recording depths and recording
intervals of the various Data recorders and Waveform recorders in the meter.
Log Depth Interval
Historic Log 930 900 seconds (15 minutes)
Waveform recording (waveform recorders) 3 Triggered on demand
Report Generator Log (EgyDmd Log) 930 900 seconds (15 minutes)
Sag/Swell Log (9350 only) 100 Triggered on demand
Event Log (Event Log Controller module) 50 Triggered on demand
Chapter 3 - Default Meter Functionality Page 45
Page 46

Data Logging Setup 9300 Series User’s Guide
Procedures for changing the logging depth and the frequency of logging are
discussed in the following sections: “Changing the Frequency of Logging” on
page 47 and “Changing the Log Depths” on page 47.
Default Logging Configuration
The standard configuration of the meter includes data recorders that log various
power system data such as energy and demand, or the average power system
quantity used over a period of time (Historic Mean Log). The 9350 also logs sags
and swells in voltage.
Revenue Logging
For the revenue meter option, Data Recorder #1 is locked, so channels must be
specified prior to the meter being sealed. Refer to RMICAN Ordering Sheet on our
website for your particular meter.
For compatibility with the UTS MV-90 billing software, Data Recorder #1 must be
configured as a 16-channel recorder.
Historical Data Logging
One Data Recorder module, the Historic Mean Log, logs the following output
register values by default:
Hist Mean Log
Vll avg mean Vln avg mean
I avg mean kW tot mean
kVAR tot mean kVA tot mean
PF sign mean Freq mean
V unbal mean I unbal mean
V1 THD mean V2 THD mean
V3 THD mean I1 THD mean
I2 THD mean I3 THD mean
WinPM.Net Reporting
One recorder is configured to provide power system data for the Reporter
software. This recorder is labeled Egy Dmd Log. If any input links to this module
are changed, Reporter will not be able to create reports from the device’s logs. If
you use the Reporter software, do not change the parameters that are logged in the
Egy Dmd Log.
Page 46 Chapter 3 - Default Meter Functionality
Page 47

9300 Series User’s Guide Data Logging Setup
Sag/Swell Logging (9350 only)
The meter logs the following output register values:
Sag/Swell Log
SS1 DistDur SS1 DistV1Min
SS1 DistV1Max SS1 DistV2Min
SS1 DistV2Max SS1 DistV3Min
SS1 DistV3Max SS1 DistNominal
Changing the Frequency of Logging
The two Periodic Timer modules that control the frequency of different data
recording are as follows:
“EgyDmd Log” Trg controls the frequency of logging for the Energy and
Demand Log (this log is used for generating reports using Reporter).
“Hist Log Trg” controls the frequency of Historic Data logging.
Change the value in the Period setup register to change the frequency of data
logging (Period values are specified in seconds). Do not change the Sync Mode
setup register.
Changing the Log Depths
Change the value in the Depth setup register to increase the number of records
stored in the recorder. The RecordMode setup register controls how the Data
Recorder will overwrite old records; refer to the Data Recorder module description
in the online ION Programmer’s Reference before changing this setup register.
Changing Waveform Recording
The Waveform Recorder modules do not require changes to their default settings.
If you want to change the format of the recorded waveforms, refer to the
Waveform Recorder module description in the online ION Programmer’s Reference.
Changing the Parameters that are Logged
The meter’s factory configuration logs a comprehensive set of energy, power and
harmonics parameters. You cannot change which parameters are logged by
configuring a setup register. Adding or deleting a log’s parameters is an advanced
procedure, as it requires changes to the links between modules.
The software “Using Designer software” section of Using WinPM.Net describes
adding and deleting links between modules. Once you are comfortable editing
module links, change logged parameters by linking the output registers you want
logged to the inputs of an ION Data Recorder module.
Chapter 3 - Default Meter Functionality Page 47
Page 48

Setpoint Configuration (9330 and 9350) 9300 Series User’s Guide
Setpoint Configuration (9330 and 9350)
Setpoints provide extensive control, secondary protection and analysis capabilities
by allowing you to initiate an action in response to a specific condition. Some
possible applications for the Setpoint module include: demand control, power
quality monitoring, fault detection, activating alarms, and gated logging functions.
For the 9330 and 9350 meters, the Setpoint modules monitor certain ‘over’ and
‘under’ conditions for sliding window demand, current, voltage and power factor.
Module Label Description
Setup Register Function
High Limit
Low Limit
SusUntlON
SusUntlOFF
The limit that a source input must exceed
for an over condition to start
The limit that a source input must exceed
for an under condition to start
Amount of time an input must be out of
range for an over/under condition to start
Amount of time an input must be back in
range for an over/under condition to end
Over kW swd
Under VII avg Monitors under conditions on the VII avg output for the Power Meter module
Over I avg Monitors over conditions on the I avg output for the Power Meter module
Under PF sign Monitors under conditions on the PF sign tot output for the Power Meter module
Monitors over conditions for kW swd on the SD1 Sliding Window Demand
module
Setpoint Module Settings
There is no need to change any of the Setpoint modules’ setup registers for normal
operation of the meter.
Default
Over kW swd Under VII avg Over I avg Under PF sign
1,000,000,000 0 1,000,000,000 0
1,000,000,000 0 1,000,000,000 0
00 0 0
00 0 0
Input Mode
Eval Mode
EvPriority
Page 48 Chapter 3 - Default Meter Functionality
This register specifies how the value of the
source input is interpreted
Determines how the High Limit and Low
Limit setup registers are interpreted
The priority assigned to a Setpoint event (0
to 255; 255 is highest)
Signed Signed Signed Absolute
GreaterThan LessThan GreaterThan LessThan
128 128 128 128
Page 49

9300 Series User’s Guide Meter Clock Configuration
Fine Tuning Over Condition Monitoring
If you want to fine-tune over condition monitoring, the only setup registers you
should change are SusUntlON and SusUntlOFF.
SusUntlON determines how long the modules wait after an over condition is
detected before reporting it. This gives the monitored value a short period to
correct itself before the event is registered with the module, so that very brief over
conditions are ignored. Similarly, SusUntlOFF is the amount of time a normal
value must be present before the module considers normal operation to be
restored. Both SusUntlON and SusUntlOFF values are entered in seconds (the
default value for both is 30 seconds).
Refer to the online ION Programmer’s Reference for more information about the
Relative Setpoint module.
Meter Clock Configuration
The Clock module controls the meter’s internal clock which provides timestamps
for data logged by the device. The clock needs to be configured properly to ensure
that logged data has accurate timestamp information. The Clock module also
receives the time synchronization signals sent to it by the workstation running
ION software, updating the device’s clock when required.
The setup registers in the Clock module specify timezone and Daylight Savings
Time (DST) parameters and time synchronization functions.
Setup Register Function Default
TZ Offset The timezone the device is in, relative to Greenwich Mean Time 0
DST Start Date and time when DST begins 0
DST End Date and time when DST ends 86,400
DST Offset The amount of time the clock is changed when DST begins or ends 0
Time Sync Source The communications port that receives time sync signals COM1
Time Sync Type The type of time sync signal (Local or Universal time) UTC
Clock Source
Specifies the clock’s time synchronization signal source (line frequency, communications signals, or
internal crystal)
Internal
NOTE
When modifying setup registers of the Clock module, use the Format option to convert between UNIX and
conventional time. Refer to the description of the Clock module in the online
Reference
for more details.
Refer to the technical note Time Synchronization and Timekeeping for further details
on using the meter’s time synchronization functions.
ION Programmer’s
Chapter 3 - Default Meter Functionality Page 49
Page 50

Display Configuration 9300 Series User’s Guide
Display Configuration
The meter’s front panel display is controlled by two types of ION modules: the
Display Options module and Display modules. Display modules determine the
form and content of each display screen, and the Display Options module controls
options such as decimal format, daylight savings time display, and backlight
timeout.
There are eight display screens which are all factory-configured. (An existing
display must be changed if you want a custom display.) The default displays are
as follows:
Display Number Display Title Parameters shown
Display #1 kWh net kWh net
Display #2 kWh swd / mx kWh swd, kWh swd mx
Display #3 Volts Va, Vb, Vc
Display #4 Amps Ia, Ib, Ic
Display #5 Power kW tot, kVAR tot, kVA tot, PF sign tot
Display #6 Frequency Freq
Display #7 V-THD V1 Total HD, V2 Total HD, V3 Total HD
Display #8 I-THD I1 Total HD, I2 Total HD, I3 Total HD
Display Options Module Settings
The Display Options module contains setup registers that hold data display
settings such as contrast level and backlight timeout. Settings in the Display
Options modules are global, and affect the entire set of front panel display screens.
Setup Register Function Default
Autoscroll
Backlight Timeout
Display Update Time Sets the period between data display refreshes 4
Display Mode
Sets the number seconds that each screen is displayed before it flips to the next display
screen. Set to DISABLED to turn-off AutoScroll.
Sets the time that the front panel’s backlight stays on after the last press of a front
panel button.
Sets the display to show the four fixed mode display screens, or the eight programmable
display screens.
Disabled
1,800
Programmable
Page 50 Chapter 3 - Default Meter Functionality
Page 51

9300 Series User’s Guide Display Configuration
Display Module Settings
The Display module’s setup registers determine the format that the Source data
will take on the front panel display. Depending on the display screen type, you can
use up to four Source links to a single Display module. Display modules have the
following setup registers:
Setup Register Function
Screen Type Determines the display format (see table below)
The number of parameters you can have linked to the Source inputs depends on the
value of the Screen Type setup register. The supported options for the setup register
and the number of allowable Source inputs for each Screen Type setting are
described below.
Screen Type Setting Max Source inputs Display Description
One Parameter 1
Two Pa ramet e r 2
Three Parameter 3
Four Parameter 4
Displays one to four values. The fewer
the values, the larger the values appear
on the display screen.
Changing the Parameters that are Displayed
The meter’s default display configuration shows a comprehensive set of
parameters. Changing these parameters requires that you alter the links between
various ION modules. Complete details on configuring the front panel displays
are provided in the Custom Front Panel Displays technical note.
Chapter 3 - Default Meter Functionality Page 51
Page 52

Demand Setup 9300 Series User’s Guide
Demand Setup
The demand modules (both Thermal Demand modules and Sliding Window
Demand modules) are configured to calculate the average current demand and
kW, kVAR and kVA demand. The setup registers in the demand modules define
time intervals for demand calculations, setting the sensitivity of the module’s
operation.
Sliding Window Demand Module Settings
Sliding Window Demand is often referred to as Rolling Block Demand. To
compute sliding window demand values, the Sliding Window Demand module
uses the sliding window averaging (or rolling interval) technique which divides
the demand interval into sub-intervals. The demand is measured electronically
based on the average load level over the most recent set of sub-intervals. This
method offers better response time than fixed interval methods.
Setup Register Function Default
Sub Intvl The time, in seconds, in the sliding window demand sub-interval 900
#SubIntvls The number of sub-intervals in the sliding window 1
Pred Resp
The speed of Predicted Demand calculations; use higher values for
faster prediction (70 to 99 recommended)
70
Thermal Demand Module Settings
The Thermal Demand module calculates thermal demand over a specified length
of time. It uses a method which is equivalent to thermal averaging. For thermal
averaging, the traditional demand indicator responds to heating of a thermal
element in a Watt-Hour meter. You can adjust the Thermal Demand module's
calculation to mimic this technique by changing the Time Const and Interval setup
parameters.
Setup Register Function Default
Interval The time, in seconds, in the thermal demand interval 900
Time Const
The sensitivity to changes in the source signal; higher values
provide faster response time (common values are 63 and 90)
90
Page 52 Chapter 3 - Default Meter Functionality
Page 53

9300 Series User’s Guide Factory Information
Factory Information
The Factory module displays firmware version, serial number and other device
information in read-only setup registers (read-only registers can be viewed but not
changed).
Factory Module Settings
The device information provided is as follows:
Setup Register Description
Device Type A device type identifier (“7300” for the 9300)
Compliance A statement of whether the device is ION compliant or not
Options Shows model number of meter
Revision The meter’s firmware version
Serial Num The meter’s serial number
ION Version The ION version supported by the device
Template The name of the factory default template (framework) installed on the device
Nom Freq The expected frequency of the power system being monitored
The Factory module also contains numerous read-only setup registers that hold
the calibration constants used at the factory.
How to TAG Your Meter
Three setup registers are provided for you to enter your company name and other
text information you want stored in the device. These configurable setup registers
are as follows:
Owner - This is a text register for storing user information (e.g. company name);
it can be up to 255 characters in length.
Tag 1 - This is a text register for storing user information (e.g. device location); it
can be up to 15 characters in length.
Tag 2 - This is a text register for storing user information (e.g. device number or
identifier); it can be up to 15 characters in length.
Chapter 3 - Default Meter Functionality Page 53
Page 54

Third Party Protocols 9300 Series User’s Guide
Third Party Protocols
Modbus and DNP modules are factory configured and do not require basic
configuration changes. Changing the factory configuration is an advanced setup
procedure that requires an understanding of the protocol, as well as an
understanding of the meter’s internal operation.
Refer to the technical notes DNP 3.0 and ION Technology and Modbus and ION
Technology for the appropriate list of protocol parameters available.
NOTE
The meter can also be configured to receive data through Modbus or DNP 3.0, though there is no factoryconfigured framework for receiving data through these protocols. An 9300 Series meter can receive data
if the meter writes to hard-coded registers.
For details on configuring your network for receiving data via Modbus or DNP 3.0, refer to the DNP Slave
Import module descriptions in
documents, as well as the technical notes
Technology
.
ION Programmer’s Reference
DNP 3.0 and ION Technology
and the 9300 Series Modbus protocol
and
Modbus and ION
Communications Protocol Configuration
In order to use the factory Modbus or DNP configuration you must first configure
the communications channel you want to use. By default all communications ports
are configured to use the ACCESS protocol. Choose the 3rd-party protocol you
want from the list of available protocols in the Communications module’s Protocol
setup register.
NOTE
Modbus RTU is available on each of the meter’s communications ports, and multiple ports can
communicate using Modbus simultaneously. Only a single port can use the DNP 3.00 protocol at any
one time.
The meter is factory configured to provide advanced interoperability support. The
meter is readily incorporated into third party power monitoring systems. This
section describes how to communicate with the meter via Modbus RTU, Profibus,
and DNP 3.0 protocols.
Using the Modbus RTU Protocol
The meter can make any real-time data available through the Modbus RTU
protocol. Modbus Master devices connected to the 9300 can access this data.
Modbus Master devices can also write data into 9300’s module registers, making
device configuration changes or initializing control actions.
Page 54 Chapter 3 - Default Meter Functionality
Page 55

9300 Series User’s Guide Using the Modbus RTU Protocol
Factory Modbus Configuration for the 9300 Series Meter
The 9300 Series meter makes data available to Modbus devices using four Modbus
Slave modules. These modules are linked to other modules in the meter that
provide energy, power and demand data. Once a communications channel is
configured to use Modbus RTU protocol (refer to “Communications Setup” in
Chapter 3), the data is available to Modbus Master devices.
communications port is set
to Modbus RTU protocol
40011
data is available to
Modbus Master devices
Power Meter
Module
ION Meter
measured data is linked
to Modbus module’s input
Vln a
Modbus Slave
Module
Modbus module outputs
data in Modbus format
As the data available through the Modbus Slave modules is in a specific format,
knowledge of the Modbus protocol and an understanding of the settings used in
the meter are required to interpret the data provided.
Changing the Modbus Configuration
If the factory Modbus configuration does not suit your needs, the existing Modbus
Slave modules can be relinked to other parameters that you want to access through
Modbus. There are ten Modbus Slave modules available in the 9300 Series meter,
so you can create more modules to make other parameters available to Modbus
Master devices.
If your Modbus Master device requires data in a format different than that
provided by the factory Modbus configuration, you can edit the setup registers in
the Modbus Slave modules. These setup registers specify the Modbus format,
scaling and base address settings. Refer to the ION Programmer’s Reference for
complete details on Modbus Slave module functionality.
NOTE
Refer to the
in the 9300 Series of meters.
Modbus 7300 Series
protocol document for complete details on the Modbus implementation
Modbus Slave Module Settings
The settings in the Modbus Slave module setup registers are shown in the tables
below. Refer to the Modbus Slave module description in the ION Programmer’s
Reference for complete details of each setup register’s function and options.
Refer to the Modicon Modbus Protocol document for additional details on the
Modbus implementation in the 9300 Series meter.
Chapter 3 - Default Meter Functionality Page 55
Page 56

Using the Modbus RTU Protocol 9300 Series User’s Guide
Modbus Slave Module #1 Modbus Slave Module #2
Setup Register Setting Setup Register Setting
Format unsigned 16-bit Format signed 32-bit
Base Address 40011 Base Address 40027
Scaling YES Scaling YES
In Zero 0 In Zero -214748364
In Full 6553 In Full 214748364
Out Zero 0 Out Zero -2147483640
Out Full 65530 Out Full 2147483640
Modbus Slave Module #3 Modbus Slave Module #4
Setup Register Setting Setup Register Setting
Format signed 32-bit Format signed 32-bit M10K
Base Address 40059 Base Address 40089
Scaling YES Scaling NO
In Zero -214748364
In Full 214748364
Out Zero -2147483640
Out Full 2147483640
Modbus Slave Module Parameter Mapping
The following tables show which measurements are provided by each of the four
Modbus Slave modules. The source for each measurement is shown (“Source ION
Module”) so that you can easily delete parameters if you want to access different
data. Note that the Modbus Register remains the same if you link a different
parameter into one of the Modbus Slave module inputs (i.e. any value you link to
Modbus Slave module #1, Source Input #1 will use Modbus Register 40011).
Modbus Slave Module #1 Links
Measurement Label Source ION Module Modbus Module and Input Number Modbus Register
L-N Voltage Phase A Vln a Power Meter Modbus Slave #1 – Source Input #1 40011
L-N Voltage Phase B Vln b Power Meter Modbus Slave #1 – Source Input #2 40012
L-N Voltage Phase C Vln c Power Meter Modbus Slave #1 – Source Input #3 40013
Average L-N Voltage Vln avg Power Meter Modbus Slave #1 – Source Input #4 40014
L-L Voltage AB Vll ab Power Meter Modbus Slave #1 – Source Input #5 40015
L-L Voltage BC Vll bc Power Meter Modbus Slave #1 – Source Input #6 40016
L-L Voltage CA Vll ca Power Meter Modbus Slave #1 – Source Input #7 40017
Page 56 Chapter 3 - Default Meter Functionality
Page 57

9300 Series User’s Guide Using the Modbus RTU Protocol
Measurement Label Source ION Module Modbus Module and Input Number Modbus Register
Average L-L Voltage Vll avg Power Meter Modbus Slave #1 – Source Input #8 40018
Phase A Current I a Power Meter Modbus Slave #1 – Source Input #9 40019
Phase B Current I b Power Meter Modbus Slave #1 – Source Input #10 40020
Phase C Current I c Power Meter Modbus Slave #1 – Source Input #11 40021
Average Current I avg Power Meter Modbus Slave #1 – Source Input #12 40022
Voltage Unbalance V unbal Power Meter Modbus Slave #1 – Source Input #13 40023
Current Unbalance I unbal Power Meter Modbus Slave #1 – Source Input #14 40024
Line Frequency Freq Power Meter Modbus Slave #1 – Source Input #15 40025
L-N Voltage Phase A Vln a Power Meter Modbus Slave #1 – Source Input #1 40011
Modbus Slave Module #2 Links
Measurement Label Source ION Module Modbus Module and Input Number Modbus Register
Phase A kW kW a Power Meter Modbus Slave #2 – Source Input #1 40027-40028
Phase B kW kW b Power Meter Modbus Slave #2 – Source Input #2 40029-40030
Phase C kW kW c Power Meter Modbus Slave #2 – Source Input #3 40031-40032
Total kW kW tot Power Meter Modbus Slave #2 – Source Input #4 40033-40034
Phase A kVAR kVAR a Power Meter Modbus Slave #2 – Source Input #5 40035-40036
Phase B kVAR kVAR b Power Meter Modbus Slave #2 – Source Input #6 40037-40038
Phase C kVAR kVAR c Power Meter Modbus Slave #2 – Source Input #7 40039-40040
Total kVAR kVAR tot Power Meter Modbus Slave #2 – Source Input #8 40041-40042
Phase A kVA kVA a Power Meter Modbus Slave #2 – Source Input #9 40043-40044
Phase B kVA kVA b Power Meter Modbus Slave #2 – Source Input #10 40045-40046
Phase V kVA kVA c Power Meter Modbus Slave #2 – Source Input #11 40047-40048
Total kVA kVA tot Power Meter Modbus Slave #2 – Source Input #12 40049-40050
Phase A signed PF PF sign a Power Meter Modbus Slave #2 – Source Input #13 40051-40052
Phase B signed PF PF sign b Power Meter Modbus Slave #2 – Source Input #14 40053-40054
Phase C signed PF PF sign c Power Meter Modbus Slave #2 – Source Input #15 40055-40056
Modbus Slave Module #3 Links
Measurement Label Source ION Module Modbus Module and Input Number Modbus Register
kW Thermal Dmd kW td Thermal Demand Modbus Slave #3 – Source Input #1 40059-40060
kVAR Thermal Dmd kVAR td Thermal Demand Modbus Slave #3 – Source Input #2 40061-40062
kVA Thermal Dmd kVA td Thermal Demand Modbus Slave #3 – Source Input #3 40063-40064
Max kW Th Dmd kW td mx Maximum Modbus Slave #3 – Source Input #4 40065-40066
Chapter 3 - Default Meter Functionality Page 57
Page 58

Using the Modbus RTU Protocol 9300 Series User’s Guide
Measurement Label Source ION Module Modbus Module and Input Number Modbus Register
Max kVAR Th Dmd kVAR td mx Maximum Modbus Slave #3 – Source Input #5 40067-40068
Max kVA Th Dmd kVA td mx Maximum Modbus Slave #3 – Source Input #6 40069-40070
Max Avg L-N Voltage Vln avg mx Maximum Modbus Slave #3 – Source Input #7 40071-40072
Max Average Current I avg mx Maximum Modbus Slave #3 – Source Input #8 40073-40074
Maximum Total kW kW tot mx Maximum Modbus Slave #3 – Source Input #9 40075-40076
Maximum Total kVAR kVAR tot mx Maximum Modbus Slave #3 – Source Input #10 40077-40078
Maximum Total kVA kVA tot mx Maximum Modbus Slave #3 – Source Input #11 40079-40080
Maximum Frequency Freq mx Maximum Modbus Slave #3 – Source Input #12 40081-40082
Min Avg L-N Voltage Vln avg mn Minimum Modbus Slave #3 – Source Input #13 40083-40084
Min Average Current I avg mn Minimum Modbus Slave #3 – Source Input #14 40085-40086
Minimum Frequency Freq mn Minimum Modbus Slave #3 – Source Input #15 40087-40088
Modbus Slave Module #4 Links
Measurement Label Source ION Module Modbus Module and Input Number Modbus Register
Imported kWh kWh imp Integrator Modbus Slave #4 – Source Input #1 40089-40090
Exported kWh kWh exp Integrator Modbus Slave #4 – Source Input #2 40091-40092
Total kWh kWh tot Integrator Modbus Slave #4 – Source Input #3 40093-40094
Net kWh kWh net Integrator Modbus Slave #4 – Source Input #4 40095-40096
Imported kVARh kVARh imp Integrator Modbus Slave #4 – Source Input #5 40097-40098
Exported kVARh kVARh exp Integrator Modbus Slave #4 – Source Input #6 40099-40100
Total kVARh kVARh tot Integrator Modbus Slave #4 – Source Input #7 40101-40102
Net kVARh kVARh net Integrator Modbus Slave #4 – Source Input #8 40103-40104
Total kVAh kVAh Integrator Modbus Slave #4 – Source Input #9 40105-40106
Max Phase A Voltage THD V1 THD max Maximum Modbus Slave #4 – Source Input #10 40107-40108
Max Phase B Voltage THD V2 THD max Maximum Modbus Slave #4 – Source Input #11 40109-40110
Max Phase C Voltage THD V3 THD max Maximum Modbus Slave #4 – Source Input #12 40111-40112
Max Phase A Current THD I1 THD max Maximum Modbus Slave #4 – Source Input #13 40113-40114
Max Phase B Current THD I2 THD max Maximum Modbus Slave #4 – Source Input #14 40115-40116
Max Phase C Current THD I3 THD max Maximum Modbus Slave #4 – Source Input #15 40117-40118
Importing Data using Modbus RTU
It is possible to bring data into the 9300 Series meter using Modbus. Various ION
registers can be written by Modbus Master devices by correlating the Modbus
register number with the address of the ION register you want to write. When a
Modbus register is written with a value, the corresponding ION register will be
written, provided the Modbus RTU protocol is active on the communications
channel that connects the Modbus Master to the 9300 Series meter.
Page 58 Chapter 3 - Default Meter Functionality
Page 59

9300 Series User’s Guide Using the Modbus/TCP Protocol
You can use the Modbus RTU protocol to write values into ION external numeric,
pulse and Boolean modules, allowing you to enable, disable and reset meter
functions. You can also use Modbus to change setup register values in various ION
modules to configure the meter’s operation.
All of the information required to write to ION registers through Modbus is
available in 9300 & 9330 Modicon Modbus Protocol, available on the Technical
Documentation CD, or by request from Siemens.
Using the Modbus/TCP Protocol
Modbus/TCP is the newest open Modbus protocol variant (formerly called
MBAP). It defines the packet structure and connection port (port 502) for the
industry standard TCP/IP protocol. The structure of Modbus/TCP is very similar
to the Modbus RTU packet except that it has an extra six-byte header and does not
use the cyclic redundancy check (CRC). Some of the newest ION firmware now
supports Modbus/TCP for direct communications with the meter.
Modbus/TCP retains the Modbus RTU limit of 256 bytes to a packet. It is suggested
that higher through-put is possible if this limitation is removed. This variant is
called Enhanced Modbus/TCP but, so far, few devices have moved to support it.
Another variant, that has yet to gain popularity, is from the Semiconductor
Equipment and Materials International (SEMI) trade association. The Generic
Sensor-Bus Sub-Committee created the Sensor/Actuator Network Standard (SEMI
E54-0997).
Modbus TCP Communications
You can now communicate to the meter via Modicon® Modbus TCP (formerly
called MBAP). Your meter must have the optional Ethernet port.
Connect to socket 502.
Ethernet
Be aware that you cannot form an EtherGate connection to the Modbus TCP
network.
Connect to socket 502
Meter with optional
Ethernet port
Chapter 3 - Default Meter Functionality Page 59
Page 60

Using the DNP 3.0 Protocol 9300 Series User’s Guide
Using the DNP 3.0 Protocol
The Distributed Network Protocol Version 3.00 (DNP 3.0) is an open protocol used
in the electric utility industry for communications and interoperability among
substation computers, RTUs, IEDs, and Master Stations. The 9300 can be
integrated into a DNP network using the DNP Slave Import, Export and Options
modules.
NOTE
Complete DNP documentation is available through the DNP User’s Group (on the web at www.dnp.org).
This documentation describes DNP 3.0 Transport Functions, the Application Layer Protocol, the Data
Object Library, Data Link Layer Protocol Description, and the Subset Definitions.
Factory DNP 3.0 Configuration for the 9330 and 9350
The meter’s factory configuration makes various parameters available through
DNP 3.0. There is no factory-configured functionality for importing DNP 3.0 data
into the meter. ION modules are linked to DNP Slave Export modules which
convert the ION data into the appropriate DNP objects. These objects are available
through the meter’s communications port that is configured to use the DNP 3.0
protocol. The DNP Options module sets global options for all of the DNP Slave
Export modules.
DNP Options
Module
DNP Options module
Power Meter
Module
ION Meter
measured data is linked
to DNP module’s input
Vln a
DNP Export
Module
DNP module outputs
data as DNP objects
sets global options
for all DNP modules
DNP objects
data is available
to DNP devices
communications port is
set to DNP 3.0 protocol
Changing the DNP Configuration
If the factory DNP configuration does not suit your needs, the existing DNP Slave
Export modules can be relinked to other parameters that you want to access
through DNP. Alternately you can add additional DNP Slave Export modules and
link the desired ION parameters to them. There are 16 DNP Slave Export modules
available on the 9330 and 9350; of these, 14 are used by the factory configuration.
NOTE
Only one port per 9330 or 9350 can be used with DNP 3.0.
Page 60 Chapter 3 - Default Meter Functionality
Page 61

9300 Series User’s Guide Using the DNP 3.0 Protocol
If your DNP network requires data in a format different than that provided by the
factory DNP configuration, you can edit the setup registers in the DNP Slave
Export modules and the DNP Options module. Do not make any changes to the
DNP Options module’s setup registers unless you understand the effects each
change will cause. Refer to the ION Programmer’s Reference for complete details on
DNP Slave Export and DNP Slave Options module function.
As DNP 3.0 is a very complex protocol, an in-depth understanding of DNP 3.0 is
required to interpret the settings in the DNP Options module and the DNP Slave
Export modules. It is beyond the scope of this meter’s User’s Guide to describe
DNP; consult the DNP User’s Group or other resources to learn more about the
protocol.
DNP Slave Export Module Settings
The 14 factory-configured DNP Slave Export modules are configured as shown in
the following table.
Setup Register Setting
BasePoint Varies – each analog input or binary counter has a different BasePoint
StaticObj 11 modules are Analog Input; three are Binary Counter
EventObj Disable Event Objects
Deadband 0
FrozStaObj Disable Frozen Static Objects
FrozEvtObj Disable Frozen Event Objects
EventClass Class 1
Scaling OFF (excluding Unbalx10 and Freqx10 which are ON)
IONZero 0
IONFull 0 (1000 for Unbalx10 and 100 for Freqx10)
DNPZero 0
DNPFull 0 (10000 for Unbalx10 and 1000 for Freqx10)
Some setup register settings vary for different modules. Specifically, BasePoint
differs for each module within a group (Analog Input and Binary Counter are
groups), and StaticObj is set to Analog Input for the 11 analog input points and
Binary Counter for the three binary counter points. (StatObj defines the type of
DNP object the module provides when the Master polls it.)
In addition, Scaling is
OFF for all but two modules. The only modules that apply
scaling are the Analog Input points that provide Voltage and Current Unbalance
data (labeled Unbalx10) and Frequency data (Labeled Freqx10). These modules
apply x10 scaling.
Chapter 3 - Default Meter Functionality Page 61
Page 62

Using the DNP 3.0 Protocol 9300 Series User’s Guide
DNP Options Module Settings
The DNP Options module provides global settings that affect all DNP Slave Export
and DNP Slave Import modules. The default settings in this module are shown in
the following table.
Setup Register Setting Function
BinInStatic Single-bit Binary Input Variant for Binary Input Static objects
BinInEvents Binary Input Change w/o time Variant for Binary Input Event objects
BinInEvDepth 100 Maximum number of Binary Input Events that can be stored
BinCntStatic 16-bit Binary Counter w/o flag Variant for Binary Counter Static objects
FrzCntStatic 16-bit Frozen Counter w/o flag Variant for Frozen Counter Static objects
FrzCntEvents 16-bit Frozen Counter Event w/o time Variant for Frozen Counter Event objects
FrzCntEvDepth 100 Max number of Frozen Counter Events that can be stored
CntChangeEvents 16-bit Counter Change Event w/o time Variant for Counter Change Event objects
CntChangeEvDepth 100 Max number of Counter Change Events that can be stored
AIStatic 16-bit Analog Input w/o flag Variant for Analog Input Static objects
FrzAIStatic 16-bit Frozen Analog Input w/o flag Variant for Frozen Analog Input Static objects
FrzAIEvents 16-bit Frozen Analog Event w/o time Variant for Frozen Analog Input Event objects
FrzAIEvDepth 100 Max number of Frozen Analog Input Events that can be stored
AIChangeEvents 16-bit Analog Input Change Event w/o time Variant for Analog Input Change Event objects
AIChangeEvDepth 200 Max number of Analog Input Change Events that can be stored
AOStatic 16-bit Analog Output Status Variant for Analog Output Block objects
SelectTimeout 10 Select Before Operate timeout period (in seconds)
TimeSynchPeriod 86400 Time (in seconds) between IED requests for time syncs
ALFragSize 2048 Max application layer message size (in octets) that IED can send
DLAck Never When device requests data link layer acknowledgements
DLTimeout 2 How long the data link layer waits for acknowledgement from Master
DLNumRetries 0 How many times a data link layer packet is re-sent after failing
Importing Data using DNP 3.0
Data can be imported into the 9330 and 9350 from a DNP Master device. DNP
Slave Import modules are used to take a DNP analog or binary output object and
map it into an ION numeric or Boolean register. Refer to the ION Programmer’s
Reference for detailed module descriptions.
Page 62 Chapter 3 - Default Meter Functionality
Page 63

9300 Series User’s Guide Using the Profibus Protocol
Using the Profibus Protocol
Those 9300 meters ordered with the optional Profibus port are suitable to provide
many real-time power system measurements to a Profibus network. Profibus
Master devices connected to the 9300-Profibus can access this data. Refer to the
9300 & 9330 Profibus Protocol Document for complete details on the Profibus
implementation in the 9300.
Factory Profibus Configuration for the 9300
The 9300-Profibus makes data available to Profibus devices using 12 Profibus
Slave Export modules. These modules are linked to other modules in the 9300 that
provide energy, power and demand data through the Profibus Commun-ications
module. As the data available through the Profibus Slave Export modules is in a
specific format, knowledge of the Profibus protocol and an understanding of the
settings used in the 9300 are required to interpret the data provided.
Changing the Profibus Configuration
If the factory Profibus configuration does not suit your needs, link the unused
parameters in the existing Profibus Slave Export modules. If you require more
changes, you will have to relink these modules to other parameters.
Profibus Slave Export Module Parameter Mapping
The following tables detail the measurements provided by 12 Profibus modules.
The “Source ION Module” is shown so that you can easily unlink parameters if
you want to access different data. To change scaling refer to the Profibus Slave
Export module description in the ION Programmer’s Reference.
Chapter 3 - Default Meter Functionality Page 63
Page 64

Using the Profibus Protocol 9300 Series User’s Guide
Profibus Slave Export Module 1 (Scaling x10)
Profibus Slave Export Module 2 (Scaling x10)
Source ION Module Measurement ION Label Source ION Module Measurement ION Label
Power Meter Volts line to neutral A Vln a Power Meter Volts line to line AB Vll ab
Power Meter Volts line to neutral B Vln b Power Meter Volts line to line BC Vll bc
Power Meter Volts line to neutral C Vln c Power Meter Volts line to line CA Vll ca
Power Meter Volts l-n average Vln avg Power Meter Volts l-l average Vll avg
Maximum #4 Vln avg Maximum Vln mx Maximum #8 Vll avg MAX Vll avg mx
Maximum #31 kVAR Tot Th. Dmd max kVAR td mx Maximum #32 kVA Tot Th. Dmd MAX kVA td mx
Profibus Slave Export Module 3 (Scaling x10)
Profibus Slave Export Module 4 (Scaling x10)
Source ION Module Measurement ION Label Source ION Module Measurement ION Label
Power Meter Current Phase A I a Power Meter kW phase A kW a
Power Meter Current Phase B I b Power Meter kW phase B kW b
Power Meter Current Phase C I c Power Meter kW phase C kW c
Power Meter Average Current I avg Power Meter kW Total kW tot
Maximum #13 Max. Average Current I avg mx Thermal Demand #1 kW Total Th.Demand kW td
Minimum #13 Min. Average Current I avg mn Maximum #30 kW Total Th. Dem. Max kW td mx
Profibus Slave Export Module 5 (Scaling x10)
Profibus Slave Export Module 6 (Scaling x10)
Source ION Module Measurement ION Label Source ION Module Measurement ION Label
Power Meter kVAR phase A kVAR a Power Meter kVA phase A kVA a
Power Meter kVAR phase B kVAR b Power Meter kVA phase B kVA b
Power Meter kVAR phase C kVAR c Power Meter kVA phase C kVA c
Power Meter kVAR Total kVAR tot Power Meter kVA Total kVA tot
Th. Demand #2 kVAR Total Th. Demand kVAR td Th. Demand #3 kVA Total Th. Demand kVA td
Maximum #31 kVAR Tot Th. Dmd max kVAR td mx Maximum #32 kVA Tot Th. Dmd MAX kVA td mx
Profibus Slave Export Module 7 (Scaling x10)
Profibus Slave Export Module 8 (Scaling x100)
Source ION Module Measurement ION Label Source ION Module Measurement ION Label
Power Meter Power Factor phase A PF a Power Meter Volts unbalanced V unbal
Power Meter Power Factor phase B PF b Power Meter Current unbalanced C unbal
Power Meter Power Factor phase C PF c Power Meter Line Frequency Freq
Power Meter Power Factor Total PF sign tot Maximum #21 Line Frequency max Freq mx
Minimum #22 Power Factor Lead min PF lead mn Minimum #21 Line Frequency min Freq mn
Minimum #23 Power Factor Lag min PF lag mn --- Not used ---
Page 64 Chapter 3 - Default Meter Functionality
Page 65

9300 Series User’s Guide Using the Profibus Protocol
Profibus Slave Export Module 9 (No Scaling)
Profibus Slave Export Module 10 (No Scaling)
Source ION Module Measurement ION Label Source ION Module Measurement ION Label
Integrator #3 kW hour Total kWh tot Integrator #1 kW hour Import kWh imp
Integrator #7 kVAR hour Total kVARh tot Integrator #2 kW hour Export kWh exp
Integrator #9 kVA hour kVAh tot Integrator #4 kW hour Net kWh net
--- Not used --- Integrator #5 kVAR hour Import kVARh imp
--- Not used --- Integrator #6 kVAR hour Export kVARh exp
--- Not used --- Integrator #8 kVAR hour Net kVARh net
Profibus Slave Export Module 11 (Scaling x10)
Profibus Slave Export Module 12 (Scaling x100)
Source ION Module Measurement ION Label Source ION Module Measurement ION Label
S W Demand #1 kW Sliding Demand kW swd Power Meter kVA phase A kVA a
S W Demand #1 kW Predicted Demand kW swd pred Power Meter kVA phase B kVA b
Maximum #27 kW Sliding Demand max kW swd mx Power Meter kVA phase C kVA c
Minimum #27 kW Sliding Demand min kw swd mn Power Meter kVA Total kVA tot
--- Not used --- Thermal Demand #3 kVA Total Th. Demand kVA td
--- Not used --- Maximum #32 kVA Tot Th. Dmd MAX kVA td mx
Chapter 3 - Default Meter Functionality Page 65
Page 66

Restoring the Factory Configuration 9300 Series User’s Guide
Restoring the Factory Configuration
If you have made changes to the default functionality and want to return to the
factory configuration, you can e-initialize the factory configuration in the meter
through Designer. The basic setup of the device can be retained, so the meter does
not need to be taken out of service for a long period of time.
NOTE
If you restore the factory configuration, all custom features you created are lost.
To restore the factory configuration:
1. Display the meter’s main Configuration screen in Designer.
2. Choose Select All from the Edit menu, then press Delete on your keyboard.
The confirmation dialog box appears explaining that some modules will not be
deleted (core modules cannot be deleted — scroll down in the dialog to see that
various standard modules will be deleted).
3. Click OK on the confirmation dialog box.
After a brief wait the modules are deleted, and the main meter Configuration
screen is blank except for the Frameworks folder in the Advanced Setup area.
(The Frameworks folder contains the folder of Core modules which cannot be
deleted.)
4. Choose Select All from the Edit menu to select the Frameworks folder. This
selects all subfolders and modules within the folder.
5. Choose Paste from Framework in the Edit menu, and select the appropriate .fwn
file from the folder \WinPM.Net\config\fmwk\nd\ and click OK.
Ensure that the chosen .fwn file includes the following in the filename:
The model name of the meter you are restoring (i.e. 7300, 7330 or 7350)
The base firmware version (e.g. v250, v265, etc.)
For example, if you are restoring an 9300 with a V252 firmware version, you
could select the file “7300_v250_FAC-4WYE_V2.1.0.0.0.fwn”. Although this file
was designed for V250, the framework is also used for V252, because v250 is the
base firmware version upon which v252 is built. (For details about framework
files, contact Customer Service.)
6. Click Open. The Paste Summary window appears.
7. Click on the first module, scroll down to the last module, hold the Shift key and
click on the last module. This selects all of the modules.
8. While holding the Shift key, click on the check box to the left of the module name
so you see a lock icon with a green checkmark.
9. Check “Maintain external inputs” and click OK on the confirmation dialog box.
A message appears indicating that Designer is pasting modules. All modules are
selected when the paste is complete. Click anywhere in the background of the
node diagram to deselect all of the modules.
Page 66 Chapter 3 - Default Meter Functionality
Page 67

9300 Series User’s Guide Restoring the Factory Configuration
10. Click the Power Meter shortcut in the Basic Configuration area to select it. Once
selected, click Reset in the Designer toolbar, or select Reset from the Edit menu.
This reverts the Power Meter to the settings it had before you deleted any
modules (retaining the basic setup you previously had).
11. Choose Send & Save from the File menu. The factory configuration is now
restored (any custom functionality you created is removed).
Chapter 3 - Default Meter Functionality Page 67
Page 68

Restoring the Factory Configuration 9300 Series User’s Guide
Page 68 Chapter 3 - Default Meter Functionality
Page 69

4 Using ACCESS Software
ACCESS software encompasses a variety of programs that enhance the
functionality and usability of your ACCESS devices. ACCESS software can collect
data via serial, wireless, modem, or Ethernet links, so you can manage a single site
or global network of devices. WinPM.Net is a software suit with applications for
displaying data, configuring ACCESS meters, and much more. ION Setup is a
stand-alone program that greatly simplifies meter configuration.
This chapter recognizes the various ACCESS software programs available to you,
providing instructions on each program’s use. Details on where to find more in
depth information on a program’s operation are included in that program’s
introduction.
In This Chapter
WinPM.Net Software . . . . . . . . . . . . . . . . . . . . . . . . . . . . . . . . . . . . . . . . 70
WinPM.Net: Management Console . . . . . . . . . . . . . . . . . . . . . . . . . . . . . . 71
Configuring Communications . . . . . . . . . . . . . . . . . . . . . . . . . . . . . . . . . . . . . . . . . . 73
WinPM.Net: Vista . . . . . . . . . . . . . . . . . . . . . . . . . . . . . . . . . . . . . . . . . . . 75
Displaying Data with Vista . . . . . . . . . . . . . . . . . . . . . . . . . . . . . . . . . . . . . . . . . . . . 75
Customizing the Vista Interface . . . . . . . . . . . . . . . . . . . . . . . . . . . . . . . . . . . . . . . . . 81
WinPM.Net: Designer . . . . . . . . . . . . . . . . . . . . . . . . . . . . . . . . . . . . . . . . 83
Basics of ION Architecture . . . . . . . . . . . . . . . . . . . . . . . . . . . . . . . . . . . . . . . . . . . . . 83
Designer’s Main Configuration Screen . . . . . . . . . . . . . . . . . . . . . . . . . . . . . . . . . . . 87
Viewing Real-time Data in Designer . . . . . . . . . . . . . . . . . . . . . . . . . . . . . . . . . . . . . 88
Changing Setup Registers with Designer . . . . . . . . . . . . . . . . . . . . . . . . . . . . . . . . . 88
Customizing Frameworks in Designer . . . . . . . . . . . . . . . . . . . . . . . . . . . . . . . . . . . 90
WinPM.Net: Reporter . . . . . . . . . . . . . . . . . . . . . . . . . . . . . . . . . . . . . . . . 94
Pre-configured Reports . . . . . . . . . . . . . . . . . . . . . . . . . . . . . . . . . . . . . . . . . . . . . . . . 94
Report Creation and Generation . . . . . . . . . . . . . . . . . . . . . . . . . . . . . . . . . . . . . . . . 96
ION Setup Software . . . . . . . . . . . . . . . . . . . . . . . . . . . . . . . . . . . . . . . . . 98
Configuring Communications . . . . . . . . . . . . . . . . . . . . . . . . . . . . . . . . . . . . . . . . . . 98
Basic Meter Configuration . . . . . . . . . . . . . . . . . . . . . . . . . . . . . . . . . . . . . . . . . . . . 101
Displaying Data with ION Setup . . . . . . . . . . . . . . . . . . . . . . . . . . . . . . . . . . . . . . . 102
Page 70

WinPM.Net Software 9300 Series User’s Guide
WinPM.Net Software
WinPM.Net software offers control capabilities and comprehensive power quality
and reliability analysis. It is a powerful software suite that can process, analyze,
store, and share data across your entire enterprise. The fully networked clientserver information system allows you to access data from any workstation, locally
or around the world, in the format you need. With WinPM.Net you can manage an
intelligent ACCESS metering network, monitoring and controlling individual
devices, analyzing data, and deciding on new courses of action.
WinPM.Net software has four main components, each with their own user
interfaces. These applications are the Management Console, Vista, Designer, and
Reporter.
If you require more information on WinPM.Net software than is presented here,
refer to the online WinPM.Net Help or the WinPM.Net Getting Started Guide.
Software Security
The software security system limits how you can use ACCESS software to view
meter data and send configuration changes to ACCESS meters. A valid user
account and password are required to log on to any ACCESS software application.
Each access level, or authority, that is specified for a user account defines the types
of operations available in each application, so you may not necessarily be allowed
to view or configure meter information if your authority is too low.
WinPM.Net provides two default software security settings: guest and supervisor.
Both of these default security settings use 0 (zero) for the password, and enable the
highest level of authority which allows complete control of the system.
NOTE
Since both the software and the meter use password security, you may need to enter the software
password, meter password, or both depending on the function you are performing.
Page 70 Chapter 4 - Using ACCESS Software
Page 71

9300 Series User’s Guide WinPM.Net: Management Console
WinPM.Net: Management Console
The Management Console is responsible for building your network. You build
your power-monitoring network to reflect the way your physical communications
network is wired so that WinPM.Net software can communicate with your
devices. The network is created using servers, sites, devices, and modems. These
network components must be configured in the Management Console before you
can use the other WinPM.Net applications.
Title Bar
System
Setup Pane
Network
Component
Icon
Display
Window
The following is a brief description of each network component. To learn how to
configure these components, refer to the “Configuring Communications” section
of this chapter.
Servers
A server is a computer in an WinPM.Net system running administrative software
that controls access to the network and its resources, such as ION devices, and
provides resources to computers functioning as workstations on the network. A
server runs service components that create communication and software links
between ACCESS systems components, and it creates links into the ACCESS
database, too.
Computers with primary and secondary WinPM.Net installations are servers, as
they have the communication software (services) installed. A primary server
contains all software components and the database; a secondary server contains
software but references the primary server for program files and database
information. Both server types connect directly to ACCESS devices via serial,
Ethernet, or modem links, but there can be only one primary server on a network.
When you install WinPM.Net, the Primary Server must be installed before any
Secondary server or Client computers.
Chapter 4 - Using ACCESS Software Page 71
Page 72

WinPM.Net: Management Console 9300 Series User’s Guide
Sites
A site in an WinPM.Net system contains one or more intelligent devices that share a
common communications link. There are three different types of sites, based on the
type of communications medium each uses. The site types are as follows:
Direct (Serial) Site - a direct-connected RS-232 or RS-485 network
Modem Site - a remote serial site connected by a modem
Ethernet Gateway Site - a gateway that transfers data between an Ethernet
device and an RS-485 chain of connected devices
NOTE
You are not required to create a site for an Ethernet Device, unless you intend to use the device as an
Ethernet Gateway Site.
Depending on the site type, devices belonging to a site may be at different physical
locations.
Devices
Devices refer to intelligent devices (basic energy meters, multi-function
monitoring/analysis/control devices, intelligent relays, etc.) that can be connected
to an WinPM.Net network serially, via Ethernet, or through a gateway.
Serial Devices belong to Direct Sites or Modem Sites, so they communicate using
modem, RS-232, or RS-485 connections. Before these types of devices can be added
to the network, they require the prior configuration of a Direct Site or Modem Site.
Ethernet Devices are those that are directly connected to an Ethernet network. You
are not required to create a site for an Ethernet Device, unless you intend to use the
device as an Ethernet Gateway Site. Furthermore, you can manually connect and
disconnect your Ethernet Devices from the Management Console.
Dialout Modems
A Dialout Modem is the modem that a server computer uses to communicate with
a remote modem at a Modem Site.
Connection Schedules
Connection schedules are programmed routines for a server to regularly connect
to and disconnect from Modem Sites and their associated ACCESS (or other)
devices. If so desired, you can also create connection schedules from Direct Sites
and Ethernet Devices/Ethernet Gateway Sites.
Page 72 Chapter 4 - Using ACCESS Software
Page 73

9300 Series User’s Guide Configuring Communications
Configuring Communications
Before you can talk to the devices on your network, you need to configure
communications within the Management Console. Essentially, this means adding
one or more sites and then adding the devices associated with each site. If you
create a modem site, then you also need to add and configure a dialout modem.
There may be instances where you want to add a new server (either another
computer or third-party gateway); the computer running the WinPM.Net software
is considered a server and is listed in the Server section.
Adding a new Server, Site, Device or Dialout Modem
1. Click the appropriate network component icon (Servers, Sites, Devices,
Dialout Modems) in the System Setup pane. The title bar reflects your
selection.
2. Right-click in the display window, select New and the type of Server, Site,
Device. If you are configuring a modem you only have one New option.
3. Configure the item using the drop-down list boxes and manually entering
values where required.
4. Right click in the Properties dialog box to access Advanced Properties. You can
use the drop-down list boxes or manually enter new values as required.
5. Click OK when you are done.
The process of adding network components to the Management Console is the
same for each component — the difference lies in how you configure the
components. When the Properties dialog appears for the component you added,
the fields for which you are required to provide information are highlighted in red.
For example, the illustration below shows the required fields when adding a new
Ethernet device:
Although Group has
a drop down list box,
you are not restricted
to the values in the
list. If you want to
create a new group,
simply type its name
in the value field.
Other drop down list
boxes restrict you to
the values in the list.
The Properties dialog has different required fields depending on which component
you are adding:
For a Direct Site you specify the serial port (COM1, COM2, etc.) on the server
computer where the serial device (or network of serial devices) is connected.
You must specify the server computer that communicates with the direct site.
For a Modem Site you provide information about the modem at the (remote)
modem site: baud rate, modem telephone number, etc. You also specify the
server computer that communicates with the modem site.
Chapter 4 - Using ACCESS Software Page 73
Page 74

Configuring Communications 9300 Series User’s Guide
For an Ethernet Gateway Site, you specify the Ethernet device acting as the
gateway and the TCP/IP port to which the serial device, or network of serial
devices, is connected. Before you can add an Ethernet Gateway Site, an Ethernet
Device must be added and configured first.
For a Serial Device you provide the device type, the unit ID, and the site to
which the meter is connected. Before you can add serial devices, a Serial or
Modem Site must be added and configured first.
For an Ethernet Device you specify the type of meter, the meter’s IP address,
and the server computer that communicates with the Ethernet device.
For a Dialout Modem, you provide the modem type, the computer that
communicates over the modem channel, and the serial port used on the
computer.
For a Computer (Server) you specify the machine’s computer name.
For a 3rd-Party Gateway (Server), you specify the name of the network host, the
IP address of the gateway device, and the computer that communicates through
the Ethernet gate
Complete details on working with the Management Console are available in the
WinPM.Net Getting Started guide, or the online WinPM.Net Help.
Page 74 Chapter 4 - Using ACCESS Software
Page 75

9300 Series User’s Guide WinPM.Net: Vista
WinPM.Net: Vista
Vista is a display, analysis, and control application. It is the main user interface to
the WinPM.Net system. Vista presents a graphical view of your power system,
allowing you to view real-time data from power meters or historical data from the
WinPM.Net database. It simplifies the tasks of managing your power system and
transcends a number of physical device boundaries, so you can retrieve, store, and
display data from any device in your system through a unified interface. Vista
reports on the status of your power system components, informing you of alarm
conditions and providing you with control capabilities for initiating intelligent
device functions or actuating field machinery.
Displaying Data with Vista
A standard set of Vista User Diagrams display real-time and logged data for
various power system parameters. Interactive objects are provided on the
diagrams that allow operators with appropriate authority to enable and disable
logging functions and reset cumulative parameters.
A network diagram uses links to default user diagrams to display data from each
device in your system. When you generate a network diagram, Vista automatically
locates all devices in your system and displays them.
Generating a network diagram in Vista
1. Select Generate Network Diagram from the File menu.
The Network Diagram initially looks like this:
Menu bar
Toolbar
Vista
Grouping
Object
2. Click the appropriate grouping object. These are labelled according to the
device’s “Group” value in the Management Console.
NOTE
If you have Show Toolbox selected in the Options menu, you must double-click diagram objects and icons
instead of single clicking them.
Chapter 4 - Using ACCESS Software Page 75
Page 76

Displaying Data with Vista 9300 Series User’s Guide
This opens a new window showing all of the installed meters. Each meter
appears with an icon that represents its type and a label reflecting the name you
configured in the Management Console.
Meter icons
(representing
configured
devices in the
Management
Console)
3. Click a meter icon to open its main default diagram.
Each meter has a set of default diagrams that show the results of various real-time
measurements and calculations that are being performed. Links to data,
waveform, and event logs are also provided (if the meter supports logging).
You should now be able to navigate through the various diagrams and view realtime and logged data.
Displaying Data if the Software is not Fully Configured
If WinPM.Net has been installed and configured using the recommended
guidelines in the WinPM.Net Getting Started guide, the standard Vista user
diagrams automatically display real-time data from your meter.
If you are unable to display data from your meter in Vista, contact your
WinPM.Net software administrator, or refer to the WinPM.Net Getting Started
guide before continuing with this User’s Guide.
Page 76 Chapter 4 - Using ACCESS Software
Page 77

9300 Series User’s Guide Displaying Data with Vista
Vista Diagram Elements
Each Vista diagram shows the name of the meter, the time on the meter’s clock,
and the type of meter. The main diagrams also provide buttons that let you jump
to other diagrams. Jump to another diagram by clicking any of the buttons near the
top right-hand corner (as illustrated in the Volts/Amps diagram below).
Click any of these
Click this button
to return to the
Network
Diagram.
This
numeric objec
shows real-time data.
t
buttons (grouping
objects) to jump to other
diagrams.
Events and Alarms
are available
through the Event
Log viewer.
Logged data is
available through
data log
these
objects.
viewer
This
grouping object
leads to Long-Term
Min/Max data.
Most measurements appear on-screen in Vista numeric objects.
Some ON/OFF quantities, such as the status of a setpoint, may appear as status
Click this
to enable/disable
historic data logging.
control object
objects.
To view another screen or diagram, click on a grouping object. Grouping objects
may be in the form of buttons, folders, meter icons, etc.
To return to the previous diagram, use the button on the Vista toolbar, or
use the File > Up One Level menu item.
Level 3 WinPM.Net authority is required to use control objects.
Logged data (such as snapshot, interval and waveform data) can be accessed by
clicking the associated the data log viewer icon, which looks like this
To view a record of events and alarms for the active user diagram,
click — the event log viewer icon.
To view records of high-priority events and alarms for your entire system, select
the global event log viewer from the View pull-down menu.
Chapter 4 - Using ACCESS Software Page 77
Page 78

Displaying Data with Vista 9300 Series User’s Guide
Summary of Data Provided in Vista
The standard set of Vista diagrams included with WinPM.Net display a variety of
data measured by the factory-configured meter. Some of the diagrams include
grouping windows that display additional data. The following section
summarizes the data, and interactive control functions provided.
Real-Time Measurements
The Real-Time diagram includes a simple power system illustration that shows
various real-time parameters. The diagram also includes links to a min/max
parameter display. The measurements you see in Vista depend on the Volts Mode
setting in your Power Meter module; here are some you may see:
Line-to-neutral voltages, line-to-line voltages, average L-N and L-L voltages and
voltage unbalance level
Phase currents and average current, or total current
Phase kW, total kW, kVAR and kVA
Frequency and signed power factor
Min/max display of each of the above parameters
All logged meter events
Trend logs of voltage, current, power, frequency and power factor
Long-term Min/Max
Double-click the Long-term Min/Max object to see a Vista grouping window
showing min/max values for line-to-line and line-to-neutral voltages, voltage
unbalance, phase currents, power values (kVA, kVAR and kW), frequency, and
power factor. Level 3 WinPM.Net authority is required to reset the min/max
values.
To return to the real-time diagram, use the button on the Vista toolbar; or use
the
File pulldown and select Up One Level.
Min/max values are valid from the time the meter was powered up, or valid from
the time the last reset was performed.
Historic Data Logging Enable
The Log Server must be running to view historical data. Historic data logging is
enabled by default. Level 3 WinPM.Net authority is required to use the enable
control object. The control object indicates the logging enable status: the switch is
in the up position (1) when logging is enabled, and down (0) when logging is
disabled.
Power Quality Data
The Power Quality diagram shows voltage disturbance and harmonics details. The
voltage disturbance display counts sag/swell and transient events, and provides
links to a sequence-of-events log and a CBEMA plot. The diagram includes a
trigger for manual waveform recording, and control objects for enabling/disabling
power quality event recording.
Page 78 Chapter 4 - Using ACCESS Software
Page 79

9300 Series User’s Guide Displaying Data with Vista
The harmonics measurement display shows total harmonic distortion for each
phase of voltage and current. Links to harmonics min/max and harmonics
trending displays are provided, and a control object is included for enabling/
disabling harmonics logging
Voltage Disturbance Counter Reset
Level 3 WinPM.Net authority is required to reset the power quality event
counter, the manual waveform trigger, and the control objects.
Disturbance Details
The Log Server must be running to view the CBEMA plot or sequence-of-events
data.
Long-term Min/Max
Double-click the Long-term Min/Max object to see a Vista grouping window
showing min/max values for phase voltage and current THD.
Level 3 WinPM.Net authority is required to reset the min/max values.
Harmonics Measurements
Total Harmonics Distortion (THD) is displayed as a percentage of the
fundamental.
Harmonics Trending
The Log Server must be running to view the logged harmonics data.
Harmonics data logging is enabled by default.
Level 3 WinPM.Net authority is required to use the control object.
The control object indicates the logging enable status: the switch is in the up
position (1) when logging is enabled, and down (0) when logging is disabled.
Setpoints
The Setpoints diagram uses setpoints to monitor kW demand, over current and
under average voltage and power factor levels. Vista annunciates warnings if any of
the values exceed specified limits. Users with Level 3 WinPM.Net authority can
define the setpoint limits.
Monitoring of kW demand, phase current and voltage unbalance conditions,
with annunciation when user-specified upper limit is exceeded
Real-time display of kW demand, phase current and voltage unbalance
Over kW Sliding Window Demand Monitoring
Over kW demand monitoring is disabled by default. Level 3 WinPM.Net authority
is required to enable this monitoring. The status will read
NOT AVAILABLE when
monitoring is disabled.
Chapter 4 - Using ACCESS Software Page 79
Page 80

Displaying Data with Vista 9300 Series User’s Guide
Energy & Demand Calculations
The Energy & Demand diagram shows the real-time sliding window demand for
kW, kVA and kVAR, and the real-time energy values kWh net, kVARh net and
kVAh. Peak demand is displayed for kW, kVAR and kVA, and a link to a demand
profile trend is provided. Control objects for enabling/disabling demand logging
and resetting energy and demand values are also included.
Real-time and peak kW, kVAR and kVA sliding window demand
Real-time net kWh, net kVARh and kVAh energy values
Trend log of all of the above parameters, plus power factor lead and lag,
imported, exported and net energy
Demand, Energy and Peak Demand Reset
Level 3 WinPM.Net authority is required to reset these values.
Demand Profile Trending
The Log Server must be running to view the energy and demand log. Energy and
demand logging is enabled by default. Level 3 WinPM.Net authority is required to
use the enable control object. The control object indicates the logging enable status:
the switch is in the up position (1) when logging is enabled, and down (0) when
logging is disabled.
Over Average Current Monitoring
Over current monitoring is disabled by default. Level 3 WinPM.Net authority is
required to enable this monitoring. Each status reads “Not Available” when
monitoring is disabled.
Under Average Voltage Line-to-Line Monitoring
Over voltage monitoring is disabled by default. Level 3 WinPM.Net authority is
required to enable this monitoring. The status reads “Not Available” when
monitoring is disabled.
Under Power Factor Monitoring
Under power factor monitoring is disabled by default. Level 3 WinPM.Net
authority is required to enable this monitoring. The status reads “Not Available”
when monitoring is disabled.
Digital Inputs
The Digital Inputs diagram monitors the four status inputs on the 9300. The status
of each input (
ON or OFF), and the number of times the status has changed is
displayed. The status change counter can be reset.
Monitoring of the 9300 meter’s four on-board status inputs
Status change counter for each input
Status
The 9300 meter’s status inputs are de-energized when the meter is powered-up, so
each status will initially be
OFF.
Reset
Level 3 WinPM.Net authority is required to reset the status counter.
Page 80 Chapter 4 - Using ACCESS Software
Page 81

9300 Series User’s Guide Customizing the Vista Interface
Customizing the Vista Interface
Standard Vista diagrams show much of the data that the factory-configured meter
measures and calculates. However, the factory-configured meter can provide
additional data that is not presented by default with these display tools. This data
can be added to the standard Vista diagrams by placing addition diagram objects
on them; or, you can create new user diagrams to display any additional data you
want.
Vista cannot be used to customize data displays on the ACCESS meters
themselves.
NOTE
Level 5 ACCESS software authority (Supervisor) is required to create and configure new Vista diagrams.
If you do not have Level 5 password authority, contact your ACCESS software administrator for assistance.
Diagram Objects in a User Diagram
Diagram objects provide the interface to ION registers in your network, and to
DDE values from other applications. Each diagram object displays a single piece
of information from somewhere in your power-monitoring network; for example,
a single numeric object displays numeric data from a single source.
If your account has permission to edit user diagrams, the following diagram
objects are represented by icons in a floating toolbox.
If this toolbox is not available in Vista, yet you have the proper permissions to edit
user diagrams, you must select Options > Show Toolbox from the Vista menu. A
check mark next to the option indicates that it has been selected.
To place a diagram object, simply click, drag and drop the object you want from
the toolbox onto the current Vista display window. Once you have added the
diagram object, right-click the icon to specify the actions you want it to perform.
Complete details on configuring diagram objects and creating Vista User
Diagrams are in the online WinPM.Net Help.
Chapter 4 - Using ACCESS Software Page 81
Page 82

Customizing the Vista Interface 9300 Series User’s Guide
Custom Appearance of a User Diagram
You can customize the appearance and configuration of any window within a user
diagram. You can alter a window's font or background color, or configure window
properties such as background image, real-time and logged data links, doubleclick action, and stale data settings.
To make one or more of these changes, right-click anywhere in the background of
a user diagram. A menu appears with three selections:
Choosing Default Font or Background Color allows you to customize the area
implied by the selection. Choosing Properties brings up the Window Properties
Configuration box, which offers five groups of options: Image, Log Server, Node,
Action and Stale Data. Complete details on these options are found in the online
WinPM.Net Help.
Page 82 Chapter 4 - Using ACCESS Software
Page 83

9300 Series User’s Guide WinPM.Net: Designer
WinPM.Net: Designer
Designer is an application for advanced users who know the nature of ION
architecture, specifically the nature of frameworks. A framework is a number of
ION modules arranged (linked) to perform a specific function or number of
functions. Designer allows you to customize current frameworks by adding,
deleting, or re-linking ION modules, and it allows you to create entirely new
frameworks. Although it can be used to perform basic setup, such as changing an
ION module’s setup register, it is recommended that you only use Designer for
framework customization and creation.
NOTE
In most cases, you will be able to achieve the functionality you want by changing the settings in an existing
module’s setup registers. For this operation it is recommended that you use ION Setup.
Basics of ION Architecture
Before you begin altering the meter’s operation, it is advisable to familiarize
yourself with the basics of how the device operates. Understanding the basics of
the ION architecture will help you understand how to make different types of
configuration changes.
The ION architecture applies the principles of object-oriented software design to
the creation of functionality inside your devices. The object-oriented structure
allows you to connect different discrete objects (called ION modules) in different
ways to define how information is accessed, transferred, and manipulated inside
the device and across the power monitoring network.
Each ACCESS device contains a number of ION modules that perform specific
functions. The ION modules are linked together to create frameworks or
framework templates, defining multiple operations and logical pathways for
power system information. The basic structure of an ION module is the same for
each module type, making it easy to use new features once the basics are
understood.
Chapter 4 - Using ACCESS Software Page 83
Page 84

Basics of ION Architecture 9300 Series User’s Guide
ION Modules
The ION module is the basic building block of the ACCESS device’s operating
software. A module can be considered as a “function box”: it receives data from its
inputs, makes decisions based on the settings in its setup registers, and then makes
data available at its output registers. All functionality provided by an ACCESS
device can be considered in terms of its modules and the linkages between them.
INPUT REGISTERS
are connected to the output
registers of other modules;
data flows into them.
Power Meter
Module
Voltage on phase A
is measured
ION Module
Input 1
Input 2
SETUP REGISTERS
control how the module
processes data
Output 1
Output 2
OUTPUT REGISTERS
hold the result of the
module’s operation–
this data is available to
other ION modules.
Modules are linked together to create powerful functions. For example, the
framework below consists of four modules that, when combined, trigger a
waveform recording in response to an over-voltage condition.
Setpoint
Vln a
Module
Setpoint goes ON when
Vln a exceeds a limit and
outputs a trigger pulse
Trigger
One-Shot Timer
Module
One-Shot Timer waits for
a specified period then
outputs a trigger pulse
Waveform Recorder
Trigger
Waveform is recorded
and stored in the log file
Module
Waveform log
Module Linking Restrictions
The maximum number of modules that can be linked in a row is 25. This is referred
to as the framework’s depth. Modules that branch off or branch into the chain do
not affect the depth, and there is no restriction on the number of branches you can
have in a framework.
Another restriction concerns “circular” linking of modules. You cannot link a
module’s output register to its own input or to the input of any module that
precedes it in the chain. This protects you from creating infinite loops that can
waste system resources.
The one exception to this rule is the Feedback module, which makes circular
linkages possible (refer to the ION Programmer’s Reference).
Page 84 Chapter 4 - Using ACCESS Software
Page 85

9300 Series User’s Guide Basics of ION Architecture
Sequence of ION Module Execution
ION modules always execute in the order of the data flow (in the example below,
from 1 to 4). This logical execution order is maintained even if you created the
framework from back to front.
1
12
3
4
ION modules may execute simultaneously if they do not depend on each other for
data (such as both ION modules labelled 1). Conversely, ION module 3 will not
execute until both ION modules 1 and ION module 2 have executed.
ION Registers
Each module has one or more output registers, and most modules have Setup
registers. (A module’s inputs are links to the output registers on other modules.)
There are different types of registers, each classified by the type of data they accept.
When you want to change a module’s configuration, you must supply the type of
data that is appropriate for the register you are configuring. The configuration
tools prevent you from entering the wrong type of data into a register, but they do
not prevent you from entering the wrong value.
The ‘N
OT AVAILABLE’ Value
An ION module that requires a link to one or more of its inputs, but has no such
links created, does not contain any values in its output registers. Instead, its output
registers are set to N
invalid (for example, a line-to-neutral measurement for a 3-wire Delta system) its
output register is also set to N
distinguish between cases where a register contains a value like 0 or
where there is actually no value stored.
OT AVAILABLE. In addition, if a module has an input that is
OT AVAILABLE. The NOT AVAILABLE value helps to
OFF, and cases
NOTE
The NOT AVAILABLE value appears in Vista objects that are linked to ION modules with output registers
that are NOT AVAILABLE. The front panel of the meter displays values that are NOT AVAILABLE as dashes (–).
If the inputs of a module are NOT AVAILABLE, its output registers are also NOT
A
VAILABLE. The NOT AVAILABLE value propagates through all linked modules.
(The N
differently - refer to the ION Arithmetic module description in the ION
Programmer’s Reference.)
Chapter 4 - Using ACCESS Software Page 85
OT AVAILABLE value propagates through linked Arithmetic modules
Page 86

Basics of ION Architecture 9300 Series User’s Guide
ION Configuration Changes and Module Security
When you make configuration changes to an ACCESS device you are either
changing a value in a module’s setup register (basic configuration) or you are
changing the linkage between two or more modules (advanced customization).
Certain parts of the meter’s operating software are protected against deletion and
tampering, specifically core ION modules, fixed module links, persistent ION
modules, and locked ION modules. Visit Power Measurement’s web site
(www.pwrm.com) for a complete listing of these module types for your meter.
Core Modules
Core ION modules are fundamental to basic device or software node operation.
You cannot create or delete core modules, and in some cases, you cannot configure
them. Those ION modules classed as Core modules are the same in every device
or software node, though not all devices and software nodes support all the Core
modules. The following are examples of Core Modules: Power Meter module,
Communications module, Display Options module, and the Factory Module.
Fixed Module Links
Several of the linkages between core modules are fixed; they are required for the
basic operation of the device. A fixed link cannot be removed. A core module with
fixed links can still be linked to other modules.
Persistent Modules
Persistent ION modules are similar to Core modules, as they are core to the
operation of the device and cannot be created or deleted. These ION modules are
protected, because they are factory-configured to provide important external
control functions. Many External Pulse modules are Persistent ION modules.
CAUTION
Persistent modules can be overwritten in Designer. When pasting a default framework onto a meter, use
lock-paste on the Persistent modules. Do not free-paste. A list of Persistent modules is available on the
Library page of Siemens's web site, under "ION Device Templates".
Locked Modules
Locked modules provide security for revenue meters. This type of module security
only applies to ACCESS meters with the revenue-lock enabled (RM) order option.
Furthermore, there are varying degrees to locked module security: Fully Locked,
Writable Locked, and Front Panel Locked. Fully Locked security is designed to
protect the revenue related functions within the meter; they cannot be modified in
any way. (Fully Locked modules have their values written via internal meter
methods, as the meter makes calculations based on its voltage and current inputs.)
Writable Locked security allows you to trigger or change the state of the ION
module, but you cannot delete it, link to it, or change its label. Front Panel Locked
security prevents registers from being altered remotely via software; you must use
the ACCESS meter’s front panel to make any modifications to these registers.
NOTE
Depending on the meter family, there may be different types of module security.
means the module cannot be modified in any way, and
be deleted.
Page 86 Chapter 4 - Using ACCESS Software
Rev_destroy_lookup
Rev_write_state_lookup
means the module cannot
Page 87

9300 Series User’s Guide Designer’s Main Configuration Screen
Designer’s Main Configuration Screen
If the software has been properly configured, the main screen of the meter’s node
diagram appears each time that you open a meter in Designer. If the ACCESS
software has not yet been configured, refer to the Getting Started Guide, or contact
your network administrator. The different types of device functions are grouped
together on the Designer screen, so you can quickly access the types of settings you
want to change.
ION modules appear on the
main Designer screen,
grouped by the functions
they perform. Right-click a
module to access its Setup
registers.
Folder icons indicate that
additional ION modules are
available. Double-click on
the folder to view them.
Status Bar
Once you have logged on to Designer and opened the meter’s node diagram, you
can begin configuring ION modules. Designer displays two types of objects on the
main configuration screen: ION modules and grouping objects (also called
folders).
A folder in Designer indicates that additional modules are available. Double-click
on a folder to access the modules contained inside it. In some cases a folder will
contain additional folders — continue double-clicking on the folders until you
reach the appropriate ION module.
Chapter 4 - Using ACCESS Software Page 87
Page 88

Viewing Real-time Data in Designer 9300 Series User’s Guide
Viewing Real-time Data in Designer
You can view the real-time values of output registers in Designer. This is useful
when you are linking these outputs to other modules. However, it is
recommended that you use Vista as your main data display application.
To view real-time data of output registers:
1. Click Options > Show Toolbox on the Designer menu.
2. Find the ION module you want, press the Shift key and click the output register.
The following example shows how the real-time data for the output is
displayed:
Changing Setup Registers with Designer
If you are familiar with the nature of ION architecture and comfortable using
Designer, you can use the application to modify ION modules’ setup registers.
NOTE
It is recommended that you use the Setup Assistant in the ION Setup software to configure an ION
module’s setup registers. The Setup Assistant is a user interface that provides access to the setup registers
for a meter. (Refer to the ION Setup section for more details.)
Page 88 Chapter 4 - Using ACCESS Software
Page 89

9300 Series User’s Guide Changing Setup Registers with Designer
To configure ION module setup registers with Designer:
1. Right-click near the module’s center. The ION Module Setup dialog box
appears, showing a list of setup registers available for configuration:
The list of available Setup
registers appears here.
Select a Setup register,
then click Modify... (or
double click on the Setup
register name).
2. Highlight the Setup register you want to configure, and click Modify.... A
Modify Register dialog box appears.
A drop down list of option
appears when you click
on the arrow because this
setup register is of the
enumerated type.
Make the change to the register’s setting here. As there are different types of data
held in setup registers, there are different Modify Register dialog boxes. The
Modify Register dialog box may require that you choose an option from a list or
enter a numeric value.
A format option is available when modifying Numeric Bounded setup registers.
Clicking Format causes a “Formatted Numeric Value” window to appear:
Chapter 4 - Using ACCESS Software Page 89
Page 90

Customizing Frameworks in Designer 9300 Series User’s Guide
Use the Interval Format area if the setting you are changing requires intervals.
Use the Date/Time Format area if the setting you are changing requires specific
dates (such as those needed used in the Clock module). Click OK when you have
the desired setting for the time interval or date.
3. Click OK when you are satisfied with your configuration changes.
Complete details about the Setup registers of every ION module are provided in
the ION Programmer’s Reference. Details about the Setup Areas on the main screen
of the node diagram can be found in the Default Functionality chapter.
Customizing Frameworks in Designer
To create custom functions, ION modules are linked together and then configured.
Linking ION modules is relatively straightforward: output registers on one
module are linked to the input registers of subsequent modules. Data flows from
the output register on the first module to the input registers on a second module.
Each module that receives data makes decisions and processes the data based on
its setup registers’ settings. Once the data has been processed, a module makes the
data available at its output registers. These output registers can then be linked to
the inputs of other modules, and so on.
Most ION modules perform simple, discrete functions. The combination of
modules linked together creates a more powerful functionality. Multiple modules
linked together can be referred to as a framework. Since a device’s operation can
be separated into the specific, smaller functions performed by the modules,
creating specialized functionality is simple if you understand the operation of the
component pieces.
CAUTION
The meter is factory-configured for optimal operation. You should not make any changes to its operating
software unless you are familiar with the ION architecture, you know specifically what you want to
accomplish, and you understand the effects of the changes you intend to make.
If you need to customize your meter’s operation, you will need to create new ION
modules, configure their settings, and in some cases link them to other modules.
Designer provides a graphical view of your meter’s internal operation, making
these tasks simple. If you require more information on Designer than is presented
in these pages, refer to the ION Programmer’s Reference or online WinPM.Net Help
for complete usage details.
Page 90 Chapter 4 - Using ACCESS Software
Page 91

9300 Series User’s Guide Customizing Frameworks in Designer
Creating New Modules
To add a module, locate its icon in the Designer toolbox, press and hold the left
mouse button over the icon, and drag it onto the node diagram. Once you release
the mouse button, the module becomes part of the diagram and is ready to be
configured and linked.
Choosing the Module
The Designer toolbox displays icons for all the meter’s available module types. If
the toolbox is not displayed, choose Show Toolbox from the Options menu to make
it appear.
As you drag the mouse over the icons in the toolbox, the status bar at the bottom
of the Designer window displays the module type.
Each ION module available to a
meter appears in the toolbox.
Creating the Module
Follow these steps to create an ION module in the meter:
1. On the ION Modules toolbox, press the mouse button down on top of the icon
of the module you want to create, and drag it onto the node diagram. As you
drag the icon, the cursor changes shape to indicate you are placing an object.
2. Release the mouse button to place the module in the diagram. When you release
the mouse button, Designer places a pending module icon into the diagram
(pending modules appear with a dashed outline).
3. Once you have configured the node to your liking, choose S
File menu to download the configuration to the node. The dashed outline is
replaced with a solid outline, indicating that your changes have been saved.
After a S
border. This can mean that the ION module’s setup is incomplete. Refer to the
online WinPM.Net Help for more details.
The web site has information about the setup register defaults a module contains
when it is initially created, as well as the ranges or options each setup register
supports.
end & Save, ION modules that are offline (or inactive) appear with a red
end & Save from the
Deleting Modules
To delete a module, select it by clicking its icon, then press the Delete key. Use
caution when deleting modules – any dependant modules will be affected.
Designer informs you of dependant modules if they exist on the same node.
Linking Modules
Module linking involves clicking on one module’s output register symbol,
choosing the output register you want to link, then clicking the input of a second
module and selecting the input to link to. This operation can be performed in
reverse – you can start with one module’s input and link to another module’s
output register if desired.
Chapter 4 - Using ACCESS Software Page 91
Page 92

Customizing Frameworks in Designer 9300 Series User’s Guide
s
You can link modules that reside on different nodes, provided that you are linking
between software nodes, or from a meter to a software node. You cannot link
modules between meters. The following section describes how to link modules
that reside on the same node. Refer to the ION Programmer’s Reference or the online
WinPM.Net Help for instructions if you want to link modules that reside on
different nodes.
Follow the steps below to link modules on the meter:
1. Click on the symbol on the right side of the module icon to list a module’s
output registers. (To list the module’s setup registers, hold the CTRL key while
clicking on the symbol.) In most cases, a pop-up menu appears and lists
the available registers. If the module has many registers, a dialog box appears
Accessing module output
instead.
or
The cursor looks like this when
a linking operation is in
progress:
Accessing module inputs
2. Click on the register you want to sele ct. In t he case of th e dialo g box, d oubl e-clic k
on an output register, or choose the register and click Select.
3. Drag the cursor towards the module to which you want to link; the cursor
changes and a dotted line follows it across the node diagram. This indicates you
are in the process of creating a link. The dotted line also shows where the
connecting line will appear in the node diagram once the link is made.
If you link to a module that is in a different window than the original module
(either in a different node diagram or grouping window), the dotted line
disappears, but the cursor still indicates that a link is in progress.
4. Click on the module icon’s left symbol to display the module’s inputs. In
most cases, a pop-up menu appears and lists the module’s inputs. (If there are a
large number of inputs, a dialog box similar to the More Output Registers dialog
box appears instead.) Inputs that are a different class than the selected output
register are grayed out to indicate that you cannot select them.
If the input is already linked, the register label it is linked to is displayed beside
the input. If you select the input, the existing link is overwritten.
5. Choose the input you want from the pop-up or dialog box.
If the two modules are in the same window, the dotted line remains on the
screen to show the link between the modules.
6. Save the changes you made to the node. When you save the line changes from a
dotted line to a thin black line to indicate that the link is now programmed on
the node.
Page 92 Chapter 4 - Using ACCESS Software
Page 93

9300 Series User’s Guide Customizing Frameworks in Designer
The linking procedure described in the preceding steps can also be performed in
reverse order. You can select a module’s input first and then link it to another
module’s output register.
Editing Existing Frameworks
If you are comfortable with the ACCESS software and the meter’s configuration,
you can make changes to the existing frameworks to customize operation. Any
edits you make to the existing frameworks alter the device’s operation — be sure
you understand what effect your changes will have before proceeding.
Checking an Output Register’s “Owner”
Using Designer, right-click a module’s output register to view its linkages, referred
to as “owners”. A dialog box appears showing all of the inputs that are linked to
that output register. With this information you can determine what changes will
result to the framework by deleting the links to the parameter. Note that links to
inputs on other nodes are not shown in this dialog box.
CAUTION
Viewing owners by right-clicking a module's output register will only show you module linkages on the
same node. Any links to modules on different nodes will not be shown. If links to modules on other nodes
may exist, always check the links at a module’s inputs.
Deleting the Link at a Module’s Input
You can also check the links at a module’s input. Using Designer, right-click on the
input symbol on a module to view a dialog box listing each of the inputs and the
output registers they are linked to. You can unlink inputs from within this dialog
box as well.
Replacing a Link
You do not need to unlink a module’s input before linking a different output
register to it. If you link an output register to an input that is already linked, the
existing link is overwritten.
Chapter 4 - Using ACCESS Software Page 93
Page 94

WinPM.Net: Reporter 9300 Series User’s Guide
WinPM.Net: Reporter
Reporter is a database reporting application. It lets you define, generate, and
manage comprehensive reports based on the data in your database. Reporter
retrieves data from the Relational Database Management System (RDBMS), and
processes it into a finished report in Microsoft Excel format. There are a number of
pre-configured reports available, including Power Quality, Load Profile, Energy
and Demand, and EN50160 reports. You can also generate custom reports that
incorporate virtually any data stored in the RDBMS and perform further analysis
using Excel’s advanced mathematical and graphical functions.
After you’ve designed custom reports and configured the Excel workbooks,
reports are updated automatically, either in response to a power system event, or
following a specified schedule. You can also configure reports to automatically
email selected recipients after updating.
NOTE
The Report View Manager, a component of the Reporter, can be used on its own to create custom
database views for use with other third party reporting packages. Advanced knowledge of database
operation may be required to use the Report View Manager with third-party applications. Refer to the
online
WinPM.Net Help
for details on the Report View Manager.
Pre-configured Reports
When you start Reporter, the main Reporter screen appears with a list of
pre-configured reports. The most commonly accessed reports are the Energy and
Demand report, the Load Profile report, and the Power Quality report. There are
also 2 reports related to the European EN50160 power quality standards.
Time of Use Schedule
used for Energy and
Demand reports.
This is not to be
confused with the
Time of Use Module
Page 94 Chapter 4 - Using ACCESS Software
Page 95

9300 Series User’s Guide Pre-configured Reports
Energy and Demand
This report is designed to generate and display details about energy consumption
and peak demand levels over a given time period. It uses a Time of Use Schedule
(TOU) to reference the metered data against an energy provider’s tariff schedule.
The first step in creating an Energy and Demand report is to preconfigure the TOU
schedule that will be applied to the metered data. If you do not require a time of
use schedule, you can create a mock schedule with only one time period defined.
Use the EgyDmd Log as a query item.
Load Profile
This report generates a graphical representation of demand, or load levels, over a
given time frame. The profile is a characterization of peak loads that can be used
to determine and limit demand peaks which could lead to financial penalties for
energy consumers, or could signal a need for additional generation or the
introduction of load control programs for energy suppliers.
The Load Profile report also uses the EgyDmd Log as a query item, but it does not
use a TOU schedule.
Power Quality
This report summarizes the number and severity of sags and swells over a given
time range, and graphically represents the waveform captures of each individual
event for further analysis.
The Power Quality report is slightly different than the other two report types mainly in its requirements for different data log sources. The Power Quality report
requires a combination of the Sag/Swell Log and Waveform Log.
EN50160
EN50160 is a general power quality standard used by energy suppliers and energy
consumers in European countries. The report is a summary of the multiple pass/
fail results of the evaluation methods outlined in the standard.
The following logs are used for the EN50160_General report:
EN50160 Vlt Dp1 to EN50160 Vlt Dp5
EN50160 Ovrvlt1 to EN50160 Ovrvlt3
EN50160 Frq/Mg, EN50160 Flicker, EN50160 Intrp, EN50160 Hrm Vlt, EN50160
Ihm Vlt, and EN50160 Vunbal
All fourteen of the above logs must be added to each EN50160_General report.
EN50160 MSignal is the log used for the EN50160_Mains_Signal report.
NOTE
The 73xx Series meters do not support EN50160 compliance. Although you see them as viable selections
in Reporter, the 73xx Series meters do not have the logs needed to create EN50160 reports.
Chapter 4 - Using ACCESS Software Page 95
Page 96

Report Creation and Generation 9300 Series User’s Guide
Report Creation and Generation
These steps are used for creating all report types. Be sure to k now which log(s) you
use for the report you are creating.
NOTE
If you are creating an Energy and Demand report, complete the steps under “Creating a Time of Use
Schedule” (following “Creating a Report”) before you procede with creating your report.
Creating a Report
1. Start Reporter.
2. Select the report type you want and click Copy.
The pre-configured reports include some basic programing to simplify the
customization process. It is recommended that you create a copy prior to
making changes, leaving the default report unmodified.
3. Click the Properties button (while your copy is selected). The Report Properties
dialog box appears.
On the General tab, it is recommended that you change the default report name
to distinguish it from other reports you may create.
4. Click New from within the Database Queries section. The Database Query
Properties dialog box appears.
5. Select your DSN (Data Source Name). This is the name of your database file or
archive.
6. Select the appropriate Log file(s) for the report. Click OK to close the Database
Query Properties dialog box.
7. Click on the Distribution tab and select the appropriate checkbox.
You may need to provide more information, such as a destination folder or
email address, depending on your distribution method.
8. Make any changes you require on the Advanced tab and write any information
you desire on the Notes tab.
9. Save your new report template.
Generating the Report
1. Select your report from the list.
2. Click Generate.
The Report Generator extracts the requested information from the database,
applies the TOU (if required), and displays the report in Microsoft Excel. Larger
reports with many queries may take a few minutes to complete.
NOTE
If you selected the checkbox for Interactive Date Range on the Advanced tab, you are prompted to select
the date range within the Interactive Date Range screen.
Page 96 Chapter 4 - Using ACCESS Software
Page 97

9300 Series User’s Guide Report Creation and Generation
Creating a Time of Use Schedule
1. Start Reporter and select the TOU tab.
2. Select the Sample file, then click copy to duplicate it.
All of the pre-configured samples include some basic programing to simplify
customization. It is generally best to create a copy of the samples before making
changes, and leave the sample in its default state.
NOTE
Be aware that the NEW button creates a completely new report or TOU schedule with no default
configuration. Use this option to create completely customized reports.
3. Select your new copy and click Properties to configure it.
Examples of the changes you may want to make to the TOU schedule are as
follows:
Rename the TOU Schedule using the appropriate field.
Modify On Peak and Off Peak charges using the appropriate field.
Add a 'Shoulder Period' which is often called a 'Partial Peak' (see below).
Change the Holidays to an appropriate country (see below).
4. Save the new TOU configuration when configuration is complete.
Adding a Shoulder Period
1. Highlight the Off Peak period by left clicking on it, select New.
2. Rename your new tariff period (i.e. Partial Peak).
3. Modify the time period by left clicking the plus sign, selecting the time period
and changing the time within the left window.
4. You will also have to modify the time period within the On Peak and/or Off Peak
intervals to ensure that there is no overlap (i.e. if your new 'Partial Peak' period
is bet wee n 6: 00 a nd 8:00 PM, t hen you will hav e to change your 'Of f Peak' peri od
to 8:00 PM to End Of Day).
Changing Which Days are Holidays
1. Select the Off Peak period.
2. Left-click 'All Day, Canada Holidays' and select a different country from the
window on the left.
3. Add or remove holiday dates as required.
CAUTION
Double check to make certain that there are no gaps and no overlapping date or time ranges.
The TOU schedule should not be confused with the Time of Use Module used by billing applications.
Once you have completed configuring the TOU schedule, you are ready to create
the actual Energy and Demand report.
Chapter 4 - Using ACCESS Software Page 97
Page 98

ION Setup Software 9300 Series User’s Guide
ION Setup Software
ION Setup is a software solution that allows basic configuration and control
capabilities for your power monitoring devices. ION Setup can also display realtime and diagnostic data for your networked devices.
When starting ION Setup, you have the option to enter network mode or single
device mode at the logon screen. Network mode allows you to add multiple sites
and meters to your network, organize your meters into logical groups, and
configure each site and meter individually. The single device mode, however,
allows you to connect to only one meter and make changes to its configuration or
view its data.
Refer to the documentation on you ION Setup CD or visit the Siemens website for
complete details on ION Setup.
Configuring Communications
With ION Setup, you first create one or more communication sites: the site defines
the communication method. You then add devices to a site, followed by grouping
the devices in a logical manner according to your needs (e.g. by common function
or physical location).
These are the
types of sites
available
You ca n g r oup
meters from
different sites
NOTE
You must be logged on to ION Setup in network mode in order to add a site, group, or device.
Page 98 Chapter 4 - Using ACCESS Software
Page 99

9300 Series User’s Guide Configuring Communications
Sites, Groups, and Meters
You can create a network of items within ION Setup so that the next time you want
to upgrade a meter’s firmware or make any configuration changes, the meter is
easy to find and your communication setup is ready.
Sites refers to a communication method. For example, you need separate sites for
Ethernet, Serial or Modem types of communication. A site can have many
connected devices. You can also have one meter that is connected to two or more
sites provided that the meter has the capability.
A group is an optional feature that lets you define a logical grouping of meters. For
example, you can have a group of meters for power quality monitoring, or you can
have a group of meters defined by location. Groups are always attached to the
System icon. Devices within each group are attached to both the group and a
communications site (sites are connected to the workstation).
You can add a meter to a communication site or a group. When you add a meter
to a group, it is automatically attached to the appropriate communication site.
However, when you delete a meter from a group, the meter remains attached to
the communication site.
Adding a Site, Group or Meter
1. Close any open windows to return to the Network Viewer screen. Do one of
the following:
From the toolbar, click the Insert An Item button, or
From the Insert menu, choose Item, or
Right-click anywhere on the screen to display the shortcut menu, and then
click Insert Item.
The New Network Item dialog box appears (see illustration in step 2).
2. Click the item (Group , Site or Meter) that you want to add. In the Attach To: box,
select where you want to attach the item.
Chapter 4 - Using ACCESS Software Page 99
Page 100

Configuring Communications 9300 Series User’s Guide
3. Click OK. A dialog box for the appropriate item appears. Depending on the
item, there may be multiple tabs each with numerous options for configuration:
When you add a new site, the dialog displays three tabs: General, Timings,
and Polling. If you are adding a modem or gateway site, there is a fourth tab
labelled Remote Info.
When you add a new group, the dialog box has only one tab labelled
General. On this tab, you can change the name of your newly created group.
When you add a new meter, the dialog box displays three tabs: General,
Display, and Tools.
Page 100 Chapter 4 - Using ACCESS Software
 Loading...