

Shimadzu UV-VIS User Manual
Shimadzu UV-VIS User’s Guide
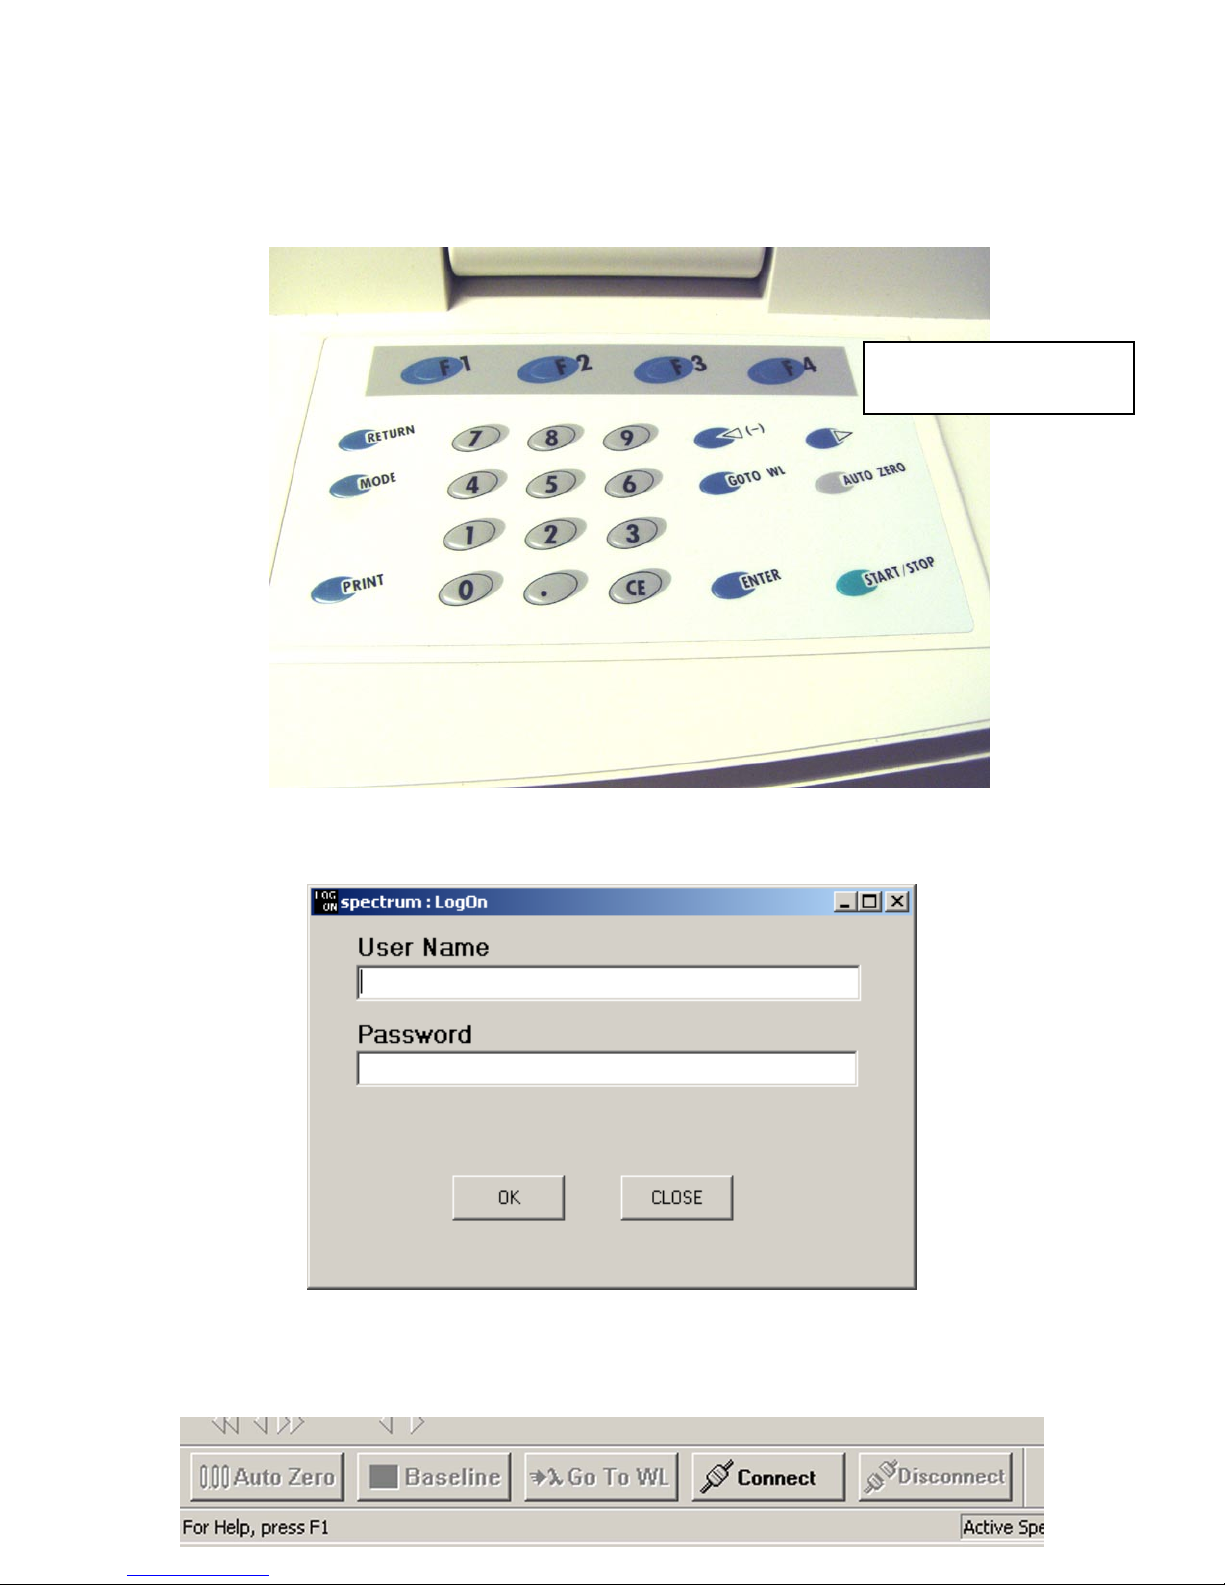
1) Push the F4 button on the UV-VIS instrument keypad. This will enable PC
control.
» Push the F4 Button
2) Log into the UV-VIS software with your username and password.
3) After the UV-Probe software comes up, click on the “Connect” button near the
bottom of the screen to connect with the spectrometer.

4) Choose what type of experiment mode you need.
Spectrum mode is for wavelength scanning over a continuous wide range.
Photometric mode is for quantitative analysis, measuring absorbance at single
wavelengths.
Kinetics mode will collect absorbance data at a particular wavelength versus time.
5) Choose the mode you need by clicking on one of the buttons on the toolbar.
Photometric ¾
Kinetics ½ ½ Spectrum
¾ Edit Method
How to Work in Spectrum Mode
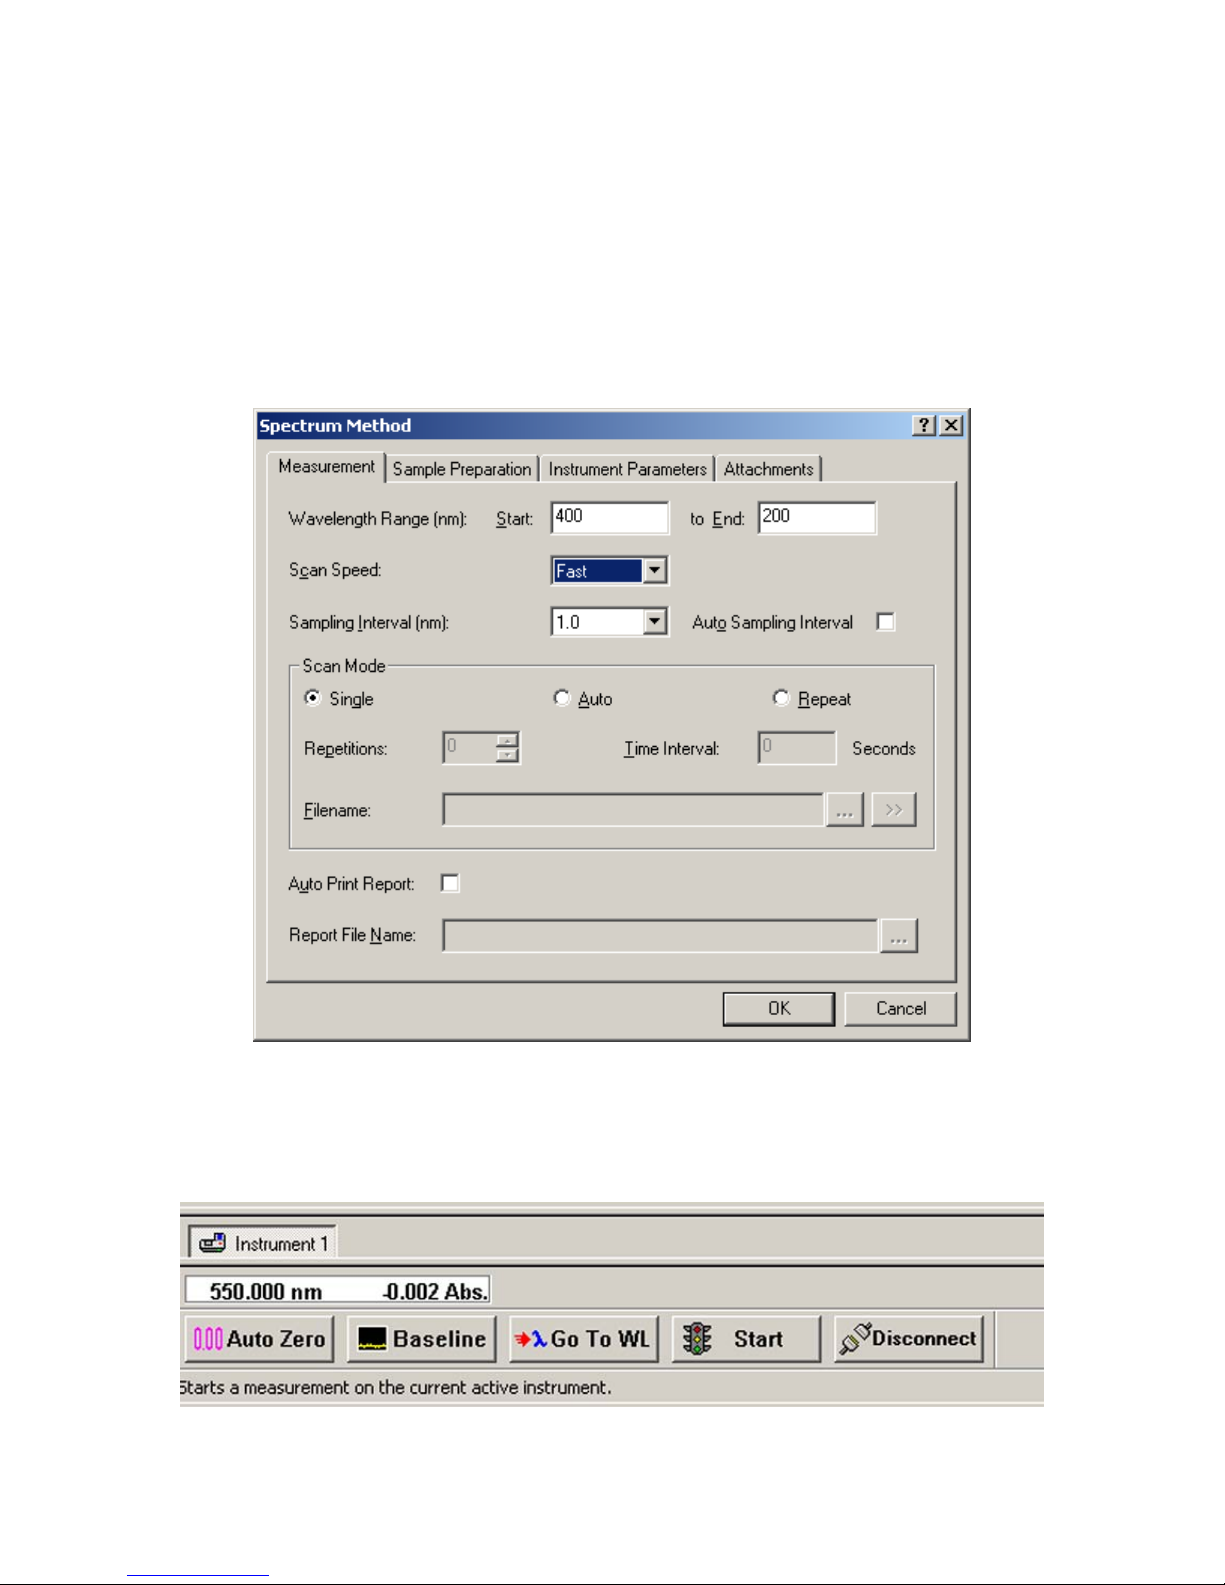
1) After choosing the Spectrum mode of operation, click on the “M” button to set up
your acquisition parameters.
2) Enter your wavelength range and scan speed (usually fast), and click on OK.
The maximum allowable wavelength range is 1100 nm to 190 nm.
3) It’s good practice to zero the baseline by clicking on the “Baseline” button near the
bottom of the screen. Be sure that there are no samples in either the sample or the
reference side while correcting the baseline. (And the cover must be closed, of course).
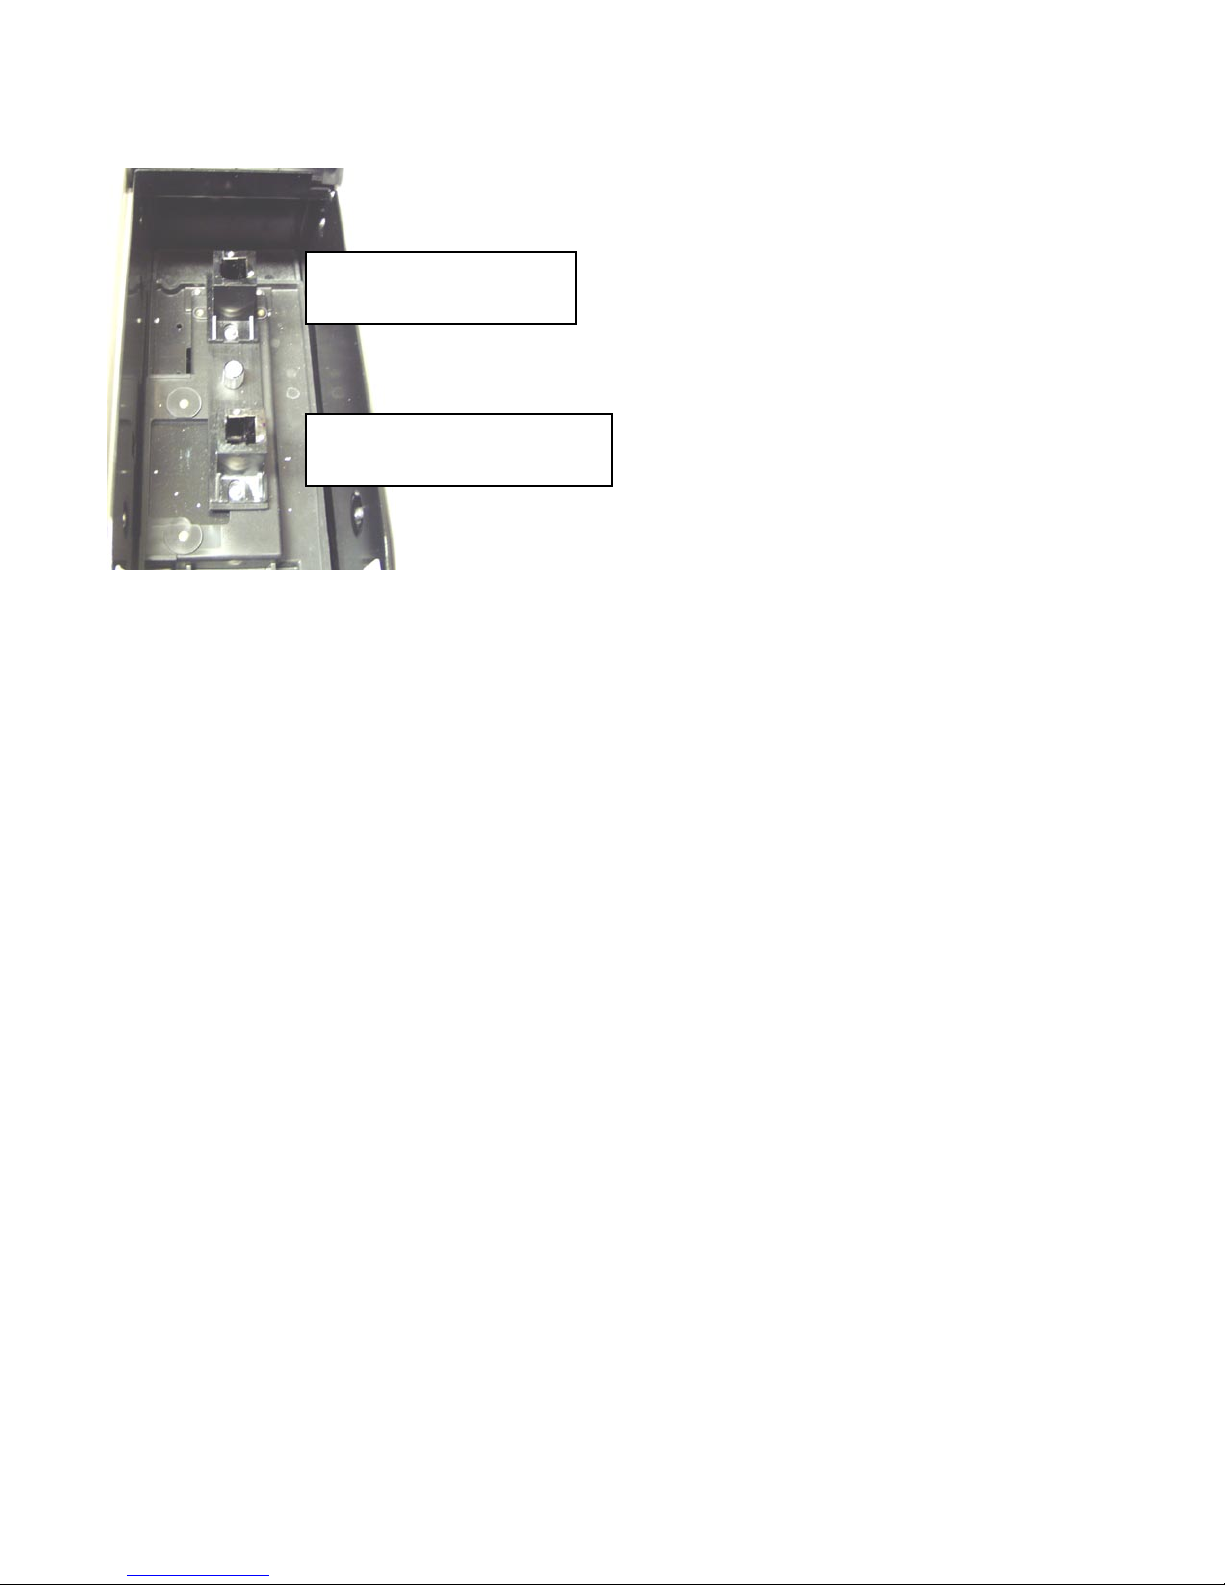
4) Insert your sample into the sample compartment. If you want to, you can insert a
cuvette with blank solution into the reference side.
» Reference side,
towards the back
» Sample side, towards
the front
5) Click on Start to start collecting the spectrum.
Please Note:
After your spectrum has been collected, the program will prompt you for a
filename. However, this does not automatically save your spectrum to disk! You
must then do a “File, Save As” in order to permanently save the spectrum to a disk
file.
To change the appearance of your spectrum, such as the display limits, or the background
color, right-click the mouse on the spectrum graph, and left-click on Customize…
Please Note:
If your peaks of interest are greater than 2 absorbance units, you should dilute the
sample, and then re-run it.
 Loading...