

Page 1

Sage ERP Solutions
Sage Accpac Extended Enterprise Suite Version 5.6 Release Guide
Improve Productivity. Streamline Operations. Increase Visibility.
December 2009
www.SageNorthAmerica.com
Page 2

Overview
As the world of business is constantly evolving, so must your business management software.
At Sage, we work to continually improve your experience with Sage Accpac and develop new
functionality to help you get more out of your solution. We work directly with our extensive
customer base (over 45,000 companies and 200,000 users) to ensure our products work the
way you do to improve processes and enhance productivity. Led by dedicated User-Centric
Design teams, we strive to understand not only how customers interact with and utilize
our software, but also how their businesses work and how we can help to solve their core
business issues. This team collaborates with our customers through several data collection and
interpretation methods, making it easy for you to get involved and get your voice heard! Over
the past year, over 5,000 customers and partners worldwide have been consulted through
on-site visits, surveys, interviews, and observational studies in our state-of-the-art usability
laboratories. The results of this rigorous research are poured into the product development
process helping us to design and build better software.
In this guide you will find an overview of the updates you and our customers prioritized for
Sage Accpac Version 5.6, scheduled for release in December 2009. The key enhancements
developed will help to automate workflow and reduce costs throughout your organization,
helping you accomplish more in less time. You can:
Access decision-quality information and significantly improve your visibility into business •
measurements with the new Sage Accpac Intelligence application.
Better manage IT costs and facilitate secure system access through virtualization.•
Save money on your upgrade costs with free training, higher quality, and faster •
implementation procedures.
Accelerate your collections efforts and improve your cash flow utilizing the now built-in AR •
Inquiry tool.
Improve your customer experiences by providing faster and more informed responses •
through improved reporting, AR Inquiry and SageCRM.
Better manage growth expectations and create loyal customers through SageCRM. •
Improve the productivity of your workforce with the many user-requested enhancements •
throughout your software.
Gain a faster and more accurate view of your cash position with improved workflow in •
Bank Services.
Reduce the risk of penalties and fees through the new functionality in Payroll•
Lower operations costs through better management of your inventory•
As you journey through this resource guide, you may be wondering how you can get your
hands on all of the dynamic new features packed into this version. Great news! You are entitled
to software upgrades and maintenance updates as part of your Sage Accpac ERP Software
Assurance plan. If you need to renew your Sage Accpac Software Assurance plan, you don’t
have to miss out. Simply contact us at 866-709-2436 (615-777-6150 for international) today.
Sage ERP Solutions
2
Page 3
New Enhancements and Functionality
“What’s New” Anytime Learning Training Course
You can quickly get all employees up to speed on the improvements in this release through
the “What’s New” Anytime Learning course specifically for Version 5.6. This online course
demonstrates how you can put all of the great new enhancements to work in your business.
Best of all, this course is offered at no additional cost to you. Visit www.SageU.com/accpac
for details.
Better Insight into Your Business
Increase insight into your business to realize your strategic vision! Take a look at how this new
functionality outlined below can enable your employees and partners to adapt successfully to
changes in today’s markets and make better, faster business decisions.
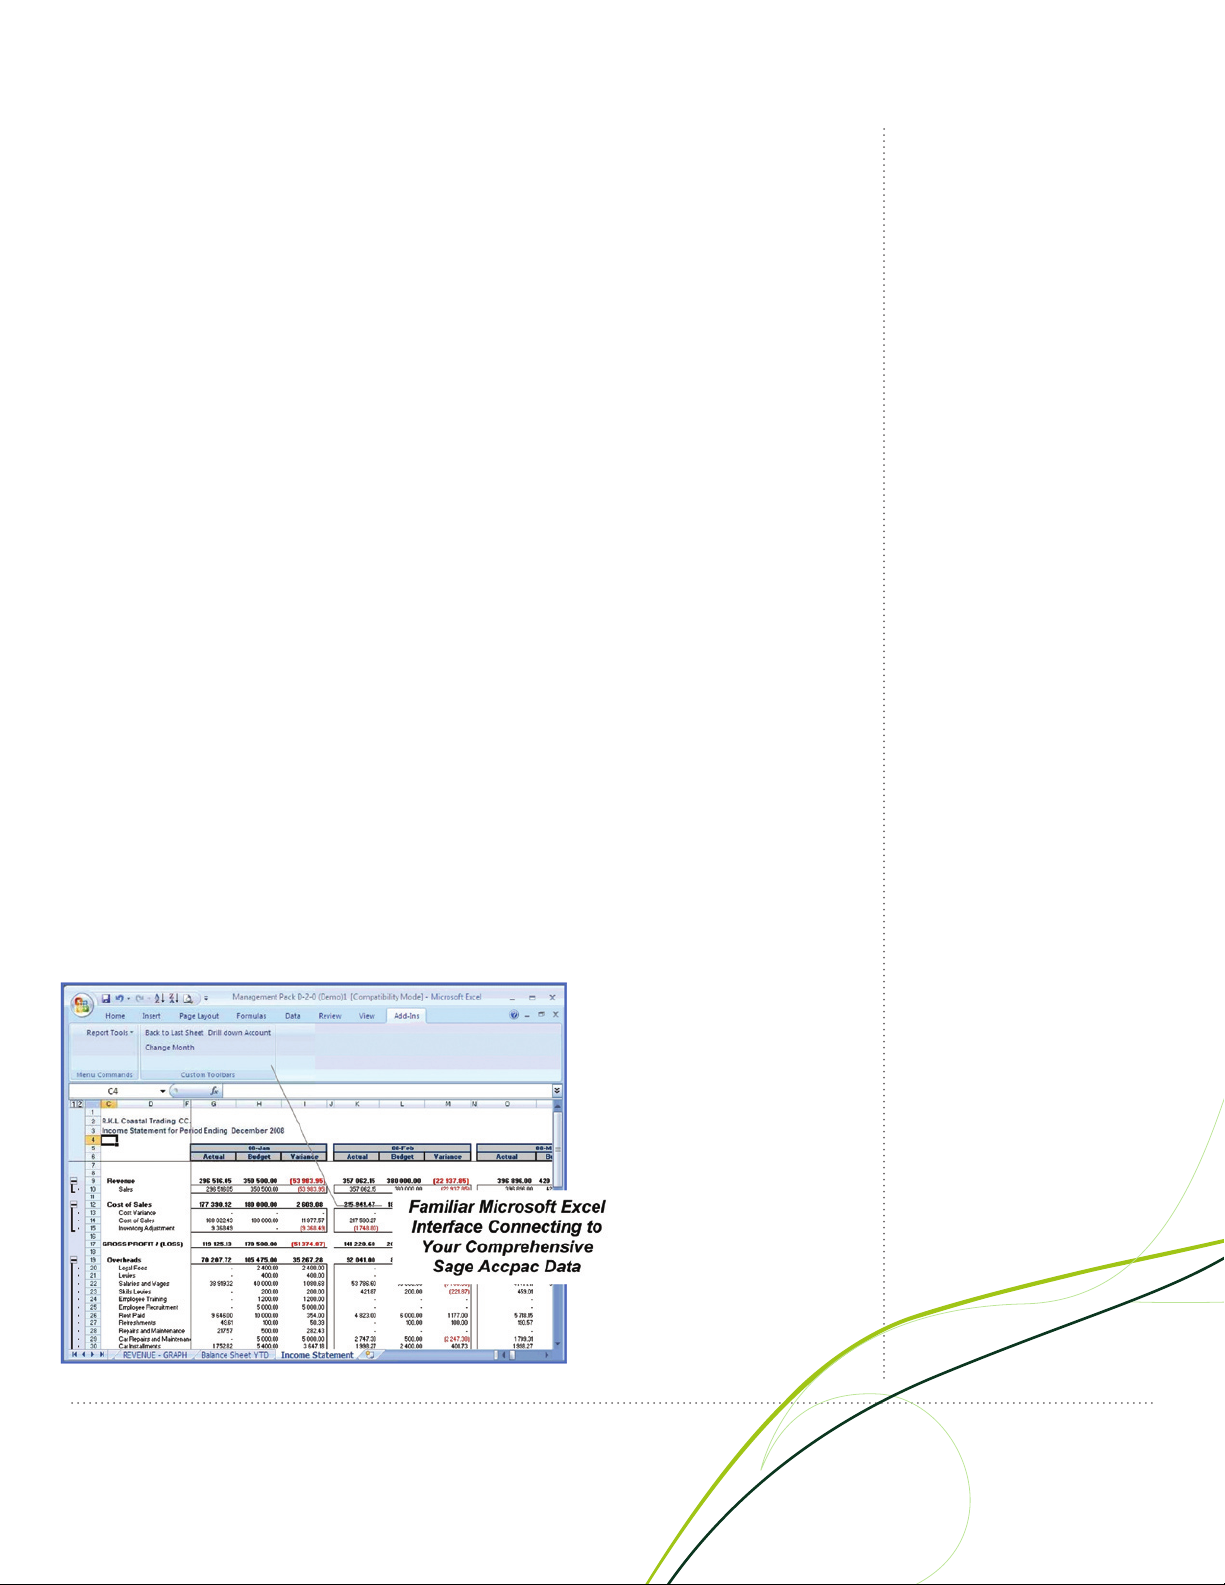
Sage Accpac Intelligence Provides Strategic Planning Tools
Sage Accpac Intelligence–a new product within the Sage Accpac Extended Enterprise Suite–
empowers you to quickly and easily obtain the information you need for operations and strategic
planning from your Sage Accpac solution. Sage Accpac Intelligence lets you effortlessly create
reports and analyze data, utilizing the familiar Microsoft® Excel® application. With Sage Accpac
Intelligence, you can spend more time focusing on information analysis and interpretation and
less time pulling the data together. Best of all, Version 5.6 provides you with the Sage Accpac
Intelligence application at no additional cost. You receive:
Sage Accpac Intelligence Application•
Connection to a single Sage Accpac company database•
Standard report templates for management, sales, purchases, and inventory (defined in the •
next section)
Sage Accpac Intelligence Report Manager•
One User License •
Author new reports (organizing, creating, editing), as well as filter and aggregate data and •
set permissions/security
Sage ERP Solutions
3
Page 4
Standard Report Templates (Included in 5.6)
Get easy-to-use, in-depth financial, operations, and strategic planning intelligence so that you
are always in the know. Sage Accpac Intelligence provides several standard report templates
with your solution, so you can focus on interpreting information to make faster, better business
decisions, rather than trying to create custom reports.
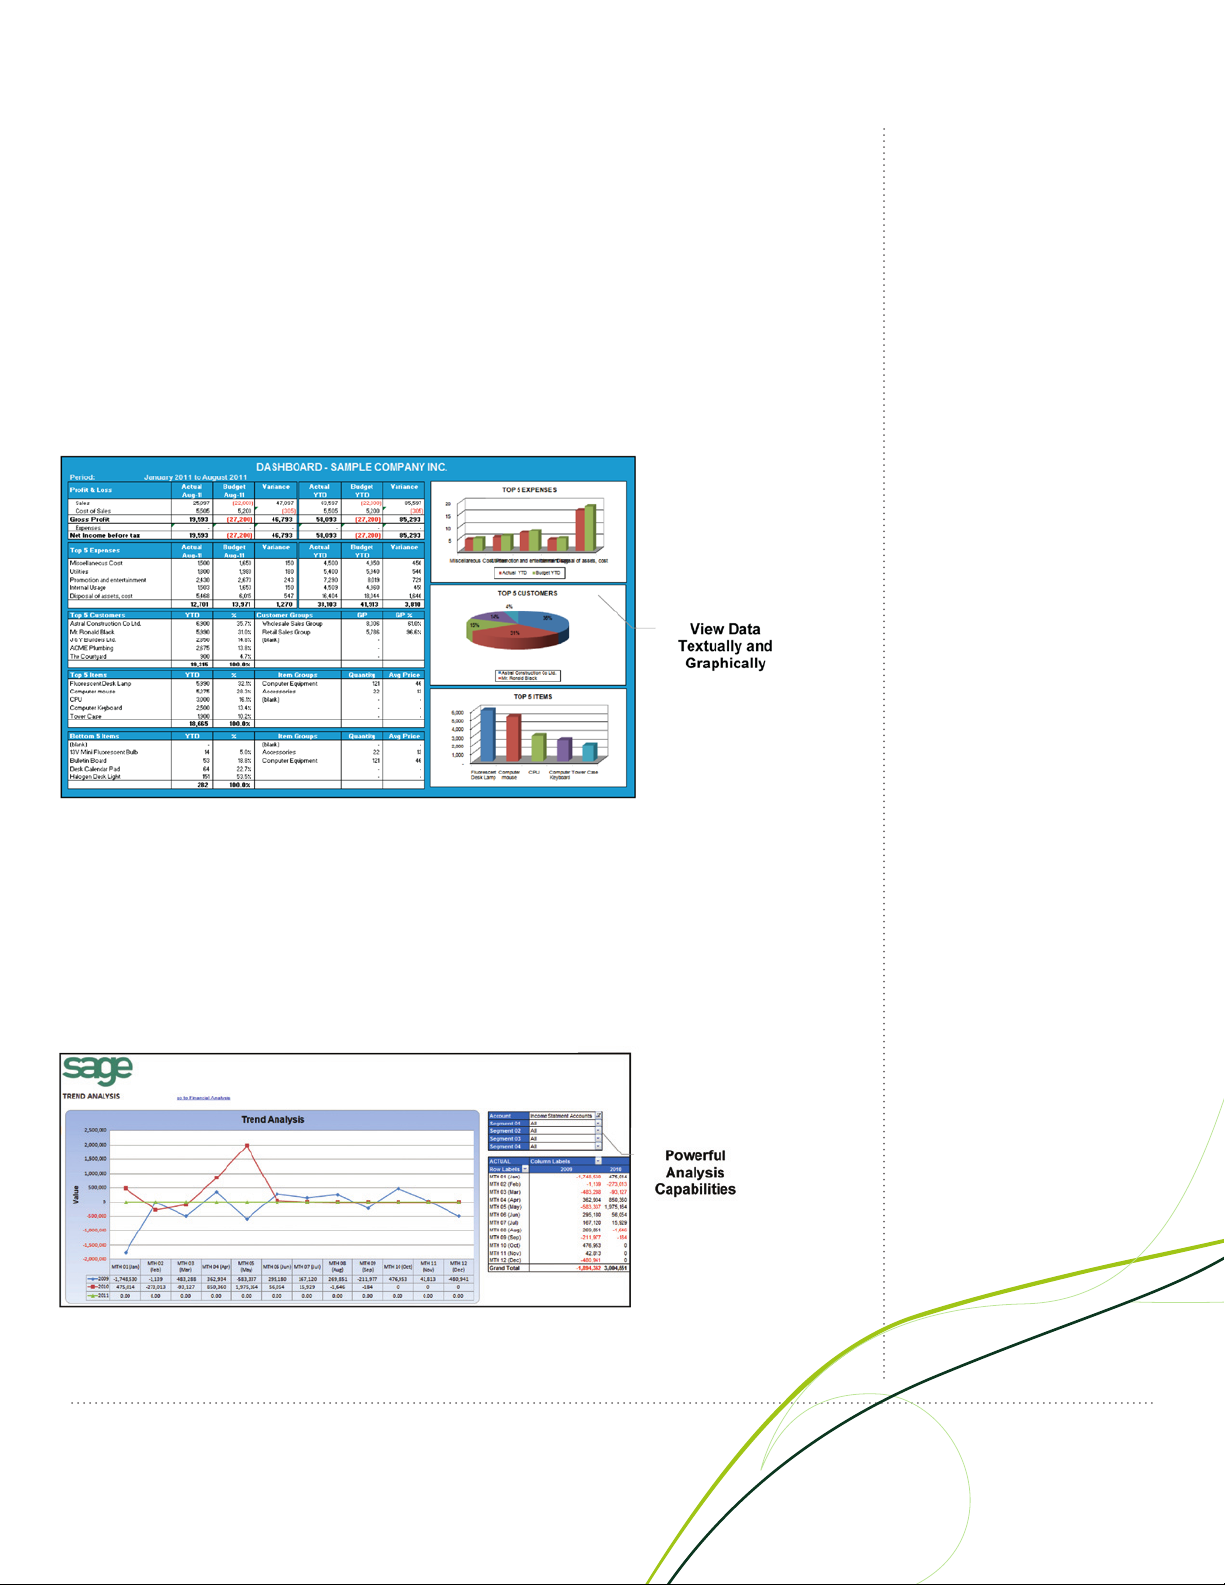
Dashboard Analysis
The Dashboard Analysis report contains a one-page summary of key business information. The
report features “Top N” Reporting on customers, items, and expenses, and contains both text
and graphics to help with daily and long-term planning. In addition, comparative Profit and Loss
figures are displayed for both the current month and year-to-date figures from the start of the
financial year.
Sage ERP Solutions
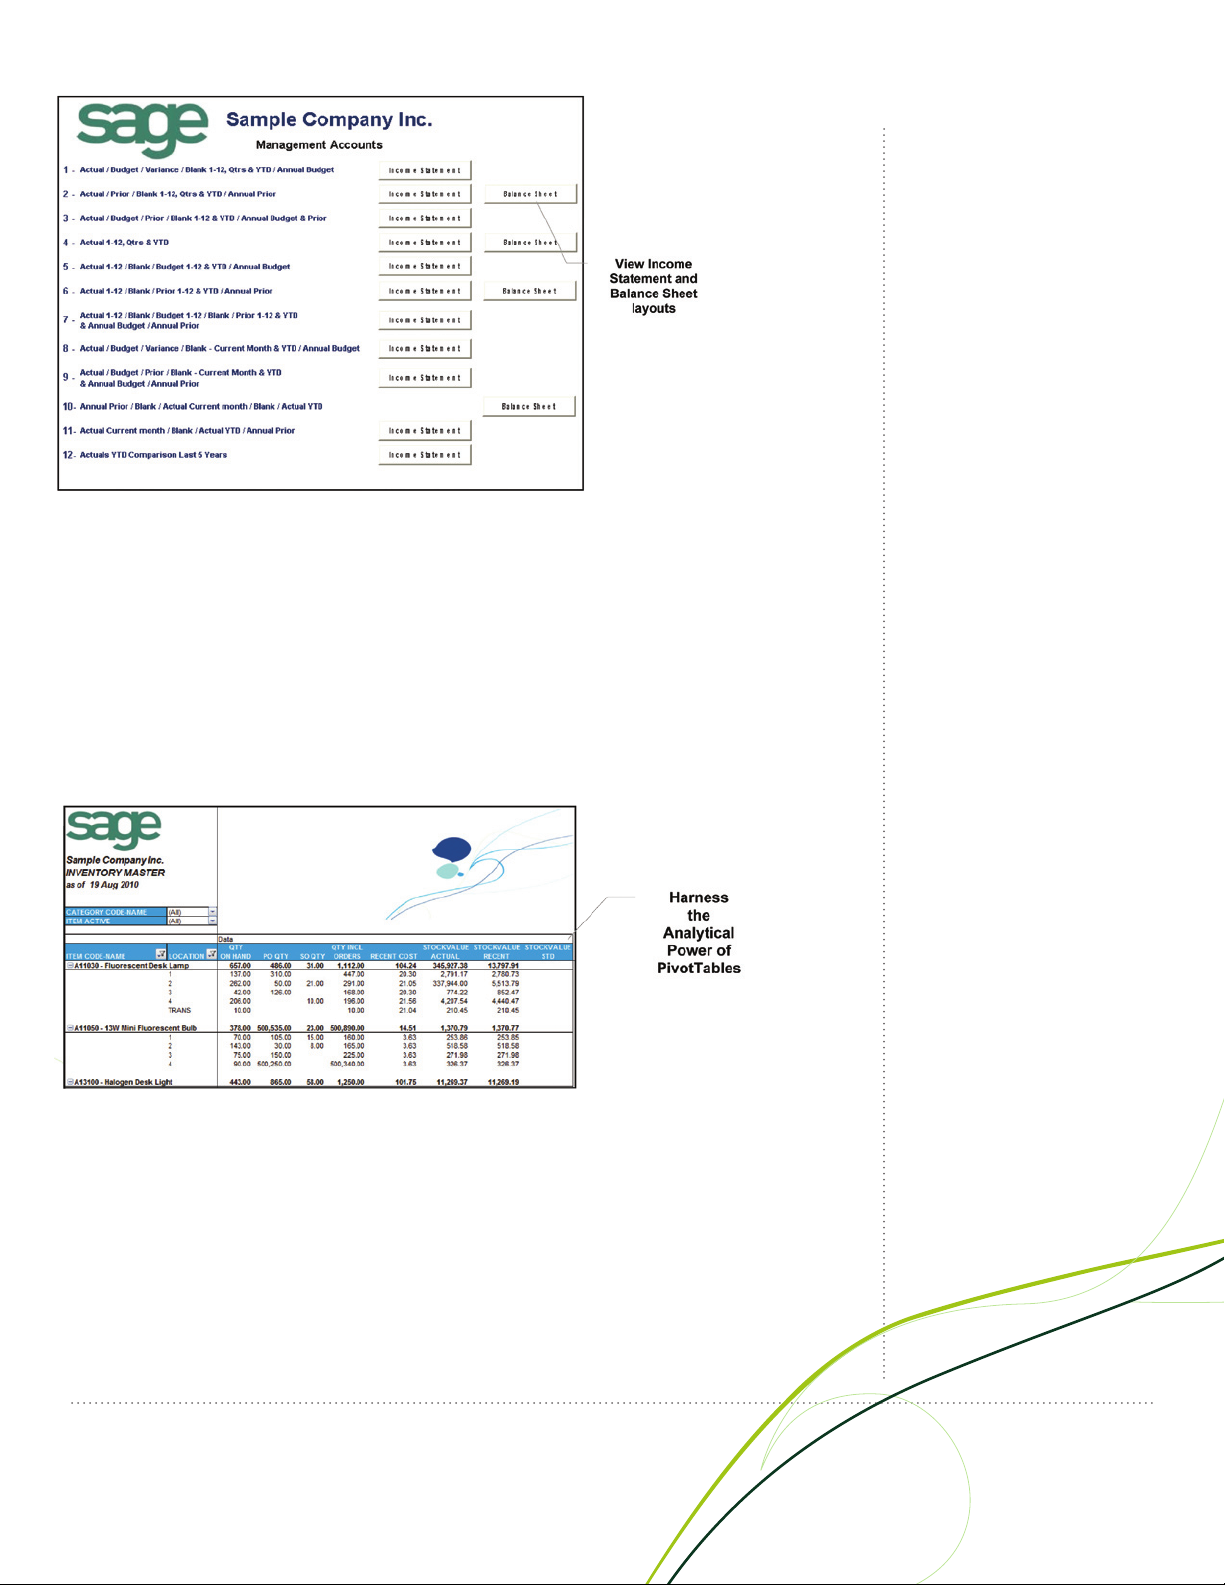
Financial Analysis Reports
Three powerful financial reports are available out of the box. Each of these reports generates
comparative balance sheets and/or income statements for any specified financial year, period,
quarter, and budget. These reports are readily customizable within Microsoft Excel. It is possible
to drill down to the GL Transaction details for any of these accounts.
The Income Statement and Balance Sheet layouts are automatically generated, grouped, and
subtotaled by mapped financial categories.
4
Page 5
General Ledger Transaction Details
This fully customizable report displays the account transaction details and relevant date,
reference, description, and amount totals. It is possible to transform this report into a monthly trial
balance by simply manipulating the Pivot Table within Microsoft Excel.
Inventory Master Report
Displays item cost and quantity information over any given date range, as well as relevant item
location details. The report can easily be filtered by item number and location, or additional
elements can be added to the pivot table for further analysis.
Sage ERP Solutions
Purchase Master
This report lists relevant purchase information by vendor and item number for any given date
range. The report can be filtered by vendor, item number, or unit of measure. It is possible to add
additional elements to the pivot table for further manipulation and analysis.
Sales Master
This report highlights pertinent sales information including item sales quantities, costs, and gross
profits by customer and product. Similar to the previous reports, additional elements can be
added to the pivot table for further manipulation and analysis.
5
Page 6

Report Manager (One License Included in 5.6)
As defined above, the Report Manager allows you to author new reports (organizing, creating,
editing), as well as filter and aggregate data. This tool also allows you to set permissions/security
for reports. One user license is included with your 5.6 upgrade; however, additional licenses can
be purchased as needed in your organization.
Report Viewer
This tool provides you with basic editing capabilities (filtering and changing of parameters) and
drill-down functionality on existing reports/templates. You can provide Report Viewer licenses to
staff members who do not need to create new reports.
Connector
The Connector tool further simplifies the day-to-day operational tasks of financial managers
allowing access to the information they need from multiple sources and consolidation of data
from multiple companies. Purchasing this tool allows for consolidations and connectivity to
unlimited ODBC data sources.
Analysis
Support business strategy and decision making through advanced analysis of trends and what-if
scenarios. The Analysis product allows you to utilize built-in Microsoft Excel Pivot Tables to get
insight into information that goes beyond transactional data. You can create OLAP cubes, which
enable multidimensional analysis of your data. However, there is no need to start from scratch, as
purchasing the Analysis tool provides several reports, such as:
Inventory Analysis Cube
This report allows you to analyze year-to-date stock-on-hand quantities, purchase and sales
order quantities, and actual stock values by inventory group. You also receive the ability to
perform multilevel drill-down into the required level of detail and a Top N Items graph.
Sales Analysis Cube
This report allows you to analyze sales quantities, gross profits, and amounts by customer,
product, and salesperson over multiple fiscal/calendar years. It also provides the ability to perform
multilevel drill-down into the required level of detail and includes Trend Analysis Graph.
Sage ERP Solutions
Financial Analysis Cube
This report allows you to analyze G/L accounts by Account Group and segment over multiple
fiscal years. It also enables multilevel drill-downs into the required level of detail and includes a
Trend Analysis Graph.
6
Page 7

Optimized Reports with More Options
We have refreshed and optimized many of the reports that you utilize on a daily basis to
incorporate many requests from our users. We have added global enhancements to reports that
allow you to save parameters easily and quickly export reports into Microsoft Excel.
Accounts Payable Reports
The Vendor Transactions, Aged Cash Requirements, and Aged Payables reports now have better
visibility for adjustments, as they can be reported as regular documents as well as in applied
details. All three reports can now be sorted by transaction type and have an easier way to identify
miscellaneous payments. Both the Aged Cash Requirements and Aged Payables report include
an option to show Aged Retainage on the report.
Check Sorting
You can now sort checks during print runs! Using the Sort Checks by list on the Transactions tab
of the A/P Options form, you can sort by Vendor Number, Payee Name, Payee Country, Payee
Postal Code, and Transaction Entry Number. The selection becomes the default sort order when
printing checks.
Accounts Receivable Reports
Customer Statements Report
We have updated the layout and organization of the Customer Statements report to make it
easier to read, removing the little-used tear-off portion of the statement. The remaining columns
in the body of the statement are now wider and can accommodate longer entries. On Balance
Forward statements, we have removed the balance forward amount from the statement body.
The previous balance is now presented in a new section at the bottom of the statement that also
shows the credits and new charges since the last statement, as well as the new balance.
Aged Trial Balance and Overdue Receivables Reports
There are several new options for the Aged Trial Balance and the Overdue Receivables reports,
including the ability to sort transactions by transaction type for each customer. You can also list
adjustments separately from the transactions that they were applied to and select whether to
print aged retainage amounts for each customer, if you are printing the report by due date.
Sage ERP Solutions
Customer Transactions
You can now sort transactions by transaction type for each customer and list adjustments
separately from the transactions that they were applied to. If you select the option to show
applied details, they also appear with the documents to which they apply.
Check Sorting
You can now specify the order in which to print refund checks! You can print refund checks
by Transaction Entry Number, Customer Number, Payee Name, Payee Country, and
Payee Zip/Postal Code.
Bank Services Reports
Along with the many improvements mentioned in the Bank Services section, we have added
three new reports to assist you with insight into your bank services. The new Transaction
History Inquiry form lets you print the results of your inquiry on transactions processed in Bank
Services. Also, the new ability to print a deposit register lists all deposits to a bank account
or a range of bank accounts for a specified period. In addition, you can restrict the report to
deposits processed using one source application or a range of applications and specify additional
selection criteria, such as deposit types and reconciliation statuses. This new report can be
sorted by deposit number, transaction date, or customer name and be printed in summary or
detail. Finally, the Bank Entries Posting Journal serves as a printed record of bank entries that
were posted together, providing an audit trail of transactions posted in Bank Services by
posting sequence.
7
Page 8

General Ledger Reports
New reports that show net changes for a specific period can be printed using the G/L Trial Balance
Report form. The trial balance report prints the balance for each account in the range of accounts,
segments, account groups, account-sorted groups, or optional fields in the general ledger as of the
fiscal period you specify. There are up to seven different trial balance report formats you can print! We
have also included new options on the Transaction Listing form, such as the ability to include Balances
and Net Changes, include Posting Sequence and Batch-Entry Numbers and the option to sort all
transactions by date within the accounting periods.
Inventory Control Reports
You can now set the period during which a price list is in effect for a particular item on the Item
Pricing form. This lets you bring new price lists into effect on particular days and retire old price lists.
You can select an option on the Transfer Slips form that lets you exclude transfer slips that have
already been printed.
Purchase Order Reports
We have enhanced several reports in the Purchase Order application. The Purchase Order Action
report now allows you to select by document date and sort by item number.
The Purchase History Report now has options to include serial and lot numbers on the report and
select by document date. The Purchase History inquiry, Print Posting Journals, Receiving Slips, and
Return form will also allow you to view serial and lot numbers for selected transaction that involve
serialized or lot items.
Sage ERP Solutions
Proficiently Manage Bank Services
Today’s business environment is ultra-complicated when it comes to managing money. Multiple
companies, multiple bank accounts, and multiple currencies translate into a lot of time spent
managing and reconciling accounts in order to get an accurate view of your cash position. Thankfully,
Bank Services pulls information from your financial transactions into a single location, and now Sage
Accpac Version 5.6 empowers you with a more straightforward way to reconcile your accounts and
finish month-end in record time.
8
Page 9

More Intuitive and Easier to Use
The new user interface simplifies the user experience and allows for greater flexibility and more efficient
daily task management. Cash management processes are greatly improved. You can also take
advantage of new functionality such as bank security resources for separation of duties, an improved
reversal process, and a bank entries posting journal. With Version 5.6, you will be more efficient in your
daily tasks so you can focus your time on strategic projects, improving processes, and generating
more profits.
Sage ERP Solutions
9
Page 10

More Visibility into Cash Management
You have the ability to get a fast and accurate view of your cash position and better insight into cash
flow with the improved reporting. Enhanced reporting includes many new options and new reports
such as the Deposit Register, Bank Entries Posting Journal, and Transaction History Inquiry reports.
It has never been easier to ensure that you have accurate, up-to-date information to determine your
cash position.
Sage ERP Solutions
Better Audit Trail and Integration to General Ledger
A new Bank Entries Posting Journal form maintains your audit trail and keeps a history of posted
transactions, so you can review bank transactions even after posting them. We also improved the
General Ledger integration as you can specify different reference information from bank entries, bank
entry details, and reconciliation entries to use in the corresponding G/L entries. Also, if you use the
“Create G/L Transactions By Creating A New Batch” or the “Create And Post A New Batch” and you
reverse multiple checks, Bank Services 5.6 assigns all the check reversals to a single G/L batch.
Increase Productivity–Finish Tasks Faster
For over 30 years, Sage Accpac software has provided businesses with the flexibility and business
management tools they need to take the complexity out of their processes, and with the new
Version 5.6 release, the bar has been raised even higher. Now you have more ways than ever to
accommodate your procedures and get your job done even faster.
10
Page 11

Improved Accounts Payable Prepayment Search Functionality
Version 5.6 saves you time when processing prepayments entered in Accounts Payable that are
applied to a purchase order. You can apply payments to existing Purchase Orders when you prepay
a vendor. This enhanced feature allows you to quickly find the information you need to validate the
prepayment details.
Quick Access to Vital Information on Accounts Receivable
Satisfied, loyal customers are more profitable, spend more per purchase, and refer other customers
to you—all of which translates into better financial performance. Sage Accpac Version 5.5 provided
the AR Inquiry tool as part of the Accounts Receivable module. And now Version 5.6 goes one step
further, as functionality of AR Inquiry is completely built into the Accounts Receivable module, allowing
you to provide faster, more informed responses to customer inquiries, gain quick access to detailed
account information, and track detailed notes. You can even utilize this tool to improve your collections
process and optimize your cash flow. Concentrate your efforts on clients who fit specific criteria that
you define—such as number of days overdue, dollars over limit, call back date, and more. Keep
records of all phone conversations, e-mails, and even resend customer invoices with a few clicks.
This way anyone who talks to the customer has the ability to know what the customer has been told
by other employees. Empower your staff with the vital information they need to provide exceptional
customer service, improve collaboration, and optimize your collections process.
Sage ERP Solutions
Customer Inquiry
The Customer Inquiry form lets you view document history and drill down from Documents, Receipts,
and Refunds tabs to original entries. Use the Customer Inquiry form to:
View customer-related details, such as the customer’s billing address, ship-to locations, or •
recurring charges, comments, credit status–including pending, outstanding, and overdue
balances and contract pricing (with Inventory Control).
Look up transaction activity for a customer and miscellaneous receipts for unspecified customers •
and sales history (if you use Order Entry).
View transactions that are pending in Accounts Receivable, as well as orders that are outstanding •
or shipped in Order Entry (if you use Order Entry).
Check a customer’s tax group or credit bureau information.•
11
Page 12

Document Inquiry
A new Document Inquiry form displays all the information for a specified document, including all
transactions that are applied to the document. The Document Inquiry form also lets you open the
Customer Inquiry form to view information for the customer associated with a document. When using
the Document Inquiry form, you can:
Set a customer filter to display only documents for the current customer when you use the Finder •
or the navigation buttons for the Document No. field.
Display amounts in customer currency or in functional currency (Multicurrency required).•
Print a copy of the original invoice, debit note, credit note, receipt, or interest charge directly from •
the Document Inquiry form.
Drill down to the batch header for the batch that contains the current document in the original •
transaction entry forms and order numbers and shipment numbers to view the original order or
shipment in the Order Entry program.
View transactions that have been applied to the current document. •
If the selected document is job-related, or if it includes retainage, you can see how transactions •
were applied on a detail basis.
Customer List
The new Customer List is a powerful, flexible reporting tool. It lets you apply a wide selection of
criteria, including optional fields, to produce a variety of reports to suit different needs. For example,
you can:
Print a report of customers with amounts overdue, for collections purposes. You can age the •
report by due date or by document date, and you can specify whether to filter the report results
by credit limit.
Get a list of customers by territory and customer group for a marketing campaign.•
Provide salespersons with a list of customers by comment follow-up date, and include customer •
contact information to ensure timely follow-up with customers.
If you use optional fields, you can print a report by any number of optional fields that you use to •
identify customers.
Print a report of customers whose accounts are inactive, prior to deleting their accounts.•
Sage ERP Solutions
Optimized Payroll Management
Sage Accpac is known for its fast, dependable, and secure payroll management, which ensures
your privacy while providing reliable and accurate information. Version 5.6 introduces several usability
enhancements. Get payroll done faster utilizing improved performance, new FLSA weekly calculation
(U.S. only), and employee security features. Ensure your payroll is up to date and compliant with the
latest government updates and regulations. A Payroll Update Plan is required to receive regular tax
updates. Call us at 866-709-2436 to get more information or go to: http://www.sageaccpac.com/
support/pup
Better Manage Project and Job Costing for Higher Profitability
Quickly find projects with new search functionality. As your business grows, you have more information
to track! With Sage Accpac Version 5.6, you can now easily find and access project information even
when you have hundreds of jobs in the system. We also have included the ability to quickly print Billing
and Revenue Recognition Worksheets. These worksheets provide the information you need to ensure
maximum profitability for each project.
12
Page 13

Better Manage Your Inventory
Version 5.6 delivers several enhancements to assist you with inventory management–a key area
for process improvements used to reduce costs that also result in better service—and greater
customer satisfaction.
New Serialized Inventory and Lot Tracking
As you know, tracking your inventory by serial and/or lot numbers can dramatically improve your
inventory traceability and allows you to manage product recalls, returns, repairs, and charge-backs
more efficiently. Sage Accpac Version 5.5 delivered Serialized Inventory and Lot Tracking as one
bundle, saving you money and giving you more flexibility. Version 5.6 takes Serialized Inventory and
Lot Tracking to the next level as this functionality has been completely redesigned to improve workflow
and performance and add customer requested functionality.
Sage ERP Solutions
Every smart business is constantly looking for ways to reduce costs and create more productive
operations. With this tighter integration you can expect better transaction tracking for improved
auditing and better performance and usability. You will also find:
Improved Serialized Inventory and Lot costing methods traceability.•
Mask structure per item–rather than per system. •
The ability to allow the quantity to be different at the item level rather than the system level.•
Auto-allocation of serials and lots•
Gain tighter control of stock levels with the improved integration and functionality. Your serial and lot
tracking will be more accurate then ever before, while eliminating costly mistakes and allowing you to
get your work done faster.
13
Page 14

Optimized Inventory Valuation Report
The Inventory Valuation report plays a crucial role in your month-end inventory management process
by providing a snapshot of inventory activity for each day within the date range you specify. In Sage
Accpac Version 5.6 we have greatly improved the performance of this report, so you can now get your
detailed valuation information faster.
Faster Access to Information
In Sage Accpac Version 5.6 inquiry selections are passed directly from the inquiry parameters to
the report. The Sales Statistics Inquiry/Report, Transaction History Inquiry/Report, and Transaction
Statistics Inquiry/Report support this time-saving functionality.
New Internal Usage Form
Inventory Control’s new Internal Usage form lets you record transactions that take items from inventory
for your own company’s use. For example, an office supply store could take a desk from inventory for
a new employee. Or it could take paper, pencils, and pens from inventory for office supplies. In both
cases, you are taking goods for internal usage.
Improved Integration to Sage FAS Fixed Assets
If you use Sage FAS to manage the fixed assets in your company, you can also mark goods taken out
of inventory for internal use as fixed assets, and choose the Sage FAS template that you want to use
for the new asset. Sage Accpac ERP software transfers the asset information to Sage FAS when you
run Create Assets in the Sage FAS Integration module.
Additional Costing and Transaction Creation Options
Inventory Control 5.5 provides more options for costing items and creating subledger transactions
and audit information—either during posting or when you run Day End Processing. Previously,
Inventory Control let you cost inventory items when transactions were posted or when you ran Day
End Processing. However, if you decided to cost inventory items during posting, the program would
automatically create subledger transactions and audit information at the same time. In Version 5.6,
these two processes have been separated to give you better control over posting performance and to
provide you with up-to-date item information.
Sage ERP Solutions
Item Inquiry and Drilldown Functionality
Inventory Control now allows you to view the number of items at each location on purchase order, on
sales order, and committed to orders. Simply open the Location Details form, highlight the location
you want, and click the appropriate drilldown button to see purchase order and sales order details.
You can drill down again to specific purchase orders and sales orders. In addition, you can now drill
down to Project and Job Costing transactions from job-related inventory shipments and adjustment
transactions.
Posting Dates for Transactions
Inventory Control now provides a Posting Date field on transaction entry forms (in addition to the
document date) that lets you specify the date to use for the transaction when it’s posted in General
Ledger. The ability to specify posting dates is particularly useful if you need to post a document to a
different year or period from the document date. In addition, a new option lets you specify the type of
date to use as the default posting date on transaction entry forms. (You can select the document date
or the session date as the default posting date.)
14
Page 15

Streamline Your Business Processes with SageCRM to
Boost Profitability
Growing a business in today’s economy can be challenging. To help you succeed, the latest version
of Sage Accpac software offers you CRM included in your solution! Version 5.5 introduced the Sage
Accpac Extended Enterprise Suite–a revolutionary approach to connecting your front and back offices,
dynamically linking processes, information, workflows, and communication channels. The foundation
of the Extended Enterprise Suite is made up of Sage Accpac and the award-winning SageCRM
solution. Sage Accpac Version 5.6 continues this tradition–integrating seamlessly with SageCRM 6.1
and with 6.2, which includes important enhancements to how Sage Accpac and SageCRM interact.
Solo Synchronization
A comprehensive CRM solution enables organizations to guarantee their sales and customer
care professionals have access to critical data–regardless of whether or not they have an Internet
connection. With Version 5.6, you can view and synchronize SageCRM data on the Solo client when
integrated with Sage Accpac. The only exception is that Sage Accpac-related data cannot be added
or modified. As a result, Offline Synchronization simply makes your field sales, marketing, and service
personnel more productive and efficient because they can work anytime, anywhere, irrespective of
connectivity. Offline Synchronization is also cost effective since end users can install the offline client
by downloading it directly from Sage Accpac CRM and it does not require additional software such as
Microsoft Internet Information Services (IIS) or Microsoft SQL Server® Desktop Engine (MSDE).
Sage ERP Solutions
Benefits
Access to important •
account contact and history
information
Maximize time while traveling•
Cultivate stronger sales •
relationships
Improve customer service•
Update account information•
Add key account data•
Schedule activities and •
appointments
Synchronize information at •
a later point in time
15
Page 16

Relationships
Customer National Account relationships are now being maintained between SageCRM and your
Sage Accpac solution. The synchronization of National Accounts is supported from Sage Accpac to
SageCRM, so National Account relationships must be maintained within Sage Accpac. You will find an
additional menu choice to “Import National Accounts” in the Sage Accpac Administration menu, and
the integration can be turned on and off in SageCRM Setup (Note: Initially it is off). Save time and keep
your Customer National Account relationships in sync.
Salesperson Integration
Version 5.6 provides the ability to set the Salesperson Codes on companies that are promoted
to Sage Accpac. A new table is available in SageCRM to allow finder capabilities on Salesperson
Codes, which can be synchronized from Sage Accpac in the “Synchronize Tables” menu choice of
the Sage Accpac Administration menu. After a company has been promoted, Salesperson codes are
displayed only within SageCRM and can only be modified within Sage Accpac. Salesperson codes
are displayed on the Customer Statistics tab. You can also display the Sales-Split on O/E Orders,
Shipments, and Invoices.
All Shipments and Receipts
New menu choices have been added in SageCRM to provide the ability to display all shipments
and receipts. These new menu choices were added to support the ability to display “Standalone
Shipments,” which do not have a corresponding order.
Tax Information
Sage Accpac Version 5.6 has added the ability to hyperlink where total tax amounts are displayed.
The hyperlink displays the breakdown of the tax by tax authority, saving you time in locating detailed
information.
Customer Price List and Vendor Contract Costs
A new menu choice, “Customer Price Lists,” has been added to the Order Entry Inquiry menu to
display customer price list information. A hyperlink has been added to the unit price field for easy
access to how the unit price was obtained based on the customer price list information. A new menu
choice has been added to the Purchase Order Inquiry menu. “Vendor Contract Costs” to display
vendor cost information as well.
Sage ERP Solutions
Serial Number and Lot Tracking Integration
Serialized Inventory and Lot Tracking integration have been added to Order Entry and Purchase Order
Inquiry. Serial and lot numbers are displayed on those documents within where serials and lots are
attached. Additional menu choices have been added to the menus to display serial and lot information.
In order to display serial and lot sales history, day-end processing must be run.
Lower Total Cost of Ownership
Version 5.6 offers the new Sage Accpac Intelligence module as part of your Software Assurance plan,
which may eliminate the need for current custom reports. This version also improves the upgrade and
activation process to ensure cost-effective adoption. We improved the installation, setup, and upgrade
processes to facilitate fast deployments, especially when utilizing multiple company databases.
Activation has also been greatly enhanced so you can easily activate multiple modules through the
new intuitive interface. In addition, we have added additional support for companies that want to
deploy the software in virtual environments, further lowering the cost of ownership.
16
Page 17

Proven Quality = Confident Upgrades with No Surprises
You can be assured that Sage Accpac ERP 5.6 will be tested, tried, and true for our General
Availability (GA) release. We have already completed extensive alpha and beta testing cycles. These
cycles continuously test our software through internal quality assurance and user-centered design
teams as well as independent business partners. The next step in the quality assurance process is
a 12-week “Controlled Release” cycle, which puts the software live in many customer sites. These
sites utilize the software in their everyday processing and work closely with our teams to ensure Sage
Accpac ERP Version 5.6 is ready for release.
We also provide a “Detailed Technical Changes List” so there are no surprises during your upgrade
process. You as well as your Sage Accpac Certified Consultant have access to this information
through the Knowledgebase and it is updated as we provide each Product Update. This is just another
example of how we are working with you to deliver the lowest Total Cost of Ownership possible. This
focus on quality ensures you can be confident that new functionality in Sage Accpac Version 5.6 can
be put to work in your business.
Technology Updates
The evolution of technology is as certain as death and taxes. Hardware, databases, operating systems
(OS), servers, and all IT infrastructures are ever-evolving. New versions of Sage Accpac are designed
to support these latest servers, operating systems, hardware, and database technologies, ensuring
that your system is supported and running at peak performance. Not upgrading means you might be
faced with legacy systems that are no longer supported or maintained by the manufacturer. For the
latest Sage Accpac compatibility information, please refer to the documents available here:
http://www.sageaccpac.com/products/systemrequirements
This document will be updated with Version 5.6-specific information after November 2009.
Most notable changes in this release are that Sage Accpac ERP Version 5.6 has been tested with
Microsoft Vista and Windows 20008.
Sage ERP Solutions
Making the Move to a Microsoft SQL Database
With Microsoft SQL Server, users and information technology professionals across your organization
benefit from improved availability, increased scalability and performance, and tight, yet flexible security
controls. Sage Accpac Extended Enterprise Suite is available bundled with Microsoft SQL Server. The
bundled SQL Server version includes all the same database administration tools and performance
characteristics as the Microsoft SQL Server Standard Edition, with no restrictions on database size.
The only difference is that it can only be used for Sage Accpac applications. So why move?
Performance: The scalability of Microsoft SQL Server has been tested with 1,000 concurrent •
midmarket ERP users. You can add indexes to improve performance without interfering with
access to tables or existing indexes.
Availability: Microsoft SQL Server includes innovative high-availability features such as database •
mirroring, replication, and enhanced online operations to minimize downtime and help to ensure
that critical enterprise systems remain accessible.
Security: A new security model beginning with Microsoft SQL Server 2005 allows administrators •
to easily manage permissions at a granular level. Administrators can set policies on logons so that
a consistent policy is applied across all accounts in the domain. Microsoft SQL Server includes
encryption capabilities within the database itself. Client/server communications are encrypted by
default. A server policy can be defined to reject unencrypted communications.
17
Page 18

Low cost maintenance: A single management console enables data administrators anywhere •
in your organization to monitor, manage, and tune databases and associated services across
your enterprise. A Microsoft SQL Server database user is now priced the same as a Pervasive
database user, so now there is no price obstacle to moving! You can also “trade in” your PSQL
licenses for Microsoft SQL Server users at no charge for the software.
Access Additional Information
You can get more information on Sage Accpac Version 5.6, future releases, and all other
aspects of Sage Accpac through the community and knowledgebase–share, collaborate,
learn—www.sageaccpac.com/community and the Sage Accpac Web Current 5.5 Release:
http://www.sageaccpac.com/products/new/
Sage ERP Solutions
The information contained in this document represents the current view of Sage on the issues
discussed as of the date this document was prepared. Sage cannot guarantee the accuracy of any
information presented after the date of publication. The capabilities, system requirements and/or
compatibility with third-party products described herein are subject to change without notice. Contact
Sage for the most current information. Always consult a network specialist to discuss the security
risks involved before implementing any Internet solution. Sage is not responsible for the content or
maintenance of third-party Web sites referred to herein. This document is for informational purposes
only and may not be distributed to third parties. Sage MAKES NO WARRANTIES, EXPRESSED OR
IMPLIED, IN THIS DOCUMENT.
18
Page 19

Sage ERP Solutions
19
Page 20

The information contained in this material represents the views of Sage on the issues discussed herein current as of the date of publication.
As market conditions are always subject to change, the information contained herein shall not be interpreted as any commitment from
Sage. This material is for informational purposes only and Sage makes no warranties, expressed or implied.
Sage
13888 Wireless Way, Suite 120
Richmond, BC
V6V 0A3
604-207-9480
www.SageNorthAmerica.com
©2009 Sage Software, Inc. All rights reserved. Sage, the Sage logos, and the Sage product and service names mentioned herein are
registered trademarks of Sage Software, Inc., or its affiliated entities. All other trademarks are the property of their respective owners.
10-20175 11/09
 Loading...