

Page 1
R&S®VSE-K10x (LTE Uplink)
LTE Uplink Measurements
User Manual
(;Úçï2)
1176899702
User Manual
Version 06
Page 2

This manual applies to the following software, version 1.50 and later:
●
R&S®VSE Enterprise Edition base software (1320.7500.xx / 1320.7951.xx)
●
R&S®VSE Basic Edition base software (1345.1011.06)
This manual describes functionality of the following R&S®VSE options:
●
R&S®VSE-K100 LTE FDD Measurement Application (1320.7545K02)
●
R&S®VSE-K102 LTE Advanced and MIMO Measurement Application (1320.7551K02)
●
R&S®VSE-K104 LTE FDD Measurement Application (1320.7568K02)
© 2018 Rohde & Schwarz GmbH & Co. KG
Mühldorfstr. 15, 81671 München, Germany
Phone: +49 89 41 29 - 0
Fax: +49 89 41 29 12 164
Email: info@rohde-schwarz.com
Internet: www.rohde-schwarz.com
Subject to change – Data without tolerance limits is not binding.
R&S® is a registered trademark of Rohde & Schwarz GmbH & Co. KG.
Trade names are trademarks of the owners.
1176.8997.02 | Version 06 | R&S®VSE-K10x (LTE Uplink)
Throughout this manual, products from Rohde & Schwarz are indicated without the ® symbol , e.g. R&S®VSE is indicated as
R&S VSE.
Page 3

R&S®VSE-K10x (LTE Uplink)
Contents
1 Preface.................................................................................................... 7
1.1 About this Manual......................................................................................................... 7
1.2 Documentation Overview............................................................................................. 7
1.3 Typographical Conventions......................................................................................... 8
2 Welcome to the LTE measurement application.................................10
2.1 Starting the LTE measurement application.............................................................. 10
2.2 Understanding the Display Information.................................................................... 11
3 Measurement Basics........................................................................... 13
3.1 Symbols and Variables...............................................................................................13
3.2 Overview...................................................................................................................... 14
Contents
3.3 The LTE Uplink Analysis Measurement Application................................................14
3.3.1 Synchronization.............................................................................................................15
3.3.2 Analysis.........................................................................................................................16
3.4 Performing Time Alignment Measurements.............................................................18
3.5 SRS EVM Calculation..................................................................................................19
4 Measurements and Result Displays...................................................21
4.1 Selecting Measurements............................................................................................ 21
4.2 Selecting Result Displays.......................................................................................... 21
4.3 Performing Measurements.........................................................................................22
4.4 I/Q Measurements....................................................................................................... 23
4.5 Time Alignment Error Measurements....................................................................... 37
5 Configuration........................................................................................40
5.1 Configuration Overview..............................................................................................40
5.2 Configuring I/Q Measurements..................................................................................42
5.2.1 Defining Signal Characteristics..................................................................................... 43
5.2.2 Configuring MIMO Setups.............................................................................................49
5.2.3 Configuring Subframes................................................................................................. 51
5.2.4 Defining Global Signal Characteristics..........................................................................57
5.2.5 Configuring the Demodulation Reference Signal.......................................................... 58
5.2.6 Configuring the Sounding Reference Signal................................................................. 60
3User Manual 1176.8997.02 ─ 06
Page 4

R&S®VSE-K10x (LTE Uplink)
5.2.7 Defining the PUSCH Structure......................................................................................64
5.2.8 Defining the PUCCH Structure......................................................................................65
5.2.9 Defining the PRACH Structure......................................................................................68
5.2.10 Selecting the Input and Output Source......................................................................... 70
5.2.11 Defining the Frequency................................................................................................. 74
5.2.12 Defining Level Characteristics.......................................................................................75
5.2.13 Configuring the Data Capture....................................................................................... 77
5.2.14 Triggering Measurements............................................................................................. 78
5.2.15 Tracking.........................................................................................................................80
5.2.16 Signal Demodulation..................................................................................................... 81
5.3 Configuring Time Alignment Error Measurements..................................................83
6 Analysis................................................................................................ 84
Contents
6.1 Configuring Tables / Numerical Results................................................................... 84
6.2 Exporting Measurement Results............................................................................... 84
6.3 Evaluation Range........................................................................................................ 85
6.4 Scale.............................................................................................................................88
6.5 Result Settings............................................................................................................ 88
6.6 Markers........................................................................................................................ 90
7 Remote Control.................................................................................... 92
7.1 Common Suffixes........................................................................................................92
7.2 Introduction................................................................................................................. 93
7.2.1 Conventions used in Descriptions.................................................................................93
7.2.2 Long and Short Form.................................................................................................... 94
7.2.3 Numeric Suffixes........................................................................................................... 94
7.2.4 Optional Keywords........................................................................................................ 95
7.2.5 Alternative Keywords.................................................................................................... 95
7.2.6 SCPI Parameters.......................................................................................................... 95
7.3 Remote Commands to Select the LTE Application.................................................. 98
7.4 Configuring the Screen Layout..................................................................................98
7.4.1 General Layout..............................................................................................................98
7.4.2 Configuring the Layout over all Channels..................................................................... 99
7.4.3 Configuring the Layout of a Channel...........................................................................103
7.5 Remote Commands to Read Trace Data.................................................................109
4User Manual 1176.8997.02 ─ 06
Page 5

R&S®VSE-K10x (LTE Uplink)
7.5.1 Using the TRACe[:DATA] Command...........................................................................109
7.5.2 Remote Commands to Read Measurement Results...................................................120
7.6 Remote Commands to Read Numeric Results.......................................................121
7.6.1 Frame Results.............................................................................................................121
7.6.2 Result for Selection..................................................................................................... 125
7.6.3 Time Alignment Error.................................................................................................. 130
7.6.4 Marker Table............................................................................................................... 131
7.6.5 CCDF Table.................................................................................................................134
7.7 Remote Commands to Read Limit Check Results.................................................136
7.7.1 Checking Limits for Numerical Result Display............................................................ 136
7.8 Remote Commands to Configure the Application................................................. 145
7.8.1 General Configuration................................................................................................. 145
7.8.2 Configuring I/Q Measurements................................................................................... 146
Contents
7.8.3 Configuring Time Alignment Measurements............................................................... 196
7.9 Analysis..................................................................................................................... 197
7.9.1 Evaluation Range........................................................................................................197
7.9.2 Y-Axis Scale................................................................................................................ 201
7.9.3 Result Settings............................................................................................................ 202
7.9.4 Markers....................................................................................................................... 204
Annex.................................................................................................. 211
A Annex: Reference...............................................................................211
A.1 Menu Reference.........................................................................................................211
A.1.1 Common R&S VSE Menus..........................................................................................211
A.1.2 LTE Measurement Menus........................................................................................... 213
A.2 Reference of Toolbar Functions.............................................................................. 215
List of Commands..............................................................................219
Index....................................................................................................225
5User Manual 1176.8997.02 ─ 06
Page 6

R&S®VSE-K10x (LTE Uplink)
Contents
6User Manual 1176.8997.02 ─ 06
Page 7

R&S®VSE-K10x (LTE Uplink)
1 Preface
1.1 About this Manual
This User Manual describes information specific to measurements in the LTE measurement application. All other applications are described in the corresponding appli-
cation manuals.
The main focus in this manual is on the measurement results and the tasks required to
obtain them. The following topics are included:
●
Welcome to the R&S VSE
Introduction to and getting familiar with the software
●
Measurements and Results
Descriptions of the measurement types available in the R&S VSE software
●
Controlling Instruments and Capturing I/Q Data
Methods of data acquisition and description of basic instrument control functions
●
LTE Measurements
Description of the settings and functions provided to analyze results with the software and the corresponding remote control commands
●
Remote Commands for LTE Measurements
Remote commands required to configure and perform measurements in a remote
environment, sorted by tasks
Remote commands required to set up the environment and to perform common
tasks in the software, sorted by tasks
Programming examples demonstrate the use of many commands and can usually
be executed directly for test purposes
●
List of Commands
Alphabetical list of all remote commands described in the manual
●
Index
Preface
Documentation Overview
1.2 Documentation Overview
The user documentation for the R&S VSE consists of the following parts:
●
"Getting Started" printed manual
●
Online Help system in the software
●
CD-ROM including the following documentation:
– Getting Started
– User Manuals for base software and options
– Service Manual
– Release Notes
– Data sheet and product brochures
7User Manual 1176.8997.02 ─ 06
Page 8

R&S®VSE-K10x (LTE Uplink)
Online Help
The Online Help is embedded in the software. It offers quick, context-sensitive access
to the complete information needed for operation and programming. Online help is
available using the icon on the toolbar of the R&S VSE.
Getting Started
This manual is delivered with the software in printed form and in PDF format on the
CD. It provides the information needed to set up and start working with the software.
Basic operations and handling are described. Safety information is also included.
User Manuals
User manuals are provided for the base software and each additional (software)
option.
The user manuals are available in PDF format - in printable form - on the CD-ROM
delivered with the software. In the user manuals, all software functions are described in
detail. Furthermore, they provide a complete description of the remote control commands with programming examples.
Preface
Typographical Conventions
The user manual for the base software provides basic information on operating the
R&S VSE in general, and the I/Q Analyzer application in particular. Furthermore, the
software functions that enhance the basic functionality for various applications are
described here. An introduction to remote control is provided, as well as information on
troubleshooting.
In the individual application manuals, the specific software functions of the application
are described in detail. For additional information on default settings and parameters,
refer to the data sheets. Basic information on operating the R&S VSE is not included in
the application manuals.
Release Notes
The release notes describe the installation of the software, new and modified functions,
eliminated problems, and last minute changes to the documentation. The corresponding software version is indicated on the title page of the release notes.
Application Notes
Application notes, application cards, white papers and educational notes are further
publications that provide more comprehensive descriptions and background information. The latest versions are available for download from the Rohde & Schwarz website, at www.rohde-schwarz.com/appnote/.
1.3 Typographical Conventions
The following text markers are used throughout this documentation:
8User Manual 1176.8997.02 ─ 06
Page 9
R&S®VSE-K10x (LTE Uplink)
Convention Description
Preface
Typographical Conventions
"Graphical user interface elements"
[Keys] Key and knob names are enclosed by square brackets.
File names, commands,
program code
Input Input to be entered by the user is displayed in italics.
Links Links that you can click are displayed in blue font.
"References" References to other parts of the documentation are enclosed by quota-
All names of graphical user interface elements on the screen, such as
dialog boxes, menus, options, buttons, and softkeys are enclosed by
quotation marks.
File names, commands, coding samples and screen output are distinguished by their font.
tion marks.
9User Manual 1176.8997.02 ─ 06
Page 10
R&S®VSE-K10x (LTE Uplink)
2 Welcome to the LTE measurement applica-
tion
The LTE measurement application is a firmware application that adds functionality to
perform measurements on LTE signals according to the 3GPP standard to the
R&S VSE.
This user manual contains a description of the functionality that the application provides, including remote control operation. Functions that are not discussed in this manual are the same as in the Spectrum application and are described in the R&S VSE
User Manual. The latest versions of the manuals are available for download at the
product homepage.
http://www2.rohde-schwarz.com/product/vse.html.
● Starting the LTE measurement application............................................................. 10
● Understanding the Display Information................................................................... 11
Welcome to the LTE measurement application
Starting the LTE measurement application
2.1 Starting the LTE measurement application
The LTE measurement application adds a new application to the R&S VSE.
To open the LTE application
1.
Select the "Add Channel" function in the Sequence tool window.
A dialog box opens that contains all operating modes and applications currently
available in your R&S VSE.
2. Select the "LTE" item.
The R&S VSE opens a new measurement channel for the LTE application.
The application is started with the default settings. It can be configured in the "Overview" dialog box, which is displayed when you select the "Overview" softkey from the
"Meas Setup" menu.
For more information see Chapter 5, "Configuration", on page 40.
10User Manual 1176.8997.02 ─ 06
Page 11
R&S®VSE-K10x (LTE Uplink)
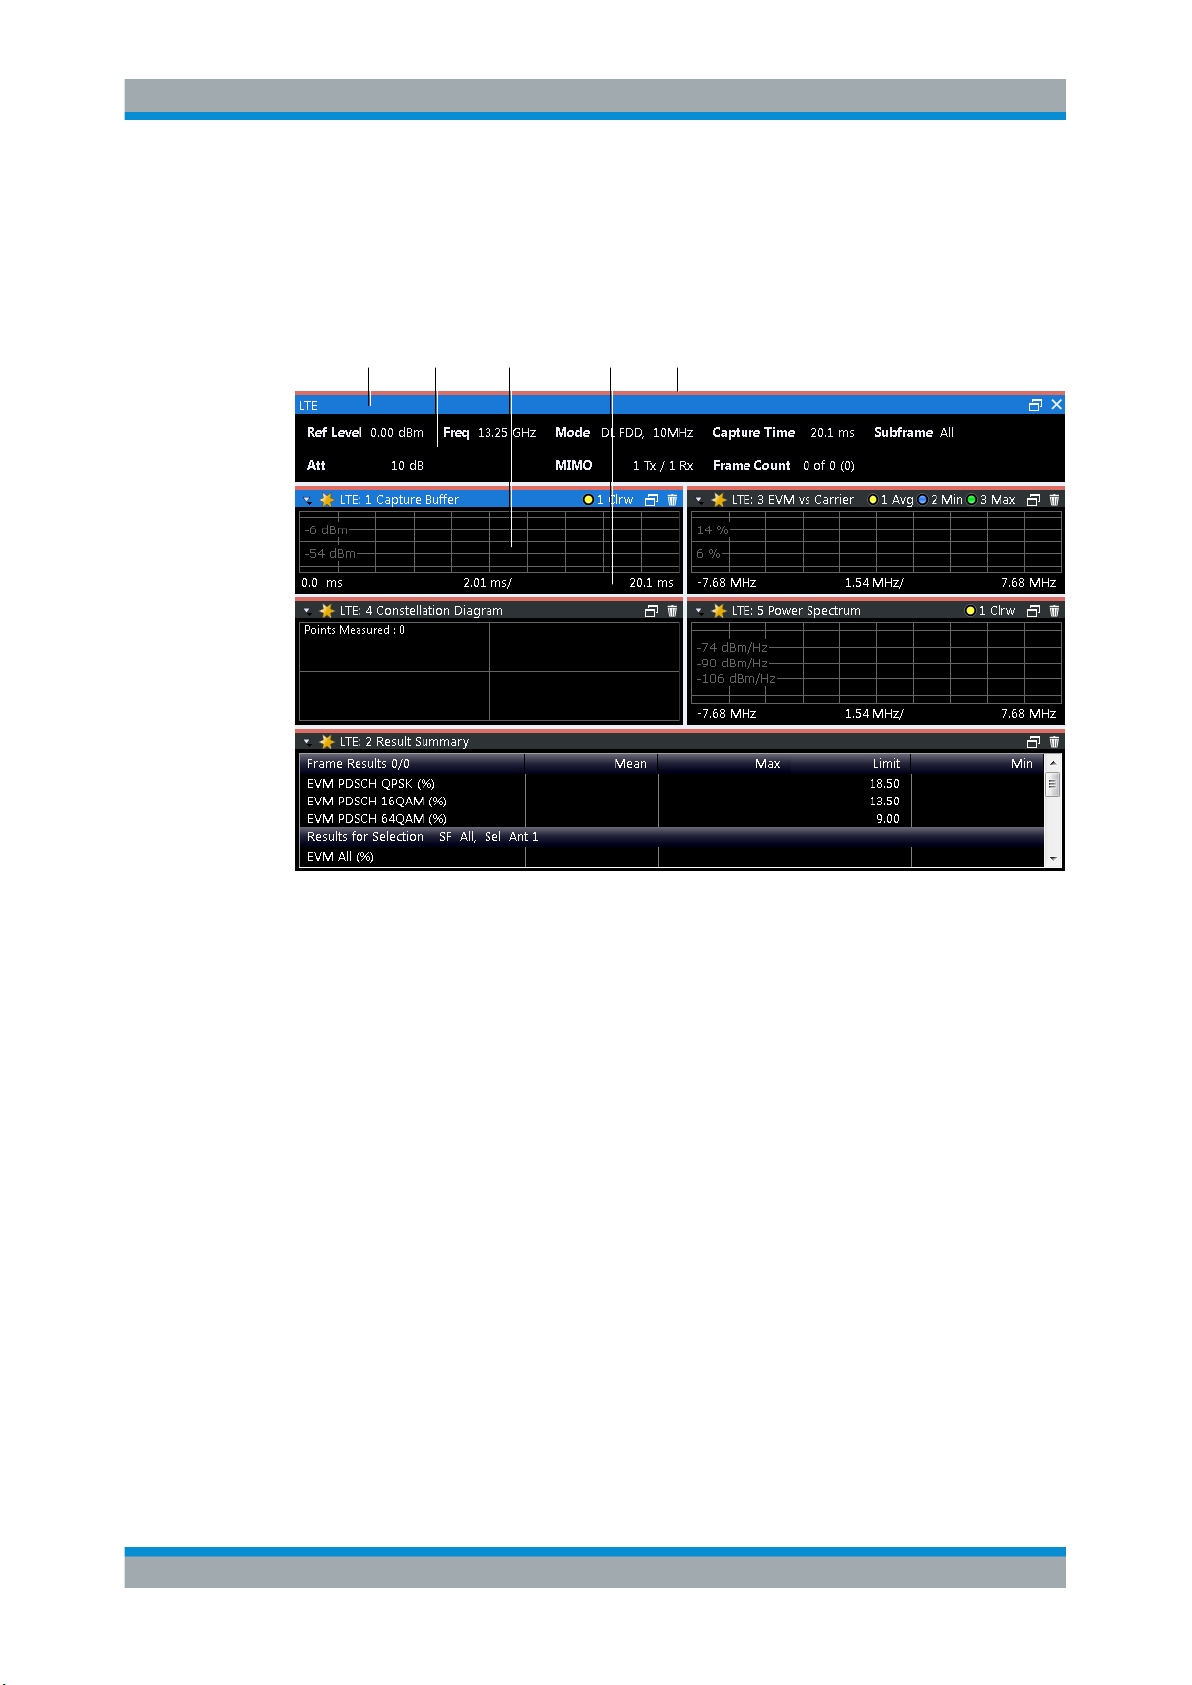
2.2 Understanding the Display Information
The following figure shows a measurement diagram during analyzer operation. All different information areas are labeled. They are explained in more detail in the following
sections.
1 2 3 4 5
Welcome to the LTE measurement application
Understanding the Display Information
1 = Window title bar with information about the diagram and its traces
2 = Channel bar with measurement settings
3 = Diagram area
4 = Diagram footer with information about the contents of the diagram
5 = Color code for windows of the same channel (here: red)
Channel bar information
In the LTE measurement application, the R&S VSE shows the following settings:
Table 2-1: Information displayed in the channel bar in the LTE measurement application
Ref Level Reference level
Att Mechanical and electronic RF attenuation
Freq Frequency
Mode LTE standard
MIMO Number of Tx and Rx antennas in the measurement setup
Capture Time Signal length that has been captured
Frame Count Number of frames that have been captured
Selected Slot Slot considered in the signal analysis
Selected Subframe Subframe considered in the signal analysis
11User Manual 1176.8997.02 ─ 06
Page 12

R&S®VSE-K10x (LTE Uplink)
In addition, the channel bar also displays information on instrument settings that affect
the measurement results even though this is not immediately apparent from the display
of the measured values (e.g. transducer or trigger settings). This information is displayed only when applicable for the current measurement. For details see the
R&S VSE Getting Started manual.
Window title bar information
The information in the window title bar depends on the result display.
The "Constellation Diagram", for example, shows the number of points that have been
measured.
Status bar information
Global instrument settings, the instrument status and any irregularities are indicated in
the status bar beneath the diagram. Furthermore, the progress of the current operation
is displayed in the status bar.
Regarding the synchronization state, the application shows the following labels.
●
Sync OK
The synchronization was successful. The status bar is green.
●
Sync Failed
The synchronization was not successful. The status bar is red.
There can be three different synchronization errors.
– Sync Failed (Cyclic Prefix): The cyclic prefix correlation failed.
– Sync Failed (P-SYNC): The P-SYNC correlation failed.
– Sync Failed (S-SYNC): The S-SYNC correlation failed.
Welcome to the LTE measurement application
Understanding the Display Information
12User Manual 1176.8997.02 ─ 06
Page 13

R&S®VSE-K10x (LTE Uplink)
3 Measurement Basics
● Symbols and Variables............................................................................................13
● Overview................................................................................................................. 14
● The LTE Uplink Analysis Measurement Application................................................14
● Performing Time Alignment Measurements............................................................18
● SRS EVM Calculation............................................................................................. 19
3.1 Symbols and Variables
The following chapters use various symbols and variables in the equations that the
measurements are based on. The table below explains these symbols for a better
understanding of the measurement principles.
Measurement Basics
Symbols and Variables
a
l,kâl,k
A
l,k
Δf, Δ
coarse
Δf
res
ζ
H
l,k, l,k
i time index
î
, î
coarse
fine
k subcarrier index
l SC-FDMA symbol index
N
DS
N
FFT
N
g
N
s
N
TX
data symbol (actual, decided)
data symbol after DFT-precoding
carrier frequency offset between transmitter and
receiver (actual, coarse estimate)
residual carrier frequency offset
relative sampling frequency offset
channel transfer function (actual, estimate)
timing estimate (coarse, fine)
number of SC-FDMA data symbols
length of FFT
number of samples in cyclic prefix (guard interval)
number of Nyquist samples
number of allocated subcarriers
N
k,l
n index of modulated QAM symbol before DFT pre-
Φ
l
r
i
R'
k,l
noise sample
coding
common phase error
received sample in the time domain
uncompensated received sample in the frequency
domain
13User Manual 1176.8997.02 ─ 06
Page 14
R&S®VSE-K10x (LTE Uplink)
Measurement Basics
The LTE Uplink Analysis Measurement Application
r
n,l
T duration of the useful part of an SC-FDMA symbol
T
g
T
s
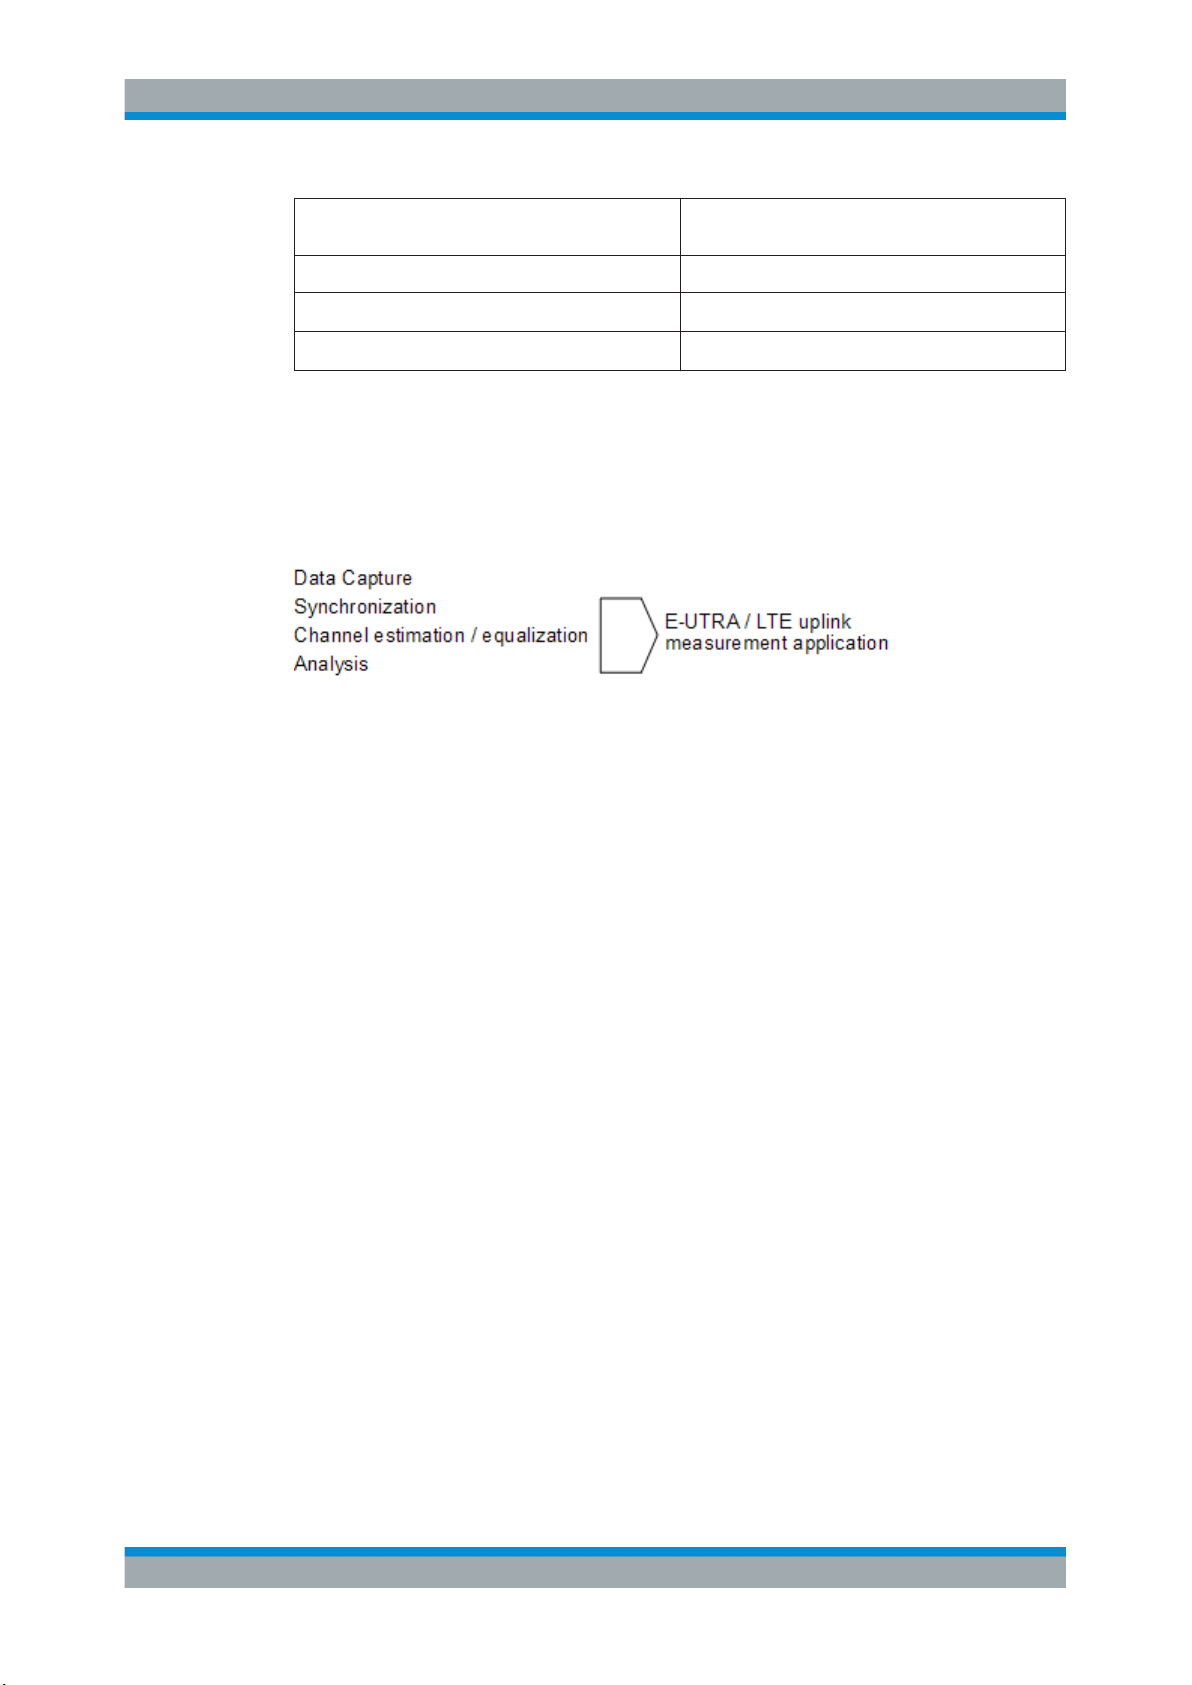
3.2 Overview
The digital signal processing (DSP) involves several stages until the software can present results like the EVM.
The contents of this chapter are structured like the DSP.
equalized received symbols of measurement path
after IDFT
duration of the guard interval
total duration of SC-FDMA symbol
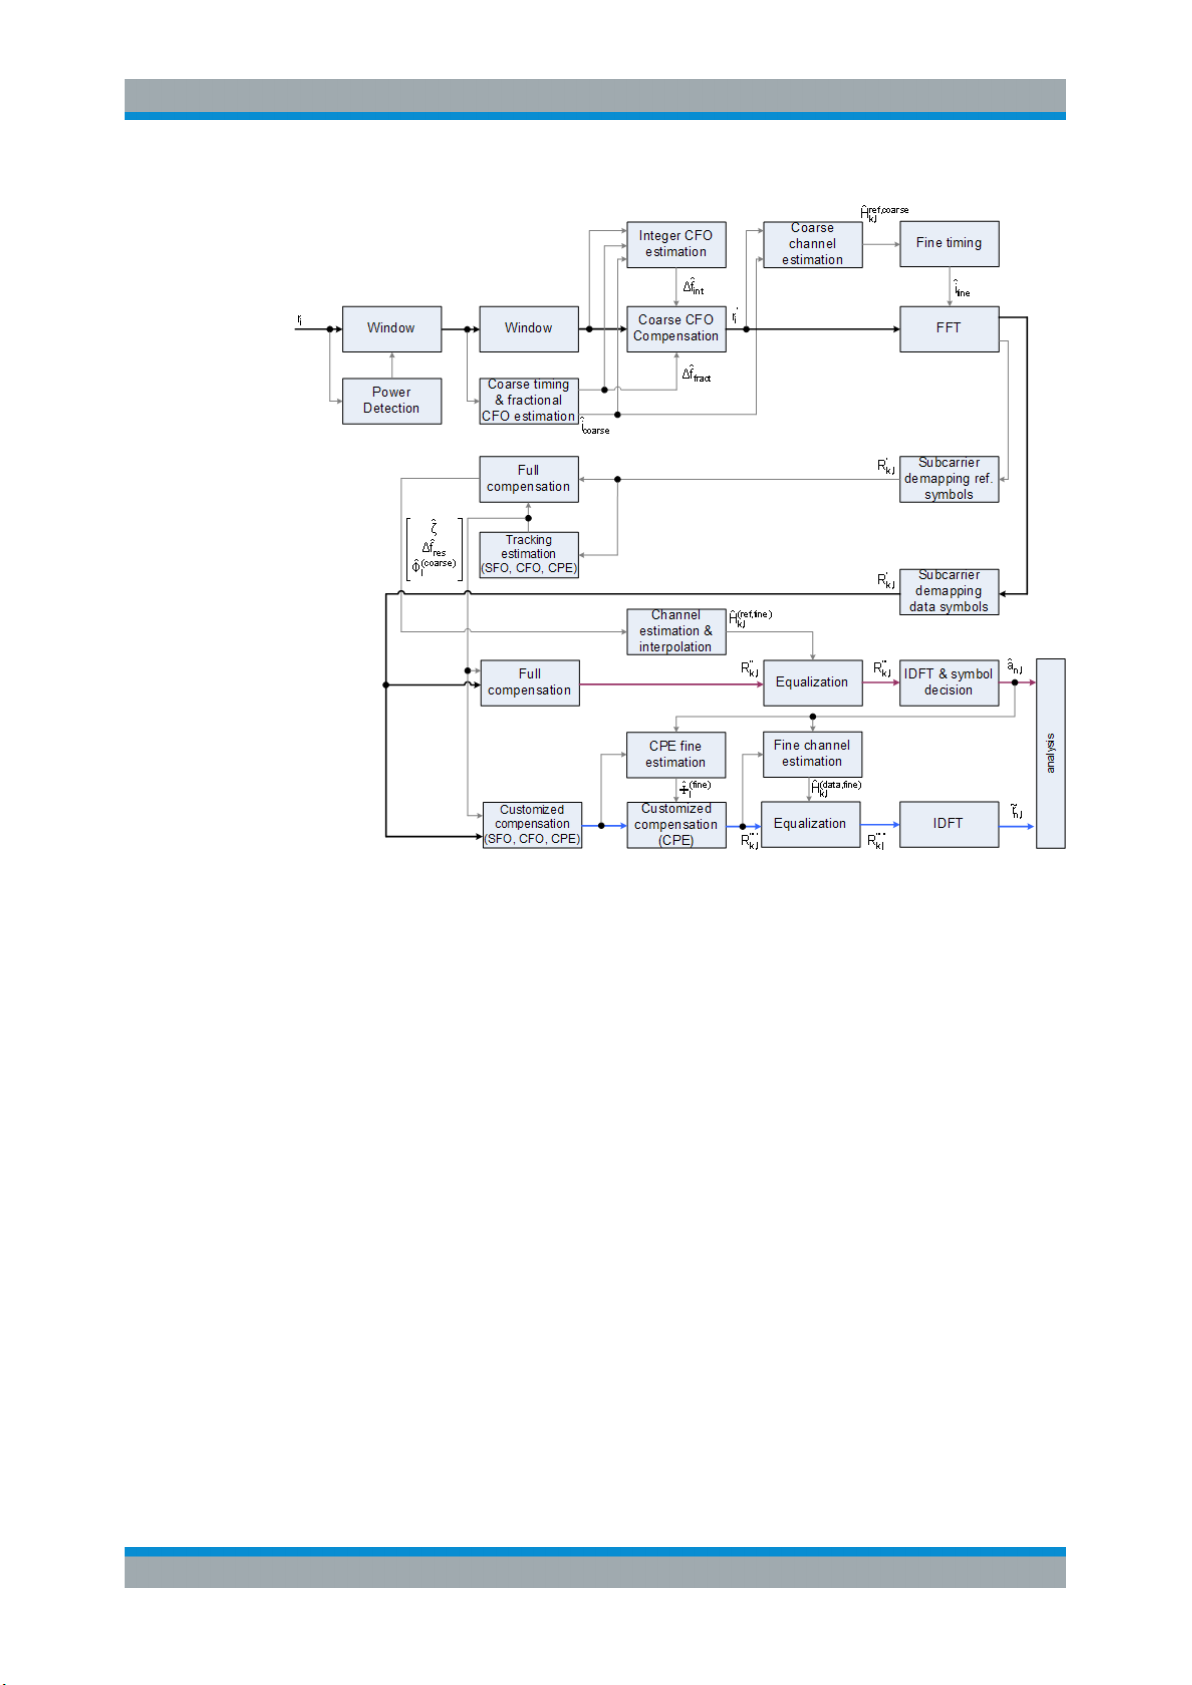
3.3 The LTE Uplink Analysis Measurement Application
The block diagram in Figure 3-1 shows the general structure of the LTE uplink measurement application from the capture buffer containing the I/Q data up to the actual
analysis block.
After synchronization a fully compensated signal is produced in the reference path
(purple) which is subsequently passed to the equalizer. An IDFT of the equalized symbols yields observations for the QAM transmit symbols a
mates â
are obtained via hard decision. Likewise a user defined compensation as
n,l
well as equalization is carried out in the measurement path (cyan) and after an IDFT
the observations of the QAM transmit symbols are provided. Accordingly, the measurement path might still contain impairments which are compensated in the reference
path. The symbols of both signal processing paths form the basis for the analysis.
from which the data esti-
n.l
14User Manual 1176.8997.02 ─ 06
Page 15
R&S®VSE-K10x (LTE Uplink)
Measurement Basics
The LTE Uplink Analysis Measurement Application
Figure 3-1: Block diagram for the LTE UL measurement application
3.3.1 Synchronization
In a first step the areas of sufficient power are identified within the captured I/Q data
stream which consists of the receive samples ri. For each area of sufficient power, the
analyzer synchronizes on subframes of the uplink generic frame structure [3]. After this
coarse timing estimation, the fractional part as well as the integer part of the carrier frequency offset (CFO) are estimated and compensated. In order to obtain an OFDM
demodulation via FFT of length N
lished which refines the coarse timing estimate.
A phase tracking based on the reference SC-FDMA symbols is performed in the frequency domain. The corresponding tracking estimation block provides estimates for
●
the relative sampling frequency offset ζ
●
the residual carrier frequency offset Δf
●
the common phase error Φ
According to references [7] and [8], the uncompensated samples R'
ded domain can be stated as
that is not corrupted by ISI, a fine timing is estab-
FFT
res
l
in the DFT-preco-
k,l
15User Manual 1176.8997.02 ─ 06
Page 16
R&S®VSE-K10x (LTE Uplink)
lk
lTfNNjlkNNjj
lklklk
NeeeHAR
CFOres
resFFTS
SFO
FFTS
CPE
l
,
22
,,
'
,
.
2
,
,,
,
ˆ
~
ln
lnln
kl
aE
ar
EVM
lnlnln
arEVM
,,,
ˆ
~
Equation 3-1:
with
●
the DFT precoded data symbol A
●
the channel transfer function H
●
the number of Nyquist samples NS within the total duration TS,
●
the duration of the useful part of the SC-FDMA symbol T=TS-T
●
the independent and Gaussian distributed noise sample N
Within one SC-FDMA symbol, both the CPE and the residual CFO cause the same
phase rotation for each subcarrier, while the rotation due to the SFO depends linearly
on the subcarrier index. A linear phase increase in symbol direction can be observed
for the residual CFO as well as for the SFO.
Measurement Basics
The LTE Uplink Analysis Measurement Application
on subcarrier k at SC-FDMA symbol l,
k,l
,
k,l
g
k,l
The results of the tracking estimation block are used to compensate the samples R'
completely in the reference path and according to the user settings in the measure-
ment path. Thus the signal impairments that are of interest to the user are left uncompensated in the measurement path.
After having decoded the data symbols in the reference path, an additional data-aided
phase tracking can be utilized to refine the common phase error estimation.
3.3.2 Analysis
The analysis block of the EUTRA/LTE uplink measurement application allows to compute a variety of measurement variables.
EVM
The most important variable is the error vector magnitude which is defined as
Equation 3-2:
for QAM symbol n before precoding and SC-FDMA symbol l. Since the normalized
average power of all possible constellations is 1, the equation can be simplified to
k,l
Equation 3-3:
The average EVM of all data subcarriers is then
16User Manual 1176.8997.02 ─ 06
Page 17

R&S®VSE-K10x (LTE Uplink)
101
0
2
,
1
LB TX
NlN
n
ln
TXDS
data
EVM
NN
EVM
tsjQtsItr
|1|balancegain modulator Q
}1arg{mismatch quadrature Q
S
RB
Tt
Nc
c
RBS
RBabsolute
RBrelative
ftY
NT
Emissions
Emissions
112
2
,
1
Equation 3-4:
for NDS SC-FDMA data symbols and the NTX allocated subcarriers.
I/Q imbalance
The I/Q imbalance contained in the continuous received signal r(t) can be written as
Equation 3-5:
where s(t) is the transmit signal and I and Q are the weighting factors describing the
I/Q imbalance. We define that I:=1 and Q:=1+ΔQ.
The I/Q imbalance estimation makes it possible to evaluate the
Measurement Basics
The LTE Uplink Analysis Measurement Application
Equation 3-6:
and the
Equation 3-7:
based on the complex-valued estimate .
Basic in-band emissions measurement
The in-band emissions are a measure of the interference falling into the non-allocated
resources blocks.
The relative in-band emissions are given by
Equation 3-8:
where TS is a set |TS| of SC-FDMA symbols with the considered modulation scheme
being active within the measurement period, ΔRB is the starting frequency offset
between the allocated RB and the measured non-allocated RB (e.g. ΔRB=1 or ΔRB=-1
for the first adjacent RB), c is the lower edge of the allocated BW, and Y(t,f) is the fre-
quency domain signal evaluated for in-band emissions. NRB is the number of allocated
RBs .
The basic in-band emissions measurement interval is defined over one slot in the time
domain.
17User Manual 1176.8997.02 ─ 06
Page 18
R&S®VSE-K10x (LTE Uplink)
Other measurement variables
Without going into detail, the EUTRA/LTE uplink measurement application additionally
provides the following results:
●
Total power
●
Constellation diagram
●
Group delay
●
I/Q offset
●
Crest factor
●
Spectral flatness
3.4 Performing Time Alignment Measurements
The measurement application allows you to perform time alignment measurements
between different antennas.
Measurement Basics
Performing Time Alignment Measurements
The measurement supports setups of up to two Tx antennas.
The result of the measurement is the time alignment error. The time alignment error is
the time offset between a reference antenna (for example antenna 1) and another
antenna.
The time alignment error results are summarized in the corresponding result display.
A schematic description of the results is provided in Figure 3-2.
Tx Antenna 1 (Reference)
Time
Tx Antenna 2
LTE Frame Start Indicator
Figure 3-2: Time Alignment Error (2 Tx antennas)
Time Alignment Error
Δ2,1
Time
Test setup
Successful Time Alignment measurements require a correct test setup.
A typical test setup is shown in Figure 3-3.
18User Manual 1176.8997.02 ─ 06
Page 19
R&S®VSE-K10x (LTE Uplink)
Tx Ant 1
DUT
Tx Ant 2
Figure 3-3: Hardware setup
For best measurement result accuracy, it is recommended to use cables of the same
length and identical combiners as adders.
In the application, make sure to correctly apply the following settings.
●
Select a reference antenna in the MIMO Configuration dialog box (not "All")
●
Select more than one antenna in the MIMO Configuration dialog box
●
Select Codeword-to-Layer mapping "2/1" or "2/2"
●
Select an Auto Demodulation different to "Subframe Configuration & DMRS"
●
The transmit signals of all available Tx antennas have to be added together
Measurement Basics
SRS EVM Calculation
FSx
+
3.5 SRS EVM Calculation
In order to calculate an accurate EVM, a channel estimation needs to be done prior to
the EVM calculation. However, the channel estimation requires a minimum of two
resource elements containing reference symbols on a subcarrier. Depending on the
current Channel Estimation Range setting, this means that either at least two reference
symbols ("Pilot Only") or one reference symbol and at least one data symbol ("Pilot
and Payload") need to be available on the subcarrier the EVM is to be measured.
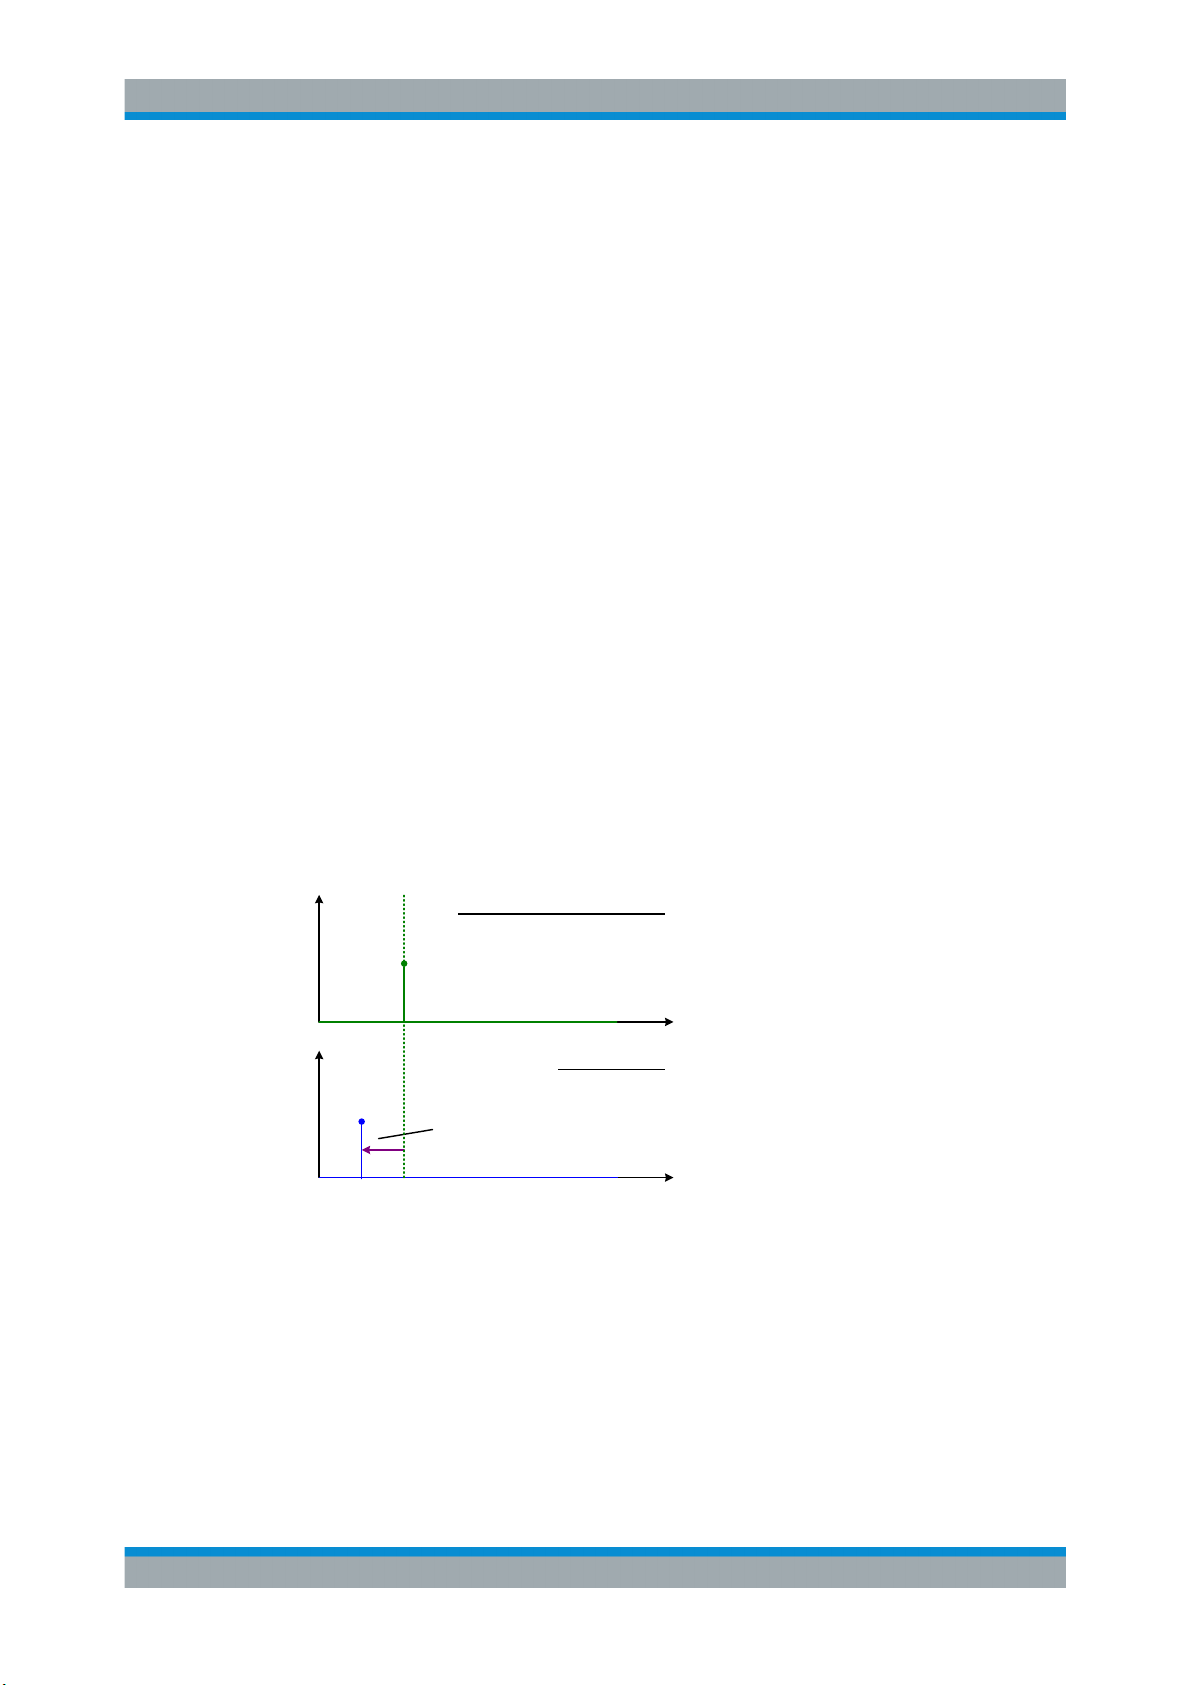
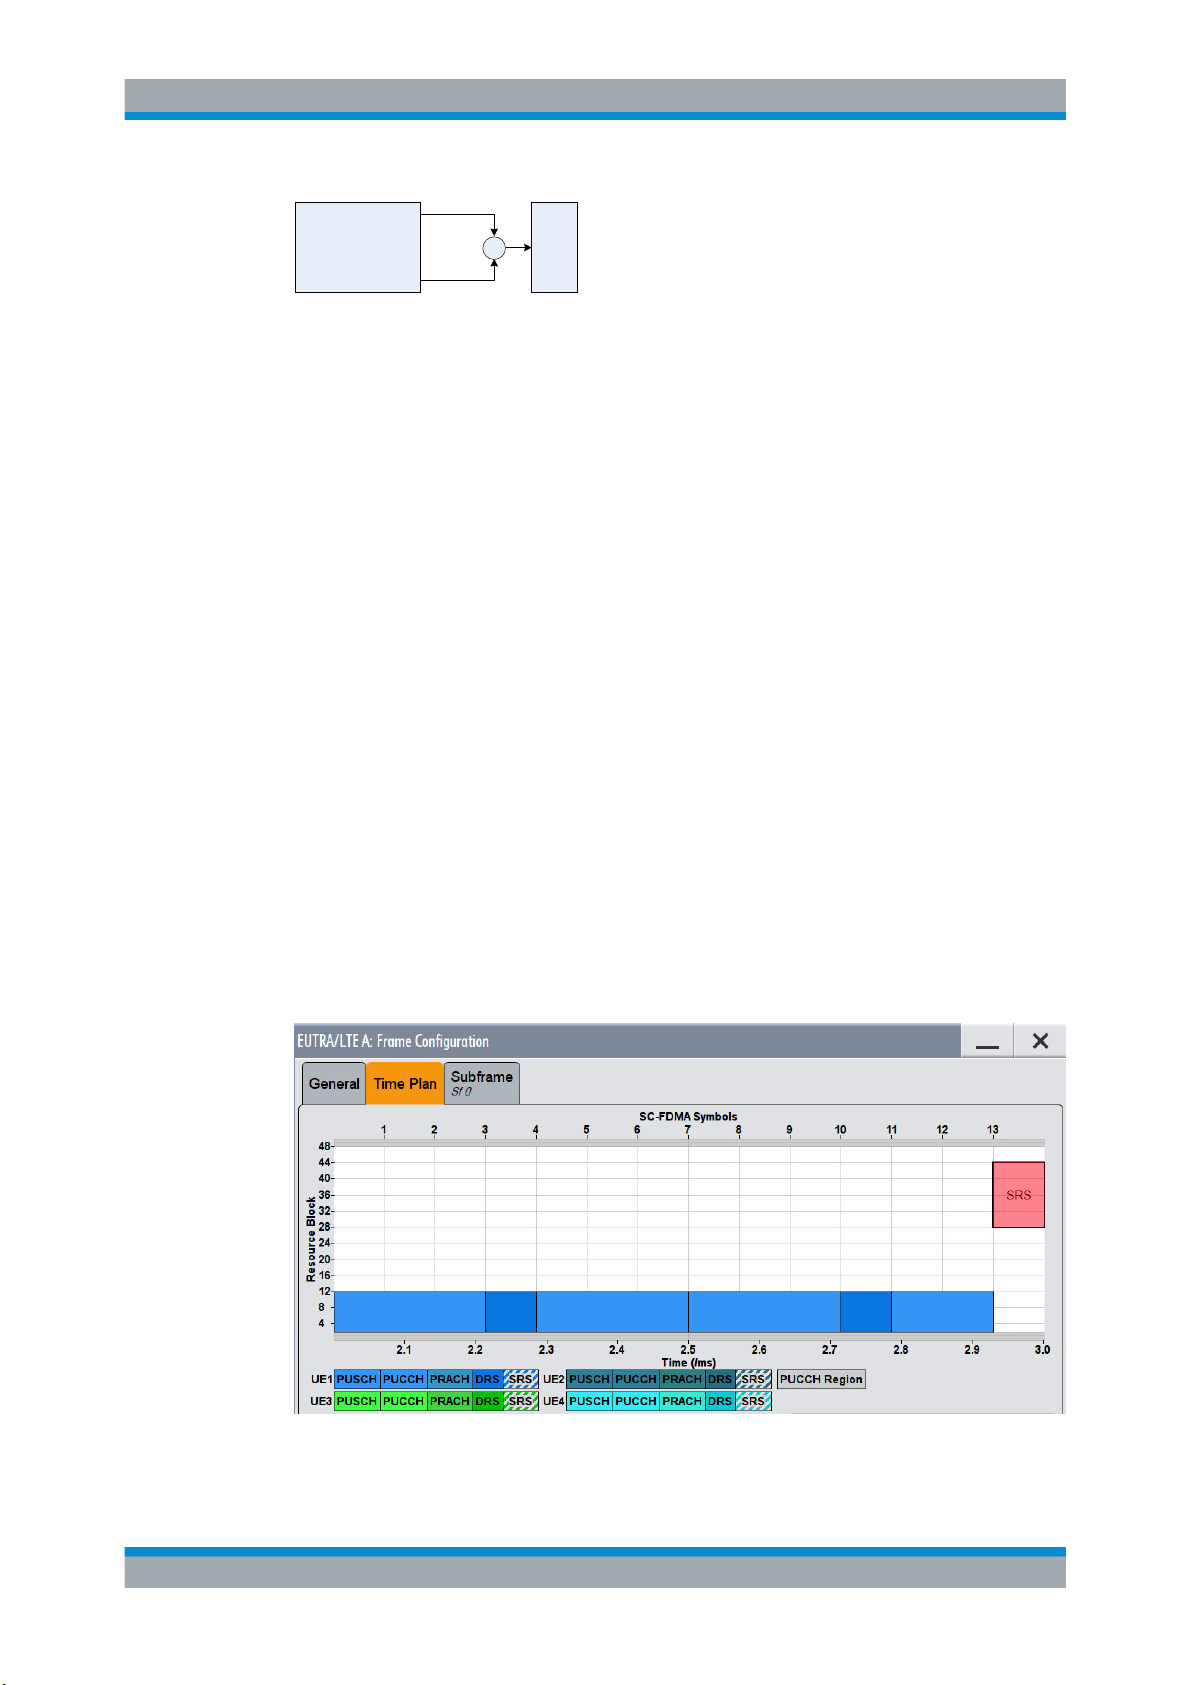
For PUSCH, PUCCH and PRACH regions, these conditions are normally fulfilled
because the DMRS (= Demodulation Reference Signal) is already included. However,
the SRS may also be located on subcarriers which do not occupy any other reference
symbols (see Figure 3-4).
Figure 3-4: No EVM can be measured for the SRS
19User Manual 1176.8997.02 ─ 06
Page 20
R&S®VSE-K10x (LTE Uplink)
In this case it is not reasonable to calculate an EVM and no SRS EVM value will be
displayed for the corresponding subframe.
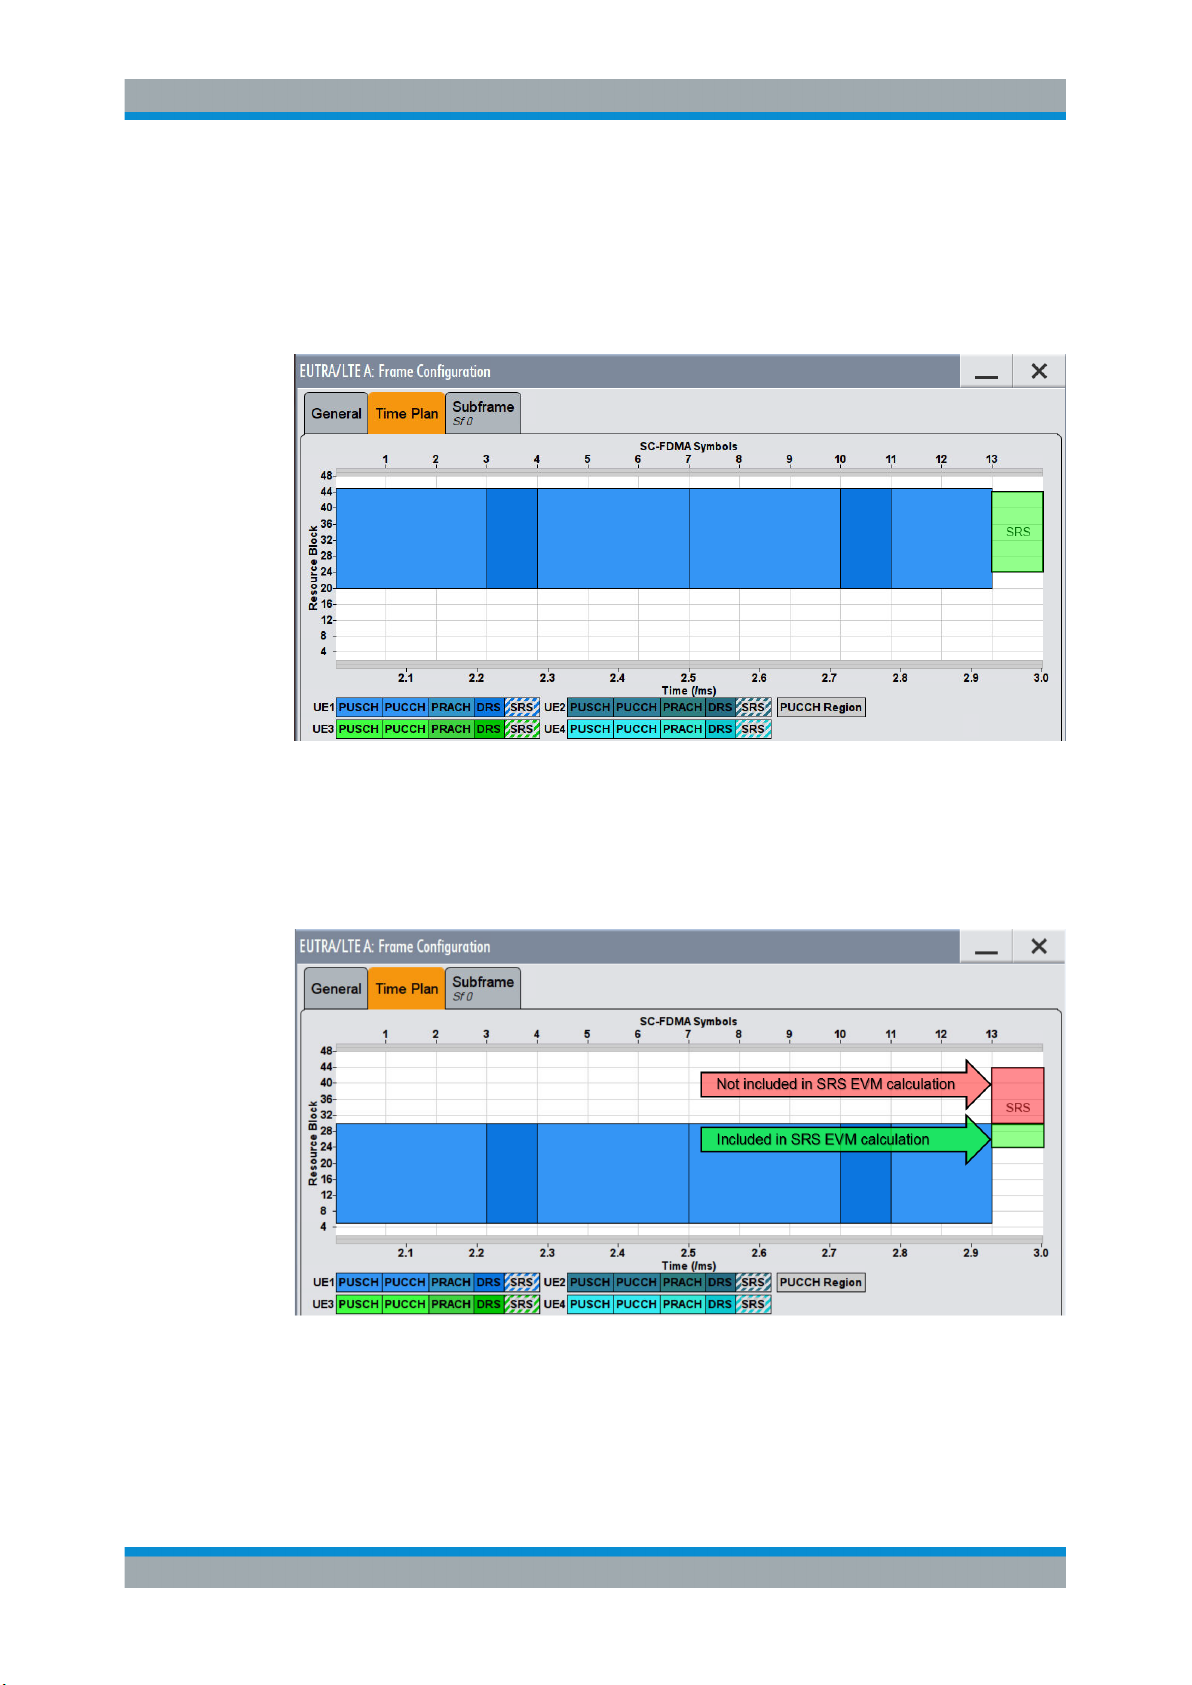
If the SRS subcarriers contain two DMRS symbols (or one DMRS and one PUSCH for
"Pilot and Payload" channel estimation range) the SRS EVM can be measured (see
Figure 3-5).
Measurement Basics
SRS EVM Calculation
Figure 3-5: The EVM of the complete SRS can be measured
The SRS allocation might cover subcarriers which partly fulfill the conditions mentioned
above and partly do not. In this case the EVM value given in the Allocation Summary
will be calculated based only on the subcarriers which fulfill the above requirements
(see Figure 3-6).
Figure 3-6: The EVM for parts of the SRS can be measured
20User Manual 1176.8997.02 ─ 06
Page 21

R&S®VSE-K10x (LTE Uplink)
4 Measurements and Result Displays
The LTE measurement application measures and analyzes various aspects of an LTE
signal.
It features several measurements and result displays. Measurements represent different ways of processing the captured data during the digital signal processing. Result
displays are different representations of the measurement results. They can be diagrams that show the results as a graph or tables that show the results as numbers.
● Selecting Measurements.........................................................................................21
● Selecting Result Displays........................................................................................21
● Performing Measurements......................................................................................22
● I/Q Measurements...................................................................................................23
● Time Alignment Error Measurements..................................................................... 37
4.1 Selecting Measurements
Measurements and Result Displays
Selecting Result Displays
► Select the "Select Meas" menu item from the "Meas Setup" menu.
The application opens a dialog box that contains several buttons.
Each button represents a set of result displays that thematically belong together
and that have a particular display configuration. If these predefined display configurations do not suit your requirements, you can add or remove result displays as
you like. For more information about selecting result displays, see Chapter 4.2,
"Selecting Result Displays", on page 21.
Depending on the button you select, the application changes the way the R&S VSE
captures and processes the raw signal data.
●
When you select "EVM", the application processes the I/Q data of the signal. For
more information on available I/Q result displays, see Chapter 4.4, "I/Q Measure-
ments", on page 23.
When you select one of the result displays available for I/Q measurements, you
can combine the result displays available for I/Q measurements in any way.
Remote command:
CONFigure[:LTE]:MEASurement on page 145
4.2 Selecting Result Displays
► Select the "New Window" menu item from the "Window" menu or select a new win-
dow with the icon in the toolbar. Depending on the number of LTE channels you
21User Manual 1176.8997.02 ─ 06
Page 22

R&S®VSE-K10x (LTE Uplink)
are currently using, there is a submenu that contains all available result displays for
each LTE channel.
In the default state of the application, it shows several conventional result displays.
●
Capture Buffer
●
EVM vs Carrier
●
Power Spectrum
●
Result Summary
●
Constellation Diagram
From that predefined state, add and remove result displays to the channels as you like
from the "Window" menu.
Remote command:
LAYout:ADD[:WINDow]? on page 103
MIMO measurements
When you capture more than one data stream, each result display is made up out of
several tabs.
The first tab shows the results for all data streams. The other tabs show the results for
each individual data stream. By default, the tabs are coupled to one another - if you
select a particular data stream in one display, the application also selects this data
stream in the other result displays (see Subwindow Coupling).
The number of tabs depends on the number of data streams.
Measurements and Result Displays
Performing Measurements
4.3 Performing Measurements
By default, the application measures the signal continuously. In "Continuous Sweep"
mode, the R&S VSE captures and analyzes the data again and again.
●
For I/Q measurements, the amount of captured data depends on the capture time.
●
For frequency sweep measurement, the amount of captured data depends on the
sweep time.
In "Single Sweep" mode, the R&S VSE stops measuring after it has captured the data
once. The amount of data again depends on the capture time.
You can also repeat a measurement based on the data that has already been captured
with the "Refresh" function. Repeating a measurement with the same data can be useful, for example, if you want to apply different modulation settings to the same I/Q data.
For more information, see the documentation of the R&S VSE.
22User Manual 1176.8997.02 ─ 06
Page 23
R&S®VSE-K10x (LTE Uplink)
4.4 I/Q Measurements
Access: "Overview" > "Select Measurement" > "EVM/Frequency Err/Power"
You can select the result displays from the evaluation bar and arrange them as you like
with the SmartGrid functionality.
Capture Buffer...............................................................................................................23
EVM vs Carrier..............................................................................................................24
EVM vs Symbol.............................................................................................................25
EVM vs Subframe......................................................................................................... 26
Power Spectrum............................................................................................................26
Inband Emission............................................................................................................26
Spectrum Flatness........................................................................................................ 27
Spectrum Flatness SRS................................................................................................28
Group Delay..................................................................................................................28
Spectrum Flatness Difference.......................................................................................29
Constellation Diagram...................................................................................................29
CCDF............................................................................................................................ 30
Allocation Summary...................................................................................................... 31
Bit Stream..................................................................................................................... 31
EVM vs Symbol x Carrier..............................................................................................32
Power vs Symbol x Carrier............................................................................................33
Result Summary............................................................................................................33
Marker Table ................................................................................................................ 36
Measurements and Result Displays
I/Q Measurements
Capture Buffer
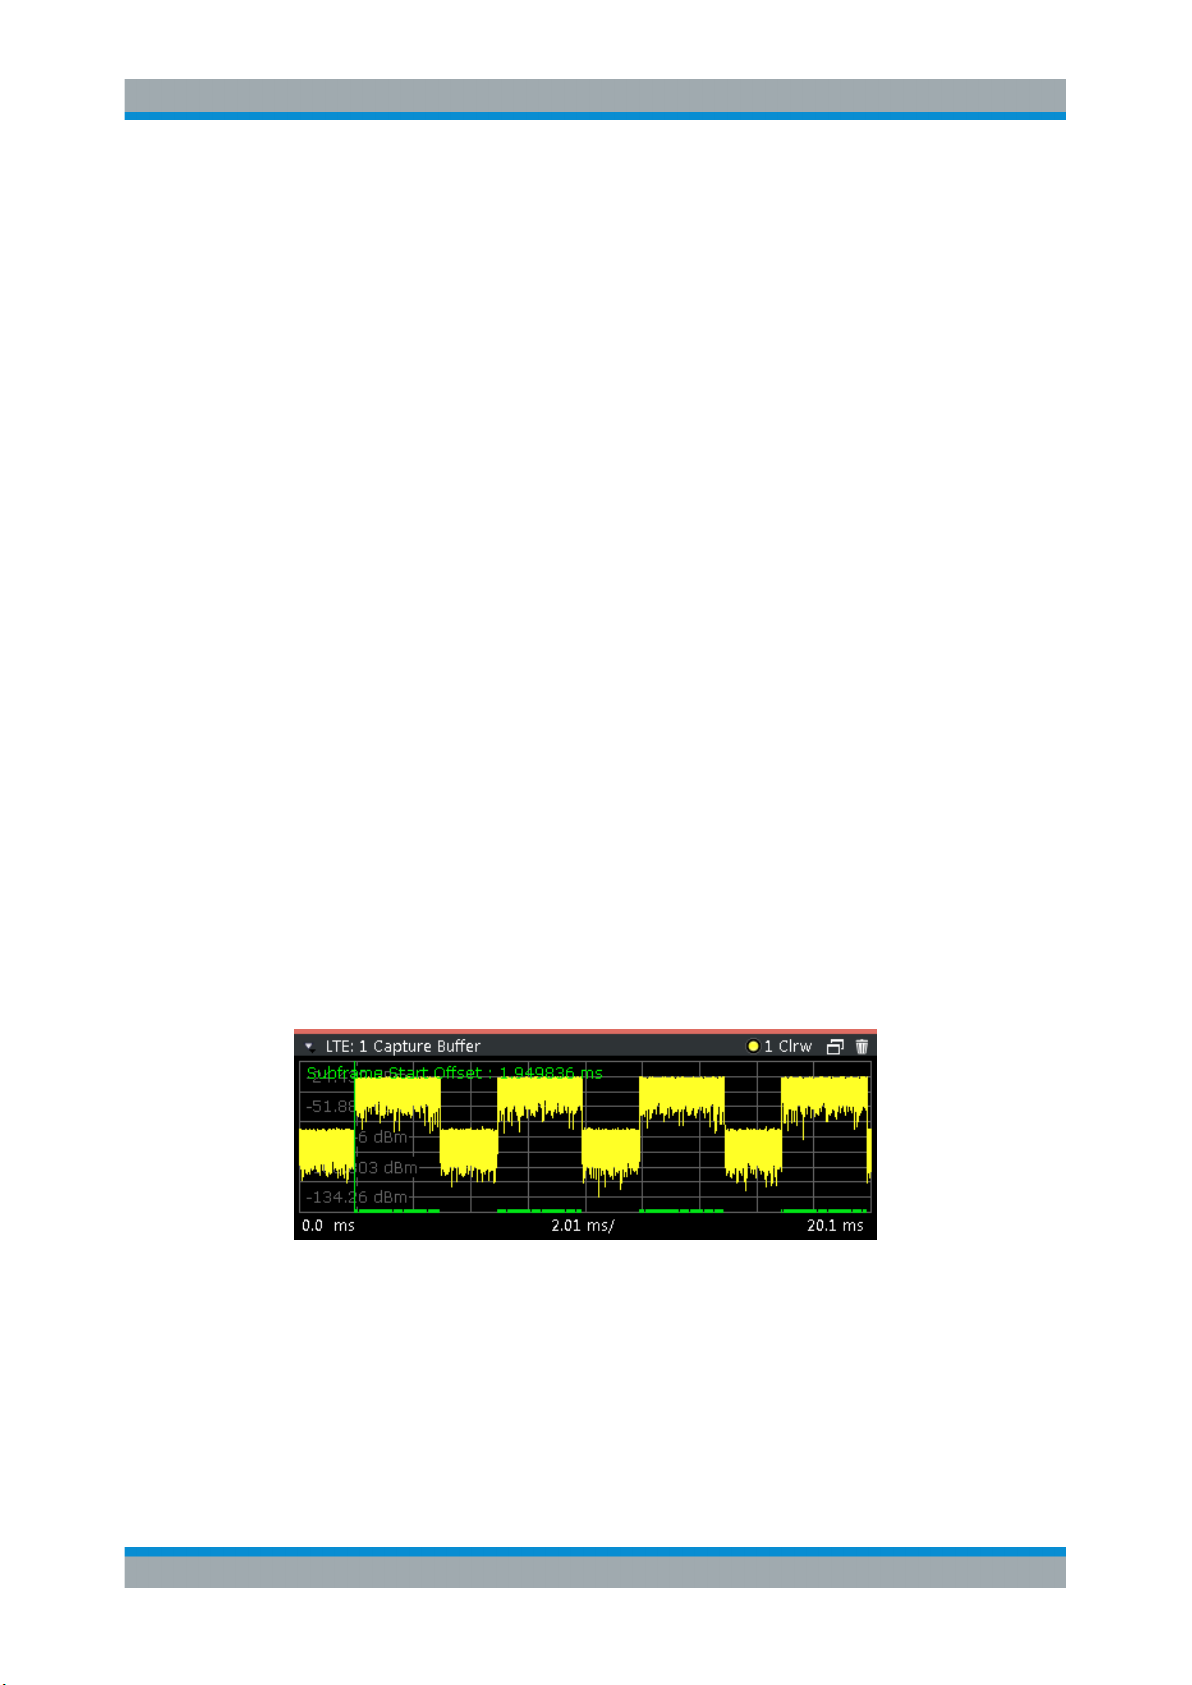
The "Capture Buffer" shows the complete range of captured data for the last data capture.
The x-axis represents time. The maximum value of the x-axis is equal to the Capture
Time.
The y-axis represents the amplitude of the captured I/Q data in dBm (for RF input).
Figure 4-1: Capture buffer without zoom
A green vertical line at the beginning of the green bar in the capture buffer represents
the subframe start. The diagram also contains the "Start Offset" value. This value is the
time difference between the subframe start and capture buffer start.
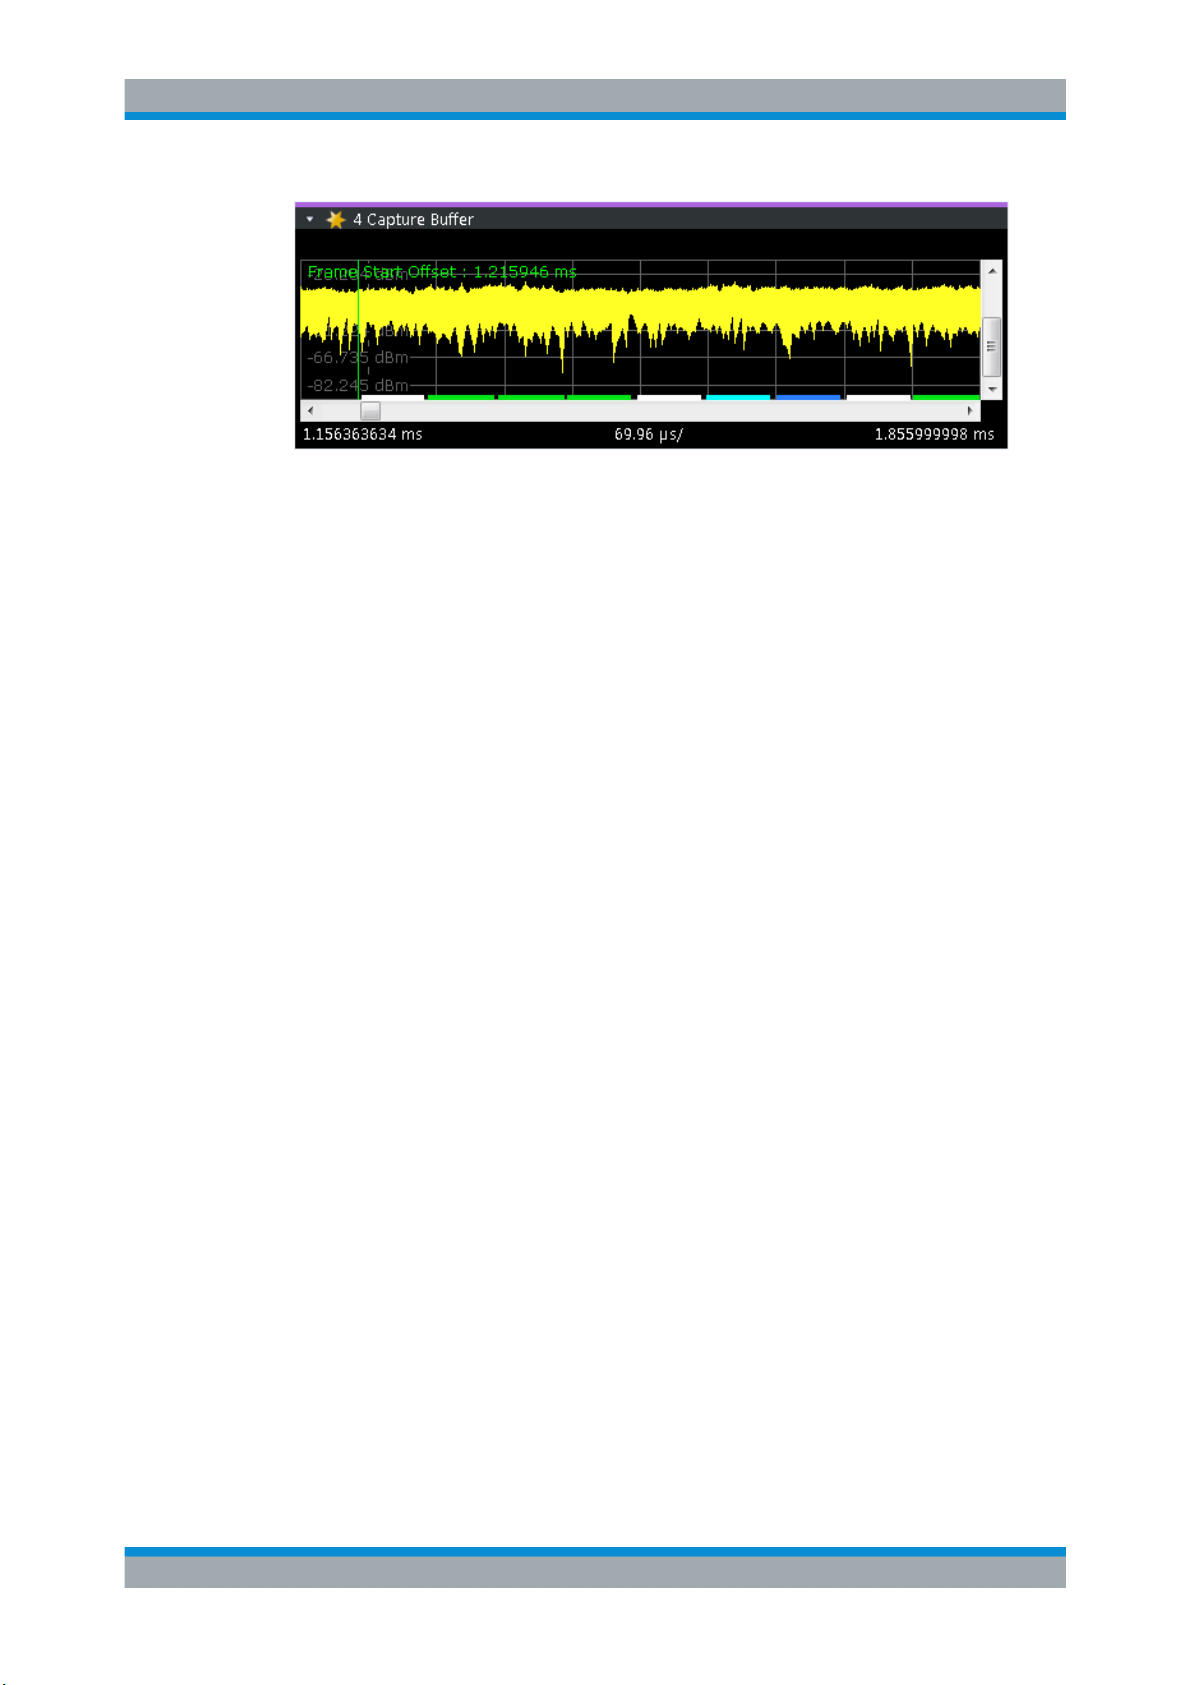
When you zoom into the diagram, you will see that the bar is interrupted at certain
positions. Each small bar indicates the useful parts of the OFDM symbol.
23User Manual 1176.8997.02 ─ 06
Page 24
R&S®VSE-K10x (LTE Uplink)
Figure 4-2: Capture buffer after a zoom has been applied
Remote command:
Selecting the result display: LAY:ADD ? '1',LEFT,CBUF
Querying results:
TRACe:DATA?
TRACe<n>[:DATA]:X? on page 119
Querying the subframe start offset: FETCh[:CC<cc>]:SUMMary:TFRame?
on page 129
Measurements and Result Displays
I/Q Measurements
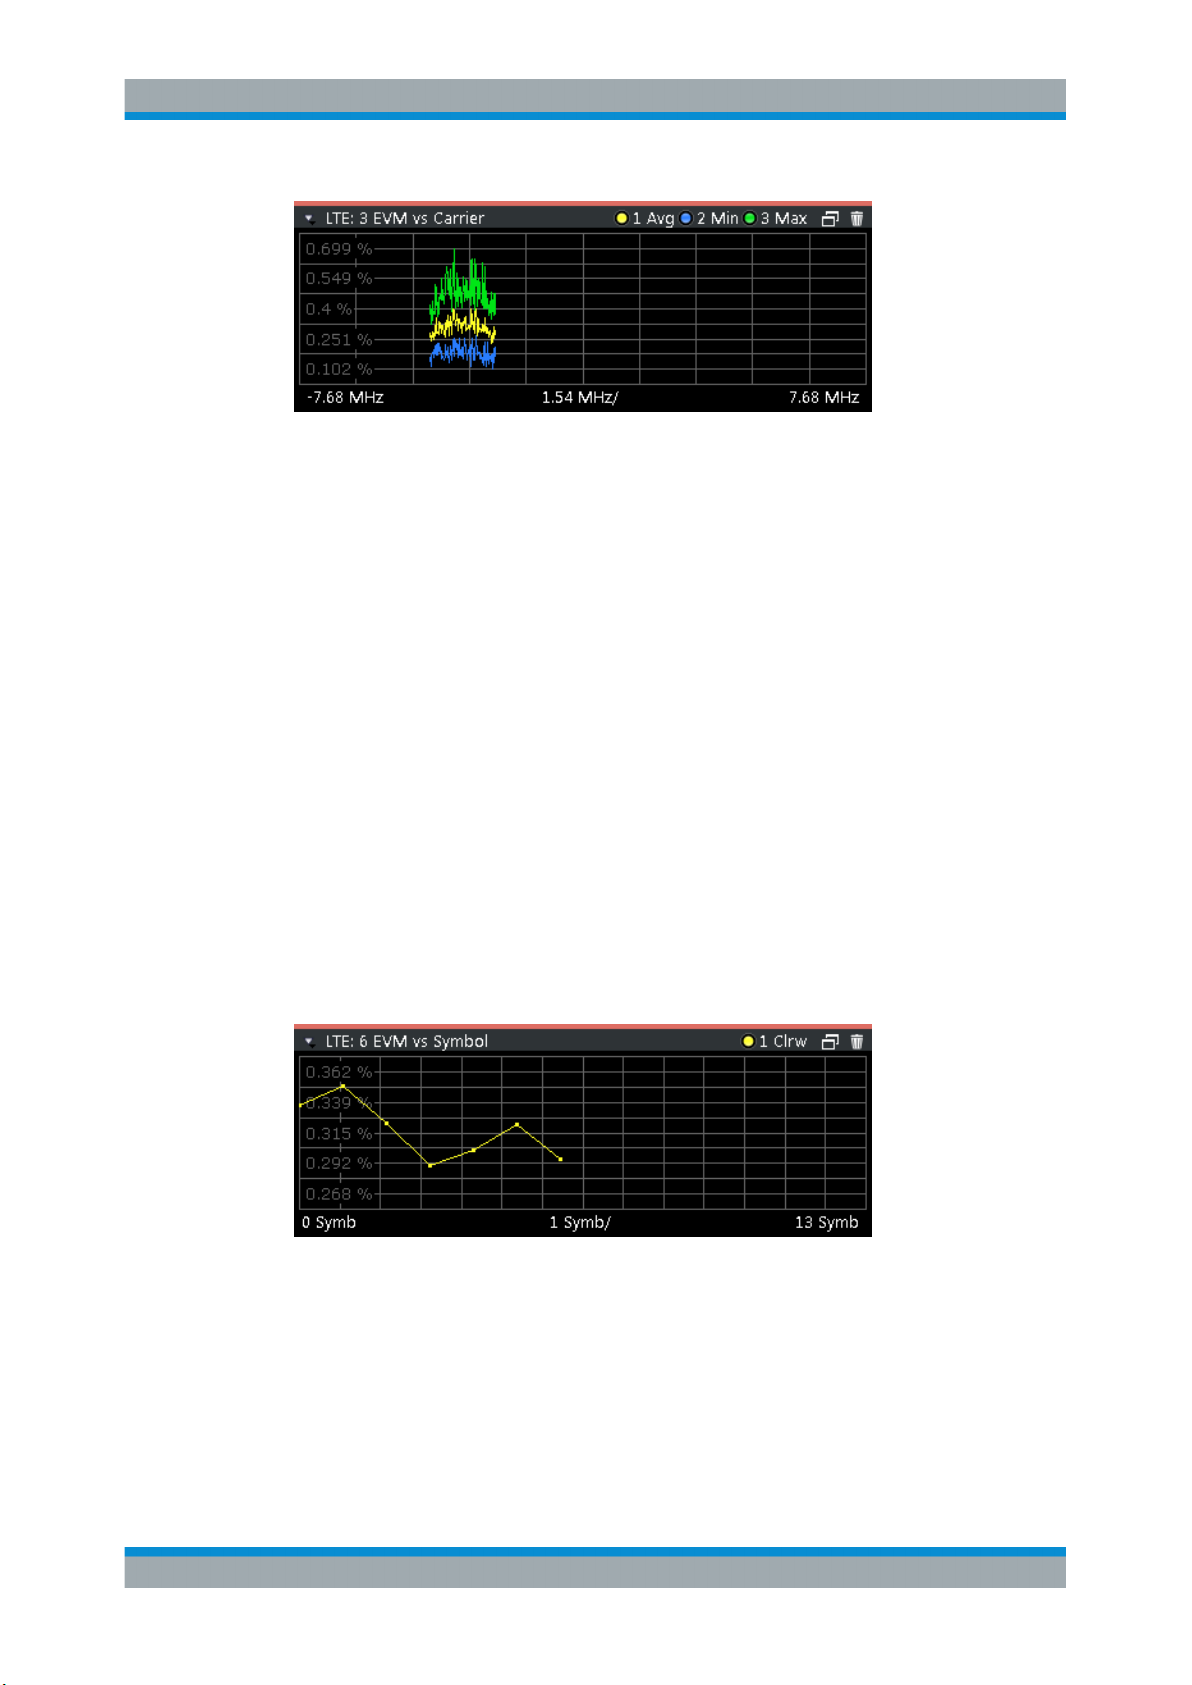
EVM vs Carrier
The "EVM vs Carrier" result display shows the error vector magnitude (EVM) of the
subcarriers. With the help of a marker, you can use it as a debugging technique to
identify any subcarriers whose EVM is too high.
The results are based on an average EVM that is calculated over the resource elements for each subcarrier. This average subcarrier EVM is determined for each analyzed slot in the capture buffer.
If you analyze all slots, the result display contains three traces.
●
Average EVM
This trace shows the subcarrier EVM, averaged over all slots.
●
Minimum EVM
This trace shows the lowest (average) subcarrier EVM that has been found over
the analyzed slots.
●
Maximum EVM
This trace shows the highest (average) subcarrier EVM that has been found over
the analyzed slots.
If you select and analyze one slot only, the result display contains one trace that shows
the subcarrier EVM for that slot only. Average, minimum and maximum values in that
case are the same. For more information, see "Slot Selection" on page 86.
The x-axis represents the center frequencies of the subcarriers. The y-axis shows the
EVM in % or in dB, depending on the EVM Unit.
24User Manual 1176.8997.02 ─ 06
Page 25
R&S®VSE-K10x (LTE Uplink)
Remote command:
Selecting the result display: LAY:ADD ? '1',LEFT,EVCA
Querying results:
TRACe:DATA?
TRACe<n>[:DATA]:X? on page 119
EVM vs Symbol
The "EVM vs Symbol" result display shows the error vector magnitude (EVM) of the
OFDM symbols. You can use it as a debugging technique to identify any symbols
whose EVM is too high.
The results are based on an average EVM that is calculated over all subcarriers that
are part of a certain OFDM symbol. This average OFDM symbol EVM is determined for
all OFDM symbols in each analyzed slot.
The x-axis represents the OFDM symbols, with each symbol represented by a dot on
the line. Any missing connections from one dot to another mean that the R&S VSE
could not determine the EVM for that symbol.
The number of displayed symbols depends on the subframe selection and the length of
the cyclic prefix.
For TDD signals, the result display does not show OFDM symbols that are not part of
the measured link direction.
On the y-axis, the EVM is plotted either in % or in dB, depending on the EVM Unit.
Measurements and Result Displays
I/Q Measurements
Remote command:
Selecting the result display: LAY:ADD ? '1',LEFT,EVSY
Querying results:
TRACe:DATA?
TRACe<n>[:DATA]:X? on page 119
25User Manual 1176.8997.02 ─ 06
Page 26
R&S®VSE-K10x (LTE Uplink)
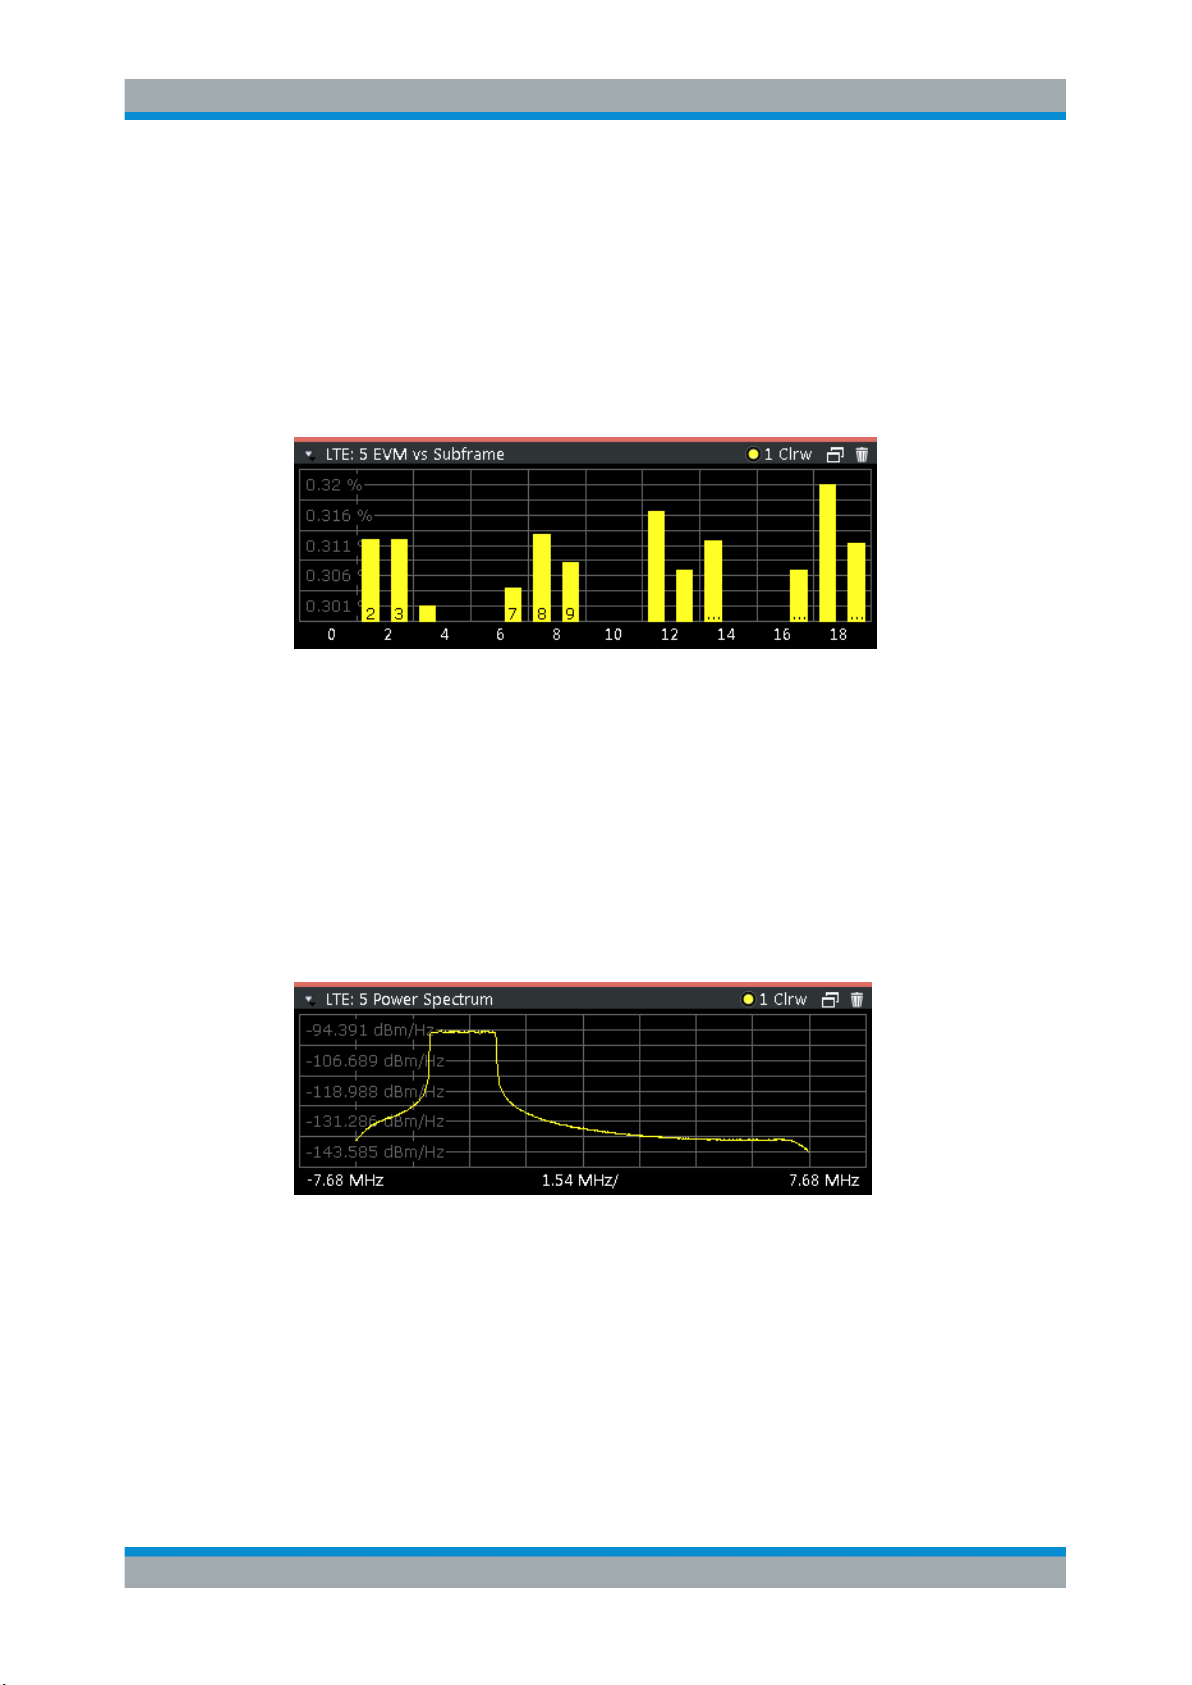
EVM vs Subframe
The "EVM vs Subframe" result display shows the Error Vector Magnitude (EVM) for
each subframe. You can use it as a debugging technique to identify a subframe whose
EVM is too high.
The result is an average over all subcarriers and symbols of a specific subframe.
The x-axis represents the subframes, with the number of displayed subframes being
10.
On the y-axis, the EVM is plotted either in % or in dB, depending on the EVM Unit.
Measurements and Result Displays
I/Q Measurements
Remote command:
Selecting the result display: LAY:ADD ? '1',LEFT,EVSU
Querying results:
TRACe:DATA?
TRACe<n>[:DATA]:X? on page 119
Power Spectrum
The "Power Spectrum" shows the power density of the complete capture buffer in
dBm/Hz.
The displayed bandwidth depends on the selected channel bandwidth.
The x-axis represents the frequency. On the y-axis, the power level is plotted.
Remote command:
Selecting the result display: LAY:ADD ? '1',LEFT,PSPE
Querying results:
TRACe:DATA?
TRACe<n>[:DATA]:X? on page 119
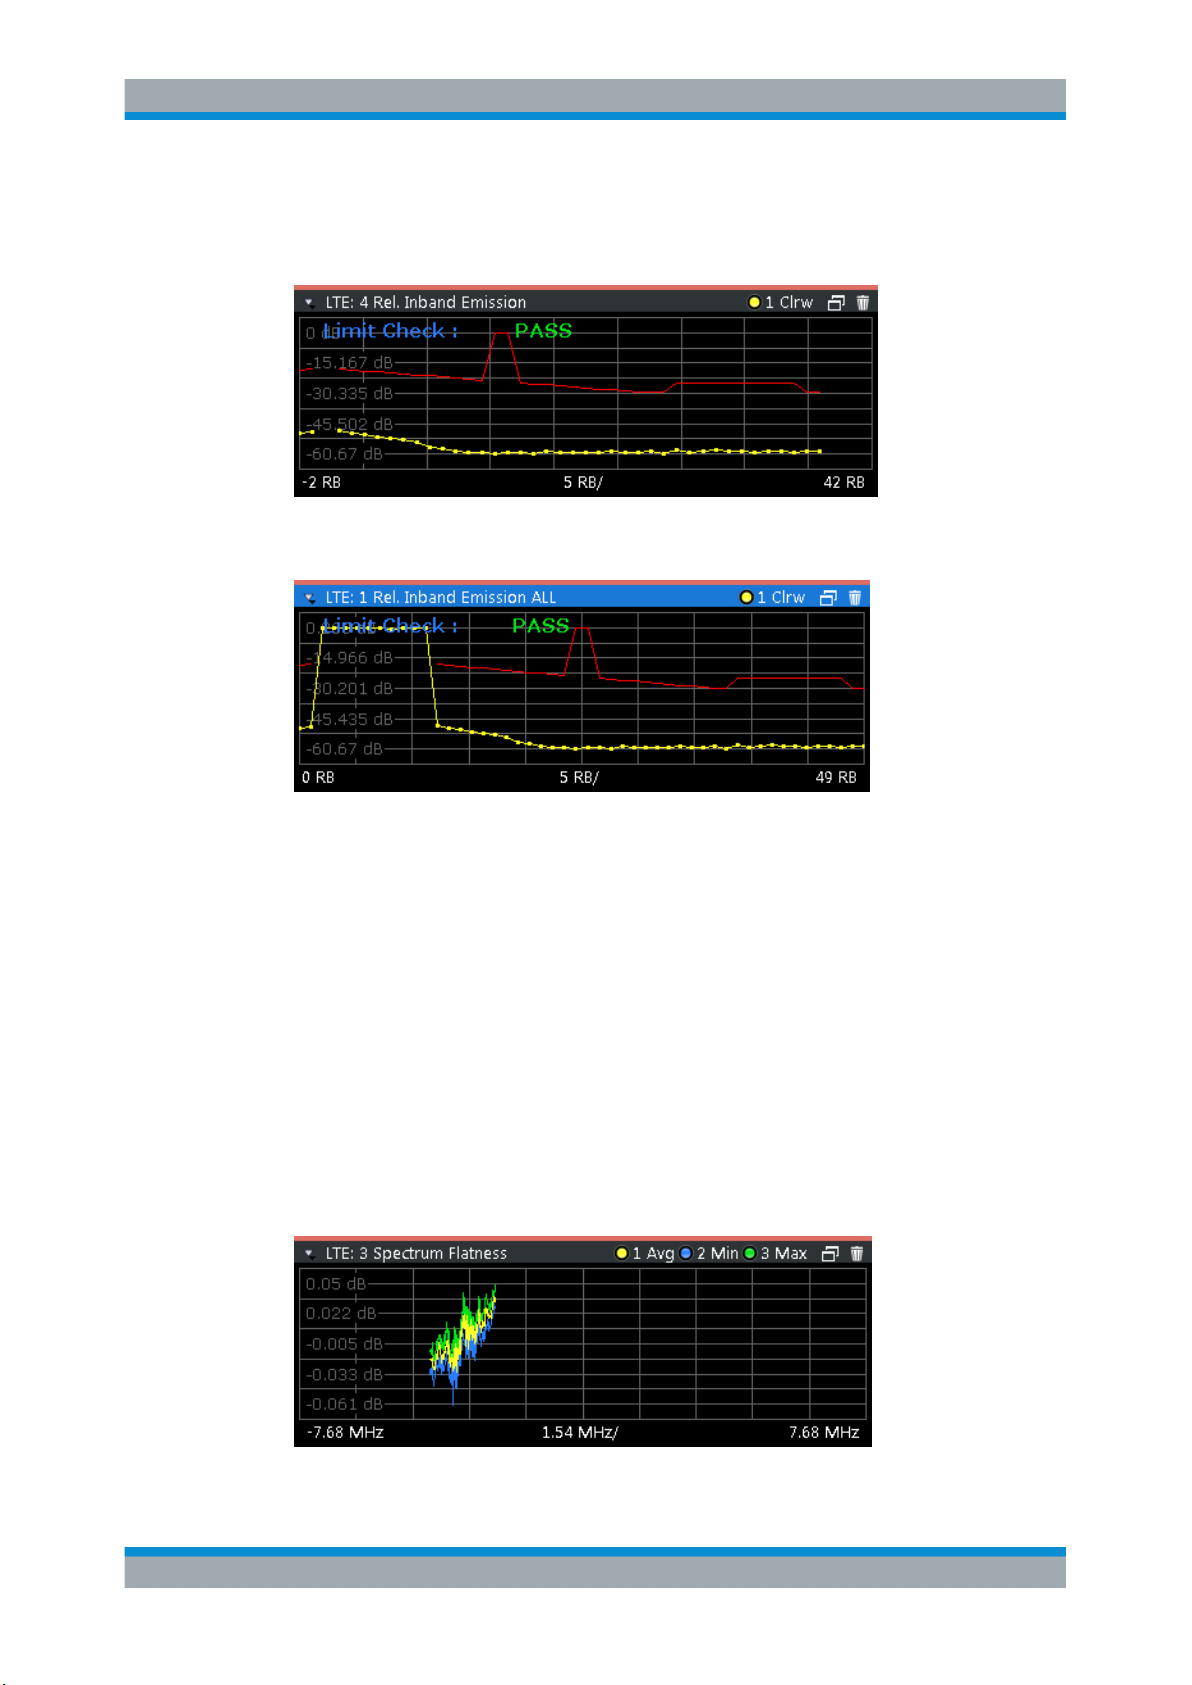
Inband Emission
The "Inband Emission" result display shows the relative power of the unused resource
blocks (yellow trace) and the inband emission limit lines (red trace) specified in 3GPP
TS36.101.
26User Manual 1176.8997.02 ─ 06
Page 27
R&S®VSE-K10x (LTE Uplink)
The measurement is evaluated over the currently selected slot in the currently selected
subframe. The currently selected subframe depends on your selection. You have to
select a specific subframe and slot to get valid measurement results.
You can also display the inband emissions for the allocated resource block in addition
to the unused resource blocks when you select the Inband Emissions All result display.
Measurements and Result Displays
I/Q Measurements
Remote command:
Selecting the result display: LAY:ADD ? '1',LEFT,IE
Selecting the result display: LAY:ADD ? '1',LEFT,IEA
Querying results:
TRACe:DATA?
TRACe<n>[:DATA]:X? on page 119
Spectrum Flatness
The "Spectrum Flatness" result display shows the relative power offset caused by the
transmit channel.
The measurement is evaluated over the currently selected slot in the currently selected
subframe.
The currently selected subframe depends on your selection.
The x-axis represents the frequency. On the y-axis, the channel flatness is plotted in
dB.
27User Manual 1176.8997.02 ─ 06
Page 28
R&S®VSE-K10x (LTE Uplink)
Note that the limit lines are only displayed if you match the Operating Band to the center frequency. Limits are defined for each operating band in the standard.
The shape of the limit line is different when "Extreme Conditions" on page 49 are on.
Remote command:
Selecting the result display: LAY:ADD ? '1',LEFT,SFL
Querying results:
TRACe:DATA?
TRACe<n>[:DATA]:X? on page 119
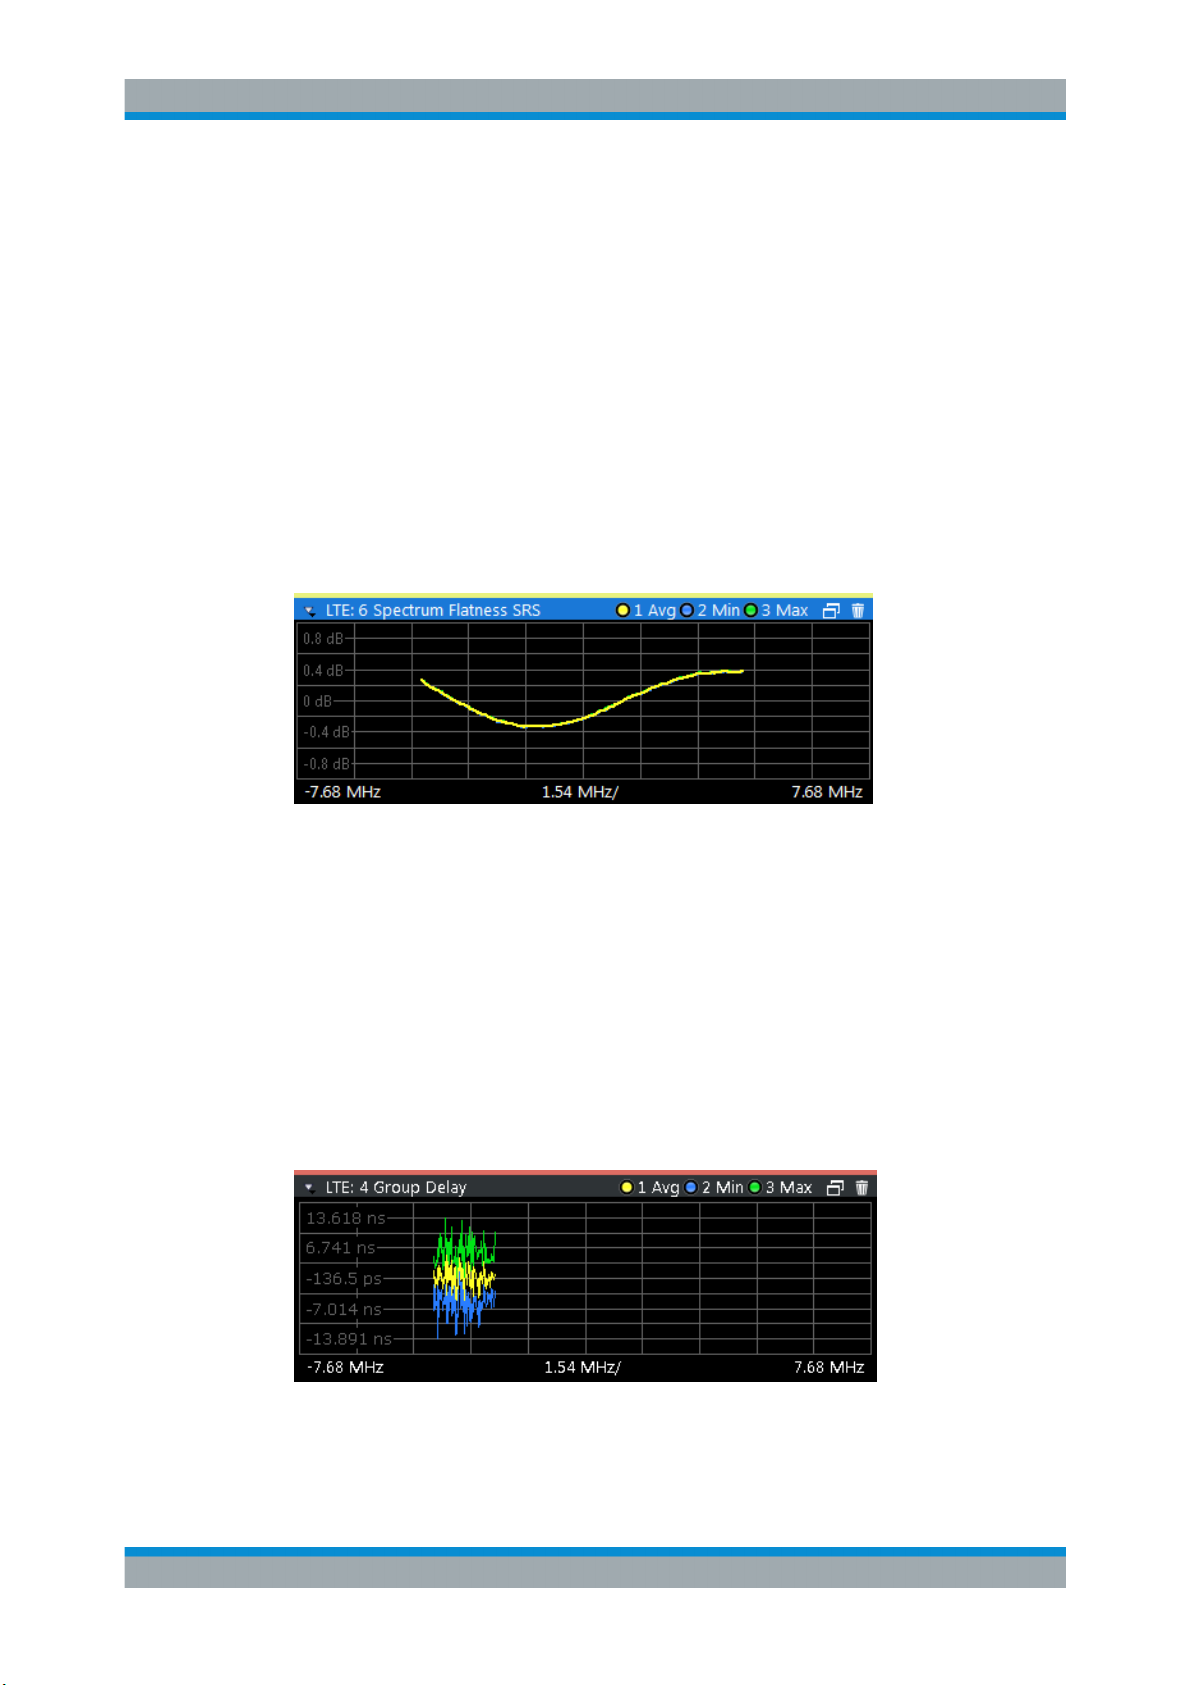
Spectrum Flatness SRS
The "Spectrum Flatness SRS" display shows the amplitude of the channel transfer
function based on the sounding reference signal.
The measurement is evaluated over the currently selected slot in the currently selected
subframe. The slot and subframe selection may be changed in the general settings.
Measurements and Result Displays
I/Q Measurements
Remote command:
Selecting the result display: LAY:ADD ? '1',LEFT,SFSR
Querying results:
TRACe:DATA?
TRACe<n>[:DATA]:X? on page 119
Group Delay
This "Group Delay" shows the group delay of each subcarrier.
The measurement is evaluated over the currently selected slot in the currently selected
subframe.
The currently selected subframe depends on your selection.
The x-axis represents the frequency. On the y-axis, the group delay is plotted in ns.
Remote command:
Selecting the result display: LAY:ADD ? '1',LEFT,GDEL
Querying results:
28User Manual 1176.8997.02 ─ 06
Page 29
R&S®VSE-K10x (LTE Uplink)
TRACe:DATA?
TRACe<n>[:DATA]:X? on page 119
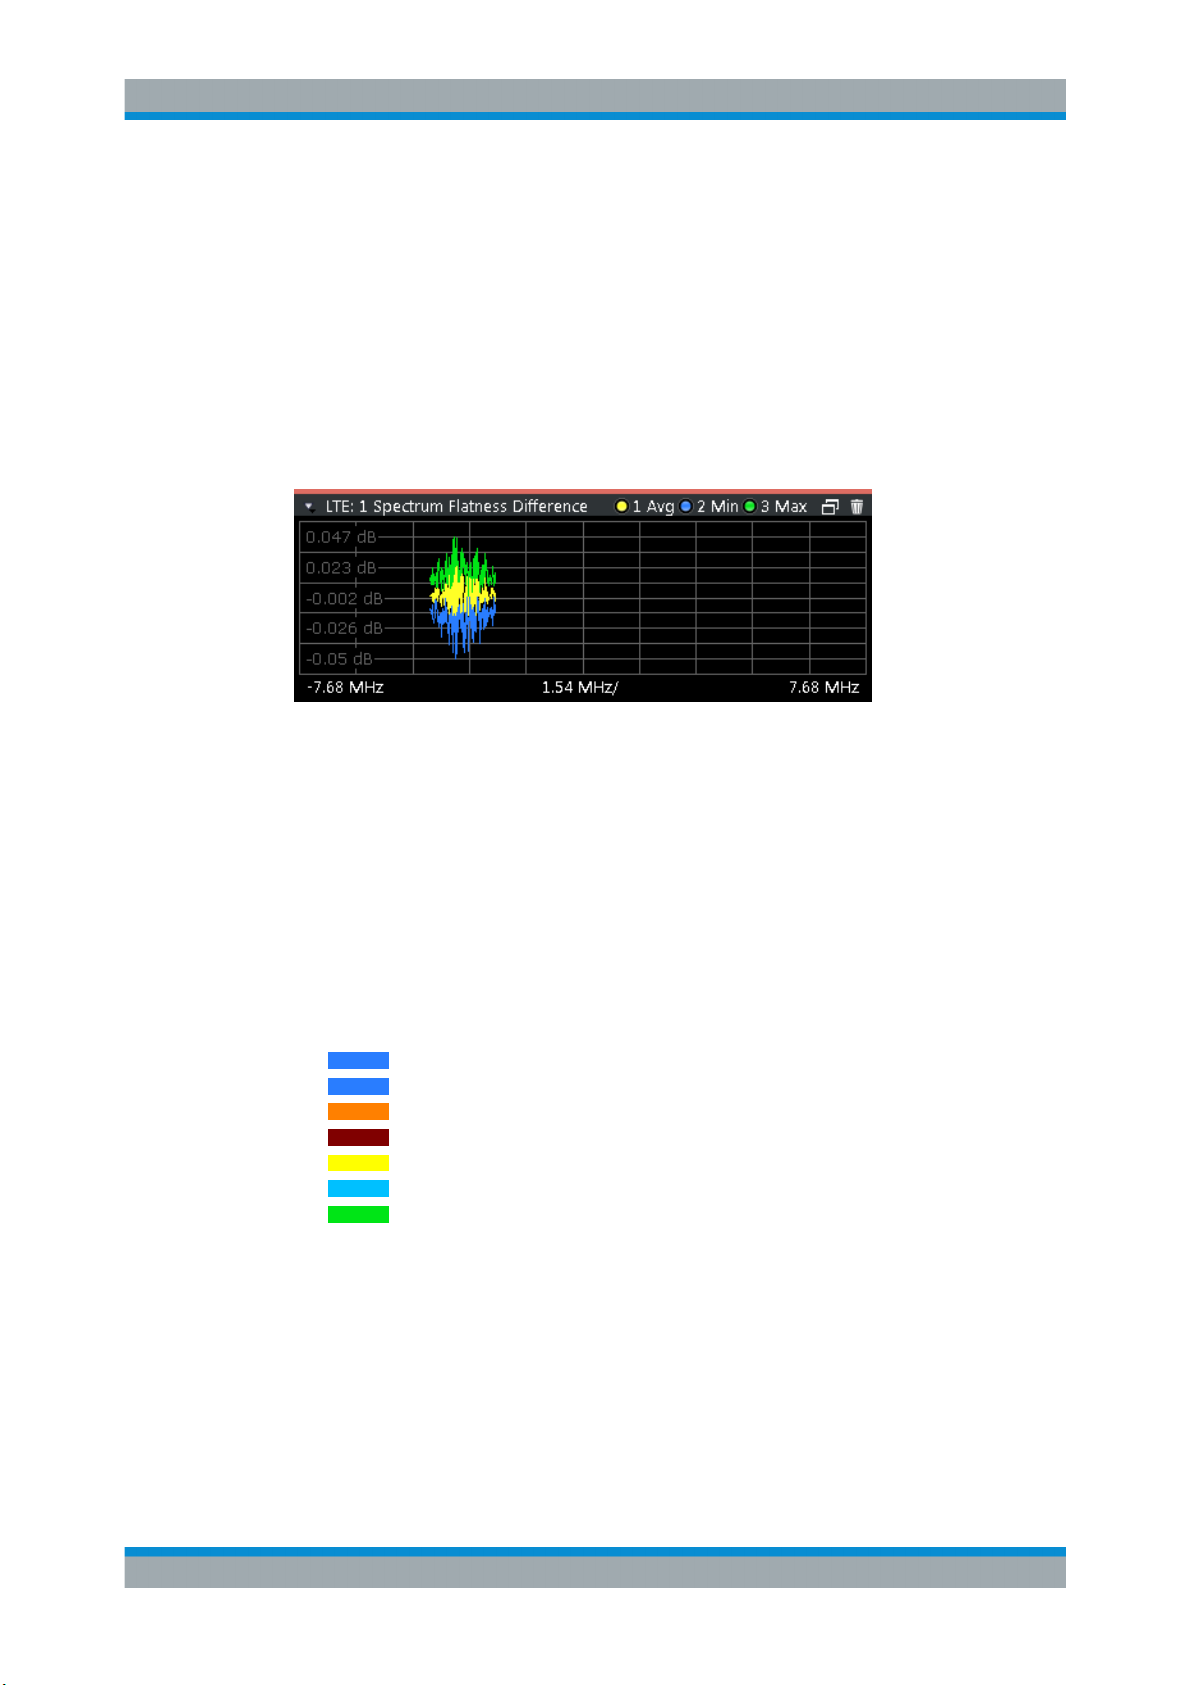
Spectrum Flatness Difference
The "Spectrum Flatness Difference" result display shows the level difference in the
spectrum flatness result between two adjacent physical subcarriers.
The measurement is evaluated over the currently selected slot in the currently selected
subframe.
The currently selected subframe depends on your selection.
The x-axis represents the frequency. On the y-axis, the power is plotted in dB.
Measurements and Result Displays
I/Q Measurements
Remote command:
Selecting the result display: LAY:ADD ? '1',LEFT,SFD
Querying results:
TRACe:DATA?
TRACe<n>[:DATA]:X? on page 119
Constellation Diagram
The "Constellation Diagram" shows the in-phase and quadrature phase results and is
an indicator of the quality of the modulation of the signal.
In the default state, the result display evaluates the full range of the measured input
data.
Each color represents a modulation type.
●
●
●
●
●
●
●
You can filter the results by changing the evaluation range.
: RBPSK
: MIXTURE
: QPSK
: 16QAM
: 64QAM
: 256QAM
: PSK (CAZAC)
29User Manual 1176.8997.02 ─ 06
Page 30
R&S®VSE-K10x (LTE Uplink)
The constellation diagram also contains information about the current evaluation
range. It also shows the number of points that are displayed in the diagram.
Remote command:
Selecting the result display: LAY:ADD ? '1',LEFT,CONS
Querying results: TRACe:DATA?
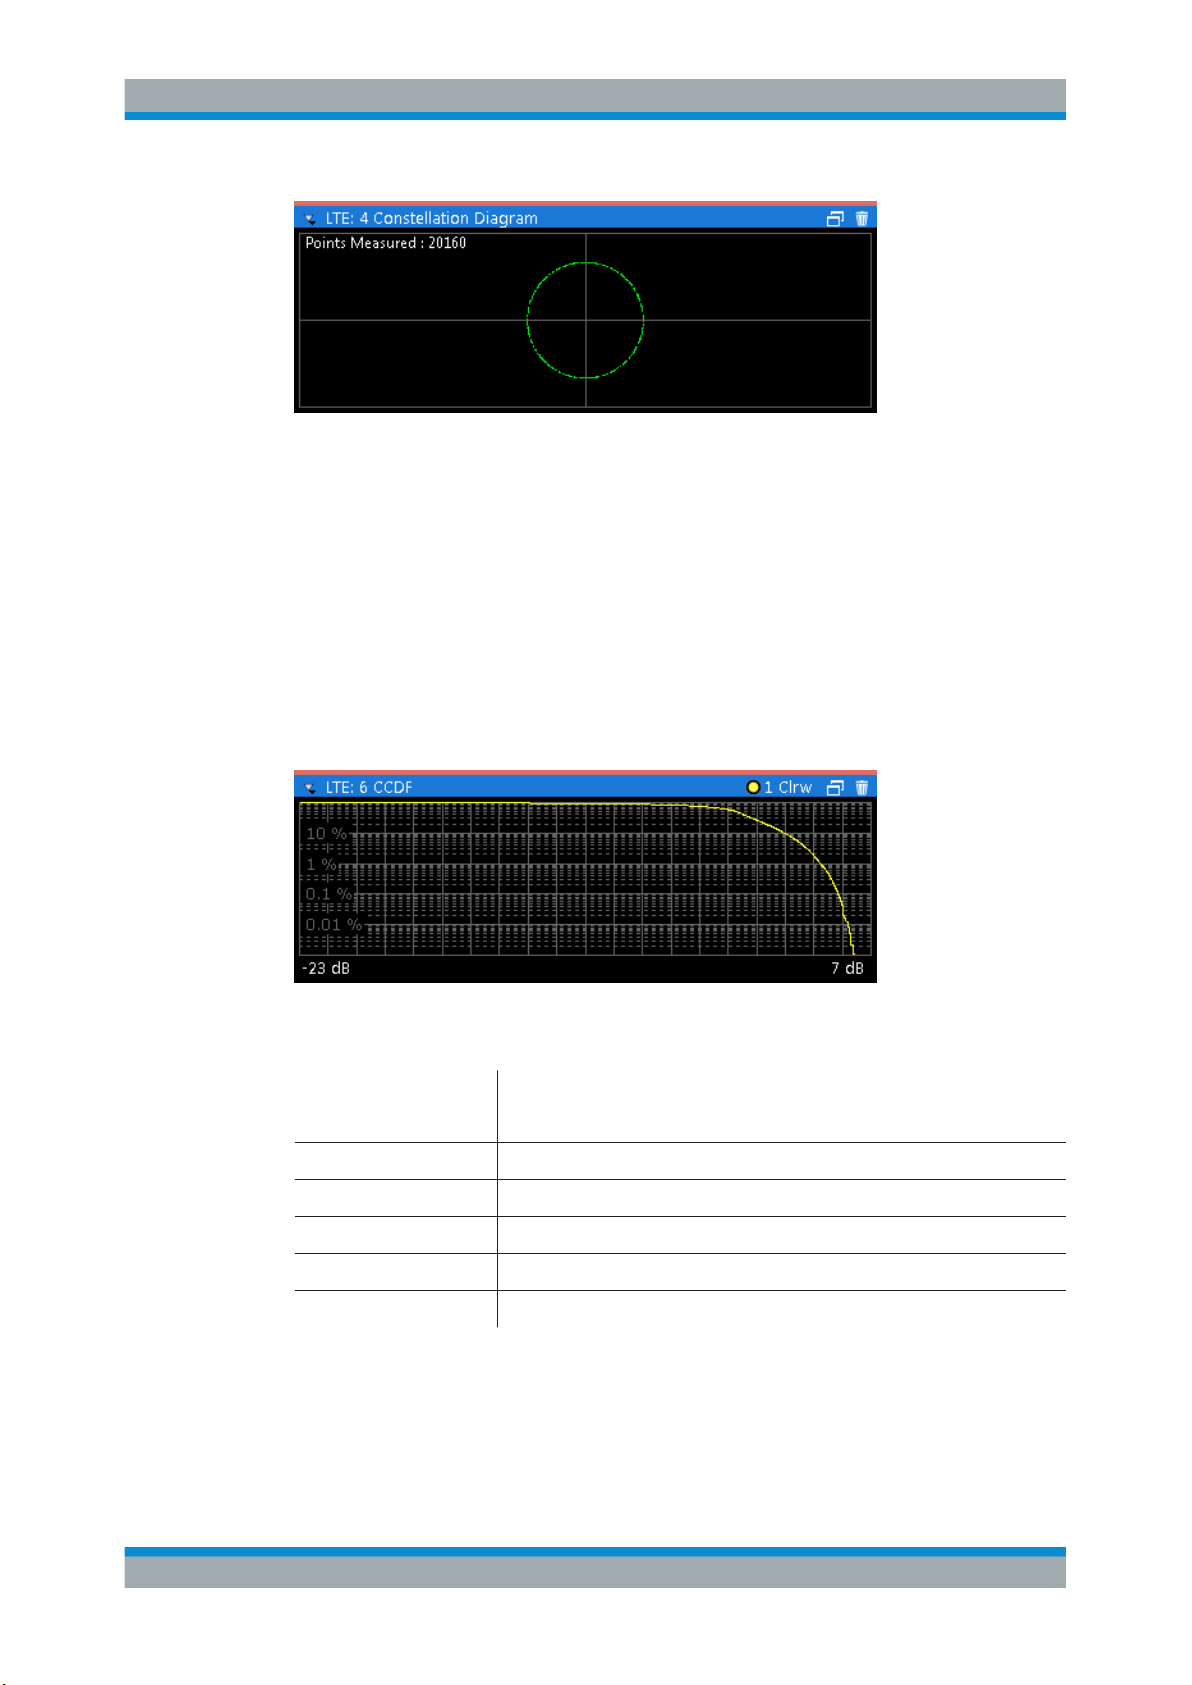
CCDF
The "Complementary Cumulative Distribution Function (CCDF)" shows the probability
of an amplitude exceeding the mean power. For the measurement, the complete capture buffer is used.
The x-axis represents the power relative to the measured mean power. On the y-axis,
the probability is plotted in %.
Measurements and Result Displays
I/Q Measurements
In addition to the diagram, the results for the CCDF measurement are summarized in
the CCDF table.
Mean Mean power
Peak Peak power
Crest Crest factor (peak power – mean power)
10 % Level values over 10 % above mean power
1 % Level values over 1 % above mean power
0.1 % Level values over 0.1 % above mean power
0.01 % Level values over 0.01 % above mean power
Remote command:
Selecting the result display: LAY:ADD ? '1',LEFT,CCDF
Querying results: TRACe:DATA?
30User Manual 1176.8997.02 ─ 06
Page 31

R&S®VSE-K10x (LTE Uplink)
Numerical results: CALCulate<n>:STATistics:CCDF:X<t>? on page 134
Numerical results: CALCulate<n>:STATistics:RESult<t>? on page 135
Allocation Summary
The "Allocation Summary" shows the results of the measured allocations in a table.
The rows in the table represent the allocation.
A set of allocations form a subframe. The subframes are separated by a horizontal line.
The columns of the table contain the following information:
●
Subframe
Shows the subframe number.
●
Allocation ID
Shows the type / ID of the allocation.
●
Number of RB
Shows the number of resource blocks assigned to the corresponding allocation.
●
Offset RB
Shows the resource block offset of the allocation.
●
Modulation
Shows the modulation type.
●
Power
Shows the power of the allocation in dBm.
●
EVM
Shows the EVM of the allocation. The unit depends on the selected EVM unit.
Note: Contents of the allocation summary
The number of columns shown in the allocation summary is variable. To add or remove
a column, select the header row of the table once. The application opens a dialog box
to select the columns which you would like to display.
Remote command:
Selecting the result display: LAY:ADD ? '1',LEFT,ASUM
Querying results: TRACe:DATA?
Measurements and Result Displays
I/Q Measurements
Bit Stream
The "Bit Stream" shows the demodulated data stream for each data allocation.
Depending on the Bit Stream Format, the numbers represent either bits (bit order) or
symbols (symbol order).
Selecting symbol format shows the bit stream as symbols. In that case, the bits belonging to one symbol are shown as hexadecimal numbers with two digits. In the case of bit
format, each number represents one raw bit.
Symbols or bits that are not transmitted are represented by a "-".
31User Manual 1176.8997.02 ─ 06
Page 32

R&S®VSE-K10x (LTE Uplink)
If a symbol could not be decoded because the number of layers exceeds the number
of receive antennas, the application shows a "#" sign.
The table contains the following information:
●
Subframe
Number of the subframe the bits belong to.
●
Allocation ID
Channel the bits belong to.
●
Codeword
Code word of the allocation.
●
Modulation
Modulation type of the channels.
●
Symbol Index or Bit Index
Shows the position of the table row's first bit or symbol within the complete stream.
●
Bit Stream
The actual bit stream.
Remote command:
Selecting the result display: LAY:ADD ? '1',LEFT,BSTR
Querying results: TRACe:DATA?
Measurements and Result Displays
I/Q Measurements
EVM vs Symbol x Carrier
The "EVM vs Symbol x Carrier" result display shows the EVM for each carrier in each
symbol.
The x-axis represents the symbols. The y-axis represents the subcarriers. Different colors in the diagram area represent the EVM. A color map in the diagram header indicates the corresponding power levels.
Remote command:
Selecting the result display: LAY:ADD ? '1',LEFT,EVSC
Querying results: TRACe:DATA?
32User Manual 1176.8997.02 ─ 06
Page 33

R&S®VSE-K10x (LTE Uplink)
Power vs Symbol x Carrier
The "Power vs Symbol x Carrier" result display shows the power for each carrier in
each symbol.
The x-axis represents the symbols. The y-axis represents the subcarriers. Different colors in the diagram area represent the power. A color map in the diagram header indicates the corresponding power levels.
Remote command:
Selecting the result display: LAY:ADD ? '1',LEFT,PVSC
Querying results: TRACe:DATA?
Measurements and Result Displays
I/Q Measurements
Result Summary
The Result Summary shows all relevant measurement results in numerical form, combined in one table.
Remote command:
LAY:ADD ? '1',LEFT,RSUM
Contents of the result summary
The contents of the result summary depend on the analysis mode you have selected.
The first screenshot shows the results for "PUSCH/PUCCH" analysis mode, the second one those for "PRACH" analysis mode.
33User Manual 1176.8997.02 ─ 06
Page 34

R&S®VSE-K10x (LTE Uplink)
Measurements and Result Displays
I/Q Measurements
Figure 4-3: Result summary in PUSCH/PUCCH analysis mode
Figure 4-4: Result summary in PRACH analysis mode
The table is split in two parts. The first part shows results that refer to the complete
frame. It also indicates limit check results where available. The font of 'Pass' results is
green and that of 'Fail' results is red.
In addition to the red font, the application also puts a red star (
) in front of
failed results.
The second part of the table shows results that refer to a specific selection of the
frame. The statistic is always evaluated over the slots. The header row of the table
contains information about the selection you have made (like the subframe).
Note: The EVM results on a frame level (first part of the table) are calculated as
defined by 3GPP at the edges of the cyclic prefix.
The other EVM results (lower part of the table) are calculated at the optimal timing
position in the middle of the cyclic prefix.
34User Manual 1176.8997.02 ─ 06
Page 35

R&S®VSE-K10x (LTE Uplink)
Because of inter-symbol interference, the EVM calculated at the edges of the cyclic
prefix is higher than the EVM calculated in the middle of the cyclic prefix.
By default, all EVM results are in %. To view the EVM results in dB, change the EVM
Unit.
Table 4-1: Result summary: part containing results as defined by 3GPP (PUSCH/PUCCH analysis)
EVM PUSCH QPSK Shows the EVM for all QPSK-modulated resource elements of the PUSCH
EVM PUSCH 16QAM Shows the EVM for all 16QAM-modulated resource elements of the PUSCH
EVM PUSCH 64QAM Shows the EVM for all 64QAM-modulated resource elements of the PUSCH
EVM PUSCH 256QAM Shows the EVM for all 256QAM-modulated resource elements of the PUSCH
Measurements and Result Displays
I/Q Measurements
channel in the analyzed frame.
FETCh[:CC<cc>]:SUMMary:EVM:USQP[:AVERage]? on page 123
channel in the analyzed frame.
FETCh[:CC<cc>]:SUMMary:EVM:USST[:AVERage]? on page 124
channel in the analyzed frame.
FETCh[:CC<cc>]:SUMMary:EVM:USSF[:AVERage]? on page 124
channel in the analyzed frame.
FETCh[:CC<cc>]:SUMMary:EVM:USTS[:AVERage]? on page 124
EVM DMRS PUSCH QPSK Shows the EVM of all DMRS resource elements with QPSK modulation of the
PUSCH in the analyzed frame.
FETCh[:CC<cc>]:SUMMary:EVM:SDQP[:AVERage]? on page 121
EVM DMRS PUSCH 16QAM Shows the EVM of all DMRS resource elements with 16QAM modulation of
the PUSCH in the analyzed frame.
FETCh[:CC<cc>]:SUMMary:EVM:SDST[:AVERage]? on page 122
EVM DMRS PUSCH 64QAM Shows the EVM of all DMRS resource elements with 64QAM modulation of
the PUSCH in the analyzed frame.
FETCh[:CC<cc>]:SUMMary:EVM:SDSF[:AVERage]? on page 121
EVM DMRS PUSCH
256QAM
EVM PUCCH Shows the EVM of all resource elements of the PUCCH channel in the ana-
EVM DMRS PUCCH Shows the EVM of all DMRS resource elements of the PUCCH channel in the
Table 4-2: Result summary: part containing results as defined by 3GPP (PRACH analysis)
EVM PRACH Shows the EVM of all resource elements of the PRACH channel in the ana-
Shows the EVM of all DMRS resource elements with 256QAM modulation of
the PUSCH in the analyzed frame.
FETCh[:CC<cc>]:SUMMary:EVM:SDTS[:AVERage]? on page 122
lyzed frame.
FETCh[:CC<cc>]:SUMMary:EVM:UCCH[:AVERage]? on page 123
analyzed frame.
FETCh[:CC<cc>]:SUMMary:EVM:UCCD[:AVERage]? on page 122
lyzed frame.
FETCh[:CC<cc>]:SUMMary:EVM:UPRA[:AVERage]? on page 123
35User Manual 1176.8997.02 ─ 06
Page 36

R&S®VSE-K10x (LTE Uplink)
Table 4-3: Result summary: part containing results for a specific selection
EVM All Shows the EVM for all resource elements in the analyzed frame.
EVM Phys Channel Shows the EVM for all physical channel resource elements in the analyzed
EVM Phys Signal Shows the EVM for all physical signal resource elements in the analyzed
Frequency Error Shows the difference in the measured center frequency and the reference
Measurements and Result Displays
I/Q Measurements
FETCh[:CC<cc>]:SUMMary:EVM[:ALL][:AVERage]? on page 126
frame.
A physical channel corresponds to a set of resource elements carrying infor-
mation from higher layers. PUSCH, PUCCH and PRACH are physical channels. For more information, see 3GPP 36.211.
FETCh[:CC<cc>]:SUMMary:EVM:PCHannel[:AVERage]? on page 126
("PUSCH/PUCCH" analysis mode only.)
frame.
The reference signal is a physical signal. For more information, see 3GPP
36.211.
FETCh[:CC<cc>]:SUMMary:EVM:PSIGnal[:AVERage]? on page 126
("PUSCH/PUCCH" analysis mode only.)
center frequency.
FETCh[:CC<cc>]:SUMMary:FERRor[:AVERage]? on page 127
Sampling Error Shows the difference in measured symbol clock and reference symbol clock
relative to the system sampling rate.
FETCh[:CC<cc>]:SUMMary:SERRor[:AVERage]? on page 129
I/Q Offset Shows the power at spectral line 0 normalized to the total transmitted power.
FETCh[:CC<cc>]:SUMMary:IQOFfset[:AVERage]? on page 128
I/Q Gain Imbalance Shows the logarithm of the gain ratio of the Q-channel to the I-channel.
FETCh[:CC<cc>]:SUMMary:GIMBalance[:AVERage]? on page 127
I/Q Quadrature Error Shows the measure of the phase angle between Q-channel and I-channel
deviating from the ideal 90 degrees.
FETCh[:CC<cc>]:SUMMary:QUADerror[:AVERage]? on page 129
Power Shows the average time domain power of the allocated resource blocks of the
analyzed signal.
FETCh[:CC<cc>]:SUMMary:POWer[:AVERage]? on page 128
Crest Factor Shows the peak-to-average power ratio of captured signal.
FETCh[:CC<cc>]:SUMMary:CRESt[:AVERage]? on page 125
Marker Table
Displays a table with the current marker values for the active markers.
Wnd Shows the window the marker is in.
Type Shows the marker type and number ("M" for a nor-
mal marker, "D" for a delta marker).
Trc Shows the trace that the marker is positioned on.
Ref Shows the reference marker that a delta marker
refers to.
36User Manual 1176.8997.02 ─ 06
Page 37

R&S®VSE-K10x (LTE Uplink)
X- / Y-Value Shows the marker coordinates (usually frequency
Measurements and Result Displays
Time Alignment Error Measurements
and level).
Z-EVM
Z-Power
Z-Alloc ID
Shows the EVM, power and allocation type at the
marker position.
Only in 3D result displays (for example "EVM vs
Symbol x Carrier").
Remote command:
LAY:ADD? '1',RIGH, MTAB, see LAYout:ADD[:WINDow]? on page 103
Results:
CALCulate<n>:MARKer<m>:X on page 132
CALCulate<n>:MARKer<m>:Y on page 133
CALCulate<n>:MARKer<m>:Z? on page 133
CALCulate<n>:MARKer<m>:Z:ALL? on page 134
4.5 Time Alignment Error Measurements
Access: "Overview" > "Select Measurement" > "Time Alignment Error"
The Time Alignment Error measurement captures and analyzes new I/Q data when
you select it.
Note that the Time Alignment Error measurement only work in a MIMO setup (2 or 4
antennas) or a system with component carriers. Therefore, you have to mix the signal
of the antennas into one cable that you can connect to the R&S VSE. For more information on configuring and performing a Time Alignment Error measurement, see
Chapter 3.4, "Performing Time Alignment Measurements", on page 18.
In addition to the result displays mentioned in this section, the Time Alignment Error
measurement also supports the following result displays described elsewhere.
●
"Capture Buffer" on page 23
●
"Power Spectrum" on page 26
●
" Marker Table " on page 36
You can select the result displays from the evaluation bar and arrange them as you like
with the SmartGrid functionality.
Time Alignment Error.................................................................................................... 38
Carrier Frequency Error................................................................................................ 38
37User Manual 1176.8997.02 ─ 06
Page 38

R&S®VSE-K10x (LTE Uplink)
Time Alignment Error
Starts the Time Alignment Error result display.
The time alignment is an indicator of how well the transmission antennas in a MIMO
system and component carriers are synchronized. The time alignment error is the time
delay between a reference antenna (for example antenna 1) and another antenna.
More information.
The application shows the results in a table.
Each row in the table represents one antenna. The reference antenna is not shown.
For each antenna, the maximum, minimum and average time delay that has been
measured is shown. The minimum and maximum results are calculated only if the
measurement covers more than one subframe.
If you perform the measurement on a system with carrier aggregation, each row represents one antenna. The number of lines increases because of multiple carriers. The
reference antenna of the main component carrier (CC1) is not shown.
In case of carrier aggregation, the Time Alignment Error measurement also evaluates
the "Carrier Frequency Error" on page 38 of the component carrier (CC2) relative to
the main component carrier (CC1).
In any case, results are only displayed if the transmission power of both antennas is
within 15 dB of each other. Likewise, if only one antenna transmits a signal, results will
not be displayed (for example if the cabling on one antenna is faulty).
For more information on configuring this measurement see Chapter 5.3, "Configuring
Time Alignment Error Measurements", on page 83.
The "Limit" value shown in the result display is the maximum time delay that may occur
for each antenna (only displayed for systems without carrier aggregation).
You can select the reference antenna from the dropdown menu in the result display.
You can also select the reference antenna in the MIMO Setup - if you change them in
one place, they are also changed in the other.
In the default layout, the application also shows the Capture Buffer and Power Spectrum result displays for each component carrier.
Remote command:
Selecting the result displays: LAY:ADD ? '1',LEFT,TAL
Querying results: FETCh:TAERror[:CC<cc>]:ANTenna<ant>[:AVERage]?
on page 131
Measurements and Result Displays
Time Alignment Error Measurements
Carrier Frequency Error
The "Carrier Frequency Error" result display is an indicator of how well the component
carriers in a system with carrier aggregation are synchronized. The Carrier Frequency
Error is the frequency deviation between a reference carrier (usually Component Carrier 1) and another component carrier.
The application shows the results in a table.
For each component carrier, the application adds two rows to the table.
●
The first row shows the lowest, average and highest frequency error that has been
measured in Hz. In addition, the limit defined by 3GPP for that scenario is displayed. Note that the application always tests against the highest measured value;
if the limit has been violated, the font color of the maximum value turns red.
38User Manual 1176.8997.02 ─ 06
Page 39

R&S®VSE-K10x (LTE Uplink)
If you measure a single slot only, the lowest, average and highest valued are the
same.
●
The second row shows the lowest, average and highest frequency error that has
been measured in ppm. In addition, the limit defined by 3GPP for that scenario is
displayed.
If you measure a single slot only, the lowest, average and highest valued are the
same.
The reference component carrier is not represented in the table.
Remote command:
In Hz: FETCh:FERRor[:CC<cc>][:AVERage]? on page 130
In ppm: FETCh:FEPPm[:CC<cc>][:AVERage]? on page 130
Measurements and Result Displays
Time Alignment Error Measurements
39User Manual 1176.8997.02 ─ 06
Page 40

R&S®VSE-K10x (LTE Uplink)
5 Configuration
LTE measurements require a special application on the R&S VSE, which you can
select by adding a new measurement channel or replacing an existing one.
For more information on controlling measurement applications, refer to the documentation of the R&S VSE base software.
When you start the LTE application, the R&S VSE starts to measure the input signal
with the default configuration or the configuration of the last measurement (if you
haven't performed a preset since then).
Automatic refresh of preview and visualization in dialog boxes after configuration changes
The R&S VSE supports you in finding the correct measurement settings quickly and
easily - after each change in settings in dialog boxes, the preview and visualization
areas are updated immediately and automatically to reflect the changes. Thus, you can
see if the setting is appropriate or not before accepting the changes.
Configuration
Configuration Overview
Unavailable menus
Note that the "Trace" and "Lines" menus have no contents and no function in the LTE
application.
● Configuration Overview...........................................................................................40
● Configuring I/Q Measurements............................................................................... 42
● Configuring Time Alignment Error Measurements..................................................83
5.1 Configuration Overview
Throughout the measurement channel configuration, an overview of the most important
currently defined settings is provided in the "Overview". The "Overview" is displayed
when you select the "Overview" menu item from the "Meas Setup" menu.
40User Manual 1176.8997.02 ─ 06
Page 41

R&S®VSE-K10x (LTE Uplink)
In addition to the main measurement settings, the "Overview" provides quick access to
the main settings dialog boxes. The individual configuration steps are displayed in the
order of the data flow. Thus, you can easily configure an entire measurement channel
from input over processing to output and analysis by stepping through the dialog boxes
as indicated in the "Overview".
Configuration
Configuration Overview
In particular, the "Overview" provides quick access to the following configuration dialog
boxes (listed in the recommended order of processing):
1. Signal Description
See Chapter 5.2.1, "Defining Signal Characteristics", on page 43.
2. Input / Frontend
See Chapter 5.2.10, "Selecting the Input and Output Source", on page 70.
3. Trigger / Signal Capture
See Chapter 5.2.14, "Triggering Measurements", on page 78.
See Chapter 5.2.13, "Configuring the Data Capture", on page 77
4. Tracking
See Chapter 5.2.15, "Tracking", on page 80.
5. Demodulation
See Chapter 5.2.16, "Signal Demodulation", on page 81.
6. Evaluation Range
See Chapter 6.3, "Evaluation Range", on page 85.
7. Analysis
See Chapter 6, "Analysis", on page 84.
8. Display Configuration
See Chapter 4, "Measurements and Result Displays", on page 21.
In addition, the dialog box provides the "Select Measurement" button that serves as a
shortcut to select the measurement type.
41User Manual 1176.8997.02 ─ 06
Page 42

R&S®VSE-K10x (LTE Uplink)
To configure settings
► Select any button in the "Overview" to open the corresponding dialog box.
Select a setting in the channel bar (at the top of the measurement channel tab) to
change a specific setting.
Preset Channel
Select the "Preset Channel" button in the lower left-hand corner of the "Overview" to
restore all measurement settings in the current channel to their default values.
Remote command:
SYSTem:PRESet:CHANnel[:EXEC] on page 146
Select Measurement
Opens a dialog box to select the type of measurement.
For more information, see Chapter 4.1, "Selecting Measurements", on page 21.
Remote command:
CONFigure[:LTE]:MEASurement on page 145
Configuration
Configuring I/Q Measurements
Specifics for
The channel may contain several windows for different results. Thus, the settings indicated in the "Overview" and configured in the dialog boxes vary depending on the
selected window.
Select an active window from the "Specifics for" selection list that is displayed in the
"Overview" and in all window-specific configuration dialog boxes.
The "Overview" and dialog boxes are updated to indicate the settings for the selected
window.
5.2 Configuring I/Q Measurements
● Defining Signal Characteristics............................................................................... 43
● Configuring MIMO Setups.......................................................................................49
● Configuring Subframes........................................................................................... 51
● Defining Global Signal Characteristics....................................................................57
● Configuring the Demodulation Reference Signal....................................................58
● Configuring the Sounding Reference Signal...........................................................60
● Defining the PUSCH Structure................................................................................64
● Defining the PUCCH Structure................................................................................65
● Defining the PRACH Structure................................................................................68
● Selecting the Input and Output Source................................................................... 70
● Defining the Frequency...........................................................................................74
● Defining Level Characteristics.................................................................................75
● Configuring the Data Capture................................................................................. 77
● Triggering Measurements....................................................................................... 78
● Tracking.................................................................................................................. 80
● Signal Demodulation...............................................................................................81
42User Manual 1176.8997.02 ─ 06
Page 43

R&S®VSE-K10x (LTE Uplink)
5.2.1 Defining Signal Characteristics
Access: "Overview" > "Signal Description" > "Signal Description"
The general signal characteristics contain settings to describe the general physical
attributes of the signal. They are part of the "Signal Description" tab of the "Signal
Description" dialog box.
Configuration
Configuring I/Q Measurements
Selecting the LTE mode................................................................................................ 43
Using Test Scenarios.................................................................................................... 44
Carrier Aggregation.......................................................................................................44
└ Basic component carrier configuration............................................................44
└ Features of the I/Q measurements................................................................. 45
└ Features of the Time Alignment Error measurement......................................46
└ Remote commands to configure carrier aggregation......................................46
Channel Bandwidth / Number of Resource Blocks....................................................... 47
Cyclic Prefix.................................................................................................................. 47
Configuring TDD Frames.............................................................................................. 47
└ TDD UL/DL Allocations...................................................................................47
└ Conf. of Special Subframe..............................................................................48
Configuring the Physical Layer Cell Identity..................................................................48
Operating Band Index................................................................................................... 49
Extreme Conditions.......................................................................................................49
Selecting the LTE mode
The "Mode" selects the LTE standard you are testing.
The choices you have depend on the set of options you have installed.
●
Option xxx-K100 enables testing of 3GPP LTE FDD signals on both uplink and
downlink
●
Option xxx-K102 enables testing of 3GPP LTE MIMO signals on both uplink and
downlink
●
Option xxx-K104 enables testing of 3GPP LTE TDD signals on both uplink and
downlink
●
Option xxx-K106 enables testing of 3GPP LTE NB-IoT TDD signals on both uplink
and downlink
FDD and TDD are duplexing methods.
●
FDD mode uses different frequencies for the uplink and the downlink.
43User Manual 1176.8997.02 ─ 06
Page 44

R&S®VSE-K10x (LTE Uplink)
●
TDD mode uses the same frequency for the uplink and the downlink.
Downlink (DL) and Uplink (UL) describe the transmission path.
●
Downlink is the transmission path from the base station to the user equipment.
The physical layer mode for the downlink is always OFDMA.
●
Uplink is the transmission path from the user equipment to the base station.
The physical layer mode for the uplink is always SC-FDMA.
Remote command:
Link direction: CONFigure[:LTE]:LDIRection on page 147
Duplexing mode: CONFigure[:LTE]:DUPLexing on page 147
Using Test Scenarios
Test scenarios are descriptions of specific LTE signals.
If these test scenarios are specified in the LTE standard, they are also called test mod-
els. Various test models are already provided by the LTE application.
The "Test Models" dialog box contains functionality to select, manage and create test
models.
●
"Specification"
The "Specification" tab contains predefined test models as defined by 3GPP.
Predefined test models are supported in downlink mode.
●
"User Defined"
The "User Defined" tab contains functionality to manage custom test scenarios.
Custom test models are supported in downlink and uplink mode.
To create a custom test scenario, describe a signal as required and then save it
with the corresponding button.
Here, you can also restore custom test scenarios and delete ones you do not need
anymore.
Configuration
Configuring I/Q Measurements
Carrier Aggregation
Carrier aggregation has been introduced in the LTE standard to increase the bandwidth. In those systems, several carriers can be used to transmit a signal.
Each carrier usually has one of the channel bandwidths defined by 3GPP.
The R&S VSE features several measurements that support contiguous and non-contig-
uous intra-band carrier aggregation (the carriers are in the same frequency band).
●
I/Q Based Measurements (EVM, Frequency Error, etc.) (downlink)
●
I/Q Based Measurements (EVM, Frequency Error, etc.) (uplink)
●
Time Alignment Error (downlink)
●
Time Alignment Error (uplink)
The way to configure these measurements is similar (but not identical, the differences
are indicated below).
●
"Basic component carrier configuration" on page 44
●
"Features of the I/Q measurements" on page 45
●
"Features of the Time Alignment Error measurement" on page 46
●
"Remote commands to configure carrier aggregation" on page 46
Basic component carrier configuration ← Carrier Aggregation
The number of component carriers (CCs) you can select depends on the measurement.
●
I/Q based measurements (EVM etc.): up to 2 CCs
44User Manual 1176.8997.02 ─ 06
Page 45

R&S®VSE-K10x (LTE Uplink)
●
Time Alignment Error: up to 2 CCs
●
The "Center Frequency" defines the carrier frequency of the carriers.
●
For each carrier, you can select the "Bandwidth" from the corresponding dropdown
menu.
●
For all component carriers, the R&S VSE also shows the "Frequency Offset" relative to the center frequency of the first carrier.
Note that the application automatically calculates the frequency and offset of the second (or subsequent) carrier according to the specification.
Note that the actual measurement frequency differs from the carrier frequencies: the
application calculates that frequency based on the carrier frequencies. It is somewhere
in between the carrier frequencies.
The measurement frequency is displayed at the bottom of the diagram area.
Selecting the channel bandwidths of each carrier is possible in two ways.
●
Predefined bandwidth combinations
Select a typical combination of channel bandwidths from the dropdown menu.
This way, you just have to define the center frequency of the first carrier. The application calculates the rest of the frequency characteristics.
●
User Defined
Select "User Defined" from the dropdown menu to test a system with channel
bandwidths not in the list of predefined combinations.
When you select a user-defined combination, you can select the channel bandwidth for each carrier from the "Bandwidth" dropdown menus.
When the defined carrier configuration is not supported by the application, a corresponding error message is displayed. This can be the case, for example, if the carriers
occupy a bandwidth that is too large.
Configuration
Configuring I/Q Measurements
Features of the I/Q measurements ← Carrier Aggregation
For measurements on component carriers, results are shown for each component carrier separately. The layout of the diagrams is adjusted like this:
●
The first tab ("All") shows the results for all component carriers.
●
The other tabs ("CC <x>") show the results for each component carrier individually.
The application also shows the "Occupied Bandwidth" of the aggregated carriers and
the "Sample Rate" in a read-only field below the carrier configuration.
45User Manual 1176.8997.02 ─ 06
Page 46

R&S®VSE-K10x (LTE Uplink)
The application also allows you to select the location of the local oscillator (LO) in your
system. You can thus define if your system uses one LO (for both carriers) or two LOs
(one for each carrier). This can be useful if you want to reliably exclude the DC component from the measurement results in both scenarios.
The application supports the following "LO locations".
●
Center of each component carrier
One LO for each carrier that is located at the center frequency of the component
carrier. See Basic component carrier configuration for information about how center
frequencies are defined.
●
Center of aggregated channel bandwidth
One LO for both carriers that is located at the center of the aggregated carriers.
●
User defined
One LO for both carriers that is not necessarily located at the center of the aggregated carriers.
When you select this option, the application opens an input field to define the real
"LO Frequency", which you arbitrarily define.
Configuration
Configuring I/Q Measurements
Features of the Time Alignment Error measurement ← Carrier Aggregation
Note that the TAE measurements are possible on one R&S VSE only. Therefore the
number of devices to measure is always "1".
You can configure additional signal characteristics of the first and second carrier in the
"CC1" and "CC2" tabs.
More information
In case you are testing a MIMO DUT, you can also select the number of antennas the
DUT supports. When you select "1 Tx Antenna", the application measures the timing
difference between two SISO carriers, when you select more than one antenna, it
measures the timing difference between the antennas. In that case, you can select the
reference antenna from the dropdown menu in the Time Alignment Error result display.
Note that the application shows measurement results for the second component carrier
even if only one antenna of the second component carrier is attached (i.e. no combiner
is used).
Remote commands to configure carrier aggregation ← Carrier Aggregation
Remote command:
Number of carriers: CONFigure[:LTE]:NOCC on page 197
Carrier frequency: [SENSe:]FREQuency:CENTer[:CC<cc>] on page 178
Measurement frequency: SENSe:FREQuency:CENTer?
Offset: [SENSe]:FREQuency:CENTer[:CC<cc>]:OFFSet on page 179
Channel bandwidth: CONFigure[:LTE]:UL[:CC<cc>]:BW on page 147
LO location: [SENSe][:LTE]:UL:DEMod:LOLocation on page 152
LO frequency: [SENSe][:LTE]:UL:DEMod:LOFRequency on page 152
46User Manual 1176.8997.02 ─ 06
Page 47

R&S®VSE-K10x (LTE Uplink)
Channel Bandwidth / Number of Resource Blocks
Specifies the channel bandwidth and number of resource blocks (RB).
The channel bandwidth and number of resource blocks (RB) are interdependent. Cur-
rently, the LTE standard recommends six bandwidths (see table below).
The application also calculates the FFT size, sampling rate, occupied bandwidth and
occupied carriers from the channel bandwidth. Those are read only.
Channel Bandwidth [MHz] 1.4 20151053
Number of Resource Blocks 6 10075502515
Sample Rate [MHz] 1.92 30.7230.7215.367.683.84
FFT Size 128 204820481024512256
For more information about configuring aggregated carriers, see "Carrier Aggregation"
on page 44.
The application shows the currently selected LTE mode (including the bandwidth) in
the channel bar.
Remote command:
CONFigure[:LTE]:UL[:CC<cc>]:BW on page 147
Configuration
Configuring I/Q Measurements
Cyclic Prefix
The cyclic prefix serves as a guard interval between OFDM symbols to avoid interferences. The standard specifies two cyclic prefix modes with a different length each.
The cyclic prefix mode defines the number of OFDM symbols in a slot.
●
Normal
A slot contains 7 OFDM symbols.
●
Extended
A slot contains 6 OFDM symbols.
The extended cyclic prefix is able to cover larger cell sizes with higher delay
spread of the radio channel.
●
Auto
The application automatically detects the cyclic prefix mode in use.
Remote command:
CONFigure[:LTE]:UL[:CC<cc>]:CYCPrefix on page 148
Configuring TDD Frames
TDD frames contain both uplink and downlink information separated in time with every
subframe being responsible for either uplink or downlink transmission. The standard
specifies several subframe configurations or resource allocations for TDD systems.
TDD UL/DL Allocations ← Configuring TDD Frames
Selects the configuration of the subframes in a radio frame in TDD systems.
47User Manual 1176.8997.02 ─ 06
Page 48

R&S®VSE-K10x (LTE Uplink)
The UL/DL configuration (or allocation) defines the way each subframe is used: for
uplink, downlink or if it is a special subframe. The standard specifies seven different
configurations.
Configuration
Configuring I/Q Measurements
Configuration
0
1
2
3
4
5
6
U = uplink
D = downlink
S = special subframe
0 987654321
D
D
D
D
D
D
D
S
S
S
S
S
S
S
Subframe Number and Usage
U
U
U
U
U
D
U
D
D
U
U
U
U
U
D
U
D
D
U
U
U
D
S
U
U
U
D
S
U
U
D
D
S
U
D
D
D
D
D
D
D
D
D
D
D
D
D
D
D
D
D
D
S
U
U
D
Remote command:
Subframe: CONFigure[:LTE]:UL[:CC<cc>]:TDD:UDConf on page 150
Conf. of Special Subframe ← Configuring TDD Frames
In combination with the cyclic prefix, the special subframes serve as guard periods for
switches from uplink to downlink. They contain three parts or fields.
●
DwPTS
The DwPTS is the downlink part of the special subframe. It is used to transmit
downlink data.
●
GP
The guard period makes sure that there are no overlaps of up- and downlink signals during a switch.
●
UpPTS
The UpPTS is the uplink part of the special subframe. It is used to transmit uplink
data.
The length of the three fields is variable. This results in several possible configurations
of the special subframe. The LTE standard defines 10 different configurations for the
special subframe. However, configurations 8 and 9 only work for a normal cyclic prefix.
If you select configurations 8 or 9 using an extended cyclic prefix or automatic detection of the cyclic prefix, the application will show an error message.
Remote command:
Special subframe: CONFigure[:LTE]:UL[:CC<cc>]:TDD:SPSC on page 149
Configuring the Physical Layer Cell Identity
The "Cell ID", "Cell Identity Group" and physical layer "Identity" are interdependent
parameters. In combination, they are responsible for synchronization between network
and user equipment.
The physical layer cell ID identifies a particular radio cell in the LTE network. The cell
identities are divided into 168 unique cell identity groups. Each group consists of 3
physical layer identities. According to:
48User Manual 1176.8997.02 ─ 06
Page 49

R&S®VSE-K10x (LTE Uplink)
)2()1(
3
IDID
cell
ID
NNN
(1)
= cell identity group, {0...167}
N
(2)
= physical layer identity, {0...2}
N
there is a total of 504 different cell IDs.
If you change one of these three parameters, the application automatically updates the
other two.
The cell ID determines:
●
The reference signal grouping hopping pattern
●
The reference signal sequence hopping
●
The PUSCH demodulation reference signal pseudo-random sequence
●
The cyclic shifts for PUCCH formats 1/1a/1b and sequences for PUCCH formats
2/2a/2b
●
The pseudo-random sequence used for scrambling
●
The pseudo-random sequence used for type 2 PUSCH frequency hopping
It is possible to select a separate "Identity" for Demodulation Reference Signal,
PUSCH and PUCCH allocations from the "Identity" property in the "Advanced Signal
Characteristics". When you select "From Cell ID", the "Identity" for the DMRS, PUSCH
and PUCCH is the same as the Cell ID.
Remote command:
Cell ID: CONFigure[:LTE]:UL[:CC<cc>]:PLC:CID on page 148
Cell Identity Group: CONFigure[:LTE]:UL[:CC<cc>]:PLC:CIDGroup
on page 149
Identity: CONFigure[:LTE]:UL[:CC<cc>]:PLC:PLID on page 149
Configuration
Configuring I/Q Measurements
Operating Band Index
Selects one of the 40 operating bands for spectrum flatness measurements as defined
in TS 36.101.
The operating band defines the frequency band and the dedicated duplex mode.
Remote command:
[SENSe:][LTE:]SFLatness:OBANd on page 151
Extreme Conditions
Turns extreme conditions on and off.
If you turn the extreme conditions on, the software will modify the limit lines for the limit
check of the spectral flatness measurement.
Remote command:
[SENSe:][LTE:]SFLatness:ECONditions on page 151
5.2.2 Configuring MIMO Setups
Access: "Overview" > "Signal Description" > "MIMO Setup"
The MIMO Configuration contains settings to configure MIMO test setups.
49User Manual 1176.8997.02 ─ 06
Page 50

R&S®VSE-K10x (LTE Uplink)
Configuring component carriers
When you are doing measurements on aggregated carriers, you can configure each
carrier separately.
When available, each carrier in the dialog boxes is represented by an additional tab
labeled "CC<x>", with <x> indicating the number of the component carrier.
Note that the additional tabs are only added to the user interface after you have
selected more than "1" component carrier.
Configuration
Configuring I/Q Measurements
MIMO Configuration......................................................................................................50
Input Source Configuration Table..................................................................................51
MIMO Configuration
Selects the antenna configuration and test conditions for a MIMO system.
The source of the data is either live data recorded with an instrument or previously
recorded data stored in a file.
The MIMO configuration selects the number of transmit antennas for selected chan-
nels in the system. MIMO configurations are supported for the PUSCH, the PUCCH
and the Sounding Reference Signal (SRS). For each channel you can select from a 1-,
2- or 4-antenna configuration.
In setups with multiple antennas, the antenna selection defines the antenna you'd like
to test. Note that as soon as you have selected a transmission on more than one
antenna for one of the channels, the corresponding number of antennas becomes
available for testing.
Antenna 1 Tests antenna 1 only.
Antenna 2 Tests antenna 2 only.
Antenna 3 Tests antenna 3 only.
Antenna 4 Tests antenna 4 only.
All Tests all antennas in the test setup in consecutive order (1-2-3-4).
A corresponding number of analyzers is required.
50User Manual 1176.8997.02 ─ 06
Page 51

R&S®VSE-K10x (LTE Uplink)
Note that the table for simultaneous signal capture is currently restricted to one device
or input source.
Remote command:
CONFigure[:LTE]:UL[:CC<cc>]:MIMO:SRS:CONFig on page 154
CONFigure[:LTE]:UL[:CC<cc>]:MIMO:PUCCh:CONFig on page 153
CONFigure[:LTE]:UL[:CC<cc>]:MIMO:PUSCh:CONFig on page 153
CONFigure[:LTE]:UL[:CC<cc>]:MIMO:ASELection on page 153
Input Source Configuration Table
MIMO measurements require several input sources, depending on the number of data
streams you are about to measure. The input source is either a spectrum analyzer or
an oscilloscope.
For each data stream, you need either one spectrum analyzer or one oscilloscope
channel.
You can configure the connected instruments in the "Instruments" dialog box.
The input source configuration table provides functionality to assign data streams to
the connected instruments.
Each row in the table represents one instrument. The size of the table therefore
depends on the number of antennas you have selected.
Table for input source = instrument
●
"Source": Index number of the connected instrument.
●
"State": Shows the connection state (connected or not connected).
●
"Instrument": Shows the name of the connected instrument.
●
"Input Source": Assigns the instrument to capture a specific data stream.
Table for input source = file
●
"Source": Index number of the input source.
●
"State": Shows if the selected file was found or not.
●
"File": Shows the name of the selected file.
●
"I/Q Channel": Assigns the file to a specific data stream.
Remote command:
not supported
Configuration
Configuring I/Q Measurements
5.2.3 Configuring Subframes
Access: "Overview" > "Signal Description" > "Subframe Configuration"
An LTE frame consists of 10 subframes. Each individual subframe can have a different
resource block configuration. This configuration is shown in the "Subframe Configuration Table".
The application supports two ways to determine the characteristics of each subframe.
●
Automatic demodulation of the channel configuration and detection of the subframe
characteristics.
For automatic demodulation, the contents of the table are determined according to
the signal currently evaluated.
For more information, see "Auto Demodulation" on page 52.
●
Custom configuration of the configuration of each subframe.
51User Manual 1176.8997.02 ─ 06
Page 52

R&S®VSE-K10x (LTE Uplink)
For manual configuration, you can customize the table according to the signal that
you expect. The signal is demodulated even if the signal does not fit the description
in the table or, for Physical Detection, only if the frame fits the description in the
table.
Remote command:
Conf. subframes: CONFigure[:LTE]:UL[:CC<cc>]:CSUBframes on page 155
Configuration
Configuring I/Q Measurements
Frame number offset
A frame number offset is also supported. The frame number offset assigns a number to
the demodulated frame in order to identify it in a series of transmitted (and captured)
frames. You can define this frame in the Global Settings.
Remote command:
CONFigure[:LTE]:UL[:CC<cc>]:SFNO on page 160
● General Subframe Configuration............................................................................ 52
● Individual Subframe Configuration..........................................................................53
● Enhanced Settings..................................................................................................55
5.2.3.1 General Subframe Configuration
Auto Demodulation........................................................................................................52
Subframe Configuration Detection................................................................................53
Auto Demodulation
Turns automatic demodulation on and off.
When you select "Predefined" mode, you can configure the subframe manually.
When you select "Auto" mode, the R&S VSE automatically detects the characteristics
of each subframe in the signal (resource allocation of the signal). Two methods of
detection are supported:
●
Auto Demodulation, DMRS Auto Detection (Off)
52User Manual 1176.8997.02 ─ 06
Page 53

R&S®VSE-K10x (LTE Uplink)
This method automatically determines the characteristics for each subframe as
shown in the Subframe Configuration Table.
The table is populated accordingly.
●
Subframe Configuration & DMRS
Auto Demodulation, DMRS Auto Detection (On)
This method automatically detects the PUSCH and SRS (i.e. no PUCCH can be
detected).
To determine these characteristics, the software detects the CAZAC base parameters. Thus, the DMRS configuration parameters are not required for the synchronization and therefore are not available using this method.
Note however that it is not possible to derive the DMRS configuration parameters
from the CAZAC base parameters so that the disabled DMRS configuration parameters do not reflect the current parameters used for the synchronization. Also note
that it can happen that the software successfully synchronizes on non-3GPP signals without a warning.
Automatic demodulation is not available if you suppress interferers for synchronization
is active.
Remote command:
[SENSe:][LTE:]UL:DEMod:ACON on page 159
Configuration
Configuring I/Q Measurements
Subframe Configuration Detection
Turns the detection of the subframe configuration on and off.
When you select "Physical Detection", the R&S VSE compares the currently demodu-
lated LTE frame to the subframe configuration you have defined in the table. The application only analyzes the LTE frame if the signal is consistent with the configuration.
When you turn the feature "Off", the software analyzes the signal even if it is not consistent with the current subframe configuration.
Subframe configuration detection is available if you are using a Predefined subframe
configuration.
Remote command:
[SENSe:][LTE:]UL:FORMat:SCD on page 159
5.2.3.2 Individual Subframe Configuration
The "Subframe Configuration Table" contains the characteristics for each subframe.
The software supports a maximum uplink LTE frame size of 10 subframes. The subframe number in the table depends on the number of "Configurable Subframes" that
you have defined or that have been detected for automatic demodulation.
53User Manual 1176.8997.02 ─ 06
Page 54

R&S®VSE-K10x (LTE Uplink)
Each row of the table represents one subframe. If the fields in a row are unavailable for
editing, the corresponding subframe is occupied by a downlink subframe or the special
subframe (in TDD systems).
Configuring component carriers
When you are doing measurements on aggregated carriers, you can configure each
carrier separately.
When available, each carrier in the dialog boxes is represented by an additional tab
labeled "CC<x>", with <x> indicating the number of the component carrier.
Note that the additional tabs are only added to the user interface after you have
selected more than "1" component carrier.
Subframe Number.........................................................................................................54
Enable PUCCH............................................................................................................. 54
Enable PUSCH............................................................................................................. 54
Modulation.....................................................................................................................54
Enhanced Settings........................................................................................................55
Number of RB............................................................................................................... 55
Offset RB.......................................................................................................................55
Configuration
Configuring I/Q Measurements
Subframe Number
Shows the number of a subframe.
Note that, depending on the TDD configuration, some subframes may not be available
for editing. The R&S VSE labels those subframes "(not used)".
Enable PUCCH
Turns the PUCCH in the corresponding subframe on and off.
Remote command:
CONFigure[:LTE]:UL[:CC<cc>]:SUBFrame<sf>:ALLoc:CONT on page 155
Enable PUSCH
Turns the PUSCH in the corresponding subframe on and off.
If you turn on a PUSCH, "Modulation", "Number of RBs" and "Offset RB" become avail-
able.
Remote command:
CONFigure[:LTE]:UL[:CC<cc>]:SUBFrame<sf>:ALLoc:CONT on page 155
Modulation
Selects the modulation scheme for the corresponding PUSCH allocation.
The modulation scheme is either QPSK, 16QAM, 64QAM or 256QAM.
Remote command:
CONFigure[:LTE]:UL[:CC<cc>]:SUBFrame<sf>:ALLoc:MODulation
on page 155
54User Manual 1176.8997.02 ─ 06
Page 55

R&S®VSE-K10x (LTE Uplink)
Enhanced Settings
Opens a dialog box to configure enhanced functionality for selected channels in each
subframe.
For more information see Enhanced Settings.
Number of RB
Sets the number of resource blocks the PUSCH allocation covers. The number of
resource blocks defines the size or bandwidth of the PUSCH allocation.
Remote command:
CONFigure[:LTE]:UL[:CC<cc>]:SUBFrame<sf>:ALLoc[:CLUSter<cl>]:
RBCount on page 158
Offset RB
Sets the resource block at which the PUSCH allocation begins.
Make sure not to allocate PUSCH allocations into regions reserved for PUCCH alloca-
tions.
Remote command:
CONFigure[:LTE]:UL[:CC<cc>]:SUBFrame<sf>:ALLoc[:CLUSter<cl>]:
RBOFfset on page 159
Configuration
Configuring I/Q Measurements
5.2.3.3 Enhanced Settings
The "Enhanced Settings" contain functionality to define enhanced characteristics for
selected channels.
Note that currently not all features available in the dialog are supported.
Enhanced PUSCH Configuration..................................................................................55
Enhanced Demodulation Reference Signal Configuration............................................56
Enhanced PUCCH Configuration..................................................................................56
Enhanced PUSCH Configuration
Configures the PUSCH in individual subframes.
Note: The Codeword to Layer Mapping and Spatial Multiplexing are not yet supported.
Resource Allocation Type 1
Turns a clustered PUSCH allocation on and off. If on, a second row is added to the corresponding allocation. This second row represents the second cluster.
You can define the number of resource block, the offset resource block and modulation
for each cluster. All other parameters are the same for both clusters.
55User Manual 1176.8997.02 ─ 06
Page 56

R&S®VSE-K10x (LTE Uplink)
Remote command:
CONFigure[:LTE]:UL[:CC<cc>]:SUBFrame<sf>:ALLoc:RATO on page 158
Enhanced Demodulation Reference Signal Configuration
Configures the Demodulation Reference Signal in individual subframes.
n(2)_DMRS
Defines the part of the demodulation reference signal index that is part of the uplink
scheduling assignment. Thus, this part of the index is valid for corresponding UE and
subframe only.
The index applies when multiple shifts within a cell are used. It is used for the calculation of the DMRS sequence.
Cyclic Shift Field
If Activate-DMRS-With OCC is on, the "Cyclic Shift Field" becomes available to define
the cyclic shift field.
The Cyclic Shift Field is signaled by the PDCCH downlink channel in DCI format 0 and
4. It selects n(2)_DMRS and the orthogonal sequence (OCC) for signals according to
LTE release 10.
If the "Cyclic Shift Field" is off, the demodulation reference signal is configured by the
n(2)_DMRS parameter.
Remote command:
CONFigure[:LTE]:UL[:CC<cc>]:SUBFrame<sf>:ALLoc:PUSCh:NDMRs
on page 158
CONFigure[:LTE]:UL[:CC<cc>]:SUBFrame<sf>:ALLoc:PUSCh:CSField
on page 157
Configuration
Configuring I/Q Measurements
Enhanced PUCCH Configuration
Configures the PUCCH in individual subframes.
n_PUCCH
Defines the n_PUCCH parameter for the selected subframe.
Available only if you have selected "Per Subframe" for the N_PUCCH.
PUCCH Format
Selects the PUCCH format for the selected subframe.
Available only if you have selected "Per Subframe" for the Format.
Remote command:
n_PUCCH: CONFigure[:LTE]:UL[:CC<cc>]:SUBFrame<sf>:ALLoc:PUCCh:
NPAR on page 157
Format: CONFigure[:LTE]:UL[:CC<cc>]:SUBFrame<sf>:ALLoc:PUCCh:
FORMat on page 156
56User Manual 1176.8997.02 ─ 06
Page 57

R&S®VSE-K10x (LTE Uplink)
5.2.4 Defining Global Signal Characteristics
Access: "Overview" > "Signal Description" > "Advanced Settings" > "Global Settings"
The global settings contain settings that apply to the complete signal.
The global signal settings are part of the "Advanced Settings" tab of the "Signal
Description" dialog box.
Configuration
Configuring I/Q Measurements
Configuring component carriers
When you are doing measurements on aggregated carriers, you can configure each
carrier separately.
When available, each carrier in the dialog boxes is represented by an additional tab
labeled "CC<x>", with <x> indicating the number of the component carrier.
Note that the additional tabs are only added to the user interface after you have
selected more than "1" component carrier.
Frame Number Offset....................................................................................................57
UE ID/n_RNTI............................................................................................................... 57
Frame Number Offset
Defines a frame number offset for the analyzed frame.
The frame number offset assigns a number to the demodulated frame in order to iden-
tify it in a series of transmitted (and captured) frames.
Remote command:
CONFigure[:LTE]:UL[:CC<cc>]:SFNO on page 160
UE ID/n_RNTI
Sets the radio network temporary identifier (RNTI) of the UE.
Remote command:
CONFigure[:LTE]:UL[:CC<cc>]:UEID on page 160
57User Manual 1176.8997.02 ─ 06
Page 58

R&S®VSE-K10x (LTE Uplink)
5.2.5 Configuring the Demodulation Reference Signal
Access: "Overview" > "Signal Description" > "Advanced Settings" > "Demodulation
Reference Signal"
The demodulation reference signal (DRS) settings contain settings that define the
physical attributes and structure of the demodulation reference signal. This reference
signal helps to demodulate the PUSCH.
The demodulation reference signal settings are part of the "Advanced Settings" tab of
the "Signal Description" dialog box.
Configuration
Configuring I/Q Measurements
Functions to configure the DRS described elsewhere:
●
Identity
Configuring component carriers
When you are doing measurements on aggregated carriers, you can configure each
carrier separately.
When available, each carrier in the dialog boxes is represented by an additional tab
labeled "CC<x>", with <x> indicating the number of the component carrier.
Note that the additional tabs are only added to the user interface after you have
selected more than "1" component carrier.
Relative Power PUSCH................................................................................................ 58
Group Hopping..............................................................................................................59
Sequence Hopping........................................................................................................59
Relative Power PUCCH................................................................................................ 59
n(1)_DMRS................................................................................................................... 59
Delta Sequence Shift.................................................................................................... 60
Activate-DMRS-With OCC............................................................................................ 60
Relative Power PUSCH
Defines the power of the DMRS relative to the power level of the PUSCH allocation in
the corresponding subframe (P
DMRS_Offset
).
58User Manual 1176.8997.02 ─ 06
Page 59

R&S®VSE-K10x (LTE Uplink)
The effective power level of the DMRS depends on the allocation of the subframe and
is calculated as follows.
P
= PUE + P
DMRS
The relative power of the DMRS is applied to all subframes.
The power of the PUSCH (P
Remote command:
CONFigure[:LTE]:UL[:CC<cc>]:DRS[:PUSCh]:POWer on page 162
Group Hopping
Turns group hopping for the demodulation reference signal on and off.
The group hopping pattern is based on 17 hopping patterns and 30 sequence shift pat-
terns. It is generated by a pseudo-random sequence generator.
If on, PUSCH and PUCCH use the same group hopping pattern.
Remote command:
CONFigure[:LTE]:UL[:CC<cc>]:DRS:GRPHopping on page 161
PUSCH
+ P
DMRS_Offset
PUSCH
Configuration
Configuring I/Q Measurements
) may be different in each subframe.
Sequence Hopping
Turns sequence hopping for the uplink demodulation reference signal on and off.
Sequence hopping is generated by a pseudo-random sequence generator.
Remote command:
CONFigure[:LTE]:UL[:CC<cc>]:DRS:SEQHopping on page 163
Relative Power PUCCH
Defines the power of the DMRS relative to the power level of the PUCCH allocation in
the corresponding subframe (P
DMRS_Offset
).
The effective power level of the DMRS depends on the allocation of the subframe and
is calculated as follows.
P
DMRS
= PUE + P
PUCCH
+ P
DMRS_Offset
The relative power of the DMRS is applied to all subframes.
The power of the PUCCH (P
) may be different in each subframe.
PUCCH
Remote command:
CONFigure[:LTE]:UL[:CC<cc>]:DRS:PUCCh:POWer on page 162
n(1)_DMRS
Defines the part of the demodulation reference signal index that is broadcast. It is valid
for the whole cell.
The index applies when multiple shifts within a cell are used. It is used for the calculation of the DMRS sequence.
The n_DMRS parameter can be found in 3GPP TS36.211 V8.5.0, 5.5.2.1.1 Reference
signal sequence.
Remote command:
CONFigure[:LTE]:UL[:CC<cc>]:DRS:NDMRs on page 162
59User Manual 1176.8997.02 ─ 06
Page 60

R&S®VSE-K10x (LTE Uplink)
Delta Sequence Shift
Defines the delta sequence shift ΔSS.
The standard defines a sequence shift pattern fss for the PUCCH. The corresponding
sequence shift pattern for the PUSCH is a function of f
shift.
For more information refer to 3GPP TS 36.211, chapter 5.5.1.3 "Group Hopping".
Remote command:
CONFigure[:LTE]:UL[:CC<cc>]:DRS:DSSHift on page 161
Activate-DMRS-With OCC
Turns the configuration of the demodulation reference signal on a subframe basis via
the "Cyclic Shift Field" on and off.
If on, the "Cyclic Shift Field" becomes available. Otherwise, the demodulation reference signal is configured by the n(2)_DMRS parameter.
Note that this parameter is automatically turned on if at least one of the physical channels uses more than one antenna.
For more information see Enhanced Settings and MIMO Configuration.
Remote command:
CONFigure[:LTE]:UL[:CC<cc>]:DRS:AOCC on page 161
Configuration
Configuring I/Q Measurements
PUCCH
ss
and the delta sequence
5.2.6 Configuring the Sounding Reference Signal
Access: "Overview" > "Signal Description" > "Advanced Settings" > "Sounding Refer-
ence Signal"
The sounding reference signal (SRS) settings contain settings that define the physical
attributes and structure of the sounding reference signal.
The sounding reference signal settings are part of the "Advanced Settings" tab of the
"Signal Description" dialog box.
60User Manual 1176.8997.02 ─ 06
Page 61

R&S®VSE-K10x (LTE Uplink)
Configuring component carriers
When you are doing measurements on aggregated carriers, you can configure each
carrier separately.
When available, each carrier in the dialog boxes is represented by an additional tab
labeled "CC<x>", with <x> indicating the number of the component carrier.
Note that the additional tabs are only added to the user interface after you have
selected more than "1" component carrier.
Present..........................................................................................................................61
SRS Subframe Configuration........................................................................................61
SRS MaxUpPts............................................................................................................. 61
SRS Bandwidth B_SRS................................................................................................ 61
Hopping BW b_hop.......................................................................................................62
SRS Cyclic Shift N_CS................................................................................................. 62
SRS Rel Power............................................................................................................. 62
SRS BW Conf. C_SRS................................................................................................. 62
Conf. Index I_SRS........................................................................................................ 63
Transm. Comb. k_TC....................................................................................................63
Freq. Domain Pos. n_RRC........................................................................................... 63
A/N + SRS Simultaneous TX........................................................................................ 63
Configuration
Configuring I/Q Measurements
Present
Includes or excludes the sounding reference signal (SRS) from the test setup.
Remote command:
CONFigure[:LTE]:UL[:CC<cc>]:SRS:STAT on page 166
SRS Subframe Configuration
Defines the subframe configuration of the SRS.
The subframe configuration of the SRS is specific to a cell. The UE sends a shortened
PUCCH/PUSCH in these subframes, regardless of whether the UE is configured to
send an SRS in the corresponding subframe or not.
Remote command:
CONFigure[:LTE]:UL[:CC<cc>]:SRS:SUConfig on page 166
SRS MaxUpPts
Turns the parameter srs_MaxUpPts on and off.
srs_MaxUpPts controls the SRS transmission in the UpPTS field in TDD systems. If
on, the SRS is transmitted in a frequency range of the UpPTS field that does not overlap with resources reserved for PRACH preamble 4 transmissions.
To avoid an overlap, the number of SRS resource blocks otherwise determined by
C_SRS and B_SRS is reconfigured.
Remote command:
CONFigure[:LTE]:UL[:CC<cc>]:SRS:MUPT on page 165
SRS Bandwidth B_SRS
Defines the parameter B
SRS
.
61User Manual 1176.8997.02 ─ 06
Page 62

R&S®VSE-K10x (LTE Uplink)
B
is a UE specific parameter that defines the bandwidth of the SRS. The SRS either
SRS
spans the entire frequency bandwidth or uses frequency hopping when several narrowband SRS cover the same total bandwidth.
The standard defines up to four bandwidths for the SRS. The most narrow SRS bandwidth (B
SRS
The other three values of B
ity depends on the channel bandwidth.
The availability of SRS bandwidths additionally depends on the bandwidth configuration of the SRS (C
For more information refer to 3GPP TS 36.211, chapter 5.5.3.2 "Mapping to Physical
Resources" for the Sounding Reference Signal.
Remote command:
CONFigure[:LTE]:UL[:CC<cc>]:SRS:BSRS on page 164
Hopping BW b_hop
Defines the parameter b
b
is a UE specific parameter that defines the frequency hopping bandwidth. SRS fre-
hop
quency hopping is active if b
For more information refer to 3GPP TS 36.211, chapter 5.5.3.2 "Mapping to Physical
Resources" for the Sounding Reference Signal.
Remote command:
CONFigure[:LTE]:UL[:CC<cc>]:SRS:BHOP on page 164
Configuration
Configuring I/Q Measurements
= 3) spans four resource blocks and is available for all channel bandwidths.
define more wideband SRS bandwidths. Their availabil-
SRS
).
SRS
.
hop
hop
< B
SRS
.
SRS Cyclic Shift N_CS
Defines the cyclic shift (nCS) used for the generation of the SRS CAZAC sequence.
Because the different shifts of the same Zadoff-Chu sequence are orthogonal to each
other, applying different SRS cyclic shifts can be used to schedule different UE to
simultaneously transmit their SRS.
Remote command:
CONFigure[:LTE]:UL[:CC<cc>]:SRS:CYCS on page 165
SRS Rel Power
Defines the power of the SRS relative to the power of the corresponding UE (P
).
set
SRS_Off-
The effective power level of the SRS is calculated as follows.
P
= PUE + P
SRS
SRS_Offset
The relative power of the SRS is applied to all subframes.
Remote command:
CONFigure[:LTE]:UL[:CC<cc>]:SRS:POWer on page 166
SRS BW Conf. C_SRS
Defines the bandwidth configuration of the SRS.
62User Manual 1176.8997.02 ─ 06
Page 63

R&S®VSE-K10x (LTE Uplink)
The bandwidth configuration is a cell-specific parameter that, in combination with the
SRS bandwidth and the channel bandwidth, defines the length of the sounding reference signal sequence. For more information on the calculation, refer to 3GPP TS
36.211 chapter 5.5.3 "Sounding Reference Signal".
Remote command:
CONFigure[:LTE]:UL[:CC<cc>]:SRS:CSRS on page 164
Conf. Index I_SRS
Defines the configuration index of the SRS.
The configuration index I
dicity (T
on T
SRS
SRS
and T
For more information refer to 3GPP TS 36.213, Table 8.2-1 (FDD) and 8.2-2 (TDD).
Remote command:
CONFigure[:LTE]:UL[:CC<cc>]:SRS:ISRS on page 165
Transm. Comb. k_TC
Defines the transmission comb kTC.
is a cell specific parameter that determines the SRS perio-
SRS
) and the SRS subframe offset (T
depends on the duplexing mode.
offset
Configuration
Configuring I/Q Measurements
). The effects of the configuration index
offset
The transmission comb. is a UE specific parameter. For more information refer to
3GPP TS 36.211, chapter 5.5.3.2 "Mapping to Physical Resources" for the Sounding
Reference Signal.
Remote command:
CONFigure[:LTE]:UL[:CC<cc>]:SRS:TRComb on page 167
Freq. Domain Pos. n_RRC
Defines the parameter n
n
is a UE specific parameter and determines the starting physical resource block of
RRC
RRC
.
the SRS transmission.
For more information refer to 3GPP TS 36.211, chapter 5.5.3.2 "Mapping to Physical
Resources" for the Sounding Reference Signal.
Remote command:
CONFigure[:LTE]:UL[:CC<cc>]:SRS:NRRC on page 166
A/N + SRS Simultaneous TX
Turns simultaneous transmission of the Sounding Reference Signal (SRS) and ACK/
NACK messages (via PUCCH) on and off.
By turning the parameter on, you allow for simultaneous transmission of PUCCH and
SRS in the same subframe.
If off, the SRS not transmitted in the subframe for which you have configured simultaneous transmission of PUCCH and SRS.
Note that simultaneous transmission of SRS and PUCCH is available only if the
PUCCH format is either 1, 1a, 1b or 3. The other PUCCH formats contain CQI reports
which are not transmitted with the SRS.
Remote command:
CONFigure[:LTE]:UL[:CC<cc>]:SRS:ANST on page 163
63User Manual 1176.8997.02 ─ 06
Page 64

R&S®VSE-K10x (LTE Uplink)
5.2.7 Defining the PUSCH Structure
Access: "Overview" > "Signal Description" > "Advanced Settings" > "PUSCH Struc-
ture"
The PUSCH structure settings contain settings that describe the physical attributes and
structure of the PUSCH.
The PUSCH structure settings are part of the "Advanced Settings" tab of the "Signal
Description" dialog box.
Configuration
Configuring I/Q Measurements
Functions to configure the PUSCH described elsewhere:
●
Identity
Configuring component carriers
When you are doing measurements on aggregated carriers, you can configure each
carrier separately.
When available, each carrier in the dialog boxes is represented by an additional tab
labeled "CC<x>", with <x> indicating the number of the component carrier.
Note that the additional tabs are only added to the user interface after you have
selected more than "1" component carrier.
Frequency Hopping Mode.............................................................................................64
Number of Subbands.................................................................................................... 65
PUSCH Hopping Offset.................................................................................................65
Info. in Hopping Bits......................................................................................................65
Frequency Hopping Mode
Selects the frequency hopping mode of the PUSCH.
Several hopping modes are supported.
●
None
No frequency hopping.
●
Inter Subframe Hopping
PUSCH changes the frequency from one subframe to another.
●
Intra Subframe Hopping
64User Manual 1176.8997.02 ─ 06
Page 65

R&S®VSE-K10x (LTE Uplink)
PUSCH also changes the frequency within a subframe.
Remote command:
CONFigure[:LTE]:UL[:CC<cc>]:PUSCh:FHMode on page 167
Number of Subbands
Defines the number of subbands reserved for PUSCH.
For more information refer to 3GPP TS 36.211, chapter 5.5.3.2 "Mapping to Physical
Resources" for the Sounding Reference Signal.
Remote command:
CONFigure[:LTE]:UL[:CC<cc>]:PUSCh:NOSM on page 168
PUSCH Hopping Offset
Defines the PUSCH Hopping Offset N
The PUSCH Hopping Offset determines the first physical resource block and the maxi-
mum number of physical resource blocks available for PUSCH transmission if PUSCH
frequency hopping is active.
Remote command:
CONFigure[:LTE]:UL[:CC<cc>]:PUSCh:FHOFfset on page 168
RB
HO
Configuration
Configuring I/Q Measurements
.
Info. in Hopping Bits
Defines the information available in the hopping bits according to the PDCCH DCI format 0 hopping bit definition.
The information in the hopping bits determines whether type 1 or type 2 hopping is
used in the subframe and, in case of type 1, additionally determines the exact hopping
function to use.
For more information on PUSCH frequency hopping refer to 3GPP TS36.213.
Remote command:
CONFigure[:LTE]:UL[:CC<cc>]:PUSCh:FHOP:IIHB on page 168
5.2.8 Defining the PUCCH Structure
Access: "Overview" > "Signal Description" > "Advanced Settings" > "PUCCH Struc-
ture"
The PUCCH structure settings contain settings that describe the physical attributes
and structure of the PUCCH.
The PUCCH structure settings are part of the "Advanced Settings" tab of the "Signal
Description" dialog box.
65User Manual 1176.8997.02 ─ 06
Page 66

R&S®VSE-K10x (LTE Uplink)
Functions to configure the PUCCH described elsewhere:
●
Identity
Configuration
Configuring I/Q Measurements
Configuring component carriers
When you are doing measurements on aggregated carriers, you can configure each
carrier separately.
When available, each carrier in the dialog boxes is represented by an additional tab
labeled "CC<x>", with <x> indicating the number of the component carrier.
Note that the additional tabs are only added to the user interface after you have
selected more than "1" component carrier.
No. of RBs for PUCCH..................................................................................................66
N(1)_cs..........................................................................................................................67
Delta Shift......................................................................................................................67
Format...........................................................................................................................67
N(2)_RB........................................................................................................................ 67
N_PUCCH.....................................................................................................................68
No. of RBs for PUCCH
Defines the number of resource blocks reserved for PUCCH.
The resource blocks for PUCCH are always allocated at the edges of the LTE spec-
trum.
In case of an even number of PUCCH resource blocks, half of the available PUCCH
resource blocks is allocated on the lower, the other half on the upper edge of the LTE
spectrum (outermost resource blocks).
In case of an odd number of PUCCH resource blocks, the number of resource blocks
on the lower edge is one resource block larger than the number of resource blocks on
the upper edge of the LTE spectrum.
If you select the "Auto" menu item, the application automatically detects the number of
RBs.
Remote command:
CONFigure[:LTE]:UL[:CC<cc>]:PUCCh:NORB on page 171
66User Manual 1176.8997.02 ─ 06
Page 67

R&S®VSE-K10x (LTE Uplink)
N(1)_cs
Defines the number of cyclic shifts used for PUCCH format 1/1a/1b in a resource block
used for a combination of the formats 1/1a/1b and 2/2a/2b.
Only one resource block per slot can support a combination of the PUCCH formats
1/1a/1b and 2/2a/2b.
The number of cyclic shifts available for PUCCH format 2/2a/2b N(2)_cs in a block with
combination of PUCCH formats is calculated as follows.
N(2)_cs = 12 - N(1)_cs - 2
For more information refer to 3GPP TS36.211, chapter 5.4 "Physical Uplink Control
Channel".
Remote command:
CONFigure[:LTE]:UL[:CC<cc>]:PUCCh:N1CS on page 170
Delta Shift
Defines the delta shift parameter.
The delta shift is the difference between two adjacent PUCCH resource indices with
the same orthogonal cover sequence (OC).
It determines the number of available sequences in a resource block that can be used
for PUCCH formats 1/1a/1b.
For more information refer to 3GPP TS36.211, chapter 5.4 "Physical Uplink Control
Channel".
Remote command:
CONFigure[:LTE]:UL[:CC<cc>]:PUCCh:DESHift on page 169
Configuration
Configuring I/Q Measurements
Format
Selects the format of the PUCCH.
You can define the PUCCH format for all subframes or define the PUCCH format for
each subframe individually.
●
F1, F1a, F1b, F2, F2a, F2b, F3
Selects the PUCCH format globally for every subframe.
●
Per Subframe
You can select the PUCCH format for each subframe separately in the Enhanced
Settings of the "Subframe Configuration".
Note that formats F2a and F2b are only supported for normal cyclic prefix length.
For more information refer to 3GPP TS36.211, table 5.4-1 "Supported PUCCH For-
mats".
Remote command:
CONFigure[:LTE]:UL[:CC<cc>]:PUCCh:FORMat on page 170
N(2)_RB
Defines bandwidth in terms of resource blocks that are reserved for PUCCH formats
2/2a/2b transmission in each subframe.
Since there can be only one resource block per slot that supports a combination of the
PUCCH formats 1/1a/1b and 2/2a/2b, the number of resource block(s) per slot available for PUCCH format 1/1a/1b is determined by N(2)_RB.
67User Manual 1176.8997.02 ─ 06
Page 68

R&S®VSE-K10x (LTE Uplink)
For more information refer to 3GPP TS36.211, chapter 5.4 "Physical Uplink Control
Channel".
Remote command:
CONFigure[:LTE]:UL[:CC<cc>]:PUCCh:N2RB on page 170
N_PUCCH
Defines the resource index for PUCCH format 1/1a/1b respectively 2/2a/2b.
You can select the PUCCH format manually or allow the application to determine the
PUCCH format automatically based on the measurement.
It is also possible to define N
menu item. For more information see Chapter 5.2.3, "Configuring Subframes",
on page 51.
Remote command:
CONFigure[:LTE]:UL[:CC<cc>]:PUCCh:NPAR on page 171
5.2.9 Defining the PRACH Structure
Configuration
Configuring I/Q Measurements
on a subframe level by selecting the "Per Subframe"
PUCCH
Access: "Overview" > "Signal Description" > "Advanced Settings" > "PRACH Structure"
The PRACH structure settings contain settings that describe the physical attributes and
structure of the PRACH.
The PRACH structure settings are part of the "Advanced Settings" tab of the "Signal
Description" dialog box.
68User Manual 1176.8997.02 ─ 06
Page 69

R&S®VSE-K10x (LTE Uplink)
Configuring component carriers
When you are doing measurements on aggregated carriers, you can configure each
carrier separately.
When available, each carrier in the dialog boxes is represented by an additional tab
labeled "CC<x>", with <x> indicating the number of the component carrier.
Note that the additional tabs are only added to the user interface after you have
selected more than "1" component carrier.
PRACH Configuration................................................................................................... 69
Restricted Set................................................................................................................69
Frequency Offset...........................................................................................................69
PRACH Preamble Mapping.......................................................................................... 69
Ncs Conf....................................................................................................................... 70
Logical Root Sequ. Idx..................................................................................................70
Sequence Index (v).......................................................................................................70
PRACH Configuration
Sets the PRACH configuration index as defined in the 3GPP TS 36.211, i.e. defines
the subframes in which random access preamble transmission is allowed.
The preamble format is automatically derived from the PRACH Configuration.
Remote command:
CONFigure[:LTE]:UL[:CC<cc>]:PRACh:CONF on page 172
Configuration
Configuring I/Q Measurements
Restricted Set
Selects whether a restricted preamble set (high speed mode) or the unrestricted preamble set (normal mode) will be used.
Remote command:
CONFigure[:LTE]:UL[:CC<cc>]:PRACh:RSET on page 174
Frequency Offset
The "Frequency Offset" defines the PRACH frequency offset for preamble formats 0 to
3 as defined in the 3GPP TS 36.211. The frequency offset determines the first physical
resource block available for PRACH expressed as a physical resource block number.
Remote command:
CONFigure[:LTE]:UL[:CC<cc>]:PRACh:FOFFset on page 173
PRACH Preamble Mapping
The frequency resource index fRA and the half frame indicator t1RA are necessary for
clear specification of the physical resource mapping of the PRACH, in case a PRACH
configuration index has more than one mapping alternative.
If you turn on the "Auto Preamble Mapping", the software automatically detects fRA and
t1RA.
The values for both parameters are defined in table '5.7.1-4: Frame structure type 2
random access preamble mapping in time and frequency' (3GPP TS 36.211 v10.2.0).
The frequency resource index and half frame indicator are available in TDD mode.
69User Manual 1176.8997.02 ─ 06
Page 70

R&S®VSE-K10x (LTE Uplink)
Remote command:
CONFigure[:LTE]:UL[:CC<cc>]:PRACh:APM on page 172
CONFigure[:LTE]:UL[:CC<cc>]:PRACh:FRINdex on page 173
CONFigure[:LTE]:UL[:CC<cc>]:PRACh:HFINdicator on page 173
Ncs Conf
Selects the Ncs configuration, i.e. determines the Ncs value set according to TS
36.211, table 5.7.2.-2 and 5.7.2-3.
Remote command:
CONFigure[:LTE]:UL[:CC<cc>]:PRACh:NCSC on page 173
Logical Root Sequ. Idx
Selects the logical root sequence index.
The logical root sequence index is used to generate preamble sequences. It is provi-
ded by higher layers.
Remote command:
CONFigure[:LTE]:UL[:CC<cc>]:PRACh:RSEQ on page 174
Configuration
Configuring I/Q Measurements
Sequence Index (v)
Defines the sequence index (v).
The sequence index controls which of the 64 preambles available in a cell is used.
If you select the "Auto" menu item, the software automatically selects the required
sequence index.
Remote command:
CONFigure[:LTE]:UL[:CC<cc>]:PRACh:SINDex on page 174
5.2.10 Selecting the Input and Output Source
The application supports several input sources and outputs.
The supported input sources depend on the connected instrument. Refer to the documentation of the instrument in use for a comprehensive description of input sources.
● RF Input.................................................................................................................. 70
● I/Q File Input............................................................................................................72
5.2.10.1 RF Input
Functions to configure the RF input described elsewhere:
●
" Input Coupling " on page 76
●
" Impedance " on page 76
Note that the actual functions to configure the RF input depend on the configuration of
the connected instrument.
70User Manual 1176.8997.02 ─ 06
Page 71

R&S®VSE-K10x (LTE Uplink)
High Pass Filter 1 to 3 GHz ..........................................................................................71
YIG-Preselector ............................................................................................................71
Capture Mode............................................................................................................... 71
RTO Sample Rate.........................................................................................................72
High Pass Filter 1 to 3 GHz
Activates an additional internal high-pass filter for RF input signals from 1 GHz to
3 GHz. This filter is used to remove the harmonics of the analyzer to measure the harmonics for a DUT, for example.
This function may require an additional hardware option on the connected instrument.
Remote command:
INPut<ip>:FILTer:HPASs[:STATe] on page 175
YIG-Preselector
Activates or deactivates the YIG-preselector, if available on the connected instrument.
An internal YIG-preselector at the input of the connected instrument ensures that
image frequencies are rejected. However, this is only possible for a restricted bandwidth. To use the maximum bandwidth for signal analysis you can deactivate the YIGpreselector at the input of the connected instrument, which can lead to image-frequency display.
Remote command:
INPut<ip>:FILTer:YIG[:STATe] on page 176
Configuration
Configuring I/Q Measurements
Capture Mode
Determines how data from an oscilloscope is input to the R&S VSE software.
This function is only available for a connected R&S RTO with a firmware version
3.0.1.1 or higher (for other versions and instruments the input is always I/Q data).
"I/Q"
"Waveform"
"Auto"
Remote command:
INPut<ip>:RF:CAPMode on page 176
The measured waveform is converted to I/Q data directly on the R&S
RTO (requires option R&S RTO-K11), and input to the R&S VSE software as I/Q data.
For data imports with small bandwidths, importing data in this format
is quicker. However, the maximum record length is restricted by the
R&S RTO. (Memory options on the R&S RTO are not available for I/Q
data.)
The data is input in its original waveform format and converted to I/Q
data in the R&S VSE software. No additional options are required on
the R&S RTO.
For data imports with large bandwidths, this format is more convenient as it allows for longer record lengths if appropriate memory
options are available on the R&S RTO.
Uses "I/Q" mode when possible, and "Waveform" only when required
by the application (e.g. Pulse measurement, Oscilloscope Baseband
Input).
71User Manual 1176.8997.02 ─ 06
Page 72

R&S®VSE-K10x (LTE Uplink)
RTO Sample Rate
Determines whether the 10 GHz mode (default) or 20 GHz mode of the connected
oscilloscope is used. The 20 GHz mode achieves a higher decimation gain, but
reduces the record length by half.
This setting is only available if an R&S RTO is used to obtain the input data, either
directly or via the R&S FSW.
When using an oscilloscope as the input source, the following restrictions apply for this
setting:
●
Only available for R&S RTO models that support a sample rate of 20 GHz (see
data sheet)
●
For R&S RTO-2064 with an analysis bandwidth of 4 GHz or larger, a sample rate of
20 GHZ is always used
Remote command:
Input source R&S FSW via R&S RTO:
SYSTem:COMMunicate:RDEVice:OSCilloscope:SRATe on page 178
Input source R&S RTO:
INPut<ip>:RF:CAPMode:WAVeform:SRATe on page 177
Configuration
Configuring I/Q Measurements
5.2.10.2 I/Q File Input
Or: "Input & Output" > "Input Source" > "I/Q File"
Alternatively to "live" data input from a connected instrument, measurement data to be
analyzed by the R&S VSE software can also be provided "offline" by a stored data file.
This allows you to perform a measurement on any instrument, store the results to a
file, and analyze the stored data partially or as a whole at any time using the R&S VSE
software.
Loading a file via drag&drop
As of R&S VSE software version 1.30, you can load a file simply by selecting it in a file
explorer and dragging it to the R&S VSE software. Drop it into the "Measurement
Group Setup" window or the channel bar for any channel. The channel is automatically
configured for file input, if necessary. If the file contains all essential information, the file
input is immediately displayed in the channel. Otherwise, the "Recall I/Q Recording"
dialog box is opened for the selected file so you can enter the missing information.
If the file contains data from multiple channels (e.g. from LTE measurements), it can be
loaded to individual input sources, if the application supports them.
For details see the R&S VSE Base Software User Manual.
The "Input Source" settings defined in the "Input" dialog box are identical to those configured for a specific channel in the "Measurement Group Setup" window.
(See "Controlling Instruments and Capturing Data" in the R&S VSE User Manual).
72User Manual 1176.8997.02 ─ 06
Page 73

R&S®VSE-K10x (LTE Uplink)
Configuration
Configuring I/Q Measurements
If the Frequency Response Correction option (R&S VSE-K544) is installed, the LTE
measurement application also supports frequency response correction using Touchstone (.snp) files or .fres files.
For details on user-defined frequency response correction, see the R&S VSE Base
Software User Manual.
Input Type (Instrument / File)........................................................................................73
Input File....................................................................................................................... 73
Zero Padding.................................................................................................................73
Input Type (Instrument / File)
Selects an instrument or a file as the type of input provided to the channel.
Remote command:
INSTrument:BLOCk:CHANnel[:SETTings]:SOURce<si> on page 177
INPut<ip>:SELect on page 176
Input File
Specifies the I/Q data file to be used for input.
Select "Select File" to open the "Load I/Q File" dialog box.
(See "Data Management - Loading the I/Q Data File" in the R&S VSE User Manual).
Zero Padding
Enables or disables zero padding for input from an I/Q data file that requires resampling. For resampling, a number of samples are required due to filter settling. These
samples can either be taken from the provided I/Q data, or the R&S VSE software can
add the required number of samples (zeros) at the beginning and end of the file.
73User Manual 1176.8997.02 ─ 06
Page 74

R&S®VSE-K10x (LTE Uplink)
If enabled, the required number of samples are inserted as zeros at the beginning and
end of the file. The entire input data is analyzed. However, the additional zeros can
effect the determined spectrum of the I/Q data. If zero padding is enabled, a status
message is displayed.
If disabled (default), no zeros are added. The required samples for filter settling are
taken from the provided I/Q data in the file. The start time in the R&S VSE Player is
adapted to the actual start (after filter settling).
Note: You can activate zero padding directly when you load the file, or afterwards in
the "Input Source" settings.
Remote command:
INPut<ip>:FILE:ZPADing on page 175
5.2.11 Defining the Frequency
Access: "Overview" > "Input / Frontend" > "Frequency"
Frequency settings define the frequency characteristics of the signal at the RF input.
They are part of the "Frequency" tab of the "Signal Characteristics" dialog box.
Configuration
Configuring I/Q Measurements
Defining the Signal Frequency......................................................................................74
Defining the Signal Frequency
For measurements with an RF input source, you have to match the center frequency
of the analyzer to the frequency of the signal.
The available frequency range depends on the hardware configuration of the analyzer
you are using.
In addition to the frequency itself, you can also define a frequency stepsize. The frequency stepsize defines the extent of a frequency change if you change it, for example
with the rotary knob. Define the stepsize in two ways.
●
= Center
One frequency step corresponds to the current center frequency.
●
Manual
Define any stepsize you need.
Remote command:
Center frequency: [SENSe:]FREQuency:CENTer[:CC<cc>] on page 178
Frequency stepsize: [SENSe:]FREQuency:CENTer:STEP on page 180
Frequency offset: [SENSe]:FREQuency:CENTer[:CC<cc>]:OFFSet on page 179
74User Manual 1176.8997.02 ─ 06
Page 75

R&S®VSE-K10x (LTE Uplink)
5.2.12 Defining Level Characteristics
Access: "Overview" > "Input / Frontend" > "Amplitude"
Amplitude settings define the expected level characteristics of the signal at the RF
input.
Level characteristics are available when you capture data with an instrument. In addition, the functions that are available depend on the configuration of the connected
instrument.
Configuration
Configuring I/Q Measurements
Defining a Reference Level...........................................................................................75
Attenuating the Signal...................................................................................................76
Input Coupling ..............................................................................................................76
Impedance ................................................................................................................... 76
Defining a Reference Level
The reference level is the power level the analyzer expects at the RF input. Keep in
mind that the power level at the RF input is the peak envelope power for signals with a
high crest factor like LTE.
To get the best dynamic range, you have to set the reference level as low as possible.
At the same time, make sure that the maximum signal level does not exceed the reference level. If it does, it will overload the A/D converter, regardless of the signal power.
Measurement results can deteriorate (e.g. EVM), especially for measurements with
more than one active channel near the one you are trying to measure (± 6 MHz).
Note that the signal level at the A/D converter can be stronger than the level the application displays, depending on the current resolution bandwidth. This is because the
resolution bandwidths are implemented digitally after the A/D converter.
You can define an arithmetic level offset. A level offset is useful if the signal is attenuated or amplified before it is fed into the analyzer. All displayed power level results are
shifted by this value. Note however, that the reference value ignores the level offset.
Thus, it is still mandatory to define the actual power level that the analyzer has to handle as the reference level.
You can also use automatic detection of the reference level with the "Auto Level"
function.
If active, the application measures and sets the reference level to its ideal value.
Automatic level detection also optimizes RF attenuation.
75User Manual 1176.8997.02 ─ 06
Page 76

R&S®VSE-K10x (LTE Uplink)
Remote command:
Manual: DISPlay[:WINDow<n>]:TRACe<t>:Y[:SCALe]:RLEVel on page 181
Automatic: [SENSe:]ADJust:LEVel on page 185
Offset: DISPlay[:WINDow<n>]:TRACe<t>:Y[:SCALe]:RLEVel:OFFSet
on page 181
Attenuating the Signal
Attenuation of the signal becomes necessary if you have to reduce the power of the
signal that you have applied. Power reduction is necessary, for example, to prevent an
overload of the input mixer.
The LTE measurement application provides several attenuation modes.
●
Mechanical (or RF) attenuation is always available. The mechanical attenuator
controls attenuation at the RF input.
●
Electronic attenuation is available when the connected instrument is equipped
with the corresponding option. Note that the frequency range must not exceed the
specification of the electronic attenuator for it to work.
For both methods, the application provides automatic detection of the ideal attenu-
ation level. Alternatively, you can define the attenuation level manually. The range
is from 0 dB to 79 dB (RF attenuation) or 30 dB (electronic attenuation) in 1 dB
steps.
For more information on attenuating the signal, see the manual of the connected
instrument.
Remote command:
RF attenuation: INPut<ip>:ATTenuation on page 182
Electronic attenuation: INPut<ip>:EATT:STATe on page 185
Electronic attenuation: INPut<ip>:EATT:AUTO on page 184
Electronic attenuation: INPut<ip>:EATT on page 184
Configuration
Configuring I/Q Measurements
Input Coupling
The RF input of the connected instrument can be coupled by alternating current (AC)
or direct current (DC).
AC coupling blocks any DC voltage from the input signal. This is the default setting to
prevent damage to the instrument. Very low frequencies in the input signal may be distorted.
However, some specifications require DC coupling. In this case, you must protect the
instrument from damaging DC input voltages manually. For details, refer to the data
sheet.
Remote command:
INPut<ip>:COUPling on page 182
Impedance
For some measurements, the reference impedance for the measured levels of the connected instrument can be set to 50 Ω or 75 Ω.
Select 75 Ω if the 50 Ω input impedance is transformed to a higher impedance using a
75 Ω adapter of the RAZ type. (That corresponds to 25Ω in series to the input impedance of the instrument.) The correction value in this case is 1.76 dB = 10 log (75Ω/
50Ω).
76User Manual 1176.8997.02 ─ 06
Page 77

R&S®VSE-K10x (LTE Uplink)
This value also affects the unit conversion.
Remote command:
INPut<ip>:IMPedance on page 184
5.2.13 Configuring the Data Capture
Access: "Overview" > "Trig / Sig Capture" > "Signal Capture"
The data capture settings contain settings that control the data capture.
The data capture settings are part of the "Signal Capture" tab of the "Trigger/Signal
Capture" dialog box.
Configuration
Configuring I/Q Measurements
Capture Time.................................................................................................................77
Swap I/Q....................................................................................................................... 77
Overall Frame Count.....................................................................................................77
Auto According to Standard.......................................................................................... 78
Number of Frames to Analyze...................................................................................... 78
Single Subframe Mode..................................................................................................78
Capture Time
Defines the capture time.
The capture time corresponds to the time of one measurement. Hence, it defines the
amount of data the application captures during a single measurement (or sweep).
By default, the application captures 20.1 ms of data to make sure that at least one
complete LTE frame is captured in the measurement.
Remote command:
[SENSe:]SWEep:TIME on page 187
Swap I/Q
Swaps the real (I branch) and the imaginary (Q branch) parts of the signal.
Remote command:
[SENSe:]SWAPiq on page 187
Overall Frame Count
Turns the manual selection of the number of frames to capture (and analyze) on and
off.
If the overall frame count is active, you can define the number of frames to capture and
analyze. The measurement runs until all frames have been analyzed, even if it takes
more than one sweep. The results are an average of the captured frames.
77User Manual 1176.8997.02 ─ 06
Page 78

R&S®VSE-K10x (LTE Uplink)
If the overall frame count is inactive, the application analyzes all complete LTE frames
currently in the capture buffer.
Remote command:
[SENSe:][LTE:]FRAMe:COUNt:STATe on page 187
Auto According to Standard
Turns automatic selection of the number of frames to capture and analyze on and off.
If active, the application evaluates the number of frames as defined for EVM tests in
the LTE standard.
If inactive, you can set the number of frames you want to analyze.
This parameter is not available if the overall frame count is inactive.
Remote command:
[SENSe:][LTE:]FRAMe:COUNt:AUTO on page 186
Number of Frames to Analyze
Sets the number of frames that you want to capture and analyze.
If the number of frames you have set last longer than a single measurement, the appli-
cation continues the measurement until all frames have been captured.
The parameter is read only in the following cases:
●
The overall frame count is inactive,
●
The data is captured according to the standard.
Remote command:
[SENSe:][LTE:]FRAMe:COUNt on page 186
Configuration
Configuring I/Q Measurements
Single Subframe Mode
Turns the evaluation of a single subframe only on and off.
Evaluating a single subframe only improves the measurement speed. For successful
synchronization, the subframe must be located within the captured data (= 1.2 ms).
You can make sure that this is the case by using, for example, an external frame trigger signal.
For maximum measurement speed, the application turns off Auto According to Stan-
dard and sets the Number of Frames to Analyze to 1. These settings prevent the appli-
cation from capturing data more than once for a single run measurement.
Remote command:
[SENSe:][LTE:]FRAMe:SSUBframe on page 187
5.2.14 Triggering Measurements
Access: "Overview" > "Trig / Sig Capture" > "Trigger"
A trigger allows you to capture those parts of the signal that you are really interested
in.
While the application runs freely and analyzes all signal data in its default state, no
matter if the signal contains information or not, a trigger initiates a measurement only
under certain circumstances (the trigger event).
78User Manual 1176.8997.02 ─ 06
Page 79

R&S®VSE-K10x (LTE Uplink)
Except for the available trigger sources, the functionality is the same as that of the
R&S VSE base system.
For a comprehensive description of the available trigger settings not described here,
refer to the documentation of the connected instrument.
Trigger Source...............................................................................................................79
Trigger Source
The application supports several trigger modes or sources.
●
Free Run
Starts the measurement immediately and measures continuously.
When you analyze a signal from an I/Q file, then the trigger source is always to
"Free Run".
●
External <x>
The trigger event is the level of an external trigger signal. The measurement starts
when this signal meets or exceeds a specified trigger level at the trigger input.
Some measurement devices have several trigger ports. When you use one of
these, several external trigger sources are available.
●
I/Q Power
The trigger event is the magnitude of the sampled I/Q data. The measurement
starts when the magnitude of the I/Q data meets or exceeds the trigger level.
●
IF Power
The trigger event is the level of the intermediate frequency (IF). The measurement
starts when the level of the IF meets or exceeds the trigger level.
●
RF Power
The trigger event is the level measured at the RF input. The measurement starts
when the level of the signal meets or exceeds the trigger level.
For all trigger sources, except "Free Run", you can define several trigger characteris-
tics.
●
The trigger "Level" defines the signal level that initiates the measurement.
●
The trigger "Offset" is the time that should pass between the trigger event and the
start of the measurement. This can be a negative value (a pretrigger).
●
The trigger "Drop-out Time" defines the time the input signal must stay below the
trigger level before triggering again.
●
The trigger "Slope" defines whether triggering occurs when the signal rises to the
trigger level or falls down to it.
●
The trigger "Holdoff" defines a time period that must at least pass between one trig-
ger event and the next.
●
The trigger "Hysteresis" is available for the IF power trigger. It defines a distance to
the trigger level that the input signal must stay below in order to fulfill the trigger
condition.
Configuration
Configuring I/Q Measurements
79User Manual 1176.8997.02 ─ 06
Page 80

R&S®VSE-K10x (LTE Uplink)
For a detailed description of the trigger parameters, see the user manual of the I/Q
Analyzer.
Remote command:
Source: TRIGger[:SEQuence]:SOURce on page 192
Level (external): TRIGger[:SEQuence]:LEVel<in>[:EXTernal] on page 189
Level (I/Q power): TRIGger[:SEQuence]:LEVel:IQPower on page 190
Level (IF power): TRIGger[:SEQuence]:LEVel:IFPower on page 190
Level (RF power): TRIGger[:SEQuence]:LEVel:RFPower on page 190
Offset: TRIGger[:SEQuence]:HOLDoff<in> on page 188
Hysteresis: TRIGger[:SEQuence]:IFPower:HYSTeresis on page 189
Drop-out time: TRIGger[:SEQuence]:DTIMe on page 188
Slope: TRIGger[:SEQuence]:SLOPe on page 191
Holdoff: TRIGger[:SEQuence]:IFPower:HOLDoff on page 189
5.2.15 Tracking
Access: "Overview" > "Signal Description" > "Tracking"
Configuration
Configuring I/Q Measurements
The tracking settings contain settings that compensate for various common measurement errors that may occur.
Phase............................................................................................................................80
Timing............................................................................................................................80
Phase
Turns phase tracking on and off.
When you turn on phase tracking, the application compensates the measurement
results for the phase error on a symbol level.
"Off"
"Pilot Only"
"Pilot and Payload"
Remote command:
[SENSe:][LTE:]UL:TRACking:PHASe on page 196
Phase tracking is not applied.
Only the reference signal is used for the estimation of the phase
error.
Both reference signal and payload resource elements are used for
the estimation of the phase error.
Timing
Turns timing tracking on and off.
When you turn on timing tracking, the application compensates the measurement
results for the timing error on a symbol level.
Remote command:
[SENSe:][LTE:]UL:TRACking:TIME on page 196
80User Manual 1176.8997.02 ─ 06
Page 81

R&S®VSE-K10x (LTE Uplink)
5.2.16 Signal Demodulation
Access: "Overview" > "Demodulation"
Analysis Mode...............................................................................................................81
Channel Estimation Range........................................................................................... 81
EVM with Exclusion Period........................................................................................... 81
Analyze TDD Transient Slots........................................................................................82
Compensate DC Offset.................................................................................................82
Scrambling of Coded Bits..............................................................................................82
Suppressed Interference Synchronization.................................................................... 82
Multicarrier Filter........................................................................................................... 83
Configuration
Configuring I/Q Measurements
Analysis Mode
Selects the channel analysis mode.
You can select from "PUSCH/PUCCH" mode and "PRACH" mode.
"PUSCH/PUCCH" mode analyzes the PUSCH and PUCCH (default mode).
"PRACH" mode analyzes the PRACH only. In PRACH analysis mode, no subframe or
slot selection is available. Instead you can select a particular preamble that the results
are shown for. Note that PRACH analysis mode does not support all result displays.
Remote command:
[SENSe:][LTE:]UL:DEMod:MODE on page 194
Channel Estimation Range
Selects the method for channel estimation.
You can select if only the pilot symbols are used to perform channel estimation or if
both pilot and payload carriers are used.
Remote command:
[SENSe:][LTE:]UL:DEMod:CESTimation on page 194
EVM with Exclusion Period
Turns exclusion periods for EVM measurements as defined in 3GPP TS 36.521 on and
off.
The exclusion period affects the PUSCH data EVM of the first and last symbol.
The software automatically determines the length of the exclusion period according to
3GPP TS 36.521-1.
81User Manual 1176.8997.02 ─ 06
Page 82

R&S®VSE-K10x (LTE Uplink)
The exclusion period has no effect on the EVM vs Carrier and EVM vs Symbol x Carrier result displays.
Remote command:
[SENSe:][LTE:]UL:DEMod:EEPeriod on page 194
Analyze TDD Transient Slots
Includes or excludes the transient slots present after a switch from downlink to uplink in
the analysis.
If on, the transient slots are not included in the measurement.
Remote command:
[SENSe:][LTE:]UL:DEMod:ATTSlots on page 193
Compensate DC Offset
Turns DC offset compensation when calculating measurement results on and off.
According to 3GPP TS 36.101 (Annex F.4), the R&S VSE removes the carrier leakage
(I/Q origin offset) from the evaluated signal before it calculates the EVM and in-band
emissions.
Remote command:
[SENSe:][LTE:]UL:DEMod:CDCoffset on page 195
Configuration
Configuring I/Q Measurements
Scrambling of Coded Bits
Turns the scrambling of coded bits for the PUSCH on and off.
The scrambling of coded bits affects the bitstream results.
Source of bitstream results when
'Scrambling of coded bits' is
=ON
(unscrambled bits)
codewords
Scrambling
Scrambling
Figure 5-1: Source for bitstream results if scrambling for coded bits is on and off
=OFF
(scrambled bits)
Modulation
mapper
Modulation
mapper
layers
[...]
Layer mapper
[...]
Remote command:
[SENSe:][LTE:]UL:DEMod:CBSCrambling on page 195
Suppressed Interference Synchronization
Turns suppressed interference synchronization on and off.
If active, the synchronization on signals containing more than one user equipment (UE)
is more robust. Additionally, the EVM is lower in case the UEs have different frequency
offsets. Note that Auto Demodulation is not supported in this synchronization mode
and the EVM may be higher in case only one UE is present in the signal.
Remote command:
[SENSe:][LTE:]UL:DEMod:SISYnc on page 195
82User Manual 1176.8997.02 ─ 06
Page 83

R&S®VSE-K10x (LTE Uplink)
Multicarrier Filter
Turns the suppression of interference of neighboring carriers on and off.
Remote command:
[SENSe:][LTE:]UL:DEMod:MCFilter on page 195
5.3 Configuring Time Alignment Error Measurements
Several settings supported by Time Alignment Error measurements are the same as
those for I/Q measurements. For a comprehensive description, refer to the following
chapters.
●
Chapter 5.2.1, "Defining Signal Characteristics", on page 43
●
Chapter 5.2.5, "Configuring the Demodulation Reference Signal", on page 58
●
Chapter 5.2.7, "Defining the PUSCH Structure", on page 64
●
Chapter 5.2.10, "Selecting the Input and Output Source", on page 70
●
Chapter 5.2.11, "Defining the Frequency", on page 74
●
Chapter 5.2.12, "Defining Level Characteristics", on page 75
●
Chapter 5.2.13, "Configuring the Data Capture", on page 77
●
Chapter 5.2.14, "Triggering Measurements", on page 78
●
Chapter 5.2.16, "Signal Demodulation", on page 81
Configuration
Configuring Time Alignment Error Measurements
83User Manual 1176.8997.02 ─ 06
Page 84

R&S®VSE-K10x (LTE Uplink)
6 Analysis
The application provides several tools to analyze the measurement results in more
detail.
● Configuring Tables / Numerical Results..................................................................84
● Exporting Measurement Results.............................................................................84
● Evaluation Range....................................................................................................85
● Scale....................................................................................................................... 88
● Result Settings........................................................................................................88
● Markers................................................................................................................... 90
6.1 Configuring Tables / Numerical Results
The application allows you to customize the number of columns for some numeric
result displays, for example the Allocation Summary.
Analysis
Exporting Measurement Results
► Click somewhere in the header row of the table.
The application opens a dialog box to add or remove columns.
6.2 Exporting Measurement Results
Access: "Edit" > "Trace Export"
In case you want to evaluate the data with external applications (for example in an MS
Excel spreadsheet), you can export the measurement data to an ASCII file. The data
export is available for I/Q measurements - EVM / Frequency Error / Power measurements and Time Alignment Error.
1. Select the "Trace Export Config" dialog box via the "Edit" menu.
2. Select the data you would like to export.
3. Select the results you would like to export from the "Specifics For" dropdown menu.
4. Export the data with the "Export Trace to ASCII File" feature.
5. Select the location where you would like to save the data (as a .dat file).
84User Manual 1176.8997.02 ─ 06
Page 85

R&S®VSE-K10x (LTE Uplink)
Note that the measurement data stored in the file depend on the selected result display
("Specifics For" selection).
As the basic principle is the same as in the I/Q Analyzer, refer to the R&S VSE User
Manual for more information.
6.3 Evaluation Range
Access: "Overview" > "Evaluation Range"
The evaluation range defines the signal parts that are considered during signal analysis.
Analysis
Evaluation Range
Configuring component carriers
When you are doing measurements on aggregated carriers, you can configure each
carrier separately.
When available, each carrier in the dialog boxes is represented by an additional tab
labeled "CC<x>", with <x> indicating the number of the component carrier.
Note that the additional tabs are only added to the user interface after you have
selected more than "1" component carrier.
Subframe Selection.......................................................................................................85
Slot Selection................................................................................................................ 86
Preamble Selection.......................................................................................................87
Evaluation range for the constellation diagram.............................................................87
Subframe Selection
The "Subframe" selection filters the results by a specific subframe number.
If you apply the filter, only the results for the subframe you have selected are dis-
played. Otherwise, the R&S VSE shows the results for all subframes that have been
analyzed.
The R&S VSE shows three traces if you display the results for all subframes.
●
One trace ("Min") shows the minimum values measured over all analyzed sub-
frames.
●
One trace ("Max") shows the maximum values measured over all analyzed sub-
frames.
●
One trace ("Avg") shows the average values measured over all subframes.
85User Manual 1176.8997.02 ─ 06
Page 86

R&S®VSE-K10x (LTE Uplink)
If you filter by a single subframe, the R&S VSE still shows three traces, but with different information.
●
One trace ("Min") shows the minimum values measured over all slots in the
selected subframe.
●
One trace ("Max") shows the maximum values measured over all slots in the
selected subframe.
●
One trace ("Avg") shows the average values measured over all slots in the
selected subframe.
The number of traces is only reduced to one trace if you filter by a single slot.
Analysis
Evaluation Range
In PRACH analysis mode, you cannot filter by a single subframe.
You can apply the filter to the following result displays.
●
Result Summary
●
EVM vs Carrier / EVM vs Symbol / EVM vs Symbol X Carrier
●
Spectrum Flatness / Spectrum Flatness SRS / Spectrum Flatness Difference
●
Inband Emission
●
Group Delay
●
Power vs Symbol X Carrier
●
Constellation Diagram
●
DFT Precoded Constellation
●
Allocation Summary
●
Bit Stream
●
Time Alignment Error
Remote command:
[SENSe:][LTE:][CC<cc>:]SUBFrame:SELect on page 200
Slot Selection
The "Slot" selection filters the results by a specific slot number.
If you apply the filter, only the results for the slot you have selected are displayed. Oth-
erwise, the R&S VSE shows the results for all slots.
The R&S VSE shows three traces if you display the results for all slots.
●
One trace ("Min") shows the minimum values measured over all slots.
●
One trace ("Max") shows the maximum values measured over all slots.
●
One trace ("Avg") shows the average values measured over all slots.
86User Manual 1176.8997.02 ─ 06
Page 87

R&S®VSE-K10x (LTE Uplink)
If you filter by a single slot, the R&S VSE shows one trace that represents the values
measured for that slot only.
In PRACH analysis mode, you cannot filter by a single slot.
You can apply the filter to the following result displays.
●
Result Summary
●
EVM vs Carrier / EVM vs Symbol / EVM vs Symbol X Carrier
●
Inband Emission
●
Spectrum Flatness / Spectrum Flatness Difference
●
Group Delay
●
Power vs Symbol X Carrier
●
Constellation Diagram
Remote command:
[SENSe:][LTE:][CC<cc>:]SLOT:SELect on page 199
Analysis
Evaluation Range
Preamble Selection
Selects a particular preamble for measurements that analyze individual preambles.
Selecting preambles is available in PRACH analysis mode.
Remote command:
[SENSe:][LTE:][CC<cc>:]PREamble:SELect on page 199
Evaluation range for the constellation diagram
The "Evaluation Range" for the constellation diagram selects the information displayed
in the constellation diagram.
By default, the constellation diagram contains the constellation points of the complete
data that has been analyzed. However, you can filter the results by several aspects.
●
Modulation
Filters the results by the selected type of modulation.
●
Allocation
Filters the results by a certain type of allocation.
●
Symbol (OFDM)
Filters the results by a certain OFDM symbol.
●
Carrier
87User Manual 1176.8997.02 ─ 06
Page 88

R&S®VSE-K10x (LTE Uplink)
Filters the results by a certain subcarrier.
Remote command:
Modulation: [SENSe:][LTE:][CC<cc>:]MODulation:SELect on page 198
Allocation: [SENSe:][LTE:][CC<cc>:]ALLocation:SELect on page 198
Symbol: [SENSe:][LTE:][CC<cc>:]SYMBol:SELect on page 200
Carrier: [SENSe:][LTE:][CC<cc>:]CARRier:SELect on page 198
6.4 Scale
Access: "Overview" > "Analysis" > "Scale"
Scaling settings define the diagram scale.
Y-Axis Scale.................................................................................................................. 88
Y-Axis Scale
The y-axis scaling determines the vertical resolution of the measurement results. The
scaling you select always applies to the currently active screen and the corresponding
result display.
Usually, the best way to view the results is if they fit ideally in the diagram area and
display the complete trace. This is the way the application scales the y-axis if you are
using the automatic scale function.
But it can become necessary to see a more detailed version of the results. In that case,
turn on fixed scaling for the y-axis by defining the minimum and maximum values displayed on the vertical axis. Possible values and units depend on the result display you
want to adjust the scale of.
You can restore the default scale at any time with "Restore Scale".
Alternatively, you can scale the windows in the "Auto Set" menu. In addition to scaling
the window currently in focus ("Auto Scale Window"), there you can scale all windows
at the same time ("Auto Scale All").
Remote command:
DISPlay[:WINDow<n>][:SUBWindow<w>]:TRACe<t>:Y[:SCALe]:AUTO
on page 201
DISPlay[:WINDow<n>][:SUBWindow<w>]:TRACe<t>:Y[:SCALe]:MAXimum
on page 201
DISPlay[:WINDow<n>][:SUBWindow<w>]:TRACe<t>:Y[:SCALe]:MINimum
on page 202
Analysis
Result Settings
6.5 Result Settings
Access: "Overview" > "Analysis" > "Result Settings"
Result settings define the way certain measurement results are displayed.
88User Manual 1176.8997.02 ─ 06
Page 89

R&S®VSE-K10x (LTE Uplink)
EVM Unit.......................................................................................................................89
Bit Stream Format.........................................................................................................89
Carrier Axes.................................................................................................................. 89
Subwindow Coupling.....................................................................................................90
Marker Coupling............................................................................................................90
EVM Unit
The "EVM Unit" selects the unit for the EVM measurement results in diagrams and
numerical result displays.
Possible units are dB and %.
Remote command:
UNIT:EVM on page 203
Analysis
Result Settings
Bit Stream Format
Selects the way the bit stream is displayed.
The bit stream is either a stream of raw bits or of symbols. In case of the symbol for-
mat, the bits that belong to a symbol are shown as hexadecimal numbers with two digits.
Examples:
Figure 6-1: Bit stream display in uplink application if the bit stream format is set to "symbols"
Figure 6-2: Bit stream display in uplink application if the bit stream format is set to "bits"
Remote command:
UNIT:BSTR on page 203
Carrier Axes
The "Carrier Axes" selects the unit of the x-axis in result displays that show results
over the subcarriers.
●
"Hertz"
X-axis shows the results in terms of the subcarrier frequency.
●
"Subcarrier Number"
X-axis shows the results in terms of the subcarrier number.
Remote command:
UNIT:CAXes on page 203
89User Manual 1176.8997.02 ─ 06
Page 90

R&S®VSE-K10x (LTE Uplink)
Subwindow Coupling
Couples or decouples result display tabs (subwindows).
If the coupling is on and you select another tab in a result display, the application auto-
matically selects the same tab for all result displays.
Subwindow coupling is available for measurements with multiple data streams (for
example carrier aggregation).
Remote command:
DISPlay[:WINDow<n>][:SUBWindow<w>]:COUPling on page 202
Marker Coupling
Couples or decouples markers that are active in multiple result displays.
When you turn on this feature, the application moves the marker to its new position in
all active result displays.
When you turn it off, you can move the markers in different result displays independent
from each other.
Remote command:
CALCulate:MARKer:COUPling on page 202
Analysis
Markers
6.6 Markers
Access: "Overview" > "Analysis" > "Marker"
Markers are a tool that help you to identify measurement results at specific trace
points. When you turn on a marker, it gives you the coordinates of its position, for
example the frequency and its level value or the symbol and its EVM value.
In general, the marker functionality of setting and positioning markers is similar to the
spectrum application.
For I/Q measurement, the R&S VSE supports up to four markers. Markers give either
absolute values (normal markers) or values relative to the first marker (deltamarkers).
If a result display has more than one trace, for example the "EVM vs Symbol" result
display, you can position the marker on either trace. By default, all markers are positioned on trace 1.
Note that if you analyze more than one bandwidth part, each bandwidth part is represented by a different trace.
The R&S VSE also supports several automatic positioning mechanisms that allow you
to move the marker to the maximum trace value (peak), the minimum trace value or
move it from peak to subsequent peak.
The marker table summarizes the marker characteristics.
For a comprehensive description, refer to the R&S VSE user manual.
Markers in result displays with a third quantity
In result displays that have a third quantity, for example the "EVM vs Symbol x Carrier"
result, the R&S VSE provides an extended marker functionality.
90User Manual 1176.8997.02 ─ 06
Page 91

R&S®VSE-K10x (LTE Uplink)
You can position the marker on a specific resource element, whose position is defined
by the following coordinates:
●
The "BWP/SS" dropdown menu selects the bandwidth part.
●
The "Symbol" input field selects the symbol.
●
The "Carrier" input field selects the carrier.
The marker information shows the EVM, the power and the allocation ID of the
resource element you have selected as the marker position.
Analysis
Markers
91User Manual 1176.8997.02 ─ 06
Page 92

R&S®VSE-K10x (LTE Uplink)
7 Remote Control
The following remote control commands are required to configure and perform noise
figure measurements in a remote environment. The R&S VSE must already be set up
for remote operation in a network as described in the base unit manual.
Universal functionality
Note that basic tasks that are also performed in the base unit in the same way are not
described here. For a description of such tasks, see the R&S VSE User Manual.
In particular, this includes:
●
Managing Settings and Results, i.e. storing and loading settings and result data.
●
Basic instrument configuration, e.g. checking the system configuration, customizing
the screen layout, or configuring networks and remote operation.
●
Using the common status registers (specific status registers for Pulse measure-
ments are not used).
Remote Control
Common Suffixes
● Common Suffixes....................................................................................................92
● Introduction............................................................................................................. 93
● Remote Commands to Select the LTE Application................................................. 98
● Configuring the Screen Layout................................................................................98
● Remote Commands to Read Trace Data..............................................................109
● Remote Commands to Read Numeric Results..................................................... 121
● Remote Commands to Read Limit Check Results................................................136
● Remote Commands to Configure the Application.................................................145
● Analysis.................................................................................................................197
7.1 Common Suffixes
In the LTE measurement application, the following common suffixes are used in remote
commands:
Table 7-1: Common suffixes used in remote commands in the LTE measurement application
Suffix Value range Description
<m> 1..4 Marker
<n> 1..16 Window (in the currently selected channel)
<t> 1..6 Trace
<li> 1 to 8 Limit line
<al> 0..110 Selects a subframe allocation.
<in>
<ant> 1..4 Selects an antenna for MIMO measurements.
Irrelevant.
92User Manual 1176.8997.02 ─ 06
Page 93

R&S®VSE-K10x (LTE Uplink)
Suffix Value range Description
<cc> 1..5 Selects a component carrier. The actual number of supported com-
<cluster> 1..2 Selects a cluster (uplink only).
<cw> 1..n Selects a codeword.
<k> --- Selects a limit line.
Remote Control
Introduction
ponent carriers depends on the selected measurement
Irrelevant for the LTE application.
<sf> DL: 0..49
UL: 0..9
7.2 Introduction
Commands are program messages that a controller (e.g. a PC) sends to the instrument or software. They operate its functions ('setting commands' or 'events') and
request information ('query commands'). Some commands can only be used in one
way, others work in two ways (setting and query). If not indicated otherwise, the commands can be used for settings and queries.
The syntax of a SCPI command consists of a header and, in most cases, one or more
parameters. To use a command as a query, you have to append a question mark after
the last header element, even if the command contains a parameter.
A header contains one or more keywords, separated by a colon. Header and parameters are separated by a "white space" (ASCII code 0 to 9, 11 to 32 decimal, e.g. blank).
If there is more than one parameter for a command, these are separated by a comma
from one another.
Only the most important characteristics that you need to know when working with SCPI
commands are described here. For a more complete description, refer to the User
Manual of the R&S VSE.
Selects a subframe.
Remote command examples
Note that some remote command examples mentioned in this general introduction may
not be supported by this particular application.
7.2.1 Conventions used in Descriptions
Note the following conventions used in the remote command descriptions:
●
Command usage
If not specified otherwise, commands can be used both for setting and for querying
parameters.
If a command can be used for setting or querying only, or if it initiates an event, the
usage is stated explicitly.
●
Parameter usage
93User Manual 1176.8997.02 ─ 06
Page 94

R&S®VSE-K10x (LTE Uplink)
If not specified otherwise, a parameter can be used to set a value and it is the
result of a query.
Parameters required only for setting are indicated as Setting parameters.
Parameters required only to refine a query are indicated as Query parameters.
Parameters that are only returned as the result of a query are indicated as Return
values.
●
Conformity
Commands that are taken from the SCPI standard are indicated as SCPI con-
firmed. All commands used by the R&S VSE follow the SCPI syntax rules.
●
Asynchronous commands
A command which does not automatically finish executing before the next com-
mand starts executing (overlapping command) is indicated as an Asynchronous
command.
●
Reset values (*RST)
Default parameter values that are used directly after resetting the instrument (*RST
command) are indicated as *RST values, if available.
●
Default unit
This is the unit used for numeric values if no other unit is provided with the parame-
ter.
●
Manual operation
If the result of a remote command can also be achieved in manual operation, a link
to the description is inserted.
Remote Control
Introduction
7.2.2 Long and Short Form
The keywords have a long and a short form. You can use either the long or the short
form, but no other abbreviations of the keywords.
The short form is emphasized in upper case letters. Note however, that this emphasis
only serves the purpose to distinguish the short from the long form in the manual. For
the instrument, the case does not matter.
Example:
SENSe:FREQuency:CENTer is the same as SENS:FREQ:CENT.
7.2.3 Numeric Suffixes
Some keywords have a numeric suffix if the command can be applied to multiple
instances of an object. In that case, the suffix selects a particular instance (e.g. a measurement window).
Numeric suffixes are indicated by angular brackets (<n>) next to the keyword.
If you don't quote a suffix for keywords that support one, a 1 is assumed.
94User Manual 1176.8997.02 ─ 06
Page 95

R&S®VSE-K10x (LTE Uplink)
Example:
DISPlay[:WINDow<1...4>]:ZOOM:STATe enables the zoom in a particular measurement window, selected by the suffix at WINDow.
DISPlay:WINDow4:ZOOM:STATe ON refers to window 4.
7.2.4 Optional Keywords
Some keywords are optional and are only part of the syntax because of SCPI compliance. You can include them in the header or not.
Note that if an optional keyword has a numeric suffix and you need to use the suffix,
you have to include the optional keyword. Otherwise, the suffix of the missing keyword
is assumed to be the value 1.
Optional keywords are emphasized with square brackets.
Example:
Without a numeric suffix in the optional keyword:
[SENSe:]FREQuency:CENTer is the same as FREQuency:CENTer
With a numeric suffix in the optional keyword:
DISPlay[:WINDow<1...4>]:ZOOM:STATe
DISPlay:ZOOM:STATe ON enables the zoom in window 1 (no suffix).
DISPlay:WINDow4:ZOOM:STATe ON enables the zoom in window 4.
Remote Control
Introduction
7.2.5 Alternative Keywords
A vertical stroke indicates alternatives for a specific keyword. You can use both keywords to the same effect.
Example:
[SENSe:]BANDwidth|BWIDth[:RESolution]
In the short form without optional keywords, BAND 1MHZ would have the same effect
as BWID 1MHZ.
7.2.6 SCPI Parameters
Many commands feature one or more parameters.
If a command supports more than one parameter, these are separated by a comma.
Example:
LAYout:ADD:WINDow Spectrum,LEFT,MTABle
Parameters may have different forms of values.
95User Manual 1176.8997.02 ─ 06
Page 96

R&S®VSE-K10x (LTE Uplink)
● Numeric Values.......................................................................................................96
● Boolean...................................................................................................................97
● Character Data........................................................................................................97
● Character Strings.................................................................................................... 97
● Block Data...............................................................................................................97
7.2.6.1 Numeric Values
Numeric values can be entered in any form, i.e. with sign, decimal point or exponent. In
case of physical quantities, you can also add the unit. If the unit is missing, the command uses the basic unit.
Example:
With unit: SENSe:FREQuency:CENTer 1GHZ
Without unit: SENSe:FREQuency:CENTer 1E9 would also set a frequency of 1 GHz.
Values exceeding the resolution of the instrument are rounded up or down.
Remote Control
Introduction
If the number you have entered is not supported (e.g. in case of discrete steps), the
command returns an error.
Instead of a number, you can also set numeric values with a text parameter in special
cases.
●
MIN/MAX
Defines the minimum or maximum numeric value that is supported.
●
DEF
Defines the default value.
●
UP/DOWN
Increases or decreases the numeric value by one step. The step size depends on
the setting. In some cases you can customize the step size with a corresponding
command.
Querying numeric values
When you query numeric values, the system returns a number. In case of physical
quantities, it applies the basic unit (e.g. Hz in case of frequencies). The number of digits after the decimal point depends on the type of numeric value.
Example:
Setting: SENSe:FREQuency:CENTer 1GHZ
Query: SENSe:FREQuency:CENTer? would return 1E9
In some cases, numeric values may be returned as text.
●
INF/NINF
Infinity or negative infinity. Represents the numeric values 9.9E37 or -9.9E37.
●
NAN
96User Manual 1176.8997.02 ─ 06
Page 97

R&S®VSE-K10x (LTE Uplink)
Not a number. Represents the numeric value 9.91E37. NAN is returned in case of
errors.
7.2.6.2 Boolean
Boolean parameters represent two states. The "ON" state (logically true) is represented by "ON" or a numeric value 1. The "OFF" state (logically untrue) is represented by
"OFF" or the numeric value 0.
Querying Boolean parameters
When you query Boolean parameters, the system returns either the value 1 ("ON") or
the value 0 ("OFF").
Example:
Setting: DISPlay:WINDow:ZOOM:STATe ON
Query: DISPlay:WINDow:ZOOM:STATe? would return 1
Remote Control
Introduction
7.2.6.3 Character Data
Character data follows the syntactic rules of keywords. You can enter text using a short
or a long form. For more information see Chapter 7.2.2, "Long and Short Form",
on page 94.
Querying text parameters
When you query text parameters, the system returns its short form.
Example:
Setting: SENSe:BANDwidth:RESolution:TYPE NORMal
Query: SENSe:BANDwidth:RESolution:TYPE? would return NORM
7.2.6.4 Character Strings
Strings are alphanumeric characters. They have to be in straight quotation marks. You
can use a single quotation mark ( ' ) or a double quotation mark ( " ).
Example:
INSTRument:DELete 'Spectrum'
7.2.6.5 Block Data
Block data is a format which is suitable for the transmission of large amounts of data.
The ASCII character # introduces the data block. The next number indicates how many
of the following digits describe the length of the data block. In the example the 4 following digits indicate the length to be 5168 bytes. The data bytes follow. During the transmission of these data bytes all end or other control signs are ignored until all bytes are
97User Manual 1176.8997.02 ─ 06
Page 98

R&S®VSE-K10x (LTE Uplink)
transmitted. #0 specifies a data block of indefinite length. The use of the indefinite format requires an NL^END message to terminate the data block. This format is useful
when the length of the transmission is not known or if speed or other considerations
prevent segmentation of the data into blocks of definite length.
7.3 Remote Commands to Select the LTE Application
INSTrument[:SELect]........................................................................................................98
INSTrument[:SELect] <ChannelType>
This command selects a new measurement channel with the defined channel type.
Parameters:
<ChannelType> LTE
Example: //Select LTE application
Remote Control
Configuring the Screen Layout
LTE measurement channel
INST LTE
7.4 Configuring the Screen Layout
● General Layout........................................................................................................98
● Configuring the Layout over all Channels............................................................... 99
● Configuring the Layout of a Channel.....................................................................103
7.4.1 General Layout
The following commands are required to configure general window layout, independent
of the application.
Note that the suffix <n> always refers to the window in the currently selected measure-
ment channel.
DISPlay[:WINDow<n>][:SUBWindow<w>]:SELect............................................................... 98
DISPlay[:WINDow<n>][:SUBWindow<w>]:SELect
This command sets the focus on the selected result display window.
This window is then the active window.
For measurements with multiple results in subwindows, the command also selects the
subwindow. Use this command to select the (sub)window before querying trace data.
Suffix:
<n>
<w> Subwindow
.
Window
98User Manual 1176.8997.02 ─ 06
Page 99

R&S®VSE-K10x (LTE Uplink)
Example: //Put the focus on window 1
Example: //Put the focus on subwindow 2 in window 1
Usage: Event
7.4.2 Configuring the Layout over all Channels
The following commands are required to change the evaluation type and rearrange the
screen layout across measurement channels as you do in manual operation.
For compatibility with other Rohde & Schwarz Signal and Spectrum Analyzers, the layout commands described in Chapter 7.4.3, "Configuring the Layout of a Channel",
on page 103 are also supported. Note, however, that the commands described there
only allow you to configure the layout within the active measurement channel.
Remote Control
Configuring the Screen Layout
DISP:WIND1:SEL
DISP:WIND1:SUBW2:SEL
LAYout:GLOBal:ADD[:WINDow]?.......................................................................................99
LAYout:GLOBal:CATalog[:WINDow]?................................................................................101
LAYout:GLOBal:IDENtify[:WINDow]?................................................................................101
LAYout:GLOBal:REMove[:WINDow]................................................................................. 102
LAYout:GLOBal:REPLace[:WINDow]................................................................................102
LAYout:GLOBal:ADD[:WINDow]?
<ExChanName>,<ExWinName>,<Direction>,<NewChanName>,<NewWinType>
This command adds a window to the display next to an existing window. The new window may belong to a different channel than the existing window.
To replace an existing window, use the LAYout:GLOBal:REPLace[:WINDow] command.
Parameters:
<ExChanName> string
Name of an existing channel
<ExWinName> string
Name of the existing window within the <ExChanName> channel the new window is inserted next to.
By default, the name of a window is the same as its index. To
determine the name and index of all active windows use the
LAYout:GLOBal:IDENtify[:WINDow]? query.
<Direction> LEFT | RIGHt | ABOVe | BELow | TAB
Direction the new window is added relative to the existing window.
TAB
The new window is added as a new tab in the specified existing
window.
99User Manual 1176.8997.02 ─ 06
Page 100

R&S®VSE-K10x (LTE Uplink)
<NewChanName> string
<NewWinType> string
Return values:
<NewWindowName> When adding a new window, the command returns its name (by
Remote Control
Configuring the Screen Layout
Name of the channel for which a new window is to be added.
Type of result display (evaluation method) you want to add.
See the table below for available parameter values.
default the same as its number) as a result.
Example:
LAYout:GLOBal:ADD:WINDow? 'IQ
Analyzer','1',RIGH,'IQ Analyzer2','FREQ'
Adds a new window named 'Spectrum' with a Spectrum display
to the right of window 1 in the channel 'IQ Analyzer'.
Usage: Query only
Table 7-2: <WindowType> parameter values for LTE uplink measurement application
Parameter value Window type
I/Q measurements
ASUM Allocation Summary
BSTR Bitstream
CBUF Capture Buffer
CCDF CCDF
CONS Constellation Diagram
EVCA EVM vs. Carrier
EVSU EVM vs. Subframe
EVSY EVM vs. Symbol
EVSC EVM vs. Symbol X Carrier
GDEL Group Delay
IE Inband Emission
IEA Inband Emission All
MTAB Marker Table
PSPE Power Spectrum
PVSC Power vs. Symbol X Carrier
RSUM Result Summary
SFD Spectrum Flatness Difference
SFL Spectrum Flatness
SFSR Spectrum Flatness SRS
Time alignment error
CBUF Capture Buffer
100User Manual 1176.8997.02 ─ 06
 Loading...