


R&S®VSE
Vector Signal Explorer Base Software
User Manual
(;ÚæW2)
1176883902
Version 16

This manual applies to the following software, version 2.10 and later:
●
R&S®VSE Enterprise Edition base software (1345.1105.06)
●
R&S®VSE Basic Edition base software (1345.1011.06)
●
R&S®VSE License Provider (1310.0002.05/.06)
●
R&S®VSESIM-VSS (1345.1511.02)
© 2021 Rohde & Schwarz GmbH & Co. KG
Mühldorfstr. 15, 81671 München, Germany
Phone: +49 89 41 29 - 0
Email: info@rohde-schwarz.com
Internet: www.rohde-schwarz.com
Subject to change – data without tolerance limits is not binding.
R&S® is a registered trademark of Rohde & Schwarz GmbH & Co. KG.
Trade names are trademarks of the owners.
1176.8839.02 | Version 16 | R&S®VSE
Throughout this manual, products from Rohde & Schwarz are indicated without the ® symbol, e.g. R&S®Vector Signal Explorer is
indicated as R&S VSE. This term refers to both the R&S®VSE Enterprise Edition and the R&S®VSE Basic Edition software.

R&S®VSE
Contents
Contents
1 Documentation Overview....................................................................21
1.1 User Manuals and Help...............................................................................................21
1.2 Data Sheets and Brochures....................................................................................... 21
1.3 Release Notes and Open Source Acknowledgment (OSA).....................................21
1.4 Application Notes, Application Cards, White Papers, etc.......................................22
2 Welcome to the R&S VSE....................................................................23
3 Software installation............................................................................24
3.1 Installing required components.................................................................................24
3.2 Installing and starting the R&S VSE software..........................................................25
3.3 Using the smart card reader...................................................................................... 26
3.4 Using a license server................................................................................................ 28
3.5
Using R&S VSE with Cadence®AWR®VSS................................................................ 30
3.6 Deinstalling R&S VSE................................................................................................. 34
4 Trying out the R&S VSE.......................................................................35
4.1 Capturing and analyzing data from a connected instrument................................. 35
4.1.1 Configuring an instrument............................................................................................. 35
4.1.2 Assigning the instrument to a channel.......................................................................... 37
4.1.3 Adding additional result displays...................................................................................38
4.1.4 Rearranging windows....................................................................................................40
4.1.5 Undocking and resizing the help window...................................................................... 41
4.1.6 Adding further measurement channels......................................................................... 41
4.1.7 Renaming a measurement channel.............................................................................. 43
4.1.8 Recording measurement data.......................................................................................44
4.2 Analyzing stored data from a file...............................................................................44
4.2.1 How to import I/Q data for analysis............................................................................... 45
4.2.2 Setting and moving a marker........................................................................................ 45
5 Measurements and results..................................................................47
5.1 Measurement concept................................................................................................ 47
5.2 Available applications.................................................................................................53
5.3 Starting an application............................................................................................... 55
3User Manual 1176.8839.02 ─ 16

R&S®VSE
6.1.4.1 Channel bar...................................................................................................................60
6.1.4.2 Result displays / measurement windows...................................................................... 61
Contents
6 Operating basics..................................................................................57
6.1 Graphical user interface elements............................................................................ 57
6.1.1 Menus........................................................................................................................... 58
6.1.2 Toolbars.........................................................................................................................58
6.1.3 Status bar......................................................................................................................59
6.1.4 Windows........................................................................................................................60
6.2 Understanding the I/Q analyzer display information............................................... 63
6.3 Customizing the user interface..................................................................................65
6.3.1 Windows concept.......................................................................................................... 65
6.3.2 Multiview mode............................................................................................................. 69
6.3.3 Displaying new windows............................................................................................... 70
6.3.4 Rearranging windows....................................................................................................71
6.3.5 Closing and deactivating windows and bars................................................................. 72
6.4 Getting help................................................................................................................. 72
6.4.1 Calling up help.............................................................................................................. 73
6.4.2 Using the help window.................................................................................................. 73
7 Controlling instruments and capturing I/Q data............................... 75
7.1 Input sources...............................................................................................................75
7.1.1 Connected instrument................................................................................................... 75
7.1.2 File input........................................................................................................................77
7.2 Configuring instruments............................................................................................ 77
7.2.1 Remote control interfaces and protocols.......................................................................78
7.2.1.1 LAN interface................................................................................................................ 78
7.2.2 Defining the connection information manually.............................................................. 80
7.2.3 Connecting to the host instrument (localhost)...............................................................82
7.2.4 Determining the address with software support............................................................ 83
7.2.5 Searching for connected instruments automatically......................................................85
7.2.6 Obtaining information on versions and options on the connected instrument...............87
7.2.7 Deleting all instrument configurations........................................................................... 88
7.2.8 Initializing a self-alignment on the connected instrument..............................................88
7.2.9 Configuring the behavior during remote control............................................................ 89
4User Manual 1176.8839.02 ─ 16

R&S®VSE
Contents
7.2.10 Configuring the use of a power sensor......................................................................... 90
7.2.11 Configuring a frequency reference for the connected instrument................................. 93
7.3 Controlling measurement channels, groups, and sequences................................95
7.3.1 Sequence functions.......................................................................................................95
7.3.2 Group functions.............................................................................................................97
7.3.3 Channel functions....................................................................................................... 100
7.4 Configuring measurements in expert mode...........................................................106
7.5 Frequency response correction (R&S VSE-K544)................................................. 107
7.5.1 Basics on frequency response correction................................................................... 108
7.5.2 User-defined frequency response correction settings................................................. 110
7.6 Output settings..........................................................................................................118
7.7 Receiving and providing trigger signals.................................................................119
8 Data management.............................................................................. 123
8.1 Restoring the default software configuration (preset).......................................... 123
8.2 Storing and recalling measurement settings......................................................... 124
8.2.1 Quick save/quick recall............................................................................................... 125
8.2.1.1 Quick save / quick recall settings................................................................................ 126
8.2.2 Configurable storage and recall.................................................................................. 127
8.2.2.1 Stored data types........................................................................................................ 127
8.2.2.2 Storage location and file name....................................................................................127
8.2.2.3 Save and recall dialog boxes...................................................................................... 128
8.2.2.4 Startup recall settings..................................................................................................130
8.3 Recording and recalling captured I/Q data for evaluation.................................... 132
8.3.1 Recording measurement data.....................................................................................133
8.3.2 General recording settings.......................................................................................... 134
8.3.3 Exporting captured and recorded I/Q data.................................................................. 136
8.3.4 Recalling measurement data from files.......................................................................139
8.3.4.1 Loading the I/Q data file and essential measurement information.............................. 140
8.3.4.2 Restoring the measurement results - R&S VSE player...............................................144
8.4 Printing current measurement results.................................................................... 148
8.5 Storing graphical results to an ASCII file............................................................... 151
8.6 Copying graphical results to the clipboard............................................................ 151
9 General software preferences and information.............................. 152
5User Manual 1176.8839.02 ─ 16

R&S®VSE
9.4.1.1 Obtaining copyright information on used third-party sources......................................167
9.4.1.2 License management..................................................................................................167
Contents
9.1 General software behavior....................................................................................... 152
9.2 Display settings.........................................................................................................154
9.2.1 Displayed items...........................................................................................................154
9.2.2 Display theme and colors............................................................................................155
9.2.3 How to configure the colors for display and printing................................................... 159
9.3 Application starter.................................................................................................... 160
9.3.1 Application starter functions........................................................................................ 161
9.3.2 How to work with the application starter......................................................................164
9.4 Software information and support.......................................................................... 166
9.4.1 Licensing, versions and options.................................................................................. 166
9.4.2 R&S support information............................................................................................. 170
9.4.3 System messages.......................................................................................................171
10 I/Q analyzer measurements...............................................................173
10.1 Measurements and result displays for the I/Q analyzer........................................ 173
10.1.1 Selecting the measurement........................................................................................ 173
10.1.2 Result displays for basic I/Q measurements...............................................................174
10.1.3 Result displays in the time and frequency domain......................................................181
10.2 Basics on I/Q data acquisition and processing..................................................... 182
10.2.1 Analyzing I/Q data.......................................................................................................183
10.2.1.1 Sample rate, record length and analysis bandwidth................................................... 183
10.2.2 How much data is measured: capture count and measurement points...................... 184
10.2.3 Basics on FFT............................................................................................................. 185
10.2.3.1 Frequency resolution of FFT results - RBW................................................................185
10.2.3.2 FFT calculation methods.............................................................................................186
Window functions........................................................................................................ 187
Overlapping.................................................................................................................188
Combining results - trace detector.............................................................................. 189
Dependencies between FFT parameters in averaging mode..................................... 189
10.2.4 Trace smoothing..........................................................................................................190
10.2.5 oscilloscope baseband input....................................................................................... 191
10.2.5.1 I/Q processing modes................................................................................................. 192
6User Manual 1176.8839.02 ─ 16

R&S®VSE
10.2.5.2 Sample rates and bandwidths for oscilloscope baseband input................................. 193
10.2.6.1 Frequency ranges....................................................................................................... 194
10.2.6.2 Two-port and three-port mixers...................................................................................195
10.2.6.3 Bias current................................................................................................................. 196
10.2.6.4 Conversion loss tables................................................................................................ 196
10.2.7.1 Using a power sensor as an external power trigger....................................................199
10.3.2.1 Radio frequency input................................................................................................. 202
10.3.2.2 oscilloscope baseband input....................................................................................... 208
Contents
10.2.6 Basics on external mixers........................................................................................... 194
10.2.7 Basics on power sensors............................................................................................ 198
10.3 Basic I/Q measurement configuration.................................................................... 199
10.3.1 Configuration overview................................................................................................200
10.3.2 Data input settings...................................................................................................... 201
10.3.2.3 I/Q file input................................................................................................................. 211
10.3.2.4 External mixer settings................................................................................................213
Mixer settings.............................................................................................................. 213
Basic settings.............................................................................................................. 217
10.3.2.5 External frontend settings........................................................................................... 218
Global configuration settings.......................................................................................218
Frontend configuration settings...................................................................................220
10.3.2.6 Power sensor settings.................................................................................................222
10.3.3 Amplitude.................................................................................................................... 227
10.3.3.1 Impact of the vertical axis settings.............................................................................. 227
Reference level........................................................................................................... 227
RF attenuation.............................................................................................................229
Scaling........................................................................................................................ 229
10.3.3.2 Amplitude settings.......................................................................................................229
10.3.3.3 Amplitude settings for oscilloscope baseband input................................................... 234
10.3.3.4 Scaling the Y-axis........................................................................................................237
10.3.3.5 Scaling for statistics diagrams.....................................................................................238
10.3.4 Frequency settings......................................................................................................241
10.3.5 Trigger and gate configuration.................................................................................... 243
10.3.5.1 Triggering.................................................................................................................... 243
7User Manual 1176.8839.02 ─ 16

R&S®VSE
10.3.5.2 Gating..........................................................................................................................253
10.3.6.1 Data acquisition...........................................................................................................257
10.3.6.2 Capture settings.......................................................................................................... 262
Contents
Triggered measurements............................................................................................ 243
Trigger settings............................................................................................................246
How to determine the required trigger/gate parameters............................................. 252
How to configure a triggered measurement................................................................ 253
Gated measurements..................................................................................................253
Gate settings............................................................................................................... 254
Continuous gate settings.............................................................................................255
How to configure a gated measurement..................................................................... 256
10.3.6 Data acquisition and bandwidth settings.....................................................................257
10.3.7 CCDF (statistics) settings............................................................................................265
10.3.8 Adjusting settings automatically.................................................................................. 266
10.4 RF measurement configuration............................................................................... 268
10.4.1 Channel power and adjacent-channel power (ACLR) measurement..........................268
10.4.1.1 About channel power measurements..........................................................................269
10.4.1.2 Channel power results................................................................................................ 269
10.4.1.3 Channel power basics.................................................................................................272
Measurement method................................................................................................. 272
Recommended common measurement parameters...................................................272
Measurement on multi-standard radio (MSR) signals.................................................276
10.4.1.4 Channel power configuration...................................................................................... 281
General CP/ACLR measurement settings.................................................................. 282
Channel setup............................................................................................................. 286
10.4.1.5 MSR ACLR configuration............................................................................................ 290
General MSR ACLR measurement settings............................................................... 290
MSR sub block and tx channel definition.................................................................... 295
MSR adjacent channel setup...................................................................................... 297
MSR gap channel setup..............................................................................................300
MSR channel names...................................................................................................303
10.4.1.6 How to perform channel power measurements.......................................................... 304
How to perform a standard channel power measurement.......................................... 304
8User Manual 1176.8839.02 ─ 16

R&S®VSE
How to set up the channels.........................................................................................304
How to configure an MSR ACLR measurement..........................................................306
How to manage user-defined configurations...............................................................307
How to compare the tx channel power in successive measurements.........................308
10.4.1.7 Measurement examples..............................................................................................308
Measurement example 1 – ACPR measurement on a CDMA2000 signal..................309
Measurement example 2 – measuring adjacent channel power of a W-CDMA uplink
signal...........................................................................................................................310
Measurement example 3 – measuring the intrinsic noise of the connected instrument
with the channel power function..................................................................................312
10.4.1.8 Optimizing and troubleshooting the measurement......................................................313
10.4.1.9 Reference: predefined CP/ACLR standards............................................................... 314
10.4.1.10 Reference: predefined ACLR user standard XML files............................................... 315
Contents
10.4.2 Occupied bandwidth measurement (OBW).................................................................316
10.4.2.1 About the measurement..............................................................................................316
10.4.2.2 OBW results................................................................................................................ 318
10.4.2.3 OBW configuration...................................................................................................... 319
10.4.2.4 How to determine the occupied bandwidth................................................................. 321
10.4.2.5 Measurement example................................................................................................322
10.4.3 Spectrum emission mask (SEM) measurement..........................................................323
10.4.3.1 About the measurement..............................................................................................323
10.4.3.2 Typical applications.....................................................................................................324
10.4.3.3 SEM results.................................................................................................................324
10.4.3.4 SEM basics................................................................................................................. 327
Ranges and range settings......................................................................................... 328
Limit lines in SEM measurements...............................................................................330
Fast SEM measurements............................................................................................332
Multi-standard radio (MSR) SEM measurements....................................................... 333
SEM with multiple sub blocks ("Multi-SEM")............................................................... 334
10.4.3.5 SEM configuration.......................................................................................................337
Sweep List ..................................................................................................................338
Multi-sem (sub block) settings.....................................................................................342
Reference range......................................................................................................... 344
Power classes............................................................................................................. 345
9User Manual 1176.8839.02 ─ 16

R&S®VSE
10.4.3.6 How to perform a spectrum emission mask measurement......................................... 352
10.4.3.7 Measurement example: multi-sem measurement....................................................... 357
10.4.3.8 Reference: SEM file descriptions................................................................................ 358
10.4.4.1 About the measurement..............................................................................................365
10.4.4.2 Time domain power results......................................................................................... 366
Contents
MSR settings...............................................................................................................346
Standard files.............................................................................................................. 349
List evaluation (results configuration)..........................................................................351
How to manage SEM settings files............................................................................. 355
How to save SEM result files...................................................................................... 356
Format description of SEM XML files..........................................................................359
ASCII file export format (spectrum emission mask).................................................... 364
10.4.4 Time domain power measurement..............................................................................365
10.4.4.3 Time domain power basics - range definition using limit lines.................................... 367
10.4.4.4 Time domain power configuration............................................................................... 367
10.4.4.5 How to measure powers in the time domain............................................................... 368
10.4.5 Frequency and span settings...................................................................................... 369
10.4.6 Bandwidth, filter and Capture configuration................................................................ 372
10.4.6.1 Impact of the bandwidth, filter and Capture settings................................................... 372
Separating signals by selecting an appropriate resolution bandwidth........................ 373
Smoothing the trace using the video bandwidth......................................................... 373
Coupling VBW and RBW............................................................................................ 374
Coupling span and RBW.............................................................................................374
How data is measured: the Capture type....................................................................375
Which data may pass: filter types............................................................................... 376
How long the data is measured: Meas Time ..............................................................376
How much data is measured: Capture points and Capture count...............................377
How often data is measured: Capture mode...............................................................377
10.4.6.2 Bandwidth, filter and Capture settings........................................................................ 377
10.4.6.3 Reference: list of available Channel filters.................................................................. 383
10.5 Analysis..................................................................................................................... 383
10.5.1 Trace configuration......................................................................................................383
10.5.1.1 Basics on setting up traces......................................................................................... 383
10User Manual 1176.8839.02 ─ 16

R&S®VSE
10.5.1.2 Trace configuration......................................................................................................395
10.5.1.3 Trace / data export configuration.................................................................................404
10.5.1.4 How to configure traces.............................................................................................. 407
Contents
Mapping samples to measurement points with the trace detector.............................. 383
Analyzing several traces - trace mode........................................................................ 385
How many traces are averaged - Capture count + Measurement mode.................... 386
X-Value of the Measurement point..............................................................................388
How trace data is averaged - the averaging mode..................................................... 389
Working with spectrograms.........................................................................................389
Trace settings..............................................................................................................395
Trace math.................................................................................................................. 398
Spectrogram settings.................................................................................................. 400
How to configure a standard trace.............................................................................. 407
How to display and configure a spectrogram.............................................................. 408
How to copy traces......................................................................................................412
10.5.2 Marker usage.............................................................................................................. 412
10.5.2.1 Basics on markers and marker functions.................................................................... 413
Marker types............................................................................................................... 414
Activating markers.......................................................................................................414
Marker results............................................................................................................. 414
Searching for signal peaks..........................................................................................415
Markers in the spectrogram........................................................................................ 417
10.5.2.2 Marker settings............................................................................................................417
Individual marker setup............................................................................................... 417
General marker settings..............................................................................................421
10.5.2.3 Marker search settings and positioning functions....................................................... 423
Marker search settings................................................................................................424
Marker search settings for spectrograms....................................................................426
Positioning functions................................................................................................... 429
10.5.2.4 Marker functions..........................................................................................................430
Measuring the power in a channel (band power marker)............................................430
Time domain power measurement..............................................................................433
Marker peak list...........................................................................................................437
11User Manual 1176.8839.02 ─ 16

R&S®VSE
10.5.3.1 Single zoom versus multiple zoom..............................................................................444
10.5.3.2 Zoom functions............................................................................................................445
10.5.3.3 How to zoom into a diagram....................................................................................... 447
10.5.4.1 Display lines................................................................................................................ 449
10.5.4.2 Limit lines.................................................................................................................... 451
Contents
Measuring noise density (noise meas marker)........................................................... 440
Fixed reference marker............................................................................................... 443
Deactivating all marker functions................................................................................ 443
10.5.3 Zoomed displays......................................................................................................... 444
10.5.4 Display and limit lines..................................................................................................449
Basics on display lines................................................................................................ 449
Display line settings.................................................................................................... 450
Defining display lines.................................................................................................. 451
Basics on limit lines.....................................................................................................451
Limit line settings and functions.................................................................................. 454
How to define limit lines.............................................................................................. 458
11 How to perform measurements with the R&S VSE.........................461
11.1 How to perform a basic measurement with instrument input.............................. 461
11.2 How to import I/Q data for analysis.........................................................................463
11.3 How to work with a power sensor........................................................................... 465
11.3.1 How to set up a power sensor.....................................................................................465
11.3.2 How to zero the power sensor.................................................................................... 466
11.3.3 How to configure a power sensor as an external (PSE) trigger.................................. 467
11.4 How to perform measurements on multiple files and instruments......................467
11.5 How to perform a sequence of measurements on a single file or instrument....468
11.6 How to save and load measurement settings........................................................ 469
11.7 How to export I/Q data..............................................................................................470
11.8 How to capture baseband (I/Q) data in the I/Q analyzer........................................472
11.9 How to analyze data in the I/Q analyzer..................................................................473
12 Network and remote operation......................................................... 475
12.1 Remote control basics..............................................................................................475
12.1.1 Remote control interfaces and protocols.....................................................................476
12.1.1.1 LAN interface.............................................................................................................. 476
12User Manual 1176.8839.02 ─ 16

R&S®VSE
12.1.2.1 Hierarchy of status registers....................................................................................... 478
12.1.2.2 Contents of the status registers.................................................................................. 479
Contents
12.1.2 Status reporting system.............................................................................................. 477
Status byte (STB) and service request enable register (SRE)....................................480
IST flag and parallel poll enable register (PPE).......................................................... 481
Event status register (ESR) and event status enable register (ESE)..........................481
STATus:OPERation register........................................................................................482
STATus:QUEStionable register...................................................................................482
STATus:QUEStionable:ACPLimit register...................................................................483
STATus:QUEStionable:EXTended register..................................................................484
STATus:QUEStionable:EXTended:INFO register........................................................484
STATus:QUEStionable:FREQuency register...............................................................485
STATus:QUEStionable:LIMit register.......................................................................... 485
STATus:QUEStionable:LMARgin register................................................................... 486
STATus:QUEStionable:POWer register...................................................................... 487
STATus:QUEStionable:TIMe register..........................................................................487
12.1.2.3 Reset values of the status reporting system............................................................... 487
12.2 Status reporting system........................................................................................... 488
12.2.1 Hierarchy of status registers....................................................................................... 488
12.2.2 Contents of the status registers.................................................................................. 489
12.2.2.1 Status byte (STB) and service request enable register (SRE)....................................490
12.2.2.2 IST flag and parallel poll enable register (PPE).......................................................... 491
12.2.2.3 Event status register (ESR) and event status enable register (ESE)..........................491
12.2.2.4 STATus:OPERation register........................................................................................492
12.2.2.5 STATus:QUEStionable register...................................................................................493
12.2.2.6 STATus:QUEStionable:ACPLimit register...................................................................493
12.2.2.7 STATus:QUEStionable:EXTended register..................................................................494
12.2.2.8 STATus:QUEStionable:EXTended:INFO register........................................................494
12.2.2.9 STATus:QUEStionable:FREQuency register...............................................................495
12.2.2.10 STATus:QUEStionable:LIMit register.......................................................................... 495
12.2.2.11 STATus:QUEStionable:LMARgin register................................................................... 496
12.2.2.12 STATus:QUEStionable:POWer register...................................................................... 497
12.2.2.13 STATus:QUEStionable:TIMe register..........................................................................497
13User Manual 1176.8839.02 ─ 16

R&S®VSE
12.5.1.1 How to assign the IP address..................................................................................... 503
12.5.2.1 How to change the user password..............................................................................505
Contents
12.2.3 Reset values of the status reporting system............................................................... 497
12.3 Locking instruments for exclusive remote control................................................498
12.4 Network and remote control settings......................................................................499
12.5 How to set up a network and remote control......................................................... 502
12.5.1 How to configure a network.........................................................................................502
12.5.2 How to log on to the network.......................................................................................505
12.5.3 How to start a remote control session from a PC........................................................506
12.5.4 How to return to manual operation on the instrument................................................. 506
13 Remote commands............................................................................508
13.1 Conventions used in SCPI command descriptions............................................... 508
13.2 Common suffixes...................................................................................................... 509
13.3 Common commands.................................................................................................509
13.4 Controlling instruments and capturing data.......................................................... 513
13.4.1 Configuring instruments.............................................................................................. 514
13.4.1.1 Configuring the basic connection data........................................................................ 514
13.4.1.2 Obtaining information on connected instruments........................................................518
13.4.1.3 General instrument setup............................................................................................520
13.4.1.4 Performing a self-alignment on the instrument........................................................... 521
13.4.1.5 Configuring an external reference on the instrument.................................................. 522
13.4.2 Loading input files....................................................................................................... 526
13.4.3 Configuring channel input sources..............................................................................542
13.4.4 Configuring measurement channels........................................................................... 545
13.4.5 Controlling measurement groups................................................................................ 552
13.4.6 Controlling measurement sequences..........................................................................567
13.4.7 Compensating for frequency response using touchstone files (R&S VSE-K544)....... 568
13.4.7.1 Remote commands for frequency response correction.............................................. 569
13.4.7.2 Programming example: using touchstone files........................................................... 588
13.4.8 Commands for power sensor usage........................................................................... 589
13.4.9 Configuring the outputs............................................................................................... 593
13.4.10 Configuring the trigger output......................................................................................593
13.5 Configuring the result display................................................................................. 595
14User Manual 1176.8839.02 ─ 16

R&S®VSE
13.6.2.1 Configuring data input................................................................................................. 610
13.6.2.2 Configuring the vertical axis (amplitude, scaling)........................................................652
Contents
13.5.1 Global layout commands.............................................................................................596
13.5.2 Working with windows in the display...........................................................................602
13.5.3 General window commands........................................................................................608
13.6 Remote commands for the I/Q analyzer..................................................................609
13.6.1 Common suffixes.........................................................................................................609
13.6.2 Configuring I/Q analyzer measurements.....................................................................610
RF input.......................................................................................................................610
Configuring oscilloscope baseband input....................................................................620
Using external mixers..................................................................................................623
Remote commands for external frontend control........................................................ 632
Working with power sensors....................................................................................... 641
Amplitude settings.......................................................................................................652
Configuring the attenuation......................................................................................... 654
Configuring a preamplifier........................................................................................... 657
Scaling the Y-axis........................................................................................................658
13.6.2.3 Configuring the axes for statistical displays................................................................ 660
13.6.2.4 Frequency................................................................................................................... 664
13.6.2.5 Configuring triggered and gated measurements.........................................................666
Configuring the triggering conditions...........................................................................666
Configuring gated measurements............................................................................... 673
Programming example: continuous gating..................................................................676
13.6.2.6 Configuring data acquisition........................................................................................676
13.6.2.7 Adjusting settings automatically.................................................................................. 685
13.6.3 Configuring RF measurements................................................................................... 688
13.6.3.1 Measuring the channel power and ACLR................................................................... 688
Managing measurement configurations...................................................................... 688
Configuring the channels............................................................................................ 690
Defining weighting filters............................................................................................. 694
Selecting the reference channel..................................................................................696
Checking limits............................................................................................................ 697
General ACLR measurement settings........................................................................ 704
15User Manual 1176.8839.02 ─ 16

R&S®VSE
13.6.3.2 Measuring the occupied bandwidth.............................................................................736
13.6.3.3 Measuring the spectrum emission mask.....................................................................738
Contents
Configuring MSR ACLR measurements..................................................................... 706
Performing an ACLR measurement............................................................................ 721
Retrieving and analyzing measurement results.......................................................... 724
Programming examples for channel power measurements........................................727
Configuring the measurement.....................................................................................736
Programming example: OBW measurement.............................................................. 737
Managing measurement configurations...................................................................... 739
Controlling the measurement...................................................................................... 740
Configuring a multi-sem measurement....................................................................... 741
Configuring a sweep list.............................................................................................. 742
Configuring the reference range................................................................................. 755
Configuring the power classes.................................................................................... 757
Configuring MSR SEM measurements....................................................................... 762
Configuring the list evaluation..................................................................................... 768
Performing an SEM measurement..............................................................................769
Retrieving results........................................................................................................ 770
Example: SEM measurement..................................................................................... 770
13.6.3.4 Measuring the time domain power.............................................................................. 773
Configuring the measurement.....................................................................................773
Performing a time domain power measurement......................................................... 777
Retrieving measurement results................................................................................. 777
13.6.3.5 Defining the frequency range...................................................................................... 782
13.6.3.6 Configuring bandwidth and sweep settings.................................................................785
Configuring the bandwidth and filter............................................................................785
Configuring the sweep................................................................................................ 788
13.6.4 I/Q analysis................................................................................................................. 790
13.6.4.1 Configuring standard traces........................................................................................ 790
13.6.4.2 Exporting trace results................................................................................................ 796
13.6.4.3 Using trace mathematics.............................................................................................798
13.6.4.4 Configuring spectrograms........................................................................................... 800
Configuring a spectrogram measurement...................................................................800
16User Manual 1176.8839.02 ─ 16

R&S®VSE
13.6.4.5 Using markers............................................................................................................. 806
13.6.4.6 Zooming into the display............................................................................................. 843
Contents
Configuring the color map........................................................................................... 804
Setting up individual markers...................................................................................... 806
General marker settings..............................................................................................812
Marker search (spectrograms).................................................................................... 813
Configuring and performing a marker search..............................................................822
Positioning the marker................................................................................................ 826
Band power marker.....................................................................................................832
Fixed reference marker settings..................................................................................836
Marker peak lists......................................................................................................... 838
Noise measurement marker........................................................................................842
Using the single zoom.................................................................................................843
Using the multiple zoom..............................................................................................845
13.6.4.7 Configuring display lines............................................................................................. 847
13.6.4.8 Defining limit checks................................................................................................... 849
Configuring limit lines.................................................................................................. 850
Managing limit lines.....................................................................................................859
Checking the results of a limit check...........................................................................861
Programming example: using limit lines......................................................................862
13.6.5 Retrieving results........................................................................................................ 864
13.6.5.1 Retrieving captured I/Q data....................................................................................... 865
13.6.5.2 Retrieving I/Q trace data............................................................................................. 868
13.6.5.3 Retrieving marker results............................................................................................ 871
13.6.5.4 Retrieving statistical results.........................................................................................873
13.7 Managing settings and results................................................................................ 874
13.7.1 Restoring the default configuration (preset)................................................................ 875
13.7.2 General data storage and loading commands............................................................ 876
13.7.3 Selecting the items to store.........................................................................................881
13.7.4 Storing and loading measurement settings.................................................................884
13.7.5 Exporting captured and recorded I/Q data.................................................................. 887
13.7.6 Storing or printing screenshots................................................................................... 895
13.8 Configuring the software..........................................................................................899
17User Manual 1176.8839.02 ─ 16

R&S®VSE
13.8.1 Software support and information............................................................................... 899
13.8.2 General display........................................................................................................... 902
13.8.3 Colors and themes...................................................................................................... 903
13.8.4 CMAP suffix assignment............................................................................................. 905
13.8.5 Configuring the application starter.............................................................................. 907
13.9 Commands for remote instrument operation.........................................................909
13.10 Working with status registers..................................................................................912
13.10.1 Using the status register............................................................................................. 912
13.10.1.1 General status register commands............................................................................. 912
13.10.1.2 Reading out the CONDition part................................................................................. 913
13.10.1.3 Reading out the EVENt part........................................................................................913
13.10.1.4 Controlling the ENABle part........................................................................................ 914
13.10.1.5 Controlling the negative transition part........................................................................914
Contents
13.10.1.6 Controlling the positive transition part......................................................................... 915
13.11 Retrieving error messages.......................................................................................916
13.12 Programming examples........................................................................................... 917
13.12.1 Configuring file input................................................................................................... 918
13.12.2 Configuring input from an instrument.......................................................................... 918
13.12.3 Performing a sequence of measurements.................................................................. 919
13.12.4 Basic I/Q analysis........................................................................................................921
13.12.4.1 Programming example: configuring a spectrogram.................................................... 922
13.12.4.2 Programming example: marker search in spectrograms............................................ 924
13.12.5 Recording I/Q data...................................................................................................... 925
13.12.6 Saving and loading measurement settings................................................................. 926
13.12.7 Programming example: complete sequential measurement with data export.............926
13.12.8 Programming examples for channel power measurements........................................932
13.12.8.1 Example: configuring and performing an ACLR measurement...................................933
13.12.8.2 Example: configuring and performing an MSR ACLR measurement..........................935
13.12.8.3 Example: configuring and performing an asymmetrical MSR ACLR measurement....938
13.12.9 Programming example: OBW measurement.............................................................. 941
14 Troubleshooting................................................................................. 943
14.1 Troubleshooting remote operation..........................................................................943
14.2 Error messages in remote control mode................................................................ 944
18User Manual 1176.8839.02 ─ 16

R&S®VSE
Contents
14.3 Troubleshooting external frontend control............................................................ 945
14.3.1 Error messages...........................................................................................................945
14.3.2 Problems with connection........................................................................................... 947
14.3.3 Problems during operation.......................................................................................... 947
14.4 Collecting information for support..........................................................................948
14.4.1 Contacting customer support...................................................................................... 949
Annex.................................................................................................. 951
A Menu reference...................................................................................951
A.1 Common R&S VSE menus....................................................................................... 951
A.1.1 File menu.................................................................................................................... 951
A.1.2 Window menu............................................................................................................. 953
A.1.3 Help menu...................................................................................................................954
A.2 I/Q analyzer menus................................................................................................... 955
A.2.1 Edit menu.................................................................................................................... 955
A.2.2 Input & output menu....................................................................................................955
A.2.3 Meas setup menu........................................................................................................956
A.2.4 Trace menu................................................................................................................. 957
A.2.5 Marker menu............................................................................................................... 957
B Reference of toolbar functions......................................................... 959
C Formats for returned values: ASCII format and binary format...... 963
D Reference: format description for I/Q data files..............................964
E Reference: supported I/Q file formats..............................................966
E.1 I/Q data file format (iq-tar)........................................................................................ 967
E.1.1 I/Q parameter XML file specification........................................................................... 968
E.1.1.1 Minimum data elements.............................................................................................. 969
E.1.1.2 User-defined data elements........................................................................................ 971
Mandatory data elements............................................................................................971
Optional data elements............................................................................................... 972
Example: userdata for I/Q recordings by R&S VSE software..................................... 975
E.1.1.3 Example...................................................................................................................... 976
E.1.2 I/Q data binary file....................................................................................................... 978
19User Manual 1176.8839.02 ─ 16

R&S®VSE
Contents
E.2 CSV file format.......................................................................................................... 980
E.2.1 Mandatory data elements............................................................................................981
E.2.2 Optional data elements............................................................................................... 981
E.2.3 Example...................................................................................................................... 982
E.2.4 Simple CSV format......................................................................................................983
E.3 IQW file format...........................................................................................................983
E.4 IQX file format............................................................................................................984
E.5
Matlab® v. 4 / v. 7.3 file format.................................................................................. 985
E.5.1 Mandatory data elements............................................................................................985
E.5.2 Optional data elements............................................................................................... 986
E.5.3 Example...................................................................................................................... 988
E.5.4 Simple matlab® format................................................................................................988
E.6 AID format..................................................................................................................988
E.6.1 Data body....................................................................................................................990
E.7 WV format.................................................................................................................. 998
E.7.1 Mandatory elements....................................................................................................998
E.7.2 Optional elements....................................................................................................... 998
F Reference: ASCII file export format..................................................999
List of remote commands (basic software)................................... 1001
Index..................................................................................................1022
20User Manual 1176.8839.02 ─ 16

R&S®VSE
Release Notes and Open Source Acknowledgment (OSA)
1 Documentation Overview
This section provides an overview of the R&S VSE user documentation. Unless specified otherwise, you find the documents on the R&S VSE product page at: www.rohde-
schwarz.com/manual/VSE
1.1 User Manuals and Help
Separate user manuals are provided for the base software and additional software
applications:
●
Base software manual
Contains the description of the graphical user interface, an introduction to remote
control, the description of all remote control commands, programming examples,
and information on maintenance, software interfaces and error messages.
●
Software application manuals
Contain the description of the specific functions of a software application, including
the remote control commands. Basic information on operating the R&S VSE is not
included.
Documentation Overview
The contents of the user manuals are available as help in the R&S VSE. The help
offers quick, context-sensitive access to the complete information for the base software
and the software applications.
All user manuals are also available for download or for immediate display on the Internet.
1.2 Data Sheets and Brochures
The data sheet contains the technical specifications of the R&S VSE. It also lists the
firmware applications and their order numbers, and optional accessories.
The brochure provides an overview of the instrument and deals with the specific characteristics.
See www.rohde-schwarz.com/brochure-datasheet/VSE
1.3 Release Notes and Open Source Acknowledgment (OSA)
The release notes list new features, improvements and known issues of the current
firmware version, and describe the firmware installation.
The open-source acknowledgment document provides verbatim license texts of the
used open source software.
21User Manual 1176.8839.02 ─ 16

R&S®VSE
Documentation Overview
Application Notes, Application Cards, White Papers, etc.
See www.rohde-schwarz.com/software/VSE
1.4 Application Notes, Application Cards, White Papers, etc.
These documents deal with special applications or background information on particular topics.
See www.rohde-schwarz.com/application/vse/
22User Manual 1176.8839.02 ─ 16

R&S®VSE
Welcome to the R&S VSE
2 Welcome to the R&S VSE
The R&S VSE is a new high-performance Rohde & Schwarz analysis software for various analysis tasks and input from various instruments.
The R&S VSE features analysis of:
●
The same data in various applications simultaneously
●
I/Q data files
●
Multiple inputs from a single instrument
●
Input from different instruments, including:
–
R&S®FSW
–
R&S®FSWP
–
R&S®FPS
–
R&S®FPL1000
–
R&S®FSV/ R&S®FSVA
–
R&S®FSL
–
R&S®FSV3000/ R&S®FSVA3000 (also via external frontend)
–
The R&S®RTx oscilloscope product family
–
R&S®ZNL Network Analyzers (with R&S®ZNL3‑B1 Spectrum Analyzer Mode
option)
–
R&S®CMA Radio Test Sets
–
R&S®NRQ6 Power Sensors
This user manual contains a description of the basic functionality that the software provides, including remote control operation. The latest version is available for download
at the product homepage (www.rohde-schwarz.com/product/VSE.html).
23User Manual 1176.8839.02 ─ 16

R&S®VSE
3 Software installation
The R&S VSE software can be installed and executed on any PC or directly on an
instrument which will be used as input for signal analysis. See the data sheet for information on which instruments the software can be installed on.
3.1 Installing required components
The following software components must be installed to run the R&S VSE successfully:
●
Microsoft .NET Framework 4.0
●
R&S License Server
●
VISA (Virtual Instrument Software Architecture)
The R&S License Server and Microsoft .NET Framework 4.0 are installed automatically during installation of the R&S VSE.
Software installation
Installing required components
VISA can be installed directly during installation of the R&S VSE, or manually, independently of the R&S VSE installation.
Installing the Microsoft .NET Framework
When you install the R&S VSE via the provided installation file (see Chapter 3.2,
"Installing and starting the R&S VSE software", on page 25), the installer automati-
cally checks whether the required Microsoft .NET Framework versions are available on
the PC. If not, version 3.5 is installed from the R&S VSE CD-ROM. An internet connection to the Microsoft website is established to download the Framework version 4.0
(due to the large file size). Thus, before attempting to install the R&S VSE software,
ensure that a strong internet connection is available from the PC, as downloading can
take some time. Alternatively, download the Framework 4.0 version from the internet
manually before you start the R&S VSE installer.
Installing VISA
It is also necessary to install VISA (Virtual Instrument Software Architecture) on the PC
to access instruments connected via IEEE or LAN bus.
It is recommended that you use the R&S VISA driver. The R&S VISA driver is supplied
with the R&S VSE installation file, and can be installed together with the R&S VSE
software (see Chapter 3.2, "Installing and starting the R&S VSE software",
on page 25).
Once the R&S VSE software is installed, a status icon in the status bar indicates
whether the VISA installation is available, see Table 6-1.
24User Manual 1176.8839.02 ─ 16

R&S®VSE
Software installation
Installing and starting the R&S
3.2 Installing and starting the R&S VSE software
It is recommended that you copy the R&S VSE installation file from the installation CDROM to your hard disk before you execute it. To install the R&S VSE software directly
on an instrument, copy the installation file to a USB storage device and execute it from
there.
To install the R&S VSE software
1. Insert the R&S VSE CD-ROM in the PC or the USB storage device in the instru-
ment.
If the start page does not open automatically, select the start.htm file in the main
directory.
2. Switch to the "Installation" tab.
3. Select the link to the VSESetup_XXX.exe file.
4. Select a storage location on your hard disk.
5. From the hard disk, select the VSESetup_XXX.exe file.
VSE software
6. Select the required options to install.
Unless you have ensured the required R&S VISA is installed manually before starting the R&S Vector Signal Explorer Base Software installation on a PC, be sure to
keep the "R&S VISA" option selected.
To make use of the R&S VSE software in a Cadence®AWR®VSS installation, make
sure to enable the "VSE Cadence VSS Integration" option. See also Chapter 3.5,
"Using R&S VSE with Cadence®AWR®VSS", on page 30.
7. Select "Install".
The installer performs the following actions:
●
Checks for the required Microsoft .NET Framework versions on the PC, and if necessary, downloads the required version from the Internet, before installing both versions
●
If enabled, installs the "R&S VISA" software on the PC
●
Installs the R&S VSE software including an uninstall tool
●
Creates a shortcut on the desktop
●
If necessary (the software specifically asks you), sets the required environment
variables
This step can require administrator rights on the PC.
When the installation is complete, the dialog box turns green and all selected options
are indicated as "OK".
To start the R&S VSE software
► Start the software via the Windows "Start Menu" entry or the shortcut on the desk-
top.
25User Manual 1176.8839.02 ─ 16

R&S®VSE
Software installation
Using the smart card reader
Demo mode
Without the use of the software license provided by a smart card reader, the software
starts in "Demo-Mode". In this case, all (installed) options and remote commands are
available. However, no instruments can be configured, no I/Q files and no measurement settings can be loaded or saved.
3.3 Using the smart card reader
The R&S VSE software requires a smart card containing the software license to be
connected to the PC when you are using the software. The R&S®FSPC license dongle
that contains the software license consists of a smart card and a USB dongle. The
smart card can be used in the supplied USB dongle or in a smart card reader. The
R&S®FSPC license dongle is available as a separate product and must be ordered in
addition to the software.
You can connect the smart card in two ways.
●
Connect the smart card in SIM format.
To connect the smart card in SIM format, use the USB smart card reader (dongle)
provided with the smart card.
●
Connect the smart card in its full format.
To connect the smart card in full format, an interface compatible to the card format
is required.
The following devices are able to read the smart card in full format.
– Smart card reader integrated in a keyboard, notebook, or in a desktop PC (e.g.
OMNIKEY)
– Smart card reader connected to the computer via serial bus or USB (e.g.
OMNIKEY)
– USB reader connected to a LAN-to-USB converter to distribute the license via
the network (e.g DIGI AnywhereUSB/2)
Licensing support
If you have any difficulties with the licensing system, support is only assured when you
are using the R&S®FSPC license dongle.
Using the R&S®FSPC USB smart card reader (dongle)
1.
The R&S®FSPC license dongle consists of a smart card in full format and a USB
smart card reader (dongle).
26User Manual 1176.8839.02 ─ 16

R&S®VSE
Software installation
Using the smart card reader
2. Break out the smart card in SIM format.
3. Twist out the upper part of the smart card reader.
4. Insert the smart card with the chip facing upwards and the angled corner facing the
USB dongle, whose "Rohde & Schwarz" label is also facing upwards.
Insert the smart card as far as possible.
5. Twist the smart card reader back into its original state.
27User Manual 1176.8839.02 ─ 16

R&S®VSE
Software installation
Using a license server
The smart card reader is ready for use on any USB interface.
Drivers
When you connect the reader to the computer, MS Windows automatically installs the
necessary drivers. If not, you can install the drivers manually from the Internet site of
the manufacturer at http://support.identiv.com/utrust-token-standard/.
Problems during login due to smart card reader
When the smart card reader is connected, the operating system may falsely identify
the smart card as a medium to perform a login procedure on the PC. In this case, the
windows lock screen is displayed instead of a login window.
You can solve this issue by editing the "DisableCAD" ("Disable Ctrl-Alt-Del") registry
key in the system registry. This key is located at
HKEY_LOCAL_MACHINE\SOFTWARE\Microsoft\Windows\CurrentVersion\
policies\system.
Administration rights
Security policies of your network environment might prevent you from editing the system registry or installing drivers. Contact your IT administration in that case.
To change the registry key
1. From the Windows "Start Menu", select the "Run" item.
(Windows 10: "Start > All applications > Windows System > Run")
2. Enter regedit in the dialog box to open the system registry.
3. Look for
HKEY_LOCAL_MACHINE\SOFTWARE\Microsoft\Windows\CurrentVersion\
policies\system.
4. Set the value of DisableCad to 0.
3.4 Using a license server
As an alternative to the R&S®FSPC license dongle, software licenses can now also be
provided by an R&S®License Server (for R&S VSE Enterprise Edition only). In this
case, all available licenses are stored on a specified server. When you need a particular application, you can obtain a license from the server. When you no longer need the
license, you return it to the server and it becomes available to other users again. These
licenses are also referred to as floating licenses, as opposed to permanently assigned
licenses.
28User Manual 1176.8839.02 ─ 16

R&S®VSE
Software installation
Using a license server
The R&S®License Server must be set up as described in the R&S®License Server Managing Floating Licenses - User Manual.
Two different kinds of floating licenses are available.
Common floating license
A common floating license enables you to use an option as long as you need it, but
requires a permanent connection to the license server.
The license is retrieved from the license server only when you open an application
channel. Only one license per option is retrieved, but the option can be used in multiple
channels. It is returned shortly after you close the (last) application channel. The
license is blocked for other users only while at least one application channel is in use.
If the connection to the license server is lost for longer than approximately 10 minutes,
the R&S VSE assumes no license is available and closes the application.
Occupied license
An occupied license is retrieved once from the license server and stored locally for up
to 7 days, depending on the selected time period. During the occupied period, the
license is blocked for other users. After this time, the license automatically expires and
becomes available on the license server again. During the occupied period, no further
access to the license server is required. The license cannot be returned or disabled
manually before it expires, but it can be extended.
When the license expires, you must retrieve a new license from the license server. If
the connection to the license server is not available or no more licenses are available,
the R&S VSE closes the application.
Setting up floating licenses
To use floating licenses, you must set up one or more floating license servers (see
"Setup Floating License Server" on page 168). The R&S VSE checks the configured
servers for available floating licenses when it starts up. Only options for which licenses
are found are available in the R&S VSE. After changing the floating license server configuration, you must restart both the local License Manager service and the R&S VSE
software.
When you first start the R&S VSE software after installation, if no license dongle or
floating license server is found, the software starts in demo mode.
In the software, you can disable, re-enable or occupy licenses from the server for individual applications. Note that all application-specific licenses for a particular application
are always enabled or disabled together, you cannot obtain individual sublicenses
(such as K100 without K102 for the LTE application).
The currently activated licenses are indicated in the "Versions + Options" dialog box in
the "Help" menu, see Chapter 9.4.1, "Licensing, versions and options", on page 166.
29User Manual 1176.8839.02 ─ 16

R&S®VSE
R&S WinIQSim2
Signal Generator
R&S VSE
Signal Analyzer
Cadence VSS
RF Design/Analysis
Software installation
3.5
Using R&S
Using R&S VSE with Cadence
VSE with Cadence®AWR®VSS
®
AWR®VSS
The Cadence AWR Visual System Simulator (VSS) allows you to simulate RF components in complete communication links. By integrating R&S®VSESIM-VSS into the simulator, you can extend the simulation to baseband signal analysis for various RF components. For example, you can use R&S WinIQSim2 to create encrypted waveform
files as input for Cadence®AWR®VSS. Then you can analyze the simulated processed
data using the R&S VSE functionality.
Figure 3-1: Typical integration scenario for R&S VSE and Cadence®AWR®VSS
Scope of functionality and restrictions
Using the simulator, the R&S VSE can only process input from encrypted waveform
files, as provided by the RS_SNK block in Cadence®AWR®VSS. It cannot analyze input
from an instrument, such as R&S FSW or R&S FSV3000. Otherwise,
Cadence®AWR®VSS provides the same analysis functionality as the R&S VSE Basic
Edition with all supported applications.
To integrate R&S VSE in Cadence®AWR®VSS
To integrate R&S VSE in Cadence®AWR®VSS, you must install additional .dll files to
Cadence®AWR®VSS via the common R&S VSE installation. Integration is only possible if the Cadence®AWR®VSS software is installed before you start the R&S VSE
installation. If necessary, repeat the R&S VSE installation for the Cadence®AWR®VSS
option after installing the Cadence®AWR®VSS software. The R&S WinIQSim2 software
can be installed before or after the R&S VSE software, if required.
Furthermore, an additional licence is required for R&S VSE (R&S®VSESIM-VSS).
1.
If necessary, install the Cadence®AWR®VSS software.
2. Install the R&S VSE software as described in "To install the R&S VSE software"
on page 25.
30User Manual 1176.8839.02 ─ 16

R&S®VSE
Software installation
Using R&S
a) Make make sure to enable the "VSE Cadence VSS Integration" package.
VSE with Cadence®AWR®VSS
The two additional .dll files are integrated in the Cadence®AWR®VSS software.
3.
Install the Cadence®AWR®VSS license key on the license server, as described in
Chapter 9.4.1.2, "License management", on page 167.
To create an encrypted waveform file from R&S WinIQSim2 as input
1. Start R&S WinIQSim2.
2. Select a digital baseband standard.
3. Enable the use of the selected standard.
4. From the "Transmission" menu, select "Transmit to:" "File".
5. Enter a file name.
6. Select "Transmit".
The output waveform file for the used baseband standard is encrypted and stored.
It is then ready for Cadence®AWR®VSS to process.
To configure analysis with R&S VSE from Cadence®AWR®VSS
1.
Start the Cadence®AWR®VSS software.
2. Create a new project.
3. Add a system block named "RS_SRC".
4. Double-click the block to display a list of parameters and their description.
31User Manual 1176.8839.02 ─ 16

R&S®VSE
Software installation
Using R&S
5. Configure the "FILENAME" parameter to use as input, e.g. the encrypted waveform
file created by R&S WinIQSim2.
VSE with Cadence®AWR®VSS
6. Add a system block named "RS_SNK".
7. Connect the "RS_SNK" block to the "RS_SRC" block, as required in your
Cadence®AWR®VSS project.
8. Configure the "FILENAME" parameter to use as output, that is: the encrypted
waveform file to analyze with R&S VSE.
32User Manual 1176.8839.02 ─ 16

R&S®VSE
Software installation
9. Start and stop the simulation.
Using R&S
VSE with Cadence®AWR®VSS
After the simulation has finished, the output waveform file is stored to the specified
location.
10. Start R&S VSE.
11. Configure a new measurement channel for the generated signal.
12. Select the encrypted .wv file as input for the R&S VSE measurement channel.
13. Perform a measurement in R&S VSE as usual.
To analyze signals after initial configuration
After setting up the test system as described in "To configure analysis with R&S VSE
from Cadence®AWR®VSS" on page 31, you can analyze signals in just a few steps.
1. Generate a signal in R&S WinIQSim2.
2. Select "Transmit" in R&S WinIQSim2.
3.
Start and stop Cadence®AWR®VSS.
4. After the simulation has finished and the output file has been stored, start the mea-
surement in R&S VSE.
For details on installing and operating Cadence®AWR®VSS, see the Cadence documentation.
33User Manual 1176.8839.02 ─ 16

R&S®VSE
Software installation
Deinstalling R&S VSE
3.6 Deinstalling R&S VSE
Access: "Start" > "All Programs" > "Rohde-Schwarz" > "VSE" > [version_number] >
"Uninstall VSE"
or: (Windows 7) "Start" > "Control Panel" > "Add or Remove Software"
or: (Windows 10) "Start" > "Settings" > "System" > "Apps & features" > "R&S VSE Sig-
nal Analyzer" > "Uninstall".
You can uninstall the software itself via the uninstall tool available in the R&S VSE
folder, or via the standard Windows "Add or Remove Software" function.
34User Manual 1176.8839.02 ─ 16

R&S®VSE
Trying out the R&S VSE
Capturing and analyzing data from a connected instrument
4 Trying out the R&S VSE
This chapter introduces the most important functions and settings of the R&S VSE step
by step. The complete and detailed description of the functionality can be found in the
subsequent chapters. Basic instrument operation is described in Chapter 6, "Operating
basics", on page 57.
Prerequisites
●
The software is installed and started as described in Chapter 3, "Software installa-
tion", on page 24.
For these first measurements, you can use either a connected instrument in the network or an input file.
● Capturing and analyzing data from a connected instrument...................................35
● Analyzing stored data from a file.............................................................................44
4.1 Capturing and analyzing data from a connected instrument
The following example demonstrates how to perform a very simple measurement on
input from a connected instrument using the R&S VSE. Only the default I/Q Analyzer
application is required.
Try out the following:
● Configuring an instrument.......................................................................................35
● Assigning the instrument to a channel.................................................................... 37
● Adding additional result displays.............................................................................38
● Rearranging windows..............................................................................................40
● Undocking and resizing the help window................................................................41
● Adding further measurement channels................................................................... 41
● Renaming a measurement channel........................................................................ 43
● Recording measurement data.................................................................................44
4.1.1 Configuring an instrument
In the first step, we will search for instruments connected to the same network as the
PC running the R&S VSE software, and attempt to connect to one of them.
1. Select the "Instruments" tab at the upper left of the R&S VSE window.
2. Select "Search" to search for all instruments in the network.
3. To find instruments using the VXI-11 protocol, in the "Device Search" dialog box,
select the interface type "LAN VXI-11" and select "Search".
35User Manual 1176.8839.02 ─ 16

R&S®VSE
Trying out the R&S VSE
Capturing and analyzing data from a connected instrument
If there are very many results, try filtering them by the type of instrument, for example, enter FSW in the "Filter" field.
4. From the result list, select the instrument from which data is to be captured, then
select "OK".
5. In the "Instruments" window, select "Connect" to establish a connection to the
specified instrument.
The connection state should turn green and indicate "connected".
36User Manual 1176.8839.02 ─ 16

R&S®VSE
Trying out the R&S VSE
Capturing and analyzing data from a connected instrument
4.1.2 Assigning the instrument to a channel
Now we must assign the configured and connected instrument as the input source for
the default measurement channel.
1. In the "Measurement Group Setup" tool window, for the default group 1, select the
"+" icon in front of the default measurement channel "IQ Analyzer".
2. Select "Instrument" as the input type.
3. From the "Instrument" selection list, select the instrument to be used for the mea-
surement.
4. From the "Input Source" selection list, select "RF".
5.
Select the "Capture" icon for the "IQ Analyzer" measurement channel.
Since the default measurement mode is continuous, a continuous measurement is
started immediately on the connected instrument. The results are displayed in the
"IQ Analyzer: Magnitude" and "IQ Analyzer: Spectrum" result displays.
37User Manual 1176.8839.02 ─ 16

R&S®VSE
Trying out the R&S VSE
Capturing and analyzing data from a connected instrument
4.1.3 Adding additional result displays
For the I/Q Analyzer, up to 6 windows can be displayed for a single channel. We will
add Spectrum and Statistics result displays.
38User Manual 1176.8839.02 ─ 16

R&S®VSE
Capturing and analyzing data from a connected instrument
1.
Select the "Add Window" icon from the toolbar.
2. Select the "Spectrum" result display.
A new window (2) for the "Spectrum" result display is opened.
Trying out the R&S VSE
3.
Select the "Add Window" icon again and select the "Statistics" result display.
A new window (3) for the "Statistics" result display is opened.
39User Manual 1176.8839.02 ─ 16

R&S®VSE
Trying out the R&S VSE
Capturing and analyzing data from a connected instrument
4.1.4 Rearranging windows
The R&S VSE window has now become rather crowded. Let us move the "Statistics"
window (3) behind the Spectrum window (2), so both become tabs in the same area.
► Select the window title bar of the "Statistics" window (3) and drag it over the Spec-
trum window (2). Possible new positions for the "Statistics" window (3) are indicated by an empty gray space in the R&S VSE window.
Figure 4-1: Moving the Statistic window over the Spectrum window
As soon as the "Statistics" window (3) is placed over the Spectrum window (2),
both windows are shown as tabs.
When you drop the window, the moved window is added as a tab.
Figure 4-2: Tabbed windows
To switch between the two windows, simply select the corresponding tab.
40User Manual 1176.8839.02 ─ 16

R&S®VSE
Capturing and analyzing data from a connected instrument
4.1.5 Undocking and resizing the help window
Displaying the help window is often useful when you need to know which values to
enter in a dialog, for example. However, if many result displays are required, the
R&S VSE window might get rather crowded. Thus, we will undock the help window and
move it outside the actual R&S VSE window.
1.
Select the "Help" icon in the window title bar to display the "Help" window.
2.
Select the
The window is detached and can be moved and resized independently of the
R&S VSE window.
"Dock" / "Undock" icon in the "Help" window title bar.
Trying out the R&S VSE
3. Move the "Help" window anywhere on the screen, for example next to the
R&S VSE window.
4. To resize the "Help" window, select the window frame and drag it to the required
size.
4.1.6 Adding further measurement channels
In addition to the default I/Q Analyzer measurement channel, we will add a second
channel for I/Q Analysis.
1. In the "Measurement Group Setup" tool window, select the "+ Channel" button to
add a new measurement channel to the group.
2. Select the "I/Q Analyzer" measurement mode.
The channel bar and the default result displays for the new IQ Analyzer measurement channel are displayed. If necessary, the previously displayed windows are
cumulated in tabs to create room on the display.
41User Manual 1176.8839.02 ─ 16

R&S®VSE
Trying out the R&S VSE
Capturing and analyzing data from a connected instrument
Figure 4-3: Second IQ Analyzer measurement channel ("IQ Analyzer 2")
3. Select the configured instrument as the input type for the new measurement chan-
nel.
42User Manual 1176.8839.02 ─ 16

R&S®VSE
Capturing and analyzing data from a connected instrument
Notice how the "IQ Analyzer 2" channel is now active, while the "IQ Analyzer"
channel is deactivated. This is due to the fact that both channels are based on the
same instrument, but each instrument can only perform one measurement at a
time. Thus, the channel that was assigned to the instrument previously ("IQ Analyzer") is deactivated when the instrument is assigned to a new channel ("IQ Analyzer 2").
4.
Select the "Capture mode" icon to toggle between single
measurements for each measurement channel.
5.
Select the "Capture" icon for a measurement channel to perform a measurement
on that channel. Only one channel can be started manually at a time. Before you
can start another channel, you must stop the previous measurement by selecting
the "Stop" icon for that channel first.
4.1.7 Renaming a measurement channel
The second I/Q Analyzer channel was named "IQ Analyzer 2" by default when it was
created. We will change the name to "New I/Q Analyzer".
Trying out the R&S VSE
and continuous
1. In the "Measurement Group Setup" tool window, double-click (slowly) the name of
the "IQ Analyzer 2" measurement channel.
(Alternatively, select "File" > "Measurement Group" > "Rename Measurement
Channel".)
The channel name turns into an input box.
2. Enter New I/Q Analyzer and press [ENTER].
The channel name is changed, not only in the "Measurement Group Setup", but
also in all channel and window title bars.
43User Manual 1176.8839.02 ─ 16

R&S®VSE
4.1.8 Recording measurement data
Now we will record the measured I/Q Analyzer data so that we can play it back again
later. We want to store all available results, regardless of how many measurements we
perform.
1. From the "File" menu, select "Preferences > Recording".
2. For the "Number of Records", select 20.
3. Close the "Preferences" dialog box.
4.
Select the "Record" function for the "IQ Analyzer" channel in the "Measurement
Group Setup" tool window.
The captured I/Q data is recorded.
5.
To stop recording measurement results, select the "Pause" function for the "IQ
Analyzer" channel in the "Measurement Group Setup" tool window.
The temporary file is used as input for the "IQ Analyzer" channel, and the first
recorded record is displayed immediately in the channel's result displays.
Trying out the R&S VSE
Analyzing stored data from a file
6. From the "File" menu, select "Save IQ Recording" to store the file permanently.
7. Select the storage location and file name for the stored data.
8. Select the "File Type": ".iq.tar".
9. Select "Save".
The captured data is stored to a file. You can now continue with the second part of
the Trying Out chapter: analyzing stored data from a file.
4.2 Analyzing stored data from a file
If no instrument is available in the network to provide input to the R&S VSE, you can
also try out the software using an input file. Several input files are provided with the
software for demonstration purposes. Check the
44User Manual 1176.8839.02 ─ 16

R&S®VSE
C:\ProgramData\Rohde-Schwarz\VSE\<version_no>\user\Demo directory
for an appropriate file.
Note that this directory is not displayed in the "Load I/Q File" dialog box, you must
enter the path and file name directly in the "File Name" field. (Tip: copy the path and
file name from the Windows Explorer window.)
4.2.1 How to import I/Q data for analysis
1. In the "Measurement Group Setup" tool window, select the "+" icon in front of the
"IQ Analyzer" measurement channel.
2. Select "File" as the input type.
3. Select the "..." icon to open the "Load I/Q File" dialog box and select the storage
location and the file name.
4.
Select the "Capture" icon for the "IQ Analyzer" measurement channel.
Trying out the R&S VSE
Analyzing stored data from a file
The stored data is loaded from the file and evaluated in the "IQ Analyzer" result
displays.
4.2.2 Setting and moving a marker
Markers are useful to determine the position of particular effects in the trace. The most
common use is to determine a peak, which is the default setting when you activate a
marker. We will set a marker on the peak in the Magnitude display of the IQ Analyzer
measurement.
1. Tap the Magnitude display to set the focus on that window.
2.
Select the "New Marker" icon from the toolbar.
Marker 1 is activated and automatically set to the maximum of trace 1. The marker
position and value is indicated in the diagram area as M1[1].
45User Manual 1176.8839.02 ─ 16

R&S®VSE
Trying out the R&S VSE
Analyzing stored data from a file
3. Now you can move the marker by tapping and dragging it to a different position.
The current position is indicated by a dotted blue line. Notice how the position and
value change in the marker area of the diagram.
46User Manual 1176.8839.02 ─ 16

R&S®VSE
Measurements and results
Measurement concept
5 Measurements and results
The R&S VSE provides several applications for different analysis tasks and different
types of signals. The I/Q Analyzer application is included in the basic R&S VSE software. All other applications, such as Analog Demodulation or Vector Signal Analysis
(VSA) are optional additions and require special licenses. (See also Chapter 5.2,
"Available applications", on page 53.)
● Measurement concept.............................................................................................47
● Available applications..............................................................................................53
● Starting an application.............................................................................................55
5.1 Measurement concept
As a rule, each instrument can only perform a single measurement at any time. However, the R&S VSE allows you to perform multiple measurements on the same instrument sequentially, or to perform multiple measurements on different instruments in parallel. Thus, comprehensive data analysis with a single tool becomes quick and simple.
R&S VSE Enterprise Edition vs Basic Edition
The R&S VSE Enterprise Edition and Basic Edition differ in the number of channels,
groups, and instruments that can be configured at the same time, see "R&S VSE
Enterprise Edition vs Basic Edition" on page 75. Not all functions described here are
supported by the R&S VSE Basic Edition.
Within Cadence®AWR®VSS, the R&S VSE can only process input from encrypted
waveform files, not from a device. Otherwise, Cadence®AWR®VSS provides the same
functionality as the R&S VSE Basic Edition with all supported applications. For details,
see Chapter 3.5, "Using R&S VSE with Cadence®AWR®VSS", on page 30.
Basic measurement process
In a basic I/Q measurement, data is imported from a file or captured from an instrument and the measured results are displayed. Multiple applications can be used at the
same time in the R&S VSE. However, data acquisition on the same instrument is
restricted to a single application at a time.
Measurement channels
When you activate an application, a new measurement channel is created which determines the measurement settings for that application. The same application can be activated with different measurement settings by creating several channels for the same
application. Whenever you switch channels, the corresponding measurement settings
are restored.
The global information and results for each channel are displayed in separate windows
(or tabs) on the screen. The results from various applications can be displayed at the
same time. Each application may provide different result displays (see the applications'
47User Manual 1176.8839.02 ─ 16
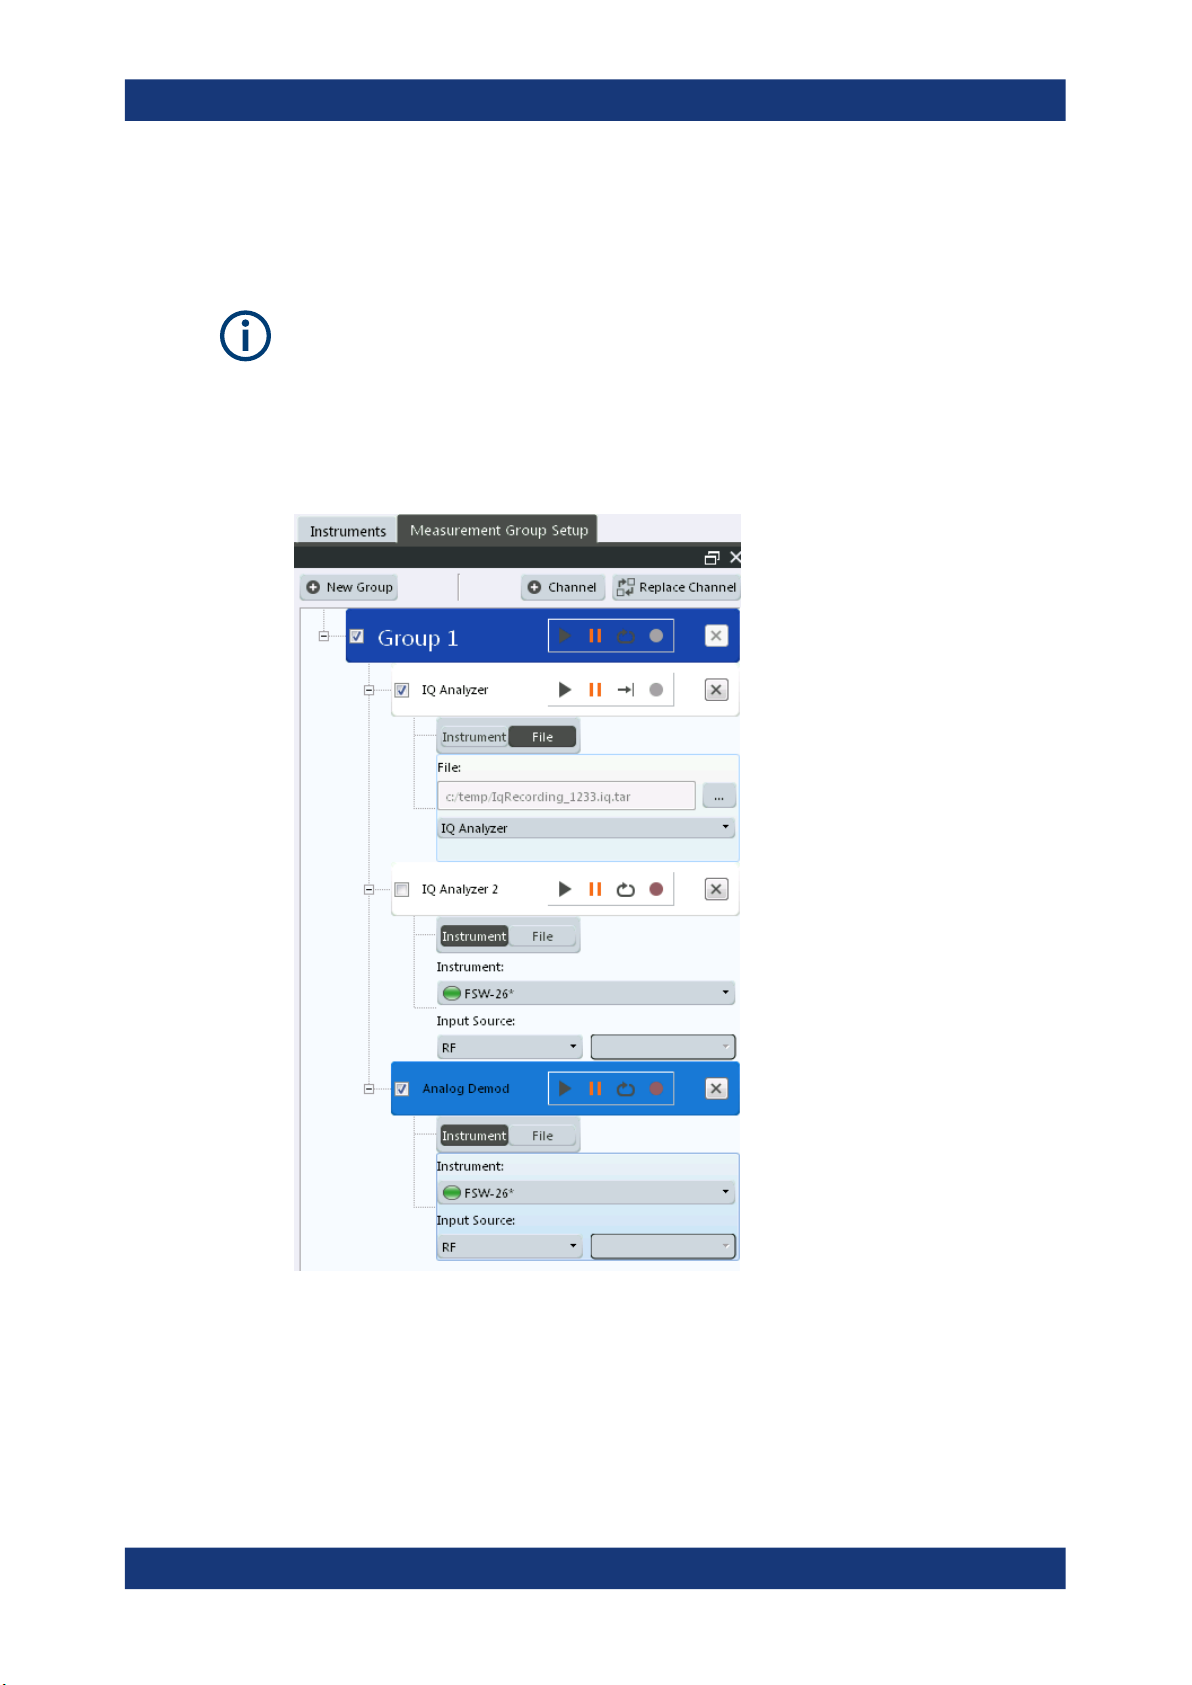
R&S®VSE
Measurements and results
Measurement concept
user manual for details). The measurement windows can be rearranged and configured in the R&S VSE to meet your requirements (see Chapter 6.3, "Customizing the
user interface", on page 65).
The measurement channels are labeled with their default name. If that name already
exists, a sequential number is added. However, the name of the measurement channel
can be changed. For an overview of default names see INSTrument:LIST?
on page 550.
In the R&S VSE, measurement channels are controlled and initially configured in the
"Measurement Group Setup" tool window.
Figure 5-1: "Measurement Group Setup" tool window
For each channel, the input type (instrument or file) and the input source type must be
configured. Detailed configuration for the measurement can then be performed via the
specific configuration "Overview" which is available for each application. (For details
see the applications' user manual.)
48User Manual 1176.8839.02 ─ 16

R&S®VSE
Measurements and results
Measurement concept
You can configure up to 30 channels at the same time (for the R&S VSE Basic Edition,
up to three channels). However, only one measurement channel can be started manually at any time. Before you can start another channel, you must stop the previous
measurement channel first.
The "running" icon in the channel function bar indicates that the channel is currently
performing a measurement.
The "error" icon in the channel function bar indicates that an error occurred in the
measurement channel. Check the R&S VSE status bar.
Measurement groups
As opposed to manual channel control, multiple measurements on different instruments or files can be performed in parallel if controlled by the software (Enterprise Edition only). All measurement channels that are to be started at the same time must be
configured within a group. When the group is started, all included (active) measurement channels are started and provide results independently as soon as their measurements are completed. Note, however, that the individual measurements are not
synchronized in any way, and the results are totally independent as the input data is
different for each channel.
Configure triggers to synchronize the individual measurements.
In the R&S VSE Enterprise Edition, multiple groups of measurement channels can be
configured, for example to define individual test scenarios.
Measurement groups are a convenient way to start multiple measurements at the
same time.
49User Manual 1176.8839.02 ─ 16

R&S®VSE
Measurements and results
Measurement concept
Figure 5-2: Example for a measurement group
Active vs inactive channels
As mentioned above, only measurements on different instruments or on files can be
performed in parallel (Enterprise Edition only). If the same instrument is assigned to
multiple measurement channels of the same group, those channels cannot be processed simultaneously. Thus, the channel to which the instrument was assigned previously is deactivated. Only active measurements are included in a group measurement.
Active channels are indicated by a checkmark in front of the channel in the "Measurement Group Setup" tool window.
50User Manual 1176.8839.02 ─ 16

R&S®VSE
Measurements and results
Measurement concept
Measurement groups and sequences
For multiple measurements on the same instrument, without switching between measurement channels manually, the R&S VSE provides a measurement sequence (Enterprise Edition only). A single instrument can perform only one measurement at a time;
however, a sequence of measurements can be performed very quickly by the software.
A measurement sequence consists of a number of measurement groups, and each
group may contain multiple channels. However, only channels with distinct input types
can be active within a group during a measurement sequence. The groups themselves
can also be activated or deactivated individually. When you start a measurement
sequence, the individual groups are processed sequentially, in the order of their definition. The measurements for a single group are started simultaneously, and only when
all channels in the group have completed, the next group is processed.
51User Manual 1176.8839.02 ─ 16

R&S®VSE
Measurements and results
Measurement concept
Figure 5-3: Example for a measurement sequence
Active groups are indicated by a checkmark in front of the group in the "Measurement
Group Setup" tool window.
A group that is currently performing a measurement is indicated by the "running" icon
next to the group's name in the "Measurement Group Setup" tool window.
A measurement sequence is a convenient way to perform multiple measurements on
an input signal in a quick succession, and to obtain results from different applications in
a relatively short measurement time without having to switch between applications
manually. For stable input data, a measurement sequence can provide results in various applications for almost identical input data.
Measurement mode
For each measurement you can define whether a defined number of measurements is
to be performed, or a continuous measurement. This is referred to as the measure-
ment mode. The measurement mode can be defined for an individual measurement
channel, a measurement group, or an entire measurement sequence. However, the
measurement mode for the channels within a group is always the same as for the
entire group, and the mode for the groups is the same as for the sequence. Thus, if
you change the mode for a sequence, the mode for the group and the individual chan-
52User Manual 1176.8839.02 ─ 16

R&S®VSE
Measurements and results
Available applications
nels is automatically adapted accordingly. Nevertheless, you can change the mode for
individual channels for manual measurement control.
Default measurement
The default measurement in the R&S VSE consists of a single measurement channel
(with the I/Q Analyzer application) in a default group and a default measurement
sequence in continuous measurement mode. The measured magnitude values are displayed.
5.2 Available applications
The I/Q Analyzer application is included in the basic R&S VSE software. All other applications, such as Analog Demodulation or Vector Signal Analysis (VSA) are optional
additions and require special licenses.
Optional applications require additional licenses. The application selection in the
"Mode" dialog box depends on which licenses are available. If the predefined number
of available licenses for a particular option are currently occupied by other users, you
cannot open a further instance of the optional application until a license is returned.
Per option, you only require a single license for any number of channels.
For more information, see Chapter 3.4, "Using a license server", on page 28.
3G FDD.........................................................................................................................53
5G NR........................................................................................................................... 54
AM/FM/PM Modulation Analysis................................................................................... 54
GSM..............................................................................................................................54
I/Q Analyzer.................................................................................................................. 54
LTE................................................................................................................................54
NB-IoT...........................................................................................................................54
OFDM Vector Signal Analysis (OFDM VSA).................................................................55
Pulse Measurements.................................................................................................... 55
Transient Analysis.........................................................................................................55
Vector Signal Analysis (VSA)........................................................................................55
WLAN............................................................................................................................55
3G FDD
The 3G FDD BTS and 3G FDD UE applications require the 3GPP FDD Measurements
option, R&S VSE-K72, to be installed, and an additional license. These applications
provide test measurements for W-CDMA uplink and downlink signals (base station signals) according to the test specification.
For details see the R&S VSE-K72 User Manual.
Remote command:
INST:SEL BWCD, see INSTrument[:SELect] on page 552
53User Manual 1176.8839.02 ─ 16

R&S®VSE
Measurements and results
Available applications
5G NR
The 5G NR application requires an instrument equipped with one of the 5G NR Measurements options.
The R&S VSE-K144 application provides 5G NR measurements on the downlink and
uplink.
The R&S VSE-K146 application provides 5G NR MIMO measurements on the downlink.
For details see the R&S VSE-K144 user manuals (one for downlink, and one for uplink.
Remote command:
INST:SEL NR5G, see INSTrument[:SELect] on page 552
AM/FM/PM Modulation Analysis
The AM/FM/PM Modulation Analysis application requires an additional license. This
application provides measurement functions for demodulating AM, FM, or PM signals.
For details see the R&S VSE-K7 User Manual.
Remote command:
INST:SEL ADEM, see INSTrument[:SELect] on page 552
GSM
The GSM application requires the GSM Measurements option R&S VSE-K10, to be
installed, and an additional license. This application provides GSM measurements.
For details see the R&S VSE-K10 User Manual.
Remote command:
INST:SEL GSM, see INSTrument[:SELect] on page 552
I/Q Analyzer
The I/Q Analyzer is the default application and provides measurement and display
functions for I/Q data.
Remote command:
INST:SEL IQ, see INSTrument[:SELect] on page 552
LTE
The LTE application requires the LTE Measurements option R&S VSE-K10x, to be
installed, and an additional license. This application provides LTE measurements.
For details see the R&S VSE-K10x (LTE Downlink and LTE Uplink) user manuals.
Remote command:
INST:SEL LTE, see INSTrument[:SELect] on page 552
NB-IoT
The NB-IoT application requires the NB-IoT Measurements option R&S VSE-K106, to
be installed, and an additional license. This application provides NB-IoT measurements.
For details see the R&S VSE-K106 (NB-IoT Downlink and NB-IoT Uplink) user manual.
Remote command:
INST:SEL NIOT, see INSTrument[:SELect] on page 552
54User Manual 1176.8839.02 ─ 16

R&S®VSE
Measurements and results
Starting an application
OFDM Vector Signal Analysis (OFDM VSA)
The OFDM VSA application requires the OFDM Vector Signal Analysis option,
R&S VSE-K96, to be installed, and an additional license. This application provides
measurements and evaluations for OFDM Vector Signal Analysis.
For details see the R&S VSE-K96 User Manual.
Remote command:
INST:SEL OFDMVSA, see INSTrument[:SELect] on page 552
Pulse Measurements
The Pulse application requires the Pulse Measurements option, R&S VSE-K6, to be
installed, and an additional license. This application provides measurement functions
for pulsed signals.
For details see the R&S VSE-K6 User Manual.
Remote command:
INST:SEL PULSE, see INSTrument[:SELect] on page 552
Transient Analysis
The Transient Analysis application requires the Transient Analysis option R&S VSEK96, to be installed, and an additional license. This application provides measurements
and evaluations for Transient Analysis.
For details see the R&S VSE-K60 Transient Analysis User Manual.
Remote command:
INST:SEL TA, see INSTrument[:SELect] on page 552
Vector Signal Analysis (VSA)
The VSA application requires the Vector Signal Analysis option, R&S VSE-K70, to be
installed, and an additional license. This application provides measurements and evaluations for Vector Signal Analysis.
For details see the R&S VSE-K70 User Manual.
Remote command:
INST:SEL DDEM, see INSTrument[:SELect] on page 552
WLAN
The WLAN application requires one of the WLAN options, R&S VSE-K91, to be installed, and an additional license. This application provides measurements and evaluations according to the WLAN IEEE 802.11 standards.
For details see the R&S VSE-K91 User Manual.
Remote command:
INST:SEL WLAN, see INSTrument[:SELect] on page 552
5.3 Starting an application
The default application in the R&S VSE is the I/Q Analyzer.
55User Manual 1176.8839.02 ─ 16

R&S®VSE
Measurements and results
Starting an application
1. To start a new application, in the "Measurement Group Setup" tool window, select
the "New Channel" button.
2. Select the required application.
For more information on working with applications see Chapter 7, "Controlling instru-
ments and capturing I/Q data", on page 75.
56User Manual 1176.8839.02 ─ 16

R&S®VSE
Operating basics
Graphical user interface elements
6 Operating basics
This chapter provides an overview on how to work with the R&S VSE. It describes
what kind of information is displayed in the diagram area, how to operate the R&S VSE
via the graphical user interface, and how to use the Online Help. The information
described here refers to the basic R&S VSE functionality, and is generally available in
all supported applications. For specifics on the individual applications, see the corresponding user manuals.
● Graphical user interface elements.......................................................................... 57
● Understanding the I/Q analyzer display information............................................... 63
● Customizing the user interface................................................................................65
● Getting help.............................................................................................................72
6.1 Graphical user interface elements
All tasks necessary to operate the connected instrument can be performed using the
R&S VSE graphical user interface.
In addition to the measurement results, the display provides status and setting information, allows you to switch between various measurement tasks, and provides access to
all measurement functions.
Figure 6-1: Graphical user interface elements
57User Manual 1176.8839.02 ─ 16

R&S®VSE
1 = Menu bar with general and measurement-specific menus
2 = Toolbar with general and measurement-specific tools
3 = Tool window for measurement group tool
4 = Tool window for instrument configuration
5 = Tabs for individual measurement channels
6 = Channel bar for active channel settings
7 = Result display for first measurement channel (yellow line)
8 = Result display for second measurement channel (purple line)
9 = Four result displays for third measurement channel (green line)
10 = Status bar with error messages, progress bar and instrument status for active channel
6.1.1 Menus
Most functions in the R&S VSE are available from the menus at the top of the window.
The following menus provide basic functions for all applications:
●
"File"
●
"Edit"
●
"Window"
●
"Help"
Operating basics
Graphical user interface elements
These functions are described in this manual.
Other menus are application-specific and provide different functions depending on
the selected measurement channel, for example:
●
Input
●
Measurement Setup
●
Trace
●
Marker
●
Limits
These menu functions are described in the user manual for the individual application
and in Chapter 10, "I/Q analyzer measurements", on page 173.
6.1.2 Toolbars
Standard functions can be performed via the icons in the toolbars.
The toolbars can be docked anywhere alongside the outer edge of the R&S VSE window; that is:
●
Beneath the menu bar
●
Above the status bar
●
On the left or right edges of the window
For details, see Chapter 6.3, "Customizing the user interface", on page 65.
For information on how to hide or display individual toolbars see Chapter 6.3.5, "Clos-
ing and deactivating windows and bars", on page 72.
58User Manual 1176.8839.02 ─ 16

R&S®VSE
Operating basics
Graphical user interface elements
Note that some icons are only available for specific applications. Those functions are
described in the user manual for the individual application.
6.1.3 Status bar
The software status, instrument status, errors and warnings and any irregularities in
the connected instrument are indicated in the status bar at the bottom of the R&S VSE
window.
Hiding the status bar
You can hide the status bar display, e.g. to enlarge the display area for the measurement results ("File > Preferences > Displayed Items").
See Chapter 9.2.1, "Displayed items", on page 154.
Software status
The status bar indicates the state of the VISA installation on the PC running the
R&S VSE software. The VISA installation is required to connect the R&S VSE to other
instruments.
The following VISA status icons may be displayed:
Table 6-1: VISA status icons
VISA installation is available; network connections to other instruments are possible
VISA installation is available, but a firewall may be prohibiting a connection to other instruments in the network.
Try one of the following to resolve the problem:
●
Check the IP addresses of the instruments configured in the "Instruments" window and
make sure you are allowed to connect to those instruments.
●
Try using HiSLIP protocol instead of VSI-11
●
Ask your local administrator to loosen the firewall restrictions on your PC.
●
Restart the instrument you want to connect to.
VISA installation is not complete or available; network connections to other instruments are not
possible.
See "Installing VISA" on page 24 or contact the Rohde & Schwarz Support Center (see Chap-
ter 14.4, "Collecting information for support", on page 948).
If you place the mouse over the icon, a descriptive message is displayed informing you
what to do.
Instrument status
The displayed instrument status information depends on the type of instrument that is
connected to the R&S VSE. For the supported Rohde & Schwarz Signal and Spectrum
Analyzers, the following types of information may be displayed, if applicable.
59User Manual 1176.8839.02 ─ 16

R&S®VSE
Operating basics
Graphical user interface elements
The instrument is configured for operation with an external reference.
The R&S VSE software is resampling the input from the connected instrument to
obtain the required sample rate.
Progress
The progress of the current software operation is displayed in the status bar.
Error messages
If errors or irregularities are detected, a keyword and an error message, if available,
are displayed in the status bar. For details, see the user manual for the individual application.
6.1.4 Windows
The R&S VSE distinguishes between three types of windows, depending on their use:
●
Tool windows: provide functionality for specific global tasks, such as configuring
instruments or measurement groups; see Chapter 7, "Controlling instruments and
capturing I/Q data", on page 75
●
Channel bar: provides information on measurement channel settings (one window
per active channel)
●
Result displays: provide the measurement results
The layout of the individual windows is customizable and highly flexible, see Chap-
ter 6.3, "Customizing the user interface", on page 65.
● Channel bar.............................................................................................................60
● Result displays / measurement windows................................................................ 61
6.1.4.1 Channel bar
For each channel, a separate window with measurement information is displayed.
When you select a result display window for a different channel, the channel bar for
that channel is also activated. Each channel bar is provided with a colored line in the
window title bar which is the same color as the corresponding channel result displays.
Figure 6-2: Example for channel bar (I/Q Analyzer)
60User Manual 1176.8839.02 ─ 16

R&S®VSE
Operating basics
Graphical user interface elements
In the default configuration, the channel bars for multiple channels are displayed in
separate tabs in the same window. Depending on which result display is currently
active, the corresponding channel information tab is displayed. However, you can separate the tabs into individual windows. See Chapter 6.3, "Customizing the user inter-
face", on page 65.
Channel-specific settings
The channel bar provides information on channel-specific settings for the measurement. A bullet next to the setting indicates that user-defined settings are used, not
automatic settings. A green bullet indicates this setting is valid and the measurement is
correct. A red bullet indicates an invalid setting that does not provide useful results.
Channel information varies depending on the active application. For details, see the
individual user manuals.
Instrument settings
In addition to the channel-specific settings, the channel bar also displays information
on general instrument settings. These settings affect the measurement results even
though it is not immediately apparent from the display of the measured values. This
information is displayed in gray font and only when applicable for the current measurement, as opposed to the channel-specific settings that are always displayed.
The instrument settings depend on the type of instrument that is connected to the
R&S VSE. For the supported Rohde & Schwarz Signal and Spectrum Analyzers, the
following types of information may be displayed, if applicable.
Table 6-2: Instrument settings displayed in the channel bar
PA The preamplifier is activated
75 Ω The input impedance of the instrument is set to 75 Ω
DC/AC An external DC or AC calibration signal is in use.
6.1.4.2 Result displays / measurement windows
Measurement results can be evaluated in many different ways, for example graphically,
as summary tables, statistical evaluations, etc. Optional applications add their own
specific measurements and result displays. Thus, the result display is highly configurable to suit your specific requirements and optimize analysis.
For each measurement, a separate measurement channel is activated. Each measurement channel can provide multiple result displays. All windows that belong to the same
measurement (including the channel bar) are indicated by a colored line at the top of
the window title bar.
61User Manual 1176.8839.02 ─ 16

R&S®VSE
Operating basics
Graphical user interface elements
Figure 6-3: Color-coded windows
Window title bar
The contents of the individual result displays are described in detail in the user manual
for the individual application.
The following common functions are available in all window title bars:
Table 6-3: Common functions and icons in the window title bar
Change result type Displays a list of possible result types for the active channels to replace
the current display.
Invalid data Indicates that invalid or inconsistent data is displayed, that is: the trace no
longer matches the displayed measurement settings. This may be the
case, for example, when you change the measurement bandwidth, but the
displayed trace is still based on the old bandwidth. As soon as a new measurement is performed or the display is updated, the icon disappears.
(This icon is sometimes also referred to as a "dirty flag".)
62User Manual 1176.8839.02 ─ 16

R&S®VSE
Operating basics
Understanding the I/Q analyzer display information
Dock / Undock window
/
Delete window Closes the selected window
Docks the window to the main R&S VSE window or separates it from the
main window.
See "Docked and undocked windows" on page 65
6.2 Understanding the I/Q analyzer display information
The following figure shows a measurement diagram during I/Q Analyzer operation. All
different information areas are labeled. They are explained in more detail in the following sections.
Figure 6-4: Screen elements in the I/Q Analyzer application
1 = Color coding for windows of same channel
2 = Channel bar with measurement settings
3 = Window title bar with diagram-specific (trace) information
4 = Diagram area with marker information
5 = Diagram footer with diagram-specific information, depending on result display
Channel bar
The channel bar shows the most important settings for the corresponding application.
63User Manual 1176.8839.02 ─ 16

R&S®VSE
Operating basics
Understanding the I/Q analyzer display information
Select a setting in the channel bar to open the corresponding configuration dialog box
and change the setting quickly and easily.
Right-click a setting to display a context menu for it.
For the I/Q Analyzer application, the channel bar shows the following settings:
Table 6-4: Information displayed in the channel bar for the I/Q Analyzer application
Ref Level Reference level
(m.+el.)Att (Mechanical and electronic) RF attenuation
Ref Offset Reference level offset
Freq Center frequency
Meas Time Measurement time
Rec Length Defined record length (number of samples to capture)
SRate Defined sample rate for data acquisition
RBW (Spectrum evaluation only) Resolution bandwidth calculated from the
sample rate and record length
Table 6-5: Icons in the channel bar
Icon Meaning
Indicates that the channel is currently performing a measurement.
Indicates that an error occurred in the measurement channel. Check the
R&S VSE status bar.
Window title bar information
For each diagram, the header provides the following information:
Figure 6-5: Window title bar information in the I/Q Analyzer application
0 = Color coding for windows of same channel
1 = Edit result display function
2 = Invalid data flag
3 = Channel name
4 = Window number
5 = Window type
6 = Trace color, trace number, detector type, trade mode
7 = Dock/undock window function
8 = Close window function
64User Manual 1176.8839.02 ─ 16

R&S®VSE
Diagram footer information
The diagram footer (beneath the diagram) displays scaling information and depends on
the evaluation:
Magnitude and Spectrum diagrams:
●
Center frequency
●
Number of measurement points
●
Range per division (x-axis)
●
Span (Spectrum)
I/Q Vector diagram:
●
Maximum value on y-axis
6.3 Customizing the user interface
The layout of the individual windows in the R&S VSE software is customizable and
highly flexible. Apart from a few fixed interface elements (menu bar, status bar), the
windows can be positioned almost anywhere on the screen.
Operating basics
Customizing the user interface
● Windows concept....................................................................................................65
● Multiview mode....................................................................................................... 69
● Displaying new windows......................................................................................... 70
● Rearranging windows..............................................................................................71
● Closing and deactivating windows and bars........................................................... 72
6.3.1 Windows concept
Docked and undocked windows
In the default layout, all windows are positioned within the main R&S VSE window.
When you change the size of the R&S VSE window, or add new subwindows, the subwindows are adapted or rearranged as necessary. The subwindows are docked to the
main window.
65User Manual 1176.8839.02 ─ 16

R&S®VSE
Operating basics
Customizing the user interface
Figure 6-6: Example for docked windows in the R&S VSE window
Optionally, each subwindow can be undocked, that is, detached from the main
R&S VSE window. Undocked windows can be placed anywhere on the screen, even
outside of the main R&S VSE window. This is useful, for example, if a second monitor
is available and you want to take advantage of the additional display area. However,
undocked windows "float" on the screen, covering any other displays behind them.
They are not adapted or rearranged when you change the size of the R&S VSE window or add new subwindows.
Figure 6-7: Example for undocked window in the R&S
VSE window
Docking areas for interface elements
The windows and other interface elements can be docked within predefined areas in
the R&S VSE window. (For details on the window types see Chapter 6.1.4, "Windows",
on page 60.)
●
The menu bar and status bar are fixed elements and are always located at the
top and bottom edge of the window, respectively. No windows can be docked
above the menu bar or below the status bar.
●
Toolbars can only be placed along the outer edges of the R&S VSE window, below
the menu bar and above the status bar.
66User Manual 1176.8839.02 ─ 16

R&S®VSE
Operating basics
Customizing the user interface
●
Tool windows can only be placed along the outer edges of the R&S VSE window,
below the menu bar and above the status bar, and not outside of any toolbars.
●
Channel bars can be placed above or below the result displays, at the top or bottom edges of the R&S VSE window, but not outside of any tool windows or toolbars.
●
Result displays are surrounded by all other window types and bars. They must be
placed within a grid structure of columns and rows. The number of result displays
in each column or row is restricted only by the available display space and the minimum window size of the individual windows.
Table 6-6: Docking areas in the R&S VSE window
Docking positions
Possible docking positions for the currently selected element are indicated by an empty
gray space in the R&S VSE window.
Window tabs
As mentioned above, each window type requires a minimum amount of space for display. If not enough display space for all active windows is available, windows of the
same type are automatically arranged in tabs within one window. To switch between
displayed windows, simply select the corresponding tab.
For example, when a new channel is started or a new display is added, the existing
windows may be combined into one window using tabs. The new windows are displayed in maximum size.
67User Manual 1176.8839.02 ─ 16

R&S®VSE
Operating basics
Customizing the user interface
To save space on the screen and when not all windows are relevant at the same time,
you can also arrange windows in tabs manually. Tabs are created when you dock a
window on top of an existing window of the same type. The docking position is indicated by showing the existing window with a tab, instead of providing an empty gray
space for a new window.
Table 6-7: Docking windows as tabs
Possible docking position: tab in existing window Result: new tab in existing window
Window size
Each window type requires a minimum amount of display space. The maximum size is
restricted only by the available display space within the R&S VSE window (for docked
windows) or on the entire screen (for undocked windows).
The result displays are placed within a grid structure (see "Docking areas for interface
elements" on page 66). Thus, the minimum width of a window may also be restricted
by other result displays in the same column. The minimum height may be restricted by
other result displays in the same row.
Active windows, selected window
When a measurement is performed in a channel, results are determined for all configured result displays. Thus, to analyze result data and possibly store it to a file, you
must activate windows for the corresponding result displays. A list of all active windows
for all configured measurement channels is available from the "Window" menu.
As soon as you select a window, for example by clicking the mouse in it, any windowspecific operations you perform subsequently are applied to that window. For example,
you can set a marker or zoom in into the display of the window. Furthermore, when you
select a window, you also select the channel the selected window belongs to. The
channel bar (see Chapter 6.1.4.1, "Channel bar", on page 60) for the selected channel
is activated, and any channel-specific operations are applied to the selected channel.
Closing vs deactivating windows
If a large number of channels or result displays are active, the display may become
very crowded and confusing. Thus, if you do not require the online visualization of the
results, you can temporarily deactivate windows in the display. Deactivating a window
68User Manual 1176.8839.02 ─ 16

R&S®VSE
Operating basics
Customizing the user interface
simply hides the display, without losing its settings or contents. A deactivated window
can easily be restored to the display without having to reconfigure it.
Closing a window permanently deletes the result display and its contents. A new window with the same evaluation method and default settings can be added again, but the
previous settings and contents are lost.
6.3.2 Multiview mode
By default, all windows for all active measurement channels are displayed at the same
time on the screen. This is referred to as the MultiView mode, as multiple channels are
displayed.
Figure 6-8: MultiView display of several measurement channels
You can disable this mode in order to display only the windows for a single measurement channel at a time. In this case, the windows for each channel are displayed in
individual tabs. Only the windows for the currently selected channel are visible. To
switch between channels, simply select the corresponding tab. This is particularly useful if the screen gets too confusing.
69User Manual 1176.8839.02 ─ 16

R&S®VSE
Operating basics
Customizing the user interface
Figure 6-9: MultiView disabled - display of a single measurement channel only
To toggle between the two views
► Select the "Multiview mode" icon in the main toolbar.
To change the default behavior
► Select "File" > "Preferences" > "Displayed Items" > "Multiview mode". "On""/"" Off".
6.3.3 Displaying new windows
For the I/Q Analyzer, up to six windows can be displayed for a single channel.
To add a new window
1. Select the global information window or any other measurement window of the
measurement channel you want to add a window for.
2.
Select the "Add Window" icon or
From the "Window" menu, select "New Window".
3. Select the result display you want to add a window for.
The available result display types depend on the selected application.
For other applications, see the application-specific documentation.
A new window for the result display is opened.
If not enough display space for all active windows is available, the existing windows are combined into one window using tabs, while the new window is displayed
in maximum size.
70User Manual 1176.8839.02 ─ 16

R&S®VSE
Operating basics
Customizing the user interface
To replace the contents of a measurement window
1. In the window whose contents you want to replace, in the window title bar, select
the "Replace" icon.
2. Select the result display.
The window displays the newly selected result display for the selected measurement channel.
Remote commands:
LAYout:GLOBal:ADD[:WINDow]? on page 596
LAYout:GLOBal:REPLace[:WINDow] on page 601
6.3.4 Rearranging windows
To dock or undock a window
►
Select the "Dock" / "Undock" icon in the window title bar.
If the window was docked, it is detached and can be moved and resized independ-
ently of the R&S VSE window.
If the window was undocked, it is docked to its default position in the R&S VSE
window.
(For details see "Docked and undocked windows" on page 65.)
To change the position of a window or bar
► Select the bar or window title bar and drag it to a new position on the screen. Pos-
sible docking positions for the currently selected element are indicated by an empty
gray space in the R&S VSE window or by showing the underlying window with a
tab.
When you drop the window or bar, it is docked to the selected position.
If you drop the window on top of an existing window of the same type, the moved
window is added as a tab.
To switch between displayed windows, simply select the corresponding tab.
To resize a window
► To resize a window, select the window frame and drag it to the required size. Note
the restrictions concerning the minimum window size described in "Window size"
on page 68.
To restore the default configuration for the measurement channel, use the Preset >
Selected Channel function in the "File" menu.
71User Manual 1176.8839.02 ─ 16

R&S®VSE
Operating basics
Getting help
6.3.5 Closing and deactivating windows and bars
Closing a window permanently deletes the result display and its contents, while deactivating a window simply hides the display, without losing its settings or contents. Tool
windows and channel bars cannot be closed permanently.
(For details see "Closing vs deactivating windows" on page 68).
To hide or display a toolbar
1. Right-click any toolbar or the menu bar.
A context menu with a list of all available toolbars is displayed.
2. Select the toolbar you want to hide or display.
A checkmark indicates that the toolbar is currently displayed.
The toolbar is toggled on or off.
To deactivate or reactivate a tool window or channel bar
► From the "Window" menu, select the tool window or channel bar.
The window is toggled on or off.
To deactivate or reactivate a result display
1. From the "Window" menu, select "Active Windows".
Alternatively, right-click the window title bar of a result display that belongs to the
same channel.
2. Select the result display you want to deactivate or reactivate.
A checkmark indicates that the window is currently active.
The window is toggled on or off.
To close a result display
►
Select the "Delete" icon in the window title bar.
The result display is permanently removed.
Remote command:
LAYout:GLOBal:REMove[:WINDow] on page 601
6.4 Getting help
If any questions or problems concerning the R&S VSE arise, an extensive online help
system is provided in the software and can be consulted at any time. The help system
is context-sensitive and provides information specifically for the current operation or
72User Manual 1176.8839.02 ─ 16

R&S®VSE
Operating basics
Getting help
setting to be performed. In addition, general topics provide an overview on complete
tasks or function groups as well as background information.
6.4.1 Calling up help
The online help can be opened at any time by selecting one of the "Help" icons on the
toolbar or by selecting the F1 key.
Calling context-sensitive help
► To display the "Help" dialog box for the currently focused screen element, e.g. a
softkey or a setting in an opened dialog box, select the "Help" icon on the toolbar.
The "Help" dialog box "View" tab is displayed. A topic containing information about
the focused screen element is displayed.
If no context-specific help topic is available, a more general topic or the "Contents"
tab is displayed.
For standard Windows dialog boxes (e.g. Print dialog, Device Search, VISA Resource
String Builder etc.), no context-sensitive help is available.
► To display a help topic for a screen element not currently focused:
a) Select the "Help pointer" icon on the toolbar.
The pointer changes its shape to a "?" and an arrow.
b) Select the screen element to change the focus.
A topic containing information about the selected (now focused) screen element is
displayed.
6.4.2 Using the help window
The Help window contains several tabs:
●
"View" - shows the selected help topic
●
"Contents" - contains a table of help contents
●
"Index" - contains index entries to search for help topics
●
"Search" - provides text search
The Help toolbar provides some buttons:
●
To browse the topics in the order of the table of contents: Up arrow = previous
topic, Down arrow = next topic
73User Manual 1176.8839.02 ─ 16

R&S®VSE
Operating basics
Getting help
●
To browse the topics visited before: Left arrow = back, Right arrow = forward
●
To increase or decrease the font
To search for a topic in the index
The index is sorted alphabetically. You can browse the list, or search for entries in the
list.
1. Switch to the "Index" tab.
2. Select the "Keyboard" icon besides the entry field.
3. Enter the first characters of the keyword you are interested in.
The entries containing these characters are displayed.
4. Double-click the suitable index entry.
The "View" tab with the corresponding help topic is displayed.
To search topics for a text string
1. Switch to the "Search" tab.
2. Select the "Keyboard" icon besides the entry field.
3. Enter the string you want to find.
If you enter several strings with blanks between, topics containing all words are
found (same as AND operator).
For advanced search, consider the following:
● To find a defined string of several words, enclose it in quotation marks. For
example, a search for "trigger qualification" finds all topics with exactly "trigger
qualification". A search for trigger qualification finds all topics that contain the
words trigger and qualification.
● Use "Match whole word" and "Match case" to refine the search.
● Use operators AND, OR, and NOT.
To close the Help window
► Select the "Close" icon in the upper right corner of the help window.
Or: Press the [ESC] key.
74User Manual 1176.8839.02 ─ 16

R&S®VSE
Controlling instruments and capturing I/Q data
Input sources
7 Controlling instruments and capturing I/Q
data
A key feature of the R&S VSE is the ability to capture data from various instruments or
retrieve data from stored measurement files, and to analyze this data in various applications.
R&S VSE Enterprise Edition vs Basic Edition
The R&S VSE Enterprise Edition and Basic Edition differ in the number of channels,
groups, and instruments that can be configured at the same time.
Within Cadence®AWR®VSS, the R&S VSE can only process input from encrypted
waveform files, not from a device. Otherwise, Cadence®AWR®VSS provides the same
functionality as the R&S VSE Basic Edition with all supported applications. For details,
see Chapter 3.5, "Using R&S VSE with Cadence®AWR®VSS", on page 30.
Supported number of Enterprise Edition Basic Edition
Instruments 128 1
Groups 30 1
Channels 30 3
● Input sources...........................................................................................................75
● Configuring instruments.......................................................................................... 77
● Controlling measurement channels, groups, and sequences................................. 95
● Configuring measurements in expert mode.......................................................... 106
● Frequency response correction (R&S VSE-K544)................................................107
● Output settings...................................................................................................... 118
● Receiving and providing trigger signals.................................................................119
7.1 Input sources
The input source selects the source of the data to be analyzed. You can either analyze
a live signal or a signal that has been recorded previously and whose characteristics
have been saved to a file.
7.1.1 Connected instrument
Any instruments that are to provide signals to the R&S VSE must be configured in the
software. The R&S VSE then manages all connections to the other instruments. If the
instrument configured for a particular measurement channel is changed, the R&S VSE
software adapts the measurement settings, if necessary and possible. Thus, the mea-
75User Manual 1176.8839.02 ─ 16

R&S®VSE
Controlling instruments and capturing I/Q data
Input sources
surement and analysis tasks performed using the R&S VSE software are mostly independent of the underlying instrument.
Currently, the following instruments can be connected to the R&S VSE software to provide signal input:
●
R&S®FSW Signal and Spectrum Analyzers
●
R&S®FSWP Phase Noise Analyzer and VCO Tester
●
R&S®FPS Signal and Spectrum Analyzers
●
R&S®FPL1000 Signal and Spectrum Analyzers
●
R&S®FSV Signal and Spectrum Analyzers
●
R&S®FSV3000/FSVA3000 Signal and Spectrum Analyzers (also via external frontend)
●
R&S®FSL Signal and Spectrum Analyzers
●
R&S®ZNL Network Analyzers (with R&S®ZNL3‑B1 Spectrum Analyzer Mode
option)
●
R&S®RTx oscilloscope product family
●
R&S®CMA Radio Test Sets
The instrument connected to and controlled by the R&S VSE software is referred to as
the connected instrument throughout this documentation.
Input sources
Depending on the type of instrument and the connectors it provides, the R&S VSE software supports the following source of input:
●
RF
Captures and analyzes the data from the RF input of the connected instrument.
●
External frontend
If the External Frontend Control option (R&S FSV3-K553) is installed on the
R&S FSV3000/FSVA3000, you can control measurements with the connected
instrument using a connected external frontend.
●
oscilloscope baseband input
Captures and analyzes complex oscilloscope baseband input from multiple channels of a connected R&S® oscilloscope. You must specify which channels are used
for input. oscilloscope baseband input requires firmware version 3.0.1.1 or later on
the oscilloscope. Not all applications in the R&S VSE software support oscilloscope
baseband input.
For details see Chapter 10.2.5, "oscilloscope baseband input", on page 191.
76User Manual 1176.8839.02 ─ 16

R&S®VSE
Controlling instruments and capturing I/Q data
Configuring instruments
R&S FSW and B2000
The R&S VSE software supports input from a connected R&S FSW with a B2000
option installed. However, the R&S FSW interface to the oscilloscope must be set up
and aligned directly on the instrument before the R&S VSE software can start analyzing the input.
Once the B2000 option has been aligned and activated, the R&S VSE applications can
process I/Q data with a bandwidth of up to 2 GHz, with a center frequency starting at
8 GHz, up to the maximum frequency supported by the instrument model (the useful
range may be restricted, see data sheet). The record length may be restricted by the
connected oscilloscope (see its data sheet).
For details on R&S FSW and B2000 see the R&S FSW I/Q Analyzer and I/Q Input
Interfaces user manual.
Oscilloscope input
Input from an R&S oscilloscope with a firmware version 3.0.1.1 or higher can be provided as the original waveform data, or as converted I/Q data. Depending on the measurement requirements and the application, either format may be more suitable.
For details see "Capture Mode" on page 205.
7.1.2 File input
Alternatively to "live" data input from a connected instrument, the R&S VSE software
can also analyze measurement data provided "offline" by a stored data file. This allows
you to perform a measurement on any instrument and store the results to a file. Then
you can analyze the stored data partially or as a whole at any time using the R&S VSE
software.
Currently, the R&S VSE software supports the following file formats as signal input:
●
.iq.tar (compressed data format)
.csv
●
●
.mat (matlab)
.iqw
●
.iqx
●
.aid
●
.wv
●
For more information, see also Chapter 8.3.4, "Recalling measurement data from files",
on page 139.
7.2 Configuring instruments
Access: "Window" > "Instruments"
77User Manual 1176.8839.02 ─ 16

R&S®VSE
Controlling instruments and capturing I/Q data
Configuring instruments
The R&S VSE can capture and analyze data from various instruments. These instruments must be configured before measurements can be performed on them via the
R&S VSE. Instruments are configured in the R&S VSE's "Instruments" tool window.
Note: In the R&S VSE Basic Edition, you can configure only one instrument at a time.
● Remote control interfaces and protocols.................................................................78
● Defining the connection information manually........................................................ 80
● Connecting to the host instrument (localhost).........................................................82
● Determining the address with software support......................................................83
● Searching for connected instruments automatically................................................85
● Obtaining information on versions and options on the connected instrument........ 87
● Deleting all instrument configurations..................................................................... 88
● Initializing a self-alignment on the connected instrument....................................... 88
● Configuring the behavior during remote control......................................................89
● Configuring the use of a power sensor................................................................... 90
● Configuring a frequency reference for the connected instrument........................... 93
7.2.1 Remote control interfaces and protocols
The software supports different interfaces and protocols for remote control. The following table gives an overview.
For a description of the protocols refer to Remote control via SCPI.
Table 7-1: Remote control interfaces and protocols
Interface
Local Area
Network
(LAN)
*
) VISA is a standardized software interface library providing input and output functions to communicate with instruments. A VISA
installation on the controller is a prerequisite for remote control using the indicated interfaces.
Protocols, VISA*) address string
●
HiSLIP High-Speed LAN Instrument Protocol (IVI-6.1)
TCPIP::host address::hislip0[::INSTR]
●
VXI-11
TCPIP::host address::inst0[::INSTR]
Library: VISA
●
socket communication (Raw Ethernet, simple Telnet)
TCPIP::host address[::LAN device name]::<port>::
SOCKET
Library: VISA or socket controller
Remarks
A LAN connector is located on the
rear panel of the instrument.
7.2.1.1 LAN interface
To be integrated in a LAN, the instrument is equipped with a LAN interface, consisting
of a connector, a network interface card and protocols. The network card can be operated with the following interfaces:
●
10 Mbit/s Ethernet IEEE 802.3
●
100 Mbit/s Ethernet IEEE 802.3u
●
1Gbit/s Ethernet IEEE 802.3ab
78User Manual 1176.8839.02 ─ 16

R&S®VSE
Controlling instruments and capturing I/Q data
Configuring instruments
For remote control via a network, the PC and the instrument must be connected via the
LAN interface to a common network with TCP/IP network protocol. They are connected
using a commercial RJ45 cable (shielded or unshielded twisted pair category 5). The
TCP/IP network protocol and the associated network services are preconfigured on the
instrument. Software for instrument control and the VISA program library must be
installed on the controller.
IP address
Only the IP address or a valid DNS host name is required to set up the connection.
The host address is part of the "VISA resource string" used by the programs to identify
and control the instrument.
The VISA resource string has the form:
TCPIP::host address[::LAN device name][::INSTR]
or
TCPIP::host address::port::SOCKET
where:
●
TCPIP designates the network protocol used
●
host address is the IP address or host name of the device
●
LAN device name defines the protocol and the instance number of a subinstrument;
– inst0 selects the VXI-11 protocol (default)
– hislip0 selects the newer HiSLIP protocol
●
INSTR indicates the instrument resource class (optional)
●
port determines the used port number
●
SOCKET indicates the raw network socket resource class
Example:
●
Instrument has the IP address 192.1.2.3; the valid resource string using VXI-11
protocol is:
TCPIP::192.1.2.3::INSTR
●
The DNS host name is VSE-123456; the valid resource string using HiSLIP is:
TCPIP::VSE-123456::hislip0
●
A raw socket connection can be established using:
TCPIP::192.1.2.3::5025::SOCKET
Identifying instruments in a network
If several instruments are connected to the network, each instrument has its own IP
address and associated resource string. The controller identifies these instruments by
the resource string.
For details on configuring the LAN connection, see Chapter 12.5, "How to set up a net-
work and remote control", on page 502.
79User Manual 1176.8839.02 ─ 16

R&S®VSE
Controlling instruments and capturing I/Q data
Configuring instruments
7.2.2 Defining the connection information manually
Access: "Window" > "Instruments"
If you already know the network connection information of the instrument you want to
control using the R&S VSE software, you can enter it directly in the "Instruments" tool
window.
New Instrument.............................................................................................................80
Search...........................................................................................................................81
Close Instrument...........................................................................................................81
Interface Type............................................................................................................... 81
IP address.....................................................................................................................81
Resource String............................................................................................................ 81
Advanced Settings........................................................................................................ 82
Calibration State/ Self Alignment.................................................................................. 82
Connection State...........................................................................................................82
Infos & Settings.............................................................................................................82
Connect / Disconnect / Reconnect................................................................................82
New Instrument
Displays the configuration dialog for a new instrument. You can also configure instruments that are not connected to the PC running the R&S VSE software.
Note: In the R&S VSE Basic Edition, you can configure only one instrument at a time.
To configure a new instrument quickly while the "Instruments" tool window is closed,
select the "File > Instruments > New window" menu item. The "Instruments" tool window is displayed with an entry for a new instrument.
Remote command:
DEVice:CREate on page 514
80User Manual 1176.8839.02 ─ 16

R&S®VSE
Controlling instruments and capturing I/Q data
Configuring instruments
Search
Starts a search for all instruments connected to the same network as the PC running
the R&S VSE software.
(See Chapter 7.2.5, "Searching for connected instruments automatically",
on page 85).
Close Instrument
You can delete an instrument that is no longer available or required by the R&S VSE
software. Select the
tool window.
Remote command:
DEVice:DELete on page 515
Interface Type
Specifies the interface protocol used to connect the instrument to the network.
For details on interfaces see Chapter 7.2.1, "Remote control interfaces and protocols",
on page 78
"VXI-11"
"HiSlip"
Remote command:
DEVice:TARGet:TYPE on page 517
"Close" icon next to the instrument name in the "Instruments"
Standard TCP/IP-based protocol
High performance protocol
IP address
Unique IP address of the connected instrument. The five most recently selected IP
addresses are available from the dropdown list.
(To delete this list, select "File > Preset > Reset VSE Layout", see "Restoring User-
Specific Settings (Reset VSE Layout)" on page 124.)
The IP address consists of four number groups separated by dots. Each group contains 3 numbers in maximum (e.g. 100.100.100.100), but also one or two numbers are
allowed in a group (as an example see the pre-installed address).
For information on how to determine the IP address see the instrument's documentation.
Remote command:
DEVice:TARGet on page 517
Resource String
VISA resource string used by the R&S VSE to identify and control the connected
instrument. The five most recently selected resource strings are available from the
dropdown list.
(To delete this list, select "File > Preset > Reset VSE layout", see "Restoring User-Spe-
cific Settings (Reset VSE Layout)" on page 124.)
For details, see Chapter 7.2.1.1, "LAN interface", on page 78.
Remote command:
DEVice:CREate on page 514
81User Manual 1176.8839.02 ─ 16

R&S®VSE
Controlling instruments and capturing I/Q data
Configuring instruments
Advanced Settings
Opens the "VISA Resource String Builder" which supports you in determining the
required resource string, see Chapter 7.2.4, "Determining the address with software
support", on page 83.
Calibration State/ Self Alignment
Indicates whether the connected instrument is calibrated. If necessary, a self-alignment
can be initiated on the connected instrument (see Chapter 7.2.8, "Initializing a self-
alignment on the connected instrument", on page 88).
Connection State
Indicates the current state of the connection to the specified instrument in the network.
Remote command:
DEVice:STATe? on page 516
Infos & Settings
Displays additional information on the connected instrument, if available. See Chap-
ter 7.2.6, "Obtaining information on versions and options on the connected instrument",
on page 87.
Remote command:
DEVice:INFO:HWINfo? on page 518
DEVice:INFO:OPT? on page 519
DEVice:INFO:IDN? on page 519
Connect / Disconnect / Reconnect
(Re-)Establishes a connection to the specified instrument in the network, or disconnects an existing connection.
Remote command:
DEVice:CREate on page 514
DEVice:DISConnect on page 515
DEVice:REConnect on page 516
7.2.3 Connecting to the host instrument (localhost)
Access: "Window" > "Instruments" > "This Instrument"
If the R&S VSE software is installed directly on a supported instrument, you can connect the software to that instrument quickly and easily.
82User Manual 1176.8839.02 ─ 16

R&S®VSE
Controlling instruments and capturing I/Q data
Configuring instruments
► In the "Instruments" tool window, select "This Instrument".
The software automatically establishes a connection to the instrument. The instrument
is displayed in the "Instruments" tool window. You can configure a measurement on
that instrument from the R&S VSE software immediately.
7.2.4 Determining the address with software support
Access: "Window" > "Instruments" > Advanced > "VISA Resource String Builder"
If you do not know the network address of the connected instrument, the R&S VSE
software can help you determine the correct connection information using the "VISA
Resource String Builder".
Alias.............................................................................................................................. 84
Timeout......................................................................................................................... 84
Interface Type............................................................................................................... 84
Address (format)........................................................................................................... 84
IP address.....................................................................................................................84
Host name.....................................................................................................................84
Board Number...............................................................................................................84
LAN device name..........................................................................................................85
83User Manual 1176.8839.02 ─ 16

R&S®VSE
Controlling instruments and capturing I/Q data
Configuring instruments
VISA Resource String................................................................................................... 85
Status............................................................................................................................85
Check............................................................................................................................85
Alias
A logical name used to identify the instrument more easily in the network and connection settings in the R&S VSE software.
Timeout
Time in which the network connection to the instrument must be established before the
attempt is aborted.
Interface Type
Specifies the interface protocol used to connect the instrument to the network.
For details on interfaces see Chapter 7.2.1, "Remote control interfaces and protocols",
on page 78
"VXI-11"
"HiSlip"
Remote command:
DEVice:TARGet:TYPE on page 517
Standard TCP/IP-based protocol
High performance protocol
Address (format)
Defines the format used to specify the instrument's network address
"IPv6"
"IPv4"
"Host name"
IP address
Unique IP address of the connected instrument. The five most recently selected IP
addresses are available from the dropdown list.
(To delete this list, select "File > Preset > Reset VSE Layout", see "Restoring User-
Specific Settings (Reset VSE Layout)" on page 124.)
The IP address consists of four number groups separated by dots. Each group contains 3 numbers in maximum (e.g. 100.100.100.100), but also one or two numbers are
allowed in a group (as an example see the pre-installed address).
For information on how to determine the IP address see the instrument's documentation.
Remote command:
DEVice:TARGet on page 517
Host name
Unique host computer name of the connected instrument (if Address (format) is "Host
name".
Internet protocol version 6
Internet protocol version 4
Computer name of the instrument instead of IP address
Board Number
Unique board number of the connected instrument.
84User Manual 1176.8839.02 ─ 16

R&S®VSE
Controlling instruments and capturing I/Q data
Configuring instruments
LAN device name
Defines the protocol and the instance number of a sub-instrument;
"inst0"
"hislip0"
VISA Resource String
The VISA resource string determined from the defined information, to be used by the
R&S VSE to identify and control the connected instrument.
For details, see Chapter 7.2.1.1, "LAN interface", on page 78.
Status
Indicates the current state of the connection to the specified instrument in the network
after a Check was performed.
Check
Checks the connection state to the instrument specified by the VISA resource string.
The result is indicated under Status.
VXI-11 protocol
HiSLIP protocol
7.2.5 Searching for connected instruments automatically
Access: "Window" > "Instruments" > "Search"
Alternatively to defining the connection information manually, the R&S VSE can search
for all instruments connected to the same network as the PC running the R&S VSE
software. You can then select the instrument you want to control with the R&S VSE
software from the detected instruments.
85User Manual 1176.8839.02 ─ 16

R&S®VSE
Controlling instruments and capturing I/Q data
Configuring instruments
Search...........................................................................................................................86
Stop...............................................................................................................................86
Interface Type............................................................................................................... 86
Results.......................................................................................................................... 87
Filter.............................................................................................................................. 87
Connect LXI.................................................................................................................. 87
Search
Starts a network search for connected instruments using the specified Interface Type.
Note that this search can take a while. Results are only displayed when the search is
completed.
Stop
Stops a search for connected instruments.
Interface Type
Specifies the interface protocol used to connect the instrument to the network.
For details on interfaces see Chapter 7.2.1, "Remote control interfaces and protocols",
on page 78
"VXI-11"
"HiSlip"
Remote command:
DEVice:TARGet:TYPE on page 517
Standard TCP/IP-based protocol
High performance protocol
86User Manual 1176.8839.02 ─ 16

R&S®VSE
Controlling instruments and capturing I/Q data
Configuring instruments
Results
For each instrument detected in the network, the following information is provided:
●
Interface Type
●
Instrument model name
●
VISA Resource String
(The full information is displayed when you select the arrow button for a result
entry.)
Filter
Applies a filter to the instrument search. Only instruments whose resource string contains the specified characters are displayed.
Connect LXI
Opens the LXI configuration home page for the connected instrument. This allows you
to configure or operate the instrument directly from a Web browser. For details see the
instrument's user documentation.
7.2.6 Obtaining information on versions and options on the connected instrument
Access: "Window" > "Instruments" > "Info & Settings" > "Info" tab
Information on the firmware version and options installed on the connected instrument
is provided.
Identification String........................................................................................................87
Options..........................................................................................................................88
Identification String
Indicates the instrument identification for the selected instrument.
The syntax is:
87User Manual 1176.8839.02 ─ 16

R&S®VSE
Controlling instruments and capturing I/Q data
Configuring instruments
"Rohde&Schwarz,<instrument type>,<part number>/serial
number>,<firmware version>"
Remote command:
DEVice:INFO:IDN? on page 519
Options
Provides a list of all hardware and software options installed on the instrument.
For details on options, refer to the instrument's documentation.
Remote command:
DEVice:INFO:HWINfo? on page 518
DEVice:INFO:OPT? on page 519
7.2.7 Deleting all instrument configurations
Access: "File" > "Instruments" > "Delete All"
You can delete the connection settings of all defined instruments in one step. Note that
after deleting a connection, the instrument is no longer known to the R&S VSE software.
Instrument configurations are also deleted when you use the preset function "File" >
"Preset" > "All & Delete Instruments", see "Restoring All Default Settings and Deleting
Instrument Configurations (Preset All & Delete Instruments)" on page 123.
Remote command:
DEVice:DELete:ALL on page 515
7.2.8 Initializing a self-alignment on the connected instrument
Access: "Window" > "Instruments" > "Self Alignment"
Once configured, you can perform a self-alignment on any instrument connected to the
R&S VSE software.
When you put the instrument into operation for the first time or when strong temperature changes occur, it may be necessary to align the data to a reference source.
During instrument start, the installed hardware is checked against the current firmware
version to ensure the hardware is supported. If not, self-alignment fails until the firmware version is updated.
The correction data and characteristics required for the alignment are determined by
comparing the results at different settings with the known characteristics of the instrument's high-precision calibration signal source.
Remote command:
DEVice:CALibrate[:INIT] on page 522
88User Manual 1176.8839.02 ─ 16

R&S®VSE
Controlling instruments and capturing I/Q data
Configuring instruments
DEVice:CALibrate[:INIT]:ABORt on page 522
7.2.9 Configuring the behavior during remote control
Access: "Window" > "Instruments" > "Infos &Settings" > "General" tab
When the R&S VSE software is used to capture and analyze input from a connected
instrument, the instrument is operated in remote mode. Some general settings are
available to define how the instrument behaves during remote control and whether
access by multiple users to the same instrument is allowed.
Local Lockout................................................................................................................89
Display Update..............................................................................................................89
VISA lock state..............................................................................................................90
Local Lockout
If enabled, the instrument is set to be controlled remotely (that is, by the R&S VSE software) and the keys or graphical user interface are disabled. See also Chapter 12.3,
"Locking instruments for exclusive remote control", on page 498.
Remote command:
DEVice:GENeral:LLO on page 520
Display Update
Defines whether the display of the connected instrument is updated while it is being
controlled by the R&S VSE software.
Turning off the display update function improves performance.
Tip: you can also turn off the display update function for the R&S VSE software, see
"Remote Display Update" on page 500.
Remote command:
DEVice:GENeral:DISPlay on page 520
89User Manual 1176.8839.02 ─ 16

R&S®VSE
7.2.10 Configuring the use of a power sensor
Controlling instruments and capturing I/Q data
Configuring instruments
VISA lock state
Locks or unlocks the VISA connection to the selected instrument. If the connection is
locked, no other devices can operate the same instrument remotely. If no connection to
the instrument has been established yet, any subsequent connection to it is locked
immediately (see also Chapter 12.3, "Locking instruments for exclusive remote con-
trol", on page 498).
Tip: you can change the default value for the VISA lock for subsequent connections in
the user preferences, see "Lock new VISA connections" on page 500.
Remote command:
DEVice:LOCKing on page 521
DEVice:LOCKing:ALL on page 521
Access: "Window" > "Instruments" > "Infos &Settings" > "General" tab / "Reference"
tab
You can connect an R&S NRQ6 power sensor to the R&S VSE software. In this case,
some additional general and reference settings are available.
Figure 7-1: Power sensor general settings
90User Manual 1176.8839.02 ─ 16

R&S®VSE
Controlling instruments and capturing I/Q data
Configuring instruments
Figure 7-2: Power sensor reference settings
For details see the R&S NRQ6 user manual.
External reference settings for the power sensor are described in
An application sheet describes the use of the R&S NRQ6 as an I/Q data source for the
R&S VSE software. It has the title "VSE Feed (I/Q Capturing)" and is available at:
www.rohde-schwarz.com/manual/NRQ6
Sync Mode.................................................................................................................... 91
Primary Trigger Source.................................................................................................92
Trigger Output Port........................................................................................................92
Local Oscillator (LO) - Source.......................................................................................92
LO Out...........................................................................................................................92
Sampl. CLK Source.......................................................................................................92
Sampl. CLK Out............................................................................................................ 93
Sync Mode
Requires the R&S NRQ6-K1 and -K3 options.
Defines the synchronization mode for phase-coherent measurements.
"Off"
"Primary"
No synchronization
If the R&S NRQ6 is the primary trigger, the power sensor outputs a
digital trigger signal in sync with its own trigger event. The trigger signal is output at the selected port (see "Trigger Output Port"
on page 92).
"Secondary"
The R&S NRQ6 is triggered by the primary trigger (the connected
instrument).
91User Manual 1176.8839.02 ─ 16

R&S®VSE
Controlling instruments and capturing I/Q data
Configuring instruments
Remote command:
[SENSe:]TRACe:IQ:SYNC:MODE on page 591
Primary Trigger Source
Effective only if the R&S NRQ6 is the primary trigger (see Sync Mode):
Selects the trigger input for the R&S NRQ6.
"Free Run"
"Host-Interface
(Ext1)"
"Ext2"
Remote command:
TRIGger:IQ:SENDer:SOURce on page 591
Trigger Output Port
Effective only if the R&S NRQ6 is the primary trigger (see Sync Mode):
Selects the port where the R&S NRQ6 outputs a digital trigger signal.
"Off"
"Host-Interface
(Ext1)"
"Ext2"
Remote command:
TRIGger:SENDer:PORT on page 592
Local Oscillator (LO) - Source
Sets the local oscillator source for the power sensor.
"Internal"
"External"
Remote command:
[SENSe:]FREQuency:CONVersion:MIXer:LO:SOURce on page 589
Default: the R&S NRQ6 triggers when a measurement is started in
the R&S VSE software.
The R&S NRQ6 "Host Interface" connector provides the trigger signal.
The R&S NRQ6 "Trigger 2 I/O" connector provides the trigger signal.
Default: the primary trigger uses its internal trigger source
The R&S NRQ6 "Host Interface" connector is used as external trigger
output port.
The R&S NRQ6 "Trigger 2 I/O" connector is used as external trigger
output port.
Uses the internal LO signal.
Uses the external LO signal fed into the LO connector. The internal
LO generation is disabled.
LO Out
Enables or disables the output of the power sensor's local oscillator signal.
"Off"
"On"
Remote command:
[SENSe:]FREQuency:CONVersion:MIXer:LO:OUTPut:STATe on page 589
Sampl. CLK Source
Sets the sampling clock source for the power sensor. By default, the R&S NRQ6 generates its sampling clock internally. Alternatively, you can use external clock sources.
"Internal"
No signal is output. You can use the LO connector as an input.
LO signal is output.
Uses the internal sampling clock.
92User Manual 1176.8839.02 ─ 16
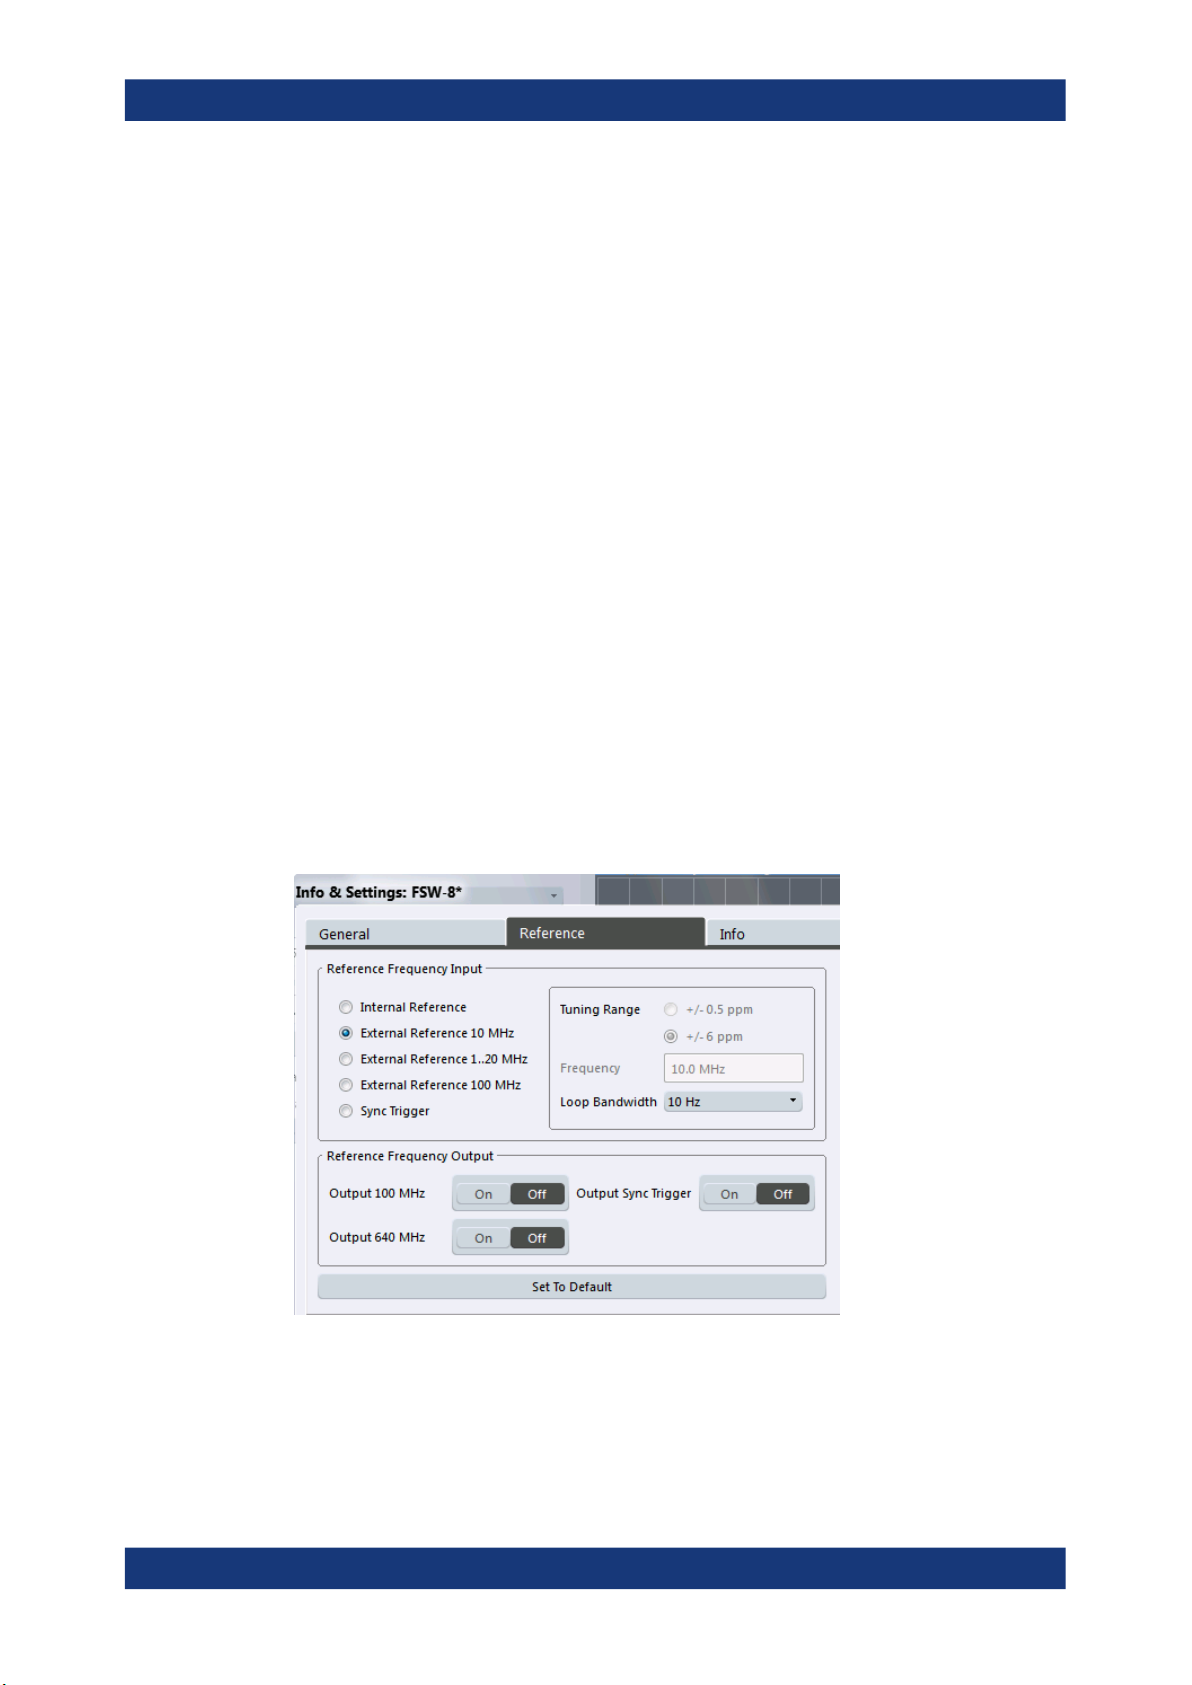
R&S®VSE
Controlling instruments and capturing I/Q data
Configuring instruments
"External"
Remote command:
[SENSe:]ROSCillator:PASSthrough on page 590
Sampl. CLK Out
Enables or disables the output of the power sensor's sampling clock signal.
"Off"
"On"
Remote command:
[SENSe:]SAMPling:CLKio:OUTPut on page 590
Uses the external sampling clock signal fed into the CLK connector.
The internal sampling clock is disabled.
No signal is output. You can use the CLK connector as an input.
Sampling clock signal is output.
7.2.11 Configuring a frequency reference for the connected instrument
Access: "Window" > "Instruments" > "Infos & Settings" > "Reference" tab
An connected instrument can use the internal reference source or an external reference source as the frequency standard for all internal oscillators. A crystal oscillator is
used as the internal reference source. If an external reference is used, all internal oscillators of the connected instrument are synchronized to the external reference frequency.
External references must be connected to the connected instrument correctly.
For details see the instrument's "Getting Started" manual.
The default setting is the internal reference. When an external reference is used, "EXT
REF" is displayed in the status bar.
Reference Frequency Input Source.............................................................................. 94
Tuning Range................................................................................................................94
Frequency..................................................................................................................... 94
93User Manual 1176.8839.02 ─ 16

R&S®VSE
Controlling instruments and capturing I/Q data
Configuring instruments
Loop Bandwidth............................................................................................................ 94
Reference Frequency Output........................................................................................94
Resetting the Default Values.........................................................................................94
Reference Frequency Input Source
Various sources are available to provide a reference frequency to the connected instrument, depending on the type of instrument. The available reference parameters also
depend on the instrument type.
Remote command:
DEVice:EXTRef:SOURce on page 524
Tuning Range
The tuning range is only available for the variable external reference frequency. It
determines how far the frequency may deviate from the defined level in parts per million (10-6).
Remote command:
DEVice:EXTRef:TRANge on page 525
Frequency
Defines the external reference frequency to be used (for variable connectors only).
Remote command:
DEVice:EXTRef:FREQuency on page 522
Loop Bandwidth
Defines the speed of internal synchronization with the reference frequency. The setting
requires a compromise between performance and increasing phase noise.
Remote command:
DEVice:EXTRef:LBWidth on page 523
Reference Frequency Output
The connected instrument can provide a reference frequency to other instruments that
are connected to this instrument. If one of the options is activated, the reference signal
is output to the corresponding connector.
Remote command:
DEVice:EXTRef:O100 on page 523
DEVice:EXTRef:O640 on page 523
DEVice:EXTRef:OSYNc on page 524
Resetting the Default Values
The values for the "Tuning Range", "Frequency" and "Loop Bandwidth" are stored for
each source of "Reference Frequency Input". Thus, when you switch the input source,
the previously defined settings are restored. You can restore the default values for all
input sources using the "Preset Channel" function.
94User Manual 1176.8839.02 ─ 16

R&S®VSE
Controlling instruments and capturing I/Q data
Controlling measurement channels, groups, and sequences
7.3 Controlling measurement channels, groups, and sequences
Access: "Window" > "Measurement Group Setup"
Measurement channels, groups, and sequences are configured and controlled in the
"Measurement Group Setup" tool window.
● Sequence functions.................................................................................................95
● Group functions.......................................................................................................97
● Channel functions................................................................................................. 100
7.3.1 Sequence functions
A measurement sequence can perform multiple measurements on the same instrument, without switching between measurement channels manually.
A measurement sequence consists of a number of measurement groups, and each
group may contain multiple channels.
In the R&S VSE Basic Edition, you can configure only one group with up to three channels at a time. In this case, the sequence functions have the same effect as the group
functions (see Chapter 7.3.2, "Group functions", on page 97).
The functions for a measurement sequence are provided above and below the measurement groups in the "Measurement Group Setup" tool window.
For details, see "Measurement groups and sequences" on page 51.
95User Manual 1176.8839.02 ─ 16

R&S®VSE
Controlling instruments and capturing I/Q data
Controlling measurement channels, groups, and sequences
Play............................................................................................................................... 96
Stop...............................................................................................................................96
Measurement mode (Single/Continuous)......................................................................96
Record...........................................................................................................................97
Play
"Play" starts a new measurement sequence according to the "Measurement mode
(Single/Continuous)" on page 96.
Remote command:
INITiate:SEQuencer:IMMediate on page 567
Stop
Stops a running measurement sequence.
Remote command:
INITiate:SEQuencer:ABORt on page 567
Measurement mode (Single/Continuous)
Defines the measurement mode for the entire measurement sequence and all measurement groups and channels it contains.
For details, see "Measurement mode" on page 52.
96User Manual 1176.8839.02 ─ 16

R&S®VSE
Controlling instruments and capturing I/Q data
Controlling measurement channels, groups, and sequences
"Single"
"Continuous"
Remote command:
INITiate:SEQuencer:MODE on page 568
Record
Currently not available.
Each measurement group is started one after the other in the order of
definition. All measurement channels in a group are started simultaneously and performed once. After all measurements are completed,
the next group is started. After the last group, the measurement
sequence is finished.
Each measurement group is started one after the other in the order of
definition. All measurement channels in a group are started simultaneously and performed once. After all measurements are completed,
the next group is started. After the last group, the measurement
sequence restarts with the first one and continues until it is stopped
explicitly (see "Play" on page 96).
7.3.2 Group functions
All measurement channels that are to be started at the same time must be configured
within a group.
Multiple groups of measurement channels can be configured (Enterprise Edition only),
for example to group measurements for a specific test scenario.
The functions for a measurement group are provided in a function bar with the group
name in the "Measurement Group Setup" tool window.
For details, see "Measurement groups" on page 49.
97User Manual 1176.8839.02 ─ 16

R&S®VSE
Controlling instruments and capturing I/Q data
Controlling measurement channels, groups, and sequences
The "running" icon in the group function bar indicates that the group is currently performing a measurement (within a sequence, see "Measurement groups and sequen-
ces" on page 51).
Activate/Deactivate Group............................................................................................ 98
New Group....................................................................................................................99
Capture......................................................................................................................... 99
Pause / Cont................................................................................................................. 99
Measurement mode (Single/Continuous)......................................................................99
Record...........................................................................................................................99
Close.............................................................................................................................99
Rename Group............................................................................................................100
Activate/Deactivate Group
If activated, the group is included in a measurement sequence.
Remote command:
INSTrument:BLOCk:USE on page 567
98User Manual 1176.8839.02 ─ 16

R&S®VSE
Controlling instruments and capturing I/Q data
Controlling measurement channels, groups, and sequences
New Group
Inserts a new group in the "Measurement Group Setup" tool window.
Note: In the R&S VSE Basic Edition, you can configure only one group.
Remote command:
INSTrument:BLOCk:CREate[:NEW] on page 555
Capture
Starts a new measurement (and restarts averaging) for all active measurement channels in the group. Only channels with distinct input types can be active at the same
time. The results for each channel are displayed whenever the measurement is completed, independently of the other channels.
Remote command:
INITiate:BLOCk:IMMediate on page 554
Pause / Cont
"Pause" stops a running measurement on the group.
"Cont" continues a measurement group (including any averaging procedures) that was
temporarily interrupted.
To restart averaging with the next measurement, use the
stopping the last channel.
Remote command:
INITiate:BLOCk:ABORt on page 553
INITiate:BLOCk:CONMeas on page 553
("Capture") function after
Measurement mode (Single/Continuous)
Defines the measurement mode for the group itself and all measurement channels it
contains.
For details, see "Measurement mode" on page 52.
"Single"
"Continuous"
Remote command:
INITiate:BLOCk:CONT on page 553
Record
Currently not available.
Close
Removes the group and closes all measurement channels and windows it included.
Note: In the R&S VSE Basic Edition, you cannot delete the group as there is only one.
Remote command:
INSTrument:BLOCk:DELete on page 556
All measurement channels in the group are started simultaneously
and performed once.
All measurement channels in the group are started simultaneously.
After all measurements are completed, the group restarts all measurements again.
99User Manual 1176.8839.02 ─ 16

R&S®VSE
Controlling instruments and capturing I/Q data
Controlling measurement channels, groups, and sequences
Rename Group
Access: "File" > "Measurement Group" > "Rename Group"
Or: Double-click (slowly) on group name in the "Measurement Group Setup" tool window
The selected group name turns into an input box so you can enter a user-defined
name. Note that you cannot assign an existing group name to another group.
Remote command:
INSTrument:BLOCk:REName on page 566
7.3.3 Channel functions
A measurement channel determines the measurement settings for a specific application.
The functions for a measurement channel are provided in a function bar with the channel name in the "Measurement Group Setup" tool window.
For details, see "Measurement channels" on page 47.
The "running" icon in the channel function bar indicates that a channel is currently
performing a measurement.
The "error" icon in the channel function bar indicates that an error occurred in the
measurement channel. Check the R&S VSE status bar.
Activate/Deactivate Channel.......................................................................................101
Assigning the Channel Input Source...........................................................................101
└ Input Type (Instrument / File)........................................................................101
└ Instrument..................................................................................................... 101
└ Input Source....................................................................................... 101
└ Generator............................................................................................102
└ File................................................................................................................ 102
└ Channel.............................................................................................. 103
100User Manual 1176.8839.02 ─ 16
 Loading...