

Page 1

Discrete Machine
Performance Solution
Target Machine Efficiency Improvements
Powered by RSBizWare
User’s Guide
Doc ID BWDMPS-UM001A-EN-E
Page 2

Contacting
Rockwell Software
Technical Support Telephone—1-440-646-5800
Technical Support Fax—1-440-646-5801
World Wide Web—www.rockwellsoftware.com
Copyright Notice
Trademark Notice
Copyright © 2004 Rockwell Software Inc. All rights reserved. Printed in USA.
This manual and any accompanying Rockwell Software products are copyrighted by Rockwell
Software Inc. Any reproduction and/or distribution without prior written consent from Rockwell
Software Inc. is strictly prohibited. Please refer to the license agreement for details.
The Rockwell Software logo, RSLogix Emulate 5, RSLogix Emulate 500, RSLinx, RSLogix 5,
RSLogix 500, RSLogix Frameworks, RSLogix SL5, RSView32, RSView, AdvanceDDE, RSSql,
RSBizWare Production Client, RSBizWare Historian, RSBizWare BatchHistorian, RSBizWare
PlantMetrics, RSBizWare Scheduler, RSBizWare Enterprise Manager, RSBizWare Batch, and
RSBizWare Batch Archiver are trademarks of Rockwell Software Inc., a Rockwell Automation
company.
VersaView is a trademark of Rockwell Automation, Inc.
Microsoft, Windows, ActiveX, and Visual Basic are registered trademarks, and Windows NT,
Windows 2000, Windows XP, Microsoft Access, Microsoft Excel, Microsoft SQL Server, and
Visual SourceSafe are trademarks of the Microsoft Corporation.
Oracle is a registered trademark of Oracle Corporation.
SAP, SAP Logo, mySAP.com, R/2, R/3, ABAP, and BAPI are trademarks or registered trademarks
of SAP AG in Germany and in several other countries all over the world.
OLE for Process Control (OPC) is a registered trademark of the OPC Foundation.
ControlNet is a trademark of ControlNet International.
DeviceNet is a trademark of the Open DeviceNet Vendors Association.
Ethernet is a registered trademark of Digital Equipment Corporation, Intel, and Xerox
Corporation.
Adobe and Acrobat are trademarks of Adobe Systems Incorporated.
All other trademarks and registered trademarks are the property of their respective holders and are
hereby acknowledged.
Warranty
This Rockwell Software product is warranted in accord with the product license. The product’s
performance will be affected by system configuration, the application being performed, operator
control, and other related factors.
This product’s implementation may vary among users.
This manual is as up-to-date as possible at the time of printing; however, the accompanying
software may have changed since that time. Rockwell Software reserves the right to change any
information contained in this manual or the software at anytime without prior notice.
The instructions in this manual do not claim to cover all the details or variations in the equipment,
procedure, or process described, nor to provide directions for meeting every possible contingency
during installation, operation, or maintenance.
ii
Page 3

Contents
1 • Welcome to the Discrete Machine Performance Solution 1
Chapter objectives . . . . . . . . . . . . . . . . . . . . . . . . . . . . . . . . . . . . . . . . . . . . . . . . . . . . . 1
What is the Discrete Machine Performance Solution? . . . . . . . . . . . . . . . . . . . . . . . . . 1
Features and benefits . . . . . . . . . . . . . . . . . . . . . . . . . . . . . . . . . . . . . . . . . . . . . . . 1
Intended audience. . . . . . . . . . . . . . . . . . . . . . . . . . . . . . . . . . . . . . . . . . . . . . . . . . . . . . 2
System installer. . . . . . . . . . . . . . . . . . . . . . . . . . . . . . . . . . . . . . . . . . . . . . . . . . . . 2
System configurator . . . . . . . . . . . . . . . . . . . . . . . . . . . . . . . . . . . . . . . . . . . . . . . . 2
Line operator. . . . . . . . . . . . . . . . . . . . . . . . . . . . . . . . . . . . . . . . . . . . . . . . . . . . . . 3
Report user . . . . . . . . . . . . . . . . . . . . . . . . . . . . . . . . . . . . . . . . . . . . . . . . . . . . . . . 3
Where can I go for help? . . . . . . . . . . . . . . . . . . . . . . . . . . . . . . . . . . . . . . . . . . . . . . . . 3
Get Discrete MPS training . . . . . . . . . . . . . . . . . . . . . . . . . . . . . . . . . . . . . . . . . . . 3
Get phone support. . . . . . . . . . . . . . . . . . . . . . . . . . . . . . . . . . . . . . . . . . . . . . . . . . 4
Get web support . . . . . . . . . . . . . . . . . . . . . . . . . . . . . . . . . . . . . . . . . . . . . . . . . . . 4
Get on-site support . . . . . . . . . . . . . . . . . . . . . . . . . . . . . . . . . . . . . . . . . . . . . . . . . 5
Get consulting services. . . . . . . . . . . . . . . . . . . . . . . . . . . . . . . . . . . . . . . . . . . . . . 5
Contact us . . . . . . . . . . . . . . . . . . . . . . . . . . . . . . . . . . . . . . . . . . . . . . . . . . . . . . . . 5
2 • Discrete MPS Hardware Installation 7
Chapter objectives . . . . . . . . . . . . . . . . . . . . . . . . . . . . . . . . . . . . . . . . . . . . . . . . . . . . . 7
Features . . . . . . . . . . . . . . . . . . . . . . . . . . . . . . . . . . . . . . . . . . . . . . . . . . . . . . . . . . . . . 7
Top and side view. . . . . . . . . . . . . . . . . . . . . . . . . . . . . . . . . . . . . . . . . . . . . . . . . . 7
Before unpacking the computer . . . . . . . . . . . . . . . . . . . . . . . . . . . . . . . . . . . . . . . . . . . 8
Packing list . . . . . . . . . . . . . . . . . . . . . . . . . . . . . . . . . . . . . . . . . . . . . . . . . . . . . . . . . . . 8
Shipping/transporting the computer. . . . . . . . . . . . . . . . . . . . . . . . . . . . . . . . . . . . . . . . 9
European Union Directive compliance . . . . . . . . . . . . . . . . . . . . . . . . . . . . . . . . . . . . . 9
Enclosures . . . . . . . . . . . . . . . . . . . . . . . . . . . . . . . . . . . . . . . . . . . . . . . . . . . . . . . . . . . 9
Environmental considerations . . . . . . . . . . . . . . . . . . . . . . . . . . . . . . . . . . . . . . . . . . . 10
Mounting hardware . . . . . . . . . . . . . . . . . . . . . . . . . . . . . . . . . . . . . . . . . . . . . . . . . . . 11
Tools required . . . . . . . . . . . . . . . . . . . . . . . . . . . . . . . . . . . . . . . . . . . . . . . . . . . . . . . 11
Mounting dimensions. . . . . . . . . . . . . . . . . . . . . . . . . . . . . . . . . . . . . . . . . . . . . . . . . . 11
Mounting clearances . . . . . . . . . . . . . . . . . . . . . . . . . . . . . . . . . . . . . . . . . . . . . . . . . . 12
Mounting clearances for the Integrated Display Computer . . . . . . . . . . . . . . . . . 13
Panel cutout dimensions. . . . . . . . . . . . . . . . . . . . . . . . . . . . . . . . . . . . . . . . . . . . . . . . 14
Panel mounting guidelines . . . . . . . . . . . . . . . . . . . . . . . . . . . . . . . . . . . . . . . . . . . . . . 14
Installing computer in panel. . . . . . . . . . . . . . . . . . . . . . . . . . . . . . . . . . . . . . . . . . . . . 14
Connecting a keyboard and pointing device . . . . . . . . . . . . . . . . . . . . . . . . . . . . . . . . 16
Connecting AC power . . . . . . . . . . . . . . . . . . . . . . . . . . . . . . . . . . . . . . . . . . . . . . . . . 17
Connecting to a network . . . . . . . . . . . . . . . . . . . . . . . . . . . . . . . . . . . . . . . . . . . . . . . 17
iii
Page 4

DISCRETE MACHINE PERFORMANCE SOLUTION USER’S GUIDE
• • • • •
3 • Initial Operation and Setup 19
Chapter objectives . . . . . . . . . . . . . . . . . . . . . . . . . . . . . . . . . . . . . . . . . . . . . . . . . . . . 19
Operating guidelines . . . . . . . . . . . . . . . . . . . . . . . . . . . . . . . . . . . . . . . . . . . . . . . . . . 19
Operator access . . . . . . . . . . . . . . . . . . . . . . . . . . . . . . . . . . . . . . . . . . . . . . . . . . . . . . 19
Boot-up sequence . . . . . . . . . . . . . . . . . . . . . . . . . . . . . . . . . . . . . . . . . . . . . . . . . . . . . 19
Initial configuration steps. . . . . . . . . . . . . . . . . . . . . . . . . . . . . . . . . . . . . . . . . . . . . . . 20
Using a touchscreen . . . . . . . . . . . . . . . . . . . . . . . . . . . . . . . . . . . . . . . . . . . . . . . . . . . 21
Touchscreen serial port usage. . . . . . . . . . . . . . . . . . . . . . . . . . . . . . . . . . . . . . . . 21
Driver software . . . . . . . . . . . . . . . . . . . . . . . . . . . . . . . . . . . . . . . . . . . . . . . . . . . 21
Resistive touchscreen technology. . . . . . . . . . . . . . . . . . . . . . . . . . . . . . . . . . . . . 21
Calibrating the touchscreen . . . . . . . . . . . . . . . . . . . . . . . . . . . . . . . . . . . . . . . . . 22
4 • Collecting Performance Data 23
Chapter objectives . . . . . . . . . . . . . . . . . . . . . . . . . . . . . . . . . . . . . . . . . . . . . . . . . . . . 23
What is the OEE rating?. . . . . . . . . . . . . . . . . . . . . . . . . . . . . . . . . . . . . . . . . . . . . . . . 23
User-defined summarization criteria . . . . . . . . . . . . . . . . . . . . . . . . . . . . . . . . . . . . . . 24
Configuring a workcell availability calendar. . . . . . . . . . . . . . . . . . . . . . . . . . . . . . . . 25
Step 1 • Define time patterns . . . . . . . . . . . . . . . . . . . . . . . . . . . . . . . . . . . . . . . . 25
Step 2 • Configure Composite Time Patterns. . . . . . . . . . . . . . . . . . . . . . . . . . . . 31
Step 3 • Schedule exceptions . . . . . . . . . . . . . . . . . . . . . . . . . . . . . . . . . . . . . . . . 33
5 • Discrete MPS Configurator Application 35
Chapter objectives . . . . . . . . . . . . . . . . . . . . . . . . . . . . . . . . . . . . . . . . . . . . . . . . . . . . 35
Exploring the user interface . . . . . . . . . . . . . . . . . . . . . . . . . . . . . . . . . . . . . . . . . . . . . 35
The Configuration Explorer . . . . . . . . . . . . . . . . . . . . . . . . . . . . . . . . . . . . . . . . . 35
The Configuration Work Area . . . . . . . . . . . . . . . . . . . . . . . . . . . . . . . . . . . . . . . 36
The Configuration Status Bar . . . . . . . . . . . . . . . . . . . . . . . . . . . . . . . . . . . . . . . . 36
Main screen . . . . . . . . . . . . . . . . . . . . . . . . . . . . . . . . . . . . . . . . . . . . . . . . . . . . . . . . . 36
General settings . . . . . . . . . . . . . . . . . . . . . . . . . . . . . . . . . . . . . . . . . . . . . . . . . . . . . . 37
Workcells . . . . . . . . . . . . . . . . . . . . . . . . . . . . . . . . . . . . . . . . . . . . . . . . . . . . . . . . . . . 38
Efficiency Analysis . . . . . . . . . . . . . . . . . . . . . . . . . . . . . . . . . . . . . . . . . . . . . . . . . . . 39
Part Counters . . . . . . . . . . . . . . . . . . . . . . . . . . . . . . . . . . . . . . . . . . . . . . . . . . . . 39
Ideal Cycle Time . . . . . . . . . . . . . . . . . . . . . . . . . . . . . . . . . . . . . . . . . . . . . . . . . 40
Availability Status . . . . . . . . . . . . . . . . . . . . . . . . . . . . . . . . . . . . . . . . . . . . . . . . 40
Running status . . . . . . . . . . . . . . . . . . . . . . . . . . . . . . . . . . . . . . . . . . . . . . . . . . . 41
Digital Events. . . . . . . . . . . . . . . . . . . . . . . . . . . . . . . . . . . . . . . . . . . . . . . . . . . . . . . . 41
Multistate Events . . . . . . . . . . . . . . . . . . . . . . . . . . . . . . . . . . . . . . . . . . . . . . . . . . . . . 42
Counters . . . . . . . . . . . . . . . . . . . . . . . . . . . . . . . . . . . . . . . . . . . . . . . . . . . . . . . . . . . . 43
Breakdown Justification. . . . . . . . . . . . . . . . . . . . . . . . . . . . . . . . . . . . . . . . . . . . . . . . 44
Manual Justification . . . . . . . . . . . . . . . . . . . . . . . . . . . . . . . . . . . . . . . . . . . . . . . 44
Automatic Justification. . . . . . . . . . . . . . . . . . . . . . . . . . . . . . . . . . . . . . . . . . . . . 45
iv
Page 5

CONTENTS
Process Variables . . . . . . . . . . . . . . . . . . . . . . . . . . . . . . . . . . . . . . . . . . . . . . . . . . . . . 46
Summarization events . . . . . . . . . . . . . . . . . . . . . . . . . . . . . . . . . . . . . . . . . . . . . . . . . 47
Strings Localization . . . . . . . . . . . . . . . . . . . . . . . . . . . . . . . . . . . . . . . . . . . . . . . . . . . 49
Generating the application . . . . . . . . . . . . . . . . . . . . . . . . . . . . . . . . . . . . . . . . . . . . . . 50
Workcell Description changes . . . . . . . . . . . . . . . . . . . . . . . . . . . . . . . . . . . . . . . 52
6 • Discrete MPS Operator Interface 57
Chapter objectives . . . . . . . . . . . . . . . . . . . . . . . . . . . . . . . . . . . . . . . . . . . . . . . . . . . . 57
Exploring the Operator Interface . . . . . . . . . . . . . . . . . . . . . . . . . . . . . . . . . . . . . . . . . 57
Graphical Keyboards . . . . . . . . . . . . . . . . . . . . . . . . . . . . . . . . . . . . . . . . . . . . . . 58
Main overview . . . . . . . . . . . . . . . . . . . . . . . . . . . . . . . . . . . . . . . . . . . . . . . . . . . . . . . 59
Login . . . . . . . . . . . . . . . . . . . . . . . . . . . . . . . . . . . . . . . . . . . . . . . . . . . . . . . . . . . . . . 60
Maintenance . . . . . . . . . . . . . . . . . . . . . . . . . . . . . . . . . . . . . . . . . . . . . . . . . . . . . . . . . 61
Workcell menu . . . . . . . . . . . . . . . . . . . . . . . . . . . . . . . . . . . . . . . . . . . . . . . . . . . . . . . 63
Performance analysis . . . . . . . . . . . . . . . . . . . . . . . . . . . . . . . . . . . . . . . . . . . . . . . . . . 64
Digital Event . . . . . . . . . . . . . . . . . . . . . . . . . . . . . . . . . . . . . . . . . . . . . . . . . . . . . . . . 65
Multistate Events . . . . . . . . . . . . . . . . . . . . . . . . . . . . . . . . . . . . . . . . . . . . . . . . . . . . . 66
Counters . . . . . . . . . . . . . . . . . . . . . . . . . . . . . . . . . . . . . . . . . . . . . . . . . . . . . . . . . . . . 67
Process Variable trends . . . . . . . . . . . . . . . . . . . . . . . . . . . . . . . . . . . . . . . . . . . . . . . . 68
Summarization Values . . . . . . . . . . . . . . . . . . . . . . . . . . . . . . . . . . . . . . . . . . . . . . . . . 69
Breakdown justification . . . . . . . . . . . . . . . . . . . . . . . . . . . . . . . . . . . . . . . . . . . . . . . . 70
• • • • •
7 • Discrete MPS Reporting 71
Chapter objectives . . . . . . . . . . . . . . . . . . . . . . . . . . . . . . . . . . . . . . . . . . . . . . . . . . . . 71
Available reports . . . . . . . . . . . . . . . . . . . . . . . . . . . . . . . . . . . . . . . . . . . . . . . . . . . . . 71
Accessing reports . . . . . . . . . . . . . . . . . . . . . . . . . . . . . . . . . . . . . . . . . . . . . . . . . . . . . 72
Report display options . . . . . . . . . . . . . . . . . . . . . . . . . . . . . . . . . . . . . . . . . . . . . . . . . 74
General toolbar . . . . . . . . . . . . . . . . . . . . . . . . . . . . . . . . . . . . . . . . . . . . . . . . . . . 74
Filter toolbar . . . . . . . . . . . . . . . . . . . . . . . . . . . . . . . . . . . . . . . . . . . . . . . . . . . . . 74
Time Selection toolbar . . . . . . . . . . . . . . . . . . . . . . . . . . . . . . . . . . . . . . . . . . . . . 75
Time Selection Tools toolbar . . . . . . . . . . . . . . . . . . . . . . . . . . . . . . . . . . . . . . . . 75
Managing report login accounts. . . . . . . . . . . . . . . . . . . . . . . . . . . . . . . . . . . . . . . . . . 75
Report samples . . . . . . . . . . . . . . . . . . . . . . . . . . . . . . . . . . . . . . . . . . . . . . . . . . . . . . . 79
Performance Analysis OEE Details by Workcell. . . . . . . . . . . . . . . . . . . . . . . . . 79
Performance Analysis OEE Overview . . . . . . . . . . . . . . . . . . . . . . . . . . . . . . . . . 80
Performance Analysis OEE Trend . . . . . . . . . . . . . . . . . . . . . . . . . . . . . . . . . . . . 81
Performance Analysis Production . . . . . . . . . . . . . . . . . . . . . . . . . . . . . . . . . . . . 82
Performance Analysis Production by Shift (text). . . . . . . . . . . . . . . . . . . . . . . . . 83
Performance Analysis Production by Shift (bar chart). . . . . . . . . . . . . . . . . . . . . 84
Digital Events Total Duration (bar chart). . . . . . . . . . . . . . . . . . . . . . . . . . . . . . . 85
Digital Events Total Duration (pie chart) . . . . . . . . . . . . . . . . . . . . . . . . . . . . . . . 86
v
Page 6

DISCRETE MACHINE PERFORMANCE SOLUTION USER’S GUIDE
• • • • •
Digital Events Number of Occurrences . . . . . . . . . . . . . . . . . . . . . . . . . . . . . . . . 87
Digital Events Detailed List . . . . . . . . . . . . . . . . . . . . . . . . . . . . . . . . . . . . . . . . . 88
Analog Events Total Duration by Day (text) . . . . . . . . . . . . . . . . . . . . . . . . . . . . 89
Analog Events Total Duration by Day (bar chart) . . . . . . . . . . . . . . . . . . . . . . . . 90
Analog Events Total Duration by Summarization Event . . . . . . . . . . . . . . . . . . . 91
Counters Total by Month (text) . . . . . . . . . . . . . . . . . . . . . . . . . . . . . . . . . . . . . . 92
Counters Total by Month (bar chart) . . . . . . . . . . . . . . . . . . . . . . . . . . . . . . . . . . 93
Breakdowns Total Duration (pie chart) . . . . . . . . . . . . . . . . . . . . . . . . . . . . . . . . 94
Breakdowns Total Duration by Summarization Event. . . . . . . . . . . . . . . . . . . . . 95
Process Variables Trend . . . . . . . . . . . . . . . . . . . . . . . . . . . . . . . . . . . . . . . . . . . . 96
A • System Troubleshooting 97
Introduction . . . . . . . . . . . . . . . . . . . . . . . . . . . . . . . . . . . . . . . . . . . . . . . . . . . . . . . . . 97
VersaView Integrated Display Computer problems . . . . . . . . . . . . . . . . . . . . . . . . . . 97
Computer interface problems. . . . . . . . . . . . . . . . . . . . . . . . . . . . . . . . . . . . . . . . . . . . 98
Index 99
vi
Page 7

1
Welcome to the Discrete Machine Performance Solution
Chapter objectives
This chapter provides an overview of the Discrete Machine Performance Solution, the
intended audience for this document, and sources of assistance for this product.
What is the Discrete Machine Performance Solution?
Companies in the discrete and repetitive manufacturing industries are being challenged by
management to maximize production from existing lines, to meet required cycle-times
and delivery dates for each product, and to reduce costs. To meet this challenge,
production management is striving to operate the equipment at its highest efficiency.
Real-time identification of production assets that are not performing to a standard is
critical to maintaining world-class efficiency. A thorough understanding of the details
behind production performance will allow you to identify sources of production
inefficiencies and to maximize asset utilization.
Historically, many custom solutions have been developed but have often failed to fulfill
expectations, essentially due to problems of long development times, high costs, and lack
of configurability.
The Discrete Machine Performance Solution (Discrete MPS) is a pre-developed system,
created to provide visualization and analysis of production asset performance based on
data acquired from a production control system. The Discrete MPS provides an industrial
computer with a standard operator interface application, and the ability to use a remote
web browser to access standard reports. The Discrete MPS is built using other successful
Rockwell Automation components, and is designed to be configured quickly to match the
production configuration or to be re-configured should the production configuration
change.
1 • Welcome
Features and benefits
Discrete MPS offers the following features and benefits:
Calculates the Overall Equipment Effectiveness (OEE) for a workcell to evaluate its
performance.
Process Event and Process Variable tracking.
Downtime duration and reason code tracking.
1
Page 8

DISCRETE MACHINE PERFORMANCE SOLUTION USER’S GUIDE
• • • • •
The ability to track the performance and process data for up to five workcells.
Visibility and analysis tools for real-time and historical process information.
Pre-developed Operator Interface displays.
Pre-developed reports.
A configuration application used to configure the site-specific production details.
An entire solution based on a single industrial computer.
Intended audience
This User’s Guide is designed to help you understand how to access and use the Discrete
MPS product.
This document is intended for the following types of users:
System installer
This is an individual who installs the Discrete MPS computer and connects it to the plant
systems.
This individual should be familiar with:
Installation of industrial computers on the plant floor
Control systems
Ethernet networking
This user will be most interested in the following chapters of this document:
Discrete MPS Hardware Installation
Initial Operation and Setup
System configurator
This is an individual who configures the Discrete MPS so that it can capture performance
data from the control system and present the real time information to the line operator and
the historical reports to the Report User.
This individual should be familiar with:
Process information (machine, line, and plant)
Control systems
The OEE calculation
The Microsoft Windows operating system
2
Page 9

1 • WELCOME TO THE DISCRETE MACHINE PERFORMANCE SOLUTION
This user will be most interested in the following chapters of this document:
Initial Operation and Setup
Collecting Performance Data
Discrete MPS Configurator Application
Line operator
This is the individual who uses the Discrete MPS Operator Interface on the shop floor.
He/she will make use of the Discrete MPS Operator Interface to enter any information that
is not automatically collected from the control system and, if required, he will select the
proper justification reason for a breakdown.
This individual should be familiar with:
Process information (machine, line)
Use of a plant floor HMI
Use of a touchscreen
This user will be most interested in the following chapters of this document:
Discrete MPS Operator Interface
• • • • •
1 • Welcome
Report user
This is the individual who makes use of the reports provided by the Discrete MPS.
This individual should be familiar with:
Process information (machine, line, and plant)
The Microsoft Internet Explorer Web browser
This user will be most interested in the following chapters of this document:
Discrete MPS Reporting
Where can I go for help?
Our commitment to your success starts with the suite of learning aids and assistance we
provide for the Discrete MPS. You have the following options for getting additional
information about this product:
Get Discrete MPS training
One of the best ways to increase your proficiency at using Rockwell Software products is
to attend Rockwell Software training programs. Our training programs can help you
master the basics and show you how to unleash the full potential of our software.
3
Page 10

DISCRETE MACHINE PERFORMANCE SOLUTION USER’S GUIDE
• • • • •
We offer a wide range of training programs, from regularly scheduled classes conducted at
Rockwell Software facilities, to custom-tailored classes conducted at your enterprise. The
size of each class is kept small intentionally to maximize student engagement.
If you would like more information about our training programs, visit the Rockwell
Software site on the World Wide Web or contact the Rockwell Software Training
Coordinator. Our World Wide Web address and telephone numbers appear on the inside
front cover of this document.
Get phone support
Rockwell Software’s support team of outstanding professionals provides top-notch
technical support — monitoring and tracking your experience with our products to pave
the road to your success in understanding and improving your factory performance.
Questions concerning installation and the use of the software are handled by the Rockwell
Automation Customer Support Center, staffed Monday through Friday — except U.S.
holidays — from 8 AM to 5 PM Eastern time zone for calls originating within the U.S.
and Canada.
To reach the Customer Support Center, call 440-646-5800 and follow the prompts. For
calls originating outside the U.S./Canada, locate the number in your country by visiting
support.rockwellautomation.com
and selecting the Phone Support link.
W
HEN YOU CALL
When you call, you should be at your computer prepared to give the following
information:
your a support contract number
the type of control system hardware you are using
the exact wording of any errors or messages that appeared on your screen
a description of what happened and what you were doing when the problem occurred
a description of how you attempted to solve the problem
Get web support
In addition to phone support, the Rockwell Automation Customer Support Center offers
extensive online knowledgebases of tech notes and frequently asked questions for support
of non-urgent issues. These databases are updated daily by our support specialists.
To receive regular e-mail messages with links to the latest tech notes, software updates,
and firmware updates for the products that are of interest to you or to submit an online
support request, visit support.rockwellautomation.com/supportrequests
4
.
Page 11

1 • WELCOME TO THE DISCRETE MACHINE PERFORMANCE SOLUTION
Get on-site support
Rockwell Automation field support engineers are located around the globe to provide
assistance with special projects, unexpected problems, or emergency situations on-site.
Field support engineers are available for dispatch 24x7x365 and can arrive at many
locations the same day.
To learn more about this and other support services, visit
support.rockwellautomation.com
.
Get consulting services
Rockwell Automation provides expert consulting and turnkey implementation of the
RSBizWare suite. Please contact your local representative for more information.
Contact us
We strive to help all of our customers become successful in their manufacturing
improvement efforts. Toward this objective, we invite you to contact your local
representative or Rockwell Software at any time that we may be of service to you.
• • • • •
1 • Welcome
5
Page 12

DISCRETE MACHINE PERFORMANCE SOLUTION USER’S GUIDE
• • • • •
6
Page 13
2
Discrete MPS Hardware Installation
Chapter objectives
This chapter describes installation of the VersaView Integrated Display Computer.
Features
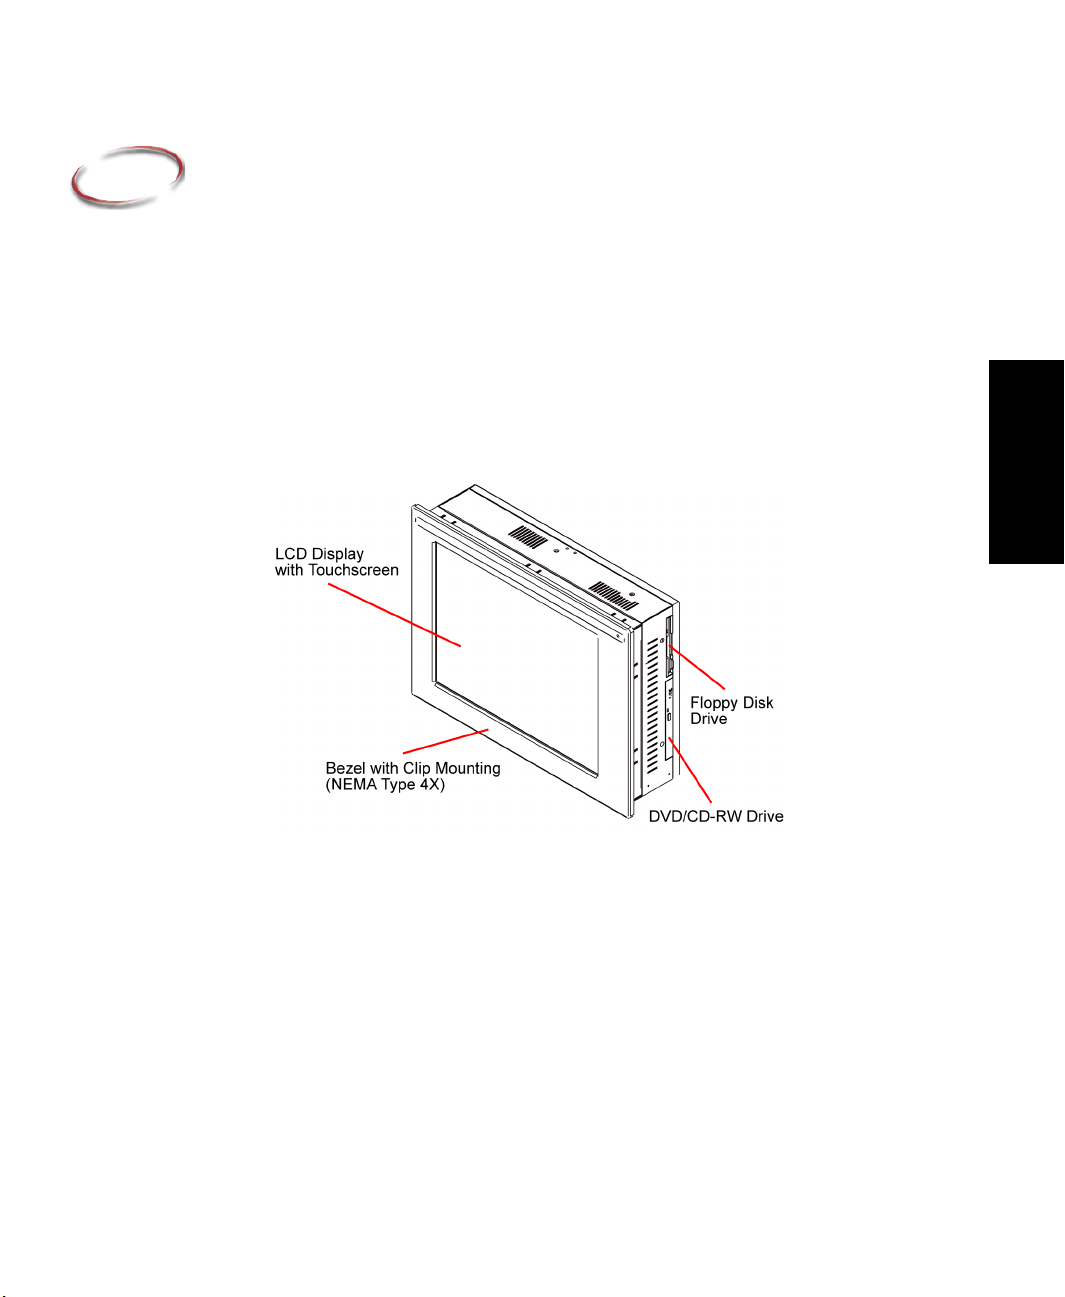
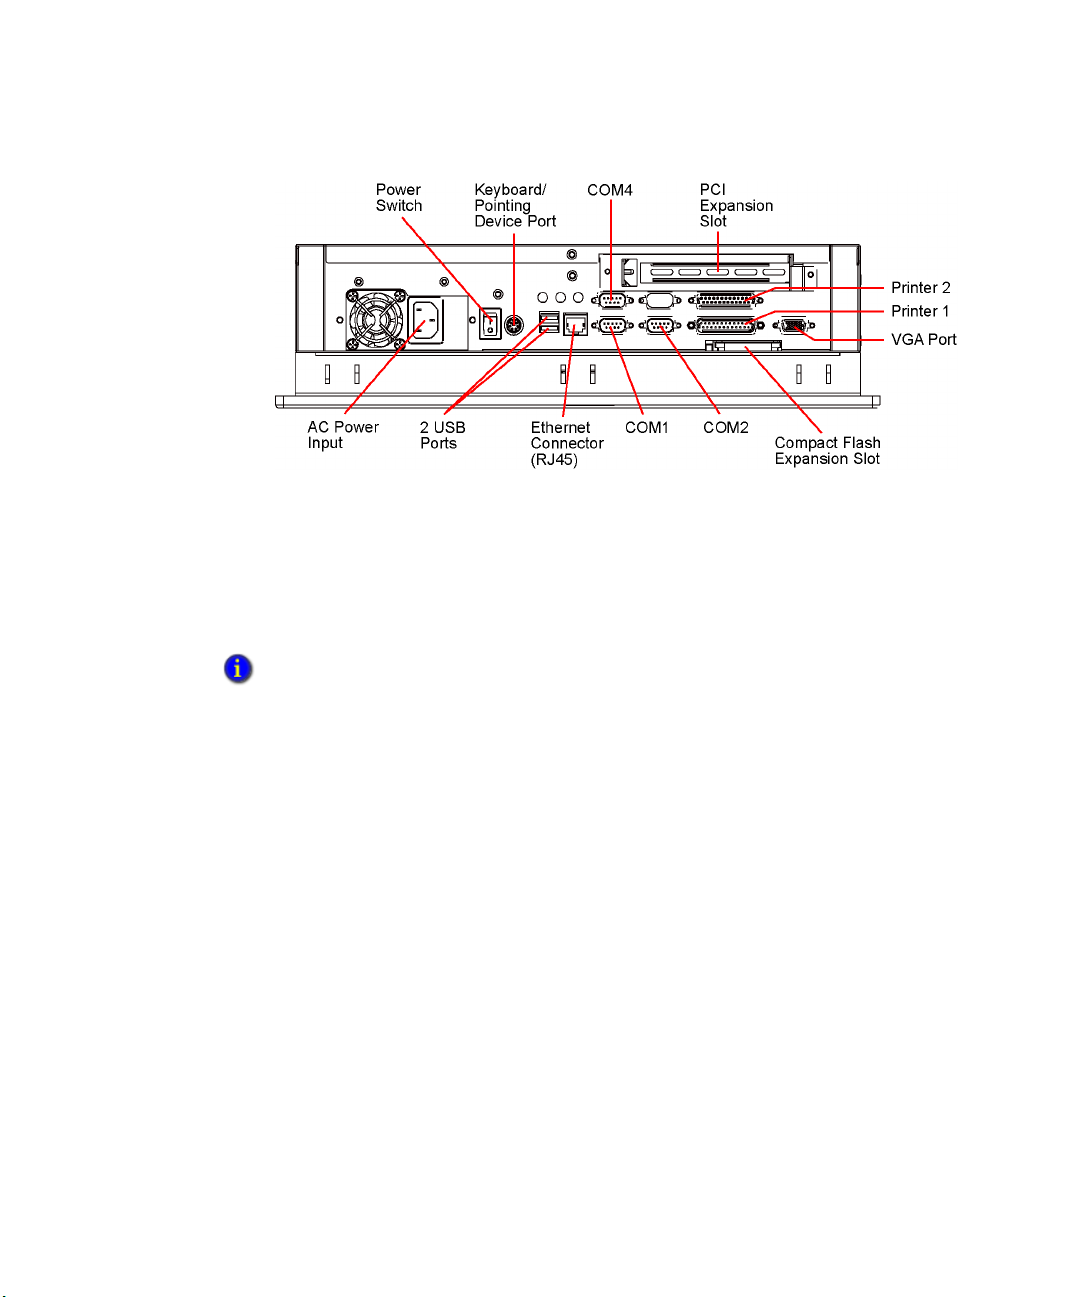
The following illustrations show the major features and controls of the VersaView
Integrated Display Computer.
Top and side view
2 • Installation
7
Page 14
DISCRETE MACHINE PERFORMANCE SOLUTION USER’S GUIDE
• • • • •
Note: The VersaView that ships with the Discrete MPS has two PS/2 ports.
Before unpacking the computer
Before unpacking your new computer, inspect the shipping carton for damage. If damage
is visible, immediately contact the shipper and request assistance. Otherwise, proceed
with unpacking.
Make sure you keep all the original packaging for the computer in case you need to return the
computer for repair. Both the inner and outer packing cartons should be used to ensure adequate
protection for any units returned for service.
Packing list
Computer with operating system pre-installed
Microsoft XP Pro License
Mounting clips
AC power cord
Accessories CD-ROM (red) containing touchscreen driver, video drivers, Ethernet
drivers, and technical documentation
Recovery CD-ROM (blue)
Quick Start guide
8
Page 15
Shipping/transporting the computer
If, after you have installed the VersaView computer, you must ship it via common carrier
or otherwise transport it to another location, you must first remove the unit from the panel
and place it in its original packing material.
Do not ship or otherwise transport the VersaView computer while it is installed in a door or panel.
You must uninstall the computer and place it in its original packing material before shipping or
transporting the unit. If you ship or transport the computer while it is installed in a door or panel,
you may severely damage the unit. Rockwell Automation is not responsible for damage incurred
to the computer if it is shipped or transported while still installed in a door or panel.
European Union Directive compliance
The VersaView Integrated Display Computer meets the European Union Directive
requirements when installed within the European Union or EEA regions and has the CE
mark. A copy of the Declaration of Conformity is available at the Rockwell Automation /
Allen-Bradley Internet site: www.ab.com
The VersaView Integrated Display Computer is intended to operate in an industrial or control
room environment, which utilizes some form of power isolation from the public low voltage mains.
Some VersaView computer configurations may not comply with the EN 61000-3-2 Harmonic
Emissions standard as specified by the EMC Directive of the European Union. Obtain permission
from the local power authority before connecting any VersaView computer configuration that
draws more than 75 watts of AC power directly from the public mains.
.
• • • • •
2 • DISCRETE MPS HARDWARE INSTALLATION
2 • Installation
To comply with EN 55024, the Ethernet LAN cable must be less than 30 m [98.42 ft.] long, and it
must only be used indoors (i.e., not exit the building at any point). All other I/O cables must be
less than 3 m [9.842 ft.] long, and must only be used indoors.
Enclosures
Mount the VersaView Integrated Display Computer in a panel or enclosure to protect the
internal circuitry. Versions with a gestated bezel meet NEMA Type 1, 12, 4, 4X (indoor
9
Page 16

DISCRETE MACHINE PERFORMANCE SOLUTION USER’S GUIDE
• • • • •
use only) and IEC IP66 only when mounted in a panel or enclosure having an equivalent
rating.
Environment and enclosure
This equipment is intended for use in a Pollution Degree 2 industrial environment, in overfatigue
Category II applications (as defined in IEC publication 60664-1), at altitudes up to 2000 meters
without darting.
This equipment is considered Group 1, Class A industrial equipment according to IEC/CISPR
Publication 11. Without appropriate precautions, there may be potential difficulties ensuring
electromagnetic compatibility in other environments due to conducted, as well as radiated,
disturbance. This equipment is supplied as “open type” equipment. It must be mounted within an
enclosure that is suitably designed for those specific environmental conditions that will be present
and appropriately designed to prevent personal injury resulting from accessibility to live parts.
The interior of the enclosure must be accessible only by the use of a tool. Subsequent sections of
this publication may contain additional information regarding specific enclosure type ratings that
are required to comply with certain product safety certifications. See NEMA Standards
publication 250 and IEC publication 60529, as applicable, for explanations of the degrees of
protection provided by different types of enclosure. Also, see the appropriate sections in this
publication, as well as the Allen-Bradley publication 1770-4.1 (
Grounding Guidelines
), for additional installation requirements pertaining to this equipment.
Industrial Automation Wiring and
10
Environmental considerations
Follow these guidelines to help ensure that the computer provides safe and reliable
service.
Ensure that sufficient space is available around air inlets and outlets to provide the
circulation necessary for cooling. Never allow air passages to become obstructed.
Allow enough room within the enclosure for adequate ventilation. The ambient
temperature around the computer must be between 0-50 °C (32-122 °F). Also
consider heat produced by other devices in the enclosure. You may need a usersupplied fan, heat exchanger, or air conditioner to meet this condition in some
installations.
Remember that heat rises. The temperature at the top of an enclosure is often much higher than
the rest of the enclosure if air is not circulating.
Page 17
The VersaView Integrated Display Computer is designed to operate at a range of extremes.
However, it is not good design practice to continuously operate the computer at the highest end
of the specified temperature range. While the product will operate at its highest specified
temperature, the overall life span of any electronic device is shortened when it operates at its
highest rated temperature.
Ensure that the humidity of the ambient air will not exceed specified limits. In very dry
environments, static charges build up very readily. Proper grounding of the equipment through
the AC power cord can help reduce the likelihood of static discharges, which may cause shocks
and damage electronic components.
Leave the computer’s enclosure or cover in place at all times during operation. The cover affords
protection against high voltages inside the computer and inhibits radio-frequency emissions that
might interfere with other equipment.
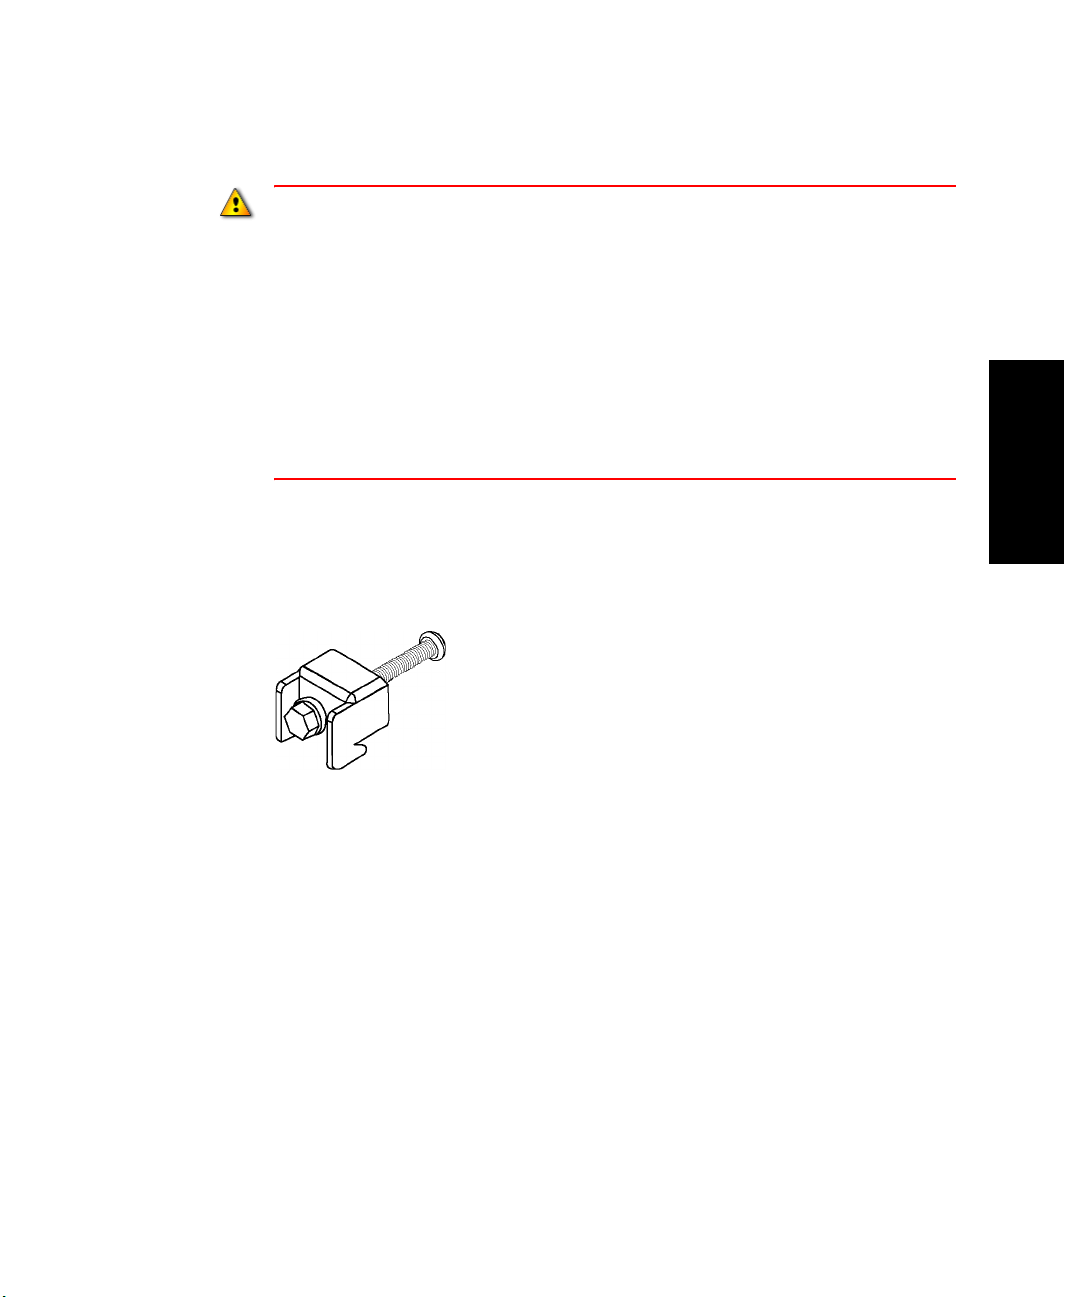
Mounting hardware
The VersaView Integrated Display Computer is shipped with 10 mounting clips, which
are used for mounting in a panel or enclosure.
• • • • •
2 • DISCRETE MPS HARDWARE INSTALLATION
2 • Installation
Tools required
In addition to the tools required to make the cutout, you will need a #2 Phillips
screwdriver.
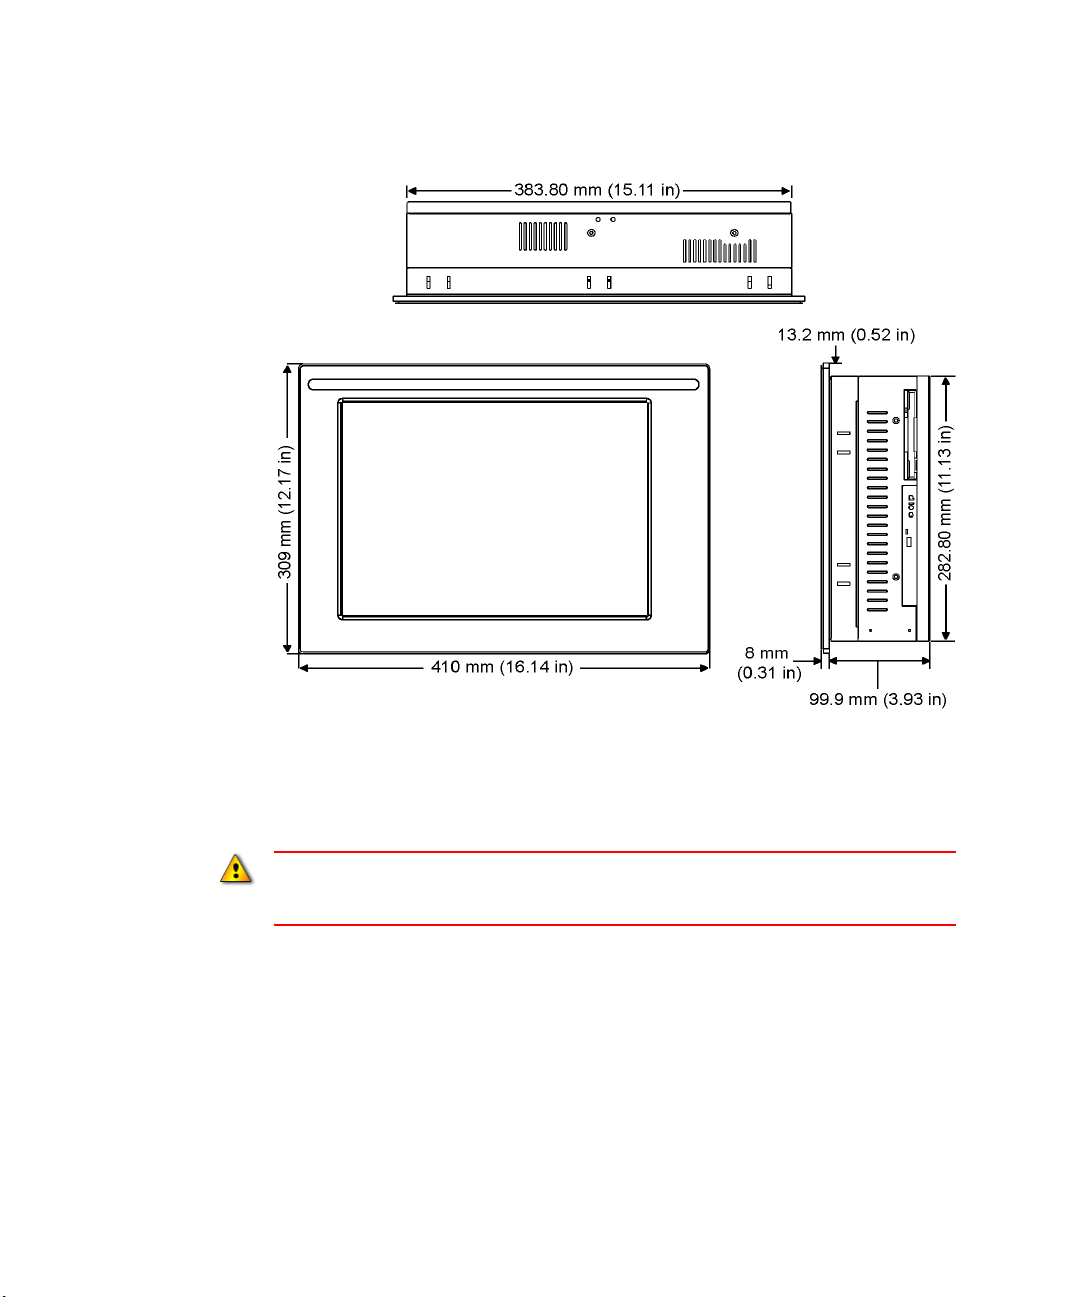
Mounting dimensions
The following figures show mounting dimensions for the VersaView Integrated Display
Computer. Dimensions are in mm [in]:
11
Page 18
DISCRETE MACHINE PERFORMANCE SOLUTION USER’S GUIDE
• • • • •
12
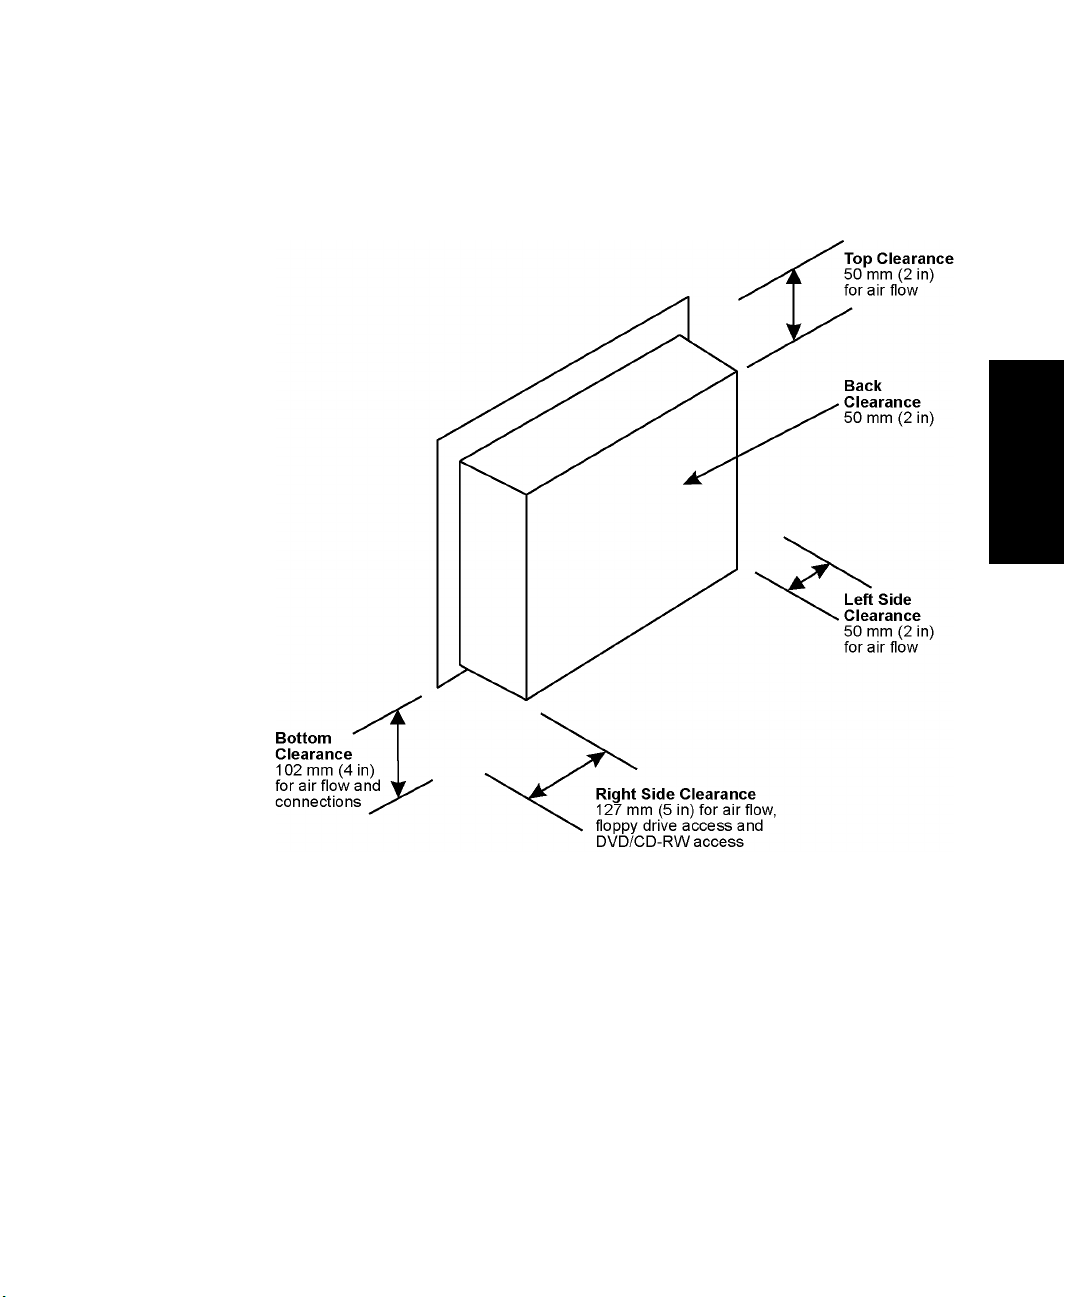
Mounting clearances
Allow adequate space for mounting, air flow, and maintenance. The figure below shows
recommended minimum clearances to other components within the rack or enclosure.
The VersaView Integrated Display Computer should not be operated within a confined space of
the dimensions shown below unless adequate ventilation or other cooling methods are used to
lower the air temperature within the enclosure.
Page 19
2 • DISCRETE MPS HARDWARE INSTALLATION
Mounting clearances for the Integrated Display Computer
• • • • •
2 • Installation
13
Page 20

DISCRETE MACHINE PERFORMANCE SOLUTION USER’S GUIDE
• • • • •
Panel cutout dimensions
Panel mounting guidelines
Observe the precautions below when installing the computer in a panel:
Confirm that there is adequate space behind the panel. A cabinet with a minimum
depth of 127 mm (5.0 in) is sufficient.
14
Supporting panels should be at least 14 gauge to ensure proper sealing against water
and dust and to provide proper support. The mounting hardware supplied
accommodates panels up to 6.25 mm (0.25 in) thick.
Supporting panels must be cut to specifications before installation.
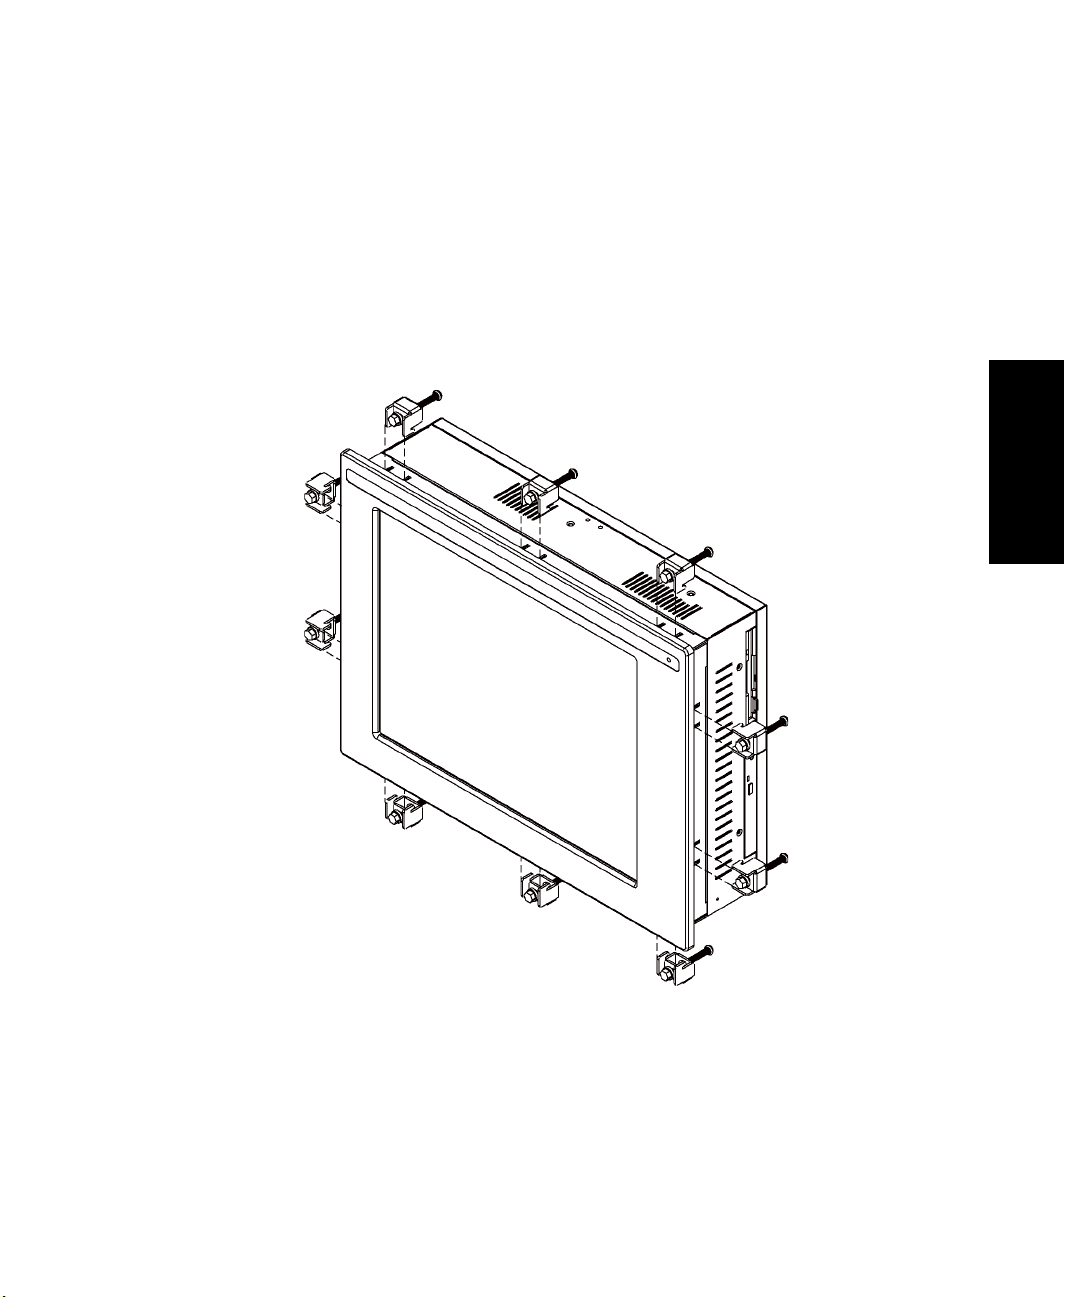
Installing computer in panel
To install the computer in a panel using mounting clips:
Disconnect all electrical power from the panel before making cutout.
Make sure area around the panel cutout is clear.
Take precautions so that metal cuttings do not enter any components that are already installed in
the panel.
Failure to follow these warnings may result in personal injury or damage to the panel
components.
Page 21
2 • DISCRETE MPS HARDWARE INSTALLATION
1. Cut an opening in the panel using the appropriate panel cutout dimensions provided
above.
2. Make sure the computer sealing gasket is properly positioned on the terminal. This
gasket forms a compression-type seal; do not use sealing compounds.
3. Place the computer in the panel cutout.
4. Install the mounting clips. The mounting clips slide into the slots on the top, bottom
and sides of the computer.
• • • • •
2 • Installation
15
Page 22
DISCRETE MACHINE PERFORMANCE SOLUTION USER’S GUIDE
• • • • •
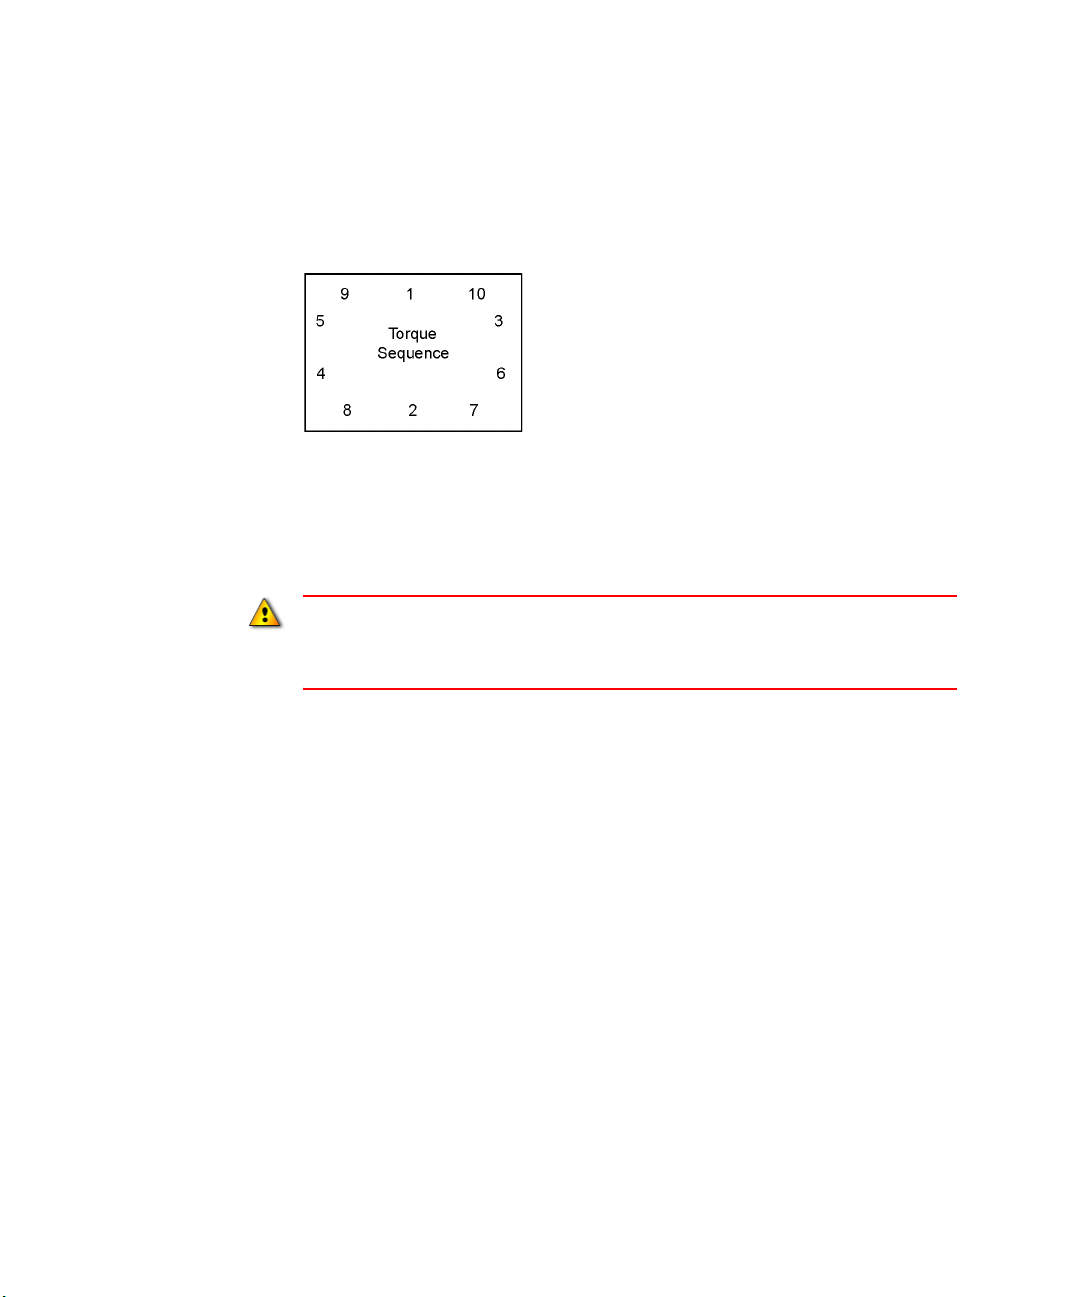
5. Gradually tighten the clips one at a time around the bezel using the specified
sequence. Note that the sequence begins with the center clips and continues to the
corner clips.
Repeat this process at least three times until the clips are hand-tight and the gasket is
compressed uniformly against the panel.
Tighten mounting clips to a torque of 10 in-lbs (1.1 N•m) in the sequence shown
above. Do not over-tighten.
Tighten mounting clips to a torque of 10 in-lbs (1.1 N•m) to provide a proper seal and prevent
damage to the VersaView computer. Rockwell Automation assumes no responsibility for
water or chemical damage to the terminal or other equipment within the enclosure because
of improper installation.
16
Connecting a keyboard and pointing device
A keyboard and pointing device can be plugged individually into the PS/2 port on the
bottom of the computer. There are separate PS/2 ports for the keyboard and the pointing
device.
Page 23

Connecting AC power
A standard IEC 320 power cord provides power to the VersaView Integrated Display
Computer. The power supply input will accept 120/240V AC. The power supply is
autoswitching. Ensure that sufficient power is available.
Select an electrical outlet carefully before plugging in your computer:
The power cord must be connected to an outlet having an earth ground (three-prong outlet).
Failure to follow this warning could result in severe electrical shock.
Installing computer in a panel, enclosure or rack that is already connected to earth ground will
satisfy this requirement. Otherwise, connect your computer to earth ground using a 16 AWG or
larger external wire.
The ground wire should have green insulation with a yellow stripe for easy identification.
The outlet should have its own disconnect. Do not plug the computer into an outlet that is
connected to the main electrical disconnect.
To prevent problems resulting from power surges or unexpected power failure, protect the outlet
with its own fuses or circuit breakers, as well as an Uninterrupted Power Supply (UPS) system.
• • • • •
2 • DISCRETE MPS HARDWARE INSTALLATION
2 • Installation
Always shut down the operating system prior to removing power. Failure to do so will cause
performance degradation and eventual failures in the operating system.
Connecting to a network
The VersaView Integrated Display Computer accommodates CAT5 twisted pair Ethernet
cabling with RJ45 connectors to support 100 Mbps network data transfer.
Performance degradation of your Ethernet communications is likely to result if the unit or cables
are subjected to extreme radiated or conducted high-frequency noise. It is the user’s
responsibility to properly route cables and condition input power in order to improve
communication reliability. Proper cable routing and power conditioning is required to ensure
reliable Ethernet communications in industrial environments. Rockwell Automation recommends
that all Ethernet cabling be routed through dedicated metal conduits. Installing ferrite bead filters
at cable ends may also improve reliability.
17
Page 24

DISCRETE MACHINE PERFORMANCE SOLUTION USER’S GUIDE
• • • • •
18
Page 25

3
Initial Operation and Setup
Chapter objectives
This chapter discusses initial setup procedures and operation of the system.
Operating guidelines
We recommend the following operating guidelines for the VersaView Integrated Display
Computer:
Avoid turning the system on and off frequently.
Always use the proper power down procedures as required by your operating system,
such as the Shut Down command in Microsoft® Windows.
Do not turn off the computer until a message appears telling you that it is safe to do so.
Do not operate the VersaView Integrated Display Computer with covers removed. An
electrical shock hazard exists. In addition, removing the covers will disrupt air flow
and may result in overheating. All covers are required to maintain EMI shield.
After shutting the system off, do not move the computer or turn it back on again until the hard
drive has come to a complete stop (it takes about 30 seconds).
Operator access
3 • Setup
Operator access is limited to the front panel of the VersaView computer. This includes the
display and touchscreen. Access to components behind the rack or panel in which the
computer is installed is restricted to authorized and properly trained personnel.
Boot-up sequence
To boot up the system:
1. Apply power to the VersaView computer. The computer performs a Power On Self
Test (POST) in which it tests the processor board, memory, keyboard, and certain
peripheral devices.
2. The computer displays the progress of the POST and initialization of accessory
devices.
19
Page 26

DISCRETE MACHINE PERFORMANCE SOLUTION USER’S GUIDE
• • • • •
3. If your system does not boot up, after previously booting successfully, refer to the
VersaView 6181P Integrated Display Computers User Manual for diagnostic and
troubleshooting information.
4. The computer will then display the startup dialogs for the operating system that has
been installed.
Initial configuration steps
During the first initial boot of the computer, several configuration windows are shown and
must be completed.
1. Initially, the Windows 2000 Professional splash screen is shown. A progress bar at the
bottom indicates startup progress.
2. A Windows 2000 Setup dialog box opens with the message “Please wait…” After
about 20 seconds this dialog will close automatically.
3. The Windows 2000 Professional Setup dialog box opens with the message “Welcome
to the Windows 2000 Setup Wizard.” Select Next to continue with the setup.
4. On the License Agreement dialog window, read the terms of the agreement. Select I
accept this agreement and then select Next to continue.
5. On the Regional Settings dialog window, customize the Windows locale setting and
keyboard layout if necessary. US English settings are the defaults; no changes are
necessary to select these. Select Next to continue.
20
6. On the Personalize Your Software dialog window, enter a Name and Organization that
the Windows Operating System will use as the identification for various operations.
Select Next to continue.
7. On the Computer Name and Administrator Password dialog window, enter the
Computer Name that has been assigned to identify this computer on the network and
enter the password to use for this computer's Administrator user account. Select Next
to continue.
After the Discrete MPS on-site services are completed, do not change the computer name
assigned to the computer. Changing the computer name will prevent the Discrete MPS from
functioning properly.
8. On the Date and Time Settings dialog window, set your local date, time and time zone
for the system clock. Select Next to continue.
Page 27
9. On the Workgroup or Computer Domain dialog window, assign the computer as a
member of the appropriate Domain or Workgroup for your network. Select Next to
continue.
If your computer is being placed on a domain you will be prompted for a network
administrator login.
After network configuration, the computer will automatically restart and attempt to log in
with the administrator user account.
After rebooting, complete any network configuration required for the computer. By
default, the computer is configured to obtain an IP address automatically (dynamically
obtain an IP address from a network server).
After the Discrete MPS on-site services are completed, do not change the password for the
administrator user account. Changing the password for the administrator user account will
prevent the Discrete MPS from functioning properly.
Using a touchscreen
The VersaView Integrated Display Computer is equipped with a touchscreen. The
touchscreen and the touchscreen controller are both factory installed and connected.
• • • • •
3 • INITIAL OPERATION AND SETUP
3 • Setup
Touchscreen serial port usage
The touchscreen controller for a VersaView computer connects internally to the COM2
serial port. The touchscreen is factory configured with the proper COM2 and touchscreen
driver settings, so no user configuration is required.
If for any reason these settings are corrupted, reset the COM2 serial port to 9600bps, 8
data bits, 1 stop bit, no parity.
Driver software
The touchscreen driver is already loaded on the computer. The driver software is also
provided on a floppy diskette.
The touchscreen utility defaults to COM1 serial port setting. You must change this setting to
COM2 when reloading the touchscreen driver.
Resistive touchscreen technology
Resistive touchscreens are activated by pressure applied to the touchscreen by an
operator’s finger. You can operate a resistive touchscreen while wearing gloves.
21
Page 28

DISCRETE MACHINE PERFORMANCE SOLUTION USER’S GUIDE
• • • • •
Resistive touchscreens consist of two layers:
A lower layer (glass substrate) with a resistive coating and a voltage applied.
An upper layer (cover sheet) with a conductive coating.
Clear spacer dots separate the two layers.
When a user presses the upper layer onto the lower layer, the upper layer receives the
voltage applied to the lower layer. The touchscreen controller detects the change in
voltage on the upper layer and alternates voltage horizontally and vertically through the
layers. The voltage transferred to the upper layer is proportional to the location of the
touch on the screen.
Do not use sharp instruments to activate the touchscreen. Scratching the surface of the
touchscreen can damage the unit.
Calibrating the touchscreen
The touchscreen supplied with the VersaView computer is factory installed and calibrated.
In the event that you need to recalibrate the touchscreen, use the following procedure:
To calibrate the touchscreen:
1. Locate the calibration utility in the Control Panel or insert the touchscreen driver
diskette in the floppy drive of the computer.
22
2. Using the appropriate commands for your operating system, run the calibration utility.
3. Follow the instructions in the calibration utility to complete the calibration process.
Page 29

4
Collecting Performance Data
Chapter objectives
This chapter provides an description of some of the concepts and configuration necessary
to collect performance data using the Discrete MPS.
The
Discrete MPS Configuration Workbook
for determining the information necessary to configure the Discrete MPS.
What is the OEE rating?
Discrete MPS uses an OEE (Overall Equipment Effectiveness) model to measure the
performance of manufacturing equipment. The OEE model yields a single performance
rating for every activity area (workcell, line, area, or plant) being monitored, thereby
providing a simple way to determine quickly if an activity area is performing adequately.
The OEE value can be used to assess a single machine’s performance over time or to
compare the performance of machines to each other.
Three components contribute to an OEE value: availability, throughput, and quality. Each
is a percentage, and the OEE value is the product of these three percentages, and therefore
is also a percentage.
Availability is the ratio of running time to available time. Available time may be defined
by a schedule or modified by planned downtime events such as preventive maintenance.
Available time may also be modified by events, such as being starved for parts or being
blocked by a downstream process.
Availability RunningTime AvailableTime⁄=
Excel file provides a step-by-step process and tips
4 • Performance Data
Throughput is the performance of a machine when it is running compared to its ideal
cycle time. The ideal cycle time will depend upon the product being produced and is
measured in units of seconds per part.
Throughput TotalParts IdealCycleTime×()RunningTime⁄=
Quality is the percentage of good parts that are produced.
GoodParts TotalParts Scrap–=
Quality GoodParts TotalParts⁄=
The OEE calculation that is used by Discrete MPS is the product of these three
components:
23
Page 30

DISCRETE MACHINE PERFORMANCE SOLUTION USER’S GUIDE
• • • • •
OEE Availability Throughput
RunningTime
OEE
-----------------------------------------
AvailableTime
× Quality×=
TotalParts IdealCycleTime×
---------------------------------------------------------------------------------
×
This reduces to:
OEE
IdealCycleTime GoodParts
----------------------------------------------------------------------------------=
AvailableTime
×
Discrete MPS gathers and stores all of the raw data necessary to make this calculation for
specific time periods, as well as by activity area, by part number, and by shift. All of the
individual components of the calculation are stored and available for analysis.
OEE is a valuable method of analyzing performance because it is widely recognized and
can be applied to any type of industry, factory, or machine. Further, Discrete MPS
supports the collection of detailed event data, which can be used to analyze the specific
causes of inefficiencies.
Refer to “Efficiency Analysis” on page 39 for a description of how to configure Discrete
MPS to determine OEE.
User-defined summarization criteria
A summarization criterion is a Discrete MPS Performance Parameter field for which
activity area data can be collected. When the value of the field changes, it triggers the
summarization of historical performance data for the activity area in the Discrete MPS
Workcell report data source. The collected values can then be used to filter OEE
performance data for the activity area. For example, if your system is configured to collect
Part ID (a default summarization criterion) for an activity area, you will be able to
calculate the OEE performance for the activity area when it is producing a particular kind
of part. In addition to the default summarization criteria — Shift, Part ID, and Ideal Cycle
Time — for which Discrete MPS can collect data values, you can configure up to five
user-defined summarization criteria, or flex fields, to represent the fields that are most
important to your organization. User-defined summarization criteria function just as the
default summarization criteria do, but, because they are user-defined, they allow you to
tailor Discrete MPS to meet your organization’s data collection and summarization needs.
RunningTime
GoodParts
------------------------------
×=
TotalParts
24
The following are sample uses of user-defined summarization criteria:
An Operator ID user-defined summarization criterion that will allow you to collect
operator IDs and to report on the OEE value for a specific operator.
A Lot Number user-defined summarization criterion that will allow you to collect lot
numbers and report on the OEE value for a specific lot of products.
Page 31

A Test/Production State user-defined summarization criterion that will allow you to
report on the OEE value for parts that were produced when the activity area was in a
Production state only.
Refer to “Summarization events” on page 47 for a description of how to configure
Summarization Criteria in the Discrete MPS.
Configuring a workcell availability calendar
Discrete MPS allows you to create the time patterns that will be used to calculate the
amount of available time for a workcell. It is not necessary for you to use a time pattern to
define available time for a workcell; however, if you do, the OEE calculation for the
activity area will not be negatively impacted by the periods of time when the workcell is
scheduled to be unavailable (e.g., weekends, evenings).
Time Patterns are created using the RSBizWare Production Client application. To define
Time Patterns you must login with the System Administrator user account.
An external keyboard and mouse must be connected to be able to configure a workcell
availability calendar.
• • • • •
4 • COLLECTING PERFORMANCE DATA
Step 1 • Define time patterns
A time pattern defines the availability of a workcell over time, which repeats as necessary
during the workcell schedule. We can define the duration of the repeating period as a Day,
Week, or Custom. A Day duration defines a time pattern for a 24-hour day, a Week
duration defines a time pattern for a standard 7-day week, and the Custom duration
defines a time pattern for an arbitrary duration, such as a 14-day cycle or an 8-hour shift.
A time pattern is composed of a default value and a series of time spans. The default value
defines the value of the time pattern during intervals where no time span is specified. Each
time span specifies a start time, end time, value (e.g., Available, Unavailable), and
optional report name for the span. The default value for the time pattern and the value for
the time span can be a named state, a numeric value, or another time pattern. Named states
are simply a set of values (e.g., 1, 0) to which you have applied descriptions (e.g.,
Available, Unavailable).
The ability to reference other time patterns allows us to build time patterns from other
time patterns.
As an example, below are the steps to define three shift time patterns, a Work Day time
pattern that is made up of the shifts, and a Work Week time pattern made up of five Work
Days.
25
4 • PerformancData
Page 32

DISCRETE MACHINE PERFORMANCE SOLUTION USER’S GUIDE
• • • • •
Our example schedule follows a time pattern that consists of three 8-hour shift periods —
each with a 30-minute break (Unavailable) — that make up the work day. This time
pattern applies Monday through Friday, and the facility is closed (Unavailable) during the
weekends. The example makes use of the Custom, Day, and Week duration options.
First, we must define the three shift time patterns.
1. Select Configure > Time Pattern... from the main menu to display the Time Patterns
dialog.
26
2. Right-click on a folder in the Time Patterns box at the left-hand side of the dialog and
select New Time Pattern from the shortcut menu that will display. A new time
pattern will display in the Time Pattern tree.
3. The default name of the time pattern (New Time Pattern) is highlighted to indicate
that it is ready to be changed. Enter the new name for the time pattern,
Shift A
and
press the Enter on your keyboard to accept the changes.
4. You will notice that the Default Value Type is set to State and the Default Va lu e is
set to Unavailable. This indicates that any periods of time that are not specified as
Available in the Time Spans list will be designated as unavailable.
5. Our shift times will be relative to the start and end times specified in the Work Day
time pattern, so clear the Lock Times check box above the Time Spans list.
Page 33

4 • COLLECTING PERFORMANCE DATA
6. We want our shift to last 8 hours. Click the browse button (...) next to the Duration
box. The Time Pattern Duration dialog will display.
• • • • •
7. Select the Custom option for Duration Type and enter a duration of
8 Hours
. Press
OK to return to the Time Patterns dialog.
8. In the Report Name box, enter
Shift A
. In the Shift number box, enter the shift
number that you want to use to refer to this shift when reporting on the Discrete MPS
data that is collected. For this example, enter
1
in the Shift box.
9. Right-click on the time span grid at the right and select New Time Span... from the
shortcut menu. The Time Span dialog will display.
4 • PerformancData
10. Make sure the Val u e Ty p e is set to
State
and the Va lu e is set to
Available
.
27
Page 34

DISCRETE MACHINE PERFORMANCE SOLUTION USER’S GUIDE
• • • • •
11. Specify this time span as starting at hour 0 and ending at hour 4. Remember that our
shift times are relative, so these times mean “start of shift” and “4 hours into shift
time.”
12. Click OK to save your changes and close the dialog.
13. Create a second time span. Set the Va lue to
4:30
starting at
and ending at 8.
Available
and specify this time span as
14. Click OK to save your changes and return to the Time Patterns dialog. Because we set
the Default Value of the time pattern to
spans is unavailable (i.e., shows a capacity of
Unavailable
0
in the time pattern chart).
, the half hour between time
15. Now we will make two copies of Shift A. To make a copy of the time pattern, right
click on
Shift A
in the Time Patterns box and select Duplicate from the shortcut
menu. The new copy of the shift is displayed in the tree. Change the name of the new
shift to Shift B. Create another copy of Shift A and name it Shift C.
28
16. Click on Time Pattern
window. Change its Report Name to
Shift B
to display its properties in the Time Patterns
Shift B
and its Shift number to 2 so that data
collected during times covered by this time pattern will be logged under this reporting
information.
17. Edit Time Pattern
number to
3
.
Shift C
to change its Report Name to
Shift C
and its Shift
Page 35

4 • COLLECTING PERFORMANCE DATA
W
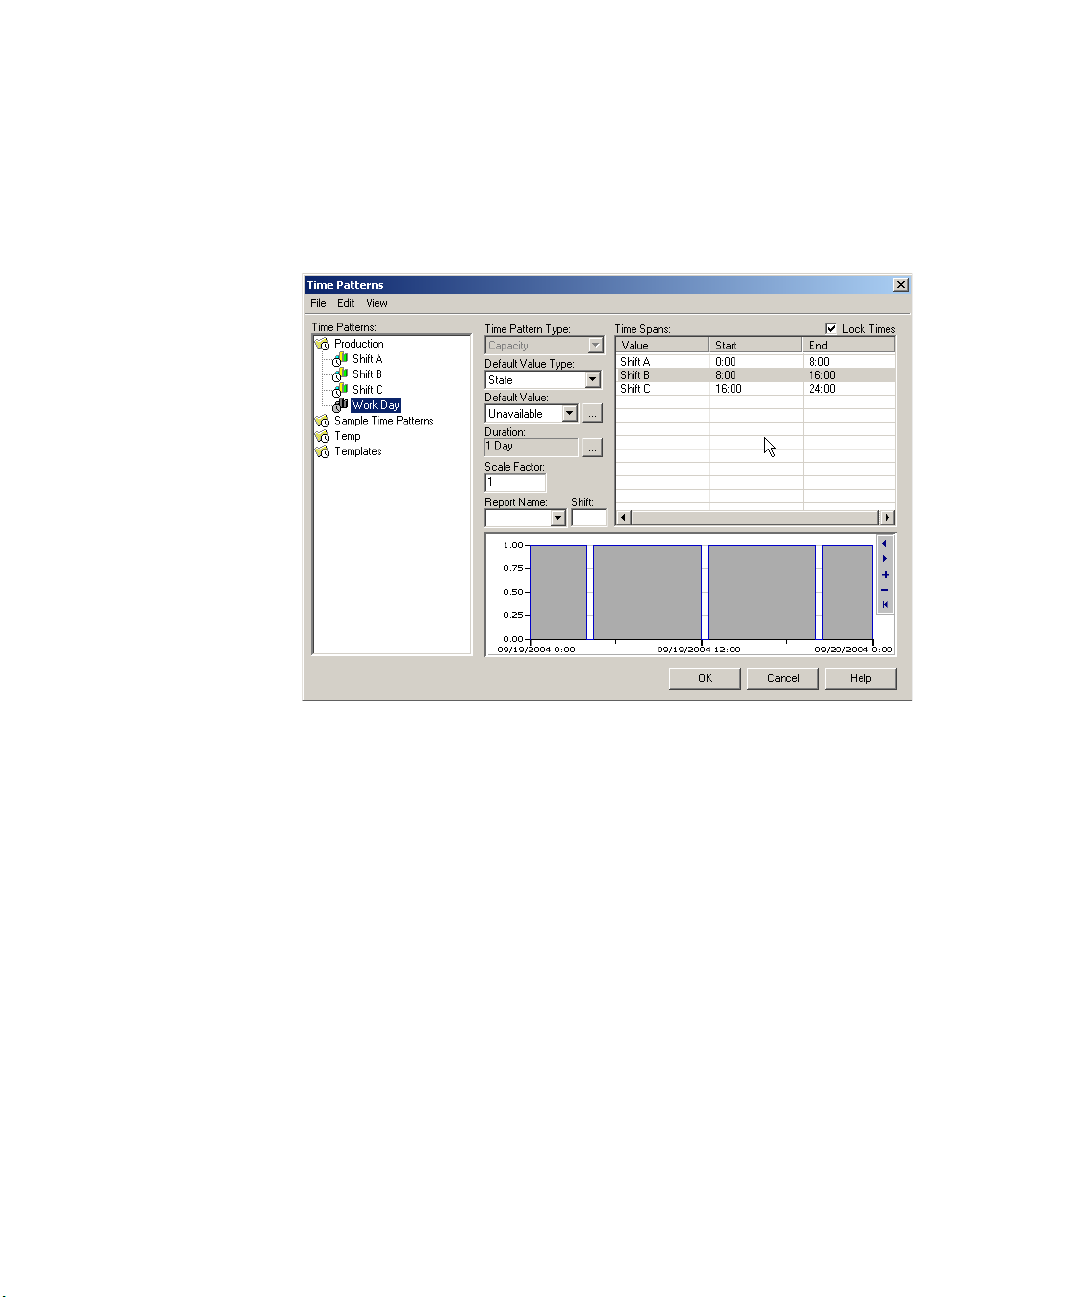
ORK DAY TIME PATTERN
Now that we have built our shift time patterns, we can use them to build the Work Day
time pattern.
• • • • •
1. With the Time Patterns dialog open, create a new time pattern and name it
Work Day
2. Leave the Report Name and Shift fields blank; data will be recorded using the report
information defined in the individual shift time patterns that we will reference in the
time spans.
3. Create a time span for the first shift in this time pattern. In the Time Span dialog,
select Time Pattern from the Va lue Ty p e drop-down and Shift A from the Va lue
drop-down. The Time Span dialog uses the 0 hour to represent 12:00 midnight. Set
the Start time to
0
(midnight) and the End time to 8 (8:00 AM). The Shift A time
span should look like the example below:
.
4 • PerformancData
4. Press OK to save your changes and close the dialog.
5. Create a time span for Shift B. Start the shift at 8. We want this time span to end at
4:00 PM, and because times must be entered in a 24-hour format, specify this time
span as ending at 16.
29
Page 36
DISCRETE MACHINE PERFORMANCE SOLUTION USER’S GUIDE
• • • • •
6. Create a time span for Shift C. Start the shift at 16 and end it at 24.
After you have completed these steps, the Work Day time pattern should look like the
example below:
30
W
ORK WEEK TIME PATTERN
Now that we have built our Work Day time pattern, we can use this to build the Work
Week time pattern.
1. With the Time Patterns dialog open, create a new time pattern and name it
.
Week
Work
2. Click the browse button (...) next to the Duration box. The Time Pattern Duration
dialog will display.
3. Change the time pattern duration to 1 Week and press OK to return to the Time
Patterns dialog.
4. Create the first time span for this work week. Select Time Pattern from the
Va lu eTyp e drop-down, and select the time pattern named Work Day for the Va lue .
Enter the first time span as starting on
Tuesday
on
at 0 (Tuesday at midnight).
Monday
at 0 (Monday at midnight) and ending
5. Repeat this for Tuesday, Wednesday, Thursday, and Friday.
Page 37

4 • COLLECTING PERFORMANCE DATA
After you have completed these steps, the Work Week should look like the example
below:
• • • • •
Take a few minutes to look at the other time patterns that are provided with the sample
data. These samples will illustrate how to create other types of time patterns.
6. Press OK to save the changes that you have made and close the Time Patterns dialog.
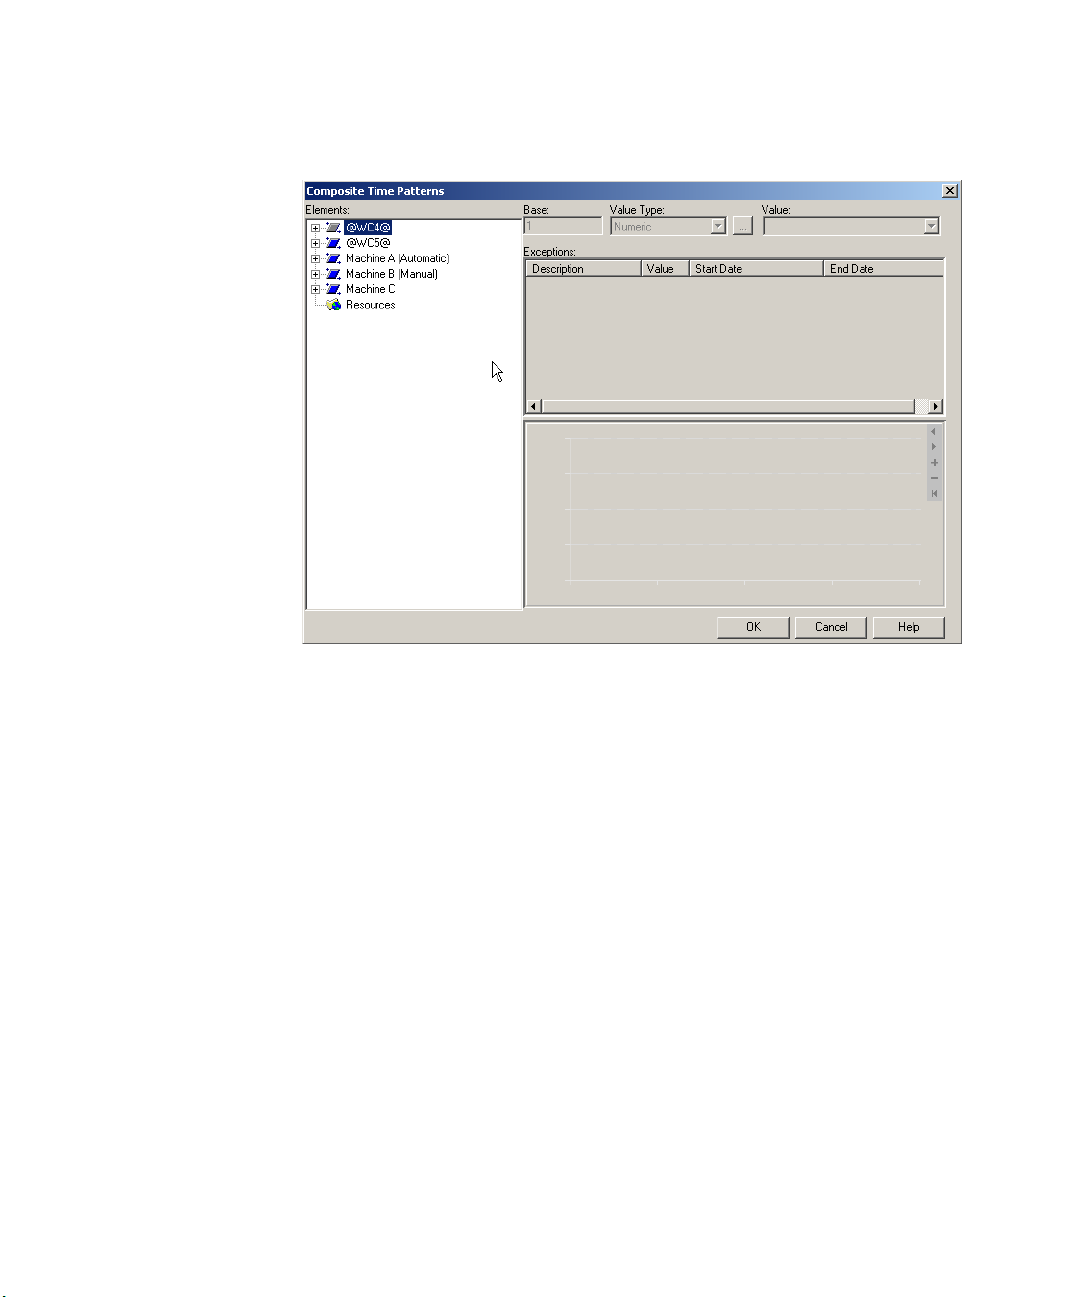
Step 2 • Configure Composite Time Patterns
A composite is a base time pattern that is associated with a workcell. The time pattern
defines the normal schedule for the workcell and the composite may have exceptions that
define any changes to the normal schedule.
As an example, below are the steps to assign the time pattern Work Week as the base time
pattern for the workcells.
1. Select Configure > Composite Time Pattern... from the main menu. The Composite
Time Patterns dialog will display.
31
4 • PerformancData
Page 38
DISCRETE MACHINE PERFORMANCE SOLUTION USER’S GUIDE
• • • • •
32
2. In the Elements tree at the left of the dialog, find the Discrete MPS workcells that have
been defined. Click on the Capacity tree item under a workcell.
3. To define a workcell’s capacity, we must assign a time pattern to the workcell. Select
Time Pattern from the Value Type list box and Work Wee k from the Va lu e list.
Page 39

4 • COLLECTING PERFORMANCE DATA
• • • • •
Note: You are associating a time pattern with one workcell only. If you want to associate the
time pattern with all the workcells, you will need to make this association with each workcell
separately.
Step 3 • Schedule exceptions
A Composite Time Pattern may have exceptions that define irregular, but expected,
changes to the normal schedule. These exceptions may be outages (unavailable times)
such as holidays or planned maintenance periods, or additional available times such as
overtime hours or extended seasonal hours.
As an example, below are the steps needed to schedule an exception for New Year’s Day.
1. Display the Composite Time Patterns dialog. Expand the tree for the first workcell and
click on the Capacity entry. Right-click on the Exceptions grid and select New...
from the shortcut menu to display the Exceptions dialog.
2. Enter
3. Select State from the Value Ty p e box and Unavailable from the Va lu e box.
4. Specify this exception as starting on January 1, 2005 at 0 and ending on January 2,
New Year’s Day
2005 at 0.
in the Description box.
33
4 • PerformancData
Page 40

DISCRETE MACHINE PERFORMANCE SOLUTION USER’S GUIDE
• • • • •
34
5. You will notice that the first workcell is listed in the Application box on the lower
right side of the dialog. This indicates that you are creating this exception for this first
workcell only. This does not mean that the exception applies to the other workcells.
If you want to apply this exception to another workcell, highlight the name of the
workcell in the Elements box on the left and click the arrow button (>) to move the
individual workcell.
6. Press OK to save your changes and return to the Composite Time Patterns dialog.
7. Press OK to save your changes and close the dialog.
Page 41

5
Discrete MPS Configurator Application
Chapter objectives
This chapter provides an overview of the Discrete MPS Configurator Application. The
Configurator Application is used to configure the Discrete MPS to collect and display
process data.
Exploring the user interface
When you start the Configurator, you will notice that the user interface is made up of three
main sections: the Configuration Explorer, the Configuration Work Area, and the
Configuration Status Bar.
The Configuration Explorer
The Configuration Explorer is a hierarchical navigation tool used to organize the Discrete
MPS configuration properties. It contains the following items: five workcells, General
Settings and String Localizations.
35
5 • Configurator
Page 42

DISCRETE MACHINE PERFORMANCE SOLUTION USER’S GUIDE
• • • • •
The Configuration Work Area
When you click on an item in the Configuration Explorer, the specified configuration
screen will display in the work area to the right of the Configuration Explorer.
The work area is the region where configuration users can create and modify workcell
properties.
The Configuration Status Bar
The current configuration name and general information about the available tags and the
used tags are displayed in the Configuration Status Bar.
An external keyboard and mouse must be connected to be able to use the functionality provided
by the Configurator.
Main screen
36
The Main Screen has several buttons that perform Configurator application functions.
Click the:
New button to create a new configuration. Click Ye s in the confirmation dialog box to
clear any unsaved modification in the open configuration.
Page 43

Open… button to load an existing configuration. The standard Windows file open
dialog box will appear. Choose between the XML and the Binary file format. Select
the file and click the Open button.
Save button to save the current configuration to disk. The configuration will be saved
in both the XML and Binary format.
Save As… button to save the current configuration with a different name. The
standard Windows save dialog box will appear. Enter a file name and click the Save
button.
Generate button to start the Discrete MPS application generator. The Discrete MPS
application generator will move the information stored in the current configuration to
the Discrete MPS user interface and to the Discrete MPS database. Make sure that
RSView is open and that the Discrete MPS application is loaded. Click the Yes button
in the confirmation dialog box to proceed.
Close button to exit from the application.
General settings
General Settings are common to all workcells.
• • • • •
5 • DISCRETE MPS CONFIGURATOR APPLICATION
37
5 • Configurator
Page 44

DISCRETE MACHINE PERFORMANCE SOLUTION USER’S GUIDE
• • • • •
1. Select the OPC Server from the OPC Server list. RSLinx is the preferred choice to
connect to Allen Bradley PLCs.
2. A Product ID and up to five other summarization events may be defined for the
workcells. Refer to “User-defined summarization criteria” on page 24 for information
about summarization events. Enter a Summary Event Description for all summary
event values that will be managed in the system configuration.
Note: The Summary Event Descriptions are displayed on the Operator Interface displays
and on the reports.
Workcells
1. Select any of the five available workcells in the Configuration Explorer to display the
main workcell display in the Configuration Work Area.
38
2. Check Enable Workcell and assign a Workcell Description to the selected workcell.
To show the configuration properties of the selected workcell, click the plus sign (+)
on the left of the workcell name in the Configuration Explorer.
Note: The Workcell Description is displayed in the Configurator, on the Operator Interface
displays and on the reports.
Page 45

Efficiency Analysis
1. Select Efficiency Analysis in the Configuration Explorer to display the Efficiency
Analysis screen in the Configuration Work Area:
• • • • •
5 • DISCRETE MPS CONFIGURATOR APPLICATION
2. The Configuration Work Area is divided in four sections. Each section contains a
different data category: Part Counters, Ideal Cycle Time, Availability Status, and
Running Status.
Part Counters
The Part Counters are part of the “Throughput” and “Quality” values in the OEE equation.
They indicate how many parts were produced by the workcell. Discrete MPS does not
care what unit is the measure of the Part Count value, because it is just comparing the rate
of items produced to the value given for the ideal cycle time. It is not necessary to collect
all three count values; however, at a minimum, you must collect the good part count or be
able to calculate good part count from the part counts that you collect.
Check:
Total Parts Counter to collect the total number of parts produced by the workcell.
Enter a description for the produced units (i.e., bottles, screws, liters…) and enter the
PLC address of the total parts counter.
39
5 • Configurator
Page 46

DISCRETE MACHINE PERFORMANCE SOLUTION USER’S GUIDE
• • • • •
Good Part Counter to collect the total number of good parts produced by the
workcell. Enter a description for the good produced parts (i.e., good bottles, good
screws…) and enter the PLC address of the good parts counter.
Bad Part Counter to collect the total number of bad parts produced by the workcell.
Enter a description for the bad produced units (i.e., scrap bottles, bad screws…) and
enter the PLC Address of the bad parts counter.
Ideal Cycle Time
The Ideal Cycle Time is part of the “Throughput” value in the OEE equation. It indicates
the length of time, in seconds, between sequentially produced parts when the machine is
running at maximum speed. If the workcell is producing parts slower than the ideal cycle
time, the OEE rating will be negatively impacted.
Select the:
Constant radio button and enter a value if the Ideal Cycle Time does not change.
Manual radio button and enter a default value to allow the line operator to enter the
Ideal Cycle Time manually, according to the operating mode of the machine.
Automatic radio button and enter a PLC address if the Ideal Cycle Time is available
in the control system.
40
Availability Status
The Availability Status is part of the “Availability” value in the OEE equation. This status
is the Monitored Availability, which indicates when the workcell is supposed to be
available to produce parts.
Select:
Manual and enter a default value to allow the line operator to select the Availability
Status through the Discrete MPS Operator Interface.
Automatic and enter a PLC address to collect the Availability Status directly from the
control system.
Discrete MPS applies the Boolean “AND” operator to the Scheduled Availability (refer to
“Collecting Performance Data” on page 23) and the Monitored Availability for a workcell
to determine the Availability value that is used in the OEE rating. This means that the
workcell is considered Available ONLY if both Scheduled Availability and Monitored
Availability indicate an Available state.
Page 47

Running status
The Running parameter allows the control system to indicate when the workcell is
actually producing parts.
1. Select Manual and select a default value to allow the line operator to select the
Running Status through the Discrete MPS Operator Interface.
2. Select Automatic and enter a PLC address to collect the Running Status directly from
the control system.
Digital Events
By defining digital events, you can direct Discrete MPS to monitor specific bits in the
plant control system, and maintain historical records on the behavior of those data points.
This feature is extremely powerful to collect extra data that you would like to associate
with the existing performance data. Digital Events will help you to investigate the root
causes of poor performances of a workcell.
A digital event is activated when the corresponding PLC tag goes high.
1. Select Digital Events in the Configuration Explorer to open the Digital Events
Configuration screen in the Configuration Work Area.
• • • • •
5 • DISCRETE MPS CONFIGURATOR APPLICATION
2. Check Digital Events in the Configuration Work Area to enable the digital events
collection. The table containing the list of the defined digital events will be displayed.
5 • Configurator
41
Page 48

DISCRETE MACHINE PERFORMANCE SOLUTION USER’S GUIDE
• • • • •
3. Click the Add button to insert a new digital event, click the Remove button to delete
the selected digital event.
4. Click on the right arrows of the Category to choose a category for the digital event.
Select New Category to create a new category.
5. Click on Description to modify the description for the digital event.
6. Click on the PLC Address to modify the PLC address for the digital event.
Multistate Events
A multistate event is used to codify a set of events with an integer number. This number is
used as an index to an Event Lookup Table to retrieve the full description of the events.
The multistate events are especially useful to represent the status of a machine.
42
1. Select Multistate Events in the Configuration Explorer to open the Multistate Events
Configuration screen in the Configuration Work Area.
2. Check Multistate Events in the Configuration Work Area to enable the multistate
events collection. The table containing the list of the defined multistate events and the
Event Lookup Table will be displayed.
3. Click the Add button to insert a new multistate event, click the Remove button to
delete the selected multistate event. You can define up to five multistate events for
each workcell.
Page 49
4. An Event Lookup Table is created for every defined multistate event. Select a
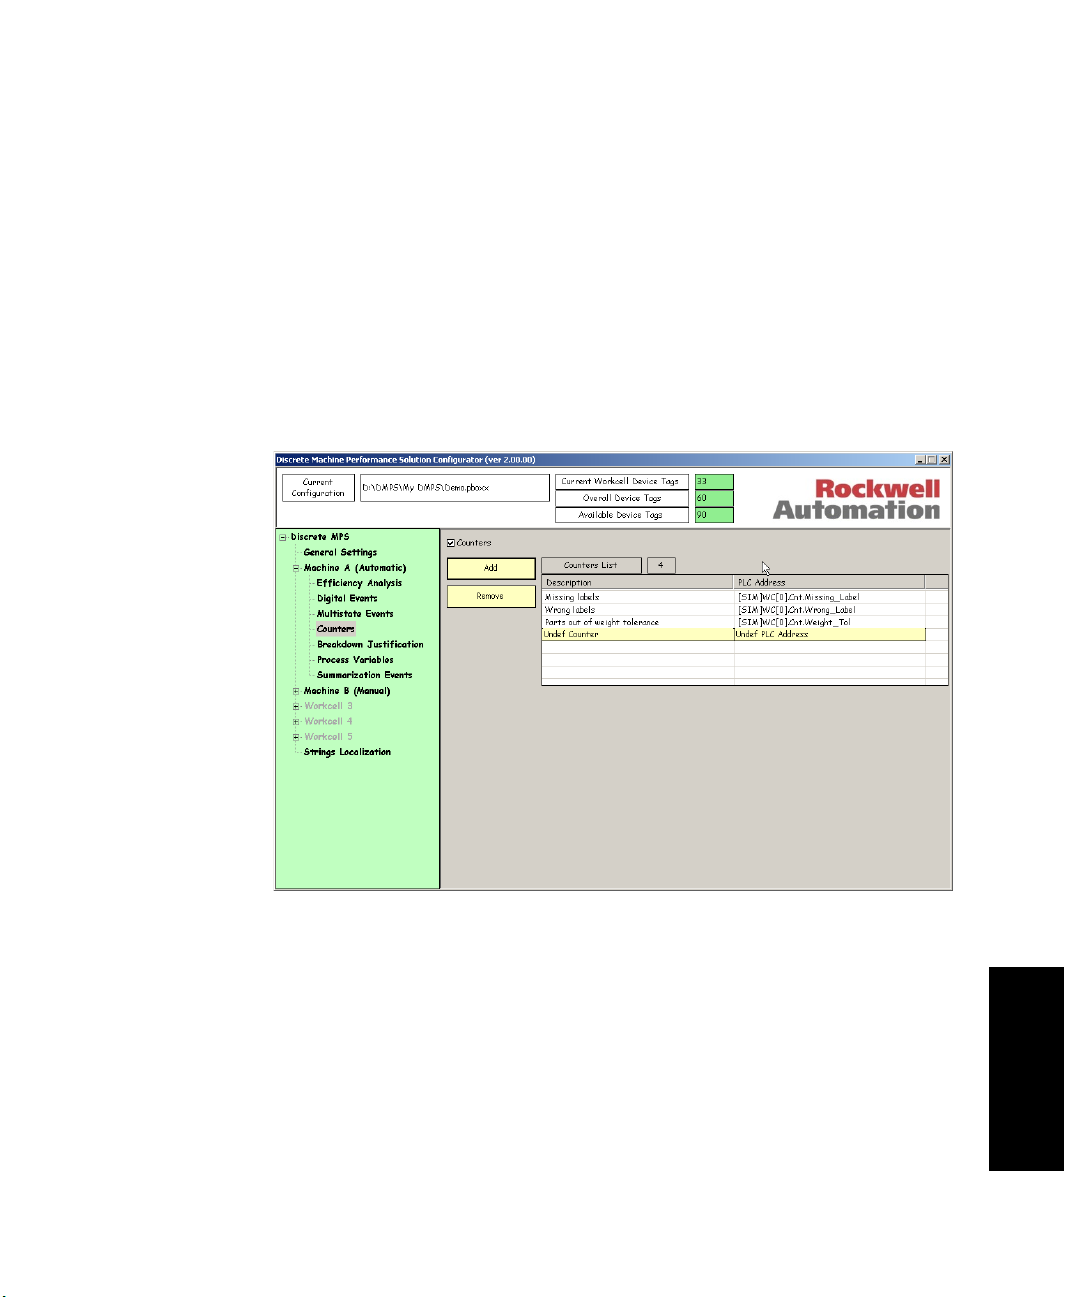
Counters
A counter is used to keep track of the number of occurrences of an event. Discrete MPS
can read a counter directly from the PLC and store its increasing value in the database.
• • • • •
5 • DISCRETE MPS CONFIGURATOR APPLICATION
multistate event. The corresponding Event Lookup Table will appear in the bottom
part of the Multistate Event Configuration Screen. Click the Add button to append a
new line to the Event Lookup Table. Click the Insert button to create a new line in the
Event Lookup Table before the selected row. Click the Remove button to delete the
selected line from the Event Lookup Table.
1. Select Counters in the Configuration Explorer to open the Counters Configuration
screen in the Configuration Work Area.
2. Check Counters in the Configuration Work Area to enable the counters collection.
The table containing the list of the defined counters will be displayed.
3. Click the Add button to insert a new counter. Enter the address of the PLC tag where
the counter is located.
4. Click the Remove button to delete the selected counter.
5 • Configurator
43
Page 50

DISCRETE MACHINE PERFORMANCE SOLUTION USER’S GUIDE
• • • • •
Breakdown Justification
Assigning a justification to a breakdown is a typical issue in the analysis of the
performance of an industrial plant. Typically control systems alone are not able to provide
operators and production managers with complete information about breakdowns and
stoppages of the machines.
When a breakdown is recognized by the control system, the Discrete MPS allows a
justification for the breakdown to be assigned.
The Discrete MPS collects information on breakdowns using two different input values:
A binary signal, always generated by the control system, which indicates the
presence of a breakdown
A code automatically generated by the PLC or manually entered by the operator,
which contains the breakdown justification.
Manual Justification
1. Select Breakdown Justification in the Configuration Explorer to open the
Breakdown Justification Configuration screen in the Configuration Work Area.
44
Page 51
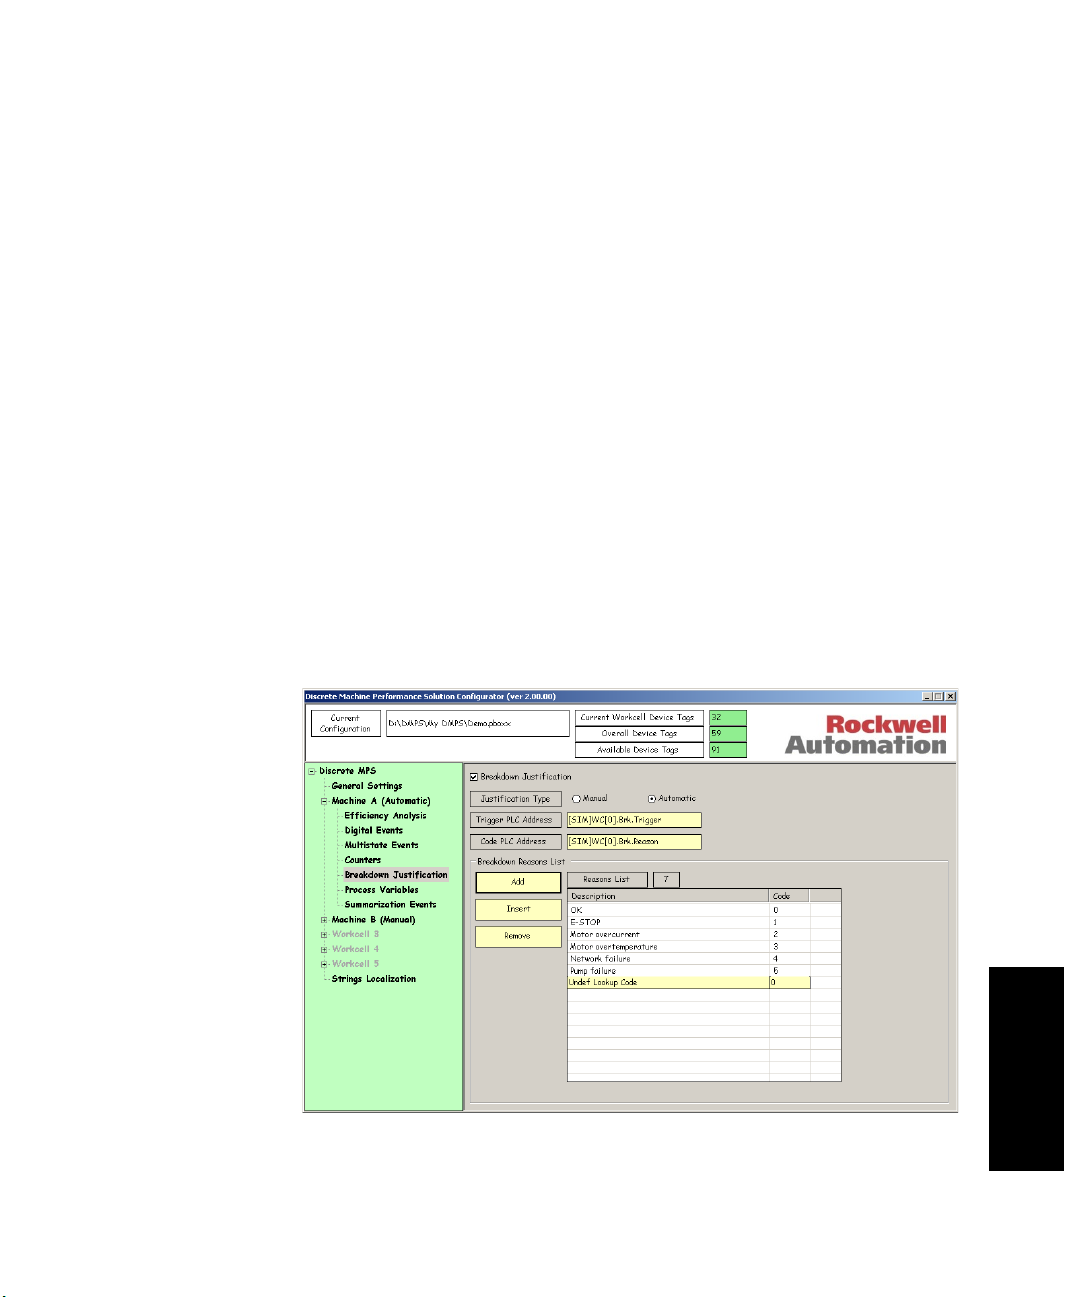
5 • DISCRETE MPS CONFIGURATOR APPLICATION
2. Check Breakdown Justification in the Configuration Work Area to enable the
Breakdown Justification collection. The table containing the list of the defined
justifications will be displayed.
3. Select the Manual radio button as the Justification Type to allow the operator to
manually enter the breakdown reason. Enter the Trigger PLC Address which
indicates the presence of a breakdown when the value makes a low-to-high transition.
You can also check Manual Reset and specify the PLC address for the Discrete MPS
to notify the PLC that a breakdown justification reason has been manually selected.
4. Click the Add button to append a new line to the Breakdown Reasons List. Click the
Insert button to create a new line in the Breakdown Reasons List before the selected
row. Click the Remove button to delete the selected line from the Breakdown Reasons
List. Up to 20 reasons can be defined for manual selection.
5. Enter a description for every Breakdown Reason in the Breakdown Reasons List. A
unique numeric code will be internally generated to identify every Breakdown
Reason.
Automatic Justification
1. Select Breakdown Justification in the Configuration Explorer to open the
Breakdown Justification Configuration screen in the Configuration Work Area.
• • • • •
45
5 • Configurator
Page 52

DISCRETE MACHINE PERFORMANCE SOLUTION USER’S GUIDE
• • • • •
2. Check Breakdown Justification in the Configuration Work Area to enable the
Breakdown Justification collection. The table containing the list of the defined
justifications will be displayed.
3. Select the Automatic radio button as the Justification Type to collect the justification
code directly from the PLC. Enter the Trigger PLC Address (see “Manual
Justification” on page 44) and the Code PLC Address which provides the value
representing the Breakdown Reason.
4. Click the Add button to append a new line to the Breakdown Reasons List. Click the
Insert button to create a new line in the Breakdown Reasons List before the selected
row. Click the Remove button to delete the selected line from the Breakdown Reasons
List. Up to 200 reasons can be defined for automatic selection.
5. Enter a description for every Breakdown Reason in the Breakdown Reasons List and a
numeric code value to match the code generated by the PLC in the Code PLC
Address for that specific Breakdown Reason.
Process Variables
In some circumstances, process variables can have a significant impact on the
performance of a workcell. Temperature, pressure and viscosity could impact the speed
and the reliability of industrial assets. For this reason, the Discrete MPS Operator
Interface provides line operators with the plot of the real time trends of selected process
variables. Discrete MPS will log the selected process variables to the Discrete MPS
database. Reports are available to display the historical trend of the monitored process
variables.
46
To select the process variables to be monitored:
1. Select Process Variables in the Configuration Explorer to open the Process Variables
Configuration screen in the Configuration Work Area.
Page 53
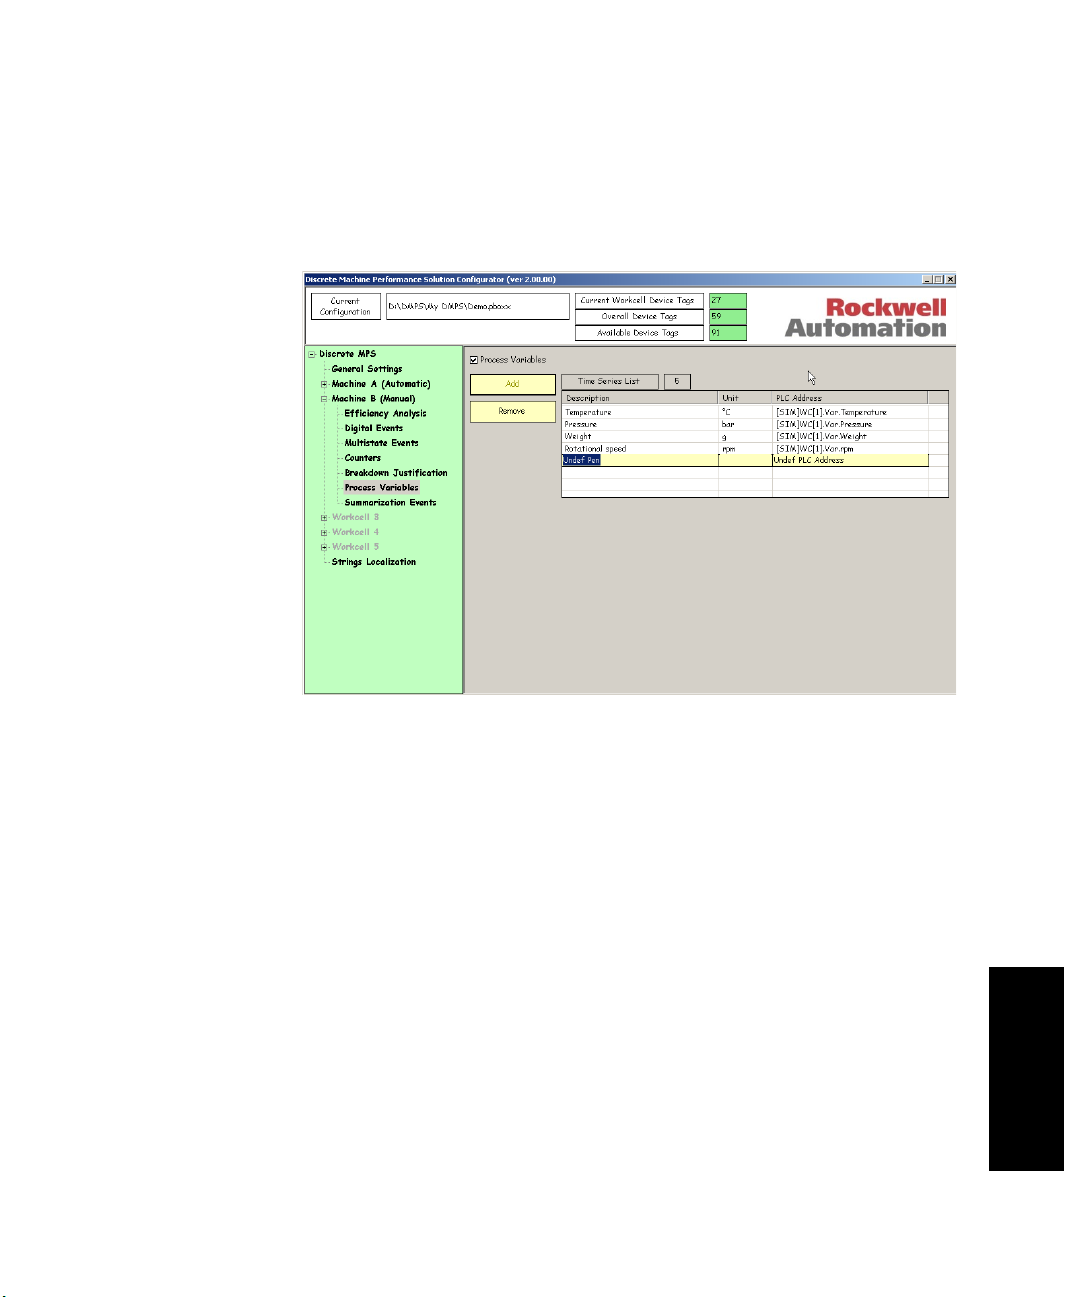
5 • DISCRETE MPS CONFIGURATOR APPLICATION
2. Check Process Variables in the Configuration Work Area to enable the Process
Variables collection. The table containing the list of the defined process variables will
be displayed.
• • • • •
3. Click the Add button to append a new line to the Process Variables List. Click the
Insert button to create a new line in the Process Variables List before the selected row.
Click the Remove button to delete the selected line from the Process Variables List.
You can configure up to five process variables.
4. Enter a description, a unit of measure, and a PLC address for every Process Variable in
the Process Variables List.
Summarization events
Refer to “User-defined summarization criteria” on page 24 and to “General settings” on
page 37 for general information about summarization events.
Summarization events can be generated either by the plant control system or by the line
operator who can trigger the event manually with the Discrete MPS Operator Interface.
Six summarization events can be configured:
The first five events are generated by a change in a text string. The first event is
reserved for storing a Product ID.
The sixth event is generated by a change in a numerical value.
5 • Configurator
47
Page 54
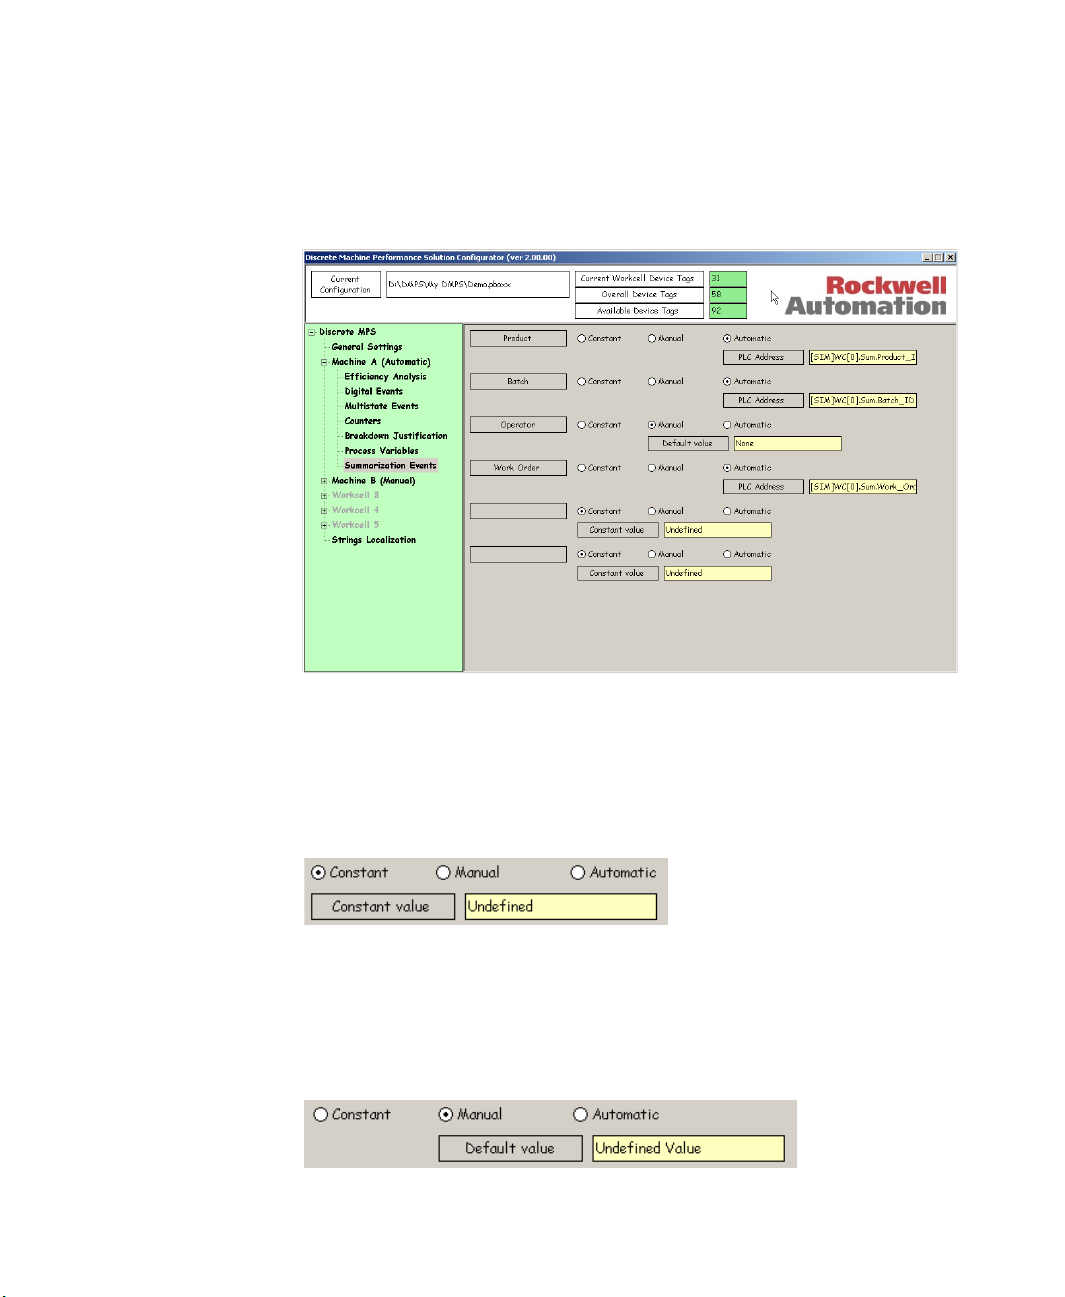
DISCRETE MACHINE PERFORMANCE SOLUTION USER’S GUIDE
• • • • •
1. Select Summarization Events in the Configuration Explorer to open the
Summarization Event Configuration screen in the Configuration Work Area.
48
2. Select the trigger mode for each of the six summarization events.
Constant means that the same value is always logged to the database. The Discrete
MPS will not detect any change and will not generate any summarization event. The
Constant option can be used to disable the summarization event. Enter a value in the
Constant value input field.
Manual means that the Operator Interface generates the summarization event when
the line operator enters a new value on the Workcell Summarization Display. Refer to
“Discrete MPS Operator Interface” on page 57 for a description of the Workcell
Summarization Display. The value entered in the Default value input field will appear
on the Workcell Summarization Display at startup.
Page 55

Automatic means that the plant control system updates the value of the
summarization event automatically. Enter the PLC Address of the summarization
event value.
Strings Localization
The Discrete MPS Operator Interface can be completely localized in the native language
and terminology of the system users. A translation of every message or description that is
part of the Discrete MPS interface can be entered into the Discrete MPS Configurator.
1. Select String Localization in the Configuration Explorer to open the String
Localization screen in the Configuration Work Area. The list of all the strings of the
Discrete MPS Operator Interface will be displayed.
• • • • •
5 • DISCRETE MPS CONFIGURATOR APPLICATION
2. For each of the English terms listed in the Description column, enter the actual text to
be used by the system in the Translation column.
49
5 • Configurator
Page 56

DISCRETE MACHINE PERFORMANCE SOLUTION USER’S GUIDE
• • • • •
Generating the application
After all of the configuration steps described in this chapter are completed, the saved site
configuration data must be used to generate the Discrete MPS system configuration.
To complete the customization process, run the Discrete MPS Configurator on the
VersaView Integrated Display Computer:
1. If the configuration data has not already been loaded, open the saved configuration
file. Make sure the file is accessible through the network or use a floppy disk to move
the configuration file to the Discrete MPS VersaView Integrated Display Computer.
Refer to “Main screen” on page 36 for a description of performing basic file
operations.
50
2. Click the Generate button to begin the generation of the Discrete MPS system
configuration. The Configurator will prompt you to run the Rockwell Software
RSView software and have the Discrete MPS application loaded.
Page 57
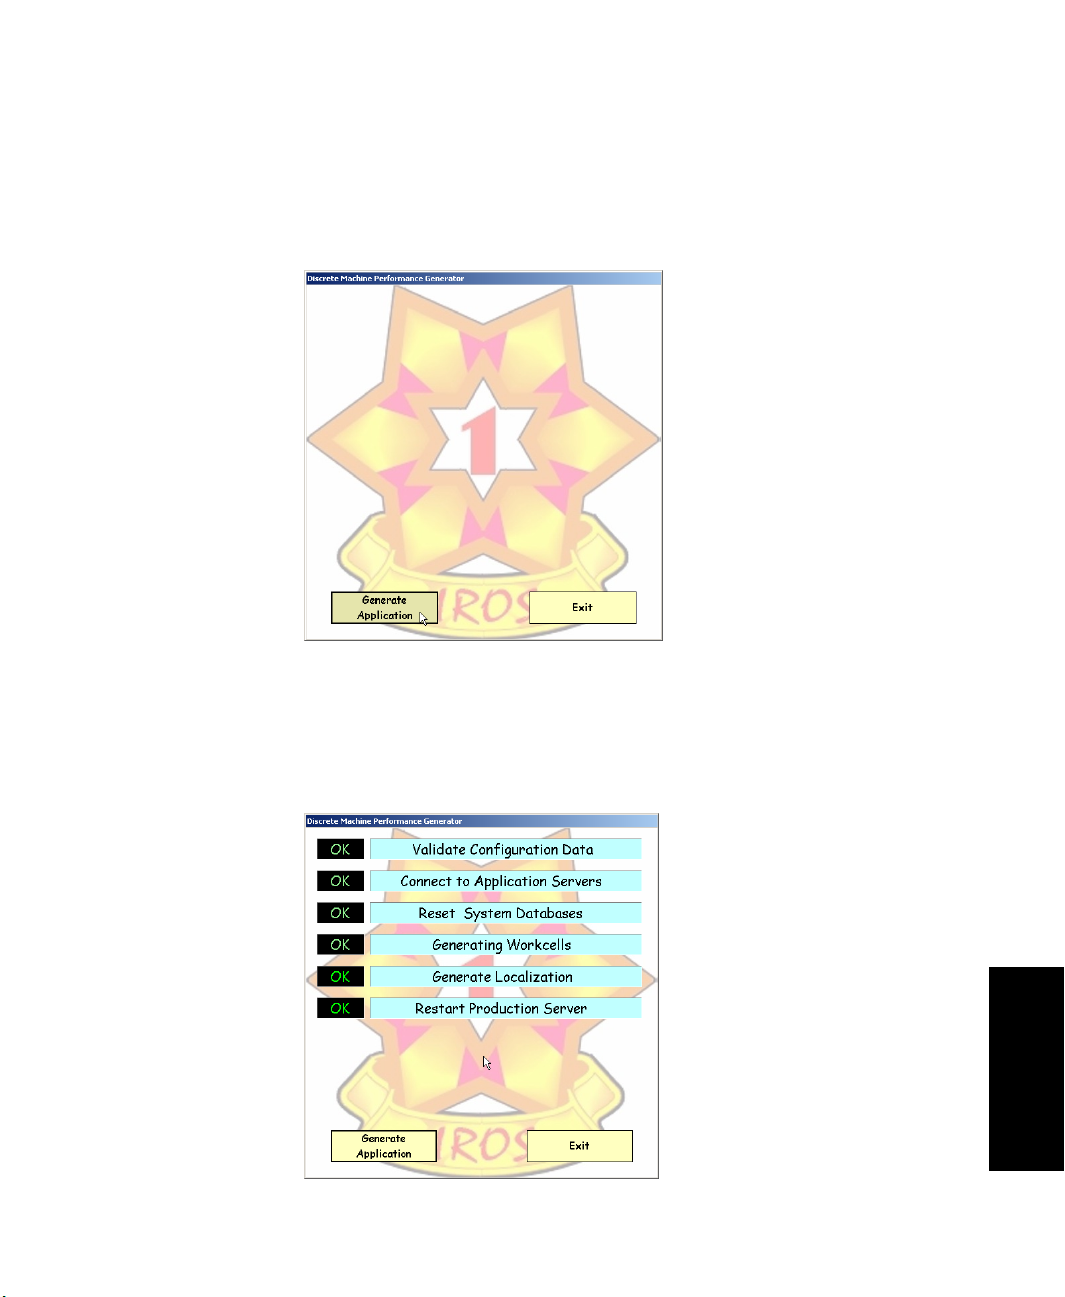
5 • DISCRETE MPS CONFIGURATOR APPLICATION
3. Make sure that RSView is running and the Discrete MPS application is loaded. Click
the OK button. The Configurator is ready to generate the Discrete MPS system
configuration.
• • • • •
4. Click the Generate Application button. The Configurator will step through all of the
configuration steps required to generate the system configuration. The status to the left
of a step will display OK if the step was completed successfully, or Fail if the step
fails. If an error occurs, note any messages that are displayed and retry generating the
system configuration.
51
5 • Configurator
Page 58

DISCRETE MACHINE PERFORMANCE SOLUTION USER’S GUIDE
• • • • •
When the application is generated successfully, the system will display a confirmation
message.
52
Workcell Description changes
If a Workcell Description was changed in the configuration, the RSBizWare Production
Client application must be used to manually edit the OEEBox Detail report and the
OEEBox Overview report section for that workcell — to re-assign the correct Workcell
Description to the report.
An external keyboard and mouse must be connected to be able to manually edit reports using
the RSBizWare Production Client.
Page 59

5 • DISCRETE MPS CONFIGURATOR APPLICATION
1. Launch the RSBizWare Production Client application.
• • • • •
2. At the Login to Production Client prompt, login to the application with the “admin”
user account.
53
5 • Configurator
Page 60

DISCRETE MACHINE PERFORMANCE SOLUTION USER’S GUIDE
• • • • •
3. Select the OEEBox Detail report for the workcell that has a new description.
4. View the OEEBox Detail report in Design Mode.
54
Page 61

5 • DISCRETE MPS CONFIGURATOR APPLICATION
5. Right click the report object (which composes the entire report) and choose
Properties. Select the correct Workcell Description on the Activity Area (i.e.,
workcell) tab. Press OK to make the change.
• • • • •
6. Save the OEEBox Detail report.
5 • Configurator
55
Page 62

DISCRETE MACHINE PERFORMANCE SOLUTION USER’S GUIDE
• • • • •
7. Select the OEEBox Overview report and view the report in Design Mode. Right click
the control for the workcell that has a new description and choose Properties.
56
8. Select the correct Workcell Description on the Activity Area (i.e., workcell) tab. Press
OK to make the change.
9. Save the OEEBox Overview report.
Page 63

6
Discrete MPS Operator Interface
Chapter objectives
This chapter provides an overview of the Discrete MPS Operator Interface functionality.
Exploring the Operator Interface
The Discrete MPS Operator Interface is a Rockwell Software RSView32 application. All
of the major displays for the Operator Interface are composed of a header area and a main
content area.
6 • Operator Interface
The header area always contains the same items:
The Menu button on the left can be selected to show the display that is above the
current display in the display hierarchy.
57
Page 64

DISCRETE MACHINE PERFORMANCE SOLUTION USER’S GUIDE
• • • • •
The yellow box in the middle is used to display an alarm record for each workcell that
is currently experiencing a breakdown event. If the workcell has been configured for
Manual Breakdown Justification, the Breakdown Justification display can be shown
by choosing the alarm record listed and selecting the Identify button.
The current day, date and time are shown at the right.
The contents of the main content area vary depending on the display being shown.
This content is detailed in the subsequent sections that discuss each display.
Note: Most text strings shown in the Discrete MPS Operator Interface can be changed using the
Discrete MPS Configurator. Refer to “Strings Localization” on page 49.
Graphical Keyboards
Graphical Keyboard popup displays are provided for use with the touchscreen. A
keyboard is shown when a data entry field on an interface display is selected.
For alphanumeric entry fields, the alpha keyboard is shown.
58
For numeric entry fields, the numeric keypad is shown.
Always press the Download button on the graphical keyboards to change the value in an entry
field. If the Download button is not used the value change will not be recorded.
Page 65
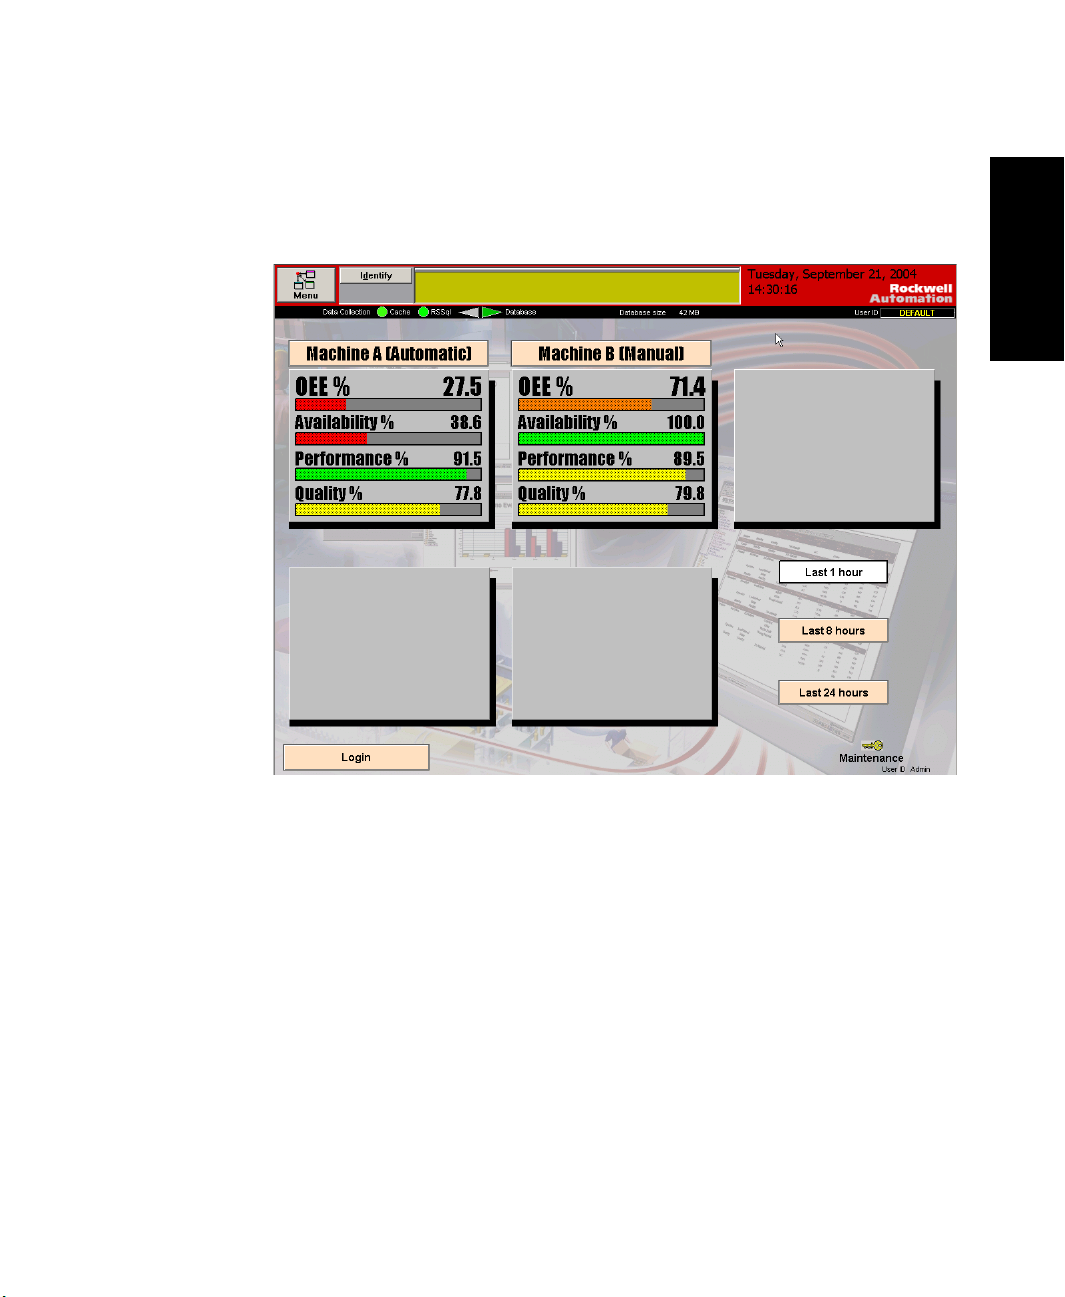
6 • DISCRETE MPS OPERATOR INTERFACE
• • • • •
Main overview
This display provides an overview of all workcells and shows their recent OEE ratings.
6 • Operator Interface
This is the initial display shown when the Operator Interface application is started. All
workcells that have been enabled in the configuration are shown along with their OEE
ratings.
Workcells that have been enabled in the configuration have a button shown which
contains the workcell description. Selecting the button with the workcell description
shows the workcell menu display for that workcell.
The OEE ratings are calculated for selected time period. There are three buttons available
to select the time period for which the OEE ratings of the workcells are shown:
For the Last 1 hour
For the Last 8 hours
For the Last 24 hours
59
Page 66

DISCRETE MACHINE PERFORMANCE SOLUTION USER’S GUIDE
• • • • •
You may also select the:
Login button to view the login display
Maintenance button to view the maintenance display
Note: in the sample display above, the Maintenance button is not visible. To activate it, it is
necessary to login with the “admin” user account. Refer to “Login,” below.
Login
This display provides the ability to login or logout a user account for the Operator
Interface.
60
To login to the Operator Interface as another User:
1. Select the User ID entry field and enter a user ID.
2. Select the Password entry field and enter the user password.
3. Select the Login button.
When the Login button is selected, the Main Overview display is shown. If the login
was successful, the user ID shown in the display header is changed to the new user ID
from the login.
Page 67

6 • DISCRETE MPS OPERATOR INTERFACE
• • • • •
To logout the current User ID from the Operator Interface:
Select the Logout button.
When the Logout button is selected, the Main Overview display is shown. The user ID
shown in the display header is changed to the default user ID of
Maintenance
This display provides access to the restricted maintenance functions that are available for
the Operator Interface.
DEFAULT
6 • Operator Interface
.
1. Select the Stop button to stop the Operator Interface application and enter the
RSView32 Runtime application configuration environment.
Stopping the Operator Interface application also stops system data collection.
61
Page 68

DISCRETE MACHINE PERFORMANCE SOLUTION USER’S GUIDE
• • • • •
2. Select the Accounts button to display the RSView32 application User Accounts
dialog for managing application User Accounts.
User accounts managed in the Operator Interface are separate from the user accounts
defined for the Reporting Interface.
A keyboard and mouse must be attached to the Discrete MPS Industrial Computer for
managing Operator Interface user accounts.
62
3. Select the Start Data Collection button to start automatic data collection. A popup
message is shown (“STARTING DATA COLLECTION”). During data collection, the
RSSql indicator in the header is green.
4. Select Stop Data Collection to stop automatic data collection. When data collection
stops, the RSSql indicator in the header turns red.
Page 69

6 • DISCRETE MPS OPERATOR INTERFACE
• • • • •
Workcell menu
This display provides links to workcell-specific displays and provides functionality for the
current Breakdown state of the workcell.
6 • Operator Interface
Select:
Performance Analysis to view the Performance Analysis display.
Digital Events to view the Digital Events display.
Multistate Events to visualize the Multistate Events display.
Counters to visualize the Counters display.
Process Variables to visualize the Process Variables display.
Summarization to visualize the Summarization Events display.
The breakdown box (labeled Breakdowns above) displays the reason the last breakdown
occurred. If there is not an active breakdown, the background color is green; if there is an
active breakdown, the background color is red.
63
Page 70

DISCRETE MACHINE PERFORMANCE SOLUTION USER’S GUIDE
• • • • •
There are two buttons in the breakdown box area.
Select:
Breakdown Reset to send the breakdown reset signal to the PLC after a breakdown
reason has been selected. This button is available if the Breakdown Justification Type
has been assigned as Manual and the Manual Reset option has been selected (refer to
“Breakdown Justification” on page 44.
Breakdown Reasons to open the Breakdown Justification display.
Performance analysis
This display provides the current values for production count-related information and
provides functionality for viewing and modifying the running and available status of the
workcell.
64
There are two areas of information on this display:
In the Counters box, you can view the Part Counters, the current Ideal Cycle Time
(labeled Seconds per Part above) and the Product code. If configured for manual
Page 71

6 • DISCRETE MPS OPERATOR INTERFACE
• • • • •
entry, the Ideal Cycle Time and Product code field values can be modified on this
display.
In the States box, you can view the running states (overall, automatic, and manual)
and the availability states (overall, automatic, and manual) of the workcell. The
indicators are green when active (i.e., running or available); they are red if they are
inactive (i.e., not running, unavailable) and they are gray if they have not been
configured for use. The buttons at the bottom are used to toggle the Manual status of
each indicator.
Setting the Manual Availability status of a workcell to unavailable (i.e., inactive, red) will also
set the Manual Running status of a workcell to not running (i.e., inactive, red).
Digital Event
This display shows the current state of all Digital Events configured for the workcell.
6 • Operator Interface
The description of each digital event configured for the workcell is shown with a colored
circle to its left to indicate its current status. When the event is on (value equals 1), the
circle appears yellow; when the event is off (value equals 0), the circle appears gray.
65
Page 72

DISCRETE MACHINE PERFORMANCE SOLUTION USER’S GUIDE
• • • • •
Multistate Events
This display shows the current state of all multistate events configured for the workcell.
66
The current code value of each multistate event configured for the workcell is shown.
Multistate events that have not been configured simply have a solid gray background
displayed for the code value. To the right of the code value, the description of the
multistate event is shown in blue. Below the description of the multistate event, the
description associated with the current code value is shown in black.
Page 73
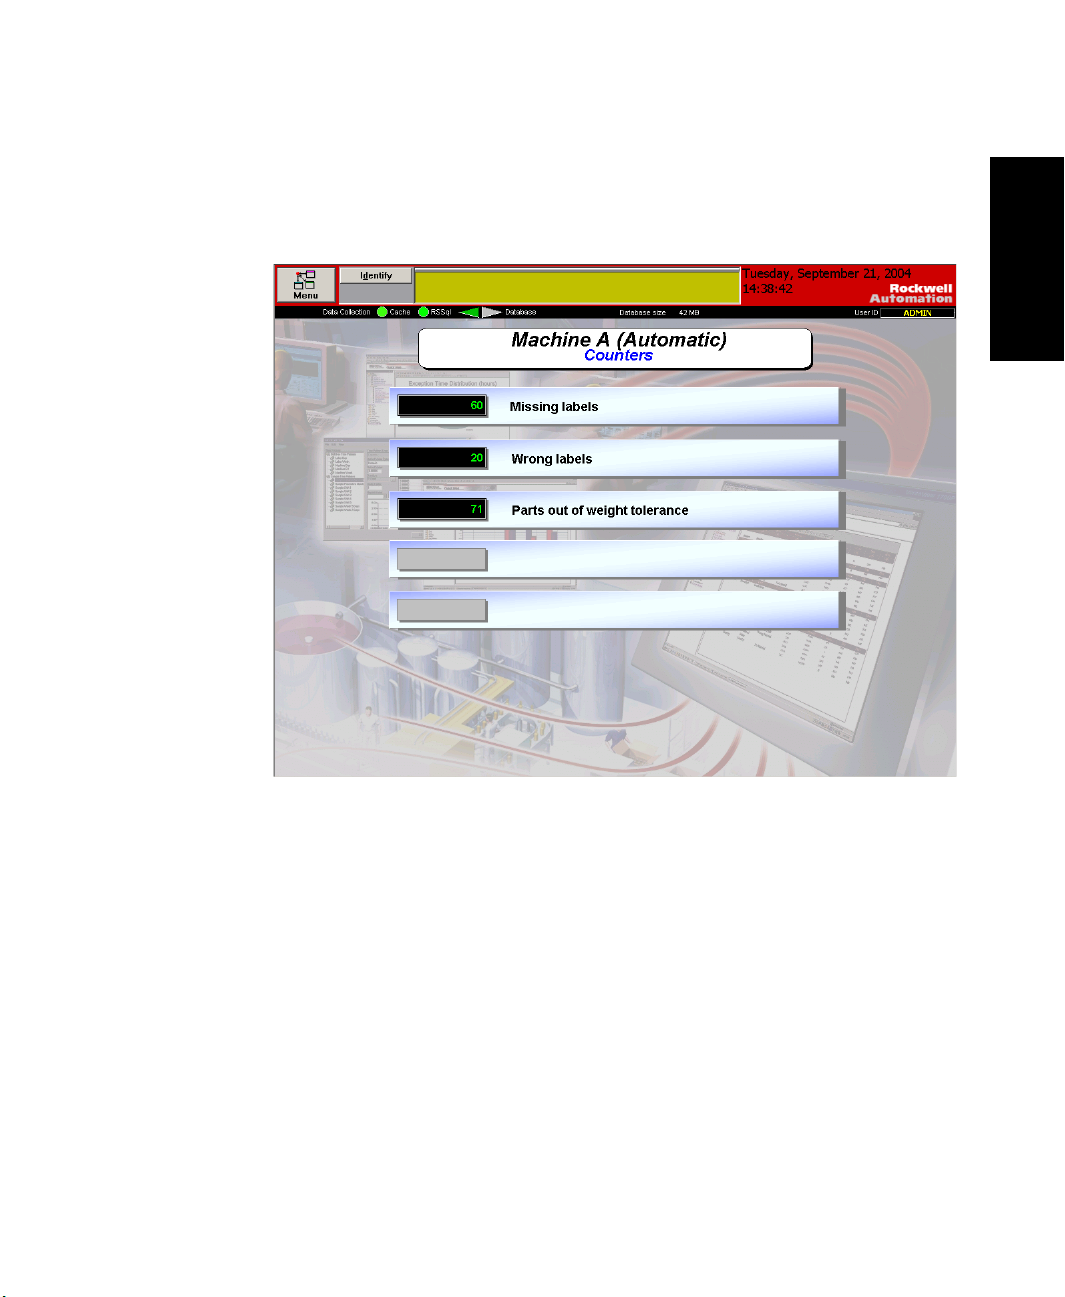
6 • DISCRETE MPS OPERATOR INTERFACE
• • • • •
Counters
This display shows the current state of all counters configured for the workcell.
6 • Operator Interface
The current value of each counter configured for the workcell is shown. To the right of the
current value, the description of the counter is shown.
67
Page 74

DISCRETE MACHINE PERFORMANCE SOLUTION USER’S GUIDE
• • • • •
Process Variable trends
This display shows the current value of all process variables configured for the workcell
and a trend of those values.
68
The description of each process variable configured for the workcell is shown with its
current actual value. Each value is color coded and a trend chart of all variables is shown
in the grid at the bottom of the display. The chart can be shown as a real-time trend that
automatically updates, or as a historical trend of previous values in a time period selected
from the last 24 hours.
There are several controls to the right of the grid that are used to adjust the displayed grid
information:
Modify the actual value limits used for the y-axis by using the entry fields at the top
right and bottom right of the grid.
Adjust the length of time depicted in the grid by using the time entry field or the slider
control, both located to the right of the grid. The length of time shown can be adjusted
from 5-300 seconds.
Page 75

6 • DISCRETE MPS OPERATOR INTERFACE
• • • • •
Adjust the time period displayed in the grid by using the buttons to the right of the
grid. Select the left-most buttons to jump to the oldest data available or to scroll
backward in time. Select the right-most buttons to jump to the most current data
available or to scroll forward in time. Select the center box to return the grid to a realtime trend that automatically updates.
Summarization Values
This display shows the current value of all summarization values configured for the
workcell.
6 • Operator Interface
The description of each summarization value configured for the workcell is shown with its
current actual value. If the summarization value has been configured for manual entry, an
entry field will be shown in the Manual Value column.
69
Page 76

DISCRETE MACHINE PERFORMANCE SOLUTION USER’S GUIDE
• • • • •
Breakdown justification
This display shows the breakdown reasons that have been configured for the workcell.
70
The Main Menu displays a selection button for each breakdown reason configured for the
workcell. The first 10 breakdown reasons are shown on the first display; select the down
arrow button to display the next 10 breakdown reasons.
To select a breakdown reason, click on the specific breakdown reason button.
After choosing a breakdown reason, select the Exit button in the top-left corner of the
display to return to the Workcell Menu display. The selected breakdown reason will be
shown in the breakdown box area of the Workcell Menu display (see “Workcell menu” on
page 63).
Page 77

7
Discrete MPS Reporting
Chapter objectives
This chapter provides an overview of the Discrete MPS Reporting functionality.
Available reports
Discrete MPS has 48 reports to display historical data recorded in the system database.
7 • Reporting
71
Page 78

DISCRETE MACHINE PERFORMANCE SOLUTION USER’S GUIDE
• • • • •
Accessing reports
Reports are accessed via an Internet Explorer browser, by accessing the HTTP server on
port number 8080 of the Discrete MPS Industrial Computer.
1. In the Address field of your browser, enter http://COMPUTER_NAME:8080
COMPUTER_NAME equals the Computer Name that has been assigned to the
Discrete MPS Industrial Computer for its Network Identification.
2. The very first time reports are accessed, you may receive a message to install report
components. Select Ye s to install and run the software. This message will not appear
during subsequent viewing of reports.
– where
72
Page 79

7 • DISCRETE MPS REPORTING
3. After browsing to the RSBizWare Quick Web page, the system displays a user Login
window that will prompt for entry of a user name and password. Enter the User and
Password information and press the Login button.
4. After you log in, a tree view of all available reports is displayed in the left-most pane
of the Quick Web interface. Expand the folders shown to select the desired report.
• • • • •
7 • Reporting
73
Page 80
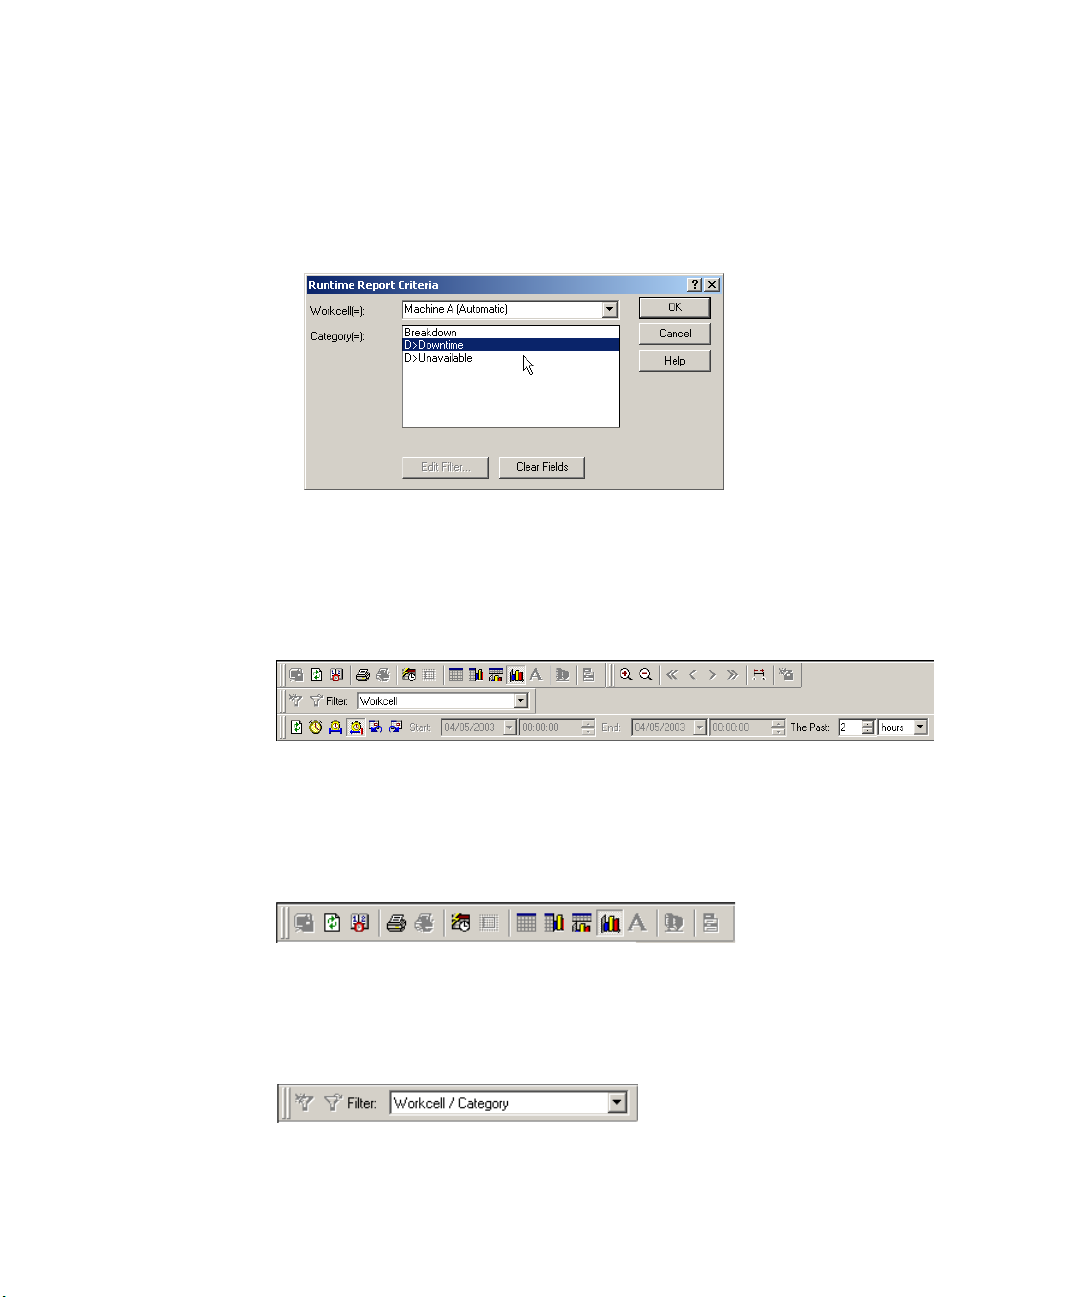
DISCRETE MACHINE PERFORMANCE SOLUTION USER’S GUIDE
• • • • •
5. After selecting a report, many reports require filter criteria to be specified for the
report. A criteria entry window will open. Select required criteria from a drop down
list or a list box and click OK to display the report.
Report display options
After a report is displayed, the filter criteria and time period used for the report may be
changed. Using the toolbars provided, select a different type of filter or change the time
period specified for the report.
74
Note: The available Toolbar buttons vary based on the report.
General toolbar
The General toolbar provides the tools that the run-time user can use to manage report
files, to generate reports and to change the report layout or behavior.
Filter toolbar
The Filter toolbar allows the run-time user to create, edit, and select the filter that is
applied to the report.
Page 81

Time Selection toolbar
Use the Time Selection toolbar to define time ranges, start and end date/times, and time
increments for retrieving data for the report.
Time Selection Tools toolbar
The Time Selection Tools toolbar provides tools for use with reports that filter data based
on time.
Managing report login accounts
A keyboard and mouse must be attached to the Discrete MPS Industrial Computer for managing
report login access.
1. Launch the RSBizWare Enterprise Manager application.
• • • • •
7 • DISCRETE MPS REPORTING
7 • Reporting
75
Page 82
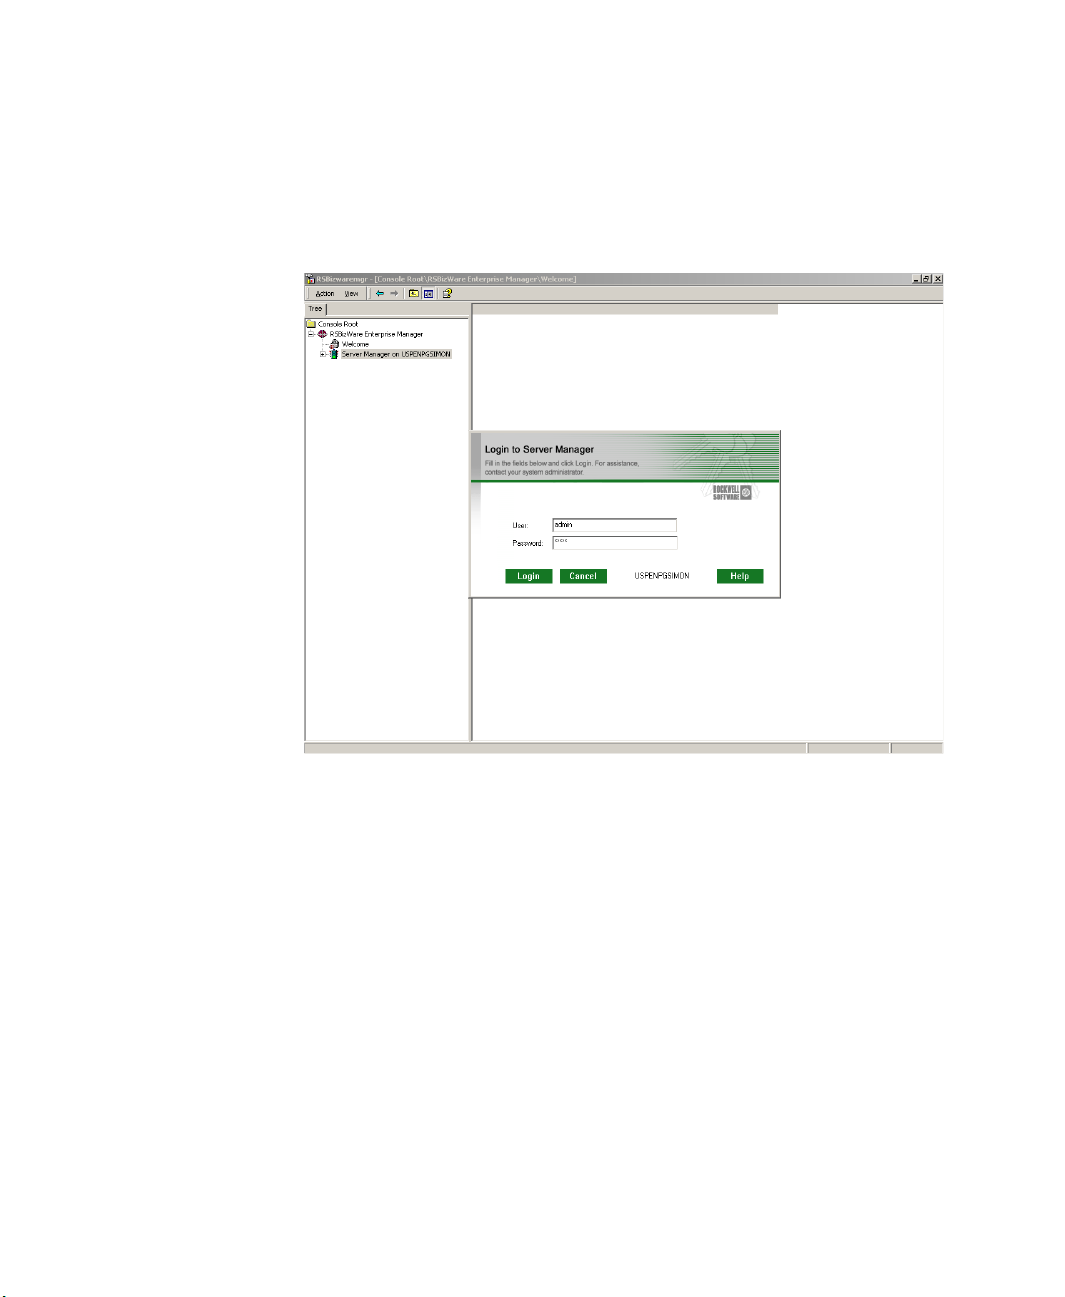
DISCRETE MACHINE PERFORMANCE SOLUTION USER’S GUIDE
• • • • •
2. Select the local Server Manager from the object tree on the left side of the window.
At the Login to Server Manager prompt, login to the application with the ‘admin’
user account.
76
Page 83

7 • DISCRETE MPS REPORTING
3. Expand Administration under the local Server Manager and select Users and
Groups. The users configured for the system are displayed in the item detail area to
the right of the tree.
• • • • •
7 • Reporting
4. Select Add User to add a new report user. The Security Control dialog is shown.
Enter a Description, User ID and Password for the new user. No Groups, Privileges
or License & Activation settings need to be made for a user to access reports (View
77
Page 84
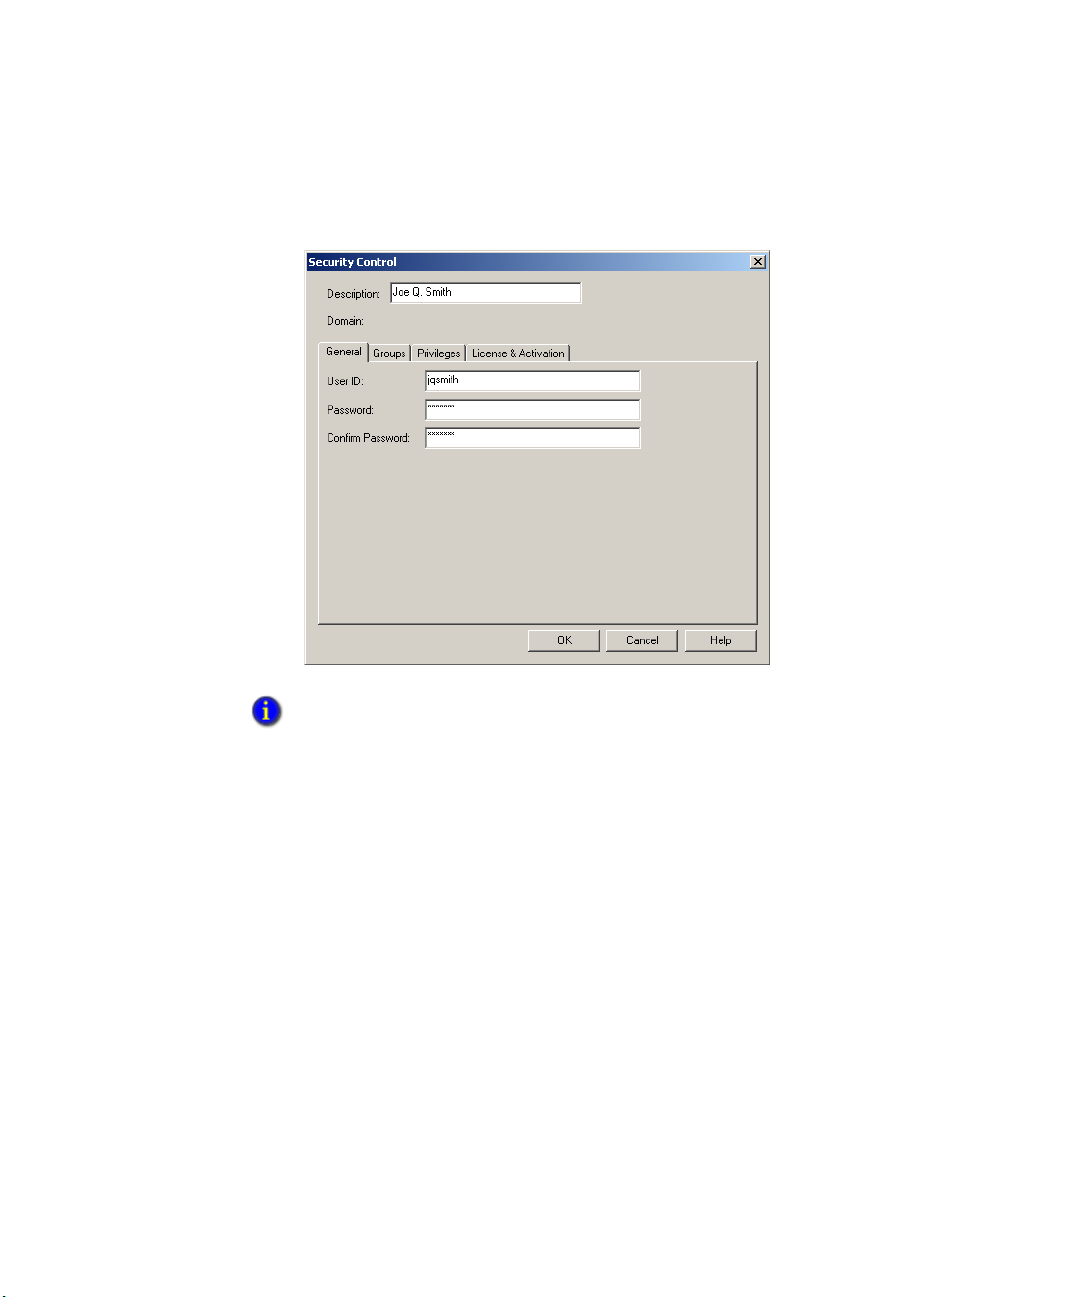
DISCRETE MACHINE PERFORMANCE SOLUTION USER’S GUIDE
• • • • •
Report access for all reports is granted to all users). Select OK to complete adding the
user.
78
Reporting Accounts managed in RSBizWare Enterprise Manager are separate from the
User Accounts defined for the Discrete MPS Operator Interface.
5. Users can also be modified by selecting Edit User, or removed by selecting Delete
User.
Note: The system administrator user account can be edited to change the password for the
“admin” user ID. The system administrator user, however, cannot be deleted.
Page 85
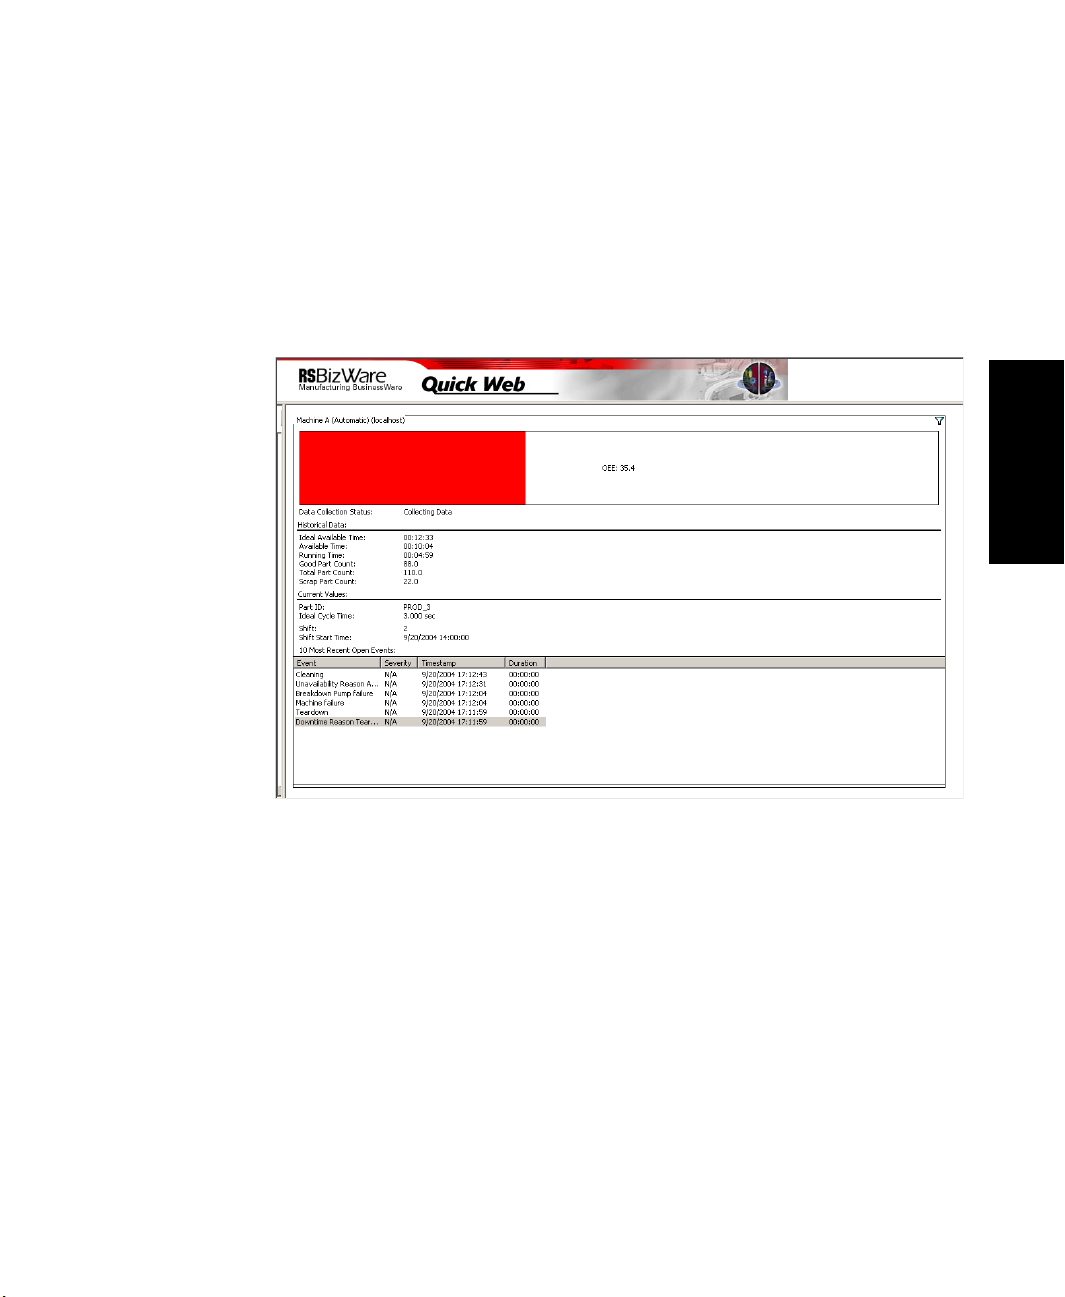
Report samples
Performance Analysis OEE Details by Workcell
This report shows a detailed analysis of a workcell’s OEE and efficiency parameters. It
also shows the 10 most recent open events. The filter icon can be used to select a different
time period for the report.
• • • • •
7 • DISCRETE MPS REPORTING
7 • Reporting
79
Page 86

DISCRETE MACHINE PERFORMANCE SOLUTION USER’S GUIDE
• • • • •
Performance Analysis OEE Overview
This report shows an overview of the OEE rating for all workcells.
80
Page 87
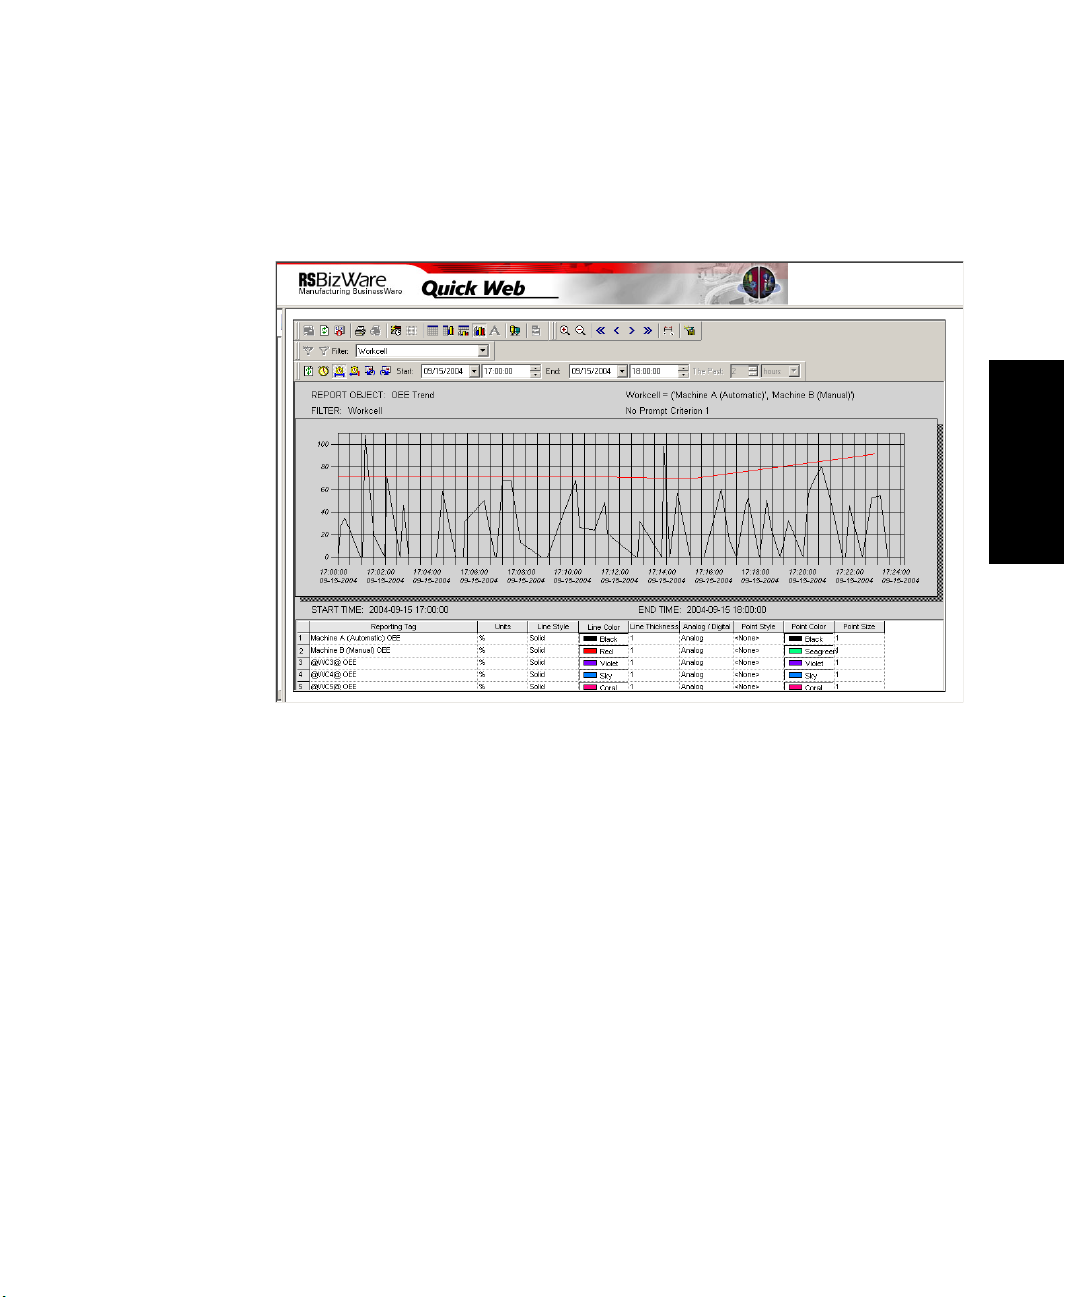
7 • DISCRETE MPS REPORTING
Performance Analysis OEE Trend
This report shows a historical trend of the OEE value for each workcell.
• • • • •
7 • Reporting
81
Page 88
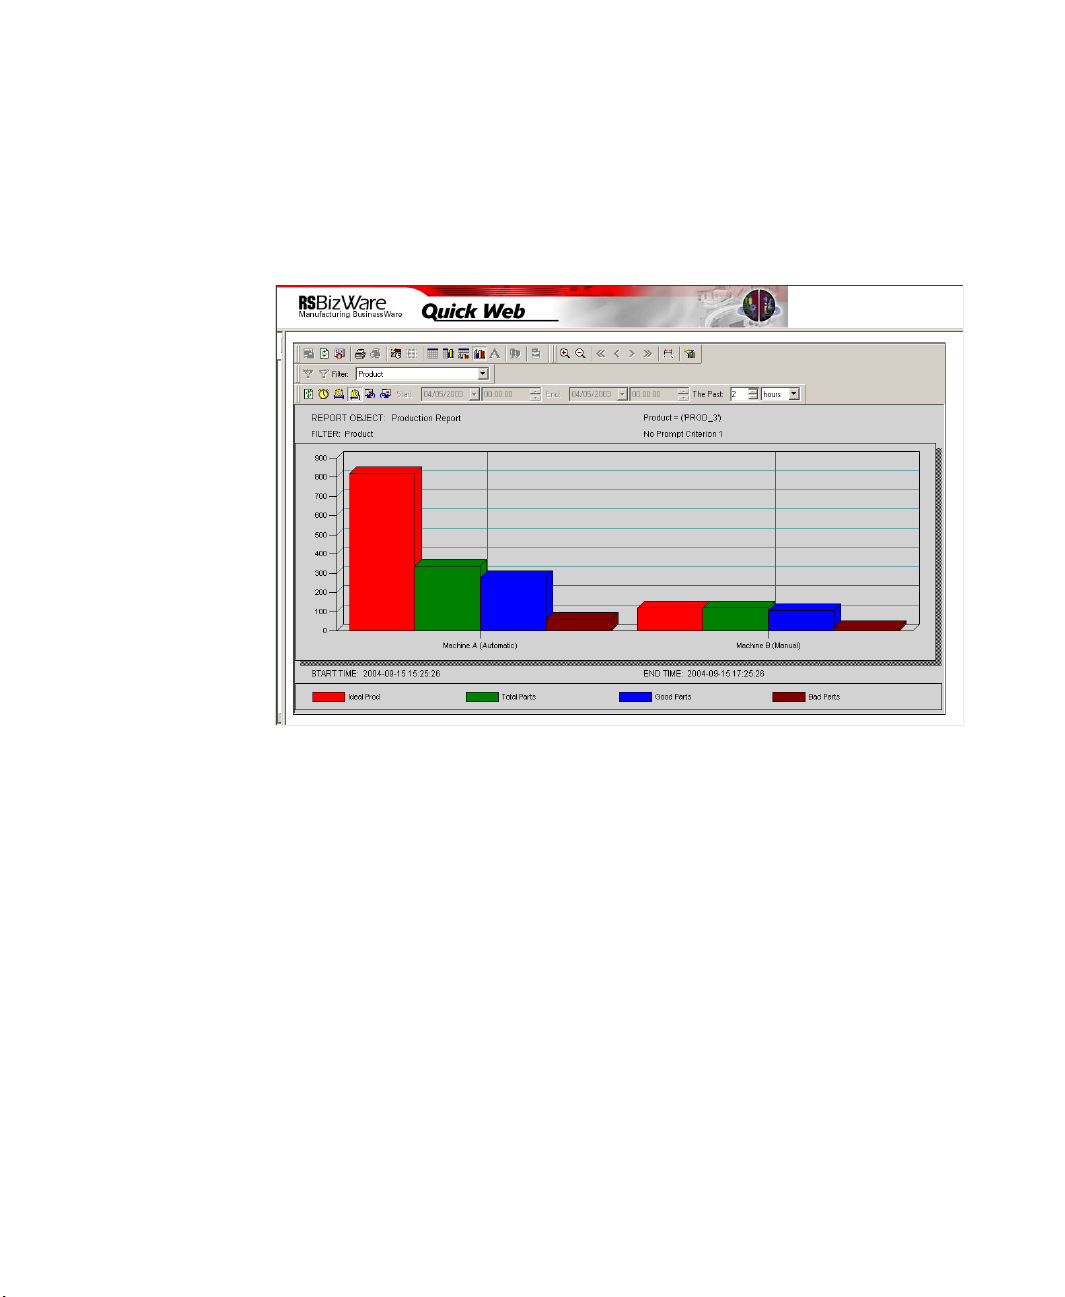
DISCRETE MACHINE PERFORMANCE SOLUTION USER’S GUIDE
• • • • •
Performance Analysis Production
This report shows a bar chart of the production counts for the criteria specified. Filter
criteria includes specifying a specific value for a summarization event.
82
Page 89

7 • DISCRETE MPS REPORTING
Performance Analysis Production by Shift (text)
This report shows the production counts grouped by shift.
• • • • •
7 • Reporting
83
Page 90

DISCRETE MACHINE PERFORMANCE SOLUTION USER’S GUIDE
• • • • •
Performance Analysis Production by Shift (bar chart)
This report shows a bar chart of the production counts grouped by shift.
84
Page 91

7 • DISCRETE MPS REPORTING
Digital Events Total Duration (bar chart)
This report shows a bar chart of the top 10 total durations for any digital events that have
occurred for the data selected.
• • • • •
7 • Reporting
85
Page 92

DISCRETE MACHINE PERFORMANCE SOLUTION USER’S GUIDE
• • • • •
Digital Events Total Duration (pie chart)
This report shows a pie chart of the top 10 total durations for any digital events that have
occurred for the data selected.
86
Page 93

7 • DISCRETE MPS REPORTING
Digital Events Number of Occurrences
This report shows a pie chart of the top 10 number of occurrences for any digital events
that have occurred for the data selected.
• • • • •
7 • Reporting
87
Page 94

DISCRETE MACHINE PERFORMANCE SOLUTION USER’S GUIDE
• • • • •
Digital Events Detailed List
This report shows all the digital events that have occurred.
88
Page 95

7 • DISCRETE MPS REPORTING
Analog Events Total Duration by Day (text)
This report shows the duration of the analog event values grouped by day for any analog
events that occurred for the data selected.
• • • • •
7 • Reporting
89
Page 96
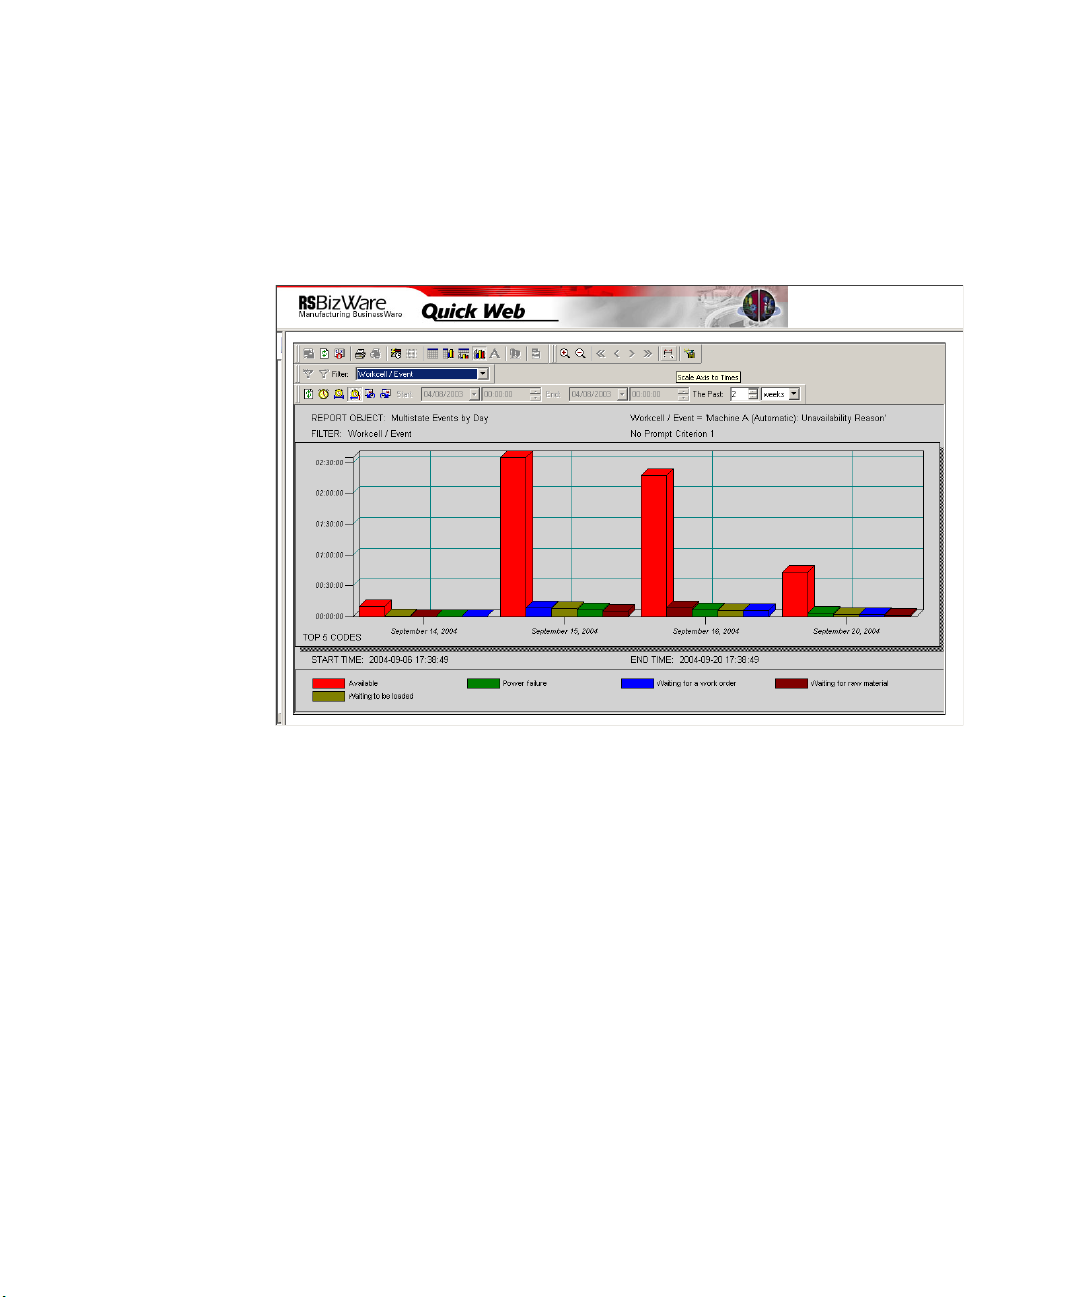
DISCRETE MACHINE PERFORMANCE SOLUTION USER’S GUIDE
• • • • •
Analog Events Total Duration by Day (bar chart)
This report shows a bar chart of the duration of the analog event values grouped by day
for the analog events, with the top five durations that occurred for the data selected.
90
Page 97
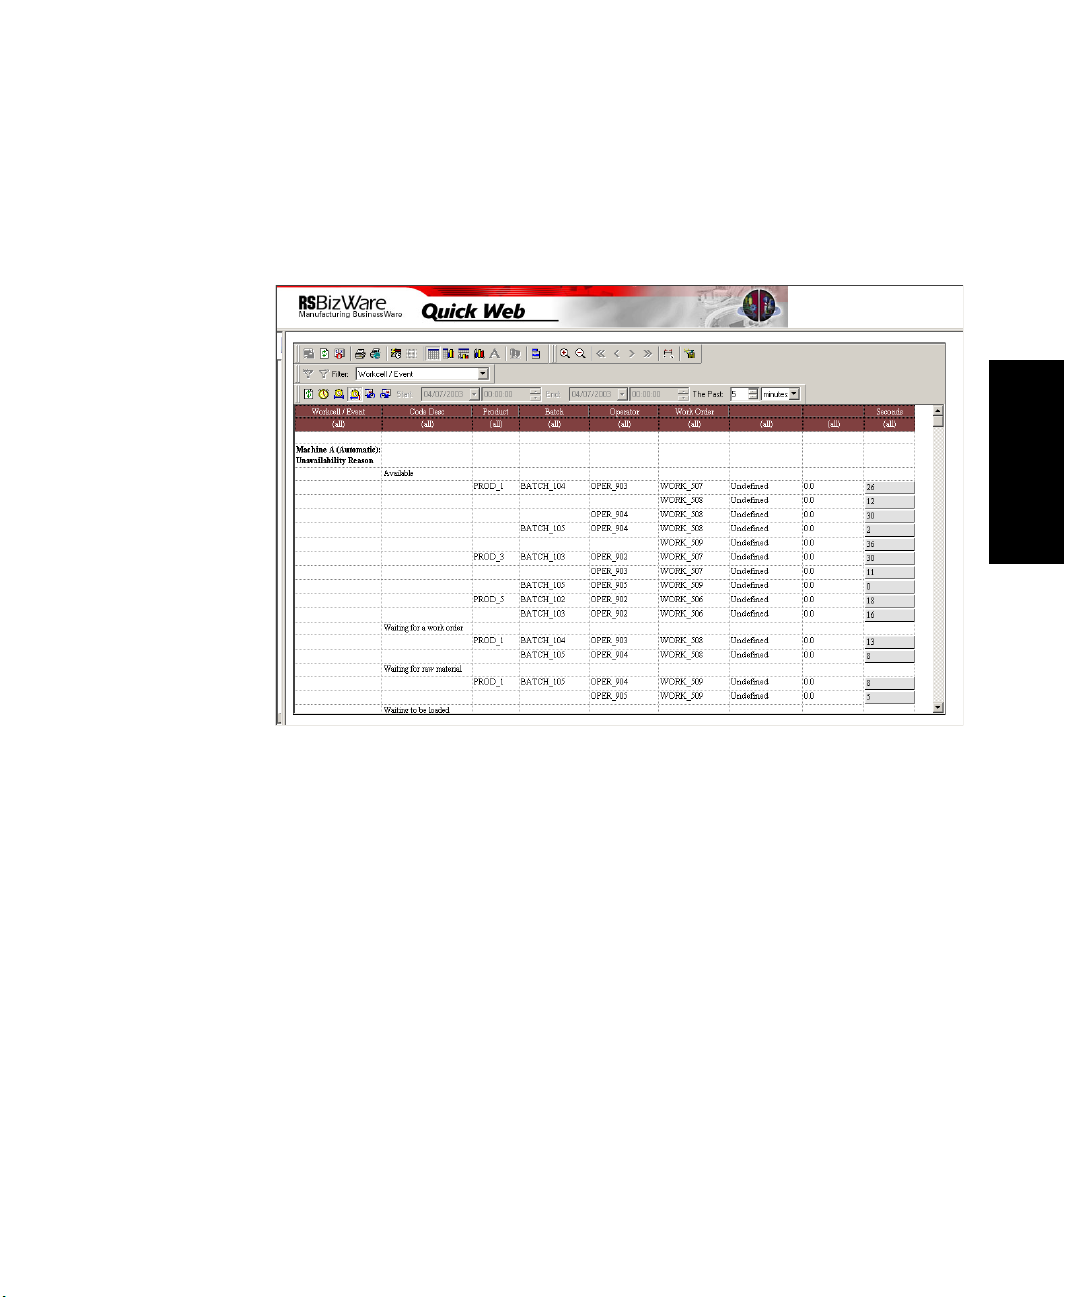
7 • DISCRETE MPS REPORTING
Analog Events Total Duration by Summarization Event
This report shows the duration (in seconds) of the analog event values grouped by
summarization event values.
• • • • •
7 • Reporting
91
Page 98

DISCRETE MACHINE PERFORMANCE SOLUTION USER’S GUIDE
• • • • •
Counters Total by Month (text)
This report shows all the counter values grouped by month for the data selected.
92
Page 99
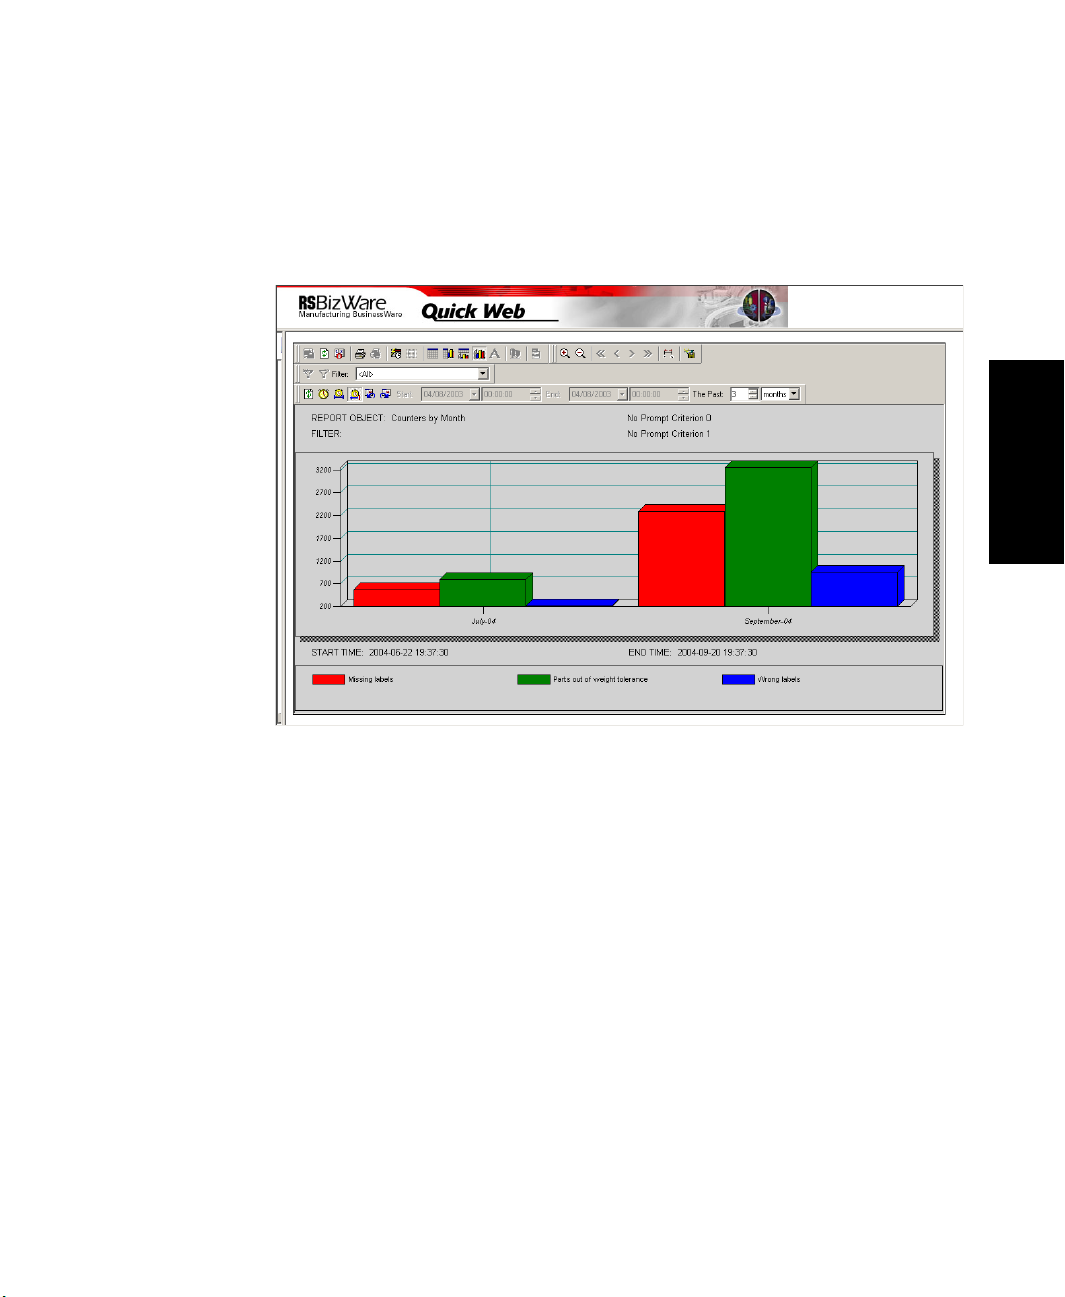
7 • DISCRETE MPS REPORTING
Counters Total by Month (bar chart)
This report shows a bar chart of all the counter values grouped by month for the data
selected.
• • • • •
7 • Reporting
93
Page 100

DISCRETE MACHINE PERFORMANCE SOLUTION USER’S GUIDE
• • • • •
Breakdowns Total Duration (pie chart)
This report shows a pie chart of the top 10 total durations for any breakdown reasons that
have been recorded for the data selected.
94
 Loading...