

Page 1

Distributed by
Any reference to Raytheon or
RTN in this manual should be
interpreted as Raymarine.
The names Raytheon and RTN
are owned by the
Raytheon Company.
Page 2

RayChart 620
and 630
Owner’ s
Handbook
Document number: 81155_2
Date: 11th May1999
Page 3

Page 4

RayChart 620 and 630
Electronic Charting Systems
Owner’ s Handbook
i
SAFETY NOTICES
1. HIGH VOLTAGE.
The display unit contains high voltages. Adjustments require specialised
service procedures and tools only available to qualified service technicians
– there are no user serviceable parts or adjustments. The operator should
never remove the display unit cover or attempt to service the equipment.
2. NAVIGATION AID.
This device is only an aid to navigation. Its accuracy can be affected by
many factors, including equipment failure or defects, environmental
conditions and improper handling or use.
It is the user’s responsibility to exercise common prudence and
navigational judgement, and this device should not be relied upon as a
substitute for such prudence and judgement.
Page 5

ii
RayChart 620 and 630
RAYTHEON MARINE products are supported by a network of Authorized
Service Representatives. For information on Raytheon products and services,
contact either of the following:
UNITED STATES Raytheon Marine Company
676 Island Pond Road
Manchester, NH 03109-5420
Telephone: (603) 647-7530
1-800 539-5539
Fax: (603) 634-4756
EUROPE Raytheon Marine Limited
Anchorage Park
Portsmouth
Hampshire PO3 5TD
England
Telephone: (+44) 1705 693611
Fax: (+44) 1705 694642
Copyright © Raytheon Marine Company 1999
The technical and graphical information contained in this handbook, to the best
of our knowledge, was correct as it went to press. However, the Raytheon
policy of continuous improvement and updating may change product
specifications without prior notice. Therefore, unavoidable differences between
the product and handbook may occur from time to time, for which liability
cannot be accepted by Raytheon.
Raytheon is a registered trademark of Raytheon Company
SeaTalk is a registered trademark of Raytheon Marine Europe Limited
RayChart is a trademark of Raytheon Marine Company
Page 6

Preface iii
Preface
This handbook covers the following electronic charting systems from Raytheon
Marine Company:
• RayChart 620 monochrome chartplotter
• RayChart 630 color chartplotter
It contains very important information on the installation and operation of your
new equipment. In order to obtain the best results in operation and performance,
please read this handbook thoroughly.
Raytheon Product Support or your local dealer will be available to answer any
questions you may have.
How this Handbook is Organized
This handbook is divided into the following chapters:
Chapter 1: Introduces the chartplotter’s features and concepts.
Chapter 2: Explains how to start using the chartplotter, including instructions
for turning it on, using the controls, changing the lighting, and using chart cards.
This chapter also describes how to display navigational data. Simple exercises
are included.
Chapter 3: Provides instructions for using the initial soft keys to set up onscreen routes, navigate to a point and measure distances.
Chapter 4: Explains how to use additional basic functions, such as track
histories, marks and events. It also explains how to use the Man Overboard
(MOB) function.
Chapter 5: Provides information on the stored data, such as waypoints, routes
and events, and how you can review, edit and use them.
Chapter 6: Provides instructions for customizing the chartplotter defaults,
such as the numerical units used, the equipment connected and the alarm
settings, to suit your preferences. It also explains how to customize the screen
display.
Chapter 7: Provides instructions for installing the chartplotter.
Chapter 8: Provides information on maintenance, and what to do if you
experience problems with your chartplotter.
Appendix A: Lists the system specifications.
Appendix B: Defines the NMEA data received/transmitted by the chartplotter.
A glossary (including a list of abbreviations), index and warranty information
are included at the end of the handbook.
Page 7

iv
How to Use this Handbook
This handbook is organized with the information about operating the
chartplotter at the front, since you will probably use these chapters most often.
When you first receive your chartplotter, you should read Chapter 7, and install
the equipment. Then read Chapters 1 and 2 to familiarize yourself with the
controls of the chartplotter. You may also wish to read Chapters 3, 4 and 5.
When you are happy with the basics of using the chartplotter, read Chapter 6,
decide how you wish to set up your defaults, alarms and the screen, and follow
the instructions to make your changes.
Once you are on the water, you can follow the instructions in Chapters 3 and 4
to perform all your routine tasks, and refer to Chapter 5 for information about
more advanced features.
If you experience any difficulties with your chartplotter, refer to Chapter 8.
Refer to the Glossary if there are any terms you are unfamiliar with.
RayChart 620 and 630
Note: The Quick Reference Card, included with your system, provides a useful
summary of the chartplotter controls.
Text Conventions
Throughout this handbook, the dedicated (labelled) keys are shown in bold
capitals; for example, MENU. The soft (unlabelled) key functions, menus and
options are shown in normal capitals; for example, ROUTE.
Operating procedures, which may consist of a single key-press or a sequence of
numbered steps, are indicated by the ➤ symbol in the margin.
Terms included in the glossary are shown in bold type.
Exercises are shown in italic type, like this paragraph.
Warranty
To register your chartplotter ownership, please take a few minutes to fill out the
warranty registration card found at the end of this handbook. It is very important
that you complete the owner information and return the card to the factory in
order to receive full warranty benefits.
EMC Conformance
All Raytheon equipment and accessories are designed to the best industry
standards for use in the leisure marine environment.
Their design and manufacture conforms to the appropriate Electromagnetic
Compatibility (EMC) standards, but correct installation is required to ensure
that performance is not compromised.
Page 8

Contents v
Contents
Chapter 1: Introduction ....................................................................... 1
1.1 Overview..................................................................................... 1
Features ...................................................................................... 1
Functions .................................................................................... 2
Navigational Displays ................................................................. 2
1.2 The Chart Display ........................................................................ 3
1.3 Operating Controls ...................................................................... 5
The Trackpad and Cursor............................................................. 5
Dedicated Keys ........................................................................... 6
The Soft Keys ............................................................................. 7
Soft Key Initial Functions ....................................................... 7
Other Soft Key Functions ....................................................... 8
Pop-Up Menus ............................................................................ 8
Database Lists ............................................................................. 8
Chapter 2: Getting Started and Controlling the Chart Display ........ 11
2.1 Introduction ................................................................................11
2.2 Switching the Chartplotter On and Off..........................................11
2.3 Adjusting the Lighting and Contrast .............................................13
2.4 Using Chart Cards .......................................................................14
Inserting a Chart Card .................................................................14
Removing a Chart Card ..............................................................15
Dis pla yin g th e Ch art Dat a ...........................................................15
Displaying Information About Objects ........................................16
Por t Ar ea ..............................................................................18
Tid e D ata..............................................................................19
2.5 Controlling the Chart ..................................................................20
Moving the Chart .......................................................................20
Changing the Chart Scale.......................................................21
Changing the Chart Center .....................................................22
Displaying Navigation Data ........................................................24
Chart .........................................................................................24
Changing between Full Screen and Windows .........................25
Changing the Window Set Up ................................................25
Navigation .................................................................................26
Page 9

vi
RayChart 620 and 630
Chapter 3: Using the Initial Soft Keys................................................ 29
3.1 Introduction ................................................................................29
Safety ...................................................................................29
3.2 Setting Up and Using On-Screen Routes ......................................30
Making a New On-Screen Route .................................................31
Editing an Existing Route On-Screen...........................................32
Editing Route Information ..........................................................33
Using a Route.............................................................................35
Following, Reversing and Stopping a Route............................35
Advancing to the Next Leg of the Route..................................36
Erasing a Route .....................................................................36
3.3 Using the GO TO Key .................................................................37
Navigating to a Target Point ........................................................37
Editing the Waypoint Details ......................................................37
Clearing or Changing a GO TO ...................................................38
3.4 Measuring Distances Using the RULER Key ...............................39
Chapter 4: Additional Basic Functions .............................................. 41
4.1 Introduction ................................................................................41
4.2 Marks and Events........................................................................41
Placing and Deleting a Mark .......................................................42
Placing and Deleting an Event .....................................................43
4.3 Using Track Histories..................................................................43
Starting and Stopping a Track .....................................................44
Deleting the Current Track..........................................................44
Editing Track Controls ...............................................................44
4.5 Man OverBoard (MOB) .............................................................46
4.6 Alarms and Timers .....................................................................47
Chapter 5: Using Stored Lists (EDIT) .................................................. 49
5.1 Introduction ................................................................................49
5.2 The Waypoint List ......................................................................50
Viewing the Waypoint List .........................................................50
Waypoint List Operations ...........................................................51
Finding a Waypoint in the List ...............................................51
Editing a Waypoint or Adding a New Waypoint......................52
5.3 The Current Route ......................................................................53
Viewing the Current Route .........................................................53
Current Route Operations ...........................................................54
Page 10

Contents vii
5.4 The Route List ............................................................................55
Viewing the Route List ...............................................................55
Route List Operations .................................................................56
Route Details .............................................................................57
Editing a Route or Building a New Route .....................................57
5.5 Finding and Displaying a Waypoint.............................................59
5.6 Displaying and Printing the Log ..................................................59
5.7 Printing the screen ......................................................................60
Chapter 6: Customizing the Chartplotter ......................................... 61
6.1 Introduction ...............................................................................61
6.2 Setting Up the Data.....................................................................62
Changing the Parameters ............................................................62
Setting Up the System.................................................................63
Language ..............................................................................65
Units ....................................................................................65
Date and Time.......................................................................65
Simulator ..............................................................................65
Help .....................................................................................65
Keypress Sound ....................................................................66
Cursor Echo ..........................................................................66
GPS Input .............................................................................66
Serial Output.........................................................................66
Printer Baud Rate ..................................................................66
Setting Up the Navigation Data ...................................................66
Heading ................................................................................68
Magnetic Variation ...............................................................68
Position Resolution ...............................................................68
TD Settings Menu .................................................................68
Map Datum and Fix Datum....................................................69
Position Correction ...............................................................69
Head Up Response ................................................................69
Setting Up the Chartplotter..........................................................70
Waypoint Name ....................................................................71
Waypoint Display .................................................................71
Course Vector .......................................................................71
Heading Vector .....................................................................71
Wind Vector .........................................................................71
Tide Vector...........................................................................72
Dead Reckoning....................................................................72
Cur sor Dat a Bo x ...................................................................72
Page 11

viii
RayChart 620 and 630
Setting Up the Alarms and Timers ...............................................72
Alarms..................................................................................73
Timers ..................................................................................73
Fix Status ...................................................................................74
Initializing the GPS ...............................................................74
Setting Up a Differential Beacon ............................................75
Memory C-Card .........................................................................76
6.3 Customizing the Screen Display ..................................................78
Setting the Cartography Detail ....................................................78
Chart Orientation........................................................................79
Setting Up Windows ..................................................................80
Changing Color Settings .............................................................82
Chapter 7: Installation ....................................................................... 85
7.1 Introduction ...............................................................................85
EMC Installation Guidelines .......................................................86
7.2 Pac kin g Li st ...............................................................................87
7.3 Planning the Installation ..............................................................88
Selecting a Location ...................................................................88
Connection Options....................................................................89
Cabling ......................................................................................90
7.4 Mounting the Chartplotter...........................................................90
Trunnion Mounting ....................................................................90
Panel Mounting..........................................................................90
7.5 Chartplotter Connections ............................................................92
Power/NMEA Connection..........................................................92
DC Power .............................................................................93
NMEA Connection ...............................................................93
Printer Connection ................................................................94
GPS Sensor Port .........................................................................94
SeaTalk Connection ...................................................................94
7.6 System Check and Initial Setup ...................................................95
System Check ............................................................................95
Switch On and Initial Setup .........................................................95
EMC Checks Before Going to Sea...............................................96
Page 12

Contents ix
Chapter 8: Maintenance and Problem Solving ................................. 97
8.1 Routine Maintenance..................................................................97
Cabling and Connections ............................................................97
EMC Servicing and Safety Guidelines.........................................97
Disposal ...............................................................................97
8.2 Problem Solving.........................................................................98
Common Problems and Their Solutions.......................................98
How to Contact Raytheon (US) ...................................................99
For Marine Product and Services Information .........................99
For Accessories and Parts ......................................................99
For Technical Support: ..........................................................99
For Product Repair and Service ..............................................99
How to Contact Raytheon (Europe) ...........................................100
Accessories and Parts ..........................................................100
Technical Support ...............................................................100
Worldwide Support ..................................................................100
Appendix A: Specification ................................................................101
Appendix B: NMEA Data Received and Transmitted ......................103
Glossary.............................................................................................105
G.1 Terms ......................................................................................105
G.2 Abbreviations ..........................................................................107
Index..................................................................................................109
Page 13

x
RayChart 620 and 630
Page 14

Chapter 1: Introduction 1
Chapter 1: Intr oduction
1.1 Overview
The chartplotter is a sophisticated electronic charting system, which uses GPS
or dGPS data to make navigation as simple and accurate as possible.
The chartplotter displays chart information from the C-MAP NT
electronic chart cards (C-Cards), and position information from satellites. It can
also display data available from other compatible instruments in your system.
The chartplotter is designed to be extremely easy to use, while providing
powerful options for handling data and customizing the system to match your
requirements. Everyday functions are available at the touch of a button, with as
much or as little help as you need. The on-screen prompt and menu system,
from which you can select the functions and options you require, simplifies
even complex tasks such as editing stored route data.
The monochrome display unit can be installed either above or below deck; the
color display unit must be mounted below. The display can be illuminated for
night-time use.
Features
• Large-screen waterproof display available in monochrome or color.
• Chart display with zoom and pan control; includes a background world map
• Display of chart object information, including port and tide data.
• Vessel’s position displayed, with optional heading, course, tide and wind
• Display options include control of cartographic data and windows for
• Plotter mode, which allows the use of the chartplotter at scales for which no
• Eight languages.
• Memory C-cards can be used to store and transfer route, waypoint, event and
• If two chartplotters are installed on the system, each can be operated
®
range of
and two slots for C-MAP NT C-Cards providing large-scale cartography.
vectors, and optional track history display.
displaying navigational data such as Course Deviation Indicator (CDI),
Bearing Deviation Indicator (BDI), and data from other instruments.
chart information is available.
track history data.
independently, but the active route is displayed on both units.
Overview
Page 15

2
Overview
RayChart 620 and 630
Functions
• Quick and easy on-screen route setup and control of up to 20 routes, 1000
waypoints.
• GOTO function navigating immediately to a waypoint.
• Event and mark recording.
• Edit and review functions for stored route, waypoint and event data.
• Setup options to customize the chartplotter according to your own system
preferences, such as chart orientation (north up, course up or head up),
display windows, and alarm setup.
• Ruler function for measuring chart distances.
• Centre options for centering the chart on the ship, cursor, or a specified
position, and a Home Mode for displaying the vessel’s current position and
tracking information.
• Alarm reporting and control, and a range of timers including countdown and
elapsed timers.
• Log record.
• Print option.
Navigational Displays
The chartplotter is compatible with the SeaTalk® and NMEA 0183 standards.
Full functionality of the chartplotter is achieved when it is part of an integrated
system, with other equipment connected via SeaTalk or NMEA 0183. Data
from this connected equipment, including position, waypoints and routes, is
displayed on the chartplotter and is used in calculations. Details of connecting
other equipment are given in Chapter 7.
Page 16

Chapter 1: Introduction 3
1.2 The Chart Display
The chartplotter includes a small-scale world map, detailed navigation
information is displayed when a chart card is installed.
The
The chartplotter screen includes a cursor data box which normally provides the
following information:
• The cursor position, in either latitude and longitude or TDs, depending on
your setup
• The vessel’s Course Over Ground (COG) and Speed Over Ground (SOG)
• A scale ruler in the selected units (e.g. nautical miles)
• The units in which chart depth data is displayed
• The cursor’s bearing (BRG) and range (RNG) from your vessel’s current
position
The cursor data box is also used to display the vessel’s position and the range
and bearing to the active waypoint, when the chartplotter is in Home Mode (see
Section 2.5).
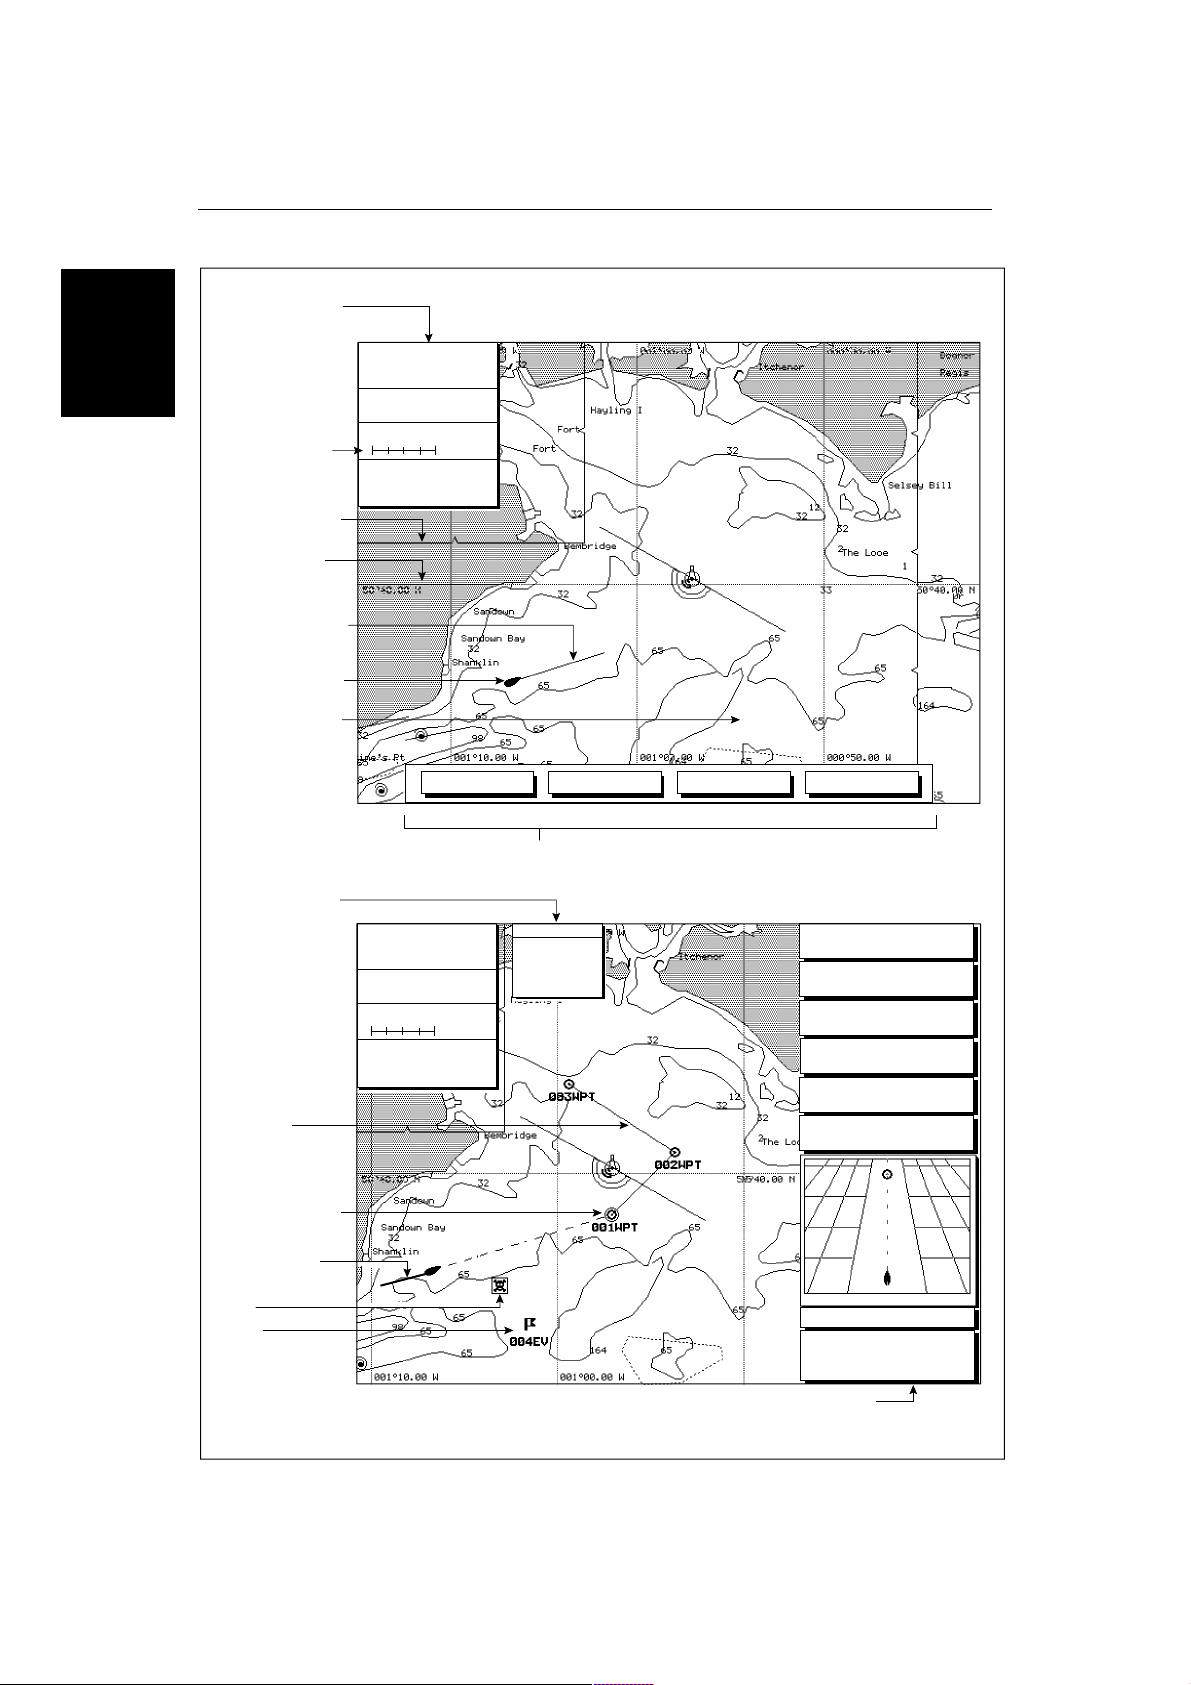
A sample chart display, in its default configuration with a chart card installed, is
shown in the top illustration overleaf.
The chart display can show additional information, depending on the current
data and on your setup selections, as shown in the example display in the
bottom illustration overleaf. You can also display the cursor position from other
compatible displays (see Chapter 6).
Chart Display
Note: If required, you can use the setup options to change the units in which
information is displayed, turn off the cursor data box and soft key labels, and
change the chart orientation (see Chapter 6).
Page 17
4
Chart Display
The
Cursor data box
Shows the current
cursor position as
either Lat/Long
or TDs
Scale rule,
in nautical miles
Chart boundary
Lat/Long grid
Vessel's heading
vector
Vessel's current
position
Cursor position,
controlled by the
trackpad
CURSOR
50°36.68 N
009°47.60 E
COG SOG
208°M 1.4$
DEPTH IN FEET
BRG
218°M 415.2$
100$
To Cursor
RNG
ROUTE GO TO RULER CENTER
RayChart 620 and 630
✣
Object data box
Route leg
Active waypoint
Track history
Mark
Event
Default soft key labels
These can be turned off. To redisplay them, press any soft key.
CURSOR
50°36.68 N
009°47.60 E
COG SOG
208°M 1.4$
DEPTH IN FEET
BRG
218°M 415.2$
100$
To Cursor
RNG
Objects: 1
NAB
Tr Racon
F1.W.10s27m16M
Horn(2).30s
✣
SPEED
DEPTH
HEADING
VMG
APP WIND
APP WIND
WPT 001 001WPT
XTE BRG RNG
0.00$
Customizable Window,
showing navigation data
and CDI
4.3
24.0
200
3.9
2.3
238
ON COURSE
M
201°
k
f
°
k
k
°
6.398$
t
t
M
t
t
P
D3819-2
Page 18
Chapter 1: Introduction 5
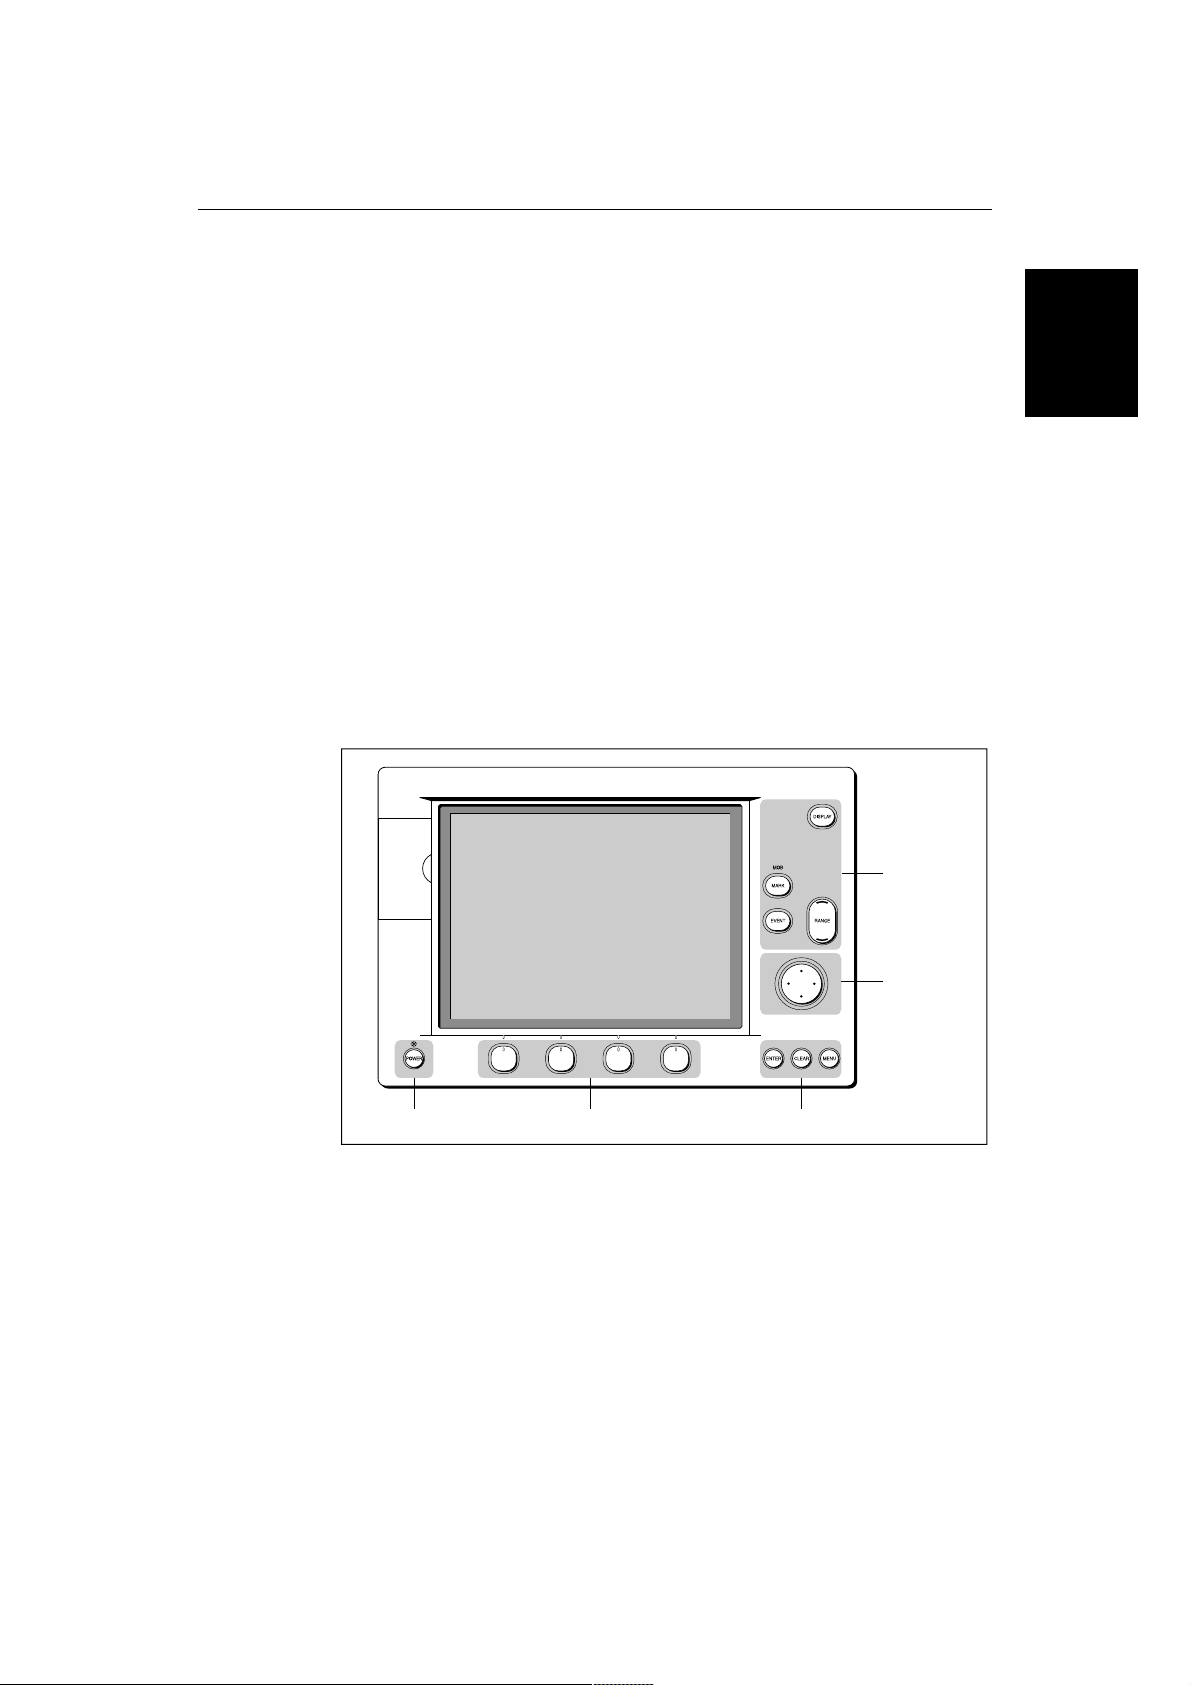
1.3 Operating Controls
To control the chartplotter, the keys on the display unit are used with on-screen
facilities such as pop-up menus. These include:
• A trackpad providing up, down, left, right and diagonal control of an on-
screen cursor.
• Eight dedicated (labelled) keys.
• Four soft keys with labels displayed on the screen.
• Pop-up menus, displayed on-screen, from which you select options.
• Database lists, displayed on-screen, which enable you to edit items.
✣
Note: The cursor is the cross symbol (
cursor with the trackpad and use it to select a position or item on the chart.
The controls are shown on the following illustration. They are back-lit for nighttime use. Many controls display a help message; you can switch help (and soft
key labels) off as described in Chapter 6.
) visible on the display. You move the
Controls
Operating
Dedicated key
Soft keys
Dedicated keys
The T r ackpad and Cursor
The trackpad has several functions:
• To move the cursor around the chart screen
• To select an item from a pop-up menu or database list
• To adjust a variable soft key control
• To enter names in database lists
You can press on any of the four sides of the trackpad to move the cursor in that
direction (up, down, left or right), or press two sections at the same time to move
Dedicated
keys
Trackpad
D3347_2
Page 19

6
RayChart 620 and 630
Operating
Controls
diagonally. The cursor moves faster as you continue to press the trackpad. The
current cursor position is shown in the cursor data box.
The cursor is displayed as a cross symbol (✣) on the chart. It is used to:
• Select a position on the chart.
• Select an item e.g. waypoint, on the chart.
• Pan the chart display.
➤ Try using the trackpad now to move the cursor around the chart. You can use
short presses on the trackpad to move the cursor small distances, or press and
hold to move the cursor quickly.
As you move the cursor to the edge of the display, the display pans across the
chart so that the area you have moved to remains in view. If you continue to
pan, the chart is redrawn on the screen at intervals.
If you move the cursor over an object for which there is information available,
an Object Data Box appears at the top of the screen (see Chapter 2).
Dedicated Keys
These keys have fixed functions. Some keys can be used in two ways:
• Press: Press the key momentarily and then release it. This method is used for
most key operations.
Controls
• Press and hold: Press the key and hold it down for the length of time stated
(for example, 3 seconds), and then release it.
Operating
When you press a dedicated key, one of the following happens:
a) The associated operation is performed, e.g. change chart scale (RANGE).
b) A pop-up menu is displayed, providing further options.
c) A set of soft keys is displayed, providing further functions.
As you press a key, a single audio beep confirms the key action. If the key-press
is not valid for the current screen or mode, three rapid beeps sound to indicate
that no response is available. If desired, you can turn the sound off as part of
your set up procedure (see Chapter 6).
The dedicated keys are defined in the illustration on page 9.
Page 20
Chapter 1: Introduction 7
The Soft Keys
The four keys below the screen are called soft keys because their functions
change according to the operation. The soft keys are grouped into related sets
and subsets providing access to the various functions. The soft key labels are
displayed on the screen just above the keys. The initial soft keys are displayed
until you press a key, or select an item on the screen; the soft keys associated
with the action are then displayed.
Note: Throughout this manual the term soft key label is shortened to soft key.
When you are instructed to press a soft key, this means press the key below the
soft key label.
You can control whether or not the soft key labels are displayed all the time,
using the system set up as described in Chapter 6. If no labels are displayed,
press one of the soft keys to make them appear. The labels disappear again if
you do not press a key for 7 seconds.
Like the dedicated keys, when you press a soft key one of the following
happens:
a) The associated operation is actioned, e.g. GOTO.
b) A sub-set of soft keys is displayed, providing further functions.
c) A pop-up menu is displayed, providing further options.
d) The appropriate database list (route, waypoint or track) is displayed.
Controls
Operating
As with dedicated keys, when you press a key, a single audio beep confirms the
key action. If the key-press is not valid for the current screen or mode, three
rapid beeps sound to indicate that no response is available.
Soft Key Initial Functions
In the initial operating mode, the soft keys provide a quick method of
performing the most commonly used tasks. These tasks are described in detail
in Chapter 3.
ROUTE
You use the soft keys to access the following functions:
ROUTE Set up or edit an on-screen route of waypoints, and navigate
towards them in turn
GO TO Navigate towards a location you have indicated with the
cursor
RULER Measure distances and bearings on the chart
CENTER Center the chart on the cursor, vessel or a specified position,
or select Home Mode
GO TO RULER CENTER
D3352_1
Page 21

8
RayChart 620 and 630
Operating
Controls
If different soft keys are displayed, press the CLEAR key to select the initial
functions.
Other Soft Key Functions
In addition to the initial soft keys, the dedicated keys MENU, EVENT, MARK,
DISPLAY or POWER provide access to different functions; these functions
have associated soft keys as shown in the illustration on page 9.
Press CLEAR to return to the initial soft key display.
Pop-Up Menus
Pop-up menus provide access to set up options. You use the trackpad to select
an option from the menu, then use the appropriate keys to set the option. An onscreen prompt tells you which key to use. When appropriate, an input box will
be displayed for you to enter information.
Database Lists
The waypoints and routes that you create on the chartplotter are stored in
database lists. You can view these lists and select items for editing.
When a list is on-screen, associated soft keys are also displayed; you use the
trackpad to select an item from the list, then use the appropriate soft key to
perform the required action. For example, you can delete a waypoint or a route.
Page 22
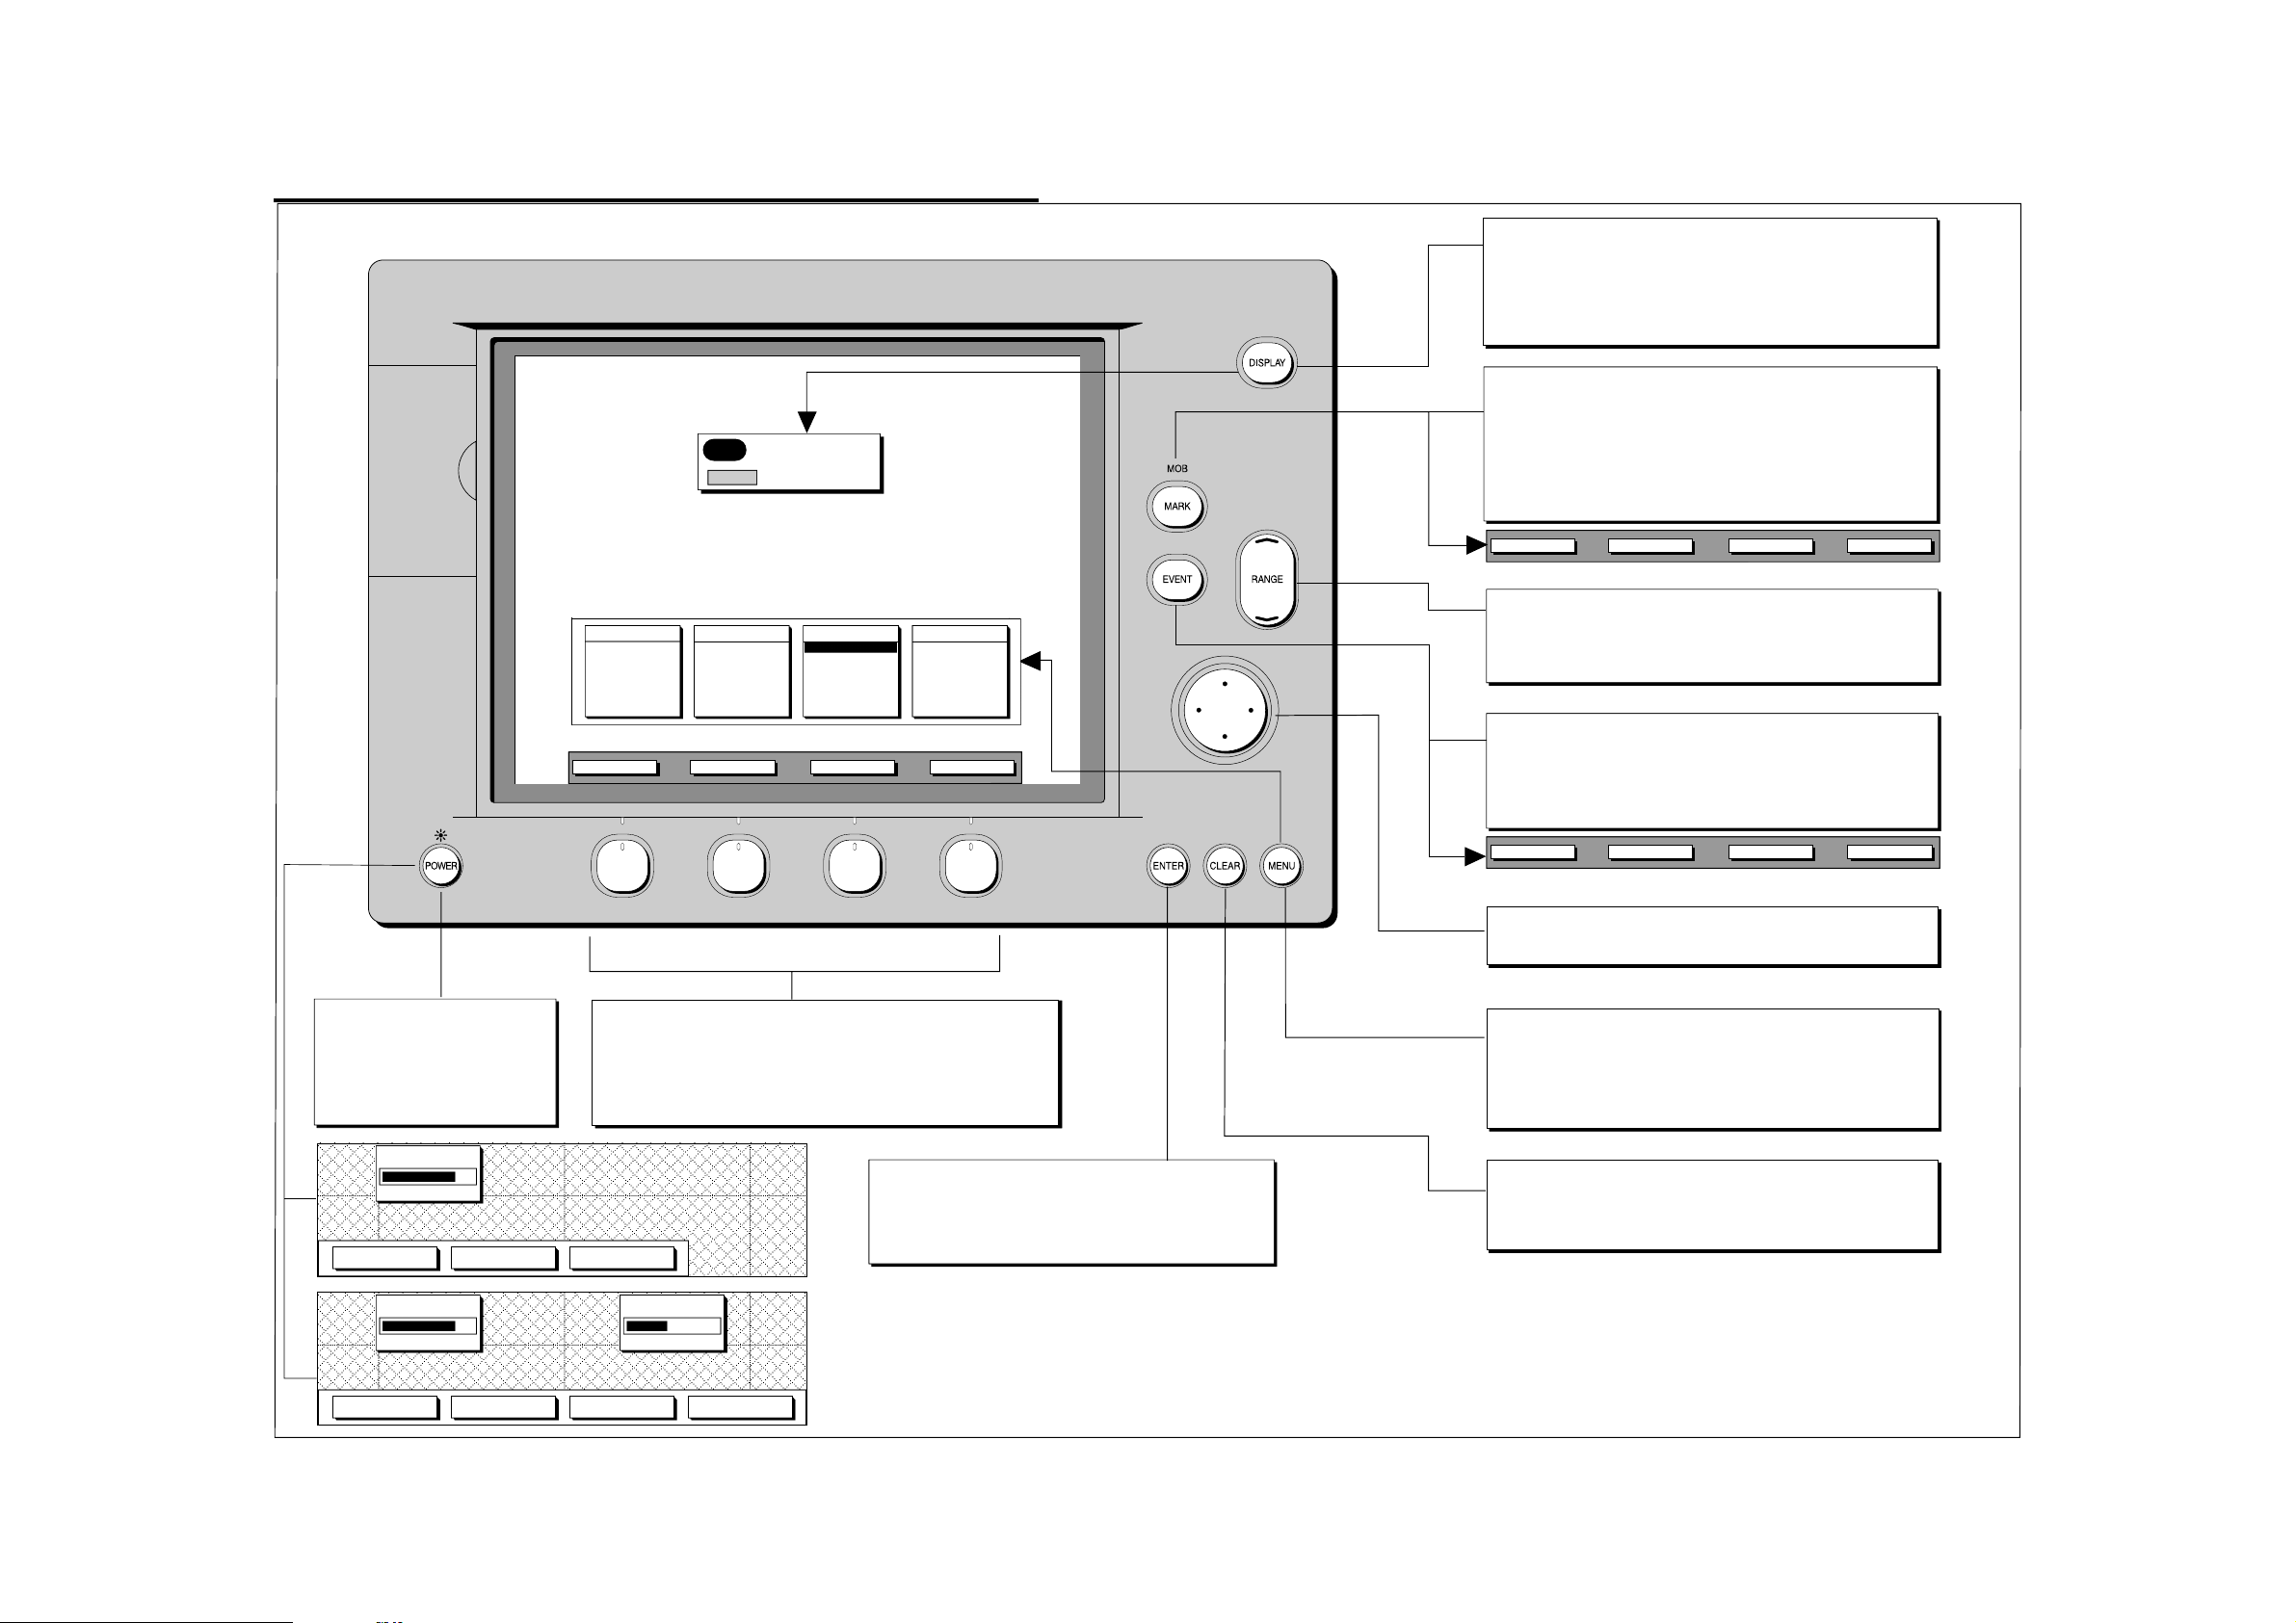
DISPLAY
FOR MAIN SCREEN SELECTION
CHART
NAV
9RayChart 620 and 630
DISPLAY
Press to display current main screen mode.
Press to toggle the main screen modes, and use the soft keys to
select the required window or a full-screen display.
The display times out to the normal display.
Press and hold for 5 seconds to print the current display
MARK
Press to display Mark soft keys
Choose Mark symbol.
Press PLACE MARK to place the mark symbol at the cursor position.
Press EXIT to finish.
MOB
Press and hold for 2 seconds to activate or cancel Man Overboard.
POWER
Press to turn on the display.
Press to access lighting control.
Press for 3 seconds to turn off
the display.
TRACKS
START
EDIT
DELETE
ROUTE GOTO
SCREEN EDIT SET UP
CARTOGRAPHY
ORIENTATION
WINDOWS
COLOURS
WAYPOINT LIST
CURRENT ROUTE
ROUTE LIST
FIND
LOG
RULER
SYSTEM
NAVIGATE
PLOTTER
ALARMS/TIMERS
FIX STATUS
MEMORY C-CARD
Soft keys
Press to select the indicated function, or scroll round a menu list.
If no labels are displayed, press any soft key to display the default
soft key labels.
Labels change when you press a dedicated key, as
shown above the keys.
CENTER
PLACE MARK
SELECT SYMBOL DELETE MARK
Chart range scale control
Press the top of the key to zoom out to a smaller-scale chart.
Press the bottom of the key to zoom in to a larger-scale chart.
Press and hold to change the scale faster.
EVENT
Press to display Event soft keys
Choose Event symbol.
Press PLACE EVENT to place event symbol at the vessel's position.
Press EXIT to finish.
PLACE EVENT SELECT SYMBOL
DELETE EVENT EXIT
Trackpad
Press the edge to move the cursor on the chart or in the menus.
MENU
Press to display the Main Menus, with the last-used option
highlighted. Use the soft keys or trackpad to highlight the required
option, and press ENTER.
Press CLEAR to finish.
EXIT
BRIGHTNESS
BRIGHTNESS - BRIGHTNESS + NIGHT VIEW
BRIGHTNESS CONTRAST
BRIGHTNESS -
BRIGHTNESS + CONTRAST -
CONTRAST +
ENTER
Press to confirm a selection and (if appropriate) clear the current
soft key labels. The key either performs the selected task,
accepts changes, or leads to a display of further options.
CLEAR
Press to cancel an operation or display, and return to the previous
display.
D3350-2
Page 23

10
RayChart 620 and 630
Page 24

Chapter 2: Getting Started and Controlling the Chart Display
Chapter 2: Getting Started and Contr olling
the Chart Display
2.1 Introduction
This chapter provides information, instructions and simple exercises to get you
started using the chartplotter. It will help you to become familiar with the chart
display and the functions of the controls before you start using the chartplotter
for routine navigation. It also explains how to change the back lighting, how to
use chart cards and how to control the chart display.
More detailed information on operating the chartplotter is given in Chapters 3, 4
and 5.
2.2 Switching the Chartplotter On and Off
➤ To switch the chartplotter on and start operation:
1. Press and release the red POWER key.
The keys light up, and the display shows the last-used location. Over this is
the chartplotter status screen, which includes:
- Software version number
- Database version number
- Chart number and description for any card in each of the two card slots.
After 10 seconds, the following caution is displayed:
CAUTION
The charts displayed on your Chartplotter are based on geographical data
that C-MAP believes to be accurate. However you should not rely on these
displays as your primary source of navigation, rather your Chartplotter
should be used only as a backup to official government charts and
traditional methods of navigation.
11
Started
Getting
Note: You can now turn on and adjust the display backlighting and contrast, if
required, as described later in Section 2.3.
2. When you have read the notice, press the CONTINUE soft key to accept the
caution.
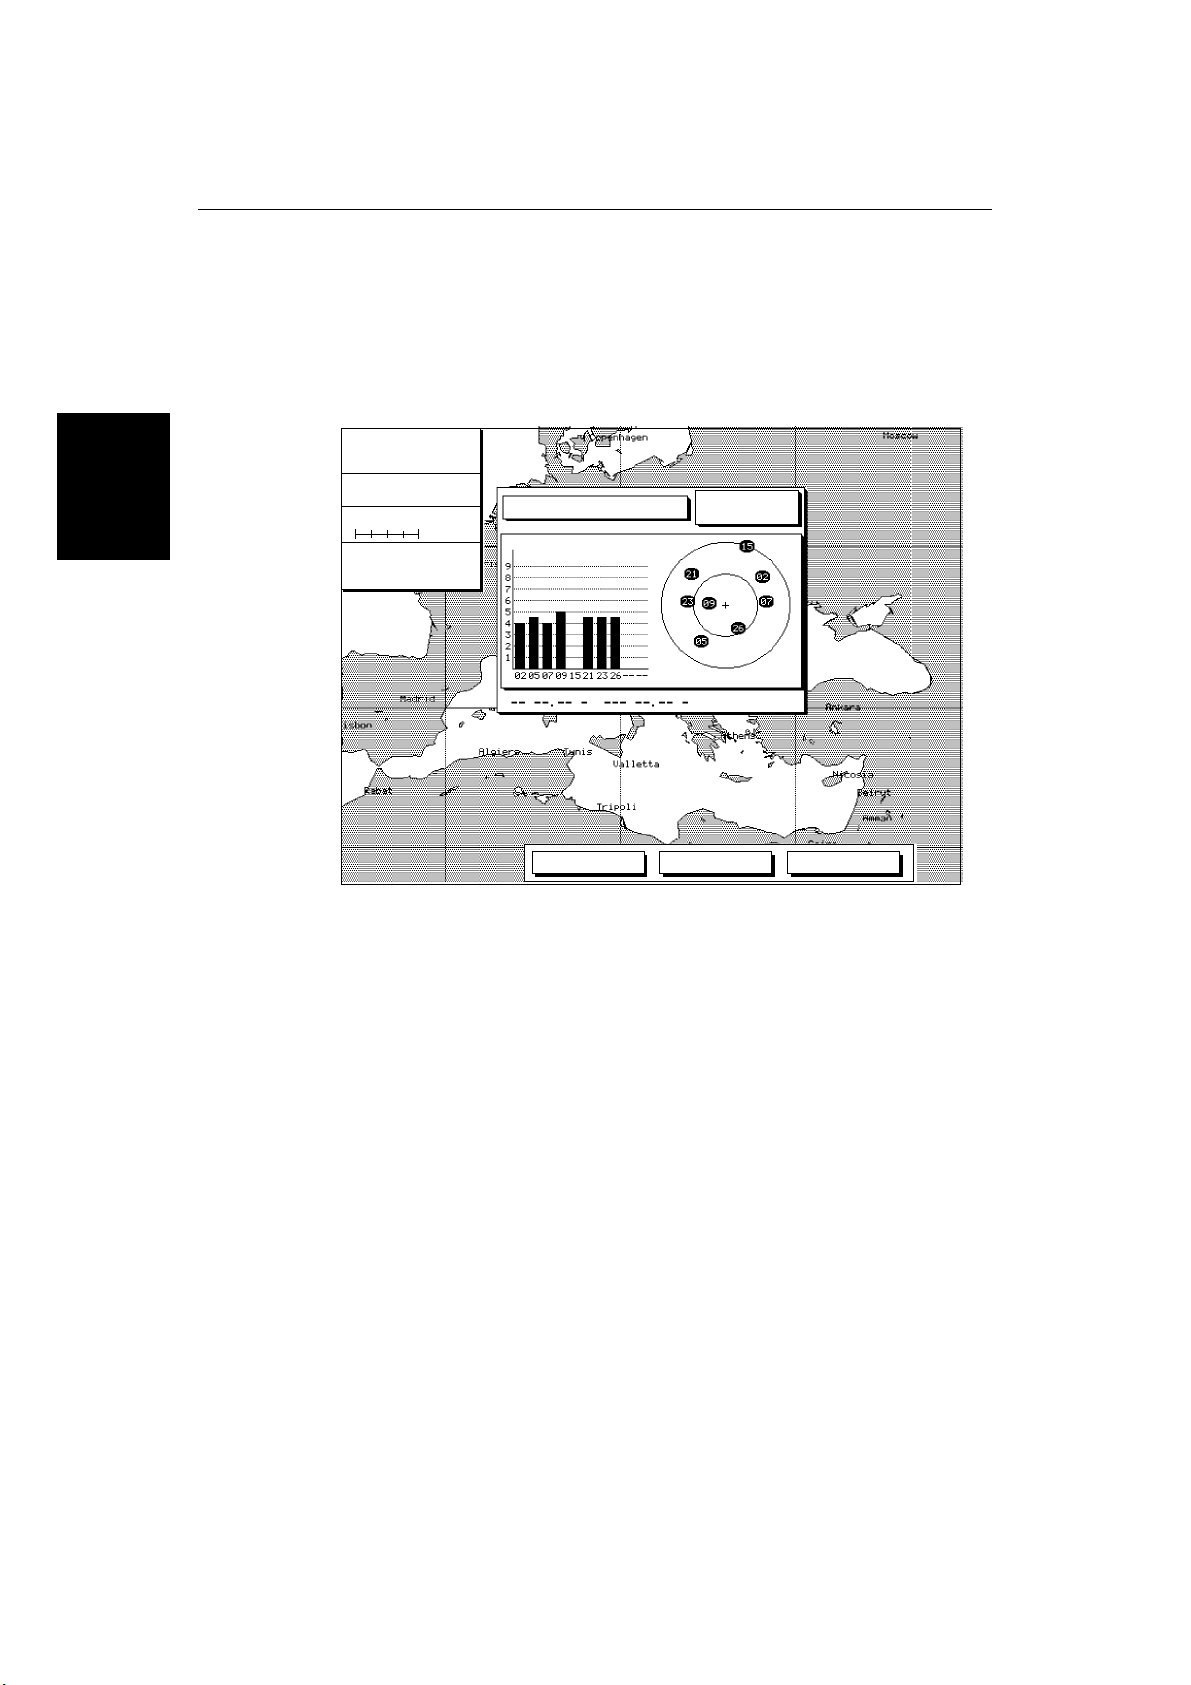
The Fix Status window, providing GPS status information is displayed. The
Fix Status window is illustrated and described on the following page.
3. To clear the Fix Status window and display the chart, press the CHART soft
key. (You can redisplay the Fix Status window later if required, as
described in Chapter 6.)
Page 25
Chartplotter
Turning the
On and Off
12
RayChart 620 and 630
➤ To switch the chartplotter off, press and hold the POWER key for three
seconds. A countdown timer is displayed, and if you release the key before the
timer reaches zero the chartplotter will remain on. Otherwise, when the timer
reaches zero the chartplotter display is cleared and the key lights go off.
Fix Status Window
CURSOR
50°36.68 N
009°47.60 E
COG SOG
208°M 1.4$
DEPTH IN FEET
BRG
218°M 415.2$
100$
To Cursor
RNG
ACQUIRING
02/24/97
10:09:14 U
HDOP: 1.Ø SOG: Ø.ØKts
BEACON INITIALIZE CHART
D3838-2
The right side of the window shows the satellite positions, with each satellite
identified by a number. The bargraphs on the left indicate the signal strength for
each of the currently located satellites. Initially, the chartplotter uses the
predicted satellite positions, and the bargraphs are blank until the satellites are
located.
The GPS searches for the strongest signals: at least four are required for an
accurate position fix. If the signals from the currently located satellites are not
strong enough, the GPS searches for other satellites and these are displayed in
turn. If the fix is from another source (e.g. Loran) the display ahows “Good Fix”
but satellite positions may not be shown.
If a position fix has not been established, a “Fix Alarm” message is displayed.
You can clear the alarm by pressing any key. The unit will beep every few
seconds to indicate there is no position fix, until the position has been
established.
The soft keys INITIALIZE and BEACON can be used to initialize the GPS and to
manually set up a differential beacon. These functions are described in
Chapter 6.
Page 26
Chapter 2: Getting Started and Controlling the Chart Display
2.3 Adjusting the Lighting and Contr ast
You can change the level of screen backlighting and monochrome screen
contrast.
• A 630 Chartplotter with color display has six brightness levels and a day/
night view setting.
• A 620 Chartplotter with a monochrome display has six brightness levels and
40 contrast levels.
13
Note: The color display lighting can be dimmed but cannot be turned off.
The control key lighting is bright when the screen backlighting is on.When the
screen lighting is off, the keys are lit at a low level so that you can always find
the keys.
➤ To change the backlighting and contrast:
1. Press the POWER key. (Do not press and hold the key, or the power-off
message will be displayed.)
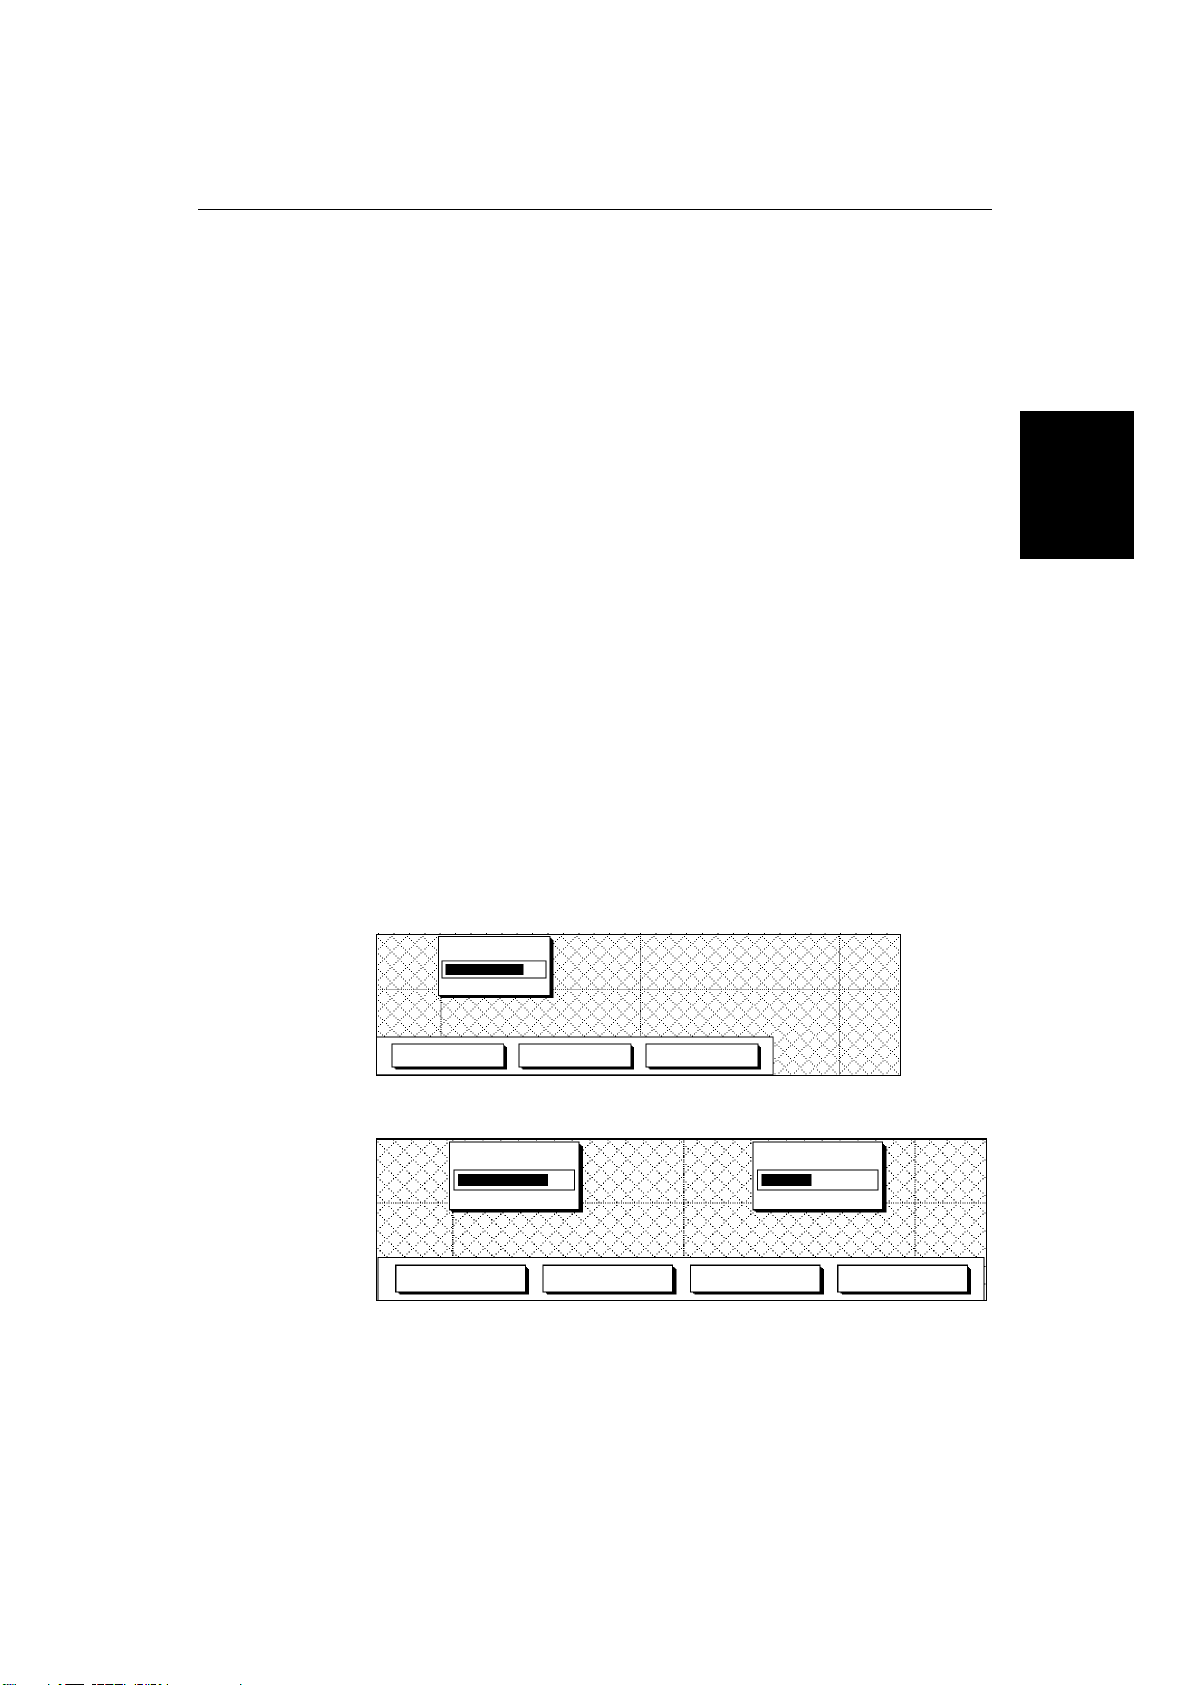
The brightness slider is displayed on the color screen; the soft keys provide
control of the slider and the night /day setting.
Two sliders appear on the monochrome screen, showing the current
settings for brightness and contrast; the soft keys provide control of the
sliders.
Color
BRIGHTNESS
BRIGHTNESS - BRIGHTNESS + NIGHT VIEW
D4195_1
Contrast
Lighting and
Adjusting the
Monochrome
BRIGHTNESS CONTRAST
BRIGHTNESS -
BRIGHTNESS + CONTRAST -
CONTRAST +
2. Press the appropriate soft key, to adjust the backlight brightness or the
contrast to the required level. The brightness and contrast change as you
adjust the sliders.
On the color display, press the NIGHT VIEW/DAY VIEW soft key to switch
between the night and day setting.
D3820-1
Page 27

Chart Cards
Using
14
3. Press ENTER or CLEAR to store the new settings and return to the previous
display.
Alternatively, after several the seconds the lighting controls are removed
and the screen returns to the previous display.
The new lighting and contrast levels are retained until you reset them or turn off
the chartplotter.
At power-on, the monochrome screen lighting is always off, but the last-used
contrast setting is retained.
The color screen powers-on at the last used settings for brightness and night/day
view.
2.4 Using Chart Cards
The chartplotter has a built-in world map. Most areas are covered on a scale of
about 300nm per inch on the screen, although some populated areas have
details down to 30nm per inch on the screen. The chartplotter displays a scale
indicator on the screen for all chart displays.
RayChart 620 and 630
To use the chartplotter fully, charts with detailed information for the area in
which you wish to navigate are required. These are available on C-MAP NT
electronic chart cards (C-Cards), each of which can store as many as 20 charts
in an electronic format. A single C-MAP chart normally provides as much
information as is available in paper charts for that geographic area, with detail
up to 0.05nm per inch.
The chartplotter allows you to install two chart cards at the same time. You can
also use the slots for C-MAP Memory C-Cards, which allow you to store and
retrieve data such as waypoints and routes.
Note: You can insert and remove cards while a chart is displayed. The chart
information is displayed when the chartplotter redraws the screen eg, when you
pan outside the current area or use the
After removal of a card, chart information is retained until screen redraw.
You should not insert or withdraw either card whilst a chart is redrawing.
RANGE
key to change the chart scale.
Inserting a Chart Card
➤ To insert a chart card:
1. Check that the card is the correct format (C-MAP NT C-Card), with the
required chart stored on it.
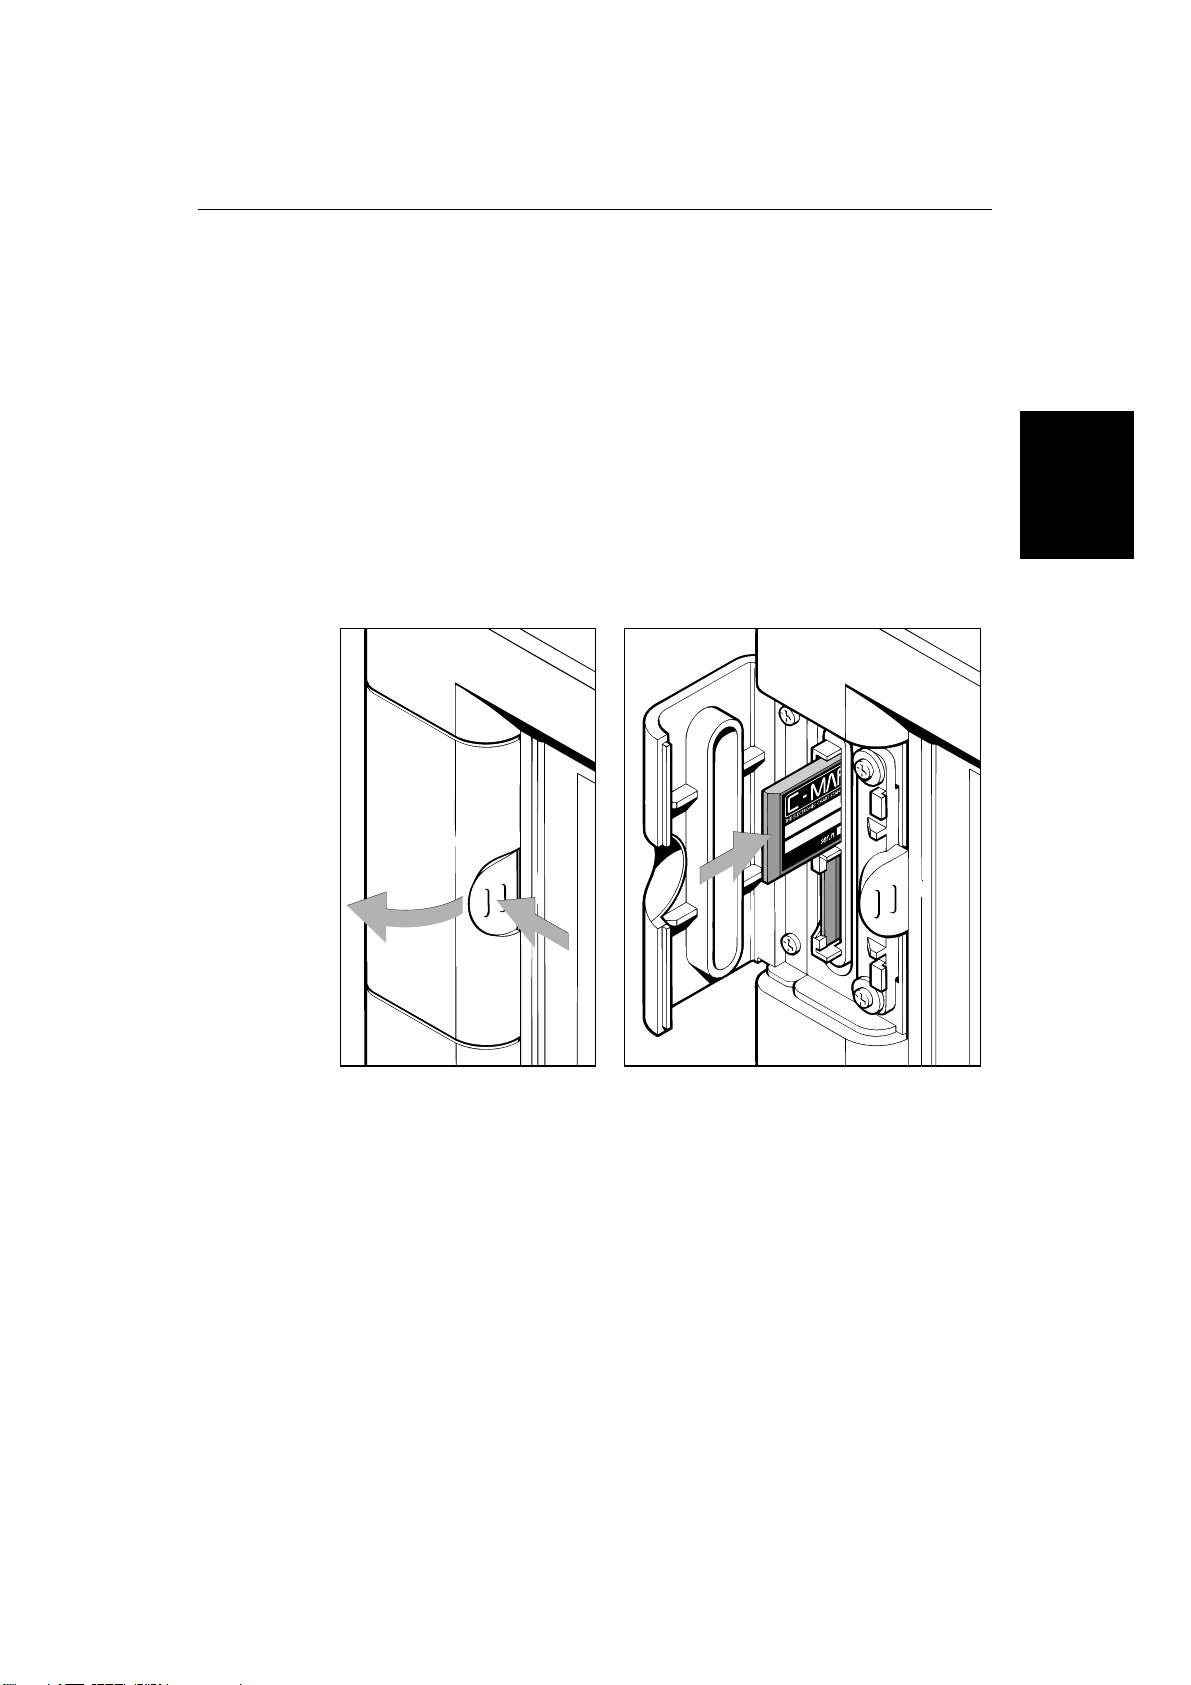
2. Open the card cover, at the top left of the chartplotter front panel, by
pushing the latch to the left and then opening the cover as shown in the
illustration on the following page.
Page 28
Chapter 2: Getting Started and Controlling the Chart Display
3. Hold the card with the metal contacts facing left and the text “front
insertion” towards the card slot. The C-MAP label will be facing right, as
shown in the illustration.
4. Gently push the card into one of the two slots. It will only go in if it is the
right way round.
Push the card in as far as it will go, then move it to the left so that the top is
under the retaining pegs. Release the card so that it is held in place by the
pegs.
5. Close the card cover so that is clicks shut, to stop water splashing into the
chartplotter.
6. Display the chart information by pressing the RANGE key to change the
chart scale.
15
Using
Chart Cards
Removing a Chart Card
➤ To remove a chart card:
1. Open the card cover, at the top left of the chartplotter front panel, by
pushing the latch to the left (see above).
2. Press down the card you wish to remove, and move the top of the card to the
right to clear the retaining pegs.
3. Pull out the card.
Displaying the Chart Data
The new chart information will be displayed when you move the cursor into an
area covered by the new chart and zoom in.
D3353_2
Page 29

Chart Cards
Using
16
RayChart 620 and 630
The boundary of each chart digitized in the displayed card is shown as a box or
rectangle. (You can switch off the chart boundaries display if you wish, as part
of the chartplotter setup described in Chapter 6).
➤ To zoom in:
1. Use the trackpad to move the cursor inside one of the chart boxes, and press
the lower part of the RANGE key.
That area is expanded so that you can see more detail. Note that the smaller
the chart box is on the screen, the greater the amount of detail that is
available when you zoom in.
Note: You cannot zoom out further than the world map and, unless you
have switched on the Plotter Mode, you cannot zoom in further than the
most detailed chart.
Displaying Information About Objects
Chart cards include a number of displayed objects for which information is
available, such as lights and buoys. Chart source data is also available and, if
your chart includes port and tide data, this can be displayed. You can use the
cursor to identify the object and display detailed information. In addition,
position information is available for waypoints and events added using the
chartplotter functions.
➤ To obtain the chart object information:
1. Move the cursor over the symbol for which you require the information.
After a moment, an Object data box appears at the top of the screen, as
shown at the top of the example below.
If the cursor is over more than one object for which information is available,
the number of objects is shown and their descriptions are listed.
2. To view further details, press ENTER. The soft keys EXPAND, ALLINFO and
NEAREST are displayed.
3. To obtain expanded information about the object(s):
a. Press the EXPAND soft key. The objects and any sub-objects are listed in
a window in the center of the screen.
b. Use the trackpad to scroll up and down the list, and highlight the
required object or sub-object.
c. Press ENTER. Any available information is displayed.
If there is more than one page of information for the object, you can
page through it using the PAGE DN soft key, and go back to the beginning
using the BACK soft key.
d. Press CLEAR to return to the expanded list, and select another object if
required.
Page 30
Chapter 2: Getting Started and Controlling the Chart Display
e. Press CLEAR to clear the expanded information display, and return to
the EXPAND and ALLINFO soft key display.
17
CURSOR
50°36.68 N
009°47.60 E
COG SOG
208°M 1.4$
DEPTH IN FEET
BRG
218°M 415.2$
100$
To Cursor
RNG
Objects: 1
NAB
Tr Racon
F1.W.1Øs27m16M
Horn(2).30s
Objects:
Lighthouse
Tower
Light
Radar transponder beacon
Fog signal
Depth area
Source of data
4. To obtain all the information available at this location:
a. Press the ALLINFO soft key.
The information is displayed in the same way as the expanded data, but
includes additional information such as the depth area and the source of
the data.
b. Press CLEAR to clear the detailed information display, and return to the
EXPAND and ALLINFO soft key display.
5. To obtain port information for the nearest ports:
a. Press the NEAREST soft key. The port facility symbols are displayed.
b. Use the trackpad to highlight the facility for which you require
information, then press ENTER.
c. The nearest ports providing that facility are listed, with distance and
bearing to the port. If you highlight a port name, then press ENTER the
cursor moves to that port (redrawing the chart) and the details for that
facility are displayed.
Note: The distance and bearing to port is a direct measurement and is not
necessarily a safe route to the facility.
d. Press CLEAR, the facility symbols for the selected port are displayed as
described below.
6. Press CLEAR to return to the initial soft key display.
Using
Chart Cards
D3822-2
Page 31

18
RayChart 620 and 630
Port Area
At large chart scales port area information is indicated by the symbol .
Where available, details for each facility can be displayed. In some areas the
chart shows symbols for individual facilities. The facilities and their associated
symbols are defined below.
Chart Cards
Using
➤ To obtain port facility details
1. Place the cursor over the port symbol
. The port facility symbols are
displayed
2. Press ENTER to display the soft keys EXPAND, ALL INFO and NEAREST.
3. Press EXPAND or ALL INFO to list the port facilities in the object information
pop-up.
4. Use the trackpad to highlight the required facility then press ENTER. The
details for that facility are displayed.
5. Press CLEAR three times to return to the initial soft key display.
D4211_1
Page 32

Controlling
the Chart
Chapter 2: Getting Started and Controlling the Chart Display
Tide Data
The symbol indicates tide height data is available for that position on the
chart. The Raychart displays a graph of real time predictions of the maximum
and minimum tide heights for the selected day. A digital readout provides
sunrise and sunset as well as tide details for the selected day. Time is displayed
in the selected local time zone.
Note: Tide predictions are accurate for moderate weather conditions. However
severe weather patterns can affect actual time and height.
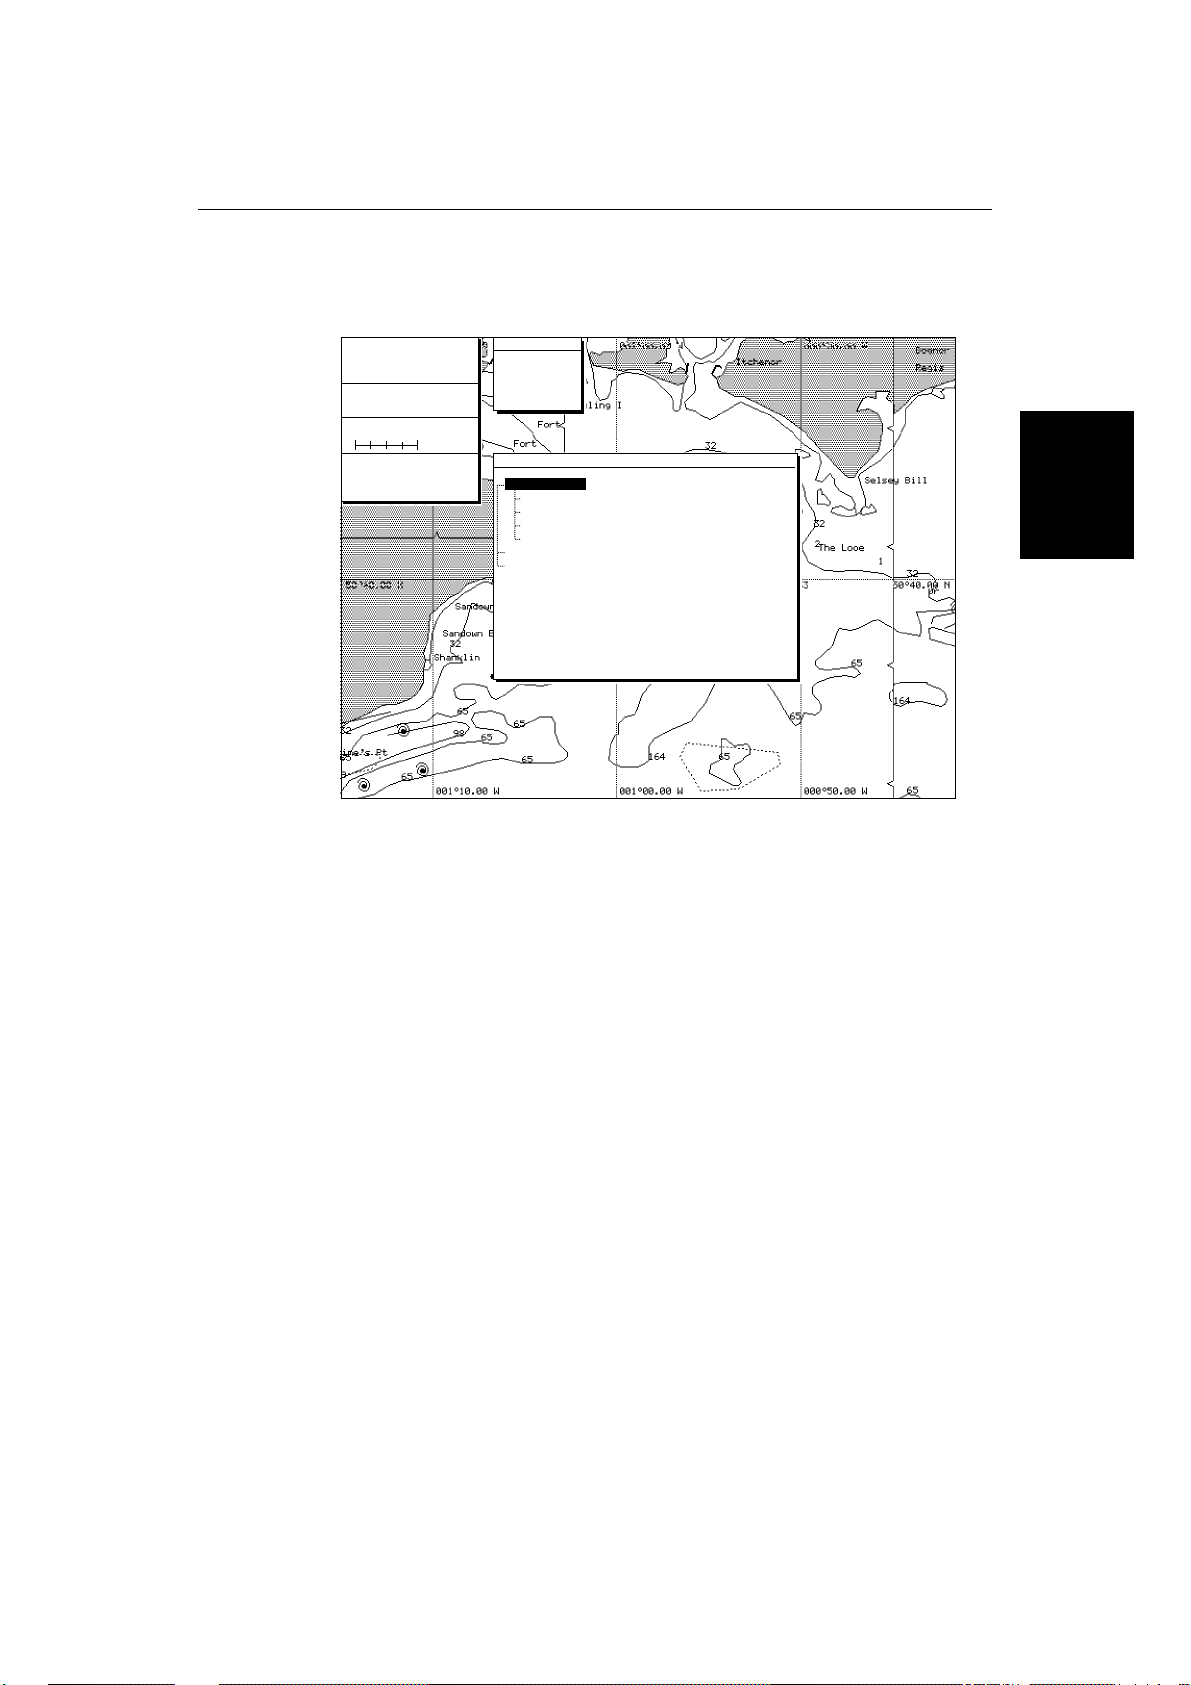
➤ To obtain tide height data:
1. Place the cursor over the tide symbol
and the soft keys EXPAND, ALL INFO and NEAREST are displayed.
2. Press EXPAND. The data is displayed as illustrated below.
19
Using
Chart Cards
. The tide height object data box
D4196_1
The time and draught are represented by a dotted vertical and horizontal line on
the graph. You can use the trackpad to move the lines; you move the vertical
line to select a time for which the tide height is displayed.
You can use the soft keys and trackpad to change the date for which tide
information is shown.
➤ To select a time, press the left or right side of the trackpad to move the cursor to
the required time.
➤ To change the day press PREV. DAY, TODAY or NEXT DAY as required.
Alternatively, press SET DATE; to change date, use the trackpad to move the
cursor left/right to select the digit and up/down to increase/decrease the digit.
The graph and tide data are updated.
Page 33

20
2.5 Controlling the Chart
You control the chart display using the cursor and control keys. You start all
operations with the initial soft keys displayed (this is referred to as the initial
screen in the following sections).
RayChart 620 and 630
Controlling the
Chart
When you have completed an action using the soft key sub-sets, to return to the
initial screen, press CLEAR; you may need to press CLEAR several times to
back-track through the sub-set hierarchy.
Note: If you have set up your system so that the initial soft keys are not
displayed all the time, press any soft key to display the labels.
Although you can use your chartplotter with the whole screen devoted to the
chart, you can also display navigation data in one or two windows, with the
chart displayed in the rest of the screen. Navigation data windows are controlled
using the DISPLAY key.
This section describes how to:
• Move around the chart by panning the display, changing the chart scale and
changing the chart centre.
• Display navigation data.
Note: The orientation of your chart (North Up, Course Up or Head Up)
depends on your choice when you set up the chartplotter, as described in
Chapter 6.
The chart controls are summarised in the illustration on page 9.
the Chart
Controlling
Moving the Chart
You will normally operate the chartplotter with the chart showing your vessel’s
current location. In the default North-Up orientation, the display is in True
Motion mode, in which the vessel moves across the screen. You will need to
move the chart if your vessel moves out of the area currently displayed, or if you
wish to examine or place marks/waypoints in another area.
There are three ways in which you can move the chart:
• Use the trackpad to move the cursor to the edge of the chart. The chart will
pan across (see Section 1.3). This method is useful if the area you wish to see
is only just off the screen.
• Use the RANGE key to zoom out to a small scale chart, move the cursor to the
centre of the required area, then zoom in on the new area . This method is
useful if the area you wish to see is a long way away.
• Use the CENTER soft key to center the chart on one of a choice of positions:
the vessel’s position, the cursor position or a specified position .
• Automatically re-center the chart using the HOME option.
Page 34

Controlling
the Chart
Chapter 2: Getting Started and Controlling the Chart Display
Note: If you have selected a chart display with one or two data windows, the
chartplotter will treat the start of the data window as the edge of the chart.
Changing the Chart Scale
The RANGE key allows you to change the cartography scale so that you can see
a smaller or larger area on the screen. Plotter mode is available to allow you to
zoom into a smaller area, even when no chart data is available for that scale.
Chapter 6 describes how to set plotter mode on/off.
21
Contrllong
The Chart
You can change the chart scale for two purposes:
• To see either more detail (a smaller area) or a larger area on the screen
• To move the display to another area of the chart, by zooming out to a small
scale chart, then zooming in on another area
Small scale charts give you the wider view, but without the level of detail that
you may need in order to navigate safely. The amount of detail that is visible
depends on the amount available for that chart, and also on how you have
specified the cartographic detail when you set up your chartplotter (see Chapter
6).
➤ To zoom in to a larger scale chart:
1. Use the trackpad to position the cursor in the area you wish to see in more
detail.
2. Press the lower part of the RANGE key.
The section of the chart around the cursor is enlarged to fill the screen with
a larger-scale chart showing more detail. The cursor is now positioned in
the center of the screen.
The range scale indicated at the top left of the screen is updated.
Note: If you hold down the RANGE key, the range scale display is redrawn
quickly without the chart being redrawn. Simply release the key when the
required scale is shown, and the chart will then be updated.
3. If further chart enlargement is available using the current chart card you can
press the bottom of the RANGE key to zoom in again, repositioning the
cursor first if required.
An area of further chart detail is indicated by a chart boundary.
4. When no further chart detail is available, as you press the bottom of the
RANGE key, the effect depends on whether you have set Plotter Mode on
or off as follows:
- If Plotter Mode is off (the default setting), the chartplotter beeps three times
and the range scale remains unchanged.
- If Plotter Mode is on, the range scale is increased and the display shows grid
lines and no cartography. The letter “P” is displayed after the scale rule to
the Chart
Controlling
Page 35

Controlling the
Chart
22
RayChart 620 and 630
indicate that the chartplotter is in Plotter Mode.
The chart detail is restored when you return to a chart scale for which the
information is available.
➤ To zoom out to a smaller scale chart, simply press the upper part of the RANGE
key as many times as required. If no smaller scale chart is available, then the
chartplotter beeps three times when you press the upper part of the RANGE key.
Changing the Chart Center
You can move a chosen point to the center of the chart, using the CENTER soft
key. The chosen point can be the vessel’s position, the cursor position or a
specified position.
You can also select Home Mode, which centers the vessel, homes the cursor
and changes the cursor data box to provide information about your vessel’s
position. The chart moves to ensure that the vessel remains on-screen.
Note: Changing the range scale always centers the chart on the cursor.
the Chart
Controlling
Centering the Chart
➤ To center the chart using the CENTER options:
1. From the initial soft key display, press the CENTER soft key.
The following soft keys are displayed:
CENTER BOAT
CENTER CURSOR REMOTE CENTER HOME
2. Press the soft key for the center option you require (or CLEAR to return to
the initial screen):
- CENTER BOAT moves the chart so that your vessel’s position is at the centre
of the chart, and repositions the cursor so that it is over the vessel
- CENTER CURSOR moves the chart so that the point you selected with the
cursor is at the centre of the chart
- REMOTE CENTER displays an input box for you to enter the position for the
new center
- HOME moves the chart so that your vessel’s position is at the centre of the
chart, and enters Home Mode (see below)
3. If you pressed REMOTE CENTER, the input box displays the current cursor
position, as latitude and longitude or TDs depending on your system.
D3351_1
Page 36

Controlling
the Chart
Chapter 2: Getting Started and Controlling the Chart Display
REMOTE CENTER
LAT: 39°21.11 N
LON: 009°52.55 E
ENTER
CLEAR
CANCEL
SELECT
SCROLL
DIGITS
ACCEPT
SELECTION
Change the values to the screen centre, as follows:
a. Move the cursor to the first digit you wish to change, using the left or
right trackpad controls. When you move right from the latitude
direction, the cursor moves to the first longitude digit.
b. Increase or decrease the number, using the up or down trackpad
controls.
c. Repeat steps a and b until all the digits are set to the required values.
d. Press ENTER to set the position or CLEAR to cancel and return to the
initial display.
4. The display returns to the CENTER soft keys display, with the new chart
position. Press CLEAR to return to the initial display.
D3821-1
23
the Chart
Controlling
Using Home Mode
When you select the HOME option, the chartplotter centres the vessel and
changes to Home Mode. In this mode:
• The cursor is not displayed, but is fixed to the vessel’s position
• The cursor data box displays the vessel’s current position; if you are tracking
to a waypoint, it also displays the waypoint name, bearing and range
• In Head Up or Course Up modes (see Chapter 6), the display changes to
Relative Motion, in which the chart moves to keep the vessel in the centre of
the display.
• In North Up mode, the chart moves to ensure the vessel remains on-screen.
➤ To return to the standard cursor and motion mode, press the trackpad. The
cursor re-appears and the cursor data box displays the cursor position data.
Page 37

Controlling the
Chart
24
RayChart 620 and 630
Displaying Navigation Data
Although you can use your chartplotter with the whole screen devoted to the
chart, you also have the option of displaying a wide range of navigational data.
This information is normally presented in one or two windows, with the chart
displayed in the rest of the screen. Three options are available for displaying
navigational data:
• Chart displayed Full Screen, with no additional data.
• Chart displayed with pre-defined navigational data in one or two Windows.
• Chart with Navigation insert displaying Bearing Deviation Indicator (BDI)
or Course Deviation Indicator (CDI).
The navigational data windows are controlled using the DISPLAY key. When
you press the DISPLAY key, the following prompt is displayed, with the lastused option highlighted:
DISPLAY
FOR MAIN SCREEN SELECTION
CHART NAV
D3839-1
Press DISPLAY to toggle between the two settings:
CHART Displays the last used option – Full Screen chart, or chart
with window.
The soft keys let you select a FULL screen chart, or a chart with the
current WINDOW(s) configuration. If Windows are selected, you
can change the window configuration.
NAV Displays the chart and inserts the last-used navigation indicator at the
bottom right of the screen. You can use the soft keys to select a BDI
or CDI display.
The soft key labels disappear after 7 seconds if you do not make a selection.
The display options are described in more detail in the following sections.
Chart
The CHART soft keys let you select either a Full Screen chart or a chart with data
window(s). When you press the DISPLAY key to select the CHART option, the
last used configuration is displayed.
FULL
WINDOW WINDOW SET UP
D4203_1
Page 38

Chapter 2: Getting Started and Controlling the Chart Display
Ten navigational data windows are available for display; six are pre-defined
and supplied with the chartplotter, in addition four can be customized as part of
your set up procedure, described in Section 6.3. You can display one or two
data windows and select the window position.
The windows soft keys disappear after seven seconds if you do not make a
selection.
Changing between Full Screen and Windows
➤ You can change between the full screen display and windows display using the
soft keys as follows:
FULL Clears any data windows .
WINDOW Displays the chart with navigational data, in the
current default windows configuration.
Press CLEAR to return to the initial soft key display .
Changing the Window Set Up
25
the Chart
Controlling
The WINDOW SET UP soft key lets you change the window configuration. You
can select:
• The number of windows (1 or 2)
• The position of the windows on the screen
• The contents of the windows, by selecting from the list of predefined or
customized windows available
Notes:
1. It is recommended that you customize the windows, as described in
Section 6.3, before you select a custom window for display.
2. If the help level is set to Level 1 (the factory setting), the windows are moved
up the screen so that they do not overlap the soft keys. This means that you
cannot select two windows in a full-height column: if you wish to do so, you
must change the help setting to Level 0, as described in Chapter 6.
➤ To change the window configuration:
1. Press DISPLAY to display the Chart soft keys (see above).
2. If a window is not already displayed, press the WINDOW soft key.
3. Press the WINDOW SET UP soft key to display the selection keys and current
settings, as shown in the following example.
Page 39

Controlling the
Chart
26
RayChart 620 and 630
DISPLAY
FOR MAIN SCREEN SELECTION
CHART NAV
NOT TRACKING
SELECT
LEFT WINDOW
DEF. WINDOW 01
D3833-1
4. Use the two left-hand soft keys to select the number and location of the
windows. You can select:
- One window at the bottom left of the chart display
- One window at the bottom right of the chart display
- Two windows, one above the other, in a full-height column at the
right of the chart display
The display changes as you highlight the different settings.
5. Use the SELECT LEFT/BOTTOM WINDOW or SELECT RIGHT/TOP WINDOW soft
key to scroll through the available data sets for the window.
Each time you press SELECT WINDOW, the next available set of data is
displayed in the current window. These sets include the six default
windows supplied with your chartplotter, plus the four custom windows
you can set up as part of your display setup procedure (see Chapter 6).
6. When you are happy with your selections, press ENTER to return to the
initial soft key display.
Alternatively, press CLEAR to cancel your selections and retain the
previous configuration.
7. Press ENTER, or wait 7 seconds, to return to the initial soft key display.
Navigation
The NAVigation display soft keys let you to select a chart display with either of
the following:
• CDI, the Course Deviation Indicator, which shows off-course error as the
distance your vessel is from the current track
• BDI, the Bearing Deviation Indicator, which shows off-course error as the
difference between your vessel’s heading and the bearing to waypoint
When you press the DISPLAY key to select the NAV option, the indicator you
last used (CDI or BDI) is shown.
Page 40

Chapter 2: Getting Started and Controlling the Chart Display
The soft keys disappear after 7 seconds if you do not make a selection.
The CDI or BDI data is presented in a window at the bottom right of the screen,
with steering data, as shown in the examples below:
CDI (Course Deviation Indicator)
Waypoint graphic, fixed until within 3nm
then moves down the screen
27
Rolling range lines at 1nm intervals
Vessel graphic
On-course indicator or direction to steer indicator
STEER LEFT
WPT 001 001WPT
XTE BRG RNG
0.11 200
°M
5.948
First arrow - XTE more than 0.01nm
Second arrow - XTE more than 0.05 nm
Waypoint sequence number and name, with
cross track error, bearing and range to waypoint
BDI (Bearing Deviation Indicator)
Compass
Range, updated as the vessel moves
Waypoint graphic, moves as distance and bearing
to waypoint change
STEER LEFT
WPT 001 001WPT
XTE BRG RNG
0.11 200
°M
5.948
On-course indicator or direction to steer indicator
Waypoint sequence number and name
Cross track error, bearing and range to waypoint
If there is no active waypoint, the message NO ACTIVE WAYPOINT is displayed
in the window.
D3834-1
the Chart
Controlling
Page 41

28
RayChart 620 and 630
Page 42

Chapter 3: Using the Initial Soft Keys 29
Chapter 3: Using the Initial Soft K eys
3.1 Introduction
This chapter explains how to perform some basic chart operations using the
trackpad, and the soft keys. The initial soft key display is shown below.
ROUTE
GO TO RULER CENTER
D3352_1
Note: If you have set up your system so that the soft keys are not displayed all
the time (Help Level 0), press any soft key to display the labels.
This chapter covers the following topics:
• Setting up and using on-screen routes
• Using the GO TO key to navigate towards a selected point
• Measuring distances using the RULER key
Further basic functions, including track histories and placing marks and events,
are described in Chapter 4. More advanced operation, involving the stored lists,
is described in Chapter 5, including retrieving stored routes and making new
routes using stored waypoints.
Safety
The chartplotter makes it very easy to mark a waypoint and track towards it.
However, you should always check first that the route is safe. If you are using
the chartplotter in combination with a SeaTalk autopilot, the autopilot will
prompt for confirmation before it steers the vessel towards the waypoint.
If you have entered your route using a small-scale chart, zoom in to a larger
scale to check for hazards, such as small shoals, that may not be shown on the
smaller scale.
Using the
Inital Soft Keys
Page 43

Using On-Screen
Setting Up &
Routes
30
3.2 Setting Up and Using On-Screen Routes
The ROUTE soft key provides a quick and easy method of setting up (or
selecting) and using a route.
Note: You can also create, edit and control routes using the
as described in Chapter 5.
The chartplotter can store up to 20 routes in the route list. When you want to
create a new route, you can either select an empty position in the list, or select
an existing route and edit it.You can also erase routes. If you need to keep more
than 20 routes, you can save the information to a memory card (see Chapter 6).
Note: If you have two chartplotters on your system, the current route (active or
GO TO
selected) or
chartplotter. It is therefore advisable to avoid using Route 0 when you create a
route.
When you press the ROUTE soft key, a menu such as the following is displayed:
on one chartplotter is displayed as Route 0 on the other
RayChart 620 and 630
EDIT
menu options,
RTE 1
MAKE / EDIT
ERASE
FOLLOW
REVERSE
NEXT LEG
SELECT
ROUTE 01
D3826-1
Note: The route number selection defaults to the last-used route. The available
menu options depend on the contents of the selected route: If this route is empty,
only the Make/Edit option is displayed; if the selected route is Route 0 and it is
the active route from another chartplotter, the
REVERSE
options are
ERASE
and
not displayed.
The menu options are as follows:
MAKE / EDIT Used to set up a new route using the cursor. You can also use
this option to edit an existing route, adding and removing
waypoints, and to edit route information such as waypoint
names and symbols.
ERASE Used to clear the existing route from memory.
This deletes the route, but not its component waypoints.
FOLLOW Used to start tracking to the first waypoint on the route.
or OFF Used to stop tracking. This soft key is displayed instead of
FOLLOW when a route is already active.
REVERSE Used to reverse the tracking order of the waypoints in the
route.
NEXT LEG Used to proceed to the next leg of the route.
Page 44

Chapter 3: Using the Initial Soft Keys 31
Making a New On-Screen Route
➤ To making a new route using the ROUTE soft key :
1. Move the cursor to the area in which you wish to make the route, and select
a suitable chart scale.
2. Press the ROUTE soft key to display the Route menu and the current route.
Note: If the selected position in the route list contains a route (the full list of
ROUTE
options is displayed), you can select
page 30), or continue with this procedure to add waypoints to the existing
route.
3. If required, press the SELECT soft key to select an empty position in the list.
4. Press ENTER to select the highlighted Make/Edit option.
The soft key labels change, as shown in the illustration below.
5. Use the trackpad to move the cursor to the position on the chart where you
want your first waypoint to be.
Note: You can position the cursor on an existing waypoint, if required. This
waypoint will be included in the route, and a new waypoint will not be
created.
6. Press the PLACE WPT soft key.
The waypoint appears on the screen at the current cursor position, together
with the waypoint number assigned by the chartplotter.
The first waypoint of a new route has a circle round the waypoint symbol,
indicating that it will be the active waypoint if the route is made active.
The cursor data box and object data box are updated to show the waypoint
number and position, as shown in the example below.
7. Move the cursor to the next waypoint position. A dotted line connects the
cursor to the previous waypoint.
8. Press PLACE WPT again. The waypoint is placed and the dotted line changes
to a solid line.
Note: If you make a mistake, you can delete a wrongly-placed waypoint or
insert an additional one, as described below.
9. Repeat steps 7 and 8 until you have placed all your waypoints. You can
have up to 50 waypoints in a route.
ERASE
to delete the route (see
Routes
Setting Up &
Using On-Screen
Page 45

32
RayChart 620 and 630
Using On-screen
Setting Up &
Routes
CURSOR
50°36.68 N
009°47.60 E
COG SOG
208°M1.4$
DEPTH IN FEET
BRG
218°M 415.2$
100$
To Cursor
RNG
PLACE WPT DELETE WPT
003WPT
50°43.06 N
000°59.39 W
✣
ADD WPT EDIT
D3827-2
10. When you have entered all your waypoints, press CLEAR to return to the
initial screen.
Your route is displayed on the screen, but is not active.
➤ To add waypoints to a route using an external device such as the NavPlotter
100, use the MAKE /EDIT option as described above. You can then add
waypoints using either the cursor and the PLACE WPT key, or using the external
device. When an external waypoint is received, the cursor is positioned on it
and the chart is centered.
Editing an Existing Route On-Screen
You can edit the current route, even if it is active. You do this using the same
screen you used for entering a new on-screen route.
➤ To add waypoints to the end of an existing route:
1. Press the ROUTE soft key to display the Route menu and the current route
selection.
2. Use the trackpad, or press the ROUTE soft key, to highlight the MAKE/EDIT
option, and press ENTER.
The cursor is connected to the last-placed waypoint with a dotted line,
ready to add further waypoints to the route in the same way as for a new
route.
You can now add, delete or insert waypoints, although you cannot delete a
waypoint if you are tracking towards it.
Page 46

Chapter 3: Using the Initial Soft Keys 33
Note: You can also use this option to delete waypoints that are not part of the
current route, if you have selected the waypoint display option when you set up
your chartplotter (see Chapter 6).
➤ To delete a waypoint:
Note: You cannot delete a waypoint if it is used in another route.
1. Use the trackpad to position the cursor over the waypoint you wish to
delete.
2. Press the DELETE WPT soft key.
3. Press ENTER to confirm the deletion.
The waypoint disappears from the screen. If the waypoint was not at the
end of the route, then the waypoints before and after the deleted waypoint
are connected with a straight line.
Press CLEAR to return to the initial screen.
➤ To insert an additional waypoint in a route:
1. Position the cursor on (or close to) the line between two existing waypoints.
2. Press the ADD WPT soft key. The line changes from a solid line to a dotted
line. (If the chartplotter beeps instead, move the cursor closer to the line and
press ADD WPT again.)
3. Move the cursor to the required position. Dotted lines connect the cursor to
the two existing waypoints.
4. Press ENTER. The new waypoint is placed, and named with the first
available waypoint number.
Press CLEAR to return to the initial screen.
Routes
Setting Up &
Using On-screen
Editing Route Information
Once you have created a route, you can edit the route information, including the
route name and the waypoint names, symbols and positions.
➤ To edit the route information for the currently selected route:
1. Press the EDIT soft key from the MAKE/EDIT screen of the ROUTE menu.
The details of the current route are displayed on the screen, and the soft key
labels change, as shown in the following example.
Page 47

Using On-screen
Setting Up &
Routes
34
RayChart 620 and 630
CURSOR
50°36.68 N
009°47.60 E
COG SOG
208°M 1.4$
DEPTH IN FEET
BRG
218°M 415.2$
100$
To Cursor
RNG
ROUTE NAME: ROUTE ØØ
LEG LAT/LON
01 43°58.95 N 010°06.64 E
02 43°59.62 N 010°05.51 E
03 44°00.40 N 010°03.93 E
SELECT
ROUTE SAVE
WPT NAME
004WPT
003WPT
002WPT
CLEAR
CANCEL
SCROLL
DIGITS
SAVE & FOLLOW SAVE AND EXIT
ENTER
ACCEPT
SELECTION
SYM SOURCE
CURSOR
CURSOR
CURSOR
D3828-2
The route name is shown at the top of the route details. For each waypoint
you placed, the following information is given:
Leg The leg number
Position The position of the waypoint at the end of this leg.
The position is given as either latitude and longitude or TDs,
depending on your setup selection.
WPT Name The waypoint name. The default name is in the format
xxxWPT, where xxx is the waypoint number.
Waypoints are listed in the Waypoint List in alphanumeric
order by name (see Chapter 5). If you plan to use the
Waypoint List, you may wish to name related waypoints so
that they are grouped together in the list.
Sym The waypoint symbol. The default is a circle, but you can
change it to any of the mark/event symbols (see page 42).
Source The source of the position information. For routes placed
on-screen, this is always the cursor. If you edit the position,
the source is updated to “EDIT”.
You can change the route name or the waypoint positions, names or
symbols.
2. Use the left or right sides of trackpad to move the cursor to the number,
letter or symbol you wish to change. You can hold the trackpad down to
move quickly, or press ENTER to skip to the start of the next field.
3. Use the top or bottom of the trackpad to increase or decrease the number, or
change the letter or symbol.
Page 48

Chapter 3: Using the Initial Soft Keys 35
4. Repeat steps 2 and 3 until the required information is displayed.
5. When you have finished editing the data, you can either:
• Press the SAVE & EXIT soft key to save the changes and return to
the initial screen
or
• Press the SAVE & FOLLOW soft key to save the changes, return to
the initial screen, and start navigating towards the first waypoint.
Using a Route
When you have set up or selected a route, you can perform the following tasks:
• Follow or “initiate” the route (that is, start tracking towards the first
waypoint)
• Retrace a route by following it in reverse order
• Advance to the next leg of the route
• Erase the route
Routes
Setting Up&
Using On-Screen
You can also edit the route, even if it is active, as described above.
Note: If you have two chartplotters on your system, the active route on one unit
is also displayed on the second unit, where it will always appear as Route 00.
You can use the Route menu options on the second unit to control the route
tracking on the first unit.
Following, Reversing and Stopping a Route
When you have set up a route, you can start navigating towards the first
waypoint. You can also follow a route in reverse order.
➤ If you did not initiate the route using the SAVE & FOLLOW soft key from MAKE/
EDIT, you can do so as follows:
1. If the Route menu is not already displayed, press the ROUTE soft key to
display it.
2. If the required route is not displayed, press SELECT until the route is
displayed.
Check the route display to confirm which waypoint will become active: this
waypoint is displayed on the screen with a circle round it.
3. If you wish to follow the route in the reverse order, use the trackpad or the
RTE soft key to highlight the REVERSE option, and press ENTER. The circle
moves to the waypoint at the opposite end of the route.
4. Use the trackpad or the ROUTE soft key to highlight the FOLLOW option, and
press ENTER.
The chartplotter navigates towards the waypoint, unless a waypoint is
already active.
Page 49

Using On-screen
Setting Up &
Routes
36
RayChart 620 and 630
If you are already navigating to a waypoint (either by following a route or
using the GO TO option), a warning message is displayed (see page 39).
➤ To stop following the current route, select the OFF option from the ROUTE menu.
This option replaces the FOLLOW option when the route is already active.
Advancing to the Next Leg of the Route
When you reach the active waypoint, the chartplotter automatically makes the
next waypoint in the route active.
The alarm buzzer sounds and a message is displayed when either of the
following conditions is met:
• If you have set the Arrival Alarm and the vessel has reached the arrival circle
specified for this alarm.
• Your vessel passes the target (that is, it crosses the line perpendicular to the
route leg, and through the target).
The alarm is cleared after 7 seconds. You can clear the alarm earlier by pressing
any key.
Arrival Alarm
to 008WPT
Any key to CLEAR
D3832-1
➤ You can also advance to the next leg even if you have not reached the current
waypoint. From the ROUTE menu, highlight the NEXT LEG option and press
ENTER. The chartplotter starts tracking from the vessel’s current position
towards the next waypoint.
Erasing a Route
The chartplotter can store up to 20 routes. If you already have 20 routes and
want to create a new route, you can erase a selected route.
Note: If required, you can store routes on a Memory C-Card for future use, as
described in Chapter 6, before deleting them from the chartplotter’s memory.
➤ To erase an existing route:
1. Press the ROUTE soft key to display the Route menu.
2. Press SELECT until the required route is displayed.
3. Use the trackpad or ROUTE soft key to highlight the ERASE option, and press
ENTER.
4. Press ENTER to confirm the deletion.
The route disappears from the screen, and the route soft keys are cleared.
Page 50

Chapter 3: Using the Initial Soft Keys 37
3.3 Using the GO T O Key
The GO TO initial soft key provides a quick method of navigating to a target
point. You can select any target point (which is then stored as a new waypoint)
or an existing waypoint.
Note: You can also search for a specific waypoint and track towards it using
the Waypoint List options (see Chapter 5).
Navigating to a T arget Point
➤ To navigate to a target point:
1. Use the trackpad to position the cursor on the target point.
2. Press GO TO.
The chartplotter saves the target point as a new waypoint and starts
tracking towards it. If your target point is an existing waypoint, its position
is used and a new waypoint is not created.
If a waypoint is already active refer to Clearing or Changing a GOTO
below.
key
Using the GOTO
✣
004WPT
EDIT
D3823-1
The waypoint is shown as a circle with a dot in the center, and is connected
to the vessel’s starting position with a dashed line. The waypoint is given a
default name of the format xxxWPT, where xxx is the next available
waypoint number.
3. Press the EDIT soft key, that is displayed for 7 seconds, if you wish to change
any of the waypoint information for the new waypoint:
Editing the W aypoint Details
You can change the new waypoint’s name, symbol and position within 7
seconds of requesting GOTO.
➤ To edit the waypoint details:
1. Press the EDIT soft key. A window such as the following is displayed:
Page 51

GOTO Key
Using the
38
RayChart 620 and 630
EDIT WAYPOINT
NAME:
ØØ1WPT
SYMBOL
LAT: 44°Ø4.39 N
LON: ØØ9°52.72 E
ENTER
CLEAR
CANCEL
SELECT
SCROLL
DIGITS
ACCEPT
SELECTION
D3825-1
2. Use the left or right sides of the trackpad to move the cursor to the number,
letter or symbol you wish to change. You can hold the trackpad down to
move quickly.
3. Use the top or bottom of the trackpad to increase or decrease the number, or
change the letter or symbol.
4. Repeat steps 2 and 3 until the required information is displayed.
5. Press ENTER to save the details.
Clearing or Changing a GO T O
If a waypoint is already active when you request a GO TO, the chartplotter
displays the following message:
WAYPOINT IS ALREADY ACTIVE
ENTER
TO SWITCH OFF ACTIVE ROUTE
TO CANCEL
CLEAR
TO STOP TRACKING
MENU
D3824-1
The active waypoint may be a previous GO TO, or it may be the active waypoint
in the current route.
➤ To change to the new waypoint (GO TO target point), press ENTER.
➤ To cancel the GO TO and continue navigating to the existing active waypoint,
CLEARCLEAR
press
CLEAR.
CLEARCLEAR
➤ To stop navigating to the active waypoint, press MENU.
Note: This means you can abandon a GO TO at any time by pressing
MENUMENU
then
MENU
. If you turned off the waypoint display when you set up your
MENUMENU
chartplotter, the waypoint disappears since only the active waypoint and the
current route waypoints are displayed (see Chapter 6).
GO TO
Page 52

Chapter 3: Using the Initial Soft Keys 39
3.4 Measuring Distances Using the RULER Key
➤ You can obtain an accurate measurement of the distance between two points by
using the RULER soft key, as follows:
1. From the initial soft key display, press the RULER soft key.
The soft key labels change, as shown in the example below.
2. Use the trackpad to move the cursor to the measurement start point.
3. Press FROM. The start point is marked with an “F”.
4. Use the trackpad to move the cursor to the measurement end point. A
dotted line connects the From point to the cursor.
5. Press TO. The end point is marked with a “T”.
A dotted line connects the two points, and a ruler data box is displayed.
RULER
FROM
TO
DST: 1.75
LAT/LON
42°51.37 N
42°51.37 N
FROM
010°29.90 E
101°32.04 E
BRG: 090°M
TO
EXIT
6. If required, repeat with further FROM and TO positions. The ruler
information is updated each time you select a new FROM or TO location.
7. Press CLEAR or EXIT to clear the ruler display and return to the initial
screen.
D3831-1
Measuring
the RULER Key
Distances Using
Page 53

40
RayChart 620 and 630
Page 54

Chapter 4: AdditionalBasic Functions 41
Chapter 4: Additional Basic Functions
4.1 Introduction
This chapter explains how to use some further basic functions available on the
chartplotter, using the dedicated keys and the menus.
To get the most out of your chartplotter, you should set up the basic data and
customize the display, as described in Chapter 6. Once you have explored the
display possibilities, you may wish to return to the customization and make
further changes (see Section 6.3).
This chapter covers the following topics:
• Using marks and events
• Recording and displaying track histories
• Man Overboard (MOB)
• Controlling alarms and timers
4.2 Marks and Events
The chartplotter allows you to place symbols to record marks or events. You
have a choice of 16 symbols that can be used for both marks and events.
Marks and events differ in the following ways:
• Marks are used to record features at the cursor position, such as fishing
buoys and anchorages. They are only graphical symbols, and you cannot edit
them or add information.
• Events are used to record features at your vessel’s current position, such as a
good fishing spot.
Events are special waypoints. The chartplotter assigns a unique identifier to
each event, in the format xxxEVT, where xxx is the next available number.
The events are stored in the waypoint list, and can be recalled and edited later
(see Chapter 5).
The Danger Zone mark (
it. You can specify the radius of the exclusion zone as part of your setup
procedure (see Section 6.2). For the first nine danger zones, if your vessel enters
the zone, an alarm will sound.
Note: The danger zone alarm is only available for the first nine danger zones.
Marks & Events
) has an associated invisible exclusion zone around
Up to 1000 marks can be displayed on the screen at one time, and up to 1000
events or waypoints.
Page 55

Marks and
Events
42
RayChart 620 and 630
Placing and Deleting a Mark
➤ To place a mark symbol at the cursor position:
1. Press the MARK key.
The soft key labels change, as shown in the example on the following page.
The current mark symbol is shown below the cursor data box at the top left
of the screen.
2. If you wish to choose a different symbol for your new mark, press the
SELECT SYMBOL soft key. The Mark Symbols dialogue box is displayed in
the centre of the screen.
3. Use the trackpad to move around the symbols until the required symbol is
highlighted, and press ENTER.
The dialogue box is removed, and the new symbol is displayed under the
cursor data box.
RNG
BRG
000°M 58.36$
MARK SYMBOLS
ENTER
CLEAR
CANCEL
ACCEPT
SELECTION
DELETE MARK
EXIT
PLACE MARK
SELECT
SYMBOL
SELECT SYMBOL
4. Position the cursor at the point where you wish to place the mark.
5. Press the PLACE MARK soft key to place the new mark at the cursor position.
6. Press EXIT or CLEAR to return to the initial soft key display.
➤ To delete a mark:
1. Press the MARK key, to display the Mark soft key labels.
2. Position the cursor over the mark you wish to delete.
3. Press the DELETE MARK soft key to delete the mark.
4. Press EXIT or CLEAR to return to the initial soft key display.
D3829-1
Page 56

Chapter 4: AdditionalBasic Functions 43
Placing and Deleting an Event
The procedure for placing an event is the same as for placing a mark, except that
you use the EVENT key and the event is always placed at the vessel’s position.
The event is marked with an event name in addition to the event symbol.
If the date, time, sea temperature and depth are available they are recorded with
the event.
The procedure for deleting an event is the same as for deleting a mark, except
that, since events are special waypoints, you are prompted to confirm the
deletion.
4.3 Using T rack Histories
The chartplotter TRACKS function allows you to mark on the chart the actual
route that your vessel has followed, as if it had left a visible fixed wake.
While the track is turned on, it is recorded in the chartplotter’s memory, and can
be retrieved and displayed later if required. For example, you may wish to
display a previous track, and then use the Route option to place waypoints along
it that you can follow the same route again.
Caution:
In confined waterways, if you place waypoints onto a track you should be
aware of GPS accuracy limitations.
Histories
using Track
You can store up to 5000 track points in total, in up to 5 track files. The
chartplotter issues a warning when 4000 points have been stored. Up to 5 track
history files, including the current track, can be displayed on screen at one time.
The track files stored in memory can be downloaded to a Memory C-Card (see
Chapter 6). C-Card files can be retrieved for display at a later date.
The length of track that can be displayed is limited by the frequency of the track
points. The more frequent the track points, the more accurate the track recorded,
but the more memory is required. If you wish to display and record a long track,
you may need to increase the gap (interval) between points. Once the memory is
full, track points will start to disappear from the beginning of the track. The
chartplotter allows you to specify the track interval, in terms of either distance
or time.
You can check the number of track points recorded for each track file, by
displaying the Tracks Edit window as described below.
Page 57

44
RayChart 620 and 630
Starting and Stopping a T r ack
➤ To start and stop a track:
1. From the initial soft key display, press the MENU key to display the main
menus.
Using Track
Histories
TRACKS
START
EDIT
DELETE
SCREEN EDIT SET UP
CARTOGRAPHY
ORIENTATION
WINDOWS
COLOURS
WAYPOINT LIST
CURRENT ROUTE
ROUTE LIST
FIND
LOG
SYSTEM
NAVIGATE
PLOTTER
ALARMS/TIMERS
FIX STATUS
MEMORY C-CARD
2. Use the trackpad or press the TRACKS soft key to highlight the START option,
and press ENTER.
The option changes to STOP, indicating that Track History is turned on, and
the chartplotter starts laying down track marks.
The track data is stored in the track file that is set as the current track (see
below).
3. If you wish to turn Track History off again, highlight the STOP option and
press ENTER.
4. Press CLEAR to clear the menus.
Deleting the Current T rack
Deleting a track clears all the track history data from the selected file, ready to
use it for new data.
➤ To delete the current track:
1. From the initial soft key display, press the MENU key to display the main
menus.
2. Use the trackpad or press the TRACKS soft key to highlight the DELETE
option, and press ENTER.
3. Press ENTER again to confirm the deletion.
The track data in the current track file is deleted.
If the track is currently active, the old data is cleared from the file and the
screen, but any new track history information is still stored in the current
file.
4. Press CLEAR to clear the menus.
D3360-2
Editing T rack Controls
The EDIT option on the Tracks menu allows you to edit the controls for the
current track and also any other tracks stored in memory. You can:
Page 58

Chapter 4: AdditionalBasic Functions 45
• Select one or more track histories for display.
• Change the track file for the current track history data. If you do this after the
track history has started, the chartplotter stops storing track data to the
original track file and starts storing it in the new file.
• Change the track interval for the current track. You can select one of the
following intervals:
- 1, 5, 10 or 30 seconds
- 1, 3, 5, 10 or 30 minutes
- 0.1, 0.5 or 1.0 nm
• Start or stop a track history, or delete a selected track. These options perform
the same functions as the START/STOP and DELETE options from the TRACKS
menu.
➤ To edit the controls:
1. From the initial soft key display, press the MENU key to display the main
menus.
2. Use the trackpad or press the TRACKS soft key to highlight the EDIT option,
and press ENTER. The Track History screen is displayed.
CURSOR
50°36.68 N
009°47.60 E
COG SOG
208°M 1.4$
DEPTH IN FEET
BRG
218°M 415.2$
100$
To Cursor
RNG
TRACKS
CURRENT TRACK
TRACK HISTORY
POINTS DISPLAY
1
2
3
4
5
1
INTERVAL
ON
ON
ON
ON
ON
1 sec
3
0
0
0
0
Histories
Using Track
ENTER
CLEAR
CANCEL
SELECT
STOP DELETE
SCROLL
DIGITS
ACCEPT
SELECTION
D3830-2
3. Use the trackpad sides to scroll around the fields, and the trackpad top and
bottom to change the settings.
You can toggle the Display option on or off for any track, change the
current track file number, and change the track interval for the current track.
4. If required, press the START/STOP soft key to turn the current track on or, if it
is already on, to turn it off.
Page 59

OverBoard
Man
46
5. To delete a track, select the track you wish to delete, and press the DELETE
soft key. Press ENTER to confirm the deletion.
6. Press ENTER to accept your selections and return to the track history
screen, with the new track settings.
4.5 Man OverBoard (MOB)
If you lose a person or object overboard, and need to return to the location, you
should use the Man OverBoard (MOB) function at once.
➤ To initiate the MOB procedure, press and hold the MARK key for two seconds.
The chartplotter then performs all the following tasks automatically:
• Marks the vessel’s position, and displays the MOB symbol, with the position
assigned as waypoint 999.
• Switches to a range scale of 0.05nm per inch, in North Up mode. If this scale
is not available plotter mode is turned on.
• Places the cursor over the MOB waypoint, and displays the MOB symbol
and position (Lat/Long or TDs) in the object data box.
• Starts (or resets) the elapsed timer, which is displayed in the cursor data box.
• Uses the MOB position as the destination waypoint, indicated by a circle
around it.
RayChart 620 and 630
MOB
PRES. POS.
50°36.71 N
001°05.99 W
COG SOG
080°M 1.4$
.020$ P
To MOB
RNG
BRG
000°M
ELAPSE: 00:01:12
415.2$
MOB
50°36.71 N
001°05.99 W
WPT 999 MOB
BRG RNG
200°M5.948
D3835-2
Note: The MOB procedure can also be initiated or cancelled remotely if the
appropriate SeaTalk message is received by the chartplotter.
Page 60

Chapter 4: AdditionalBasic Functions 47
➤ To cancel the MOB procedure, press and hold the MARK key for two seconds
again.
4.6 Alarms and Timers
The chartplotter reports the following alarms:
Alarm Indicates:
Arrival Your vessel has arrived at the active waypoint; it has either:
entered the arrival circle (the radius of which is set in Set Up)
or, has passed the perpendicular to the route leg through the
waypoint.
Off course Your vessel has exceeded the specified cross track error
distance (set in Set Up) from the active route leg.
Anchor Your vessel has moved from its anchor position by more than
the distance specified in Set Up.
Countdown The countdown timer has reached zero.
Clock The time matches the alarm time set in Set Up.
Danger zone Your vessel has entered the danger zone circle (the radius of
which is set in Set Up) for the danger mark (
Fix status The chartplotter is no longer receiving position information
from GPS, dGPS or other source.
).
Timres
Alarms and
The alarms are switched on or off, and the limits set, using the ALARMS/TIMERS
option from the Set Up menu (see Chapter 6). This option also controls the
elapsed time counter, which displays the time elapsed since the last reset in the
cursor data box.
When an alarm is triggered, the alarm buzzer sounds and a window such as the
following is displayed:
Arrival Alarm
to 008WPT
Any key to CLEAR
D3832-1
➤ To silence the alarm and clear the message, press any key. Alternatively, wait 7
seconds for the alarm to time out.
No action is taken by the chartplotter except for the Arrival Alarm. If you press
a key, or after 7 seconds, the next waypoint becomes active. Alternatively, if
you have arrived at the last waypoint in the route, the chartplotter stops
navigating.
Note: The chartplotter also repeats any SeaTalk alarms it receives, such as
Depth and Wind alarms.
Page 61

48
RayChart 620 and 630
Page 62

Chapter 5: Using Stored Lists (EDIT) 49
Chapter 5: Using Stor ed Lists (EDIT)
5.1 Introduction
The chartplotter allows you to perform a number of tasks using the information
you have stored. This information includes waypoints, routes, events, track
histories and the log.
This chapter explains how to view, edit, use and print the stored information
using the EDIT menu.
TRACKS
START
EDIT
DELETE
SCREEN EDIT SET UP
CARTOGRAPHY
ORIENTATION
WINDOWS
COLOURS
WAYPOINT LIST
CURRENT ROUTE
ROUTE LIST
FIND
LOG
SYSTEM
NAVIGATE
PLOTTER
ALARMS/TIMERS
FIX STATUS
MEMORY C-CARD
D3360-2
The tasks you can perform from this menu include:
• Finding and selecting an existing waypoint to steer towards immediately
• Adding a new waypoint or editing the details of an existing waypoint
• Making a new route by selecting existing waypoints from the waypoint list
• Selecting an existing route and starting to follow it
• Reviewing the route you are currently following, and moving on to the next
leg
• Displaying calculated estimated times of arrival at waypoints, based on
either current or planned speed over the ground
This chapter covers the following information:
• The Waypoint List
• The Current Route details
• The Route List
• Finding and Displaying a waypoint
• Displaying and Printing the Log
• Printing
Lists
Using Stored
Controlling and displaying track histories is described in Chapter 4.
Page 63

50
5.2 The Waypoint List
Whenever you create a waypoint, it is added to the Waypoint List. The
Waypoint List also includes any events you have marked, which have default
names of the format xxxEVT, and waypoints sent from a master chartplotter as
part of the active or selected route.
This option allows you to perform the following tasks:
• View the Waypoint List
• Find a waypoint of known name, and display its details
• GO TO a selected waypoint
• Delete a waypoint
• Edit the details of an existing waypoint, or add a new waypoint
Viewing the W aypoint List
➤ To view the list:
1. Press MENU to display the main menus.
2. Use the trackpad, or press the EDIT soft key, to highlight the WAYPOINT LIST
3. Press ENTER. The Waypoint List screen is displayed:
The Waypoint List
option on the EDIT menu.
CURSOR
50°36.68 N
009°47.60 E
COG SOG
208°M 1.4$
DEPTH IN FEET
BRG
218°M 415.2$
100$
To Cursor
RNG
01 001WPT
02 002WPT
03 003WPT
04 004WPT
05 005WPT
L/L
44°04.39 N
009°52.72 E
---.-ft
DEPTH
TEMP.
---.-°C
WAYPOINT LIST
BRG
RNG
110° 0.924nm
CURSOR
SOURCE:
--/--/--
DATE:DATE:
--:--:--
TIME:
RayChart 620 and 630
ENTER
CLEAR
CANCEL
SCROLL
DIGITS
GO TO FIND DELETE EDIT
ACCEPT
SELECTION
D3812-2
The list shows the waypoint symbol, number (assigned by the chartplotter)
and name for each waypoint. The waypoints are listed in alphanumeric
order by waypoint name.
The box below the list gives the following details for the highlighted
waypoint:
Page 64

Chapter 5: Using Stored Lists (EDIT) 51
• Position, in either latitude and longitude or TDs, depending on your setup
• Bearing and range from your vessel’s current position
• Source of position data (cursor, edit, GPS etc)
• Depth and temperature when the event waypoint was created, if available
• Date and time that the waypoint was created
4. Use the trackpad top and bottom sides to move up and down the list,
displaying the details for each waypoint in turn.
Waypoint List Operations
With the Waypoint List displayed, you can use the soft keys to perform the
following tasks:
GOTO Starts navigating towards the highlighted waypoint. The
Waypoint List is cleared and the chart is displayed.
FIND Finds a specified waypoint in the Waypoint List (see below).
DELETE Deletes the highlighted waypoint from the list. If the waypoint
part of an existing route, press ENTER to confirm the
deletion.
EDIT Allows you to edit the highlighted waypoint, or add a new
waypoint (see below).
Notes: If a waypoint is used in two or more routes it cannot be deleted. You
must first remove it from the routes as described in Section 3.2.
You cannot delete an active waypoint.
Finding a Waypoint in the List
➤ To find a waypoint in the list:
1. Press the FIND soft key. The Find Waypoint window is displayed, with the
currently highlighted waypoint name and symbol displayed.
Find Waypoint
NAME: ØØ1WPT
TYPE:
ENTER
CLEAR
CANCEL
SCROLL
SELECT
DIGITS
2. Use the trackpad left and right sides to move to the first position in the
waypoint name that you wish to edit.
3. Use the top and bottom sides to change the value. The chartplotter tries to
match the waypoint as you change each character (from left to right), and
provides the nearest character for which there is a match in the waypoint
list.
ACCEPT
SELECTION
D3813-1
The Waypoint List
Page 65

52
D3814-2
CURSOR
50°36.68 N
009°47.60 E
COG SOG
208°M 1.4$
DEPTH IN FEET
100$
To Cursor
BRG
RNG
218°M 415.2$
NEW
WAYPOINT LIST
SCROLL
DIGITS
CLEAR
CANCEL
ENTER
ACCEPT
SELECTION
EDIT WAYPOINT
SCROLL
DIGITS
SELECT
CLEAR
CANCEL
ENTER
ACCEPT
SELECTION
NAME:
ØØ1WPT
SYMBOL
LAT: 44°Ø4.39 N
LON: ØØ9°52.72 E
RayChart 620 and 630
The symbol type is updated to match the waypoint selected: you cannot edit
this field.
4. Press ENTER to accept your selection. The Waypoint List is redisplayed,
with the selected waypoint highlighted.
FIND
Note: You can find a waypoint on the chart using the
option from the
menu (see section 5.5).
Editing a Waypoint or Adding a New Waypoint
➤ To edit an existing waypoint or add a new waypoint:
1. Display the waypoint list as described above.
2. Use the trackpad to highlight the waypoint that is either:
- The waypoint you wish to edit, or
- A waypoint with similar details to the new waypoint you wish to create.
3. Press the EDIT soft key. The Edit Waypoint window is displayed, with the
details of the selected waypoint.
EDIT
The Waypoint List
4. If you wish to add a new waypoint, press the NEW soft key. The waypoint
name changes to xxxWPT, where xxx is the next available waypoint
number. The other details remain the same.
5. You can edit the waypoint name, symbol and position. Use the trackpad to
move to the character you wish to edit, and change the value.
6. When you have finished your edits, press ENTER to save the information
and return to the Waypoint List, or CLEAR to abandon your changes.
Note: The entry is rejected if the edited position is the same as another
waypoint.
Page 66

Chapter 5: Using Stored Lists (EDIT) 53
5.3 The Current Route
The Current Route option allows you to view the currently selected route, with
progress details, and to specify a planned Speed Over the Ground (SOG) to
obtain an estimated time of arrival (ETA). You can also advance to the next leg
of the route from this screen.
Viewing the Current Route
➤ To view the Current Route information, select the CURRENT ROUTE option from
the EDIT menu.
The Current Route screen is displayed, as shown below.
CURSOR
50°36.68 N
009°47.60 E
COG SOG
208°M 1.4$
DEPTH IN FEET
BRG
218°M 415.2$
100$
To Cursor
RNG
CURRENT ROUTE 1
CURRENT SOG: 1.0 Kts
01 006WPT
02 007WPT
03 008WPT
04 009WPT
L/L
44°03.70 N
009°51.85 E
LEG BRG
ELAPSE TIME:
TOTAL DISTANCE COV.:
LEG DIST.
179° 0.571nm
--:--
ETA:
--:--
0.0 Nm
SCROLL
DIGITS
NEXT LEG PLANNED SOG
ACCEPT
SELECTION
D3815-2
ENTER
CLEAR
CANCEL
The Current Route screen lists the waypoints for the current route, showing the
waypoint symbol, sequence number in the route and name for each waypoint.
The box below the list gives the following details for the highlighted waypoint:
• Position, in either latitude and longitude or TDs, depending on your setup.
• Route leg bearing and distance (from waypoint to waypoint or, for the first
waypoint in a route, vessel to waypoint).
If the route is active, the following details are also provided:
• Estimated time of arrival (ETA) at the waypoint
• Total time elapsed since the start of the route
• Total distance covered since the start of the route
The ETA predictions are based on either the current or planned speed over the
ground (SOG), as displayed above the list of waypoints, depending on your
selection.
The Current Route
Page 67

54
RayChart 620 and 630
Current Route Operations
With the current route summary displayed, you can use the soft keys to perform
the following tasks:
NEXT LEG Jumps to the next leg of the route. This has the same effect as
the NEXT LEG option from the ROUTE initial soft key menu.
PLANNED SOG Switches from Current SOG to Planned SOG to calculate the
ETA for each waypoint.
The Planned SOG value is displayed above the waypoint list
instead of the Current SOG, and the ADJUST SOG soft key
becomes available so that you can change the planned SOG
value.
or CURRENT SOGSwitches from Planned SOG to Current SOG to calculate the
ETA for each waypoint.
ADJUST SOG This soft key is only available if you have already selected the
PLANNED SOG option, and displays the Planned SOG window.
Use the trackpad to adjust the value, and press ENTER to
accept the new value.
The Current Route
Page 68

Chapter 5: Using Stored Lists (EDIT) 55
5.4 The Route List
Whenever you create a route, its details are added to the Route List. You can
store data for up to 20 routes in the chartplotter’s memory.
The Route List option allows you to perform the following tasks:
• View the Route List
• Display and edit the waypoints for a selected route
• Display a selected route on the chart
• Follow or reverse a selected route
• Delete a route
• Edit the details of an existing route, or construct a new route by selecting
existing waypoints
You select the option in the same way as described for the Waypoint List
option (see Section 5.2).
Viewing the Route List
➤ To view the Route List:
1. Select the ROUTE LIST option from the EDIT menu.
CURSOR
50°36.68 N
009°47.60 E
COG SOG
208°M 1.4$
DEPTH IN FEET
BRG
218°M 415.2$
100$
To Cursor
RNG
ROUTE DETAILS DISPLAY DELETE SELECT
00 ROUTE 00
01 ROUTE 01
02 (EMPTY)
03 (EMPTY)
04 (EMPTY)
ROUTE LIST
001 001WPT
002 002WPT
003 003WPT
004 004WPT
005 005WPT
CLEAR
CANCEL
SCROLL
DIGITS
ENTER
ACCEPT
SELECTION
The first five waypoints are listed for the currently highlighted route.
2. Use the trackpad to scroll through the list.
3. If you cannot identify a route from its name and the first 5 waypoints, you
can display it on the chart as described below.
List
The Route
D3816-2
Page 69

56
RayChart 620 and 630
Route List Operations
When the Route List is displayed, you can use the soft keys to display, delete, or
follow a selected route, and display the details of the waypoints that make up the
route:
ROUTE DETAILS Displays the details of all the waypoints in the selected
route, in the same format as the Waypoint List (see
below), and allows you to follow the route or access the
Route Edit screen
DISPLAY Displays the selected route (see SELECT below) on
the chart at an appropriate scale. After 7 seconds, the
display returns to the Route List.
DELETE Deletes the highlighted route. Press ENTER to confirm
the deletion. Note that this only deletes the route from
the route list – it does not delete the component
waypoints.
The Route
List
SELECT Selects the route so that it can be displayed or activated.
When a route is selected, the SELECT soft key is
replaced by either the FOLLOW soft key or, if the
route is already active, the OFF soft key.
or FOLLOW This soft key is displayed instead of SELECT if the
highlighted route has been selected and is not already
active. It activates the selected route, tracking towards
the target waypoint. This has the same effect as the
FOLLOW option from the ROUTE initial soft key
menu.
or OFF This soft key is displayed instead of SELECT or
FOLLOW if the highlighted route has been selected
and is active. It turns off the selected route.
Note: You can also reverse, select and activate a route from the Route Details
screen (see below).
Page 70

Chapter 5: Using Stored Lists (EDIT) 57
Route Details
➤ To display the details of the currently highlighted route:
1. Press the ROUTE DETAILS soft key. The Route Details screen is displayed.
CURSOR
50°36.68 N
009°47.60 E
COG SOG
208°M 1.4$
DEPTH IN FEET
BRG
218°M 415.2$
100$
To Cursor
RNG
ROUTE: ROUTE 00
01 001WPT
02 002WPT
03 003WPT
04 004WPT
05 005WPT
L/L
44°04.39 N
009°52.72 E
DEPTH
TEMP.
SCROLL
DIGITS
BRG
RNG
092° 0.712nm
CURSOR
SOURCE:
01/01/70
DATE:DATE:
00:00:00
TIME:
ENTER
CLEAR
CANCEL
ACCEPT
SELECTION
REVERSE SELECT
This displays the details of the waypoints in the route, in the same format as
the Waypoint List (see Section 5.2).
You can press the REVERSE soft key to reverse the order in which the
waypoints will be followed in the route, then press SELECT followed by the
FOLLOW soft key to start following the route. The soft key label is updated
to OFF.
2. Press CLEAR to return to the Route List, or ENTER to go to the Route Edit
screen (see below).
Editing a Route or Building a New Route
You can edit an existing route, or build a new route, simply by selecting existing
waypoints from the list.
➤ To edit an existing route or build a new route:
1. Display the Route Edit page, either:
- From the Route Details screen, by pressing ENTER, or
- From the Route List, by highlighting the required route and pressing
ENTER. Highlight an empty route if you wish to build a new route.
D3817-2
List
The Route
Page 71

58
RayChart 620 and 630
D4210_1
The Route
List
The right side of the screen shows the Route Details window, and the left side
shows the Waypoint List window.
Initially, cursor control is in the Route Details window.
2. Use the trackpad to highlight the position in the Route Details list where
you wish to insert or delete a waypoint.
3. To delete a waypoint from the route, press the DELETE soft key.
4. To add a waypoint to the route:
a. Press the left side of the trackpad to move into the Waypoint List
window.
b. Scroll up or down the list until the required waypoint or location is
highlighted.
c. To find a specific waypoint, press the FIND soft key. The Find Waypoint
window is displayed, as described in Section 5.2.
d. When you have found the required waypoint, press the ADD WPT soft
key to add the waypoint to the route.
If you are inserting the waypoint into an existing route, the new waypoint
is inserted immediately after the highlighted location, and all the other
waypoints in the route are moved down the list. The new waypoint is now
highlighted in the route list.
e. Control stays in the Waypoint List window, so you can continue to select
waypoints and add them to the route.
Page 72

Chapter 5: Using Stored Lists (EDIT) 59
f. Press the right trackpad edge to return control to the Route Details
window.
If you made a mistake, you can use the DELETE soft key to remove the
waypoint(s) from the route.
5. Press the EDIT RTE NAME key to edit the route name. Use the trackpad to
change the letters and numbers, and press ENTER when you have finished.
6. When you have finished editing the route, press ENTER or CLEAR to return
to the Route List.
5.5 Finding and Displaying a W aypoint
The FIND option on the EDIT menu is used to find a specified waypoint (or event)
on the chart.
➤ To find a waypoint:
1. With the main menus displayed, use the trackpad or the EDIT soft key to
highlight the FIND option on the EDIT menu. Press ENTER.
2. Use the trackpad to select the waypoint name. Start with the left-most
character; as you change each character, the chartplotter displays the
nearest match from the Waypoint List, and updates the waypoint symbol as
appropriate.
3. When the required waypoint name is displayed, press ENTER.
The chart is repositioned, with the waypoint displayed in the centre of the
screen. The waypoint data is shown in the object data box.
5.6 Displaying and Printing the Log
A log entry is created every 30 minutes and the log keeps data from the last 24
hours.
Note: You cannot edit the log.
➤ To display the log, select the LOG option from the EDIT menu.
The list shows the date and time of each log entry, plus the following details for
the highlighted entry:
• Vessel’s position
• Course Made Good (CMG) and Distance Made Good (DMG) since the
previous log entry.
Use the trackpad to scroll up or down the list.
Waypoint &
Finding and a
Printing the Log
Page 73

60
➤ To print the log:
1. Check that:
Your printer is connected and switched on.
In the System Set Up menu, serial port is set to printer and the baud rate is
correct (see Chapter 6).
2. Press the PRINT soft key.
5.7 Printing the screen
The chartplotter provides a Print function that allows you to print any screen
display.
➤ To print a screen display:
1. Check that:
Your printer is connected and switched on.
In the System Set Up menu, serial port is set to printer and the baud rate is
correct.
2. Press and hold the DISPLAY key for 5 seconds. At the end of this time, the
chartplotter beeps 3 times, the cursor disappears, and the display
information is sent to the printer.
RayChart 620 and 630
Printing
Page 74

Chapter 6: Customizing the Chartplotter 61
Chapter 6: Customizing the Chartplotter
6.1 Introduction
When you have installed your chartplotter and are familiar with its basic
operation, you may need to set it up so that it obtains the correct information
from the equipment that you have connected it to, operates according to your
requirements, and displays information according to your preferences.
This is achieved using two of the Main Menus that are displayed using the
MENU key: the SET UP menu and the SCREEN menu.
TRACKS
START
EDIT
DELETE
Note: If you have a monochrome chartplotter, the
SCREEN EDIT SET UP
CARTOGRAPHY
ORIENTATION
WINDOWS
COLOURS
WAYPOINT LIST
CURRENT ROUTE
ROUTE LIST
FIND
LOG
SCREEN
SYSTEM
NAVIGATE
PLOTTER
ALARMS/TIMERS
FIX STATUS
MEMORY C-CARD
menu
COLORS
D3360-2
option
is not available.
Most of the options will only need to be set up when you first use your system.
However, the SET UP menu also controls the alarms and timers, which you may
wish to change from time to time. In addition, you may decide to change the
way you have customized your screen and help levels as you become more
familiar with your chartplotter system.
Note: Where possible, the chartplotter uses settings from other SeaTalk
instruments. The default settings may therefore already be set to your preferred
value.
This chapter covers the following topics:
• Setting up the data, including system defaults, alarms and the timer
• Customizing the screen display
Chartplotter
Customizing the
Page 75

62
6.2 Setting Up the Data
The chartplotter allows you to set up a number of parameters that control the
way it operates. These are accessed from the SET UP menu.
The SET UP menu options control the following:
• System set up
• Navigation set up
• Chartplotter set up
• Alarms and timers set up
• Position fixer initial settings and reset
• Memory C-Card transfers
Before you make any changes:
1. Check the lists of parameters and options provided in the tables in this
section.
2. Decide what changes, if any, you wish to make.
3. Fill in the required settings in the spaces provided in the tables.
RayChart 620 and 630
Setting Up
the Data
Once you have done this, follow the instructions given below to make the
changes.
Changing the Parameters
➤ To change the set up parameters:
1. Press the MENU key to display the SET UP menu above the right hand soft
key. The option you used last is currently highlighted.
2. Use the trackpad or SET UP soft key to highlight the required menu option,
and press ENTER.
The requested set up menu is displayed, listing the parameters and their
current settings and, for some items, menus of further parameters. For
example, the SYSTEM set up menu is shown on the following page.
3. Use the up and down trackpad controls to move the highlight through the
list.
4. When the required parameter or sub-menu is highlighted, press ENTER.
For sub-menus, a further menu of parameters is displayed. Repeat steps 3
and 4 to select a parameter.
A window is displayed, listing the settings available, with the current
setting highlighted. Alternatively, for numerical parameters, a single value
(or OFF) is displayed, that can be adjusted.
Page 76

Chapter 6: Customizing the Chartplotter 63
SYSTEM SET UP
MAIN MENU
LANGUAGE
UNITS MENU
DATE & TIME MENU
SIMULATOR MENU
HELP
KEYPRESS SOUND
CURSOR ECHO
GPS INPUT
SERIAL OUTPUT
PRINTER BAUD RATE
CLEAR
CANCEL
SCROLL
LIST
5. Use the up and down trackpad controls to move the highlight bar through
the options or to increase/decrease the parameter value.
6. Press ENTER to accept the new setting, or CLEAR to cancel the change. The
options window is cleared from the menu.
7. When you have set all the required values, press CLEAR.
If you were in a sub-menu, the previous menu is displayed and you can
continue changing the parameters.
If you were in one of the set up menus, you are returned to the initial soft
key display.
ENTER
CHANGE
SELECTION
LEVEL 0
ON
OFF
NAVAID
NMEA
9600
D3836-2
Setting Up the System
The SYSTEM option from the Set Up menu allows you to set up your system
preferences.
The following table lists the System parameters or menus and their options,
shows the factory default setting, and provides a space for you to make a note of
your new default setting. Each parameter or menu is described in the following
subsections.
the Data
Setting Up
Page 77

64
RayChart 620 and 630
Parameter/Menu Options Factory New
Default Default
Language English, Italiano, English
Francais, Deutsch,
Espanol, Norge,
Svensk, Dutch
Units Menu
Distance Nautical miles Nautical miles
Statute miles
Kilometers
Depth Feet Feet
Fathoms
Metres
Temperature Centigrade Centigrade
Fahrenheit
Speed Knots Knots
Miles per hour
Kilometers per hour
Date & Time Menu
Time Format 24 hour 24 hour
12 hour
Time Offset UTC UTC
Local (offset value) (0)
Date Format MM-DD-YY MM-DD-YY
DD-MM-YY
Setting Up
the Data
Simulator Menu
Speed Value 10.0 kts
Heading Value 000°T
Starting Point (Position) Activate Simulation OFF OFF
ON
Help Level 0 Level 1
Level 1
Keypress Sound OFF ON
ON
Cursor Echo OFF OFF
ON
GPS Input NMEA NAVAID
NAVAID
Serial Output NMEA NMEA
PRINTER
Printer Baud Rate 300, 600, 1200, 9600
2400, 4800, 9600
Page 78

Chapter 6: Customizing the Chartplotter 65
Language
Select the language in which you wish information to be displayed. The
selected language will be used for screen text, labels, menus and options, but
will not affect the chart information.
Units
Choose your preferred units for distance, speed, depth and temperature. The
units you set will be used to display all data, including information received
from other instruments on the system.
Date and Time
Set your preferred time (12 or 24 hour) and date (month-day-year or day-monthyear) format.
Specify either UTC for universal time, or LOCAL and enter the current time offset.
The local time offset is retained if you change to UTC, so you can switch
between the two easily.
Simulator
The simulator allows you to operate your chartplotter without position data. It
generates a display with a moving vessel, so that you can practice using the
controls in safety.
➤ To set up the simulator:
1. Adjust the values to the required settings for the speed and heading.
2. Select the Starting Point option, the chart is displayed.
Move the cursor to the required starting position and press ENTER.
The set up menu is redisplayed with the starting position.
3. Set Activate Simulator to ON.
When the simulator is active, the word “SIMULATE” is displayed at the top of the
screen above the cursor data box.
Help
Choose one of the following help levels:
Level 0 The default soft key labels are only displayed if a soft key is
pressed when no other operation is in progress, and they
disappear if no operation is performed for 7 seconds.
the Data
Setting Up
Level 1 The default soft key labels are displayed if no other operation
is in progress.
Page 79

66
RayChart 620 and 630
Keypress Sound
This option controls whether or not the chartplotter beeps when you press a key
or when an alarm is activated.
Cursor Echo
Cursor Echo ON allows the cursor position to be displayed on a radar display.
Radar cursor position will be displayed if you switch ON cursor echo at your
radar display.
Note: If you have two or more chartplotters in you system, you must not switch
ON cursor echo at more than one chartplotter. It is normal to switch ON cursor
echo at the unit adjacent to the radar display.
GPS Input
The chartplotter can receive position data via a SeaTalk, NAVAID or NMEA
connection. Where position information is available from more than one
source, SeaTalk will always take precedence. You can select whether the
NAVAID or NMEA has next priority.
Setting Up
the Data
Serial Output
If you want to use a printer, select PRINTER, otherwise select NMEA. This avoids
conflicts of printing NMEA data.
Printer Baud Rate
Select the highest baud rate that is compatible with both your printer and the
Raychart. Refer to your printer manual for further information.
Setting Up the Navigation Data
The NAVIGATE option, illustrated below, from the Set Up menu allows you to
set up your navigation preferences.
The following table lists the Navigate parameters and their options, shows the
factory default setting, and provides a space for you to make a note of your new
default setting. Each parameter is described in the following subsections.
Page 80

Chapter 6: Customizing the Chartplotter 67
D4200_1
Parameter/Menu Options Factory New
Default Default
Heading Magnetic Magnetic
True
Magnetic Variation AUTOMATIC AUTOMATIC
Value, + or - in 0.1° steps (value)
Position resolution .00 .00
.000
TD
TD Settings Menu
GRI 9970
Slave 1 W
Slave 2 X
ASF 1 +0.0
ASF 2 +0.0
Alternate Solution OFF
Map Datum WGS 1984
Fix Datum WGS 1984
Position correction No correction
Head Up Response +/-10 +/-15
+/-15
+/-20
Data
Setting Up the
Page 81

68
RayChart 620 and 630
Heading
Select either degrees magnetic or degrees true for your heading data. The units
you set will be used to display all heading data, including information received
from other instruments on the system.
Magnetic Variation
The default setting for magnetic variation is Automatic, which means that the
variation value is computed from a world magnetic model for the year and
current position of the boat.
If no position is available, you can set a specific variation value. Use the
trackpad to change from Automatic to a value, and increase or decrease the
value in 0.1° steps. Press and hold the trackpad to change the value quickly.
Position Resolution
When working with position information in latitude and longitude, you can
display any position data to either two or three decimal places. Alternatively,
you can select TD to display all your position information in Loran TDs.
Setting Up
the Data
TD Settings Menu
If you are using a Loran position fixer, set the TD parameters to the required
values.
The chartplotter allows you to select the following GRI numbers for active
Loran chains:
GRIGRI
GRI
GRIGRI
4990 Central Pacific (Obselete)
5930 Canadian East Coast
5970 Commando Lion (Korea) (Obselete)
5990 Canadian West Coast
7170 Saudi Arabia South (Obselete)
7930 Labrador Sea (Obselete)
7960 Gulf of Alaska
7970 Norwegian Sea (Obselete)
7980 Southeast US
ChainChain
Chain
ChainChain
7990 Mediterranean Sea
8970 Great Lakes
Page 82

Chapter 6: Customizing the Chartplotter 69
8990 Saudi Arabia North (Obselete)
9940 US West Coast
9960 Northeast US
9970 North West Pacific (Obselete)
9980 Icelandic (Obselete)
9990 North Pacific
Note: Obselete chains do not transmit, but allow old TD positions to be
entered.
Map Datum and Fix Datum
The Map Datum is the geodetic datum to which position details are referenced
on the chartplotter display. You can select a datum to match paper charts that
you are using.
The Fix Datum is the geodetic datum to which position details received from
the GPS are referenced. You should select the same datum as your GPS uses.
Position Correction
If the displayed position does not agree with your known position, and you
cannot correct it by selecting the appropriate map datum or fix datum, you can
apply a position correction. The value of the current correction is displayed on
this menu.
➤ To apply a position correction:
1. Move the selection bar to the Position Correction option and press ENTER.
The chart is displayed.
2. Use the trackpad to move the cursor until the correct position is displayed in
the cursor readout box.
3. Press the DONE soft key to set the correction, press NONE to remove a
previously set correction, or press the CLEAR soft key to exit without
change.
Head Up Response
The Head Up Response controls the damping of the chart rotation when Head
Up mode is selected.
The default value is +/-15°, which means that the chart will only be rotated, and
the screen redrawn, if your vessel’s heading has changed by more than 15° in
either direction from the current head up display. Select +/-10 for a more
frequent response, or +/-20 for a less frequent response.
Data
Setting up the
Page 83

70
RayChart 620 and 630
Setting Up the Chartplotter
The PLOTTER option, illustrated below, from the Set Up menu allows you to set
up your chartplotter display preferences.
Setting Up
the Data
D4201_1
The following table lists the Plotter parameters and their options, shows the
factory default setting, and provides a space for you to make a note of your new
default setting. Each parameter is described in the following subsections.
Parameter Options Factory New
Default Default
Waypoint Name 3 characters 6 characters
6 characters
16 characters
None
Waypoint Display OFF ON
ON
Course Vector OFF SHORT
SHORT
LONG
INFINITE
Heading Vector OFF SHORT
SHORT
LONG
INFINITE
Page 84

Chapter 6: Customizing the Chartplotter 71
Wind Vector OFF OFF
ON
Tide Vector OFF OFF
ON
Dead Reckoning OFF OFF
ON
Cursor Data Box OFF ON
ON
Waypoint Name
This option controls the number of characters of each waypoint name that are
displayed on the chart. Reducing or removing the waypoint name can
sometimes improve the readability of the chart (all the characters are still shown
in other displays).
Waypoint Display
This option controls whether or not the waypoints and events are displayed on
the chart. If you set it to OFF, only the waypoints in the current route and the
active waypoint (if any) are displayed.
Course Vector
When the Course Vector is switched on, your vessel is displayed on the chart
with a dotted line extending from the bow indicating the current course. You
can select the length of the vector line; an “infinite” vector extends to the edge
of the chart.
The course vector shows the direction in which the boat is travelling (COG).
Heading Vector
When the Heading Vector is switched on, your vessel is displayed on the chart
with a solid line extending from the bow indicating the current heading. You
can select the length of the vector line; an “infinite” vector extends to the edge
of the chart.
Wind Vector
When the Wind Vector is switched on, your vessel is displayed on the chart
with a solid line extending from it indicating W (wind) angle.
The vector is only displayed if the required wind data is available from a wind
instrument connected to your system.
the Data
Setting Up
Page 85

72
RayChart 620 and 630
Tide Vector
When the Tide Vector is switched on, your vessel is displayed on the chart with
a solid line extending from it indicating T (tide) angle.
The tide information is calculated from the speed through the water and the
compass data, compared with COG and SOG information from the GPS. It is
therefore only displayed if all this information is available.
Dead Reckoning
If you set Dead Reckoning to ON, the chartplotter will calculate your position
by dead reckoning if position data is lost. The dead reckoned position is
calculated from your speed and heading (if available), and a dead reckoning
indicator is shown at the top left of the display.
Set Dead Reckoning to OFF if you do not wish to use a calculated position.
Cursor Data Box
This option controls whether or not the cursor data box is displayed. If you turn
it off, only the depth units and scale rule are displayed at the top left of the
screen.
Setting Up
the Data
Setting Up the Alarms and Timers
You can set up the following navigational alarms and timers:
Parameter Options Factory New
Default Default
Arrival Radius Alarm OFF OFF
Arrival radius value
Off Course Alarm OFF OFF
Value
Anchor Alarm OFF OFF
Value
Danger Zone Alarm OFF OFF
Value
Countdown Timer OFF OFF
ON (and value)
RESET
Elapsed Timer OFF OFF
ON
RESET
Clock Alarm OFF OFF
ON (and value)
Page 86

Chapter 6: Customizing the Chartplotter 73
Alarms
All the alarms default to OFF, that is, disabled. You can switch an alarm on and
adjust its setting to any value, in steps of 0.01. When an alarm is set, it will be
triggered when the alarm condition is met (see Chapter 4). All the alarms relate
to a specified distance.
To switch an alarm ON and adjust its value, select the alarm then press the top
side of the trackpad.
Note: The alarm limits are not displayed on the chart.
The alarms settings have the following functions:
• Arrival alarm specifies the radius of a circle around the waypoint: when
your vessel enters this circle the alarm sounds
• Off course alarm specifies the distance from the route, at right angles to the
route, beyond which the alarm sounds
• Anchor alarm specifies the distance from the anchor position beyond which
the alarm sounds; you can only set this if a position fix is available
• Danger zone alarm specifies the radius of a circle around marks classed as
dangerous (see page 41): when your vessel enters this circle the alarm sounds
Timers
The timer controls have the following functions:
• Countdown timer counts down from selected time (in hours, minutes and
seconds); an alarm is triggered when the timer reaches zero
• Elapsed timer counts up from zero, and is displayed in the cursor data box
on the chart
• Clock alarm, if set, sounds when the time data received by the system
matches the time specified here (in hours, minutes and seconds); you can
only select this if time data is being received
the Data
Setting Up
Page 87

74
RayChart 620 and 630
Fix Status
The FIX STATUS option allows you to access the GPS position fix status window
that is displayed when you turn on the chartplotter.
CURSOR
50°36.68 N
009°47.60 E
COG SOG
208°M 1.4$
DEPTH IN FEET
BRG
218°M 415.2$
100$
To Cursor
RNG
ACQUIRING
02/24/97
10:09:14 U
HDOP: 1.Ø SOG: Ø.ØKts
Setting Up
the Data
BEACON INITIALIZE CHART
D3838-2
When a fix has been acquired, the text “Fix Good” is displayed at the top of the
screen, and the vessel’s position at the bottom, together with the HDOP
(precision) factor and the Speed Over Ground (SOG).
If required, you can initialize the GPS or perform manual setup of a differential
beacon.
Initializing the GPS
➤ To initialize the GPS:
1. Press the INITIALIZE soft key. The current date, time and position settings are
shown.
2. Use the trackpad to edit the entries to the required values, and press
INITIALIZE to send them to the position fixer.
3. Alternatively, press the RESET soft key to reset the GPS.
4. Press CLEAR or ENTER to return to the Fix Status screen, and CHART to
return to the chart.
Page 88

Chapter 6: Customizing the Chartplotter 75
Setting Up a Differential Beacon
Normally, your differential beacon receiver (if fitted) automatically picks up the
transmitted differential signal. If there are two differential beacons competing
in a region, you may wish to set up the beacon manually. The Beacon Set Up
menu also indicates Beacon status and can be used to return to auto mode after
having set up the beacon manually.
➤ To set up a differential beacon manually:
1. Press the BEACON soft key. The current settings, read from the beacon
receiver (if connected) are displayed as shown below:
D4202_1
2. Press ENTER, then select AUTO or MANUAL mode. When manual mode is
selected, you are prompted for frequency and bit rate.
Use the trackpad to select the required bit rate, and to edit the beacon
frequency to the required value.
3. Press ENTER to accept the changes, or CLEAR to cancel.
4. Press CLEAR or ENTER to return to the Fix Status screen, and CHART to
return to the chart.
Screen Display
Customizing the
Page 89

76
RayChart 620 and 630
Memory C-Card
The MEMORY C-CARD option allows you to save or load data to or from a
Memory C-Card. Data is saved or loaded in files, by type: a file can be used to
store one of the following: all waypoints; all marks; all tracks or an individual
route. You can also change the C-Card and change the Card slot for these
operations.
➤ To save the data from the chartplotter’s memory to a C-Card:
1. Insert a Memory C-Card into one of the chart slots, in the same way as for a
chart card (see Chapter 2).
2. Press MENU to display the menus.
3. Use the soft key or trackpad to highlight the MEMORY C-CARD option on the
SETUP menu, and press ENTER.
C-CARD 2
WAYPTS MARKS TRACK ROUTES
NONAME
12FEB7
Customizing the
Screen Display
ENTER
MOVE
LOAD FILE SAVE FILE ERASE FILE FORMAT C-CARD
CHANGE C-CARD
MENU
CHANGE SLOT
CLEAR
EXIT
D3840-1
The list indicates the card slot and shows the names of the files, by type,
stored on the current C-Card.
If the device is not available, press MENU to select the other slot for display.
4. Use the trackpad to select the type of data (Waypoints, Marks, Track or a
Route) you wish to save.
Note: All data of the selected type is saved into the file, except for Routes
where only the currently selected route is saved.
5. Press the SAVE FILE soft key.
The system prompts you for the name of the new file.
6. Change the default file name (NONAME) to the required name, using the
trackpad left and right sides to select the character to change, and the top
and bottom to change the character.
Page 90

Chapter 6: Customizing the Chartplotter 77
7. Press ENTER to accept the new name.
The system saves all the data of the selected type into the named file on the
C-Card, and updates the display with the filename. If you have inserted a
new (unformatted) C-card, the chartplotter automatically formats it before
saving the file.
8. Press CLEAR to return to the chart display.
➤ To load data from a C-Card into the chartplotter’s memory:
1. Insert the Memory C-Card into one of the chart slots and select the
MEMORY C-CARD option, as described above.
2. Use the trackpad to select the file you wish to load.
3. Press the LOAD FILE soft key. The data is loaded into the chartplotter’s
memory.
- Track or mark data replaces any existing data of the same type.
- Waypoint data replaces any existing waypoints, and also deletes any
existing routes.
- A route file is loaded as Route 0. Waypoints in the route file are added
to the waypoint list.
4. Press CLEAR to return to the chart display.
➤ To erase data from a C-Card:
1. Display the file information for the card, as described above.
2. Use the trackpad to select the file you wish to erase, and press the ERASE
FILE soft key. Then press ENTER to confirm the deletion, or CLEAR to
abandon the operation.
Alternatively, to remove all the data from the card, press FORMAT C-CARD.
Then press ENTER to confirm the deletion, or CLEAR to abandon the
operation.
3. Press CLEAR to return to the chart display.
➤ To change the C-Card:
1. When the C-Card files information is displayed, press ENTER. You are
prompted to change the C-Card.
2. Replace the memory C-Card then press ENTER. The information for the
new card is displayed.
➤ To change the Card slot:
1. When the C-Card file information is displayed, press MENU. The
information from th card in the aother card slot is displayed.
Screen Display
Customizing the
Page 91

78
6.3 Customizing the Screen Display
You can customize the display of your chartplotter so that all the information
you require is available at the touch of a button. You can select the layout of the
display and the level of cartographic detail you prefer.
You customize the display using the SCREEN menu, which is displayed when
you press the MENU key. The SCREEN menu options control the following:
CARTOGRAPHY Setting the cartographic detail
ORIENTATION Setting the chart orientation
WINDOWS Setting up the contents of the windows that can be displayed
using the DISPLAY menus
COLORS Setting up the colors used to display tracks, routes, symbols,
vectors, the vessel and the cursor (available for color displays
only)
Setting the Cartography Detail
RayChart 620 and 630
Customizing the
Screen Display
The CARTOGRAPHY option allows you to select the types of cartographic
features that will be displayed or hidden. You can also enable or disable Plotter
Mode.
Note: Some cartographic details are automatically suppressed on small-scale
charts, to avoid the chart appearing too cluttered.
➤ To set your preferred levels of cartographic detail:
1. Press MENU to display the main menus.
2. Use the trackpad or the SCREEN soft key to highlight the CARTOGRAPHY
option from the SCREEN menu, and press ENTER.
The Map Configuration main menu is displayed.
3. Use the trackpad to move up or down the list and highlight the menu you
require, then press ENTER to accept your selection.
The menu options and their current settings are then displayed, as shown in
the following table.
4. Use the trackpad to move up or down the list and highlight the item you
require, then press ENTER to accept your selection, or CLEAR to cancel.
The parameters for that option are then displayed.
5. Use the trackpad to highlight the required setting, and press ENTER.
6. When you have reset all the required values, press CLEAR to return to the
Chart Configuration menu, and CLEAR again to return to the default
display.
Page 92

Chapter 6: Customizing the Chartplotter 79
The following table lists the map configuration options and their default
settings, and provides a space for you to make a note of your new default
setting. Items can be set either OFF or ON, unless indicated.
Menu/Parameters Factory New
Default Default
Land Settings Menu Natural Features ON
Rivers & Lakes ON
Cultural Features ON
Landmarks ON
Marine Settings Menu
Water Turbulence ON
Depths Contours ON
Depth Color 1Limit (value) 6 ft
Depth Color 2 Limit (value)50 ft
Depth Contours & Soundings
Range (max & min values) 0-33ft
Spot Soundings ON
Bottom Type ON
Nav-Aids and Features
Ports & Services ON
Attention Areas CONTOUR
Tracks & Routes ON
Lights NO SECTOR
Buoys & Beacons ON
Signals ON
Cartographic Objects ON
Other Settings Menu Names ON
Compass ON
Chart Generation ON
New Objects ON
Simplified Display OFF
Info Level (Basic or Detailed) DETAILED
Chart Settings Menu Lat/Lon Grid ON
Chart Boundaries ON
Plotter Mode OFF
Chart Orientation
You can select the normal orientation of your chart according to your personal
preference. The orientation can be one of the following:
• North Up: The chart is displayed with north upwards. This is the standard
chart mode.
• Course Up: The chart is displayed with the active course leg upwards. When
a new course leg becomes active, the chart rotates to keep course upwards.
If no waypoint is active, the chart is drawn north up.
Screen Display
Customizing the
Page 93

80
RayChart 620 and 630
• Head Up: The chart is displayed with the vessel’s current heading upwards.
This is useful if you wish to compare the chart with a radar screen.
As the heading changes the chart will rotate, although some damping is
provided to stop it swinging too wildly. You can set the amount of damping
by adjusting the Head Up Response parameter in the system set up (see page
69).
When you first select Head Up Mode, or if you select Home Mode when in
Head Up Mode, the cursor is homed on the vessel and the chartplotter
display is in Relative Motion mode. In this mode, the chart moves to keep
the vessel in the centre of the display. When you move the cursor away from
the vessel, the display returns to normal True Motion, and the vessel moves
across the chart.
Note: When the chart rotates in Course Up or Head Up mode, it may not be
possible to display the chart text. In this case, markers are left at the text points
which you can interrogate using the cursor (see Chapter 2).
➤ To select the orientation:
1. Press MENU to display the main menus.
2. Use the trackpad or the SCREEN soft key to highlight the ORIENTATION
option from the SCREEN menu, and press ENTER. The soft key labels
change, as follows:
Cudtomizing the
Screen Display
NORTH UP
COURSE UP HEAD UP
3. Press the soft key corresponding to the chart orientation you require. The
new chart orientation is displayed.
4. Press the EXIT soft key, or CLEAR to clear the soft key labels.
The display reverts to the default soft keys display, with the new chart
orientation.
Setting Up Windows
A powerful feature of the chartplotter is the ability to define your own windows
so that, when you request a windowed display, precisely the data you require is
displayed alongside the chart. You can define up to four customized windows.
Six default windows are also provided.
The default windows are selected using the DISPLAY key options, as described
in Chapter 2. These options allow you to select the data set to be displayed in
either one or two windows, with a choice of window positions.
EXIT
D3837_1
Page 94

Chapter 6: Customizing the Chartplotter 81
➤ To set up a customized window:
1. Press MENU to display the main menus.
2. Use the trackpad or the SCREEN soft key to highlight the WINDOWS option
from the SCREEN menu, and press ENTER.
The Customize On Screen Data Windows screen is displayed, showing the
last-used window selection. An example screen is shown below.
CURSOR
50°36.68 N
009°47.60 E
COG SOG
208°M 1.4$
DEPTH IN FEET
BRG
218°M 415.2$
100$
To Cursor
RNG
CUSTOM WIN 01
EMPTY WIN
NAVDATA
CDI
BDI
COMPASS
RUDDER
STEER CDI
STEER BDI
SEATALK
SPEED
AVERAGE SPEED
MAXIMUM SPEED
DEPTH
MIN DEPTH
MAX DEPTH
EDIT REVIEW
RESTORE WIN
CLEAR WINDOW
DEL LAST ITEM
CUSTOM WIN 01
CUSTOM WIN 02
CUSTOM WIN 03
CUSTOM WIN 04
D3811_2
3. If the custom window you wish to set up or change is not already displayed,
use the REVIEW soft key to display the required window.
Now you are ready to start specifying the data that will be displayed. The
NAVDATA and SEATALK menus list all the data that is available for selection:
further options can be seen by scrolling down the menus using the trackpad
or soft keys.
4. Highlight one of the data options in either the NAVDATA or SEATALK menu,
and press ENTER.
The data appears in the window at the top of the screen. Most of the
SeaTalk items take up one line, but some (such as the FULL WPT selection)
take up 2 lines. Some items, such as CDI, fill the entire window – the
display will not change if there is insufficient space in the window.
5. If you make a mistake or change your mind, you can delete the last item
using the DEL LAST ITEM option from the EDIT menu.
Alternatively, you can clear all the items in the window using the CLEAR
WINDOW option. RESTORE WIN will restore a cleared window that has been
saved.
6. Repeat step 4 until you have selected all the data items you require.
Screen Display
Customizing the
Page 95

82
RayChart 620 and 630
7. If you wish to set up another window, use the REVIEW soft key to select
another window and repeat the procedure.
8. When you have finished defining windows, press CLEAR to return to
normal operation.
9. You can now check the appearance of your windows using the DISPLAY
key (see Section 2.5).
Changing Color Settings
The color chartplotter includes options for setting the colors of the following:
• Tracks
• Routes
• Symbols (waypoints, marks and events)
• The vessel
• Vectors
• The cursor
Cudtomizing the
Screen Display
Note: You cannot change the colors of the charts and their associated objects.
➤ To change the color settings:
1. Press MENU to display the main menus.
2. Use the trackpad or the SCREEN soft key to highlight the COLORS option
from the SCREEN menu, and press ENTER. The following window is
displayed:
D4209_1
Page 96

Chapter 6: Customizing the Chartplotter 83
3. Use the up and down trackpad controls to select an item from the menu.
Where necessary, press the apropriate soft key to select the specific item
(TRACK, ROUTE, SYMBOL, VECTOR) to change.
4. Press ENTER to accept your selection. The available colors are displayed,
use the up and down trackpad controls to select a color then press ENTER to
accept the color (or CLEAR to cancel the selection).
5. When you have set all the required values, press CLEAR to return to the
Screen Setup menu, and CLEAR again to return to the initial screen.
Note: You can set all the colors back to their factory defaults. To do so,
highlight the
FACTORY DEFAULTS
option, press ENTER to confirm that you
wish to reset the colors.
Screen Display
Customizing the
Page 97

84
RayChart 620 and 630
Page 98

Chapter 7: Installation 85
Chapter 7: Installation
7.1 Introduction
This chapter explains how to install the chartplotter. Installation should only be
undertaken by a competent installer.
The chartplotter can be trunnion (yoke) or panel mounted. It must be connected
to a power supply and to a source of position data (for example, a GPS), and can
also be connected to other units via the SeaTalk, Navaid or NMEA connections.
You can install more than one chartplotter as part of a larger system. Details of
the current route or GO TO are sent to the second unit.
An example of an integrated system is shown in the following diagram.
Extended Chartplotter System, using SeaTalk Connection Mode
GPS Antenna
Chartplotter
Raydata
Distribution
panel
GPS
Raypilot 650
Speed
transducer
Depth
transducer
Power
Raydata
Second Chartplotter
SeaTalk port 2
SeaTalk port 1
D3354-2
Installation
Page 99

86
RayChart 620 and 630
Note: Before attempting any installation, you should read the Electromagnetic
Compatibility (EMC) installation guidelines provided below.
This chapter covers the following topics:
• Packing list
• Planning the installation
• Mounting the chartplotter
• Chartplotter connections
• System check and initial setup
If you are connecting your chartplotter to a larger system, you should refer to the
installation instructions for the other units and for connection to the SeaTalk
bus.
EMC Installation Guidelines
All Raytheon equipment and accessories are designed to the best industry
standards for use in the leisure marine environment.
EMC Guidelines
Their design and manufacture conforms to the appropriate Electromagnetic
Compatibility (EMC) standards, but correct installation is essential to ensure
that EMC performance is maintained. Although every effort has been taken to
ensure that they will perform under all conditions, it is important to understand
what factors could affect the operation of the product.
To avoid the risk of operating problems, all Raytheon equipment and cables
connected to it should be:
• At least 3 feet (1m) from any equipment transmitting or cables carrying radio
signals e.g. VHF radios, cables and antennas. In the case of SSB radios, the
distance should be increased to 7ft (2m).
• More than 7ft (2m) from the path of a radar beam. A radar beam can
normally be assumed to spread 20 degrees above and below the radiating
element.
• The equipment should be supplied from a different battery than the one used
for engine start. Voltage drops below 10v in the power supply to our
products can cause the equipment to reset. This will not damage the
equipment, but will cause the loss of some information and can change the
operating mode.
• Genuine Raytheon cables should be used at all times. Cutting and rejoining
these cables can compromise EMC performance and so should be avoided
unless doing so is detailed in this handbook.
• If a suppression ferrite is attached to a cable, this ferrite should not be
removed. If the ferrite has to be removed during installation it must be
reassembled in the same position.
Page 100

Chapter 7: Installation 87
The following illustration shows the range of suppression ferrites fitted to
Raytheon equipment.
If your Raytheon equipment is going to be connected to other equipment using a
cable not supplied by Raytheon, a suppression ferrite MUST always be fitted to
the cable close to the Raytheon unit.
7.2 Packing List
Your chartplotter display should be supplied with the following:
• Trunnion (yoke) bracket, fitted to the display with two knobs
• Self-tapping screws (4) for fixing trunnion bracket
• Power cable
• SeaTalk cable
• Display cover
• Panel mounting kit, consisting of thumb studs (4), thumb nuts (4), and fixing
template
• This handbook
• Quick reference card
If you have purchased the ChartPlotter GPS System the package will also
include the Raytheon Raystar 112 GPS.
Packing List
 Loading...