

Page 1

User's Guide
Version 2.0
Document Number: 012-11074D
Page 2

SPARKvue
®
User's Guide
SPARKvue disclaimers
Document Number: 012-11074D
Version 2.0
Limited Warranty
For a description of the product warranty, see the PASCO catalog.
Copyright
This user’s guide is copyrighted with all rights reserved. Permission is granted to nonprofit educational institutions for reproduction of any part of this manual, providing the
reproductions are used only in their laboratories and classrooms, and are not sold for
profit. Reproduction under any other circumstances, without the written consent of
PASCO scientific, is prohibited.
Trademarks
PASCO, PASCO scientific, DataStudio, PASPORT, SPARK, SPARK Science Learning
System, SPARKlab, SPARKbook,SPARKvue, Xplorer, and Xplorer GLX are trademarks
or registered trademarks of PASCO scientific, in the United States and/or in other countries. All other brands, products, or service names are or may be trademarks or service
marks of, and are used to identify products or services of their respective owners. For
more information visit www.pasco.com/legal.
Software Licenses
All required licenses for software components of SPARKvue and the SPARK Science
Learning System can be found on the CD-ROM or DVD-ROM included with the product
or are included in the software download. To obtain source code for GPL/LGPL licensed
software components, contact PASCO at by phone at 1-800-772-8700 (in the U.S), +1
916 786 3800 (worldwide), or by email at support@pasco.com
Document Number: 012-11074D i
Page 3
SPARKvue
®
Teacher and Technical Support
Teacher and Technical Support
For help with SPARKvue and other PASCO products, you can contact PASCO Teacher
and Technical Support staff by phone, email, or on the Web.
1-800-772-8700 (in the U.S.)
Phone:
+1 916 786 3800 (worldwide)
Email:
Web:
Tech Notes:
support@pasco.com
www.pasco.com/support/
www.pasco.com/support/technical-support/technote/
Document Number: 012-11074D ii
Page 4
SPARKvue
®
User's Guide
Contents
SPARKvue disclaimers i
Teacher and Technical Support ii
Contents iii
1 Introduction 1
About SPARKvue 1
Getting started 1
2 Starting an experiment 2
Installing SPARKvue 2
Launching SPARKvue 2
Connecting an interface and sensors to your computer 2
SPARK Science Learning System 3
Connecting a SPARK Science Learning System to your computer 3
Connecting sensors to the SPARKvue 4
Connecting PASPORT sensors to the SPARK SLS 4
Connecting a temperature probe to the SPARK SLS 4
Connecting a voltage probe to the SPARK SLS 4
Xplorer GLX 5
Connecting the Xplorer GLX to your computer 5
Connecting sensors to the Xplorer GLX 5
Connecting PASPORT sensors to the GLX 5
Connecting temperature probes to the GLX 5
Connecting a voltage probe to the GLX 6
Xplorer datalogger 6
PowerLink 6
USB Link 6
Connecting a bluetooth device 6
iPad 7
Android 7
Document Number: 012-11074D iii
Page 5

SPARKvue
®
User's Guide
Mac and Windows 7
Connecting multiple interfaces to your computer 8
Monitoring live data 8
Moving on from the Home screen 8
Opening a SPARKlab 9
Showing a SPARKlab 9
Building a SPARKlab 10
A. From the Home screen create a new SPARKlab: 10
B. Within a SPARKlab add a new page: 10
Add additional pages: 11
3 Setting up an experiment 12
Customizing data collection 12
Setting the sample rate 12
Putting SPARKvue into periodic sampling mode 12
Putting SPARKvue into manual sampling mode 13
Setting an automatic stop condition 13
Customizing how numbers are displayed 14
Setting the number of decimal places displayed 14
Setting the number of significant figures displayed 14
Displaying numbers in scientific notation 15
Changing the units of a measurement 15
Changing the units of a measurement in an existing display 15
Changing the default units of a measurement 16
Calibrating sensors 16
Selecting a measurement to calibrate and a calibration type 16
Performing a calibration 17
Performing a 2-point calibration 17
Performing a 1-point offset-only calibration 18
Document Number: 012-11074D iv
Page 6

SPARKvue
®
User's Guide
Performing a 1-point slope-only calibration 18
Calibrating a Drop Count sensor (example) 18
Using sensor adapters 19
Connecting a sensor through a Digital Adapter or Photogate Port 19
Connecting a sensor through an Analog Adapter 20
4 Data recording 21
Recording a run of periodically sampled data 21
Recording a set of manually sampled data 21
Deleting data runs 22
5 Data display 23
Displaying data in a line graph 23
Creating a new line graph 23
A. From the Home screen create a new SPARKlab: 23
B. Within a SPARKlab add a new page: 23
Showing and hiding the line graph tool palette 25
Adjusting the scale of a line graph 25
Scaling a graph to fit all data 25
Scaling by direct manipulation 26
Selecting data to show in an existing line graph 26
Showing and hiding data runs in a graph 26
Changing the variable on the x- or y-axis 27
Selecting data for operation in a line graph 28
Selecting a data run for operation in a line graph 28
Selecting part of a data run for operation in a line graph 28
Annotating data in a line graph 30
Adding an annotation 30
Editing or deleting an annotation 31
Displaying data in a Multiple y-axis graph 31
Document Number: 012-11074D v
Page 7

SPARKvue
®
User's Guide
Creating a multiple y-axes line graph 31
A. From the Home screen create a new SPARKlab: 31
B. Within a SPARKlab add a new page: 32
Working with multiple y-axes 34
Displaying data in a bar graph 34
Creating a new bar graph 34
A. From the Home screen create a new SPARKlab: 34
B. Within a SPARKlab add a new page: 34
Showing and hiding the bar graph tool palette 36
Showing data in bar graphs 36
Adding bars and bar names in bar graphs 36
Editing bars and bar names in bar graphs 37
Adding data in bar graphs 37
Entering data into bar graph manually 38
Collecting data for bar graph using a sensor 38
Adding additional data runs to a bar graph 38
Adding additional data runs to a bar graph using sensor readings 39
Showing and hiding data runs in a bar graph 39
Selecting data for operation in a bar graph 40
Annotating data in bar graphs 40
Adding annotations to bars 41
Editing or deleting annotations to bars 41
Showing numeric values on bars 42
Viewing bar graphs 42
Scrolling a bar graph 43
Scaling a bar graph to show all data 43
Scaling a bar graph by expanding or compressing the axes 43
Customizing axes labels and units on bar graphs 44
Document Number: 012-11074D vi
Page 8

SPARKvue
®
User's Guide
Displaying data in a table 44
Creating a table 44
A. From the Home screen create a new SPARKlab: 44
B. Within a SPARKlab add a new page: 45
Showing and hiding the table tool palette 46
Scrolling a table 46
Selecting data to show in an existing table 47
Selecting a run for display in an existing column 47
Changing the variable displayed in an existing column 47
Adding a column 48
Removing a column 48
Selecting cells for operation in a table 49
Displaying data in a digits display 50
Creating a new digits display 50
A. From the Home screen create a new SPARKlab: 50
B. Within a SPARKlab add a new page: 51
Showing and hiding the digits display tool palette 52
Changing the variable in a digits display 52
Displaying data in a meter 52
Creating a new meter 53
A. From the Home screen create a new SPARKlab: 53
B. Within a SPARKlab add a new page: 53
Showing and hiding the meter tool palette 54
Adjusting the scale of a meter 54
Scaling a meter to fit all data 55
Setting the scale of a meter 55
Changing the variable displayed in a meter 55
Customizing the appearance of a meter 56
Document Number: 012-11074D vii
Page 9

SPARKvue
®
User's Guide
6 Image capture 57
Connecting a camera or other video device 57
Creating a new camera image 57
A. From the Home screen create a new SPARKlab: 57
B. Within a SPARKlab add a new page: 58
Displaying a camera image 58
From the Home screen 58
From within a SPARKlab 59
Showing and hiding the image tool palette 59
Capturing a camera image 60
Switching between live and captured camera images 60
Selecting a captured camera image for display 61
Adjusting the scale and position of a camera image 61
Zooming in 61
Zooming out 62
Scale to fit 62
Panning a camera image 62
Measuring in a camera image 62
Placing a Measurement tool 62
Moving a Measurement tool 63
Deleting a Measurement tool 64
Calibrating camera image measurements 64
Drawing on a camera image 65
Drawing 66
Erasing 66
Erasing all 67
Annotating a camera image 67
Adding an annotation 68
Document Number: 012-11074D viii
Page 10

SPARKvue
®
User's Guide
Moving an annotation 69
Editing an annotation 69
Deleting an annotation 69
Naming an image 70
Deleting and Renaming an image 70
Exporting an image 71
7 Data analysis 72
Analyzing data in a graph 72
Viewing statistics in a line graph 72
Applying a curve fit 74
Removing a curve fit 75
Drawing a prediction 75
Finding the x- and y-values of a point 75
Finding the x- and y-difference between two points 77
Finding the slope at a point on a data plot 78
Finding the correlation coefficient (r) 79
Displaying the RMSE Root-Mean-Square Error 81
Analyzing data in a multiple-y axes graph 82
Viewing Statistics in a bar graph 82
Viewing statistics in a table 83
Viewing statistics in a digits display 85
Viewing statistics in a meter 86
8 Calculations and manually entered data 88
Working with calculations 88
Opening the calculator screen 88
Creating a calculation 88
Displaying a calculation 89
Entering data manually 90
Document Number: 012-11074D ix
Page 11

SPARKvue
®
User's Guide
Opening the measurements list 90
View the available measurements 90
View the available User-entered Data 91
Creating a data set for manual entry 91
Creating a data set for manually entered numbers 91
Creating a data set for manually entered text 91
Preparing a table for manual data entry 91
Entering data into a manual data set 92
Displaying manually entered data 92
Editing manually entered data 93
Enter User-defined Data 93
9 Building SPARKlab pages 94
Starting a new SPARKlab page 94
A. From the Home screen create a new SPARKlab: 94
B. Within a SPARKlab add a new page: 94
About adding elements to a SPARKlab page 95
Removing or replacing an image or media file 95
Adding a background image 96
Deleting a SPARKlab page 96
10 Saving and sharing 98
Saving a SPARKlab (Locally and Online) 98
To save your work locally: 98
To save your work using Online Storage Services: 98
Printing a lab 99
Exporting data 99
Opening a saved lab 100
Using Online Storage Services 100
Log in to Online Storage Services 100
Document Number: 012-11074D x
Page 12

SPARKvue
®
User's Guide
Open a file from Online Storage Services 101
Save a file to Online Storage Services 101
11 Keeping a journal 102
Taking a snapshot 102
Opening the journal 102
Adding a caption to a snapshot or editing an existing caption 103
Navigating in the journal 103
Deleting a journal entry or snapshot 103
Rearranging journal entries 103
Closing the journal 103
Saving a journal 104
Printing a journal 104
12 Common tasks 105
Turning pages 105
Returning to the Home screen 105
Entering symbols and Greek letters 105
Opening the About SPARKvue screen 106
Setting the language 106
Document Number: 012-11074D xi
Page 13
1 Introduction
SPARKvue
®
About SPARKvue
1 Introduction
n
"About SPARKvue": 1
n
"Getting started": 1
n
"Teacher and Technical Support": ii
About SPARKvue
SPARKvue software combines multimedia curriculum, real-time data collection, and
powerful scientific analysis tools in an easy-to-use, icon-based user interface.
SPARKvue is compatible with all PASCO PASPORT sensors and interfaces.
SPARKvue is designed to become the center of your school's discovery-based science
learning environment, providing both teacher and student the embedded support for
exploring scientific concepts.
SPARKvue includes free pre-installed SPARKlabs™ — standards-based guided inquiry
labs in a unique electronic notebook format. These SPARKlabs integrate background
content, data collection and analysis, even assessment —all within the same environment. Everything you need is right there in context.
Getting started
There are three basic ways to start an investigation in SPARKvue.
n
Open an embedded SPARKlab and follow the on-screen instructions
n
Show a SPARKlab with one measurement in a graph, table, digits display, and
meter
n
Build a custom SPARKlab with your choice of data, displays,text, and pictures
To start learning SPARKvue, install the software,connect an interface to your computer,
plug in a sensor, and start the software from the desktop icon. If you need help doing a
task, you'll find step-by-step instructions in this guide.
Document Number: 012-11074D 1
Page 14
2 Starting an experiment
SPARKvue
®
Installing SPARKvue
2 Starting an experiment
1. "Installing SPARKvue": 2
2. "Launching SPARKvue": 2
3. "Connecting an interface and sensors to your computer": 2
4. "Monitoring live data": 8
Installing SPARKvue
1. Download SPARKvue from www.pasco.com/sparkvue/ or insert the SPARKvue
USB drive into your computer.
2. Follow the instructions provided with the download or USB drive to complete the
installation.
Launching SPARKvue
Click the SPARKvue icon to launch SPARKvue.
Connecting an interface and sensors to your computer
SPARKvue software running on your computer or mobile device receives data from one
or more connected or built-in sensors. In SPARKvue, sensors that are built into a computer or device are called Onboard sensors, such as Onboard Microphone, Onboard
Light Sensor, and so forth.
SPARKvue is compatible with most common onboard sensors as well as several types
of external interfaces that provide access to sensors, including AirLink 2, SPARKLink,
SPARKLink Air, SPARK Science Learning System, USBLink, and Xplorer GLX. To collect data with SPARKvue, you will need a computer or mobile device with at least one
onboard sensor or be connected to an external interface with sensors attached.
You can connect multiple interfaces to one computer in order to do an experiment that
requires more sensors than can be connected to a single interface. The interfaces can
be of the same type or different types.
Use the following links to find instructions for connecting interfaces and sensors to your
computer or mobile device.
Document Number: 012-11074D 2
Page 15
2 Starting an experiment
SPARKvue
n
"SPARK Science Learning System": 3
n
"Xplorer GLX": 5
n
"Xplorer datalogger": 6
n
"PowerLink": 6
n
"USB Link": 6
n
"Connecting a bluetooth device": 6
n
"Connecting multiple interfaces to your computer": 8
®
Connecting an interface and sensors to your computer
SPARK Science Learning System
The SPARK Science Learning System (SPARK) includes ports for two PASPORT
sensors, a temperature probe, and a voltage probe. When it is not connected to a computer, the device records data and displays it on its own screen; however, when connected to a computer, it passes data through to be recorded and displayed on the
computer. It is powered either by its AC adapter, or by its rechargeable battery.
n
"Connecting a SPARK Science Learning System to your computer": 3
n
"Connecting sensors to the SPARKvue": 4
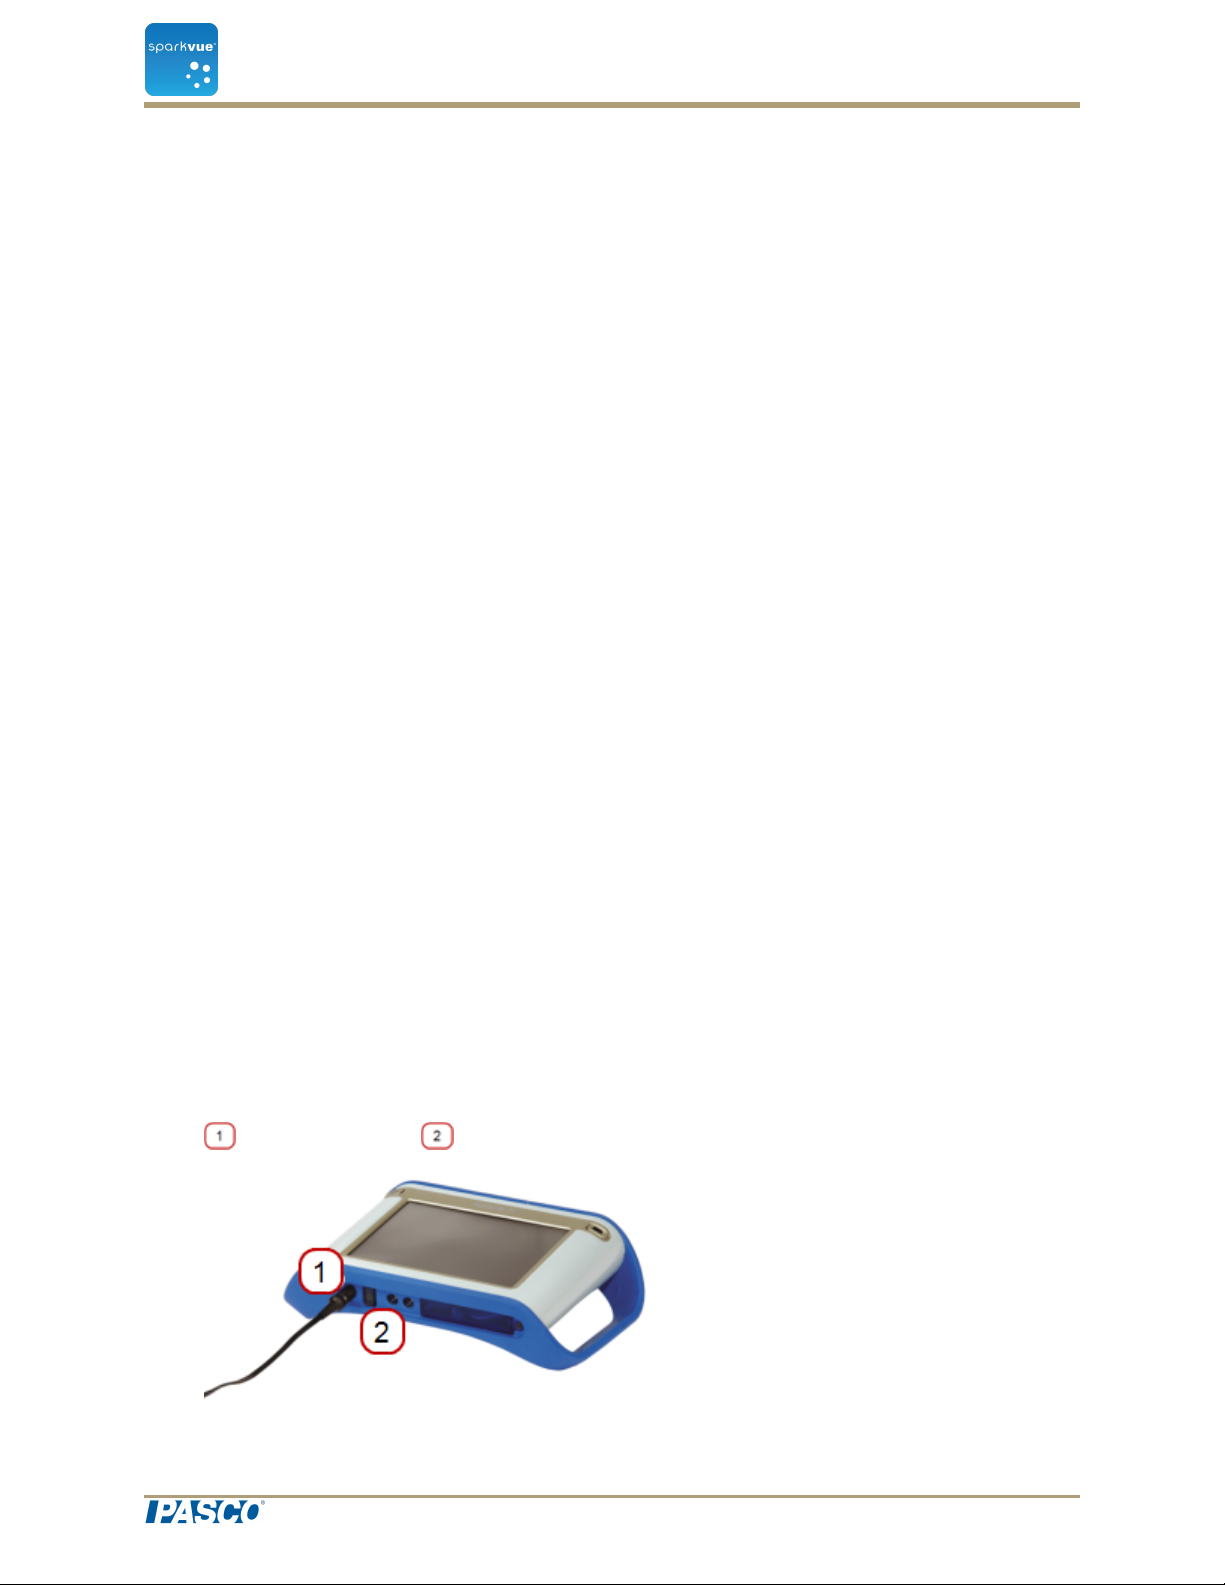
Connecting a SPARK Science Learning System to your computer
1. Use an A-to-mini-B USB cable (such as PASCO part PS-2528) to connect the
smaller USB port of the SPARK to a USB port on your computer (or a USB hub
connected to the computer).
2. Connect the AC adapter (included with the SPARK) to a wall outlet and to the AC
adapter port on the bottom of the SPARK.
You can skip this step if the SPARK battery is charged and you wish to let it run on
battery power.
3. Press and hold the power button.
The SPARK turns on and boots up.
AC adapter port. Power button.
Document Number: 012-11074D 3
Page 16
SPARKvue
®
Connecting an interface and sensors to your computer
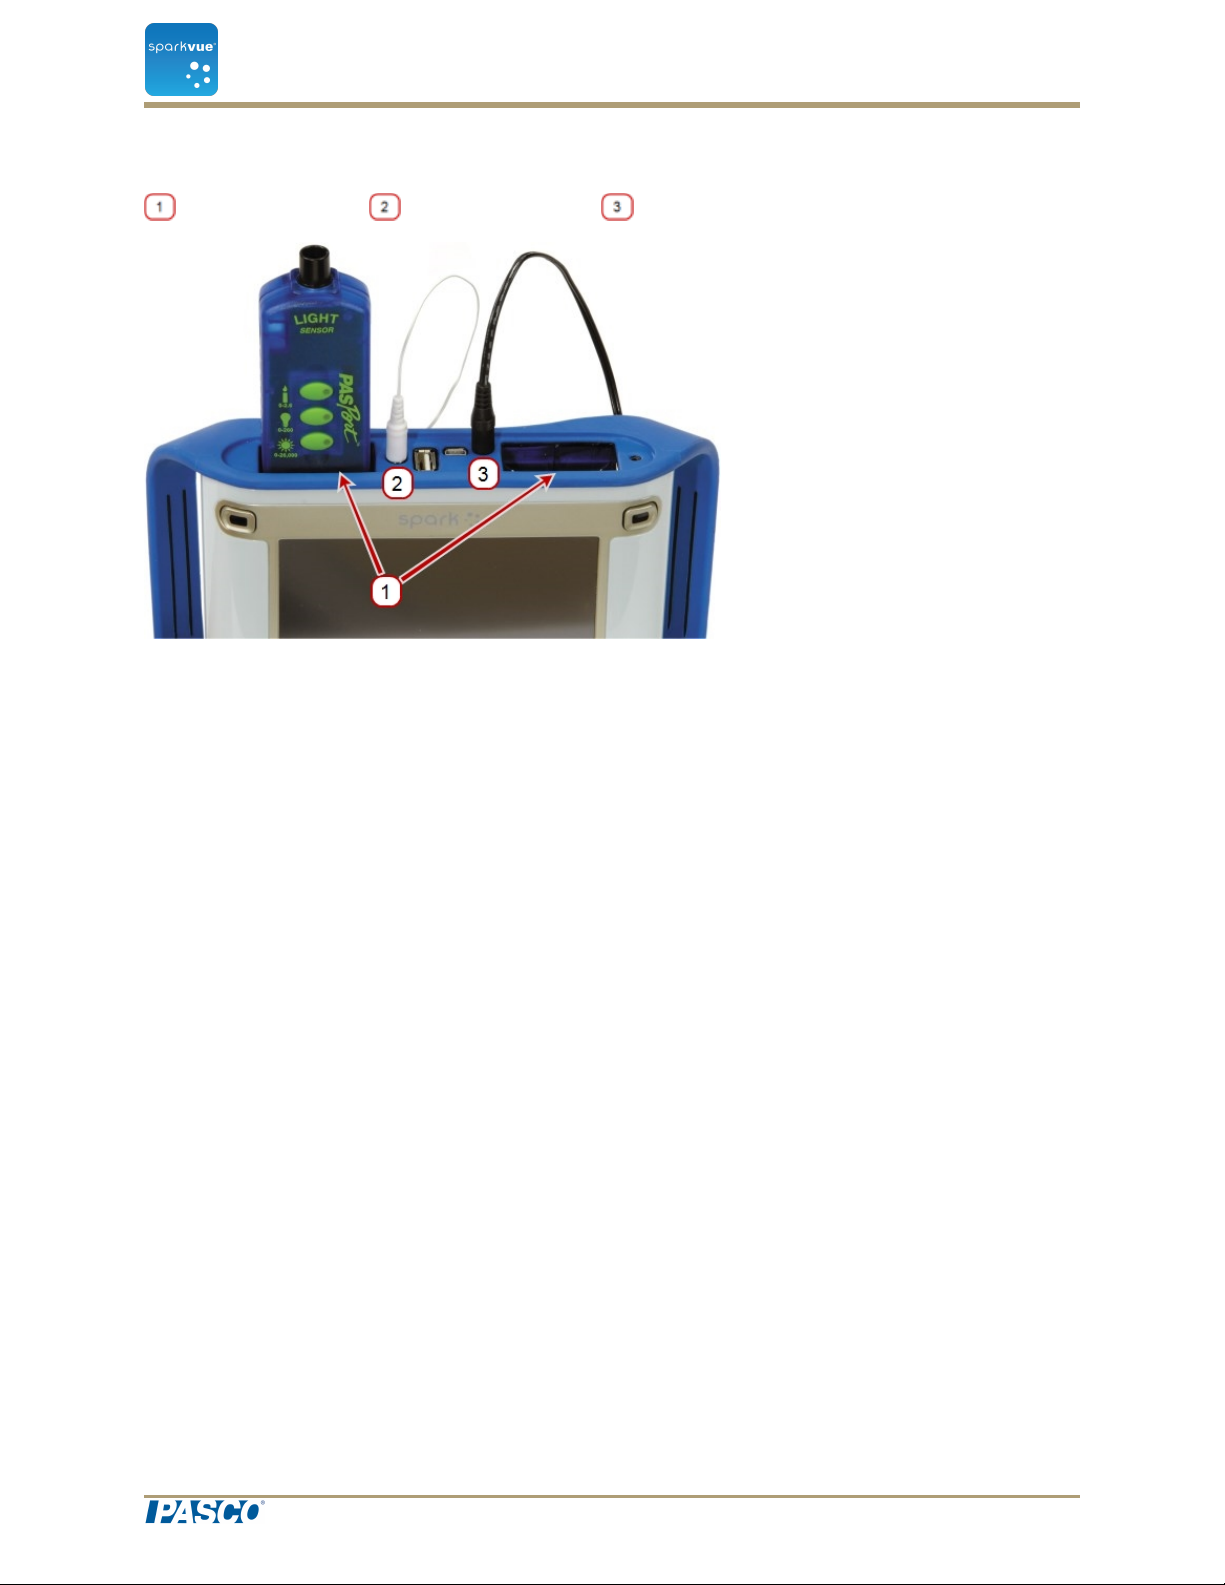
Connecting sensors to the SPARKvue
PASPORT ports. Temperature port. Voltage port.
2 Starting an experiment
You can use up to two PASPORT sensors plus a temperature probe and a voltage
probe.
Complete one or more of the following tasks to connect sensors to the SPARK.
n
"Connecting PASPORT sensors to the SPARK SLS": 4
n
"Connecting a temperature probe to the SPARK SLS": 4
n
"Connecting a voltage probe to the SPARK SLS": 4
Connecting PASPORT sensors to the SPARK SLS
1. Plug a PASPORT sensor into one of the PASPORT ports on the top of the SPARK
SLS.
2. Optionally, plug a second PASPORT sensor into the other PASPORT port.
Connecting a temperature probe to the SPARK SLS
Plug the included fast-response temperature probe (or other type of temperature probe)
into the temperature port on the top of the SPARK SLS.
Connecting a voltage probe to the SPARK SLS
Plug the included voltage probe into the voltage port on the top of the SPARK SLS.
Document Number: 012-11074D 4
Page 17

2 Starting an experiment
SPARKvue
®
Connecting an interface and sensors to your computer
Xplorer GLX
The Xplorer GLX includes ports for four PASPORT sensors, two temperature probes,
and a voltage probe. When it is not connected to a computer, the device records data
and displays it on its own screen; however, when connected to a computer, it passes
data through to be recorded and displayed on the computer. It is powered either by its
AC adapter, or by its rechargeable battery.
n
"Connecting the Xplorer GLX to your computer": 5
n
"Connecting sensors to the Xplorer GLX": 5
Connecting the Xplorer GLX to your computer
1. Use USB cable (included with the GLX)to connect the smaller USB port of the GLX
to a USB port on your computer (or a USB hub connected to the computer).
2. Connect the included AC adapter to a wall outlet and to the AC adapter port on the
right side of the GLX.
You can skip this step if the GLX’s battery is charged and you wish to let it run on
battery power.
3. Press and hold the power button.
4. The GLX turns on and boots up. If SPARKvue is running, the GLX screen displays
a message indicating that it is connected.
Connecting sensors to the Xplorer GLX
You can use up to four PASPORT sensors plus two temperature probes and a voltage
probe.
Complete one or more of the following tasks to connect sensors to the GLX.
n
"Connecting PASPORT sensors to the GLX": 5
n
"Connecting temperature probes to the GLX": 5
n
"Connecting a voltage probe to the GLX": 6
Connecting PASPORT sensors to the GLX
1. Plug a PASPORT sensor into one of the PASPORT ports on the top of the GLX.
2. Optionally, plug additional PASPORT sensors into the other PASPORT ports.
Connecting temperature probes to the GLX
1. Plug one of the included fast-response temperature probes (or another type of temperature probe) into one of the temperature ports on the left side of the GLX.
2. Optionally, plug a second temperature probe into the other temperature port.
Document Number: 012-11074D 5
Page 18

2 Starting an experiment
SPARKvue
Connecting a voltage probe to the GLX
Plug the included voltage probe into the voltage port on the left side of the GLX.
®
Connecting an interface and sensors to your computer
Xplorer datalogger
The Xplorer datalogger contains a single port for a PASPORT sensor. When it is not connected to a computer, the device records data and displays it on its own screen; however, when connected to a computer, it passes data through to be recorded and
displayed on the computer. When connected to a computer, it is powered by the USB
port, and it does not require batteries.
1. Use the included USB cable to connect the Xplorer to a USB port on your computer (or a powered USB hub connected to the computer).
2. Connect a PASPORT sensor to the Xplorer.
PowerLink
The PowerLink contains ports for up to three PASPORT sensors. It also includes two
USB ports that other interfaces can be connected to. It is powered by its AC adapter, or
by replaceable batteries.
1. Connect the AC adapter (included with the PowerLink)to a wall outlet and to the
AC adapter port on the back of the PowerLink,or install two “C” batteries in the
PowerLink.
2. Use the included USB cable to connect the PowerLink to a USB port on your computer (or a USB hub connected to the computer).
3. Connect up to three PASPORT sensors to the PowerLink.
USB Link
The USB Link contains a single port for a PASPORT sensor.
1. Connect the USB Link to a USB port on your computer (or a powered USB hub
connected to the computer).
2. Connect a PASPORT sensor to the USB Link.
Connecting a bluetooth device
The bluetooth device can connect to only one host at a time and must remain within
approximately 10 meters. (An error message displays if the device is already connected
to another system.)
Document Number: 012-11074D 6
Page 19
2 Starting an experiment
SPARKvue
The AirLink2 and SPARKlink Air can also connect via USB.
Note: If prompted, enter pass code "1234" for SPARKlink Air devices.
®
Connecting an interface and sensors to your computer
iPad
1. Use the standard iPad process to pair the PASCO bluetooth device.
2. Connect sensors as needed.
Android
1. Use the standard Android process to pair the PASCO bluetooth device.
2. Continue to step 1 of the Mac and Windows process.
Mac and Windows
To connect a device (no pairing necessary)
1. Turn on the AirLink2, SPARKlink Air or other supported bluetooth device.
2. Click the Device Tools button to open the Device Tools screen.
3. Click the Connect Sensor via Bluetooth button.
SPARKvue searches for available bluetooth sensors and lists the supported
devices within range.
Note: In a classroom setting, there may be many devices available for connection.
To ensure you are connecting with the correct PASCO device, check the back for
its identification number.
Note: If the device is not listed, pair the device using the standard Mac or Windows
process before continuing.
4. Click Connect.
The selected device will change from Connect to Disconnectupon successful
connection.
5. Click OK twice to close the Device Tools screen.
6. Optional: plug in sensors into the bluetooth interface.
To disconnect a device
Document Number: 012-11074D 7
Page 20
2 Starting an experiment
SPARKvue
®
Monitoring live data
1. Click the Device Tools button to open the Device Tools screen.
2. Click the Connect Sensor via Bluetooth button.
3. Click Disconnect.
The selected device will change from Disconnect to Connect upon successful
connection.
4. Click OK twice to close the Device Tools screen.
Connecting multiple interfaces to your computer
n
If the computer has enough available USB ports, connect each interface to a USB
on the computer.
n
If the computer has only one available USB port, connect a powered USB hub to the
computer, and connect the interfaces to the hub.
n
If at least one of the interfaces is a PowerLink, you can connect the PowerLink to the
computer and connect two additional interfaces to the USB ports on the back of the
PowerLink.
Monitoring live data
Live data from all connected sensors are displayed whenever the Home screen is open.
The Home screen is the first screen that appears when SPARKvue starts.
If the Home screen is not visible, click the Home button to return to the Home screen.
Moving on from the Home screen
With the Home screen displayed, you are ready to move into a SPARKlab. A SPARKlab
is a multiple page environment where your science investigation takes place.
Complete one of the following tasks to open an embedded SPARKlab, show a measurement in a SPARKlab, or build a custom SPARKlab.
n
"Opening a SPARKlab": 9
n
"Showing a SPARKlab": 9
n
"Building a SPARKlab": 10
Document Number: 012-11074D 8
Page 21
2 Starting an experiment
SPARKvue
®
Moving on from the Home screen
Opening a SPARKlab
SPARKvue includes embedded SPARKlabs. Additional no-cost labs are available from
PASCO. Complete these steps to open a SPARKlab:
1. Connect the sensors required for the SPARKlab that you wish to do.
2. If there are unneeded sensors connected, disconnect them.
3. In the SPARKlabs pane, navigate to the folder containing the SPARKlab that you
would like to open.
4. Click a SPARKlab to preview.
The lab preview opens in the right pane.
5. Click the preview to open the lab.
The SPARKlab opens.
Follow the on-screen instructions to continue your science investigation.
6. Click the Page Navigator to turn pages.
Showing a SPARKlab
A show-path SPARKlab is the fastest way to record data and display it in a graph, table,
digits display, and meter.
Complete these steps to show a SPARKlab:
1. Connect a sensor.
2. In the Home screen, click the measurement that you would like to show.
The selected measurement is highlighted.
3. Click Show.
Note: A measurement must be selected for Show to be available.
A four-page SPARKlab opens.
4. Click the Start button to record data.
Click the Page Navigator to see your data in the different displays.
Document Number: 012-11074D 9
Page 22
2 Starting an experiment
SPARKvue
®
Moving on from the Home screen
Building a SPARKlab
When you build a custom SPARKlab, you design each page with your choice of measurements and displays. You can also add text and pictures.
Connect a sensor (or sensors) and complete these steps to start building a SPARKlab.
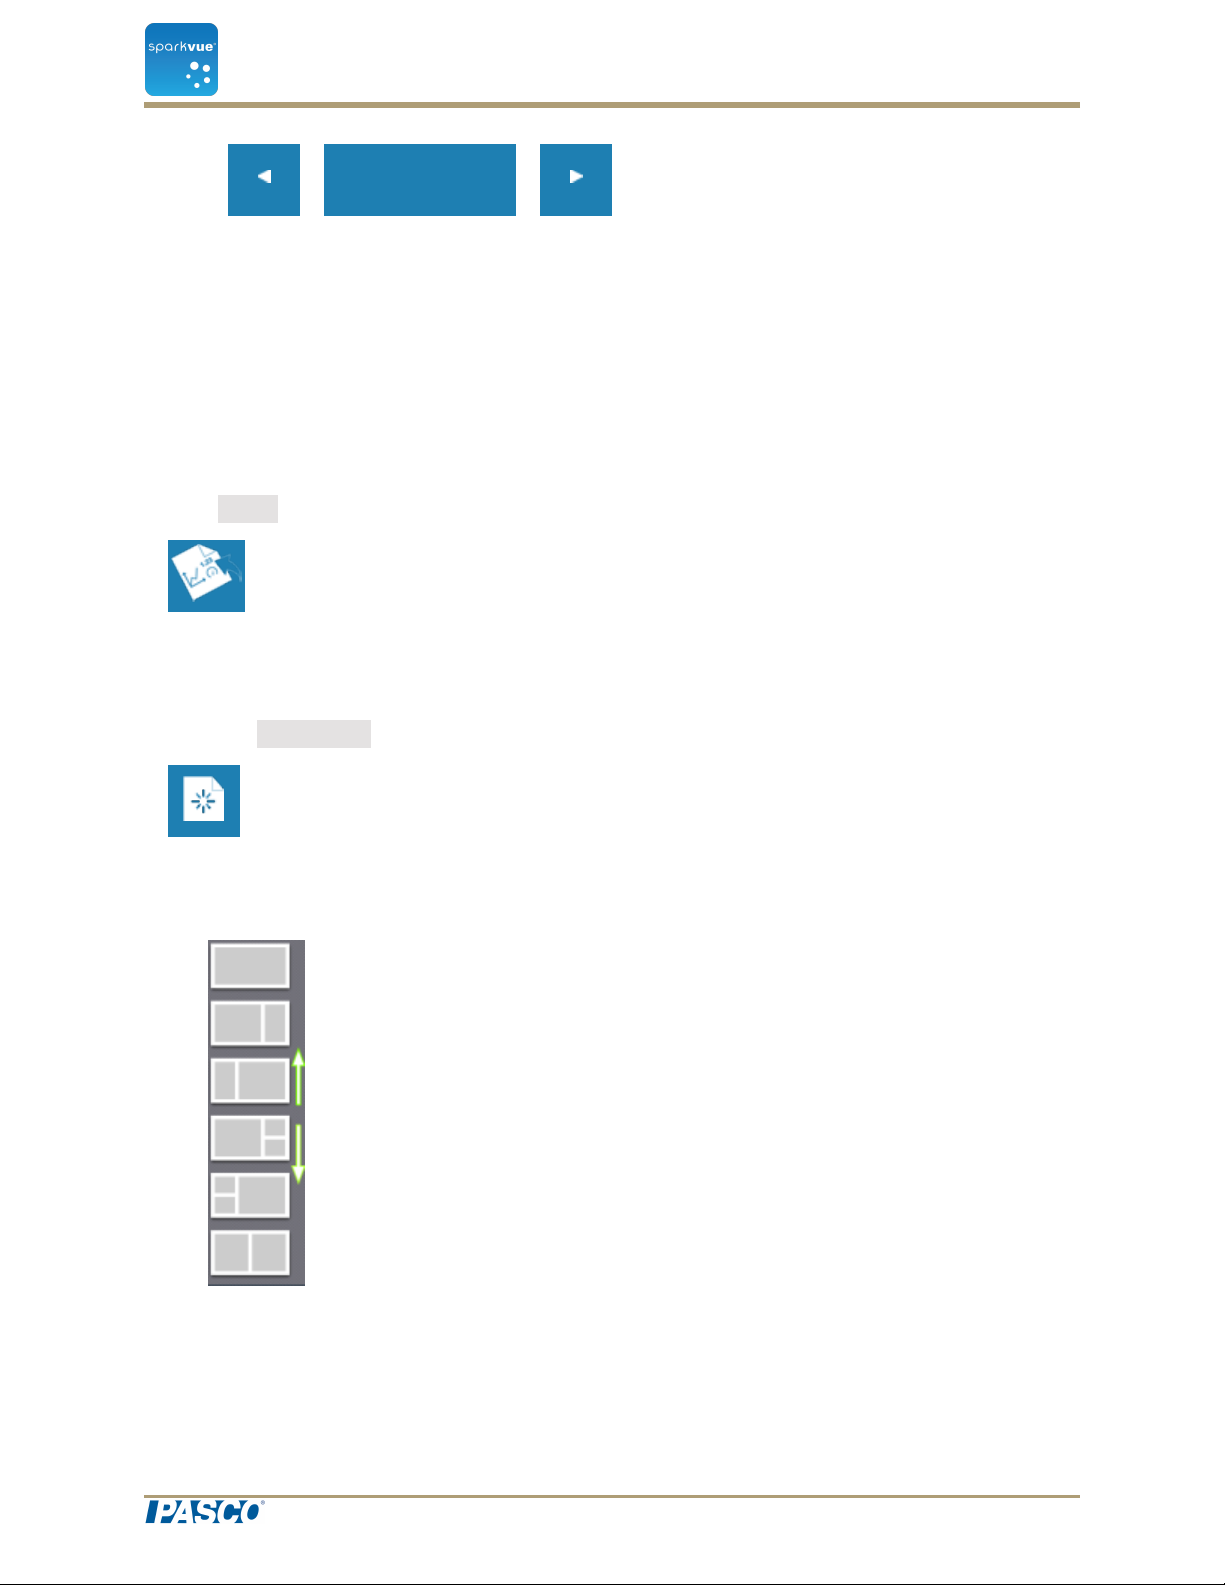
A. From the Home screen create a new SPARKlab:
Touch Build.
Continue to step 1.
B. Within a SPARKlab add a new page:
Touch the New Page button.
Continue to step 1.
1. Select a template from the library.
Scroll up and down to view templates
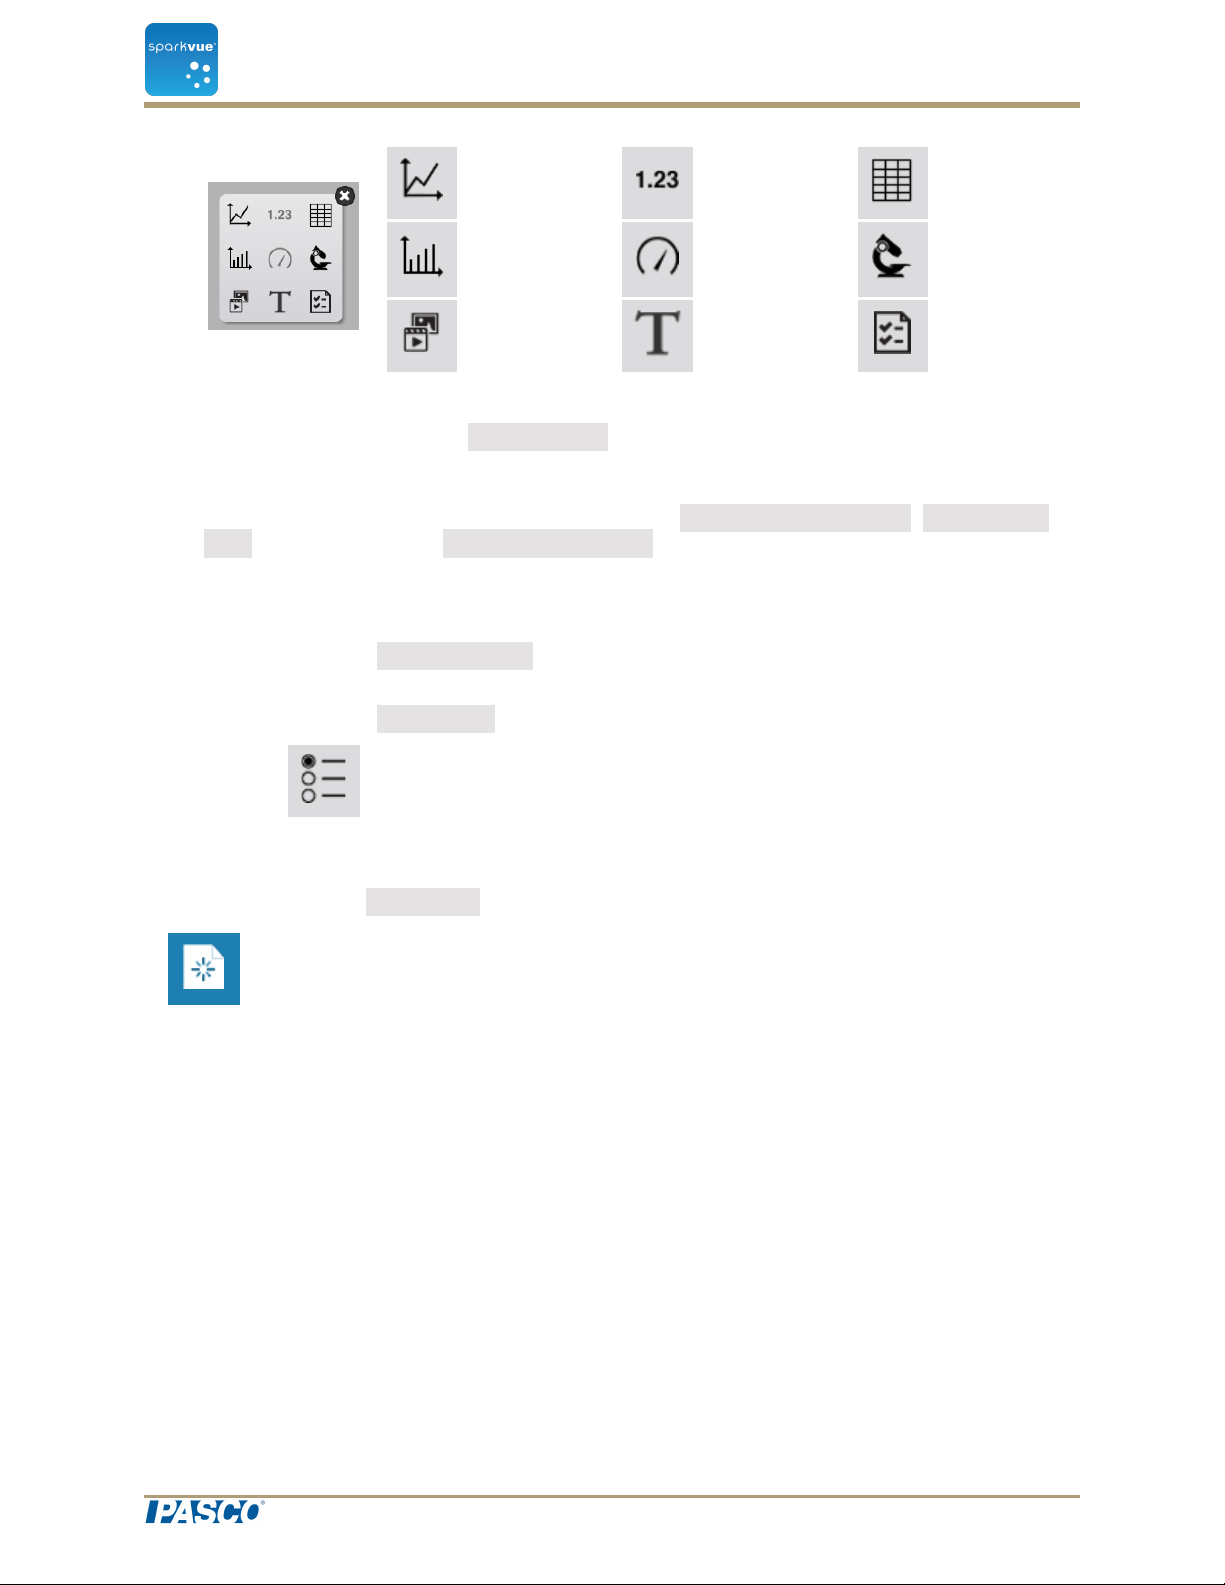
2. Touch a display type for each placeholder.
Document Number: 012-11074D 10
Page 23
SPARKvue
2 Starting an experiment
®
Moving on from the Home screen
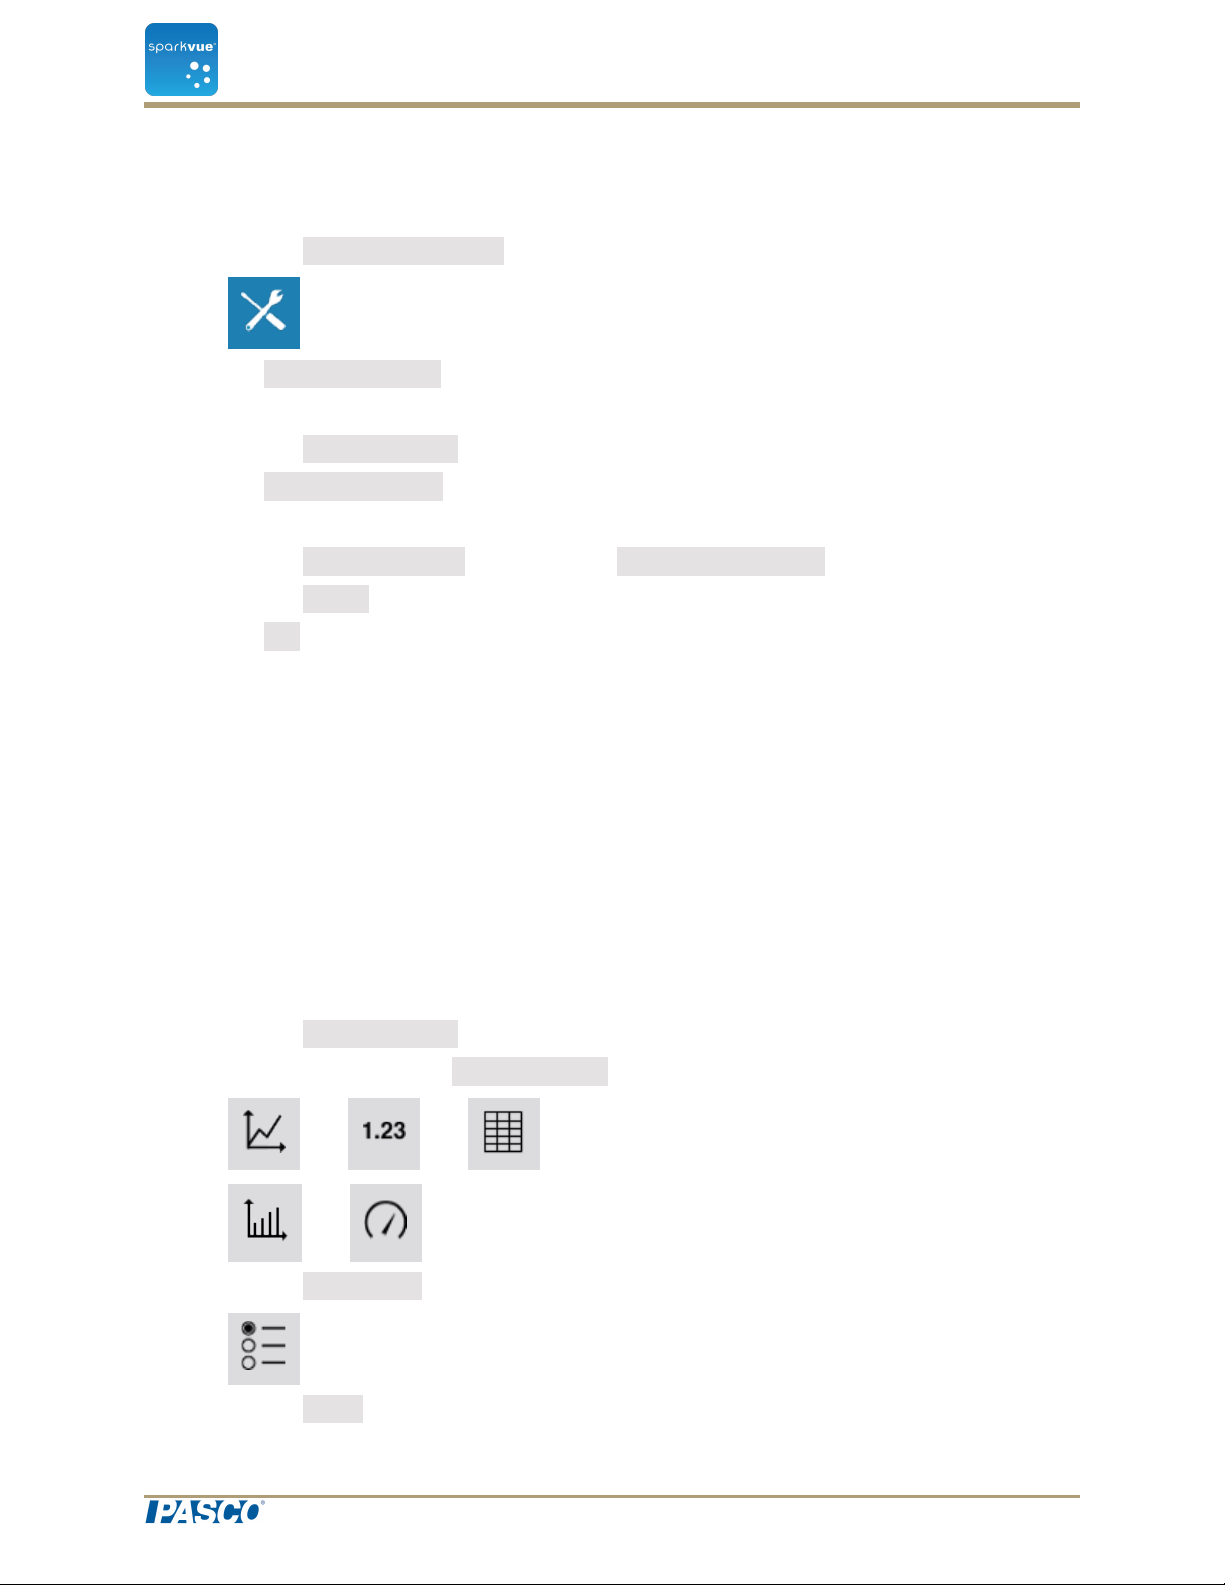
Line
Graph
Digits Table
Bar Graph Meter Camera
Media Text
Assessment
3. For Text Boxes: Type in text into the Text Box.
4. For Cameras: Touch the Image Tools button. See Capturing a camera image.
5. For other data displays: Select the data for each display on the page.
a. Touch the display data label(s), for example: Select Measurement, X-Axis Vari-
able, Y-Axis Variable, Select a Media File, Add an Assessment
or
b. Open the display properties and select the data.
i. Touch the Display Tools button near the lower or upper left corner of the dis-
play.
ii. Touch the Properties button.
Add additional pages:
Repeatedly click the New Page button to add pages to your SPARKlab.
Document Number: 012-11074D 11
Page 24
3 Setting up an experiment
SPARKvue
®
Customizing data collection
3 Setting up an experiment
n
"Customizing data collection": 12
n
"Customizing how numbers are displayed": 14
n
"Calibrating sensors": 16
n
"Using sensor adapters": 19
Customizing data collection
You can start recording data using the default settings, or complete one or more of the following tasks to change the sampling rate or sampling mode.
n
"Setting the sample rate": 12
n
"Putting SPARKvue into periodic sampling mode": 12
n
"Putting SPARKvue into manual sampling mode": 13
n
"Setting an automatic stop condition": 13
Setting the sample rate
With SPARKvue in periodic sampling mode (the default mode), complete these steps to
set how many data points are recorded each second or how much time elapses between
data points:
1. Click the Sampling Options button.
2. The Sampling Options screen opens.
3. Click the Sample Rate box and click a value.
4. Click the Sample Rate Unit box and click Hz, seconds, minutes, or hours.
5. Click OK.
Putting SPARKvue into periodic sampling mode
In periodic sampling mode (the default mode, sometimes known as “continuous” mode),
SPARKvue records data points at regular intervals. If SPARKvue is in manual sampling
mode, complete these steps to put it into periodic sampling mode:
Document Number: 012-11074D 12
Page 25
3 Setting up an experiment
SPARKvue
1. Click the Sampling Options button.
The Sampling Options screen opens.
2. Click Periodic.
3. Click OK.
®
Customizing data collection
Putting SPARKvue into manual sampling mode
In manual sampling mode, a single value from each measurement is recorded each time
you manually trigger SPARKvue. Complete these steps to put SPARKvue into manual
sampling mode:
1. Click the Sampling Options button.
The Sampling Options screen opens.
2. Click Manual.
3. Click OK.
Setting an automatic stop condition
When a stop condition is set, SPARKvue automatically stops recording data after a set
time interval.
Complete these steps to set a stop condition:
1. Click the Sampling Options button.
The Sampling Options screen opens.
2. Under Automatic Stop Condition:, click the Condition: box and click Stop after
duration.
3. Click the Value box and enter a time value.
4. Click the Units box and click units of time.
5. Click OK.
Document Number: 012-11074D 13
Page 26
3 Setting up an experiment
SPARKvue
®
Customizing how numbers are displayed
Customizing how numbers are displayed
n
"Setting the number of decimal places displayed": 14
n
"Setting the number of significant figures displayed": 14
n
"Displaying numbers in scientific notation": 15
n
"Changing the units of a measurement": 15
Setting the number of decimal places displayed
1. Click the Experiment Tools button.
The Experiment Tools screen opens.
2. Click Data Properties.
The Data Properties screen opens.
3. Click the Measurement box and click a measurement or other variable.
4. Click the Number Style box and click Fixed Precision.
5. Click the Digits box and select the number of digits to be displayed after the
decimal point.
6. Click OK.
Setting the number of significant figures displayed
1. Click the Experiment Tools button.
The Experiment Tools screen opens.
2. Click Data Properties.
The Data Properties screen opens.
3. Click the Measurement box and click a measurement or other variable.
4. Click the Number Style box and click Significant Figures.
5. Click the Digits box and select the number of significant figures to be displayed.
6. Click OK.
Document Number: 012-11074D 14
Page 27
3 Setting up an experiment
SPARKvue
®
Customizing how numbers are displayed
Displaying numbers in scientific notation
1. Click the Experiment Tools button.
2. Click Data Properties.
The Data Properties screen opens.
3. Click the Measurement box and click a measurement or other variable.
4. Click Number Format.
The number format options appear.
5. Click the Number Style: box and click Scientific Notation.
6. Click the Digits box and select the number of digits to be displayed.
7. Click OK.
Changing the units of a measurement
Do one or both of the following tasks to select different units for a measurement.
n
"Changing the units of a measurement in an existing display": 15
n
"Changing the default units of a measurement": 16
Changing the units of a measurement in an existing display
Complete these steps to change the units of a measurement displayed in an existing
graph, digits display, table, or meter:
1. Click the Measurement button to change; skip to step 4.
2. Or, click the applicable Display Tools button to open the tools palette.
3. Click the Properties button to open the Properties screen.
4. Click the Units box and select a unit of measure.
Document Number: 012-11074D 15
Page 28
3 Setting up an experiment
SPARKvue
5. Click OK.
The display shows the measurement with the selected units.
®
Calibrating sensors
Changing the default units of a measurement
Complete these steps to change the units that will be used by default when you select a
measurement in the future:
1. Click the Experiment Tools button to open the Experiment Tools screen.
Note:The Experiment Tools button is visible in data collection mode.
2. Click Data Properties to open the Data Properties screen.
3. Click the Measurement box and select a measurement.
4. Click the Units box and select units of measure.
5. Click OK.
The next time you select that measurement for display, it will appear with the units
that you selected.
Calibrating sensors
Sensor calibration is an optional step that can help to make measurements more accurate.
Complete the following tasks to select a measurement and calibration type and perform
a calibration.
1. "Selecting a measurement to calibrate and a calibration type": 16
2. "Performing a calibration": 17
Selecting a measurement to calibrate and a calibration type
1. Click the Experiment Tools button.
The Experiment Tools screen opens.
2. Click Calibrate Sensor.
The Calibrate Sensor: Select Measurement screen opens.
3. Click the Sensor box and click the sensor to be calibrated.
Document Number: 012-11074D 16
Page 29

3 Setting up an experiment
SPARKvue
®
Calibrating sensors
4. Click the Measurement box and click the measurement to be calibrated.
5. Click the Calibration Type box and click a calibration type.
See the instructions provided with your sensor for information about what type of
calibration is appropriate for your sensor.
6. Click Next.
The Calibrate Sensor Enter Values screen opens.
7. Continue to "Performing a calibration": 17.
Performing a calibration
After you have selected a measurement to be calibrated and a calibration type (see previous task), you are ready to perform a calibration.
Depending on the calibration type that you have selected, perform a 2-point calibration,
a 1-point offset-only calibration, or a 1-point slope-only calibration.
n
"Performing a 2-point calibration": 17
n
"Performing a 1-point offset-only calibration": 18
n
"Performing a 1-point slope-only calibration": 18
n
"Calibrating a Drop Count sensor (example)": 18
Performing a 2-point calibration
In the Calibrate Sensor Enter Values screen, complete these steps:
1. Apply a known quantity to the sensor. For example, place a pH probe in a pH4 buffer solution.
2. Under Calibration Point 1Click the Standard Value box and enter the known
value.
For example, enter the known pH of the buffer solution.
3. Under Calibration Point 1Click Read From Sensor.
The value measured by the sensor is transferred to the Sensor Value box.
4. Apply a different known quantity to the sensor. For example, place the pH probe in
a pH7 buffer solution.
5. Under Calibration Point 2Click the Standard Value box and enter the known
value. For example, enter the known pH of the buffer solution.
6. Under Calibration Point 2Click Read From Sensor. The value measured by the
sensor is transferred to the Sensor Value box.
7. Click OK.
Calibration is complete.
Document Number: 012-11074D 17
Page 30

3 Setting up an experiment
SPARKvue
®
Calibrating sensors
Performing a 1-point offset-only calibration
In the Calibrate Sensor Enter Values screen, complete these steps:
1. Apply a known quantity to the sensor. For example, place a temperature probe in
ice water known to be 0°C.
2. Under Calibration Point 1 Click the Standard Value box and enter the known
value.
For example, enter the known temperature of the water.
3. Under Calibration Point 1 Click Read From Sensor.
The value measured by the sensor is transferred to the Sensor Value box.
4. Click OK.
Calibration is complete.
Performing a 1-point slope-only calibration
In the Calibrate Sensor Enter Values screen,complete these steps:
1. Apply a known quantity to the sensor. For example, place a dissolved oxygen
probe in a bottle known to contain 9.1mg/L of dissolved oxygen.
2. Under Calibration Point 2 Click the Standard Value box and enter the known
value.
For example, enter the known dissolved oxygen concentration.
3. Under Calibration Point 2 Click Read From Sensor.
The value measured by the sensor is transferred to the Sensor Value box.
4. Click OK.
Calibration is complete.
Calibrating a Drop Count sensor (example)
Tip: The Drop Dispenser has two stopcocks. The top stop cock is used to regulate flow
rate and the bottom stopcock is used to turn the flow on and off. The bottom stopcock
should either be in the completely open or completely closed position.
The drop counter is calibrated, using the SPARKvue Experiment Tools to correlate the
number of drops counted to the volume of liquid dispensed from the Drop Dispenser.
1. Attach the Drop Dispenser (syringe, two stopcocks and drop tip) to a support rod.
2. Fill the syringe with titrant.
3. Open both stopcock valves and adjust the valve on the top stopcock so that the
drops fall at a rate of about 1 drop per second. Close the bottom valve after the rate
is achieved.
4. Connect the Drop Counter and launch SPARKvue.
Document Number: 012-11074D 18
Page 31

3 Setting up an experiment
SPARKvue
®
Using sensor adapters
5. Align the drop tip with the opening in the Drop Counter. Put a graduated 10 mL cylinder under the Drop Counter opening.
6. While on the Home screen, open the bottom stopcock to allow titrant to flow.
7. After about 10 mL of titrant is collected in the graduated cylinder, close the bottom
stopcock.
8. Record the exact volume from the graduated cylinder.
9. Build the desired display for you experiment.
10. Click the Experiment Tools button.
The Experiment Tools screen opens.
11. Click Calibrate Sensor.
The Calibrate Sensor: Select Measurement screen opens.
12. the Sensor: box and select Drop Counter.
13. Click the Measurement: box and select Fluid Volume (ml).
14. Click the Calibration Type: box and select 1 point (Adjust Slope Only).
15. Click NEXT.
The Calibrate Sensor screen opens.
16. Under Calibration Point 2 click the Standard Value: box and enter the recorded
volume (from step 8).
17. Under Calibration Point 2 click Read From Sensor.
18. Click OK to exit the Calibrate Sensor screen.
19. Click OK to exit the Experiment Tools screen.
Using sensor adapters
n
"Connecting a sensor through a Digital Adapter or Photogate Port": 19
n
"Connecting a sensor through an Analog Adapter": 20
Connecting a sensor through a Digital Adapter or Photogate Port
The Digital Adapter (PASCO part PS-2159) allows digital switch-type sensors such as
photogates and smart pulleys to be connected to a PASPORT interface and used with
SPARKvue. It also allows the use of a ScienceWorkshop Motion Sensor (CI-6742A) or
Rotary Motion Sensor (CI-6538).
Document Number: 012-11074D 19
Page 32

3 Setting up an experiment
SPARKvue
®
Using sensor adapters
The Photogate Port (PS-2123) is a type of adapter that supports switch-type sensors, but
not the Rotary Motion Sensor or Motion Sensor.
Complete these steps to connect and configure a sensor with a Digital Adapter or Photogate Port:
1. Connect the adapter to your PASPORT interface.
2. Connect a digital sensor to the adapter.
You can connect a switch-type sensor to either port of the adapter.
If you are connecting a Motion Sensor or Rotary Motion Sensor, connect the yellow
plug to Port 1 and the black plug to Port 2. A list of digital sensors and sensor configurations appears.
3. Optionally, connect a second switch-type sensor to the other port of the adapter.
4. In the list, click one of the sensors or configurations to select it and click OK.
You may need to click the arrows to scroll the list.
5. If SPARKvue prompts you to enter one or more measurements specific to your
equipment, enter the value or values and click OK. The measurements that you
enter will be used to compute data such as the velocity of an object passing
through a photogate.
Connecting a sensor through an Analog Adapter
The Analog Adapter (PASCO part PS-2158) allows analog ScienceWorkshop sensors
to be connected to a PASPORT interface and used with SPARKvue.
Complete these steps to connect and configure a sensor with an Analog Adapter:
1. Connect the Analog Adapter to your PASPORT interface.
2. Connect an analog sensor to the adapter.
A list of sensors appears.
3. Click one of the sensors to select it and click OK.
You may need to click the arrows to scroll the list.
4. Optionally, click the Gain box and click a gain setting.
5. Click OK again.
Document Number: 012-11074D 20
Page 33

4 Data recording
SPARKvue
®
Recording a run of periodically sampled data
4 Data recording
The following tasks describe how to record a data run with SPARKvue in periodic
sampling mode and manual sampling mode.
Note: Over the course of a science investigation, you can record multiple data runs and
sets.
n
"Recording a run of periodically sampled data": 21
n
"Recording a set of manually sampled data": 21
n
"Deleting data runs": 22
Recording a run of periodically sampled data
To record manually sampled data, first put SPARKvue into periodic sampling mode.
With SPARKvue in periodic sampling mode (the default mode, sometimes known as
“continuous” mode), complete these steps to record a data run:
1. Click the Start button.
SPARKvue creates a new data run and starts recording data points into it.
2. To stop recording data, click the Stop button.
SPARKvue stops recording data.
3. Repeat these steps to record another data run.
Recording a set of manually sampled data
To record manually sampled data, first put SPARKvue into manual sampling mode.
In manual sampling mode, a single value from each measurement is recorded each time
you manually trigger SPARKvue. A series of values is recorded in a data set.
Complete these steps to start a data set, trigger points to be recorded, and close the data
set:
1. Optionally, turn to a page in your SPARKlab where you will be able to see your
data in a table.
Document Number: 012-11074D 21
Page 34

4 Data recording
SPARKvue
®
Deleting data runs
You can record data with any type of display visible (or no display at all), but it is
typical to record manually sampled data while looking at a table.
2. Click the Start button.
SPARKvue creates a new data set. Live data appear in the data displays.
3. When you are ready to record a data point, click the Keep button.
SPARKvue records a single value from each measurement.
4. Repeat the previous step as many times as necessary to record all of the data that
you want in the data set.
5. When the entire set has been recorded, click the Stop button.
The data set closes.
6. Repeat these steps to record another data set.
Deleting data runs
1. Click the Experiment Tools button.
The Experiment Tools screen opens.
2. Click Manage Data.
3. Click Manage Runs.
The Manage Runs screen opens.
4. Do one of the following:
l
Click Delete Last Run.
l
Click Delete All Runs.
l
Click Delete Run… and click the run that you want to delete.
5. Click Done.
6. Click OK.
Document Number: 012-11074D 22
Page 35

SPARKvue
®
5 Data display
n
"Displaying data in a line graph": 23
n
"Displaying data in a bar graph": 34
n
"Displaying data in a Multiple y-axis graph": 31
n
"Displaying data in a table": 44
n
"Displaying data in a digits display": 50
n
"Displaying data in a meter": 52
Displaying data in a line graph
n
"Creating a new line graph": 23
n
"Showing and hiding the line graph tool palette": 25
5 Data display
Displaying data in a line graph
n
"Adjusting the scale of a line graph": 25
n
"Selecting data to show in an existing line graph": 26
n
"Selecting data for operation in a line graph": 28
n
"Annotating data in a line graph": 30
n
"Displaying data in a Multiple y-axis graph": 31
Creating a new line graph
To create a new line graph, do one of the following (A or B):
A. From the Home screen create a new SPARKlab:
Touch Build.
Continue to step 1.
B. Within a SPARKlab add a new page:
Touch the New Page button.
Document Number: 012-11074D 23
Page 36

SPARKvue
®
Continue to step 1.
1. Select a template from the library.
Scroll up and down to view templates
The Display Selection opens for each placeholder.
5 Data display
Displaying data in a line graph
2. Touch the Line Graph icon.
Note: Tables and graphs are disabled for some page configurations.
Examples:
Disabled for tables and graphs
Enabled
3. Select the data for each display on the page.
a. Touch the display data label(s): Select Measurement
or
Document Number: 012-11074D 24
Page 37

5 Data display
SPARKvue
®
Displaying data in a line graph
b. Open the display properties and select the data.
i. Touch the Display Tools button near the lower or upper left corner of the dis-
play.
ii. Touch the Properties button.
Showing and hiding the line graph tool palette
Show: To show the tool palette, touch the Display Tools button near the lower or upper
left corner of the display.
Hide: To hide the tool palette, touch the Display Tools button.
Adjusting the scale of a line graph
Do one or more of the following tasks (in any order) to change the range and domain of a
graph.
n
"Scaling a graph to fit all data": 25
n
"Scaling by direct manipulation": 26
Scaling a graph to fit all data
1. Click the Graph Tools button to open the tool palette.
2. Click the Scale-to-fit button.
The graph adjusts to fit all data (or selected data).
Document Number: 012-11074D 25
Page 38

5 Data display
SPARKvue
®
Displaying data in a line graph
Scaling by direct manipulation
Complete one or more of these steps in any order:
n
Click one of the numbers labeling the x-scale of the graph and drag it left or right.
The graph expands or contracts horizontally.
n
Click one of the numbers labeling the y-scale of the graph and drag it up or down.
The graph expands or contracts vertically.
n
Click the middle of the graph and drag it in any direction.
The graph moves.
Expanding and contracting horizontally. Expanding and contracting vertically.
Moving.
Selecting data to show in an existing line graph
n
"Showing and hiding data runs in a graph": 26
n
"Changing the variable on the x- or y-axis": 27
Showing and hiding data runs in a graph
1. Click the graph legend.
The legend enlarges to show available data runs.
Document Number: 012-11074D 26
Page 39

5 Data display
SPARKvue
®
Displaying data in a line graph
2. Select or clear (Click) the check box next to each data run that you want to show or
hide.
3. Optionally, click outside the legend to reduce the size of the legend.
Graph legend
Changing the variable on the x- or y-axis
1. Click the Measurement button to change; skip to step 4.
2. Or, click the applicable Display Tools button to open the tools palette.
3. Click the Properties button to open the Properties screen.
4. Click the display variable you want to change.
5. Click the Measurement box and click the replacement measurement or other variable.
6. Click OK.
Document Number: 012-11074D 27
Page 40

5 Data display
SPARKvue
®
Displaying data in a line graph
Selecting data for operation in a line graph
n
"Selecting a data run for operation in a line graph": 28
n
"Selecting part of a data run for operation in a line graph": 28
Selecting a data run for operation in a line graph
In the display legend, a red outline surrounds the run that is selected for operation. Complete these steps to change which run is selected:
i. Click the legend.
The legend enlarges.
ii. In the legend, click the symbol (but not the check box) of the run that you want to
select.
The red outline moves to the selected run.
Sample Legend
Note: When you apply statistics, such as mean or standard deviation, they are
applied to the selected run.
Selecting part of a data run for operation in a line graph
If part of a data run is selected for operation, the selected data points are highlighted.
Scale-to-fit, statistics, graph tools, and curve fits are applied only to the selected data
points.
Complete these steps to select part of a data run:
1. Optional: select a different data run.
In the display legend, a red outline surrounds the run that is selected for operation.
Document Number: 012-11074D 28
Page 41

5 Data display
SPARKvue
®
Displaying data in a line graph
Complete these steps to change which run is selected:
i. Click the legend.
The legend enlarges.
ii. In the legend, click the symbol (but not the check box) of the run that you
want to select.
The red outline moves to the selected run.
Sample Legend
Note: When you apply statistics, such as mean or standard deviation, they
are applied to the selected run.
2. Click the Graph Tools button to open the tool palette.
3. Click the Select button.
The button changes color.
4. Click and drag to select data points.
5. When the desired data points are highlighted, click done selecting.
6. To clear the selection, click the Select button again.
Document Number: 012-11074D 29
Page 42

5 Data display
SPARKvue
®
Displaying data in a line graph
Annotating data in a line graph
n
"Adding an annotation": 30
n
"Editing or deleting an annotation": 31
Adding an annotation
1. If there is more than one data run on the line graph, first select the run that the
annotation will be attached to:
a. Click the graph legend.
The legend enlarges.
b. In the legend, click the symbol of the run that you want to select.
The red outline moves to the selected run.
2. Click the Graph Tools button to open the tool palette.
3. Click the Select button.
The button changes color.
4. Click one or points on the graph.
5. Click done selecting.
6. Click the Annotation button.
7. Enter a note and click OK.
Document Number: 012-11074D 30
Page 43

SPARKvue
®
An annotation appears on the graph. You can then click and the move the annotation.
8. Click the Select button.
Editing or deleting an annotation
1. Click the Graph Tools button to open the tool palette.
2. Click the annotation that you want to edit or delete.
The annotation is highlighted.
3. Click the Annotation button.
The on-screen keyboard appears.
5 Data display
Displaying data in a line graph
4. Edit or delete the annotation and click OK.
If you delete all the text, the annotation is removed.
If you change the text, the new text appears in the annotation box on the bar graph.
Displaying data in a Multiple y-axis graph
n
"Creating a multiple y-axes line graph": 31
n
"Working with multiple y-axes": 34
Creating a multiple y-axes line graph
To create a new line graph with multiple y-axes:
I. Create a line graph (or use an existing line graph)
II. "Add a vertical axis:": 33
To create a line graph, do one of the following (A or B):
A. From the Home screen create a new SPARKlab:
Touch Build.
Document Number: 012-11074D 31
Page 44

SPARKvue
®
Continue to step 1.
B. Within a SPARKlab add a new page:
Touch the New Page button.
Continue to step 1.
1. Select a template from the library.
Scroll up and down to view templates
5 Data display
Displaying data in a line graph
The Display Selection opens for each placeholder.
2. Touch the Line Graph icon.
Document Number: 012-11074D 32
Page 45

SPARKvue
®
Displaying data in a line graph
Note: Tables and graphs are disabled for some page configurations.
Examples:
Disabled for tables and graphs
Enabled
3. Select the data for each display on the page.
a. Touch the display data label(s): Select Measurement
5 Data display
or
b. Open the display properties and select the data.
i. Touch the Display Tools button near the lower or upper left corner of the dis-
play.
ii. Touch the Properties button.
Add a vertical axis:
1. Open the properties.
i. Touch the Display Tools button near the lower or upper left corner of the dis-
play.
ii. Touch the Properties button.
2. Click Add Vertical Axis.
3. Click Measurement and select the second measurement.
Note: Axis y1 is the outside axis and y2 is the inside axis.
4. Click OK.
A graph with multiple y-axes displays.
Document Number: 012-11074D 33
Page 46

5 Data display
SPARKvue
®
Displaying data in a bar graph
Working with multiple y-axes
Most of the actions you can perform on a single y-axis graph can be performed on multiple y-axes graphs. You can:
n
"Adjusting the scale of a line graph": 25
n
"Selecting data to show in an existing line graph": 26
n
"Selecting data for operation in a line graph": 28
n
"Annotating data in a line graph": 30
Displaying data in a bar graph
n
"Creating a new bar graph": 34
n
"Showing and hiding the bar graph tool palette": 36
n
"Showing data in bar graphs": 36
n
"Annotating data in bar graphs": 40
n
"Viewing bar graphs": 42
n
"Customizing axes labels and units on bar graphs": 44
Creating a new bar graph
To create a new bar graph, do one of the following (A or B):
A. From the Home screen create a new SPARKlab:
Touch Build.
Continue to step 1.
B. Within a SPARKlab add a new page:
Touch the New Page button.
Continue to step 1.
Document Number: 012-11074D 34
Page 47

SPARKvue
®
1. Select a template from the library.
Scroll up and down to view templates
The Display Selection opens for each placeholder.
5 Data display
Displaying data in a bar graph
2. Touch the Bar Graph icon.
Note: Tables and graphs are disabled for some page configurations.
Examples:
Disabled for tables and graphs
Enabled
3. Select the data for each display on the page.
a. Touch the display data label(s): X-Axis Variable, Y-Axis Variable
or
b. Open the display properties and select the data.
Document Number: 012-11074D 35
Page 48

5 Data display
SPARKvue
®
Displaying data in a bar graph
i. Touch the Display Tools button near the lower or upper left corner of the dis-
play.
ii. Touch the Properties button.
Showing and hiding the bar graph tool palette
Show: To show the tool palette, touch the Display Tools button near the lower or upper
left corner of the display.
Hide: To hide the tool palette, touch the Display Tools button.
Showing data in bar graphs
When you create a new bar graph, the first bar is already created for you. You will need
to name the bar and add additional bars in your bar graph and record data for each bar.
n
"Adding bars and bar names in bar graphs": 36
n
"Editing bars and bar names in bar graphs": 37
n
"Adding data in bar graphs": 37
n
"Adding additional data runs to a bar graph": 38
n
"Adding additional data runs to a bar graph using sensor readings": 39
n
"Showing and hiding data runs in a bar graph": 39
n
"Selecting data for operation in a bar graph": 40
Adding bars and bar names in bar graphs
1. Click the placeholder bar. This will open the bar edit menu. A placeholder bar
appears in the bar graph.
Document Number: 012-11074D 36
Page 49

5 Data display
SPARKvue
®
Displaying data in a bar graph
Note: this tool will already be active when a bar graph is first created.
2. Click the bar with muted color.
3. Click the default bar name above the numeric keypad, such as Bar 1
4. Click in the bar name box, delete the old name, and enter a new name.
5. Click OK.
A new placeholder bar is automatically added.
6. To name the new bar, click it, and repeat steps 2 through 4.
7. Continue adding the bars you need.
8. When you finish adding bars, click the Bar Add and Edit button to turn off the tool.
Turning this tool off removes the last placeholder bar.
Editing bars and bar names in bar graphs
1. Open Properties:
i. Touch the Display Tools button near the lower or upper left corner of the dis-
play.
ii. Touch the Properties button.
2. Click the Bar Edit button.
3. Click the bar you want to edit.
The bar edit menu opens.
4. Click in the bar name box, delete the old name, and enter a new name.
5. Click OK.
Adding data in bar graphs
You can add data to bars either manually or through collecting data using a sensor.
n
"Entering data into bar graph manually": 38
n
"Collecting data for bar graph using a sensor": 38
Document Number: 012-11074D 37
Page 50

5 Data display
SPARKvue
®
Displaying data in a bar graph
Entering data into bar graph manually
1. Click the Bar Graph Tools button to open the tool palette.
2. Click the bar you want to edit.
3. Enter a value for the bar.
4. Click OK.
Collecting data for bar graph using a sensor
It is recommended that the bars are given names either before or during data collection.
See Editing bars and bar names in bar graphs and "Adding bars and bar names in bar
graphs": 36.
1. Click the record arrow to record data for the first empty bar in a data run.
The first bar becomes active and displays the data being collected, and the record
button changes to a check mark.
2. Click the check mark to stop collecting for the current bar and move to the next bar.
Note: The will remains gray if it does not have a name assigned to it.
3. Click the Stop button to stop collecting data.
Adding additional data runs to a bar graph
You can show multiple data sets in a bar graph at once.
1. If necessary, click the Bar Graph Tools button near the lower left corner of the bar
graph to open the tool palette.
Document Number: 012-11074D 38
Page 51

5 Data display
SPARKvue
®
Displaying data in a bar graph
2. For manually entered data, click the Run Addition button.
3. Enter or record the data for each bar.
Adding additional data runs to a bar graph using sensor readings
You can show multiple data sets in a bar graph at once.
1. For data collected using a sensor, click the Record Arrow.
2. Click the Check mark to stop collecting for the current bar and move to the next
bar.
Note: the bar will remain gray if it does not have a name assigned to it.
3. Click the Stop button to stop collecting data.
Showing and hiding data runs in a bar graph
1. Click the graph legend.
The legend enlarges to show available data runs.
2. Select or clear (Click)the check box next to each data run that you want to show or
hide.
3. Optionally, click outside the legend to reduce the size of the legend.
Document Number: 012-11074D 39
Page 52

5 Data display
SPARKvue
®
Displaying data in a bar graph
Bar Graph legend
Selecting data for operation in a bar graph
In the display legend, a red outline surrounds the run that is selected for operation. Complete these steps to change which run is selected:
i. Click the legend.
The legend enlarges.
ii. In the legend, click the symbol (but not the check box) of the run that you want to
select.
The red outline moves to the selected run.
Sample Legend
Note: When you apply statistics, such as mean or standard deviation, they are
applied to the selected run.
Annotating data in bar graphs
You can add annotation and show numeric values on bars.
Document Number: 012-11074D 40
Page 53

5 Data display
SPARKvue
n
"Adding annotations to bars": 41
n
"Editing or deleting annotations to bars": 41
n
"Showing numeric values on bars": 42
®
Displaying data in a bar graph
Adding annotations to bars
If there is more than one data run on the graph, first select the run that the annotation will
be attached to:
1. Click the graph legend.
The legend enlarges.
2. In the legend, click the symbol of the run(s) that you want to annotate.
3. click the Bar Graph Tools button to open the tool palette.
4. Click the Annotation button.
5. Click a bar.
6. Enter a note, and click OK.
An annotation appears on the bar graph.
Editing or deleting annotations to bars
1. Click the Graph Tools button to open the tool palette.
2. Click the annotation that you want to edit or delete.
The annotation is highlighted.
3. Click the Annotation button.
Document Number: 012-11074D 41
Page 54

SPARKvue
®
Displaying data in a bar graph
The Enter Note screen appears.
4. Edit or delete the annotation text, and click OK.
If you delete all the text, the annotation is removed.
If you change the text, the new text appears in the annotation box on the bar graph.
Showing numeric values on bars
To show numeric values at the tops of bars in a bar chart for a data run:
1. Click the Bar Graph Tools button to open the tool palette.
5 Data display
2. Click the Numeric Values button.
Numeric values appear at the top of each bar.
3. Click the Numeric Values button to remove the numeric values.
Viewing bar graphs
You can scroll and scale bar graphs to help you view all data in the graph:
Document Number: 012-11074D 42
Page 55

5 Data display
SPARKvue
n
"Scrolling a bar graph": 43
n
"Scaling a bar graph to show all data": 43
n
"Scaling a bar graph by expanding or compressing the axes": 43
®
Displaying data in a bar graph
Scrolling a bar graph
To scroll and change the view of a bar graph, click the middle of the graph and drag it
up, down, side-to-side, or diagonally.
Scaling a bar graph to show all data
1. Click the Bar Graph Tools button to open the tool palette.
2. Click the Scale-to-fit button.
The graph adjusts to fit all data (or selected data).
Scaling a bar graph by expanding or compressing the axes
You can change the scale of a bar graph by expanding or compressing the X-axis, Yaxis, or both.
To do this, complete one or both of the following actions:
n
Click one of the labels on the X-axis and drag horizontally (left or right).
The graph expands or contracts horizontally, making each bar area wider or narrower.
n
Click one of the labels on the Y-axis, and drag vertically (up or down).
The bars in the bar graph display larger or smaller depending on the scale adjustment.
Document Number: 012-11074D 43
Page 56

5 Data display
SPARKvue
®
Displaying data in a table
Customizing axes labels and units on bar graphs
To create an axis label:
1. Open Properties:
i. Touch the Display Tools button near the lower or upper left corner of the dis-
play.
ii. Touch the Properties button.
2. Click the Measurement box for either the X-axis variable or Y-axis variable.
3. Click User-entered.
4. Click Create Data Set.
The Define Data Set box displays.
5. Click the Measurement Name box.
6. Type the label text, and click OK.
7. Click the Unit Name box (if desired).
8. Type the type of unit, and click OK.
9. Click OK.
The new axis label(s) and unit(s) display in your bar graph.
Displaying data in a table
n
"Creating a table": 44
n
"Showing and hiding the table tool palette": 46
n
"Scrolling a table": 46
n
"Selecting data to show in an existing table": 47
n
"Selecting cells for operation in a table": 49
Creating a table
To create a table, do one of the following (A or B):
A. From the Home screen create a new SPARKlab:
Touch Build.
Document Number: 012-11074D 44
Page 57

SPARKvue
®
Continue to step 1.
B. Within a SPARKlab add a new page:
Touch the New Page button.
Continue to step 1.
1. Select a template from the library.
5 Data display
Displaying data in a table
Scroll up and down to view templates
The Display Selection opens for each placeholder.
2. Touch the Table icon.
Document Number: 012-11074D 45
Page 58

SPARKvue
Note: Tables and graphs are disabled for some page configurations.
3. Select the data for each display on the page.
a. Touch the display data label(s): Select Measurement
®
Examples:
Disabled for tables and graphs
Enabled
Displaying data in a table
5 Data display
or
b. Open the display properties and select the data.
i. Touch the Display Tools button near the lower or upper left corner of the dis-
play.
ii. Touch the Properties button.
Showing and hiding the table tool palette
Show: To show the tool palette, touch the Display Tools button near the lower or upper
left corner of the display.
Hide: To hide the tool palette, touch the Display Tools button.
Scrolling a table
Click the middle of the table and drag it up or down.
Document Number: 012-11074D 46
Page 59

SPARKvue
®
Selecting data to show in an existing table
n
"Selecting a run for display in an existing column": 47
n
"Changing the variable displayed in an existing column": 47
5 Data display
Displaying data in a table
n
"Adding a column": 48
n
"Removing a column": 48
Selecting a run for display in an existing column
1. Click the run number at the top of the column.
A list of available runs appears.
2. Click the run that you want to see.
Changing the variable displayed in an existing column
1. Click the Measurement button to change; skip to step 4.
2. Or, click the Display Tools button to open the tools palette.
3. Click the Properties button to open the Properties screen.
4. Click the display variable you want to change.
Note: For tables, columns are number 1, 2, 3, etc. from left to right.
5. Click the Measurement box and click the replacement measurement or other variable.
6. Click OK.
Document Number: 012-11074D 47
Page 60

5 Data display
SPARKvue
®
Displaying data in a table
Adding a column
A table can contain up to six columns. Complete these steps to add a column to a table:
1. Click the Table Tools button to open the tool palette.
2. Optionally, click a position in the table where the new column will be inserted:
a. Click the Select button.
The button changes color.
b. Click the column to the right of where you want the new column to appear.
Note: If you do not click a position, the new column will be added to the right
side of the table.
3. Click the Add Column button.
A new, empty column is added to the table.
4. Click the Select Measurement button to select a measurement or other variable to
display in the new column.
Removing a column
1. Click the Table Tools button to open the tool palette.
2. Click the Select button.
The button changes color.
3. Click the column that you want to remove.
Document Number: 012-11074D 48
Page 61

5 Data display
SPARKvue
®
Displaying data in a table
4. Click the Remove Column button.
5. Click OK.
Selecting cells for operation in a table
If a group of table cells is selected for operation, the selected cells are outlined. If statistics are displayed, they apply only to the data in the selected cells.
Complete these steps to select cells:
1. Optional: select a different data run.
In the display legend, a red outline surrounds the run that is selected for operation.
Complete these steps to change which run is selected:
i. Click the legend.
The legend enlarges.
ii. In the legend, click the symbol (but not the check box) of the run that you
want to select.
The red outline moves to the selected run.
Sample Legend
Note: When you apply statistics, such as mean or standard deviation, they
are applied to the selected run.
2. Click the Table Tools button to open the tool palette.
Document Number: 012-11074D 49
Page 62

5 Data display
SPARKvue
®
Displaying data in a digits display
3. Click the Select button.
The button changes color.
4. On the table, drag down a column, across a row, or diagonally across rows and
columns to select a group of cells.
The selected group of cells is outlined.
Selecting cells in a single column. Selecting cells in a single row. Select-
ing cells in multiple columns and rows.
5. To clear the selection, click the Select button again.
Displaying data in a digits display
n
"Creating a new digits display": 50
n
"Showing and hiding the digits display tool palette ": 52
n
"Changing the variable in a digits display": 52
Creating a new digits display
To create a new digits display, do one of the following (A or B):
A. From the Home screen create a new SPARKlab:
Touch Build.
Document Number: 012-11074D 50
Page 63

SPARKvue
®
Continue to step 1.
B. Within a SPARKlab add a new page:
Touch the New Page button.
Continue to step 1.
1. Select a template from the library.
5 Data display
Displaying data in a digits display
Scroll up and down to view templates
The Display Selection opens for each placeholder.
2. Touch the Digits icon.
3. Select the data for each display on the page.
a. Touch the display data label(s): Select Measurement
or
b. Open the display properties and select the data.
i. Touch the Display Tools button near the lower or upper left corner of the
Document Number: 012-11074D 51
Page 64

5 Data display
SPARKvue
®
Displaying data in a meter
display.
ii. Touch the Properties button.
Showing and hiding the digits display tool palette
Show: To show the tool palette, touch the Display Tools button near the lower or upper
left corner of the display.
Hide: To hide the tool palette, touch the Display Tools button.
Changing the variable in a digits display
1. Click the Measurement button to change; skip to step 4.
2. Or, click the Display Tools button to open the tools palette.
3. Click the Properties button to open the Properties screen.
4. Click the display variable you want to change.
5. Click the Measurement box and click the replacement measurement or other variable.
6. Click OK.
Displaying data in a meter
n
"Creating a new meter": 53
n
"Showing and hiding the meter tool palette": 54
Document Number: 012-11074D 52
Page 65

SPARKvue
n
"Adjusting the scale of a meter": 54
n
"Changing the variable displayed in a meter": 55
n
"Customizing the appearance of a meter": 56
®
Creating a new meter
To create a new meter, do one of the following (A or B):
A. From the Home screen create a new SPARKlab:
Touch Build.
5 Data display
Displaying data in a meter
Continue to step 1.
B. Within a SPARKlab add a new page:
Touch the New Page button.
Continue to step 1.
1. Select a template from the library.
Scroll up and down to view templates
The Display Selection opens for each placeholder.
Document Number: 012-11074D 53
Page 66

SPARKvue
®
2. Touch the Meter icon.
3. Select the data for each display on the page.
a. Touch the display data label(s): Select Measurement
or
b. Open the display properties and select the data.
i. Touch the Display Tools button near the lower or upper left corner of the dis-
play.
5 Data display
Displaying data in a meter
ii. Touch the Properties button.
Showing and hiding the meter tool palette
Show: To show the tool palette, touch the Display Tools button near the lower or upper
left corner of the display.
Hide: To hide the tool palette, touch the Display Tools button.
Adjusting the scale of a meter
n
"Scaling a meter to fit all data": 55
n
"Setting the scale of a meter": 55
Document Number: 012-11074D 54
Page 67

SPARKvue
®
Scaling a meter to fit all data
1. Click the Meter Tools button to open the tool palette.
2. Click the Scale-to-fit button.
The scale adjusts to fit all data for the currently displayed data run.
Setting the scale of a meter
1. Click the Meter Tools button to open the tool palette.
5 Data display
Displaying data in a meter
2. Click the Properties button to open the Properties screen.
3. For the Always Scale to Fit: option click Off.
4. Click the Minimum: box and enter the low value of the desired range.
5. Click the Maximum: box and enter the high value of the desired range.
6. Click OK.
Changing the variable displayed in a meter
1. Click the Measurement button to change; skip to step 4.
2. Or, click the Display Tools button to open the tools palette.
3. Click the Properties button to open the Properties screen.
4. Click the display variable you want to change.
5. Click the Measurement box and click the replacement measurement or other vari-
Document Number: 012-11074D 55
Page 68

5 Data display
SPARKvue
®
Displaying data in a meter
able.
6. Click OK.
Customizing the appearance of a meter
1. Open Properties:
i. Touch the Display Tools button near the lower or upper left corner of the dis-
play.
ii. Touch the Properties button.
2. Click the Sweep Range: box and click Semicircle, Small Sweep, or Large
Sweep.
3. Click OK.
Document Number: 012-11074D 56
Page 69

SPARKvue
®
Connecting a camera or other video device
6 Image capture
n
"Connecting a camera or other video device": 57
n
"Displaying a camera image": 58
n
"Showing and hiding the image tool palette": 59
n
"Capturing a camera image": 60
n
"Switching between live and captured camera images": 60
n
"Selecting a captured camera image for display": 61
n
"Adjusting the scale and position of a camera image": 61
n
"Measuring in a camera image": 62
n
"Drawing on a camera image": 65
n
"Annotating a camera image": 67
6 Image capture
n
"Naming an image": 70
n
"Deleting and Renaming an image": 70
n
"Exporting an image": 71
Connecting a camera or other video device
Connect the camera or other imaging device to your computer. If your computer has a
built in camera, it will be detected automatically.
On the Home screen, you will see the camera(s) appear in the Sensors list.
Creating a new camera image
To create a new camera image, do one of the following (A or B):
A. From the Home screen create a new SPARKlab:
Touch Build.
Continue to step 1.
Document Number: 012-11074D 57
Page 70

SPARKvue
®
B. Within a SPARKlab add a new page:
Touch the New Page button.
Continue to step 1.
1. Select a template from the library.
Scroll up and down to view templates
6 Image capture
Displaying a camera image
The Display Selection opens for each placeholder.
2. Touch the Camera icon.
Displaying a camera image
From the Home screen
1. In the Home screen, click an Image measurement.
When selected, Image is highlighted in color.
2. Click Show.
Document Number: 012-11074D 58
Page 71

SPARKvue
A camera image display appears in a SPARKlab.
3. Click the Live Image button at the center of the display.
A live camera view appears in the display.
®
Showing and hiding the image tool palette
From within a SPARKlab
1. Click the New Page button.
The build a new page screen opens.
6 Image capture
2. Select a template. See "Starting a new SPARKlab page": 94
3. Click the Live Image button at the center of the display.
A camera image display appears in a SPARKlab.
4. Click the Live Image button at the center of the display.
A live camera view appears in the display.
Showing and hiding the image tool palette
Show: To show the tool palette, touch the Display Tools button near the lower or upper
left corner of the display.
Hide: To hide the tool palette, touch the Display Tools button.
Document Number: 012-11074D 59
Page 72

6 Image capture
SPARKvue
®
Capturing a camera image
Capturing a camera image
See "Creating a new camera image": 57 to add a new page with a Camera element.
On the page, perform the following to capture an image:
1. Click the Image Tools button to open the tool palette.
2. Click the Live Image button on the tool palette to show a live image if a live image
is not displayed.
A live image must be showing before you can capture a still image.
When a live image is showing, the button changes color.
3. Click the Capture button to capture a still image.
The live image is replaced by the captured still image.
Switching between live and captured camera images
To switch from a captured still image back to a live image:
1. Click the Image Tools button to open the tool palette.
2. Click the Live Image button in the tool palette.
The still image is replaced with a live image.
The Live Image button changes color.
Document Number: 012-11074D 60
Page 73

SPARKvue
To switch from a live image to a previously captured still image:
1. Click the image legend.
The legend expands to show all captured images.
2. Click the image to display.
®
Selecting a captured camera image for display
6 Image capture
Selecting a captured camera image for display
1. Click the image legend.
2. The legend expands to show a list of captured images.
3. Click the image to display.
Adjusting the scale and position of a camera image
Zooming in
In the tool palette, click the Zoom In button.
The display zooms in toward the center.
Document Number: 012-11074D 61
Page 74

6 Image capture
SPARKvue
®
Measuring in a camera image
Zooming out
In the tool palette, click the Zoom Out button.
The display zooms in toward the center.
Scale to fit
To show the entire image, click the Scale-to-fit button.
Panning a camera image
You can view different parts of an image by panning, or click a point on the image and
drag it left, right, diagonal, up, or down.
Measuring in a camera image
You can use a measurement tool on an image to measure the distance between two
points. By default, the distance is reported in pixels (px), but you can calibrate the measurement tool to report the distance in other units.
The following topics describe how to position and calibrate measurement tools.
n
"Placing a Measurement tool": 62
n
"Moving a Measurement tool": 63
n
"Deleting a Measurement tool": 64
n
"Calibrating camera image measurements": 64
Placing a Measurement tool
While displaying a still image, complete the following steps.
1. Click the Image Tools button to open the tool palette.
2. In the tool palette, click the Measurement button.
Document Number: 012-11074D 62
Page 75

SPARKvue
®
Measuring in a camera image
3. Optional: click the color button in the palette to change the color.
4. Click the point on the image.
5. Drag the box to the other point in the image.
A leader line with length display on the image.
6 Image capture
6. If necessary, drag the ends of the measurement tool to the desired location.
7. You can add additional measurement arrows, if needed.
Moving a Measurement tool
Measurements added to images can be moved.
To move a measurement arrow:
1. Click the box at one end of the measurement, and drag it to the desired location.
2. If necessary, click the box at the other end of the measurement tool and drag it to
the desired location.
Document Number: 012-11074D 63
Page 76

6 Image capture
SPARKvue
®
Measuring in a camera image
Deleting a Measurement tool
Measurements added to images can be removed. To remove a measurement arrow:
1. click the Image Tools button to open the tool palette.
2. In the tool palette, click the Measurement button.
The Measurement button changes color, and the measurement toolbar appears.
3. In the measurement toolbar, click the Erase button.
The Erase button changes color.
4. click the box at one end of a measurement arrow.
The measurement arrow is deleted.
Calibrating camera image measurements
To calibrate measurements, the image must include an object of known length.
1. Click the Image Tools button to open the tool palette.
2. In the tool palette, click the Measurement button.
3. Click the point on the image at one end of the object of known length.
4. Drag the box to the other end of the object.
Document Number: 012-11074D 64
Page 77

6 Image capture
SPARKvue
®
Drawing on a camera image
A leader line with length display on the image.
5. If necessary, drag the ends of the measurement tool so that it exactly represents
the known length.
6. Click the Measurement button again.
7. The Measurement button changes color, and the measurement toolbar appears.
8. In the measurement toolbar, click the Measurement button.
9. The buttons changes color.
10. Click the box at one end of the measurement arrow.
11. The Image Measurement Properties screen opens.
12. Click the Known length: box, type the known length in your desired units, and
click OK.
13. Optionally, click the Digits box and select the number of decimal places that will
be displayed.
14. Click the Units box, delete the existing units, type the name of the units, and click
OK.
15. Click OK to close the Image Measurement Properties screen.
All measurement tools on the image now use the new calibration. Any new measurement tool that you add will also use the new calibration.
Drawing on a camera image
You can draw and erase on image using one of the follow tools.
n
"Drawing": 66
n
"Erasing": 66
n
"Erasing all": 67
Document Number: 012-11074D 65
Page 78

SPARKvue
®
Drawing
1. Click the Image Tools button to open the tool palette.
2. In the tool palette, click the Draw button.
3. The button changes color and the drawing toolbar appears.
4. To change the pen color, click the color button.
6 Image capture
Drawing on a camera image
5. Click a point on the image and drag to draw lines.
6. Click the Draw button again in the tool palette to turn off the drawing pen and hide
the drawing toolbar.
Erasing
1. Click the Image Tools button to open the tool palette.
2. In the tool palette, click the Draw button.
3. The button changes color and the draw palette appears.
4. In the draw palette, click the Eraser button.
Document Number: 012-11074D 66
Page 79

6 Image capture
SPARKvue
The button changes color.
5. To erase parts of a drawing, click a point on the drawing and drag over it.
6. Click the Draw button in the tool palette to close the draw palette.
®
Annotating a camera image
Erasing all
1. Click the Image Tools button to open the tool palette.
2. In the tool palette, click the Draw button.
3. The button changes color and the draw palette appears.
4. In the draw palette, click the Eraser button.
The button changes color.
5. To erase parts of a drawing, click a point on the drawing and drag over it.
6. To erase all drawings from the image, click the Erase button again.
7. Click Yes.
8. Click the Draw button in the tool palette to close the draw palette.
Annotating a camera image
You can annotate an image using one of the follow tools.
"Adding an annotation": 68
Document Number: 012-11074D 67
Page 80

6 Image capture
SPARKvue
®
Annotating a camera image
"Moving an annotation": 69
"Editing an annotation": 69
"Deleting an annotation": 69
Adding an annotation
1. Optional: If there is more than one image, first select the image for the annotation:
a. Click the image legend.
The legend expands.
b. In the legend, click the image that you want to select.
The red outline moves to the selected image.
2. Click the Image Tools button to open the tool palette.
3. Click the Annotate button.
4. The Annotation button changes color, and the image annotation bar opens, showing the eraser and text color box.
5. Click the color box until you see the color you want to use.
6. Click the screen in the location to place the annotation.
Document Number: 012-11074D 68
Page 81

6 Image capture
SPARKvue
®
Annotating a camera image
7. Enter a note and click OK.
8. An annotation appears on the image and the image annotation bar closes.
9. Optional: Drag to move the annotation text box.
Moving an annotation
You can move the text and pointer arrow on an annotation:
l
To move annotation text on an image, click the text and drag it to a new location.
l
To move an annotation arrow on an image, click the point of the arrow and drag it to a
new location.
Editing an annotation
1. Click the Image Tools button to open the tool palette.
2. Click the Annotation button.
3. The Annotation button changes color and the image annotation toolbar displays.
4. Click the annotation you want to edit.
5. Edit the text and click OK.
Deleting an annotation
1. Click the Image Tools button to open the tool palette.
2. Click the Annotation button.
3. The Annotation button changes color and the image annotation toolbar displays.
4. Click the Eraser button on the image annotation bar.
Document Number: 012-11074D 69
Page 82

6 Image capture
SPARKvue
®
Naming an image
5. The Eraser button changes color.
6. Click the all annotations you want to delete.
7. When you finish deleting annotations, click the Eraser button to turn off the deletion tool.
8. Click the Annotation button to close the annotation toolbar.
Naming an image
1. Click the Experiment Tools button to open Experiment Tools screen.
2. Click Manage Data to open the Manage Data screen.
3. Click Manage Images to open the Manage Images screen.
4. Click Rename Image… to open the Rename Image… screen.
5. Click the image that you would like to rename and click OK.
6. Type the new name of the image and click OK.
7. Click OK to close the Manage Images screen and click OK again to close the Man-
age Data screen.
Deleting and Renaming an image
1. Click the Experiment Tools button to open the Experiment Tools screen.
2. Click Manage Data to open the Manage Data screen.
3. Click Manage Images to open the Manage Images screen.
4. Do one of the following:
l
To delete all images, click Delete All Images, and click OK.
l
To delete a single image, click Delete Image…, click the image to delete, and
click OK.
l
To rename an image, click Rename Image…, click the image to delete, and
click OK
Document Number: 012-11074D 70
Page 83

6 Image capture
SPARKvue
5. Click OK to close the Manage Images screen, click OK again to close the Manage Data screen.
®
Exporting an image
Exporting an image
1. Click the Sharing button to open the Sharing screen.
2. Click the Export Images tab.
3. After saving your images, click OK to return to your SPARKlab.
Document Number: 012-11074D 71
Page 84

7 Data analysis
SPARKvue
®
Analyzing data in a graph
7 Data analysis
In any display, you can view the statistics of data runs, including minimum value, maximum value, mean value, standard deviation, and count (or number of points). In a graph,
the area statistic is also available.
A graph also allows you to apply curve fits; draw predictions; and find coordinates, distances, and slopes on data plots.
n
"Analyzing data in a graph": 72
n
"Viewing statistics in a table": 83
n
"Viewing statistics in a digits display": 85
n
"Viewing statistics in a meter": 86
Analyzing data in a graph
n
"Viewing statistics in a line graph": 72
n
"Applying a curve fit": 74
n
"Removing a curve fit": 75
n
"Drawing a prediction": 75
n
"Finding the x- and y-values of a point": 75
n
"Finding the x- and y-difference between two points": 77
n
"Finding the slope at a point on a data plot": 78
n
"Finding the correlation coefficient (r)": 79
n
"Displaying the RMSE Root-Mean-Square Error": 81
n
"Analyzing data in a multiple-y axes graph": 82
n
"Viewing Statistics in a bar graph": 82
Viewing statistics in a line graph
To see the minimum, maximum, mean, standard deviation, count, and area-under-thecurve of a data run:
1. Optional: select a different data run.
In the display legend, a red outline surrounds the run that is selected for operation.
Complete these steps to change which run is selected:
Document Number: 012-11074D 72
Page 85

7 Data analysis
SPARKvue
®
Analyzing data in a graph
i. Click the legend.
The legend enlarges.
ii. In the legend, click the symbol (but not the check box) of the run that you
want to select.
The red outline moves to the selected run.
Sample Legend
Note: When you apply statistics, such as mean or standard deviation, they
are applied to the selected run.
2. Click the Graph Tools button to open the tool palette.
3. Click the Statistics button to open the Statistics screen.
4. Click one or more of the statistics.
Selected statistics are highlighted.
5. Click OK.
Statistics appear on the graph.
6. Optionally, click part of the data set for statistics to be applied to.
See "Selecting part of a data run for operation in a line graph": 28.
7. Click the Statistics button to remove the statistics.
Document Number: 012-11074D 73
Page 86

7 Data analysis
SPARKvue
®
Analyzing data in a graph
Applying a curve fit
Complete these steps to apply a linear, quadratic, power, inverse, inverse square, or
sine fit to a data run:
1. Optional: select a different data run.
In the display legend, a red outline surrounds the run that is selected for operation.
Complete these steps to change which run is selected:
i. Click the legend.
The legend enlarges.
ii. In the legend, click the symbol (but not the check box) of the run that you
want to select.
The red outline moves to the selected run.
Sample Legend
Note: When you apply statistics, such as mean or standard deviation, they
are applied to the selected run.
2. Click the Graph Tools button to open the tool palette.
3. Click the Curve Fit button to open the Curve Fit screen.
4. Click one curve fit to select it.
5. Click OK.
Document Number: 012-11074D 74
Page 87

SPARKvue
®
Analyzing data in a graph
The curve and parameters of the curve appear on the graph.
6. Optionally, select part of the data set for the curve fit to be applied to.
See "Selecting part of a data run for operation in a line graph": 28.
Removing a curve fit
1. Click the Graph Tools button to open the tool palette.
2. Click the Curve Fit button.
7 Data analysis
Drawing a prediction
Complete these steps to manually sketch on a graph:
1. Click the Graph Tools button to open the tool palette.
2. Click the Prediction button.
3. Do one of the following:
l
Trace a continuous curve on the graph.
l
Click several locations on the graph to draw a series of connected points.
4. To delete the prediction, click the Prediction button.
Finding the x- and y-values of a point
Complete these steps to select a point on a graph and display its coordinates:
Document Number: 012-11074D 75
Page 88

7 Data analysis
SPARKvue
®
Analyzing data in a graph
1. Optional: select a different data run.
In the display legend, a red outline surrounds the run that is selected for operation.
Complete these steps to change which run is selected:
i. Click the legend.
The legend enlarges.
ii. In the legend, click the symbol (but not the check box) of the run that you
want to select.
The red outline moves to the selected run.
Sample Legend
Note: When you apply statistics, such as mean or standard deviation, they
are applied to the selected run.
2. Click the Graph Tools button to open the tool palette.
3. Click the Select button.
The button changes color.
4. Click a point on the graph.
5. Click Done.
6. Click Graph coordinate information button.
Document Number: 012-11074D 76
Page 89

7 Data analysis
SPARKvue
®
Analyzing data in a graph
7. The x- and y-values of the selected point are displayed.
8. Click the Graph coordinate information button again to clear the selection.
Finding the x- and y-difference between two points
Complete these steps to select a range of points and display the change-in-x and
change-in-y between the first and last points in the selected range:
1. Optional: select a different data run.
In the display legend, a red outline surrounds the run that is selected for operation.
Complete these steps to change which run is selected:
i. Click the legend.
The legend enlarges.
ii. In the legend, click the symbol (but not the check box) of the run that you
want to select.
The red outline moves to the selected run.
Sample Legend
Note: When you apply statistics, such as mean or standard deviation, they
are applied to the selected run.
2. Click the Graph Tools button to open the tool palette.
3. Click the Select button.
Document Number: 012-11074D 77
Page 90

7 Data analysis
SPARKvue
®
Analyzing data in a graph
The button changes color.
4. Click and drag to select data points.
5. When the desired data points are highlighted, click done selecting.
6. Click the Select button.
7. Click the Coordinates button.
An annotation with the following information appears on the graph:
l
The x- and y-values of the first point in the selected range (x1 and y1),
l
The x- and y-values of the last point in the selected range (x2 and y2), and
l
The x- and y-differences between those two points (dx and dy).
8. To clear the annotation, click the Coordinates button again.
9. To clear the selection, click the Select button again.
Finding the slope at a point on a data plot
Complete these steps to display the slope at a selected point:
1. Optional: select a different data run.
In the display legend, a red outline surrounds the run that is selected for operation.
Complete these steps to change which run is selected:
i. Click the legend.
The legend enlarges.
ii. In the legend, click the symbol (but not the check box) of the run that you
want to select.
Document Number: 012-11074D 78
Page 91

SPARKvue
®
The red outline moves to the selected run.
Sample Legend
Note: When you apply statistics, such as mean or standard deviation, they
are applied to the selected run.
2. Click the Graph Tools button to open the tool palette.
3. Click the Slope Tool button.
7 Data analysis
Analyzing data in a graph
The Slope Tool appears on the graph displaying the slope at one point.
The Slope Tool appears in the middle of the data run or, if part of the data run has
been selected, in the middle of the selected part.
See "Selecting part of a data run for operation in a line graph": 28.
4. Click the arrows of the point selector to move the slope tool to nearby points.
5. To hide the Slope Tool, click the Slope Tool button again
Finding the correlation coefficient (r)
To find the correlation coefficient (r):
1. Optional: select a different data run.
In the display legend, a red outline surrounds the run that is selected for operation.
Complete these steps to change which run is selected:
i. Click the legend.
The legend enlarges.
Document Number: 012-11074D 79
Page 92

7 Data analysis
SPARKvue
®
Analyzing data in a graph
ii. In the legend, click the symbol (but not the check box) of the run that you
want to select.
The red outline moves to the selected run.
Sample Legend
Note: When you apply statistics, such as mean or standard deviation, they
are applied to the selected run.
2. In the legend, click the symbol of the measurement run to analyze.
A red outline appears around the selected run.
3. Click the Graph Tools button to open the tool palette.
The line graphs tools palette displays.
4. Click the Curve Fit button.
The Select Desired Curve Fit screen displays.
5. Click the Linear Fit button, and click OK.
The statistics appear on the line graph and the Curve Fit button changes color.
6. To move the statistics box, drag it.
7. To remove the statistics box, click the Curve Fit button.
Document Number: 012-11074D 80
Page 93

7 Data analysis
SPARKvue
®
Analyzing data in a graph
Displaying the RMSE Root-Mean-Square Error
To find the Root Mean Square Error (RMSE):
If more than one data measurement run is displayed, first select a measurement run:
1. Optional: select a different data run.
In the display legend, a red outline surrounds the run that is selected for operation.
Complete these steps to change which run is selected:
i. Click the legend.
The legend enlarges.
ii. In the legend, click the symbol (but not the check box) of the run that you
want to select.
The red outline moves to the selected run.
Sample Legend
Note: When you apply statistics, such as mean or standard deviation, they
are applied to the selected run.
2. In the legend, click the symbol of the measurement run to analyze.
A red outline appears around the selected run.
3. Click the Graph Tools button to open the tool palette.
The line graphs tools palette displays.
4. Click the Curve Fit button.
Document Number: 012-11074D 81
Page 94

SPARKvue
®
Viewing Statistics in a bar graph
The Select Desired Curve Fit screen displays.
5. Click a curve fit option, and click OK.
The statistics appear on the line graph and the Curve Fit button changes color.
6. To move the statistics box, drag it.
7. To remove the statistics box, click the orange Curve Fit button.
The statistics are removed from the line graph.
Analyzing data in a multiple-y axes graph
7 Data analysis
All of the actions performed on a single y-axis graph can be performed on multiple-y
axes graphs.
See "Creating a multiple y-axes line graph": 31.
You can perform the following:
n
"Viewing statistics in a line graph": 72
n
"Applying a curve fit": 74
n
"Removing a curve fit": 75
n
"Drawing a prediction": 75
n
"Finding the x- and y-values of a point": 75
n
"Finding the x- and y-difference between two points": 77
n
"Finding the slope at a point on a data plot": 78
Viewing Statistics in a bar graph
To see the minimum, maximum, mean bar values; or standard deviation of a data run:
1. Optional: select a different data run.
In the display legend, a red outline surrounds the run that is selected for operation.
Complete these steps to change which run is selected:
Document Number: 012-11074D 82
Page 95

7 Data analysis
SPARKvue
i. Click the legend.
The legend enlarges.
ii. In the legend, click the symbol (but not the check box) of the run that you
want to select.
The red outline moves to the selected run.
Sample Legend
®
Viewing statistics in a table
Note: When you apply statistics, such as mean or standard deviation, they
are applied to the selected run.
2. Click the Bar Graph Tools button to open the tool palette.
3. Click the Statistics button to open the Statistics screen.
4. Click one or more of the statistics options to select it.
5. Click OK.
Statistics are added to the chart.
6. Click the Statistics button to remove the statistics.
Viewing statistics in a table
To see the minimum, maximum, mean, standard deviation, and count of data runs:
Document Number: 012-11074D 83
Page 96

7 Data analysis
SPARKvue
®
Viewing statistics in a table
1. Optional: select a different data run.
In the display legend, a red outline surrounds the run that is selected for operation.
Complete these steps to change which run is selected:
i. Click the legend.
The legend enlarges.
ii. In the legend, click the symbol (but not the check box) of the run that you
want to select.
The red outline moves to the selected run.
Sample Legend
Note: When you apply statistics, such as mean or standard deviation, they
are applied to the selected run.
2. Click the Graph Tools button to open the tool palette.
3. Click the Statistics button to open the Statistics screen.
4. Click one or more of the statistics.
Selected statistics are highlighted.
5. Click OK.
Statistics at the bottom of each column.
6. Optionally, click a group of cells for statistics to be applied to.
See "Selecting cells for operation in a table": 49.
Document Number: 012-11074D 84
Page 97

7 Data analysis
SPARKvue
7. Click the Statistics button to remove the statistics.
®
Viewing statistics in a digits display
Viewing statistics in a digits display
To see the minimum, maximum, mean, standard deviation, or count of a data run:
1. Optional: select a different data run.
In the display legend, a red outline surrounds the run that is selected for operation.
Complete these steps to change which run is selected:
i. Click the legend.
The legend enlarges.
ii. In the legend, click the symbol (but not the check box) of the run that you
want to select.
The red outline moves to the selected run.
Sample Legend
Note: When you apply statistics, such as mean or standard deviation, they
are applied to the selected run.
2. Click the Digits Display Tools button to open the tool palette.
3. Click the Statistics button to open the Statistics screen.
Document Number: 012-11074D 85
Page 98

7 Data analysis
SPARKvue
4. Click one of the statistics to select it.
5. Click OK.
The selected statistic appears in the digits display (instead of the most recently collected value).
6. Click the Statistics button to return the digits display to most recent data.
®
Viewing statistics in a meter
Viewing statistics in a meter
To see the minimum, maximum, mean, standard deviation, or count of a data run:
1. Optional: select a different data run.
In the display legend, a red outline surrounds the run that is selected for operation.
Complete these steps to change which run is selected:
i. Click the legend.
The legend enlarges.
ii. In the legend, click the symbol (but not the check box) of the run that you
want to select.
The red outline moves to the selected run.
Sample Legend
Note: When you apply statistics, such as mean or standard deviation, they
are applied to the selected run.
2. Click the Digits Display Tools button to open the tool palette.
Document Number: 012-11074D 86
Page 99

7 Data analysis
SPARKvue
®
Viewing statistics in a meter
3. Click the Statistics button to open the Statistics screen.
4. Click one of the statistics to select it.
5. Click OK.
The selected statistic appears in the digits display (instead of the most recently collected value).
6. Click the Statistics button to return the digits display to most recent data.
Document Number: 012-11074D 87
Page 100

8 Calculations and manually entered data
SPARKvue
®
Working with calculations
8 Calculations and manually entered data
n
"Working with calculations": 88
n
"Entering data manually": 90
Working with calculations
1. "Opening the calculator screen": 88
2. "Creating a calculation": 88
3. "Displaying a calculation": 89
Opening the calculator screen
1. Click the Experiment Tools button.
The Experiment Tools screen opens.
2. Click Calculated Data.
The calculator screen opens.
Creating a calculation
Calculations may be a combination of measurement data, math functions, and text.
Tip: You can create User-entered data using a calculation in a table.
Complete one or more of the following steps in any order to build an expression in the
calculator screen:
To... Do this...
Edit an existing
expression
Start a new expression
Click the 123 or αβγ button.
Click Insert. You can change the name of the expression from the default.
Insert measurement
data
Click Measurements to insert a measurement data anywhere in the expression.
Document Number: 012-11074D 88
 Loading...