

Page 1

OMB-TempBook/66
Thermocouple & Voltage Measurement
Data Acquisition System
User’s Manual
p/n
GE285-0920,
Rev.
4.0
Page 2

OMEGAnetSM On-Line Service
http://www.omega.com
Servicing North America:
Internet e-mail
info@omega.com
USA:
Canada:
One Omega Drive, Box 4047
Stamford, CT 06907-0047
Tel: (203) 359-1660
e-mail: info@omega.com
976 Berger
Laval (Quebec) H7L 5A1
Tel: (514) 856-6928
e-mail: canada@omega.com
FAX: (203) 359-7700
FAX: (514) 856-6886
For immediate technical or appli cation assistance:
USA and Canada:
Mexico and
Latin America:
Sales Service: 1-800-826-6342 / 1-800-TC-OMEGA
Customer Service: 1-800-622-2378 / 1-800-622-BEST
Engineering Service: 1-800-872-9436 / 1-800-USA-WHEN
TELEX: 996404 EASYLINK: 62968934 CABLE: OMEGA
Tel: (95) 800-TC-OMEGA
En Espanol: (95) 203-359-7803
SM
FAX: (95) 203-359-7807
e-mail: espanol@omega.com
SM
SM
SM
Servicing Europe:
Benelux:
Czech Republic:
France:
Germany/Austria:
United Kingdom:
It is the policy of OMEGA to comply with all worldwide safety and EMC/EMI regulations that
apply. OMEGA is constantly pursuing certification of its products to the European New Approach
Directives. OMEGA will add the CE mark to every appropriate device upon certification.
The information contained i n t hi s document is believed t o be correct but OMEGA Engineering, Inc. accepts
no liability for any errors it contains, and reserves t he right to alter specifications without notic e.
WARNING: These products are not desi gned f or use in, and should not be used for, pat i ent-connected applications.
Postbus 8034, 1180 LA Amstelveen, The Netherlands
Tel: (31) 20 6418405
Toll Free in Benelux: 06 0993344
e-mail: nl@omega.com
ul. Rude armady 1868
733 01 Karvina-Hranice
Tel: 420 (69) 6311899
e-mail:czech@omega.com
9, rue Denis Papin, 78190 Trappes
Tel: (33) 130-621-400
Toll Free in France: 0800-4-06342
e-mail: france@omega.com
Daimlerstrasse 26, D-75392 Deckenpfronn, Germany
Tel: 49 (07056) 3017
Toll Free in Germany: 0130 11 21 66
e-mail: germany@omega.com
25 Swannington Road,
Broughton Astl ey, Leicestershire,
LE9 6TU, England
Tel: 44 (1455) 285520
FAX: 44 (1455) 283912
Toll Free in England: 0800-488-488
e-mail: uk@omega.com
FAX: (31) 20 6434643
FAX: 420 (69) 6311114
FAX: (33) 130-699-120
FAX: 49 (07056) 8540
P.O. Box 7, Omega Drive,
Irlam, Manchester,
M44 5EX, England
Tel: 44 (161) 777-6611
FAX: 44 (161) 777-6622
Page 3

About This Manual
This manual explains the setup and operation of the TempBook data acquisition system. This manual
consists of chapters and document modules. The later are like chapters, but as they are shared by other
manuals and are sometimes used as “stand-alone” documents. For these reasons the document modules
do not contain chapter headings, nor do they contain footers that associate them with a specific manual.
Chapter 1 - Introduction and Quick Start includes an overview, specifications, and a Quick Start that
explains how to hook up a simple system.
Chapter 2 - Installation, Configuration, and Calibration discusses switches, indicators, connectors,
hardware hookups, software installation, configuration, and calibration.
Document Module
– DaqView [32-Bit Support]. DaqView is out-of-the-box data acquisition software
that is installed during 32-Bit Product Support Installation. Pull-down menus, toolbars, charts,
and parameter fields are discussed. The program does not apply to 16-Bit TempBook Support.
Document Module
- DaqViewXL [32-Bit Support]. DaqViewXL is an optional out-of-the-box
Microsoft-based add-on for data-acquisition and spreadsheet display. The program does not
apply to 16-Bit TempBook Support.
Document Module
– PostView [16-Bit and 32-Bit Support]. PostView is a post-data acquisition
viewing program that allows you to view waveforms that were previously acquired by
TempView.
Document Module
- TempView [16-Bit Support]. This document module explains the use and features
of the out-of-the-box data acquisition software that is installed during the 16-Bit Product Support
Installation. Pull-down menus, charts, and parameter fields are discussed. Note that this
document module does not apply to 32-Bit TempBook Support.
Chapter’s 3 and 4 – These two chapter’s have been replaced with document modules. Your user’s
manual continues at this point with chapter 5.
Chapter 5 - Programmer’s Guide explains how to custom-program for your application. Various
concerns are discussed; e.g., a comparison of standard and enhanced APIs and language support.
Chapter 6 – 16-Bit API Programming of the TempBook With C describes several example programs
using the standard API with the C language.
Chapter 7 - Software Calibration and Zero Compensation describes the commands and parameters
related to calibration and zero compensation. This chapter organizes and supplements related
sections of the tbkCommand Reference chapter.
Chapter 8 - Thermocouple Measurement describes the commands and parameters related to
thermocouple measurement. This chapter organizes and supplements related sections of the
tbkCommand Reference chapter.
Chapter 9 - tbkCommand Reference (16-Bit API) describes the commands and parameters of the
16-Bit API including useful reference tables.
Chapter 10 - Programming Models for 32-Bit API describes the fundamental building blocks for
TempBook data acquisition software. These programming blocks can then be arranged and
filled with your parameters to make your system do as you please. Program excerpts illustrate
the basic concepts and can often (with modifications) be used in your code.
Chapter 11 - daqCommand Reference (32-Bit API) describes the commands and parameters of the
32-Bit API including useful reference tables.
Using this equipment in ways other than described in this manual can cause
personal injury or equipment damage. Before setting up and using your
equipment, you should read all documentation that covers your system. Pay
special attention to cautions and warnings formatted like this one.
TempBook User’s Manual
04-26-01
CAUTION
CAUTION
CAUTIONCAUTION
i
Page 4

Software Reference Note for Users of 16-Bit TempBook Support:
16-bit PC users can use TempView out-of-the-box software (see the TempView
document module), or may choose to program their own application.
Programmers using 16-bit API should refer to chapters 5 through 9. Chapters 6, 7, and 8
provide examples and explain how to perform common tasks with the 16-bit API
detailed in chapter 9.
Software Reference Note for Users of 32-Bit TempBook Support:
32-bit PC users can use the DaqView and DaqViewXL out-of-the-box software
programs (refer to the related document modules); or program their own application.
Programmers using 32-bit API should refer to chapters 5, 10, and 11. Chapter 10
explains programming models for the enhanced API, detailed in chapter 11.
Note: 16-Bit and 32-bit refer to software support, not to A/D resolution.
ii
04-26-01
TempBook User’s Manual
Page 5

Table of Contents
1 Introduction and Quick Start
Overview …… 1-1
Description …… 1-1
Available Accessories ……1-2
Specifications …… 1-2
Quick Start …… 1-4
Signal Connection ……1-4
PC Connection …… 1-4
Power Connection ……1-5
Software Installation ……1-5
Parallel Port Capabilities …… 1-6
TempBook Configuration Under Windows 95/98/ME/NT and 2000 …… 1-6
2 Installation, Configuration, and Calibration
Inspection …… 2-1
Panel Connectors and Indicators …… 2-1
Termination Card and I/O Connectors …… 2-2
Internal Configuration …… 2-3
Watchdog Timer Enable/Disable (JP8)….. 2-4
Time Base Selection (JP9)……2-4
Hardware Installation …… 2-4
Rechargeable Battery Module (DBK30A)…… 2-4
Charging the Battery Modules …… 2-5
Battery Module Connection ……2-5
Connection Troubleshooting …… 2-6
Calibration of TempBook …… 2-7
Calibration Constants File Installation …… 2-7
Hardware Calibration …… 2-7
Differential Measurement Configurations …… 2-8
Floating Differential …… 2-8
Referenced Differential …… 2-8
Document Module
[32-Bit Support]
Overview……
Starting DaqView……
A Tour of DaqView……
Acquisition Setup ……
Data Destination ……
Pull-Down Menus ……
Toolbar Items ……
Document Module
[32-Bit Support]
Overview……
Program Requirements……
Installation of DaqViewXL Software……
Basic Function of DaqViewXL ……
Hints and Tips for using DaqViewXL ……
– DaqView
DaqView_pv, pg.
DaqView_pv, pg.
– DaqViewXL
DaqViewXL, pg.
2
DaqView_pv, pg.
DaqView_pv, pg.
DaqView_pv, pg.
DaqView_pv, pg.
DaqView_pv, pg.
19
1
DaqViewXL, pg.
2
2
13
15
16
DaqViewXL, pg.
1
DaqViewXL, pg.
DaqViewXL, pg.
2
2
4
TempBook User’s Manual
04-26-01
iii
Page 6

Document Module
– PostView
[16-Bit and 32-Bit Support]
Introduction ……
Starting PostView ……
Toolbar ……
Channel Information Region ……
Menu Items ……
Understanding Groups, Charts, and Channels ……
Chart Setup Wizard ……
Display Configuration ……
PostView Timebase ……
PostView, pg.
PostView, pg.
PostView, pg.
PostView, pg.
4
6
PostView, pg.
PostView, pg.
2
PostView, pg.
3
PostView, pg.
7
9
15
5
PostView, pg.
7
Document Module
- TempView
[16-Bit Support]
Application Startup……
TempView, pg.
TempView Components……
1
TempView, pg.
2
Charts and the Spreadsheet's "Reading" Column……
TempView Menu Items ……
Chapters 3 and 4 have been replaced by the preceding Document Modules.
3 – 4
TempView, pg.
8
5 Programmer’s Guide
A Programmer’s View of TempBook Operations ……5-1
Driver Options …… 5-3
16-Bit API (tbk…) …… 5-3
32-Bit API (daq…) ……5-3
Language Support …… 5-3
6 16-Bit API Programming of the TempBook With C
Accessing TempBook from a Windows Program …… 6-1
Accessing TempBook from a C-for-Windows Program …… 6-1
High-Level Analog Input …… 6-1
Low-Level Analog Input …… 6-2
Analog Input in the Background …… 6-2
General Purpose Digital I/O Functions ……6-4
High-Speed Digital Input …… 6-4
Counter/Timer Functions …… 6-5
High-Level Thermocouple Data Acquisition …… 6-6
Thermocouple Linearization …… 6-7
Sample Programs …… 6-8
High-Level Analog Input …… 6-8
Low-Level Analog Input …… 6-9
Analog Input in the Background …… 6-10
General Purpose Digital I/O …… 6-11
High-Speed Digital Input …… 6-12
Counter Timer Functions ……6-13
High-Level Thermocouple Measurement …… 6-14
Low-Level Thermocouple Linearization …… 6-15
16-Bit API Command Summary, for C Language …… 6-17
TempView, pg.
7
iv
04-26-01
TempBook User’s Manual
Page 7

7 Software Calibration and Zero Compensation
Software Calibration …… 7-1
Initializing the Calibration Constants ……7-1
Calibration Setup and Conversion …… 7-2
Calibration Example ……7-2
Zero Compensation ……7-3
Zero Compensation Example ……7-4
Automatic Zero Compensation …… 7-5
8 Thermocouple Measurement
Low-Level Thermocouple Data Conversion Functions …… 8-1
High-Level Thermocouple Measurement Functions …… 8-3
Single-Channel Measurement (tbkRdTemp) …… 8-3
Multiple Measurements from a Single Channel (tbkRdTempN) …… 8-4
Multiple Channel Measurement (tbkRdTempScan) …… 8-4
Multiple Measurements from Multiple Channels (tbkRdTempScanN) …… 8-4
9 tbkCommand Reference (16-Bit API)
Overview…… 9-1
Commands in Alphabetical Order …… 9-2
API Reference Tables …… 9-32
A/D Channel Descriptions ……9-32
A/D Gain Definitions ……9-32
A/D Trigger Source Definitions …… 9-32
Pretrigger Functions Trigger Source Definitions …… 9-33
Thermocouple Types …… 9-33
API Error Codes - C Languages …… 9-33
API Error Codes – QuickBASIC …… 9-34
API Error Codes - Turbo Pascal …… 9-35
API Error Codes - Visual Basic …… 9-36
10 32-Bit API Programming Models for TempBook
Overview …… 10-1
Data Acquisition Environment …… 10-1
Application Programming Interface (API) …… 10-1
32-Bit vs 16-Bit API ……10-1
Hardware Capabilities and Constraints ……10-1
Signal Environment ……10-2
Basic Models …… 10-2
Initialization and Error Handling ……10-3
Foreground Acquisition with One-Step Commands ……10-4
Temperature Acquisition Using One-Step Commands ……10-6
Counted Acquisition Using Linear Buffers ……10-8
Indefinite Acquisition, Direct-To-Disk Using Circular Buffers ……10-10
Multiple Hardware Scans, Software Triggering ……10-13
Background Acquisition……10-15
Temperature Acquisition Using TC Conversion Functions……10-17
Double Buffering……10-20
Direct-To-Disk Transfers……10-22
Transfers With Driver-Allocated Buffers……10-25
Summary Guide of Selected 32-Bit API Functions……10-27
TempBook User’s Manual
04-26-01
v
Page 8

11 daqCommand Reference, 32-Bit
Overview……11-1
Commands in Alphabetical Order……11-2
API Reference Tables……11-35
Daq Device Property Definitions……11-36
Event-Handling Definitions……11-36
Hardware Information Definitions……11-36
ADC Trigger Source Definitions……11-37
ADC Miscellaneous Definitions……11-37
TempBook Definitions……11-38
General I/O Definitions……11-38
DaqTest Command Definitions……11-38
Calibration Input Signal Sources……11-38
API Error Codes……11-39
vi
04-26-01
TempBook User’s Manual
Page 9
Introduction and Quick Start
Overview
This chapter describes the TempBook in general terms including specifications. A Quick Start is included
in the chapter to help you get a simple system up and running in a short amount of time. Chapter 2 has
more detailed instructions.
Description
1
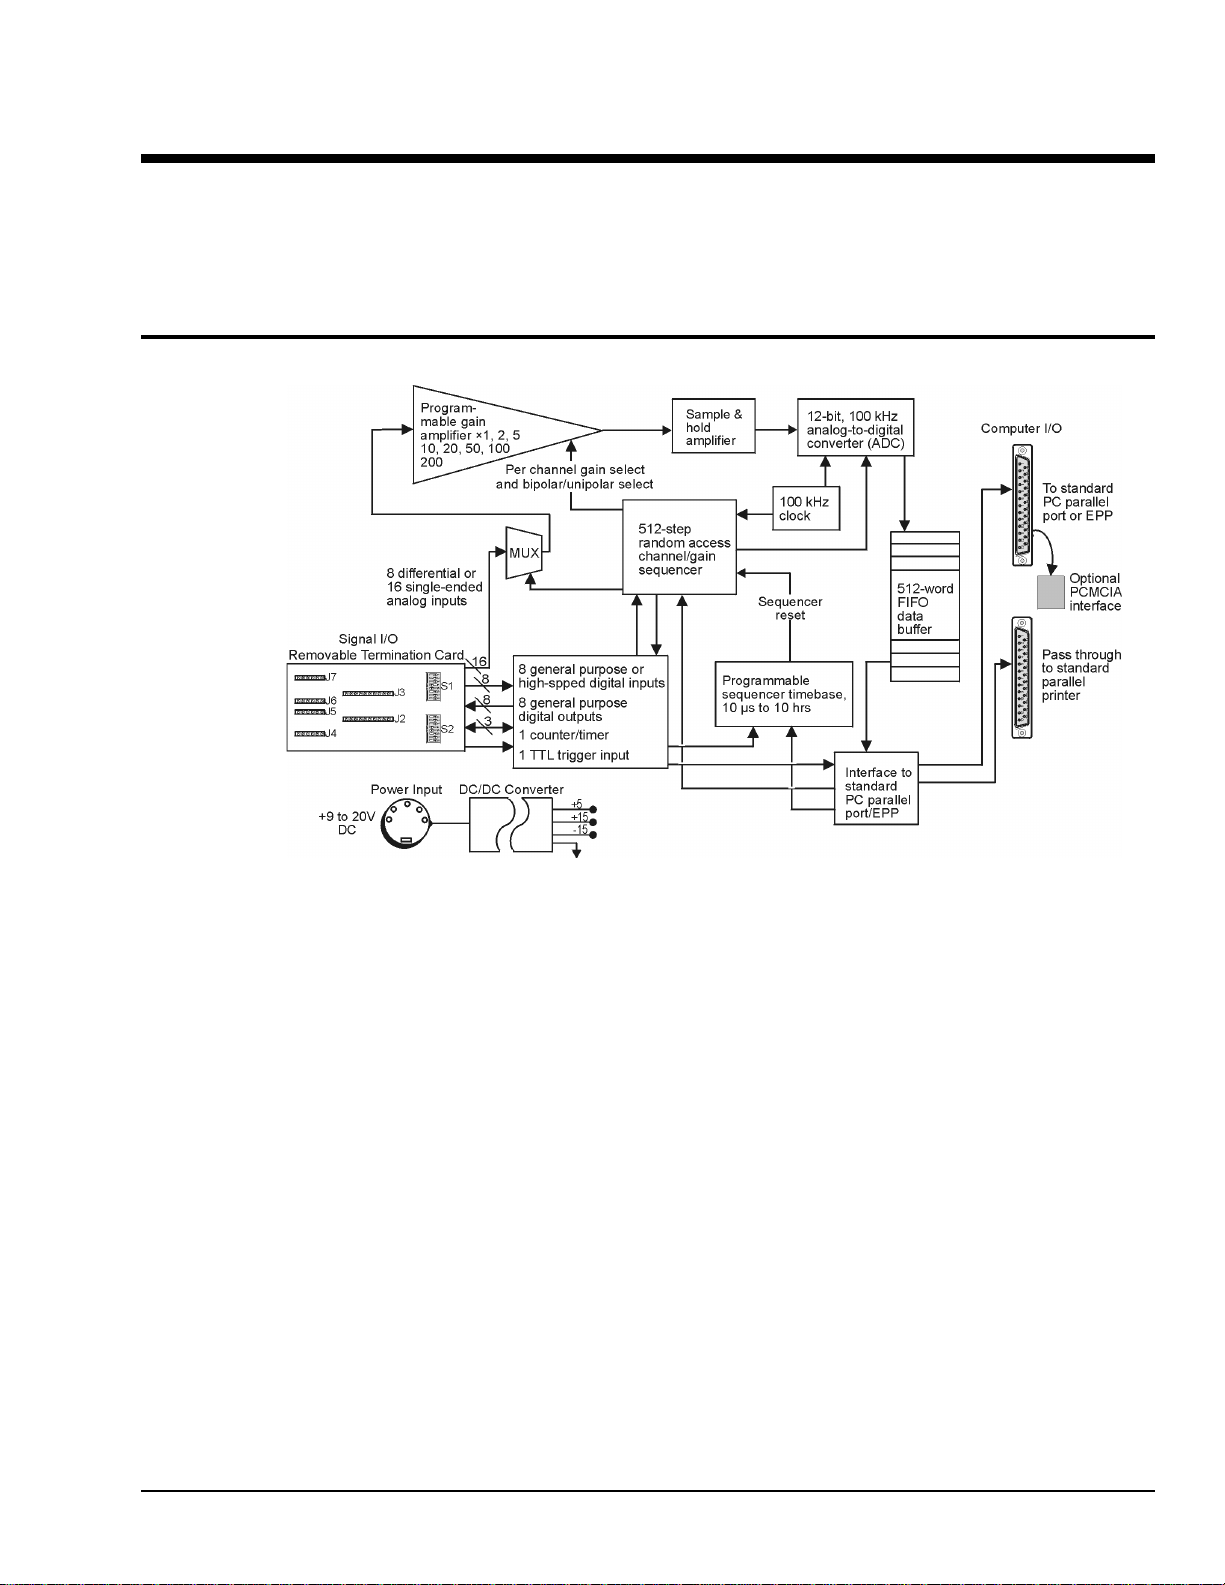
TempBook/66 Block Diagram
The TempBook/66 adds voltage and thermocouple measurement capability to notebook PCs for portable
test applications. The TempBook also provides an effective alternative to plug-in boards for desktop PCs.
The TempBook provides 12-bit, 100 kHz data acquisition and can support up to 800 Kbyte/s data transfer
to a PC via an enhanced parallel port interface or PCMCIA link. The unit can also connect to a standard
parallel port and transfer readings [directly to disk] at up to 100K readings/s. As an external module with
the same footprint as a typical notebook PC, the TempBook can be attached directly under a notebook PC
for portability.
The TempBook has a built-in analog capability that permits it to measure 8 channels in a differential mode
or 16 channels in single-ended mode. Its on-board programmable-gain instrumentation amplifier can be set
to gains of ×1, 2, 5, 10, 20, 50, 100 or 200 on a per channel basis. Its A/D converter scans selected
channels at a constant 10 us/channel rate, minimizing the time skew between consecutive channels. The
time between the start of each scan sequence can be programmed to start immediately or at intervals of up
to 10 hours. The TempBook features a hardware-based digital/TTL trigger that minimizes trigger latency to
less than 10 us. The TempBook can also be triggered from a command from the PC.
The TempBook/66 can be powered by an included AC adapter, a standard 12V car battery, any
+9 to 20 VDC source, or an optional rechargeable nickel-cadmium battery module (DBK30A). This makes
it ideal for field and remote data acquisition applications.
TempBook User’s Manual
04-20-01_o
Introduction and Quick Start 1-1
Page 10

TempBook related Software – What you should install from the Data Acquisition CD
For 32-Bit Support* For 16-Bit Support*
32-bit TempBook Support
•
is used with Windows 9x, ME, NT, and
Windows 2000 Operating Systems and
installs the following:
DaqView (32-bit)
DaqViewXL (32-bit)
File Converter (32-bit)
DaqCal (32-bit)
32-bit drivers for VB, C, and Delphi
PDF version of Programmer’s Manual
PostView, Post-data viewing program
•
Acrobat Reader
•
*32-bit refers to support, not to A/D resolution. *16-bit refers to support, not to A/D resolution.
Available Accessories
Additional accessories that can be ordered for the TempBook/66 include:
• WBK20A PCMCIA interface card and cable
• DBK30A Rechargeable battery module
• WBK21 ISA Interface Card
16-bit TempBook Support
•
is used with Windows 3.x Operating
Systems and installs:
TempView (16-bit)
TempCal (16-bit)
16-bit drivers for VB, C, PASCAL, and
DOS
PostView, Post-data viewing program
•
Acrobat Reader
•
Specifications
General
Connector
removable screw-terminal card.
Thermocouple Types
Input Ranges
Unipolar
Bipolar
Analog Inputs
Analog-to-Digital Converter
Cold Junction Sensor Output
Input Impedance
Input RC Filter -3dB Frequency
Gain Accuracy
Maximum Input Voltage
CMRR (Input Stage)
Offset
Offset Drift
Channel Sequencer
Depth
Speed
Interval Between Scans
Gains
Unipolar/Bipolar
Single-Ended/Differential: Software programmable for all channels
: Connects to a PC via an included parallel port cable; user signals are connected via screw terminals on a
: J, K, S, T, E, B, R & N
:
: .05, 0.1, 0.2, 0.5, 1, 2, 5, 10V
: ±0.025, .05, 0.1, 0.25, 0.5, 1, 2.5, 5 V
: 8 differential or 16 single-ended voltage or 8 differential thermocouple inputs
: 12-bit with no missing codes, unsigned binary output format.
: 100 mV/°C
: 100K/100M Ohm, Switch-selectable on a per-channel basis in parallel with switched 100 pF
: 15.9 kHz switch-selectable on a per channel basis
: 0.1%
: ±15 V
: 90 dB typ, DC to 60 Hz
: Software-compensated
: Software-compensated
: 512 locations
: 10 µs per channel, fixed
: 10 µs to 10 hours, software-programmable
: Sequencer programmable on a per-channel basis.
: Sequencer programmable on a per channel basis.
1-2 Introduction and Quick Start
04-26-01_o
TempBook User’s Manual
Page 11

Digital I/O
Inputs
Number
Usage
Outputs
Trigger Input
: 8 fixed as inputs
: General-purpose register addressable or high-speed scanned via channel sequencer
Type
: TTL-compatible
High Voltage
Low Voltage
Number
Usage
Type
: TTL-compatible
High Voltage
Low
Voltage: 0.4V @ 2.5 mA sink
Type
: TTL-compatible
High Voltage
Low Voltage
: 2.0 V min
: 0.8 V max
: 8 fixed as outputs
: General-purpose register addressable
: 3.0 V @ 2.5 mA source
: 2.0 V min
: 0.8 V max
Counter/Timer Port
Device
: 8254 (P0 only)
Number
Clock
Usage
Type
Input High Voltage
Input Low Voltage
Output High Voltage
Output Low Voltage
Temperature Specifications
: 1 gate input, 1 clock input & 1 output
: Internal 100 kHz or external up to 10 MHz
: Register addressable
: TTL compatible
: 2.0 V min
: 0.8 V max
: 3.0 V @ 2.5 mA source
: 0.4 V @ 2.5 mA sink
Thermocouple Accuracy
(TempBook/66 @ 0 to 50°C)
Type Min Max Accuracy
(°C ) (°C ) (<°C ) (>°C ) Type <0°C >0°C
J -200 760 ±0.9 ±0.9 J 1.2 0.5
K -200 1260 ±2.4 ±1.5 K 1.1 0.8
T -200 400 ±2.1 ±1.2 T 0.8 0.3
E -270 1000 ±2.1 ±1.3 E 1.9 0.9
N28 -270 400 ±1.2 ±1.2 N28 0.9 0.9
N14 - 1300 - ±1.5 N14 - 5.0
S - 1780 - ±2.4 S - 1.6
R - 1780 - ±2.4 R - 1.5
B +900 1820 - ±2.7 B - 1.8
Thermocouple Resolution (°C)
TempBook User’s Manual
04-26-01_o
Introduction and Quick Start 1-3
Page 12
Quick Start
For those users who wish to get their TempBook up and running as quickly as possible, this section
provides a brief explanation of the steps required.
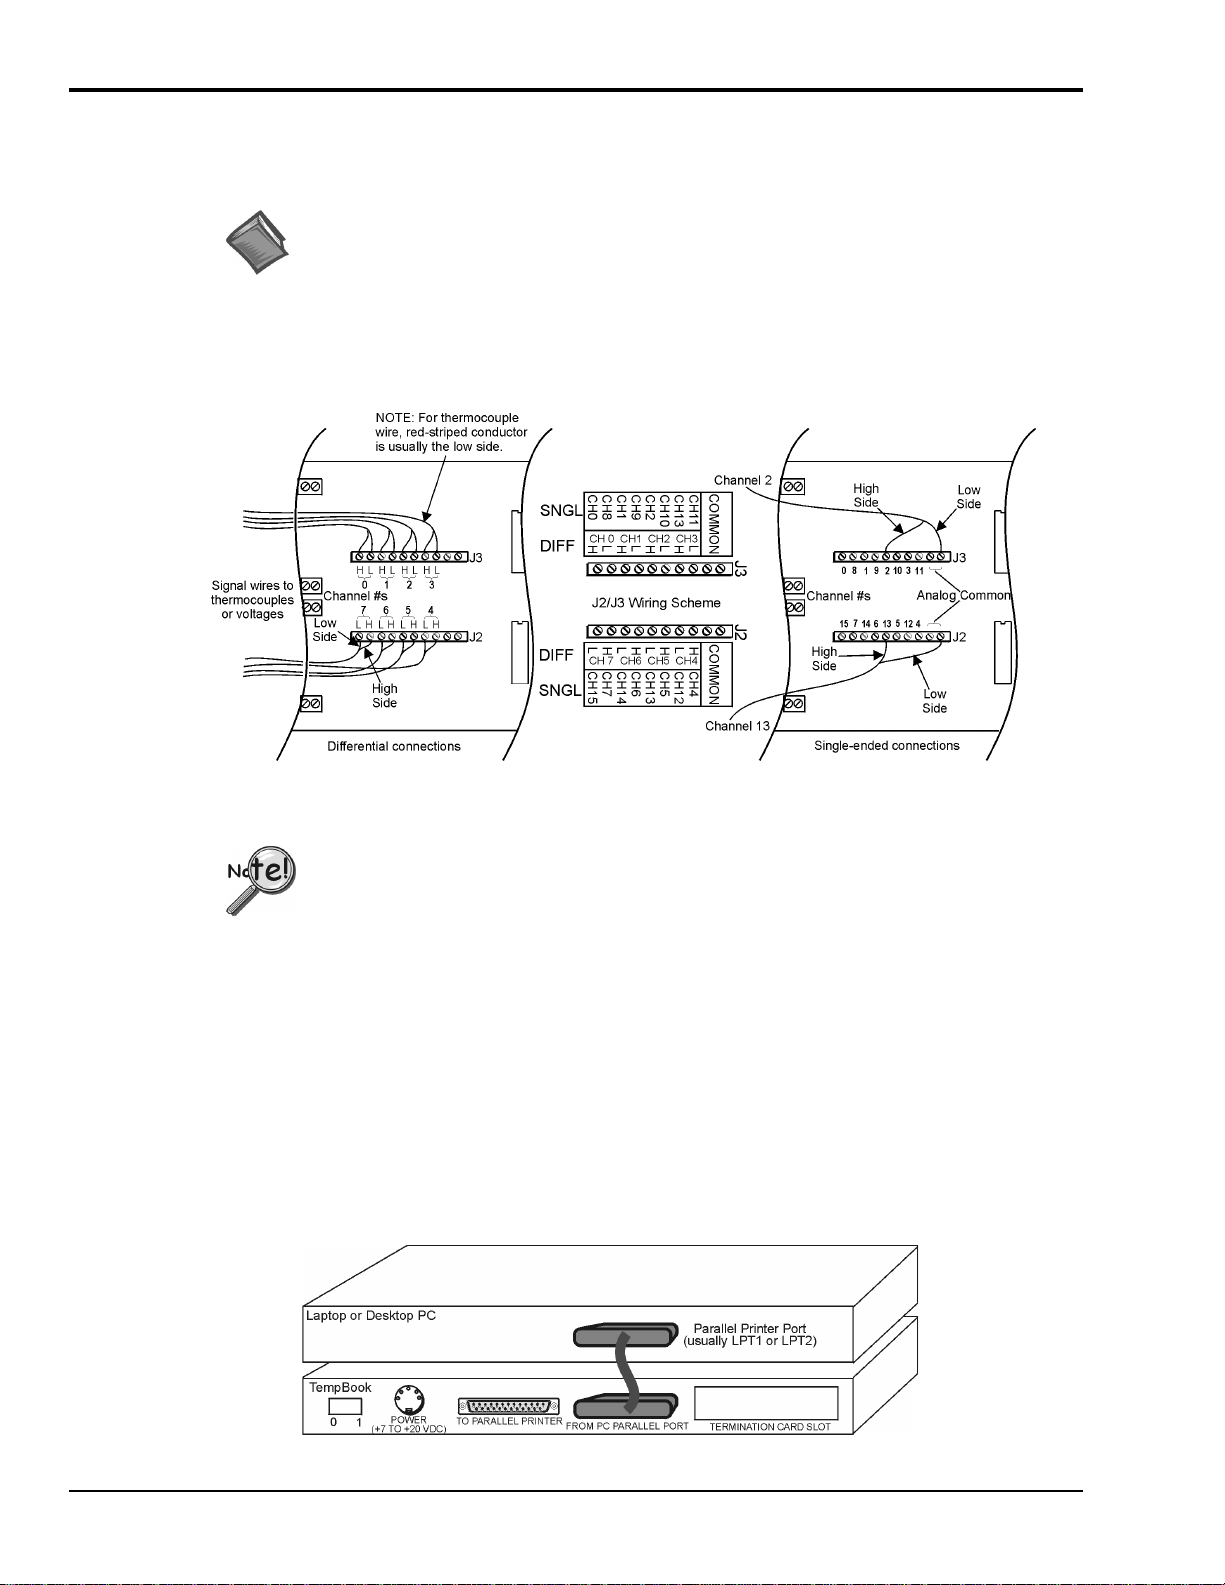
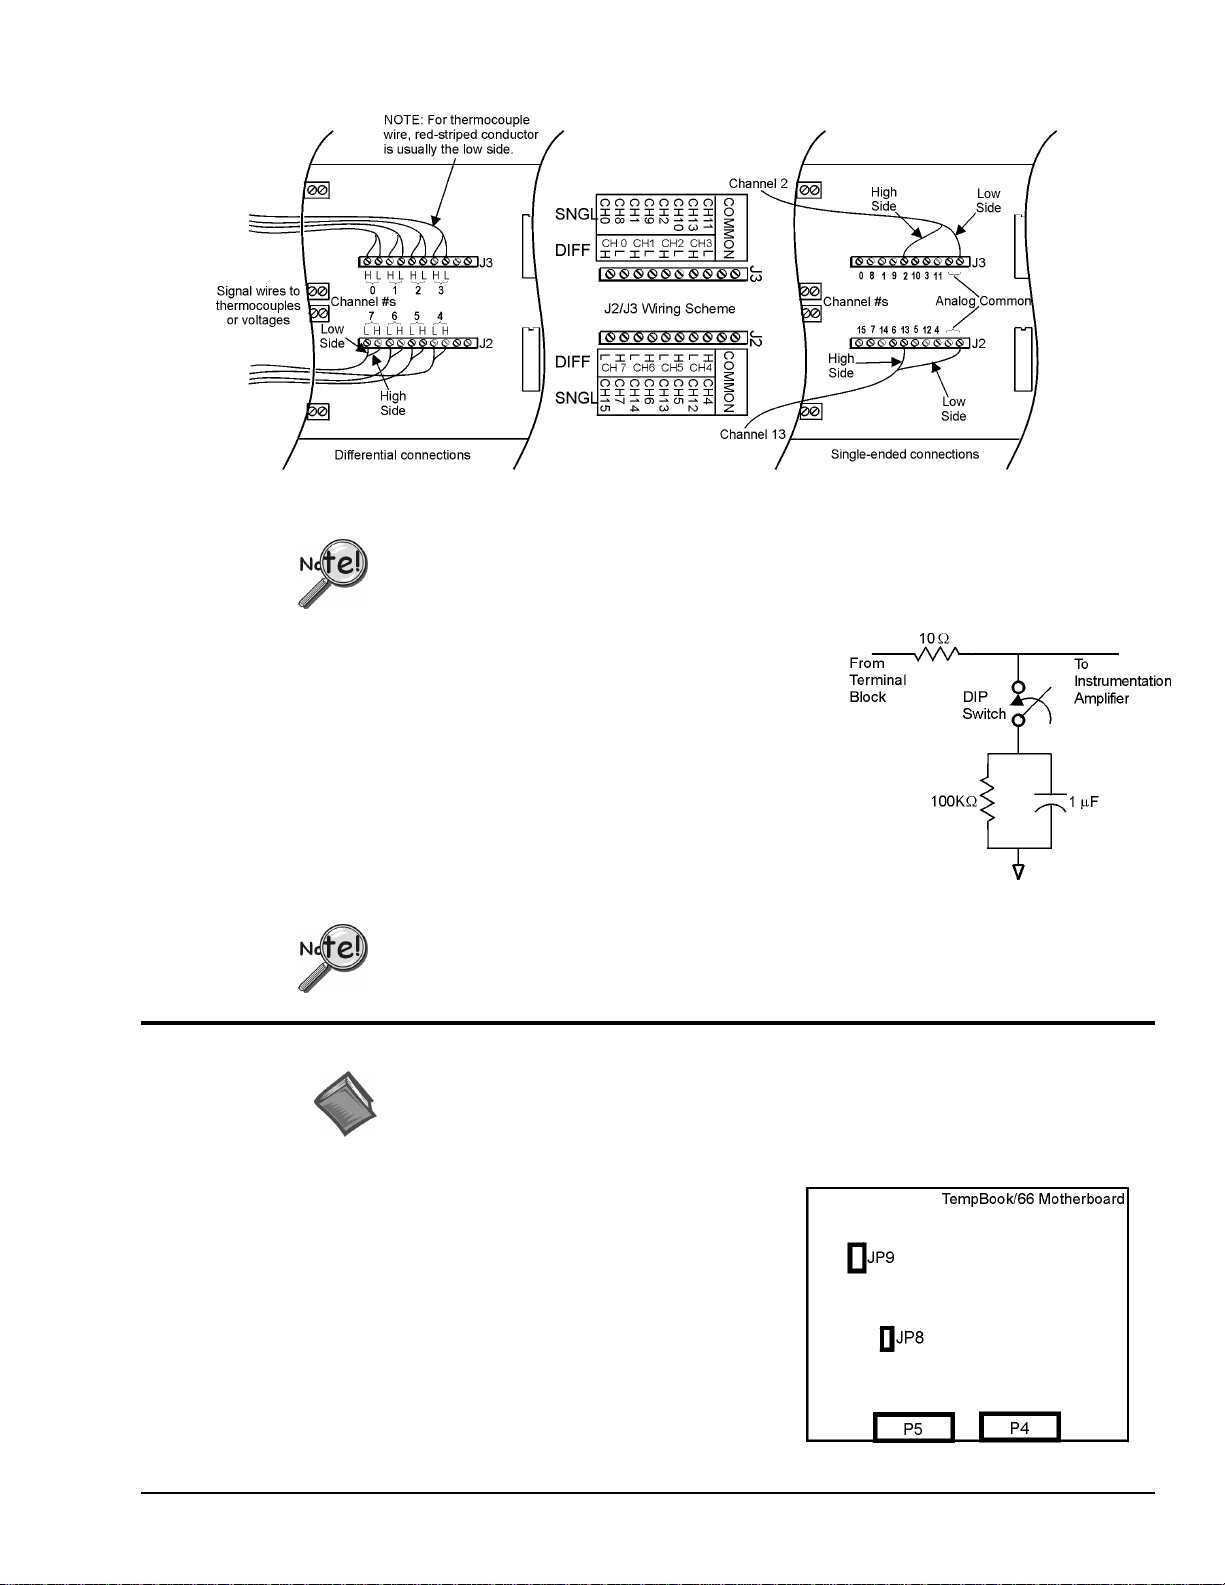
Signal Connection
The thermocouple and voltage input signals are fed to the TempBook through a removable termination
card. To remove this card, rotate the ejector handle with your thumb or finger. Once removed, the
thermocouple or voltage connections should be made as shown in the figure.
Reference Note: Refer to chapter 2, Installation and Configuration, if you are not
already familiar with TempBook systems, or if you need information that goes beyond
the scope of this Quick Start.
The DIP switches located on the termination card connect optional biasing resistors as well as input filters.
For further details, refer to section Termination Card and I/O Connectors in chapter 2.
PC Connection
The TempBook communicates with a laptop or desktop computer through the parallel printer port. Connect
the supplied cable to the computer’s parallel port and the TempBook's parallel port.
Signal Connections, Differential and Single-Ended
When connecting both low and high level signals, the low-level signals should be
connected to the lowest numbered channels with connections following in ascending
order of signal magnitude.
•
For thermocouple or other differential inputs, these switches should be closed to provide the required
bias current path.
•
For single-ended inputs these switches can be optionally opened or closed.
1-4 Introduction and Quick Start
PC-to-TempBook Connection
04-26-01_o
TempBook User’s Manual
Page 13
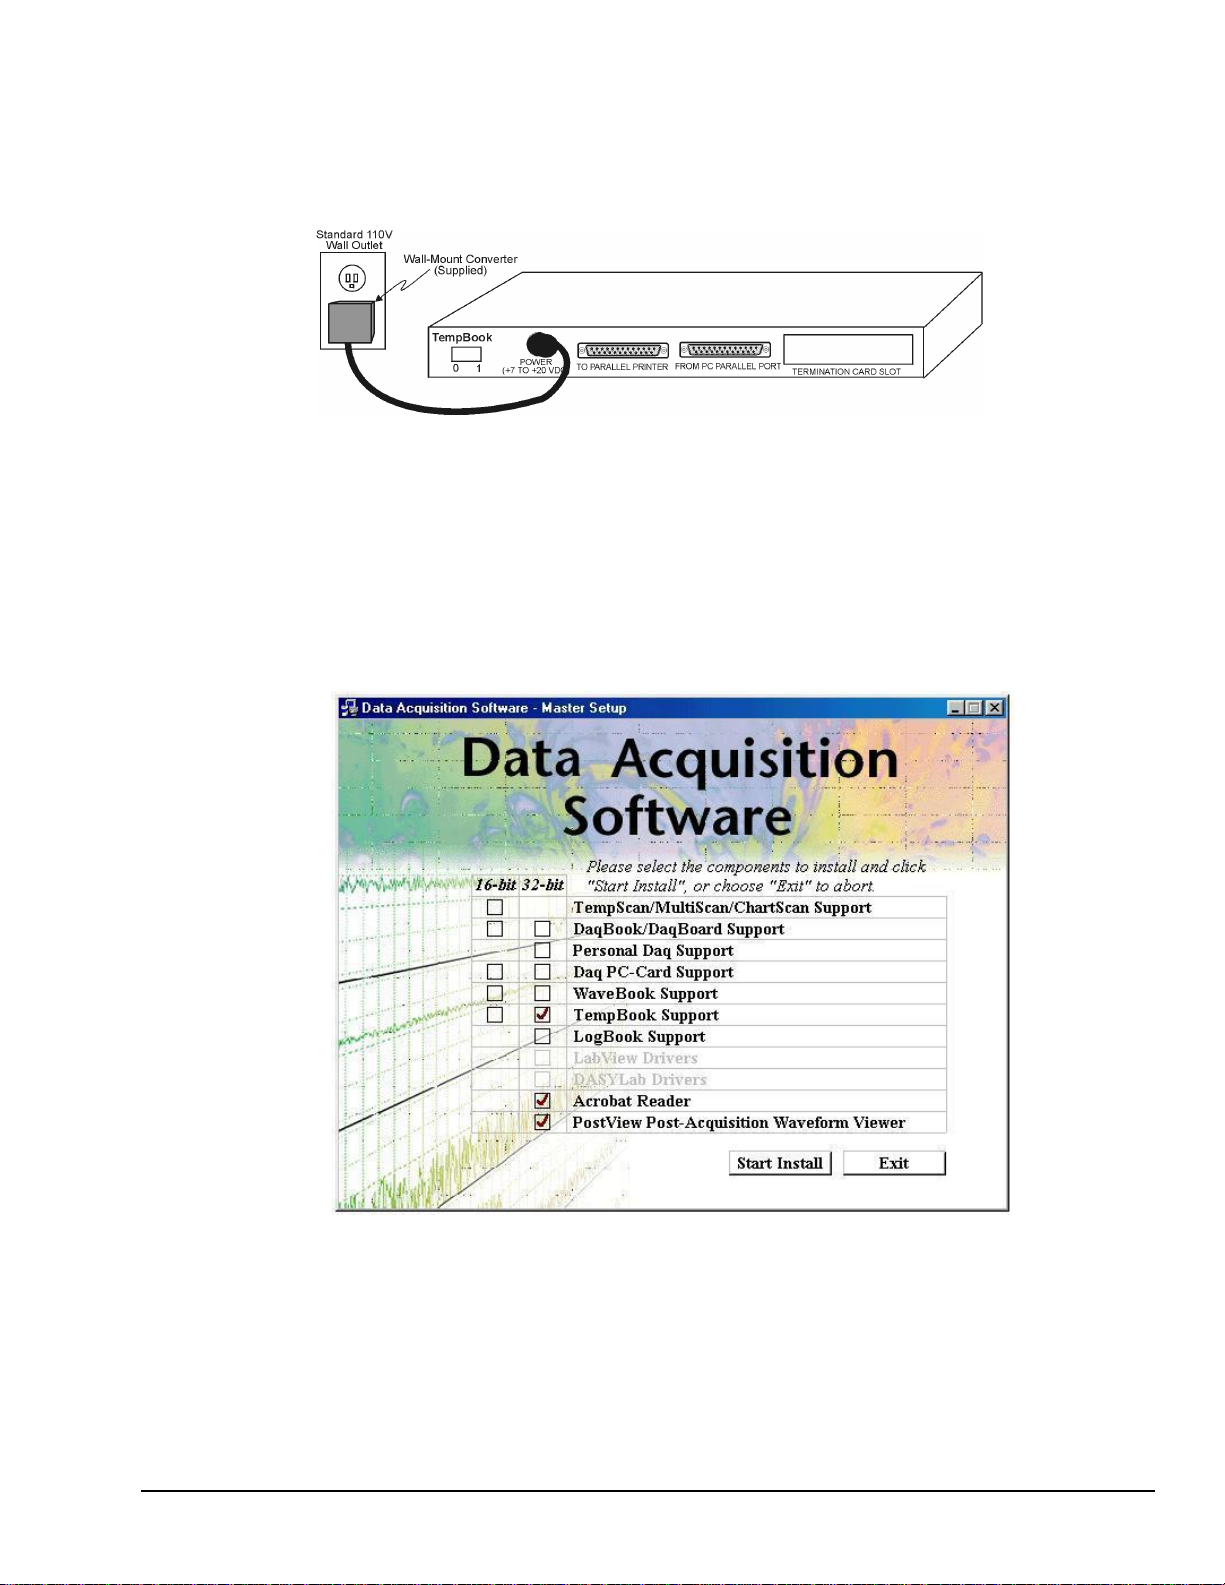
Power Connection
The TempBook is typically powered from the supplied wall-mount converter or from an optional DBK30A
battery module. The wall-mount converter plugs into any standard 110 VAC wall outlet and its other end
plugs into the circular DIN5 receptacle on the TempBook's rear panel. If using the battery module, please
refer to the section Rechargeable Battery Module in chapter 2.
Software Installation
The TempBook/66 comes with a Microsoft Windows-based application (32-bit DaqView) that provides the
easiest means to collect data from the TempBook. To install the software insert the installation CD into
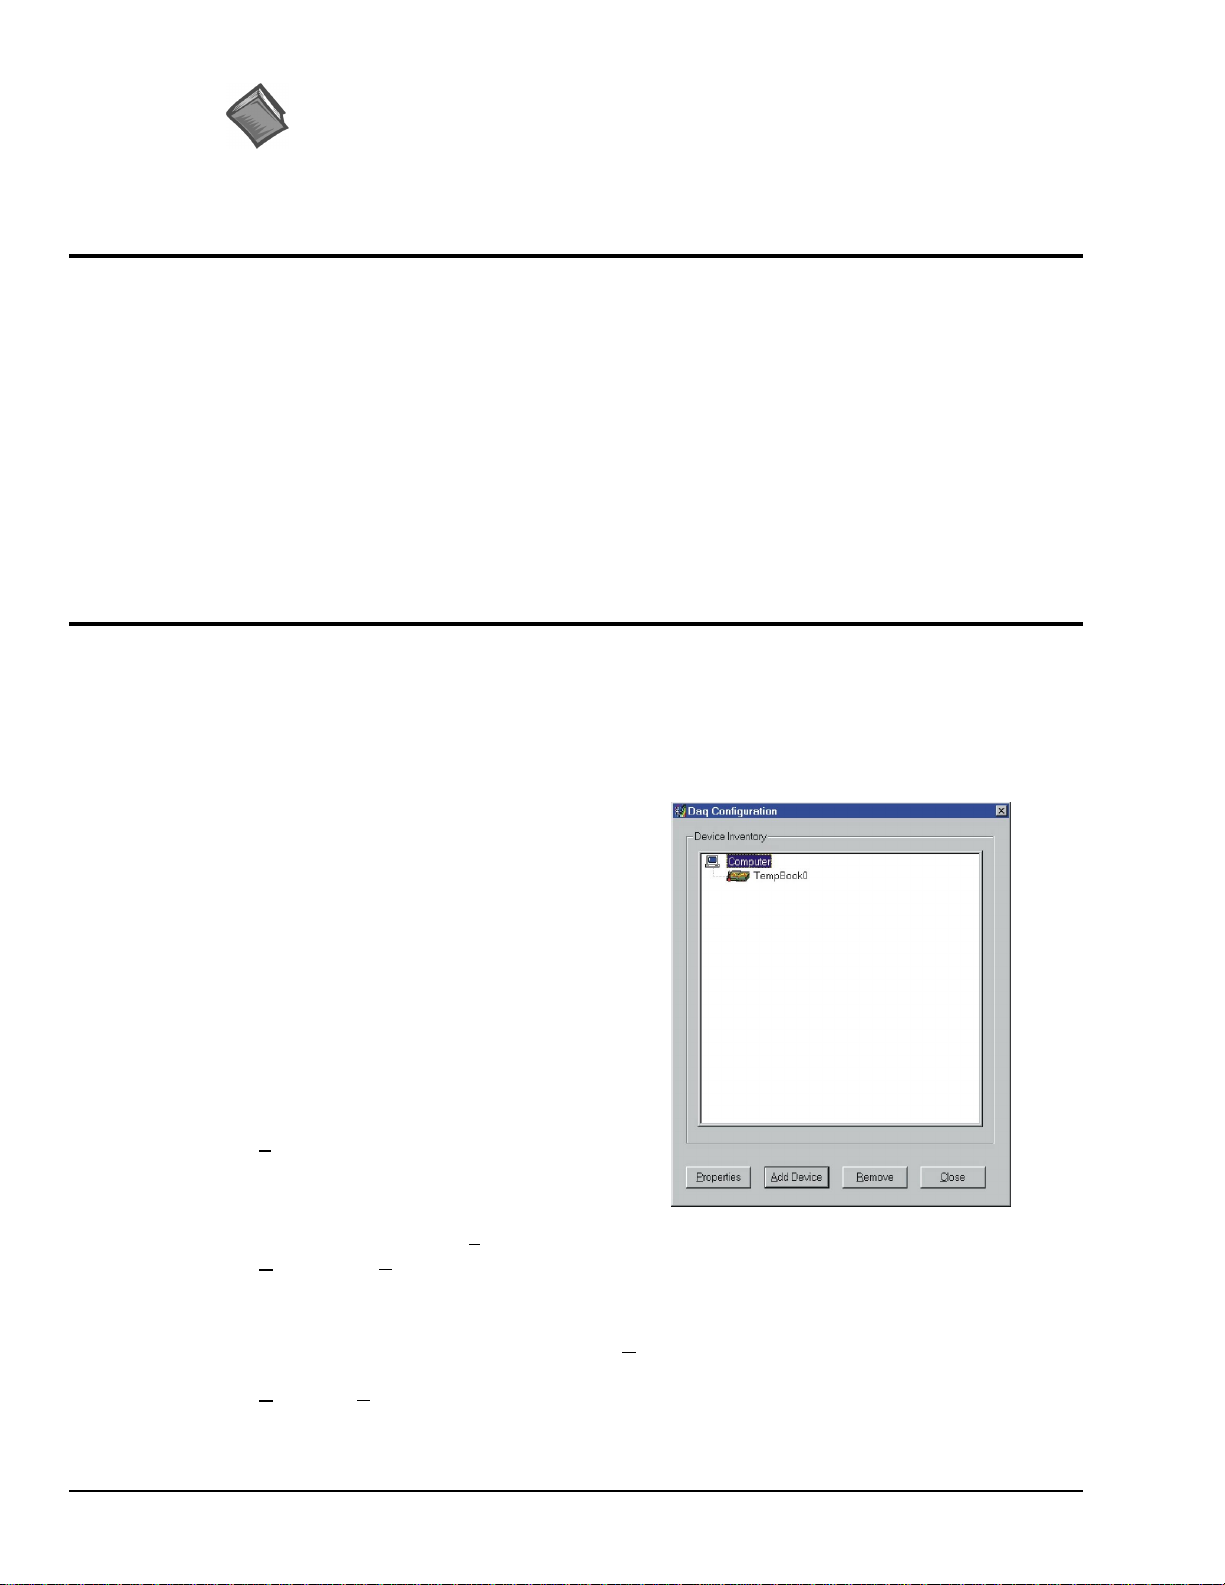
your PC’s CD drive. After agreeing with the legal statement a master setup screen will appear (see
following figure).
If you are using Windows 3.x, select 16-bit TempBook Support from the Data Acquisition Software Master
Setup screen, otherwise select 32-bit (see following figure).
TempBook Power Connection
Selecting TempBook Support (32-Bit), Acrobat Reader, and PostView from the Master Setup Screen
After selecting TempBook Support [also, Acrobat Reader and PostView, if desired], click
Start Install and follow the on-screen prompts.
Once the setup program has installed the software, a TempBook program group will appear within
Windows. To start DaqView, click on its program icon. The main window will soon display a spreadsheet
of channels in rows and channel parameters in columns.
TempBook User’s Manual
04-26-01_o
Introduction and Quick Start 1-5
Page 14
Reference Note:
Users of 32-bit TempBook Support should refer to the DaqView, DaqViewXL, and
PostView document modules.
Users of 16-bit TempBook Support should refer to the TempView and PostView
document modules.
Parallel Port Capabilities
The TempBook includes a test program that verifies your computer's parallel port, testing its standard and
enhanced capabilities.
•
Standard LPT ports on IBM compatible computers have two modes to read data from the printer port:
4-bit and 8-bit. The 8-bit mode is somewhat faster than the 4-bit, but not all printer ports support this
mode.
• Enhanced parallel ports (EPP) are parallel ports that include additional hardware that allows the
TempBook to communicate with the PC at 3 to 10 times the speed possible with standard parallel
ports. This greatly improves data acquisition performance.
Enhanced parallel ports require special hardware, and only certain computers are EPP capable. Most laptop
computers that use the Intel 386SL or 486SL chip set (which includes the 82360 I/O Controller) are EPP
capable. For those computers which have plug-in card slots, EPP adapter cards are available. You may
wish to contact your computer's manufacturer for details about your machine and possible adapter cards.
TempBook Configuration Under Windows 95/98/ME/NT/ and 2000
This section describes the configuration of TempBook devices under the Windows 95/98/ME/NT and 2000
operating systems. A configuration utility is supplied via a control panel applet. The Daq Configuration
applet allows you to add a device, remove a device, or change existing configuration settings. Daq
Configuration also has a built-in test utility to test the device. The test utility provides feedback on the
validity of the current configuration settings as well as providing relevant performance summaries.
Daq Configuration can be found in the Windows
control panels and can be executed any time that it is
desirable to add, remove or change device
configuration settings. Daq Configuration may also
be entered during driver installation. The following
description applies to either method.
The Daq Configuration/Device Inventory screen at
right will display all currently configured devices.
Devices are identified by their name, and by an icon
that indicates the device type. If no device is currently
configured, no device will appear in this field.
The 4 buttons across the bottom of the Daq
Configuration screen are used as follows:
• Properties. Current configuration settings for a
device can be changed by bringing up the
corresponding properties screen. To do so,
double-click the device icon or single-click the
device and then select the Properties button.
• Remove. The R
removed if it is no longer installed or if the device’s configuration no longer applies.
Note: If a device is removed, applications may no longer access the device. However, the device can
be re-configured at any time using the Add Device function described below.
emove button is used to remove a device from the configuration. A device may be
• Close. The C
1-6 Introduction and Quick Start
lose button may be used at any time to exit the Daq Configuration applet.
04-26-01_o
TempBook User’s Manual
Page 15
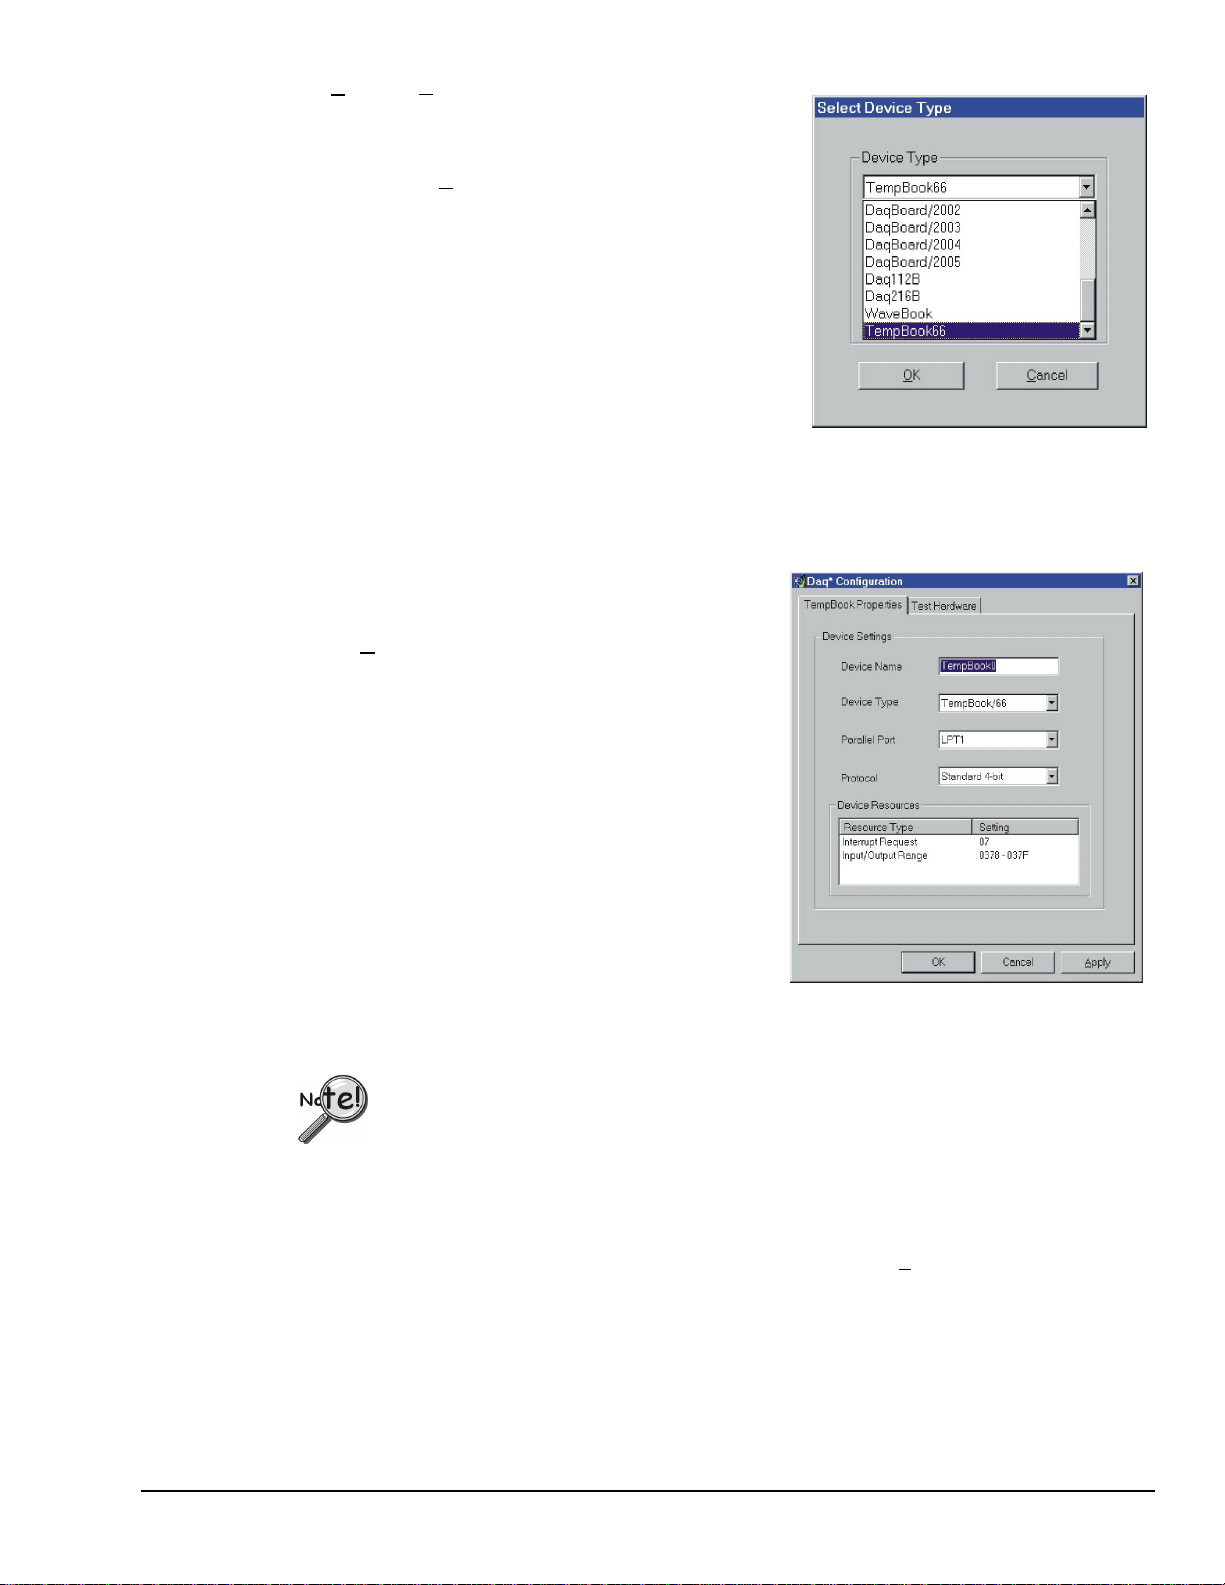
• Add. The A
dd Device button is used to add a device
configuration whenever a new device is added to the
system. Failure to perform this step will prevent
applications from properly accessing the device.
Selecting the Add Device button will display a window as
shown in the figure.
Use the scroll bar to find the TempBook device type to be
configured. Once found, click the device type (the type should
then appear in the main edit box). Now select the OK button.
The next screen displays the properties for the TempBook
device with the default configuration settings. Fields include:
• The Device Name field is displayed with the default
device name. However, this field can be changed to any
descriptive name as desired.
• The Device Type field should indicate the device type which was initially selected. However, it can
be changed here if necessary.
• The Protocol field is used to set the parallel port protocol for communicating with the TempBook.
Depending on your system, not all protocols may be available.
When all fields have been changed to the desired settings,
you can click:
• the Apply button to store the configuration.
• the OK button to store the configuration and exit the
current property screen.
•
the Cancel button to exit the current device
configuration property screen without storing any
changes.
• the Test Hardware tab to test the current stored
configuration for the device. This selection will bring
up the Test property screen.
Before testing the TempBook, make sure the device has
been properly installed and powered-on. Make sure the
parallel port cable is firmly in place on both the TempBook
and the proper LPT port in the computer.
Testing the TempBook device may, in some cases, cause the system to hang.
If test results are not displayed in 30 seconds or if the system does not seem to be
responding …
(1) reboot the system.
(2) upon power-up, re-enter the Daq Configuration, and
(3) change the configuration settings to those that work properly.
To test the current stored configuration for the device, click the Test button. Test results
should be displayed within a few seconds. The test results have 2 components:
Resource Tests and Performance Tests.
TempBook User’s Manual
04-26-01_o
Introduction and Quick Start 1-7
Page 16
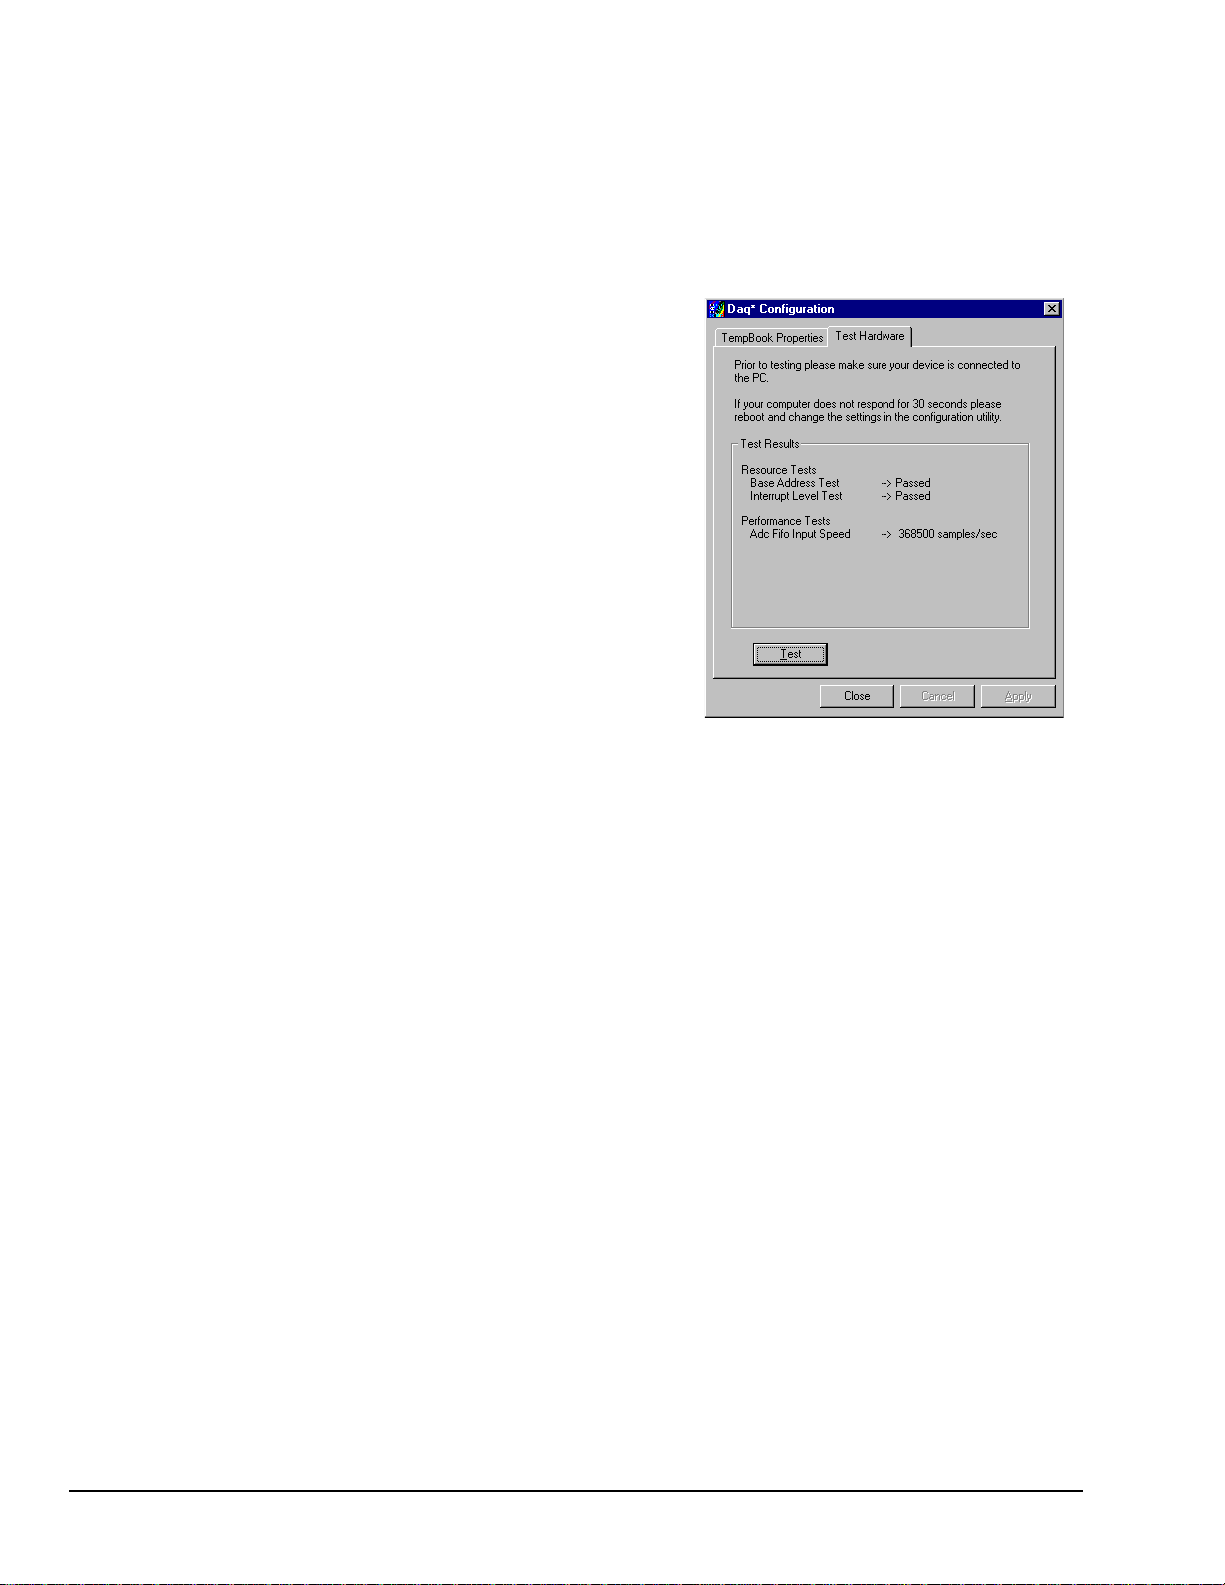
Resource Tests
The resource tests are intended to test system capability for the current device configuration. These tests
are pass/fail. Resource test failure may indicate a lack of availability of the resource or a possible resource
conflict.
• Base Address Test - This test will test the base address for the selected parallel port. Failure of this
test may indicate that the parallel port is not properly configured within the system. See relevant
operating system and computer manufacturer’s documentation to correct the problem.
Performance Tests
The performance tests are intended to test various
TempBook functions with the current device
configuration. These tests give quantitative results for
each supported functional group. The results represent
maximum rates at which the various operations can be
performed. These rates depend on the selected parallel
port protocol and will vary according to port hardware
capabilities.
• ADC FIFO Input Speed - This test will test the
maximum rate at which data can be transferred from
the TempBook’s internal ADC FIFO to computer
memory through the parallel port. Results are given
in samples/second (sample is 2 bytes in length
representing a single A/D count).
1-8 Introduction and Quick Start
04-26-01_o
TempBook User’s Manual
Page 17
Installation, Configuration, and Calibration 2
Inspection
The TempBook components were carefully inspected prior to shipment. When you receive your data
acquisition system, carefully unpack all items from the shipping carton and check for any obvious signs of
physical damage that may have occurred during shipment. Immediately report any damage to the shipping
agent. Retain all shipping materials in case you must return the unit to the factory.
Every TempBook is shipped with the following items:
•
TempBook Data Acquisition System
•
User's Manual
• Installation CD
• Calibration Constants Disk
• Accessory Kit, including: CA-35-2 (2 ft parallel port cable) and an AC Adapter
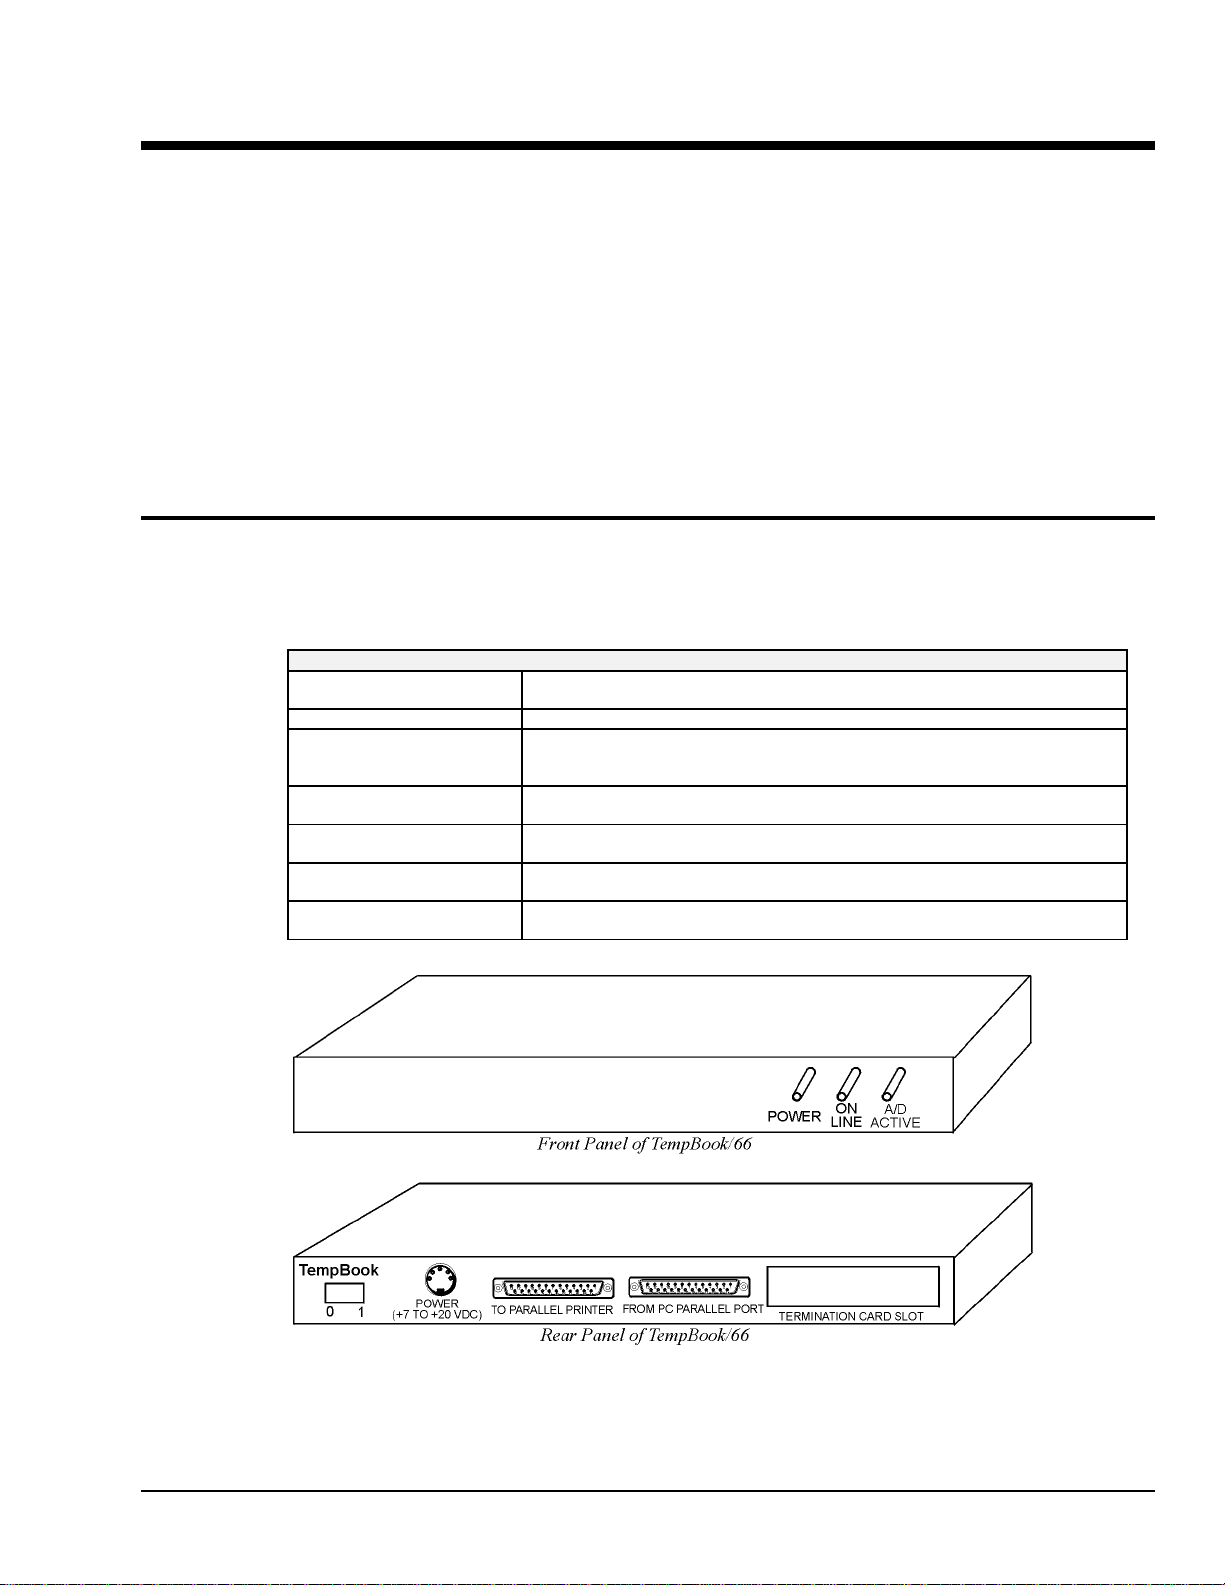
Panel Connectors and Indicators
The TempBook front panel consists of 3 status-indicator LEDs. The rear panel consists of the power
switch, power input, two DB25s for parallel port connection and pass-thru, and a slot to accept the input
termination card. The function of each of these components is described below.
TempBook Panel Connectors and Indicators
POWER SW ITCH This rocker arm switch turns on the DC power to the TempBook when the "1" side
POWER INPUT This input connector accepts +7 VDC to +20 VDC.
TO PARALLEL PRINTER This parallel port can connect to any standard parallel printer. This allows the
FROM PC PARALLEL PORT This parallel port connects directly to the PC's parallel printer port. This allows
POWER This LED is ON when power is applied to the TempBook (and the power switch is
ON-LINE This LED is ON when the TempBook is in an Active state. OFF, when the
A/D ACTIVE ON during an A/D scan sequence. If the sequence has a small number of steps
of the switch is depressed.
user to attach both the TempBook and a parallel printer to the system
simultaneously.
the host system to communicate with the TempBook.
in the ON position). OFF, if power is not present.
TempBook is not enabled or in the printer pass through mode.
and occurs infrequently, this indicator will only flash briefly.
TempBook User’s Manual
TempBook Front and Rear Panels
04-25-01
Installation, Configuration, and Calibration 2-1
Page 18
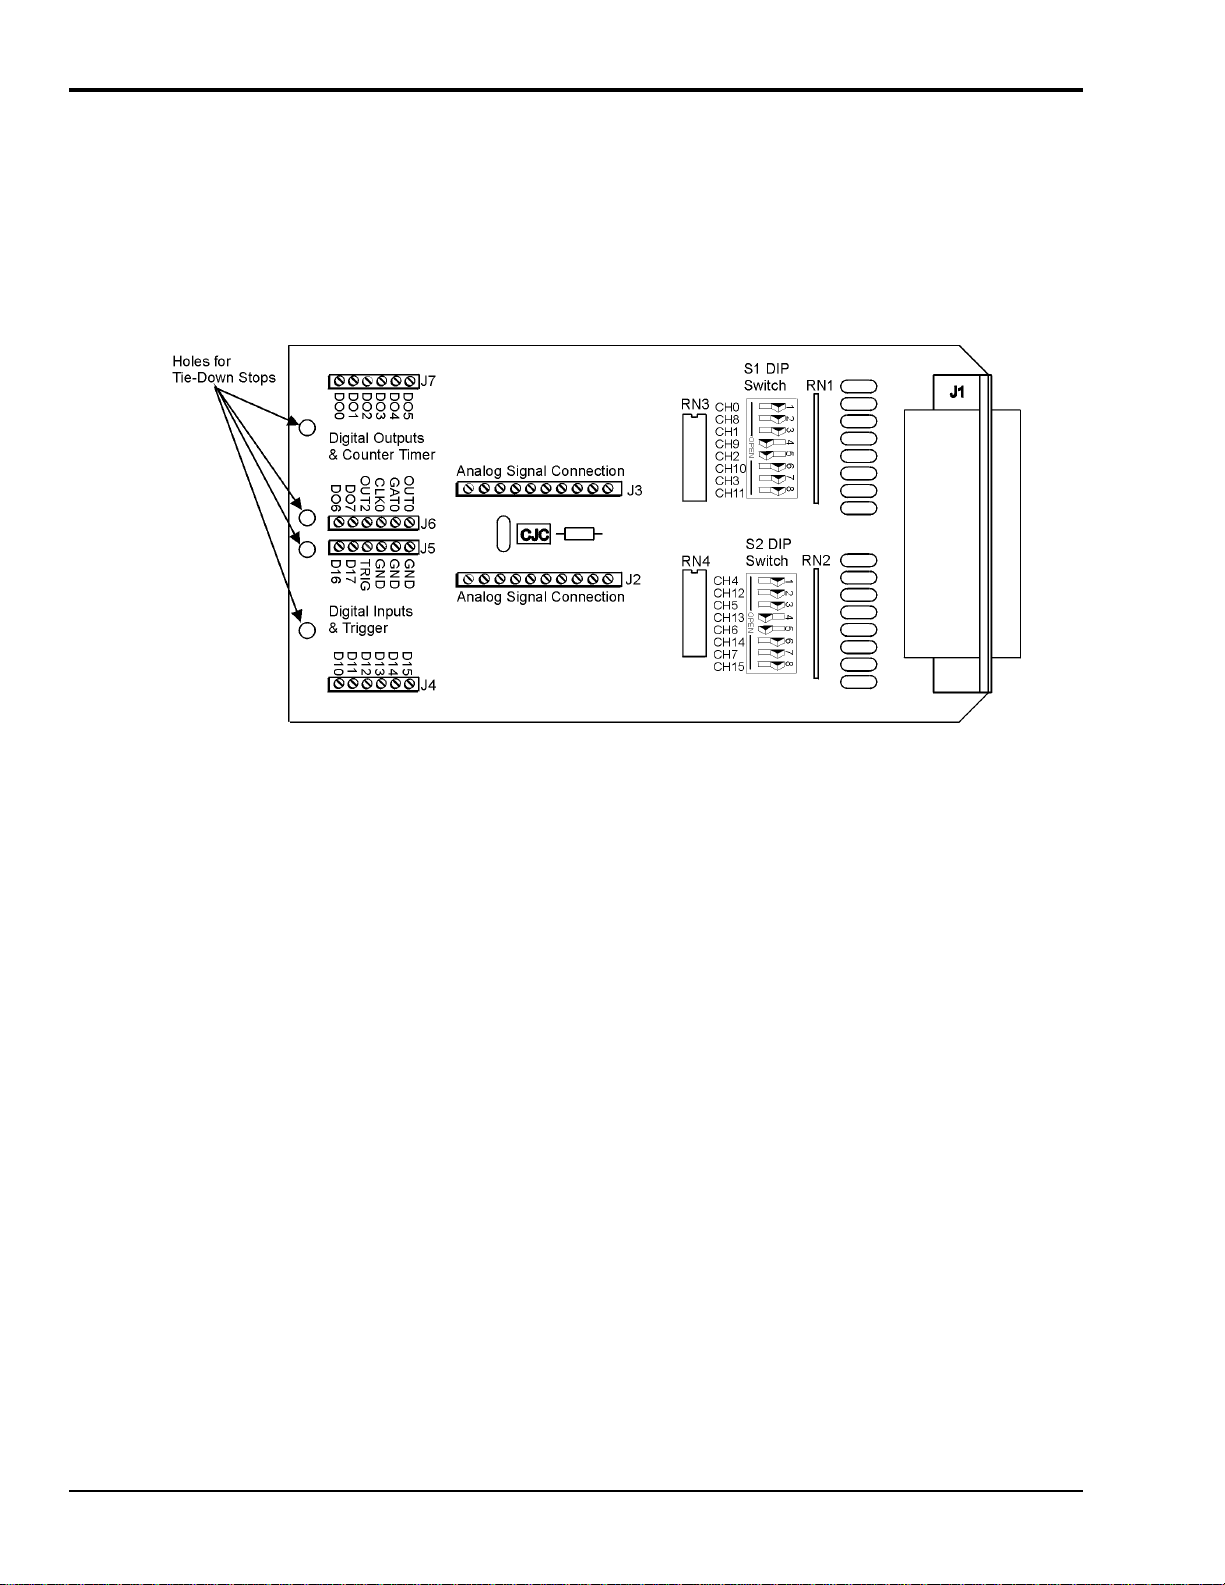
Termination Card and I/O Connectors
The TempBook/66 accepts all analog and digital I/O signals via a removable termination card (see figure).
This termination card has six screw terminal strips, a CJC temperature sensor, and input R/C filters which
also provide a bias current return path for the TempBook's instrumentation amplifier. The filters/bias
resistors are switch-selectable on a per channel basis.
TempBook Termination Card
Terminal strips J2 and J3 provide analog input signal connection. Note that the terminals are arranged in
differential pairs for easy thermocouple connection. These terminal strips also provide analog signal
common connections for convenient referencing of single-ended input signals.
Terminal strips J4 and J5 provide connections for the eight digital outputs and the TTL trigger input. These
terminal strips also provide ground connections for referencing digital signals. Terminal strips J6 and J7
provide connections for the eight digital inputs, the pacer clock output (OUT2), and the three counter/timer
(8254 P0) I/O signals.
2-2 Installation, Configuration, and Calibration
04-25-01
TempBook User’s Manual
Page 19
The thermocouple or voltage connections should be made as shown in the following figure.
Analog Signal Connection
When connecting both low and high level signals, the low-level signals should be
connected to the lowest numbered channels with connections following in ascending
order of signal magnitude.
Each of the 16 analog input channels is configured as shown in the
figure (also, refer to page 2-10 for more information on wiring
differential inputs).
The series resistance and shunt capacitance form a single-pole lowpass filter with a corner frequency of 15.9 kHz. The shunt
resistance provides the bias current path for the instrumentation
amplifier.
When reading thermocouples, these filters should be switched in.
If the filters are not used with thermocouples or any other
differential input, then the user must provide a bias current return
path to signal common.
Two DIP switches need to be set for each differential channel.
Internal Configuration
Reference Note:
This section pertains to TempBook/66 hardware configuration. Software installation and
software configuration under Windows 95/98/Me/NT and 2000 is discussed in chapter 1.
To open the unit, place the TempBook on a flat surface.
Remove the screw on the top rear of the case, and slide out the
top cover. Reverse this procedure to assemble the unit.
The internal configuration of a TempBook/66 consists of
setting the following jumpers to reflect the desired mode of
operation:
•
Time Base (JP9)
• Watchdog Timer Enable (JP8)
The location of each jumper is shown in the figure.
TempBook User’s Manual
04-25-01
Installation, Configuration, and Calibration 2-3
Page 20
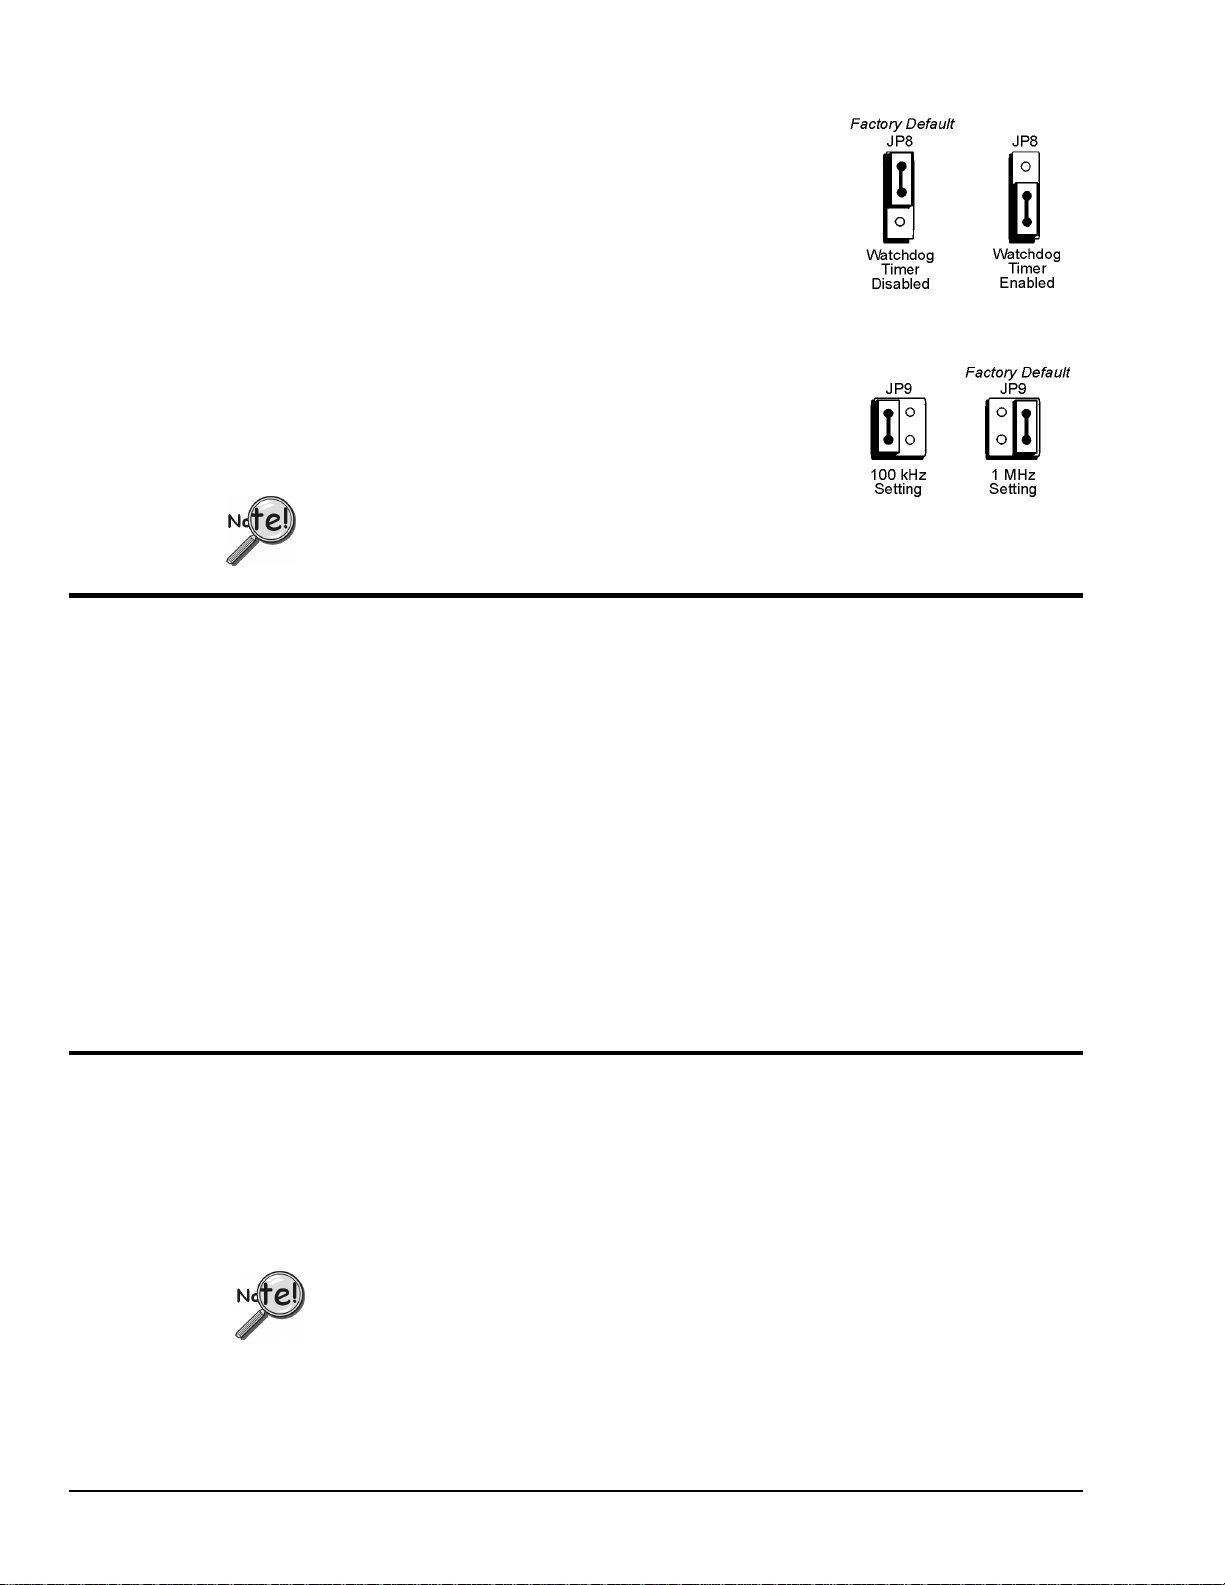
Watchdog Timer Enable/Disable (JP8)
This 3-pin header allows the elective use of the TempBook watchdog timer
function. If using a printer with the TempBook, the watchdog timer should
be enabled to allow the TempBook to be most reliably reset by the host
computer. Note that enabling the watchdog timer might impede background
measurements. If the user is not going to attach a printer, the timer is
optional. The default setting is Watchdog Timer Disabled. To enable, place
the shunt jumper in the enabled position as shown in the figure. To disable,
place the jumper in the disabled position, as shown.
Time Base Selection (JP9)
This 2×2 header allows the user to select one of two oscillator derived
frequencies to be applied to the pacer clock (8254 P1 & P2). The pacer clock
sets the interval between scans in continuous trigger mode. The two
frequencies are 1 MHz and 100 kHz. The most useful range of clock output
frequencies [for the typical user] is provided by the default, 1 MHz setting.
DaqView only supports a setting of 1 MHz, which is the factory default.
Hardware Installation
Connect the TempBook to any PC parallel printer port (female DB25) by unplugging the printer cable and
plugging the male end of the supplied cable (CA-35) into the computer and the female end into the mating
connector on the TempBook. Any printer port (LPT1, LPT2, or LPT3) may be used but should be noted
for use in software installation.
TempBook allows for LPT pass-through for simultaneous data acquisition and printer operation. When
using a printer in the system, attach the original printer cable male DB25 into the mating connector on the
TempBook.
The TempBook may be powered by the supplied AC adapter that plugs into any standard wall outlet or
from an isolated 9-20 VDC source of 1-2 A.
If using the power adapter, plug it into a 120 VAC outlet, and attach the low voltage end to the jack on the
TempBook. Turn ON the power switch, and the POWER LED should be on.
At power-on, the printer should behave normally and can be checked by issuing a PRINT SCREEN
command (or any other convenient method of checking the printer). (Installation of the software will be
necessary before the TempBook can perform any functions.)
Rechargeable Battery Module (DBK30A)
For portable applications where external AC or DC power is not available, the DBK30A rechargeable
nickel cadmium battery module can be used with the TempBook/66. This module is housed in a rugged
metal package that is the same size as the TempBook. It also comes with high-strength Velcro tabs that
allow convenient mounting underneath the TempBook/66.
The DBK30A has two modes, the 14 VDC default and the 28 VDC mode. An internal slide-switch
determines the mode.
Only the 14VDC mode of the DBK30A is to be used with the TempBook/66.
The 14VDC operating mode provides 14.4 VDC at 3.4 A-Hr. This setup can power the TempBook for 3 to
6 hours depending on the application. The battery module has built-in automatic battery-charging circuits,
which quickly and safely recharge the internal batteries when connected to the supplied AC adapters. The
only requirement for trouble-free operation is for the user to fully charge the battery module before
attempting to use it.
2-4 Installation, Configuration, and Calibration
04-25-01
TempBook User’s Manual
Page 21
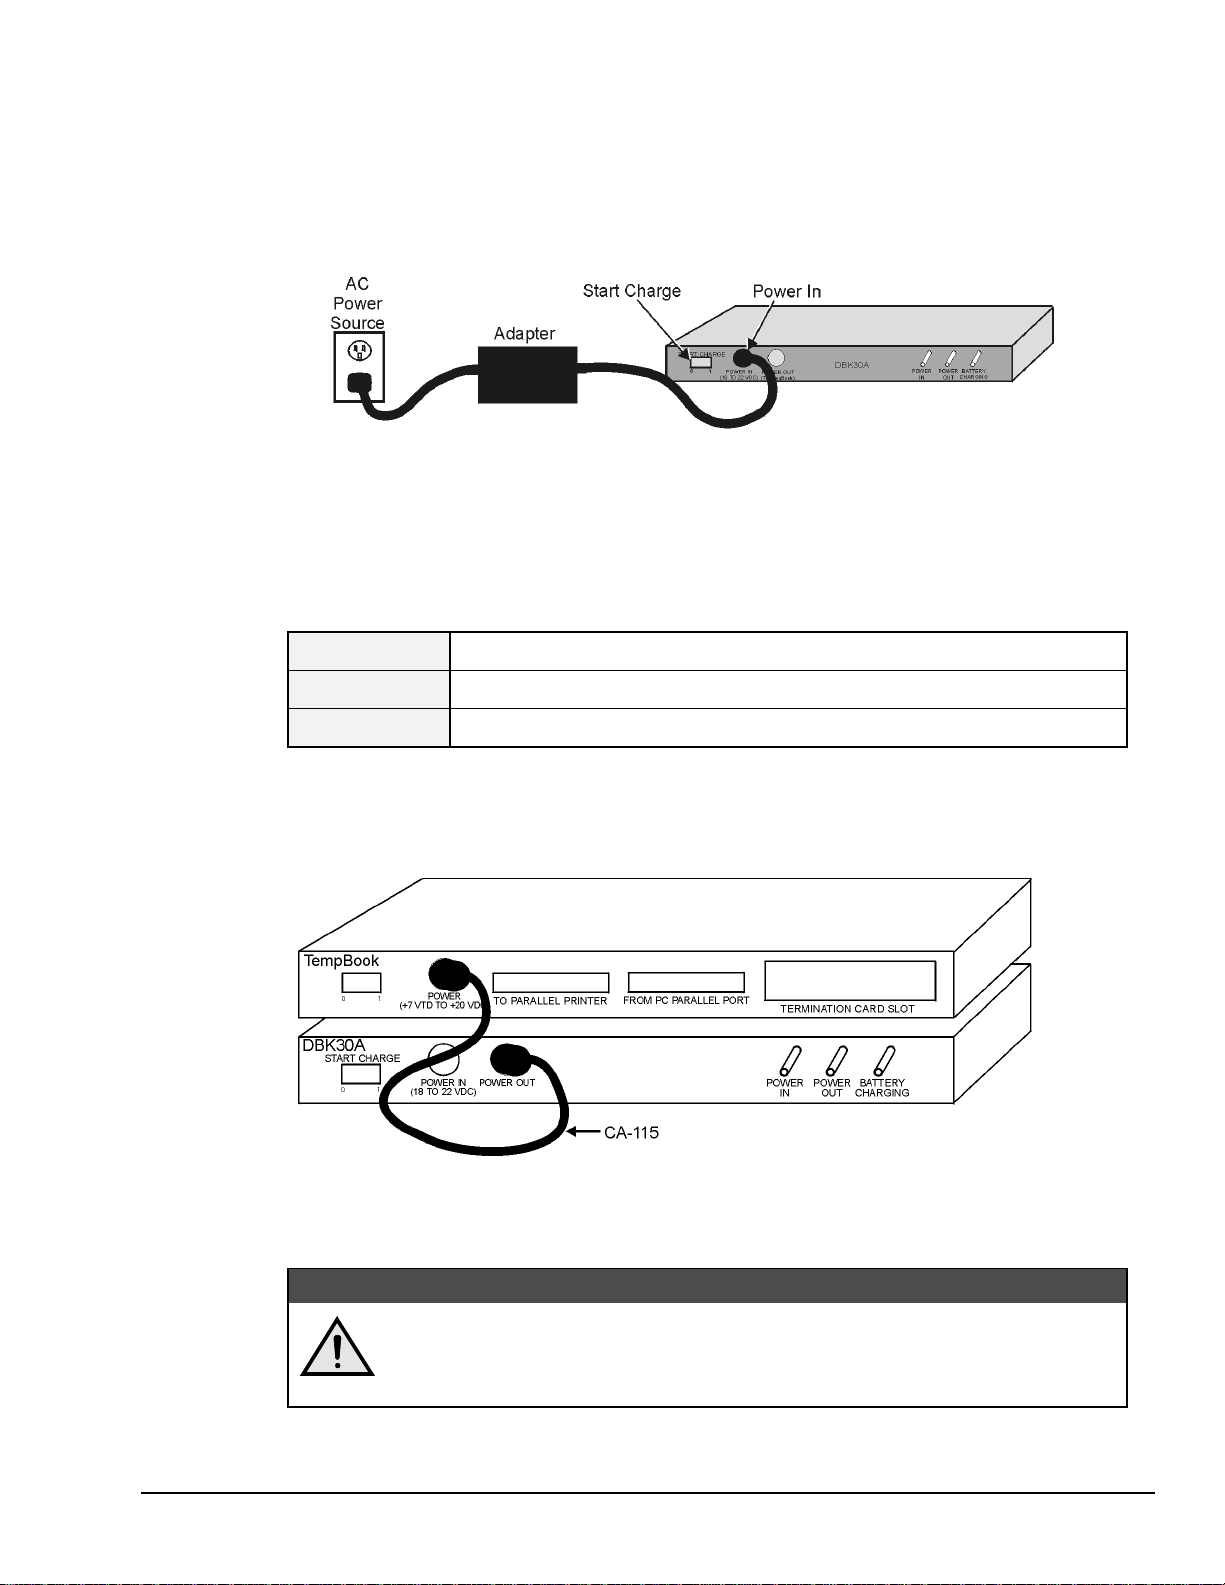
Charging the Battery Modules
The DBK30A package includes a charger for the intended line voltage (either 120 VAC or 230 VAC). To
charge the battery module, plug the output cable from the charger into the POWER IN connector on the
DBK30A, and plug the charger into an appropriate source of AC power (see figure). The charge cycle will
be initiated automatically, and the batteries will be fully charged after the charging cycle terminates.
To initiate another charge cycle, depress the START CHARGE momentary rocker-arm switch. Subsequent
charge cycles applied to a fully charged DBK30A will have no ill effect because the DBK30A will sense
the fully-charged status of the batteries and revert to the trickle-charge state within a few minutes.
Three LED status indicators on the DBK30A provide information on the charge process or external load as
noted in the table.
Power In
Battery Charging
Power Out
Illuminated when the charger is connected to a source of AC power and to the battery
Illuminated steadily while battery is in the high current (2-amp) charge mode.
Flashing briefly, one or two flashes at a time, when the internal batteries are fully charged.
Illuminated steadily when an external TempBook product is connected and drawing current
Connecting the Charger
module.
from the battery modules.
Battery Module Connection
The DBK30A package includes a short connecting cable (CA-115) to connect to the TempBook. This
cable connects the Power Out connector on the DBK30A to the Power In connector on the TempBook (see
figure).
The run time available from a DBK30A operating a TempBook will depend on what the TempBook is
doing. This time can be as little as 3 hours or as much as 6 hours.
The DBK30A must periodically be fully discharged or the cells may develop "lazy
chemistry" that may limit storage capacity. (This “memory” is characteristic for
nickel-cadmium batteries.) To manually discharge a battery pack, connect a
TempBook, and leave it turned on until the indicator lights go dark.
Connecting the TempBook to the Battery Module
CAUTION
CAUTION
CAUTIONCAUTION
TempBook User’s Manual
04-25-01
Installation, Configuration, and Calibration 2-5
Page 22

Connection Troubleshooting
If communications cannot be established with the TempBook or if trying to connect causes the system to
hang or crash, then you should:
• Check that TempBook’s power LED is ON. If not ON, verify power connection between the
TempBook and the power source.
• Make sure the LPT cable is firmly attached to the computer’s proper LPT port and to the TempBook
port labeled “TO COMPUTER”.
•
Check that the desired LPT port has the proper resource configurations. The base address and IRQ
level must be properly configured and recognized by the operating system. The parallel port must be
capable of generating interrupts for proper operation. (This information may be obtained in the
Device Manager in the Control Panel of the operating system). More information on this subject can
be found in the readme.txt file in the current software release.
•
Check the BIOS settings for the LPT port. If ECP, change to normal or bi-directional.
• Make sure the BIOS LPT protocol settings are compatible with the settings selected for the LPT port
with the Control Panel applet.
• Make sure the Daq Configuration Applet has been run and the proper LPT port and protocol have
been selected for the device. The Daq Configuration applet can be found in the Control Panel of the
operating system. The Test Hardware function in the control panel applet can be used to confirm
proper communication with the device.
2-6 Installation, Configuration, and Calibration
04-25-01
TempBook User’s Manual
Page 23

Calibration of TempBook
The TempBook/66 is factory calibrated for gain and offset. After calibration, gain and offset errors, and
software correction constants are calculated.
Calibration Constants File Installation
Each TempBook is shipped with a calibration constants file. The file is named serial_no.cal where
serial_no is the serial number of the TempBook for which the constants were generated.
The default calibration constants filename is tempbook.cal. Use Windows Explorer to copy serial_no.cal
from the disk to the following directory.
C:\PROGRAM FILES\DAQX\APPLICATIONS\TEMPBOOK.CAL\
Within DaqView, the user must go to Window/P
TEMPBOOK.CAL file.
Next one should enable “Perform zero-offset adjustment” by checking the check box.
Hardware Calibration
Since the TempBook is factory calibrated, user recalibration is not recommended. One exception to this
recommendation is the calibration of the TempBook's internal 5V reference. This 5V reference is used to
level-shift the amplified analog input signal for unipolar measurements. Reference-voltage drift is not
compensated for with zero compensation; and therefore, periodic recalibration can improve unipolar
measurement accuracy.
The following characteristics can be calibrated through potentiometer adjustments on the TempBook main
board:
• 5V Reference Voltage
•
Instrumentation Amplifier Offset
• Level Shift Amplifier Offset
• ADC Offset
• ADC Span
The TempBook includes a simple calibration program that can be used to perform these adjustments. If the
user is only performing the reference voltage adjustment, then only a 4-1/2 digit DMM is required. If the
user is performing the full TempBook calibration, then an adjustable voltage calibrator is also required.
references. Specify “Use Cal File” and browse to pick the
Reference Note:
Refer to the DaqView document module for more information.
A Microsoft Windows program, DAQCAL.EXE, is provided to perform calibration of the TempBook. To
use this program, install the TempBook Windows support and launch the DAQCAL program; follow the
on-screen instructions.
TempBook User’s Manual
04-25-01
Installation, Configuration, and Calibration 2-7
Page 24
Differential Measurement Configurations
Floating Differential
Floating differential measurements are generally made when low-level signals must be measured in the
presence of relatively high levels of common mode noise. The most common example would be a nongrounded thermocouple. When the signal source has no direct connection to the system analog common,
one must be provided. The easiest way to do this on the TempBook is to use the built-in biasing resistors
by closing the corresponding input channel DIP switches (S1 and S2) on the termination card. Discussion
of the card begins on page 2-2. As an alternative, a resistor can be connected between one of the two signal
lines (usually the lower in potential) and common. A resistor of 10 KΩ to 100 KΩ is satisfactory (less
noise with the lower values).
Floating Differential Configuration
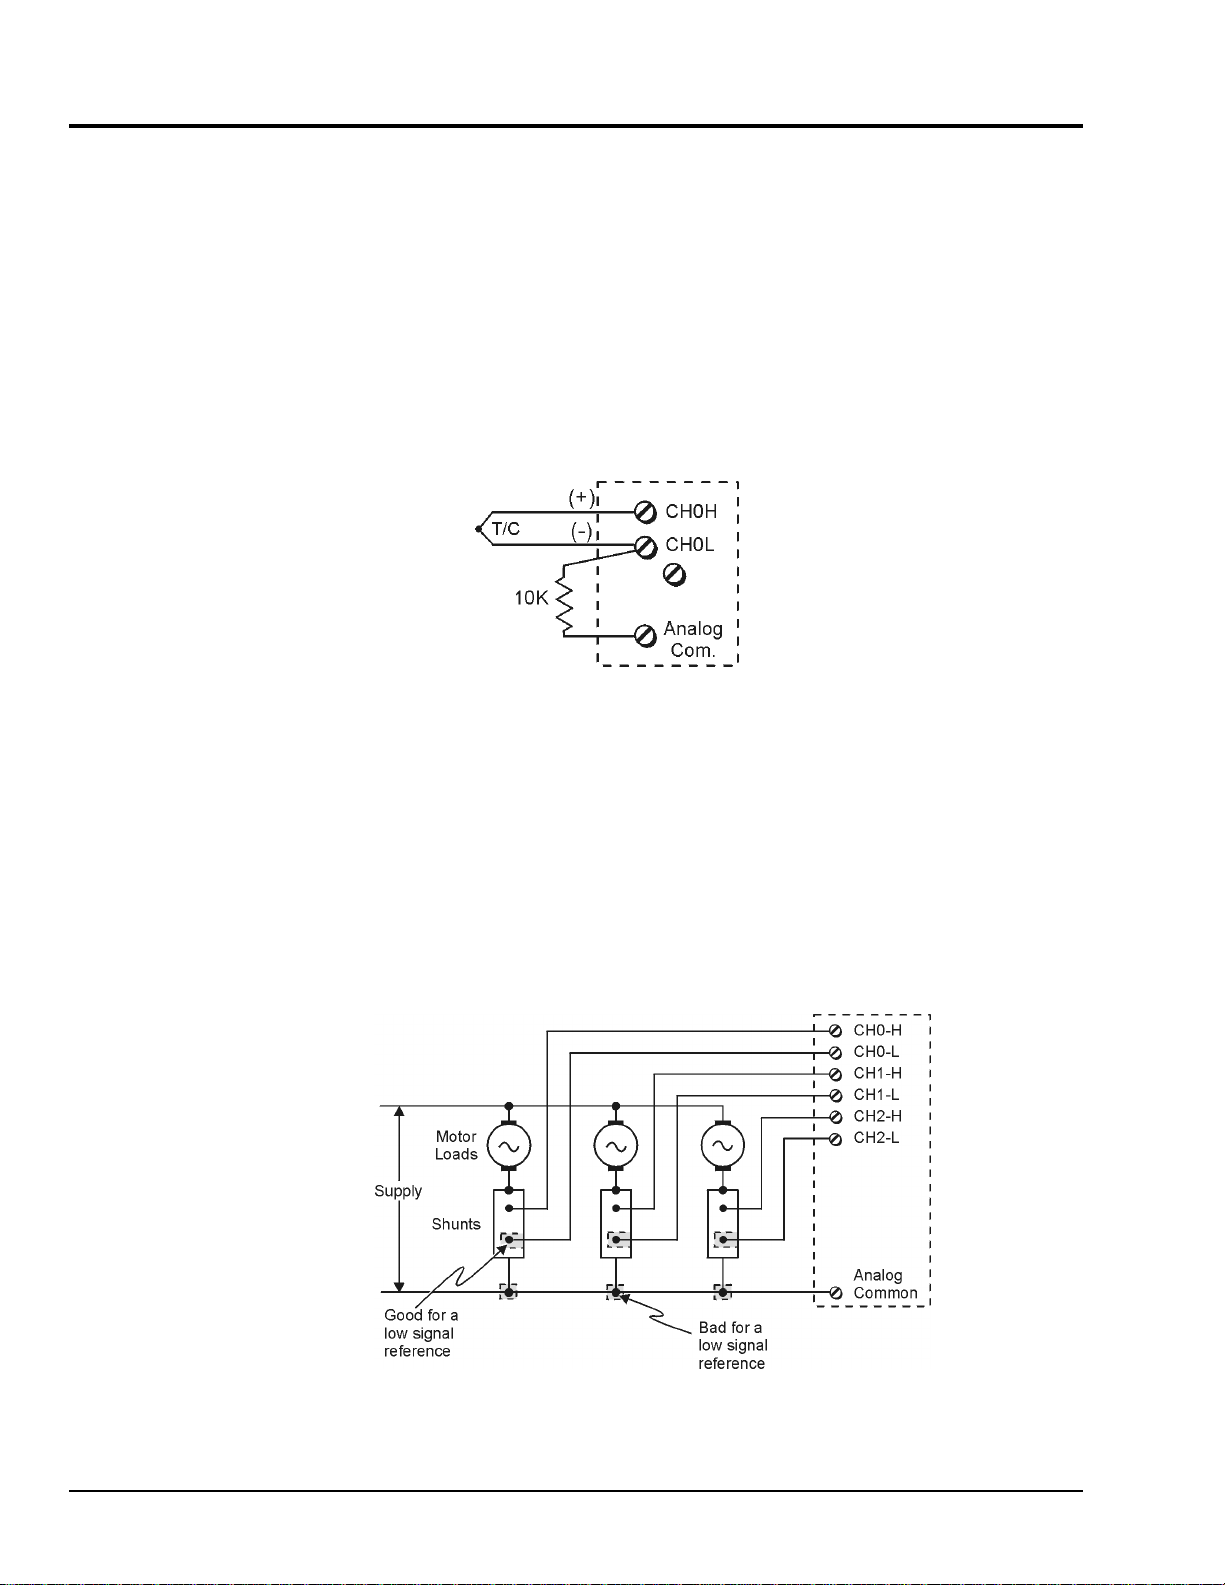
Referenced Differential
Referenced differential measurement is used when measuring several voltages. However, the voltages
cannot share the same common node as a group of single-ended measurements might. An example is to
measure several currents via shunts that happen to share a common supply terminal along a bus. The
weakness in a single-ended hookup is that current flow through the common bus can introduce substantial
errors that can be indistinguishable from the real values measured. The need for the system common to be
connected to the common supply terminal is shown in the figure.
2-8 Installation, Configuration, and Calibration
Referenced Differential Configuration
04-25-01
TempBook User’s Manual
Page 25

DaqView
Overview……2
Starting DaqView……2
A Tour of DaqView……2
A Look at the Main Window…..3
Functionality Differences……4
A DaqView Walk-Through…… 7
Channel Setup……11
Acquisition Setup……13
Data Destination……15
Pull-Down Menus……16
Toolbar Items……19
All Users:
DaqView can only be used with one device at a time.
For multiple DaqBoard/2000 Series board use (via custom programming)
refer to the Programmer’s Manual (1008-0901), chapter 3, Using Multiple
Devices.
TempBook Users:
TempBook devices do not make use of DBK cards or DBK modules, nor do
they make use of certain DaqView functions. TempBook users should skip
over material that is identified as “not applicable to TempBook.”
Document Module
04-24-01
DaqView
_pv
, pg. 1
Page 26

Overview
DaqView is a 32-bit Windows-based data acquisition program that can be used to operate DaqBoard/2000
Series boards, ISA-type DaqBoards, DaqBooks, Daq PC-Cards, and TempBooks.
Daq devices typically make use of optional DBK cards and modules. TempBooks are never used with
DBK cards or modules.
Note: TempBook does not make use of optional DBK cards or DBK modules.
DaqView was designed for ease-of-use; programming expertise is not required. DaqView allows you to:
•
Set up system parameters (selecting channels, gains, transducer types, etc) to acquire data.
• Save data to disk and transmit data to spreadsheets and databases.
•
Automatically re-arm the trigger function and save data in new files as needed.
•
Configure and operate the DBK option modules. Does not apply to TempBook.
• Configure the counter/timer into one of three modes for measuring frequency, totalizing, or
generating pulse trains. Does not apply to TempBook.
• Use the two analog outputs, including waveform generation for DaqBoards.
Does not apply to TempBook.
• Use digital I/O (for Daq devicess with digital I/O). Does not apply to TempBook.
PostView can be launched from DaqView to view, measure, and edit data. PostView is discussed in
a separate document module that is included as part of this manual.
DaqViewXL is a Microsoft Excel-based “add-in.” The application is discussed in a separate document
module that is included as part of this manual.
Starting DaqView
Minimum computer requirements include:
• Intel
• 32 Mbytes of RAM
• Windows 95/98, Windows NT 3.51, or Windows NT 4.0
•
Data acquisition hardware
To run DaqView, double-click the DaqView icon or use your Windows desktop Start button to navigate to
the program file.
Note: If acquisition hardware is not available, or you just want to explore the software, you can select
Simulated Instrument; the main window will open (see following figure).
When DaqView detects hardware, or a simulated instrument has been selected, DaqView’s main window
will open.
Note: In event of a Daq device communication problem, exit DaqView and perform a hardware test from
the Daq Configuration applet control panel.
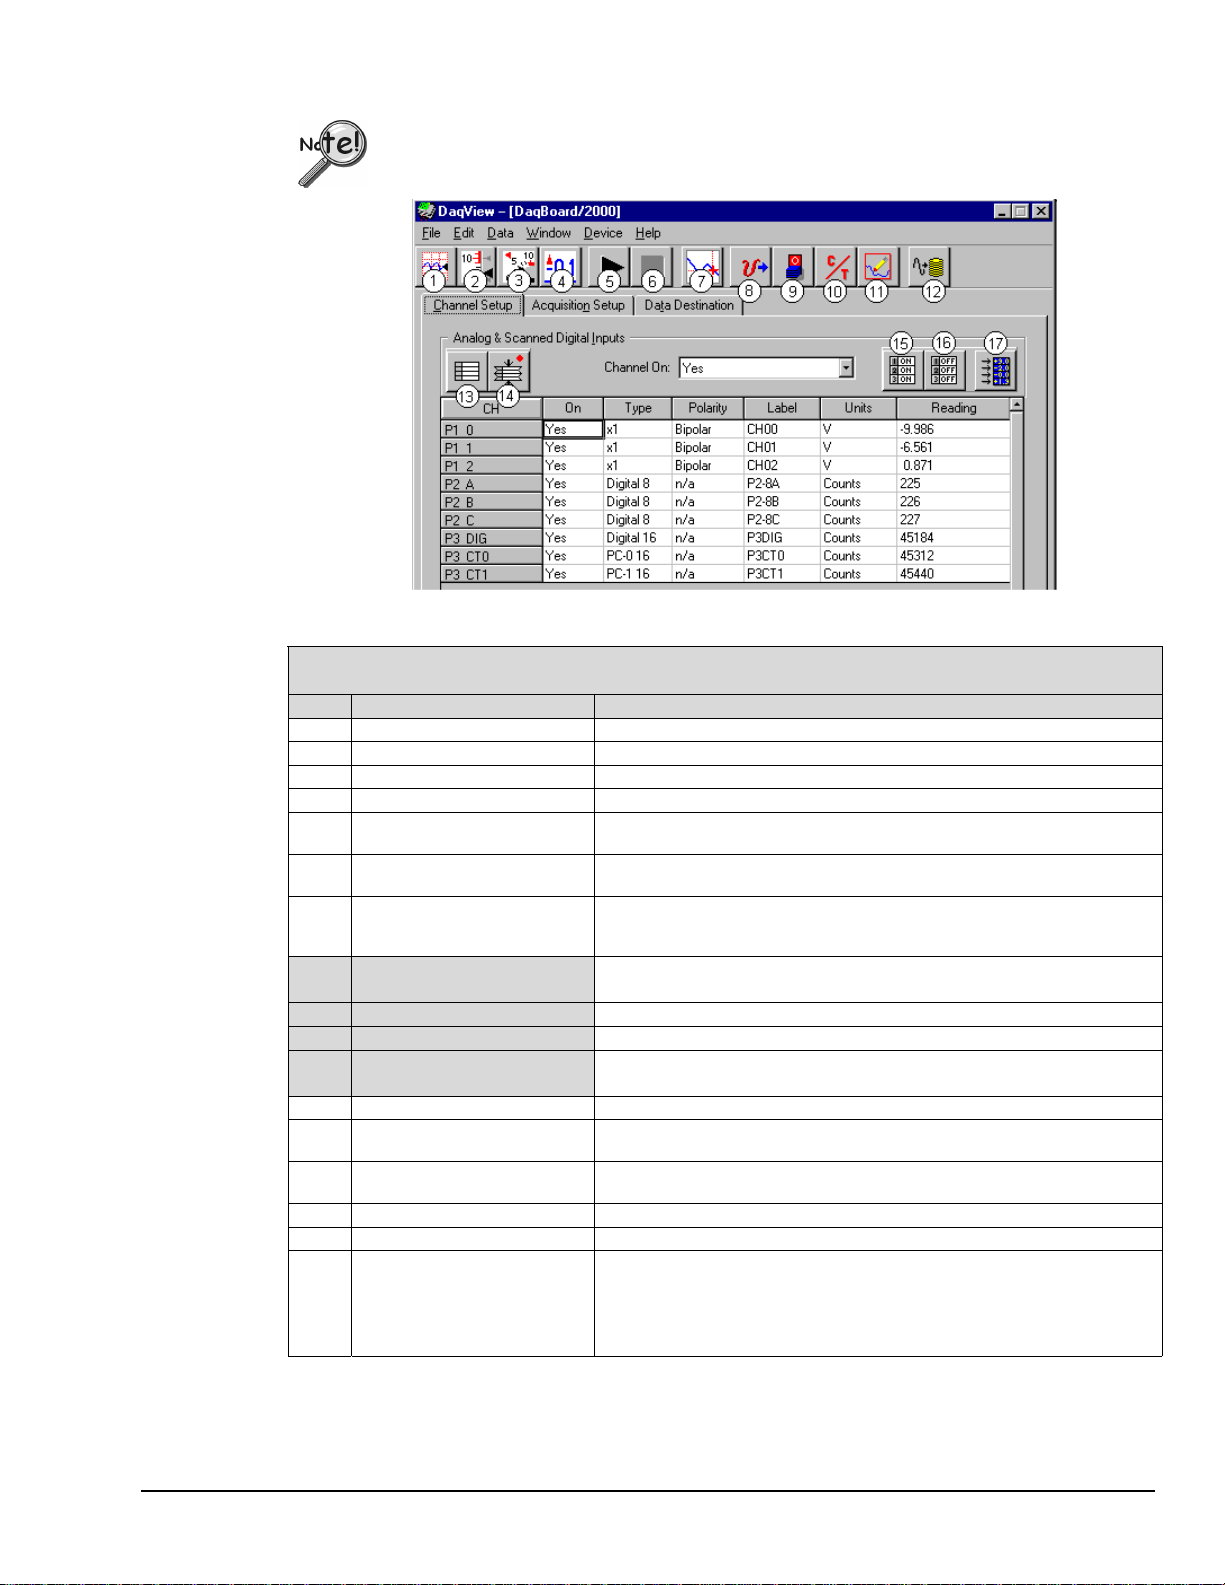
The following figure shows DaqView’s main window for a DaqBoard/2000 and a TempBook. The table
identifies the toolbar buttons, and other buttons that are visible when the Channel Setup Tab is selected [as
in the following figure].
A Tour of DaqView
This section includes a look at DaqView’s main window, a discussion of DaqBoard series 2000 and
TempBook functionality, and steps for completing a self-tour of DaqView. The tour will acquaint you with
several of DaqView’s basic features.
TM
Pentium® P100, or equivalent
DaqView
, pg. 2
_pv
04-24-01
Document Module
Page 27
A Look at the Main Window
Daq devices differ from one another in regard to functionality. Functions that are not
supported by a particular board [or device] will be grayed-out.
Main Window, a Brief Description of Button Control Functions
Note: Functions 8, 9, 10, and 11 are not used by TempBook.
#
Item Description
1 Charts Displays the DaqView Channel Display window.
2 Bar Graph Meters Displays a bar graph meter.
3 Analog Meters Displays an analog dial meter.
4 Digital Meters Displays a digital meter.
5 Start All Indicators Starts displaying data in the Reading column and any open Chart or Meters
6 Stop All Indicators Stops displaying data in the Reading column and any open Chart or Meters
7 View File Data Launches PostView, an independent post-data acquisition program.
8 Analog Output Displays the Analog Output window of the two DAC channels.
9 Digital I/O Displays the Digital I/O window. This feature is not used by TempBook.
10 Counter/Timer Displays the Counter/Timer window. This feature is not used by TempBook.
11 Waveform & Pattern Output Displays the Arbitrary Waveform and Streamed Output windows.
12 Acquire Activates an acquisition of data to a file.
13 Show ALL Channels Expands Analog & Scanned Digital Inputs spreadsheet to show all channels,
14 Hide INACTIVE Channels Condenses the Analog & Scanned Digital Inputs spreadsheet, to hide
15 Turn All Visible Channels ON Turns all visible channels ON. Hidden channels will remain off.
16 Turn All Channels OFF Turns all the channels OFF.
17 Channel Reading A toggle button that enables [or disables] the Channel Reading column of
DaqView Main Window in a DaqBoard/2000 Application
Channel Setup Tab Selected
window.
window.
PostView allows you to manage and view data acquired by DaqView. Refer
to separate PostView documentation for details.
This feature is not used by TempBook.
This feature is not used by TempBook.
whether active or not.
channels that are inactive.
the Analog and Scanned Digital Input spreadsheet. Some windows require
the Channel Reading column to be disabled when changing channels or
other parameters. This command is also available from the Data pull-down
menu.
Document Module
04-24-01
DaqView
_pv
, pg. 3
Page 28
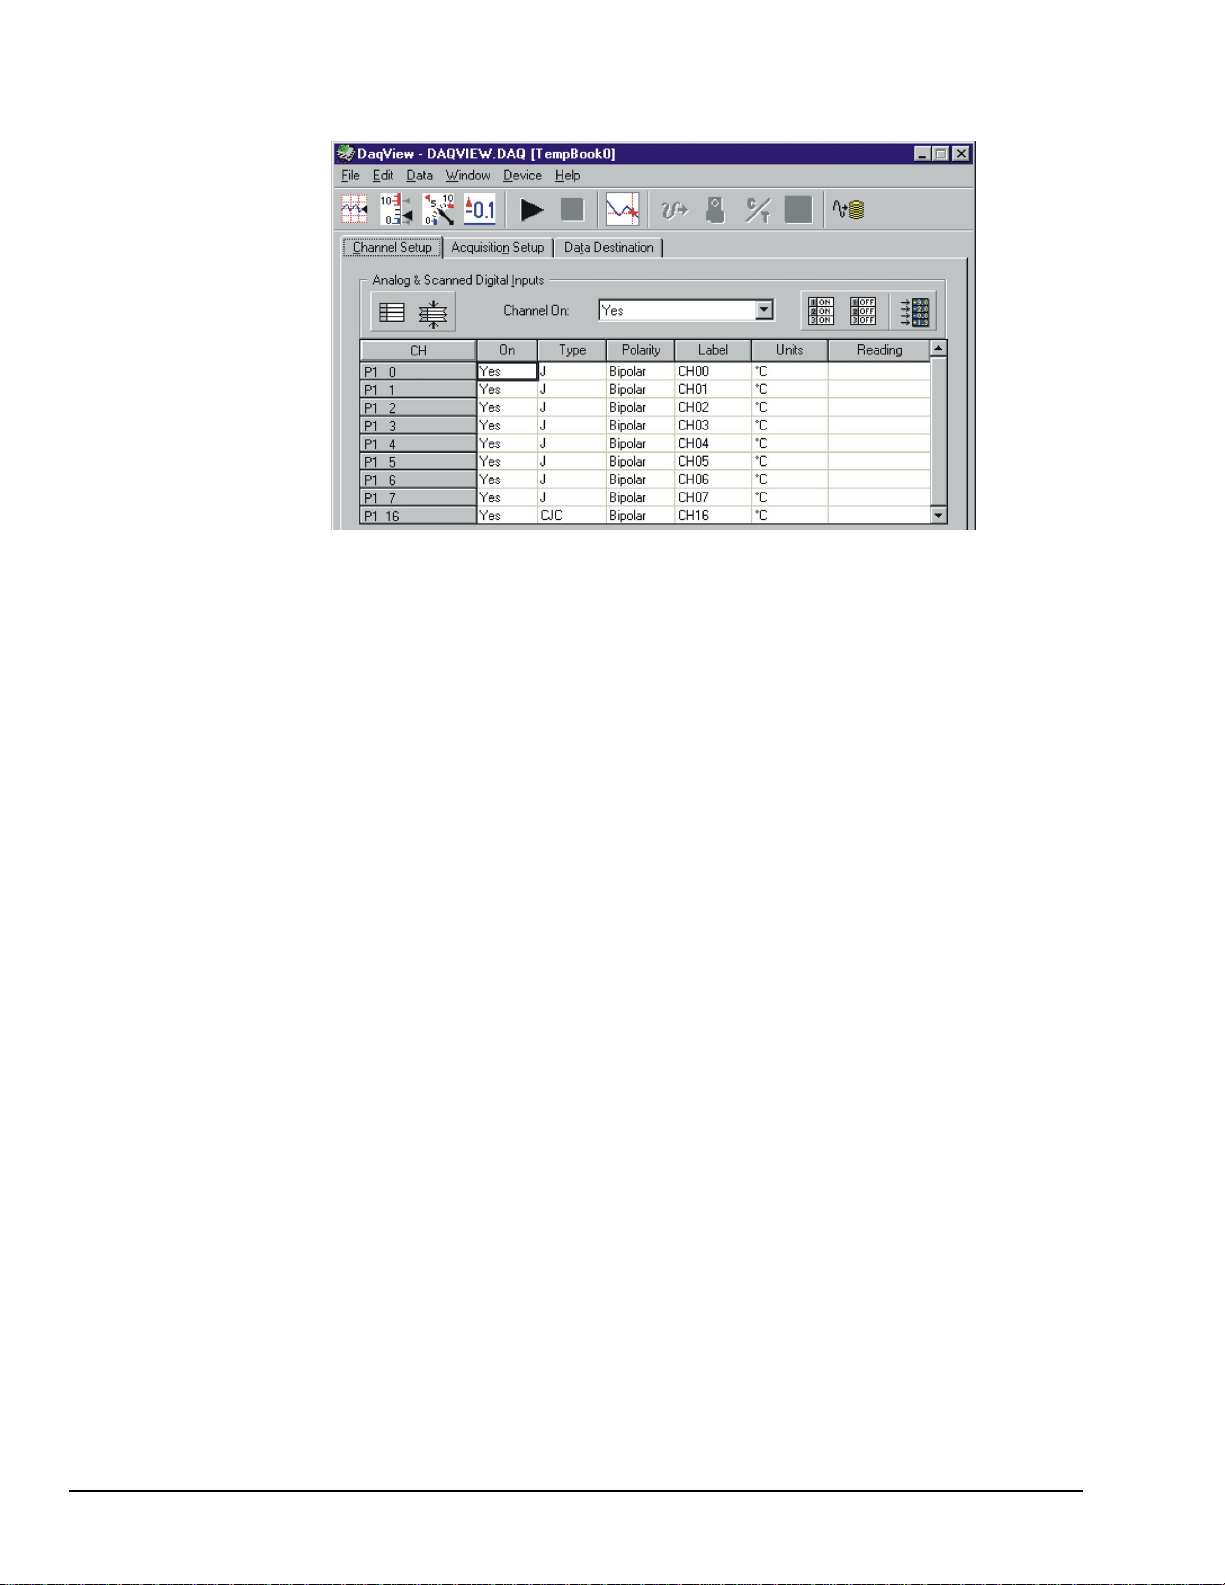
DaqView Main Window in a TempBook Application
Channel Setup Tab Selected
As noted in the previous table, and as can be seen in the above figure, when DaqView functions do not
apply to a device the non-applicable buttons are grayed-out. TempBook, for example, does not make
use of DaqView’s Analog Output, Digital I/O, Counter/Timer, or Waveform & Pattern Output
functions.
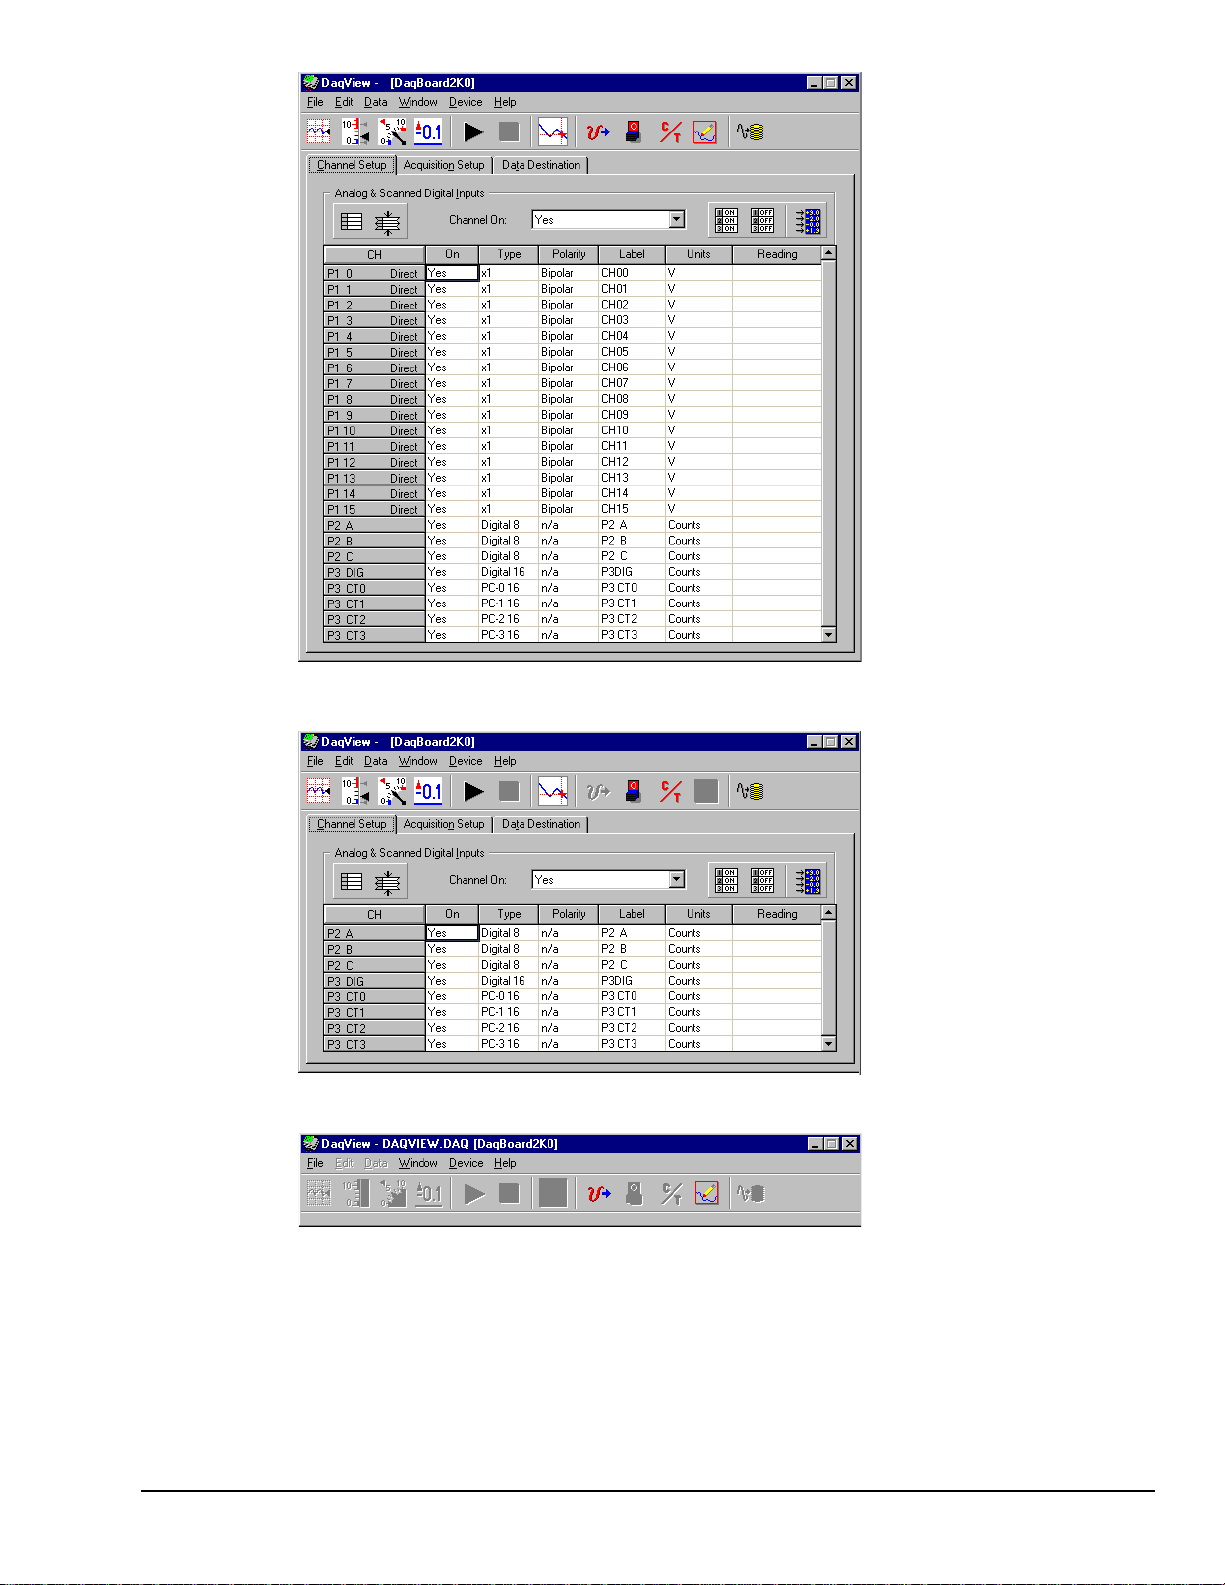
Functionality Differences amongst the DaqBoard/2000 Series Boards
Each of the DaqBoard/2000 Series Boards has a different I/O count. DaqBoard/2001 has more I/O than
any of the other boards [in the 2000 series]. All other 2000 series boards are essentially derivations of
DaqBoard/2001.
The differences in the boards are paralleled in the DaqView software. Basically, if a board does not support
a particular function, the related software feature will be disabled (grayed-out). When using any of the
information presented in this chapter, always take time to note whether or not it applies to your specific
board.
The following screen images represent DaqView Main Windows as they appear for the various boards.
A board synopsis is provided just to the right of each screen.
DaqView
, pg. 4
_pv
04-24-01
Document Module
Page 29
DaqBoard/2000 and
DaqBoard/2001 Boards
These boards have 16 Analog
Input Channels, 40 Digital I/O
Channels, and 6 Counter/
Timers.
In addition:
DaqBoard/2000 boards have 2
Analog Output Channels.
DaqBoard/2001 boards have 4
Analog Output Channels.
DaqBoard/2000 and DaqBoard/2001 Main Window
DaqBoard/2002 Main Window – Channel Setup Tab Selected
DaqBoard/2003 Main Window
DaqBoard/2002 Boards
These boards have 40 Digital
I/O Channels and 6 Counter/
Timers.
These boards have no Analog
Channels. Analog-related
buttons are grayed-out and P1
(Analog Input) Channels do not
appear in the spreadsheet.
DaqBoard/2003 Boards
DaqBoard/2003 has 4 Analog
Output Channels. The main
window allows use of four pulldown menus and two toolbar
buttons: Analog Output, and
Waveform and Pattern Output.
Remaining toolbar buttons
serve no purpose with this
board and are grayed-out.
DaqBoard/2003’s Main
Window has no spreadsheet.
Document Module
04-24-01
DaqView
_pv
, pg. 5
Page 30
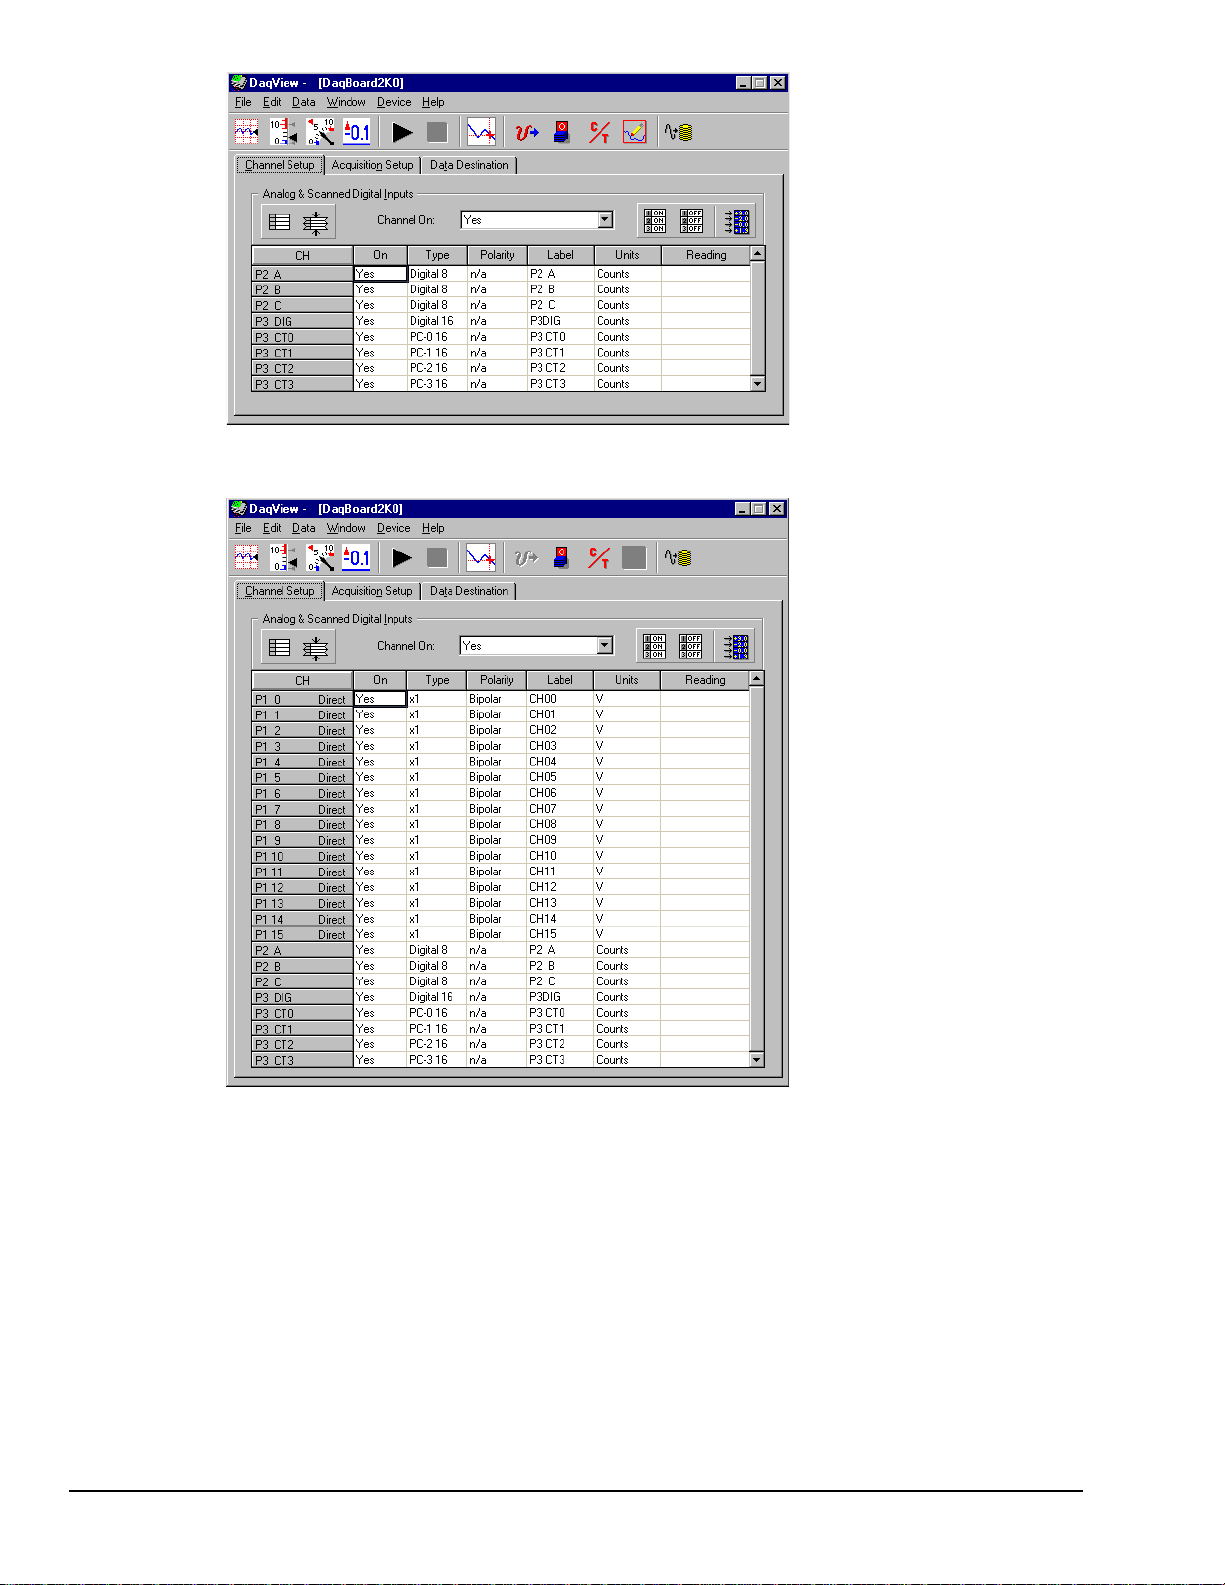
DaqBoard/2004 Main Window
DaqBoard/2004 Boards
DaqBoard/2004 has 4 Analog
Output Channels, 40 Digital I/O
Channels, and 6 Counter/
Timers.
The board has no Analog Input
Channels, and for that reason no
P1 designated channels appear
on the spreadsheet portion of
the window.
DaqBoard/2005 Boards
DaqBoard/2005 has 16 Analog
Input Channels, 40 Digital I/O
Channels, 6 Counter/Timers.
The board has no Analog
Output Channels, and for that
reason the Waveform and
Pattern Output button is grayedout.
DaqView
, pg. 6
_pv
DaqBoard/2005 Main Window
04-24-01
Document Module
Page 31

A DaqView Walk-Through
The following walk-through is intended to familiarize you quickly with the DaqView data acquisition
program. The walk-through does not apply to DaqBoard/2003, as that board makes minimal use of
DaqView. DaqBoard/2003 users can, however, go through the following steps with the simulated
instrument.
(1) Open DaqView. If your Daq device or DBK signal conditioning units are not connected you can
select Simulated Instrument as your device.
(2) From DaqView’s File menu, select
Authorization.
(3) If you ordered DaqView, enter the
Authorization Code found on a separate sheet and
click the Apply Code button.
If you have no Authorization Code you can click
the Start 30-Day Trial button to enable a
temporary version of DaqView. Note that you can
also order DaqView upgrades “online.”
Since each DaqBoard/2000 Series board has
different enabled functions, your board’s actual
screen shots may appear slightly different than
shown in the following example screens.
(4) To familiarize yourself with the three windows
available from DaqView’s main window, click the
tabs Channel Setup, Acquisition Setup,
and Data Destination. These are not available for
DaqBoard/2003.
Channel Setup displays a spreadsheet for viewing
and changing the configuration of analog and
scanned digital input channels. Each row is
dedicated to a single channel.
Document Module
04-24-01
DaqView
_pv
, pg. 7
Page 32

Acquisition Setup displays a window that includes
parameters for triggering and configuring the scan.
These settings are used when an acquisition to disk
is started with the toolbar’s Acquire button. When
the trigger is satisfied, scans are collected at the
selected scan frequency and stored to disk in the
designated file. Note that these parameters cannot
be altered while an acquisition is in progress.
Data Destination provides a means of designating
the desired file formats and directories for acquired
data.
From DaqView’s Device menu, select Configure
Hardware Settings.
The window Configure System Hardware will appear. Whenever expansion cards are added, you must
update this window.
On the left side of the window, select any channel’s pull-down box to reveal the external connection
options. Besides the default, direct signal connection, you can choose among the DBK option cards and
modules. The right side of the screen sets up digital connections if your Daq device is so equipped.
User’s of certain DBK cards will need to select an internal clock speed of 100 kHz as discussed in the
following section.
Click OK to return to DaqView’s main window.
DaqView
, pg. 8
_pv
04-24-01
Document Module
Page 33

Configure System Hardware Screen Sample
for DaqBoard/2000, /2001, and /2005)
Configure System Hardware Screen Sample
for DaqBoard/2002 and /2004
DaqBoard/2002 and DaqBoard 2004 have no
Analog Input, thus the Analog I/O Option Cards
sections of the screen are grayed-out.
Document Module
04-24-01
DaqView
_pv
, pg. 9
Page 34

The information in this block only applies to DaqBoard/2000, /2001, and /2005.
Selecting 100 kHz Internal Clock Speed
User’s of DBK12, DBK13, DBK15, DBK19, DBK52, DBK53, or DBK54 need to select
100 kHz internal clock speed as discussed below.
In the Configure Systems
Hardware window, after
selecting DBK12, DBK13,
DBK15, DBK19, DBK52,
DBK53, or DBK54 you will
need to select an internal
clock speed of
100 kHz.
To select an “Internal Clock Speed” of 100 kHz:
(1) Select the Acquisition Setup tab on DaqView’s main window.
(2) On the lower left corner of the window, under Scan Configuration,
click the Preferences button.
The Advanced Options window will appear (following figure).
Note: The Advanced Options box can also be accessed from the
Windows pull-down menu.
Continuing with the “Tour of DaqView”…
Select the Channel Readings button. If in the Simulated Instrument mode, the Reading
column of the Analog & Scanned Digital Inputs spreadsheet will display simulated data.
Selecting the Channel Readings button again will freeze the Reading column’s display.
If working hardware is connected, the readings will quantify actual signals.
To acquire data to a file, press the Acquire button. For simulated hardware, you will be
prompted to enable a manual trigger. Binary data is acquired to a file (with default name
of daqv.bin).
To view the PostView data, click the View File Data button.
Refer to the PostView module for detailed information regarding PostView.
(3) Under “Internal Clock Speed,”
select 100 kHz.
(4) Click the OK button to return to
DaqView’s main window.
This completes the clock setting
procedure.
DaqView
, pg. 10
_pv
04-24-01
Document Module
Page 35

Channel Setup
The Channel Setup window (first tab on lower portion of main window) displays the analog and scanned
digital input channels and allows you to configure them. Each row shows a single channel and its
configuration. The number of rows may vary, but each row has seven columns. Some columns allow blocks
of cells to be altered at the same time (clicking a column header can select the entire column). Other
columns allow only a single cell to change. The table summarizes the function of each column.
Channel Setup Tab Selected
Document Module
04-24-01
DaqView
_pv
, pg. 11
Page 36

Channel Setup Window
Column Description
CH
The channel number (cannot be changed from this window). This number includes the main channel
number and the expansion board number and channel (if used). Expansion channels are configured
using the Hardware Configuration window described later in this module.
On
Type
Polarity
Label
Units
This column allows you to select whether data will be collected from that channel. When a cell or
block of cells in this column is selected, a selection box will appear that allows “Yes” to enable or
“No” to disable the channel. Double-clicking a cell in this column will toggle the channel status. The
Edit menu allows you to Make All Channels Active or Make All Channels Inactive.
This column allows you to set the gain or input type for each channel. The gains and types will vary
among the option cards. A block of cells in this column can be selected for multiple channels with
the same type of option card. Double-clicking a cell will select the next available gain or type.
Note: If one of the P3 counters is active in the scan, and Type is selected for frequency
measurement, low frequency input signals will require a slow scan rate setting for accurate
measurement. For example, for a frequency of 200 Hz, set the Scan Rate (in the Acquisition Setup
window) for 1 scan per second or 6 scans per minute.
This column shows the channel polarity (unipolar or bipolar) for each channel. The polarity can be
programmed here on a per channel basis when using a DaqBook/200, /216, /260 and any DaqBoard
[ISA or PCI type], or a DBK15 Universal Current/Voltage expansion card. When using any other
Daq*s, this column is set in the Hardware Setup window. For selected cells that can be changed, a
selection box will display “Unipolar” or “Bipolar”. Double-clicking in a cell will toggle the polarity. If
the hardware cannot program the polarity, no selection box will be displayed.
This column contains a descriptive name for the input channel. The default label is the channel
number, but it can be changed to any 8 characters and must be unique. This label is used when
selecting a channel in the analog trigger and chart selection lists.
This column allows you to change the engineering units of each channel and apply a linear equation
to the Daq data. When a cell or block of cells in this column is selected, the analog input box
displays entry options in a pull-down box. Selecting “mx+b” allows you to define m and b and the
engineering units label. The engineering units will then be displayed in the “Units” column and the
“mx+b” equation will be applied to the reading from the Daq before the reading is displayed or written
to disk. The X in this equation is the voltage read back from the Daq (or degrees Celsius for a
DBK19). For example, if a Daq channel is configured as bipolar and unity (×1) gain, the default
voltage would be ±5 V. This corresponds to an m of 1, a b of 0, and a unit of V. V can be changed
to millivolts by setting m to 1000 and units to mV. The Units column can also be used to perform a
software calibration of the Daq. This is done by reading known inputs at two different points of the
input voltage range (usually at 0 and full-scale) and solving the equation y = mx + b. The full-scale
voltage, which changes according to the gain of the channel, is 5 V/gain for bipolar channels and 10
V/gain for unipolar channels.
DaqView
, pg. 12
_pv
Reading
This column displays the device’s analog or scanned digital input readings. This column cannot be
altered by the user and is enabled by selecting Enable Input Reading Column under the Data menu
or by selecting “Start/Stop All Indicators” under the window menu. This column will update the
readings as fast as the computer will allow. The spreadsheet cannot be altered while the input
reading column is enabled.
04-24-01
Document Module
Page 37

Acquisition Setup
Selecting the second tab of the main window displays the Acquisition Setup window. The four main parts of
this window include setup parameters for triggering and configuring the scan. These settings will be used
when an acquisition to disk is started by selecting “Acquire” (last item on the toolbar). When the trigger is
satisfied, the scans are collected at the selected scan frequency and stored to disk in the designated file.
Acquisition Tab Selected
Acquisition Setup Window
Parameter Description
Pre-Trigger
Trigger Event
These 6 triggers
apply only to
DaqBoard/2000
Series Boards
The number of scans to acquire before the trigger event.
Selects the trigger source, depending on the device. Possible trigger sources include:
Immediately – arms and executes the trigger immediately.
Key Hit – arms the acquisition and waits for the user to press a key.
External TTL Rising/Falling – waits for a rising or falling edge slope on P1-25.
Hardware Rising/Falling Edge – monitors value with hysteresis on selected channel; triggers
when parameter is satisfied.
External TTL High/Low – waits for a TTL high or low level on pin 25 of connector P1.
Hardware Above/Below Level – monitors value on selected channel; triggers when parameter is
satisfied.
Above/Below Level – monitors value on selected channel; triggers when parameter is satisfied.
Rising/Falling Edge – monitors value with hysteresis on selected channel; triggers when
parameter is satisfied.
Inside/Outside Window – monitors upper and lower values on selected channel; triggers when
parameters are satisfied.
Digital Pattern – monitors 8-bit pattern on selected digital input channel; triggers when
parameters (less/greater than or equal to/not equal to) are satisfied.
Document Module
04-24-01
DaqView
_pv
, pg. 13
Page 38

Stop Event
These 4 Stop
Events apply
only to
DaqBoard/2000
Series Boards
Scan Configuration
Selects the event that stops the scanning, depending on the device connected. Possible
sources include:
Number of Scans - can range from 1 to 100,000,000. A scan includes all of the channels that
are marked as “On” in the Analog & Scanned Digital Inputs spreadsheet.
Key Hit – stops acquisition when the user presses a key.
Above/Below Level – monitors value on selected channel; stops scan when parameter is
satisfied.
Rising/Falling Edge – monitors value with hysteresis on the selected channel; stops the scan
when the parameter is satisfied.
Inside/Outside Window – monitors upper and lower values on selected channel; stops scan
when parameters are satisfied.
Digital Pattern – monitors 8-bit pattern on selected digital input channel; stops scan when
parameters (less/greater than or equal to/not equal to) are satisfied.
Clock Source Selects the device’s internal clock or an external, user-supplied clock. The Preferences button
brings up a Preferences box the following options:
Internal Clock Speed - For DaqBoard/2000 series boards, the default setting is 200 kHz. Note
that the use of certain DBK cards requires a setting of 100 kHz, as discussed elsewhere in this
manual. (For DaqBoard/2000 Series Only).
Pacer Clock – Enable or disable a pacer clock. (For DaqBoard/2000 Series Only).
File Conversion – Enable or disable a “delete Raw Binary files” notice.
Calibration Table – Select Factory or User calibration table. (For DaqBoard/2000 Series Only).
Calibration File – Included on a separate disk, the calibration file fine tunes the accuracy of the
device. Read the readme.txt file on the disk for more information.
Zero Offset Adjustment –Protects against drift
Channel Display –Enables the expansion option type in the channel list.
The following sections
of the “Preferences” box
apply only to the
DaqBoard/2000 Series
Boards:
• Internal Clock Speed
• Pacer Clock
• Calibration Table
Zero Offset Adjustment
applies only to DBK19,
DBK52, and TempBook
Preferences Box
Scan Rate
The scan frequency can be set in units of seconds, milliseconds, minutes, or hours via a pulldown box. Typing into the numeric field changes the rate. The maximum scan frequency is
dependent on the number of channels that are enabled and whether or not averaging is
enabled. Enabling more channels or averaging will lower the maximum scan frequency.
DaqView
, pg. 14
_pv
Averaging
The checkbox allows averaging of the analog input data to be enabled or disabled. Averaging
can be used to increase the effective accuracy of a noisy signal. Averaging will increase the
actual scan frequency and number of scans, but the perceived scan frequency and number of
scans (which is set by DaqView) does not change.
Note: These parameters cannot be altered during an acquisition.
04-24-01
Document Module
Page 39

Data Destination
Selecting the third tab of the main window displays the Data Destination window. The two parts of this
window let you designate the directory for acquired data and the desired file formats.
Data Destination Tab Selected
Data Destination Window
Parameter Description
Data Destination
Data File Name Acquired data is saved to this file name. This file always has a “.bin” file extension.
Base Directory This is the directory from which other directories are created to store the converted and
Auto Re-Arm
Binary Data and Selected Format File List
File Conversion
Preferences
acquired data. You can type in changes or use the Browse button to direct files elsewhere,
including other disk drives.
With the Enable Auto Re-Arm box checked, you can specify when file conversions are
performed and the sequence range of incrementing file names.
This button lets you select the format of saved data. Selections include: DIAdem, ASCII text,
DADiSP, DASYLab, MATLAB, PostView Binary, and Snap-Master Binary. The tree shows
where the various formatted files will be saved on disk.
The graphic display shows the directories and files created during acquisition. Double-clicking
a directory brings up Windows Explorer. Double-clicking a file brings up any program
associated with the file type.
Document Module
04-24-01
DaqView
_pv
, pg. 15
Page 40

Pull-Down Menus
Some (but not all) items in the pull-down menu can also be enabled from the toolbar. Their description in
the toolbar section is more detailed than presented in this section.
File
New Set all parameters to their startup, default setting.
Open Set all parameters as directed by a specified setup file.
Save Save the existing configuration for later recall (overwrites the existing version).
Save As Saves the existing configuration for later recall; asks whether to overwrite the original
Authorization Displays the Authorization window for entering the Authorization Code.
Exit
Edit
Hide Inactive
Channels
Show All Channels This command shows all channels, whether turned on or off.
Make All Channels
Inactive
Make All Channels
Active
Fill Down
F8
File Menu Items and Descriptions
version or save under a new filename.
Leave the DaqView program.
Edit Menu Items and Descriptions
This command collapses the spreadsheet to show only those channels that are turned on.
It can be selected repeatedly as needed.
This command places a “No” in the On field of all channels. To scan only a few channels it
may be easier to make all channels inactive, then turn on the desired channels.
This command places a “Yes” in the On field of all of the channels.
For multiple cells selected within a column, this command copies the value in the top cell to
all the cells below.
Data
Data Menu Items and Descriptions
Acquire This command arms the hardware for an acquisition to disk. When the trigger is satisfied,
Convert Existing
Files
Enable Input
Reading Column
the acquisition begins. All of the interactive I/O controls are disabled while the system is
armed. No acquisition parameters can be altered at this time.
During an acquisition, a raw binary file is created and updated as data is read. This
command lets you convert raw binary files to the selected formats. This allows you to
convert files that may not have been converted when the data was acquired.
This command reads the analog inputs and scanned digital inputs and puts the numeric
values in the spreadsheet in the “Reading” column. If the Reading column is already
enabled, this command disables it.
DaqView
, pg. 16
_pv
04-24-01
Document Module
Page 41

Window
Window Menu Items and Descriptions
Charts Displays the charts window.
Bar Graph Meters Displays a bar graph meter.
Analog Meters Displays an analog dial meter.
Digital Meters Displays a digital meter.
Start All Indicators Starts displaying data in the Reading column and any open Chart or meters window.
Stop All Indicators Stops displaying data in the Reading column and any open Chart or meters window.
View File Data Launches the PostView data analysis application.
Analog Output Displays the analog output window. Does not apply to TempBook.
Digital I/O Displays the digital I/O window. Does not apply to TempBook.
Counter/Timer Displays the counter/timer window. Does not apply to TempBook.
Waveform &
Pattern Output
Preferences Displays a preferences box that shows user-selectable options the particular Device
Displays the arbitrary waveform and streamed output windows.
Does not apply to TempBook.
model may have. For example, with a DaqBoard/2001, the following preferences
can be set.
Device
Select Device
Note that for DaqBoard/2000 series boards, internal clock speed can be set to
to 200 kHz (default) or 100 kHz. However, the use of certain DBK cards requires
a setting of 100 kHz, as discussed elsewhere in this manual.
The Pacer Clock checkbox lets you enable a clock output.
Device Menu Items and Descriptions
Provides a means to select an actual connected device, or a simulated instrument.
Document Module
04-24-01
DaqView
_pv
, pg. 17
Page 42

Configure
Hardware
Settings
Opens the Configure System Hardware window that lets you tell the software how the hardware
is set up. Setup sections include: Analog I/O Option Cards (DBKs), Digital Option Cards,
A/D Input Polarity, A/D Signal Reference, and D/A External Reference.
Options that do not apply to a particular device will be grayed-out when applicable.
Configure System Hardware
Help
The Analog I/O Option Cards section lets you assign DBK expansion cards to the 16 analog
input channels. If no expansion cards are added, leave the default value (Direct Signal
Connection) on all 16 channels. As expansion cards are added, this window must be
updated.
Selecting a DBK expansion board will add channels in the main window’s Analog & Scanned
Digital Inputs spreadsheet. Channels associated with DBK expansion boards will also have
their own gains or modes to choose from in the analog input spreadsheet. If needed, a dialog
box will appear and allow you to set sub-channel addresses or other parameters.
If using the DaqBook/100, DaqBook/112 orDaqBook/120, set the radio buttons for Single-
Ended or Differential and Bipolar or Unipolar to match the settings of the corresponding
hardware jumpers (the default hardware settings are Single-Ended and Bipolar). When
Differential is selected, only 8 analog inputs are available. When analog expansion boards
are connected, set the Daq for Single-Ended.
If using the DaqBook/100, DaqBook/200, DaqBook/260, DaqBoard/100A, DaqBoard/200A, or
DaqBoard/2000, the Digital Option Cards section lets you configure the digital I/O hardware.
If no DBK20 digital expansion boards are connected, three 8-bit I/O ports are accessible from
the main window. Six additional 8-bit ports are made available in the main window for each
DBK20 added.
Make sure this window is kept updated for the actual hardware used.
User’s of DBK12, DBK13, DBK15, DBK19, DBK52, DBK53, or DBK54 need to
select 100 kHz internal clock speed as discussed on page 10 of this document
module.
Session Status
Displays the currently selected device, its alias, and whether DaqView can recognize it.
The Help menu provides access to the on-line Help file.
About provides the current software version number.
DaqView
, pg. 18
_pv
04-24-01
Document Module
Page 43

Toolbar Items
Main Window Buttons
Each item in the main window toolbar has its own icon and is accessible from the pull-down menu. Placing
the cursor on the icon and clicking the mouse button enables the tool or opens the corresponding window.
When a function does not apply to a particular board, the toolbar button will be grayed-out. The beginning
of this chapter includes toolbar screen shots for each of the DaqBoard/2000 Series boards.
Note: Functions 8, 9, 10, and 11 do not apply to TempBook.
Item#Item Description
1 Charts Displays the DaqView Channel Display window.
2 Bar Graph
Meters
3 Analog Meters Displays an analog dial meter.
4 Digital Meters Displays a digital meter.
5 Start All
Indicators
6 Stop All
Indicators
7 View File Data Launches PostView, an independent post-data acquisition program, if installed. It allows
8 Analog Output Displays the Analog Output window of the two DAC channels.
9 Digital I/O Displays the Digital I/O window. Does not apply to TempBook.
10 Counter/Timer Displays the Counter/Timer window. Does not apply to TempBook.
11 Waveform &
Pattern
Output
12 Acquire Activates an acquisition of data to a file.
Main Window Toolbar Items
Displays a bar graph meter.
Starts displaying data in the Reading column and any open Chart or Meters window.
Stops displaying data in the Reading column and any open Chart or Meters window.
you to manage and view data acquired by DaqView. Refer to the PostView module for
details.
Does not apply to TempBook.
Displays the Arbitrary W aveform and Streamed Output windows.
Does not apply to TempBook.
Channel Setup Buttons
Show All Channels, Hide Inactive Channels
These toolbar buttons collapse or expand the Analog & Scanned Digital Inputs spreadsheet to show all
channels, whether active or not, or to hide those that are inactive. These commands are also available from
the Edit pull-down menu.
Turn All Visible Channels On, Turn All Visible Channels Off
These toolbar buttons can turn all the channels ON or OFF at a single stroke. This feature is convenient
during setup and troubleshooting or if only 1 or 2 channels must be set differently from the rest. Both these
commands are also available from the Edit pull-down menu as Make All Channels Active and Make All
Channels Inactive.
Channel Readings
This toolbar item enables/disables the Reading column of the Analog and Scanned Digital Input spreadsheet
to provide a numeric view of incoming data. This function toggles on and off when the button is repeatedly
selected. Some windows require the Reading column to be disabled while changing channels or other
parameters. This command is available from the Data pull-down menu as Enable Input Reading Column.
Document Module
04-24-01
DaqView
_pv
, pg. 19
Page 44

Charts and Meters Buttons
Additional tool icons in charts and meters include the following (DaqViewXL and PostView have more tool
icons described later):
Button Display Windows
Charts
This toolbar item displays real-time data in
a strip-chart format for several channels on
the DaqView Channel Display window.
Charts are enabled by selecting the
triangular “Play” button on the top left (see
figure). Before “playing”, at least one
chart must be assigned to an active channel
through the drop-down list on the right side
of the chart. For the selected channel, you
can change the minimum and maximum
values as needed. This command can also
be enabled from the Window pull-down
menu.
Data is read and displayed in the charts,
meters, and Readings column as fast as the
computer will allow. When an acquisition
to disk has begun using the Acquire
command, the charts, meters, and the
Reading column take a lower priority,
updating only when there is time in the
acquisition-to-disk task. Thus, the data
seen in the charts may not be the same as
on the disk. As the scan rate is increased,
the acquisition-to-disk task will take up
more processor time and the charts will be
unable to keep up.
DaqView Display Charts
DaqView
, pg. 20
_pv
04-24-01
Document Module
Page 45

Bar Graph Meters
Selecting the Bar Graph Meter icon brings up
the Bar Graph window to display several
channels in bar graph format. To activate the
display, select the Start button on the left side
of the toolbar (or Start All Indicators in the
pull-down menu or in the toolbar). You can
vary the number of channels displayed by
selecting the input box at the end of the
toolbar. The Grid tool (next to last item on
toolbar) is used to arrange the display for
convenient reading. The pushpin icon in the
center of the toolbar locks this window on
top of other windows until you unlock it by
selecting the pushpin again. Right-click on a
meter to bring up an option menu.
Analog Meters
Selecting the Analog Meter icon brings up
the Analog Meters window to display several
channels in a dial/gage format. To activate
the display, select the Start button on the left
side of the toolbar (or Start All Indicators in
the pull-down menu or in the toolbar). You
can vary the number of channels displayed by
selecting the input box at the end of the
toolbar. The Grid tool (next to last item on
toolbar) is used to arrange the display for
convenient reading. The pushpin icon in the
center of the toolbar locks this window on
top of other windows until you unlock it by
selecting the pushpin again. Right-click on a
meter to bring up an option menu.
Bar Graph Window
Digital Meters
Document Module
Selecting the Digital Meters icon brings up
the Digital Meters window to display several
channels in numeric format. To activate the
display, select the Start button on the left side
of the toolbar (or Start All Indicators in the
pull-down menu or in the toolbar). You can
vary the number of channels displayed by
selecting the input box at the end of the
toolbar. The Grid tool (next to last item on
toolbar) is used to arrange the display for
convenient reading. The pushpin icon in the
center of the toolbar locks this window on
top of other windows until you unlock it by
selecting the pushpin again. Right-click on a
meter to bring up an option menu.
04-24-01
Analog Meters Window
Digital Meters Window
DaqView
_pv
, pg. 21
Page 46

Properties of Meter Windows
The meter windows simulate the look of 3 popular meter types: the bar graph, the analog dial, and the
digital readout. Within each meter type, you can adjust their display properties to fit your needs. While in
the meter window, place the cursor in the display area and click the right mouse button; then select
Properties. A Properties window will appear and allow you to:
• Scale - set the high and low points and the format (number of decimal places)
•
Limits - set the high and low points and whether to display these limits
• Misc - set option to show the Trend Indicator and/or the Peak Hold Indicators.
Start (or Stop) All Indicators
These buttons use the same icons as many CD players (right-pointing triangle for start; square for stop). To
change some parameters, you may have to stop the data display. The Start and Stop All Indicators buttons
affect several windows if open, including: Reading column, Charts, Bar Graph Meters, Analog Meters, and
Digital Meters.
Note: You can start or stop any of these active windows separately using their own Start, Stop (or Pause)
buttons.
Analog Output Window
Note: This feature is not used by
TempBook.
The analog output window provides
interactive access to the two analog outputs
on the DaqBoard/2000. When set to the
default internal reference, these outputs can
be set from 0 to +10 VDC for the
DaqBoard/2000.
The output voltage can be with the slide
control, or by placing the cursor in the
numeric field and entering a valid voltage
value. Selecting the Execute button sends
the voltage values to the outputs.
DaqView
, pg. 22
_pv
Two versions of this window exist. If a
DBK2 or DBK5 (see Note 1) is active in the
Analog & Scanned Digital Input
spreadsheet, the window will accommodate
voltage and current output in addition to the
DAC reference.
Note 1: DBK2 and DBK5 cannot be used
with DaqBoard/2002, /2003, or
/2004.
Analog Output Window (with and without DBK2 & DBK5
Note 2: This window is not available when the arbitrary waveform window is visible.
04-24-01
)
Document Module
Page 47

Digital I/O Windows
Note: This feature is not used by TempBook.
For:
DaqBook/100, /200, /260
DaqBoard/100A, /200A
DaqBoard/2000, /2001, /2002, and /2004
Asynchronous Digital I/O Window –
P2 Digital I/O Tab Selected
The digital I/O windows are displayed when the Digital I/O button on the main window is selected. These
windows provide interactive control of all configured digital I/O ports (as configured in the Configure
System Hardware window). The base unit has the three 8-bit ports of P2 that can be configured as either
inputs or outputs. If high-speed digital I/O is supported (on connector P3), a second window is available
for configuring inputs and outputs. Up to twenty 8-bit ports can be accessed when expansion boards are
added. When the Execute button is pressed, all ports configured as outputs will be updated and all input
ports will be read.
Counter/Timer Window
Note: This feature is not used by TempBook.
The Counter/Timer function is used by DaqBoard/2000 Series Boards (except /2003):
Two C/T modes are available for the DaqBoard/2000 Series Boards (excluding the /2003 board).
• Totalize Input – Counts rising or
falling edges of signals from the
related pin on P3 adapter. Each
channel has its own Reset button.
Asynchronous Digital I/O Window –
P3 HS (High Speed) Digital I/O Tab Selected
Document Module
• Square Wave Generator Output
– Outputs a square wave on each of
2 channels with a selectable
frequency and duty cycle.
Note: When using DaqBoard/2000 Series boards, channels that are enabled in the scan cannot be used
from the asynchronous counter/timer window.
04-24-01
DaqView
_pv
, pg. 23
Page 48

Waveform & Digital Pattern Output Window
Note: This feature is not used by TempBook.
Note: This window can not be used with DaqBoard/2002 or DaqBoard/2005,
as these two boards have no DACs.
Unlike the DaqBook, the DaqBoard has a
waveform mode for its analog output
channels. DaqView allows the DaqBoard
DACs to be configured in interactive mode
or waveform mode.
With a DaqBoard, both the Analog
Waveform and Streaming Output tabs are
enabled.
•
Selecting the Analog Waveform tab
accesses the standard analog output
window for both DaqBoard and
DaqBook (see previous section).
•
Selecting the Streaming Output tab
accesses the arbitrary waveform
window.
Note: This window is not available when
the analog output window is visible.
The following material identifies the
functions of various buttons and regions of
the window. Refer to the screen shot at the
right as needed.
Waveform and Digital Pattern Output Window –
Analog Waveform Tab Selected
In the Waveform Type box, you can select a standard function generator waveform (sine, square, triangle,
sawtooth) or a freehand drawing. In Freehand, move the mouse to the waveform window and draw a
waveform using the left mouse button.
The Save Waves button allows you to save the values of each displayed waveform to disk in an ASCII
format. The files created are compatible with spreadsheets and word processors, allowing you to
numerically inspect and/or alter the saved waveforms.
Sample Waveform File Format Examples
One Channel Two Channels
2043<CR> 2432<TAB>293<CR>
1019<CR> 394<TAB>345<CR>
300<CR> 2934<TAB>3456<CR>
923<CR> 743<TAB>875 <CR>
In the two-channel example (to the immediate
left), the entry preceding the <TAB> is for
the first channel and the entry after the TAB is
for the second channel.
The Load Waves button reads any ASCII file of numbers up to the number of points specified in the
Updates per Channel field.
DaqView
, pg. 24
_pv
04-24-01
Document Module
Page 49

The Copy Waves and Paste Waves buttons use the system clipboard to post and receive waveform data
from all DAC channels. The data formats are identical to the Save and Load operations. Copy and Paste are
recommended for use with spreadsheets to numerically inspect and/or modify waveforms. Waveforms can
also be copied and pasted from the popup menu that is displayed when the mouse is right clicked over the
Waveform display. The waveform selected in the DAC selection listbox is the target of the Cut or Paste.
If multiple channels of data are on the clipboard, you can select the one that you want to paste into the
selected DAC channel.
The size of the memory buffer allocated for each DAC channel is determined by the number of updates that
you specify. Different Daq devices have different limits on the maximum updates that can be specified.
You can select one of three clock sources to pace the DAC output. The three options are as follows:
• DAC Pacer with a rate set in the Sample Update Rate field. When using the DAC pacer, the Update
Rate field controls the speed at which the DAC is updated.
• Acq Pacer, the clock used by the analog input section of the DaqBoard. Using the Acq pacer clock
synchronizes the update of the DAC output with the analog input data collection.
• External TTL. Update rate is controlled by the rate of the clock signal applied to the external input
pin.
Note: If the DAC Pacer clock is selected, you must enter the update rate that paces the DAC outputs.
The selection for the DAC channel for which you want to create a waveform, is made in the DAC selection
listbox,. From the same listbox you can control the channel's output by clicking the checkbox on or off.
Note that DaqBoard/2000, having two DACs allows for two channels to be selected. DaqBoard/2001,
2003, and /2004 have four DACs and allow for up to 4 DAC analog output channels to be selected.
In the Waveform selection box, you can select a standard function generator waveform (sine, square,
triangle, sawtooth) or an arbitrary freehand drawing. In arbitrary mode, move the mouse to the waveform
window and draw a waveform using the left mouse button. The drawn waveform will be loaded into the
channel selected in the DAC channel listbox. You can also create a waveform by right clicking the mouse
with the cursor over the waveform window. Select the waveform type from the resulting popup menu.
Repeat this process for each channel in the DAC selection listbox.
To start the waveforms playing on the DACs, click the Start Waveforms button.
Auto Scale Waveform
DaqView provides an easy method to determine the upper and lower extents of the selected DAC
waveform. Simply right click the mouse over the Waveform display, and select the Auto Scale item from
the popup menu. DaqView scans the waveform for the highest and lowest values, then sets the upper and
lower waveform range fields to these values. This causes the waveform to be displayed full scale within
the waveform display.
This is useful if the waveform is off scale on the high or low end (indicated by the range input field color set
to red) and you want to bring it back to a full scale view.
Auto Fit Waveform
The DaqView Auto Fit feature is similar to Auto Scale. However, Auto Fit causes the data to be re-scaled
so it fits full scale in the range defined by the values in the upper and lower range input fields.
Note: For some Daq hardware, when hardware triggering has been selected to trigger an acquisition, DAC1
is used internally to supply the desired threshold voltage. In this case, CH 1 is not available for
waveform output. The Copy Waves and Paste Waves buttons use the system clipboard to post and
receive waveform data. The data formats are identical to the Save and Load operations. Copy and
Paste are recommended for use with spreadsheets to numerically inspect and/or modify waveforms.
To start the waveforms playing on the DACs, click the Start Waveforms button.
Note: When the analog input section is set for analog input triggering, DAC1 is used internally to supply the
desired threshold voltage. In this case, DAC1 is not available for waveform output.
Document Module
04-24-01
DaqView
_pv
, pg. 25
Page 50

For DaqBoard/2000, /2001, /2003, and /2004 only:
Selecting the Streaming Output tab brings
up the window to configure continuous
streamed output via one or more DACs, or
digital outputs via the P3 16-bit port.
•
Analog or digital output is chosen
from the Data Selection section of the
Streamed Output window.
• The Data Source section selects the
file name and type (ASCII or binary).
• Within the Output Control section, you
can select to send all samples or a
portion, and whether to continuously
repeat or stop after a specified count.
• The clock source can be an internal or
external DAC clock, or an internal or
external pacer clock.
• The Start button initiates a streamed
output.
Acquire
The Acquire selection activates an acquisition of data to file. The Event option under the Trigger Setup
portion of the Main window determines when the Acquire process is initiated. The Event selections are
detailed in the Acquisition Setup section of this chapter. After Acquire is selected, the process is automatic
beginning with the DaqView Armed screen. This screen posts the Trigger Armed time as well as the
Trigger Event information. The Acquire process makes use of the Data File Setup parameters to format
data collection.
Once the Trigger Event occurs, the DaqView Triggered screen appears. This screen allows you to witness
the data sampling parameters you set in the Main window prior to initiating the Acquire process as well as
the progress of the data acquisition.
If file conversion is selected, the Acquire process concludes by converting the generated .BIN file from
binary to ASCII data. The resulting file is saved under a user-specified directory and file name or as a
default under the DaqView subdirectory as DAQV.TXT. This .TXT file is available for data processing or
analysis by various software packages such as DaqViewXL.
DaqView
, pg. 26
_pv
04-24-01
Document Module
Page 51

DaqViewXL
Overview
Overview ……1
Program Requirements ……1
Installation of DaqViewXL Software ……2
Basic Function of DaqViewXL ……2
Configuring an Acquisition ……3
Data Header ……3
Hints and Tips for DaqViewXL ……4
DaqViewXL is a Microsoft Excel add-in that provides complete setup and data acquisition within Excel
under Windows 95, 98, ME, NT, or 2000. Acquired data is immediately placed in an active spreadsheet,
updating cells and graphics. Data is then analyzed and graphically displayed. DaqViewXL:
• Augments Microsoft’s Excel spreadsheet software with data acquisition capability
• Provides strip-chart graphics for real-time data display
• Automatically converts data to engineering units
Once DaqViewXL is installed within Excel, the spreadsheet provides a toolbar that contains all the data
acquisition controls. This DaqViewXL tool bar (also accessible from Excel’s menu) can enable all
configuration and data acquisition tasks. The features of Excel and DaqView are seamlessly combined to
form a powerful data acquisition solution.
DaqViewXL performs like DaqView despite a slightly different user-interface. To set up your data
acquisition system, you just click on the Configure button in the Excel tool bar. DaqViewXL’s main
window appears with all of the controls required to configure data acquisition including setting up input and
output channels on an easy-to-use grid. Each column of the channel-configuration grid corresponds to
specific parameters in the data acquisition system and allows you to set these parameters on a per-channel
basis.
DaqViewXL can be enabled for a 30-day trial
period by pressing the “Evaluation” button in the
product registration dialog.
The ability to run DaqViewXL can be verified by
checking the option status in DaqView’s “About”
dialog.
You can obtain automated reports by taking advantage of the Software Components concept. For example,
you can embed an Excel spreadsheet object into a Word document. When the spreadsheet object is
activated, it gives you access to DaqViewXL. In this case, the Word document holds all text, as well as an
embedded Excel spreadsheet object that holds raw and calculated data and graphics. Double-clicking on
the Excel object in Word can access DaqViewXL to efficiently prepare a statistical report. This compound
document allows you to collect, configure, analyze, graph, and annotate data with a few clicks of a mouse
button.
Program Requirements
DaqViewXL requires the following software:
•
IOtech DaqBook/DaqBoard Series driver version 5 or later.
Installed components must include DaqView version 7.7.25 or later.
•
Microsoft Excel 97 or later
• Microsoft Windows Operating System (Windows 95, 98, ME, NT, or 2000)
Document Module
04-24-01
DaqViewXL, pg.1
Page 52

Installation of DaqViewXL Software
DaqViewXL is an option in DaqView that can be enabled by entering an appropriate authorization code
into DaqView’s product registration dialog. DaqViewXL can also be enabled for a 30-day trial period by
pressing the “Evaluation” button in the same dialog.
The ability to run DaqViewXL can be verified by checking the option status in DaqView’s “About” dialog.
To run DaqViewXL, simply start Excel and open the Daqviewxl.xls macro. You may be prompted about
the workbook containing macros. This is OK. The DaqViewXL file uses Excel macros to communicate with
DaqView. Click the “Enable macros” button to continue.
To enable the DaqViewXL toolbar, click View-Toolbars-DaqViewXL. You can position this toolbar just
like any other Excel toolbar.
Basic Function of DaqViewXL
DaqViewXL performs much like the standard DaqView. With Excel’s macro capabilities, you can tailor
DaqViewXL to meet various requirements. Your knowledge of Excel will help you use all its tools for
better data acquisition and processing. The following sections give you the basics of how DaqViewXL can
organize and analyze your data. These basic ideas will give you the ability to explore all DaqViewXL has
to offer. The discussion mirrors previous sections and highlights the differences between DaqViewXL and
DaqView. The Hints and Tips section gives you tools and suggestions to improve your productivity with
DaqViewXL.
DaqViewXL, pg.2
DaqViewXL Toolbar and Displays
04-24-01
Document Module
Page 53

Configuring an Acquisition
After installing DaqViewXL and entering Excel, click the Configure... icon (first in the DaqViewXL
toolbar) to set up your system. This launches DaqViewXL’s main screen (see following figure). This
screen is slightly different from the stand-alone version shown at the beginning of the chapter.
(Specifically, DaqViewXL does not have a PostView or DIAdem button—Excel performs those functions
better. Also, the Go button is now the 2nd button on the toolbar window rather than the main screen.) The
earlier discussion of DaqView configuration still applies.
Data Header
DaqView Screen Within Excel
DaqViewXL’s optional data header supplies the global acquisition parameters and the configuration of each
channel and places this information directly in the spreadsheet along with acquired data. This information
includes channel gain or thermocouple type, bipolar/unipolar setting, units, and channel label. To activate
Data Headers select the Use Data Headers icon in the DaqViewXL toolbar.
Document Module
DaqViewXL Data Header
04-24-01
DaqViewXL, pg.3
Page 54

Hints and Tips for using DaqViewXL
• Do not run DaqView first and then try to use DaqViewXL. When DaqViewXL runs, DaqView is put into a
special "server" mode which supports transactions with "client" applications such as Excel. Normally
DaqView does not run in this mode and cannot support DaqViewXL.
• When you acquire data into a worksheet, some of the data may be displayed as a string of hash marks
(e.g. ######). Excel will do this whenever the column is not wide enough to display all the digits of a
number. To eliminate the hash marks, just widen the column. An easy way to do this is to use the
"Format, Column, Auto Fit Selection" menu command. Immediately after an acquisition, all the rows and
columns of data are selected. Click this menu item to automatically fit all the columns to the new data.
•
You can start an acquisition from an Excel macro as shown in the following VBA macro code example:
Sub Macro1()
Application.Run Macro:="menuGoDoIt"
End Sub
This is equivalent to clicking the Go! button on the DaqViewXL toolbar. It arms the hardware for an
acquisition, and if DaqView is set up to trigger on "External TTL" or "Channel Value", the acquisition will
take place automatically when the trigger condition is met. For acquisitions configured to trigger on a "Key
Hit", the acquisition will not start until the user presses the "Manual Trigger" button on the "DaqView
Armed" dialog box.
To automatically press this button after arming DaqView use the following macro:
Sub ArmAndKeyHit()
Application.Run Macro:="menuGoDoIt" 'presses the Go! button
SendKeys "{ENTER}" 'presses the space bar
End Sub
This macro will start a "Key Hit" acquisition immediately.
Note: Macro1, shown above, was generated by Excel's macro recorder.
•
If you chose to customize DaqViewXL’s toolbar, you should avoid removing buttons. If DaqViewXL
detects missing buttons it will prompt you to allow it to remove the toolbar and recreate it with all buttons.
You can decline to do so, but DaqViewXL will continue to ask you to recreate the toolbar each time it
starts-up. You can add buttons, rearrange them, and re-size the toolbar without getting this prompt.
• If DaqView cannot connect to your hardware on start-up, it will automatically switch to the Simulated
Instrument mode when loaded from DaqViewXL.
DaqViewXL, pg.4
04-24-01
Document Module
Page 55

PostView
For use with 16-Bit and 32-Bit Product Support
Introduction ……2
Starting PostView ……3
Toolbar ……4
Channel Information Region ……5
Menu Items ……6
Understanding Groups, Charts, and Channels ……7
Chart Setup Wizard ……7
Introduction ……7
Automatic Display Creation ……8
Display Configuration ……9
Editing a Display ……10
Manually Creating a Display ……12
PostView Timebase ……15
Data File Accessibility
The 32-Bit PostView post-data-acquisition software supports several programs, including: ChartView,
DaqView, LogView, Personal DaqView, TempView, and WaveView. These six acquisition programs create
data files that can be viewed and analyzed in PostView after the acquisition has been completed.
PostView makes use of ASCII (
programs create the data files in raw binary format (
.txt) or PostView Binary (.iot) files. However, most acquisition
.bin
) during the acquisition. For these programs, a
conversion of the file format must be completed before PostView can access the data. A further explanation
follows:
• Personal DaqView, DaqView, LogView, and WaveView create raw binary (
.bin) formatted
files during the data acquisition. After the acquisition is complete, these programs convert the
.bin formats to .iot or .txt formats (as determined by the user). PostView can then
access the re-formatted data.
•
ChartView and TempView create
.iot or .txt formatted data files during the acquisition.
Since PostView makes direct use of these formats, charts can be updated in “real-time” while
the acquisition is in progress.
Reference Note: Refer to PostView's Help file for data file information relating to specific
data acquisition programs. Note that some data acquisition programs can convert data
formats to
.sma format for Snap-Master or .dat for DADiSP.
PostView Document Module
04-23-01
PostView, pg. 1
Page 56

Introduction
PostView is an independent program that allows you to view waveforms recorded by various data
acquisition programs. As the data file is being created, a descriptor file used by PostView is also created.
PostView Control Options
= Mouse, Ú= Arrow Keypads , = PageUp/PageDown Keypads
1 Group Select
2 Open
3Print
4 Setup
5 Zoom Out
6 Zoom In
7 AutoScale
8 Show Grid
9 Show Markers
, Ú
,
or Ctrl+O
, or
, or
,
Ctrl+G
,
Ctrl+K
,
or
Ctrl+P
Ctrl+S
12 Multiply (x2)
13 Value at Marker
14 Offset
15 Units/Division
16 Chart Min. Scale
17
18 Time Stamp
19 Scroll
20 Access Chart Setup
1
2
2
Value
Divide (÷2)
2
2
2
, or [
spacebar
-------------
, Ú, or
, Ú, or
type-in
type-in
Setup Dialog Box
2
, or [
spacebar
Hours: mins: seconds. Tenths
Time stamp can be relative or
absolute.
Default is relative time stamp.
Right-click to access
edit menu for selected
chart and channel.
10 Chart Max
Scale Value
11 Channel
Selection
1
Note: For keypad options, first use the Tab key to “tab over” to the desired control item. For example,
2
Setup Dialog Box 21 Number of Samples
2
, or Ú
Displayed
22 Time at Marker Indicates time at marker
Automatic indication of
no. of samples per chart
position.
you can use the tab key to highlight the Group Select (item 1), then use any of the following 3
methods to obtain the desired group: Ctrl+G, keypad arrows, or PageUp/PageDown keys.
2
Note: Items 10 through 17, and item 22 are discussed in the section, PostView Channel Information
Region, page 5 of this document module.
3
Note: Toolbar button functions are discussed on page 4.
4
Note: Ctrl+J will show the software version number.
]
]
PostView, pg. 2
04-23-01
PostView Document Module
Page 57

Starting PostView
The main ways of starting PostView are:
1) Open PostView directly from the Windows Explorer, Desktop Icon, or Start Run browse feature (on
desktop).
2) From the acquisition program’s main window, click on the toolbar’s PostView button.
The toolbar option is not available with TempView.
3) Select PostView from the main acquisition program’s File pull-down menu.
Note: In TempView, PostView is selected from the Windows pull-down menu.
Each of these methods is illustrated in the following figure. Actions in the decision diamond are
performed automatically by PostView and require no user action.
Method 1: Open PostView Directly from Windows Explorer, Desktop Icon, or Start Run browse
Windows Explorer
PostView
Method 2: Open PostView directly from the Data Acquisition Program
File Chart View Acquire Data Window Device Setup
Group 1
Charting
Initia l izi ng
Open PostView from the data acquisition
program by using the button, or by
selecting from the appropriate
pull-down menu.
PV
Charting Buffering in InstrumentDisk
PostView
Open
Data1.iot
Data2.iot
Data3.txt
PostView's File/Open Box
x
Uploading
PostView
OK
Does
Data File
Exist
?
Configuration
1
NO
Does
Display
File Exist
2
?
NO
Open
Data1.iot
Data2.iot
Data3.txt
PostView's
File/Open Box
YES
PostView opens
Chart Setup Wizard
OK
PostView uses
existing Display
Configuration
File (Data1.io#)
Does
Display
Configuration
File Exist
?
PostView uses
YESYES
2
NO
existing Display
Configuration
File (Data1.io#)
PostView opens
Chart Setup Wizard
When you first open PostView the program automatically checks for the existence of an
file (previous figure). If no data file can be found, PostView displays its File Open dialog box so you can
select the desired file. In addition, PostView checks for a Display Configuration File (see Note). If none is
found the File Open dialog box still allows you to select the desired file. In this later case the Chart Setup
Wizard opens, providing a means of setting up a chart display (the number of chart groups, number of
charts per group, channel assignments for each chart, and types of channels).
1
Note: PostView automatically checks for Data Files. These files are recognized by .iot or .txt filename
2
Note: PostView automatically checks for Display Configuration files. These files are automatically
3
Note: Several copies of PostView can be active at the same time; allowing you to view different data files
The Chart Setup Wizard can be started from the PostView’s File pull-down menu. The Chart Setup
Wizard’s use in PostView is discussed on page 7 of this document module.
PostView Document Module
Two Basic Methods of Opening 32-Bit PostView
.iot or .txt data
extensions.
saved when exiting your data acquisition program. These files are recognized by filename
extensions of: .io# (for binary files) and .tx# (for ASCII files).
during the same session. To view a data file from PostView, select Open under PostView’s File
menu, and select the desired data file.
04-23-01
PostView, pg. 3
Page 58

Toolbar
The following table explains PostView toolbar items, while the next page begins a description of PostView
Menu items. Menu and toolbar items are shown in the figure below.
32-Bit PostView, Toolbar Items
Item#Item Description
1 Group Select This feature indicates the chart group, which is being charted. Clicking on the down
2 Open Accesses the Open Data File window.
3 Print Sends PostView chart(s) to an assigned printer.
4 Display
Configuration
5 Zoom Out
(><)
6 Zoom In
(<>)
7 Autoscale Clicking the Auto Scale button adjusts the Y-axis labels so that the waveform fills 90%
Y-axis Adjust The Y-axis Adjust fields show the chart’s minimum and maximum for currently selected
8 Show Grid Places a grid on the chart (s), or removes the grid if already present.
9 Show Markers Each chart contains a cross-hair marker that shows the numerical values of time and
Trigger Event
Marker
Stop Event
Marker
The Scroll Bar at the bottom of the PostView window allows the waveforms to be scrolled right or left in two ways:
) reveals other chart groups configured by the user. To select a different chart
τ
arrow (
group, simply pull down the group list and select the desired group. The group list can
be obtained by any of the following control options: a) clicking the down arrow (
b) using Ctrl + G on the keyboard, c) using the keyboard up or down arrow key, d) using
the page up or page down key. If using a control option other than “a,” you may need to
select the group select box by repeatable pressing the keyboard’s Tab key until the
group select box is selected. When this happens the name of the currently selected
group appears in white on a dark background.
The Display Configuration button accesses a Display Configuration Setup dialog box.
This box will also be displayed if manual setup is selected during use of the Wizard
Chart Setup program. Clicking on the button accesses a Display Configuration Setup
box, which displays the configured structure of the groups, charts, and channels. From
this box you can select the number of charts to be assigned to a specific group. With
the use of the mouse cursor you can also select a chart or channel for additional editing.
Display Configuration is discussed in more detail, immediately after description of the
pull-down menu options.
The Zoom Out button doubles the visible timebase, showing more of the waveform. For
example, if 10 seconds of information is visible, clicking the Zoom Out button will
show 20 seconds.
The Zoom In button halves the visible timebase, showing less of the waveform. For
example, if 10 seconds of information is visible, clicking the Zoom In button will show
5 seconds.
of the chart’s range. Affects all channels of the selected group.
charts in the engineering units shown. Clicking the Auto Scale button automatically
adjusts the Y-axis Adjust fields.
magnitude at its present location in the waveform. The Markers start out at the far left
of every chart, showing the time and magnitude of the first visible point.
Ctrl+Left Mouse Button moves the markers from all the charts in unison.
The Options menu contains a function which allows you to turn markers on and off.
When a check appears in front of this item, its associated indicator is on or visible.
Selecting the menu item toggles the indicator (and the check mark) on and off.
The Trigger Event Marker on the time axis shows the location of the trigger point.
(See figure, PostView TimeBase)
The Stop Event Marker on the time axis shows the location of the stop point.
(See figure, PostView TimeBase)
),
τ
1. When clicked on, the small left and right arrow boxes scroll the waveforms approximately 20%.
2. The plain scroll button shows the relative location of the visible region of the waveforms and can be
dragged along the scroll bar to any location desired.
PostView, pg. 4
04-23-01
PostView Document Module
Page 59

Channel Information Region
By clicking on the up or down arrows (σ, or τ) by the channel selection box (item 11), you can select one
channel (of a maximum of 4 overlapping channels) that were assigned to that chart. You could then observe
the chart-related information for that specific channel. You can also select a new channel for the
information region by placing the cursor in (or tabbing over to) the “Center” or “Units/Div” fields and then
pressing PageUp or PageDown. This is particularly useful when your main window has been re-sized such
that the channel selection boxes are not visible.
The following list identifies the various areas of the region.
(10) Chart Max. Scale Value (Grid Limit Line)
(11) Channel Selection (Of chart’s available channels)
(12) Multiply (x2)
(13) Value at Marker
(14) Center(Value at chart mid-line)
(15) Units/Division (Provides the vertical increment of one
grid box.)
(16) Chart Min. Scale Value (Grid Limit Line)
(17) Divide (÷2)
(22) Time at Marker
Multiply and Divide Buttons (12 & 17) - In addition to reading channel values, you can increase or
decrease the size of the selected channel’s chart. This is accomplished with the Multiply (12) and
Divide (17) push buttons. The Multiply push-button effectively increases the size of the selected channel’s
chart by a factor of 2, while automatically adjusting the chart’s high and low values (items 10 and 16).
Aside from “clicking” on the Multiply/Divide controls, you can use your keyboard spacebar to control this
feature once the button (12 or 17) is selected. Selection may be with mouse, or by tabbing over to the
control.
Making changes to a channel’s chart parameters does not affect the parameters of the other channels, with
the following exception: Holding the keyboard’s control key down while adjusting either spinner (
σ/τ
) for
center (item 14), or spinner for units/div (item 15) causes the parameter change to apply to all channels
displayed for the chart, not just the currently selected channel display. This feature applies to the spinners
and keyboard up and down arrow keys, but not to the text input.
Value at Marker (13) - is the charted channel value at the marker position. Item (22) indicates the time
this value was read.
Center Control (14) - changes the value of the selected channel’s chart centerline. Changing the value of
center results in an automatic change of the chart’s high and low end values (items 10 and 16), and possibly
an automatic change of the units/div (item 15). Aside from using the center spinner controls to change
center, you can change the center value by placing the mouse cursor in (or tabbing over to) the field and
then either typing in the desired value, or using the PC keyboard up and down arrow control keys.
Units/div (15) - The units in units/div
(15) can be °C, °F, °K, °R, mV, or V. The division referenced is one
vertical grid. In the example above for Channel 1, each vertical grid increment represents 0.1231°C per
division. Changing the units/division spinner controls (
σ/τ
) will result in an automatic adjustment of the
max scale and min scale values (items 10 and 16). Aside from using the units/div triangular controls to
change the value, you can change units/div from the Display Configuration Setup dialog box as described
on page 14 of this document module.
Time at Marker (22) - is the time at the marker position. It is also the time that the indicated chart value
(13) was read.
PostView Document Module
04-23-01
PostView, pg. 5
Page 60

Menu Items
File
Open Opens a data file created by the data acquisition program. PostView automatically
Print Prints the present PostView window.
Setup Accesses Display Configuration Setup dialog box, allowing you to edit the display
Wizard Accesses the Chart Setup Wizard.
Exit Exits the File menu.
detects whether the file contains ASCII or binary data.
configuration.
Go To
Percentage
(Ctrl+P)
Scan Number
(Ctrl+S)
Time
(Ctrl+m)
Trigger Point
(Ctrl+T)
Note: In PostView Version 3.0 – If there is a Pre-trigger, then Pre-trigger and Post-trigger times (in seconds) are
displayed in the Go To menu’s dialog box.
Automatically scrolls the waveform such that the displayed waveform begins at the
specified percentage.
Automatically scrolls the waveform such that the displayed waveform begins at the
specified scan number.
Automatically scrolls the waveform such that the displayed waveform begins at the
specified time.
Automatically scrolls the waveform such that the displayed waveform begins at the trigger
point (t = 0).
Options
Zoom Graph Out Allows more of a chart(s) to be seen by decreasing the dimensions.
Zoom Graph In Zooms in on a chart(s), providing more detail to a smaller area of the chart(s).
Zoom Chart
Zoom Chart causes PostView to display one chart only. For example, if you were viewing
3 charts and desired to get a better view of Chart 2, you could use Zoom to view Chart 2
using the full chart viewing area, as compared to using one third of the area. The zoom
feature can also be invoked by double-clicking in the chart region of the chart for which
you want to apply the zoom.
Once you have zoomed in on a chart, the pull-down menu Zoom option is replaced by a
Restore option. Selecting R
previous multiple chart viewing status. The restore feature can also be invoked by again
double-clicking in the chart region.
estore from the menu will return the main window to its
Absolute time
(Ctrl+A)
Relative time
(Ctrl+R)
Autoscale Current
Channel
Autoscale All
Channels
Show Grid
(Ctrl+G)
Show Markers
(Ctrl+K)
Data Commentary
(Ctrl+C)
Places the timebase in a 24-hour absolute time format. For example:
25.2 seconds after 3:08 p.m. would appear as 15:08:25.2.
(Also see PostView Timebase, page 15.)
Places the timebase in a relative time format, typically having 00:00:00.0 as the start time
and having other times represented as hours, minutes, seconds and tenths which have
elapsed since the start time. (Also see PostView Timebase, page 15.)
For the currently selected channel, automatically generates a scale, in contrast to
manually assigning the scale.
Automatically generates a scale for each channel in every chart of the selected group.
Allows grids to be turned off and on for all visible graphs. When a check appears in front
of an item, its indicator is on or visible.
Allows markers to be turned off and on for all visible graphs. When a check appears in
front of an item, its indicator is on or visible.
This function is hidden unless a comment has been added to the data header file. If such
a comment has been entered, then Data Commentary will be visible, allowing you to
display the comment in a message box. The comment feature is supported by certain
acquisition software, and can only be used by PostView versions 3.3 or greater. For
ChartView users: note that commentary can be entered in ChartView’s Setup/Data
Destination dialog box, providing the commentary feature is enabled. To enable the
feature in ChartView, start with the View pull-down menu and navigate as follows:
View ⇒ Options ⇒ Acquisition ⇒ (3) Enable PostView Comment (refer to the software
chapter, if needed.)
Help
Contents The initial PostView help screen provides an overview and listing of the help file contents.
Search Type a word or select one from the Show Topics list for quick access to help information.
Help on Help
About Provides PostView’s version number.
A single topic can be selected for quick access to help information.
Provides instructions on how to use a Windows Help system.
PostView, pg. 6
04-23-01
PostView Document Module
Page 61

Understanding Groups, Charts, and Channels
As indicated in the figure on page 3, when no display configuration file is found, PostView opens the Chart
Setup Wizard to assist you in creating a display file. To make the best use of Chart Setup Wizard you need
to understand the relationship of Groups, Charts, and Channels. The Chart Setup Wizard feature is
discussed immediately following this text.
Group. “Group” refers to a group of charts. You can add and remove
groups to your display, and you can add or remove charts to each group.
Depending on the capabilities of your PC, you can have up to 64 groups
assigned to your display.
Note: PostView can only display data from one group at a time.
Chart. A “Chart” is a display area containing up to four channels. You can
assign up to 16 charts per group. Charts can be displayed with or without
gridlines.
Channel. “Channel” refers to a signal channel. You can have up to four
channels assigned to one chart. Channels will be displayed in units of °C,
°F, °K, °R, mV, V, or user defined units, depending on the configuration and
type of signal conditioning card which was used during data acquisition.
Chart Setup Wizard
Introduction
The Chart Setup Wizard feature allows you to create PostView’s initial chart display configuration with an
automated or manual method. When PostView can not locate a display configuration file, it automatically
accesses the Chart Setup Wizard feature. If a display configuration file is located, PostView bypasses the
Chart Setup Wizard.
Note: You can manually activate the Chart Setup Wizard from the File pull-down menu. Activating the
Chart Setup Wizard will reset an existing display configuration. Prior to manually activating the
Wizard feature, a “New Display Setup” box will appear to remind you of the display reset. You
can then activate Wizard by selecting “OK,” or discontinue by selecting “cancel.”
Note: You can edit the display configuration file without use of the Chart Setup Wizard by using the
Display Configuration Setup dialog box. This box can be accessed from Setup in the File pull-
down menu, or by clicking on the Chart Setup button in PostView’s toolbar. This method of
display editing is discussed in the section, Display Configuration, beginning on page 9.
The chart display setup determines how your PostView window will appear in regard to the following:
•
number of chart groups available for viewing
•
number of charts shown for each selected group
•
the number of overlapping channels in each chart (not to exceed 4)
You can choose to manually create a display configuration, or have one created automatically. The
automatic setup method offers three choices: Simple, M
oderate, and Advanced.
PostView Document Module
04-23-01
PostView, pg. 7
Page 62

A Manual Chart Creation, Create Charts button allows you to bypass the Chart Setup Wizard and enter a
manual editing mode. This option makes use of PostView’s Display Configuration feature (discussed in the
following Display Configuration section). Manual Chart Creation allows you to vary the number of
assigned channels per chart, as well as vary the number of charts per group.
Chart Setup Wizard, Simple Mode
Chart Setup Wizard, Automatic Setup Options for PostView
Setup Type Group Setup
Simple
Moderate
Advanced
Note: The Manual Charts Creation, Create Charts button (above figure) allows you to exit the Chart Setup Wizard and
enter the manual Display Configuration mode.
(for Chart Groups)
1 group only Up to 16 charts 1 channel per chart
1 group only Up to 16 charts Up to 4 overlapping channels per chart
Up to 64 groups Up to 16 charts per
Chart Setup Channel Setup
Up to 4 overlapping channels per chart
group
Automatic Display Creation
The previous figure shows the Simple mode dialog box for Automatic Chart Creation. The following
figures show the Moderate and Advanced mode dialog boxes.
Dialog Boxes for Moderate and Advanced Modes of Automatic Chart Creation
PostView, pg. 8
04-23-01
PostView Document Module
Page 63

It is a simple task to create a chart display configuration using the automatic method. The following steps
apply to this feature of Chart Setup Wizard.
Note: If PostView locates a display configuration file, Chart Setup Wizard will not be activated unless
you choose to manually activate the Wizard from the File pull-down menu.
1. From the Chart Setup Wizard window, select the desired mode (Simple, Moderate, or Advanced).
Note: Selecting Manual Chart Creation, Create Charts bypasses the Chart Setup Wizard and enters a
manual editing mode. This option makes use of PostView’s Display Configuration feature
discussed in the following section, Display Configuration.
2. Use the pull-down arrows (
number of groups, charts, and channels as applicable.
3. If you desire to start with a channel other than channel 1, use the pull-down arrow and select the desired
starting channel number.
4. When your setup is complete, click on the Create Charts button. A percentage of completion bar will
appear, followed by the PostView window.
The channels in the setup you create will appear in chart form on PostView’s window. The Channels will
overlap on their assigned Chart (for configurations making use of multiple channels per chart), and will be
visible when the applicable Group is selected. Note that only one group of charts can be viewed at a time.
Display Configuration
Note: When PostView does not find a display configuration file it automatically opens the Chart Setup
Wizard. You can use this feature to automatically create a display configuration. You also have
the option of selecting Manual Chart Creation, Create Charts to bypass the Chart Setup Wizard
and enter the manual editing mode, as discussed in this section.
The Display Configuration button accesses a Display Configuration Setup dialog box. This box will also
be displayed if:
a) Manual Chart Creation, Create Charts is selected from the Wizard Chart Setup window
b) You select Setup from the File pull-down menu
c) You right-click on the chart region in PostView’s window
τ
), or use the cursor and type in a new value to make selections for the
Note: If multiple chart groups are present in the display configuration, the current group will be selected
When you first click on the Display Configuration button, a Display Configuration Setup box appears. A
display region shows the configured structure of the groups, charts, and channels. From this box you can
select the number of charts to be assigned to a specific group. With the use of the mouse cursor you can
also select a chart or channel for additional editing.
The rest of this section has been divided into two parts. The first pertains to editing an existing display;
while the second section pertains to manually creating a display configuration from scratch, i.e., there is no
existing display configuration to edit. Both methods make use of Display Configuration Setup dialog
boxes.
PostView Document Module
in the display configuration tree.
04-23-01
PostView, pg. 9
Page 64

Editing a Display
Display Configuration Setup Dialog Box with an Existing Configuration
To explain editing a configuration, we make use of an example in which assumes you want to edit Chart 1.
In the following figure, Chart 1 was highlighted by clicking on it with the mouse cursor. The Display
Configuration Setup box then changed, allowing you to see specific channel types (such as volts only) or to
“Show all Types,” as in the example. From this setup box you can add or delete charts and channels. You
can:
• Use the Shift or Ctrl key in conjunction with the cursor to select several channels for addition or deletion
• double-click on an available channel to add it to the selected channels
• double-click on a selected channel to remove it from the selected channels list
Note: When a chart contains overlapping channels which share values (such that their traces reside on top
of each other), the more recent channel will obscure the earlier channel. Note that the lower a
channel is on the display list, the more recent it is in regard to the display.
Adding Channel 2 to Chart 1
PostView, pg. 10
04-23-01
PostView Document Module
Page 65

Another variation of the Display Configuration Setup box appears when you highlight a channel. In the
following figure, Channel 1 (of Chart 1, Group 1) was selected, resulting in a new screen image. From this
screen you can edit the channel setup.
Adjusting Channel Setup for Channel 1
PostView channels can be set for either of two modes: Units Full Scale or, Units/Div. The mode is selected
by radio button. Mode descriptions are as follows:
Units Full Scale. When Units Full Scale is selected, as depicted in the above figure, you can alter Y Max
and Y Min. These are the upper and lower limits of the Channel as they will appear on the chart when the
channel is selected. When you change either parameter, Y Center and Units/Division are automatically
adjusted. You can not directly adjust Y Center or Units/Division while “Units Full Scale” is selected. You
can change Y Max and Y Min by using the up and down arrows, or by highlighting the existing value,
typing in the new value, the pressing “Enter” on your PC keyboard.
Note: If the window size is changed, a chart operating in the Units Full Scale mode will maintain its
full scale setting across the chart.
Units/Div. When Units/Div. is selected you can alter Y Center and Units/Div. Y Center is the centerline
value of the chart when the channel is selected. Units/Div. is the vertical value of on chart grid increment.
When you change Y Center or Units/Div. Y Max and Y Min are automatically adjusted. You can not
directly adjust Y Max or Y Min while “Units/Div.” Is selected. You can change Y Center and Units/Div. by
using the up and down arrows, or by highlighting the existing value, typing in the new value, the pressing
“Enter” on your PC keyboard.
Note: If the window size is changed, a chart operating in the Units/Div. Mode will maintain its units per
division scale setting across the chart.
PostView Document Module
04-23-01
PostView, pg. 11
Page 66

Manually Creating a Display
Note: This method of creating a display can only be accessed from the Chart Setup Wizard. It cannot be
accessed if PostView is using an existing display configuration file.
Unlike editing a display, as just described, this method involves creating a display from scratch. If you plan
to have a chart setup which is not weighted evenly, i.e., different numbers of channels per chart and
different numbers of charts per group, you may want to manually create your chart display in this manner.
This method can only be arrived at from the Chart Setup Wizard by selecting Manual Chart Creation,
Create Charts. This bypasses the Chart Setup Wizard and enters the manual editing mode, discussed.
Although this method is referred to as “manual,” it still contains automatic elements, such as Automatically
Add Groups to the Setup.
Perform the following steps to manually create your chart display.
1. From the Chart Setup Wizard window, select Manual Chart Creation, Create Charts. This bypasses
the Chart Setup Wizard and enters the manual editing mode.
Display Configuration Setup, Initial Screen During Manual Creation
2. Perform (2a) or (2b) as appropriate to your application.
(2a) Automatically add groups to the setup. Enter the number of groups and charts desired by using the cursor and
typing in the value, or by using the pull-down arrows (τ) and making the appropriate selections; then click on the
Create Groups button.
(2b) Manually add groups to the setup. Type in the name of the chart group; then click on the Add Display Group
button.
The Display Configuration Setup screen changes to show chart groups, and the number of charts for the
selected (black highlighted) chart group (see following figure). From this screen you can change the
number of charts in a group, as well as change the group name.
PostView, pg. 12
04-23-01
PostView Document Module
Page 67

Adding a Chart to Group 1
3. Change the number of charts per group if desired.
4. Change the group name if desired.
5. Click on a group to see the chart(s) assigned to the group. In the above example there is one group
with one chart.
6. Click on a chart to assign channels to the chart. A screen similar to the following will appear.
Assigning Channels to Chart 1 of Group 1
7. Choose channels for the selected chart. You can select up to 4 overlapping channels per chart. There
are four methods of adding channels. These are as follows:
• Highlight an available channel using the cursor and left-hand mouse button; then click the Add button. Repeat for
• Double-click on the channel (in the available channels list to add; in the selected channels list to remove)
• Hold down the keyboard’s Shift Key and use the left-hand mouse button to select a block of consecutive available
• Hold down the keyboard’s Ctrl button and use the left-hand mouse button to select up to 4 available channels
PostView Document Module
each channel to be added.
channels (up to 4); then click the Add button. Example: CH3, CH4, CH5,and CH6.
(these can be non-consecutive); then click the Add button.
Example: CH1, CH3, CH5, and CH7, as in the previous figure.
04-23-01
PostView, pg. 13
Page 68

Note: You can remove channels by highlighting a channel(s) in the Select Channels box, and then
clicking on the Remove button. In the previous figure, CH7 (in the select box) is highlighted.
Clicking the Remove button would delete that channel from Chart1.
Note: When a chart contains overlapping channels which share values (such that their traces reside on
top of each other), the more recent channel will obscure the earlier channel. Note that the lower a
channel is on the display list, the more recent it is in regard to the display.
8. In the display area (on the left-hand side of the screen) click on a channel to check the channel’s
configuration and to re-configure the channel, if desired. The Display Configuration Setup Window
will appear similar to that in the following figure.
This screen contains two “radio buttons” for selecting the method of adjusting the display mode and
channel setup. It is the same screen that was discussed in the sub-section, Editing an Existing Display
Configuration. From this screen you need to choose Units Full Scale or Units/Div.
Adjusting Channel Setup for Channel 1
Units Full Scale. When Units Full Scale is selected, as depicted in the above figure, you can alter Y Max
and Y Min. These are the upper and lower limits of the Channel as they will appear on the chart when the
channel is selected. When you change either parameter, Y Center and Units/Division are automatically
adjusted. You can not directly adjust Y Center or Units/Division while “Units Full Scale” is selected. You
can change Y Max and Y Min by using the up and down arrows, or by highlighting the existing value,
typing in the new value, the pressing “Enter” on your PC keyboard.
Note: If the window size is changed, a chart operating in the Units Full Scale mode will maintain its full
scale setting across the chart.
Units/Div. When Units/Div. is selected you can alter Y Center and Units/Div. Y Center is the centerline
value of the chart when the channel is selected. Units/Div. is the vertical value of on chart grid increment.
When you change Y Center or Units/Div. Y Max and Y Min are automatically adjusted. You can not
directly adjust Y Max or Y Min while “Units/Div.” Is selected. You can change Y Center and Units/Div. by
using the up and down arrows, or by highlighting the existing value, typing in the new value, the pressing
“Enter” on your PC keyboard.
The Channels will overlap on their assigned Chart and will be visible when the applicable Group is selected.
Note that only one group of charts can be viewed at a time.
Note: If the window size is changed, a chart operating in the Units/Div. Mode will maintain its units per
division scale setting across the chart.
PostView, pg. 14
04-23-01
PostView Document Module
Page 69

PostView Timebase
PostView automatically detects and displays the data file timebase along the X-axis at the bottom of the
PostView window. The timebase can be displayed as relative time or as absolute time in the format:
00:00:00.0 (hour/minute/second/tenth). The timebase format of absolute or relative can be selected in
PostView’s Option pull-down menu, or by using Ctrl+A or Ctrl+R respectively.
Note: PostView automatically displays milliseconds (ms) or microseconds (µs) when applicable to
acquisition programs that make use of such time scales. Aside from selecting the type of timebase
desired (absolute or relative) no user action is required in regard to the timebase display.
Two Points About the PostView Timebase
•
When a data file is loaded into PostView for the very
first time, the relative timebase format will be used.
• You can not select absolute timebase when the data
file has no timebase. In this case PostView will
automatically use relative time.
The following figure illustrates a partial timebase in the relative format. Note that the user could switch to
absolute time with Ctrl+A on the keypad, or by selecting Absolute time from the Options pull-down menu.
The example below resulted from a ChartScan/1400 using ChartView software.
Example of a PostView Timebase
Note: For many data acquisition programs, trigger point (t = 0) may not be the first point in the data file.
PostView Document Module
04-23-01
PostView, pg. 15
Page 70

It is possible for the data acquisition program to create files containing multiple timebases, pre-trigger, posttrigger, and post-stop data. PostView accommodates all these features, as shown in the previous example
(taken from a ChartScan/1400 unit with the ChartView data acquisition program).
•
If pre-trigger scans are available, they will be shown prior to the trigger point and labeled with
negative time numbers.
• If post-stop data is available (scans collected after the Stop Event), they are displayed after the Stop
Event marker.
•
If a dual timebase was used when collecting the data, PostView will show a discontinuity in the time
axis when the timebase changes. When a dual timebase is used, the post-trigger scans are collected at
one frequency while the pre-trigger and post-stop scans are collected at another.
Note: Some timebase aspects may differ, depending on the actual data acquisition program used. Refer
to PostView’s Help File for timebase information relating to specific data acquisition programs.
PostView, pg. 16
04-23-01
PostView Document Module
Page 71

TempView
Application Startup…… 1
TempView Components…… 2
Charts and the Spreadsheet's "Reading" Column…… 7
TempView Menu Items …… 8
TempView is a 16-bit graphical Microsoft Windows based application used to operate TempBook
hardware. No programming knowledge is required to operate TempView. The program allows you to set
up an application to acquire data, and save the acquired data directly to disk. The program is featured with
the ability to transmit the data to other Windows applications, such as spreadsheets and databases.
TempView provides the following capabilities:
• Set up all of the analog input parameters, then acquire and save the data to a disk file.
• Exercise TempBook’s digital I/O section.
•
• Launch 16-bit PostView, an independent application. PostView provides a means of viewing
(16-Bit Support)
Analog Input Spreadsheet…… 2
Acquisition Configuration …… 5
Counter/Timer Window …… 5
Digital I/O Window …… 6
File …… 8
Edit …… 8
Select Device …… 8
Window …… 8
Acquisition …… 8
Charts …… 8
Exercise the counter/timer.
waveforms that were previously recorded by TempView.
Application Startup
If you have not already installed TempView, refer to chapter 1 of the TempBook/66 manual.
To launch the application, double-click the TempView icon. TempView holds many user-configured
parameters that can be saved to disk. The default configuration file name is “TEMPVIEW.CFG”.
TempView will then proceed to search the working directory for the TEMPVIEW.CFG configuration file.
The following conditions may apply:
•
If the default configuration file is found, all the required setup information will be extracted from it,
and the application's main window will open.
• If the default configuration file is not found, TempView will try to connect with the TempBook
hardware with the following default parameters: Printer Port LPT1, Interrupt Level 7, and 4-bit
Standard Protocol.
•
If connection with the TempBook is established, the applications main window will open with default
setup.
• If all of the above fails to establish communications with the TempBook, then a dialog box will appear
asking whether or not you want to open a different setup file. Answering “Yes” will open another
dialog box where you can select your file. If this is the first time you have used this application, no
saved setups will be available; select “No”.
• If a configuration file is selected, no further dialog boxes will appear, all the required setup
information will be extracted from it, and the applications main window will open.
• If no user configuration file is selected or found, or communications is not established, the next dialog
prompts the user to choose a real instrument or a simulated instrument. If the hardware is not
available and you just want to try out the software, select Simulated Instrument. The Simulated
Instrument mode allows you to exercise all the software functions without any hardware installed. If
the TempBook hardware is connected and switched on, select Real Instrument.
16-Bit Support
04-19-01
TempView, pg. 1
Page 72

• If Real Instrument was selected, an additional dialog box will appear, prompting you to select the LPT
port that the hardware is connected to, the interrupt level of that port, and the parallel port protocol to
use.
TempView will attempt to find the TempBook on the specified LPT port. If the hardware is found, the
application's main window will open. If no hardware is found, a message appears and the application will
open with the controls disabled.
To reconfigure the LPT port setting and try again, click Select LPT Port under the Select Port menu. If the
TempBook hardware still cannot be identified by the software, exit TempView and try the TEMPTEST
utility program.
TempView Components
The figure shows TempView’s main window that has areas for the following:
•
Analog input spreadsheet to summarize system configuration and show current readings
• Trigger configuration, event type and edge
• Sequence repetition rate, number of scans, and averaging enable
•
Data destination (filename and data format)
• High-speed digital input enable
• Signal reference type
Analog Input Spreadsheet
The input spreadsheet allows the analog input channels to be configured and displayed. The spreadsheet
consists of rows and columns much like a standard accounting spreadsheet.
•
Each row configures a single analog input channel. There are 16 rows if single-ended inputs are
selected; or 8 rows if differential inputs are selected.
• The columns contain the configuration information for each channel. Some columns allow blocks of
cells to be altered simultaneously while others allow only one cell to be changed at a time. Clicking a
column header will select the entire column if possible.
The 7 columns for each row are used as follows:
CH - The channel-number column labeled "CH" is static and cannot be altered. This column identifies rows
by the corresponding analog input channel to configure.
TempView, pg. 2
TempView’s Main Window
04-19-01
16-Bit Support
Page 73

ON - The column labeled "On" allows you to select whether or not data will be collected from the
corresponding input during an acquisition. An acquisition consists of reading data to disk, either to charts
or the input reading column of this spreadsheet. When a cell or block of cells in this column is selected, a
selection box will appear above the spreadsheet that allows a "Yes" or "No" choice to enable or disable the
channel. Double-clicking a cell in this column will toggle the channel status. The Make All Channels
Active and Make All Channels Inactive menu items under the Edit menu can be used to globally change all
channels to a "Yes" or "No".
Type - The "Type" column allows you to set the thermocouple or gain type for the selected channel or
block of channels. Double-clicking a cell or block of cells in this column will select the next available gain
or type.
Pole - The "Pole" column shows the state of the channel polarity which can be either unipolar or bipolar.
The channel polarity can be programmed on a per channel basis. If a cell or block of cells in this column is
selected, a selection box will be displayed above the spreadsheet with the selections "Uni" and "Bi" when
the cell is selected. Double-clicking in one of these cells will toggle the polarity.
Label - The "Label" column contains a descriptive name for the input channel. By default it contains a
label similar to its channel number; however, you can enter a more relevant, descriptive label of 8
characters. This label will be used when selecting a specific channel in the analog trigger and chart
selection lists. This column does not have a selection list above the spreadsheet and does not allow
selecting blocks of cells.
Units - The "Units" column allows you to change the
engineering units of each channel and apply a linear equation to
the data read from the TempBook. When a cell or block of cells
in this column is selected, a selection box is displayed
containing mX+b as well as common engineering units (see
figure). Selecting mX+b will pop up a window that allows the
m and b of this equation and the engineering units label to be
defined. The engineering units will then be displayed in the
"Units" column, and the mX+b equation will be applied to the
reading from the TempBook before the reading is displayed or
written to disk. The X in this equation is the voltage or the degrees in Celsius read back from the
TempBook. For example, if a TempBook channel is configured as bipolar and unity (×1) gain, the default
voltage would be ±5 V. This corresponds to an m of 1, a b of 0 and an engineering unit of V. This could be
changed to millivolts by setting m to 1000 and units to mV. This column could also be used to perform a
software calibration of the TempBook. This is performed by reading known inputs at two different points
of the input voltage range (usually at 0 and full scale) and solving the equation y = mX+b. The full-scale
voltage, which changes according to the gain of the channel, is 5V/gain for bipolar channels and 10V/gain
for unipolar channels.
Engineering Units Conversion Using mx + b
Most of our data acquisition products allow the user to convert a raw signal input (for example, one that is
in volts) to a value that is in engineering units (for example, pressure in psi). The products accomplish this
by allowing the user to enter scale and offset numbers for each input channel, using the software associated
with the product. Then the software uses these numbers to convert the raw signals into engineering units
using the following “mx + b” equation:
Engineering Units = m(Raw Signal) + b (1)
The user must, however, determine the proper values of scale (m) and offset (b) for the application in
question. To do the calculation, the user needs to identify two known values: (1) the raw signal values, and
(2) the engineering units that correspond to the raw signal values. After this, the scale and offset parameters
can be calculated by solving two equations for the two unknowns. This method is made clear by the
following example.
16-Bit Support
04-19-01
TempView, pg. 3
Page 74

Example
An engineer has a pressure transducer that produces a voltage output of 10.5 volts when the measured
pressure is 3200 psi. The same transducer produces an output of 0.5 volt when the pressure is 0 psi.
Knowing these facts, m and b are calculated as follows.
A - Write a pair of equations, representing the two known points:
3200 = m(10.5) + b (2)
0 = m(0.5) + b (3)
B - Solve for m by first subtracting each element in equation (3) from equation (2):
3200 - 0 = m(10.5 – 0.5) + (b - b) (4)
Simplifying gives you:
3200 = m(10) (5)
And so:
m = 320 (6)
C - Substitute the value for m into equation (3) to determine the value for b:
0 = 320 (0.5) + b (7)
So:
b = - 160 (8)
Now it is possible to rewrite the general equation (1) using the specific values for m and b that we just
determined:
Engineering Units = 320(Raw Signal) - 160 (9)
The user can then enter the values of m and b into the appropriate location using the facilities provided by
compatible data acquisition software, for example: DaqView, Personal DaqView, LogView, and
TempView. The software uses equation (9) to calculate signal values in engineering units from that point
on.
TempView, pg. 4
04-19-01
16-Bit Support
Page 75

Reading - The "Reading" column can display the analog input readings of the TempBook. This column
cannot be altered by the user and is enabled by selecting Enable Input Reading Column under the
Acquisition menu. This column will update the readings as fast as the computer will allow. If data is being
written to disk while this column is enabled, it will be updated whenever possible. The spreadsheet cannot
be altered while the input reading column is enabled.
In addition to the analog inputs, there is one 8-bit digital input channel accessible on the termination card.
This high-speed digital input, which is read at the same rate as any analog inputs, can be enabled or disabled
by clicking the "ChanOn" checkbox in the lower right of the analog input spreadsheet.
Acquisition Configuration
The acquisition configuration section of TempView’s main window is just to the right of the analog input
spreadsheet. This section has 5 parts: the Trigger, Scan Frequency, Number of Scans, Signal Conditioning,
and Data Destination sections. These sections allow you to set up all of the acquisition parameters for the
analog inputs and the high-speed digital input channel. The analog acquisition configuration includes
parameters for setting up a trigger source, the scanning frequency after the trigger is satisfied, the number of
scans to take after the trigger, and the file name for the collected data. These settings will be used when an
acquisition-to-disk is started by selecting "Go" under the acquisition menu.
Trigger - The Trigger section selects the source of the trigger. When the trigger is satisfied, the scans are
collected at the selected scan frequency and stored to disk. The sources are: Key Hit, which arms the
acquisition and waits for the user to hit a key; and External TTL, which waits for a falling or rising edge on
the 'trig' input terminal on the termination card.
Sequence Rep Rate - The scan frequency can be set in units of seconds, minutes and hours. Moving the
slide switch changes the rate. The cursor can also be placed in the numeric field and a number can be
entered directly. The maximum scan frequency is dependent on the number of channels that are enabled
and whether or not averaging is enabled. Enabling more channels or enabling averaging will lower the
maximum scan frequency.
Signal Cond Averaging - The Averaging checkbox enables or disables averaging of the analog input data.
Averaging can be used to increase the effective accuracy of a noisy signal. Averaging will increase the
actual scan frequency and number of scans, but the perceived scan frequency and number of scans (which is
set by TempView) does not change.
No. of Scans - The number of scans can range from 1 to 100,000. A scan includes all of the channels that
are marked as "On" in the analog input configuration spreadsheet.
Data Destination - This section contains the file name and type of file(s) that exist after an acquisition-todisk is complete. A file name can be typed in directly or the Browse Files button can be pressed to open a
file-selection dialog box. The selected file will be placed directly into the filename field. During an
acquisition, a raw binary file is created and updated as data is read. After the acquisition is complete, an
ASCII text file and PostView binary file can be created if the appropriate checkbox is enabled. Both of
these files can be read by PostView (described later in this chapter). If the raw binary checkbox is not
enabled, the raw binary file will be deleted after creating the PostView or ASCII file.
After the acquisition is started, these parameters can not be altered.
Counter/Timer Window
The counter/timer window is displayed when ctr/tmr is selected under the Windows pull-down menu. This
window allows configuration of the 8254's counter 0. Counter 0 is configured by selecting its function,
clock source and initial count. When the Start Timer button is clicked, the counter configuration will take
place.
16-Bit Support
04-19-01
TempView, pg. 5
Page 76

Digital I/O Window
The digital I/O window is displayed when digital I/O is selected
under the windows menu. This window provides interactive control
of the 8 digital input lines and 8 digital output lines on the
TempBook termination card. Select output values by clicking on the
output witches which toggle between 0 and 1—or you can enter the
hex value and <Enter>; the switch positions will update to reflect the
new setting. When the Execute button is pressed, all output lines
will be updated and all input lines will be read.
Counter/Timer Window
TempView, pg. 6
04-19-01
16-Bit Support
Page 77

Charts and the Spreadsheet's "Reading" Column
Up to 4 charts can be displayed by selecting charts under the Window menu. Before the charts can be
enabled, at least one chart must be assigned a channel through the channel’s drop-down list. When a
channel is selected, you can change the minimum and maximum values displayed in the chart (see figure).
This can be done whether or not the charts are currently enabled.
The charts and the spreadsheet Readings column are independently enabled. The charts can be enabled
under the Charts menu of the Charts window. The Readings column can be enabled under the Acquisition
menu of the main TempView window. These windows provide instant feedback of the analog input
readings.
Data is read and displayed in the charts and Readings column as fast as the computer will allow. When an
acquisition to disk has begun using the Go command under the Acquisition menu, the charts and the
spreadsheet Reading column take a lower priority, updating only when there is sufficient time in the
acquisition-to-disk task. Therefore, the data seen in the charts may not be an accurate reflection of the data
that is being placed on the disk. As the scan rate is increased, the acquisition-to-disk task will take up more
processor time and the charts will be unable to keep up.
TempView Display Charts
16-Bit Support
04-19-01
TempView, pg. 7
Page 78

TempView Menu Items
File
The file menu provides four basic functions:
New Set all parameters to their startup setting.
Save Save the existing configuration for later recall.
Load Load a saved configuration.
Convert Binary to ASCII Convert a previously acquired binary file to an ASCII file that can be read by
Convert Binary to PostView Binary Convert a previously acquired binary file to a binary file that can be read by
Exit Leave the TempView program.
Edit
The Edit menu includes the following functions:
Make All Channels Inactive This command places a "No" in the On field of all of the channels. If your channel
Make All Channels Active This command places a "Yes" in the On field of all of the channels.
Fill Down When multiple cells within a column are selected, this command takes the top-
Select Device
The Select Device menu includes the following functions:
Select LPT Port Brings up a dialog box prompting the user to select the LPT port on which the TempBook is
Simulated Device This command opens a TempView session but does not attempt to communicate with
spreadsheets or other analysis programs.
the PostView application.
scan includes only a few channels, it may be easier to make all of the channels
inactive, then turn on only those few channels that you want.
most selected cell and copies its contents in the selected cells below.
connected. After an LPT port is selected, TempView opens a new session with the
TempBook hardware and attempts to communicate with it. If the hardware is found, the
main window is opened. If no hardware is found, the user is alerted and the application is
opened with the controls disabled. To reconfigure the LPT port setting and try again, click
Select LPT Port under the Select Port menu. If the TempBook hardware still can not be
identified by the software, exit TempView and try the TEMPTEST utility program.
TempBook hardware. Instead, the application simulates the interaction between the
software and the hardware. If TempView is presently attached to real TempBook
hardware, this command will close that session.
Window
The Window menu includes the following functions:
PostView This command launches an instance of the PostView application.
Charts This command displays the charts window.
Analog Output This command displays the analog output window.
Digital I/O This command displays the digital I/O window.
Ctr/Tmr This command displays the counter/timer window.
Acquisition
The Acquisition menu includes the following functions:
Go This command arms the hardware for an acquisition to disk. When the trigger is satisfied,
Enable Input
Reading Column
the acquisition begins. All of the interactive I/O controls are disabled while the system is
armed. No acquisition parameters can be altered at this time.
This command reads the analog inputs and puts the numeric values in the spreadsheet in
the "Reading" column. If it is already enabled, this command disables it.
Charts
The Charts menu of the charts window includes the following function:
Enable Charts This command starts the scroll chart running. If the chart is already running, this command
TempView, pg. 8
stops it.
04-19-01
16-Bit Support
Page 79

Programmer's Guide
This and the following chapters are written for users who wish to write their own programs to control and
acquire data from the TempBook/66. This introductory chapter covers basic TempBook operation from a
programmer’s perspective and the options available for API drivers and languages. Further detail is
included through examples in the individual language support chapters, the command reference section, as
well as the chapters on thermocouple linearization and software calibration & zero compensation.
5
A Programmer’s View of TempBook Operations
The TempBook provides flexible, high-speed, multi-channel data acquisition capabilities through the use of
sophisticated analog and digital electronic circuitry. This circuitry allows up to 16 analog input channels to
be read at an aggregate 100 kHz sampling frequency. Each of these channels can be read as a unipolar
(0 to +V) or bipolar (±V) signal in one of 8 input voltage ranges. These ranges are determined by dividing
the standard 0 to 10V unipolar or ±5V bipolar input range by the available gains of ×1, 2, 5, 10, 20, 50,
100, or 200. Additionally, each input can be read as a single-ended or differential signal (selecting
differential limits the number of available channels to 8).
The conversion of these input signals to a digital code is accomplished by a high-performance 12-bit
analog-to-digital converter (ADC). (The resultant digital code can then be converted into a voltage via a
DAC). The output of the ADC is an unsigned value which is leftjustified within a 16-bit data word. In unipolar and bipolar modes,
the output code is related to the input voltage as shown in the table
(12-bit data format and standard input range shown).
The analog section of the TempBook consists of the following: channel select multiplexers, a single-ended /
differential selector, an instrumentation amplifier, programmable gain amplifiers, a unipolar / bipolar
selector, and the 12-bit ADC.
Bipolar Unipolar
0x000 = -5V 0x000 = 0V
0x800 = 0V 0x800 = 5V
0xFFF = 4.9976V 0xFFF = 9.9976V
The analog electronics are controlled by a scan-sequencer and control registers. The scan sequencer is
implemented with a 16-bit × 512-location FIFO RAM. Each entry in the scan sequencer contains channel,
gain, and polarity information. The single-ended/differential selection is controlled by a static control
register entry. Once triggered, the scan sequencer is stepped through at a constant rate of 100 kHz until all
sequencer entries have been read. At each step, an ADC conversion is performed and the resultant output is
stored in a data buffer implemented with another 16-bit × 512-location FIFO RAM.
A scan is initiated by a trigger from a software command, a TTL input, or an internal pacer clock. In
addition to the source, a mode (one-shot or continuous-trigger) can be selected.
• In one-shot mode, the scan sequencer is stepped through once (scanned) each time a trigger is
• In continuous mode, the scan sequencer waits for the selected trigger for the initial scan but
Note: The selection of one-shot or continuous mode has no effect if the pacer clock is selected as
TempBook User’s Manual
Block Diagram
received.
subsequent scans are initiated by the pacer clock.
the trigger source.
04-24-01
Programmer's Guide 5-1
Page 80

The pacer clock is generated by dividing an internal 1 MHz or 100 kHz clock by a programmable 32-bit
counter. The pacer clock source selection is made by an internal jumper setting, and the counter is
implemented by cascading P1 and P2 of an 8254 counter/timer chip.
The scan sequencer must be loaded prior to any data acquisition. When using the high-level data
acquisition routines (as in the adcex1 example programs), a single command can combine the scan
sequencer setup, trigger selection, pacer clock programming, and data collection. When using the low-level
data acquisition routines (as in adcex2 and adcex3), these operations are broken out into separate
commands.
When connecting thermocouple and other low-level signals in addition to high-level
signals, the low-level signals should be programmed first into the scan sequence with
the high-level signals following in ascending order of signal magnitude.
In addition to the 16 externally available analog input channels, two internal
channels are provided for offset correction and thermocouple cold junction
compensation. The external analog input channels are addressed as channels 0 15, the CJC channel is at address 16, and the internal shorted channel is at 18.
The CJC channel must be included in the scan group when reading
thermocouples. This channel reading is used by the thermocouple linearization
functions. The shorted channel, when read at the same gain as an analog input
channel, can be used to remove offset errors present at run time in the analog
electronics. These topics are covered in greater detail in the
Thermocouple
Linearization and Zero Compensation chapters.
Besides zero compensation, software compensation can be used to improve
measurement accuracy. The offset and gain errors present after factory
calibration are characterized and recorded within a unit-specific calibrationconstants file. The calibration-constants file is read by the data acquisition
program at run time. The collected ADC data can then be corrected for offset
and gain errors. This topic is covered in greater detail in the Software
Calibration and Zero Compensation chapter.
In addition to analog input, the TempBook provides digital I/O and
counter/timer function. Eight bits each of digital I/O are provided which can be
accessed as register-addressable I/O ports. Additionally, the 8 bits of digital
input can be read as part of the scan group by programming the scan sequencer
with the appropriate channel definition. The digital inputs are then returned
within the ADC data buffer and are right justified within the 16-bit data words.
When the digital inputs are read in this way, the timing relationship between the
trigger event and the analog & digital data is fixed.
A user accessible counter / timer is provided through the P0 port of the 8254.
This port can be configured into one of several modes including one-shot and
pulse-train generation as well as event counting. The clock input to this counter
/ timer port can be taken from an external or internal 100 kHz source. These
topics are covered in greater detail in the Command Reference chapter under the
tbkConfCntr0 and tbkSetTrig commands.
The flowchart diagram shows the operation of a typical TempBook data
acquisition program.
Data Acquisition
Program Flowchart
5-2 Programmer's Guide
04-24-01
TempBook User’s Manual
Page 81

Driver Options
The install disks include several “drivers” to accommodate various programming environments. This
section is intended to help you decide which API and programming language to use in developing your
application.
TempBook applications can be written to either the 16-bit TempBook API or to the 32-bit Daq* API. 16bit API functions have the tbk… prefix. The 32-bit API is a new format which can be generically used
with the TempBook, WaveBook, DaqBook, DaqBoard, and Daq PC-Card product lines. 32-bit API
functions share the daq… prefix. Generally,
• If starting with an existing TempBook Application written to Windows 3.1, the quickest port is to use
• If writing a new application, it is best to write code to the 32-bit API due to its improved performance
16-Bit API (tbk…)
The 16-bit API was originally written for the TempBook’s Windows 3.1 driver. However, it can be used
under Windows 95 in 16-bit mode. The 16-bit API is the only API option available for Windows 3.1 or
DOS applications. Use the 16-bit API:
• When developing a new or existing DOS application
• When developing a new or existing Windows 3.1 application
32-Bit API (daq…)
The API for 32-bit systems has several features that are not present in the 16-bit API:
• Multi-device - can concurrently handle up to 4 devices (including WaveBooks, Daq products, and/or
• Larger buffer - can handle up to 2 billion samples at a time
• Enhanced acquisition and trigger modes
• Direct-to-disk capabilities
• Wait-on-event features
• Uses multi-tasking advantages of Windows 95/98/Me/NT/2000.
or re-write code to the 16-bit API.
and enhanced feature set (see following).
TempBooks)
Because of these new features and other improvements, we recommend you use the 32-bit API whenever
feasible. Use the 32-bit API:
• When developing new or existing Windows 95/98/Me/NT/2000 applications
• When developing new or existing Windows NT applications
• When porting an existing 16-bit API application to 32-bit mode to take advantage of the enhanced API
Language Support
The following table shows language support for the 16-bit and 32-bit API drivers.
16-Bit API Supported Languages 32-Bit API Supported Languages
C/C++
Microsoft Visual C++
Borland C++ (v4.0 and greater)
BASIC
Microsoft Visual Basic (v4.0 and previous)
QuickBASIC
Pascal
Turbo Pascal
features.
C/C++
Microsoft Visual C++ (v2.2 and greater)
Borland C++ (v4.0 and greater)
BASIC
Microsoft Visual Basic (v4.0 and greater)
Delphi
Borland Delphi (v2.0)
TempBook User’s Manual
04-24-01
Programmer's Guide 5-3
Page 82

5-4 Programmer's Guide
04-24-01
TempBook User’s Manual
Page 83

16-Bit API Programming of the TempBook with C
Reference Note: The 32-bit API commands do not work exactly like the 16-bit API commands;
refer to chapters 10 and 11 if you are seeking information regarding 32-bit API.
Accessing TempBook from a Windows Program
The structure of a Windows program generally dictates that actions take place in response to messages such
as an operator key-press, mouse action, menu selection, etc. This discussion covers the basic actions
needed to control the TempBook. How these actions are combined and coordinated in response to
Windows messages is up to the application designer.
Accessing TempBook from a C-for-Windows Program
There is one library and one header file located in the TEMPBOOK\WIN\C directory. The header file,
TEMPBOOK.H, must be included at the top of a C program using the #include command. This will
allow the compiler to know what TempBook functions and constants are available.
The library, TEMPBOOK.LIB, must be included in the application's makefile or project file so that the
linker will find the TempBook functions. This is a large memory model library; the appropriate compiler
and linker options for a large memory model program must be invoked. See the documentation for your
specific C compiler for a description on using header files, libraries, and memory models.
To use the example program located in the TEMPBOOK\DOS\C directory, create a makefile or project file
which consists of the TBKEX.C source file, TBKEX.RC resource file, TBKEX.DEF definition file,
TBKEX.ICO icon file and the TEMPBOOK.LIB library.
6
High-Level Analog Input
The following excerpt from TBKEX.C shows the usage of several high level analog input routines.
unsigned sample, buf [10], data[7], data2[80];
int i, scan, chan;
Set default operating mode to single-ended, bipolar. These parameters will affect all scanned channels.
tbkSetMode(0, 1);
Get one A/D sample from channel 0 at unity gain and print the unsigned integer that is returned. Since the
TempBook contains a 12-bit A/D converter, the least significant 4 bits are undefined. Shifting the value to
the right 4 times right justifies the 12 bit value in the 16 bit variable.
tbkRd(0, &sample, TgainX1);
sprintf(tempstr, "Result of tbkRd : %4d\r\n\r\n", sample>4);
Get 10 samples from channel 0, trigged by the pacer clock with a 1kHz sampling frequency at unity gain.
Once the data has been collected, print the 10 samples that were placed in the buffer.
tbkRdN(0, buf, 10, TtsPacerClock, 0, 1000, TgainX1);
sprintf("tempstr, "Results of tbkRdN:");
strcat (response, tempstr);
for(i=0;i<8;i++){
sprintf(tempstr, "%4d ", buf[i]>4);
strcat (response, tempstr);
}
Get 1 scan of channels 0 to 7 at unity gain. Once the data has been collected, print all 8 channel values.
tbkRdScan(0, 7, data, TgainX1);
sprintf(tempstr"\r\n\r\nResults of tbkRdscan:\r\n");
strcat (response, tempstr);
for(i=0;i<8;i++) {
sprintf(tempstr"Channel: %2d Data: %4d\r\n", i, data[i]>4);
strcat (response, tempstr);
}
TempBook User’s Manual 16-bit API Programming of the TempBook with C 6-1
Page 84

Get 10 scans of channels 0 to 7, triggered by the pacer clock with a 1kHz sampling frequency and unity
gain, then print the scan data.
tbkRdScanN(0, 7, data2, 10, TtsPacerClock, 0, 1000, TgainX1);
sprintf(tempstr"\r\nResults of tbkRdScanN Channels 0 - 7:");
strcat (response, tempstr);
for (scan=0 ; scan<8 ; scan++){
sprintf(tempstr"\r\nScan %d: ", scan);
strcat (response, tempstr);
for (chan=0 ; chan<8 ; chan++){
sprintf(tempstr"%4d ", data2[(scan * 8) + chan]>4);
strcat (response, tempstr);
}
}
Low-Level Analog Input
The following excerpt from TBKEX.C shows the usage of several low-level analog input routines.
unsigned int buf[80], scan, chan;
Set the default operating mode to single-ended, bipolar. These parameters will affect all scanned channels.
tbkSetMode(0, 1);
Setup the scan sequencer for channels 0 to 7 with each channel in the scan at unity gain.
tbkSetMux(0, 7, TgainX1);
Set the scan frequency for 1kHz.
tbkSetFreq(1000);
Make the Pacer Clock the trigger source. This will also arm and trigger the system.
tbkSetTrig(TtsPacerClock, 0, 0, 1);
Read 10 scans of data into the language buffer buf, then print the 8 scan values.
tbkRdNFore(buf, 10);
sprintf(tempstr"\r\nResults of tbkRdNFore Channels 0 - 7:\r\n");
strcat (response, tempstr);
for (scan=0 ; scan<8 ; scan++)
{
sprintf(tempstr"\r\nScan %d: ", scan);
strcat (response, tempstr);
for (chan=0 ; chan<8 ; chan++){
sprintf(tempstr"%4d ", buf[(scan * 8) + chan]>4);
strcat (response, tempstr);
}
}
Analog Input in the Background
The following excerpt from TBKEX.C shows the usage of background acquisition functions. These
functions setup the TempBook to collect data in the background while your program continues to process
new lines of code in the foreground.
unsigned int data[80], chans[8], i, scan, chan;
unsigned chargains[8], polarities[8], active;
unsigned longcount;
6-2 16-bit API Programming of the TempBook with C TempBook User’s Manual
Page 85

Initialize the TempBook on LPT1 with interrupt 7.
tbkInit(LPT1, 7);
Set the default operating mode to single-ended, bipolar. These parameters will affect all scanned channels.
tbkSetMode(0, 1);
The TempBook has a sophisticated channel-gain sequencer that allows every channel in the defined scan to
have a different gain and unipolar/bipolar setting. The following array assignment will be used to setup the
sequencer to sample channels 0 through 7 in bipolar mode at unity gain. If desired, each channel could
have been assigned a different gain and/or unipolar/bipolar setting.
for(i=0;i<8;i++){
chans[i] = i;
gains[i] = TgainX1;
polarities[i] = 1;
}
Once the arrays are loaded with the desired channel numbers and their associated gain and unipolar/bipolar
settings, the following function uses them to load the sequencer.
tbkSetScan(chans, gains, polarities, 8);
Set the Clock to 1 Hz. (This assumes that the time base selection jumper is in the default 1 MHz position)
tbkSetClk(1000, 1000);
Make the Pacer Clock the trigger source.
tbkSetTrig(TtsPacerClock, 1, 0, 0);
Setup the background acquisition of 10 scans. As the data is collected, place it into the array called data.
Regardless of the status of the acquisition, the program will immediately return from this function call and
proceed to the next line in our code. The data will be collected via interrupts and placed in the specified
buffer in the background.
tbkRdNBack(data, 10, 0, 1);
At any point in the program, you can check the status of the background acquisition. The next lines of code
poll the background status continuously until it is no longer active, then it exits the do loop and proceeds
through the remainder of the program.
/* Check if acquisition is complete */
do
{
tbkGetBackStat(&active, &count);
sprintf(tempstr"Transfer in progress : %2d scans acquired.\r",count);
strcat(response, tempstr);
}
while (active != 0);
sprintf(tempstr"\r\nAcquisition complete.\r\n\r\n");
Since the background acquisition is complete, print the data in the buffer.
sprintf(tempstr"Data Acquired:\r\n");
strcat(response, tempstr);
for (scan=0 ; scan<8 ; scan++){
sprintf(tempstr, "\nScan %d:", scan);
strcat(response, tempstr);
for (scan=0 ; scan<8 ; scan++){
sprintf(tempstr" %4d", data[(scan * 8) + chan]>4);
strcat(response, tempstr);
}
}
TempBook User’s Manual 16-bit API Programming of the TempBook with C 6-3
Page 86

General Purpose Digital I/O Functions
The following except from TBKEX.C shows the usage of the general purpose digital I/O functions.
unsigned char bit, in_bit, out_bit, out_byte, in_byte;
Read the state of the digital input bit 3, and place its value in in_bit.
tbkRdBit(3, &in_bit);
Depending on its state, print a message.
if (in_bit) {
sprintf(tempstr, "Digital input #3 is set\r\n\r\n");
strcat(response, tempstr);
} else {
sprintf(tempstr, "Digital input #3 is clear\r\n\r\n");
strcat(response, tempstr);
}
Set the digital output bit 5 to a high state.
tbkWtBit(5, 1);
The following lines of code use the byte manipulation functions to perform a "walking-bit" test on the
digital output port.
for (bit=0 ; bit<8 ; bit++)
{
out_byte = 0x01<bit;// Put a 1 in the bit(th) location of a byte
tbkWtByte(out_byte);// Write that byte to the digital output port
sprintf(tempstr, "Digital output byte written 0x%2x\n", out_byte);
strcat(response, tempstr);
}
Read the value from the digital input port (DI0 - DI7 inclusive), then print the result.
tbkRdByte(&in_byte);
sprintf(tempstr, "Digital input byte is 0x%2x\r\n", in_byte);
strcat(response, tempstr);
High-Speed Digital Input
The following excerpt from TBKEX.C shows the usage of the high-speed digital input function calls.
The high-speed digital port can be specified as a channel in the analog scan sequence, just like an analog
input channel. In this way the high-speed digital port data is acquired synchronously with the analog input
data and is placed in the same data buffer as the analog input data. This program sets up a scan which
includes analog channels and the high speed digital port.
unsigned chans[9], data[9], i, chan;
unsigned char gains[9], polarity[9];
Configure a scan consisting of analog input channels 0 through 7.
for (i=0 ; i<8 ; i++){
chans[i] = i; // Analog input channels 0 - 7
gains[i] = TgainX1; // Unity gain
}
Include the high speed port as the last channel in the scan. Note that the high speed channel can be placed
anywhere in the scan.
chans[8] = TchHighSpeedDig; // High speed digital inputs
gains[8] = TgainX1; // Put any gain, it doesn't matter
6-4 16-bit API Programming of the TempBook with C TempBook User’s Manual
Page 87

Initialize the TempBook on LPT1 with interrupt 7.
tbkInit(LPT1, 7);
Set the default operating mode to single-ended, bipolar. These parameters will affect all scanned channels.
tbkSetMode(0, 1);
Load the scan sequencer using a NULL pointer for the polarities array which indicates the use of the
default, global polarity.
tbkSetScan(chans, gains, 0, 9);
Set the trigger source to software trigger.
tbkSetTrig(TtsSoftware, 0, 0, 0);
Trigger a scan.
tbkSoftTrig();
Read the A/D FIFO buffer and print the results.
tbkRdNFore(data, 1);
sprintf("Analog input channels 0 - 7:\n");
strcat(response, tempstr);
for (chan=0 ; chan<8 ; chan++)
sprintf(" %4d", data[chan]>4);
strcat(response, tempstr);
}
sprintf(tempstr, "\nHigh speed digital inputs DI0 - DI7:\n");
sprintf(response, tempstr);
Counter/Timer Functions
The following excerpt from TBKEX.C shows the usage of the counter/timer functions.
The counter/timer port available through the termination card is the P0 port af an 8254 counter/timer chip.
This port can be configured through software to perform several functions which are described in detail in
the command reference section under the tbkConfCntr0 command. This example demonstrates the usage of
three of the counter/timer modes. Although the invocation of these modes is demonstrated there is no way
to observe the function of the port without the connection of external test equipment or circuitry.
Configure CTR0 to use the internal 100 kHz clock.
tbkSetTrig(TtsSoftware, 0, 1, 0);
Configure CTR0 to mode 0, High on Terminal Count and write a count value of 100 to counter 0. After this
the counter 0 output (OUT0) will go high after 100 pulses are received on the counter 0 gate input (GAT0).
tbkConfCntr0(Tc0cHighTermCnt);
tbkWtCntr0(100);
Configure CTR0 to mode 1, Hardware Retriggerable One-Shot and write a count value of 1000 to counter
0. After this a rising edge on the counter 0 input (GAT0) will cause the output to go high for 10 msec.*/
tbkConfCntr0(Tc0cOneShot);
tbkWtCntr0(1000);
Configure CTR0 to mode 3, Square Wave Generator and write a count value of 20 to counter 0. After this a
square wave of 5kHz frequency should be present on the counter 0 output (OUT0).
tbkConfCntr0(Tc0cSquareWave);
tbkWtCntr0(20);
TempBook User’s Manual 16-bit API Programming of the TempBook with C 6-5
Page 88

High-Level Thermocouple Data Acquisition
The following excerpt from TBKEX.C demonstrates the use of the TempBook's high-level thermocouple
temperature data acquisition routines. These functions have combined scan sequencer setup, ADC data
collection, and thermocouple linearization.
int i, temp, temps[10];
unsigned buf[1200];
Set the default operating mode to differential, bipolar. These parameters will affect all scanned channels.
tbkSetMode(1, 1);
Get one temperature sample from a type J thermocouple on channel 0, then print the result.
tbkRdTemp(0, TbkTypeJ, &temp);
sprintf(tempstr, "\r\nResults of tbkRdTemp\r\n");
strcat(response, tempstr);
sprintf(tempstr, "Temperature: %4,1f \r\n", (float)temp/10.0);
strcat(response, tempstr);
Get one temperature value from a type J thermocouple on channel 0 which is the average of 10 acquired
values, then print the result. This has the effect of reducing the noise content of your signal. The 10
readings will be taken at 1kHz, with only one temperature value returned by the function.
tbkRdTempN(0, TbkTypeJ, 10, &temp, buf, 1000, 0);
sprintf(tempstr, "\r\nResults of tbkRdTempN\r\n");
strcat(response, tempstr);
sprintf(tempstr, "Temperature: %4.1f \r\n", (float)temp/10.0);
strcat(response, tempstr);
Get one temperature value from a type J thermocouple on channels 0 through 7, then print the result.
tbkRdTempScan(0, 7, TbkTypeJ, temps);
sprintf(tempstr, "\r\nResults of tbkRdTempScan\r\n");
strcat(response, tempstr);
for (i=0 ; i<8 ; i++){
sprintf(tempstr, "Channel %d Temperature: %4.1f \r\n", i,
(float)temps[i]/10.0);
strcat(response, tempstr);
Get 8 temperature values from type J thermocouple on channels 0 through 7 which are the average of 10
acquired values, then print the result. This has the effect of reducing the noise content of your signal. The
10 readings will be taken at 1kHz, with only one temperature value for each channel returned by the
function.
tbkRdTempScanN(0, 7, TbkTypeJ, 10, temps, buf, 1000, 0);
sprintf(tempstr, "\r\nResults of tbkRdTempScanN\r\n");
strcat(response, tempstr);
for (i=0 ; i<8 ; i++){
sprintf(tempstr, "Channel %d Temperature: %4.1f \r\n", i,
(float)temps[i]/10.0);
strcat(response, tempstr);
}
6-6 16-bit API Programming of the TempBook with C TempBook User’s Manual
Page 89

Thermocouple Linearization
The following excerpt from TBKEX.C, demonstrates the use of the TempBook's thermocouple linearization
routines.
unsigned i, chans[11], data[1100];
unsigned char gains[11];
int temp[8];
The following lines of code assign channels and gains to the arrays that will be used to create a scan
sequence. The position of the CJC in the scan and the assignment of the gains for all of the channels must
conform to the conventions used by the linearization routines. See the command reference section for more
information on scan configuration.
/* Configure chans array */
chans[0] = 18; /* Shorted channel*/
chans[1] = 18; /* Shorted channel */
chans[2] = 16; /* CJC channel */
chans[3] = 0; /* Thermocouple on channel 0 */
chans[4] = 1; /* Thermocouple on channel 1 */
chans[5] = 2; /* Thermocouple on channel 2 */
chans[6] = 3; /* Thermocouple on channel 3 */
chans[7] = 4; /* Thermocouple on channel 4 */
chans[8] = 5; /* Thermocouple on channel 5 */
chans[9] = 6; /* Thermocouple on channel 6 */
chans[10] = 7; /* Thermocouple on channel 7 */
/* Configure gains array */
gains[0] = TbkBiCJC; /* Bipolar CJC gain setting */
gains[1] = TbkBiTypeJ; /* Bipolar Type J Thermocouple gain setting */
gains[2] = TbkBiCJC; /* Bipolar CJC gain setting */
gains[3] = TbkBiTypeJ; /* Bipolar Type J Thermocouple gain setting */
gains[4] = TbkBiTypeJ; /* Bipolar Type J Thermocouple gain setting */
gains[5] = TbkBiTypeJ; /* Bipolar Type J Thermocouple gain setting */
gains[6] = TbkBiTypeJ; /* Bipolar Type J Thermocouple gain setting */
gains[7] = TbkBiTypeJ; /* Bipolar Type J Thermocouple gain setting */
gains[8] = TbkBiTypeJ; /* Bipolar Type J Thermocouple gain setting */
gains[9] = TbkBiTypeJ; /* Bipolar Type J Thermocouple gain setting */
gains[10] = TbkBiTypeJ; /* Bipolar Type J Thermocouple gain setting */
Set the default operating mode to differential, bipolar. These parameters will affect all scanned channels.
tbkSetMode(1, 1);
Configure the scan sequencer,with the desired channels and gains. A zero for the polarity argument forces
the use of the default polarity for all of the channels.
tbkSetScan(chans, gains, 0, 11);
Set the pacer clock for a 1 msec period.
tbkSetFreq(1000);
Use the Pacer Clock as the trigger source.
tbkSetTrig(TtsPacerClock, 0, 0, 0);
The following function tells all of the TbkTC functions to to use zero correction. Zero correction
compensates for offset drift in the electronics due to ambient temperature changes and/or age.
tbkTCAutoZero(1);
Read 100 scans and place the raw data in the supplied buffer.
tbkRdNFore(data, 100);
Reset the trigger to prevent a buffer overrun.
TempBook User’s Manual 16-bit API Programming of the TempBook with C 6-7
Page 90

tbkSetTrig(TtsSoftware, 1, 0, 0);
Configure and perform Thermocouple Linearization with block averaging on the raw ADC counts. The raw
counts are in the data buffer, data. The converted temperature values will be returned in the buffer temp.
With block averaging enabled one temperature, the average of all 100 scans, will be returned for each
channel.
tbkTCSetup(11, 2, 8, TbkTypeJ, 1, 0);
tbkTCConvert(data, 100, temp, 8);
The converted temperatures can now be printed to the screen.
for (i=0 ; i<8 ; i++){
sprintf(tempstr, "%8.1f ", (float)temp[i] / 10.0);
strcat(response, tempstr);
}
sprintf(tempstr, "\r\n");
strcat(response, tempstr);
SendDlgItemMessage(myDlg, 101, WM_SETTEXT, 0, (LONG)(LPSTR)response);
EmptyMessageQueue(myDlg);
Sample Programs
High-Level Analog Input
/***********************************************
File:Adcex1.c
Description:This example demonstrates the use of TempBook/66s highest level
ADC functions. These functions have combined scan sequencer setup and ADC
data collection.
Functions Used:tbkRd(unsigned chan, unsigned *sample, unsigned char gain)
tbkRdN(unsigned chan, unsigned *buf, unsigned count, unsigned char trigger,
unsigned char oneShot, float freq, unsigned char gain) tbkRdScan(unsigned
startChan, unsigned endChan, unsigned * buf, unsigned char gain)
tbkRdScanN(unsigned startChan, unsigned endChan, unsigned * buf, unsigned
count, unsigned char trigger, unsigned char oneShot, float freq, unsigned
char gain)
***********************************************/
unsigned sample, buf[10], data[7], data2[80];
int i, scan, chan; sprintf(response,"\r\nAdcex1.c\r\n\r\n");
/* Set the default operating mode to single-ended, bipolar */
tbkSetMode(0, 1);
/* Get 1 ADC sample from channel 0 at unity gain. */
tbkRd(0, &sample, TgainX1);
/* Print results using a 12 bit data format */
sprintf(tempstr,"Result of tbkRd : %4d\r\n\r\n", sample>4);
strcat(response,tempstr);
/* Get 10 samples from channel 0, trigged by the pacer clock with a */
/* 1000 Hz sampling frequency at unity gain. */
tbkRdN(0, buf, 10, TtsPacerClock, 0, 1000, TgainX1);
/* Print the results using a 12 bit data format */
sprintf(tempstr,"Results of tbkRdN:");
strcat(response,tempstr);
for(i=0;i<8;i++) {
sprintf(tempstr,"%4d ", buf[i]>4);
strcat(response,tempstr);
}
/* Get 1 sample from channels 0 through 7 at unity gain. */
6-8 16-bit API Programming of the TempBook with C TempBook User’s Manual
Page 91

tbkRdScan(0, 7, data, TgainX1);
/* Print the results using a 12 bit data format */
sprintf(tempstr,"\r\n\r\nResults of tbkRdscan:\r\n");
strcat(response,tempstr);
for(i=0;i<8;i++) {
sprintf(tempstr,"Channel: %2d Data: %4d\r\n", i, data[i]>4);
strcat(response,tempstr);
}
/* Get 10 samples from channels 0 - 7, triggered by the pacer clock
with a 1000 Hz sampling frequency and unity gain. */
tbkRdScanN(0, 7, data2, 10, TtsPacerClock, 0, 1000, TgainX1);
/* Print the results using a 12 bit data format */
sprintf(tempstr,"\r\nResults of tbkRdScanN Channels 0 - 7:");
strcat(response,tempstr);
for (scan=0 ; scan <8; scan++) {
sprintf(tempstr,"\r\nScan %d: ", scan);
strcat(response,tempstr);
for (chan=0 ; chan<8 ; chan++) {
sprintf(tempstr,"%4d ", data2[(scan * 8) + chan]>4)
; strcat(response,tempstr);
}
}
SendDlgItemMessage(myDlg, 101, WM_SETTEXT, 0, (LONG)(LPSTR)response)
; EmptyMessageQueue(myDlg);
}
Low-Level Analog Input
/***********************************************
File:Adcex2.c
Description:This example demonstrates the use of the TempBook/66's lower
level ADC functions. These functions allow separate scan
sequencer setup, trigger source selection, and ADC data collection.
Functions Used:bkSetMux(unsigned startChan, unsigned endChan, unsigned char
gain)
tbkSetFreq(float freq) tbkSetTrig(unsigned char trigger, unsigned char
oneShot, unsigned char ctr0mode, unsigned char pacerMode)
tbkRdNFore(unsigned _far *buf, unsigned count)
*************************************************/
unsigned int buf[80], scan, chan;
sprintf(response,"\r\nAdcex2.c\r\n");
/* Set the default mode of operation to single-ended bipolar */
tbkSetMode(0, 1);
/* Set the scan sequencer for channels 0 - 7 at unity gain */
tbkSetMux(0, 7, TgainX1);
/* Set the scan frequency for 1000 Hz */
tbkSetFreq(1000);
/* Set the trigger source for the Pacer Clock. Note that the trigger
is armed immediately */
tbkSetTrig(TtsPacerClock, 0, 0, 1);
/* Read 10 scans of data */
TempBook User’s Manual 16-bit API Programming of the TempBook with C 6-9
Page 92

tbkRdNFore(buf, 10);
/* Print the results using a 12 bit data format */
sprintf(tempstr,"\r\nResults of tbkRdNFore Channels 0 - 7:\r\n");
strcat(response,tempstr);
for (scan=0 ; scan<8 ; scan++) {
sprintf(tempstr,"\r\nScan %d: ", scan); strcat(response,tempstr);
for (chan=0 ; chan<8 ; chan++) {
sprintf(tempstr,"%4d ", buf[(scan * 8) + chan]>4);
strcat(response,tempstr);
}
}
sprintf(tempstr,"\r\n");
strcat(response,tempstr);
SendDlgItemMessage(myDlg, 101, WM_SETTEXT, 0, (LONG)(LPSTR)response);
EmptyMessageQueue(myDlg);
}
Analog Input in the Background
/***********************************************
File: Adcex3.c
Description:This example demonstrates the use of the TempBook/66's
background transfer routines.
Functions Used:tbkRdNBack(unsigned _far *buf, unsigned count, unsigned char
cycle,
unsigned char updateSingle)
tbkGetBackStat(unsigned char _far *active, unsigned long _far *count)
***********************************************/
unsigned int data[80], chans[8], i, scan, chan;
unsigned char gains[8], polarities[8], active;
unsigned long count;
sprintf(response,"\r\nAdcex3.c\r\n\r\n");
/* Set the default mode of operation to single-ended bipolar */
tbkSetMode(0, 1);
/* Set channels, gains, & polarities arrays to channels 0-7,
bipolar, at unity gain. */
for(i=0;i<8;i++)
{
chans[i] = i;
gains[i] = TgainX1;
polarities[i] = 1;
}
/* Load the scan sequencer FIFO */
tbkSetScan(chans, gains, polarities, 8);
/* Set Clock : 1Hz - xtal set to 1MHz */
tbkSetClk(1000, 1000);
/* Set pacer clock trigger source */
tbkSetTrig(TtsPacerClock, 1, 0, 0);
/* Read 10 scans of data in the background, cycle off, */
/* update on each scan */
tbkRdNBack(data, 10, 0, 1);
/* Check if acquisition is complete */
do {
6-10 16-bit API Programming of the TempBook with C TempBook User’s Manual
Page 93

tbkGetBackStat(&active, &count);
sprintf(tempstr,"Transfer in progress : %2d scans acquired.\r",count);
strcat(response,tempstr);
}
while (active != 0);
sprintf(tempstr,"\r\nAcquisition complete.\r\n\r\n");
strcat(response,tempstr);
/* Print results using a 12 bit data format */
sprintf(tempstr,"Data Acquired:\r\n");
strcat(response,tempstr);
for (scan=0 ; scan<8 ; scan++)
{
sprintf(tempstr,"\r\nScan %d:", scan);
strcat(response,tempstr);
for (chan=0 ; chan <8; chan++) {
sprintf(tempstr," %4d", data[(scan * 8) + chan]>4);
strcat(response,tempstr);
}
}
sprintf(tempstr,"\r\n");
strcat(response,tempstr);
SendDlgItemMessage(myDlg, 101, WM_SETTEXT, 0, (LONG)(LPSTR)response);
EmptyMessageQueue(myDlg);
}
General Purpose Digital I/O
/***********************************************
File: Adcex3.c
Description:This example demonstrates the use of the TempBook/66's general
purpose digital I/O ports.
Functions Used:tbkRdBit(unsigned char bitNum, unsigned char *bitVal)
tbkRdByte(unsigned char *byteVal)
tbkWtBit(unsigned char bitNum, unsigned char bitVal)
tbkWtByte(unsigned char byteVal)
***********************************************/
*/ unsigned char bit, in_bit, out_byte, in_byte;
sprintf(response,"\r\nDigex1.c\r\n\r\n");
/* Read the state of digital input DI3 */
tbkRdBit(3, &in_bit);
if (in_bit) {
sprintf(tempstr,"Digital input #3 is set\r\n\r\n");
strcat(response,tempstr); } else {
sprintf(tempstr,"Digital input #3 is clear\r\n\r\n");
strcat(response,tempstr); }
/* Set digital output DO5 */
tbkWtBit(5, 1);
/* Perform a 'walking bit' test by setting each digital
output in order from DO0 to DO7 */
for (bit=0 ; bit<8 ; bit++)
{
out_byte = 0x01<bit;
// Put a 1 in the bit(th) location of a byte
tbkWtByte(out_byte);
// Write that byte to the digital output port
TempBook User’s Manual 16-bit API Programming of the TempBook with C 6-11
Page 94

sprintf(tempstr,"Digital output byte written 0x%2x\r\n", out_byte);
strcat(response,tempstr);
}
/* Read the value from the digital input port (DI0 - DI7 inclusive) */
tbkRdByte(&in_byte);
sprintf(tempstr,"Digital input byte is 0x%2x\r\n", in_byte);
strcat(response,tempstr);
SendDlgItemMessage(myDlg, 101, WM_SETTEXT, 0, (LONG)(LPSTR)response);
EmptyMessageQueue(myDlg);
}
High-Speed Digital Input
/***********************************************
File: Digex2.c
Description:This example demonstrates the use of the TempBook's high speed
digital inputs.
Functions Used:tbkSetScan(unsigned *chans, unsigned char *gains, unsigned
char *polarity, unsigned count)
tbkRdNFore(unsigned _far *buf, unsigned count)
***********************************************/
unsigned chans[9], data[9], i, chan;
unsigned char gains[9], polarity[9];
sprintf(response,"\nDigex2.c\n\n");
/* Configure the channels and gains arrays for analog inputs 0-7 */
/* plus the high speed digital inputs */
for (i=0 ; i<8 ; i++)
{
chans[i] = i; /* Analog input channels 0 - 7 */
gains[i] = TgainX1; /* Unity gain */
polarity[i] = 1; /* Bipolar */
}
chans[8] = TchHighSpeedDig; /* High speed digital inputs */
gains[8] = TgainX1; /* Put any gain, it doesn't matter */
polarity[8] = 1; /* Put any polarity, it doesn't matter */
/* Set default operation to single-ended, bipolar */
tbkSetMode(0, 1);
/* Load the scan sequencer, NULL pointer for polarities array */
/* indicates use default polarity */
tbkSetScan(chans, gains, 0, 9);
/* Set software trigger source */
tbkSetTrig(TtsSoftware, 0, 0, 0);
/* Trigger a scan */
tbkSoftTrig();
/* Read the ADC FIFO buffer */
tbkRdNFore(data, 1);
/* Print the results */
sprintf(tempstr,"Analog input channels 0 - 7:\n");
6-12 16-bit API Programming of the TempBook with C TempBook User’s Manual
Page 95

strcat(response,tempstr);
for (chan=0 ; chan<8 ; chan++) {
sprintf(tempstr," %4d", data[chan]>4);
strcat(response,tempstr);
}
sprintf(tempstr,"\nHigh speed digital inputs DI0 - DI7:\n");
strcat(response,tempstr);
sprintf(tempstr," 0x%x", (char)data[8]);
strcat(response,tempstr);
SendDlgItemMessage(myDlg, 101, WM_SETTEXT, 0, (LONG)(LPSTR)response);
EmptyMessageQueue(myDlg);
}
Counter Timer Functions
/************************************
File: Ctrex1.c
Description: This example demonstrates the use of the TempBook's
counter timer functions.
Functions Used:
tbkConfCntr0(unsigned char config)
tbkWtCntr0(unsigned cntr0)
*************************************/
sprintf(response,"\r\nctrex1.c\r\n\r\n");
/* Configure CTR0 to use the internal 100kHz clock */
tbkSetTrig(TtsSoftware, 0, 1, 0);
/* Configure CTR0 to mode 1, Hardware Retriggerable One-Shot and write
a count value of 1000 to counter 0. After this a rising edge on the
counter 0 input (GAT0) will cause the output to go high
for 10 msec. */
tbkConfCntr0(Tc0cOneShot);
tbkWtCntr0(1000);
/* Configure CTR0 to mode 3, Square Wave Generator and write a count
value of 20 to counter 0. After this a square wave of 5kHz
frequency should be present on the counter 0 output (OUT0) */
tbkConfCntr0(Tc0cSquareWave);
tbkWtCntr0(20);
/* Configure CTR0 to use an external clock */
tbkSetTrig(TtsSoftware, 0, 0, 0);
/* Configure CTR0 to mode 0, High on Terminal Count and write a count
value of 100 to counter 0. After this the counter 0 output (OUT0)
will go high after 100 pulses are received on the counter 0 clock
input (CLK0) */
tbkConfCntr0(Tc0cHighTermCnt);
tbkWtCntr0(100);
SendDlgItemMessage(myDlg, 101, WM_SETTEXT, 0, (LONG)(LPSTR)response);
EmptyMessageQueue(myDlg);
}
TempBook User’s Manual 16-bit API Programming of the TempBook with C 6-13
Page 96

High-Level Thermocouple Measurement
***********************************************
File:
Description:
This example demonstrates the use of the TempBook's high level
thermocouple temperature data acquisition routines. These
functions have combined scan sequencer setup, ADC data
collection, and thermocouple linearization.
Functions Used:
tbkRdTemp(unsigned chan, unsigned tcType, int * temp)
tbkRdTempN( unsigned chan, unsigned tcType, unsigned count, int *
temp,
unsigned * buf, float freq, unsigned avg ) tbkRdTempScan(unsigned startChan,
unsigned endChan,unsigned tcType, int * temp) tbkRdTempScanN(unsigned
startChan,
unsigned endChan, unsigned tcType, unsigned count, int * temp, unsigned *
buf,
float freq, unsigned avg)
****************************************************/
int i, temp, temps[10];
unsigned buf[1200];
sprintf(response,"\r\nTempex1.c\r\n");
/* Set the default mode of operation to differential bipolar */
tbkSetMode(1, 1);
/* Get 1 ADC sample from a type J thermocouple on channel 0 and
convert the reading to a temperature. Print the result. */
tbkRdTemp(0, TbkTypeJ, &temp);
sprintf(tempstr,"\r\nResults of tbkRdTemp\r\n");
strcat(response,tempstr);
sprintf(tempstr,"Temperature: %4.1f \r\n", (float)temp/10.0);
strcat(response,tempstr);
/* Get 10 ADC samples from a type J thermocouple on channel 0 and
convert the readings to a single temperature using block averaging.
Print the results. */
tbkRdTempN(0, TbkTypeJ, 10, &temp, buf, 1000, 0);
sprintf(tempstr,"\r\nResults of tbkRdTempN\r\n");
strcat(response,tempstr);
sprintf(tempstr,"Temperature: %4.1f \r\n", (float)temp/10.0);
strcat(response,tempstr);
/* Get 1 ADC sample each from type J thermocouples on channels 0
through
7 and convert the readings to temperatures. Print the results */
tbkRdTempScan(0, 7, TbkTypeJ, temps);
sprintf(tempstr,"\r\nResults of tbkRdTempScan\r\n");
strcat(response,tempstr);
for (i=0 ; i<8 ; i++) {
sprintf(tempstr,"Channel %d Temperature: %4.1f \r\n", i,
(float)temps[i]/10.0);
strcat(response,tempstr);
}
6-14 16-bit API Programming of the TempBook with C TempBook User’s Manual
Page 97

/* Get 10 ADC samples each from type J thermocouples on channels 0
through 7 and convert the readings to temperatures using block
averaging. Print the results */
tbkRdTempScanN(0, 7, TbkTypeJ, 10, temps, buf, 1000, 0);
sprintf(tempstr,"\r\nResults of tbkRdTempScanN\r\n");
strcat(response,tempstr);
for (i=0 ; i<8 ; i++) {
sprintf(tempstr,"Channel %d Temperature: %4.1f \r\n", i,
(float)temps[i]/10.0); strcat(response,tempstr);
}
SendDlgItemMessage(myDlg, 101, WM_SETTEXT, 0, (LONG)(LPSTR)response);
EmptyMessageQueue(myDlg);
}
Low-Level Thermocouple Linearization
***********************************************
File: Description:
This example demonstrates the use of the TempBook's thermocouple
linearization
routines.
Functions Used:
tbkTCSetup(unsigned nscan, unsigned cjcPosition, unsigned ntc,
unsigned tcType, unsigned char bipolar, unsigned avg)
tbkTCConvert(unsigned _far *counts, unsigned scans,
int _far *temp, unsigned ntemp)
*************************************************/
*/ unsigned i, chans[11], data[1100];
unsigned char gains[11]; int temp[8];
sprintf(response,"\r\nTempex2.c\r\n");
/* Configure chans array */
chans[0] = 18; /* Shorted channel*/
chans[1] = 18; /* Shorted channel*/
chans[2] = 16; /* CJC channel */
chans[3] = 0; /* Thermocouple on channel 0 */
chans[4] = 1; /* Thermocouple on channel 1 */
chans[5] = 2; /* Thermocouple on channel 2 */
chans[6] = 3; /* Thermocouple on channel 3 */
chans[7] = 4; /* Thermocouple on channel 4 */
chans[8] = 5; /* Thermocouple on channel 5 */
chans[9] = 6; /* Thermocouple on channel 6 */
chans[10] = 7; /* Thermocouple on channel 7 */
/* Configure gains array */
gains[0] = TbkBiCJC; /* Bipolar CJC gain setting */
gains[1] = TbkBiTypeJ; /* Bipolar Type J Thermocouple gain setting */
gains[2] = TbkBiCJC; /* Bipolar CJC gain setting */
gains[3] = TbkBiTypeJ; /* Bipolar Type J Thermocouple gain setting */
gains[4] = TbkBiTypeJ; /* Bipolar Type J Thermocouple gain setting */
gains[5] = TbkBiTypeJ; /* Bipolar Type J Thermocouple gain setting */
gains[6] = TbkBiTypeJ; /* Bipolar Type J Thermocouple gain setting */
gains[7] = TbkBiTypeJ; /* Bipolar Type J Thermocouple gain setting */
gains[8] = TbkBiTypeJ; /* Bipolar Type J Thermocouple gain setting */
gains[9] = TbkBiTypeJ; /* Bipolar Type J Thermocouple gain setting */
gains[10] = TbkBiTypeJ; /* Bipolar Type J Thermocouple gain setting */
/* Set the default mode of operation to differential bipolar */
tbkSetMode(1, 1);
/* Configure the scan sequencer, will use default polarity. */
tbkSetScan(chans, gains, 0, 11);
TempBook User’s Manual 16-bit API Programming of the TempBook with C 6-15
Page 98

/* Set the pacer clock for a 1 msec period */
tbkSetFreq(1000);
/* Configure for pacer clock trigger, continuous mode. */
tbkSetTrig(TtsPacerClock, 0, 0, 0);
/* Tell tbkTC.. functions to use zero correction */
tbkTCAutoZero(1);
/* Read 100 scans of ADC data */
tbkRdNFore(data, 100);
/* Reset the trigger to prevent a buffer overrun */
tbkSetTrig(TtsSoftware, 1, 0, 0);
/* Configure and Perform Thermocouple Linearization with block
averaging */
tbkTCSetup(11, 2, 8, TbkTypeJ, 1, 0);
tbkTCConvert(data, 100, temp, 8);
/* The converted temperatures can now be printed to the screen */
sprintf(tempstr,"\r\nThermocouple temperatures: Channels 0 through
7\r\n\r\n"); strcat(response,tempstr);
for (i=0 ; i<8 ; i++) {
sprintf(tempstr,"%8.1f ", (float)temp[i] / 10.0);
strcat(response,tempstr);
}
sprintf(tempstr,"\r\n");
strcat(response,tempstr);
SendDlgItemMessage(myDlg, 101, WM_SETTEXT, 0, (LONG)(LPSTR)response);
EmptyMessageQueue(myDlg);
}
6-16 16-bit API Programming of the TempBook with C TempBook User’s Manual
Page 99

16-Bit API Command Summary, for C Language
Command Description
Initialization, Communication and Error Handling:
tbkInit (uint lptPort, uchar lptIntr)
tbkSelectPort (uint lptPort)
tbkClose (void)
tbkSetErrHandler (tbkErrorHandlerFPT
tbkErrHandler)
tbkDefaultHandler (int tbkErrnum)
tbkGetProtocol (int *protocol)
tbkSetProtocol (int protocol)
Separate Scan Sequence, Pacer Clock and Trigger Commands:
tbkSoftTrig (void)
tbkSetFreq (float freq)
tbkGetFreq (float _far *freq)
tbkSetClk (uint ctr1, uint ctr2)
tbkSetMode (uchar di_se, uchar polarity)
tbkSetMux (uint startChan, uint endChan, uchar
gain)
tbkGetScan (uint *chans, uchar *gains, uchar
*polarity, uint *count)
Digital I/O and Counter/Timer Functions:
tbkSetScan (uint *chans, uchar *gains, uchar
*polarity, uint count)
tbkSetTrig (uchar trigger, uchar oneShot, uchar
ctr0mode, uchar pacerMode)
Separate Data Read and Background Transfer Commands:
tbkRdFore (uint _far *sample)
tbkRdNFore (uint _far *buf, uint count)
tbkRdNBack (uint _far *buf, uint count, uchar
cycle, uchar updateSingle)
tbkGetBackStat (uchar _far *active, uint long
_far *count)
tbkStopBack (void)
Data Read Commands with Combined Scan Sequencer, Pacer Clock and Trigger Setup and Thermocouple
Linearization:
tbkRd (uint chan, uint *sample, uchar gain)
tbkRdN (uint chan, uint *buf, uint count, uchar
trigger, uchar oneShot, float uchar gain)
tbkRdScan (uint startChan, uint endChan, uint
*buf, uchar gain)
tbkRdScanN (uint startChan, uint endChan, uint
*buf, uint count, uchar trigger, uchar oneShot,
float freq, uchar gain)
tbkRdTemp (uint chan, uint tcType, int temp)
tbkRdTempN (uint chan, uint tcType, uint count,
int *temp, uint *buf, float freq, uint avg)
tbkRdTempScan (uint startChan, uint endChan, uint
tcType, int temp)
tbkRdTempScanN (uint startChan, uint endChan,
uint tcType, uint count, int *temp, uint *buf,
float freq, uint avg)
Thermocouple Linearization Commands:
tbkTCSetup (uint nscan, uint cjcPosition, uint
ntc, uint tcType, uchar bipolar, uint avg)
tbkTCConvert (uint _far *counts, uint scans, int
_far *temp, uint ntemp)
tbkTCSetupConvert (uint nscan, uint cjcPosition,
uint ntc, uint tcType, uchar bipolar, uint avg,
uint _far *counts, uint scans, int *far *temp,
uint ntemp)
tbkTCAutoZero (uint zero)
Establish communication with the TempBook at the specified LPT
port and interrupt
Select an initialized TempBook as the current TempBook
End communication with the TempBook
Specify a user-defined routine to call when error occurs
Default error handling routine
Get the current parallel port communication protocol
Set the parallel port communication protocol
Issue a software trigger to the TempBook
Set the pacer clock frequency
Read the pacer clock frequency
Set the pacer clock frequency divider registers
Specify input signal type (single-ended or differential)
Setup the scan sequencer for a range of channels at the same
gain
Read the scan sequencer contents
Setup the scan sequencer with specific channels, gains, and
polarities
Set the trigger source for analog data acquisition
Read a single ADC sample in the foreground and increment the
scan sequencer
Read multiple scans in the foreground
Read multiple scans in the background using interrupts
Determine is a background transfer is still in progress
Stop the background transfer
Read a single sample from the specified channel
Read multiple samples from the specified channel
Read a single sample from the specified range of channels
Read multiple samples from the specified range of channels
Read the thermocouple temperature once from the specified
channel
Read the thermocouple temperature from the specified channel
multiple times with optional averaging
Read the thermocouple temperature once from each channel in a
range
Read the thermocouple temperature from each channel in a range
multiple times using optional averaging
Specify scan information used by tbkTCConvert
Perform thermocouple linearization on scan data
Combined tbkTCSetup and tbkTCConvert
Tell the thermocouple linearization functions that auto zeroing will
be used
TempBook User’s Manual 16-bit API Programming of the TempBook with C 6-17
Page 100

Software Calibration and Zero Compensation Commands:
tbkReadCalFile (char *calfile)
tbkCalSetup (uint nscan, uint readingsPos, uint
nReadings, uint chanType, uint chanGain, uint
bipolar, uint noOffset)
tbkCalConvert (uint *counts, uint scans)
tbkCalSetupConvert (uint nscan, uint readingsPos,
uint nReadings, uint chanType, uint chanGain,
uint bipolar, uint noOffset, uint *counts, uint
scans)
tbkZeroSetup (uint nscan, uint zeroPos, uint
readingsPos, uint nReadings)
tbkZeroConvert (uint *counts, uint scans)
tbkZeroSetupConvert (uint nscan, uint zeroPos,
uint readingsPos, uint nReadings, uint *counts,
uint scans)
tbkConfCntr0 (uchar config)
tbkWtCntr0 (uint cntr0)
tbkRdCntr0 (uint _far *cntr0, uchar mode)
tbkRdBit (uchar bitNum, uchar *bitVal)
tbkRdByte (uchar *byteVal)
tbkWtBit (uchar bitNum, uchar bitVal)
tbkWtByte (uchar byteVal)
Pretrigger Operation Commands:
tbkSetTrigPreT (uchar source, uint channels, uint
level, uint preCount, uint postCount)
tbkRdNForePreT (uint _far *buf, uint count, uint
_far *retcount, uchar _far active)
tbkRdNForePreTWait (uint _far *buf, uint count,
uint _far *retcount)
tbkRdNBackPreT (uint _far *buf, uint count, uchar
cycle)
Read the calibration constants text file
Specify scan information used by tbkCalConvert
Perform software calibration on scan data
Combined tbkCalSetup and tbkCalConvert
Specify scan information used by tbkZeroConvert function
Perform zero compensation on scan data
Combined tbkZeroSetup and tbkZeroConvert
Set the operating mode of the counter/timer
Write a value to the counter/timer count down register
Read the counter/timer hold register
Read a specific digital input bit
Read all digital inputs
Write to a specific digital output bit
Write to all digital outputs
Setup the trigger source and level for a pretrigger operation
Read multiple scans for a pretrigger operation in the foreground
Read multiple scans for a pretrigger operation in the foreground
continuing until the trigger event occurs
Read multiple scans for a pretrigger operation in the background
6-18 16-bit API Programming of the TempBook with C TempBook User’s Manual
 Loading...